

Verdetto - buono, ma abbastanza buono da superare la concorrenza?
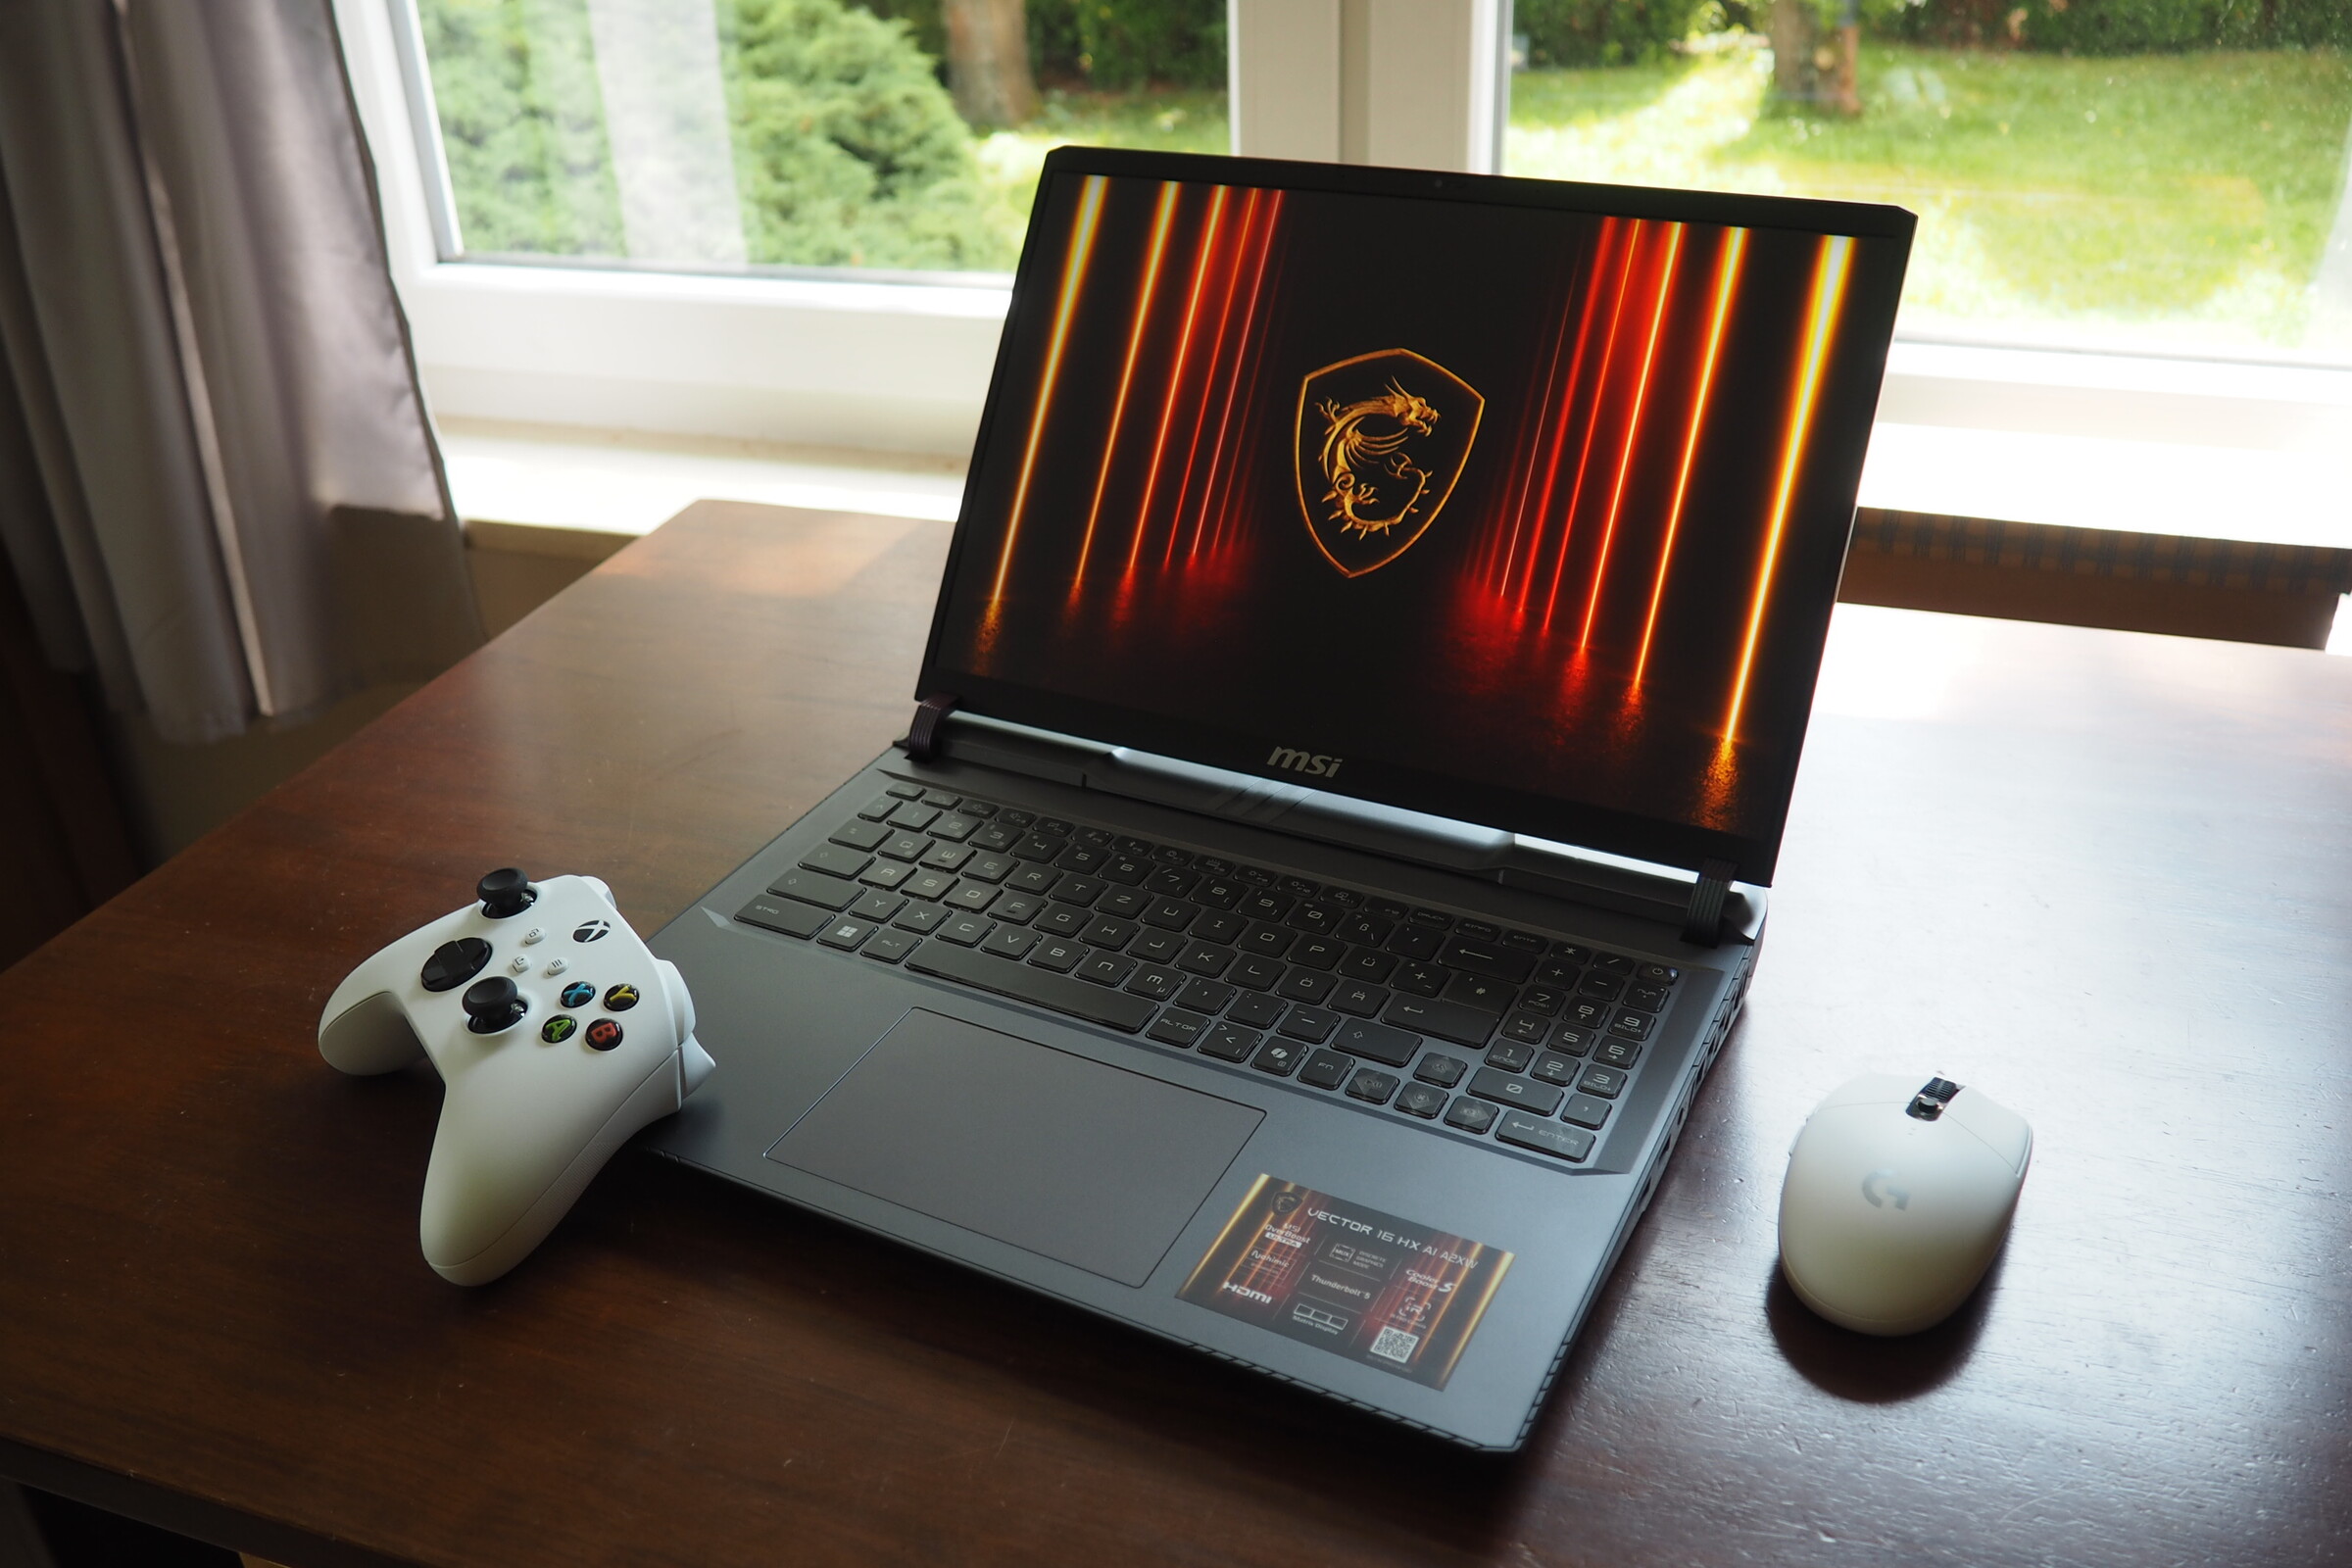
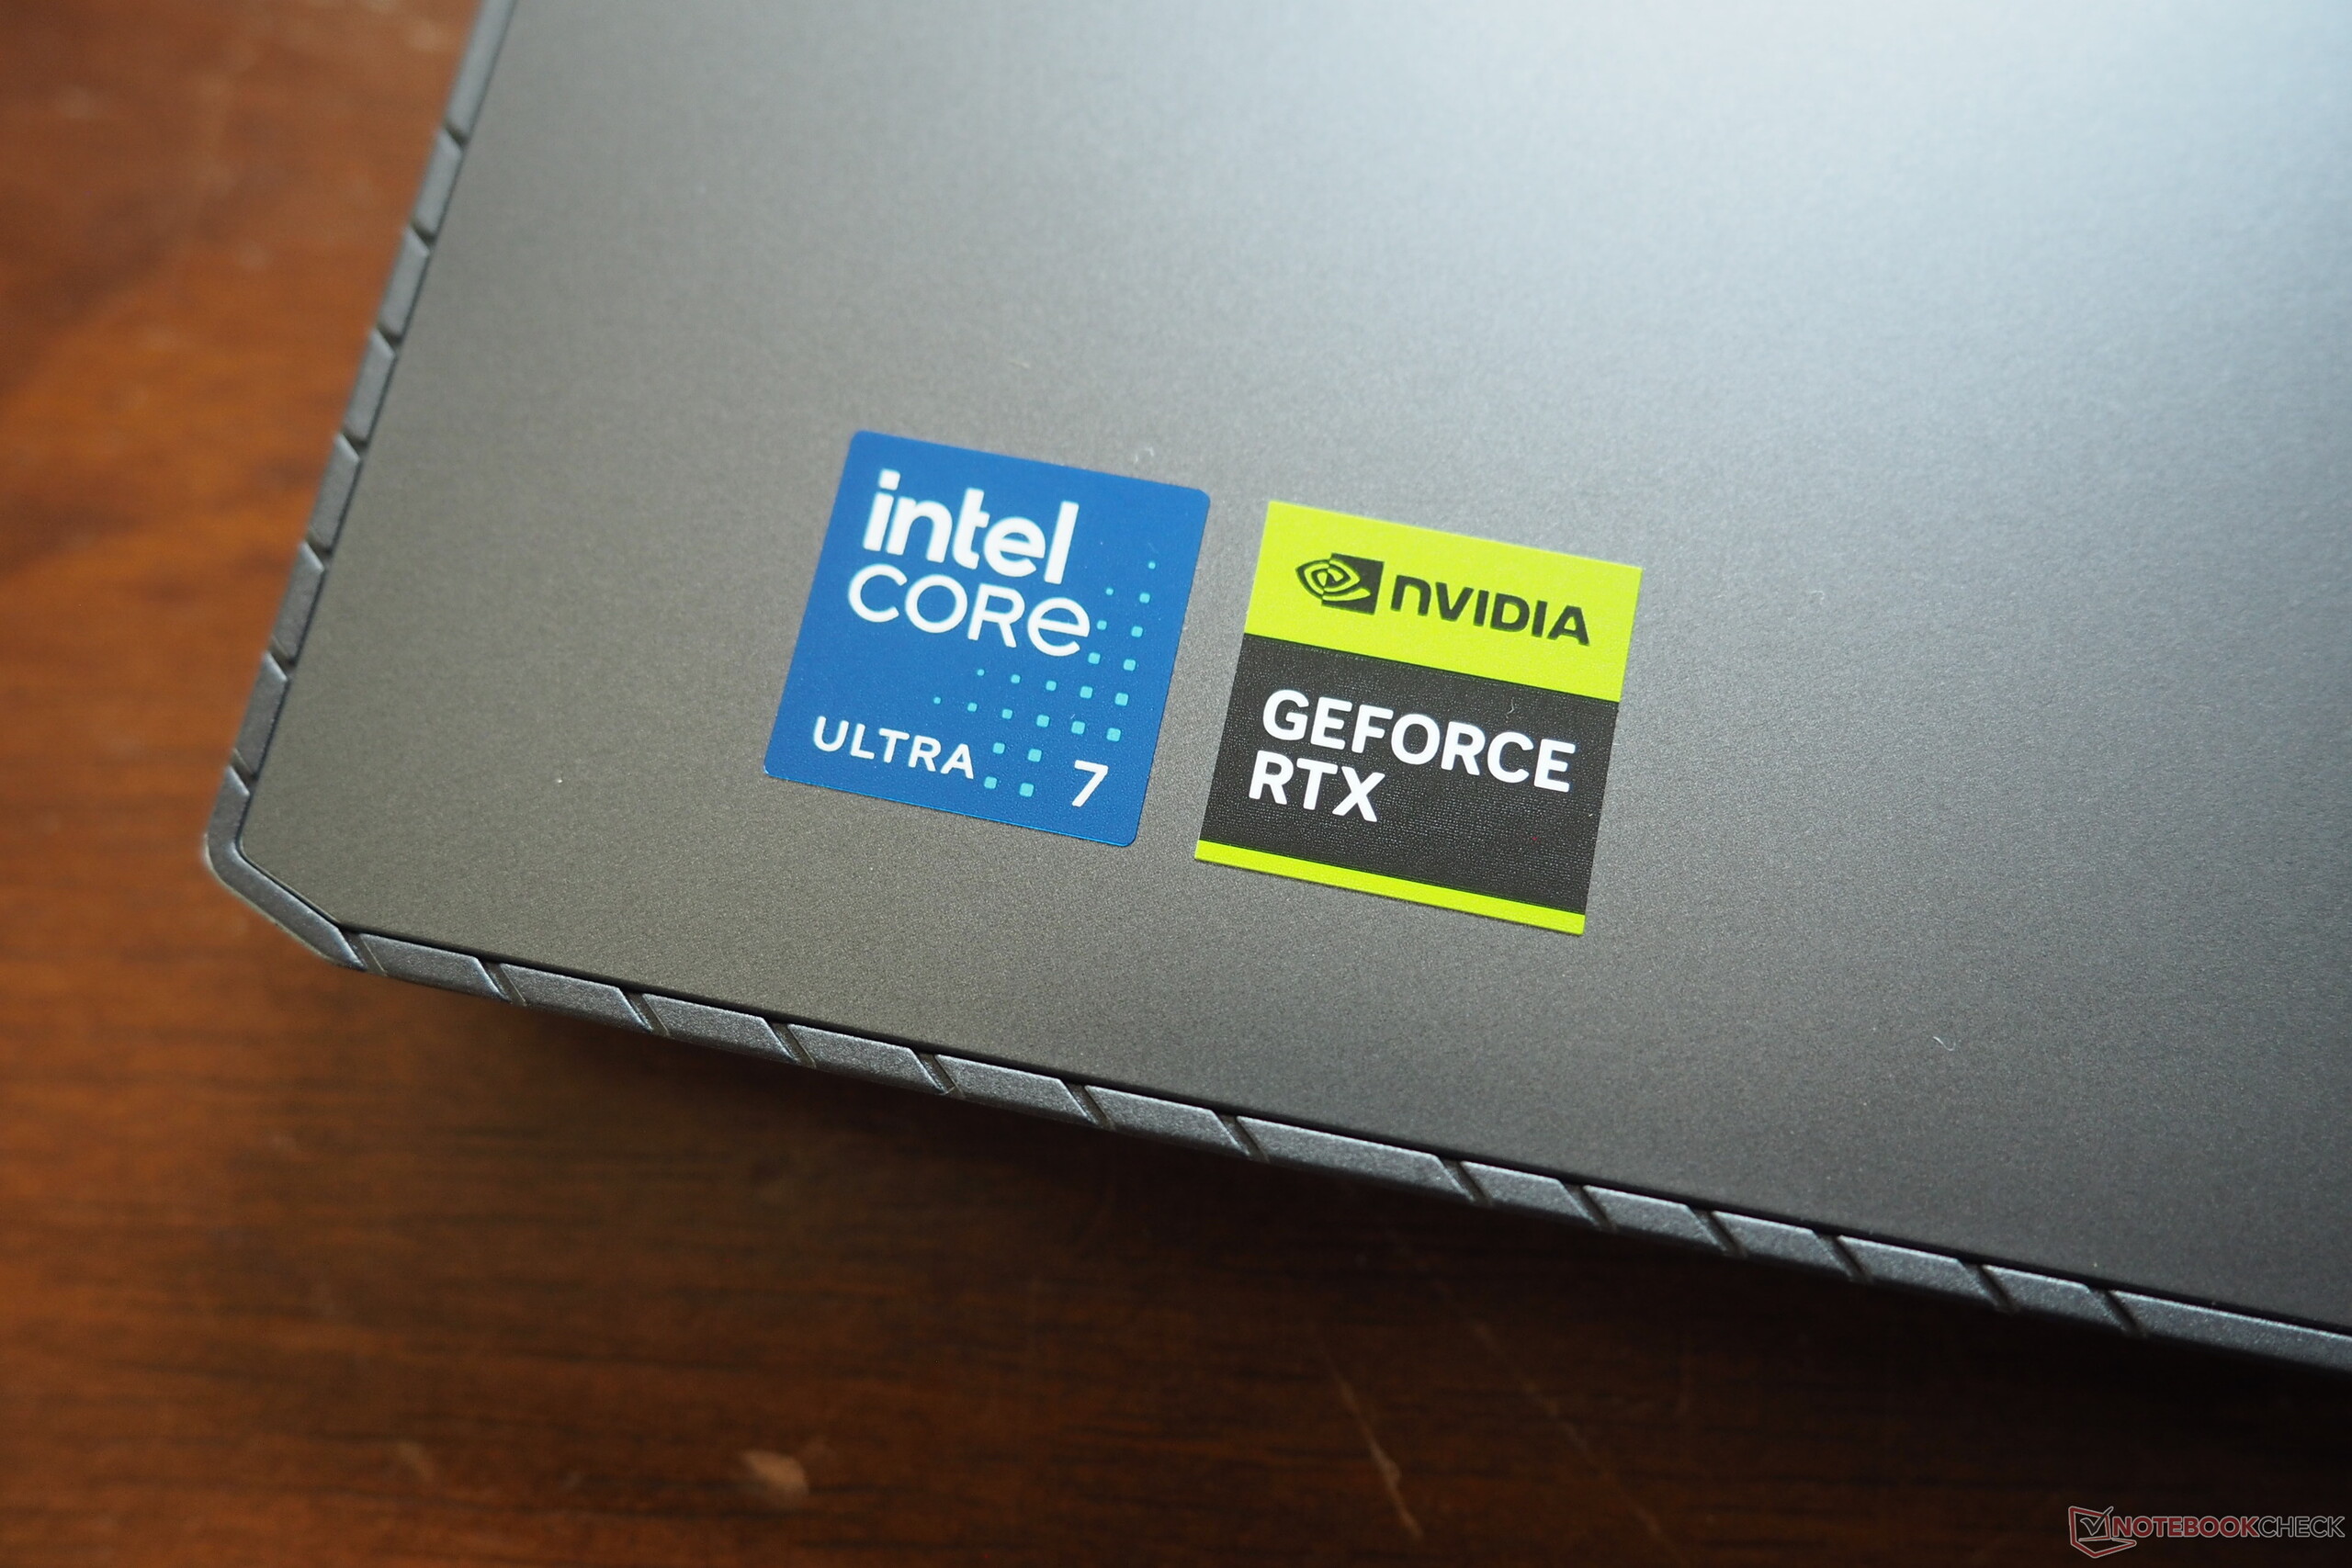
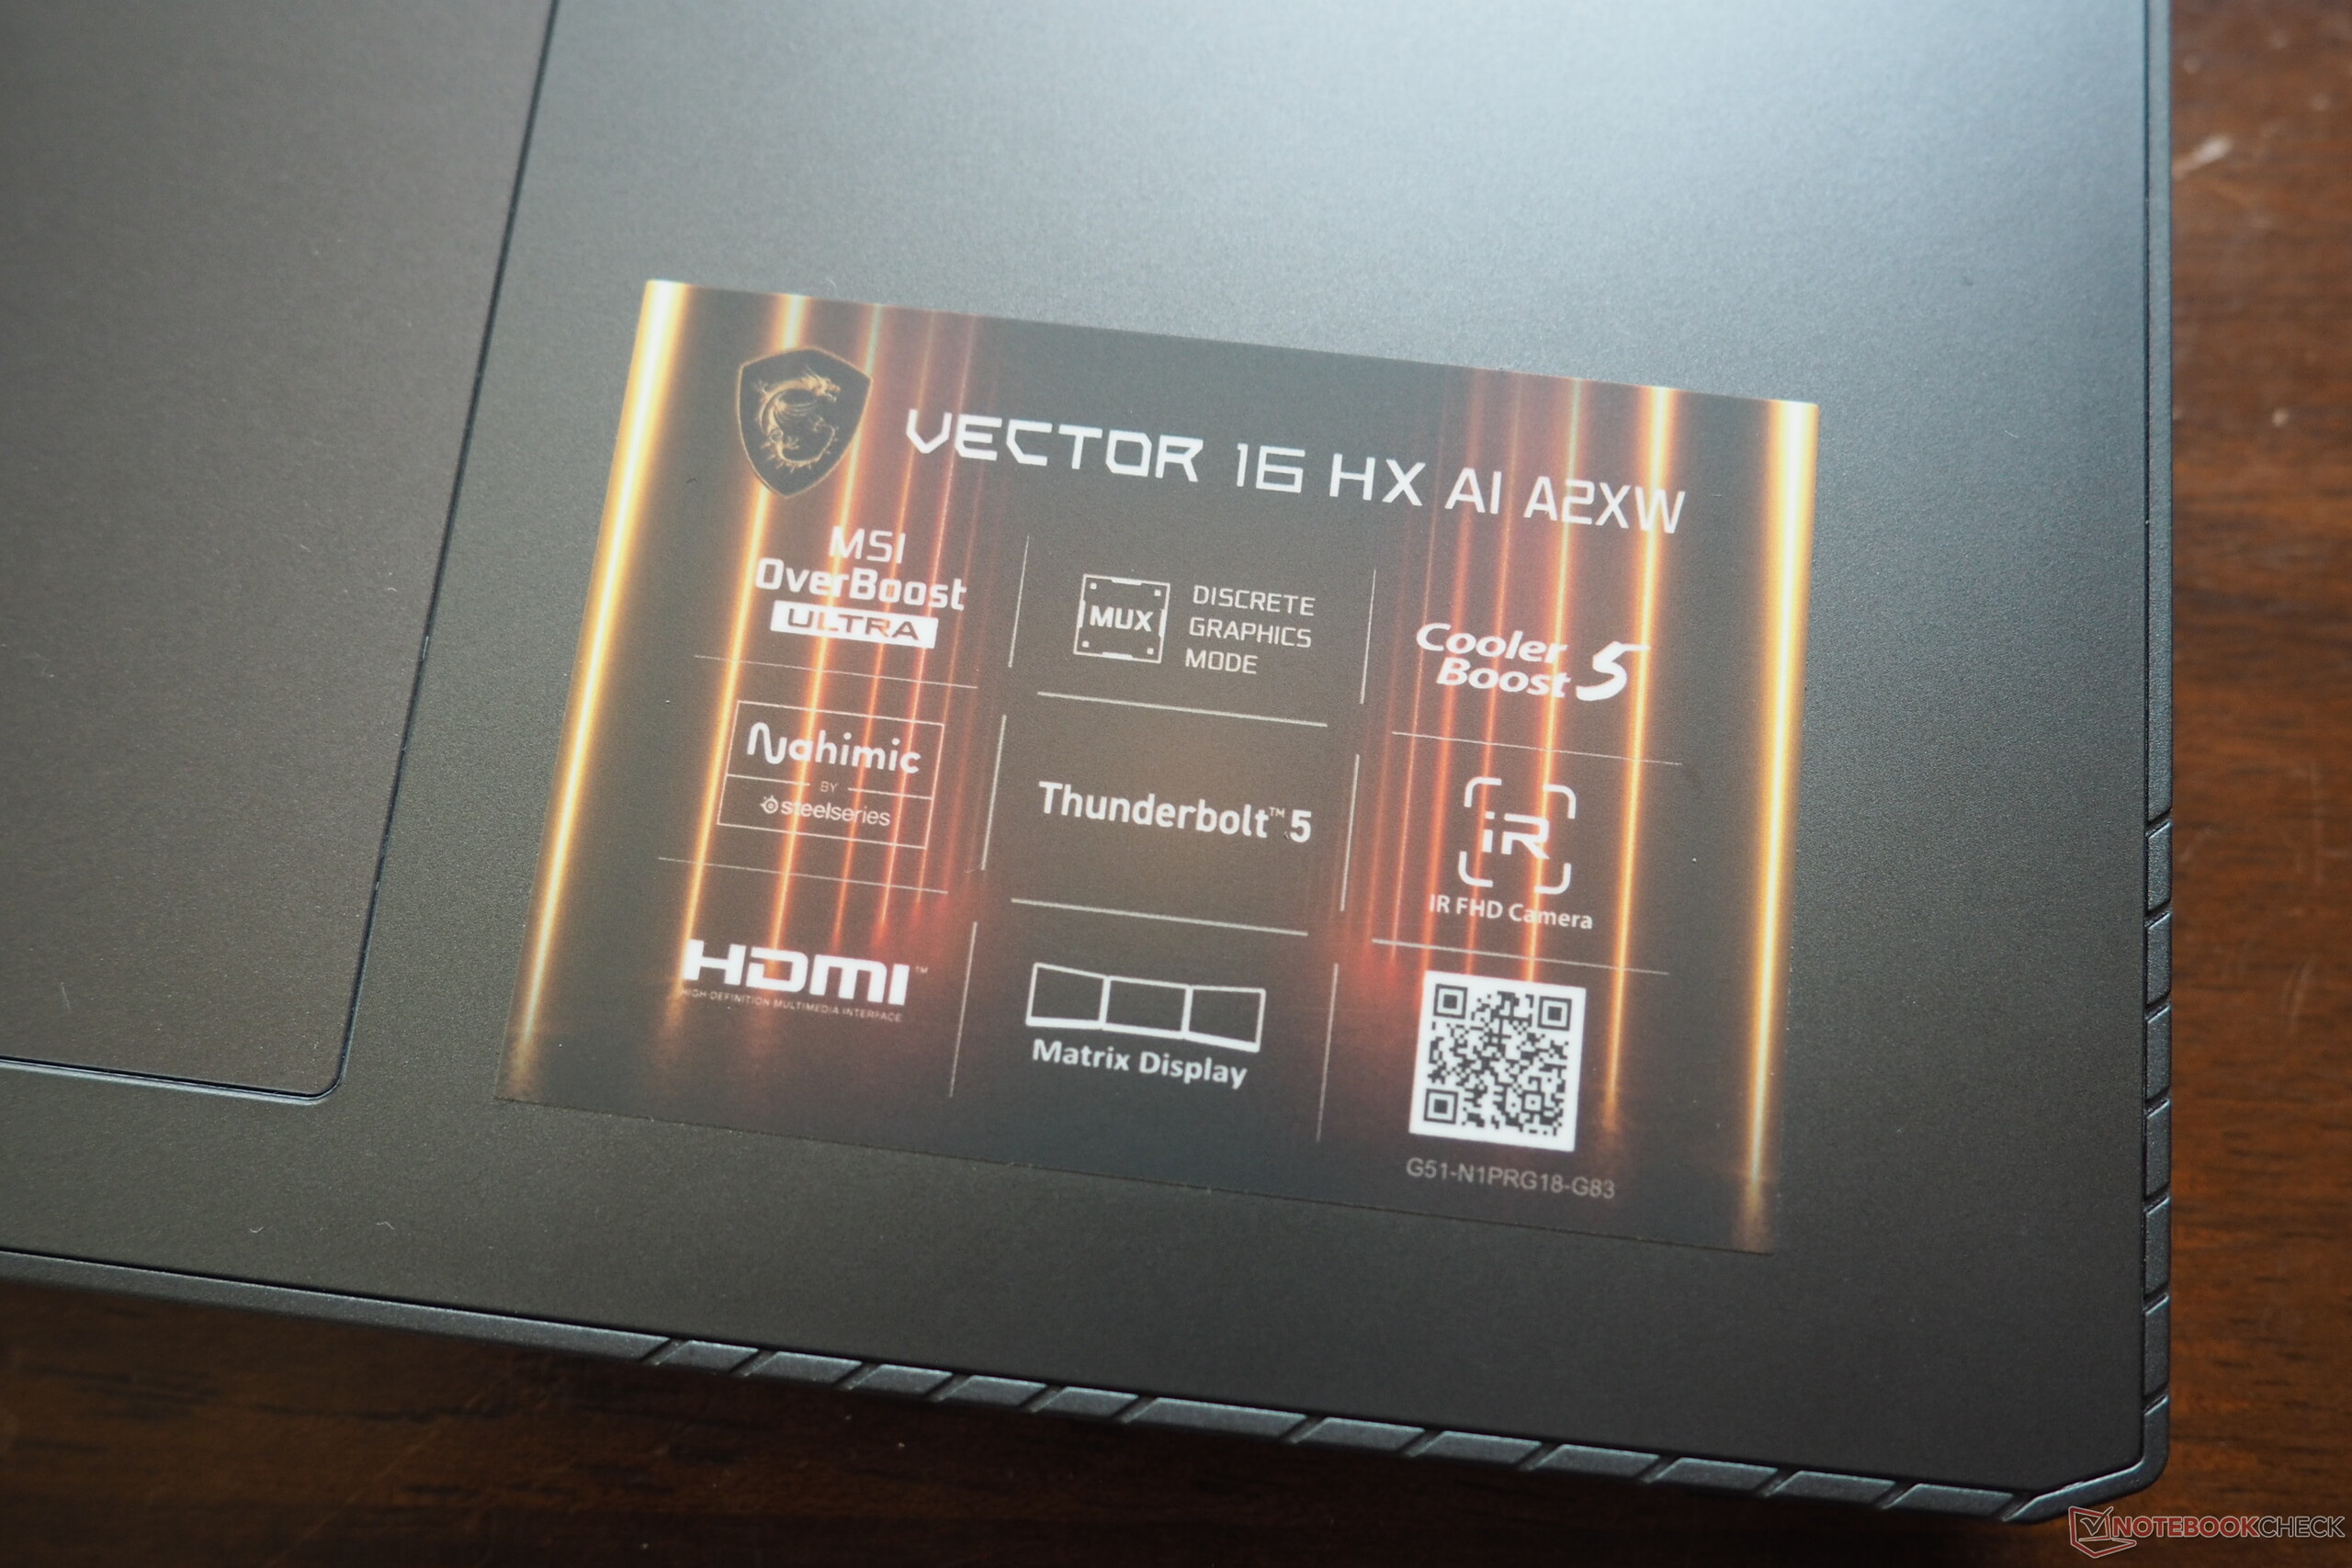
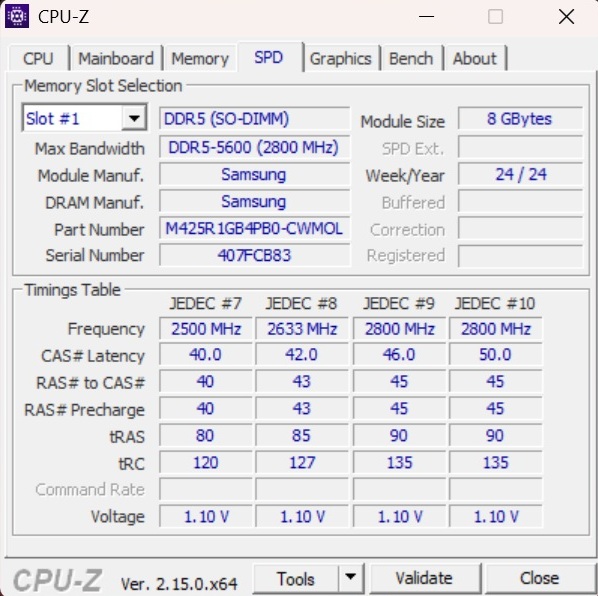
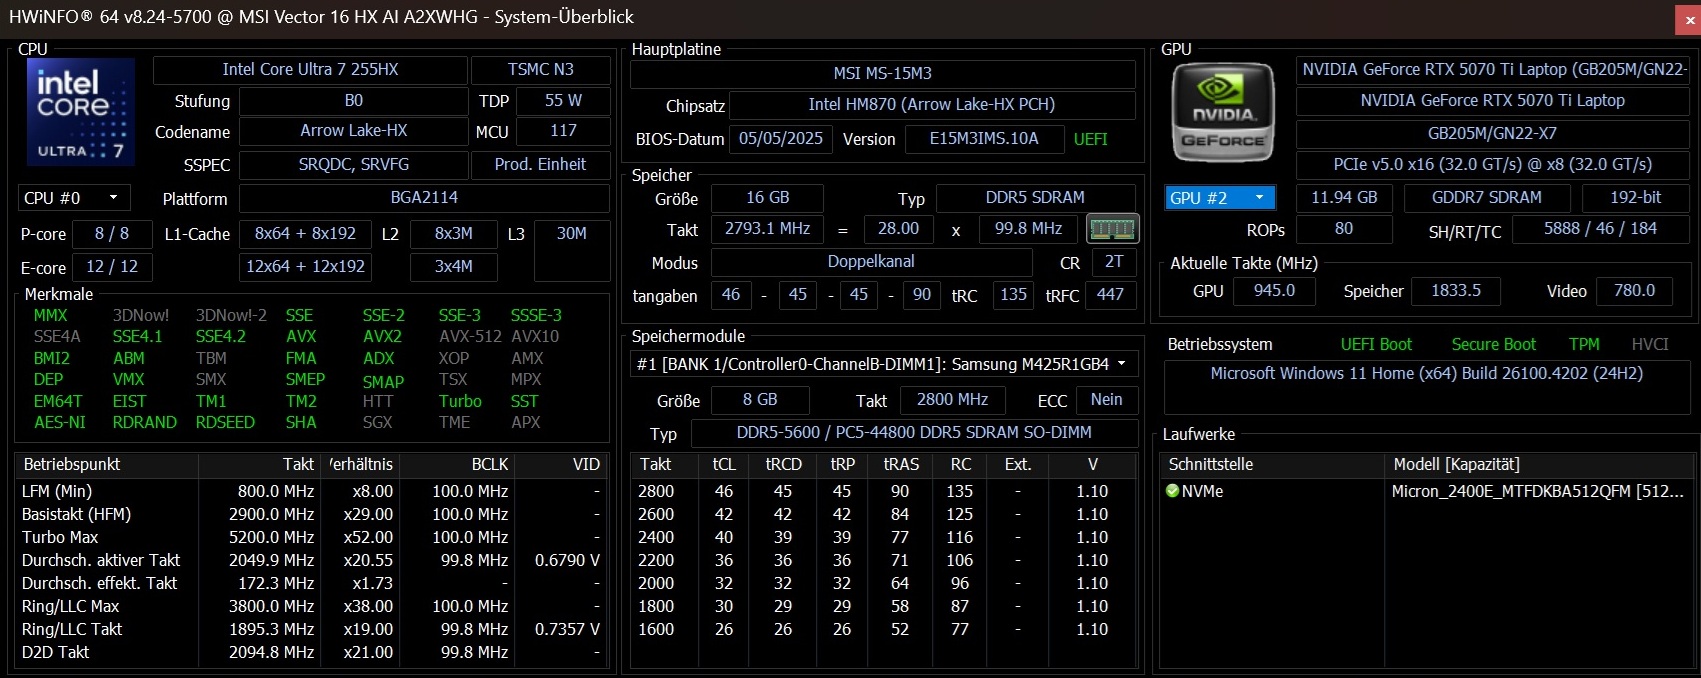
A prima vista, MSI ottiene un punteggio elevato con il Vector 16 HX AI. La configurazione A2XWHG(074) testata, al prezzo di circa 2.000 euro, offre una serie di funzionalità forti, anche se l'SSD da 512 GB, relativamente modesto, si distingue come una limitazione notevole. Anche se 16 GB di RAM DDR5-5600 (2x 8 GB SO-DIMM) potrebbero non suscitare un entusiasmo sfrenato, il Core Ultra 7 255HX e la RTX 5070 Ti di GeForce, con 12 GB di VRAM GDDR7, promettono una grande potenza di gioco. Il display IPS colpisce per la risoluzione nitida di 2.560 per 1.600, la frequenza di aggiornamento fluida di 240 hertz e la copertura quasi completa degli spazi colore sRGB e DCI-P3. Tra le caratteristiche di spicco c'è l'abbondante connettività, con due porte Thunderbolt 5.
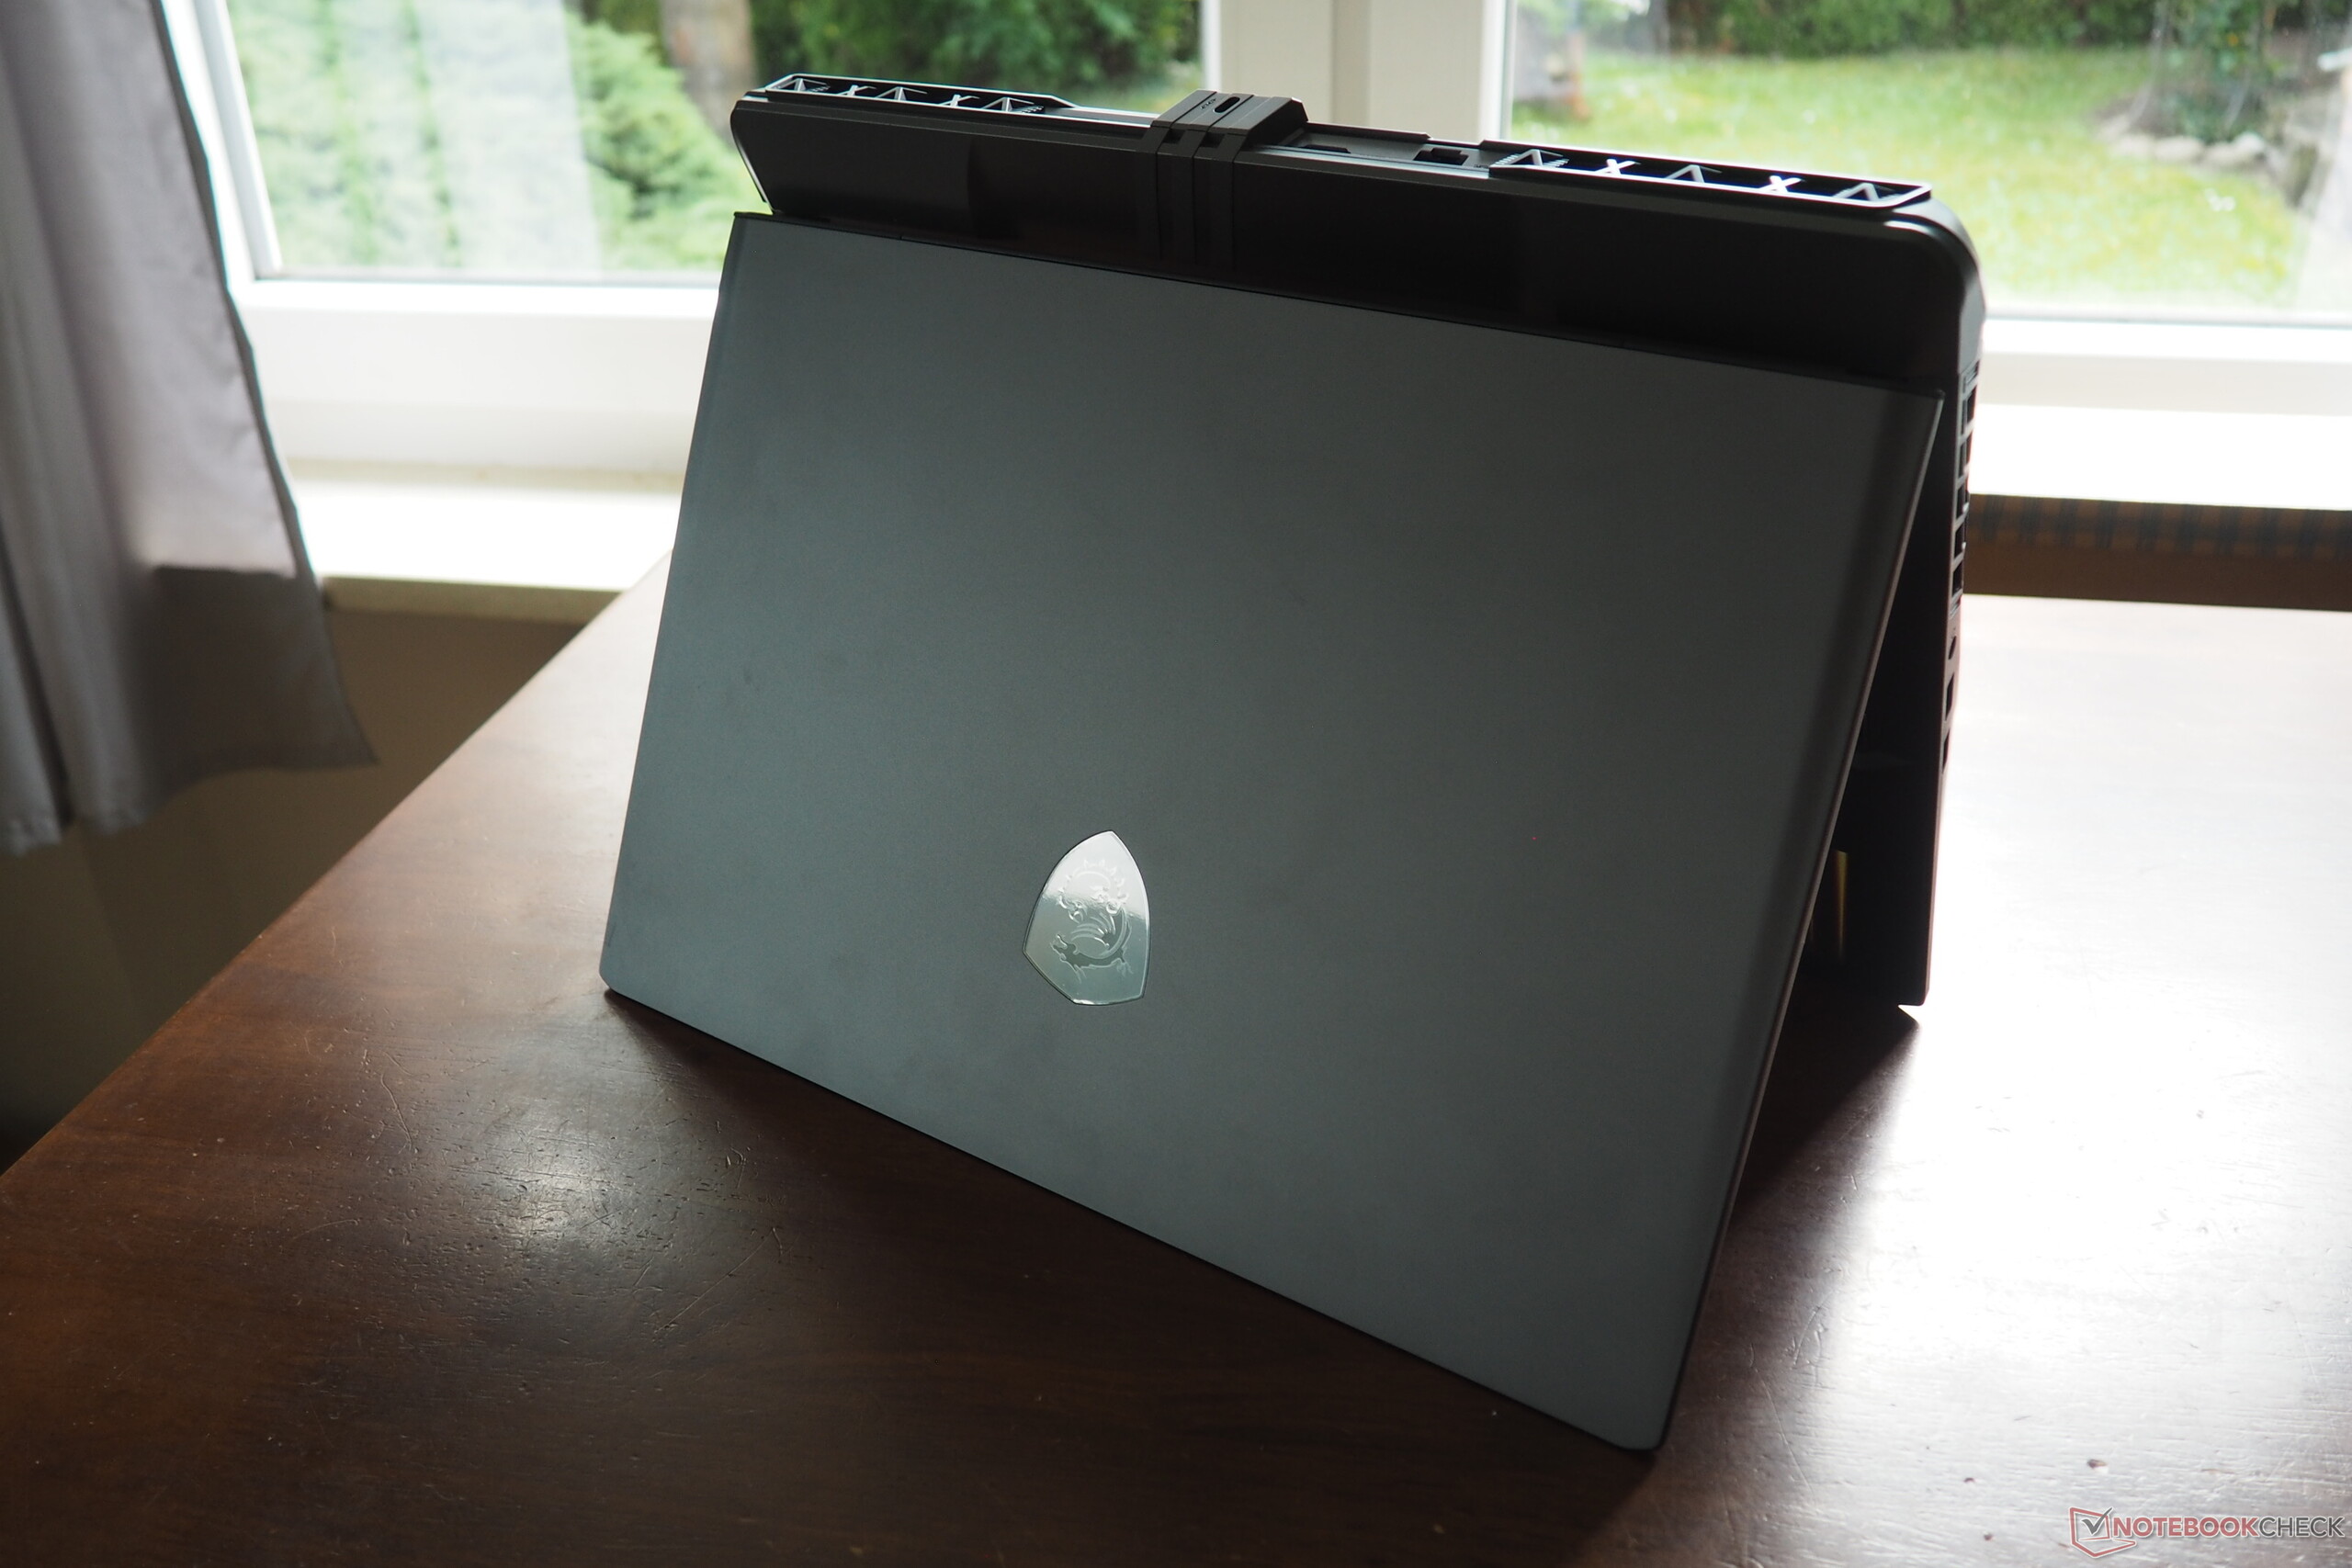
Osservando più da vicino i singoli aspetti, emergono alcune critiche. Ad esempio, sebbene lo chassis sia generalmente ben progettato, offre un angolo di apertura relativamente limitato e una parte posteriore notevolmente ingombrante. Anche il layout della tastiera, come tipico di MSI, è una questione di preferenze personali. L'alimentatore è particolarmente pesante sia in termini di dimensioni che di peso, e sarebbe più appropriato per un notebook con RTX 5080 o 5090. Ciò che abbiamo trovato più frustrante, tuttavia, è stato il controllo non ottimale della ventola. In modalità AI, il Vector 16 rimane chiaramente udibile anche quando è inattivo. Nel complesso, questa macchina da 16 pollici si guadagna comunque una solida valutazione complessiva, anche se manca di poco il 'Molto buono'.
Pro
Contro
Prezzo e disponibilità
MSI Vector 16 HX AI A2XWHG, equipaggiato con Core Ultra 7 255HX e GeForce RTX 5070 Ti, è disponibile presso vari rivenditori online, con prezzi a partire da circa 2.100 dollari. La disponibilità può variare a seconda della regione.
- $2,089.00HIDevolution [2025] MSI Vector 16 HX AI A2XWHG 16" QHD+ 240Hz, 2.1 GHz Ultra 9-275HX, RTX 5070TI, 16 GB DDR5 RAM, 2 TB PCIe SSD, Windows 11 Pro
- $2,849.00HIDevolution [2025] MSI Vector 16 HX AI A2XWHG 16" QHD+ 240Hz, 2.1 GHz Ultra 9-275HX, RTX 5070TI, 32 GB DDR5 RAM, 2 TB PCIe SSD, Windows 11 Pro
Tra i concorrenti del Vector 16 ci sono altri portatili da gioco di recente uscita nella gamma da 16 a 17 pollici, come lo Schenker XMG Pro 16 E25e l'Alienware 16 Area-51 Alienware 16 Area-51e il modello di MSI Katana 17 HX. Il modello precedenteche abbiamo recensito con un Core i9-14900HX e GeForce RTX 4080) compare anche nelle nostre tabelle di confronto.
Specifiche
Telaio
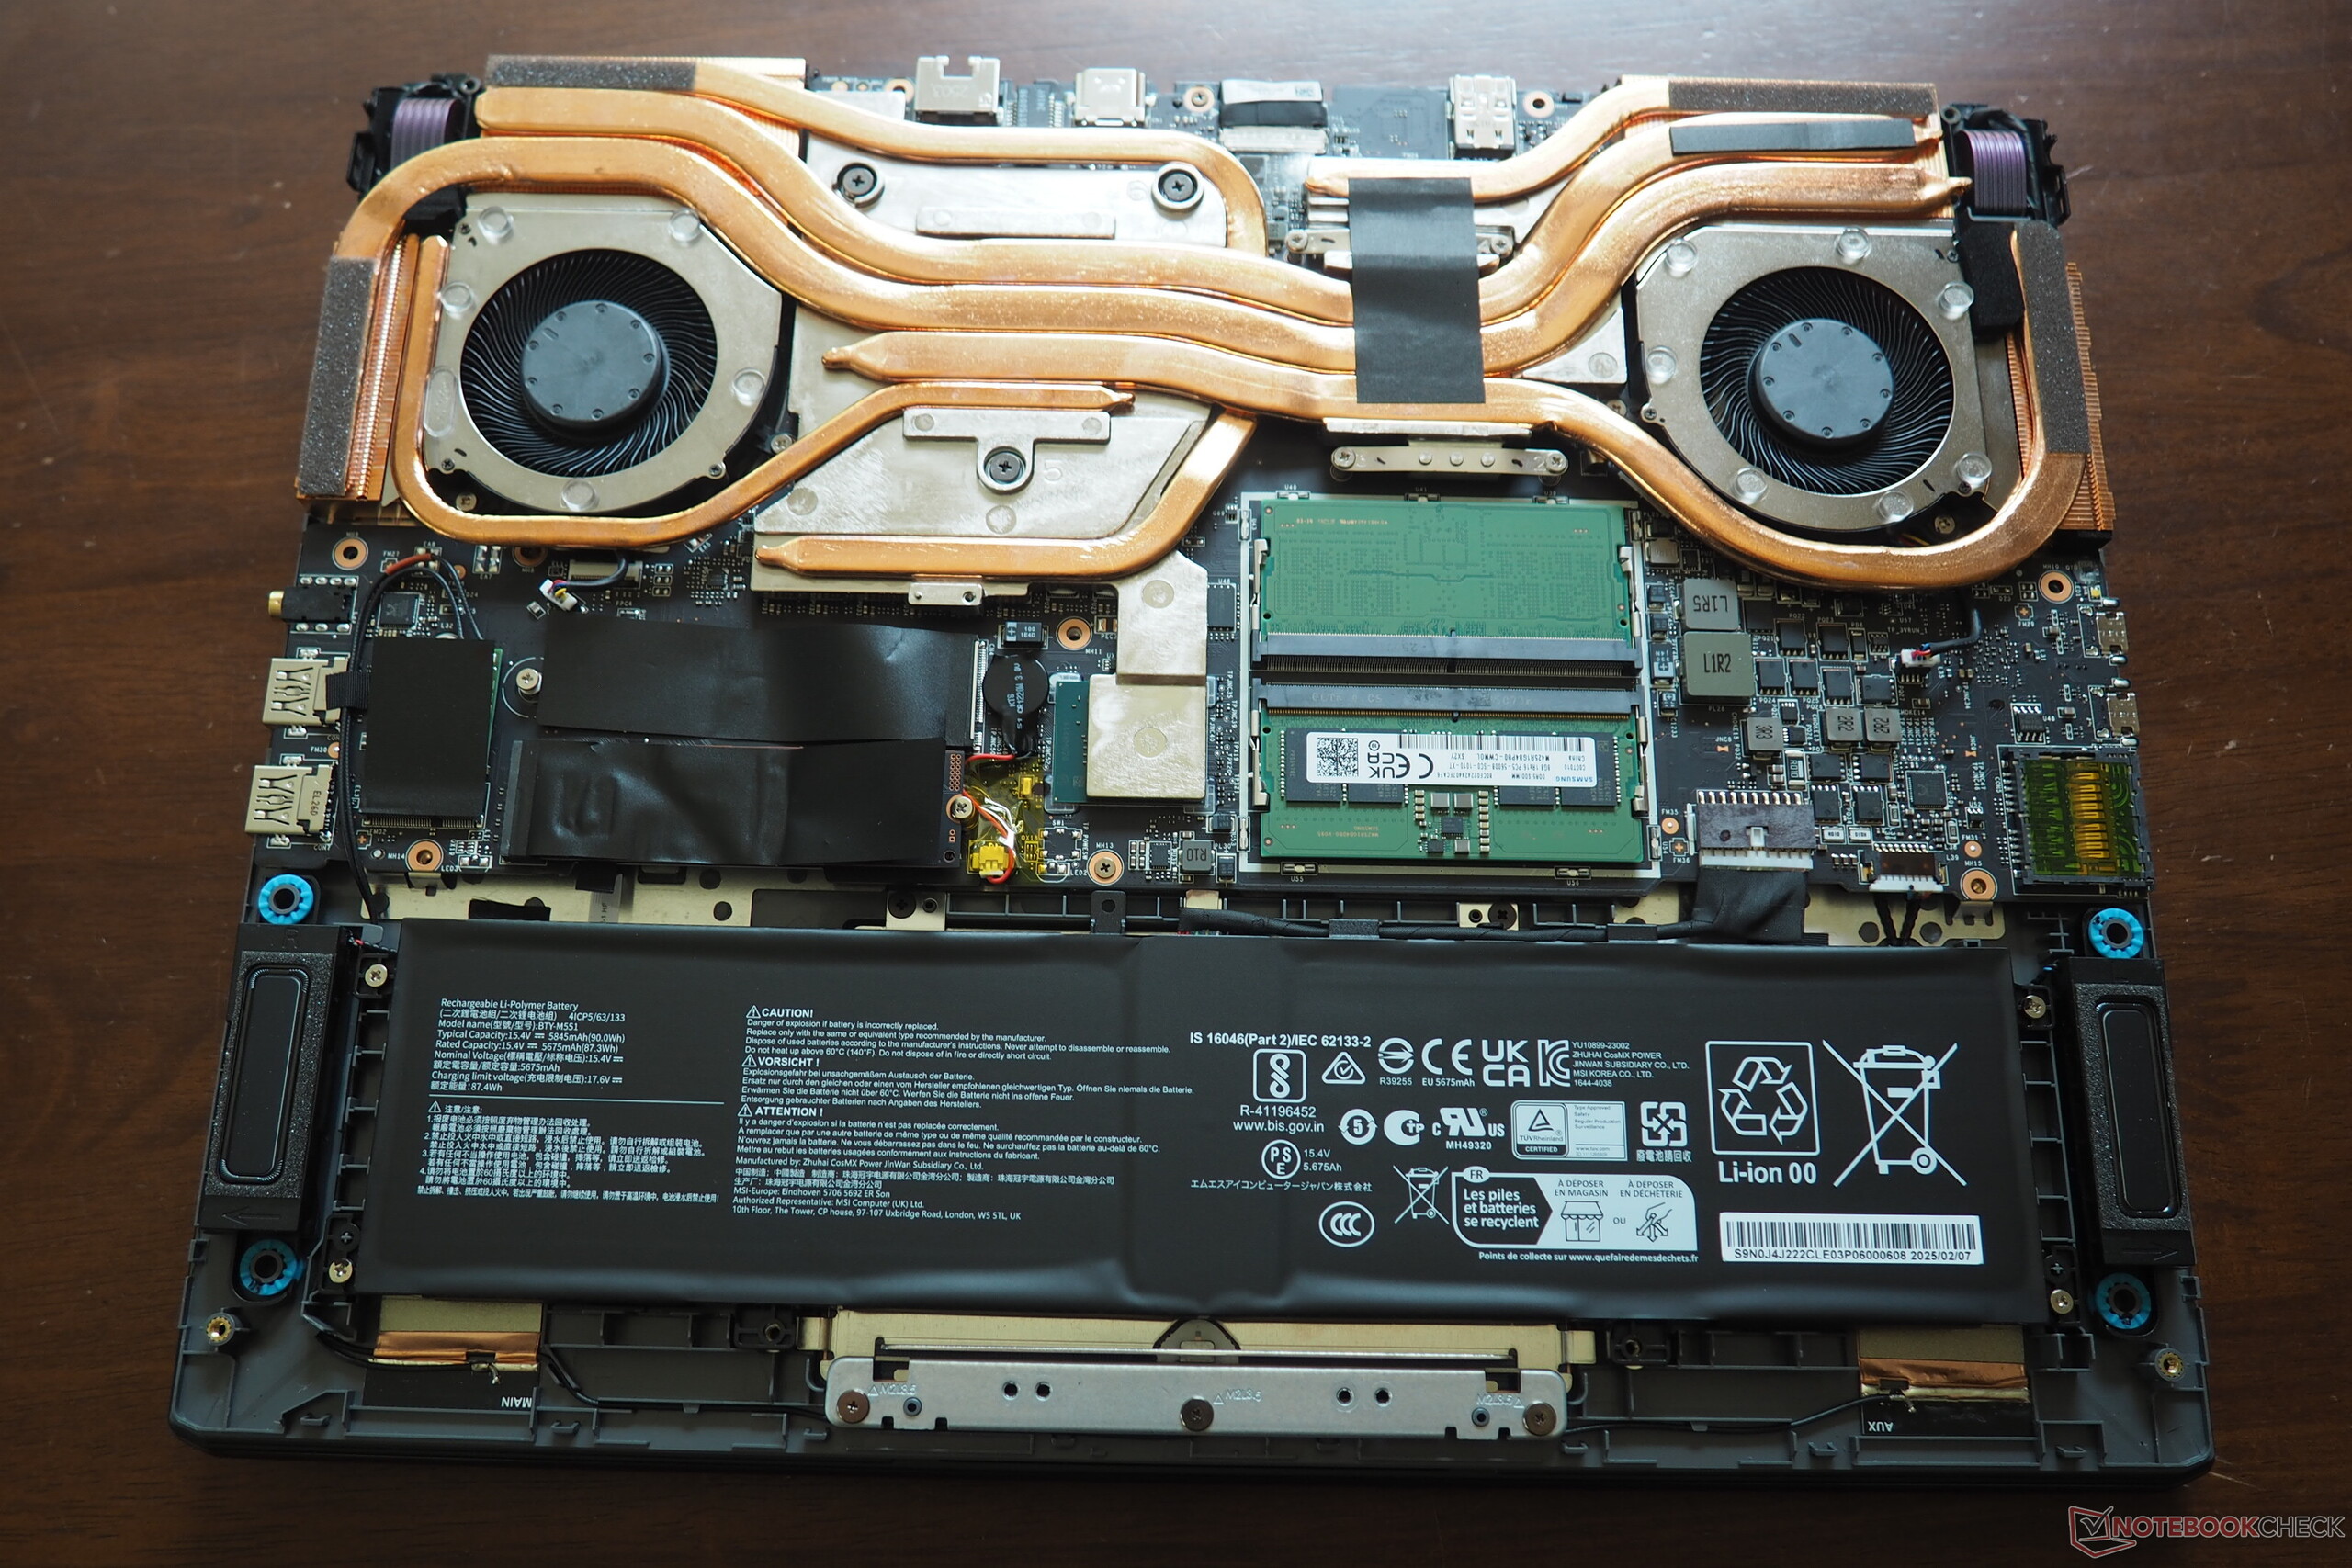
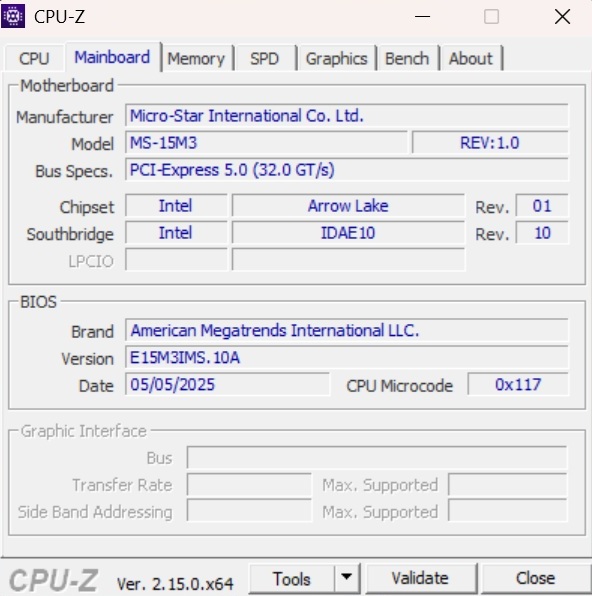
Il telaio conserva in gran parte il linguaggio di design del suo predecessorecon sottili perfezionamenti, in particolare nella selezione e nella disposizione delle porte. In termini di qualità costruttiva, offre una sensazione decisamente più solida e premium rispetto al Katana 17, un po' fragile e inconsistente. Anche se solo il coperchio è in metallo, l'unità di base sembra comunque solida e ben costruita. Le linee decise e le forme sorprendenti si rivolgono chiaramente ad un pubblico di giocatori. Con un peso di 2,6 kg, il Vector 16 HX AI si colloca perfettamente tra gli altri concorrenti da 16 pollici, mentre solo l'Alienware 16 si distingue per il suo pesante telaio da 3,3 kg. Nel complesso, la qualità costruttiva lascia poco spazio alle lamentele.

Connettività e caratteristiche
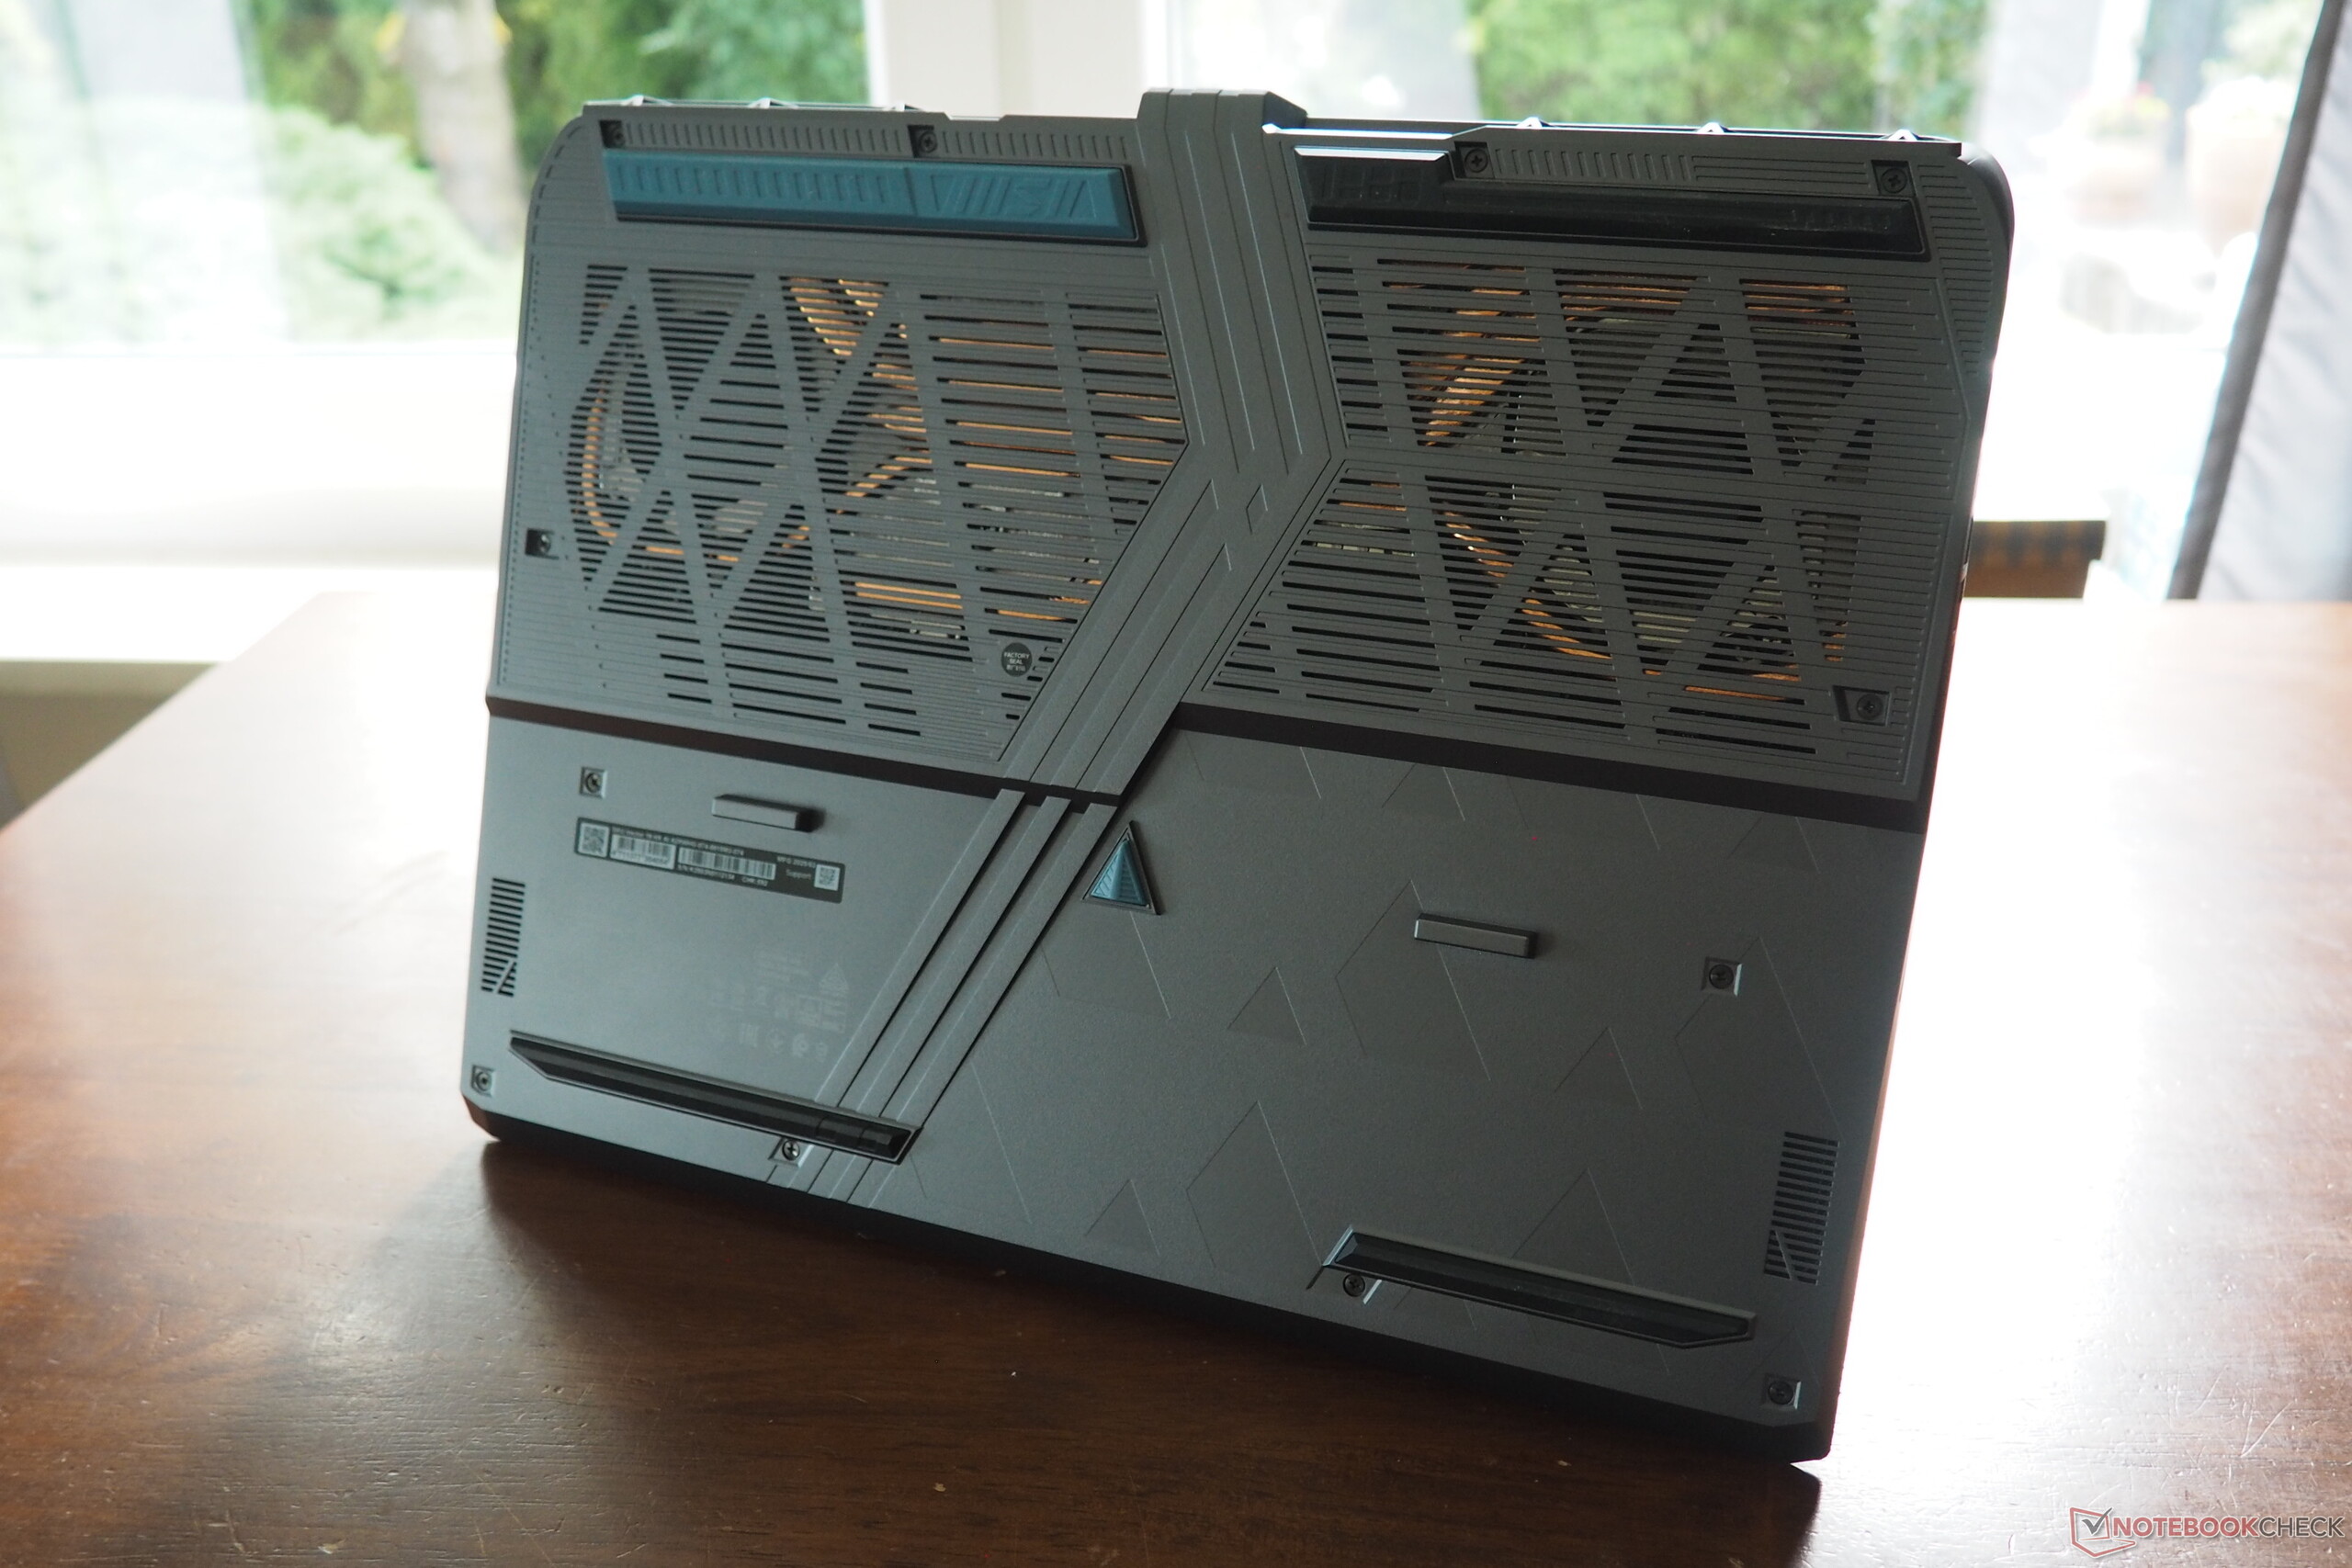
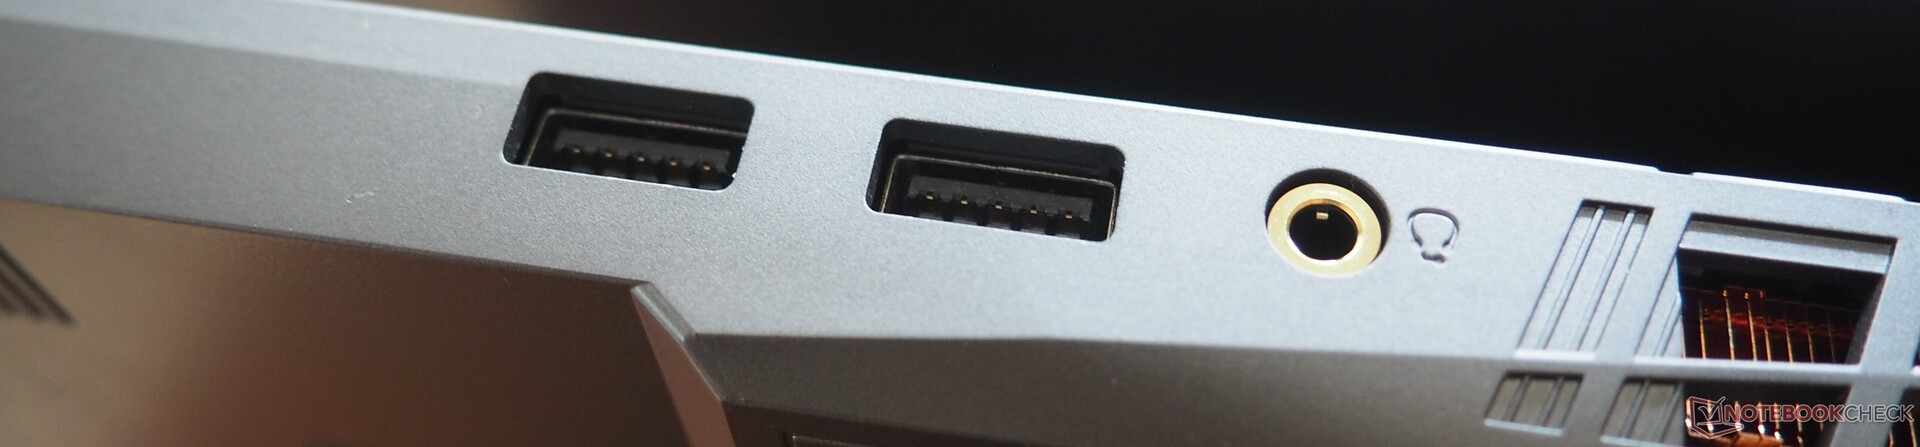
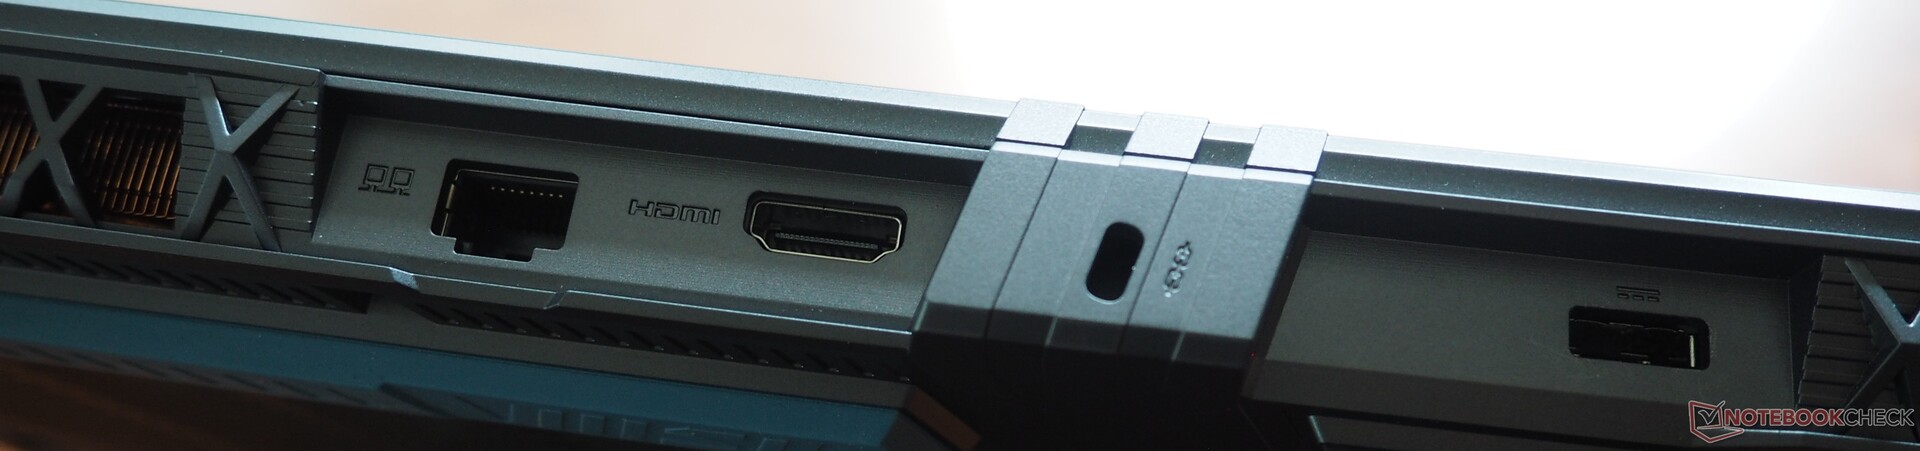
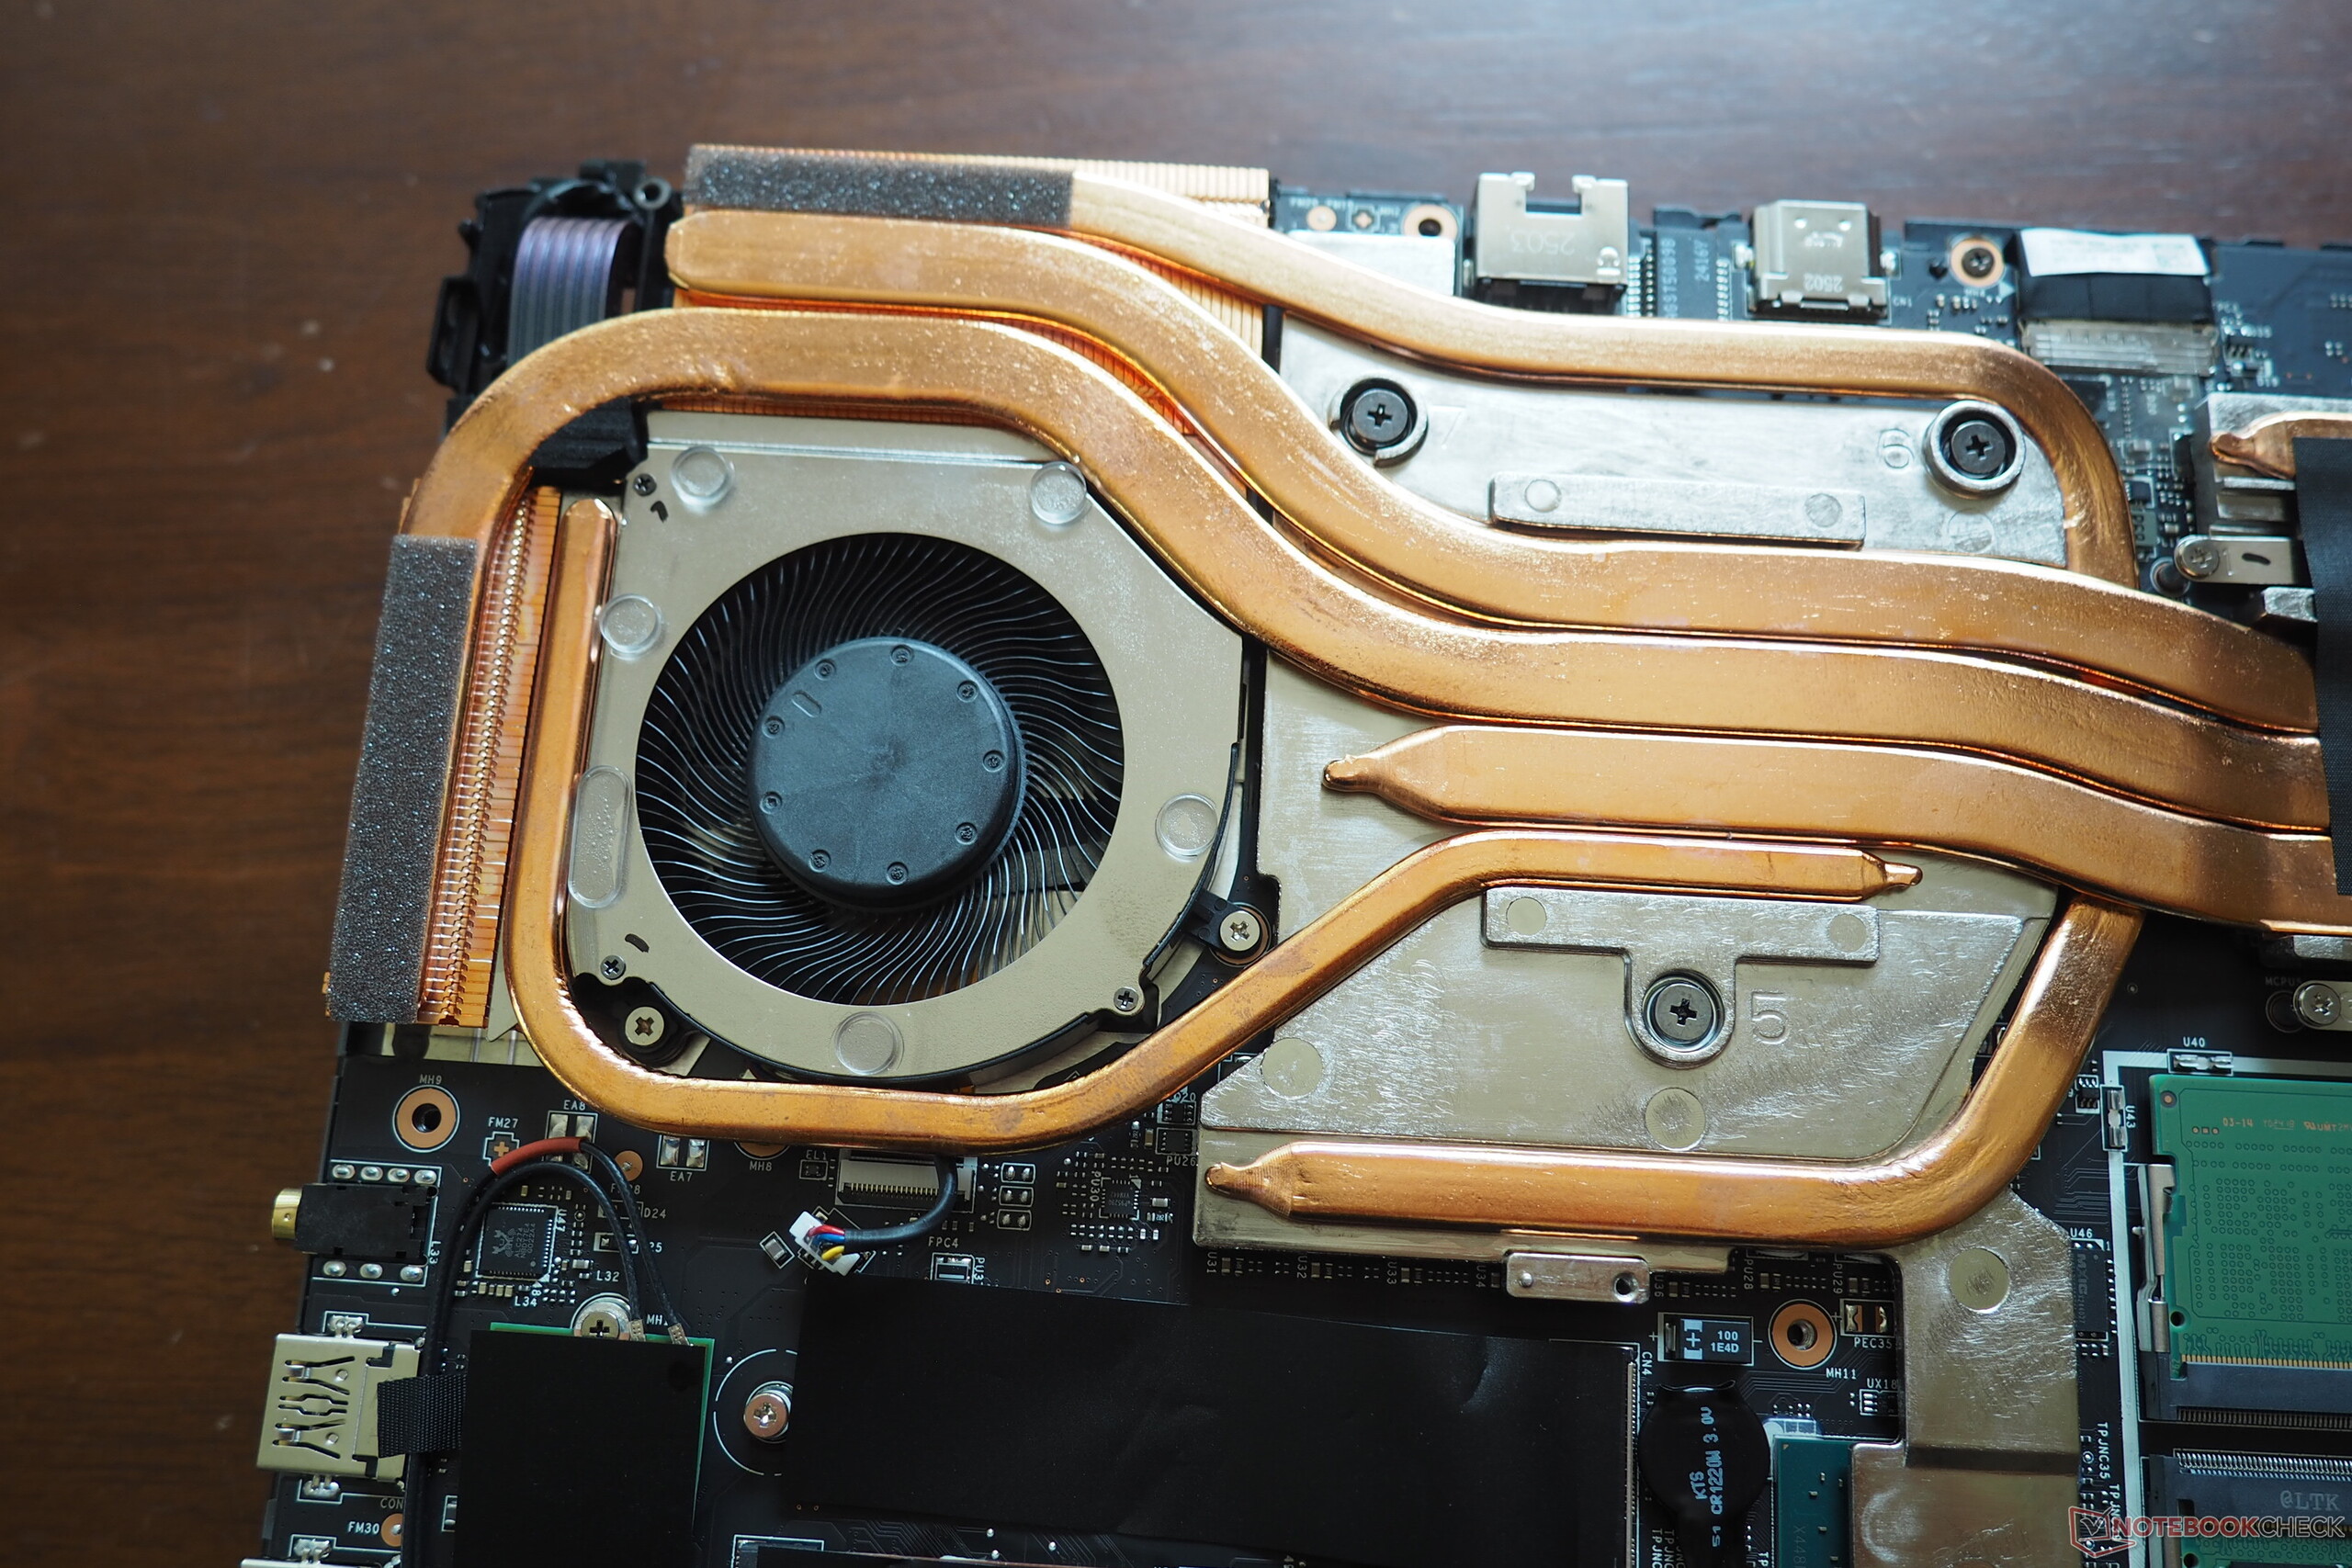
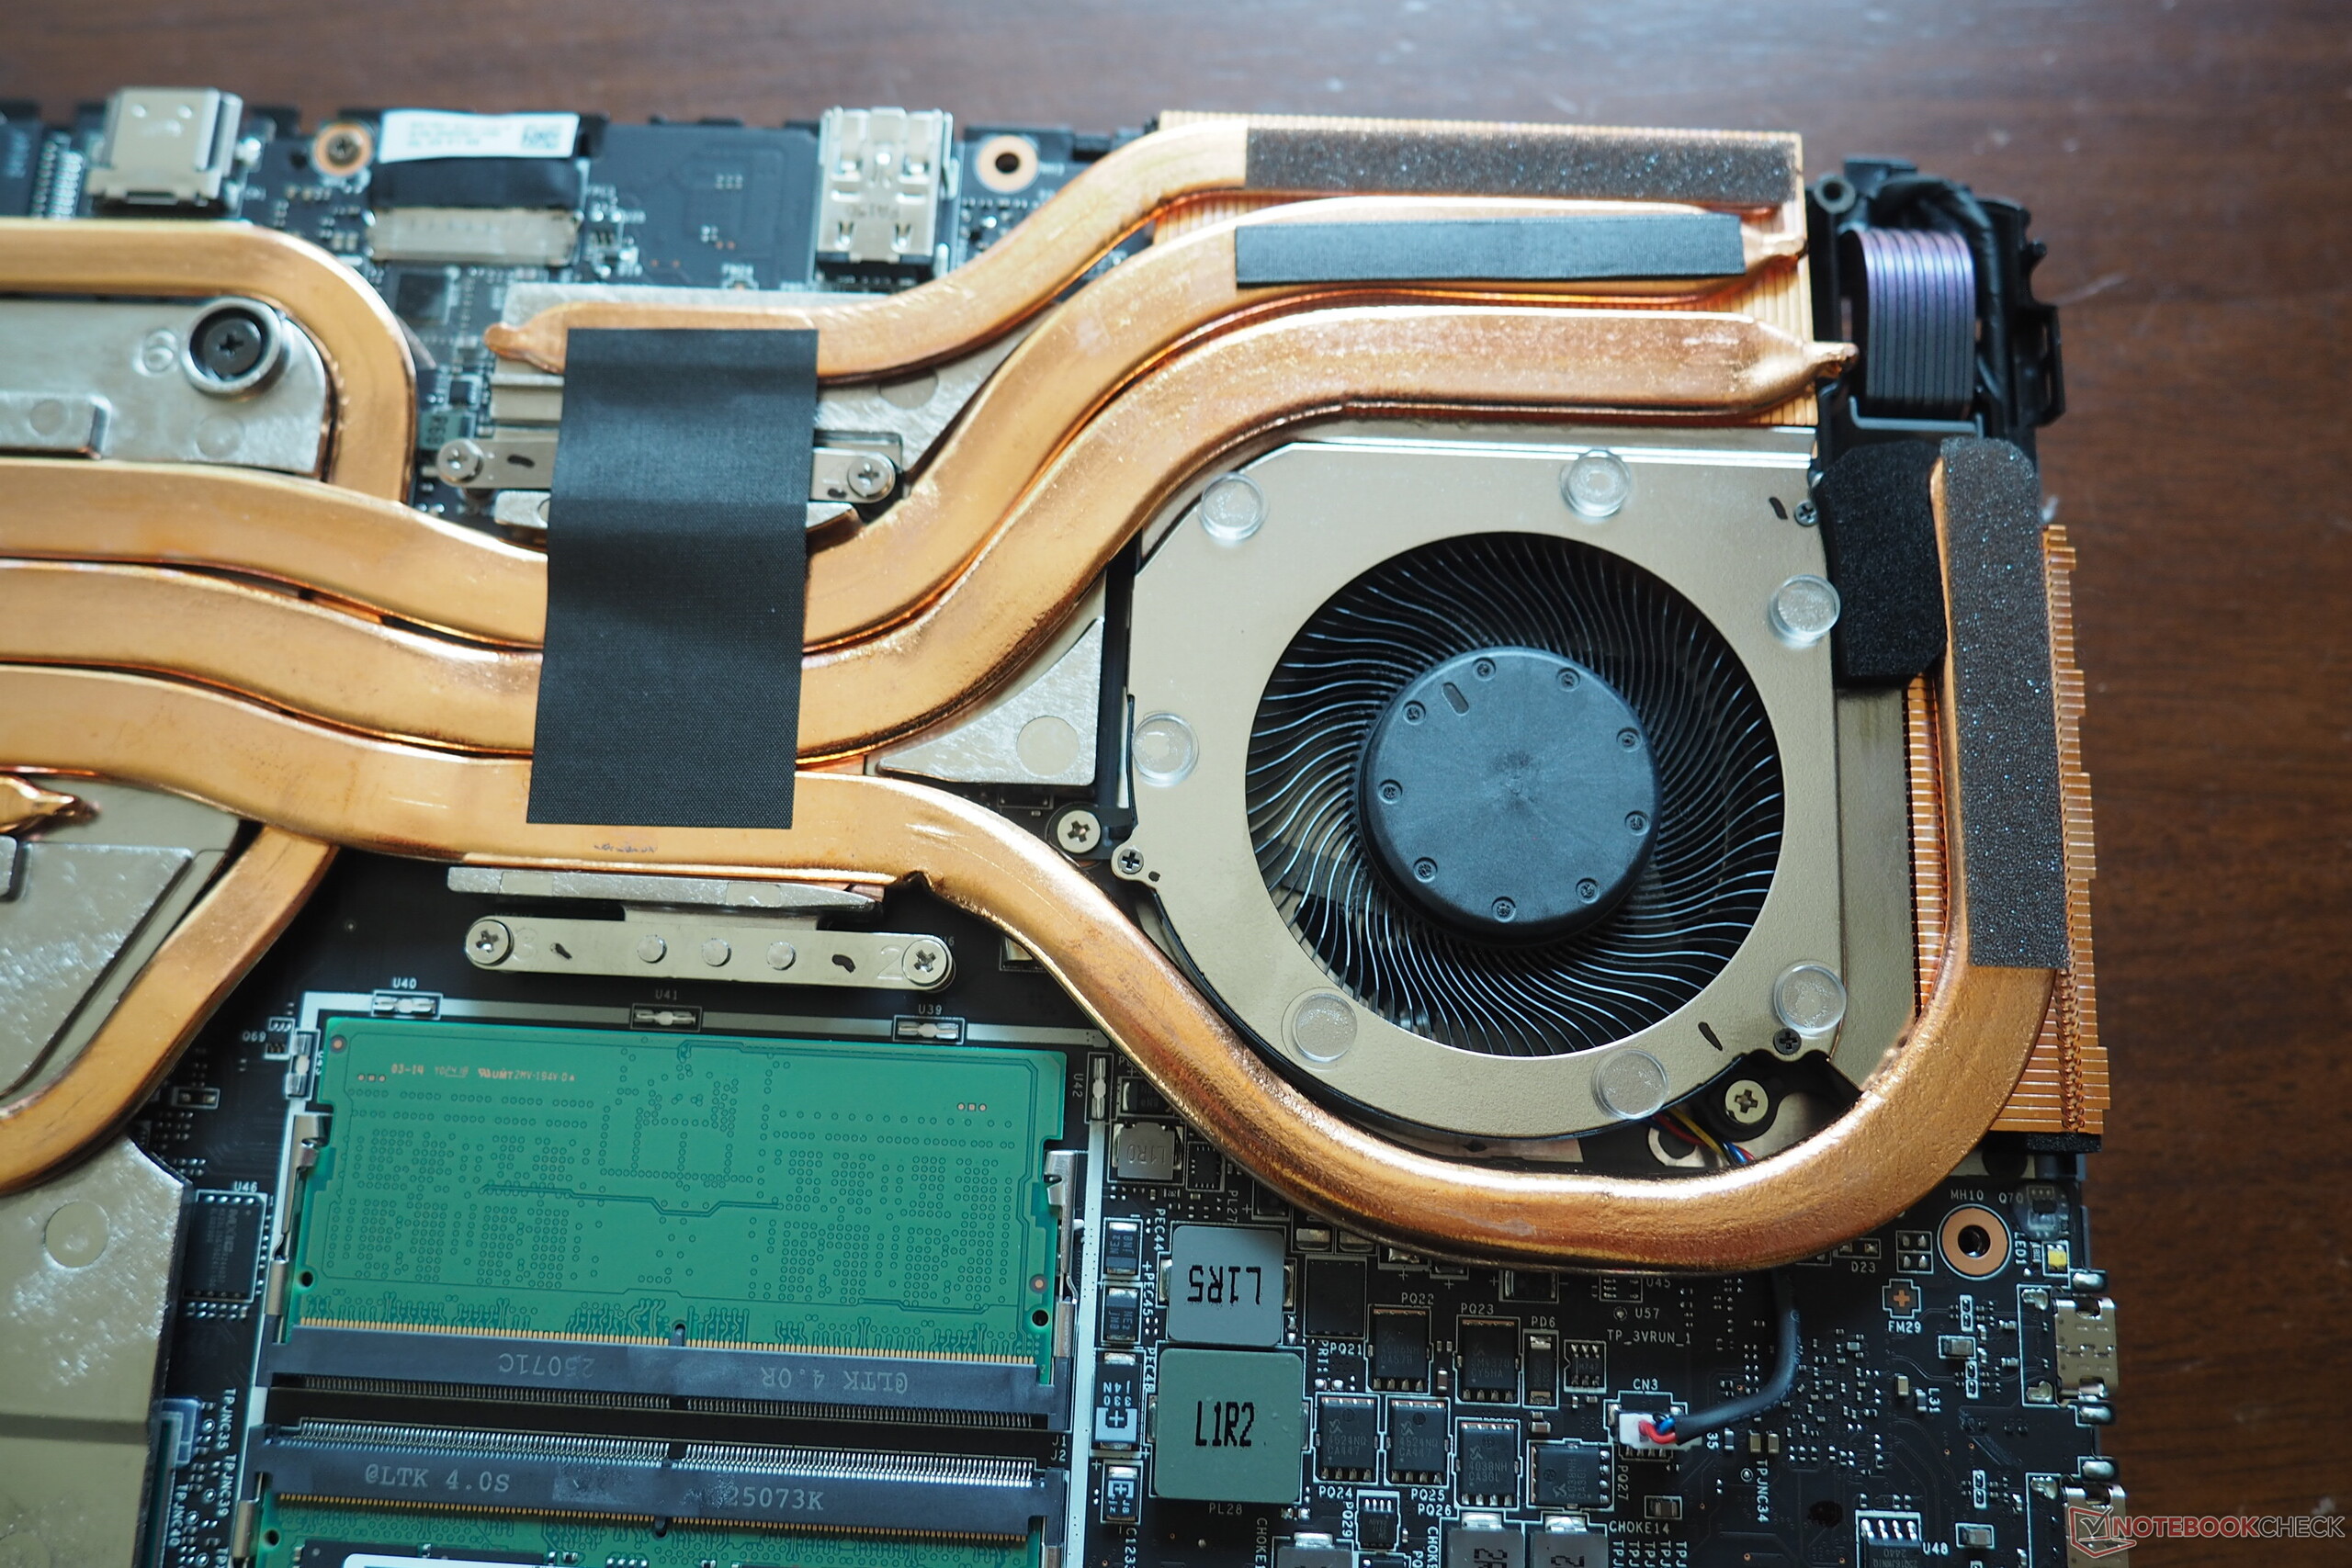
MSI fa di tutto per quanto riguarda la connettività. Sul lato sinistro, sono presenti due porte Thunderbolt 5 con supporto Power Delivery, USB 4 e DisplayPort 2.1. Il lato destro ospita due porte USB-A 3.1 Gen2. La selezione è completata da un'uscita HDMI 2.1, una porta Ethernet da 2,5 Gbit, un jack audio combinato, uno slot Kensington lock e un lettore di schede moderatamente veloce. La comunicazione wireless è gestita dal modulo Wi-Fi 6E di Intel (AX211), che offre prestazioni particolarmente elevate nella ricezione dei dati. La webcam Full HD è decente per gli standard dei notebook, anche se non particolarmente impressionante. La manutenzione rimane un po' scomoda, come nel modello precedente, in quanto lo chassis è più difficile e lungo da aprire rispetto ad altri dispositivi.

Lettore di schede SD
| SD Card Reader | |
| average JPG Copy Test (av. of 3 runs) | |
| Alienware 16 Area-51 (Toshiba Exceria Pro SDXC 64 GB UHS-II) | |
| SCHENKER XMG Pro 16 (E25) (Angelbird AV Pro V60) | |
| Media della classe Gaming (19 - 204, n=76, ultimi 2 anni) | |
| MSI Vector 16 HX A14V (Toshiba Exceria Pro SDXC 64 GB UHS-II) | |
| MSI Vector 16 HX AI A2XWHG (AV PRO microSD 128 GB V60) | |
| maximum AS SSD Seq Read Test (1GB) | |
| SCHENKER XMG Pro 16 (E25) (Angelbird AV Pro V60) | |
| Alienware 16 Area-51 (Toshiba Exceria Pro SDXC 64 GB UHS-II) | |
| Media della classe Gaming (25.8 - 261, n=75, ultimi 2 anni) | |
| MSI Vector 16 HX A14V (Toshiba Exceria Pro SDXC 64 GB UHS-II) | |
| MSI Vector 16 HX AI A2XWHG (AV PRO microSD 128 GB V60) | |
Comunicazione
Webcam


Manutenzione
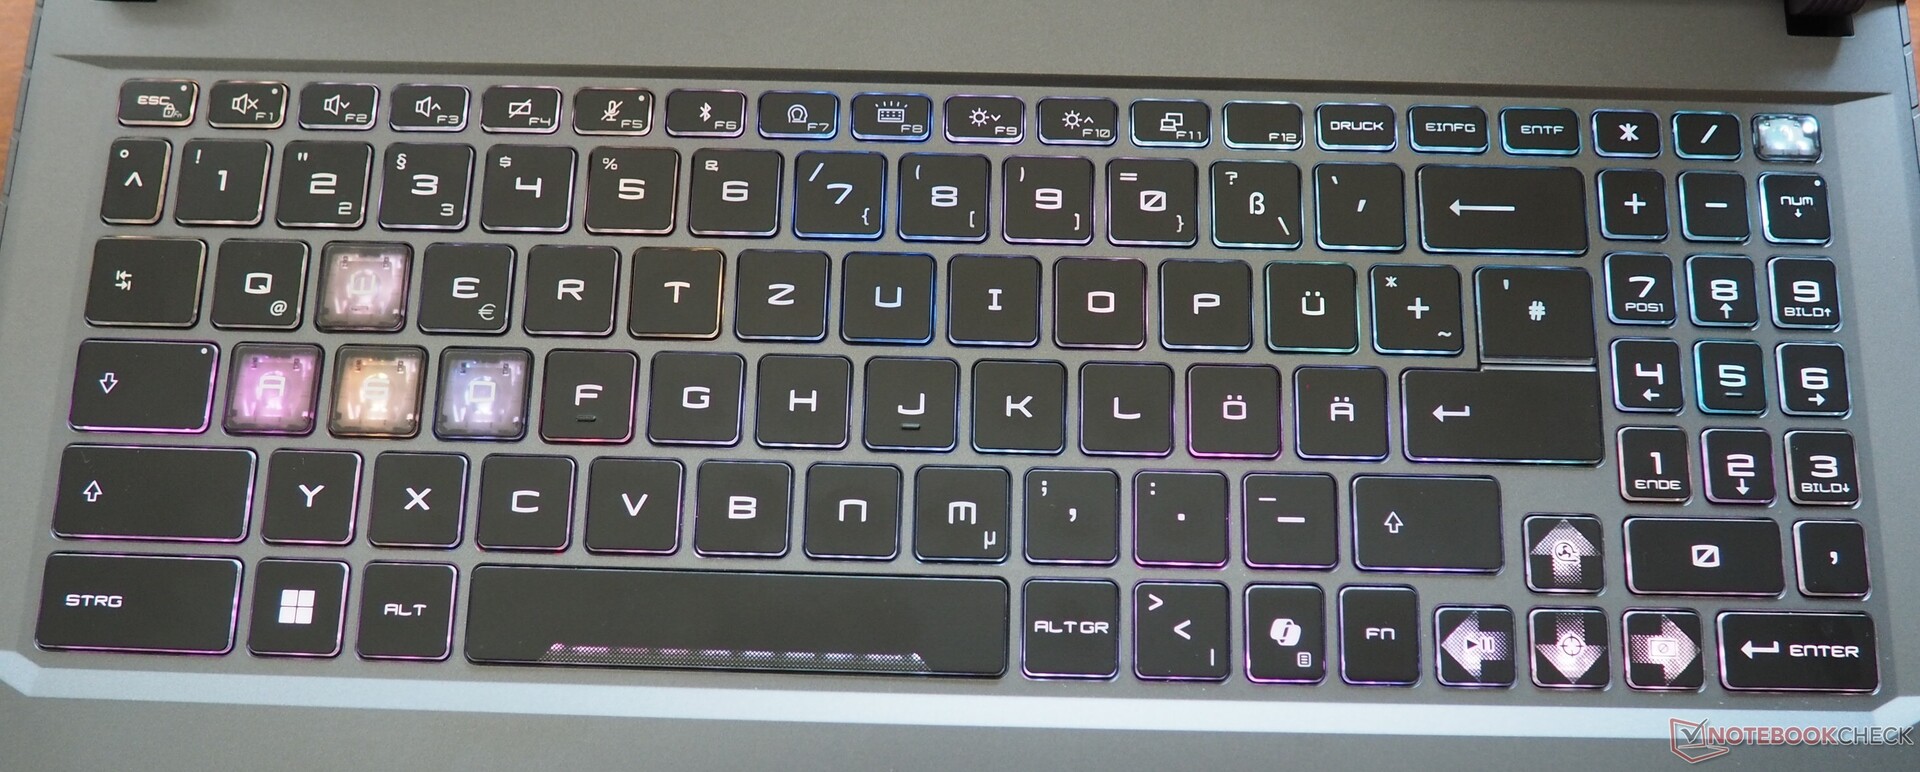
Dispositivi di ingresso
MSI ha mantenuto il suo layout di tastiera piuttosto anticonvenzionale per diversi anni, e ci vuole un po' di tempo per abituarsi. Il posizionamento di molti tasti non segue il layout standard. Anche la decisione di utilizzare un tastierino numerico a tre colonne anziché il più comune a quattro colonne ci sembra un po' strana. In termini di sensazione di digitazione, la tastiera si comporta complessivamente bene, anche se naturalmente non può eguagliare la qualità tattile dei modelli meccanici. Un punto a favore è l'ampia illuminazione RGB, che può essere personalizzata individualmente. Il touchpad misura un generoso 13 cm per 8 cm e offre uno scorrimento fluido e una solida precisione. Le aree cliccabili lungo il bordo inferiore rispondono in modo affidabile, anche se per i nostri gusti sono un po' fragili.
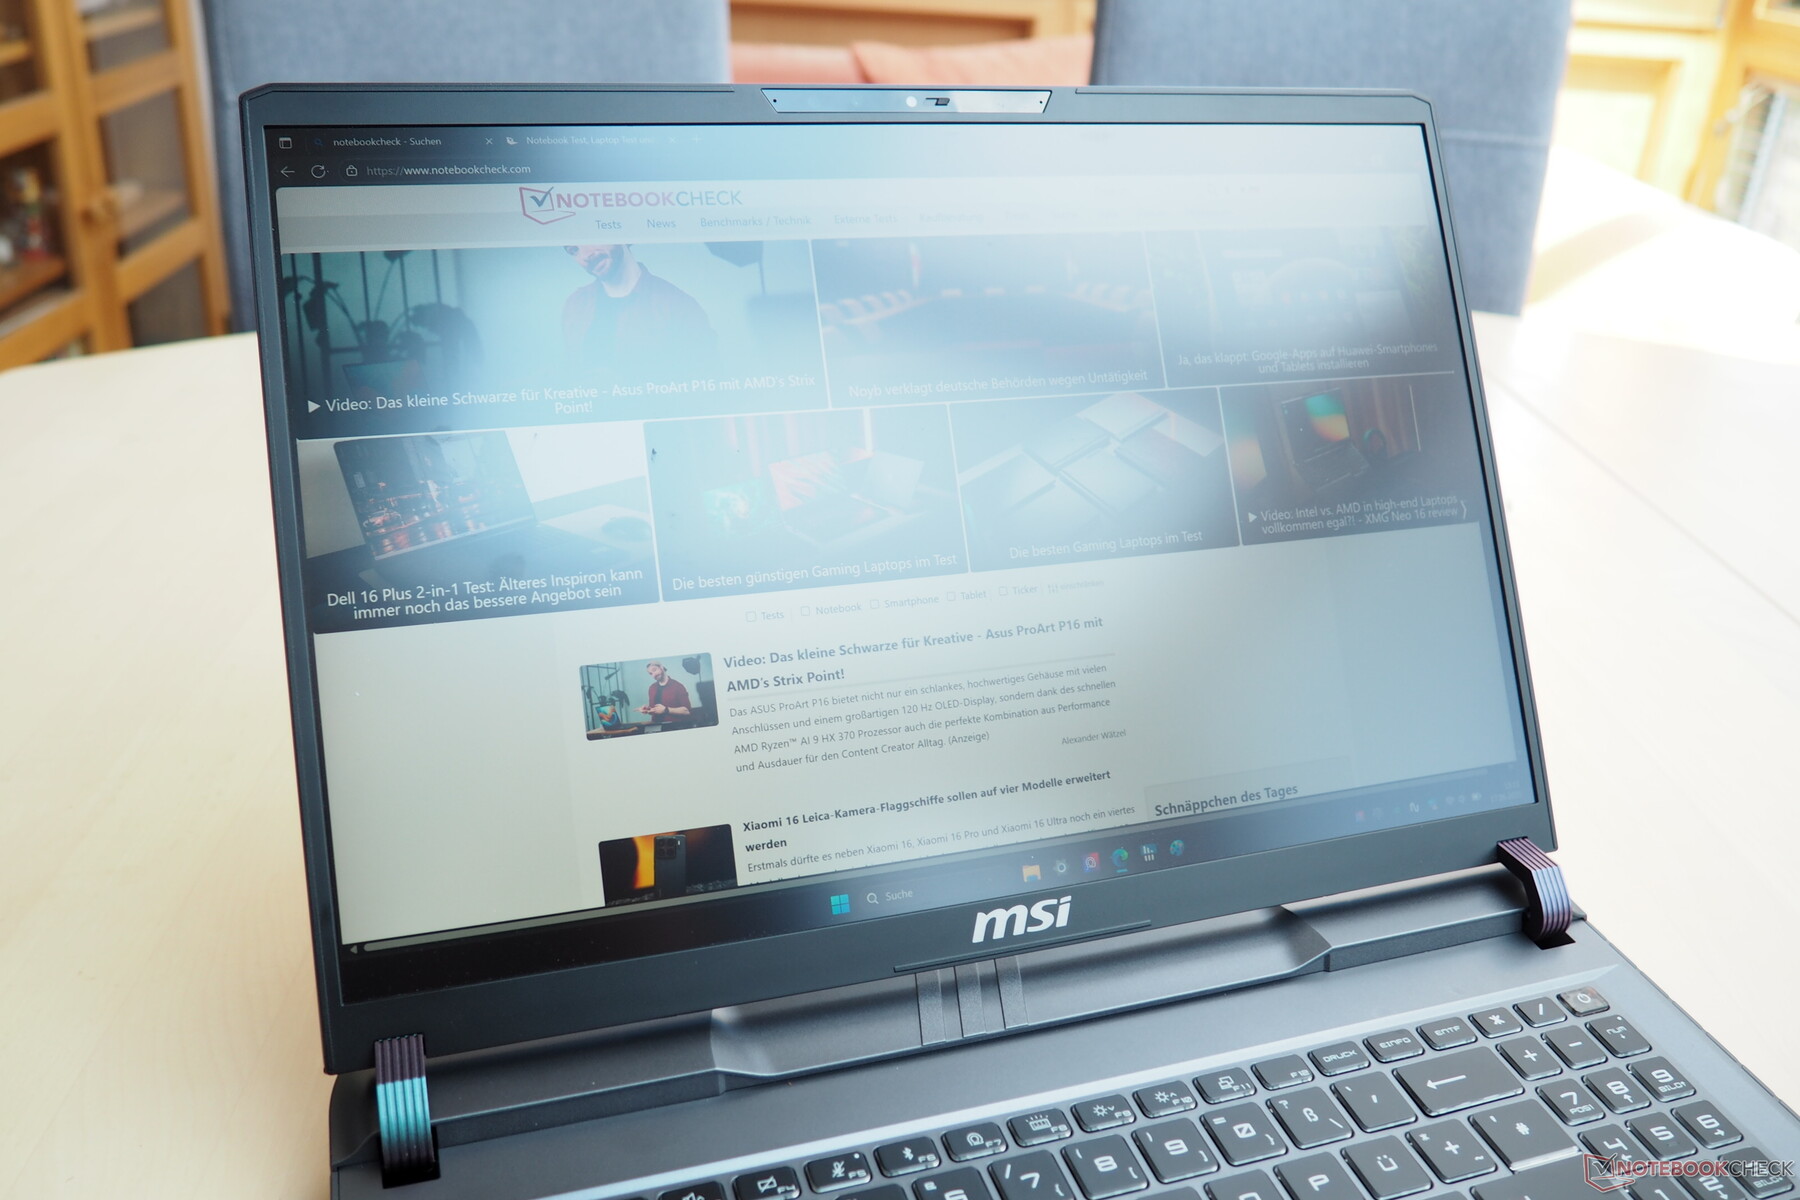
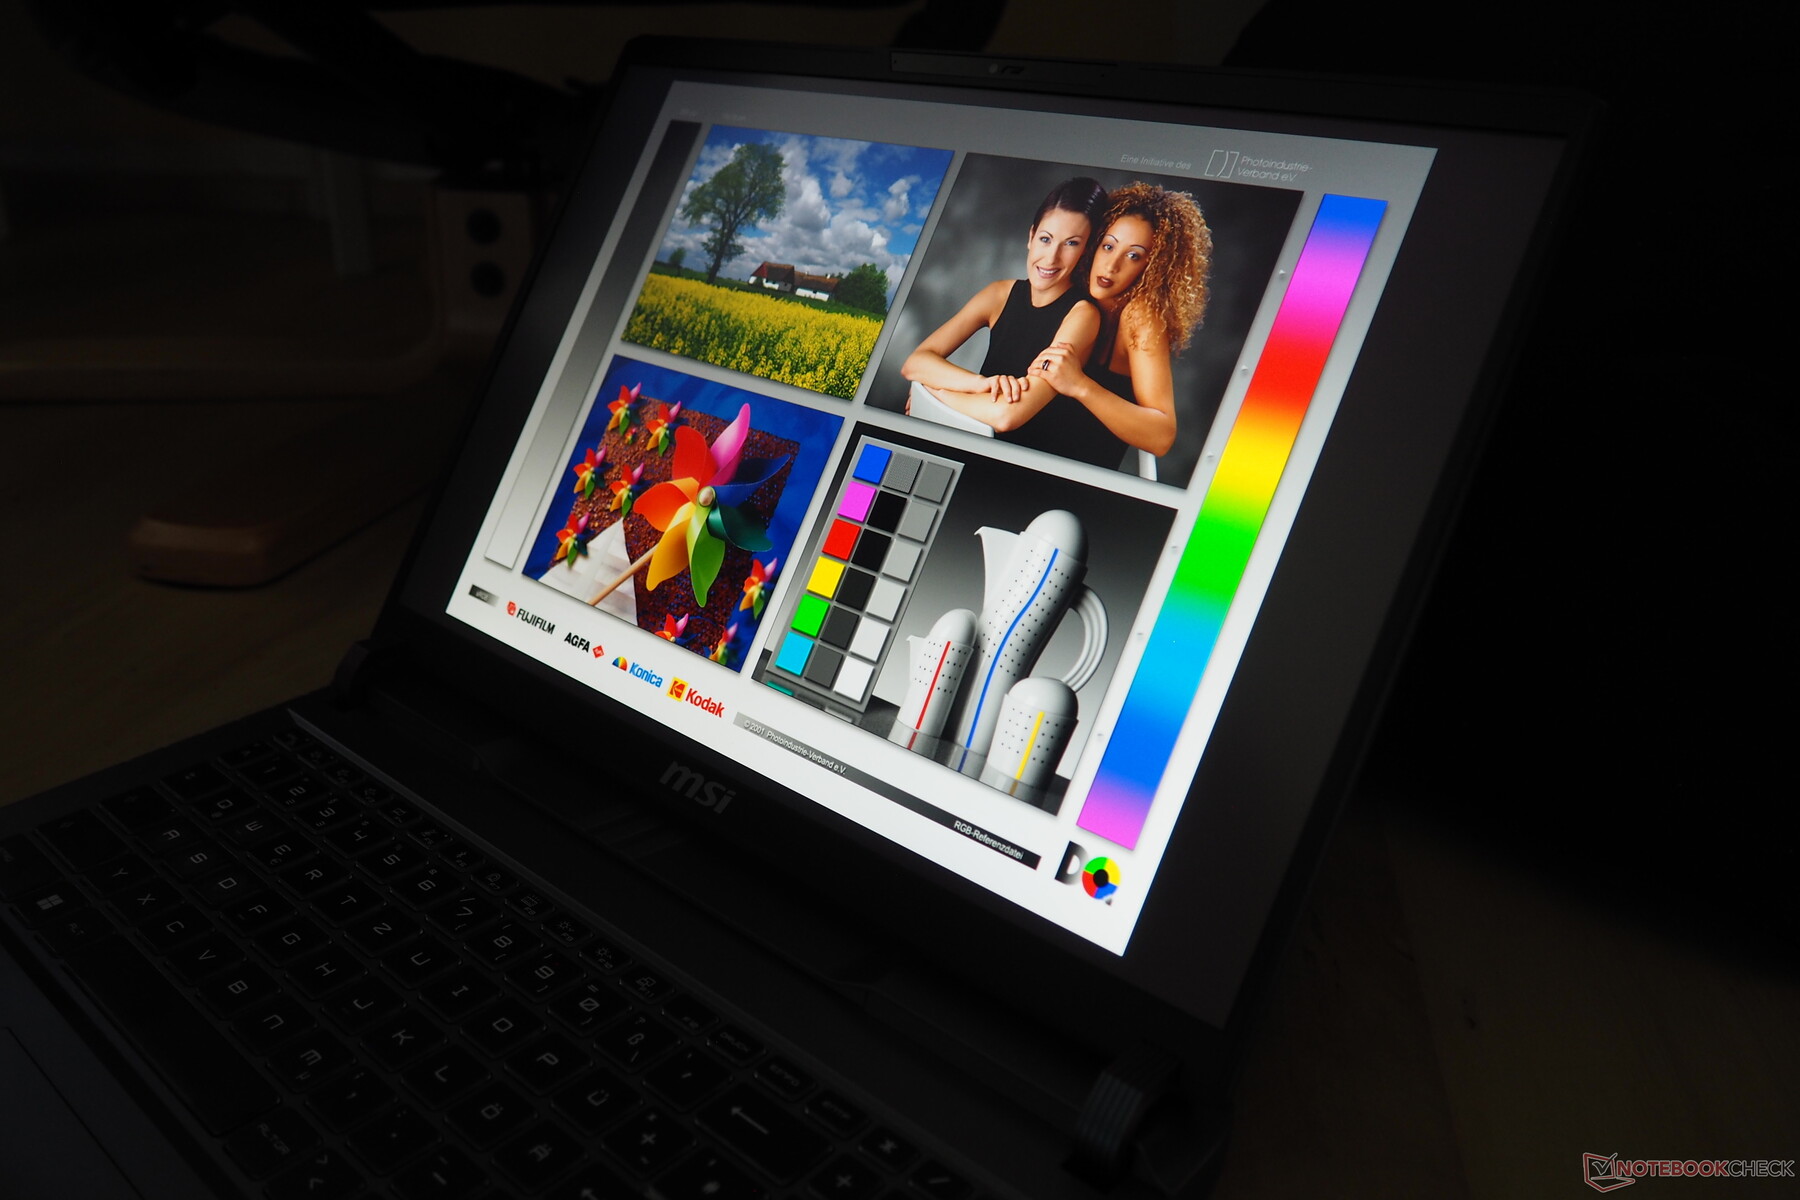
Display
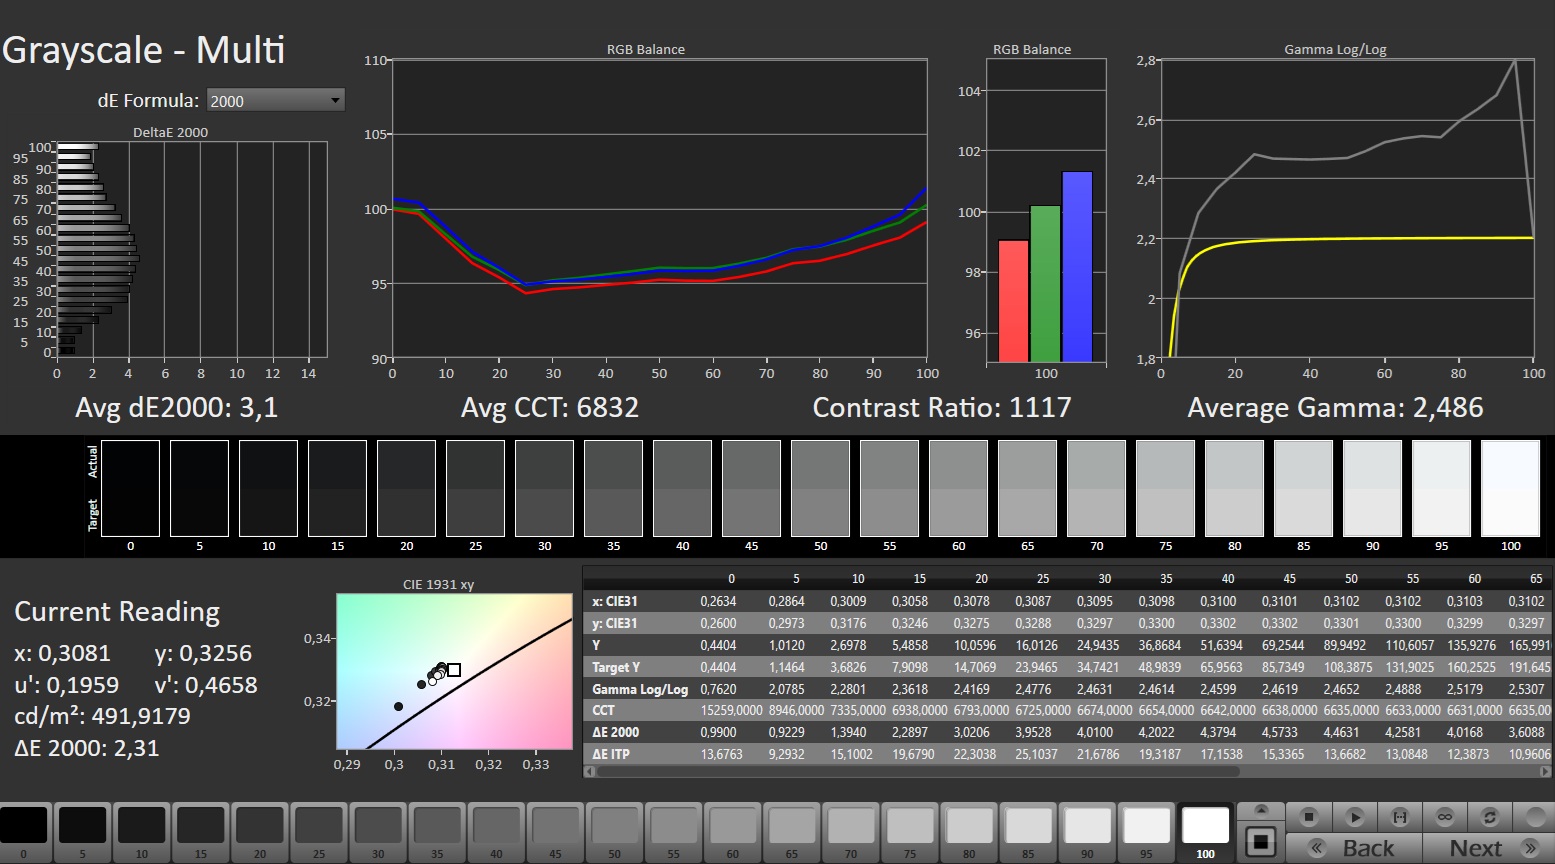
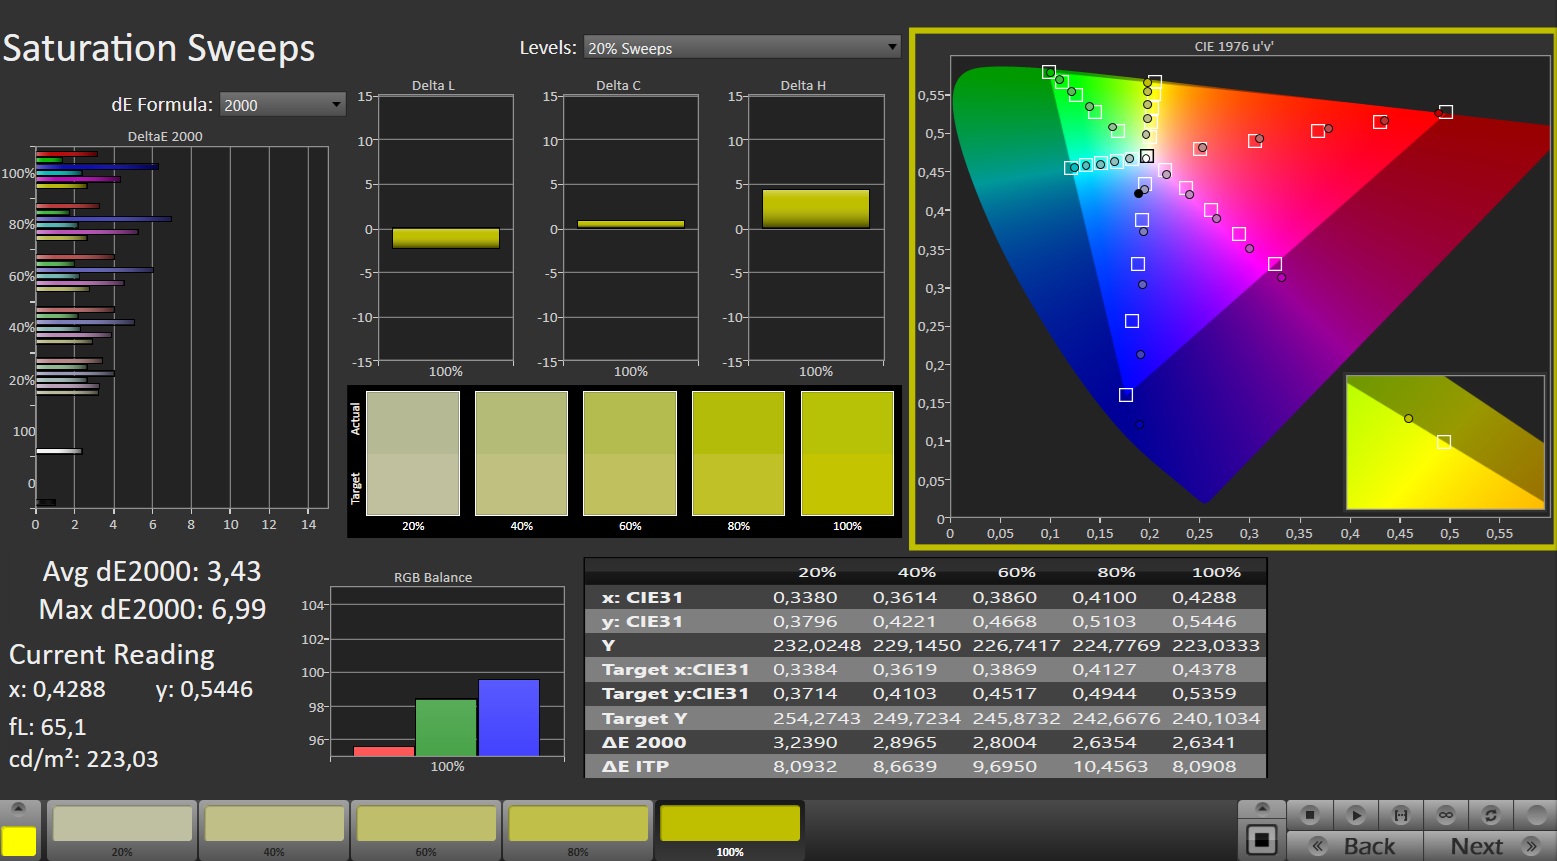
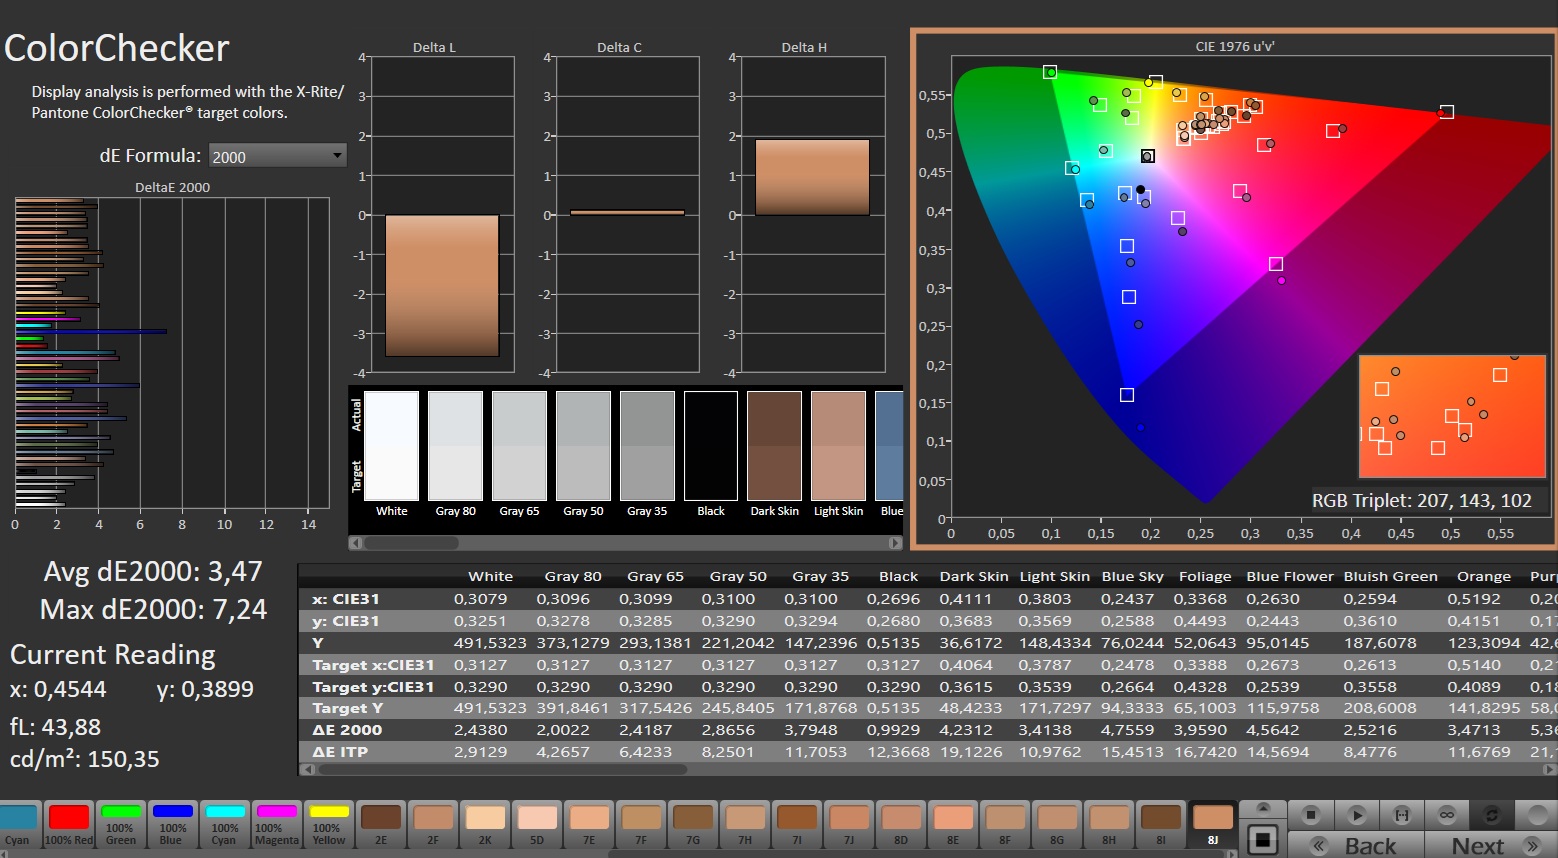
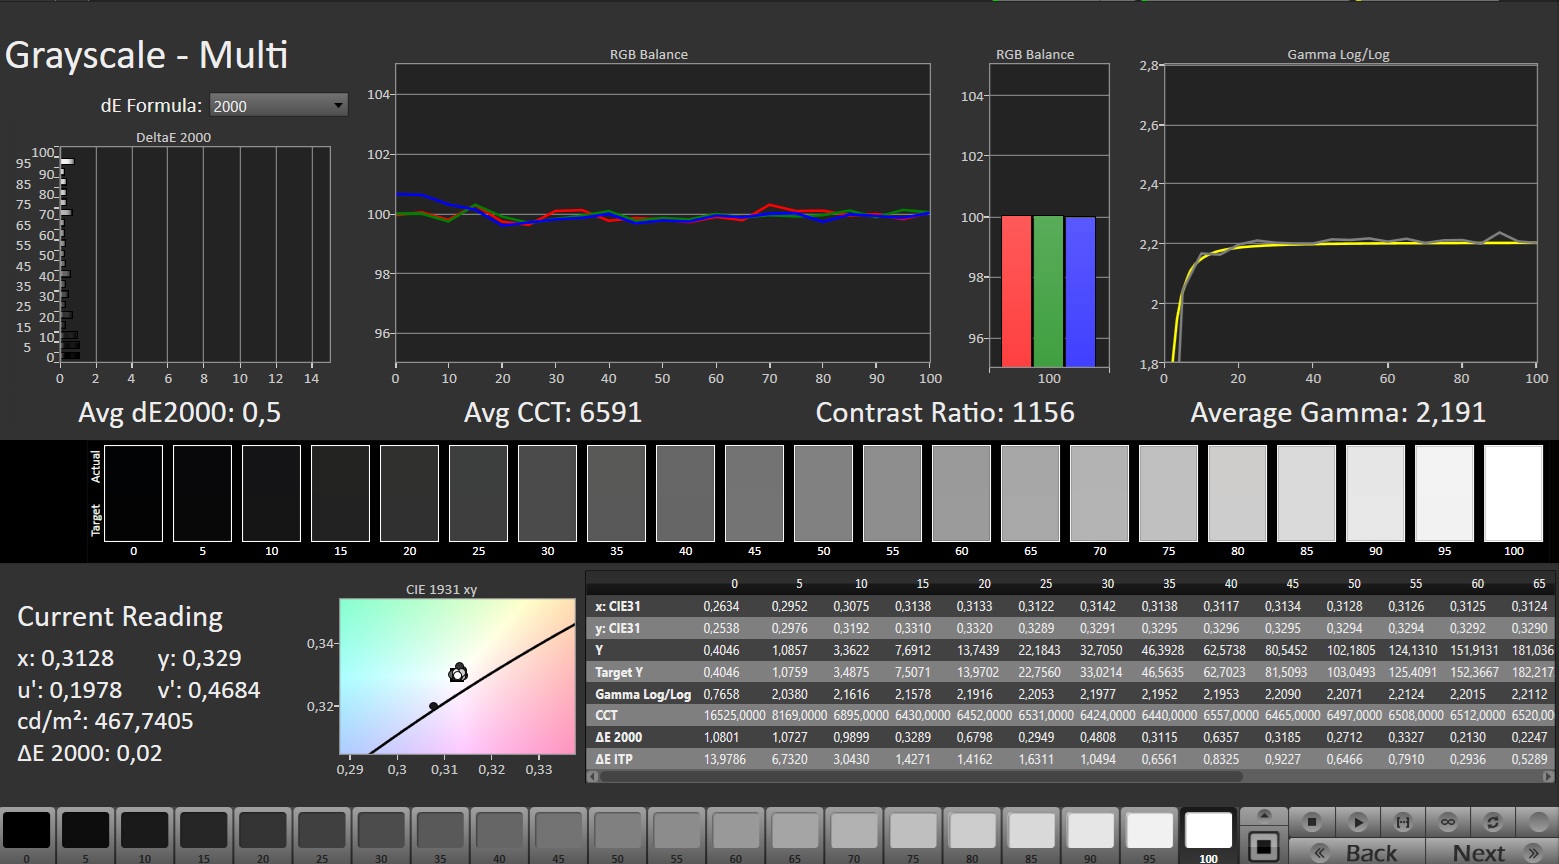
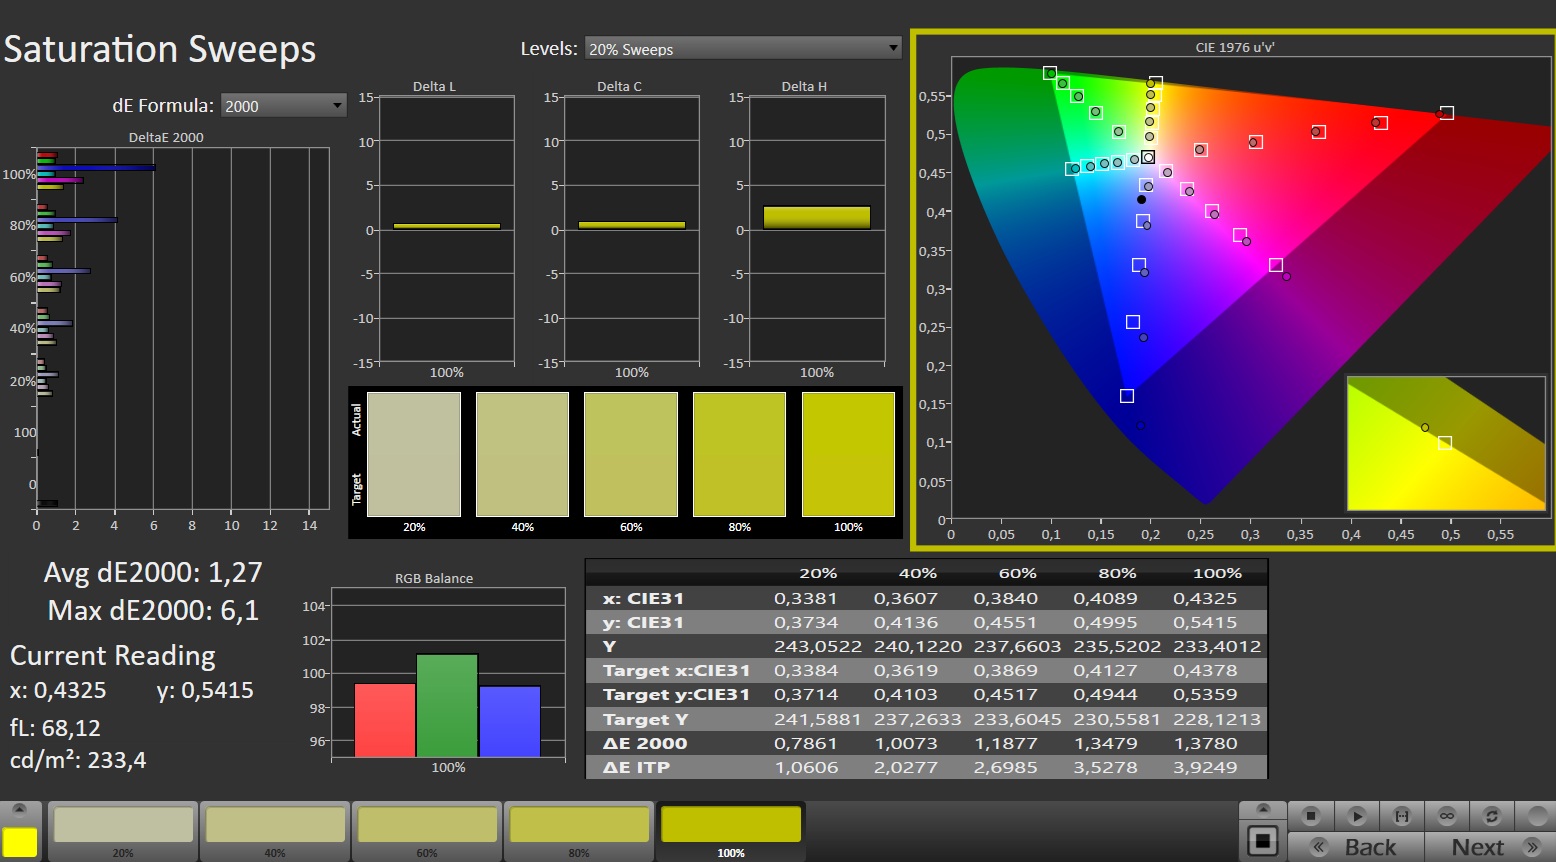
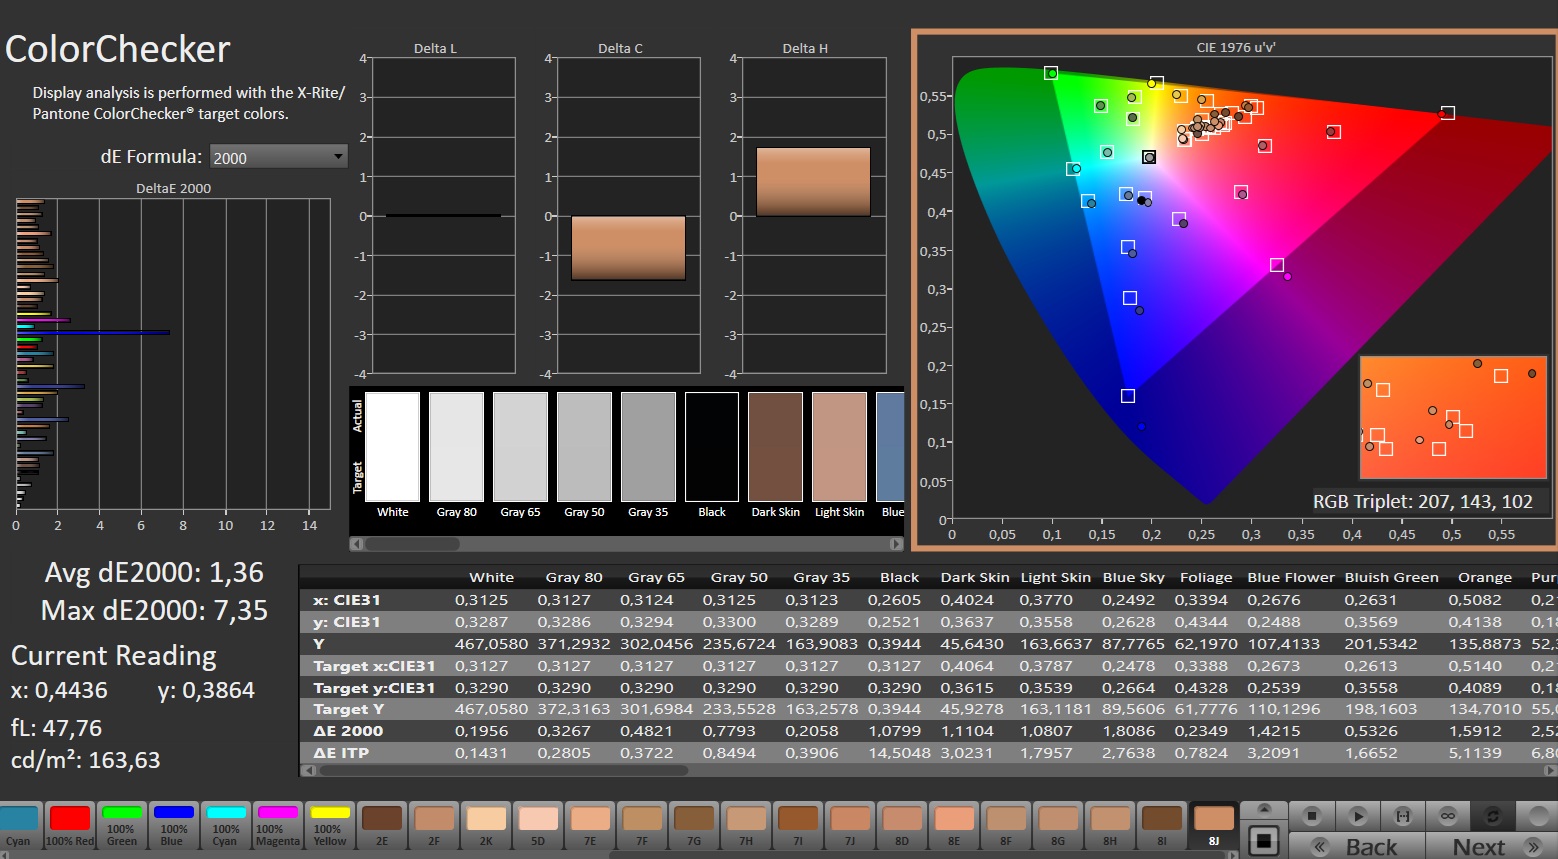
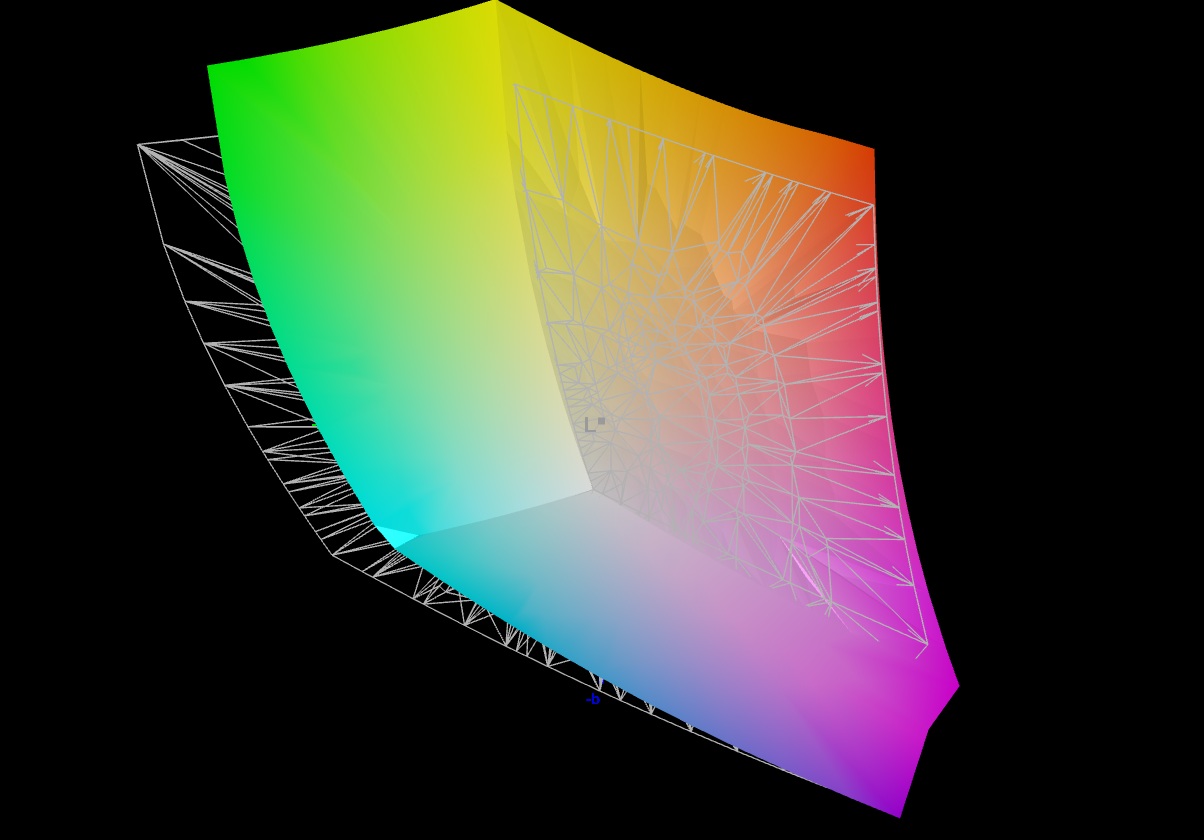
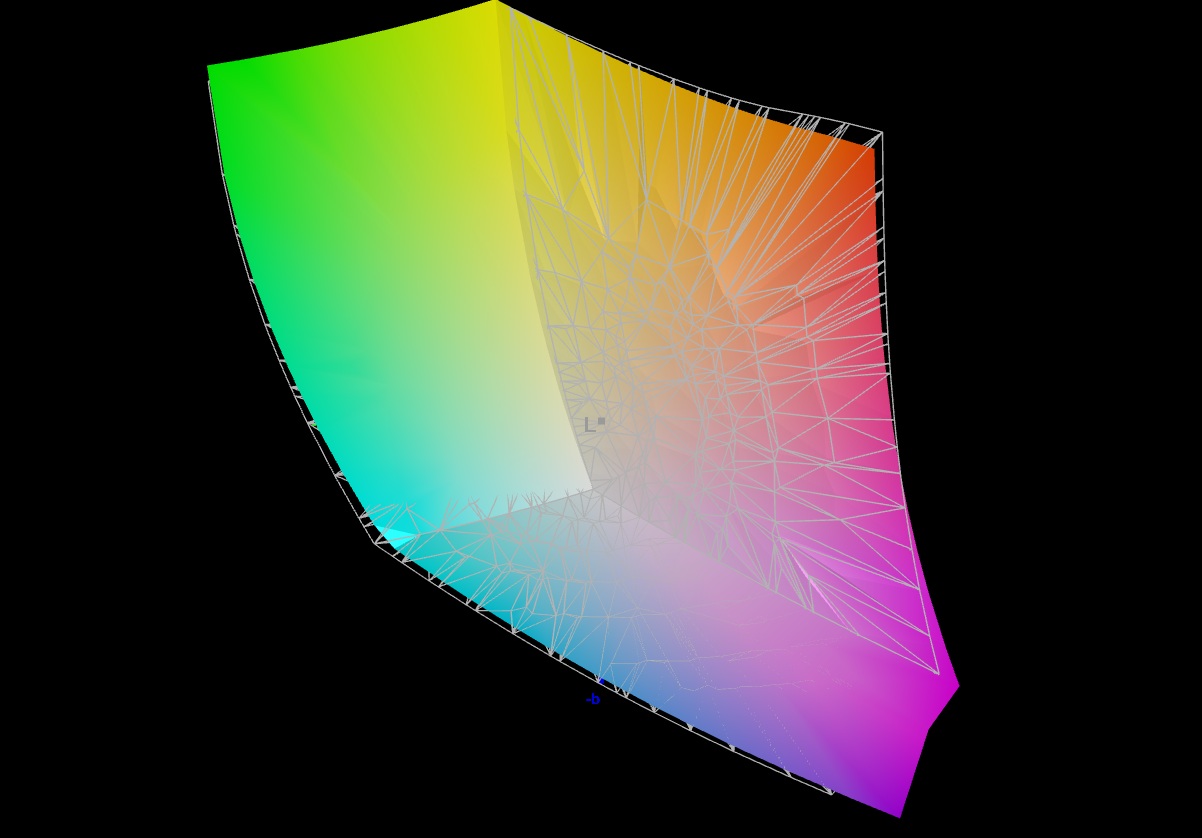
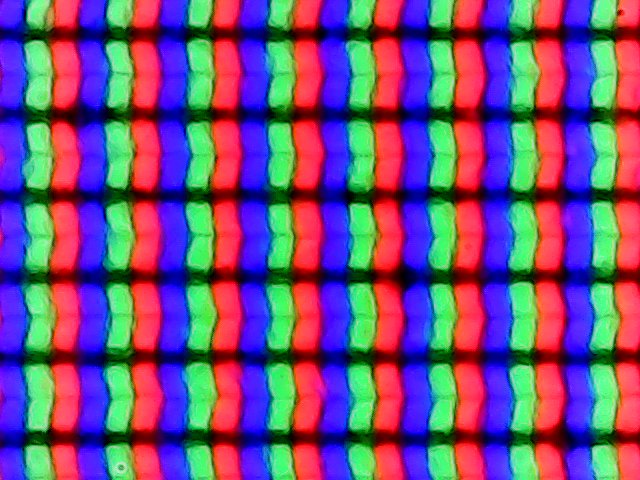
Lo schermo adotta il rapporto d'aspetto 16:10, attualmente molto diffuso, e si comporta senza grossi difetti. Anche se il pannello IPS non raggiunge i livelli dell'OLED nella maggior parte delle aree, il Vector 16 regge il confronto con altri portatili da gioco. Inizia con un buon tempo di risposta, che dovrebbe essere abbastanza veloce anche per i giochi 3D ad alto ritmo. Il display offre anche una solida luminosità media di 426 cd/m², superando nettamente i 272 cd/m² del Katana 17, che non sono affatto soddisfacenti. Nonostante un livello di nero semplicemente medio di 0,42 cd/m², il pannello da 16 pollici supera comunque la soglia di rapporto di contrasto di 1.000:1. Anche la precisione del colore è impressionante e può essere ulteriormente migliorata con la calibrazione. Non abbiamo osservato alcuno sfarfallio dello schermo e gli angoli di visione sono in linea con i tipici standard IPS.
| |||||||||||||||||||||||||
Distribuzione della luminosità: 85 %
Al centro con la batteria: 473 cd/m²
Contrasto: 1126:1 (Nero: 0.42 cd/m²)
ΔE Color 3.47 | 0.5-29.43 Ø4.84, calibrated: 1.36
ΔE Greyscale 3.1 | 0.09-98 Ø5.1
84.4% AdobeRGB 1998 (Argyll 2.2.0 3D)
99.8% sRGB (Argyll 2.2.0 3D)
96.6% Display P3 (Argyll 2.2.0 3D)
Gamma: 2.486
| MSI Vector 16 HX AI A2XWHG B160QAN02.3 (AUO7DB2), IPS, 2560x1600, 16", 240 Hz | MSI Vector 16 HX A14V Chi Mei N160GME-GTB, IPS, 2560x1600, 16", 240 Hz | MSI Katana 17 HX B14WGK CSOT MNH301CA3-1, IPS, 2560x1440, 17.3", 240 Hz | SCHENKER XMG Pro 16 (E25) NE160QDM-NZL, IPS, 2560x1600, 16", 300 Hz | Alienware 16 Area-51 AU Optronics B160QAN, IPS, 2560x1600, 16", 240 Hz | |
|---|---|---|---|---|---|
| Display | 0% | 2% | -11% | 2% | |
| Display P3 Coverage | 96.6 | 95.4 -1% | 97.3 1% | 74.7 -23% | 96 -1% |
| sRGB Coverage | 99.8 | 99.7 0% | 99.6 0% | 99.8 0% | 100 0% |
| AdobeRGB 1998 Coverage | 84.4 | 85.4 1% | 89 5% | 75.4 -11% | 89.2 6% |
| Response Times | -62% | -37% | -67% | -16% | |
| Response Time Grey 50% / Grey 80% * | 4.3 ? | 5.7 ? -33% | 5.2 ? -21% | 10.5 ? -144% | 4.8 ? -12% |
| Response Time Black / White * | 6 ? | 11.4 ? -90% | 9.2 ? -53% | 5.4 ? 10% | 7.2 ? -20% |
| PWM Frequency | |||||
| Screen | 5% | 13% | 16% | 2% | |
| Brightness middle | 473 | 557.2 18% | 296 -37% | 538 14% | 554 17% |
| Brightness | 426 | 506 19% | 272 -36% | 508 19% | 532 25% |
| Brightness Distribution | 85 | 83 -2% | 87 2% | 88 4% | 88 4% |
| Black Level * | 0.42 | 0.41 2% | 0.27 36% | 0.47 -12% | 0.52 -24% |
| Contrast | 1126 | 1359 21% | 1096 -3% | 1145 2% | 1065 -5% |
| Colorchecker dE 2000 * | 3.47 | 2.91 16% | 1.35 61% | 1.9 45% | 2.81 19% |
| Colorchecker dE 2000 max. * | 7.24 | 5.94 18% | 4.76 34% | 4 45% | 8.32 -15% |
| Colorchecker dE 2000 calibrated * | 1.36 | 1.63 -20% | 0.78 43% | 0.65 52% | |
| Greyscale dE 2000 * | 3.1 | 3.8 -23% | 2.7 13% | 2.7 13% | 4.7 -52% |
| Gamma | 2.486 88% | 2.23 99% | 2.201 100% | 2.24 98% | 2.3 96% |
| CCT | 6832 95% | 6408 101% | 6770 96% | 7027 93% | 6476 100% |
| Media totale (Programma / Settaggio) | -19% /
-5% | -7% /
3% | -21% /
-3% | -4% /
-0% |
* ... Meglio usare valori piccoli
Tempi di risposta del Display
| ↔ Tempi di risposta dal Nero al Bianco | ||
|---|---|---|
| 6 ms ... aumenta ↗ e diminuisce ↘ combinato | ↗ 2.2 ms Incremento | 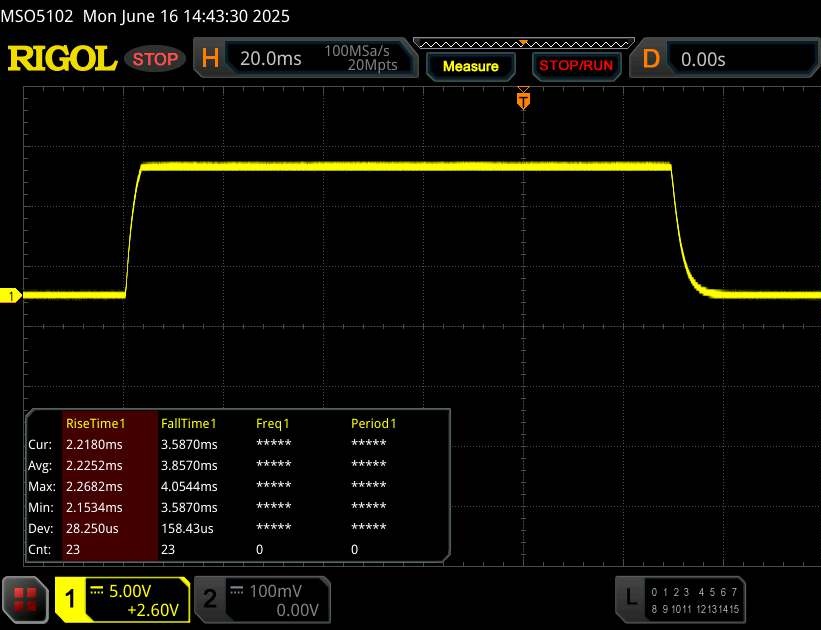 |
| ↘ 3.8 ms Calo | ||
| Lo schermo ha mostrato valori di risposta molto veloci nei nostri tests ed è molto adatto per i gaming veloce. In confronto, tutti i dispositivi di test variano da 0.1 (minimo) a 240 (massimo) ms. » 16 % di tutti i dispositivi è migliore. Questo significa che i tempi di risposta rilevati sono migliori rispettto alla media di tutti i dispositivi testati (20.5 ms). | ||
| ↔ Tempo di risposta dal 50% Grigio all'80% Grigio | ||
| 4.3 ms ... aumenta ↗ e diminuisce ↘ combinato | ↗ 1.8 ms Incremento | 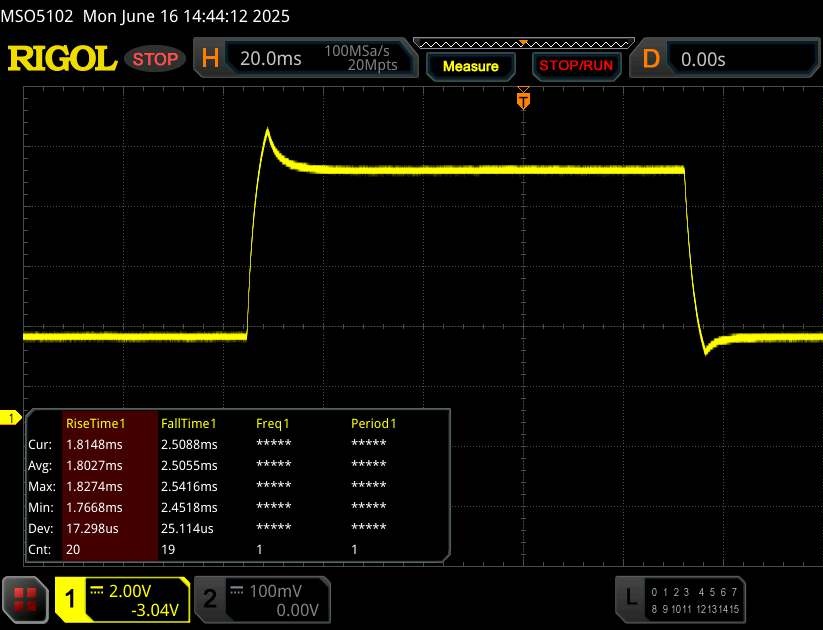 |
| ↘ 2.5 ms Calo | ||
| Lo schermo ha mostrato valori di risposta molto veloci nei nostri tests ed è molto adatto per i gaming veloce. In confronto, tutti i dispositivi di test variano da 0.165 (minimo) a 636 (massimo) ms. » 14 % di tutti i dispositivi è migliore. Questo significa che i tempi di risposta rilevati sono migliori rispettto alla media di tutti i dispositivi testati (32.1 ms). | ||
Sfarfallio dello schermo / PWM (Pulse-Width Modulation)
| flickering dello schermo / PWM non rilevato | 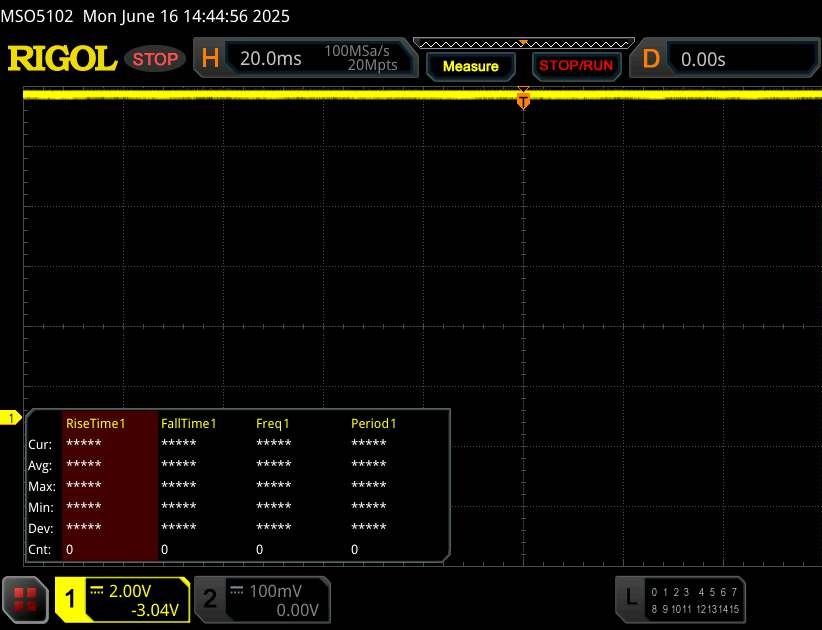 | ||
In confronto: 53 % di tutti i dispositivi testati non utilizza PWM per ridurre la luminosita' del display. Se è rilevato PWM, una media di 8363 (minimo: 5 - massimo: 343500) Hz è stata rilevata. | |||
Prestazioni
In termini di potenza della CPU e della GPU, Vector 16 HX si colloca comodamente tra la fascia media e la fascia alta assoluta dei portatili da gioco. La capacità dell'SSD e della RAM può essere facilmente aggiornata o espansa in base alle esigenze, grazie a due slot ciascuno.
Condizioni del test
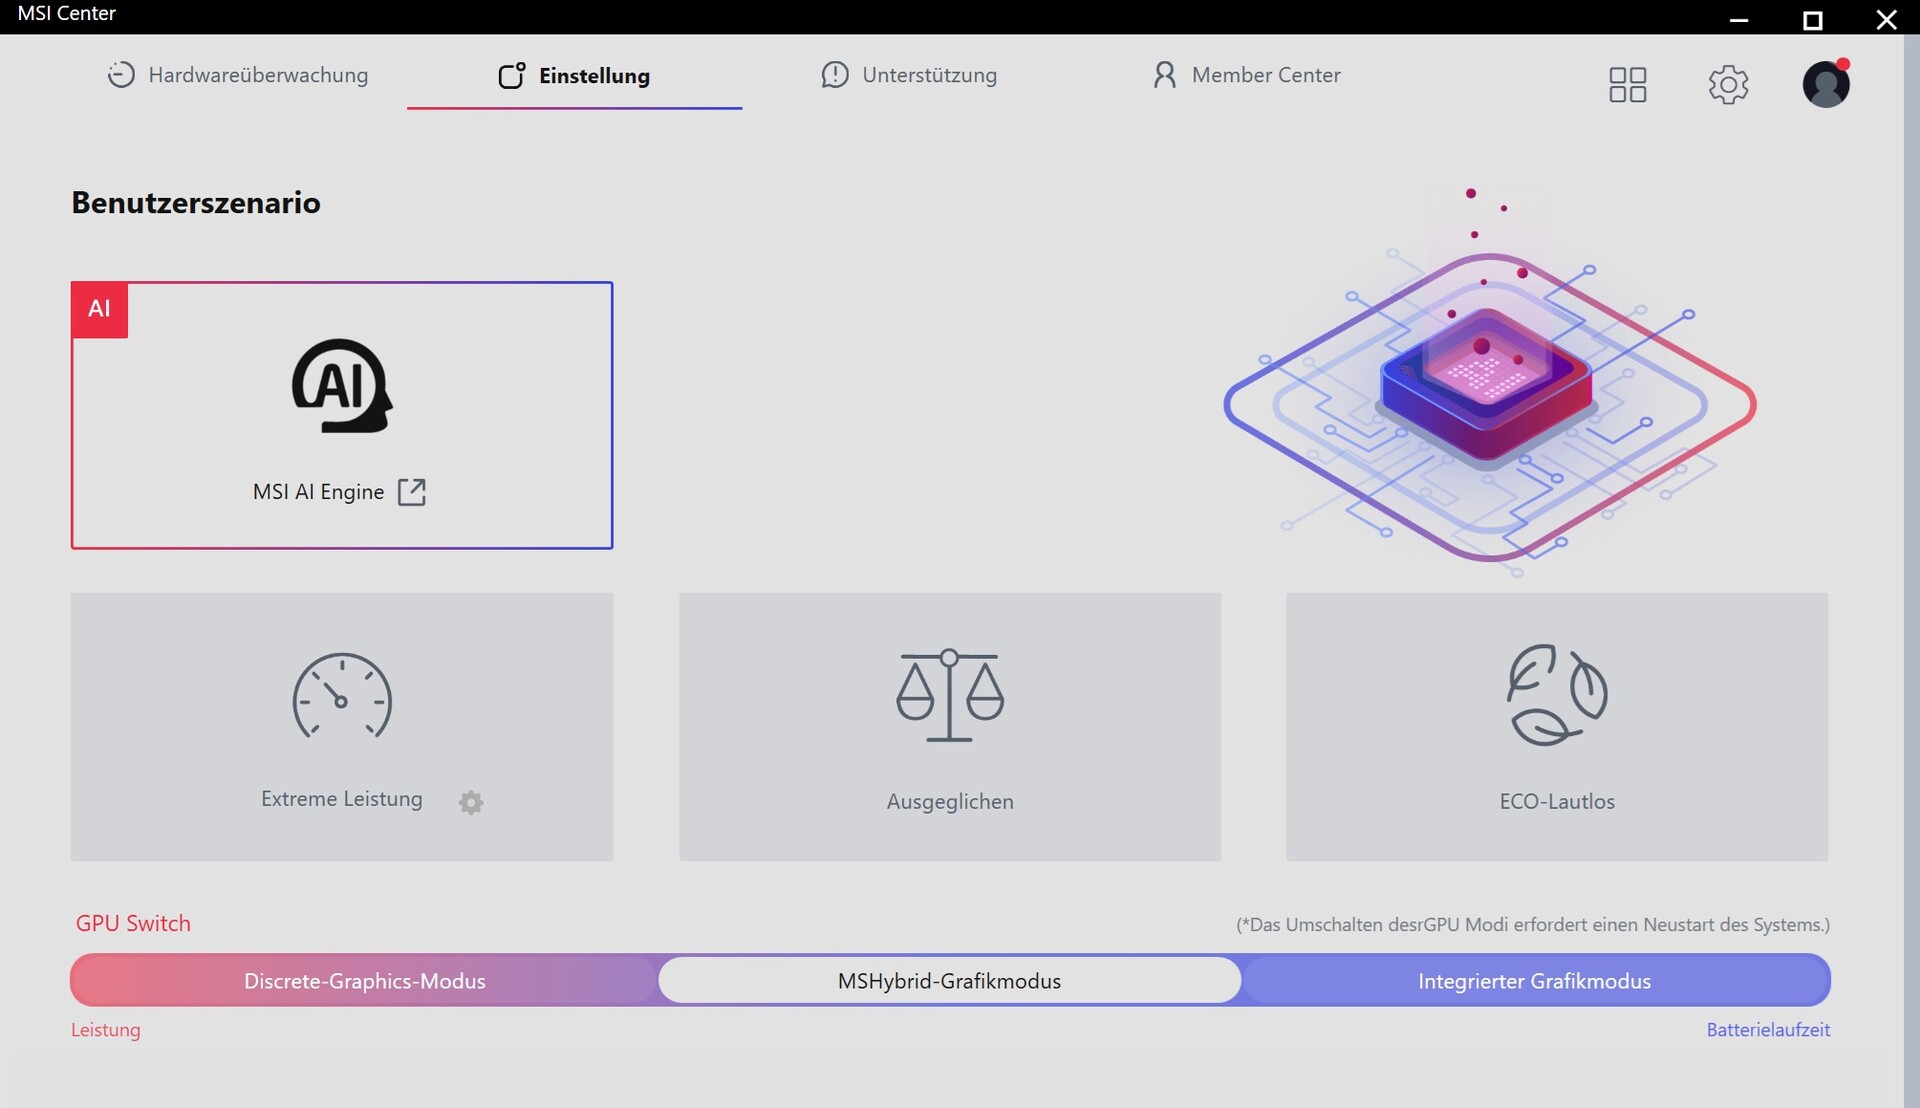
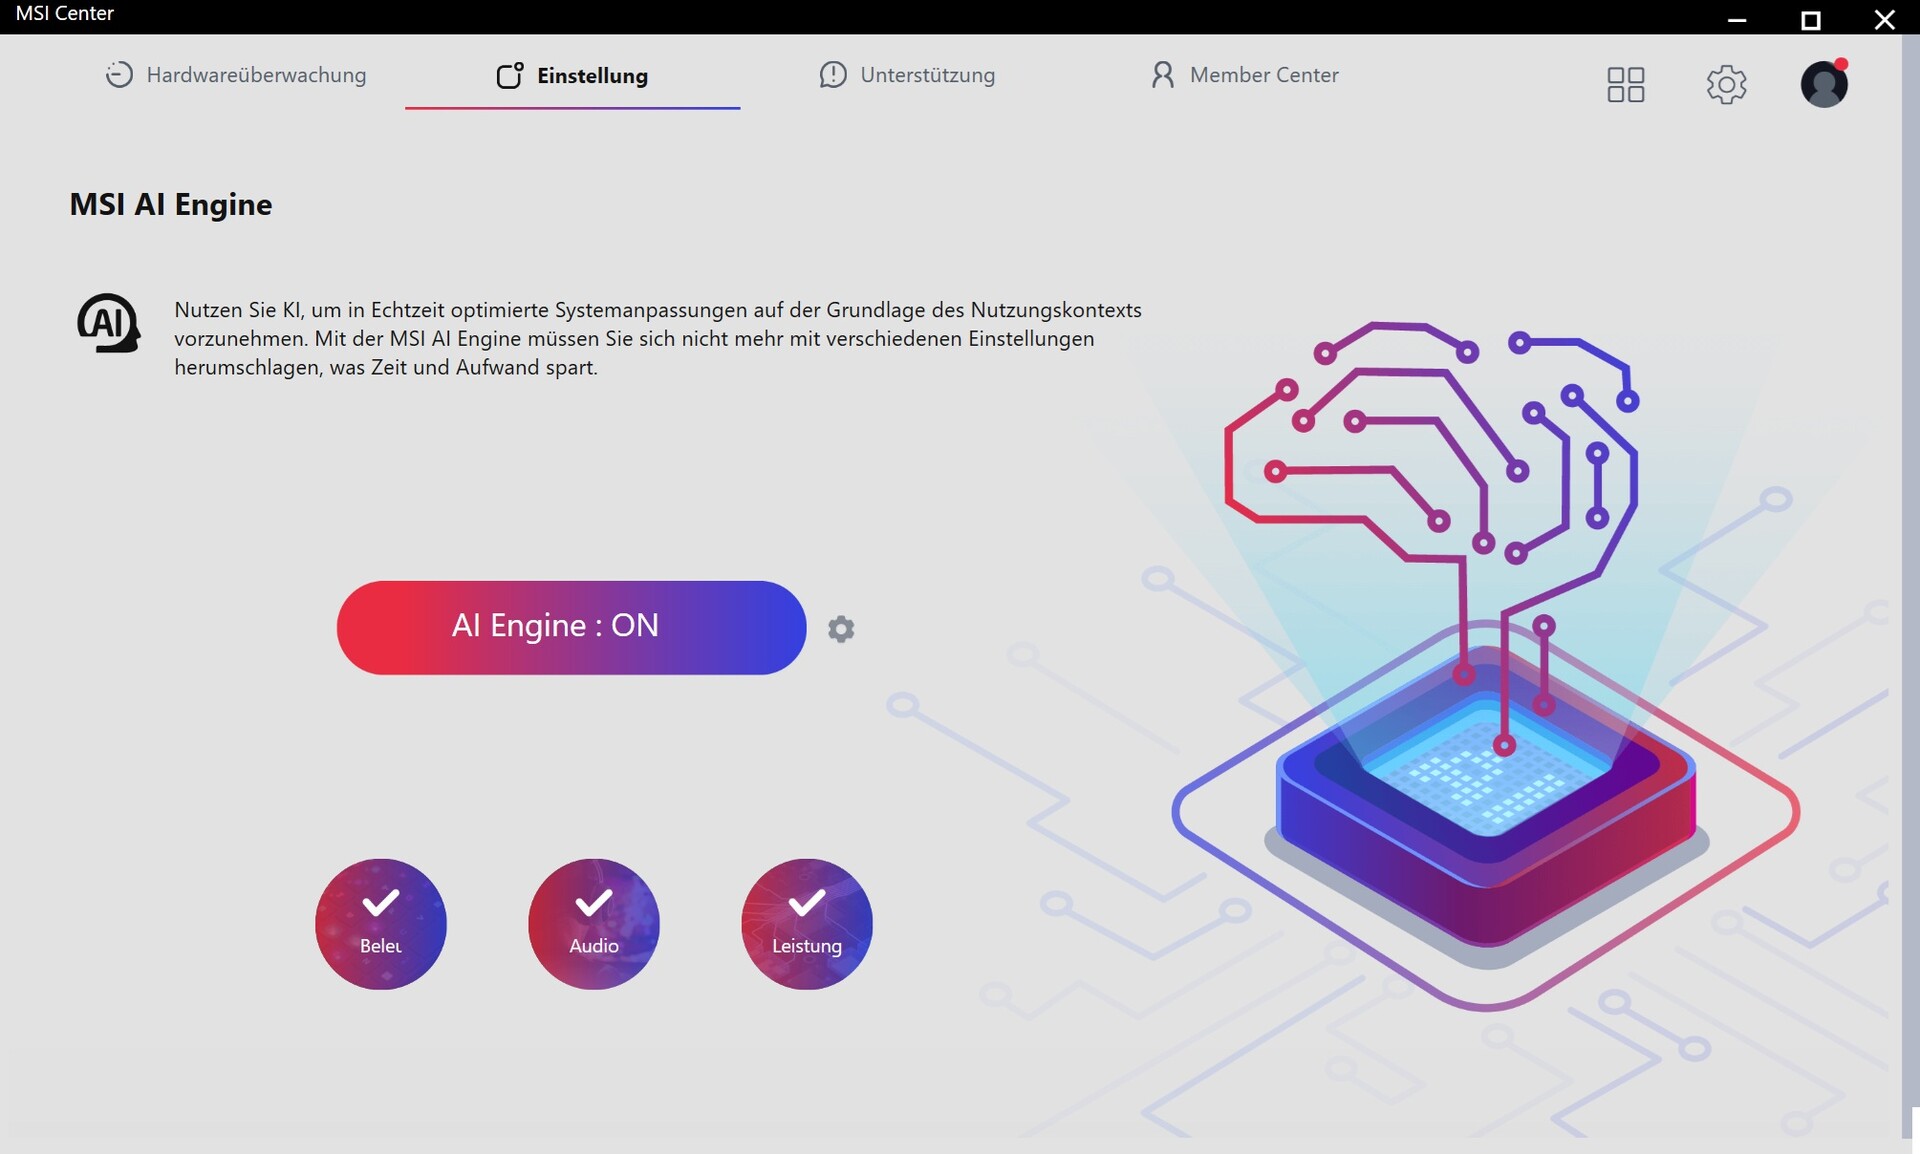
L'MSI Center contiene quattro modalità operative, di cui è stato utilizzato il profilo AI per le misurazioni, che, secondo i nostri test, si basa principalmente sulla modalità "Bilanciato" piuttosto che sulla modalità "Prestazioni massime". In genere non raccomandiamo quest'ultima, in quanto il modello da 16 pollici è assurdamente rumoroso sotto carico, con un livello appena inferiore a 60 dB(A). Le prestazioni della GPU aumentano di quasi il 10% nel profilo massimo.
| MSI Center Mode | MSI AI Engine | Prestazioni estreme | Bilanciato | ECO Silent |
| Cyberpunk 2077 Rumore | 47 dB(A) | 60 dB(A) | 47 dB(A) | 41 dB(A) |
| Prestazioni di Cyberpunk 2077 (FHD/Ultra) | 119,6 fps | 129,9 fps | 117,1 fps | 51,5 fps |
| Punteggio Cinebench R15 Multi | 4118 Punti | 5196 Punti | 4037 Punti | 1064 Punti |
| CPU PL1 | 80 watt | 110 watt | 80 watt | 15 watt |
| CPU PL2 | 80 watt | 220 watt | 80 watt | 15 watt |
Processore
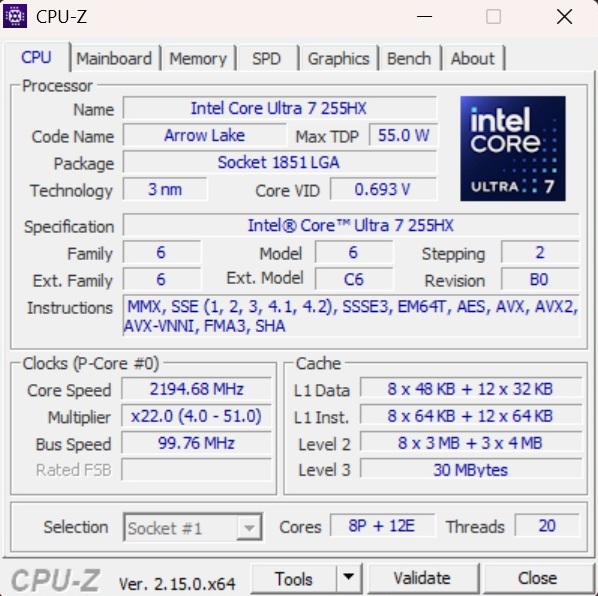
Il Core Ultra 7 255HX festeggia la sua anteprima nel Vector 16. Il modello da 3 nm della generazione Arrow Lake è dotato di 8 core per le prestazioni e 12 core per l'efficienza, ciascuno senza Hyper-Threading. Nel corso del benchmark, il 255HX si comporta leggermente peggio del vecchio chip di fascia alta Core i9-14900HX, ma in modo significativamente migliore rispetto al Core i7-14650HX della Katana 17 Core Ultra 9 275HX è solo circa il 10% più veloce in media, che è un risultato rispettabile per il 255HX.
Cinebench R15 multi sustained test
* ... Meglio usare valori piccoli
AIDA64: FP32 Ray-Trace | FPU Julia | CPU SHA3 | CPU Queen | FPU SinJulia | FPU Mandel | CPU AES | CPU ZLib | FP64 Ray-Trace | CPU PhotoWorxx
| Performance Rating | |
| SCHENKER XMG Pro 16 (E25) | |
| Alienware 16 Area-51 | |
| MSI Vector 16 HX A14V | |
| Media Intel Core Ultra 7 255HX | |
| MSI Vector 16 HX AI A2XWHG | |
| Media della classe Gaming | |
| MSI Katana 17 HX B14WGK | |
| AIDA64 / FP32 Ray-Trace | |
| SCHENKER XMG Pro 16 (E25) | |
| Alienware 16 Area-51 | |
| Media Intel Core Ultra 7 255HX (27732 - 32373, n=2) | |
| MSI Vector 16 HX A14V | |
| MSI Vector 16 HX AI A2XWHG | |
| Media della classe Gaming (7192 - 85542, n=145, ultimi 2 anni) | |
| MSI Katana 17 HX B14WGK | |
| AIDA64 / FPU Julia | |
| SCHENKER XMG Pro 16 (E25) | |
| Alienware 16 Area-51 | |
| Media Intel Core Ultra 7 255HX (140290 - 163570, n=2) | |
| MSI Vector 16 HX A14V | |
| MSI Vector 16 HX AI A2XWHG | |
| Media della classe Gaming (35040 - 252486, n=145, ultimi 2 anni) | |
| MSI Katana 17 HX B14WGK | |
| AIDA64 / CPU SHA3 | |
| SCHENKER XMG Pro 16 (E25) | |
| Alienware 16 Area-51 | |
| MSI Vector 16 HX A14V | |
| Media Intel Core Ultra 7 255HX (6445 - 7513, n=2) | |
| MSI Vector 16 HX AI A2XWHG | |
| Media della classe Gaming (1728 - 10389, n=145, ultimi 2 anni) | |
| MSI Katana 17 HX B14WGK | |
| AIDA64 / CPU Queen | |
| MSI Vector 16 HX A14V | |
| Alienware 16 Area-51 | |
| SCHENKER XMG Pro 16 (E25) | |
| Media Intel Core Ultra 7 255HX (115802 - 130615, n=2) | |
| Media della classe Gaming (50699 - 200651, n=145, ultimi 2 anni) | |
| MSI Vector 16 HX AI A2XWHG | |
| MSI Katana 17 HX B14WGK | |
| AIDA64 / FPU SinJulia | |
| MSI Vector 16 HX A14V | |
| SCHENKER XMG Pro 16 (E25) | |
| Media della classe Gaming (5020 - 33636, n=145, ultimi 2 anni) | |
| Alienware 16 Area-51 | |
| Media Intel Core Ultra 7 255HX (11066 - 12035, n=2) | |
| MSI Vector 16 HX AI A2XWHG | |
| MSI Katana 17 HX B14WGK | |
| AIDA64 / FPU Mandel | |
| SCHENKER XMG Pro 16 (E25) | |
| Alienware 16 Area-51 | |
| Media Intel Core Ultra 7 255HX (72938 - 84513, n=2) | |
| MSI Vector 16 HX AI A2XWHG | |
| MSI Vector 16 HX A14V | |
| Media della classe Gaming (17585 - 134044, n=145, ultimi 2 anni) | |
| MSI Katana 17 HX B14WGK | |
| AIDA64 / CPU AES | |
| MSI Vector 16 HX A14V | |
| Alienware 16 Area-51 | |
| SCHENKER XMG Pro 16 (E25) | |
| Media della classe Gaming (19065 - 328679, n=145, ultimi 2 anni) | |
| Media Intel Core Ultra 7 255HX (96832 - 112828, n=2) | |
| MSI Vector 16 HX AI A2XWHG | |
| MSI Katana 17 HX B14WGK | |
| AIDA64 / CPU ZLib | |
| MSI Vector 16 HX A14V | |
| SCHENKER XMG Pro 16 (E25) | |
| Alienware 16 Area-51 | |
| Media Intel Core Ultra 7 255HX (1510 - 1752, n=2) | |
| MSI Vector 16 HX AI A2XWHG | |
| Media della classe Gaming (373 - 2531, n=145, ultimi 2 anni) | |
| MSI Katana 17 HX B14WGK | |
| AIDA64 / FP64 Ray-Trace | |
| Alienware 16 Area-51 | |
| SCHENKER XMG Pro 16 (E25) | |
| Media Intel Core Ultra 7 255HX (15137 - 17617, n=2) | |
| MSI Vector 16 HX A14V | |
| MSI Vector 16 HX AI A2XWHG | |
| Media della classe Gaming (3856 - 45446, n=145, ultimi 2 anni) | |
| MSI Katana 17 HX B14WGK | |
| AIDA64 / CPU PhotoWorxx | |
| Alienware 16 Area-51 | |
| SCHENKER XMG Pro 16 (E25) | |
| MSI Vector 16 HX A14V | |
| Media Intel Core Ultra 7 255HX (39697 - 49664, n=2) | |
| Media della classe Gaming (10805 - 62916, n=145, ultimi 2 anni) | |
| MSI Vector 16 HX AI A2XWHG | |
| MSI Katana 17 HX B14WGK | |
Prestazioni del sistema
Le prestazioni del sistema si dimostrano poco appariscenti, il 16 pollici si comporta all'interno della gamma prevista. Interessante: Nonostante i componenti presumibilmente più deboli (CPU/GPU), il Katana 17, testato contemporaneamente, si avvia più velocemente.
PCMark 10: Score | Essentials | Productivity | Digital Content Creation
CrossMark: Overall | Productivity | Creativity | Responsiveness
WebXPRT 3: Overall
WebXPRT 4: Overall
Mozilla Kraken 1.1: Total
| Performance Rating | |
| Alienware 16 Area-51 | |
| SCHENKER XMG Pro 16 (E25) | |
| MSI Vector 16 HX A14V | |
| Media Intel Core Ultra 7 255HX, Nvidia GeForce RTX 5070 Ti Laptop | |
| MSI Vector 16 HX AI A2XWHG | |
| Media della classe Gaming | |
| MSI Katana 17 HX B14WGK | |
| PCMark 10 / Score | |
| Alienware 16 Area-51 | |
| MSI Vector 16 HX A14V | |
| SCHENKER XMG Pro 16 (E25) | |
| Media della classe Gaming (5776 - 9852, n=132, ultimi 2 anni) | |
| Media Intel Core Ultra 7 255HX, Nvidia GeForce RTX 5070 Ti Laptop (7842 - 7858, n=2) | |
| MSI Vector 16 HX AI A2XWHG | |
| MSI Katana 17 HX B14WGK | |
| PCMark 10 / Essentials | |
| MSI Vector 16 HX A14V | |
| SCHENKER XMG Pro 16 (E25) | |
| Alienware 16 Area-51 | |
| Media della classe Gaming (9057 - 12600, n=132, ultimi 2 anni) | |
| Media Intel Core Ultra 7 255HX, Nvidia GeForce RTX 5070 Ti Laptop (10737 - 10773, n=2) | |
| MSI Vector 16 HX AI A2XWHG | |
| MSI Katana 17 HX B14WGK | |
| PCMark 10 / Productivity | |
| Media della classe Gaming (6662 - 14612, n=132, ultimi 2 anni) | |
| MSI Vector 16 HX A14V | |
| SCHENKER XMG Pro 16 (E25) | |
| MSI Vector 16 HX AI A2XWHG | |
| Media Intel Core Ultra 7 255HX, Nvidia GeForce RTX 5070 Ti Laptop (9270 - 9510, n=2) | |
| Alienware 16 Area-51 | |
| MSI Katana 17 HX B14WGK | |
| PCMark 10 / Digital Content Creation | |
| Alienware 16 Area-51 | |
| MSI Vector 16 HX A14V | |
| SCHENKER XMG Pro 16 (E25) | |
| Media della classe Gaming (7440 - 19351, n=132, ultimi 2 anni) | |
| Media Intel Core Ultra 7 255HX, Nvidia GeForce RTX 5070 Ti Laptop (12817 - 13186, n=2) | |
| MSI Vector 16 HX AI A2XWHG | |
| MSI Katana 17 HX B14WGK | |
| CrossMark / Overall | |
| SCHENKER XMG Pro 16 (E25) | |
| MSI Vector 16 HX A14V | |
| Alienware 16 Area-51 | |
| Media Intel Core Ultra 7 255HX, Nvidia GeForce RTX 5070 Ti Laptop (1944 - 2097, n=2) | |
| MSI Katana 17 HX B14WGK | |
| Media della classe Gaming (1247 - 2344, n=113, ultimi 2 anni) | |
| MSI Vector 16 HX AI A2XWHG | |
| CrossMark / Productivity | |
| MSI Vector 16 HX A14V | |
| SCHENKER XMG Pro 16 (E25) | |
| Alienware 16 Area-51 | |
| Media Intel Core Ultra 7 255HX, Nvidia GeForce RTX 5070 Ti Laptop (1845 - 1959, n=2) | |
| MSI Katana 17 HX B14WGK | |
| MSI Vector 16 HX AI A2XWHG | |
| Media della classe Gaming (1299 - 2211, n=113, ultimi 2 anni) | |
| CrossMark / Creativity | |
| SCHENKER XMG Pro 16 (E25) | |
| MSI Vector 16 HX A14V | |
| Alienware 16 Area-51 | |
| Media Intel Core Ultra 7 255HX, Nvidia GeForce RTX 5070 Ti Laptop (2249 - 2400, n=2) | |
| MSI Vector 16 HX AI A2XWHG | |
| Media della classe Gaming (1275 - 2729, n=113, ultimi 2 anni) | |
| MSI Katana 17 HX B14WGK | |
| CrossMark / Responsiveness | |
| Alienware 16 Area-51 | |
| MSI Vector 16 HX A14V | |
| MSI Katana 17 HX B14WGK | |
| SCHENKER XMG Pro 16 (E25) | |
| Media della classe Gaming (1030 - 2330, n=113, ultimi 2 anni) | |
| Media Intel Core Ultra 7 255HX, Nvidia GeForce RTX 5070 Ti Laptop (1468 - 1713, n=2) | |
| MSI Vector 16 HX AI A2XWHG | |
| WebXPRT 3 / Overall | |
| SCHENKER XMG Pro 16 (E25) | |
| Alienware 16 Area-51 | |
| MSI Vector 16 HX A14V | |
| Media Intel Core Ultra 7 255HX, Nvidia GeForce RTX 5070 Ti Laptop (319 - 325, n=2) | |
| MSI Vector 16 HX AI A2XWHG | |
| Media della classe Gaming (235 - 532, n=126, ultimi 2 anni) | |
| MSI Katana 17 HX B14WGK | |
| WebXPRT 4 / Overall | |
| SCHENKER XMG Pro 16 (E25) | |
| Alienware 16 Area-51 | |
| Media Intel Core Ultra 7 255HX, Nvidia GeForce RTX 5070 Ti Laptop (305 - 306, n=2) | |
| MSI Vector 16 HX AI A2XWHG | |
| MSI Vector 16 HX A14V | |
| Media della classe Gaming (176.4 - 341, n=114, ultimi 2 anni) | |
| MSI Katana 17 HX B14WGK | |
| Mozilla Kraken 1.1 / Total | |
| Media della classe Gaming (397 - 674, n=137, ultimi 2 anni) | |
| MSI Katana 17 HX B14WGK | |
| MSI Vector 16 HX A14V | |
| MSI Vector 16 HX AI A2XWHG | |
| Media Intel Core Ultra 7 255HX, Nvidia GeForce RTX 5070 Ti Laptop (425 - 425, n=2) | |
| Alienware 16 Area-51 | |
| SCHENKER XMG Pro 16 (E25) | |
* ... Meglio usare valori piccoli
| PCMark 10 Score | 7842 punti | |
Aiuto | ||
| AIDA64 / Memory Copy | |
| SCHENKER XMG Pro 16 (E25) | |
| Alienware 16 Area-51 | |
| MSI Vector 16 HX A14V | |
| Media Intel Core Ultra 7 255HX (68939 - 77224, n=2) | |
| Media della classe Gaming (21750 - 97515, n=145, ultimi 2 anni) | |
| MSI Vector 16 HX AI A2XWHG | |
| MSI Katana 17 HX B14WGK | |
| AIDA64 / Memory Read | |
| SCHENKER XMG Pro 16 (E25) | |
| Alienware 16 Area-51 | |
| MSI Vector 16 HX A14V | |
| Media Intel Core Ultra 7 255HX (82336 - 85818, n=2) | |
| MSI Vector 16 HX AI A2XWHG | |
| Media della classe Gaming (22956 - 104349, n=145, ultimi 2 anni) | |
| MSI Katana 17 HX B14WGK | |
| AIDA64 / Memory Write | |
| Media Intel Core Ultra 7 255HX (66479 - 133486, n=2) | |
| SCHENKER XMG Pro 16 (E25) | |
| Alienware 16 Area-51 | |
| MSI Vector 16 HX A14V | |
| Media della classe Gaming (22297 - 133486, n=145, ultimi 2 anni) | |
| MSI Vector 16 HX AI A2XWHG | |
| MSI Katana 17 HX B14WGK | |
| AIDA64 / Memory Latency | |
| Alienware 16 Area-51 | |
| Media Intel Core Ultra 7 255HX (106.4 - 110, n=2) | |
| MSI Vector 16 HX AI A2XWHG | |
| SCHENKER XMG Pro 16 (E25) | |
| Media della classe Gaming (59.5 - 259, n=145, ultimi 2 anni) | |
| MSI Katana 17 HX B14WGK | |
| MSI Vector 16 HX A14V | |
* ... Meglio usare valori piccoli
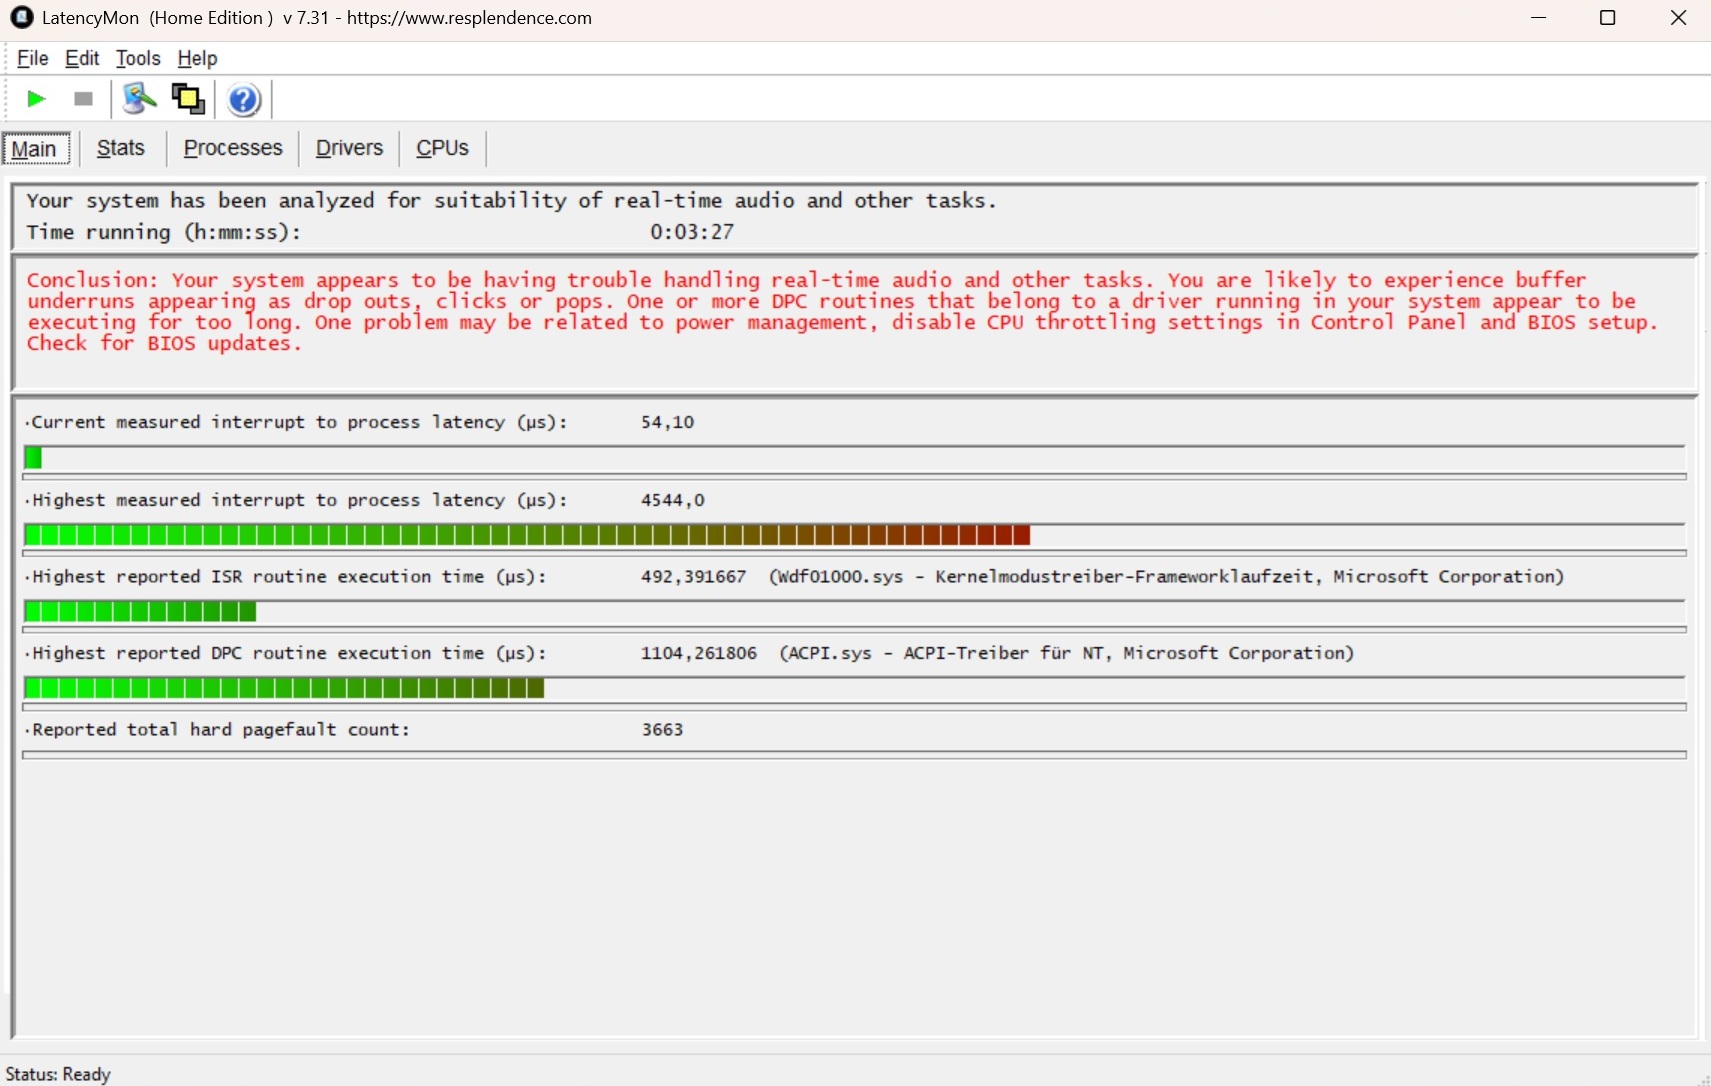
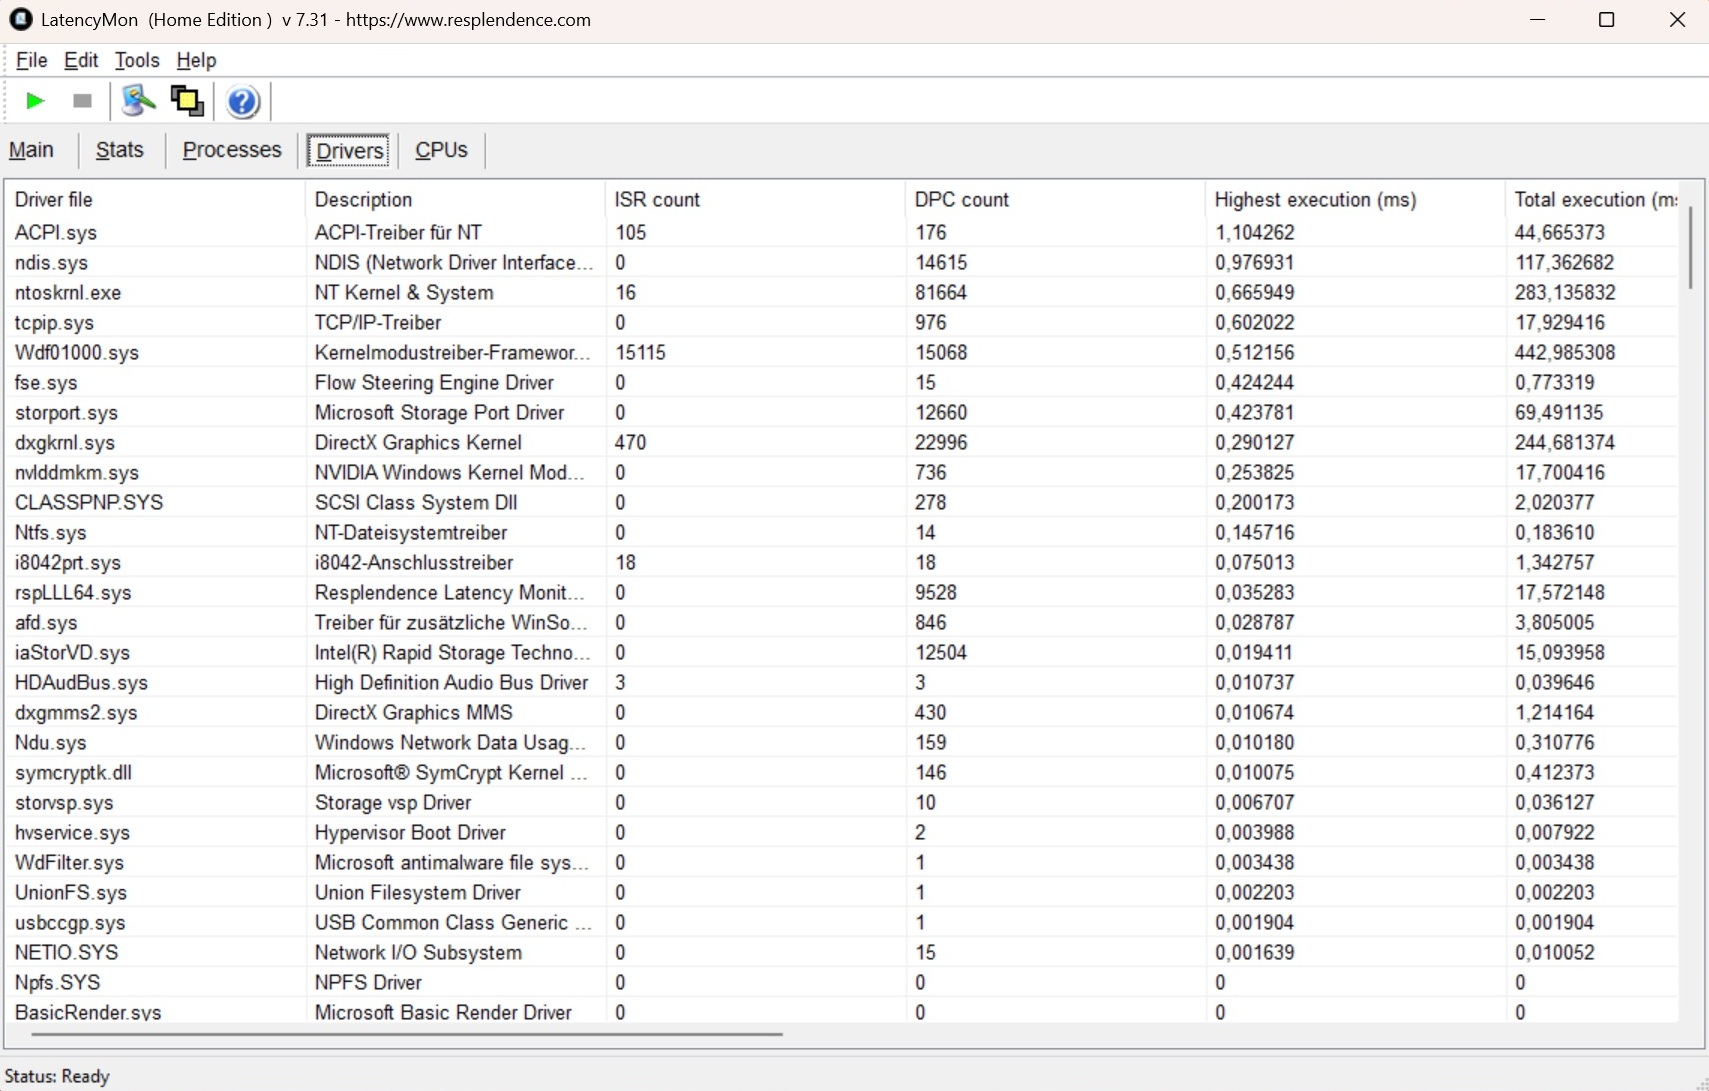
Latenze DPC
MSI dovrebbe comunque lavorare sul problema della latenza. Secondo LatencyMon, sia il Vector 16 che il Katana 17 raggiungono valori estremamente elevati, che possono portare a dei dropout.
| DPC Latencies / LatencyMon - interrupt to process latency (max), Web, Youtube, Prime95 | |
| MSI Katana 17 HX B14WGK | |
| MSI Vector 16 HX AI A2XWHG | |
| Alienware 16 Area-51 | |
| SCHENKER XMG Pro 16 (E25) | |
| MSI Vector 16 HX A14V | |
* ... Meglio usare valori piccoli
Conservazione
C'è anche un margine di miglioramento in termini di memoria di massa. Mentre la velocità di lettura dell'unità Micron integrata è abbastanza decente per un modello NVMe, la velocità di scrittura lascia a desiderare. Tuttavia, l'unità da 16 pollici non ha avuto problemi di cadute nel test del ciclo.

* ... Meglio usare valori piccoli
Sustained read performance: DiskSpd read loop, queue depth 8
Prestazioni della GPU
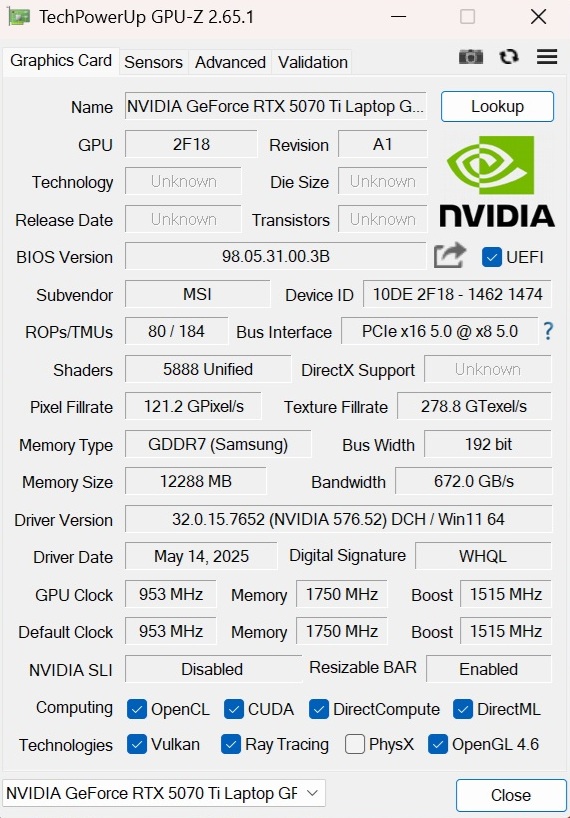
La GeForce RTX 5070 Ti secondo noi avrebbe dovuto essere la vera e propria RTX 5070 che, con 8 anziché 12 GB di VRAM, non è più al passo con i tempi. Tuttavia, la versione Ti lascia una buona impressione sia nei benchmark sintetici che nei giochi. I risultati nel Vector 16 si basano sulla media precedentemente determinata per questa scheda grafica. MSI assegna al rappresentante di Blackwell un massimo di 140 watt TGP, incluso Dynamic Boost. La RTX 5080 dell'Alienware 16 supera la RTX 5070 Ti di circa il 20%.
| 3DMark 06 Standard Score | 60964 punti | |
| 3DMark 11 Performance | 41662 punti | |
| 3DMark Cloud Gate Standard Score | 61167 punti | |
| 3DMark Fire Strike Score | 36625 punti | |
| 3DMark Time Spy Score | 15886 punti | |
Aiuto | ||
* ... Meglio usare valori piccoli
Prestazioni di gioco
La RTX 5070 Ti è un compagno adatto agli schermi Full HD e QHD. Nella nostra risoluzione standard di 2.560 x 1.440 pixel, ad eccezione del poco ottimizzato Oblivion Remastered tutti i titoli hanno funzionato a 40+ fps - con dettagli massimi, ovviamente. La situazione è ancora migliore quando si attiva l'upscaling. Includendo DLSS (4) e (Multi) Frame Generation, di solito si possono raggiungere valori significativamente più alti, come ad esempio Stalker 2 (vedere tabella), il che garantisce una visualizzazione più fluida.
| Doom: The Dark Ages | |
| 2560x1440 Ultra Nightmare AA:T | |
| Medion Erazer Beast 18 X1 MD62731 | |
| Media della classe Gaming (35 - 82.1, n=10, ultimi 2 anni) | |
| MSI Vector 16 HX AI A2XWHG | |
| Media Nvidia GeForce RTX 5070 Ti Laptop (45.7 - 59.1, n=3) | |
| MSI Katana 17 HX B14WGK | |
| 2560x1440 Ultra Nightmare - DLSS Quality | |
| Medion Erazer Beast 18 X1 MD62731 | |
| Media della classe Gaming (55.1 - 107.3, n=9, ultimi 2 anni) | |
| MSI Vector 16 HX AI A2XWHG | |
| Media Nvidia GeForce RTX 5070 Ti Laptop (61 - 82.5, n=3) | |
| MSI Katana 17 HX B14WGK | |
| The Elder Scrolls IV Oblivion Remastered | |
| 2560x1440 Ultra Preset AA:T | |
| Medion Erazer Beast 18 X1 MD62731 | |
| Media Nvidia GeForce RTX 5070 Ti Laptop (28 - 30.1, n=2) | |
| Media della classe Gaming (12.7 - 41.7, n=6, ultimi 2 anni) | |
| MSI Vector 16 HX AI A2XWHG | |
| MSI Katana 17 HX B14WGK | |
| 2560x1440 Ultra Preset + Quality DLSS | |
| Medion Erazer Beast 18 X1 MD62731 | |
| Media Nvidia GeForce RTX 5070 Ti Laptop (41.9 - 44.7, n=2) | |
| Media della classe Gaming (25.3 - 59.7, n=6, ultimi 2 anni) | |
| MSI Vector 16 HX AI A2XWHG | |
| MSI Katana 17 HX B14WGK | |
| Kingdom Come Deliverance 2 | |
| 2560x1440 Ultra Preset | |
| Medion Erazer Beast 18 X1 MD62731 | |
| Media della classe Gaming (45.5 - 86, n=7, ultimi 2 anni) | |
| Media Nvidia GeForce RTX 5070 Ti Laptop (59 - 62.7, n=2) | |
| MSI Vector 16 HX AI A2XWHG | |
| MSI Katana 17 HX B14WGK | |
| 2560x1440 Ultra Preset + Quality DLSS | |
| Medion Erazer Beast 18 X1 MD62731 | |
| Media della classe Gaming (57.6 - 114.5, n=7, ultimi 2 anni) | |
| Media Nvidia GeForce RTX 5070 Ti Laptop (79.2 - 86.1, n=2) | |
| MSI Vector 16 HX AI A2XWHG | |
| MSI Katana 17 HX B14WGK | |
| Until Dawn | |
| 2560x1440 Ultra Preset | |
| Medion Erazer Beast 18 X1 MD62731 | |
| Media della classe Gaming (32.9 - 69.5, n=7, ultimi 2 anni) | |
| MSI Vector 16 HX AI A2XWHG | |
| Media Nvidia GeForce RTX 5070 Ti Laptop (n=1) | |
| MSI Katana 17 HX B14WGK | |
| 2560x1440 Ultra Preset + Quality DLSS + Ray Tracing | |
| Medion Erazer Beast 18 X1 MD62731 | |
| Media della classe Gaming (41.5 - 86.3, n=7, ultimi 2 anni) | |
| MSI Vector 16 HX AI A2XWHG | |
| Media Nvidia GeForce RTX 5070 Ti Laptop (n=1) | |
| MSI Katana 17 HX B14WGK | |
| Space Marine 2 | |
| 2560x1440 Ultra Preset AA:T | |
| Medion Erazer Beast 18 X1 MD62731 | |
| Media della classe Gaming (48.2 - 98.6, n=7, ultimi 2 anni) | |
| MSI Vector 16 HX AI A2XWHG | |
| Media Nvidia GeForce RTX 5070 Ti Laptop (n=1) | |
| MSI Katana 17 HX B14WGK | |
| 2560x1440 Ultra Preset + Quality DLSS | |
| Medion Erazer Beast 18 X1 MD62731 | |
| MSI Vector 16 HX AI A2XWHG | |
| Media Nvidia GeForce RTX 5070 Ti Laptop (n=1) | |
| Media della classe Gaming (58.5 - 100.8, n=7, ultimi 2 anni) | |
| MSI Katana 17 HX B14WGK | |
| Senua's Saga Hellblade 2 | |
| 2560x1440 High Preset | |
| Medion Erazer Beast 18 X1 MD62731 | |
| Media della classe Gaming (27.1 - 57.3, n=9, ultimi 2 anni) | |
| MSI Vector 16 HX AI A2XWHG | |
| Media Nvidia GeForce RTX 5070 Ti Laptop (n=1) | |
| MSI Katana 17 HX B14WGK | |
| 2560x1440 High Preset + Quality DLSS | |
| Medion Erazer Beast 18 X1 MD62731 | |
| Media della classe Gaming (42.2 - 83.1, n=8, ultimi 2 anni) | |
| MSI Vector 16 HX AI A2XWHG | |
| Media Nvidia GeForce RTX 5070 Ti Laptop (n=1) | |
| MSI Katana 17 HX B14WGK | |
| Ghost of Tsushima | |
| 2560x1440 Very High Preset AA:T | |
| Medion Erazer Beast 18 X1 MD62731 | |
| MSI Vector 16 HX AI A2XWHG | |
| Media Nvidia GeForce RTX 5070 Ti Laptop (n=1) | |
| Media della classe Gaming (22.7 - 84.9, n=10, ultimi 2 anni) | |
| MSI Katana 17 HX B14WGK | |
| 2560x1440 Very High Preset + Quality DLSS | |
| Medion Erazer Beast 18 X1 MD62731 | |
| MSI Vector 16 HX AI A2XWHG | |
| Media Nvidia GeForce RTX 5070 Ti Laptop (n=1) | |
| Media della classe Gaming (60.2 - 105.2, n=8, ultimi 2 anni) | |
| MSI Katana 17 HX B14WGK | |
| Horizon Forbidden West | |
| 2560x1440 Very High Preset AA:T | |
| Medion Erazer Beast 18 X1 MD62731 | |
| MSI Vector 16 HX AI A2XWHG | |
| Media Nvidia GeForce RTX 5070 Ti Laptop (n=1) | |
| Media della classe Gaming (24.1 - 98, n=14, ultimi 2 anni) | |
| MSI Katana 17 HX B14WGK | |
| 2560x1440 Very High Preset + DLSS Quality | |
| Medion Erazer Beast 18 X1 MD62731 | |
| MSI Vector 16 HX AI A2XWHG | |
| Media Nvidia GeForce RTX 5070 Ti Laptop (n=1) | |
| Media della classe Gaming (59.9 - 116.6, n=5, ultimi 2 anni) | |
| MSI Katana 17 HX B14WGK | |
| Cyberpunk 2077 2.2 Phantom Liberty - 1920x1080 Ultra Preset (FSR off) | |
| Alienware 16 Area-51 | |
| SCHENKER XMG Pro 16 (E25) | |
| Media Nvidia GeForce RTX 5070 Ti Laptop (104.9 - 135.5, n=8) | |
| MSI Vector 16 HX AI A2XWHG | |
| MSI Vector 16 HX A14V | |
| MSI Katana 17 HX B14WGK | |
| Media della classe Gaming (6.76 - 166.5, n=116, ultimi 2 anni) | |
| GTA V - 1920x1080 Highest Settings possible AA:4xMSAA + FX AF:16x | |
| SCHENKER XMG Pro 16 (E25) | |
| Media Nvidia GeForce RTX 5070 Ti Laptop (124.7 - 161, n=6) | |
| MSI Vector 16 HX AI A2XWHG | |
| MSI Vector 16 HX A14V | |
| Media della classe Gaming (12.1 - 186.9, n=124, ultimi 2 anni) | |
| MSI Katana 17 HX B14WGK | |
| Final Fantasy XV Benchmark - 1920x1080 High Quality | |
| Alienware 16 Area-51 | |
| MSI Vector 16 HX A14V | |
| MSI Vector 16 HX AI A2XWHG | |
| Media Nvidia GeForce RTX 5070 Ti Laptop (135.8 - 181.4, n=8) | |
| SCHENKER XMG Pro 16 (E25) | |
| Media della classe Gaming (19.2 - 212, n=143, ultimi 2 anni) | |
| Strange Brigade - 1920x1080 ultra AA:ultra AF:16 | |
| Alienware 16 Area-51 | |
| MSI Vector 16 HX A14V | |
| Media Nvidia GeForce RTX 5070 Ti Laptop (136.4 - 353, n=5) | |
| Media della classe Gaming (38.9 - 456, n=135, ultimi 2 anni) | |
| SCHENKER XMG Pro 16 (E25) | |
| Dota 2 Reborn - 1920x1080 ultra (3/3) best looking | |
| MSI Vector 16 HX A14V | |
| SCHENKER XMG Pro 16 (E25) | |
| MSI Vector 16 HX AI A2XWHG | |
| Media Nvidia GeForce RTX 5070 Ti Laptop (134.2 - 193, n=7) | |
| Alienware 16 Area-51 | |
| Media della classe Gaming (65.1 - 248, n=146, ultimi 2 anni) | |
| MSI Katana 17 HX B14WGK | |
| basso | medio | alto | ultra | QHD DLSS | QHD | |
|---|---|---|---|---|---|---|
| GTA V (2015) | 185.6 | 179 | 144.8 | 138.8 | ||
| Dota 2 Reborn (2015) | 209 | 183.9 | 175.8 | 164.7 | ||
| Final Fantasy XV Benchmark (2018) | 208 | 163.1 | 119.7 | |||
| X-Plane 11.11 (2018) | 138.7 | 114.7 | 106.6 | |||
| Baldur's Gate 3 (2023) | 179.1 | 151.9 | 147.4 | 99.1 | ||
| Cyberpunk 2077 2.2 Phantom Liberty (2023) | 138.5 | 135.4 | 119.6 | 75 | ||
| Counter-Strike 2 (2023) | 316 | 265 | 222 | 174.1 | ||
| Prince of Persia The Lost Crown (2024) | 358 | 358 | 357 | 356 | ||
| Helldivers 2 (2024) | 143.8 | 141.7 | 141.4 | 101.6 | ||
| Dragon's Dogma 2 (2024) | 83 | 74.8 | ||||
| Horizon Forbidden West (2024) | 131.1 | 97.5 | 96 | 93.1 | 72.6 | |
| Ghost of Tsushima (2024) | 106.5 | 102 | 83.8 | 83.9 | 60.7 | |
| Senua's Saga Hellblade 2 (2024) | 77.2 | 55 | 59.1 | 40 | ||
| Star Wars Outlaws (2024) | 70.7 | 66.5 | 55.9 | 56.8 | 40.3 | |
| Space Marine 2 (2024) | 90.9 | 88.8 | 87.7 | 84.6 | 73.1 | |
| Until Dawn (2024) | 99.3 | 85.9 | 67.7 | 61.4 | 48 | |
| Stalker 2 (2024) | 84.6 | 73.6 | 62 | 100.8 | 46.9 | |
| Kingdom Come Deliverance 2 (2025) | 145.2 | 118.8 | 84.1 | 79.2 | 59 | |
| Civilization 7 (2025) | 192.1 | 187.5 | 129.1 | |||
| The Elder Scrolls IV Oblivion Remastered (2025) | 86.9 | 78.2 | 40 | 41.9 | 28 | |
| Doom: The Dark Ages (2025) | 94.8 | 84.3 | 82.7 | 79.1 | 57.9 |
Il nostro Cyberpunk 2077 Il test dimostra anche che le prestazioni della GPU rimangono costanti per un periodo di tempo più lungo. La storia è simile a quella della CPU nel ciclo di Cinebench.
Cyberpunk 2077 ultra FPS chart
Emissioni
Livelli di rumore
MSI dovrebbe riconsiderare il controllo delle ventole. Con il profilo AI, le due ventole del case, come già detto, sono già abbastanza udibili quando sono inattive. In modalità 3D, il Vector 16 è un po' più silenzioso di diversi concorrenti, registrando tra 46 e 49 dB, a condizione che non ci sia un carico esclusivo della CPU. Tuttavia, questo non significa che il portatile da 16 pollici sia silenzioso.
Rumorosità
| Idle |
| 33 / 34 / 38 dB(A) |
| Sotto carico |
| 46 / 49 dB(A) |
 | ||
30 dB silenzioso 40 dB(A) udibile 50 dB(A) rumoroso |
||
min: | ||
| MSI Vector 16 HX AI A2XWHG Ultra 7 255HX, GeForce RTX 5070 Ti Laptop | MSI Vector 16 HX A14V i9-14900HX, NVIDIA GeForce RTX 4080 Laptop GPU | MSI Katana 17 HX B14WGK i7-14650HX, GeForce RTX 5070 Laptop | SCHENKER XMG Pro 16 (E25) Ultra 9 275HX, GeForce RTX 5070 Ti Laptop | Alienware 16 Area-51 Ultra 9 275HX, GeForce RTX 5080 Laptop | |
|---|---|---|---|---|---|
| Noise | -4% | -4% | 10% | 13% | |
| off /ambiente * | 25 | 23.2 7% | 25 -0% | 23.3 7% | 23.6 6% |
| Idle Minimum * | 33 | 33.5 -2% | 31 6% | 25 24% | 25.4 23% |
| Idle Average * | 34 | 33.5 1% | 32 6% | 25 26% | 27.8 18% |
| Idle Maximum * | 38 | 33.5 12% | 34 11% | 25 34% | 28.1 26% |
| Load Average * | 46 | 52.1 -13% | 50 -9% | 45.5 1% | 28.8 37% |
| Cyberpunk 2077 ultra * | 47 | 58 -23% | 53.3 -13% | 50.4 -7% | |
| Load Maximum * | 49 | 62 -27% | 59 -20% | 53.3 -9% | 56.4 -15% |
| Witcher 3 ultra * | 62 |
* ... Meglio usare valori piccoli
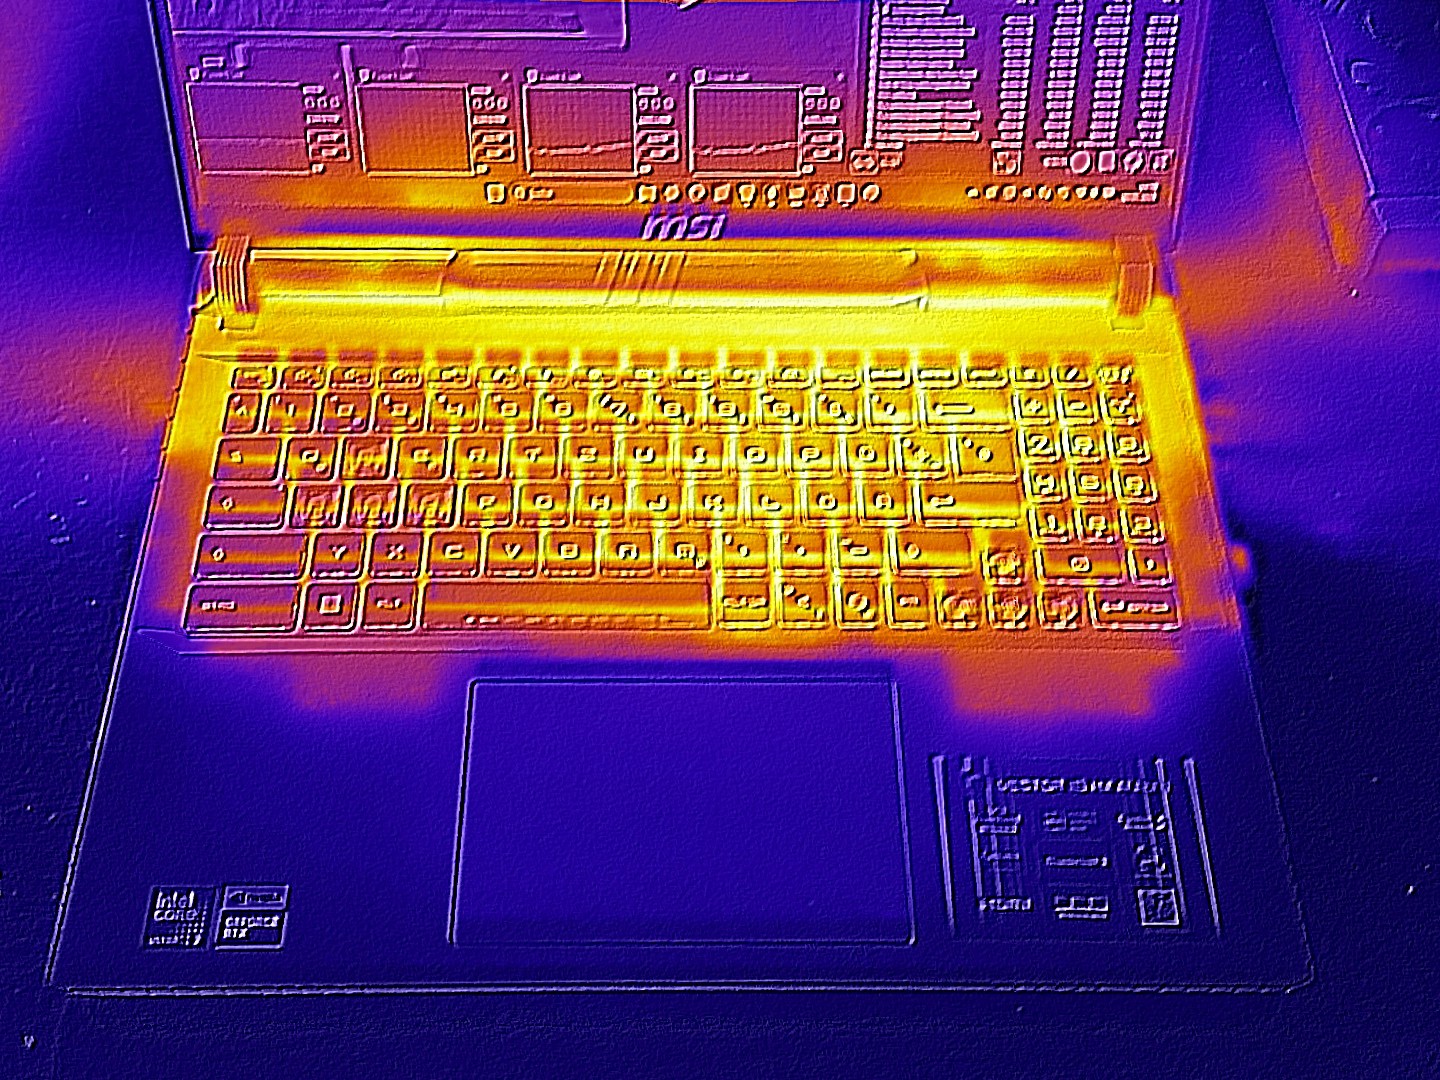
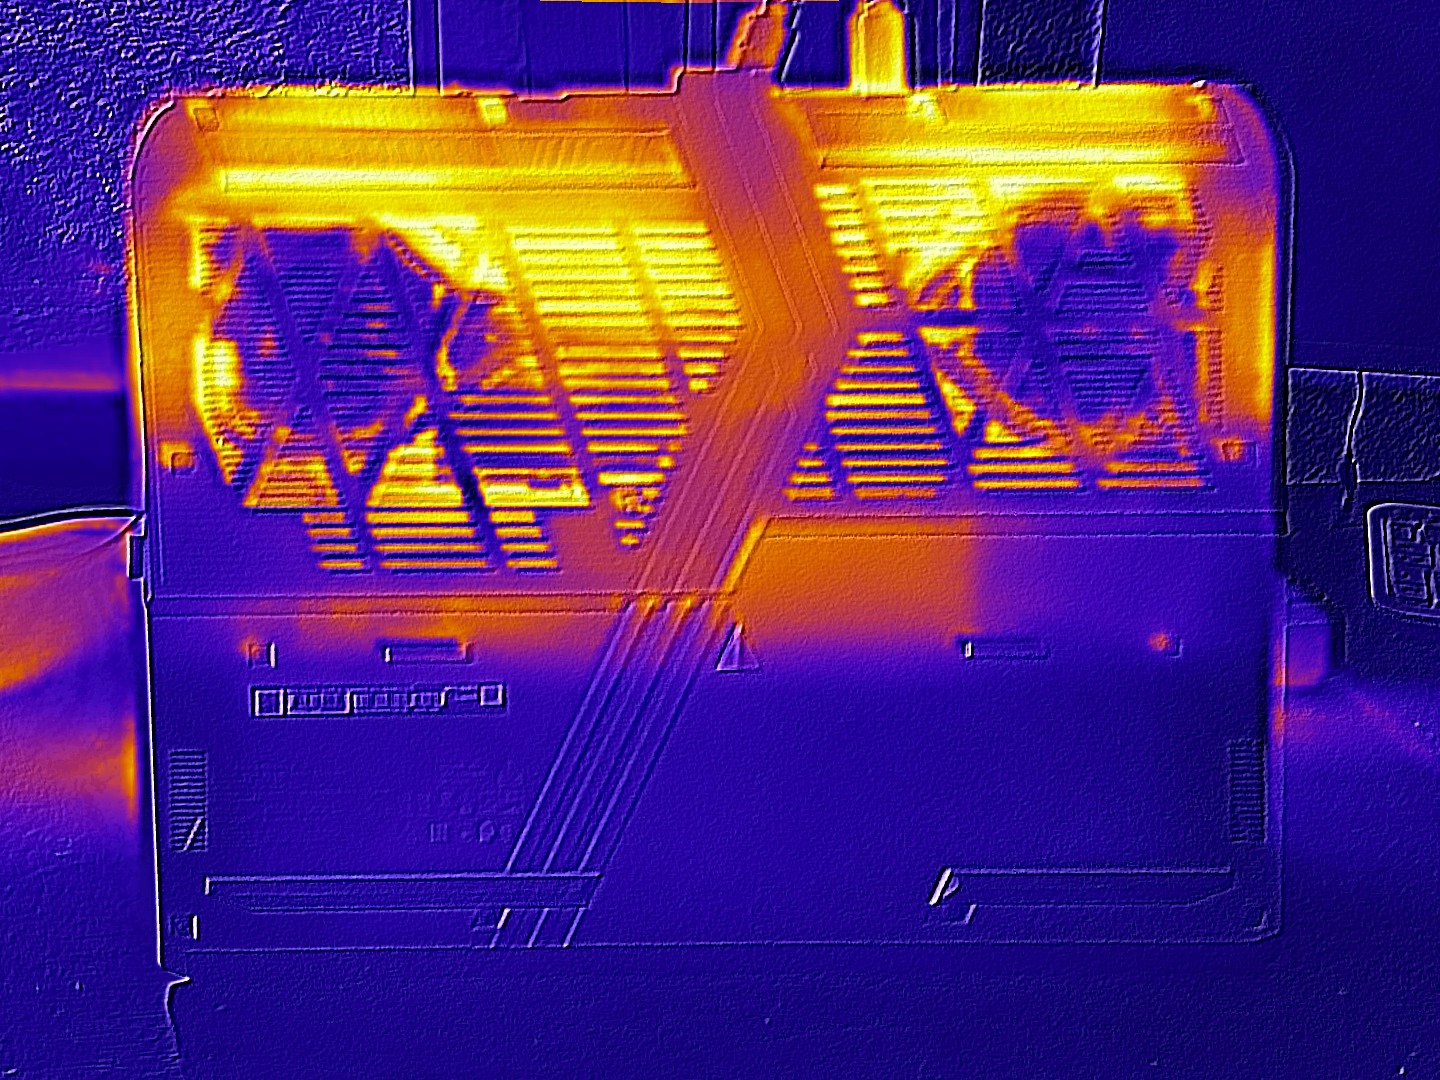
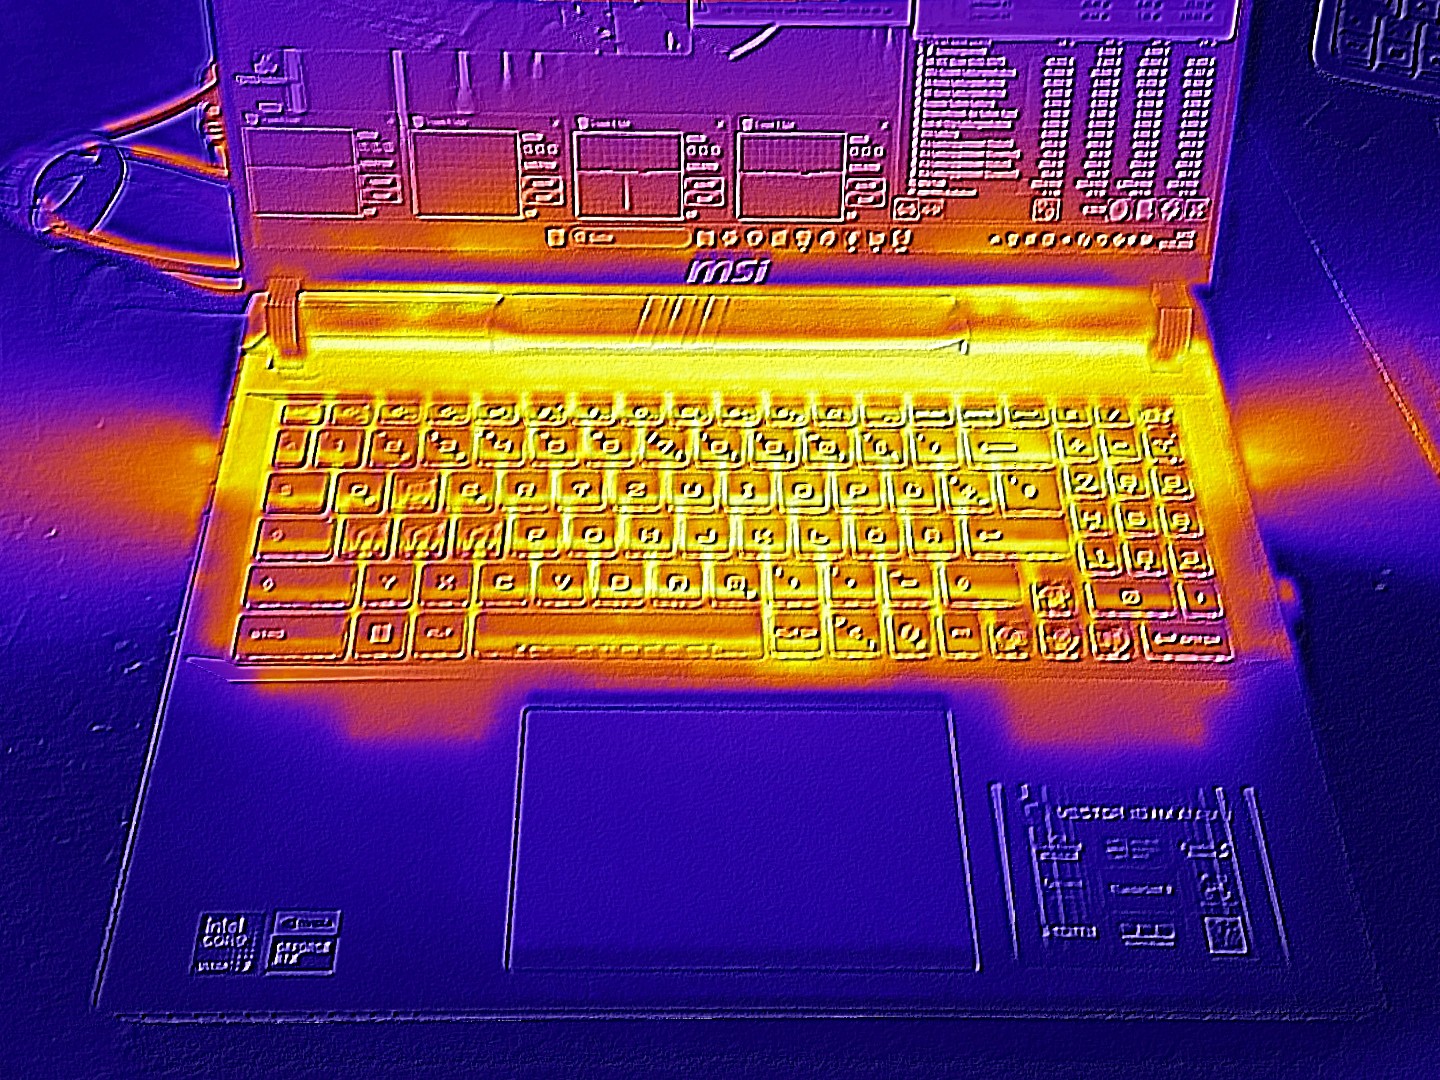
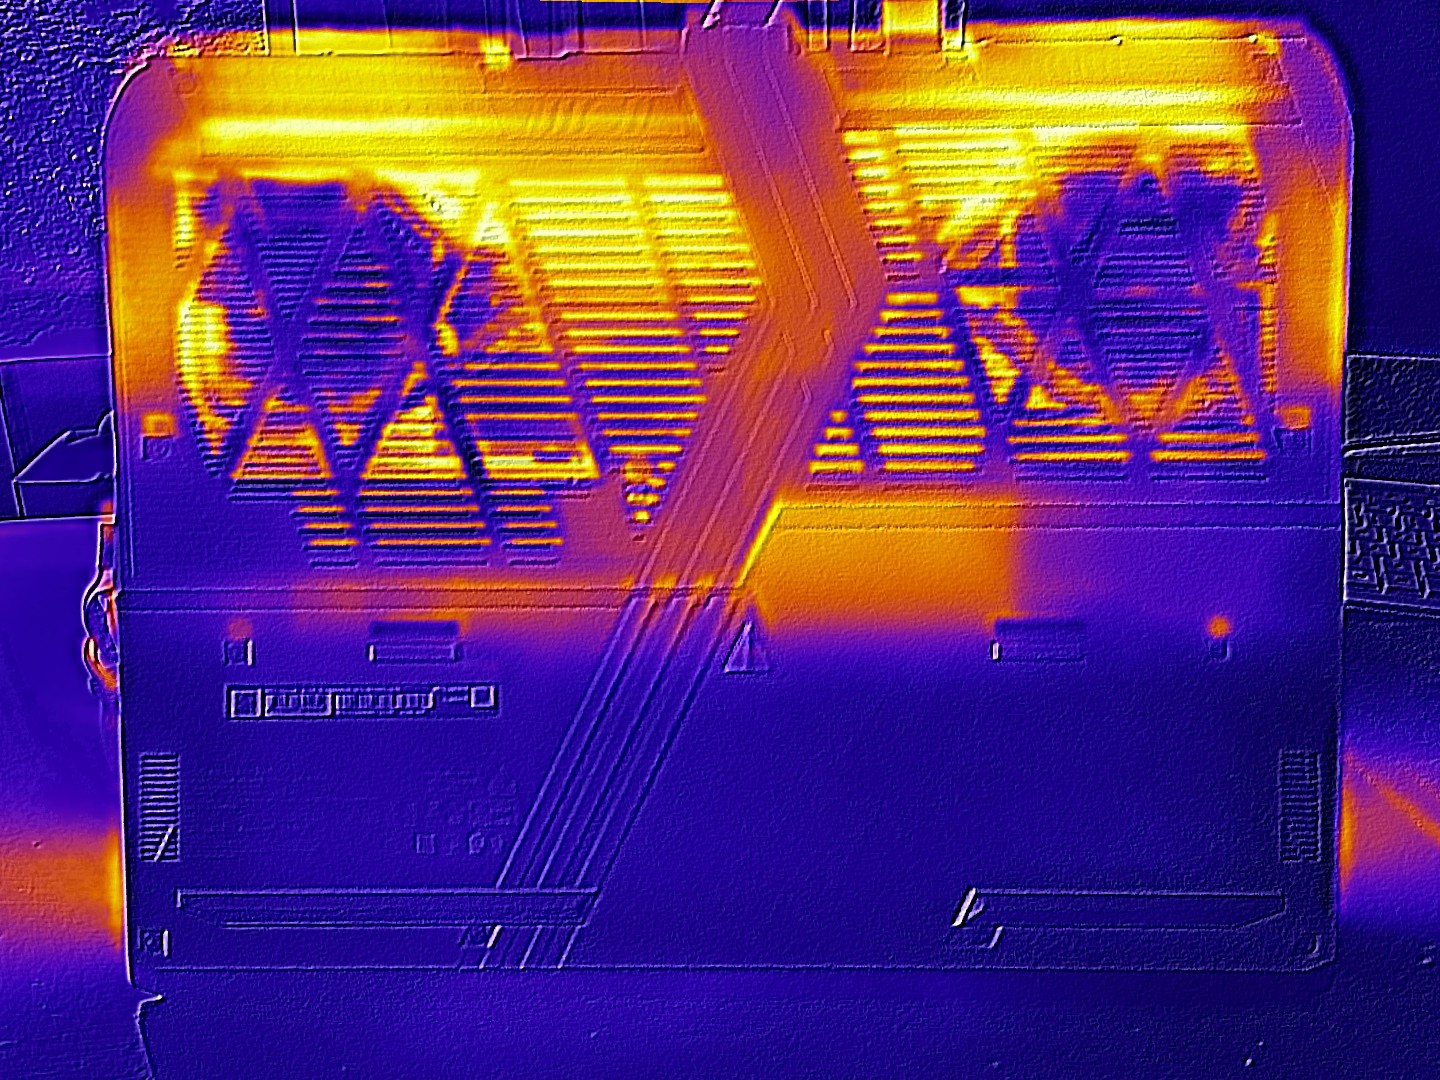
Temperatura
Sotto carico, lo chassis diventa più caldo verso il terzo posteriore. Le temperature di picco di 53 °C sulla superficie superiore e di 52 °C sul lato inferiore sono meno che ideali e leggermente superiori a quelle dei dispositivi concorrenti. Quando è inattivo, tuttavia, lo chassis rimane tipicamente al di sotto dei 30 °C, mantenendosi comodamente fresco.
(-) La temperatura massima sul lato superiore è di 53 °C / 127 F, rispetto alla media di 40.5 °C / 105 F, che varia da 21.2 a 68.8 °C per questa classe Gaming.
(-) Il lato inferiore si riscalda fino ad un massimo di 52 °C / 126 F, rispetto alla media di 43.3 °C / 110 F
(+) In idle, la temperatura media del lato superiore è di 28.1 °C / 83 F, rispetto alla media deld ispositivo di 33.9 °C / 93 F.
(-) 3: The average temperature for the upper side is 43.9 °C / 111 F, compared to the average of 33.9 °C / 93 F for the class Gaming.
(±) I poggiapolsi e il touchpad possono diventare molto caldi al tatto con un massimo di 37 °C / 98.6 F.
(-) La temperatura media della zona del palmo della mano di dispositivi simili e'stata di 28.9 °C / 84 F (-8.1 °C / -14.6 F).
| MSI Vector 16 HX AI A2XWHG Ultra 7 255HX, GeForce RTX 5070 Ti Laptop | MSI Vector 16 HX A14V i9-14900HX, NVIDIA GeForce RTX 4080 Laptop GPU | MSI Katana 17 HX B14WGK i7-14650HX, GeForce RTX 5070 Laptop | SCHENKER XMG Pro 16 (E25) Ultra 9 275HX, GeForce RTX 5070 Ti Laptop | Alienware 16 Area-51 Ultra 9 275HX, GeForce RTX 5080 Laptop | |
|---|---|---|---|---|---|
| Heat | 22% | -4% | -191% | 3% | |
| Maximum Upper Side * | 53 | 36.4 31% | 52 2% | 43.2 18% | 43.8 17% |
| Maximum Bottom * | 52 | 35.6 32% | 56 -8% | 46 12% | 40 23% |
| Idle Upper Side * | 33 | 26.6 19% | 33 -0% | 27.7 16% | 35.8 -8% |
| Idle Bottom * | 29 | 27 7% | 32 -10% | 264 -810% | 35.2 -21% |
* ... Meglio usare valori piccoli
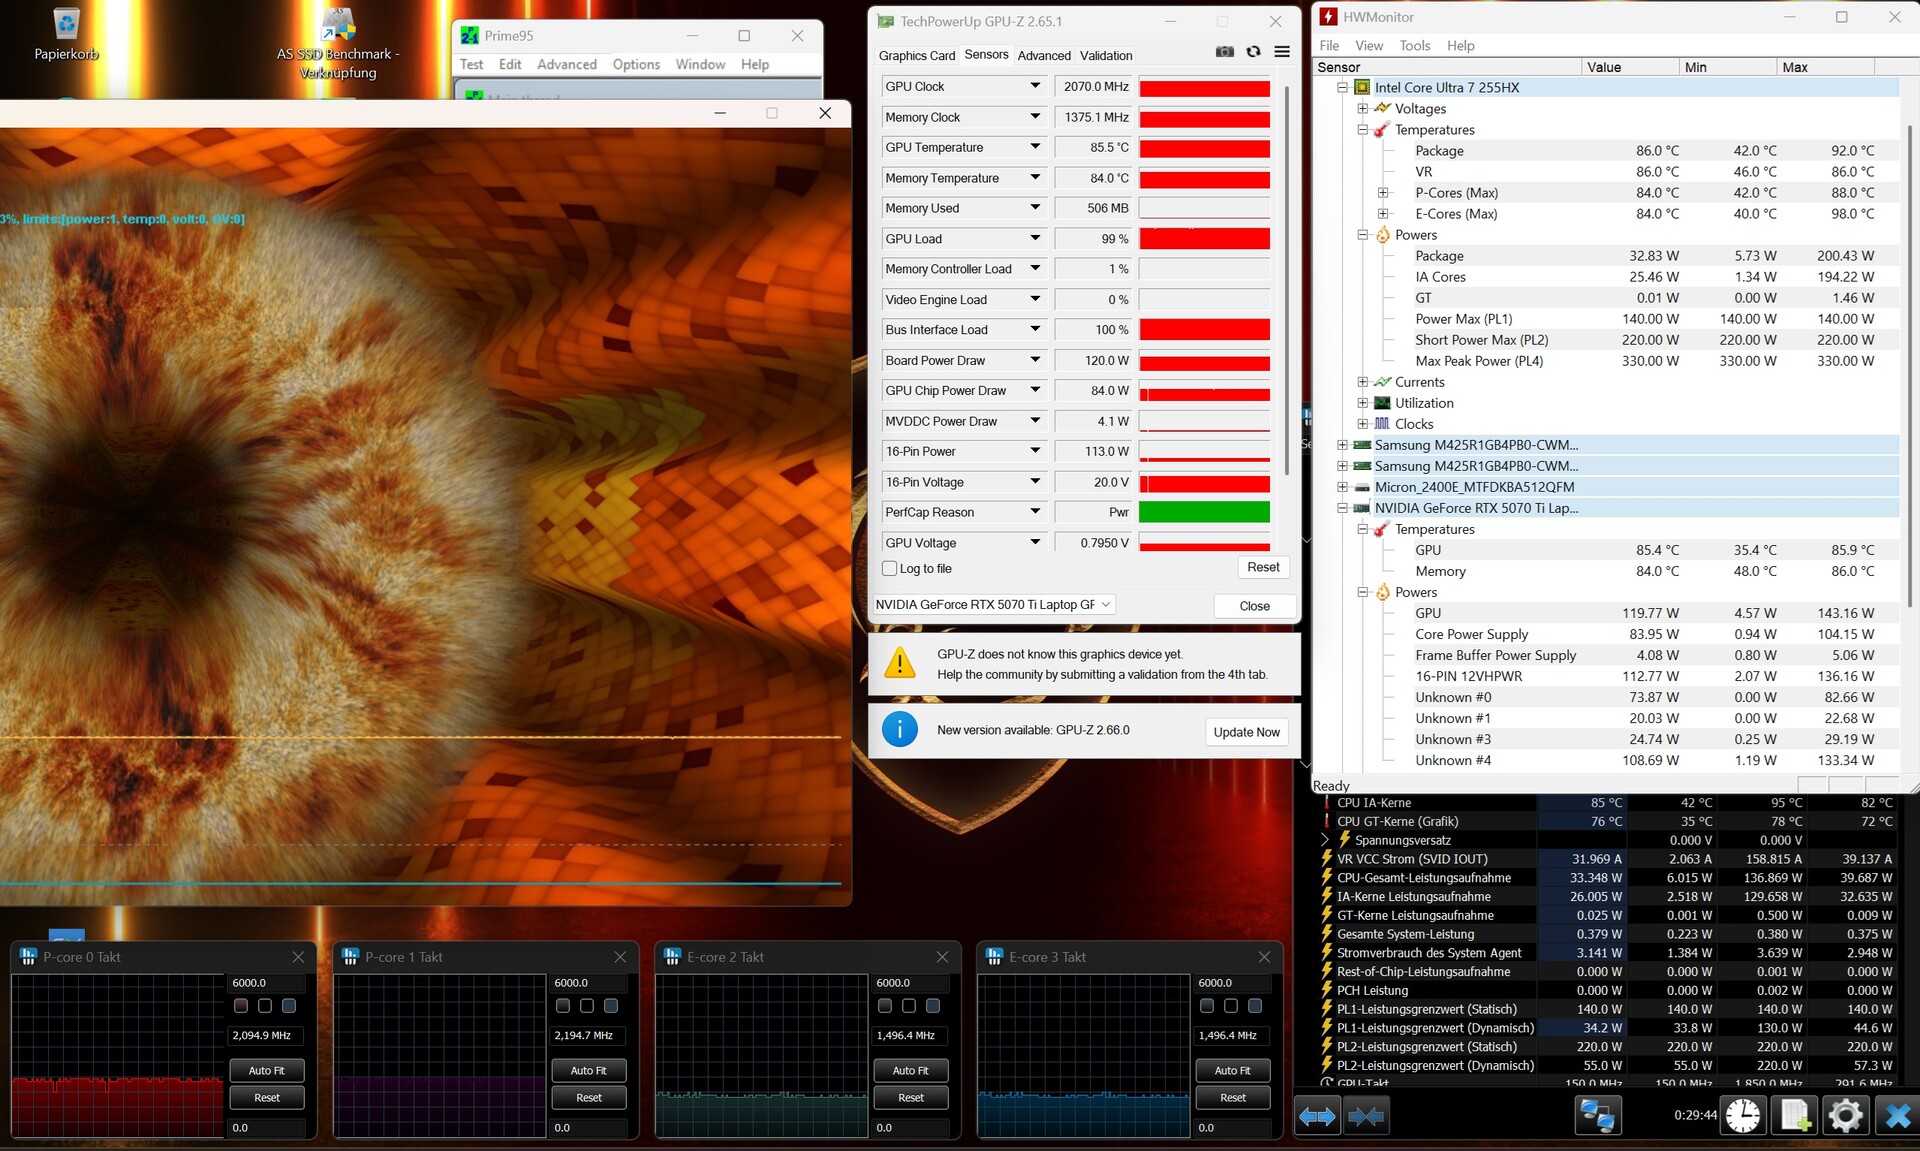
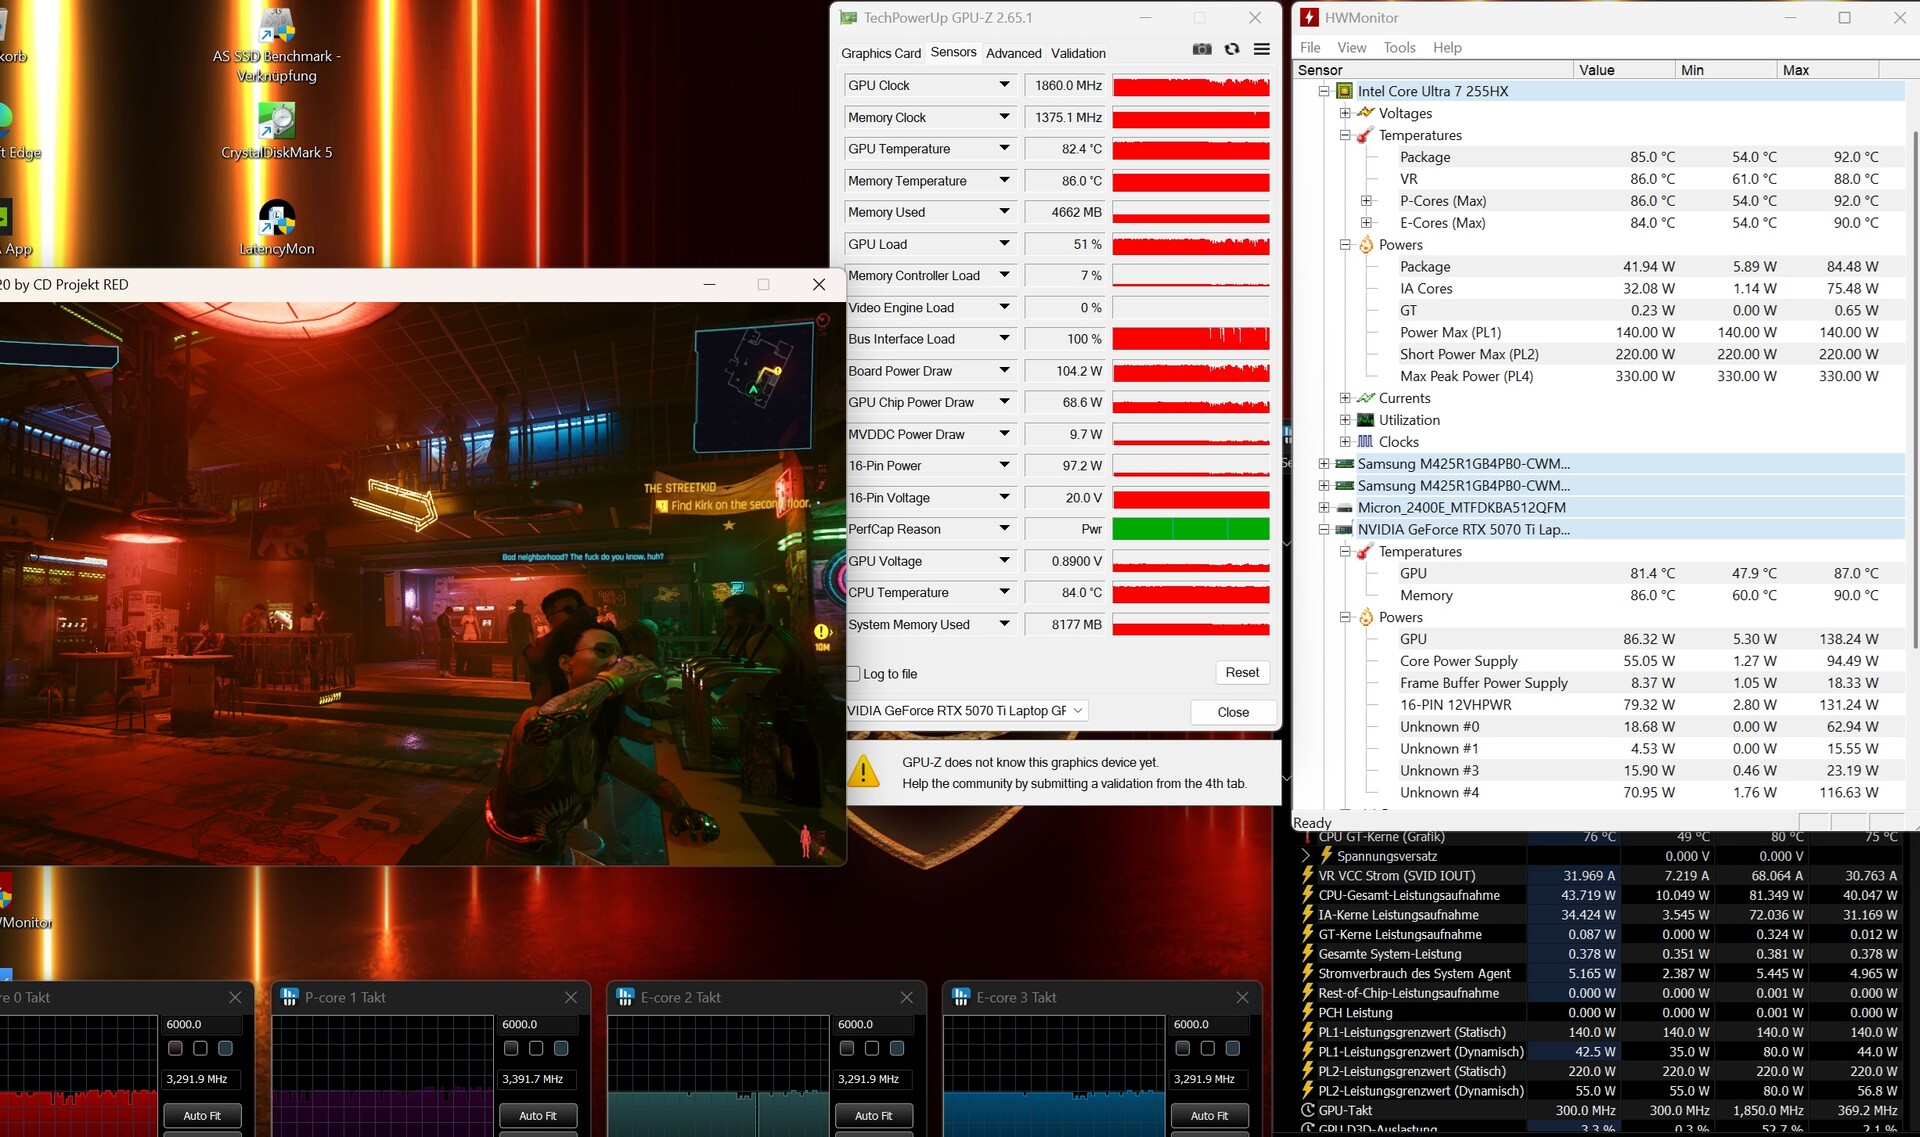
Test da sforzo
Il test di stress utilizzando FurMark e Prime95 ha prodotto risultati contrastanti. Le temperature di circa 86 °C sia per la CPU che per la GPU non sono né particolarmente basse né eccessivamente alte. In Cyberpunk 2077, le temperature dei componenti erano solo leggermente inferiori.
Altoparlanti
La qualità del suono si colloca nella fascia media dei portatili da gioco. Come spesso accade, i bassi potrebbero essere più pronunciati. Detto questo, il sistema audio integrato è chiaramente migliore di quello presente nel Katana 17 (vedere tabella di confronto).
MSI Vector 16 HX AI A2XWHG analisi audio
(+) | gli altoparlanti sono relativamente potenti (86 dB)
Bassi 100 - 315 Hz
(±) | bassi ridotti - in media 12.3% inferiori alla media
(±) | la linearità dei bassi è media (8.5% delta rispetto alla precedente frequenza)
Medi 400 - 2000 Hz
(±) | medi elevati - circa 9.9% superiore alla media
(+) | medi lineari (6.8% delta rispetto alla precedente frequenza)
Alti 2 - 16 kHz
(+) | Alti bilanciati - appena 1.8% dalla media
(+) | alti lineari (2.9% delta rispetto alla precedente frequenza)
Nel complesso 100 - 16.000 Hz
(±) | la linearità complessiva del suono è media (15.8% di differenza rispetto alla media
Rispetto alla stessa classe
» 36% di tutti i dispositivi testati in questa classe è stato migliore, 7% simile, 57% peggiore
» Il migliore ha avuto un delta di 6%, medio di 18%, peggiore di 132%
Rispetto a tutti i dispositivi testati
» 22% di tutti i dispositivi testati in questa classe è stato migliore, 5% similare, 72% peggiore
» Il migliore ha avuto un delta di 4%, medio di 24%, peggiore di 134%
MSI Katana 17 HX B14WGK analisi audio
(+) | gli altoparlanti sono relativamente potenti (84 dB)
Bassi 100 - 315 Hz
(-) | quasi nessun basso - in media 19% inferiori alla media
(±) | la linearità dei bassi è media (10.6% delta rispetto alla precedente frequenza)
Medi 400 - 2000 Hz
(±) | medi elevati - circa 8.7% superiore alla media
(±) | linearità dei medi adeguata (7.5% delta rispetto alla precedente frequenza)
Alti 2 - 16 kHz
(+) | Alti bilanciati - appena 4.6% dalla media
(±) | la linearità degli alti è media (9.7% delta rispetto alla precedente frequenza)
Nel complesso 100 - 16.000 Hz
(±) | la linearità complessiva del suono è media (20.6% di differenza rispetto alla media
Rispetto alla stessa classe
» 73% di tutti i dispositivi testati in questa classe è stato migliore, 5% simile, 22% peggiore
» Il migliore ha avuto un delta di 6%, medio di 18%, peggiore di 132%
Rispetto a tutti i dispositivi testati
» 53% di tutti i dispositivi testati in questa classe è stato migliore, 8% similare, 39% peggiore
» Il migliore ha avuto un delta di 4%, medio di 24%, peggiore di 134%
Gestione dell'energia
Consumo di energia
L'assorbimento di energia al minimo si aggira in media intorno ai 16 watt, che è inferiore a quello di molti altri portatili con RTX 5070 (Ti). Sotto carico, il sistema da 16 pollici consuma tra i 124 watt (3DMark 06) e un picco di 336 watt durante lo stress test. Durante il gioco, il consumo energetico si aggira in genere intorno ai 220 watt. Si noti che quando si utilizzano monitor esterni, il sistema si imposta sulla GPU dedicata, il che comporta un consumo energetico inattivo più elevato.
| Off / Standby | |
| Idle | |
| Sotto carico |
|
Leggenda:
min: | |
| MSI Vector 16 HX AI A2XWHG Ultra 7 255HX, GeForce RTX 5070 Ti Laptop | MSI Vector 16 HX A14V i9-14900HX, NVIDIA GeForce RTX 4080 Laptop GPU | MSI Katana 17 HX B14WGK i7-14650HX, GeForce RTX 5070 Laptop | SCHENKER XMG Pro 16 (E25) Ultra 9 275HX, GeForce RTX 5070 Ti Laptop | Alienware 16 Area-51 Ultra 9 275HX, GeForce RTX 5080 Laptop | Media della classe Gaming | |
|---|---|---|---|---|---|---|
| Power Consumption | -33% | 5% | -5% | -67% | -16% | |
| Idle Minimum * | 7.1 | 15.8 -123% | 9.7 -37% | 11.7 -65% | 27 -280% | 14.2 ? -100% |
| Idle Average * | 15.9 | 23.3 -47% | 15 6% | 16.6 -4% | 33.5 -111% | 20.1 ? -26% |
| Idle Maximum * | 29.5 | 30 -2% | 23.7 20% | 17.1 42% | 41.4 -40% | 27.3 ? 7% |
| Load Average * | 124 | 123.9 -0% | 126 -2% | 122.4 1% | 124.7 -1% | 107.5 ? 13% |
| Cyberpunk 2077 ultra external monitor * | 217 | 202 7% | 241 -11% | 249 -15% | ||
| Cyberpunk 2077 ultra * | 222 | 205 8% | 245 -10% | 256 -15% | ||
| Load Maximum * | 336 | 306 9% | 227 32% | 291.5 13% | 367.2 -9% | 257 ? 24% |
| Witcher 3 ultra * | 285 |
* ... Meglio usare valori piccoli
Power consumption: Cyberpunk/stress test
Power consumption with external monitor
Durata della batteria
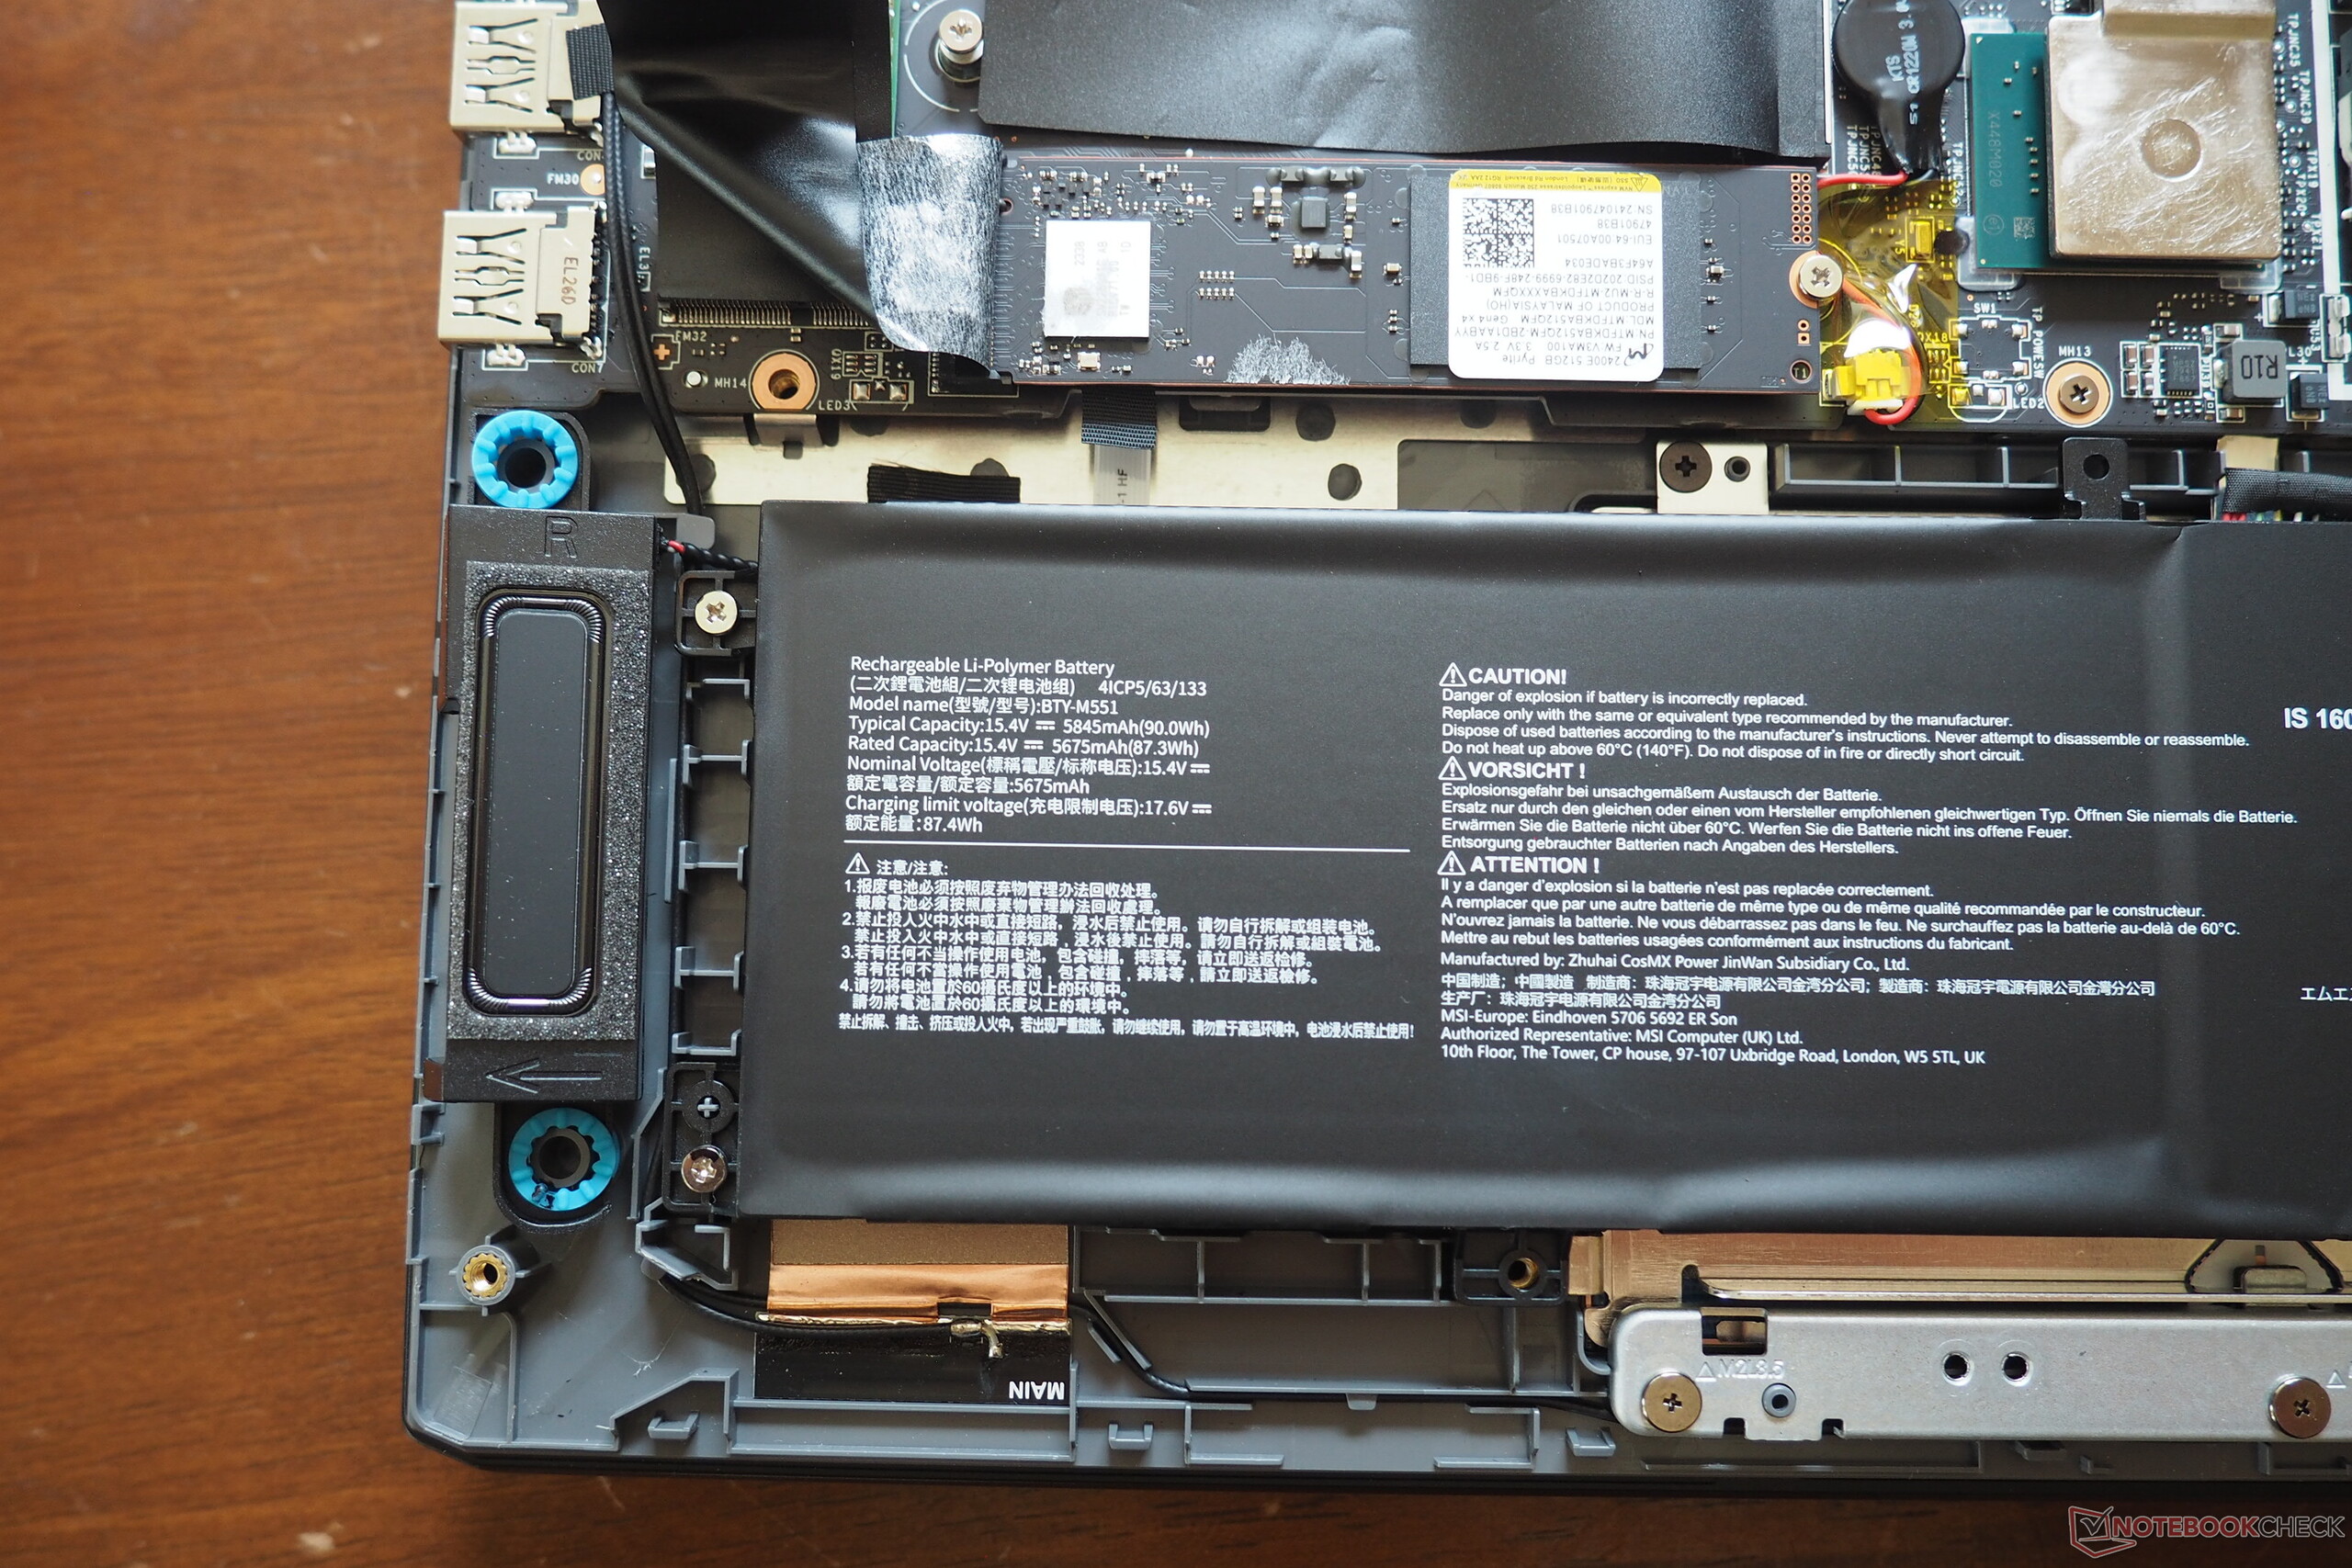
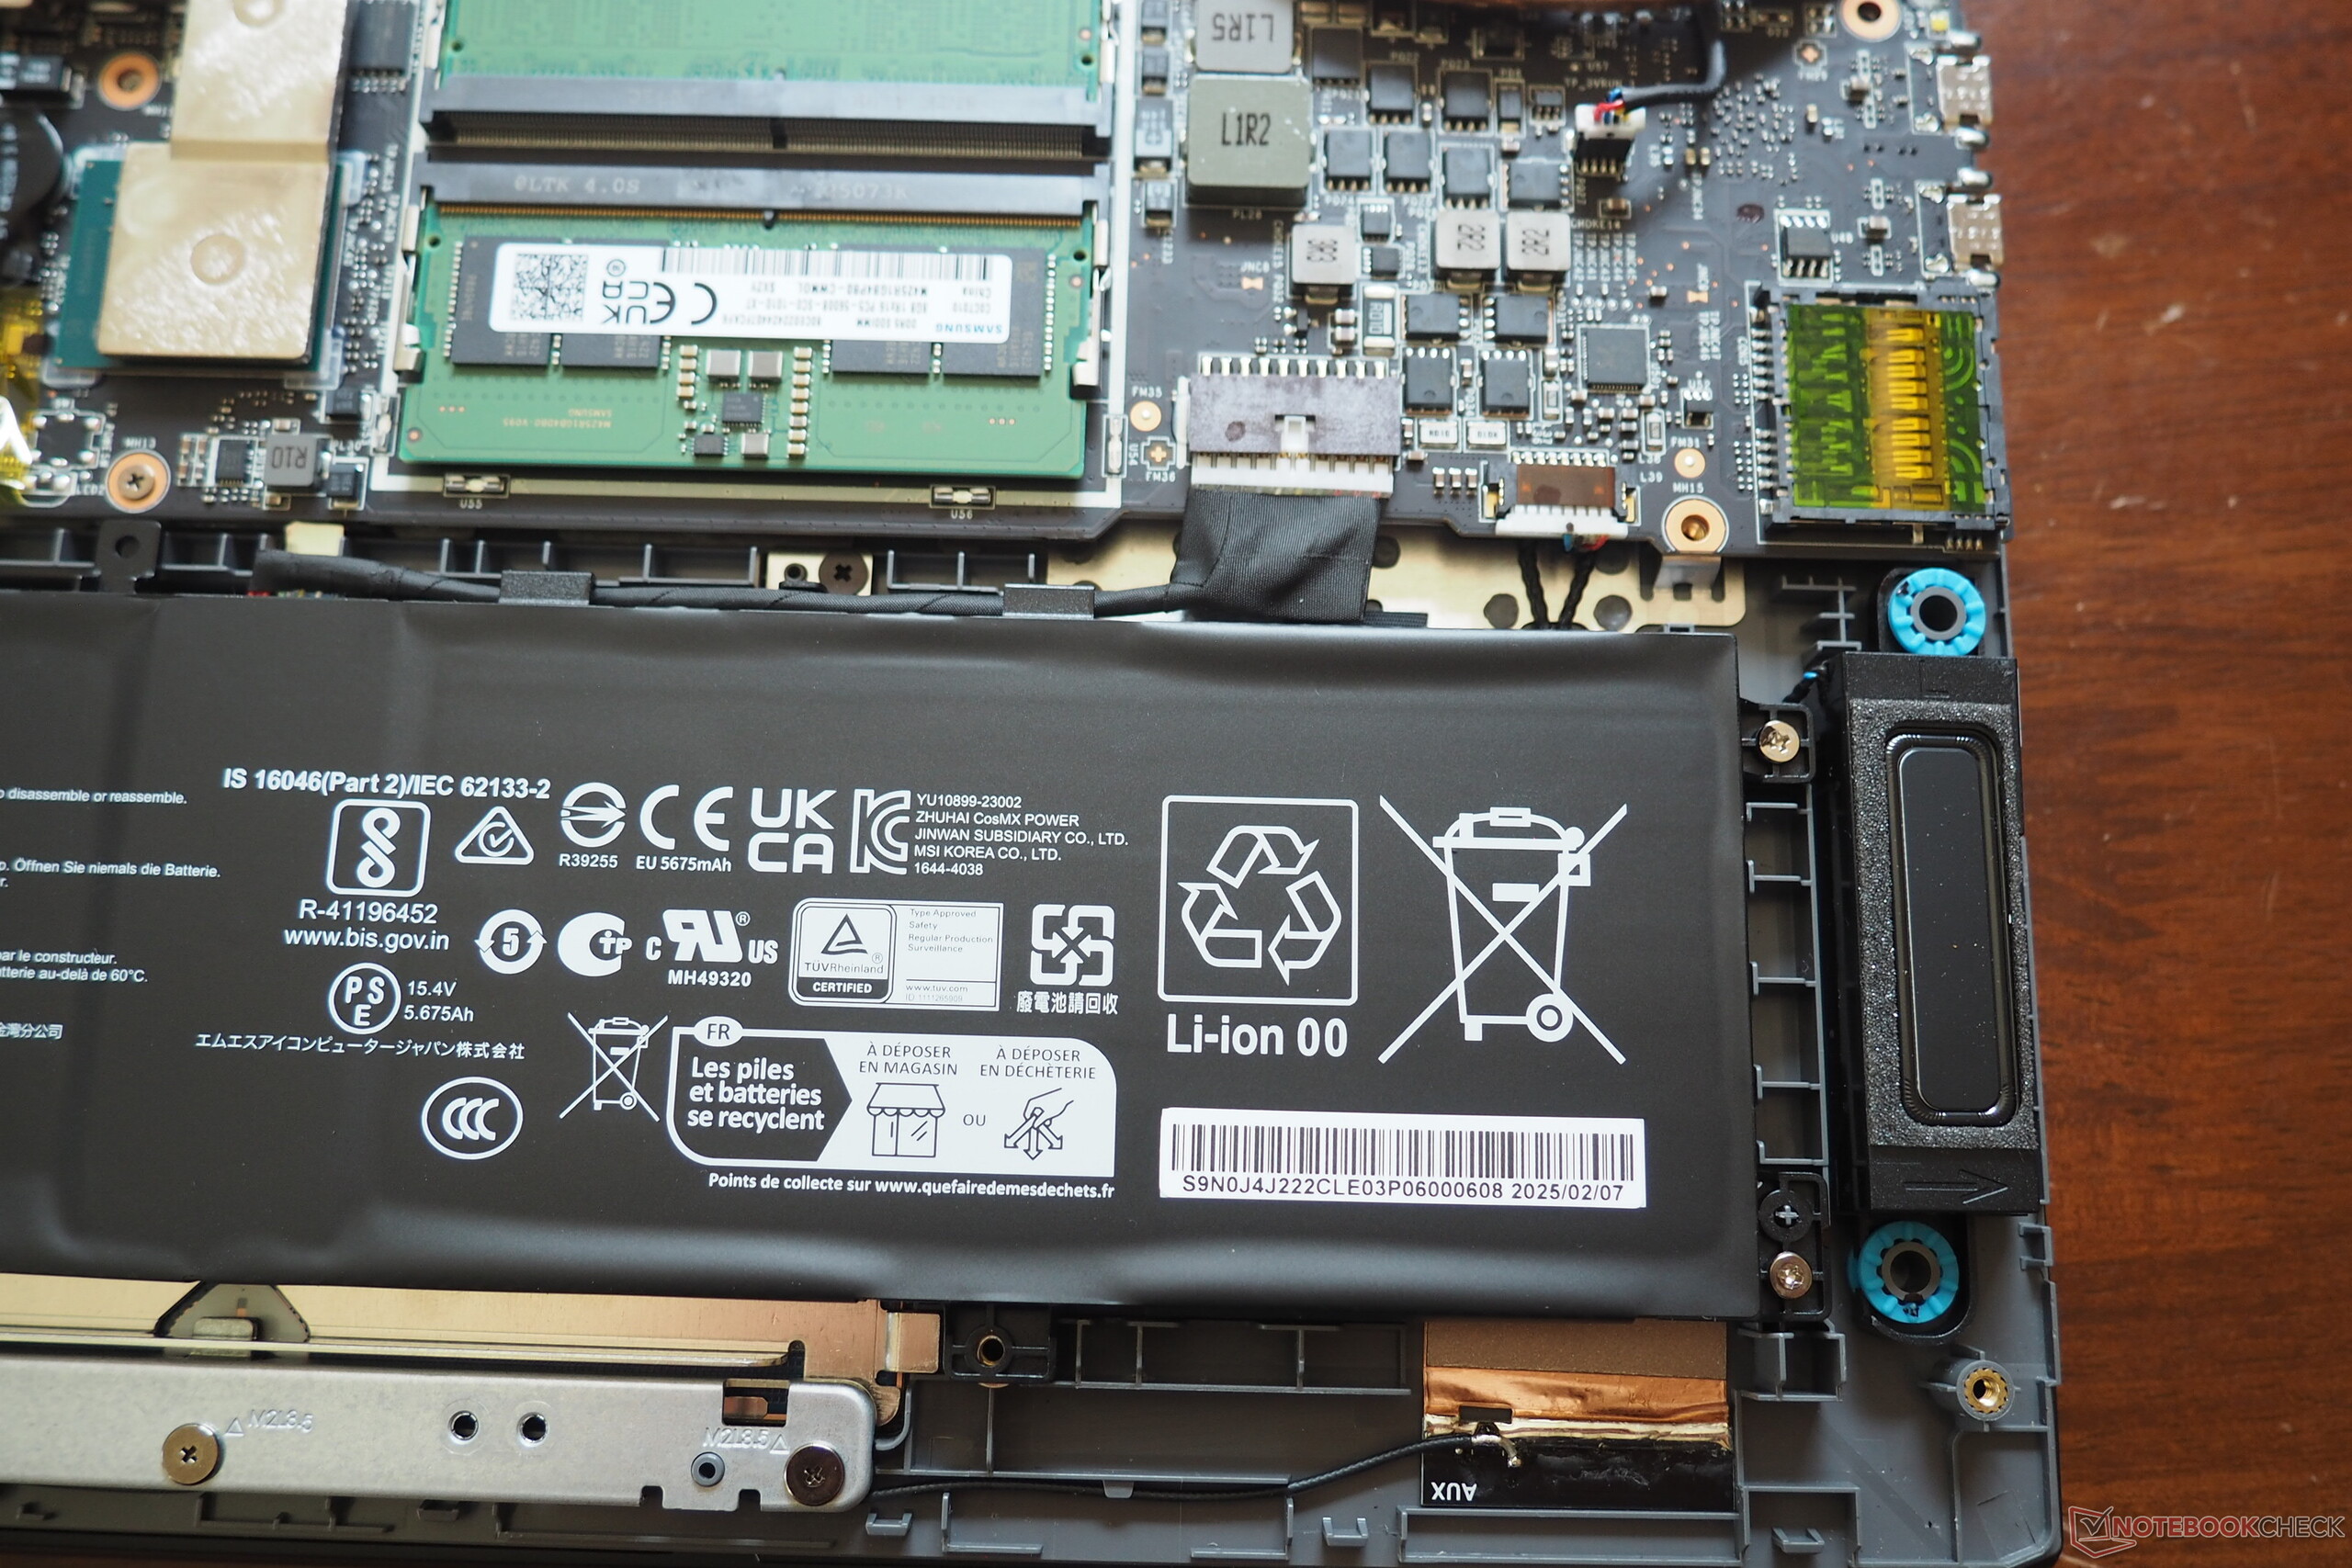
Con una generosa capacità di 90 Wh, la batteria convince per la sua resistenza. Durante il nostro test Wi-Fi con una luminosità ridotta di 150 cd/m², il portatile da 16 pollici ha funzionato per poco meno di sette ore. Sebbene questa autonomia sia lodevole, lo Schenker XMG Pro 16 è ancora in vantaggio con ben nove ore di durata della batteria.
| MSI Vector 16 HX AI A2XWHG Ultra 7 255HX, GeForce RTX 5070 Ti Laptop, 90 Wh | MSI Vector 16 HX A14V i9-14900HX, NVIDIA GeForce RTX 4080 Laptop GPU, 90 Wh | MSI Katana 17 HX B14WGK i7-14650HX, GeForce RTX 5070 Laptop, 75 Wh | SCHENKER XMG Pro 16 (E25) Ultra 9 275HX, GeForce RTX 5070 Ti Laptop, 99.8 Wh | Alienware 16 Area-51 Ultra 9 275HX, GeForce RTX 5080 Laptop, 96 Wh | Media della classe Gaming | |
|---|---|---|---|---|---|---|
| Autonomia della batteria | -21% | -27% | 30% | -59% | -8% | |
| WiFi v1.3 | 419 | 332 -21% | 305 -27% | 545 30% | 170 -59% | 384 ? -8% |
| Reader / Idle | 641 | 187 | 565 ? | |||
| Load | 84 | 86.1 ? |
Valutazione complessiva di Notebookcheck
MSI Vector 16 è un modello RTX 5070 (Ti) di grande successo, anche se è un po' deluso dalla mancanza di controllo della ventola.
MSI Vector 16 HX AI A2XWHG
- 06/20/2025 v8
Florian Glaser
 Total Sustainability Score:
 Comparable models for reference
Immagine | Modello | Prezzo | Peso | Altezza | Schermo |
|---|---|---|---|---|---|
1. 84%  | MSI Vector 16 HX AI A2XWHG Intel Core Ultra 7 255HX ⎘ Nvidia GeForce RTX 5070 Ti Laptop ⎘ 16 GB Memoria, 512 GB SSD | Amazon: 1. $1,979.00 HIDevolution [2025] MSI Vect... 2. $2,089.00 HIDevolution [2025] MSI Vect... 3. $2,849.00 HIDevolution [2025] MSI Vect... Prezzo di listino: 2000 EUR | 2.6 kg | 28.6 mm | 16.00" 2560x1600 189 PPI IPS |
2. 88% v7 (old)  | MSI Vector 16 HX A14V Intel Core i9-14900HX ⎘ NVIDIA GeForce RTX 4080 Laptop GPU ⎘ 32 GB Memoria, 1024 GB SSD | Amazon: 1. $45.99 Smatree Hard EVA Protective ... 2. $59.99 Smatree 16 inch Laptop Sleev... 3. $55.99 Smatree MS112 Hard EVA Prote... Prezzo di listino: 2700 USD | 2.7 kg | 28.55 mm | 16.00" 2560x1600 189 PPI IPS |
3. 77.3%  | MSI Katana 17 HX B14WGK Intel Core i7-14650HX ⎘ Nvidia GeForce RTX 5070 Laptop ⎘ 16 GB Memoria, 1024 GB SSD | Amazon: 1. $49.99 230W 200W AC Adapter Replace... 2. $1,455.89 MSI MSI Sword 16 HX 16" Full... Prezzo di listino: 1800 EUR | 2.7 kg | 28 mm | 17.30" 2560x1440 170 PPI IPS |
4. 87.4%  | SCHENKER XMG Pro 16 (E25) Intel Core Ultra 9 275HX ⎘ Nvidia GeForce RTX 5070 Ti Laptop ⎘ 32 GB Memoria, 1024 GB SSD | Prezzo di listino: 2480€ | 2.5 kg | 26.5 mm | 16.00" 2560x1600 189 PPI IPS |
5. 85.7%  | Alienware 16 Area-51 Intel Core Ultra 9 275HX ⎘ Nvidia GeForce RTX 5080 Laptop ⎘ 32 GB Memoria | Amazon: $4,899.99 Prezzo di listino: 3500 USD | 3.3 kg | 28.5 mm | 16.00" 2560x1600 189 PPI IPS |
Transparency
La selezione dei dispositivi da recensire viene effettuata dalla nostra redazione. Il campione di prova è stato fornito all'autore come prestito dal produttore o dal rivenditore ai fini di questa recensione. L'istituto di credito non ha avuto alcuna influenza su questa recensione, né il produttore ne ha ricevuto una copia prima della pubblicazione. Non vi era alcun obbligo di pubblicare questa recensione. Non accettiamo mai compensi o pagamenti in cambio delle nostre recensioni. In quanto società mediatica indipendente, Notebookcheck non è soggetta all'autorità di produttori, rivenditori o editori.
Ecco come Notebookcheck esegue i test
Ogni anno, Notebookcheck esamina in modo indipendente centinaia di laptop e smartphone utilizzando procedure standardizzate per garantire che tutti i risultati siano comparabili. Da circa 20 anni sviluppiamo continuamente i nostri metodi di prova e nel frattempo stabiliamo gli standard di settore. Nei nostri laboratori di prova, tecnici ed editori esperti utilizzano apparecchiature di misurazione di alta qualità. Questi test comportano un processo di validazione in più fasi. Il nostro complesso sistema di valutazione si basa su centinaia di misurazioni e parametri di riferimento ben fondati, che mantengono l'obiettività.