
Verdetto - ThinkPad P16v Gen 3 è una buona workstation mobile
Nel test, il ThinkPad P16v Gen 3 è abbastanza convincente come workstation mobile e riceve una buona valutazione complessiva. Oltre alla lunga durata della batteria, ci sono buone prestazioni di sistema, molte connessioni e ottime opzioni di manutenzione. I tasti TouchPad e TrackPoint sono di qualità molto elevata, ma la tastiera è solo nella media e c'è sicuramente un margine di miglioramento (soprattutto rispetto al ThinkPad P1 16 Gen 8).
La classificazione come workstation relativamente economica si nota soprattutto nell'involucro, in quanto qui viene utilizzata solo plastica e ci sono anche punti critici in termini di stabilità (soprattutto l'area centrale della tastiera) e le cerniere (dondolamenti evidenti). Per i display (compresi gli OLED) sono disponibili solo pannelli a 60 Hz, mentre il modello IPS standard fa un lavoro ragionevole con una luminosità di oltre 500 cd/m², colori accurati e copertura sRGB completa.
Avremmo preferito un po' più di prestazioni, soprattutto dalla scheda grafica. La Nvidia RTX PRO 2000 (Blackwell, paragonabile a GeForce RTX 5060) funziona solo con un massimo di 60 watt ed è quindi ben lontana dal massimo di 115 watt (che fornirebbe circa il 30% di prestazioni in più). In considerazione del grande case da 16 pollici, questo è relativamente debole.
Pro
Contro
Prezzo e disponibilità
Il dispositivo di prova è disponibile presso il nostro sito di prestito Campuspoint per 2.825 Euro (~$3277) (o 2.529 Euro/~$2933 nel programma Campus) e il P16v G3 può essere configurato presso Lenovo a partire da 2.469 Euro (~$2864).
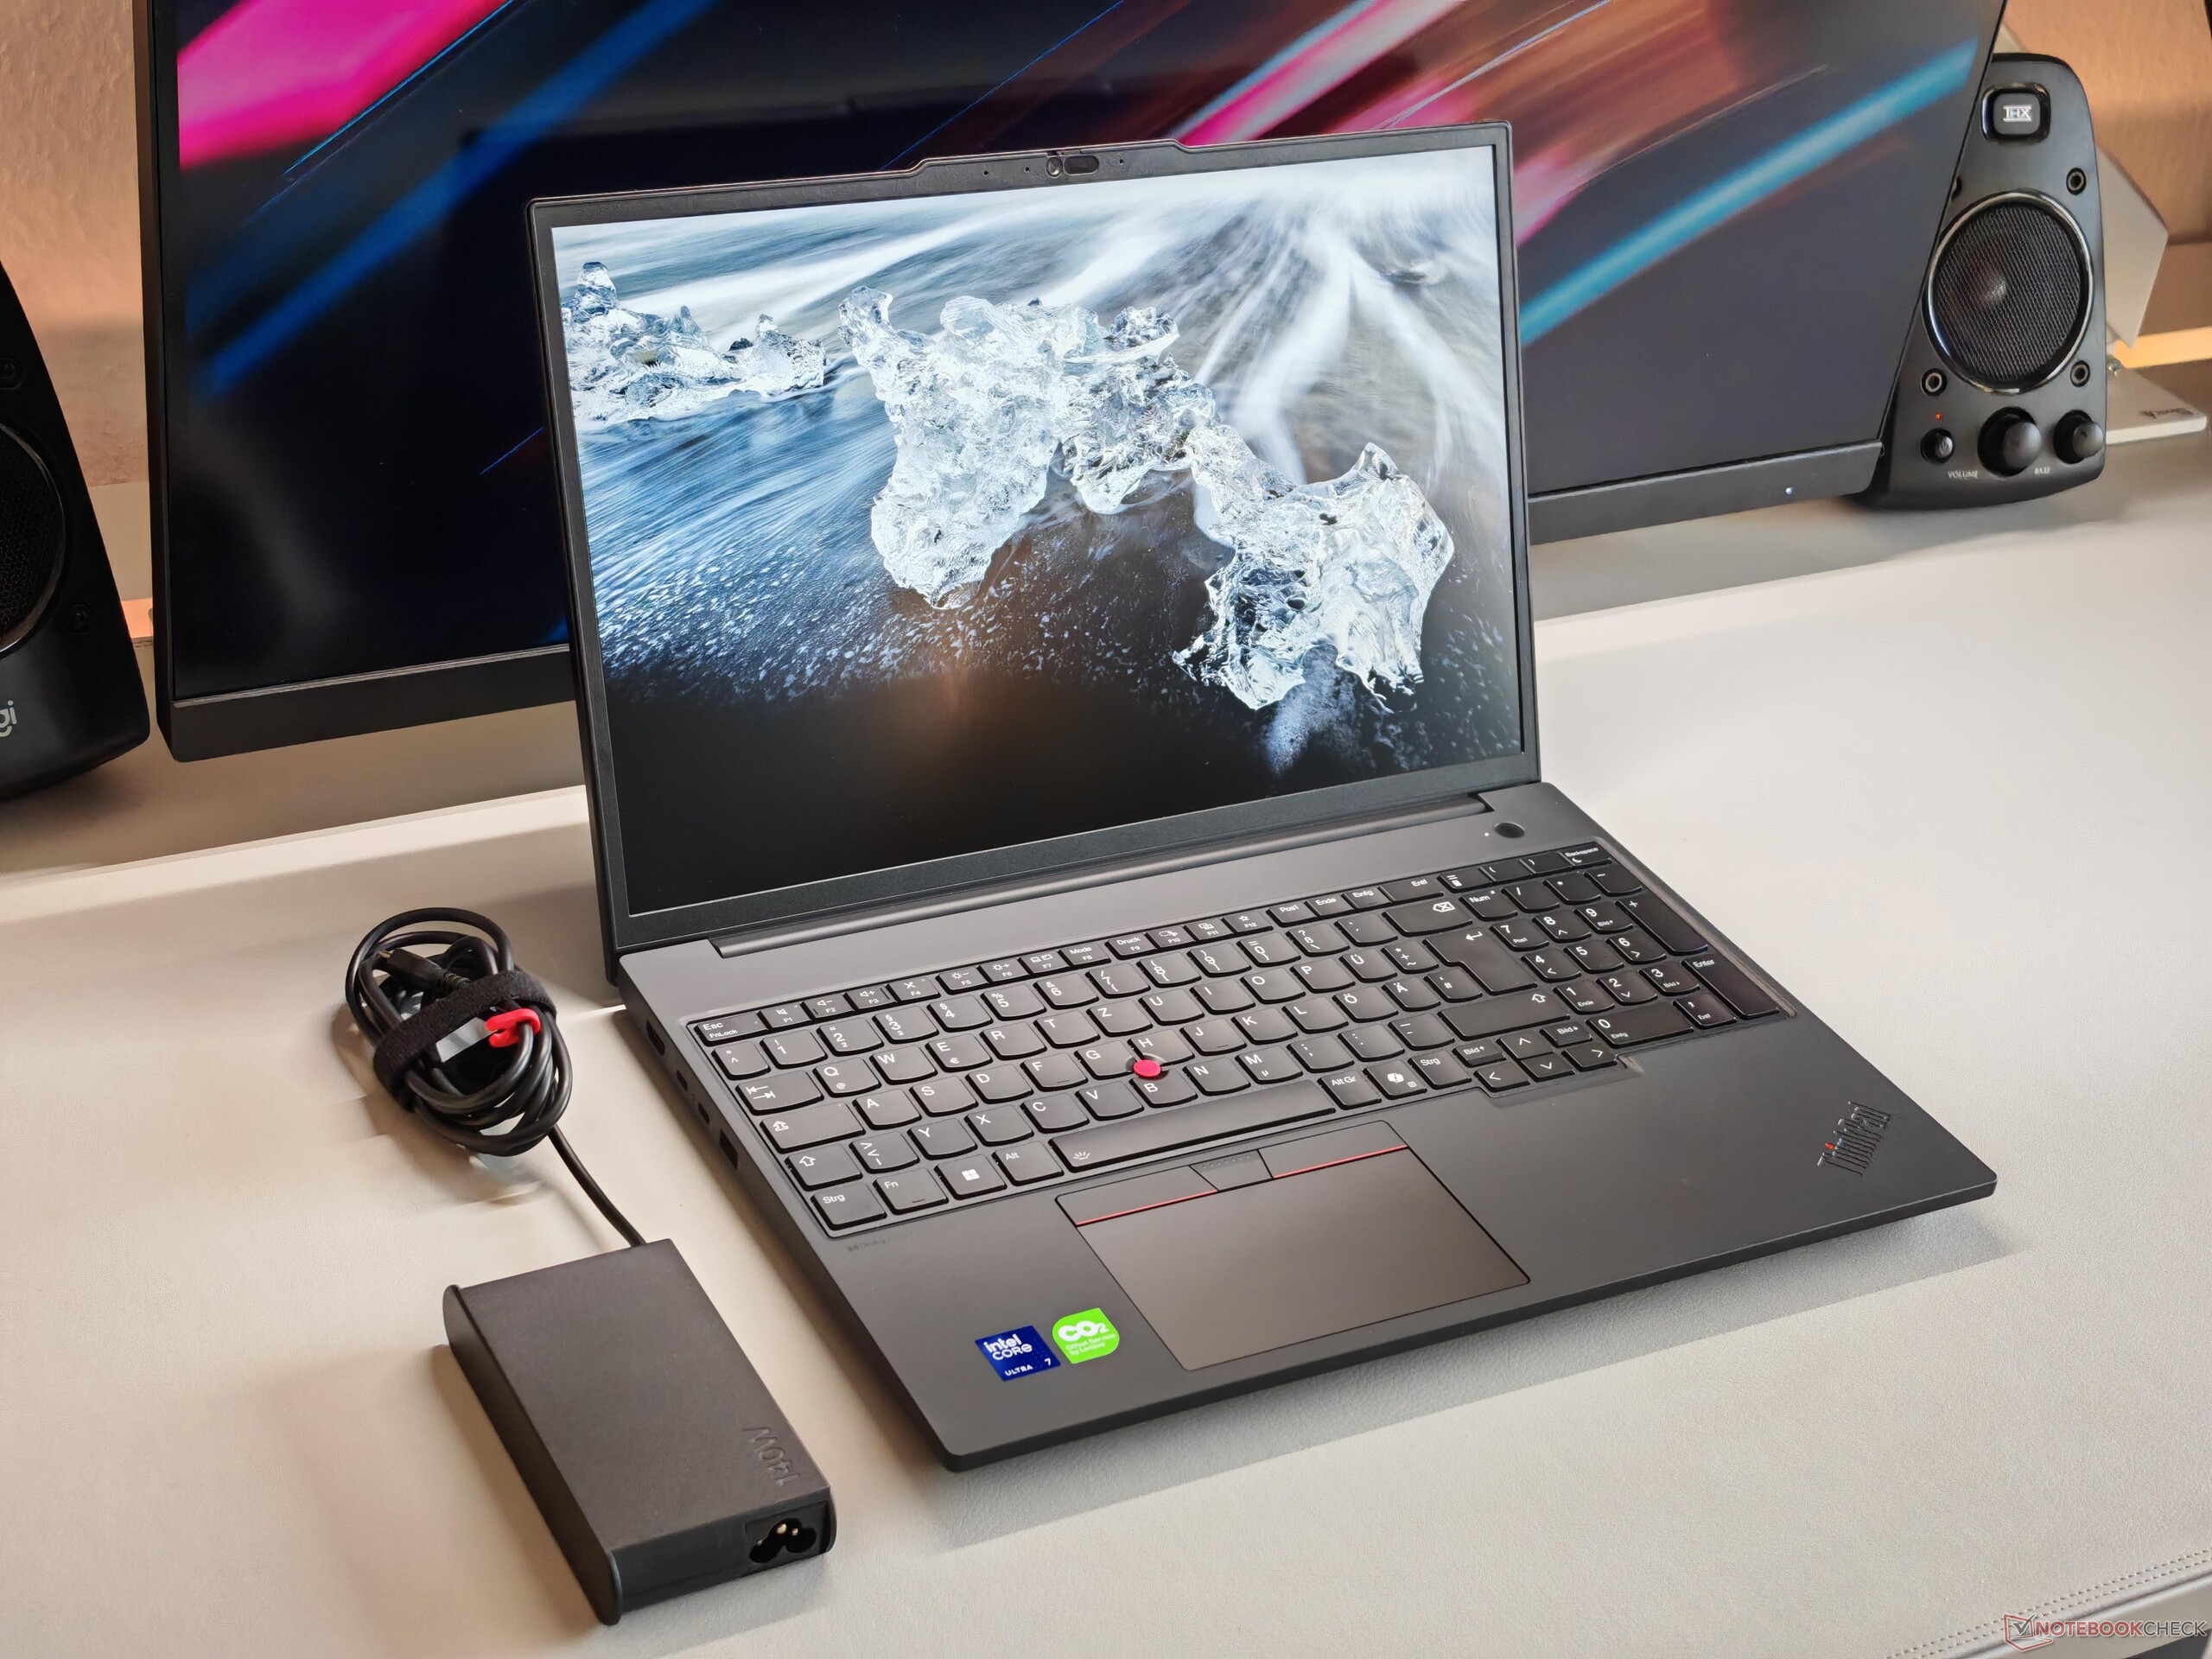
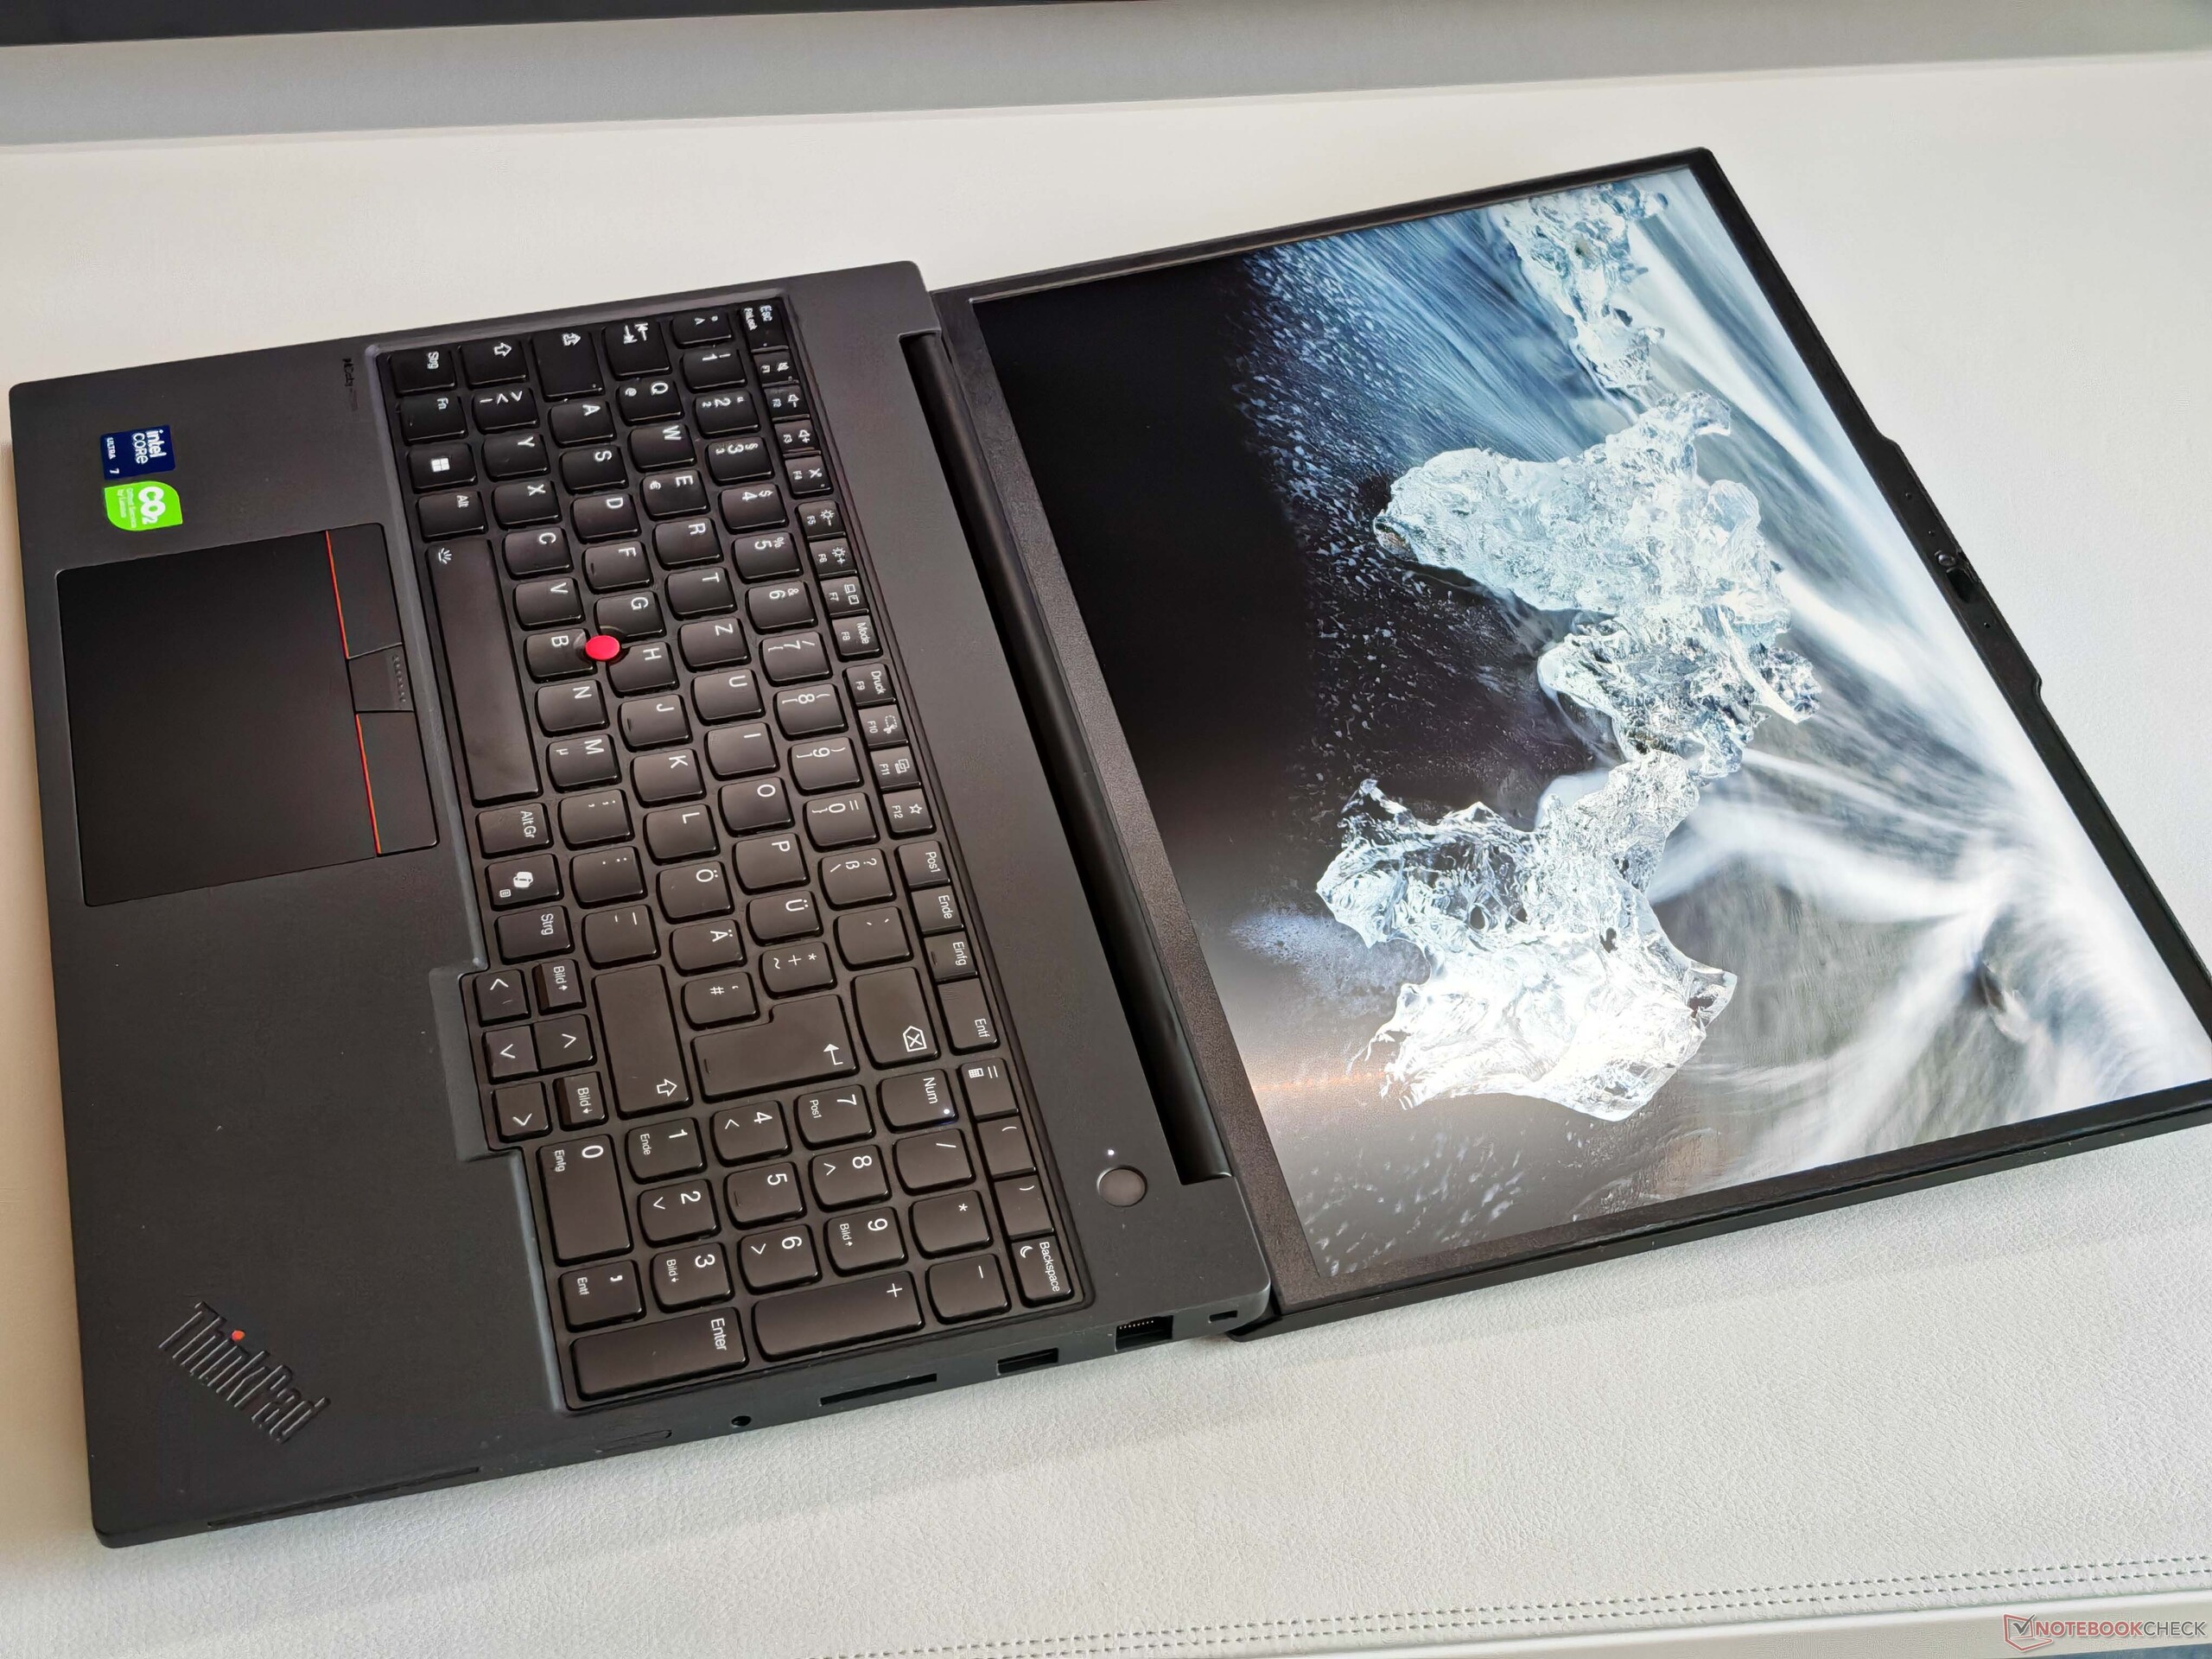
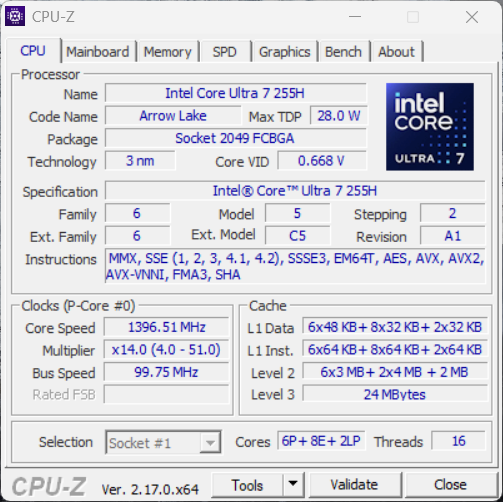
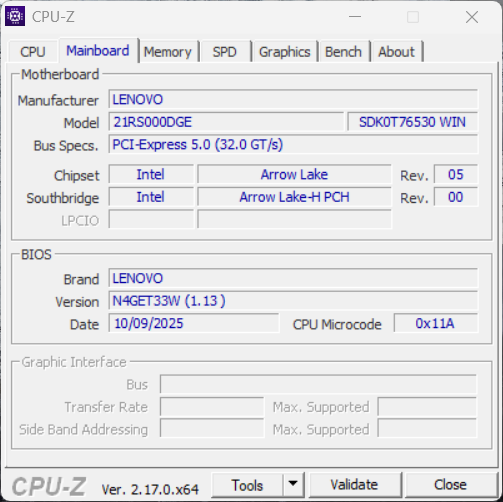
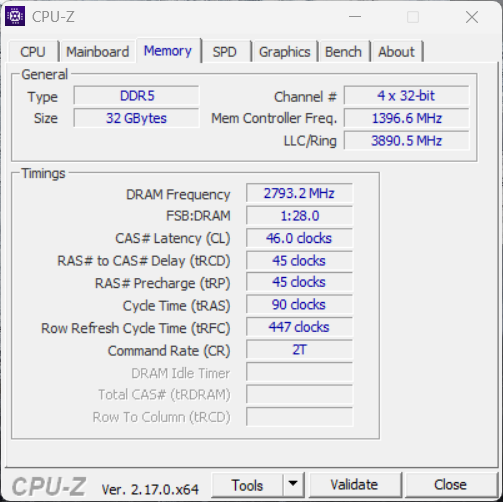
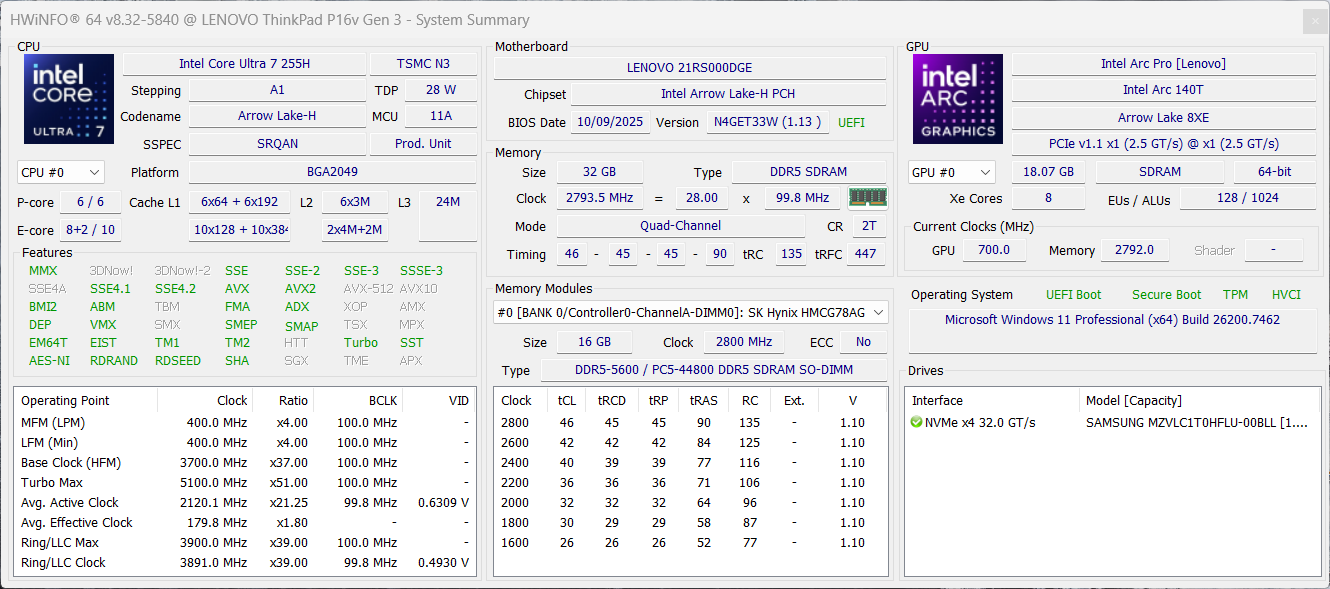
Il ThinkPad P16v Gen3 è l'attuale modello entry-level di Lenovo per quanto riguarda le workstation mobili complete. Abbiamo testato il modello 21RS000DGE con il Core Ultra 7 255H32 GB di RAM, la Nvidia RTX PRO 2000, un SSD da 1 TB e lo schermo Full HD con una luminosità di 500 cd/m² per 2.825 euro (~$3277).
Specifiche
Valigetta e attrezzatura
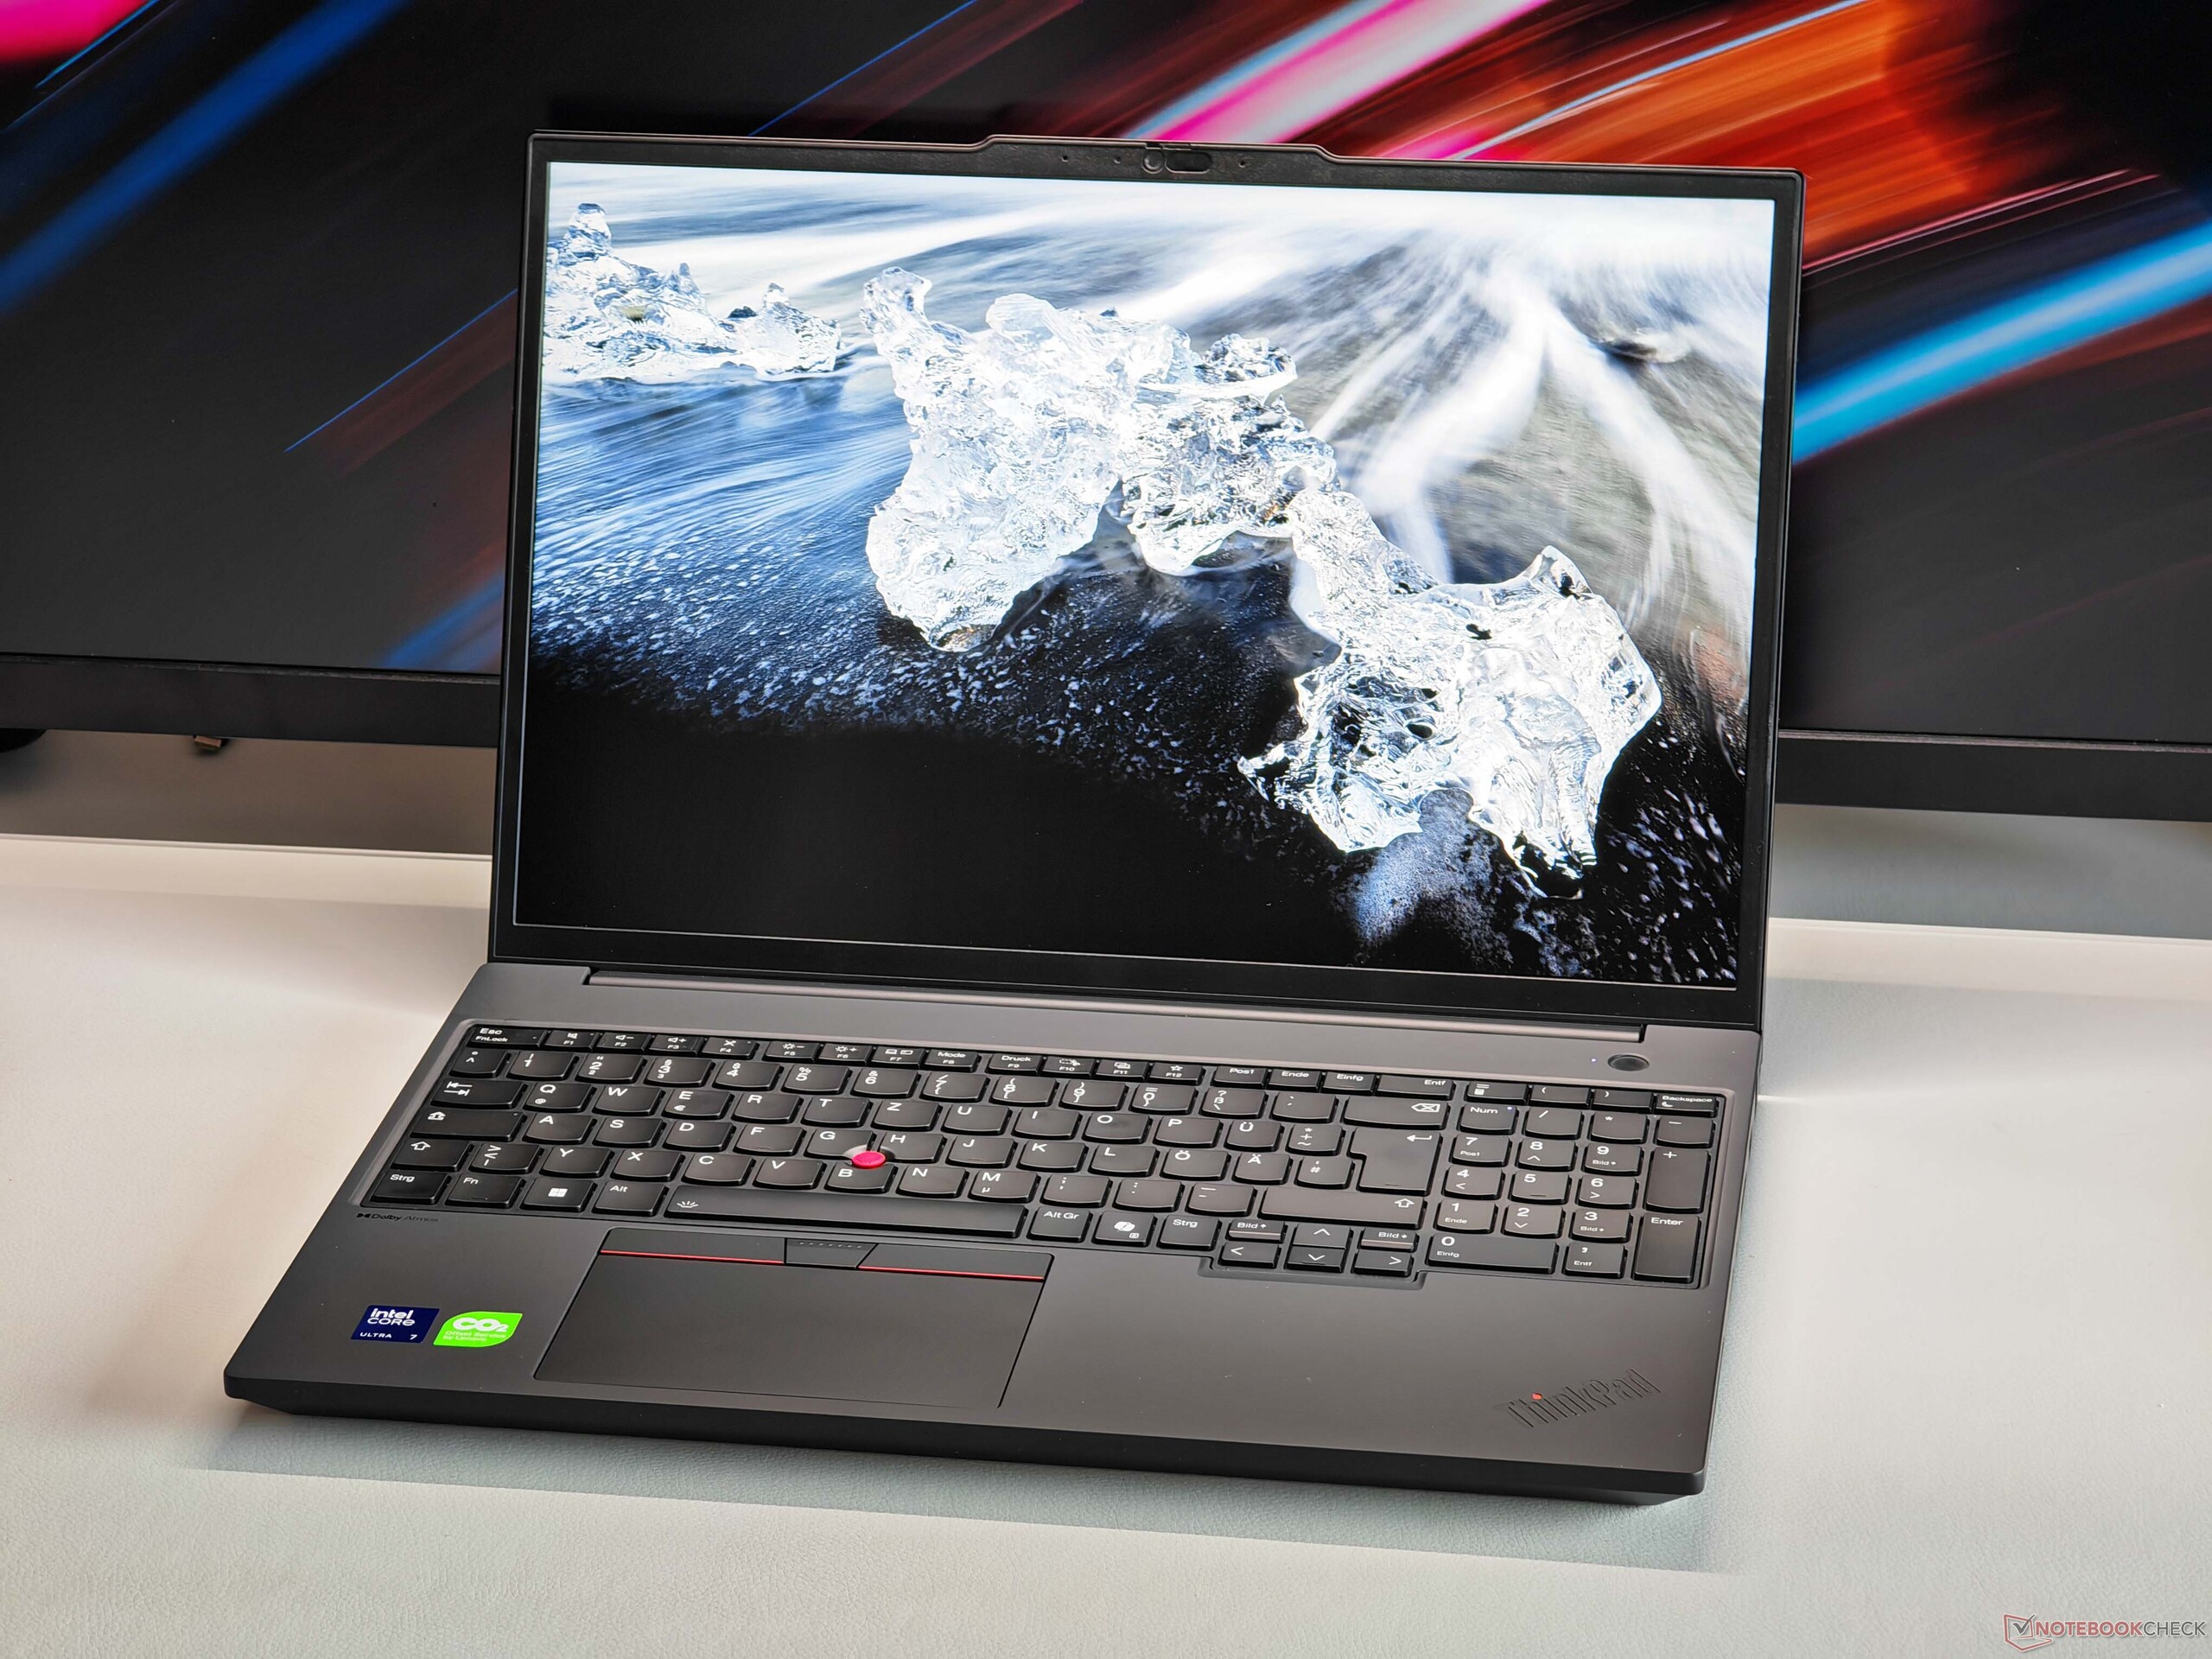
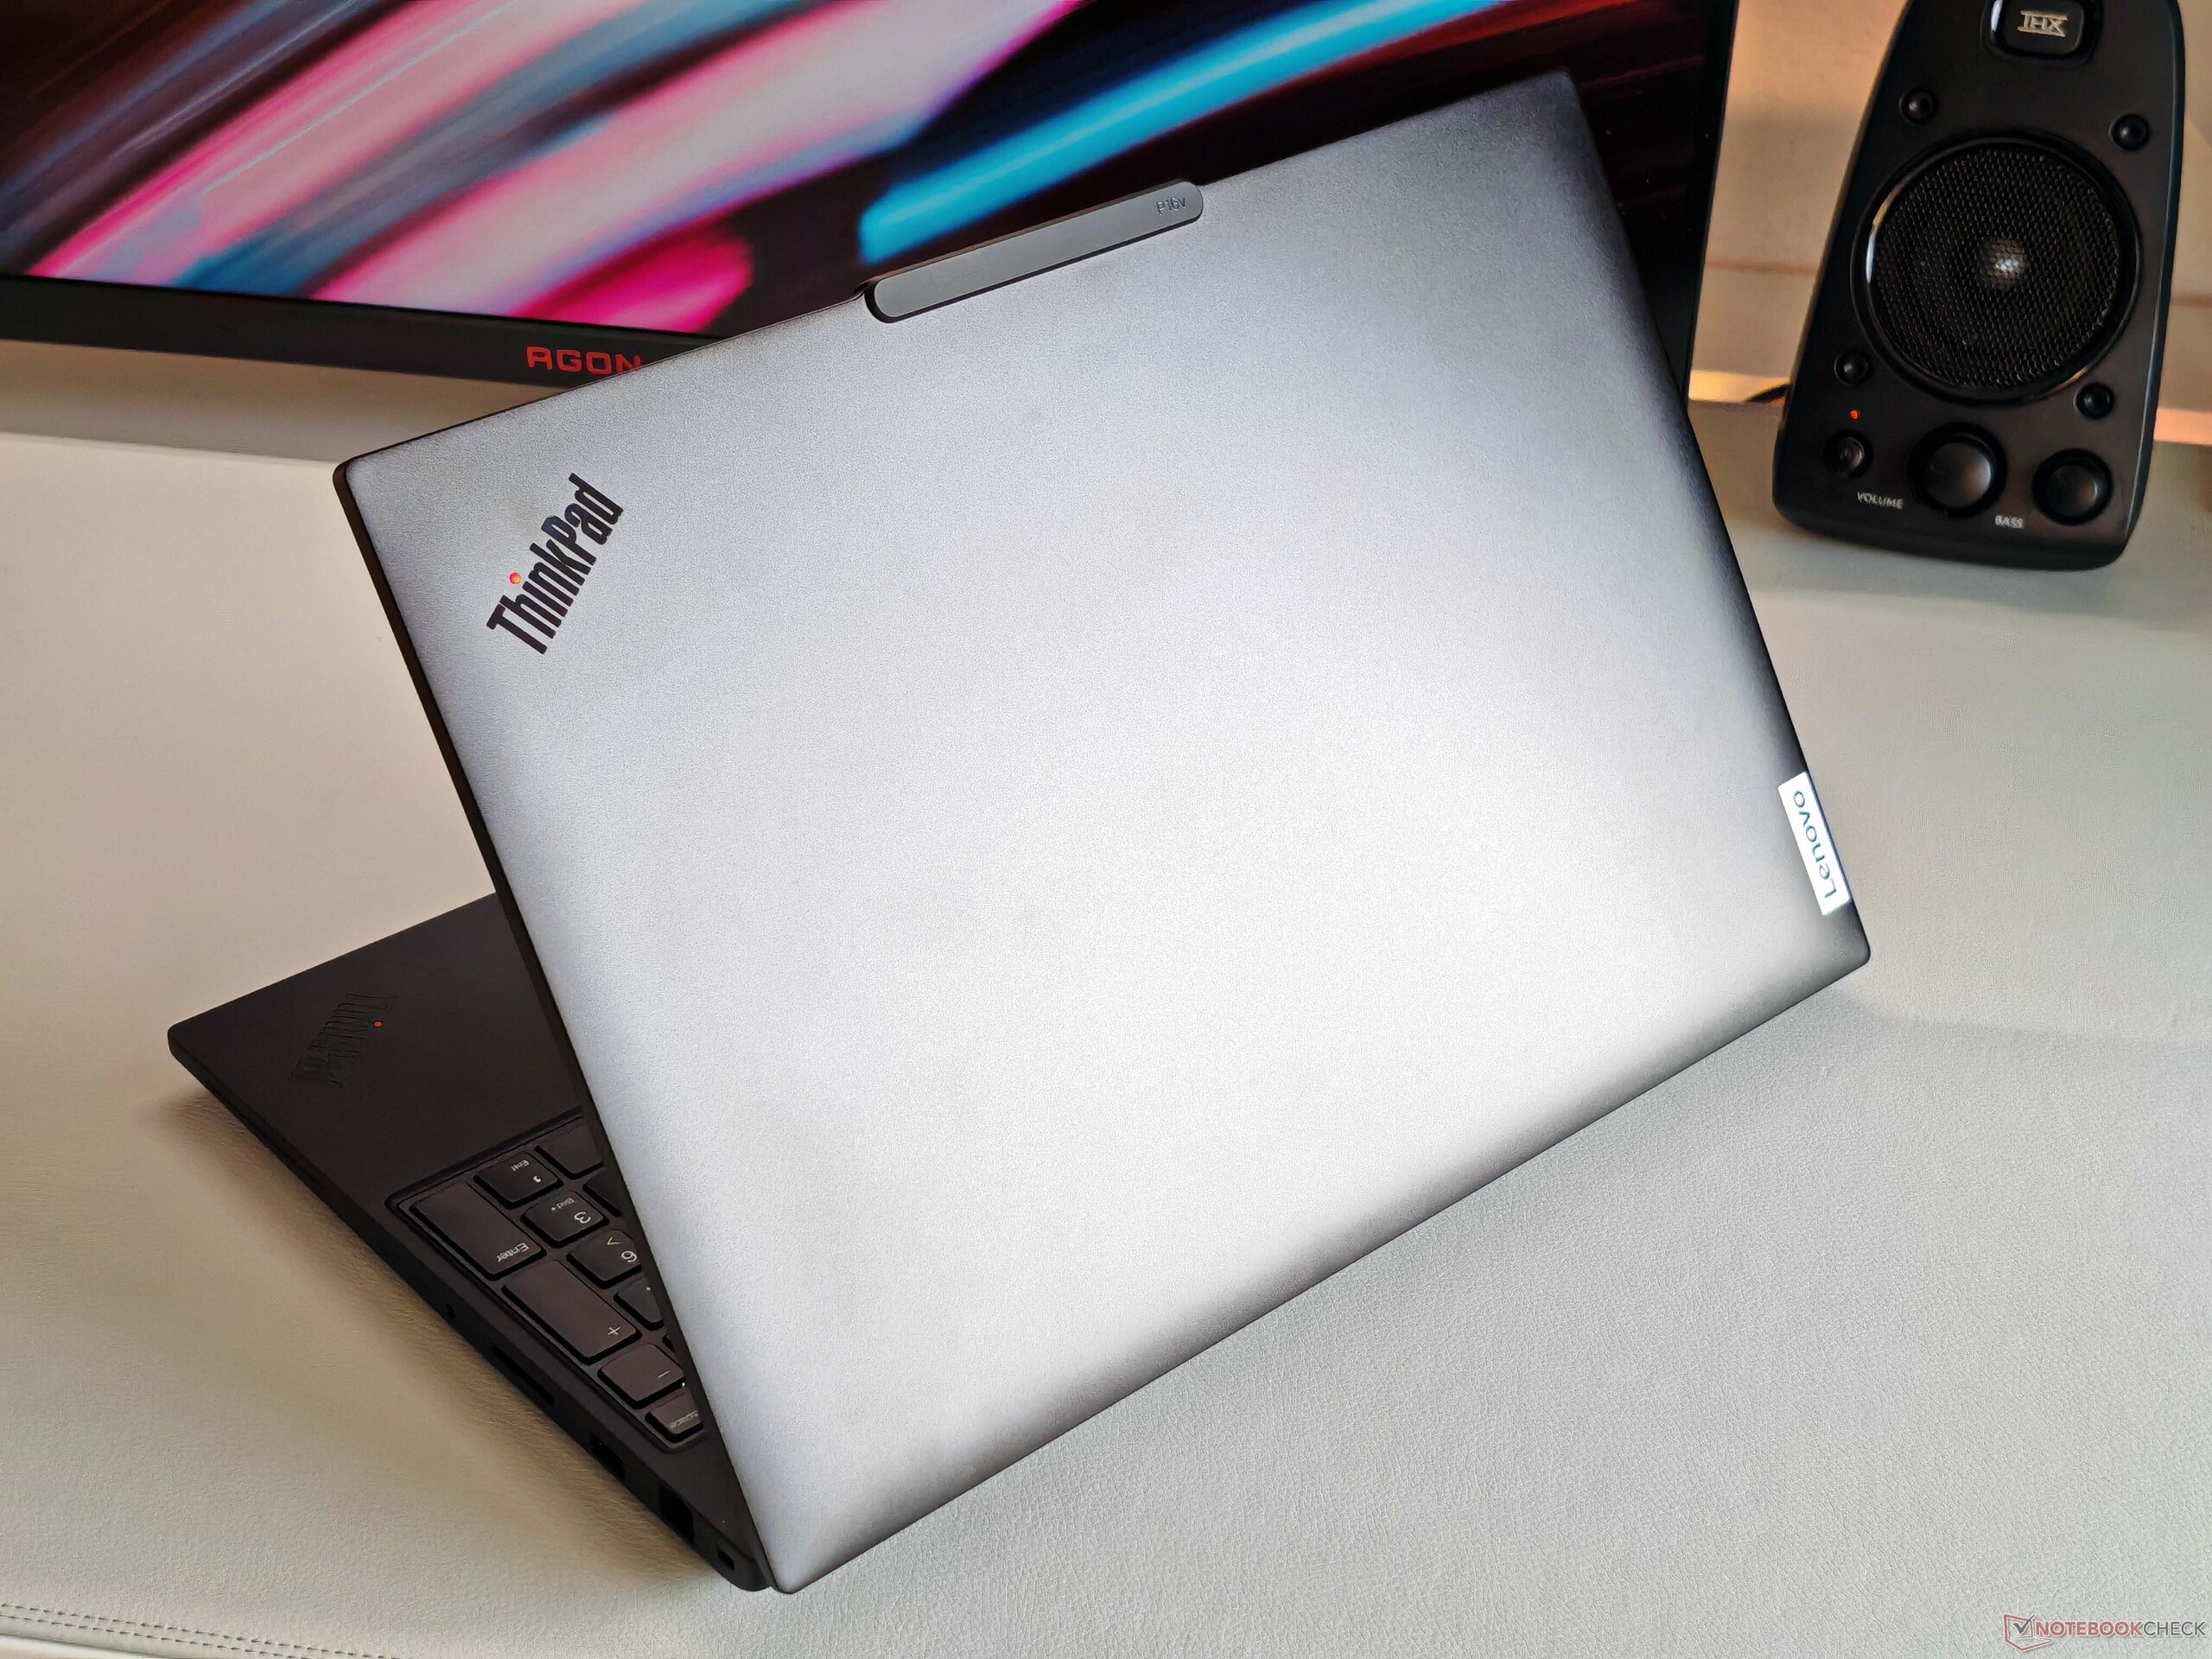
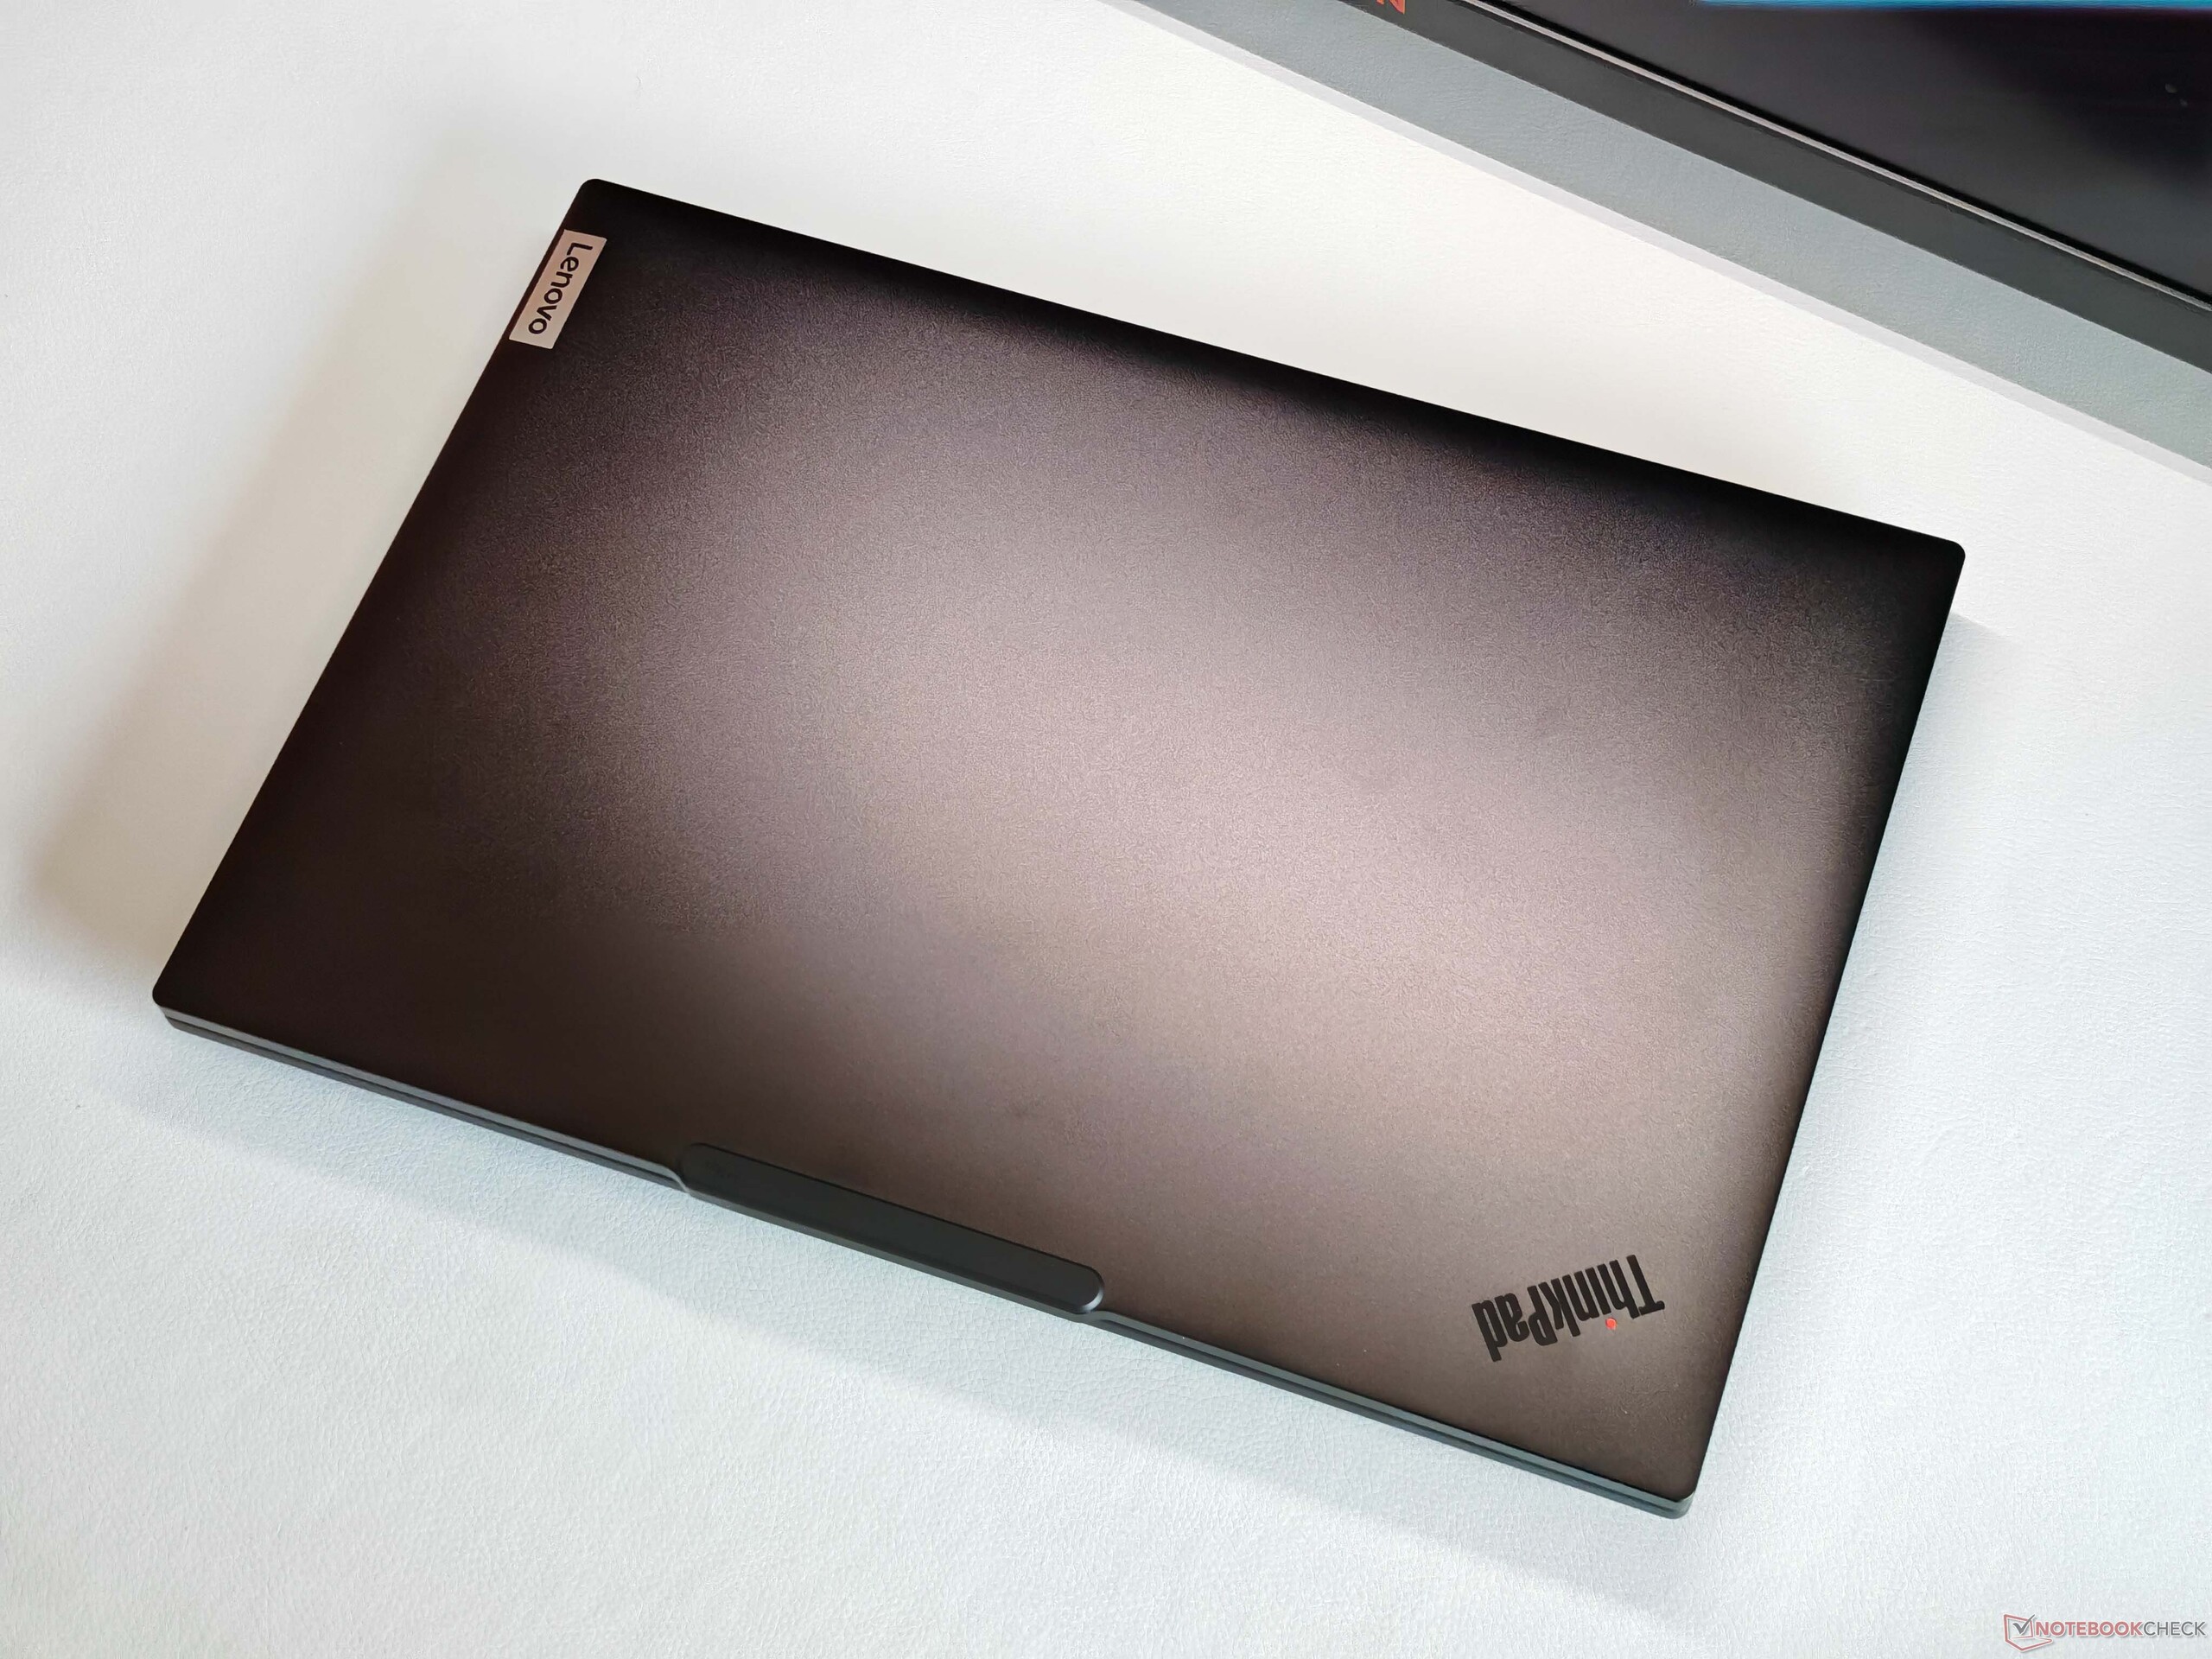
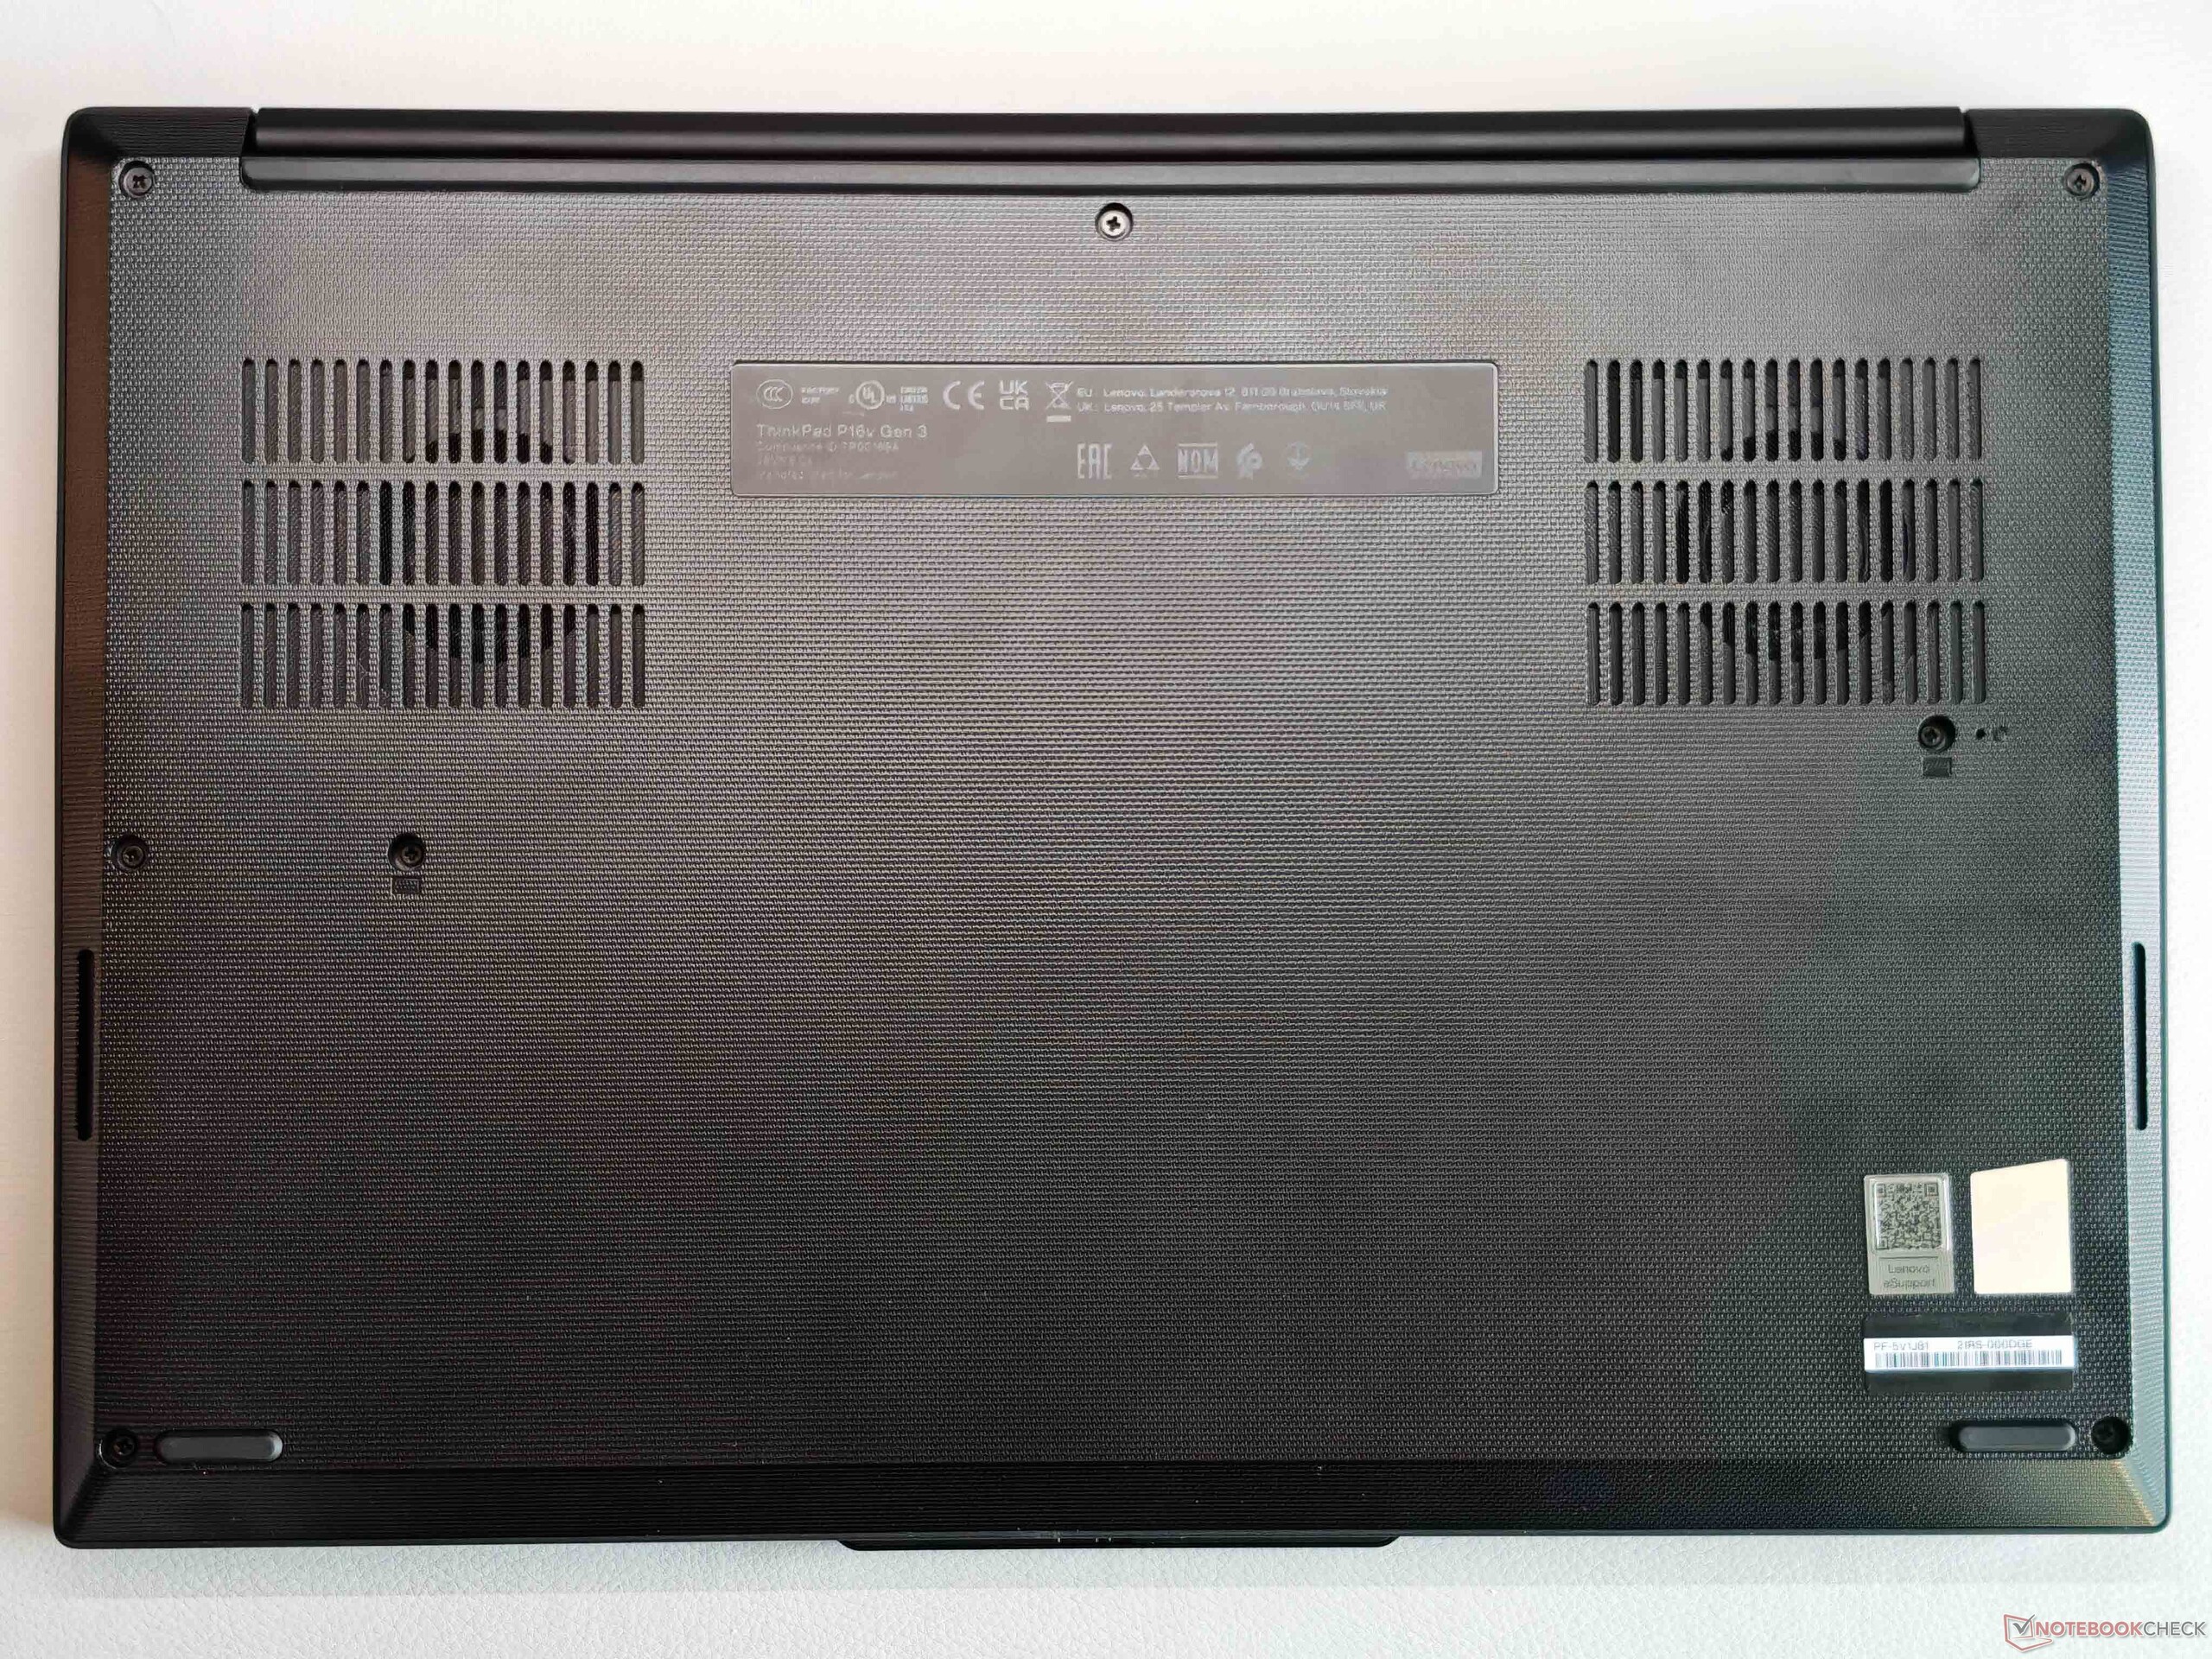
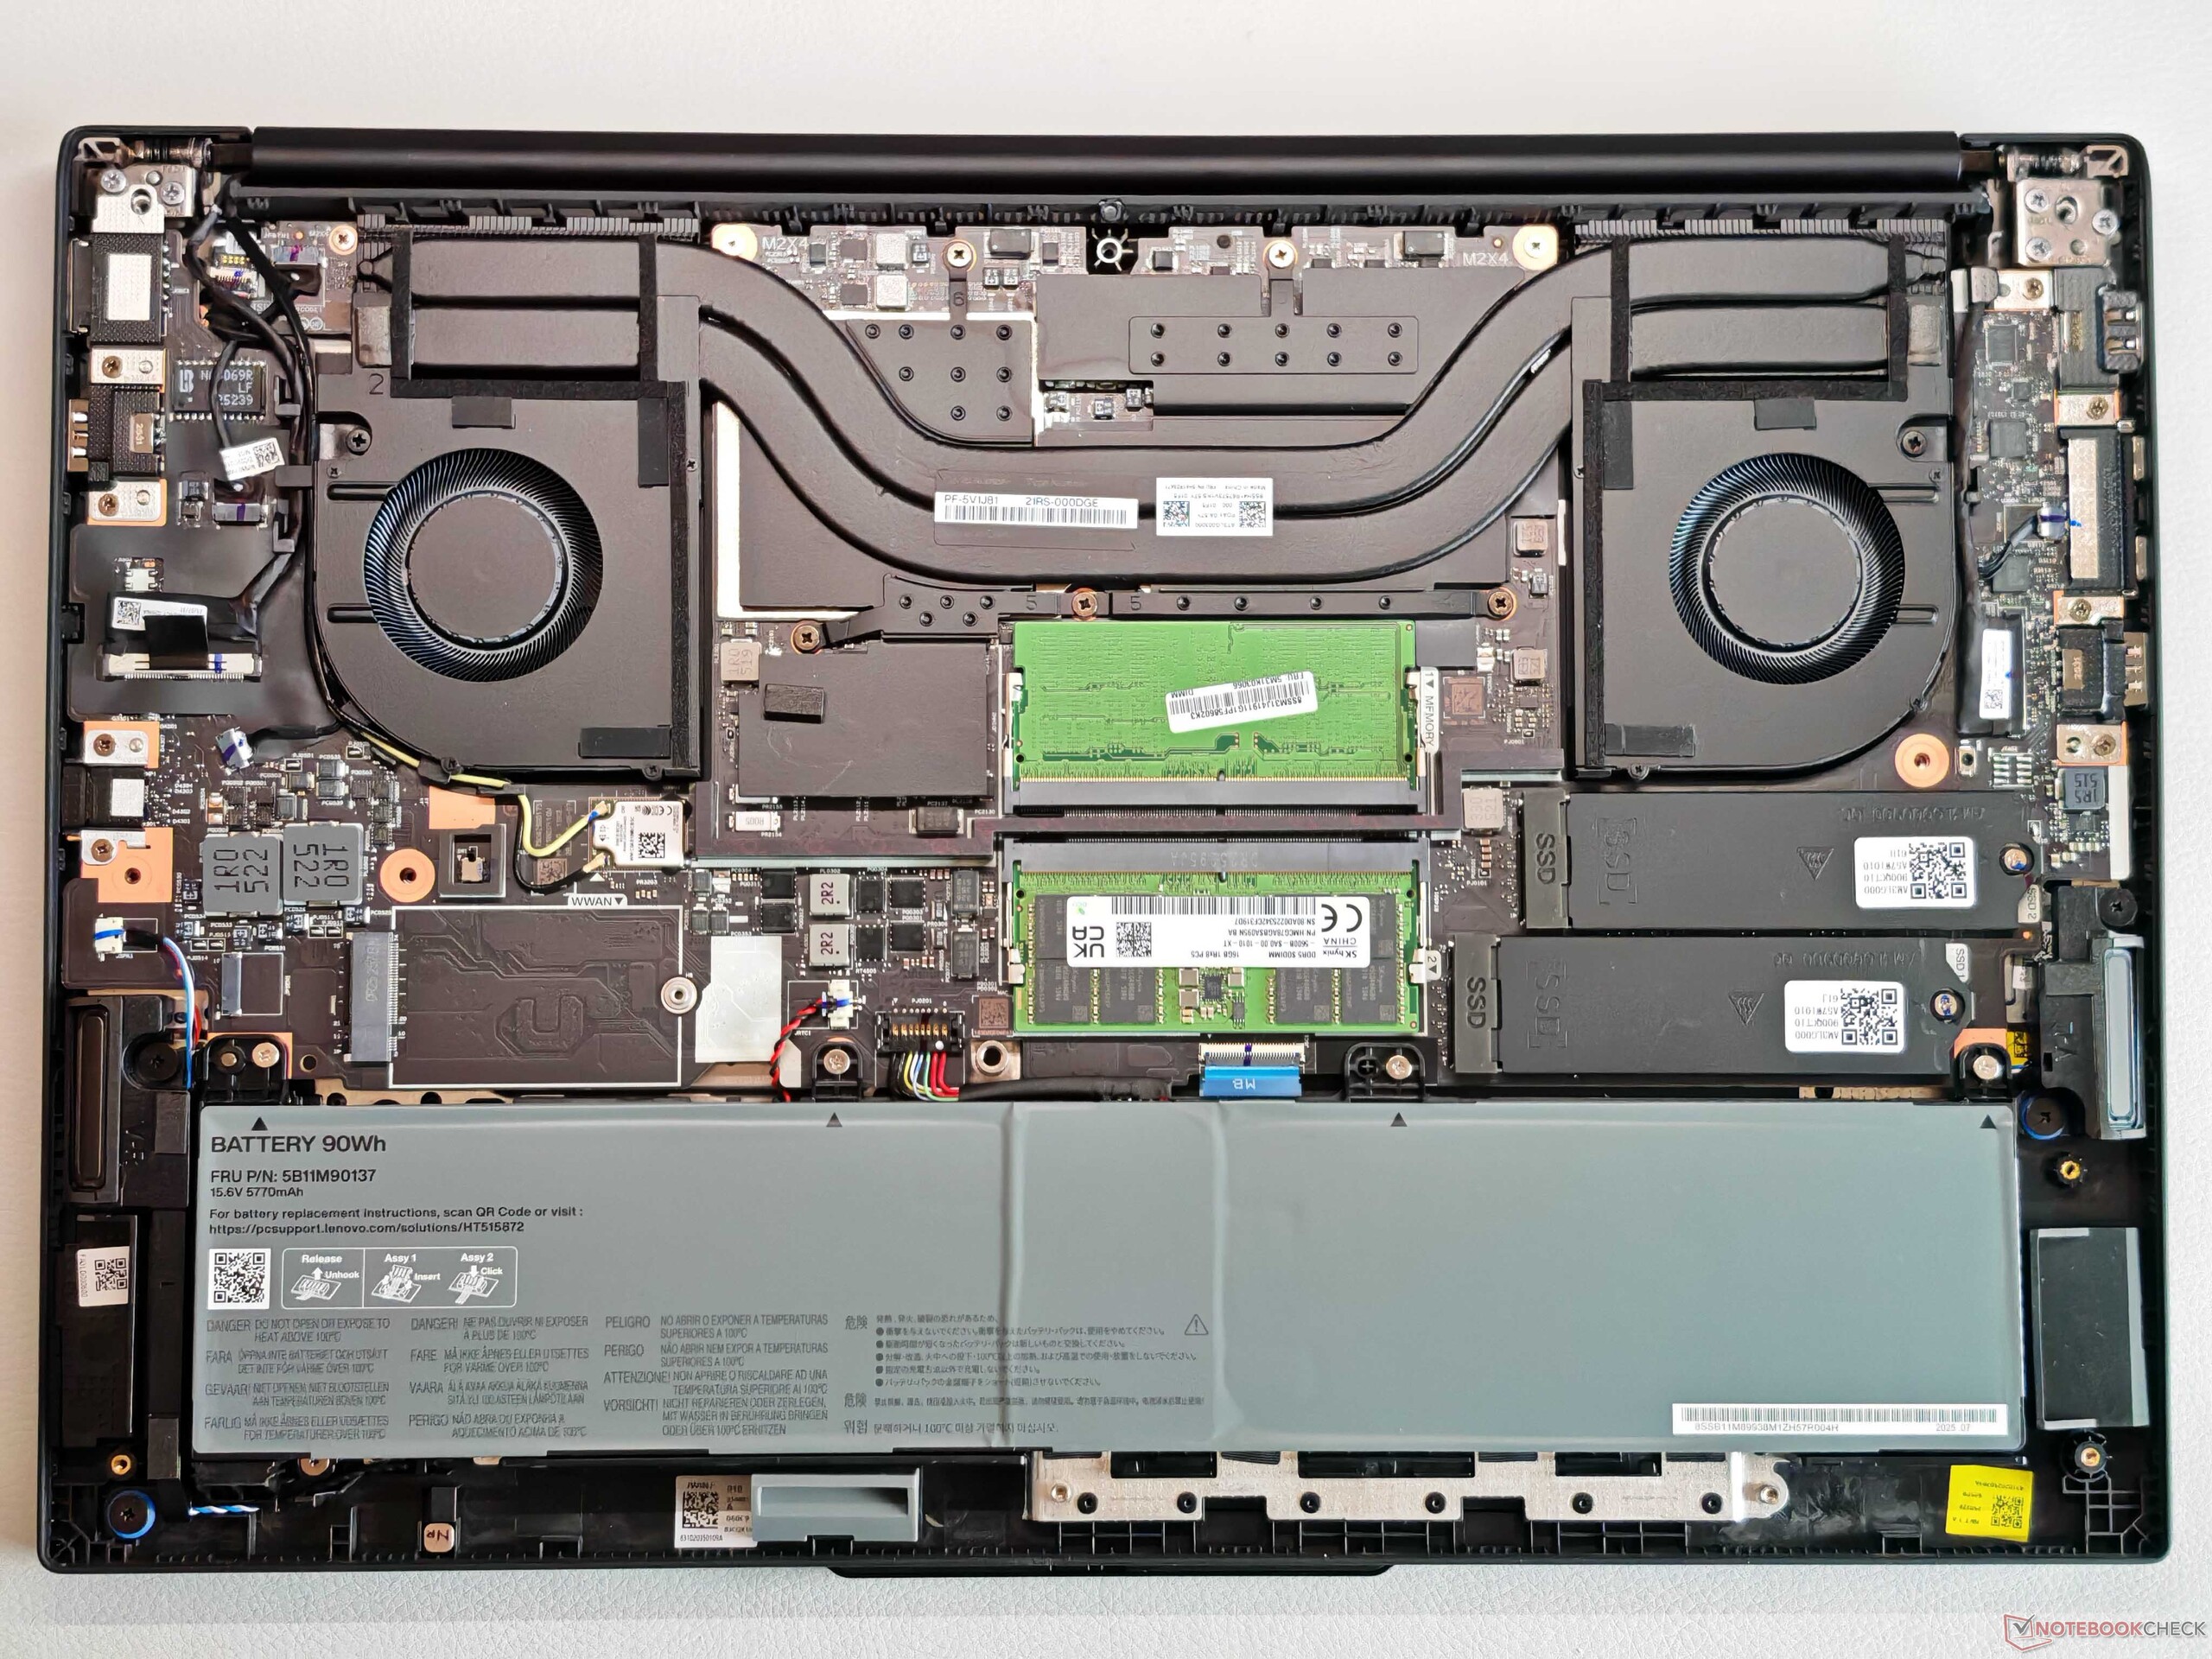
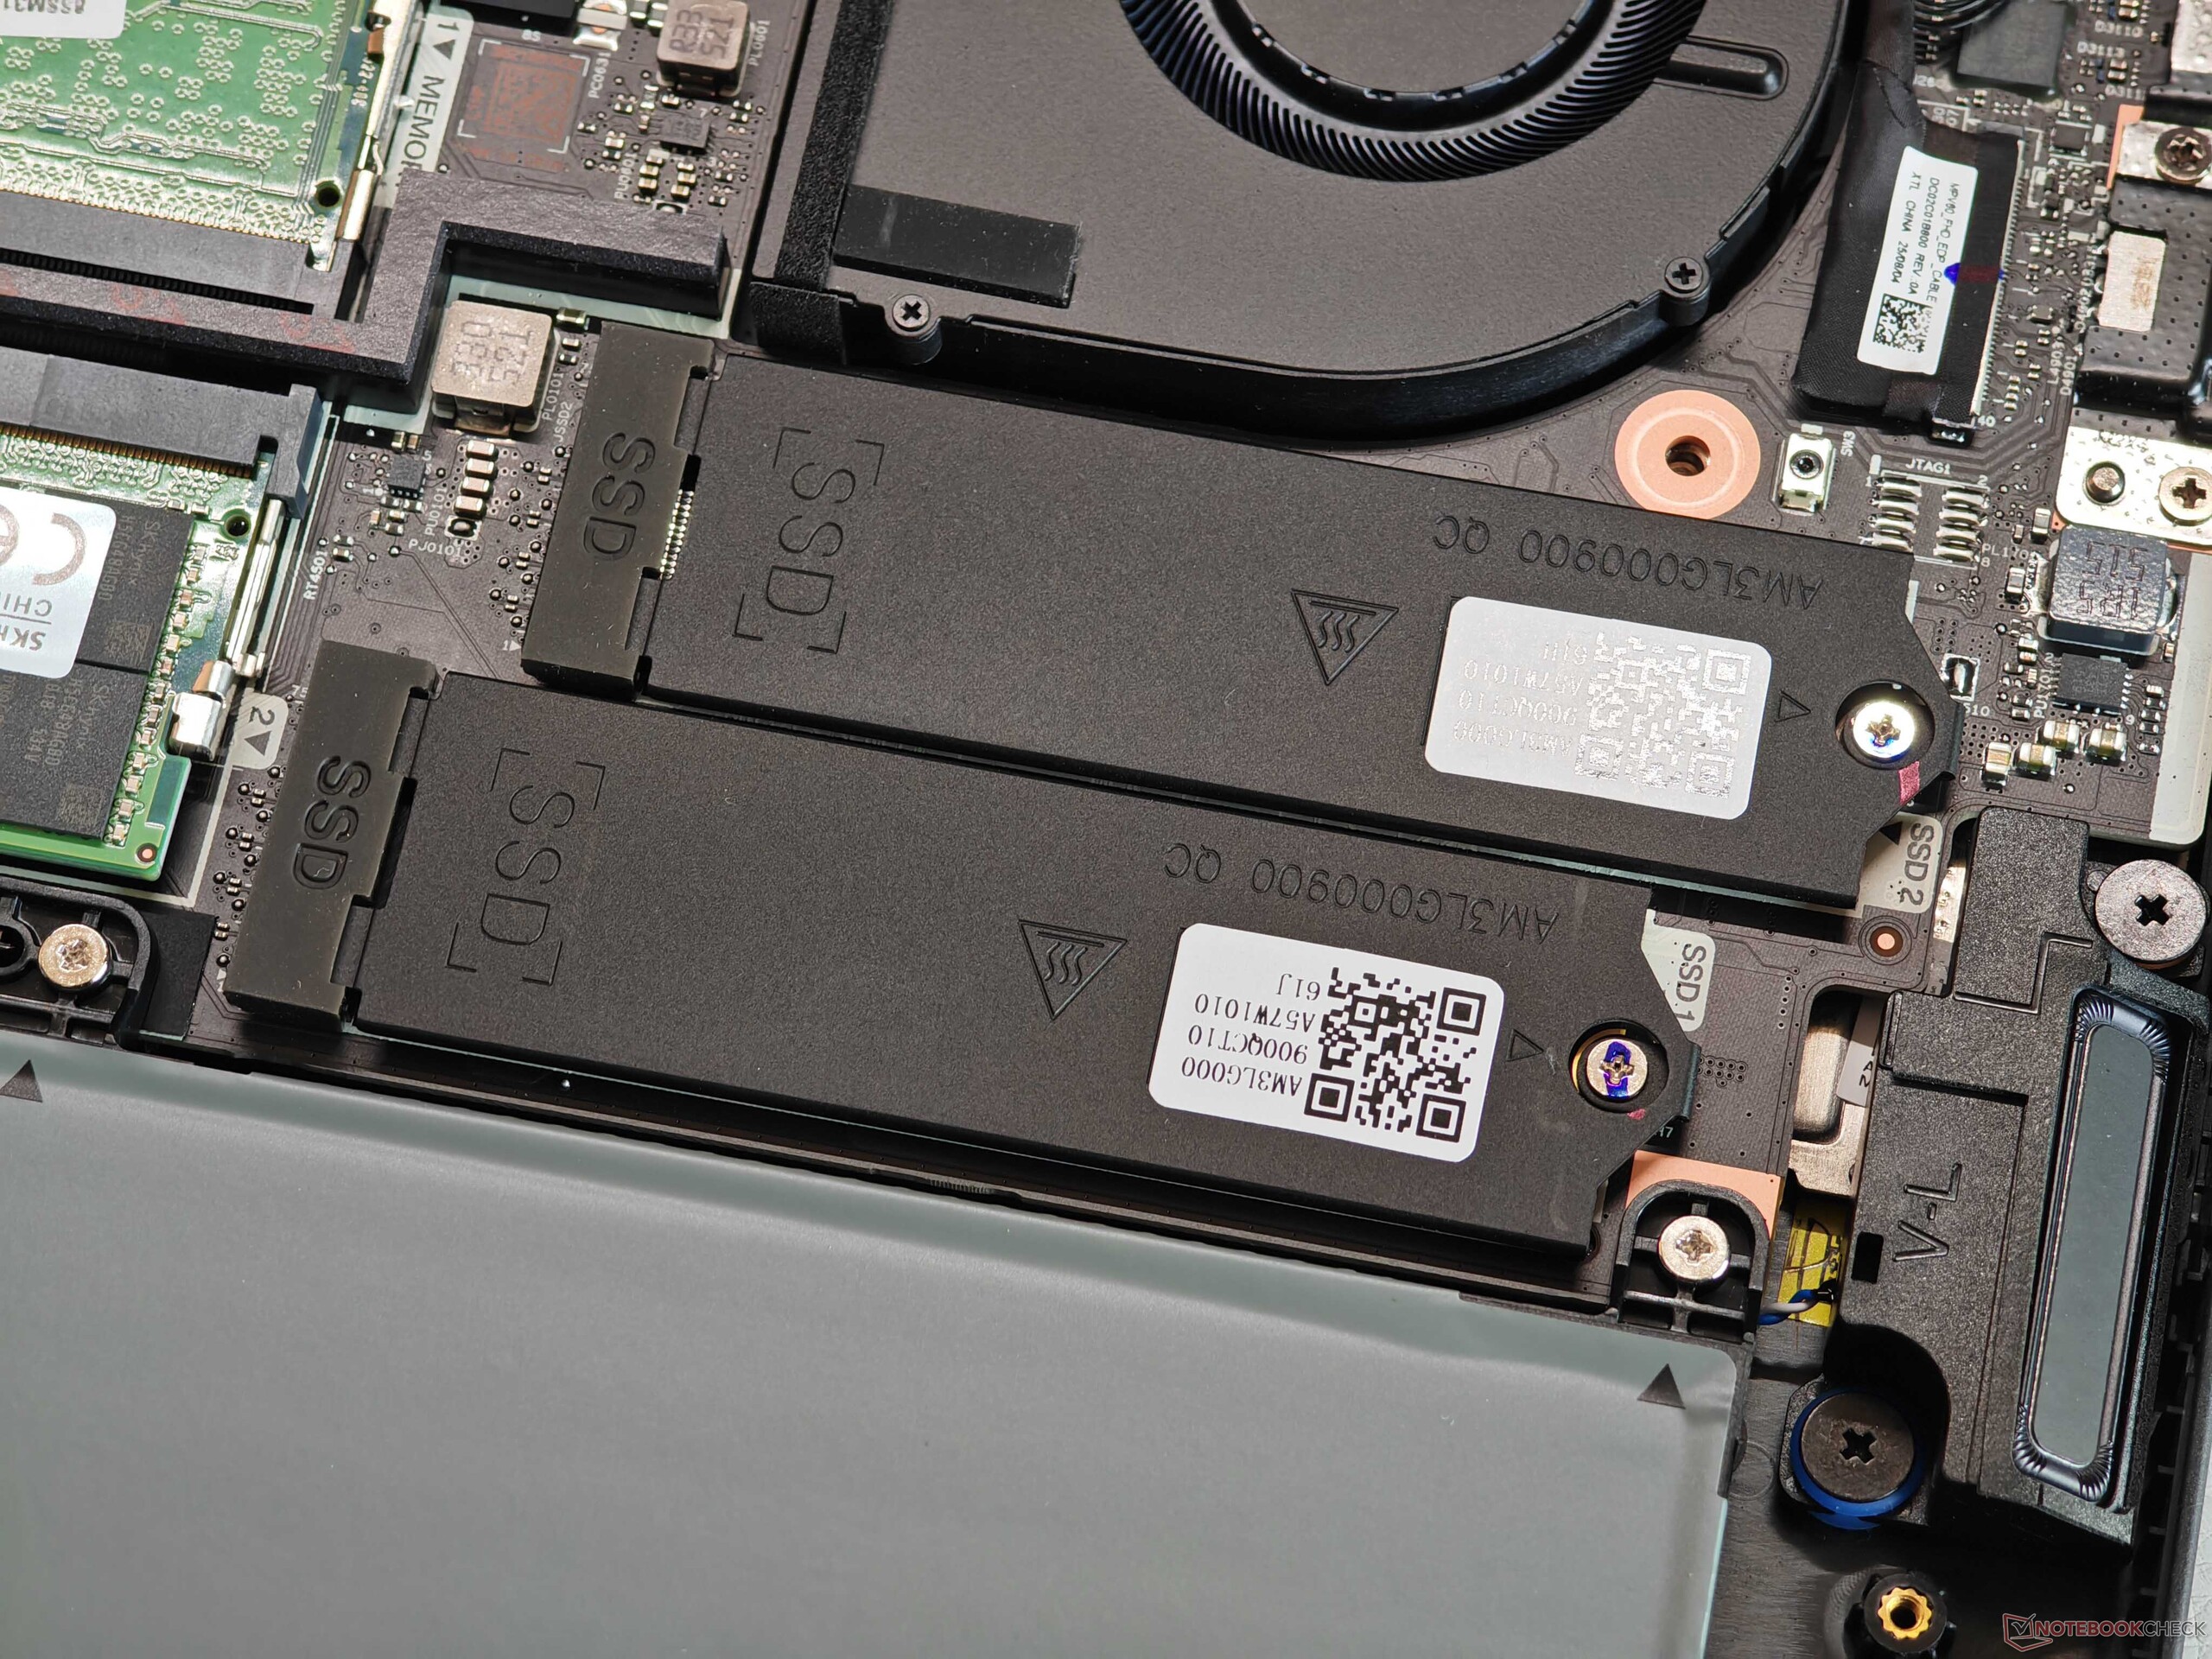
Nonostante il prezzo elevato, la classificazione come workstation entry-level è evidente nell'involucro, in quanto viene utilizzata solo plastica. Il design è tipico degli attuali ThinkPad, compresa l'antiestetica gobba della fotocamera. La lavorazione è sostanzialmente buona, ma la stabilità è deludente, soprattutto se si considera l'unità base piuttosto spessa. L'area centrale della tastiera, in particolare, può essere visibilmente ammaccata, ma non siamo riusciti a provocare alcun rumore di scricchiolio. Il coperchio del display si comporta meglio, ma le cerniere rimbalzano un po' (angolo di apertura massimo 180 gradi). Il coperchio liscio, in particolare, è molto sensibile alle impronte digitali ed è anche difficile da pulire. Le opzioni di manutenzione sono complessivamente molto buone (2x RAM, 2x SSD).
Non c'è molto di cui lamentarsi in termini di connessioni, ma una delle due porte Thunderbolt 4 è sempre occupata dall'alimentatore. Il modulo Wi-Fi 7 raggiunge velocità di trasferimento buone e stabili, ed è disponibile anche una porta Ethernet. C'è spazio anche per un modulo WWAN, ma le antenne non sono preindirizzate (non sono predisposte per WWAN). Il lettore di schede raggiunge velocità di trasferimento medie e la webcam da 5 MP (con otturatore + IR) scatta foto utilizzabili.


| SD Card Reader | |
| average JPG Copy Test (av. of 3 runs) | |
| HP ZBook X G1i 16 (Toshiba Exceria Pro SDXC 64 GB UHS-II) | |
| HP ZBook Power 16 G11 A (Toshiba Exceria Pro SDXC 64 GB UHS-II) | |
| Media della classe Workstation (49.6 - 681, n=14, ultimi 2 anni) | |
| Lenovo ThinkPad P1 Gen 8 (Toshiba Exceria Pro SDXC 64 GB UHS-II) | |
| Lenovo ThinkPad P16v G3 21RS000DGE (Angelbird AV Pro V60) | |
| maximum AS SSD Seq Read Test (1GB) | |
| HP ZBook Power 16 G11 A (Toshiba Exceria Pro SDXC 64 GB UHS-II) | |
| HP ZBook X G1i 16 (Toshiba Exceria Pro SDXC 64 GB UHS-II) | |
| Media della classe Workstation (87.6 - 1455, n=14, ultimi 2 anni) | |
| Lenovo ThinkPad P16v G3 21RS000DGE (Angelbird AV Pro V60) | |
| Lenovo ThinkPad P1 Gen 8 (Toshiba Exceria Pro SDXC 64 GB UHS-II) | |
| Networking | |
| Lenovo ThinkPad P16v G3 21RS000DGE | |
| iperf3 transmit AXE11000 | |
| iperf3 receive AXE11000 | |
| Lenovo ThinkPad P1 Gen 8 | |
| iperf3 transmit AXE11000 | |
| iperf3 receive AXE11000 | |
| iperf3 transmit AXE11000 6GHz | |
| iperf3 receive AXE11000 6GHz | |
| HP ZBook X G1i 16 | |
| iperf3 transmit AXE11000 | |
| iperf3 receive AXE11000 | |
| iperf3 transmit AXE11000 6GHz | |
| iperf3 receive AXE11000 6GHz | |
| HP ZBook Power 16 G11 A | |
| iperf3 transmit AXE11000 | |
| iperf3 receive AXE11000 | |
| iperf3 transmit AXE11000 6GHz | |
| iperf3 receive AXE11000 6GHz | |
| Lenovo ThinkPad P16s Gen 4 21RX000YGE | |
| iperf3 transmit AXE11000 | |
| iperf3 receive AXE11000 | |
| iperf3 transmit AXE11000 6GHz | |
| iperf3 receive AXE11000 6GHz | |


Sostenibilità
Lenovo fornisce ampie informazioni sul bilanciodi CO2 e sull'uso di materiali riciclati.


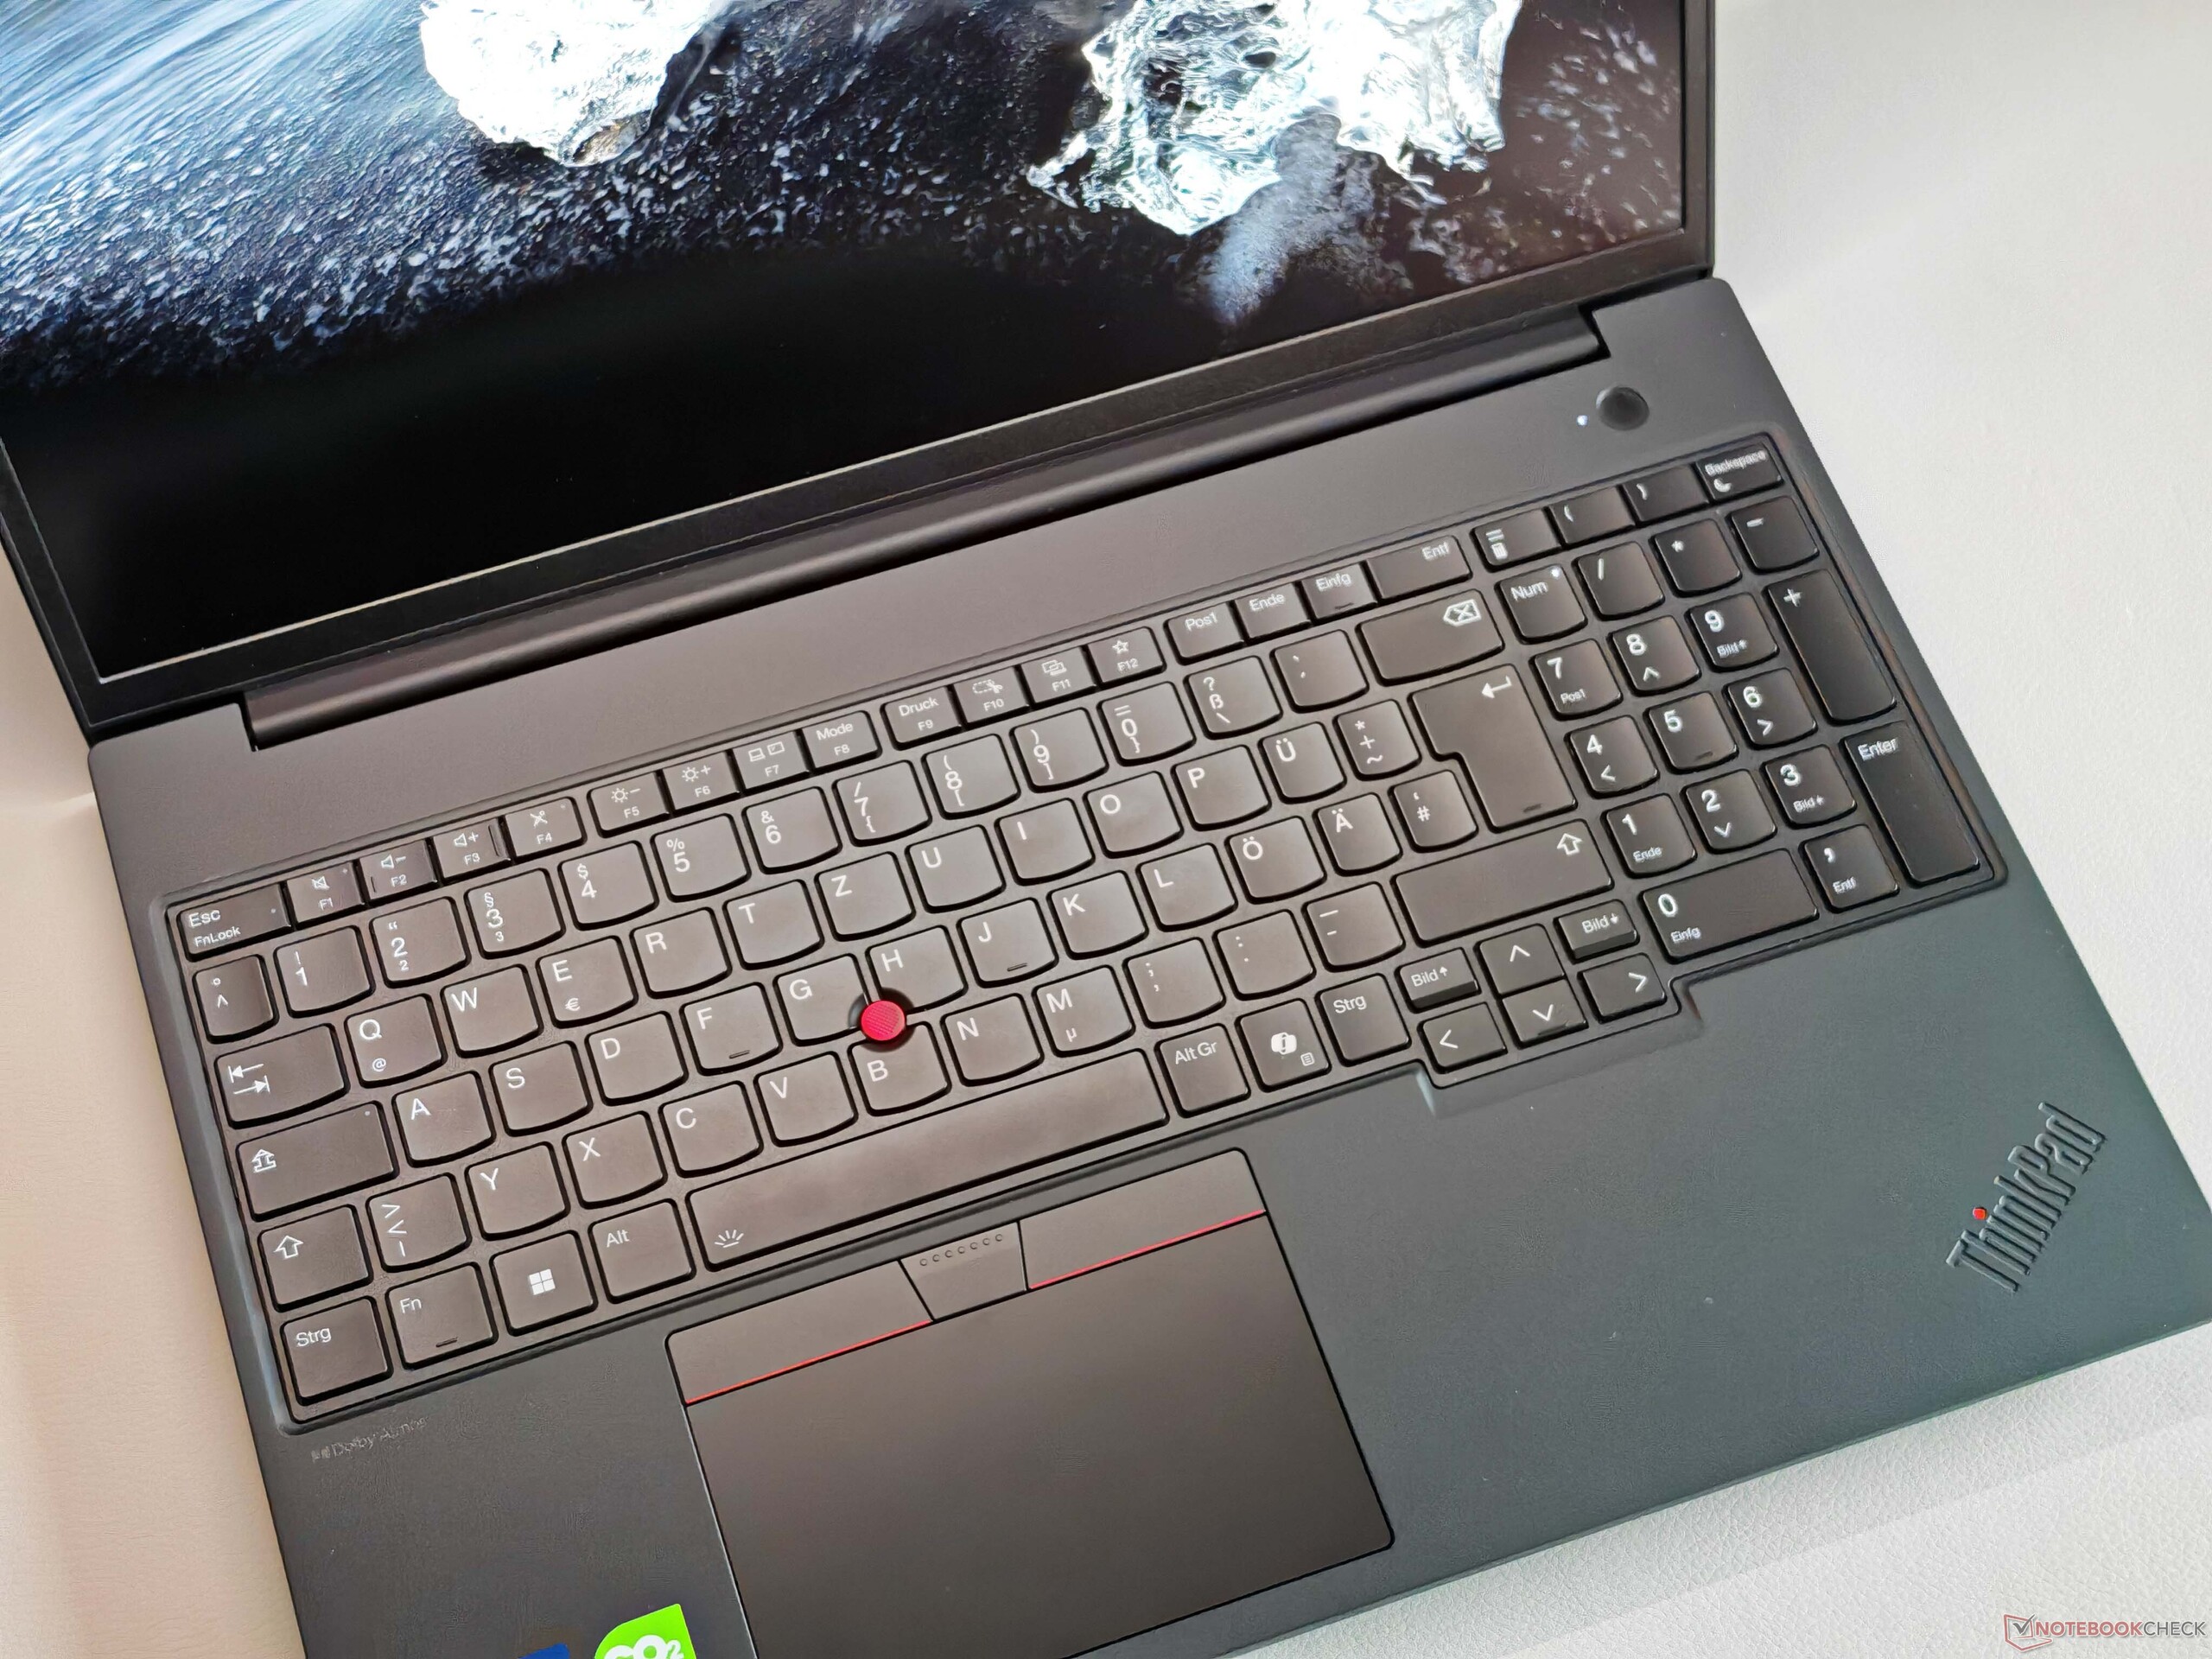
Dispositivi di input - Tastiera media
Anche la tastiera retroilluminata, comprensiva di tastierino numerico, soddisfa l'attuale standard ThinkPad, anche se ci sono modelli significativamente migliori nell'attuale line-up (ad es ThinkPad P1 16 G8). Nel complesso, descriveremmo la sensazione di digitazione come confortevole e precisa, ma la concorrenza è in grado di farlo almeno altrettanto bene. Il ClickPad (11,5 x 6,7 cm/~4,5 x ~2,6 pollici) è piuttosto piccolo rispetto agli standard moderni, a causa dei pulsanti TrackPoint dedicati, ma il funzionamento è eccellente e anche i clic meccanici nell'area inferiore sono di altissima qualità. Questo vale anche per i pulsanti TrackPoint.


Display - IPS con 500 cd/m²

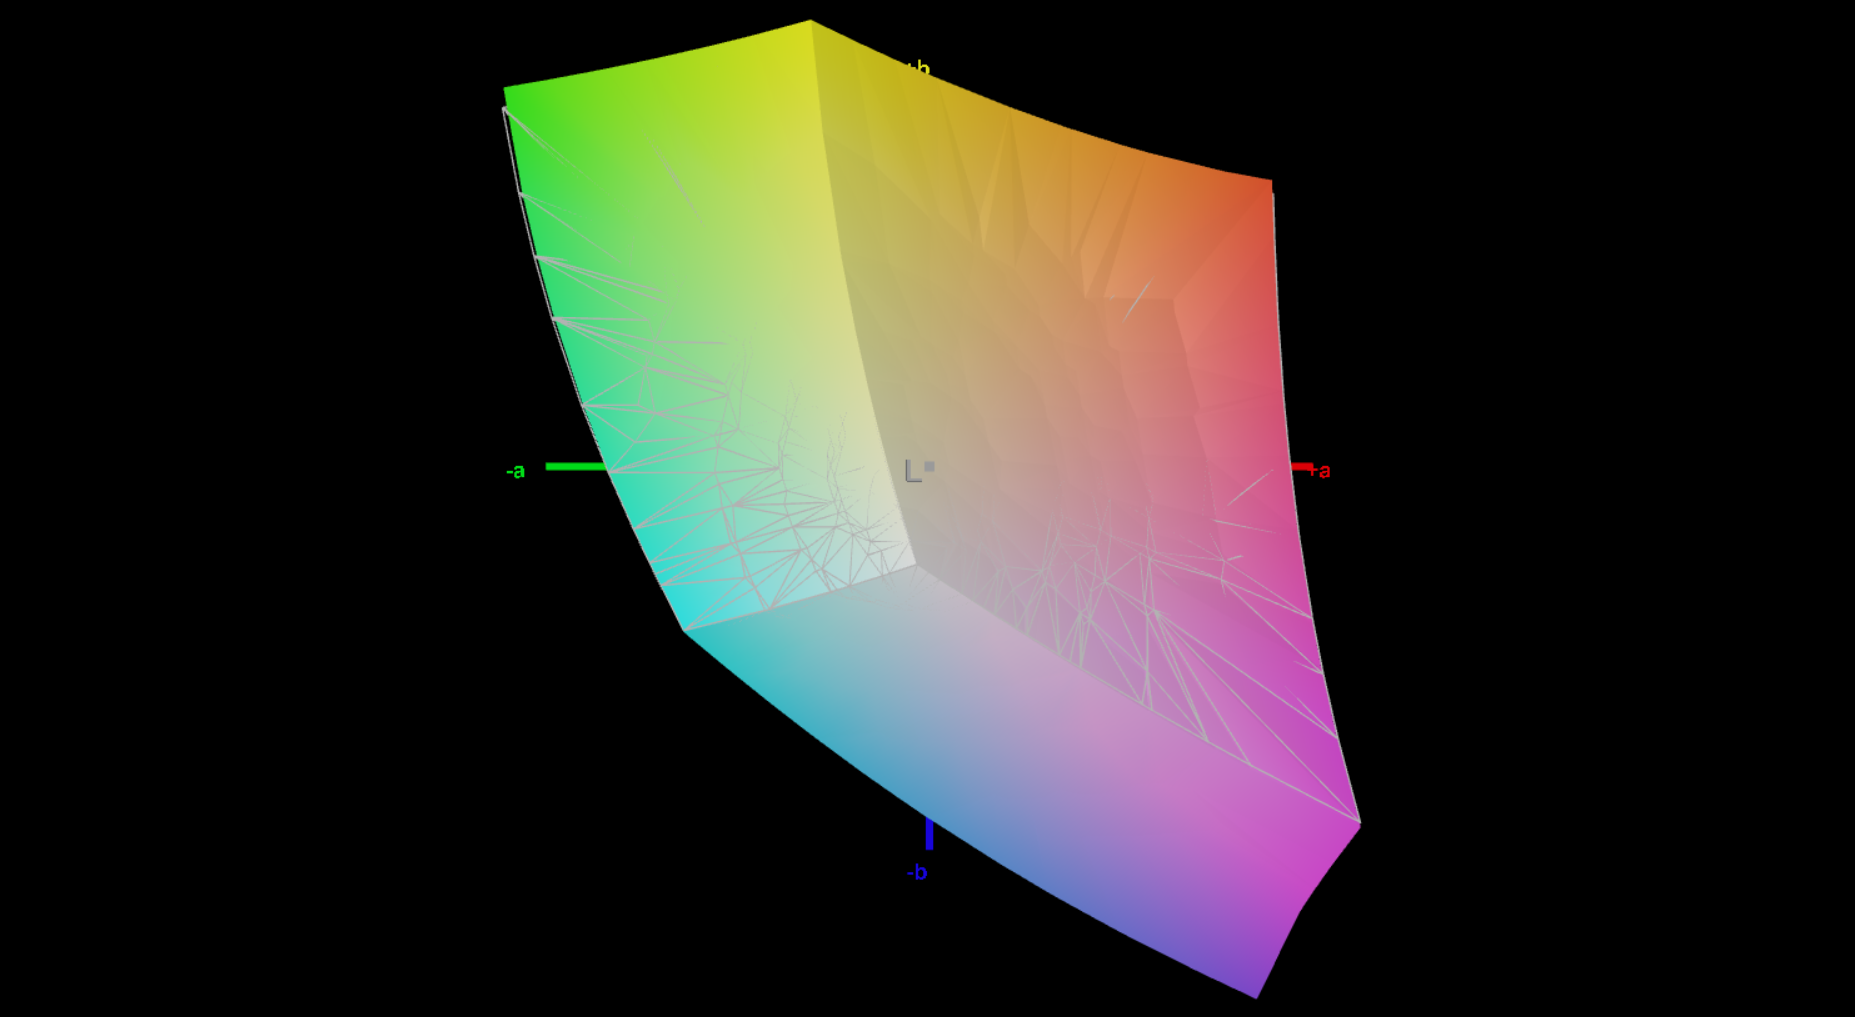
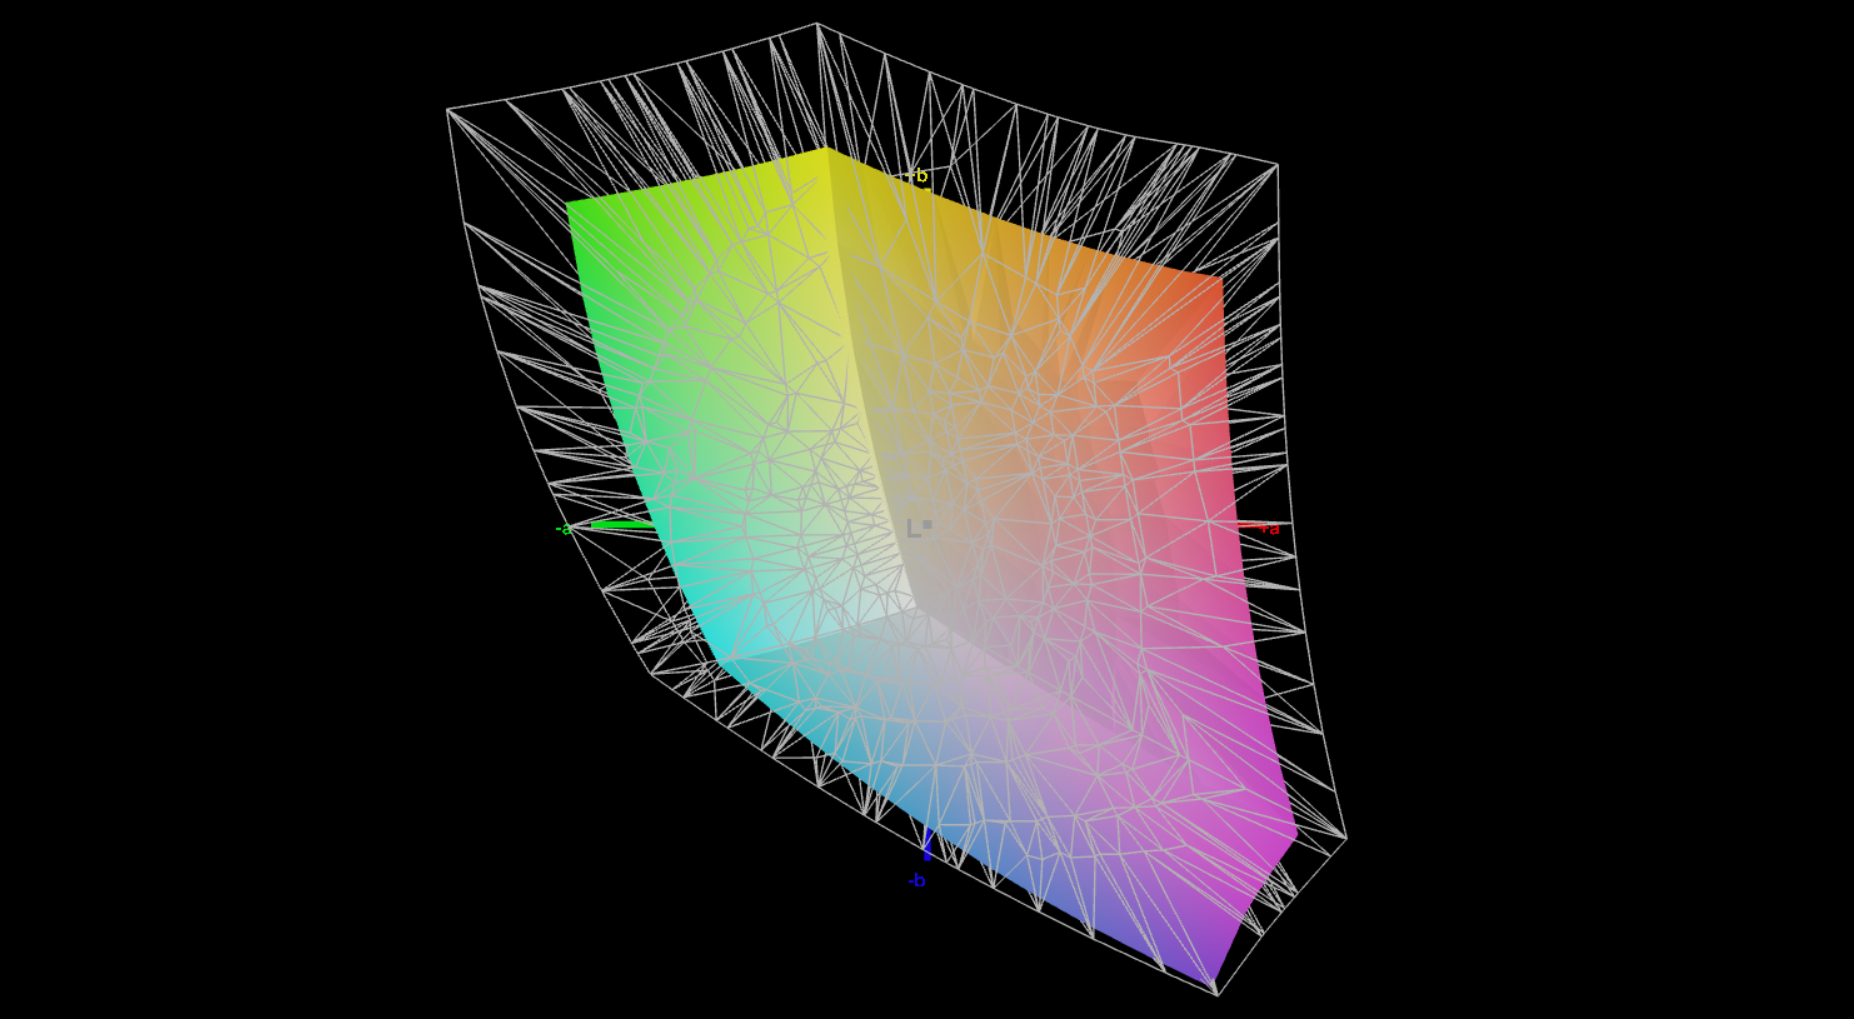
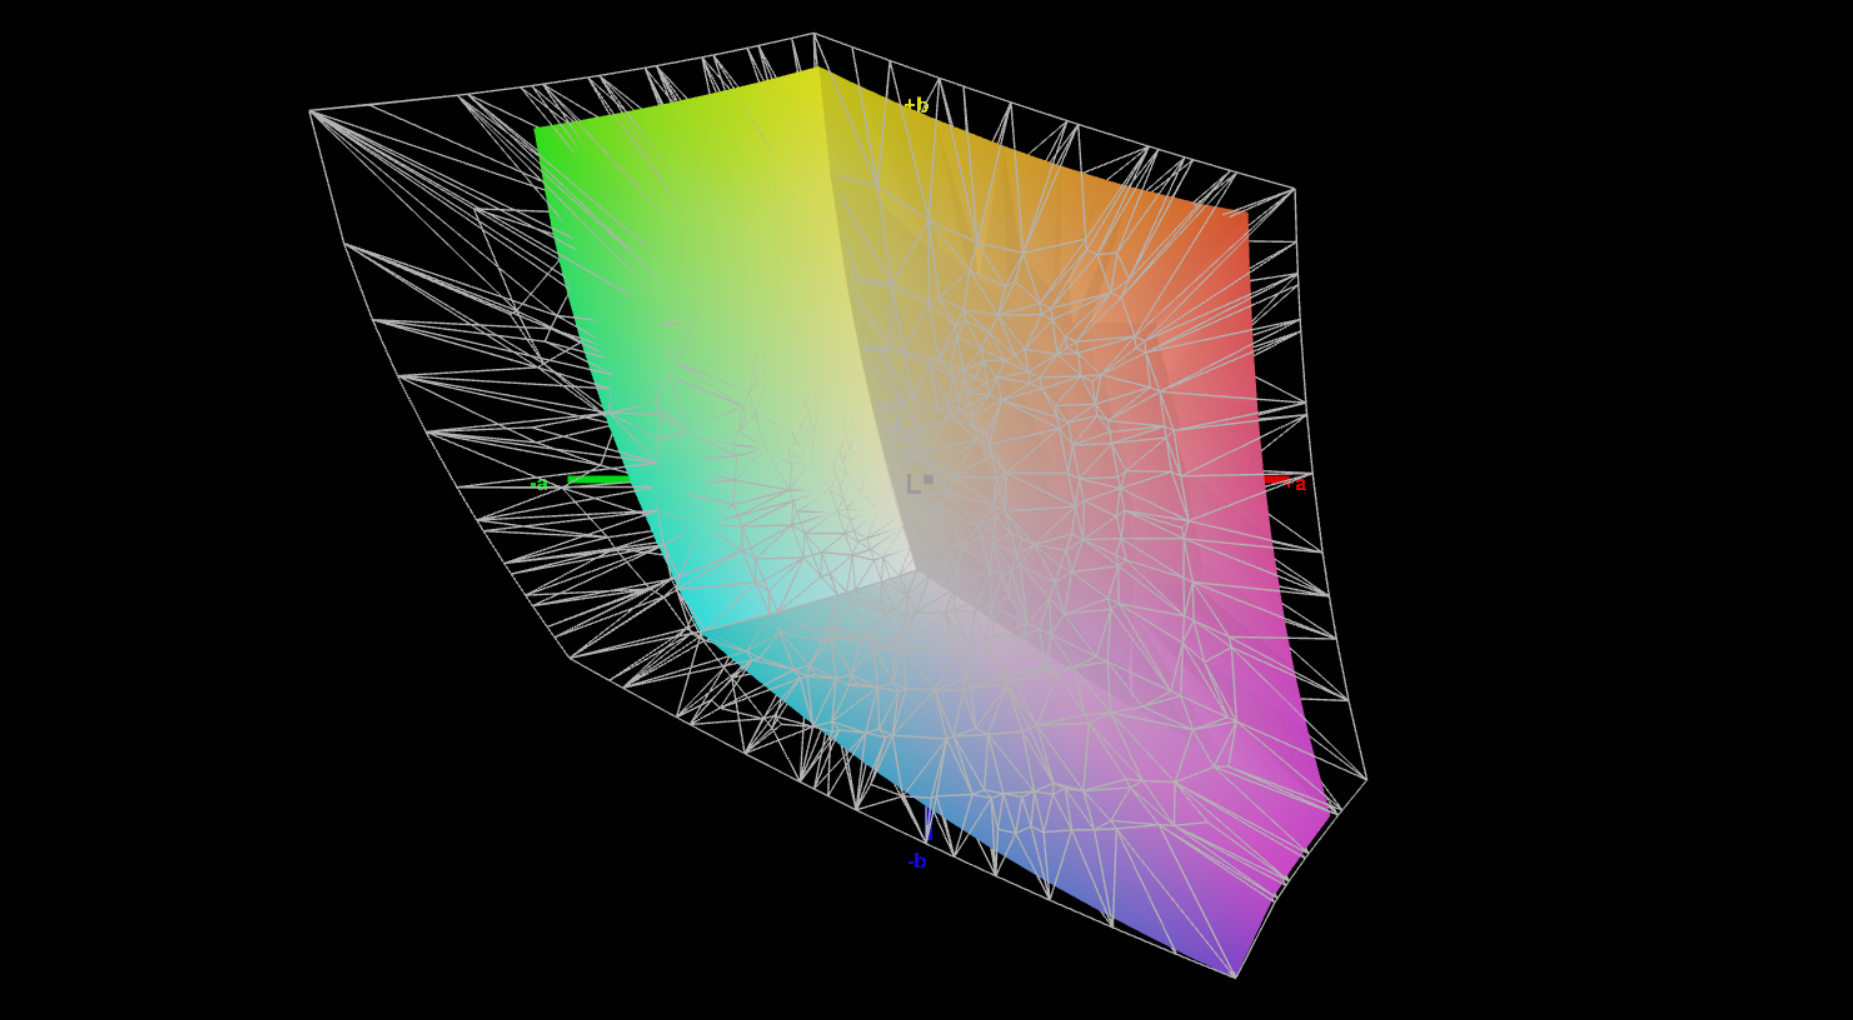
Lenovo offre solo schermi a 60 Hz (IPS e OLED) per il P16v Gen 3, il che è un po' sorprendente considerando il prezzo elevato. Nel nostro dispositivo di prova è installato il modello IPS Full HD standard (1.920 x 1.200 pixel, 16:10) con superficie opaca. L'impressione soggettiva dell'immagine è generalmente buona, ma le aree luminose appaiono leggermente sgranate a un esame più attento. Non c'è sfarfallio PWM e i tempi di risposta sono generalmente irrilevanti.
La luminosità media è un'ottima ~554 cd/m² e, insieme al livello del nero di 0,33 cd/m², si traduce in un elevato rapporto di contrasto (~1.700:1). Il profilo di colore di fabbrica mostra già una buona performance nella nostra analisi con il software professionale CalMAN, ma siamo riusciti a migliorare ulteriormente il display con la nostra calibrazione.
| |||||||||||||||||||||||||
Distribuzione della luminosità: 90 %
Al centro con la batteria: 565 cd/m²
Contrasto: 1712:1 (Nero: 0.33 cd/m²)
ΔE ColorChecker Calman: 1.8 | ∀{0.5-29.43 Ø4.72}
calibrated: 0.7
ΔE Greyscale Calman: 2.9 | ∀{0.09-98 Ø4.97}
70.6% AdobeRGB 1998 (Argyll 3D)
99.7% sRGB (Argyll 3D)
68.4% Display P3 (Argyll 3D)
Gamma: 2.23
CCT: 6534 K
| Lenovo ThinkPad P16v G3 21RS000DGE M160NW49 R0, IPS, 1920x1200, 16", 60 Hz | Lenovo ThinkPad P1 Gen 8 Samsung ATNA60KA02-0, Tandem OLED, 3200x2000, 16", 120 Hz | HP ZBook X G1i 16 LG Philips LGD07B3, IPS, 2560x1600, 16", 120 Hz | HP ZBook Power 16 G11 A AUOA0A9, IPS, 2560x1600, 16", 120 Hz | Lenovo ThinkPad P16s Gen 4 21RX000YGE N160JCA-GT1, IPS LED, 1920x1200, 16", 60 Hz | |
|---|---|---|---|---|---|
| Display | 27% | 28% | 0% | -4% | |
| Display P3 Coverage (%) | 68.4 | 98.8 44% | 97.2 42% | 69.1 1% | 65.8 -4% |
| sRGB Coverage (%) | 99.7 | 100 0% | 100 0% | 97.7 -2% | 96.8 -3% |
| AdobeRGB 1998 Coverage (%) | 70.6 | 97.5 38% | 99.9 42% | 71 1% | 67.8 -4% |
| Response Times | 97% | -51% | 53% | -17% | |
| Response Time Grey 50% / Grey 80% * (ms) | 39.2 ? | 0.57 ? 99% | 45.5 ? -16% | 13.6 ? 65% | 29.4 ? 25% |
| Response Time Black / White * (ms) | 14.1 ? | 0.73 ? 95% | 26.1 ? -85% | 8.4 ? 40% | 22.4 ? -59% |
| PWM Frequency (Hz) | 1199 | 26536 ? | |||
| PWM Amplitude * (%) | 18 | 47 | |||
| Screen | 15% | -41% | -35% | -27% | |
| Brightness middle (cd/m²) | 565 | 561.8 -1% | 461.8 -18% | 470.7 -17% | 540 -4% |
| Brightness (cd/m²) | 554 | 566 2% | 427 -23% | 431 -22% | 516 -7% |
| Brightness Distribution (%) | 90 | 99 10% | 88 -2% | 88 -2% | 93 3% |
| Black Level * (cd/m²) | 0.33 | 0.46 -39% | 0.57 -73% | 0.37 -12% | |
| Contrast (:1) | 1712 | 1004 -41% | 826 -52% | 1459 -15% | |
| Colorchecker dE 2000 * | 1.8 | 1.29 28% | 4.08 -127% | 2.16 -20% | 3.4 -89% |
| Colorchecker dE 2000 max. * | 4.2 | 2.96 30% | 8.1 -93% | 4.39 -5% | 5.6 -33% |
| Colorchecker dE 2000 calibrated * | 0.7 | 0.81 -16% | 0.75 -7% | 1.37 -96% | 0.9 -29% |
| Greyscale dE 2000 * | 2.9 | 1.4 52% | 3.5 -21% | 3.7 -28% | 4.5 -55% |
| Gamma | 2.23 99% | 2.23 99% | 2.15 102% | 2.38 92% | 2.51 88% |
| CCT | 6534 99% | 6319 103% | 6715 97% | 6765 96% | 6294 103% |
| Media totale (Programma / Settaggio) | 46% /
32% | -21% /
-28% | 6% /
-15% | -16% /
-20% |
* ... Meglio usare valori piccoli


Tempi di risposta del Display
| ↔ Tempi di risposta dal Nero al Bianco | ||
|---|---|---|
| 14.1 ms ... aumenta ↗ e diminuisce ↘ combinato | ↗ 4.6 ms Incremento | 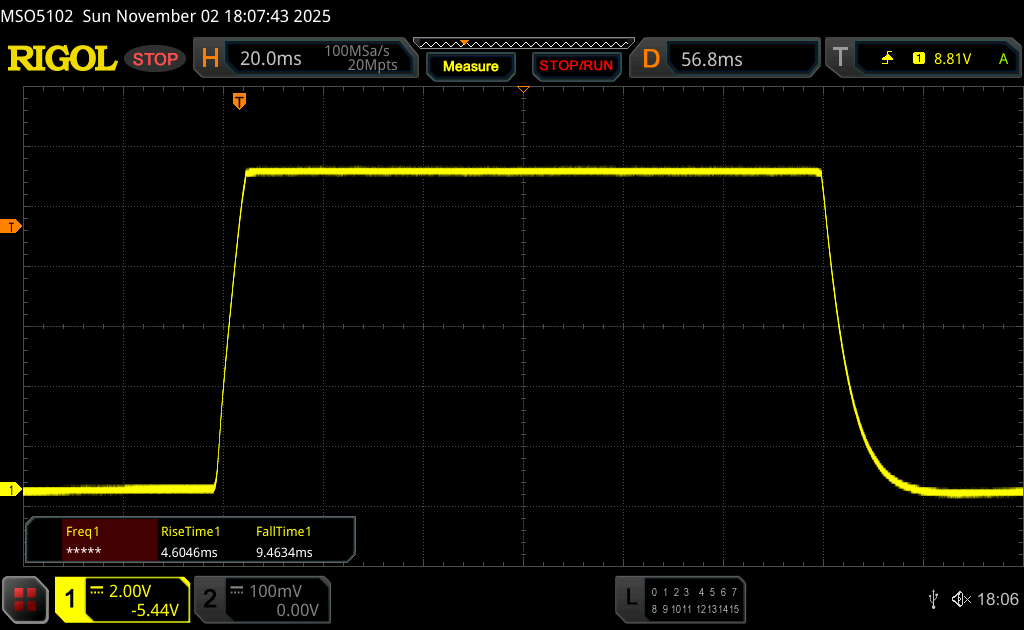 |
| ↘ 9.5 ms Calo | ||
| Lo schermo mostra buoni tempi di risposta durante i nostri tests, ma potrebbe essere troppo lento per i gamers competitivi. In confronto, tutti i dispositivi di test variano da 0.1 (minimo) a 240 (massimo) ms. » 35 % di tutti i dispositivi è migliore. Questo significa che i tempi di risposta rilevati sono migliori rispettto alla media di tutti i dispositivi testati (19.8 ms). | ||
| ↔ Tempo di risposta dal 50% Grigio all'80% Grigio | ||
| 39.2 ms ... aumenta ↗ e diminuisce ↘ combinato | ↗ 17.5 ms Incremento | 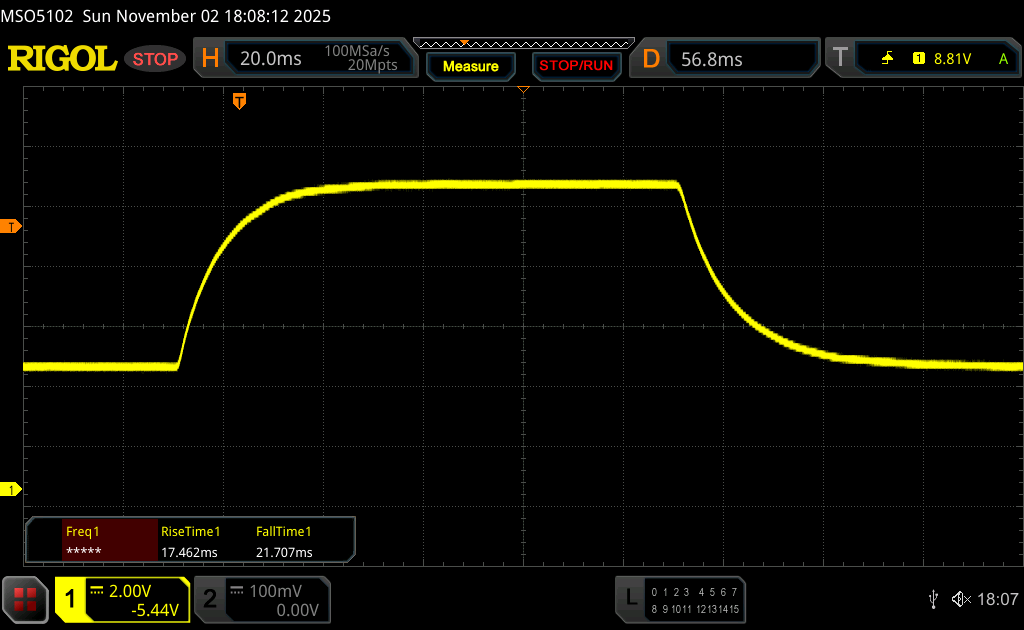 |
| ↘ 21.7 ms Calo | ||
| Lo schermo mostra tempi di risposta lenti nei nostri tests e sarà insoddisfacente per i gamers. In confronto, tutti i dispositivi di test variano da 0.165 (minimo) a 636 (massimo) ms. » 60 % di tutti i dispositivi è migliore. Questo significa che i tempi di risposta rilevati sono peggiori rispetto alla media di tutti i dispositivi testati (31 ms). | ||
Sfarfallio dello schermo / PWM (Pulse-Width Modulation)
| flickering dello schermo / PWM non rilevato | 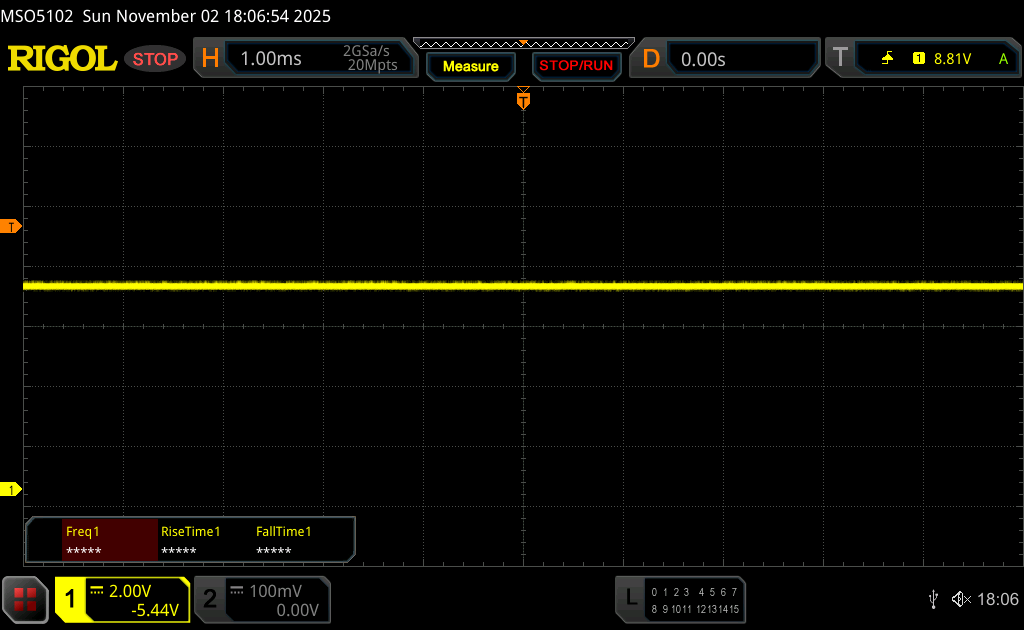 | ||
In confronto: 52 % di tutti i dispositivi testati non utilizza PWM per ridurre la luminosita' del display. Se è rilevato PWM, una media di 7747 (minimo: 5 - massimo: 343500) Hz è stata rilevata. | |||


Prestazioni - Arrow Lake & RTX PRO 2000
Condizioni del test
I profili energetici di Lenovo sono direttamente collegati alle impostazioni di Windows sui ThinkPad. Abbiamo eseguito i benchmark e le misurazioni in modalità Best Performance.
Processore
Il dispositivo di prova contiene il Intel Core Ultra 7 255H (Arrow Lake), che può consumare fino a 115 watt per brevi periodi e 70 watt in modo continuo. Le prestazioni della CPU sono complessivamente buone, anche se alcuni concorrenti sono leggermente più veloci. In modalità batteria, il processore può consumare un massimo di 40 watt, motivo per cui le prestazioni multi-core sono inferiori di circa il 14%.
Test di resistenza multipla Cinebench R15
Cinebench R23: Multi Core | Single Core
Cinebench R20: CPU (Multi Core) | CPU (Single Core)
Cinebench R15: CPU Multi 64Bit | CPU Single 64Bit
Blender: v2.79 BMW27 CPU
7-Zip 18.03: 7z b 4 | 7z b 4 -mmt1
Geekbench 6.7: Multi-Core | Single-Core
Geekbench 5.5: Multi-Core | Single-Core
HWBOT x265 Benchmark v2.2: 4k Preset
LibreOffice : 20 Documents To PDF
R Benchmark 2.5: Overall mean
| CPU Performance rating | |
| Media della classe Workstation | |
| HP ZBook X G1i 16 | |
| Lenovo ThinkPad P16v G3 21RS000DGE | |
| Lenovo ThinkPad P1 Gen 8 | |
| Media Intel Core Ultra 7 255H | |
| Lenovo ThinkPad P16s Gen 4 21RX000YGE | |
| HP ZBook Power 16 G11 A | |
| Cinebench R23 / Multi Core | |
| Media della classe Workstation (14621 - 38520, n=23, ultimi 2 anni) | |
| Lenovo ThinkPad P1 Gen 8 | |
| HP ZBook X G1i 16 | |
| Lenovo ThinkPad P16v G3 21RS000DGE | |
| Media Intel Core Ultra 7 255H (16105 - 22578, n=20) | |
| Lenovo ThinkPad P16s Gen 4 21RX000YGE | |
| HP ZBook Power 16 G11 A | |
| Cinebench R23 / Single Core | |
| Lenovo ThinkPad P16v G3 21RS000DGE | |
| Media Intel Core Ultra 7 255H (1874 - 2152, n=20) | |
| Media della classe Workstation (1712 - 2228, n=23, ultimi 2 anni) | |
| HP ZBook X G1i 16 | |
| Lenovo ThinkPad P1 Gen 8 | |
| Lenovo ThinkPad P16s Gen 4 21RX000YGE | |
| HP ZBook Power 16 G11 A | |
| Cinebench R20 / CPU (Multi Core) | |
| Media della classe Workstation (5760 - 15043, n=23, ultimi 2 anni) | |
| Lenovo ThinkPad P1 Gen 8 | |
| HP ZBook X G1i 16 | |
| Lenovo ThinkPad P16v G3 21RS000DGE | |
| Media Intel Core Ultra 7 255H (6356 - 8860, n=19) | |
| Lenovo ThinkPad P16s Gen 4 21RX000YGE | |
| HP ZBook Power 16 G11 A | |
| Cinebench R20 / CPU (Single Core) | |
| Lenovo ThinkPad P16v G3 21RS000DGE | |
| Lenovo ThinkPad P16s Gen 4 21RX000YGE | |
| Media Intel Core Ultra 7 255H (743 - 826, n=19) | |
| Media della classe Workstation (671 - 857, n=23, ultimi 2 anni) | |
| HP ZBook X G1i 16 | |
| Lenovo ThinkPad P1 Gen 8 | |
| HP ZBook Power 16 G11 A | |
| Cinebench R15 / CPU Multi 64Bit | |
| Media della classe Workstation (2489 - 5810, n=23, ultimi 2 anni) | |
| HP ZBook X G1i 16 | |
| Lenovo ThinkPad P1 Gen 8 | |
| Lenovo ThinkPad P16v G3 21RS000DGE | |
| Lenovo ThinkPad P16s Gen 4 21RX000YGE | |
| Media Intel Core Ultra 7 255H (2414 - 3444, n=19) | |
| HP ZBook Power 16 G11 A | |
| Cinebench R15 / CPU Single 64Bit | |
| Lenovo ThinkPad P16s Gen 4 21RX000YGE | |
| HP ZBook X G1i 16 | |
| Media Intel Core Ultra 7 255H (258 - 322, n=20) | |
| Lenovo ThinkPad P1 Gen 8 | |
| Lenovo ThinkPad P16v G3 21RS000DGE | |
| Media della classe Workstation (191.4 - 328, n=23, ultimi 2 anni) | |
| HP ZBook Power 16 G11 A | |
| Blender / v2.79 BMW27 CPU | |
| HP ZBook Power 16 G11 A | |
| Media Intel Core Ultra 7 255H (156 - 293, n=19) | |
| Lenovo ThinkPad P16s Gen 4 21RX000YGE | |
| Lenovo ThinkPad P16v G3 21RS000DGE | |
| Lenovo ThinkPad P1 Gen 8 | |
| HP ZBook X G1i 16 | |
| Media della classe Workstation (91 - 222, n=23, ultimi 2 anni) | |
| 7-Zip 18.03 / 7z b 4 | |
| Media della classe Workstation (60489 - 116969, n=23, ultimi 2 anni) | |
| Lenovo ThinkPad P16s Gen 4 21RX000YGE | |
| HP ZBook X G1i 16 | |
| Lenovo ThinkPad P16v G3 21RS000DGE | |
| HP ZBook Power 16 G11 A | |
| Lenovo ThinkPad P1 Gen 8 | |
| Media Intel Core Ultra 7 255H (42155 - 70397, n=20) | |
| 7-Zip 18.03 / 7z b 4 -mmt1 | |
| HP ZBook Power 16 G11 A | |
| Lenovo ThinkPad P16s Gen 4 21RX000YGE | |
| Lenovo ThinkPad P16v G3 21RS000DGE | |
| Media della classe Workstation (5126 - 6960, n=23, ultimi 2 anni) | |
| HP ZBook X G1i 16 | |
| Media Intel Core Ultra 7 255H (4589 - 6385, n=20) | |
| Lenovo ThinkPad P1 Gen 8 | |
| Geekbench 6.7 / Multi-Core | |
| HP ZBook X G1i 16 | |
| Lenovo ThinkPad P1 Gen 8 | |
| Lenovo ThinkPad P16v G3 21RS000DGE | |
| Media della classe Workstation (12721 - 20887, n=23, ultimi 2 anni) | |
| Media Intel Core Ultra 7 255H (11979 - 17489, n=20) | |
| Lenovo ThinkPad P16s Gen 4 21RX000YGE | |
| HP ZBook Power 16 G11 A | |
| Geekbench 6.7 / Single-Core | |
| Lenovo ThinkPad P16s Gen 4 21RX000YGE | |
| Lenovo ThinkPad P16v G3 21RS000DGE | |
| HP ZBook X G1i 16 | |
| Media Intel Core Ultra 7 255H (2712 - 2939, n=20) | |
| Media della classe Workstation (2389 - 3065, n=23, ultimi 2 anni) | |
| Lenovo ThinkPad P1 Gen 8 | |
| HP ZBook Power 16 G11 A | |
| Geekbench 5.5 / Multi-Core | |
| Media della classe Workstation (11542 - 25554, n=23, ultimi 2 anni) | |
| Lenovo ThinkPad P1 Gen 8 | |
| HP ZBook X G1i 16 | |
| Lenovo ThinkPad P16v G3 21RS000DGE | |
| Lenovo ThinkPad P16s Gen 4 21RX000YGE | |
| Media Intel Core Ultra 7 255H (11348 - 17218, n=19) | |
| HP ZBook Power 16 G11 A | |
| Geekbench 5.5 / Single-Core | |
| Lenovo ThinkPad P16s Gen 4 21RX000YGE | |
| Lenovo ThinkPad P16v G3 21RS000DGE | |
| HP ZBook X G1i 16 | |
| Media Intel Core Ultra 7 255H (1938 - 2121, n=19) | |
| Media della classe Workstation (1783 - 2183, n=23, ultimi 2 anni) | |
| Lenovo ThinkPad P1 Gen 8 | |
| HP ZBook Power 16 G11 A | |
| HWBOT x265 Benchmark v2.2 / 4k Preset | |
| Media della classe Workstation (17.8 - 40.5, n=23, ultimi 2 anni) | |
| Lenovo ThinkPad P1 Gen 8 | |
| HP ZBook X G1i 16 | |
| Lenovo ThinkPad P16v G3 21RS000DGE | |
| Lenovo ThinkPad P16s Gen 4 21RX000YGE | |
| Media Intel Core Ultra 7 255H (13.7 - 26.5, n=19) | |
| HP ZBook Power 16 G11 A | |
| LibreOffice / 20 Documents To PDF | |
| Lenovo ThinkPad P16s Gen 4 21RX000YGE | |
| HP ZBook Power 16 G11 A | |
| Media Intel Core Ultra 7 255H (41.1 - 61.6, n=19) | |
| Media della classe Workstation (37.1 - 74.7, n=23, ultimi 2 anni) | |
| HP ZBook X G1i 16 | |
| Lenovo ThinkPad P1 Gen 8 | |
| Lenovo ThinkPad P16v G3 21RS000DGE | |
| R Benchmark 2.5 / Overall mean | |
| Lenovo ThinkPad P16s Gen 4 21RX000YGE | |
| HP ZBook Power 16 G11 A | |
| Media Intel Core Ultra 7 255H (0.4233 - 0.515, n=19) | |
| Lenovo ThinkPad P16v G3 21RS000DGE | |
| Lenovo ThinkPad P1 Gen 8 | |
| Media della classe Workstation (0.3825 - 0.603, n=23, ultimi 2 anni) | |
| HP ZBook X G1i 16 | |
* ... Meglio usare valori piccoli
AIDA64: FP32 Ray-Trace | FPU Julia | CPU SHA3 | CPU Queen | FPU SinJulia | FPU Mandel | CPU AES | CPU ZLib | FP64 Ray-Trace | CPU PhotoWorxx
| Performance rating | |
| Media della classe Workstation | |
| Lenovo ThinkPad P16s Gen 4 21RX000YGE | |
| HP ZBook Power 16 G11 A | |
| Lenovo ThinkPad P1 Gen 8 | |
| Lenovo ThinkPad P16v G3 21RS000DGE | |
| Media Intel Core Ultra 7 255H | |
| AIDA64 / FP32 Ray-Trace | |
| Lenovo ThinkPad P16s Gen 4 21RX000YGE | |
| Media della classe Workstation (16730 - 61611, n=23, ultimi 2 anni) | |
| HP ZBook Power 16 G11 A | |
| Lenovo ThinkPad P1 Gen 8 | |
| Lenovo ThinkPad P16v G3 21RS000DGE | |
| Media Intel Core Ultra 7 255H (13863 - 24741, n=17) | |
| AIDA64 / FPU Julia | |
| Media della classe Workstation (89597 - 186971, n=23, ultimi 2 anni) | |
| Lenovo ThinkPad P1 Gen 8 | |
| HP ZBook Power 16 G11 A | |
| Lenovo ThinkPad P16s Gen 4 21RX000YGE | |
| Lenovo ThinkPad P16v G3 21RS000DGE | |
| Media Intel Core Ultra 7 255H (71030 - 119222, n=17) | |
| AIDA64 / CPU SHA3 | |
| Media della classe Workstation (4178 - 8975, n=23, ultimi 2 anni) | |
| Lenovo ThinkPad P1 Gen 8 | |
| Lenovo ThinkPad P16s Gen 4 21RX000YGE | |
| Lenovo ThinkPad P16v G3 21RS000DGE | |
| HP ZBook Power 16 G11 A | |
| Media Intel Core Ultra 7 255H (3408 - 5548, n=17) | |
| AIDA64 / CPU Queen | |
| HP ZBook Power 16 G11 A | |
| Media della classe Workstation (60778 - 144411, n=23, ultimi 2 anni) | |
| Lenovo ThinkPad P16s Gen 4 21RX000YGE | |
| Lenovo ThinkPad P1 Gen 8 | |
| Lenovo ThinkPad P16v G3 21RS000DGE | |
| Media Intel Core Ultra 7 255H (59098 - 68460, n=16) | |
| AIDA64 / FPU SinJulia | |
| Lenovo ThinkPad P16s Gen 4 21RX000YGE | |
| HP ZBook Power 16 G11 A | |
| Media della classe Workstation (8165 - 29343, n=23, ultimi 2 anni) | |
| Lenovo ThinkPad P1 Gen 8 | |
| Lenovo ThinkPad P16v G3 21RS000DGE | |
| Media Intel Core Ultra 7 255H (6716 - 9006, n=17) | |
| AIDA64 / FPU Mandel | |
| Media della classe Workstation (44497 - 98153, n=23, ultimi 2 anni) | |
| Lenovo ThinkPad P1 Gen 8 | |
| Lenovo ThinkPad P16s Gen 4 21RX000YGE | |
| Lenovo ThinkPad P16v G3 21RS000DGE | |
| HP ZBook Power 16 G11 A | |
| Media Intel Core Ultra 7 255H (37031 - 63347, n=17) | |
| AIDA64 / CPU AES | |
| Media della classe Workstation (73133 - 187841, n=23, ultimi 2 anni) | |
| Lenovo ThinkPad P16s Gen 4 21RX000YGE | |
| Lenovo ThinkPad P1 Gen 8 | |
| HP ZBook Power 16 G11 A | |
| Lenovo ThinkPad P16v G3 21RS000DGE | |
| Media Intel Core Ultra 7 255H (58402 - 83568, n=17) | |
| AIDA64 / CPU ZLib | |
| Media della classe Workstation (929 - 2148, n=23, ultimi 2 anni) | |
| Lenovo ThinkPad P1 Gen 8 | |
| Lenovo ThinkPad P16s Gen 4 21RX000YGE | |
| Lenovo ThinkPad P16v G3 21RS000DGE | |
| Media Intel Core Ultra 7 255H (822 - 1316, n=17) | |
| HP ZBook Power 16 G11 A | |
| AIDA64 / FP64 Ray-Trace | |
| Lenovo ThinkPad P16s Gen 4 21RX000YGE | |
| Media della classe Workstation (8545 - 32891, n=23, ultimi 2 anni) | |
| Lenovo ThinkPad P1 Gen 8 | |
| HP ZBook Power 16 G11 A | |
| Lenovo ThinkPad P16v G3 21RS000DGE | |
| Media Intel Core Ultra 7 255H (7384 - 13231, n=17) | |
| AIDA64 / CPU PhotoWorxx | |
| Lenovo ThinkPad P1 Gen 8 | |
| Media Intel Core Ultra 7 255H (23836 - 65787, n=17) | |
| Media della classe Workstation (37151 - 93684, n=23, ultimi 2 anni) | |
| Lenovo ThinkPad P16s Gen 4 21RX000YGE | |
| Lenovo ThinkPad P16v G3 21RS000DGE | |
| HP ZBook Power 16 G11 A | |
Prestazioni del sistema
Nell'uso quotidiano, il ThinkPad P16v Gen 3 è un computer molto reattivo e i risultati dei benchmark sono molto buoni. Non ci sono stati problemi di stabilità durante il test.
PCMark 10: Score | Essentials | Productivity | Digital Content Creation
CrossMark: Overall | Productivity | Creativity | Responsiveness
WebXPRT 3: Overall
WebXPRT 4: Overall
Mozilla Kraken 1.1: Total
| Performance rating | |
| Lenovo ThinkPad P16v G3 21RS000DGE | |
| Media Intel Core Ultra 7 255H, NVIDIA RTX PRO 2000 Blackwell Generation Laptop | |
| Lenovo ThinkPad P1 Gen 8 | |
| HP ZBook X G1i 16 -4! | |
| Media della classe Workstation | |
| HP ZBook Power 16 G11 A | |
| Lenovo ThinkPad P16s Gen 4 21RX000YGE | |
| PCMark 10 / Score | |
| Lenovo ThinkPad P16v G3 21RS000DGE | |
| Media Intel Core Ultra 7 255H, NVIDIA RTX PRO 2000 Blackwell Generation Laptop (9625 - 9723, n=2) | |
| Lenovo ThinkPad P1 Gen 8 | |
| Media della classe Workstation (6563 - 10409, n=19, ultimi 2 anni) | |
| Lenovo ThinkPad P16s Gen 4 21RX000YGE | |
| HP ZBook Power 16 G11 A | |
| PCMark 10 / Essentials | |
| Lenovo ThinkPad P16v G3 21RS000DGE | |
| Media Intel Core Ultra 7 255H, NVIDIA RTX PRO 2000 Blackwell Generation Laptop (10650 - 10921, n=2) | |
| Lenovo ThinkPad P16s Gen 4 21RX000YGE | |
| Lenovo ThinkPad P1 Gen 8 | |
| Media della classe Workstation (9622 - 11157, n=19, ultimi 2 anni) | |
| HP ZBook Power 16 G11 A | |
| PCMark 10 / Productivity | |
| Lenovo ThinkPad P1 Gen 8 | |
| Media Intel Core Ultra 7 255H, NVIDIA RTX PRO 2000 Blackwell Generation Laptop (18083 - 18261, n=2) | |
| Lenovo ThinkPad P16v G3 21RS000DGE | |
| Media della classe Workstation (8789 - 20616, n=19, ultimi 2 anni) | |
| Lenovo ThinkPad P16s Gen 4 21RX000YGE | |
| HP ZBook Power 16 G11 A | |
| PCMark 10 / Digital Content Creation | |
| Lenovo ThinkPad P16v G3 21RS000DGE | |
| Media Intel Core Ultra 7 255H, NVIDIA RTX PRO 2000 Blackwell Generation Laptop (12443 - 12631, n=2) | |
| Media della classe Workstation (8108 - 15631, n=19, ultimi 2 anni) | |
| Lenovo ThinkPad P1 Gen 8 | |
| HP ZBook Power 16 G11 A | |
| Lenovo ThinkPad P16s Gen 4 21RX000YGE | |
| CrossMark / Overall | |
| HP ZBook X G1i 16 | |
| Lenovo ThinkPad P1 Gen 8 | |
| Media Intel Core Ultra 7 255H, NVIDIA RTX PRO 2000 Blackwell Generation Laptop (1942 - 1953, n=2) | |
| Lenovo ThinkPad P16v G3 21RS000DGE | |
| Media della classe Workstation (1307 - 2267, n=22, ultimi 2 anni) | |
| HP ZBook Power 16 G11 A | |
| Lenovo ThinkPad P16s Gen 4 21RX000YGE | |
| CrossMark / Productivity | |
| HP ZBook X G1i 16 | |
| Lenovo ThinkPad P1 Gen 8 | |
| Media Intel Core Ultra 7 255H, NVIDIA RTX PRO 2000 Blackwell Generation Laptop (1834 - 1836, n=2) | |
| Lenovo ThinkPad P16v G3 21RS000DGE | |
| Media della classe Workstation (1130 - 2122, n=22, ultimi 2 anni) | |
| HP ZBook Power 16 G11 A | |
| Lenovo ThinkPad P16s Gen 4 21RX000YGE | |
| CrossMark / Creativity | |
| HP ZBook X G1i 16 | |
| Lenovo ThinkPad P16v G3 21RS000DGE | |
| Media Intel Core Ultra 7 255H, NVIDIA RTX PRO 2000 Blackwell Generation Laptop (2211 - 2232, n=2) | |
| Media della classe Workstation (1657 - 2725, n=22, ultimi 2 anni) | |
| Lenovo ThinkPad P1 Gen 8 | |
| HP ZBook Power 16 G11 A | |
| Lenovo ThinkPad P16s Gen 4 21RX000YGE | |
| CrossMark / Responsiveness | |
| Lenovo ThinkPad P1 Gen 8 | |
| Media della classe Workstation (993 - 2096, n=22, ultimi 2 anni) | |
| Media Intel Core Ultra 7 255H, NVIDIA RTX PRO 2000 Blackwell Generation Laptop (1520 - 1622, n=2) | |
| HP ZBook X G1i 16 | |
| Lenovo ThinkPad P16v G3 21RS000DGE | |
| HP ZBook Power 16 G11 A | |
| Lenovo ThinkPad P16s Gen 4 21RX000YGE | |
| WebXPRT 3 / Overall | |
| Lenovo ThinkPad P1 Gen 8 | |
| Media Intel Core Ultra 7 255H, NVIDIA RTX PRO 2000 Blackwell Generation Laptop (322 - 330, n=2) | |
| Lenovo ThinkPad P16v G3 21RS000DGE | |
| HP ZBook X G1i 16 | |
| Media della classe Workstation (260 - 360, n=23, ultimi 2 anni) | |
| Lenovo ThinkPad P16s Gen 4 21RX000YGE | |
| HP ZBook Power 16 G11 A | |
| WebXPRT 4 / Overall | |
| Lenovo ThinkPad P16v G3 21RS000DGE | |
| Media Intel Core Ultra 7 255H, NVIDIA RTX PRO 2000 Blackwell Generation Laptop (298 - 307, n=2) | |
| HP ZBook X G1i 16 | |
| Lenovo ThinkPad P1 Gen 8 | |
| Media della classe Workstation (189.2 - 326, n=23, ultimi 2 anni) | |
| HP ZBook Power 16 G11 A | |
| Lenovo ThinkPad P16s Gen 4 21RX000YGE | |
| Mozilla Kraken 1.1 / Total | |
| HP ZBook Power 16 G11 A | |
| Lenovo ThinkPad P16s Gen 4 21RX000YGE | |
| Lenovo ThinkPad P1 Gen 8 | |
| HP ZBook X G1i 16 | |
| Media della classe Workstation (411 - 538, n=23, ultimi 2 anni) | |
| Media Intel Core Ultra 7 255H, NVIDIA RTX PRO 2000 Blackwell Generation Laptop (448 - 461, n=2) | |
| Lenovo ThinkPad P16v G3 21RS000DGE | |
* ... Meglio usare valori piccoli
| PCMark 10 Score | 9723 punti | |
Aiuto | ||
| AIDA64 / Memory Copy | |
| Lenovo ThinkPad P1 Gen 8 | |
| Media Intel Core Ultra 7 255H (39188 - 110930, n=17) | |
| Media della classe Workstation (56003 - 164795, n=23, ultimi 2 anni) | |
| Lenovo ThinkPad P16v G3 21RS000DGE | |
| Lenovo ThinkPad P16s Gen 4 21RX000YGE | |
| HP ZBook Power 16 G11 A | |
| AIDA64 / Memory Read | |
| Lenovo ThinkPad P16s Gen 4 21RX000YGE | |
| Lenovo ThinkPad P16v G3 21RS000DGE | |
| Media Intel Core Ultra 7 255H (43703 - 90552, n=17) | |
| Media della classe Workstation (55795 - 121563, n=23, ultimi 2 anni) | |
| Lenovo ThinkPad P1 Gen 8 | |
| HP ZBook Power 16 G11 A | |
| AIDA64 / Memory Write | |
| Media della classe Workstation (55663 - 214520, n=23, ultimi 2 anni) | |
| HP ZBook Power 16 G11 A | |
| Lenovo ThinkPad P16s Gen 4 21RX000YGE | |
| Lenovo ThinkPad P16v G3 21RS000DGE | |
| Media Intel Core Ultra 7 255H (36438 - 87199, n=17) | |
| Lenovo ThinkPad P1 Gen 8 | |
| AIDA64 / Memory Latency | |
| Lenovo ThinkPad P1 Gen 8 | |
| Media della classe Workstation (84.5 - 165.2, n=23, ultimi 2 anni) | |
| Media Intel Core Ultra 7 255H (107.6 - 147.2, n=17) | |
| Lenovo ThinkPad P16v G3 21RS000DGE | |
| Lenovo ThinkPad P16s Gen 4 21RX000YGE | |
| HP ZBook Power 16 G11 A | |
* ... Meglio usare valori piccoli
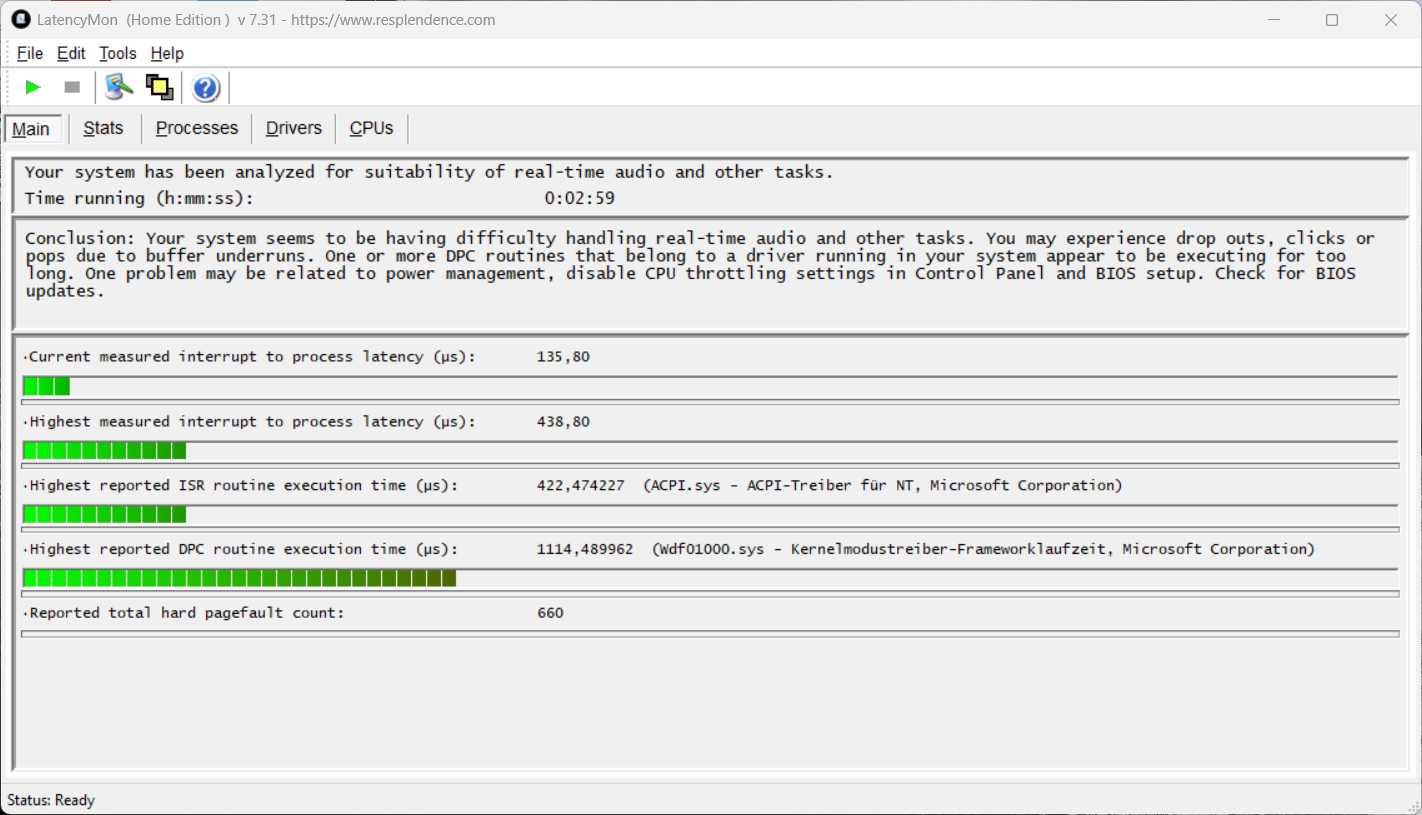
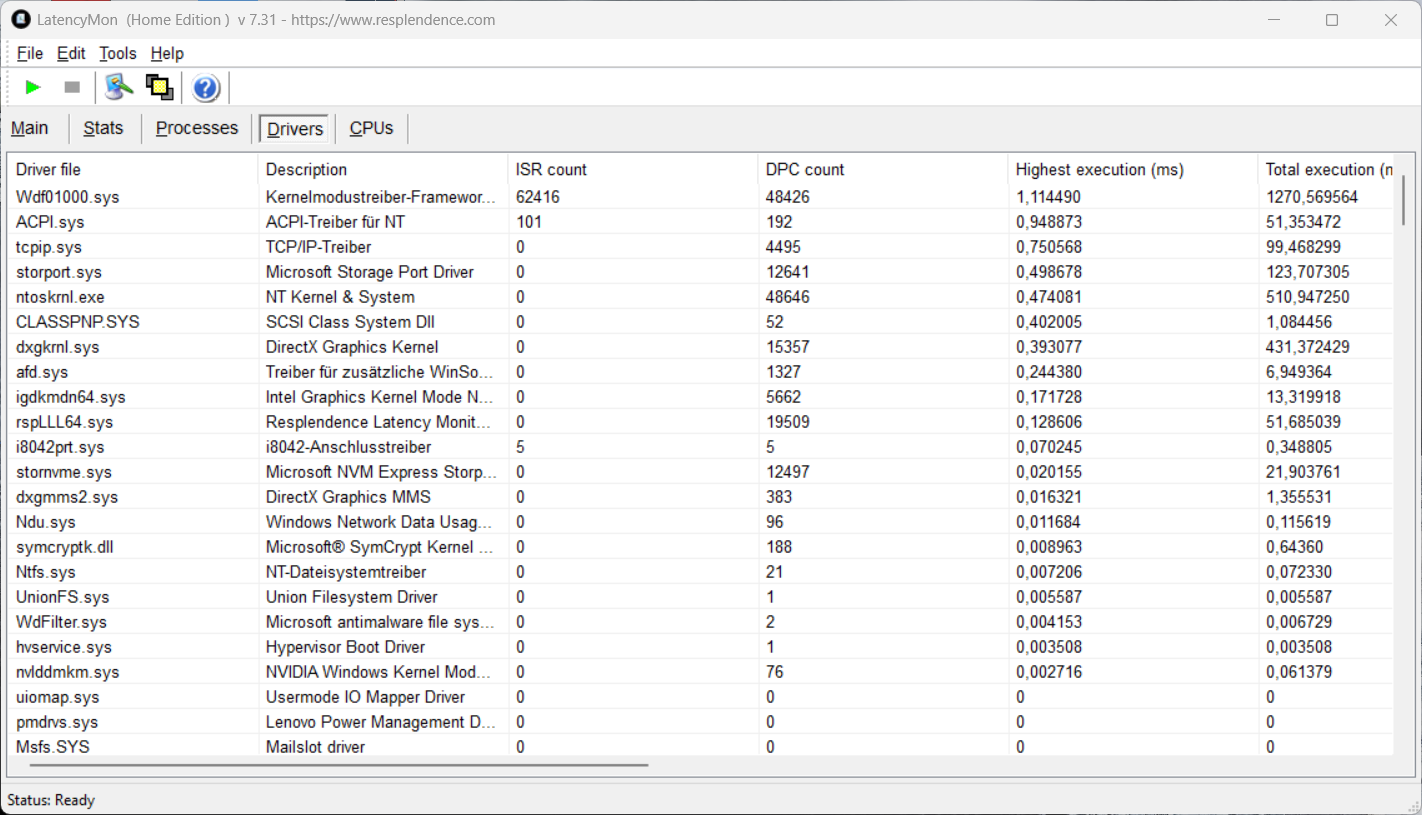
Latenze DPC
Nel nostro test di latenza standardizzato (navigazione in Internet, riproduzione di YouTube 4K, carico della CPU), il dispositivo di prova con l'attuale versione del BIOS mostra leggere limitazioni quando si utilizzano applicazioni audio in tempo reale.
| DPC Latencies / LatencyMon - interrupt to process latency (max), Web, Youtube, Prime95 | |
| HP ZBook Power 16 G11 A | |
| Lenovo ThinkPad P1 Gen 8 | |
| Lenovo ThinkPad P16s Gen 4 21RX000YGE | |
| HP ZBook X G1i 16 | |
| Lenovo ThinkPad P16v G3 21RS000DGE | |
* ... Meglio usare valori piccoli
Dispositivi di archiviazione
L'unità Samsung PM9E1 (1 TB, 879 GB liberi), un SSD PCIe 5.0, è già installata nel nostro dispositivo di prova, ma i due slot M.2-2280 sono collegati solo tramite PCIe 4.0. Di conseguenza, anche le velocità di trasferimento sono al massimo di circa 7 GB/s invece di 13-14 GB/s. Tuttavia, le prestazioni sono ancora buone e rimangono stabili anche sotto carico prolungato.

* ... Meglio usare valori piccoli
Prestazioni in lettura continua: Loop di lettura DiskSpd, profondità della coda 8
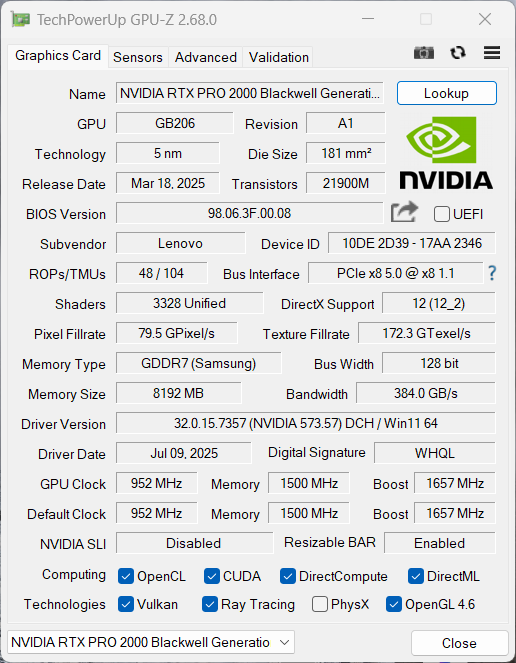
Prestazioni della GPU
La GPU è quella professionale Nvidia RTX PRO 2000 (Blackwell, 8 GB VRAM), che viene attivata tramite la tecnologia Optimus. Il chip stesso è identico alla GeForce RTX 5060ma nel caso del P16v Gen 3, è implementata solo la versione da 60 watt (sarebbe possibile un massimo di 115 watt), il che è un po' deludente dato l'involucro di grandi dimensioni. Tuttavia, la situazione è simile a quella delle altre workstation mobili di questo segmento (massimo 75 watt), per cui anche le prestazioni grafiche sono paragonabili. Abbiamo incluso nel confronto anche la versione da 115 watt del laptop RTX 5060, che lavora ben il 31% più velocemente. Le prestazioni grafiche rimangono completamente stabili sotto carico continuo, ma la GPU può consumare solo 25 watt in modalità batteria (-56% di prestazioni).
| 3DMark 11 Performance | 29308 punti | |
| 3DMark Fire Strike Score | 23134 punti | |
| 3DMark Time Spy Score | 9371 punti | |
| 3DMark Steel Nomad Score | 1932 punti | |
| 3DMark Steel Nomad Light Score | 9029 punti | |
Aiuto | ||
| Blender / v3.3 Classroom OPTIX/RTX | |
| HP ZBook Power 16 G11 A | |
| HP ZBook X G1i 16 | |
| Media NVIDIA RTX PRO 2000 Blackwell Generation Laptop (22 - 25, n=3) | |
| Lenovo ThinkPad P1 Gen 8 | |
| Lenovo ThinkPad P16v G3 21RS000DGE | |
| Media della classe Workstation (10 - 43, n=17, ultimi 2 anni) | |
| Blender / v3.3 Classroom CUDA | |
| HP ZBook Power 16 G11 A | |
| HP ZBook X G1i 16 | |
| Media NVIDIA RTX PRO 2000 Blackwell Generation Laptop (42 - 45, n=3) | |
| Lenovo ThinkPad P1 Gen 8 | |
| Lenovo ThinkPad P16v G3 21RS000DGE | |
| Media della classe Workstation (16 - 74, n=17, ultimi 2 anni) | |
| Blender / v3.3 Classroom CPU | |
| HP ZBook Power 16 G11 A | |
| Lenovo ThinkPad P1 Gen 8 | |
| Lenovo ThinkPad P16v G3 21RS000DGE | |
| Media NVIDIA RTX PRO 2000 Blackwell Generation Laptop (266 - 273, n=3) | |
| Lenovo ThinkPad P16s Gen 4 21RX000YGE | |
| HP ZBook X G1i 16 | |
| Media della classe Workstation (148 - 364, n=23, ultimi 2 anni) | |
* ... Meglio usare valori piccoli
| SPECviewperf 15 | |
| 3840x2160 Siemens NX 2406 (snx-05) | |
| Lenovo ThinkPad P16v G3 21RS000DGE | |
| 3840x2160 Unreal Engine 5.4.2 (unreal_engine-01) | |
| Lenovo ThinkPad P1 Gen 8 | |
| Lenovo ThinkPad P16v G3 21RS000DGE | |
| 3840x2160 Solidworks 2024 (solidworks-08) | |
| Lenovo ThinkPad P1 Gen 8 | |
| Lenovo ThinkPad P16v G3 21RS000DGE | |
| 3840x2160 Tuvok (medical-04) | |
| Lenovo ThinkPad P1 Gen 8 | |
| Lenovo ThinkPad P16v G3 21RS000DGE | |
| 3840x2160 Maya 2025 (maya-07) | |
| Lenovo ThinkPad P1 Gen 8 | |
| Lenovo ThinkPad P16v G3 21RS000DGE | |
| 3840x2160 Enscape 4.0 (enscape-01) | |
| Lenovo ThinkPad P1 Gen 8 | |
| Lenovo ThinkPad P16v G3 21RS000DGE | |
| 3840x2160 OpendTect (energy-04) | |
| Lenovo ThinkPad P1 Gen 8 | |
| Lenovo ThinkPad P16v G3 21RS000DGE | |
| 3840x2160 Creo 9 (creo-04) | |
| Lenovo ThinkPad P1 Gen 8 | |
| Lenovo ThinkPad P16v G3 21RS000DGE | |
| 3840x2160 Blender 3.6 (blender-01) | |
| Lenovo ThinkPad P1 Gen 8 | |
| Lenovo ThinkPad P16v G3 21RS000DGE | |
| 3840x2160 3ds Max 2023 (3dsmax-08) | |
| Lenovo ThinkPad P1 Gen 8 | |
| Lenovo ThinkPad P16v G3 21RS000DGE | |
Prestazioni di gioco
La RTX PRO 2000 è perfettamente in grado di gestire i giochi e i driver professionali non hanno rappresentato alcun problema. In linea di massima, la maggior parte dei titoli moderni può essere giocata senza problemi alla risoluzione nativa e con dettagli elevati/massimi. Abbiamo scritto di recente sui limiti di 8 GB di VRAM in un articolo separato articolo separato.
| Performance rating - Percent | |
| Media della classe Workstation | |
| Lenovo ThinkPad P1 Gen 8 | |
| HP ZBook X G1i 16 | |
| Lenovo ThinkPad P16v G3 21RS000DGE | |
| HP ZBook Power 16 G11 A | |
| Lenovo ThinkPad P16s Gen 4 21RX000YGE -1! | |
| Cyberpunk 2077 - 1920x1080 Ultra Preset (FSR off) | |
| Media della classe Workstation (21.5 - 152.4, n=23, ultimi 2 anni) | |
| Lenovo ThinkPad P1 Gen 8 | |
| HP ZBook X G1i 16 | |
| Lenovo ThinkPad P16v G3 21RS000DGE | |
| HP ZBook Power 16 G11 A | |
| Lenovo ThinkPad P16s Gen 4 21RX000YGE | |
| Baldur's Gate 3 - 1920x1080 Ultra Preset AA:T | |
| Lenovo ThinkPad P1 Gen 8 | |
| Media della classe Workstation (23.7 - 205, n=24, ultimi 2 anni) | |
| HP ZBook X G1i 16 | |
| Lenovo ThinkPad P16v G3 21RS000DGE | |
| HP ZBook Power 16 G11 A | |
| Lenovo ThinkPad P16s Gen 4 21RX000YGE | |
| GTA V - 1920x1080 Highest AA:4xMSAA + FX AF:16x | |
| Lenovo ThinkPad P1 Gen 8 | |
| Lenovo ThinkPad P16v G3 21RS000DGE | |
| HP ZBook X G1i 16 | |
| Media della classe Workstation (18.1 - 156.1, n=23, ultimi 2 anni) | |
| HP ZBook Power 16 G11 A | |
| Lenovo ThinkPad P16s Gen 4 21RX000YGE | |
| Final Fantasy XV Benchmark - 1920x1080 High Quality | |
| Lenovo ThinkPad P1 Gen 8 | |
| Media della classe Workstation (26.4 - 197.6, n=23, ultimi 2 anni) | |
| HP ZBook X G1i 16 | |
| Lenovo ThinkPad P16v G3 21RS000DGE | |
| HP ZBook Power 16 G11 A | |
| Lenovo ThinkPad P16s Gen 4 21RX000YGE | |
| Strange Brigade - 1920x1080 ultra AA:ultra AF:16 | |
| Media della classe Workstation (93.2 - 418, n=17, ultimi 2 anni) | |
| Lenovo ThinkPad P1 Gen 8 | |
| HP ZBook X G1i 16 | |
| Lenovo ThinkPad P16v G3 21RS000DGE | |
| HP ZBook Power 16 G11 A | |
| Dota 2 Reborn - 1920x1080 ultra (3/3) best looking | |
| Lenovo ThinkPad P16v G3 21RS000DGE | |
| HP ZBook X G1i 16 | |
| Media della classe Workstation (50.7 - 178.4, n=23, ultimi 2 anni) | |
| Lenovo ThinkPad P1 Gen 8 | |
| HP ZBook Power 16 G11 A | |
| Lenovo ThinkPad P16s Gen 4 21RX000YGE | |
Cyberpunk 2077 grafico FPS ultra
| basso | medio | alto | ultra | |
|---|---|---|---|---|
| GTA V (2015) | 174.7 | 117.7 | ||
| Dota 2 Reborn (2015) | 174.2 | 159.8 | 151.6 | 142.8 |
| Final Fantasy XV Benchmark (2018) | 199.5 | 127.3 | 98.1 | |
| X-Plane 11.11 (2018) | 105.4 | 95.2 | 78.8 | |
| Strange Brigade (2018) | 469 | 241 | 194.1 | 167.8 |
| Baldur's Gate 3 (2023) | 121.3 | 96 | 81.4 | 81.2 |
| Cyberpunk 2077 (2023) | 119.5 | 93.5 | 79.1 | 70.1 |
| F1 24 (2024) | 200 | 194.8 | 165.5 | 53.3 |
Emissioni ed energia
Emissioni di rumore

L'unità di raffreddamento rimane molto silenziosa durante le attività quotidiane (max. 29,2 dB(A)), ma diventa sensibilmente più rumorosa quando i componenti sono sottoposti a maggiori sforzi. In modalità Best Performance, abbiamo misurato 47,1 dB(A) durante il gioco e lo stress test(Bilanciato: 43,2 dB(A), Best Energy Efficiency: 39,9 dB(A), batteria: 37 dB(A)). Il coil whine non si è verificato sul dispositivo di prova.
Rumorosità
| Idle |
| 25.9 / 25.9 / 29.2 dB(A) |
| Sotto carico |
| 37.5 / 47.1 dB(A) |
 | ||
30 dB silenzioso 40 dB(A) udibile 50 dB(A) rumoroso |
||
min: | ||
| Lenovo ThinkPad P16v G3 21RS000DGE Ultra 7 255H, RTX PRO 2000 Blackwell Generation Laptop | Lenovo ThinkPad P1 Gen 8 Ultra 7 255H, RTX PRO 2000 Blackwell Generation Laptop | HP ZBook X G1i 16 Ultra 7 265H, RTX PRO 2000 Blackwell Generation Laptop | HP ZBook Power 16 G11 A R7 8845HS, RTX 2000 Ada Generation Laptop | Lenovo ThinkPad P16s Gen 4 21RX000YGE Ryzen AI 9 HX PRO 370, Radeon 890M | |
|---|---|---|---|---|---|
| Noise | 13% | 7% | 12% | -3% | |
| off /ambiente * (dB) | 25.9 | 23.1 11% | 23.7 8% | 23.5 9% | 25.9 -0% |
| Idle Minimum * (dB) | 25.9 | 23.1 11% | 23.7 8% | 23.8 8% | 25.9 -0% |
| Idle Average * (dB) | 25.9 | 23.1 11% | 23.7 8% | 24.2 7% | 25.9 -0% |
| Idle Maximum * (dB) | 29.2 | 23.1 21% | 23.7 19% | 24.2 17% | 28.5 2% |
| Load Average * (dB) | 37.5 | 27.3 27% | 32.7 13% | 25.4 32% | 42.9 -14% |
| Cyberpunk 2077 ultra * (dB) | 47.1 | 50.9 -8% | 43 9% | 48.7 -3% | |
| Load Maximum * (dB) | 47.1 | 47.9 -2% | 48 -2% | 45 4% | 48.5 -3% |
* ... Meglio usare valori piccoli
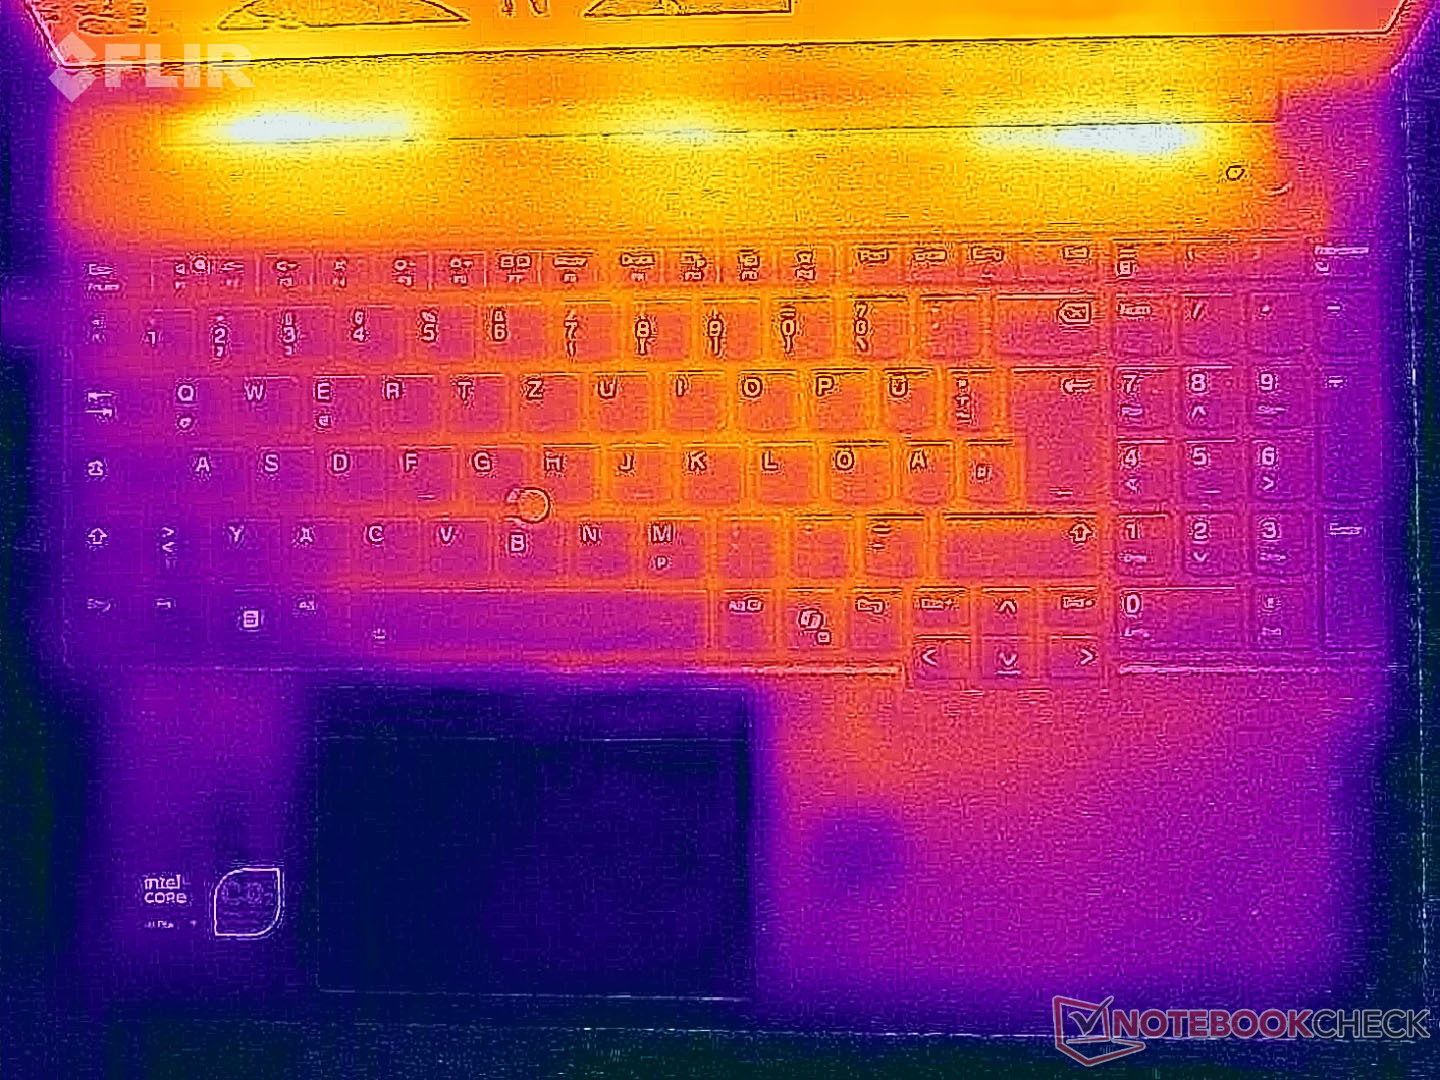
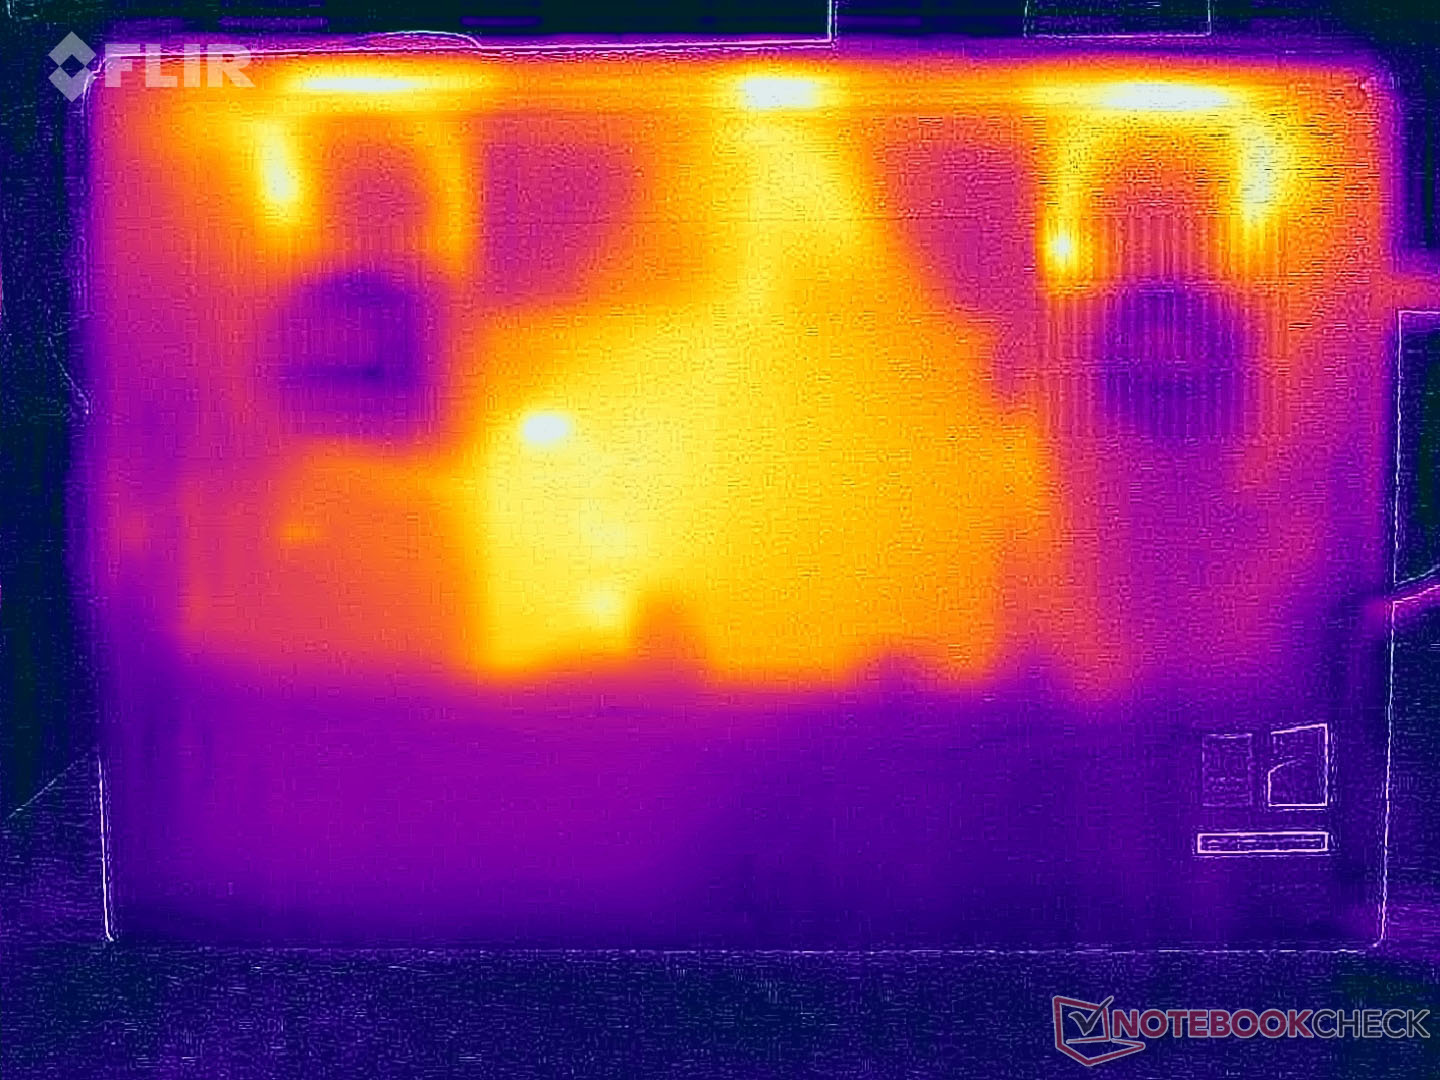
Temperatura
Le temperature superficiali rimangono del tutto innocue anche nel test di stress, poiché abbiamo misurato solo poco meno di 45 °C (113 °F) in un punto del lato inferiore; gli altri punti di misurazione rimangono sensibilmente più freddi. Nel test di stress, il processore si è stabilizzato a ~34 watt (81 °C/177,8 °F) e la GPU a ~55 watt (76 °C/168,8 °F). Non si tratta di valori particolarmente elevati, considerando l'involucro di grandi dimensioni.

(+) La temperatura massima sul lato superiore è di 39.9 °C / 104 F, rispetto alla media di 38.2 °C / 101 F, che varia da 22.2 a 69.8 °C per questa classe Workstation.
(±) Il lato inferiore si riscalda fino ad un massimo di 44.8 °C / 113 F, rispetto alla media di 41.1 °C / 106 F
(+) In idle, la temperatura media del lato superiore è di 23.5 °C / 74 F, rispetto alla media deld ispositivo di 32 °C / 90 F.
(±) 3: The average temperature for the upper side is 33 °C / 91 F, compared to the average of 32 °C / 90 F for the class Workstation.
(+) I poggiapolsi e il touchpad raggiungono la temperatura massima della pelle (32.1 °C / 89.8 F) e quindi non sono caldi.
(-) La temperatura media della zona del palmo della mano di dispositivi simili e'stata di 27.8 °C / 82 F (-4.3 °C / -7.8 F).
| Lenovo ThinkPad P16v G3 21RS000DGE Ultra 7 255H, RTX PRO 2000 Blackwell Generation Laptop | Lenovo ThinkPad P1 Gen 8 Ultra 7 255H, RTX PRO 2000 Blackwell Generation Laptop | HP ZBook X G1i 16 Ultra 7 265H, RTX PRO 2000 Blackwell Generation Laptop | HP ZBook Power 16 G11 A R7 8845HS, RTX 2000 Ada Generation Laptop | Lenovo ThinkPad P16s Gen 4 21RX000YGE Ryzen AI 9 HX PRO 370, Radeon 890M | |
|---|---|---|---|---|---|
| Heat | -10% | -8% | -2% | -37% | |
| Maximum Upper Side * (°C) | 39.9 | 45 -13% | 36 10% | 40.6 -2% | 50.6 -27% |
| Maximum Bottom * (°C) | 44.8 | 33 26% | 39.4 12% | 40.6 9% | 54.3 -21% |
| Idle Upper Side * (°C) | 24 | 30.6 -28% | 30.4 -27% | 26 -8% | 35.3 -47% |
| Idle Bottom * (°C) | 25 | 31.6 -26% | 31.8 -27% | 26.6 -6% | 38.5 -54% |
* ... Meglio usare valori piccoli
Altoparlanti
Gli altoparlanti stereo sono poco convincenti; il ThinkPad P1 16 G8 ha un chiaro vantaggio.
Lenovo ThinkPad P16v G3 21RS000DGE analisi audio
(±) | potenza degli altiparlanti media ma buona (78.2 dB)
Bassi 100 - 315 Hz
(±) | bassi ridotti - in media 10.7% inferiori alla media
(±) | la linearità dei bassi è media (10% delta rispetto alla precedente frequenza)
Medi 400 - 2000 Hz
(±) | medi elevati - circa 7.2% superiore alla media
(+) | medi lineari (5.3% delta rispetto alla precedente frequenza)
Alti 2 - 16 kHz
(+) | Alti bilanciati - appena 1.3% dalla media
(+) | alti lineari (3.8% delta rispetto alla precedente frequenza)
Nel complesso 100 - 16.000 Hz
(±) | la linearità complessiva del suono è media (15.6% di differenza rispetto alla media
Rispetto alla stessa classe
» 35% di tutti i dispositivi testati in questa classe è stato migliore, 11% simile, 54% peggiore
» Il migliore ha avuto un delta di 7%, medio di 17%, peggiore di 35%
Rispetto a tutti i dispositivi testati
» 23% di tutti i dispositivi testati in questa classe è stato migliore, 5% similare, 72% peggiore
» Il migliore ha avuto un delta di 4%, medio di 23%, peggiore di 134%
Lenovo ThinkPad P1 Gen 8 analisi audio
(+) | gli altoparlanti sono relativamente potenti (87.5 dB)
Bassi 100 - 315 Hz
(±) | bassi ridotti - in media 9.8% inferiori alla media
(±) | la linearità dei bassi è media (11.2% delta rispetto alla precedente frequenza)
Medi 400 - 2000 Hz
(+) | medi bilanciati - solo only 2.9% rispetto alla media
(+) | medi lineari (2.8% delta rispetto alla precedente frequenza)
Alti 2 - 16 kHz
(+) | Alti bilanciati - appena 3% dalla media
(+) | alti lineari (4.7% delta rispetto alla precedente frequenza)
Nel complesso 100 - 16.000 Hz
(+) | suono nel complesso lineare (8.3% differenza dalla media)
Rispetto alla stessa classe
» 1% di tutti i dispositivi testati in questa classe è stato migliore, 1% simile, 97% peggiore
» Il migliore ha avuto un delta di 7%, medio di 17%, peggiore di 35%
Rispetto a tutti i dispositivi testati
» 2% di tutti i dispositivi testati in questa classe è stato migliore, 1% similare, 97% peggiore
» Il migliore ha avuto un delta di 4%, medio di 23%, peggiore di 134%
HP ZBook X G1i 16 analisi audio
(+) | gli altoparlanti sono relativamente potenti (84 dB)
Bassi 100 - 315 Hz
(-) | quasi nessun basso - in media 28% inferiori alla media
(±) | la linearità dei bassi è media (8.8% delta rispetto alla precedente frequenza)
Medi 400 - 2000 Hz
(+) | medi bilanciati - solo only 1.9% rispetto alla media
(+) | medi lineari (6.1% delta rispetto alla precedente frequenza)
Alti 2 - 16 kHz
(+) | Alti bilanciati - appena 2.9% dalla media
(+) | alti lineari (5.1% delta rispetto alla precedente frequenza)
Nel complesso 100 - 16.000 Hz
(±) | la linearità complessiva del suono è media (15.6% di differenza rispetto alla media
Rispetto alla stessa classe
» 35% di tutti i dispositivi testati in questa classe è stato migliore, 11% simile, 54% peggiore
» Il migliore ha avuto un delta di 7%, medio di 17%, peggiore di 35%
Rispetto a tutti i dispositivi testati
» 23% di tutti i dispositivi testati in questa classe è stato migliore, 5% similare, 72% peggiore
» Il migliore ha avuto un delta di 4%, medio di 23%, peggiore di 134%
HP ZBook Power 16 G11 A analisi audio
(+) | gli altoparlanti sono relativamente potenti (87.9 dB)
Bassi 100 - 315 Hz
(-) | quasi nessun basso - in media 28.1% inferiori alla media
(±) | la linearità dei bassi è media (9% delta rispetto alla precedente frequenza)
Medi 400 - 2000 Hz
(+) | medi bilanciati - solo only 1.9% rispetto alla media
(+) | medi lineari (4.8% delta rispetto alla precedente frequenza)
Alti 2 - 16 kHz
(+) | Alti bilanciati - appena 3.6% dalla media
(+) | alti lineari (2.4% delta rispetto alla precedente frequenza)
Nel complesso 100 - 16.000 Hz
(±) | la linearità complessiva del suono è media (15.1% di differenza rispetto alla media
Rispetto alla stessa classe
» 33% di tutti i dispositivi testati in questa classe è stato migliore, 7% simile, 60% peggiore
» Il migliore ha avuto un delta di 7%, medio di 17%, peggiore di 35%
Rispetto a tutti i dispositivi testati
» 21% di tutti i dispositivi testati in questa classe è stato migliore, 4% similare, 75% peggiore
» Il migliore ha avuto un delta di 4%, medio di 23%, peggiore di 134%
Lenovo ThinkPad P16s Gen 4 21RX000YGE analisi audio
(±) | potenza degli altiparlanti media ma buona (79.6 dB)
Bassi 100 - 315 Hz
(-) | quasi nessun basso - in media 15.7% inferiori alla media
(±) | la linearità dei bassi è media (11.9% delta rispetto alla precedente frequenza)
Medi 400 - 2000 Hz
(±) | medi elevati - circa 5.8% superiore alla media
(+) | medi lineari (5.9% delta rispetto alla precedente frequenza)
Alti 2 - 16 kHz
(+) | Alti bilanciati - appena 1.5% dalla media
(+) | alti lineari (4.6% delta rispetto alla precedente frequenza)
Nel complesso 100 - 16.000 Hz
(±) | la linearità complessiva del suono è media (16.2% di differenza rispetto alla media
Rispetto alla stessa classe
» 43% di tutti i dispositivi testati in questa classe è stato migliore, 7% simile, 50% peggiore
» Il migliore ha avuto un delta di 7%, medio di 17%, peggiore di 35%
Rispetto a tutti i dispositivi testati
» 26% di tutti i dispositivi testati in questa classe è stato migliore, 6% similare, 68% peggiore
» Il migliore ha avuto un delta di 4%, medio di 23%, peggiore di 134%
Consumo di energia

Il consumo massimo in modalità idle è di 12,7 watt, che è relativamente alto considerando la bassa risoluzione del display. Abbiamo misurato brevemente ~140 watt nel test di stress, ma questo si è rapidamente stabilizzato a ~120 watt. L'alimentatore da 140 watt è quindi sufficientemente dimensionato.
| Off / Standby | |
| Idle | |
| Sotto carico |
|
Leggenda:
min: | |
| Lenovo ThinkPad P16v G3 21RS000DGE Ultra 7 255H, RTX PRO 2000 Blackwell Generation Laptop, Samsung PM9E1 1 TB MZVLC1T0HFLU, IPS, 1920x1200, 16" | Lenovo ThinkPad P1 Gen 8 Ultra 7 255H, RTX PRO 2000 Blackwell Generation Laptop, Samsung PM9E1 1 TB MZVLC1T0HFLU, Tandem OLED, 3200x2000, 16" | HP ZBook X G1i 16 Ultra 7 265H, RTX PRO 2000 Blackwell Generation Laptop, Samsung PM9A1 MZVL22T0HBLB, IPS, 2560x1600, 16" | HP ZBook Power 16 G11 A R7 8845HS, RTX 2000 Ada Generation Laptop, Samsung PM9A1 MZVL22T0HBLB, IPS, 2560x1600, 16" | Lenovo ThinkPad P16s Gen 4 21RX000YGE Ryzen AI 9 HX PRO 370, Radeon 890M, Micron 3500 1TB MTFDKBA1T0TGD, IPS LED, 1920x1200, 16" | Media NVIDIA RTX PRO 2000 Blackwell Generation Laptop | Media della classe Workstation | |
|---|---|---|---|---|---|---|---|
| Power Consumption | -50% | 12% | 14% | 41% | -18% | -36% | |
| Idle Minimum * (Watt) | 4.8 | 15.4 -221% | 4.1 15% | 4.6 4% | 3.9 19% | 8.1 ? -69% | 9.11 ? -90% |
| Idle Average * (Watt) | 12.3 | 16.5 -34% | 9 27% | 10 19% | 8.3 33% | 12.6 ? -2% | 13.8 ? -12% |
| Idle Maximum * (Watt) | 12.7 | 23.1 -82% | 9.4 26% | 10.6 17% | 8.7 31% | 15.1 ? -19% | 17.9 ? -41% |
| Load Average * (Watt) | 89.6 | 86.6 3% | 86.7 3% | 60.9 32% | 51.6 42% | 87.6 ? 2% | 96 ? -7% |
| Cyberpunk 2077 ultra external monitor * (Watt) | 115.8 | 121.8 -5% | 102 12% | 92.8 20% | 54.6 53% | ||
| Cyberpunk 2077 ultra * (Watt) | 115.1 | 123.1 -7% | 106.1 8% | 96.8 16% | 55.4 52% | ||
| Load Maximum * (Watt) | 139.5 | 143.6 -3% | 152.9 -10% | 154.8 -11% | 63.7 54% | 145.3 ? -4% | 180.3 ? -29% |
* ... Meglio usare valori piccoli
Consumo energetico Cyberpunk / Stress test
Consumo energetico con monitor esterno
Durata della batteria
Con la batteria da 90 Wh, abbiamo misurato 14:11 ore (150 cd/m²) e 8:51 ore (piena luminosità) nel test WLAN, che sono buoni risultati.

| Lenovo ThinkPad P16v G3 21RS000DGE Ultra 7 255H, RTX PRO 2000 Blackwell Generation Laptop, 90 Wh | Lenovo ThinkPad P1 Gen 8 Ultra 7 255H, RTX PRO 2000 Blackwell Generation Laptop, 90 Wh | HP ZBook X G1i 16 Ultra 7 265H, RTX PRO 2000 Blackwell Generation Laptop, 83 Wh | HP ZBook Power 16 G11 A R7 8845HS, RTX 2000 Ada Generation Laptop, 83 Wh | Lenovo ThinkPad P16s Gen 4 21RX000YGE Ryzen AI 9 HX PRO 370, Radeon 890M, 86 Wh | Media della classe Workstation | |
|---|---|---|---|---|---|---|
| Battery Runtime | -61% | -12% | -32% | -2% | -30% | |
| WiFi Websurfing (h) | 14.2 | 5.5 -61% | 12.5 -12% | 9.7 -32% | 13.9 -2% | 8.55 ? -40% |
| WiFi Websurfing max. Brightness (h) | 8.9 | 7.17 ? -19% |
Valutazione complessiva di Notebookcheck
Lenovo ThinkPad P16v G3 21RS000DGE
- 01/14/2026 v8
Andreas Osthoff
 Total Sustainability Score:
 Possibili alternative a confronto
Immagine | Modello | Prezzo | Peso | Altezza | Schermo |
|---|---|---|---|---|---|
1. 87.3%  | Lenovo ThinkPad P16v G3 21RS000DGE Intel Core Ultra 7 255H ⎘ NVIDIA RTX PRO 2000 Blackwell Generation Laptop ⎘ 32 GB Memoria, 1024 GB SSD | Amazon: Prezzo di listino: 2825€ | 2.2 kg | 19.6 mm | 16.00" 1920x1200 IPS |
2. 91.6%  | Lenovo ThinkPad P1 Gen 8 Intel Core Ultra 7 255H ⎘ NVIDIA RTX PRO 2000 Blackwell Generation Laptop ⎘ 32 GB Memoria, 1024 GB SSD | Amazon: Prezzo di listino: 2000 USD | 1.9 kg | 20.6 mm | 16.00" 3200x2000 236 PPI Tandem OLED |
3. 87.4%  | HP ZBook X G1i 16 Intel Core Ultra 7 265H ⎘ NVIDIA RTX PRO 2000 Blackwell Generation Laptop ⎘ 64 GB Memoria, 2048 GB SSD | Amazon: Prezzo di listino: 2700 USD | 2.2 kg | 23 mm | 16.00" 2560x1600 189 PPI IPS |
4. 85.4%  | HP ZBook Power 16 G11 A AMD Ryzen 7 8845HS ⎘ NVIDIA RTX 2000 Ada Generation Laptop ⎘ 64 GB Memoria, 2048 GB SSD | Amazon: Prezzo di listino: 2100 USD | 2.2 kg | 22.9 mm | 16.00" 2560x1600 189 PPI IPS |
5. 82%  | Lenovo ThinkPad P16s Gen 4 21RX000YGE AMD Ryzen AI 9 HX PRO 370 ⎘ AMD Radeon 890M ⎘ 64 GB Memoria, 1024 GB SSD | Amazon: Prezzo di listino: 2440 Euro | 2 kg | 23 mm | 16.00" 1920x1200 142 PPI IPS LED |
Transparency
La selezione dei dispositivi da recensire viene effettuata dalla nostra redazione. Il campione di prova è stato fornito all'autore come prestito dal produttore o dal rivenditore ai fini di questa recensione. L'istituto di credito non ha avuto alcuna influenza su questa recensione, né il produttore ne ha ricevuto una copia prima della pubblicazione. Non vi era alcun obbligo di pubblicare questa recensione. In quanto società mediatica indipendente, Notebookcheck non è soggetta all'autorità di produttori, rivenditori o editori.
Ecco come Notebookcheck esegue i test
Ogni anno, Notebookcheck esamina in modo indipendente centinaia di laptop e smartphone utilizzando procedure standardizzate per garantire che tutti i risultati siano comparabili. Da circa 20 anni sviluppiamo continuamente i nostri metodi di prova e nel frattempo stabiliamo gli standard di settore. Nei nostri laboratori di prova, tecnici ed editori esperti utilizzano apparecchiature di misurazione di alta qualità. Questi test comportano un processo di validazione in più fasi. Il nostro complesso sistema di valutazione si basa su centinaia di misurazioni e parametri di riferimento ben fondati, che mantengono l'obiettività.