

Verdetto - Prestazioni CPU deboli, prestazioni di gioco irrilevanti
È fastidioso che le prestazioni della CPU del Vector 17 si riducano drasticamente nel test di resistenza, soprattutto perché il Vector 16 è un'azienda che ha un'ottima reputazione Vector 16 si comporta in modo coerente con una CPU più debole. Le prestazioni di gioco puro sono mediocri al massimo, ma abbastanza costanti. Purtroppo, il Vector 17 è piuttosto rumoroso.
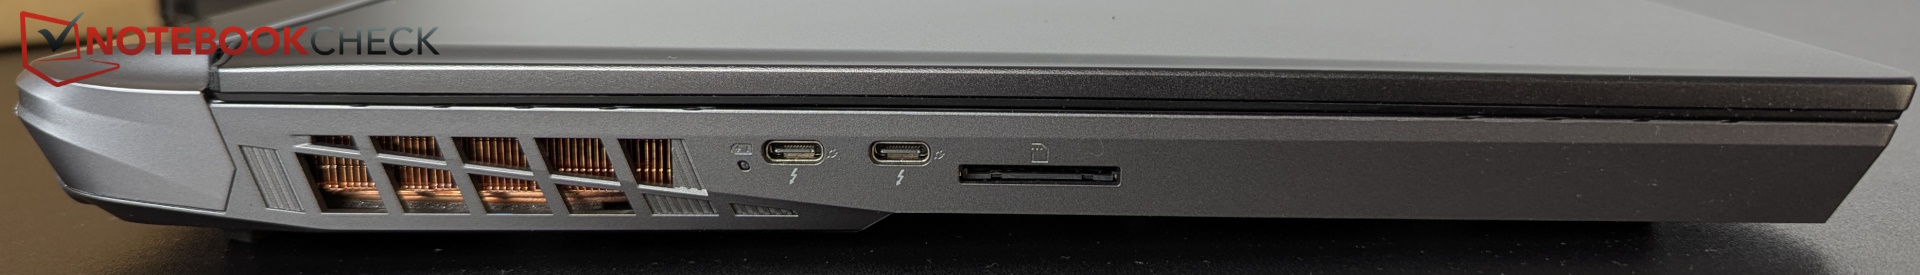
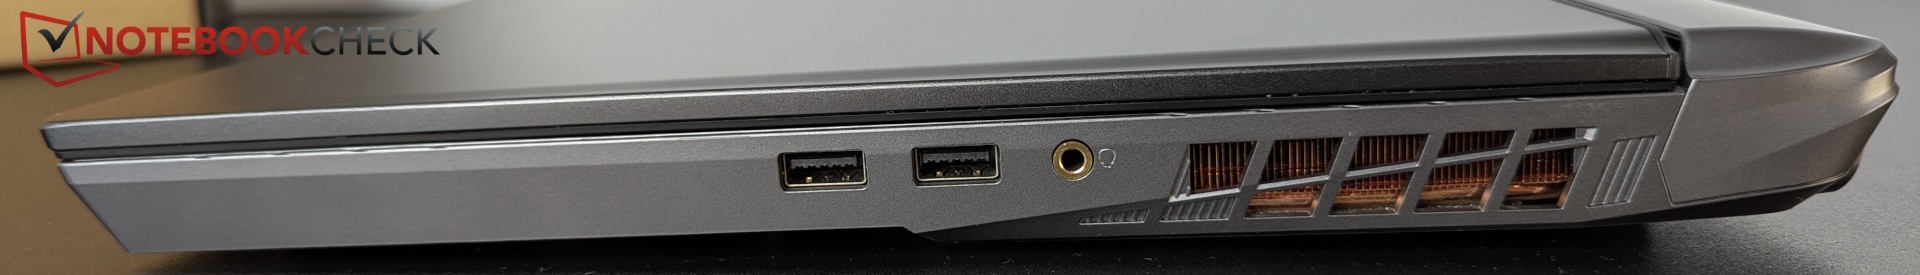
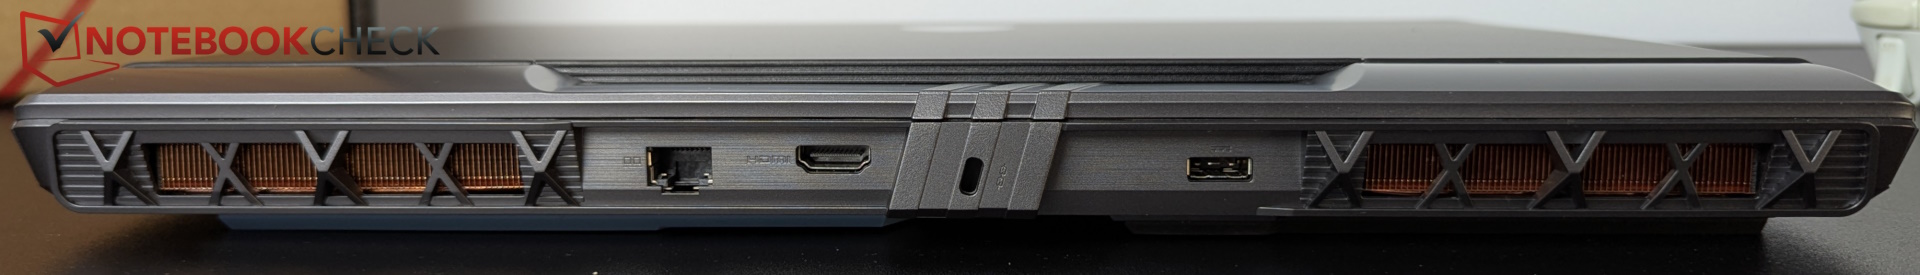
Il display lascia un'impressione ambivalente: Ottiene un buon punteggio con una luminosità decente e lo spazio colore P3, ma perde un po' di simpatia a causa del valore del nero troppo alto. D'altra parte, la dotazione con doppia Thunderbolt 5, lettore SD completo e Wi-Fi 7 lascia un'impressione positiva.
Rimane un portatile da gioco medio-buono che, a parte le sue caratteristiche, non si distingue dalla massa. Per circa lo stesso prezzo, può trovare anche il modello Legion Pro 7i Gen 10 con la stessa GPU, che ci ha impressionato molto di più nel test.
Pro
Contro
Prezzo e disponibilità
Il Vector 17 con RTX 5080 costa normalmente 3.499 Euro (~$4066). È stato appena ridotto a 3.099 Euro (~$3602) su Amazon.
- $20.99Vaxson 2-Pack Clear Protector Film, compatible with MSI Vector 17 HX AI A2XW A2XWJG A2XWIG A2XWHG 17" Laptop TPU Keyboard Touchpad Trackpad Guard [ Not Screen Protectors ]
- $20.98Puccy 2 Pack Film Protector, compatible with MSI Vector 17 HX AI A2XW A2XWJG A2XWIG A2XWHG 17" Laptop TPU Keyboard TouchPad Trackpad Guard Cover (Not Tempered Glass Screen Protectors)
Sommario
- Verdetto - Prestazioni CPU deboli, prestazioni di gioco irrilevanti
- Specifiche
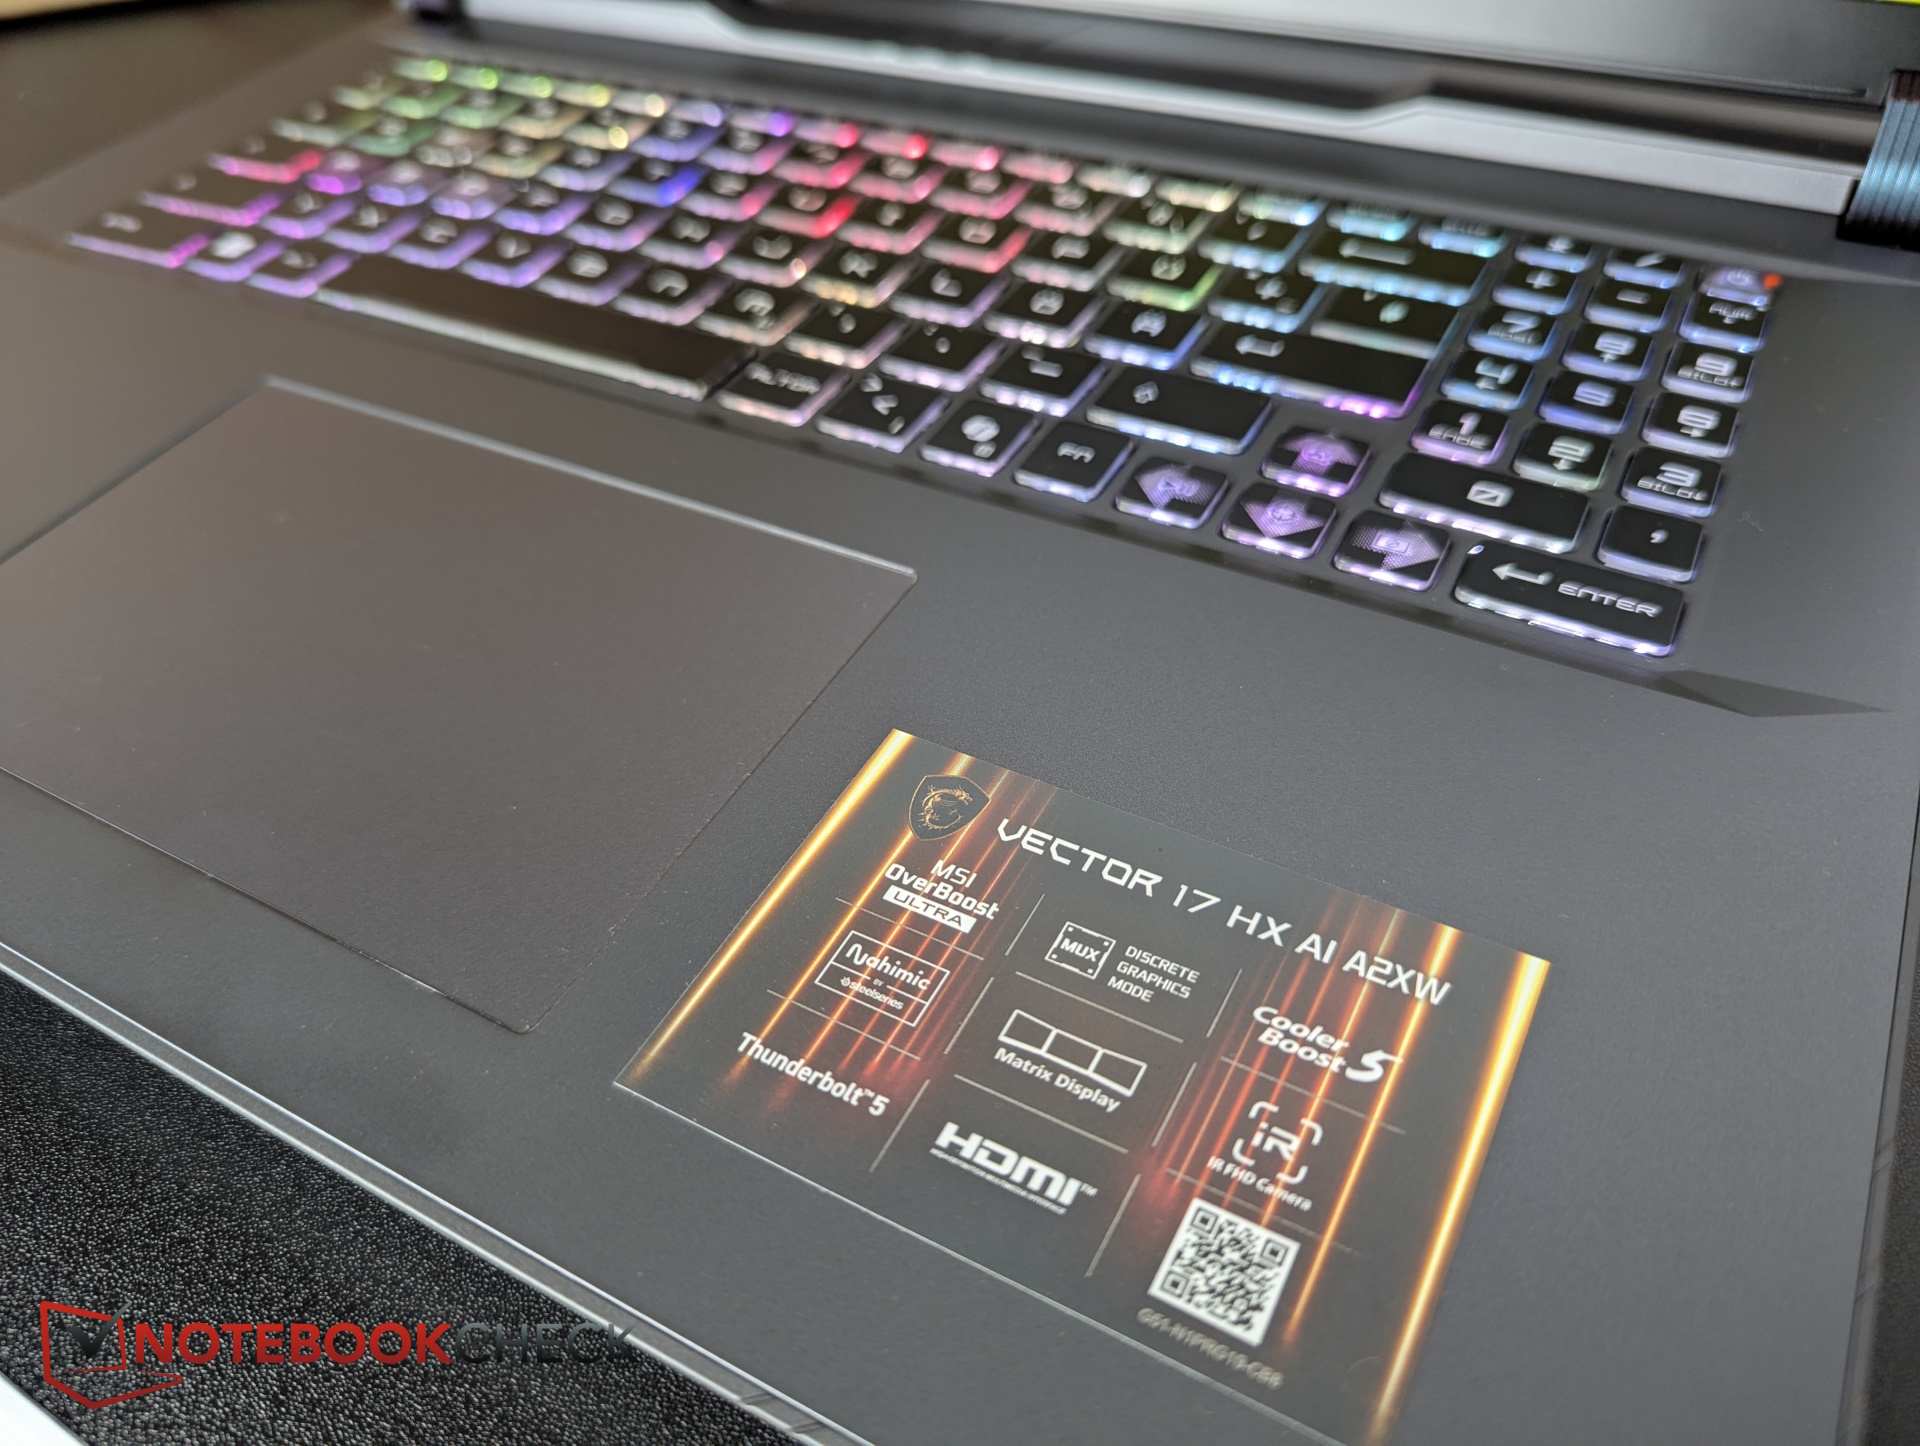
- Caso e caratteristiche - Massiccio come un Alienware
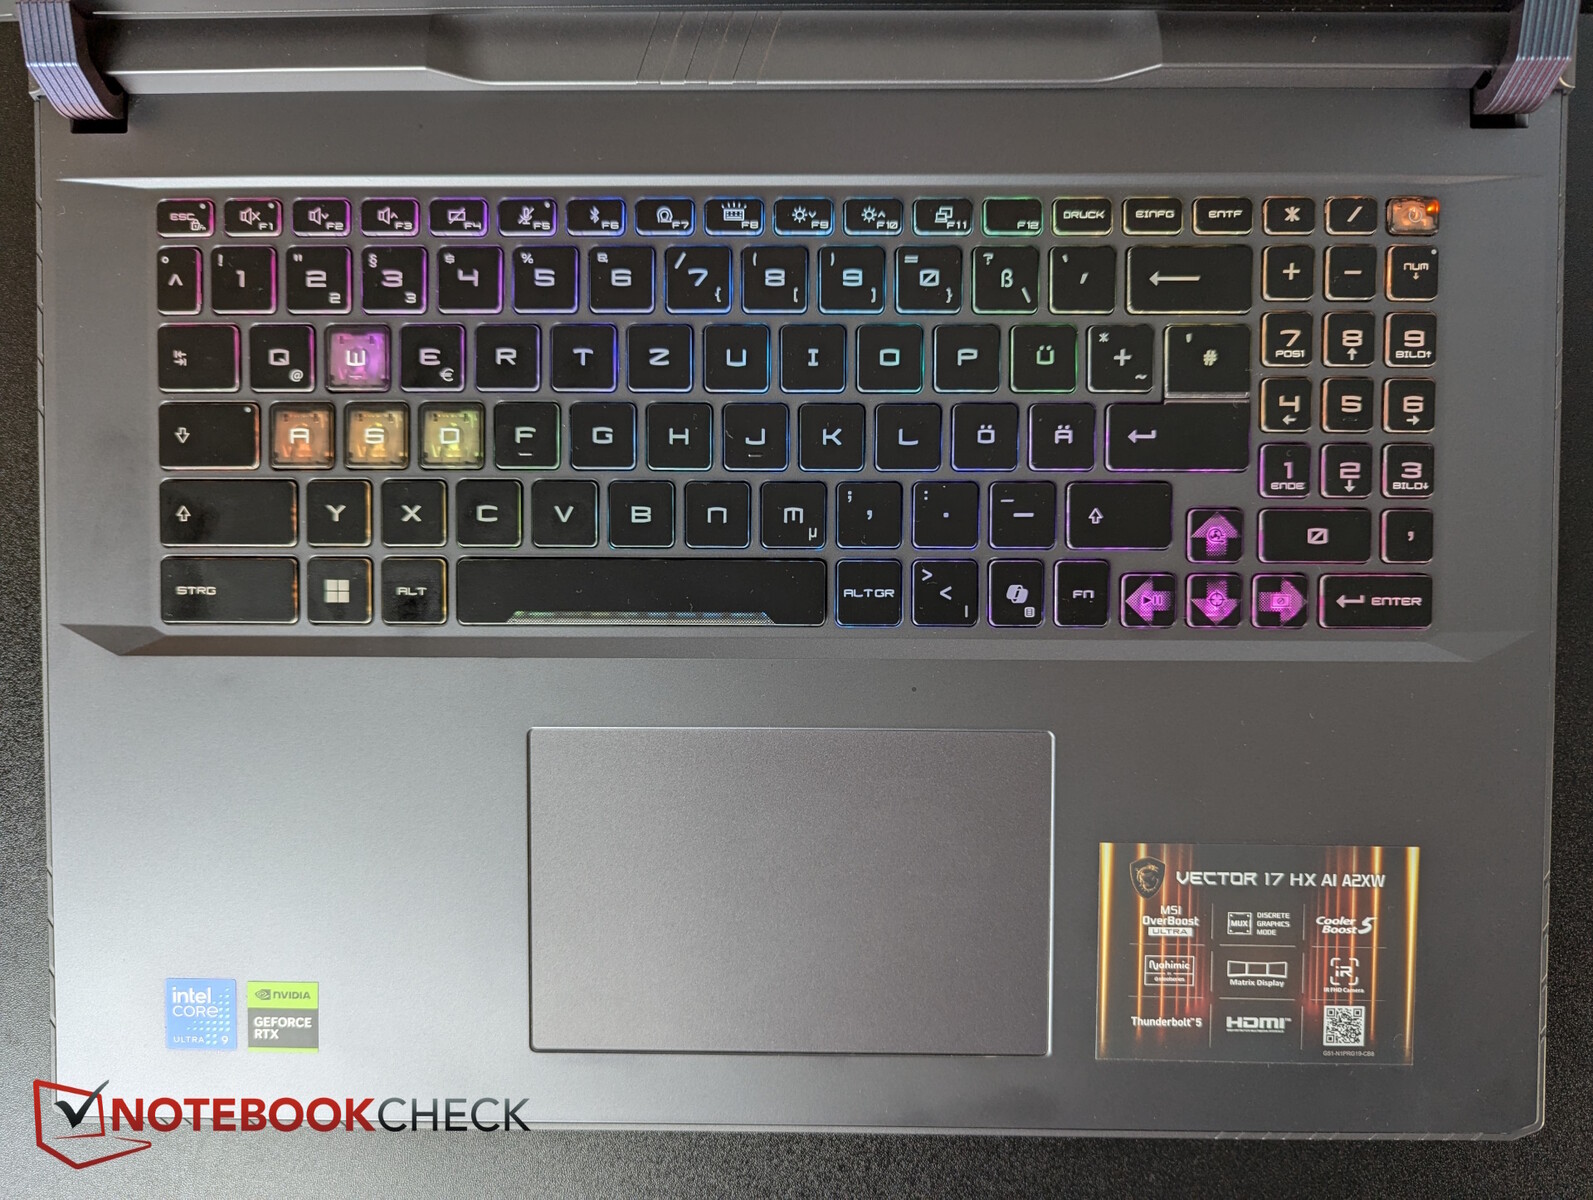
- Dispositivi di input - Questo layout MSI!
- Display - IPS QHD+ con 470 nits
- Prestazioni - Crollo della CPU sotto carico continuo
- Emissioni ed energia - Fino a 60 dB(A) è abbastanza rumoroso in confronto
- Valutazione complessiva di Notebookcheck
- Confronto tra le possibili alternative
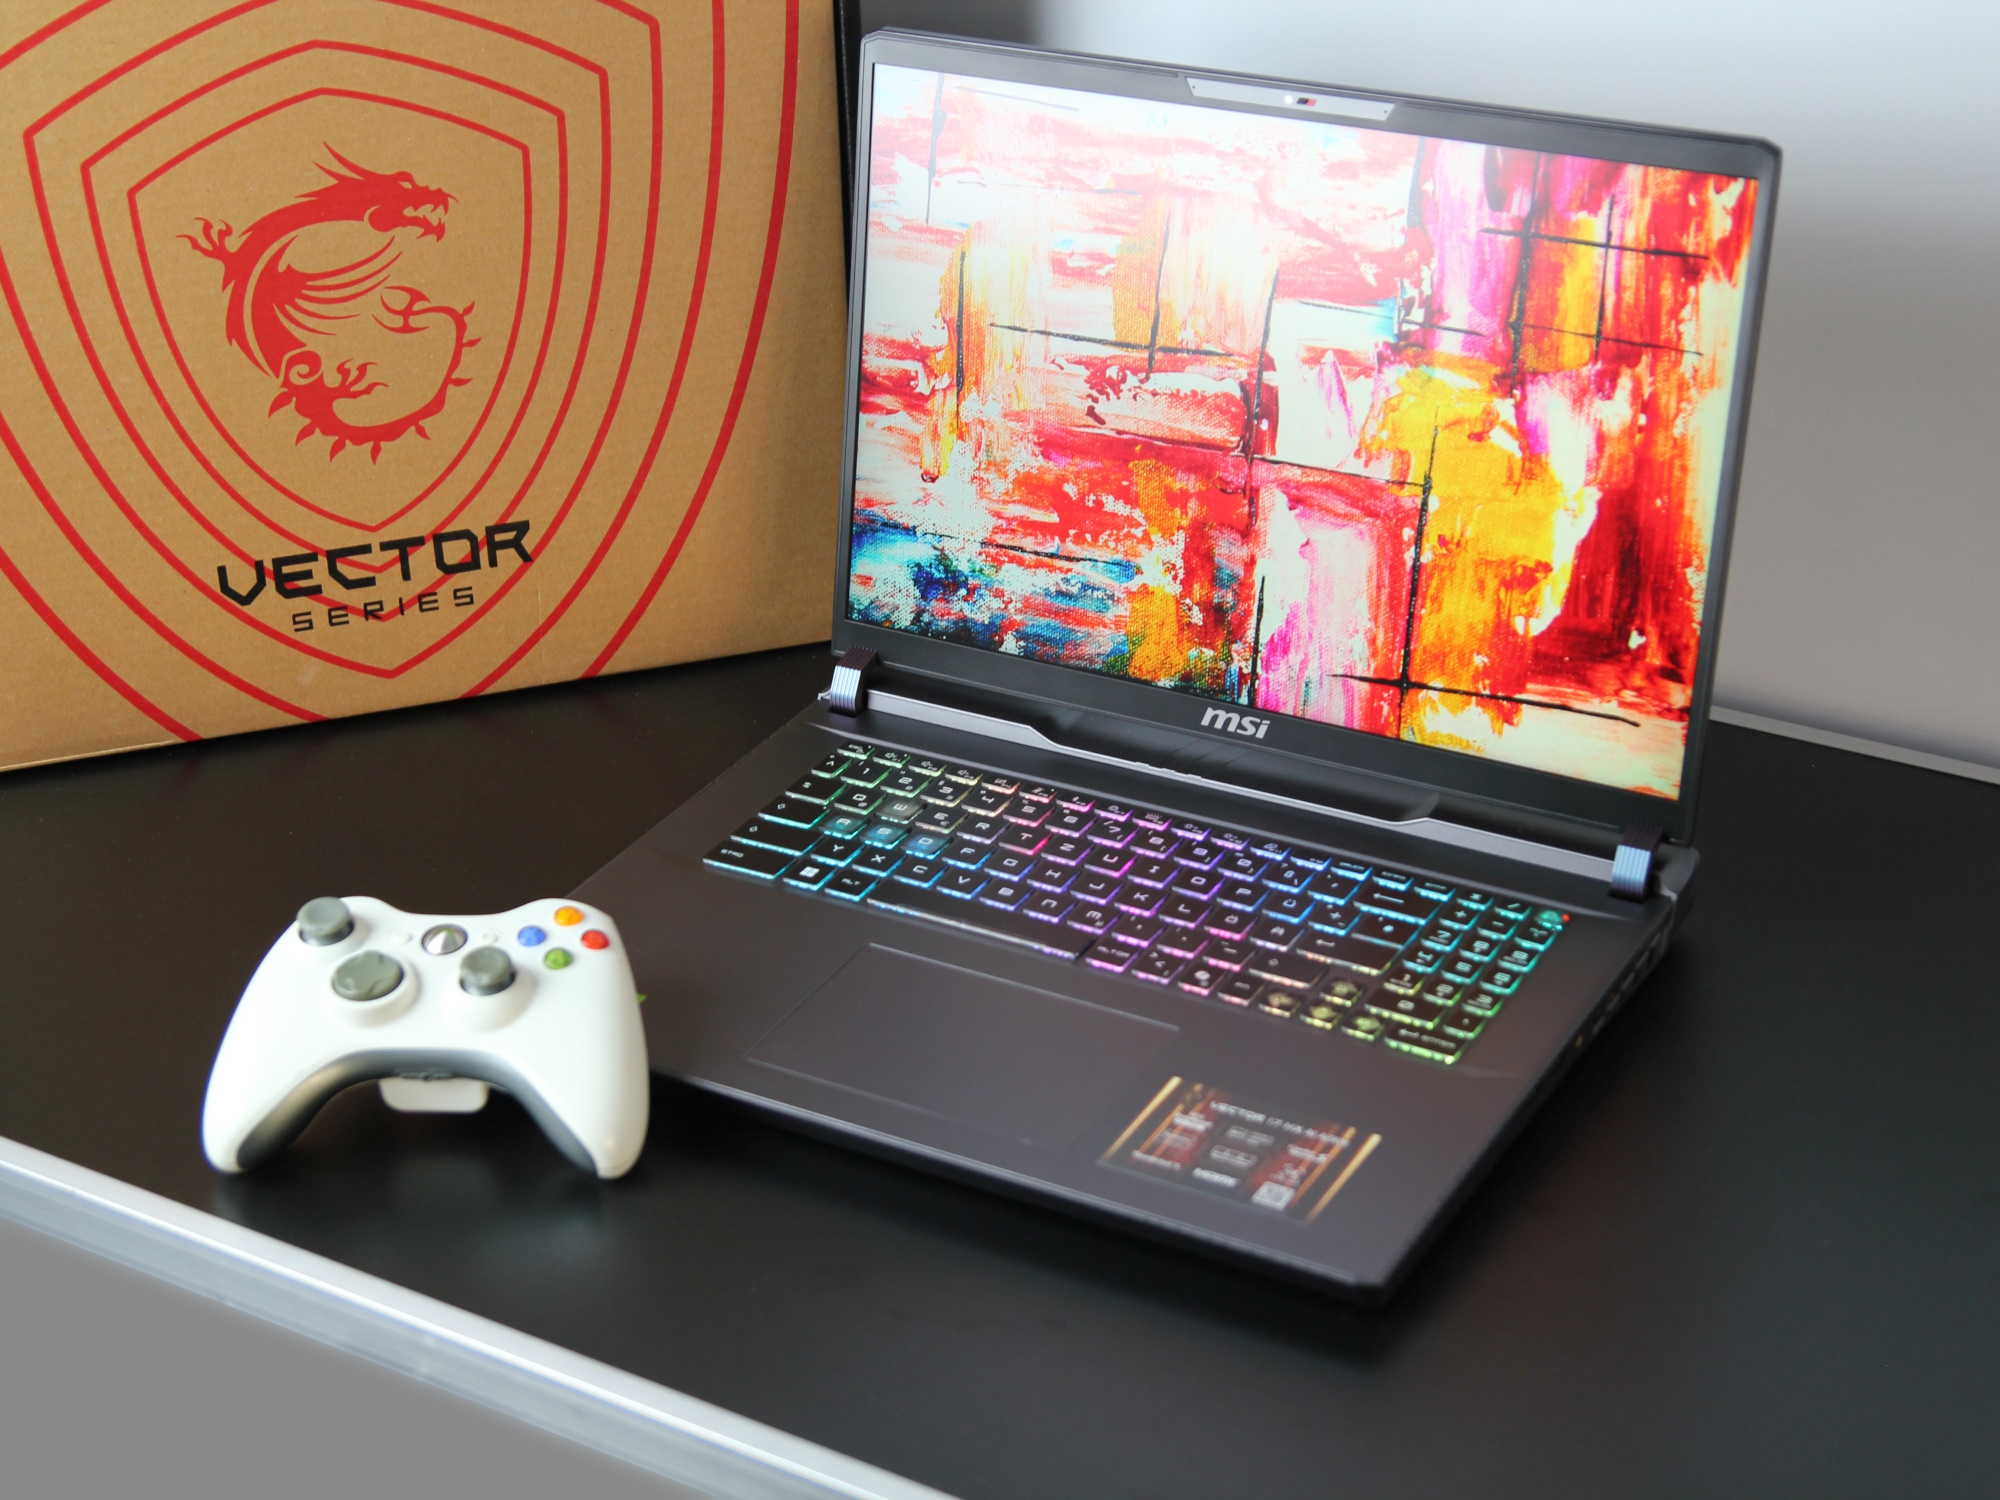
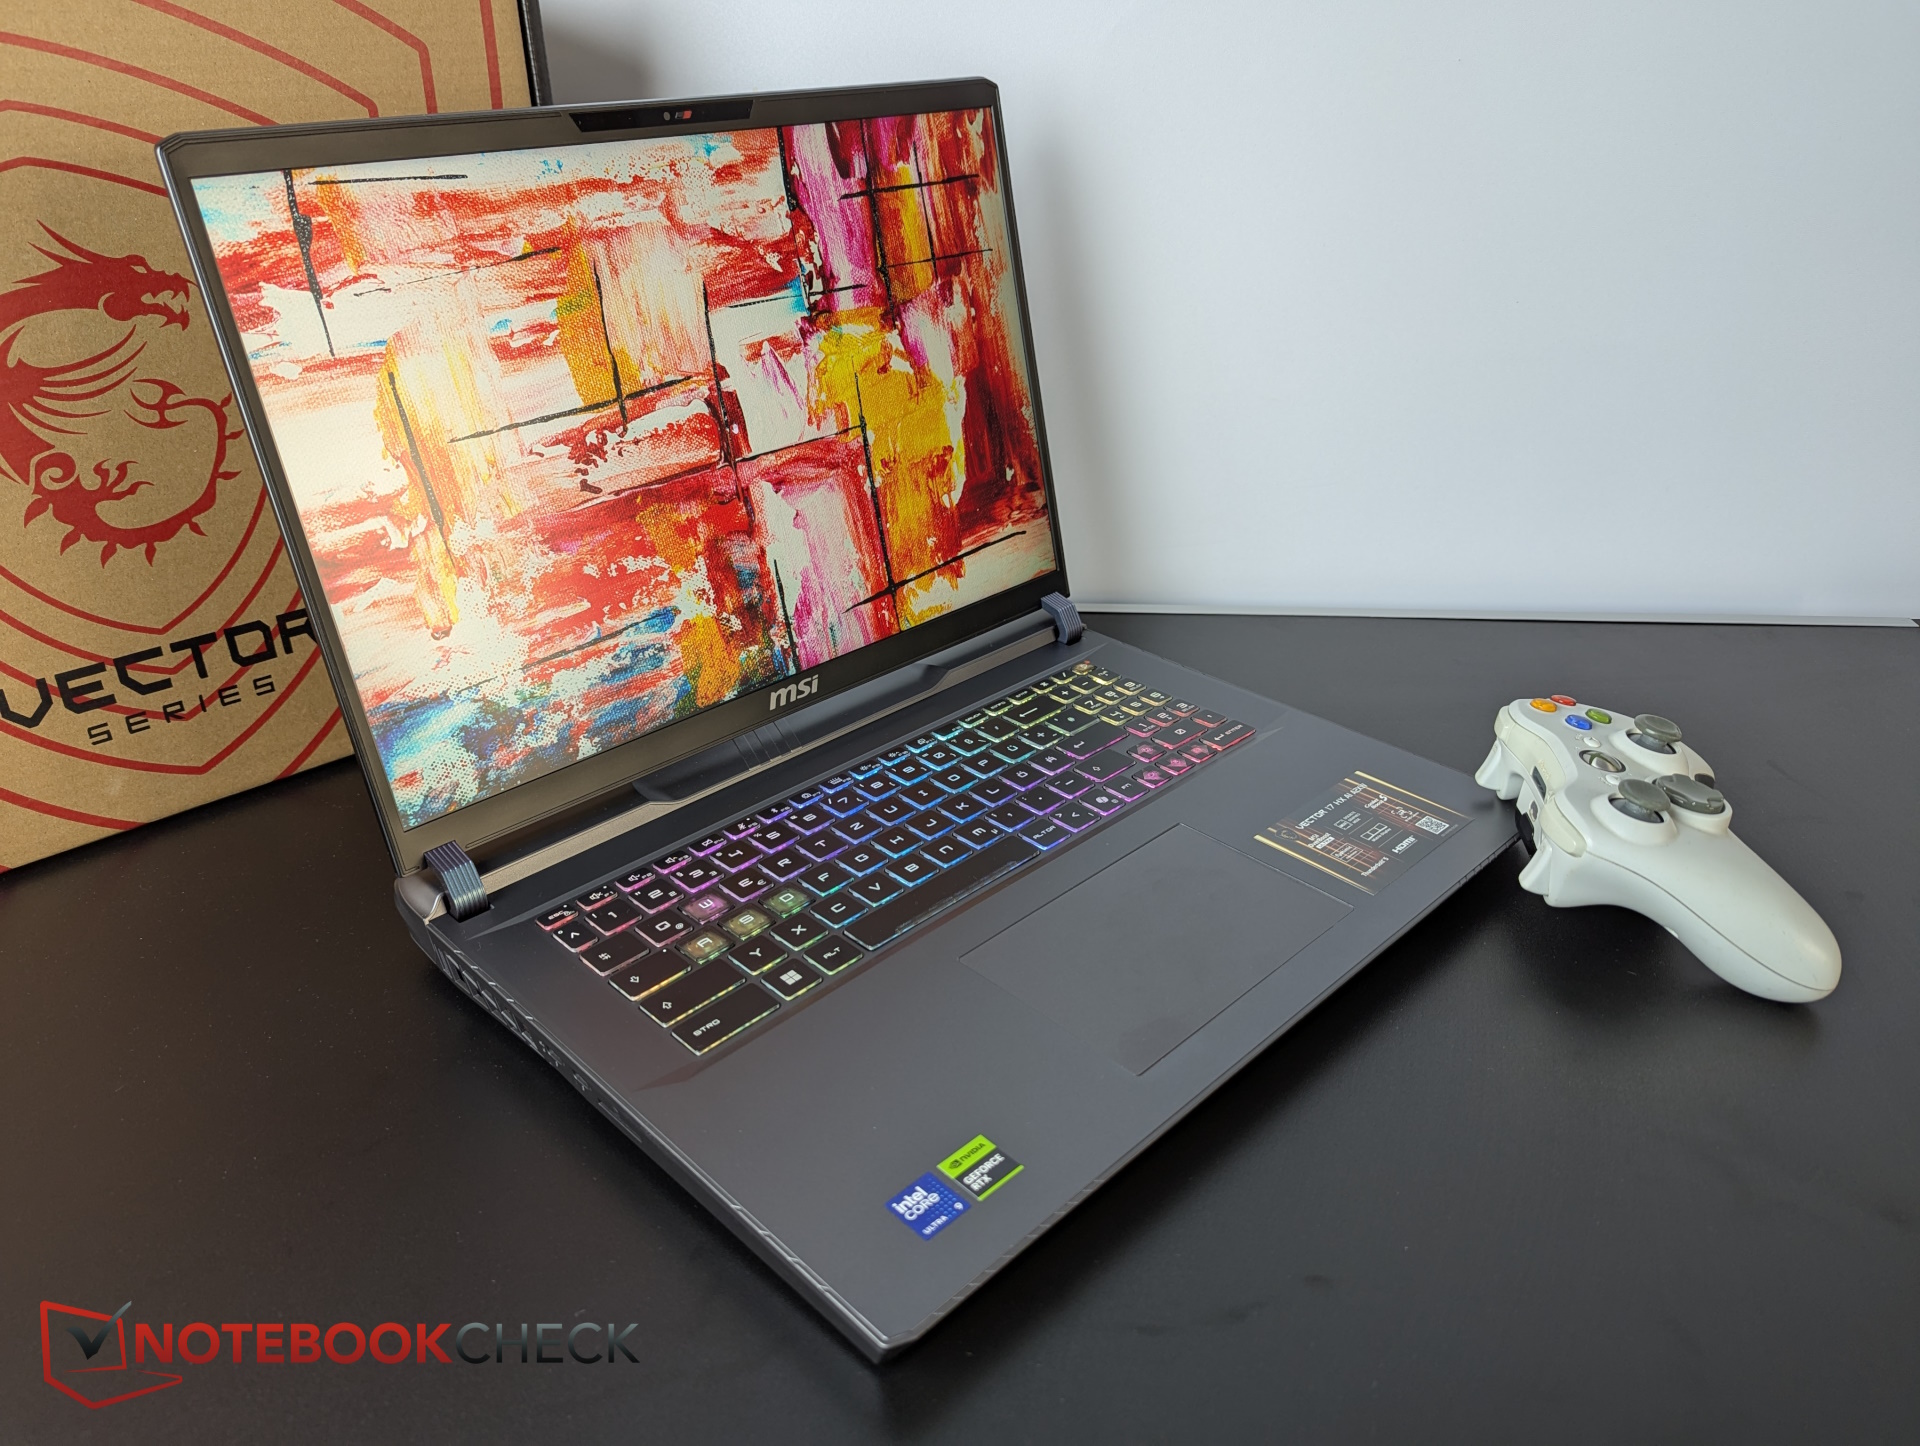
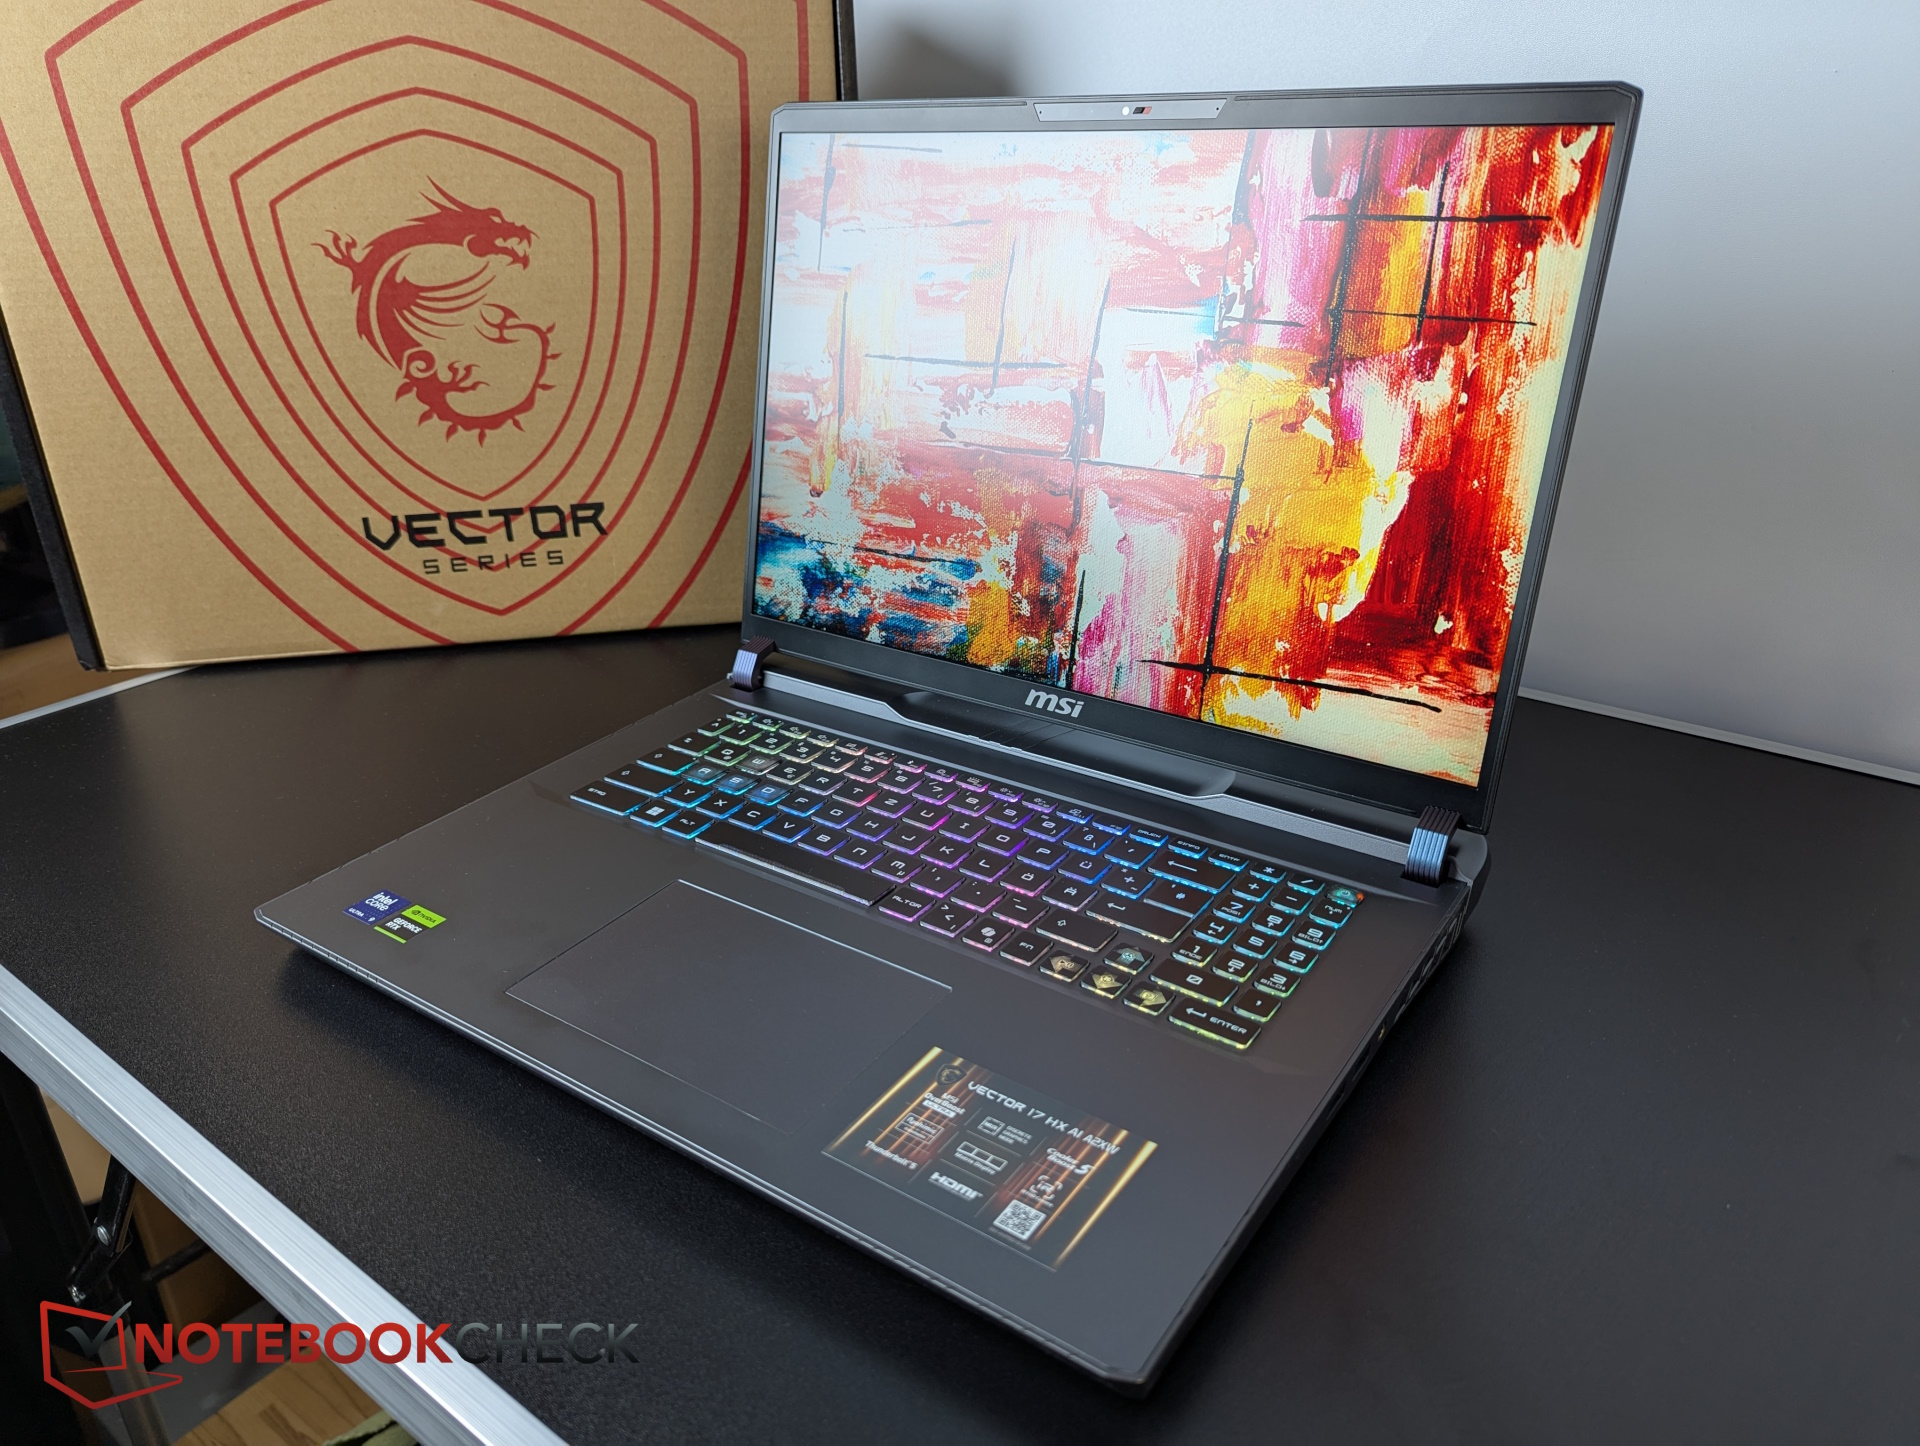
i gamer da 17 pollici con grafica Blackwell sono estremamente rari e quindi il gamer si colloca proprio tra i numerosi dispositivi da 16 e 18 pollici. Il nostro Vector 17 HX AI è disponibile con RTX 5090, 5080 o 5070 Ti, noi stiamo testando la configurazione intermedia.
Specifiche
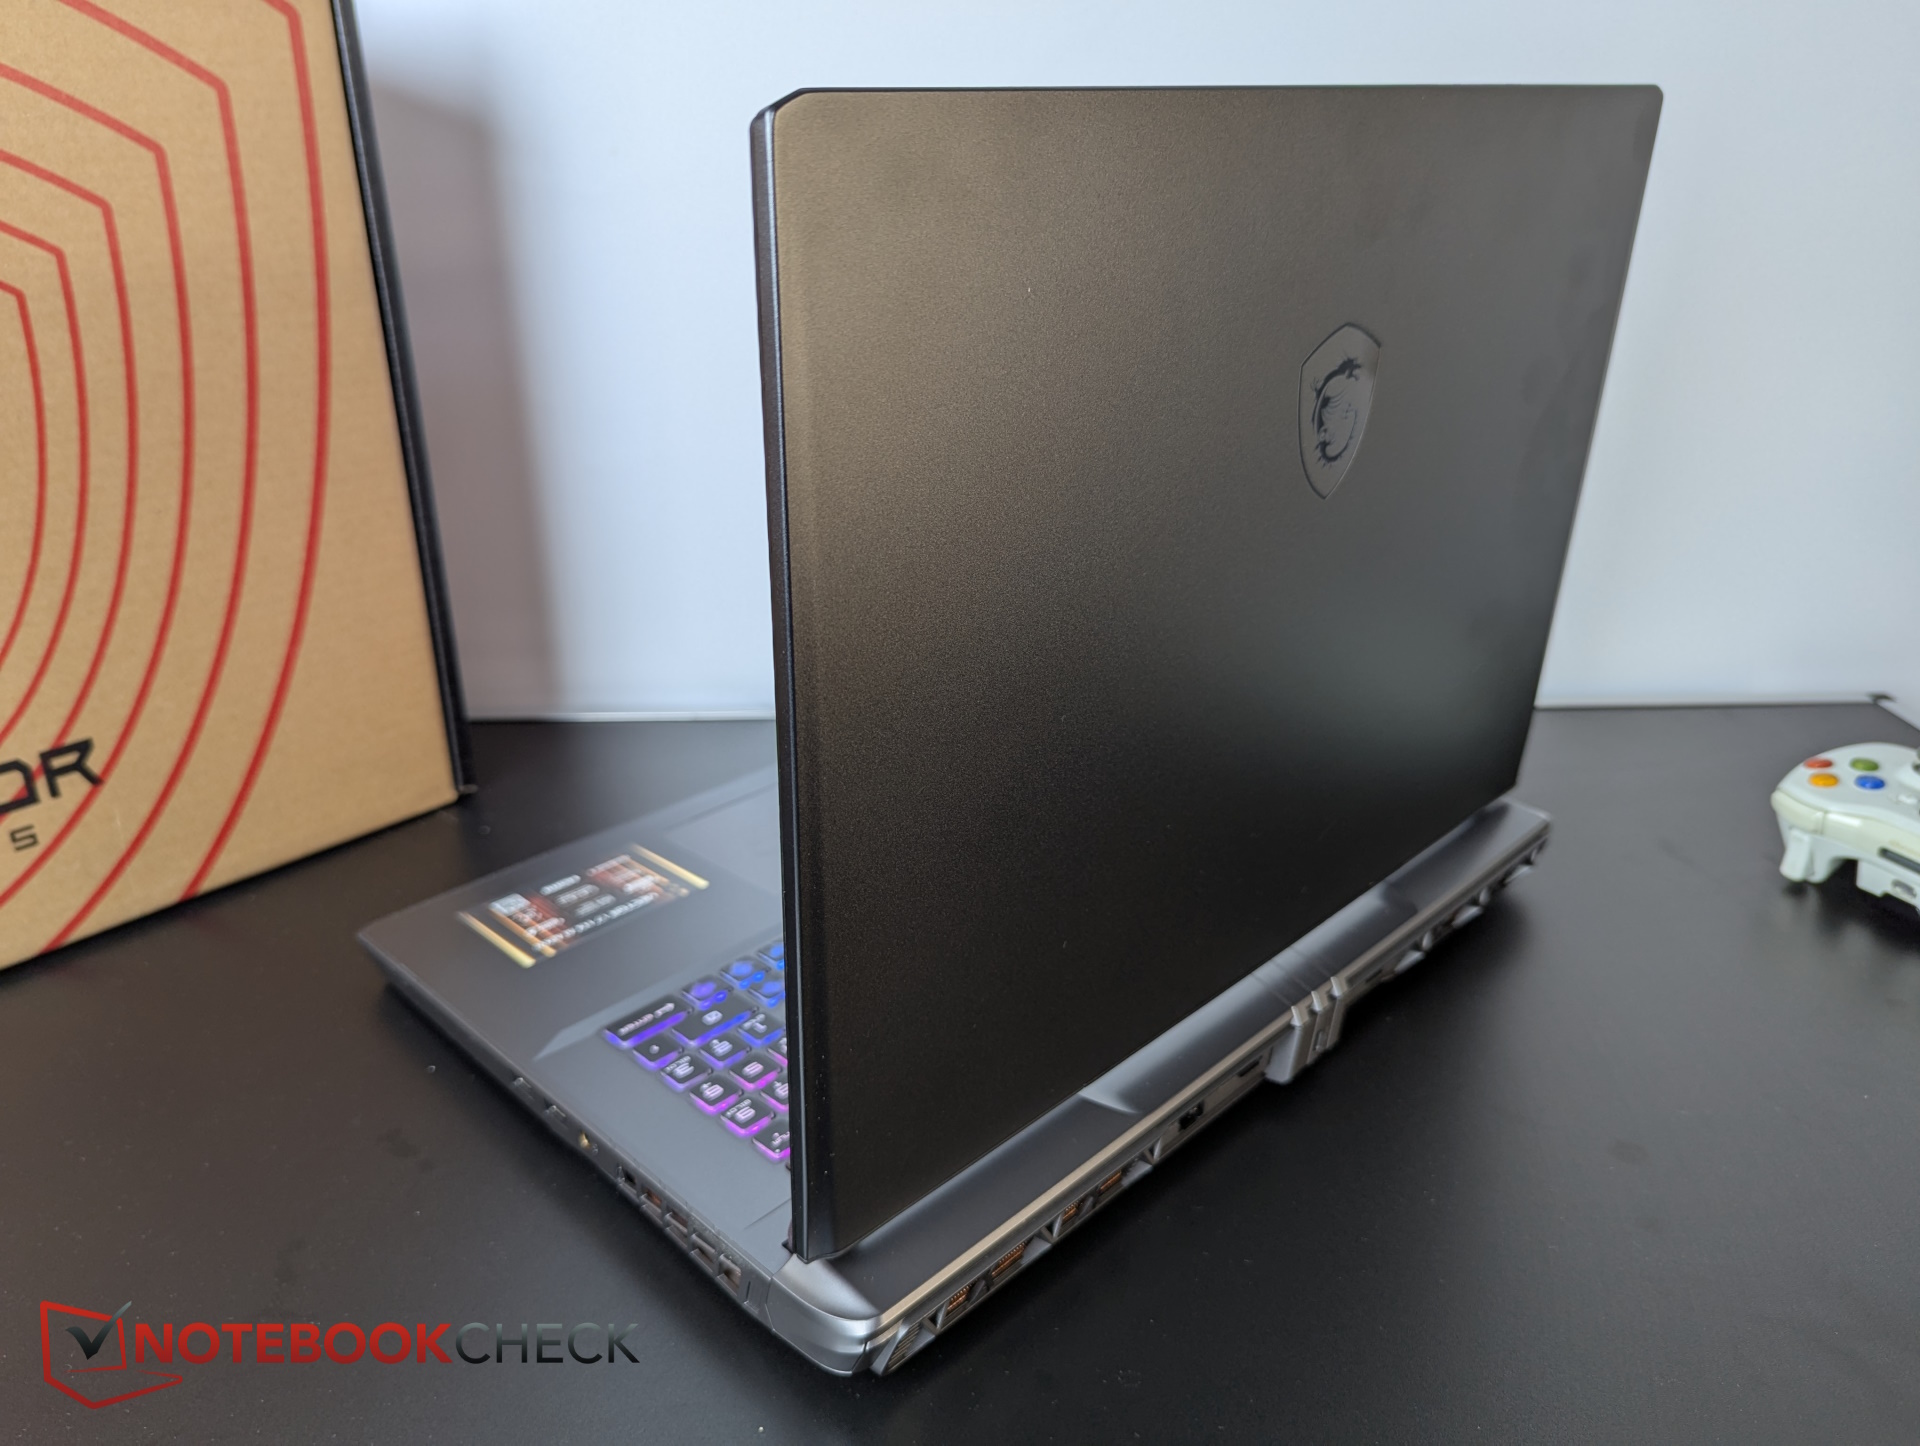
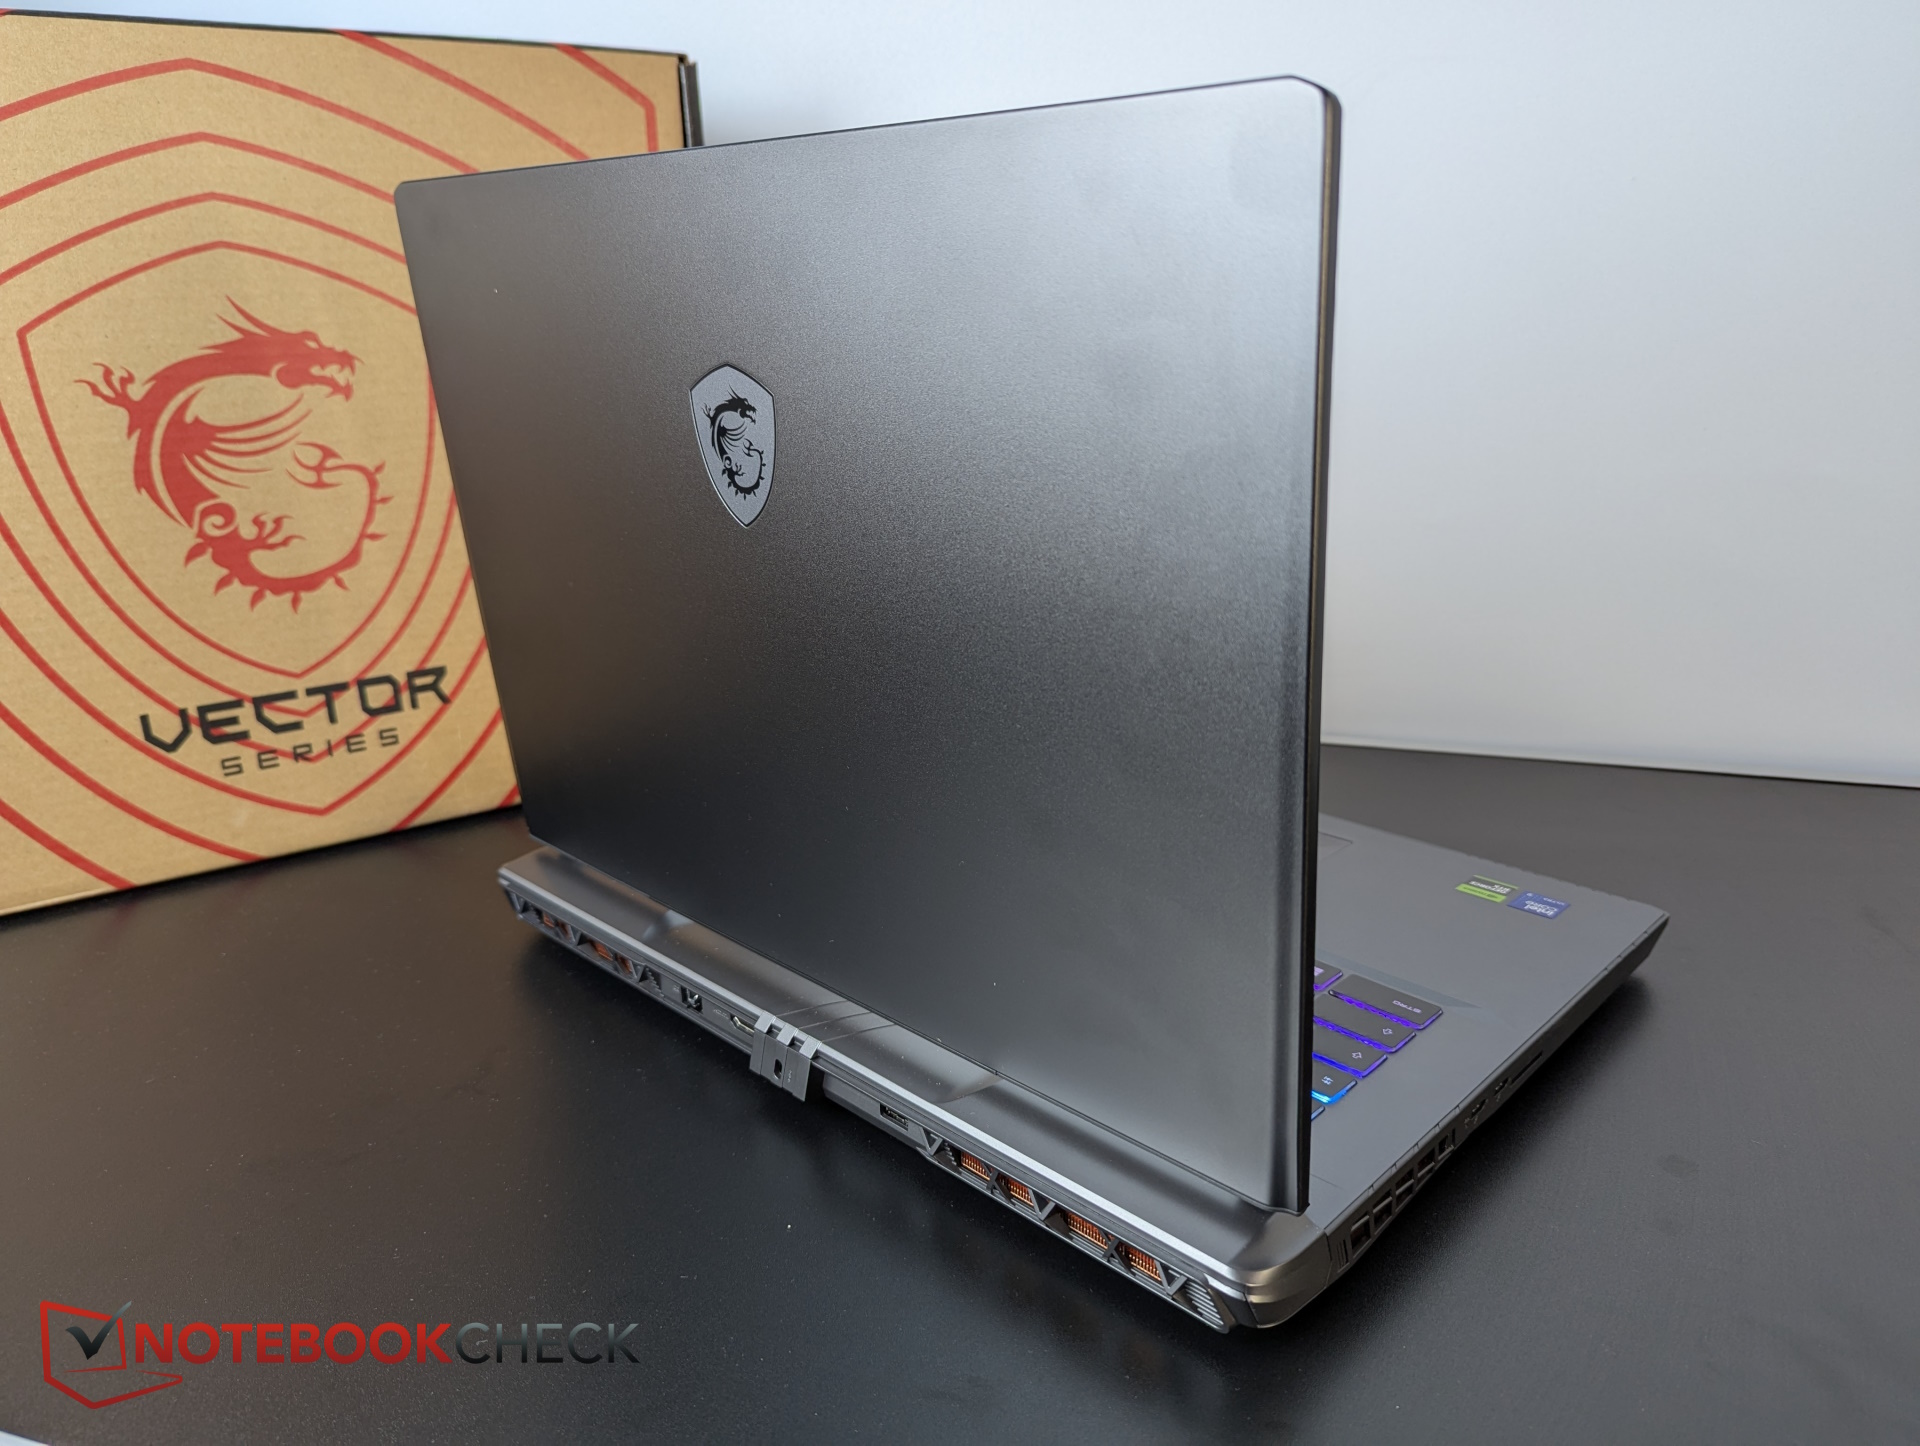
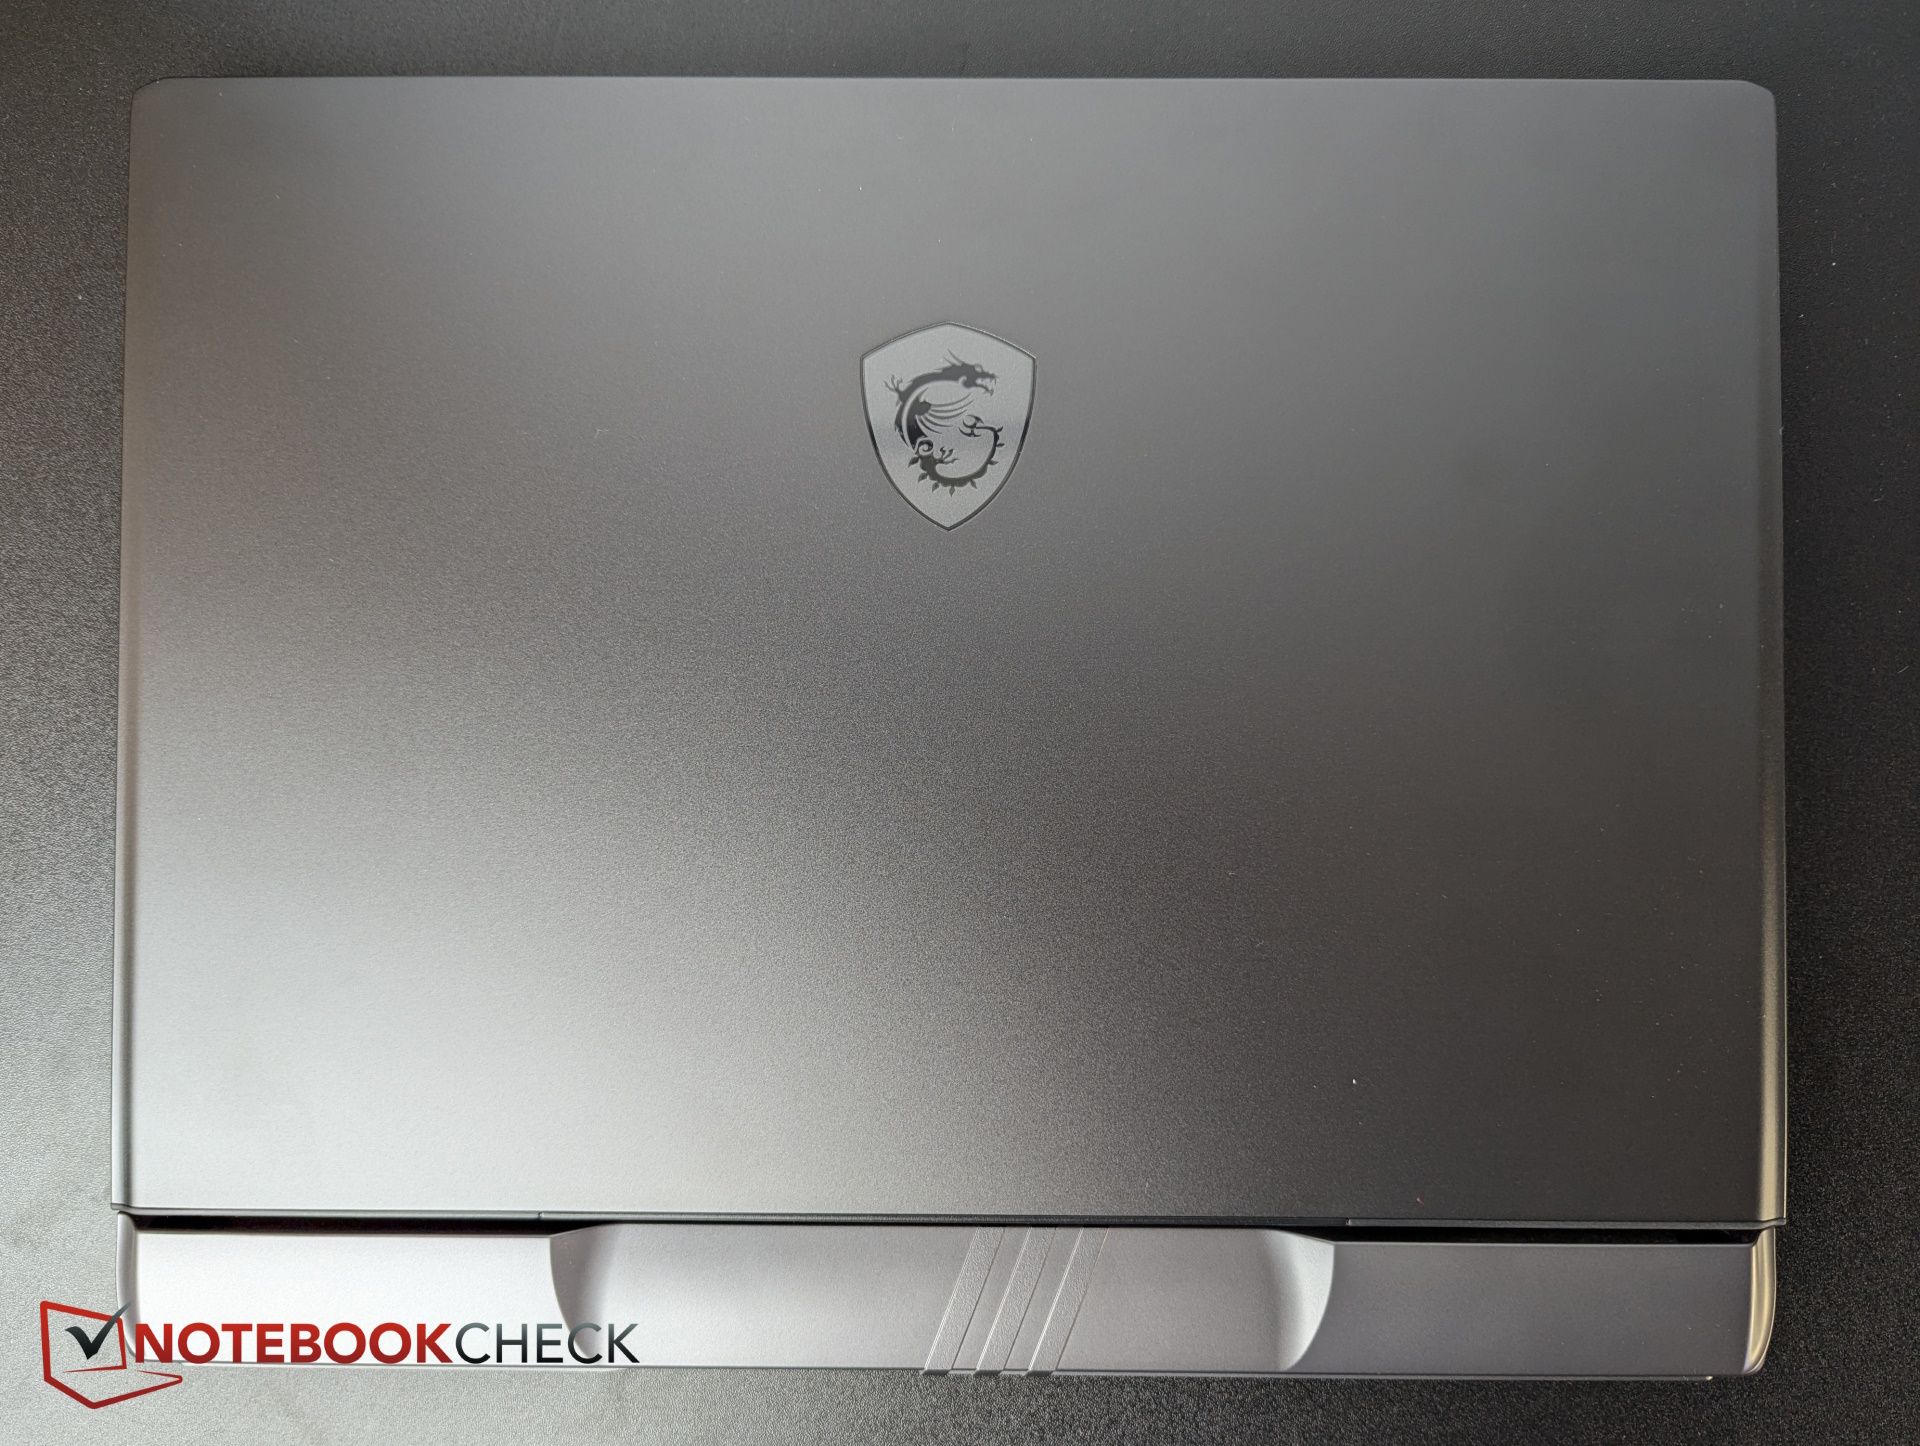
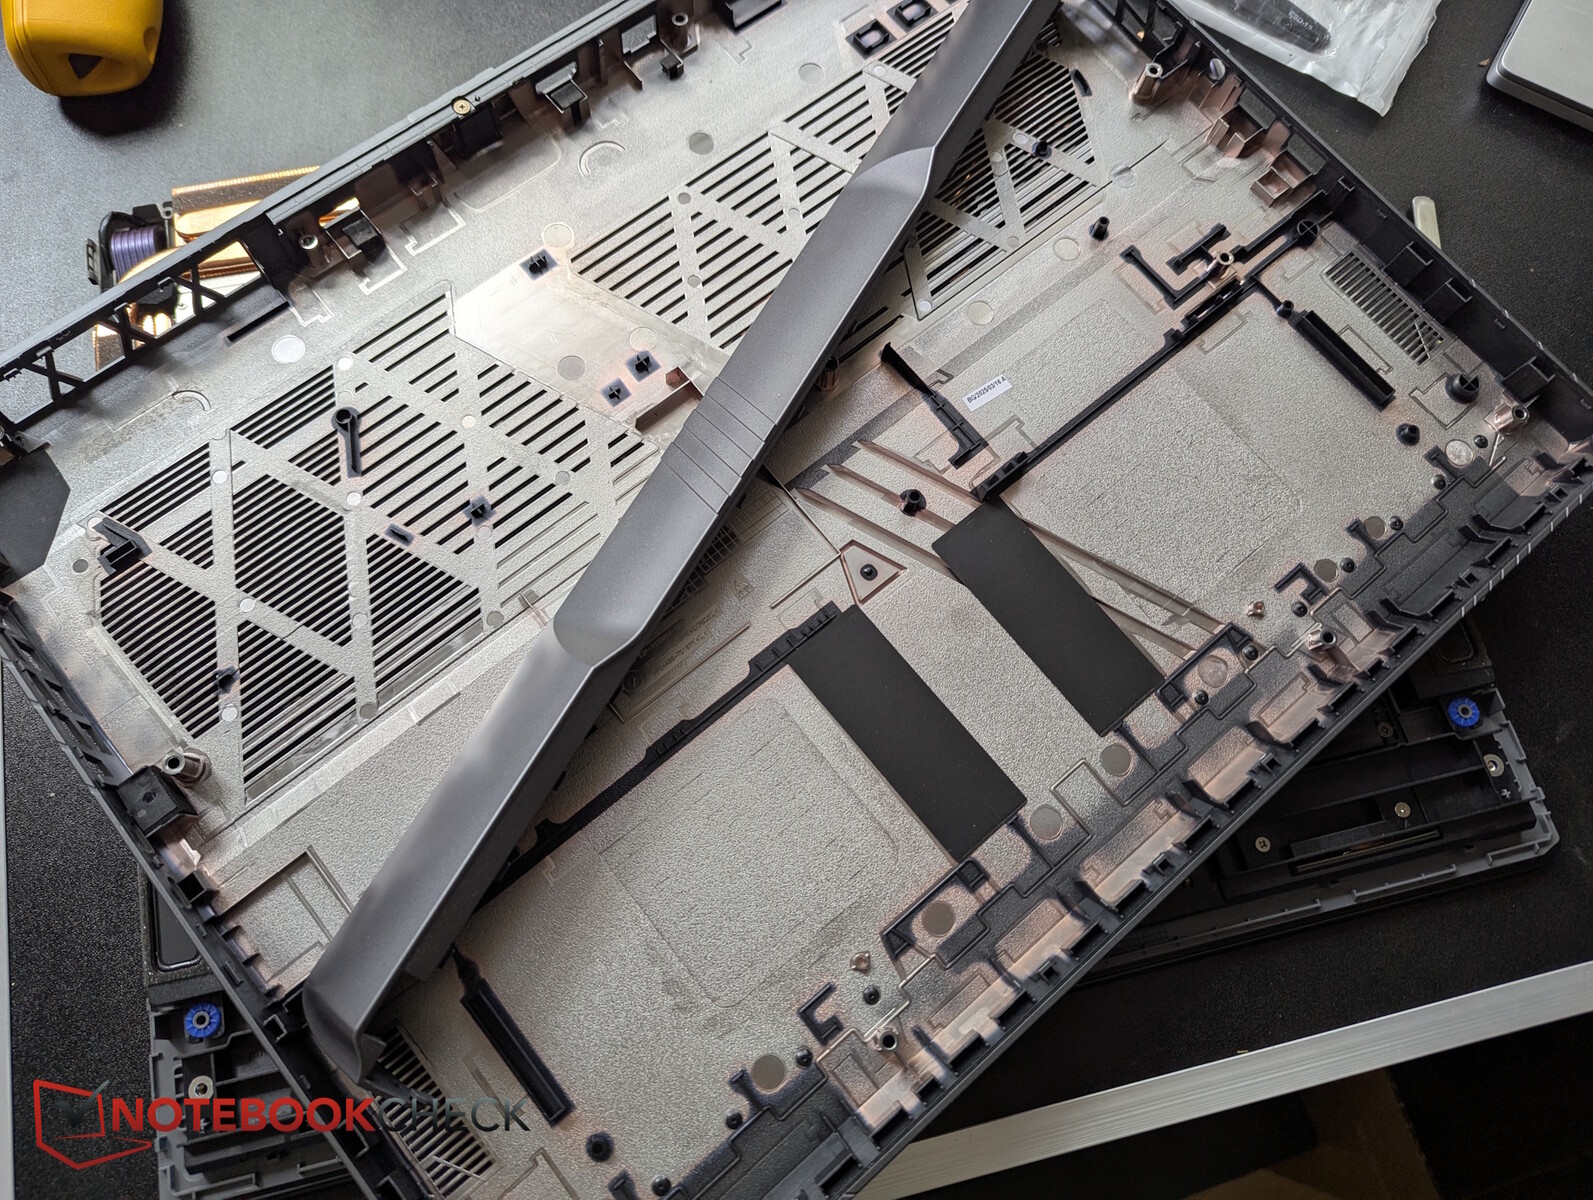
Caso e caratteristiche - Massiccio come un Alienware
Dal momento che abbiamo già il MSI Vector 16 HX AI con quasi lo stesso alloggiamento, ci riferiamo a questo punto al suo Test e saltiamo le sezioni relative al case, alla manutenzione e ai dispositivi di input.
| SD Card Reader | |
| average JPG Copy Test (av. of 3 runs) | |
| Alienware 16 Area-51 (Toshiba Exceria Pro SDXC 64 GB UHS-II) | |
| SCHENKER XMG Neo 16 A25 5090 (Angelbird AV Pro V60) | |
| Aorus MASTER 16 AM6H | |
| Media della classe Gaming (20 - 207, n=73, ultimi 2 anni) | |
| MSI Vector 17 HX AI A2XWIG | |
| MSI Titan 18 HX AI A2XWJG (AV PRO microSD 128 GB V60) | |
| MSI Raider A18 HX A9WIG-080 | |
| maximum AS SSD Seq Read Test (1GB) | |
| SCHENKER XMG Neo 16 A25 5090 (Angelbird AV Pro V60) | |
| Alienware 16 Area-51 (Toshiba Exceria Pro SDXC 64 GB UHS-II) | |
| MSI Vector 17 HX AI A2XWIG | |
| Aorus MASTER 16 AM6H | |
| MSI Raider A18 HX A9WIG-080 | |
| Media della classe Gaming (25.8 - 261, n=72, ultimi 2 anni) | |
| MSI Titan 18 HX AI A2XWJG (AV PRO microSD 128 GB V60) | |
Webcam
È installata una webcam Full HD con otturatore manuale, buona fedeltà cromatica e nitidezza media.


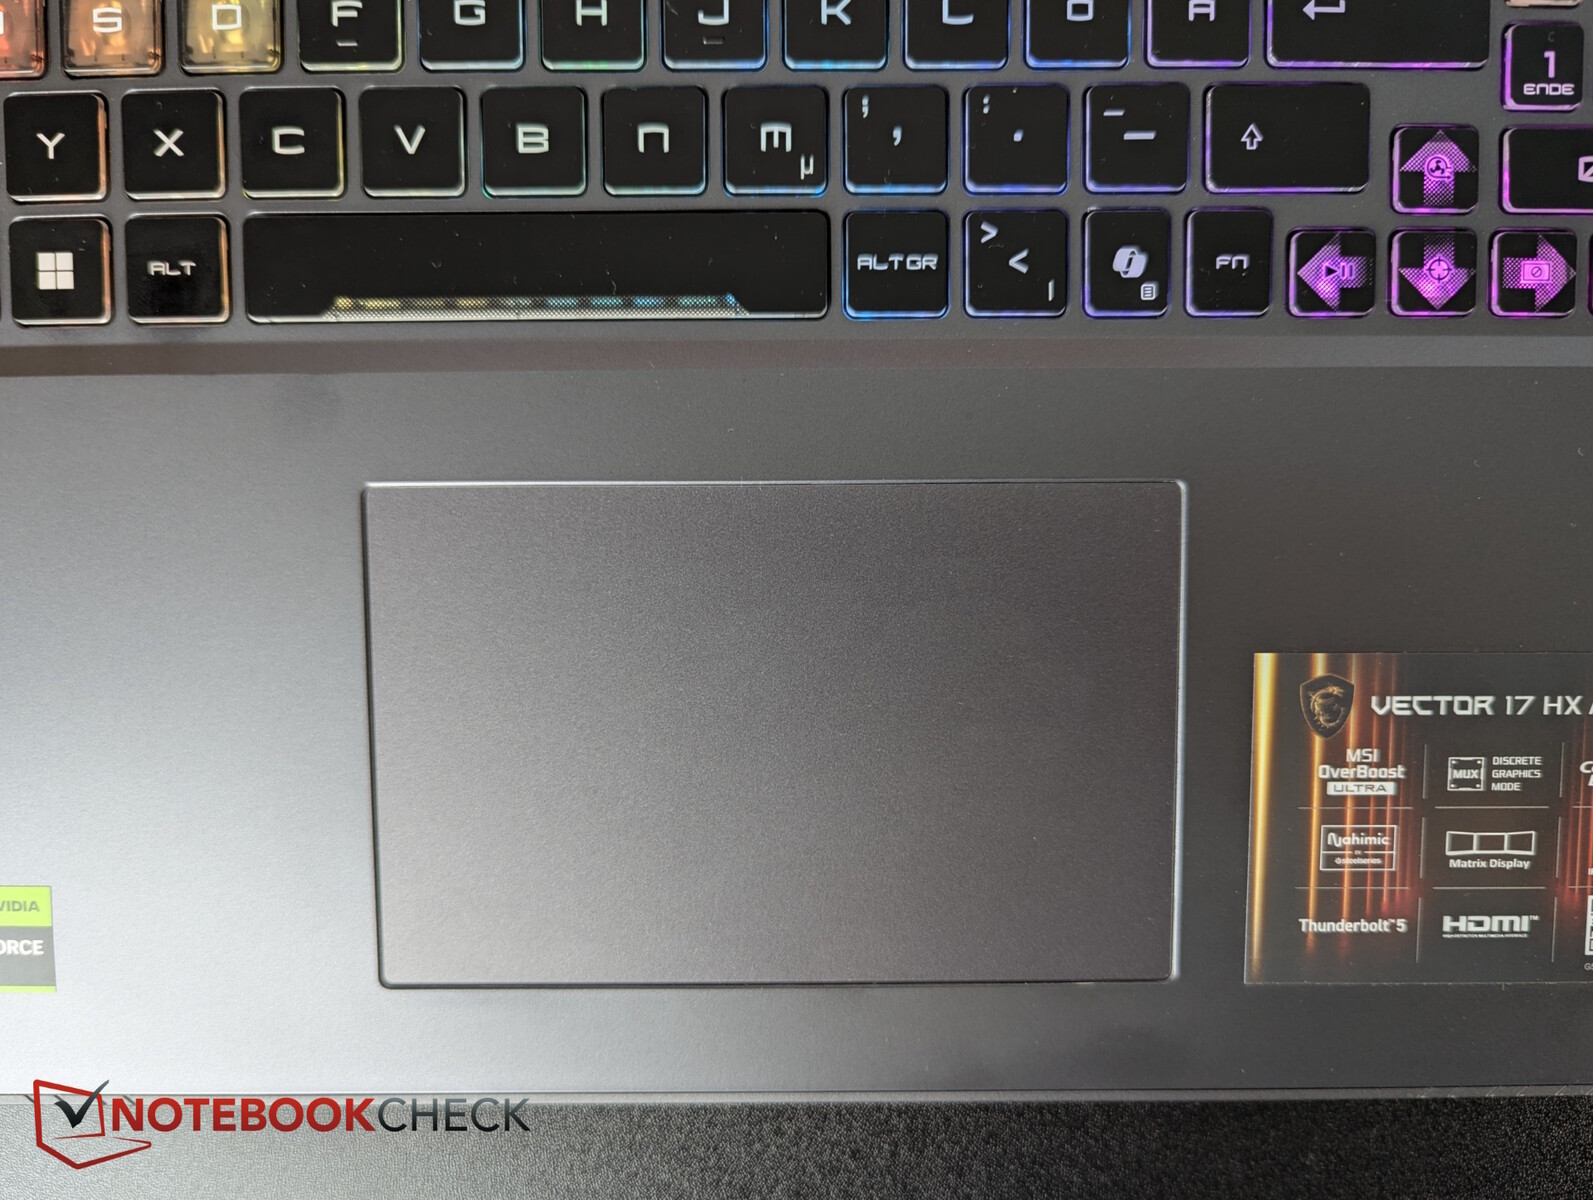
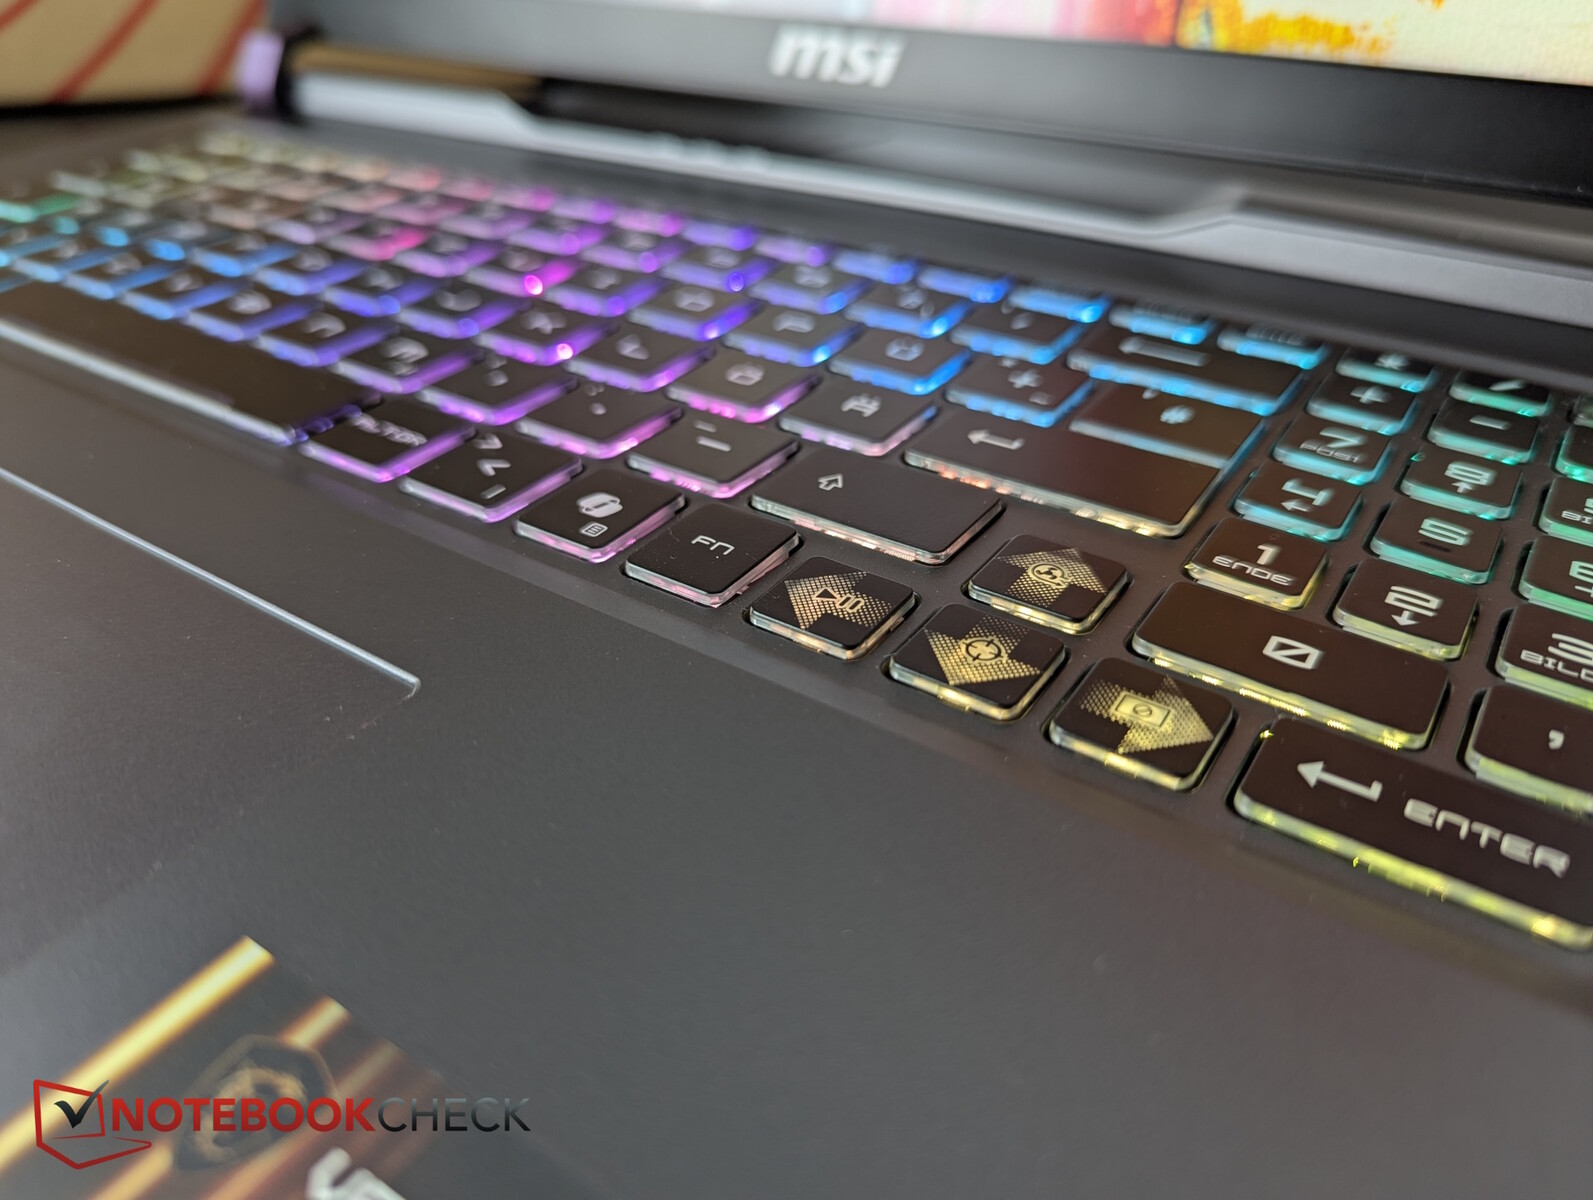
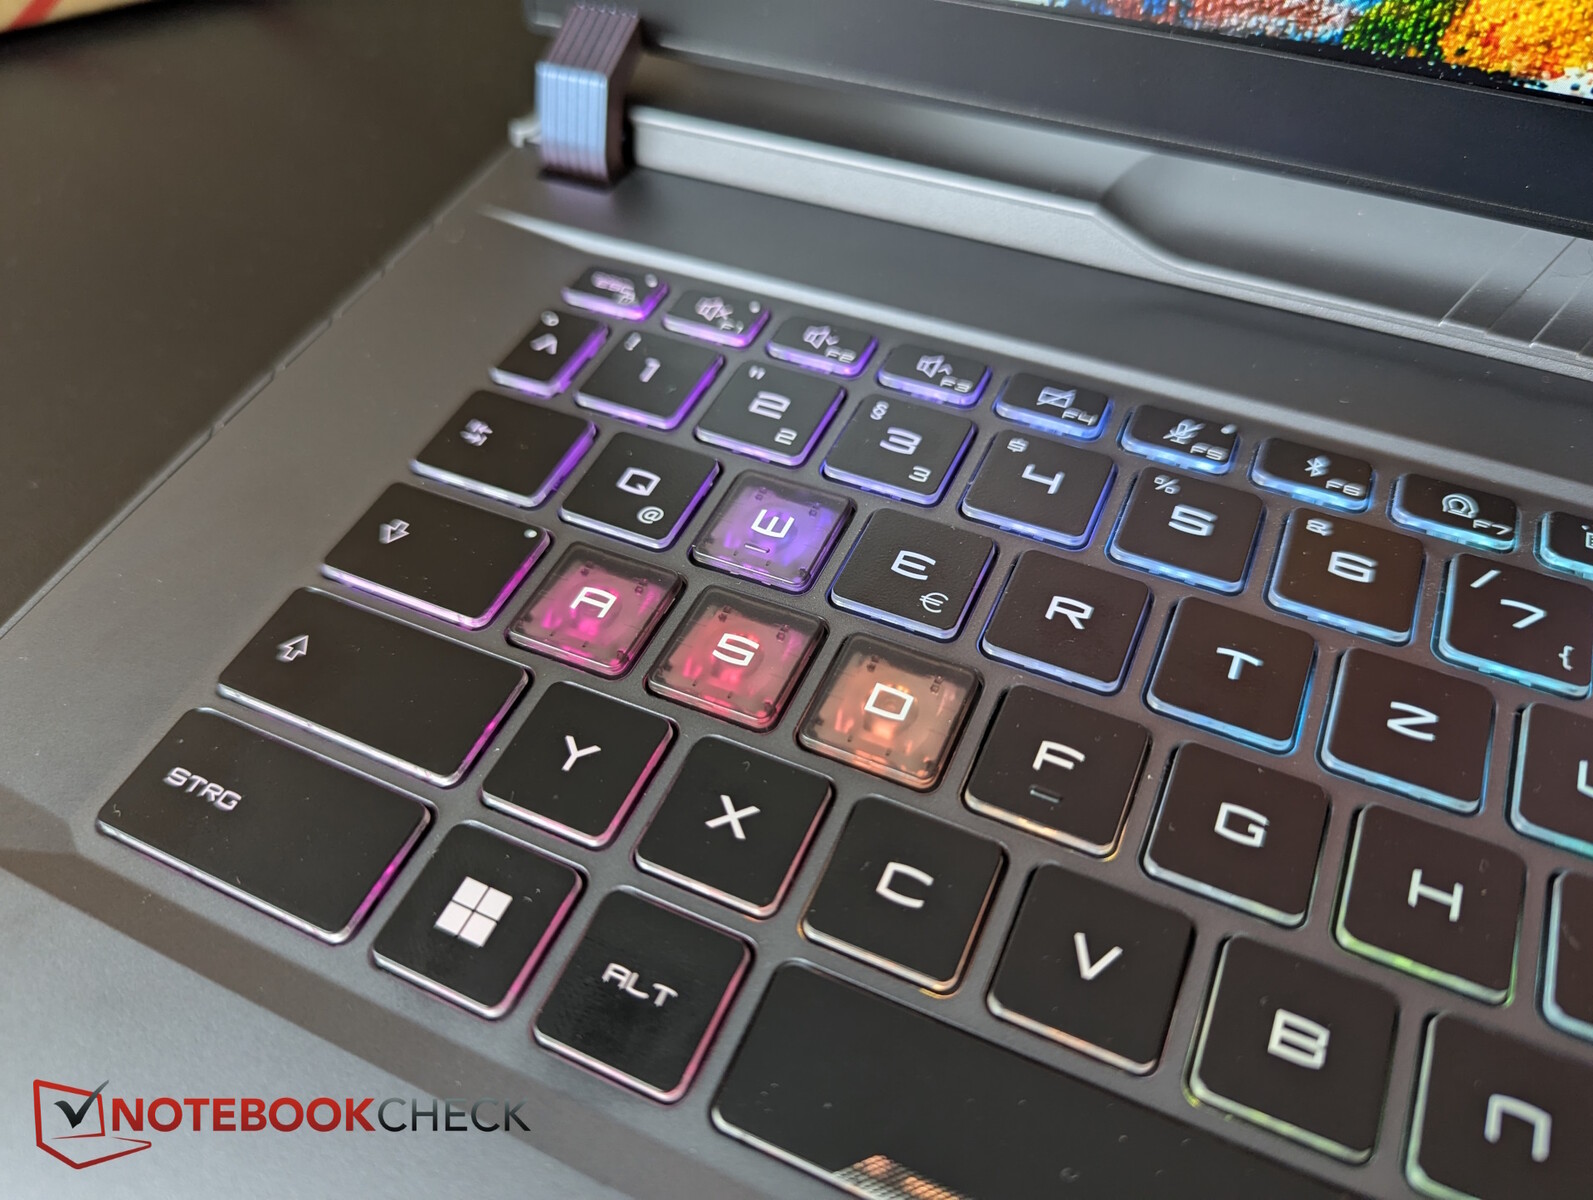
Dispositivi di input - Questo layout MSI!
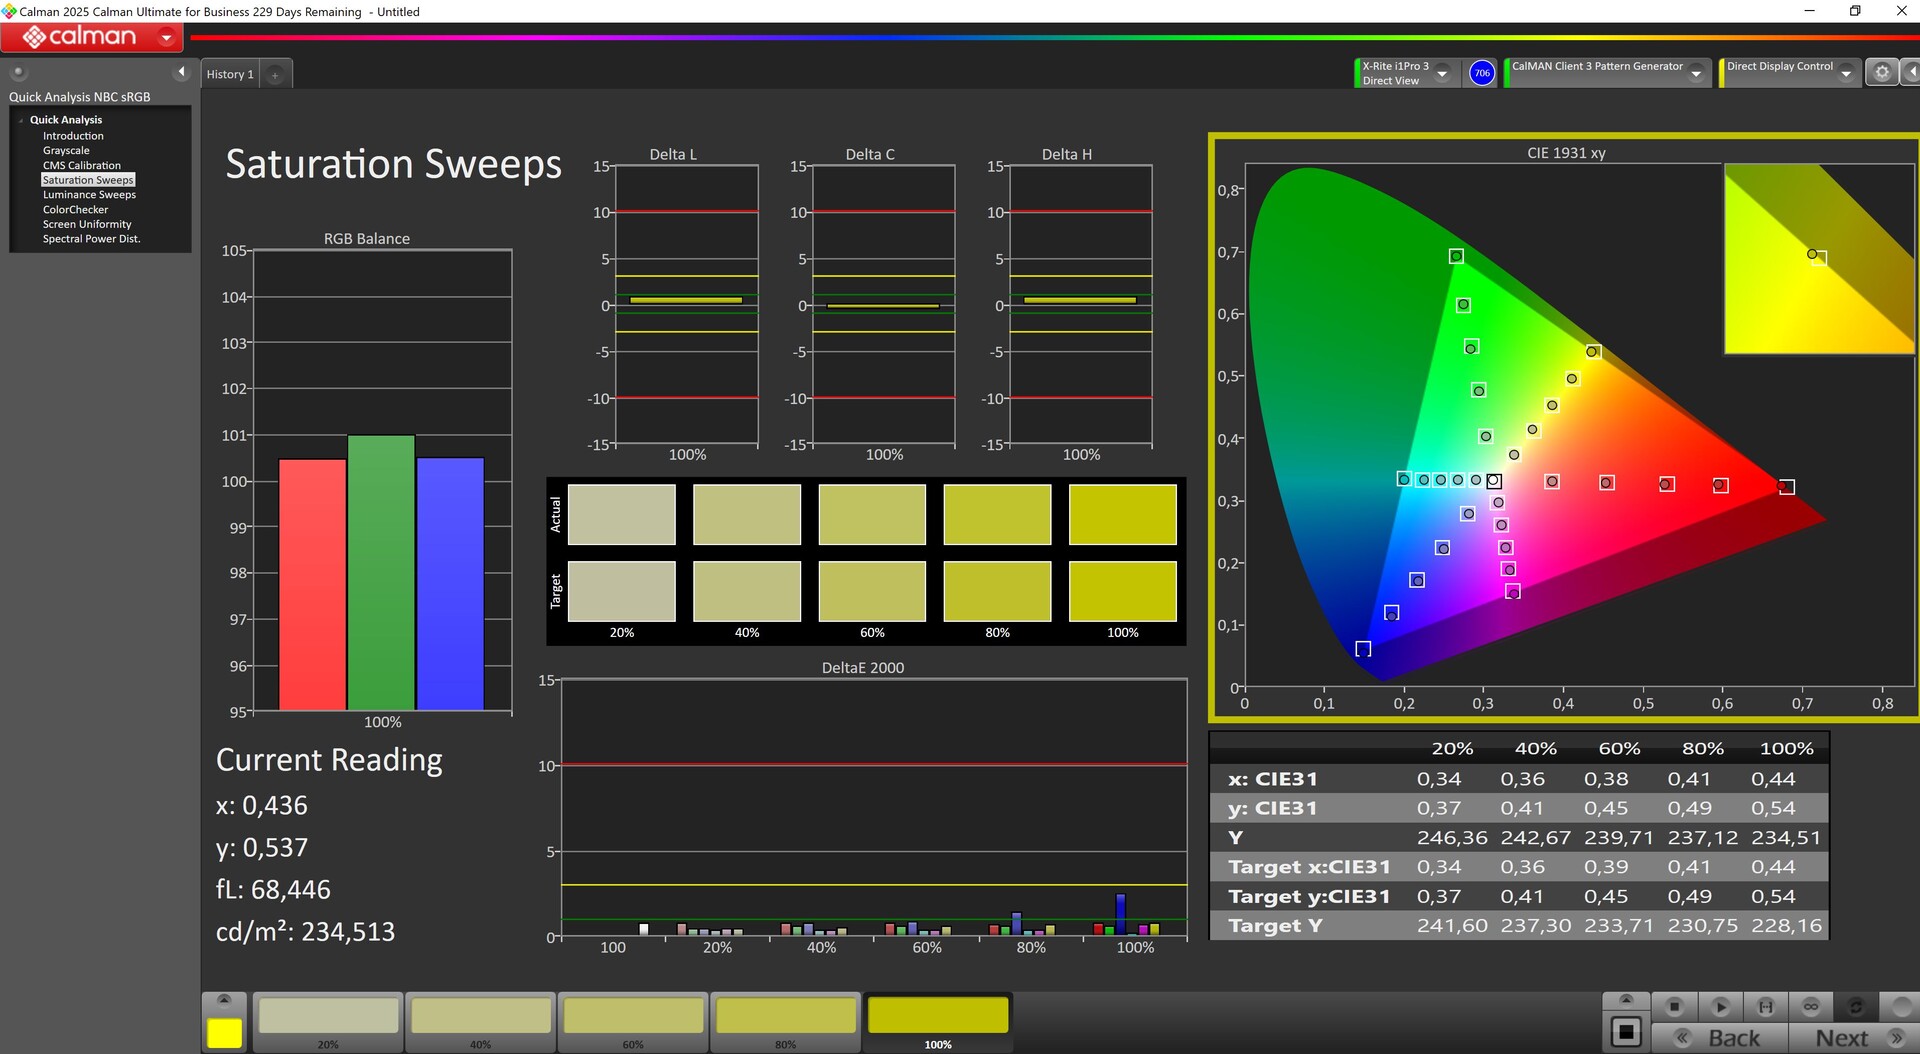
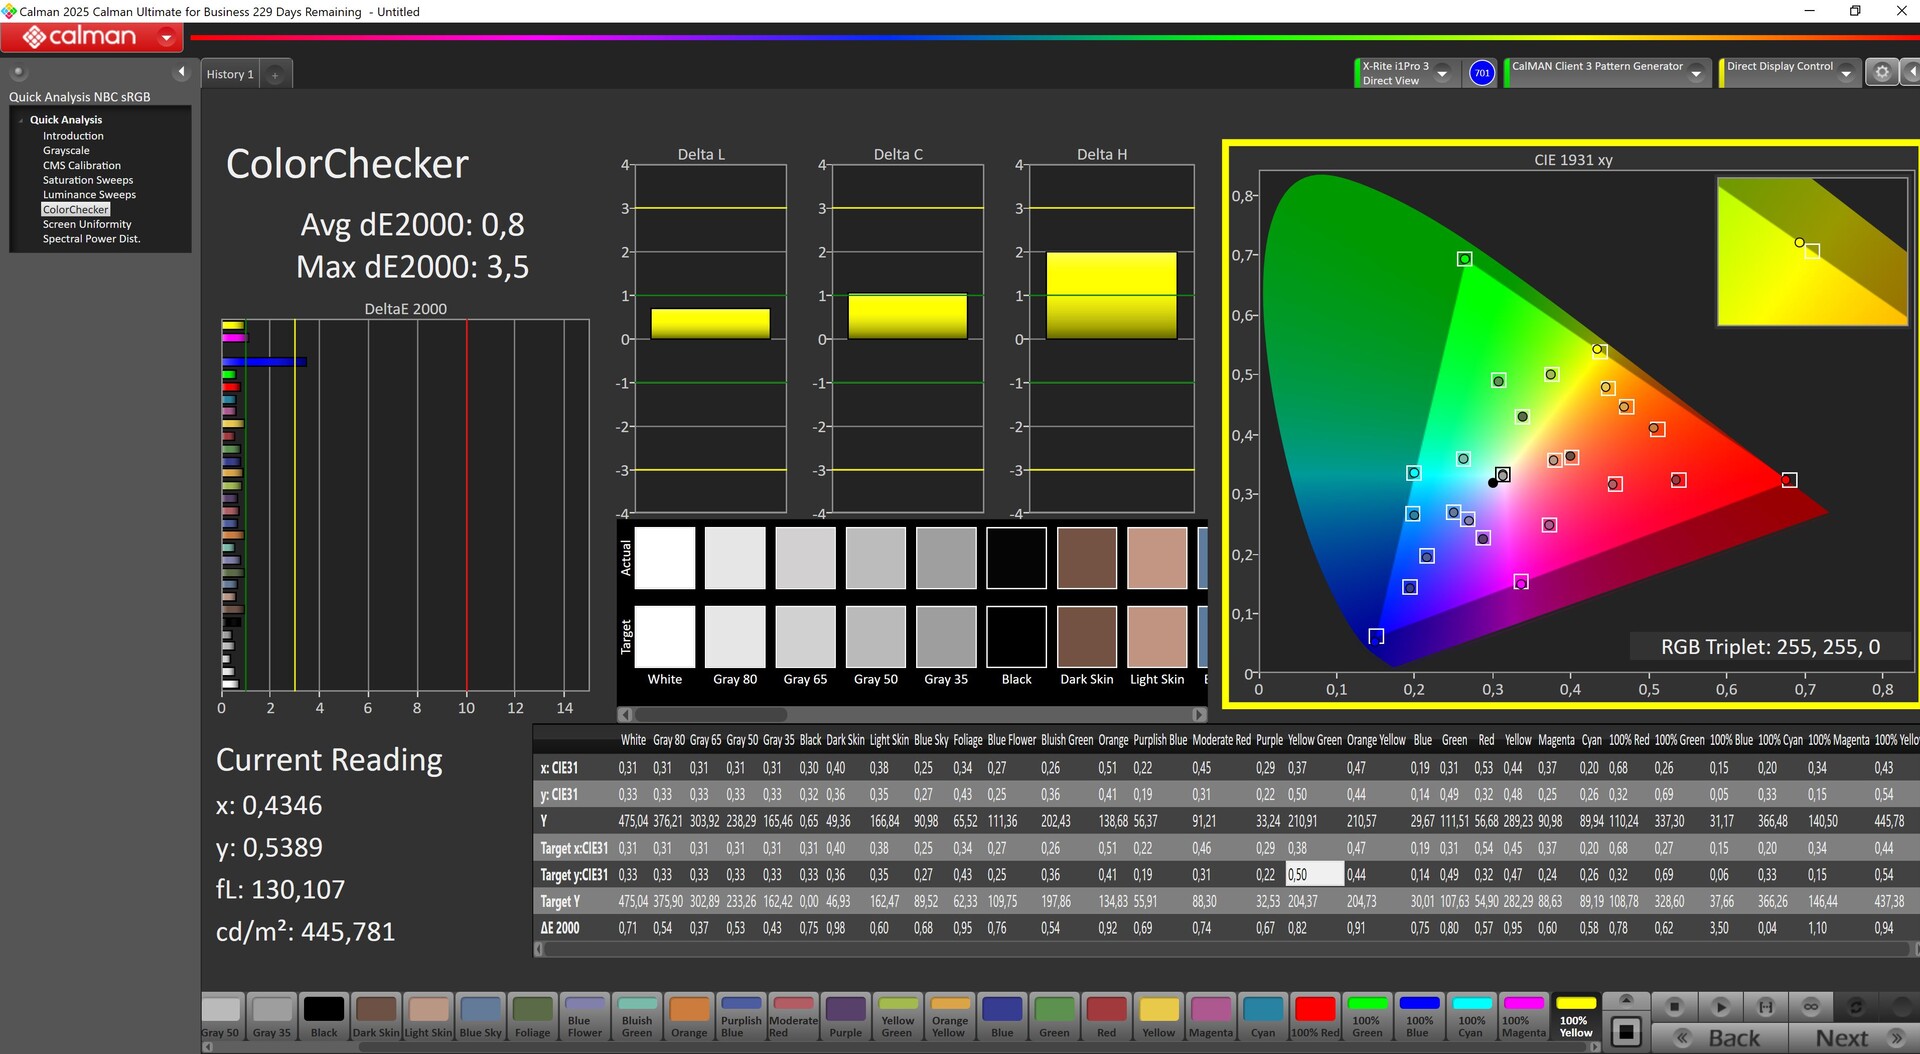
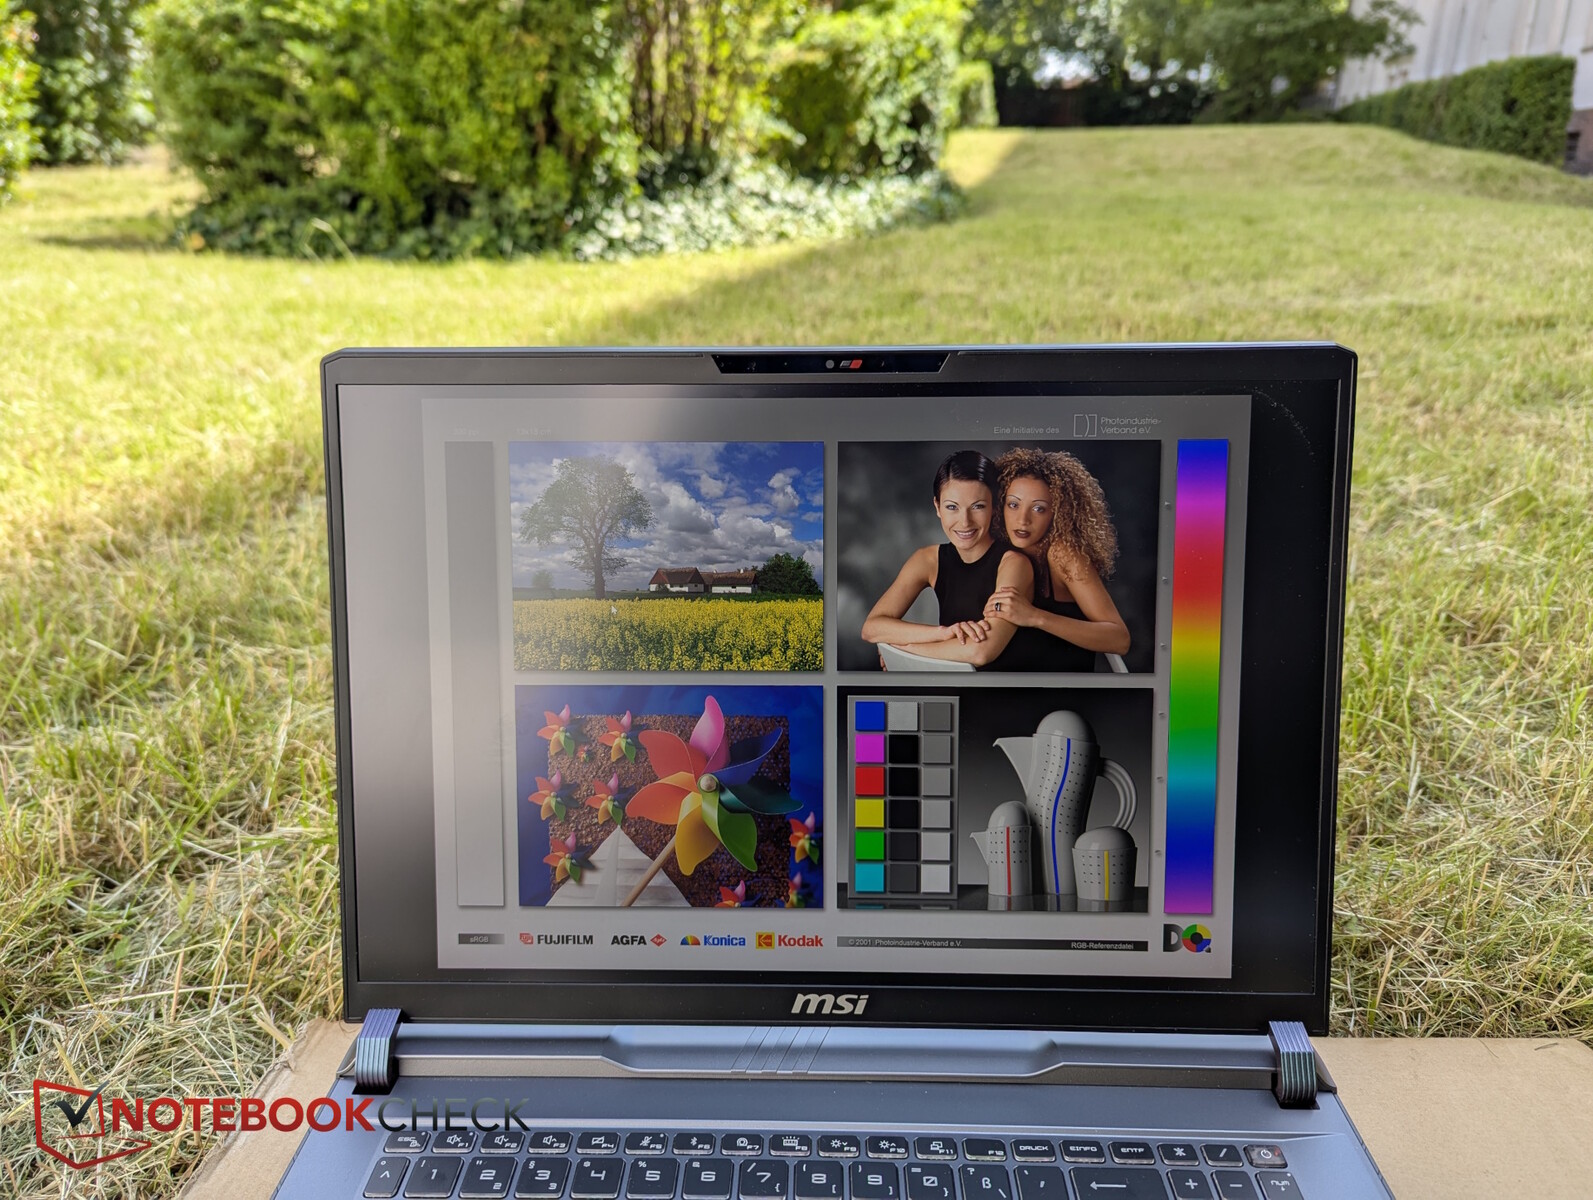
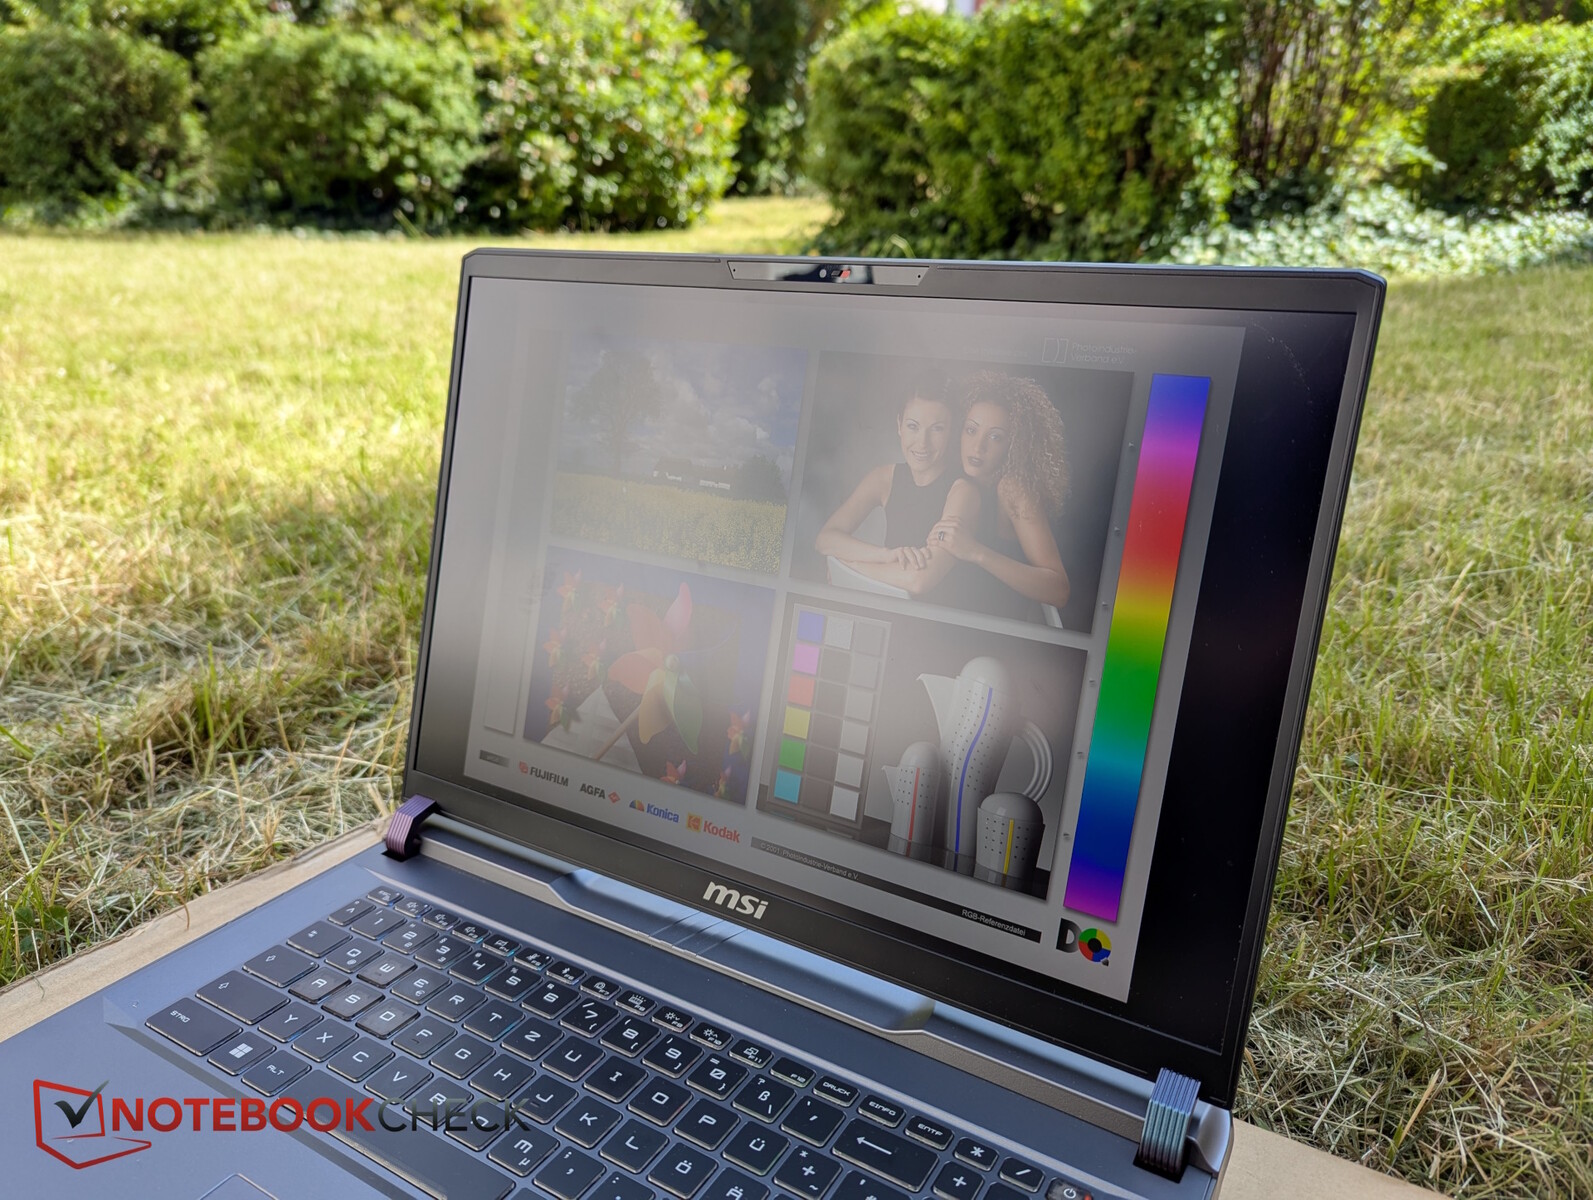
Display - IPS QHD+ con 470 nits
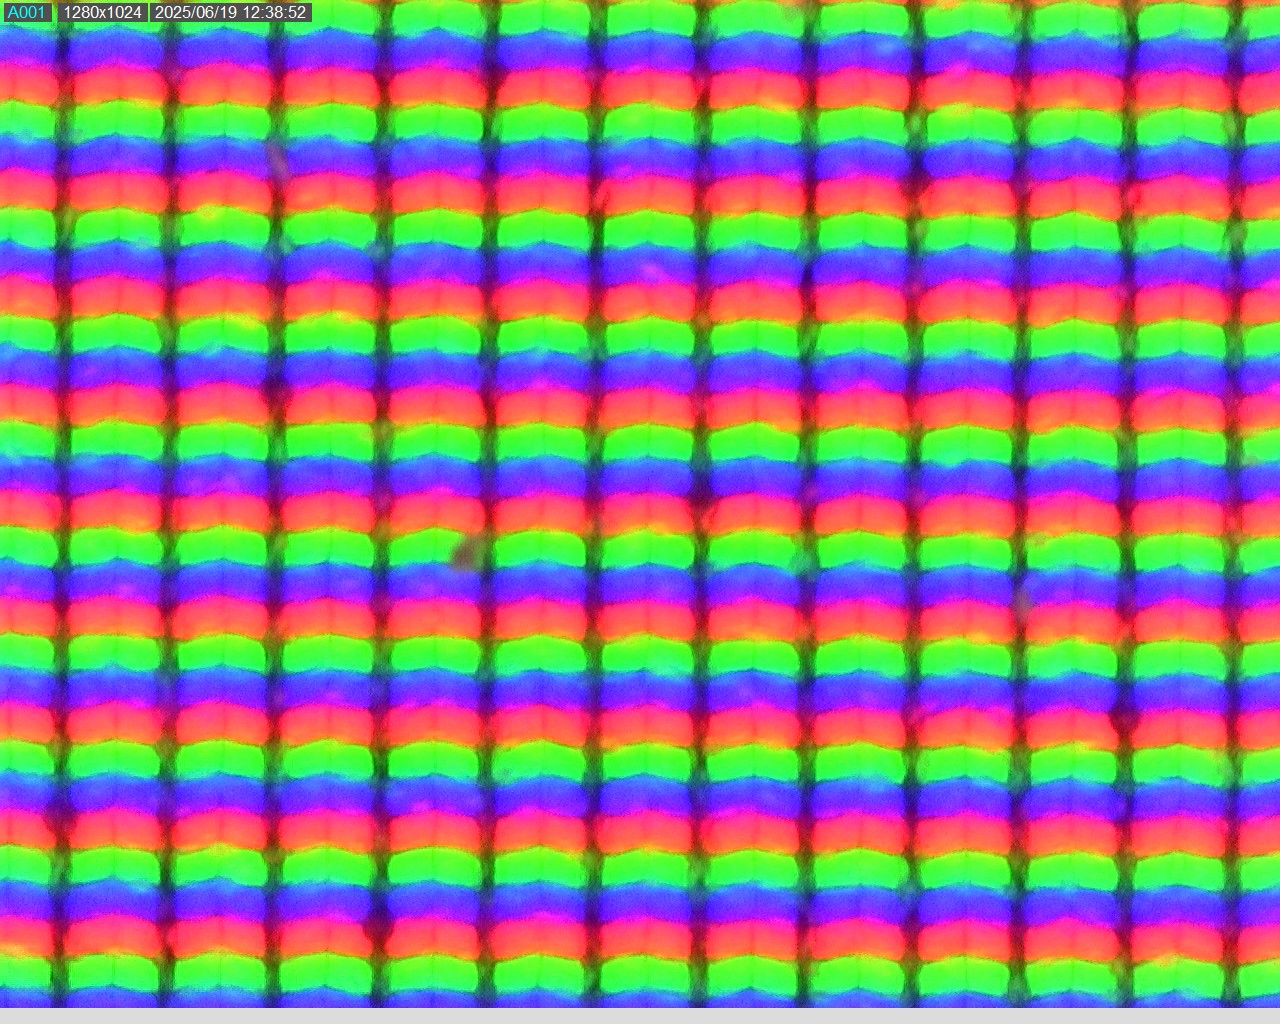
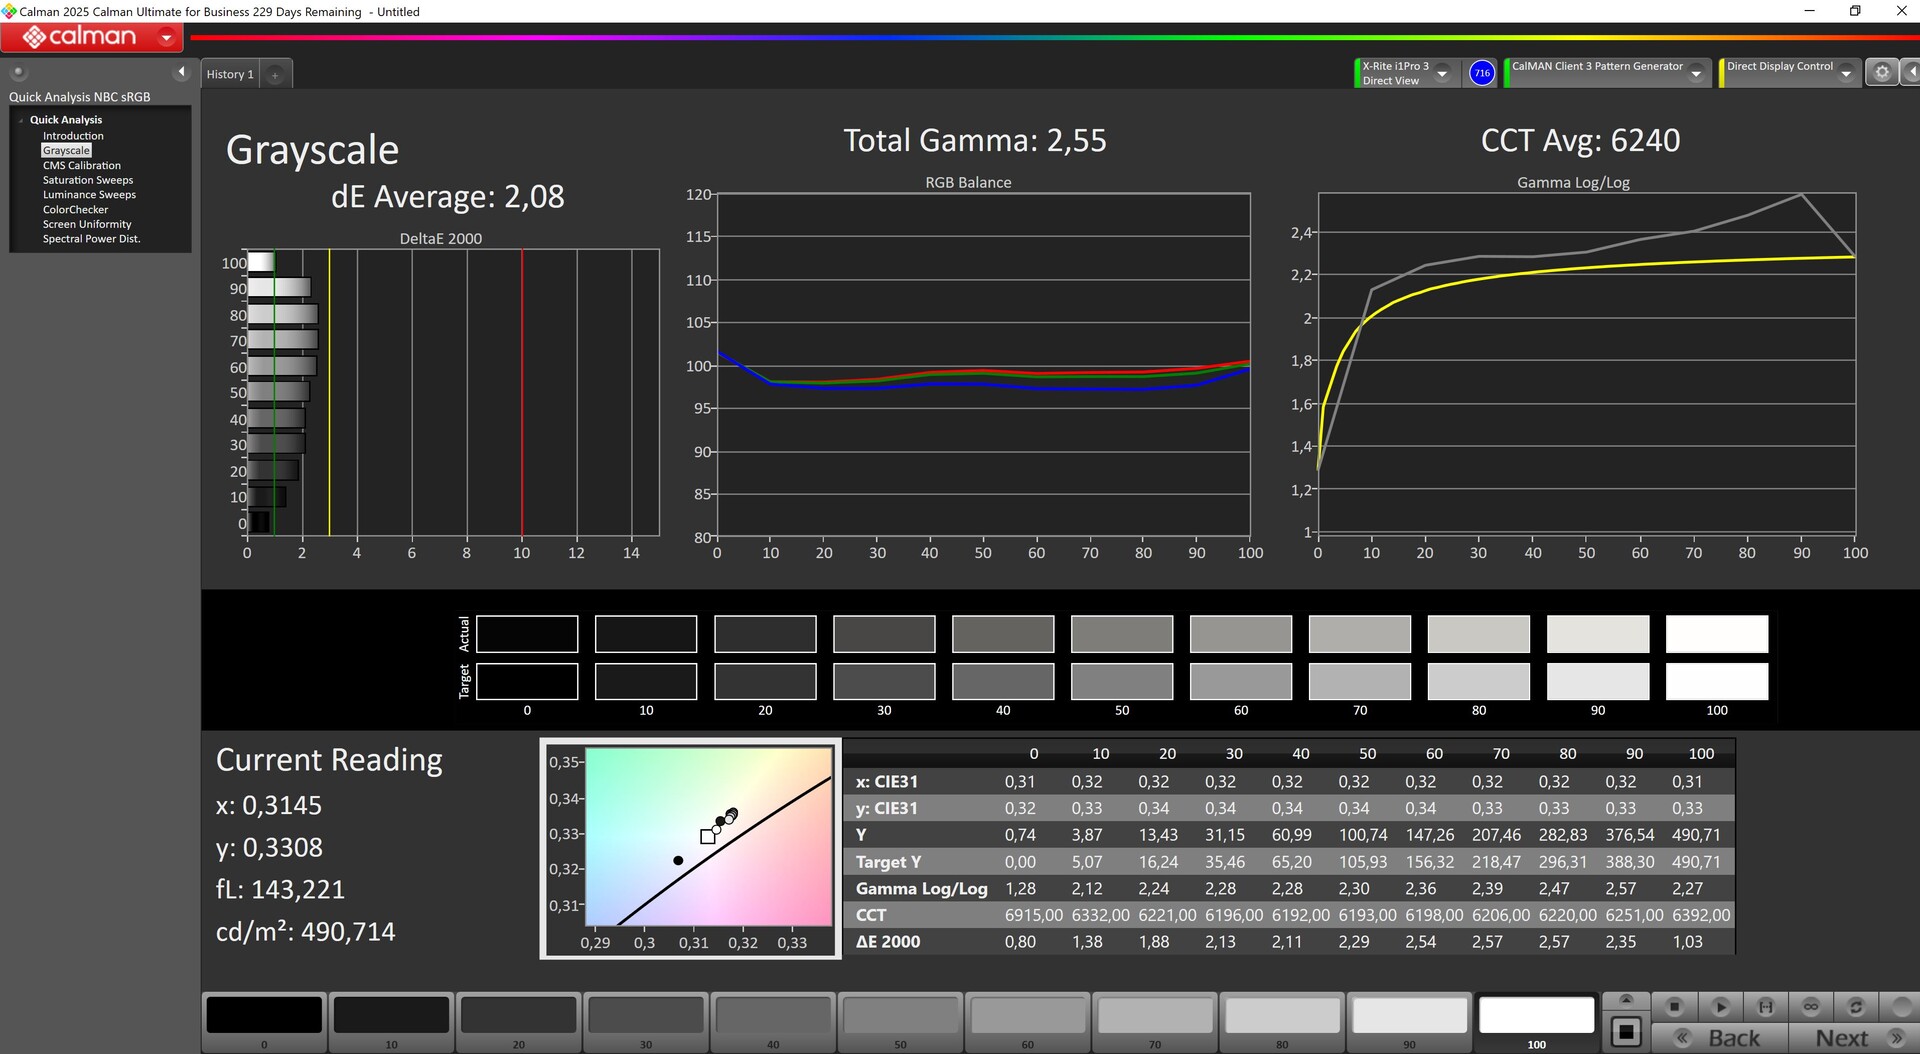
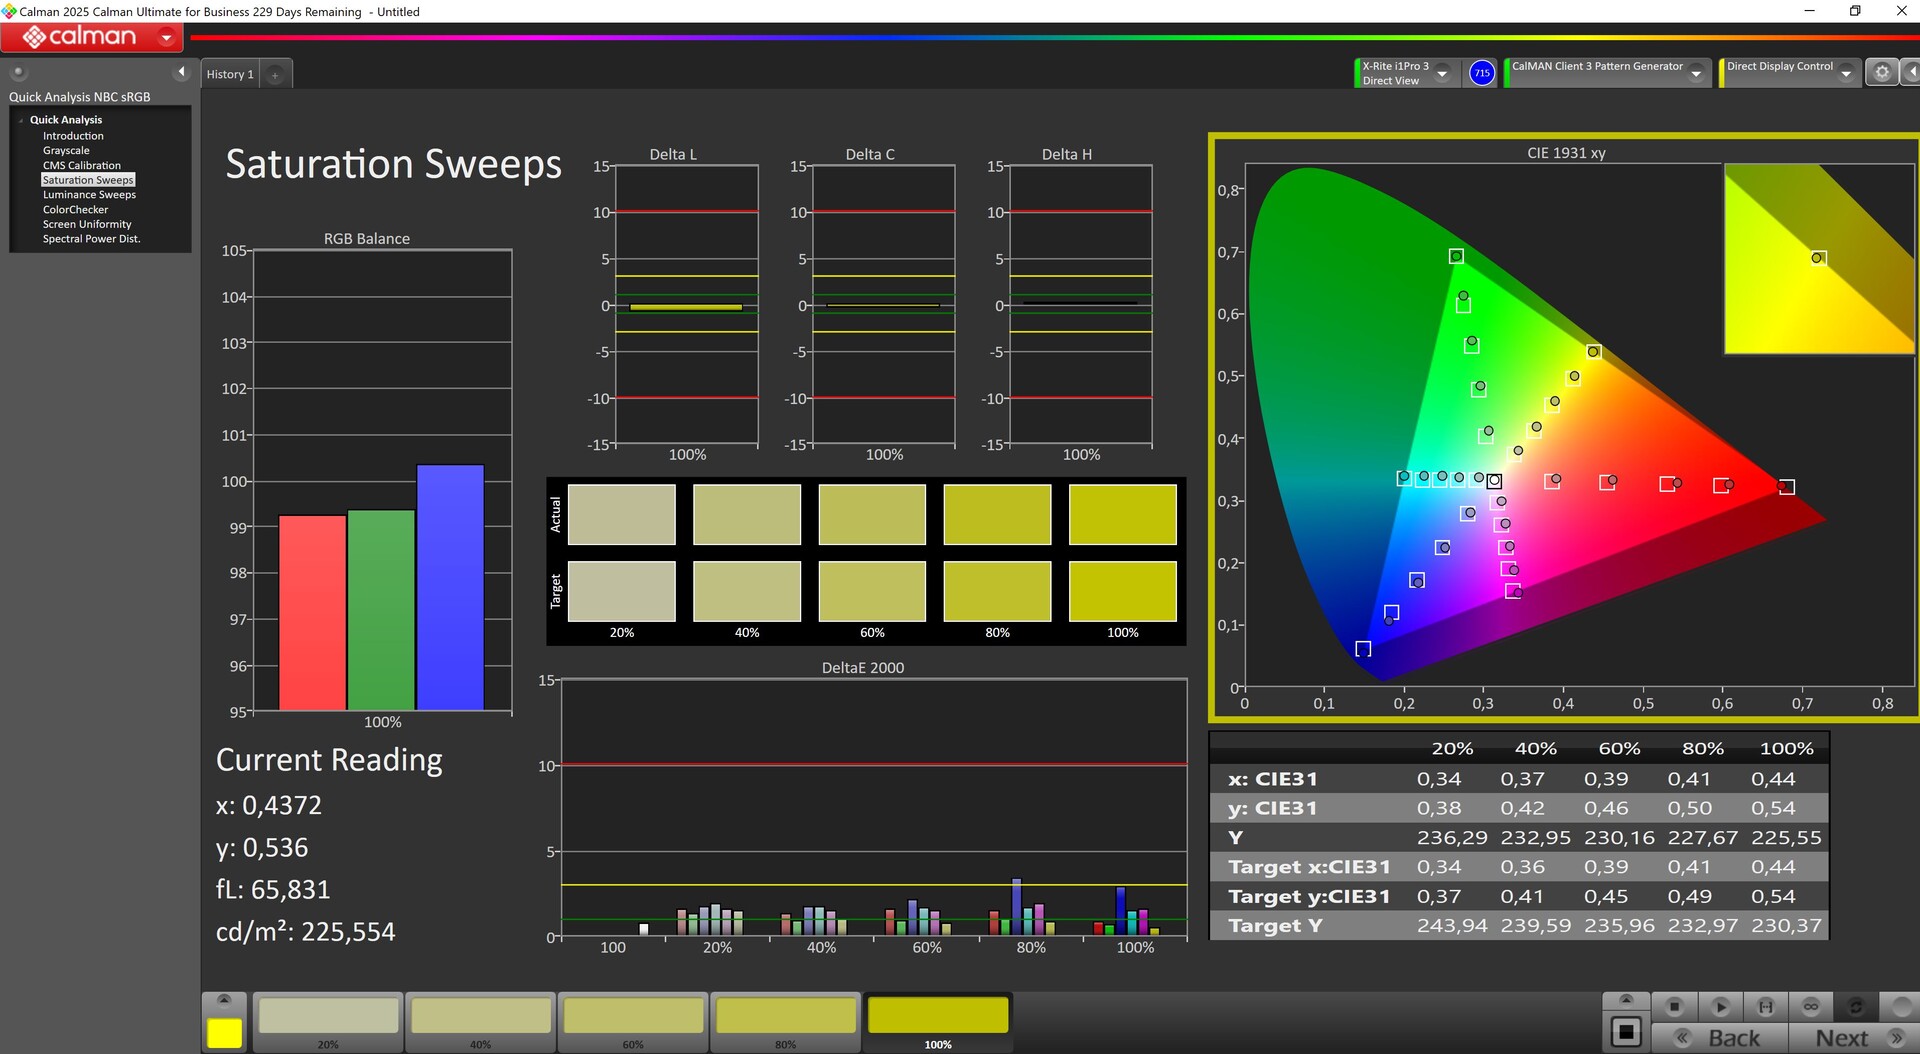
Viene utilizzato un display IPS QHD+ opaco e veloce (circa 4 ms) (2.560 x 1.600 pixel) con 240 Hz. La luminosità media è di circa 470 nit e l'illuminazione è abbastanza uniforme. Tuttavia, il valore del nero è chiaramente troppo alto, il che penalizza il contrasto.
Nota: MSI offre anche un display IPS Full HD con 165 Hz come alternativa.

| |||||||||||||||||||||||||
Distribuzione della luminosità: 91 %
Al centro con la batteria: 486 cd/m²
Contrasto: 659:1 (Nero: 0.74 cd/m²)
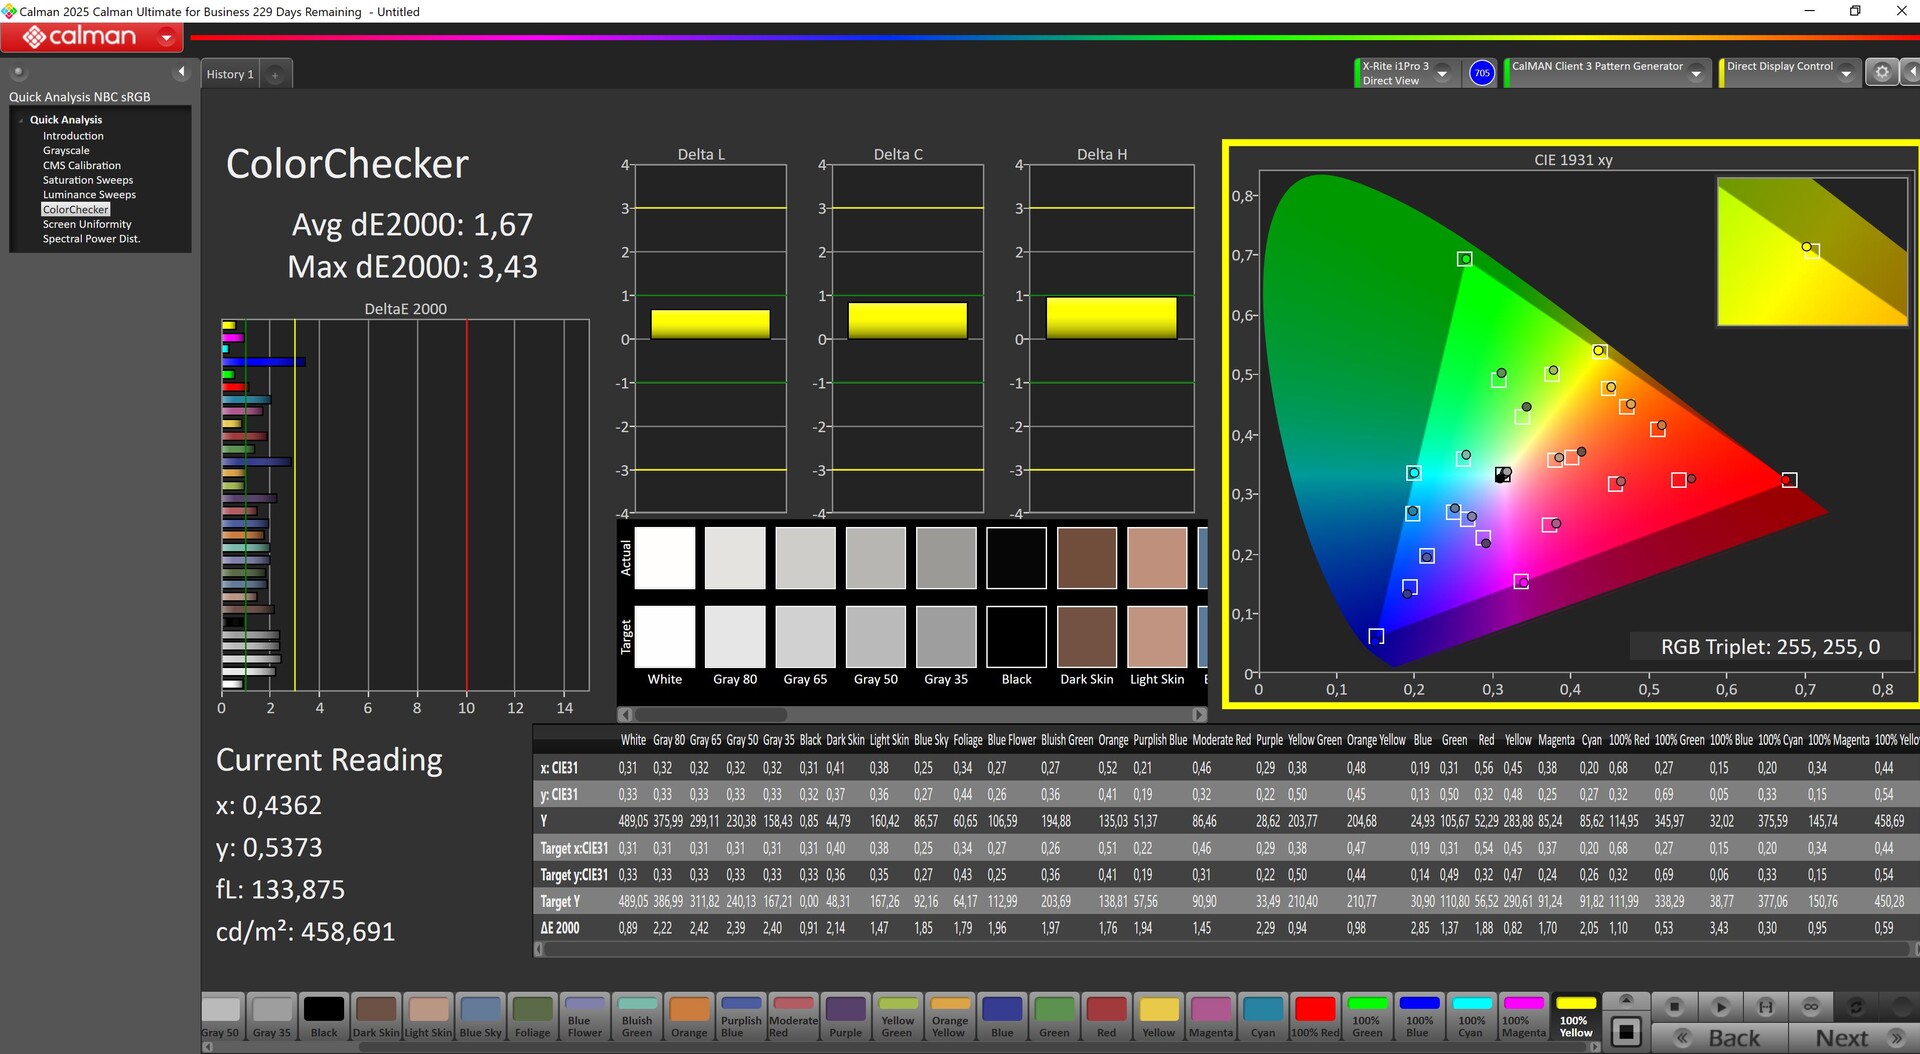
ΔE Color 1.67 | 0.5-29.43 Ø4.83, calibrated: 0.8
ΔE Greyscale 2.08 | 0.09-98 Ø5.1
87.4% AdobeRGB 1998 (Argyll 2.2.0 3D)
100% sRGB (Argyll 2.2.0 3D)
99.6% Display P3 (Argyll 2.2.0 3D)
Gamma: 2.55
| MSI Vector 17 HX AI A2XWIG B170QAN01.2 (AUO84A6), IPS, 2560x1600, 17", 240 Hz | Alienware 16 Area-51 AU Optronics B160QAN, IPS, 2560x1600, 16", 240 Hz | MSI Raider A18 HX A9WIG-080 B180ZAN01.0, MiniLED IPS, 3840x2400, 18", 120 Hz | Aorus MASTER 16 AM6H ATNA60DL03-0 (SDC41AB), OLED, 2560x1600, 16", 240 Hz | MSI Titan 18 HX AI A2XWJG AU Optronics B180ZAN01.0, Mini-LED, 3840x2160, 18", 120 Hz | SCHENKER XMG Neo 16 A25 5090 NE160QDM-NM9, Mini-LED, 2560x1600, 16", 300 Hz | |
|---|---|---|---|---|---|---|
| Display | -1% | 2% | 1% | 1% | 0% | |
| Display P3 Coverage | 99.6 | 96 -4% | 99.9 0% | 95.3 -4% | 99.7 0% | 99.9 0% |
| sRGB Coverage | 100 | 100 0% | 100 0% | 98.8 -1% | 99.9 0% | 100 0% |
| AdobeRGB 1998 Coverage | 87.4 | 89.2 2% | 93.9 7% | 94.1 8% | 90.4 3% | 88.5 1% |
| Response Times | -42% | -377% | 92% | -179% | -277% | |
| Response Time Grey 50% / Grey 80% * | 3.6 ? | 4.8 ? -33% | 23 ? -539% | 0.24 ? 93% | 8.8 ? -144% | 17.4 ? -383% |
| Response Time Black / White * | 4.8 ? | 7.2 ? -50% | 15.1 ? -215% | 0.43 ? 91% | 15 ? -213% | 13 ? -171% |
| PWM Frequency | 15203 | 960 | 15430 ? | 20253 | ||
| PWM Amplitude * | 100 | 47 | 50 | 75 | ||
| Screen | -23% | 759% | 57% | -71% | -23% | |
| Brightness middle | 488 | 554 14% | 510 5% | 435 -11% | 704 44% | 888 82% |
| Brightness | 473 | 532 12% | 470 -1% | 437 -8% | 680 44% | 859 82% |
| Brightness Distribution | 91 | 88 -3% | 85 -7% | 96 5% | 88 -3% | 94 3% |
| Black Level * | 0.74 | 0.52 30% | 0.01 99% | 0.08 89% | ||
| Contrast | 659 | 1065 62% | 51000 7639% | 5438 725% | ||
| Colorchecker dE 2000 * | 1.67 | 2.81 -68% | 4.5 -169% | 2.42 -45% | 4.11 -146% | 3.3 -98% |
| Colorchecker dE 2000 max. * | 3.43 | 8.32 -143% | 7.3 -113% | 4.81 -40% | 6.43 -87% | 5.5 -60% |
| Colorchecker dE 2000 calibrated * | 0.8 | 0.65 19% | 5.7 -613% | 2.03 -154% | 2.5 -213% | 1.5 -88% |
| Greyscale dE 2000 * | 2.08 | 4.7 -126% | 2.3 -11% | 3.11 -50% | 4.9 -136% | 3.8 -83% |
| Gamma | 2.55 86% | 2.3 96% | 2.08 106% | 2.48 89% | 2.03 108% | 2.46 89% |
| CCT | 6240 104% | 6476 100% | 6648 98% | 6270 104% | 6331 103% | 6267 104% |
| Media totale (Programma / Settaggio) | -22% /
-21% | 128% /
434% | 50% /
50% | -83% /
-71% | -100% /
-60% |
* ... Meglio usare valori piccoli
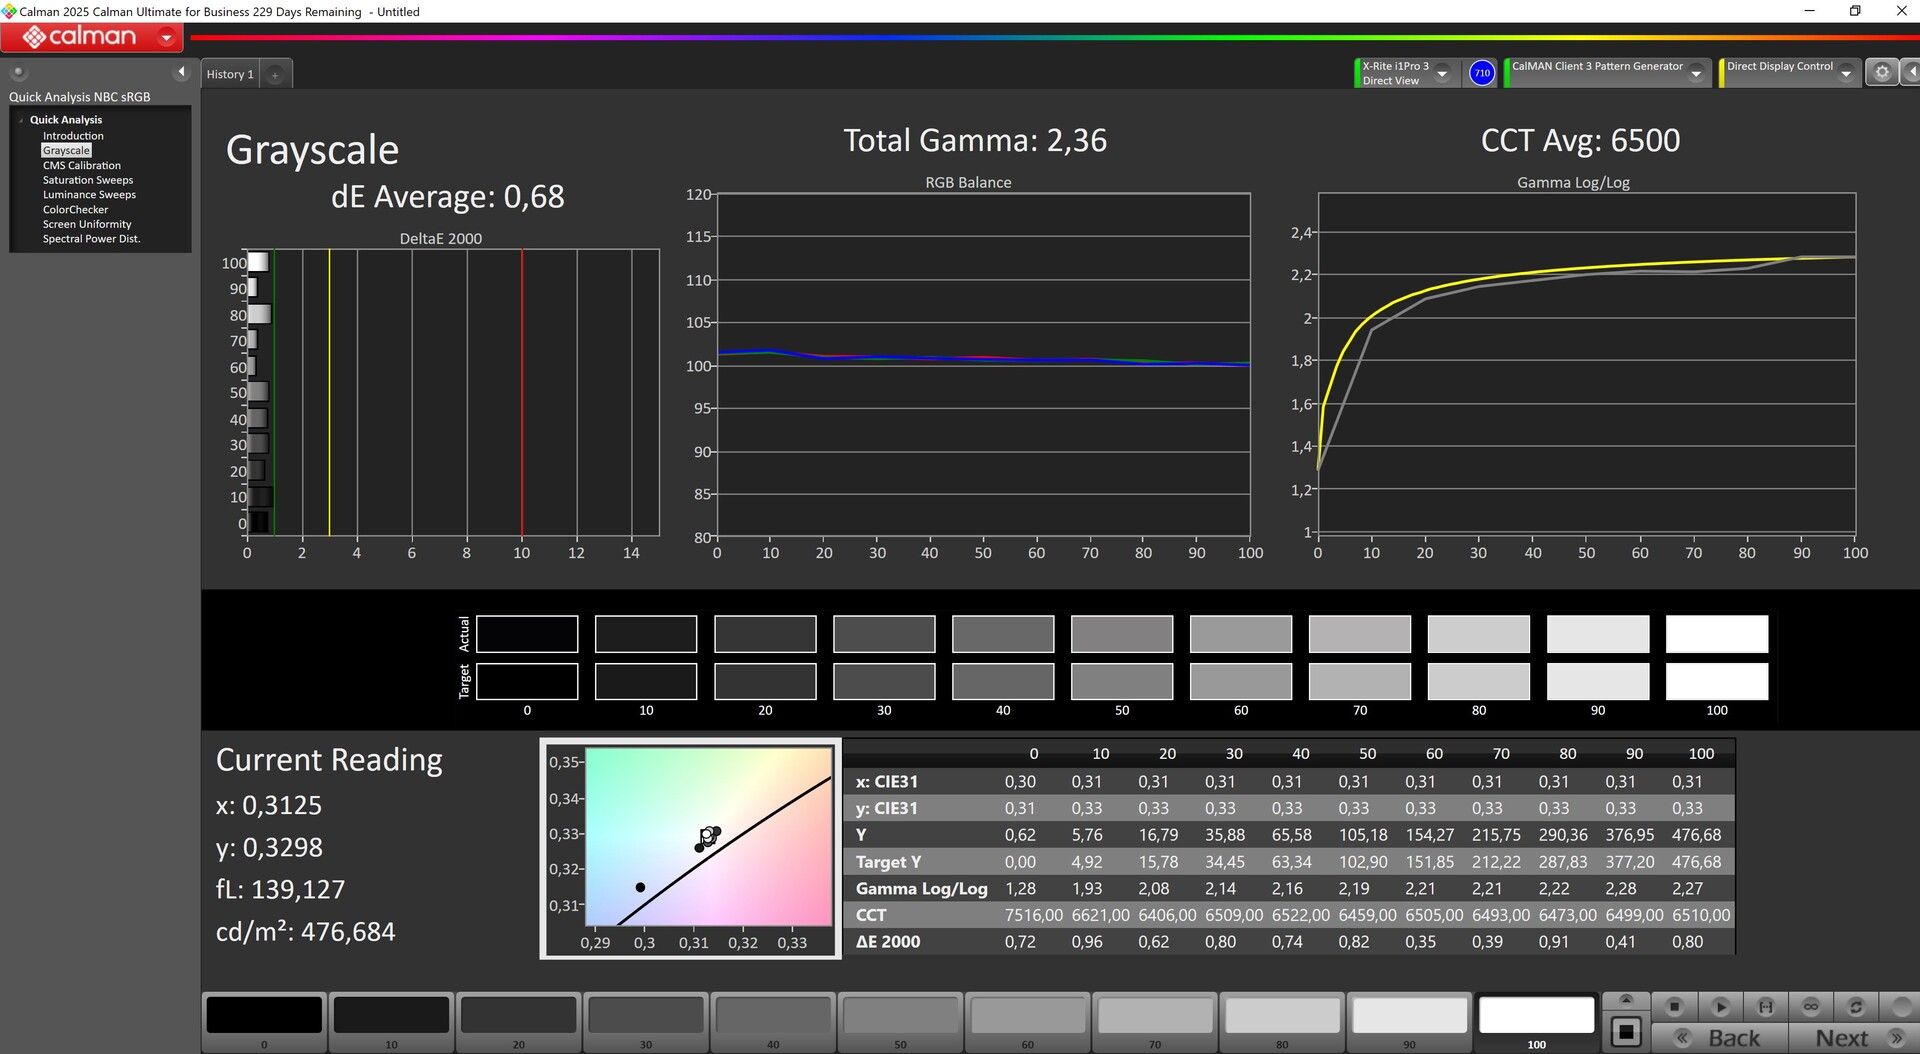
Misuriamo già valori ben calibrati ex fabbrica. Dopo la nostra calibrazione, riduciamo persino le deviazioni a meno di 1.
Tempi di risposta del Display
| ↔ Tempi di risposta dal Nero al Bianco | ||
|---|---|---|
| 4.8 ms ... aumenta ↗ e diminuisce ↘ combinato | ↗ 1.8 ms Incremento | 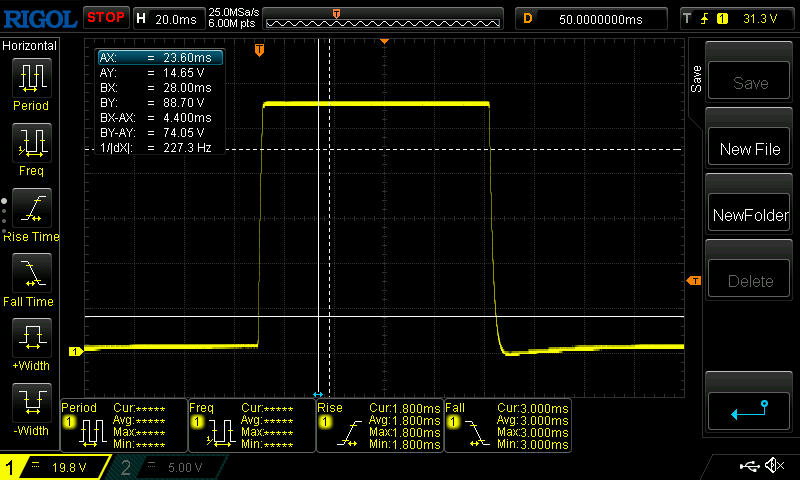 |
| ↘ 3 ms Calo | ||
| Lo schermo ha mostrato valori di risposta molto veloci nei nostri tests ed è molto adatto per i gaming veloce. In confronto, tutti i dispositivi di test variano da 0.1 (minimo) a 240 (massimo) ms. » 15 % di tutti i dispositivi è migliore. Questo significa che i tempi di risposta rilevati sono migliori rispettto alla media di tutti i dispositivi testati (20.5 ms). | ||
| ↔ Tempo di risposta dal 50% Grigio all'80% Grigio | ||
| 3.6 ms ... aumenta ↗ e diminuisce ↘ combinato | ↗ 1.8 ms Incremento | 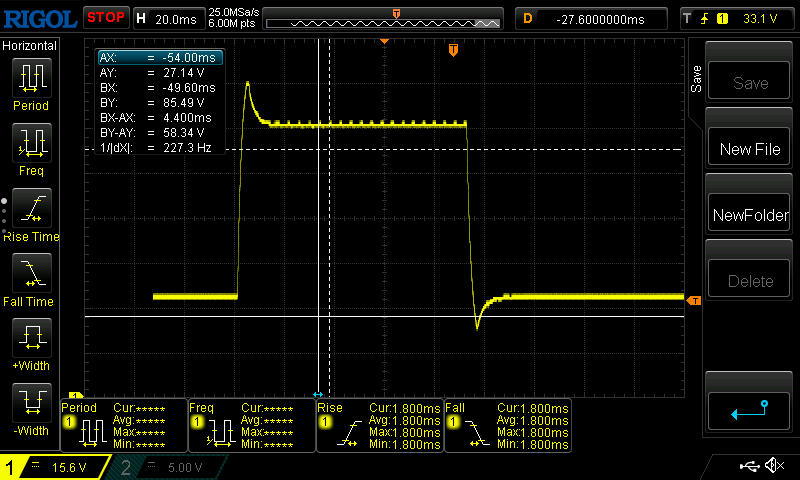 |
| ↘ 1.8 ms Calo | ||
| Lo schermo ha mostrato valori di risposta molto veloci nei nostri tests ed è molto adatto per i gaming veloce. In confronto, tutti i dispositivi di test variano da 0.165 (minimo) a 636 (massimo) ms. » 12 % di tutti i dispositivi è migliore. Questo significa che i tempi di risposta rilevati sono migliori rispettto alla media di tutti i dispositivi testati (32.1 ms). | ||
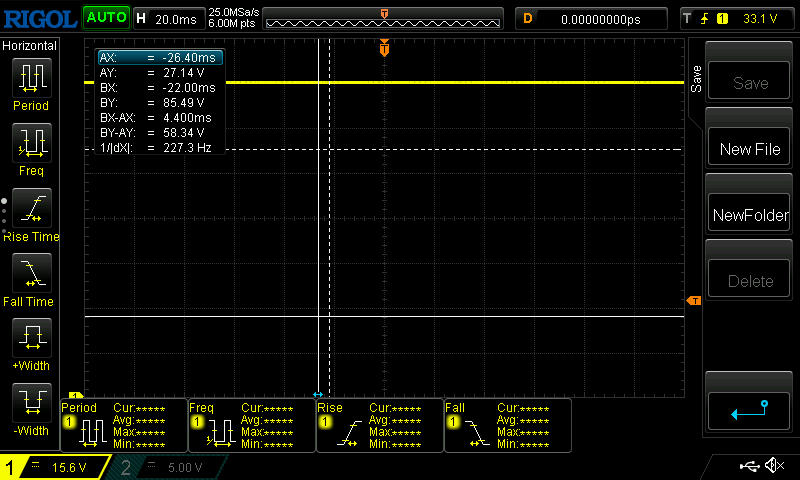
Sfarfallio dello schermo / PWM (Pulse-Width Modulation)
| flickering dello schermo / PWM non rilevato |  | ||
In confronto: 53 % di tutti i dispositivi testati non utilizza PWM per ridurre la luminosita' del display. Se è rilevato PWM, una media di 8343 (minimo: 5 - massimo: 343500) Hz è stata rilevata. | |||


Prestazioni - Crollo della CPU sotto carico continuo
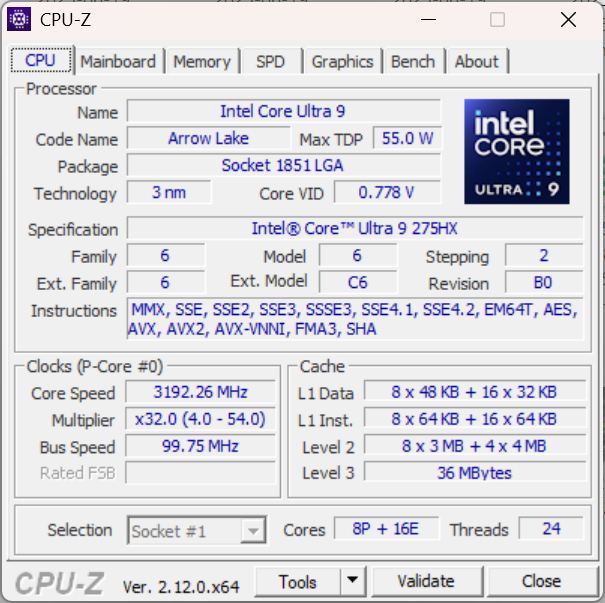
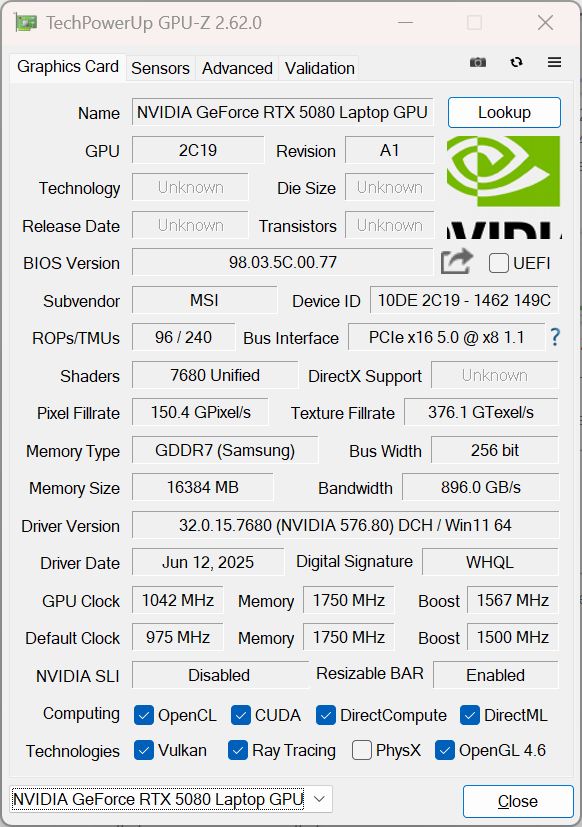
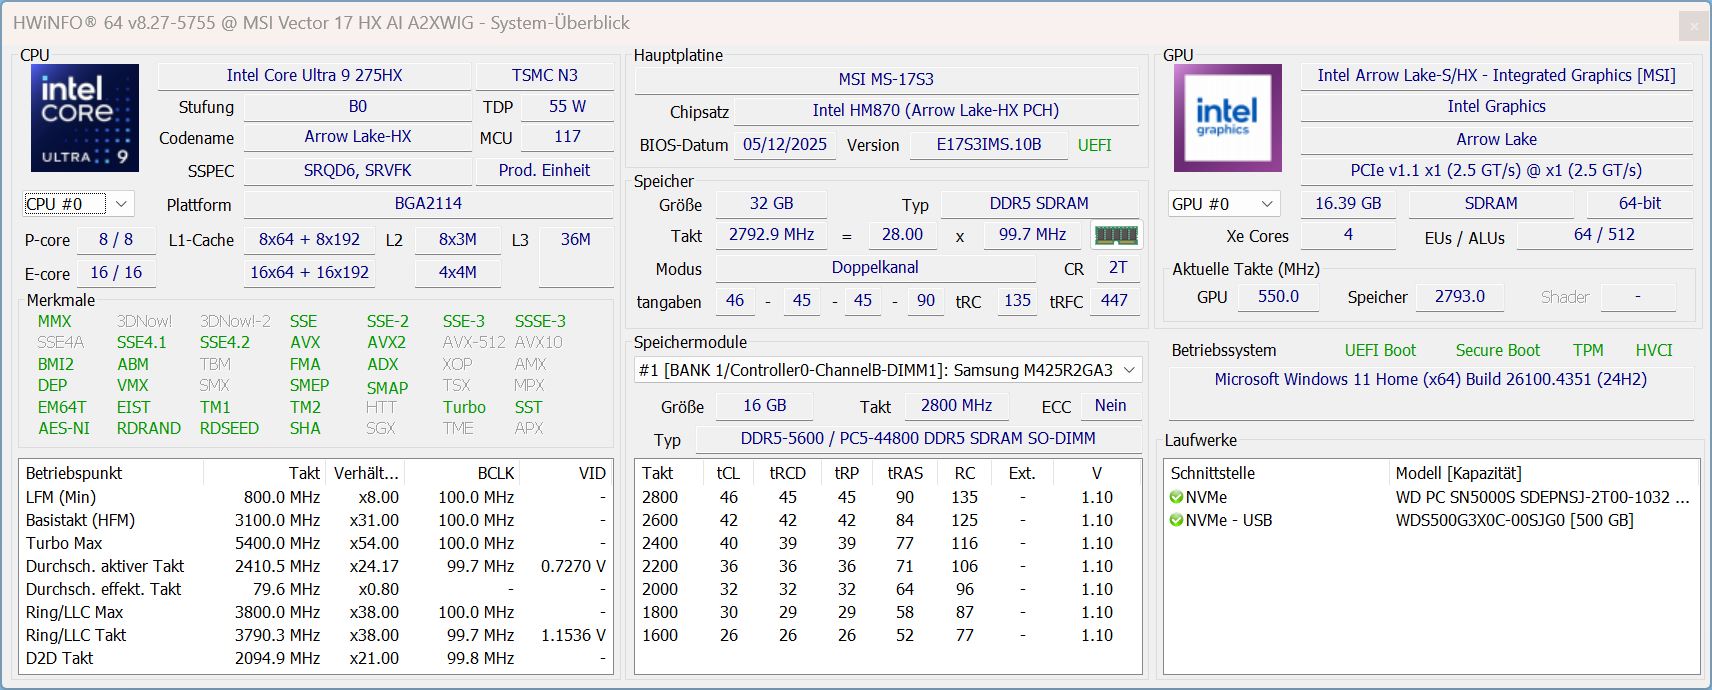
Con Intel Core Ultra 9 275HX, RTX 5080, 2 TB SSD e 32 GB di RAM, il Vector 17 HX è un gamer di fascia alta e dovrebbe essere equipaggiato per tutti i titoli attuali.
Condizioni del test
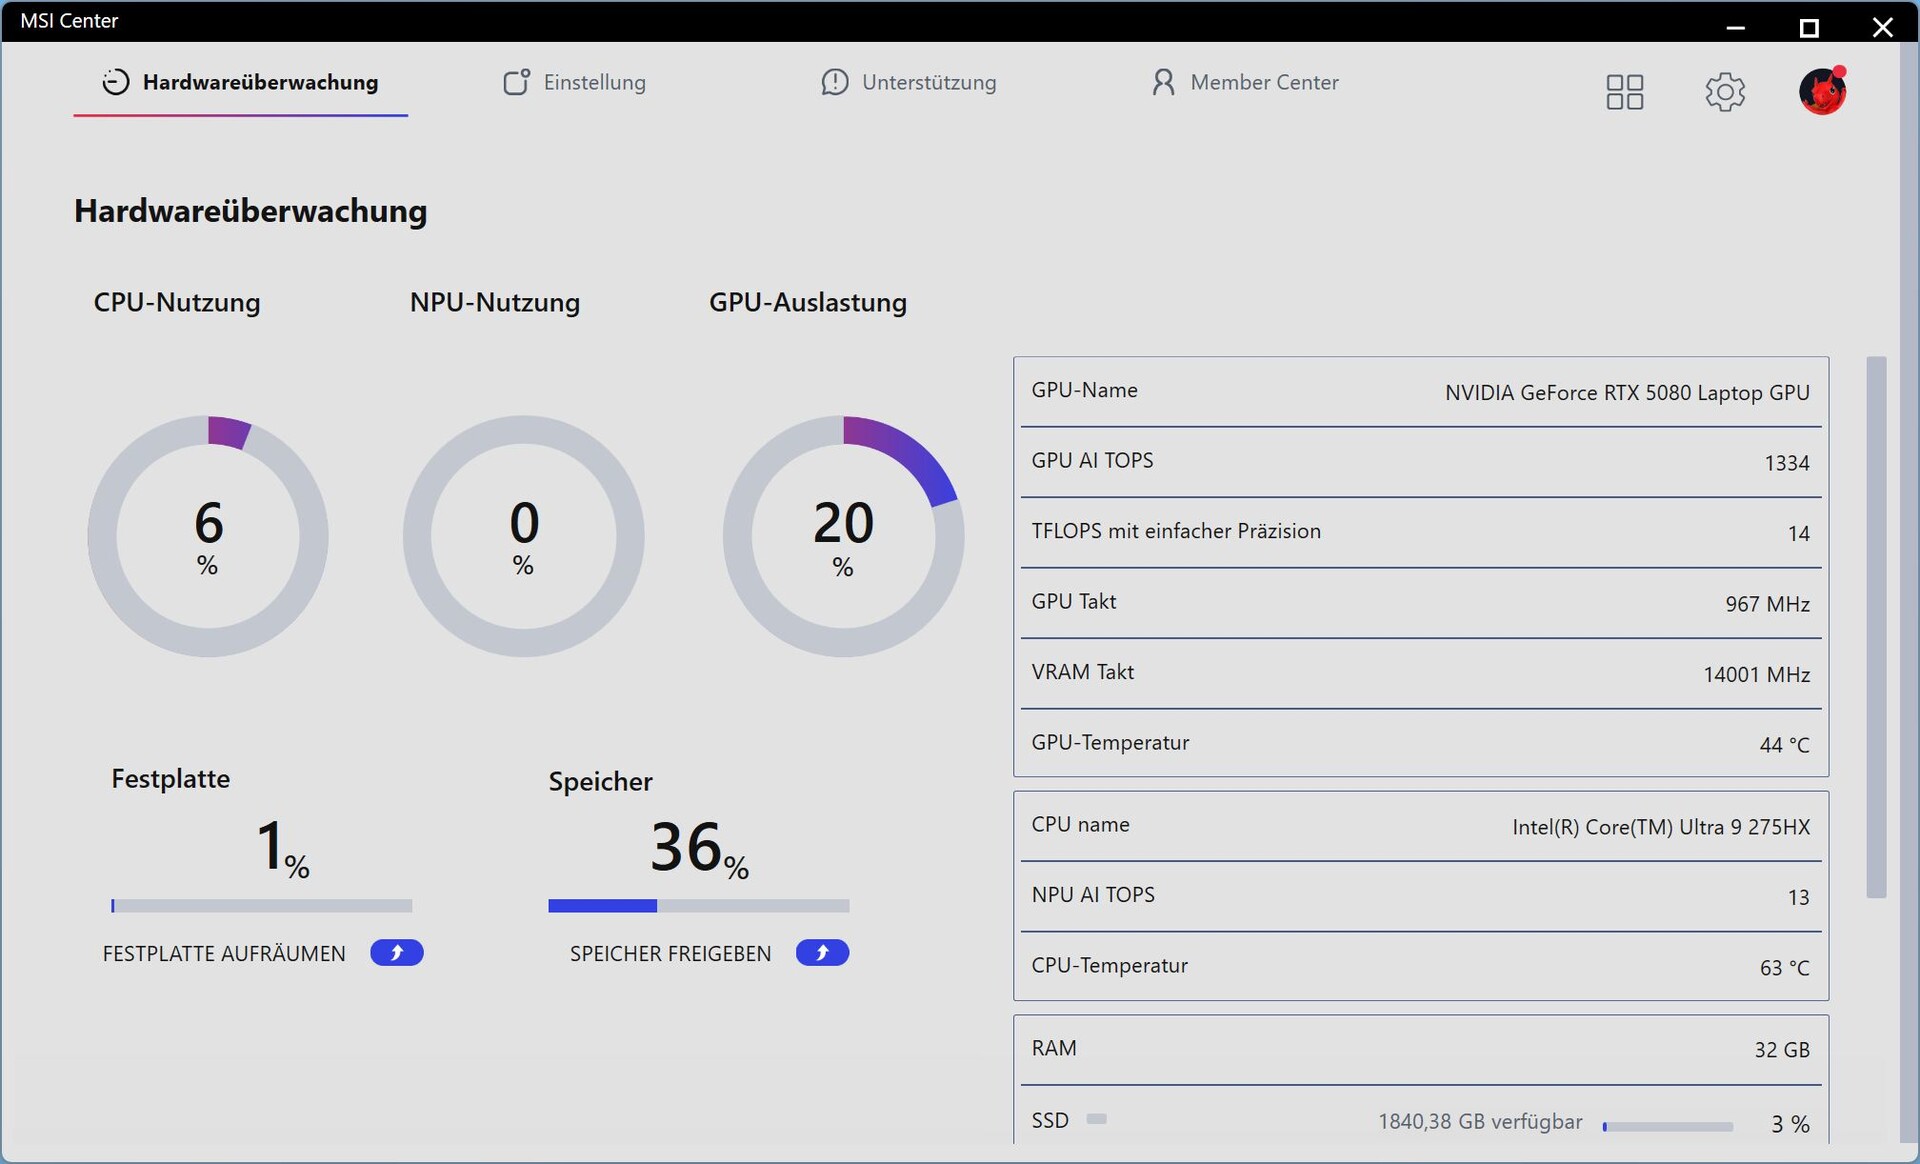
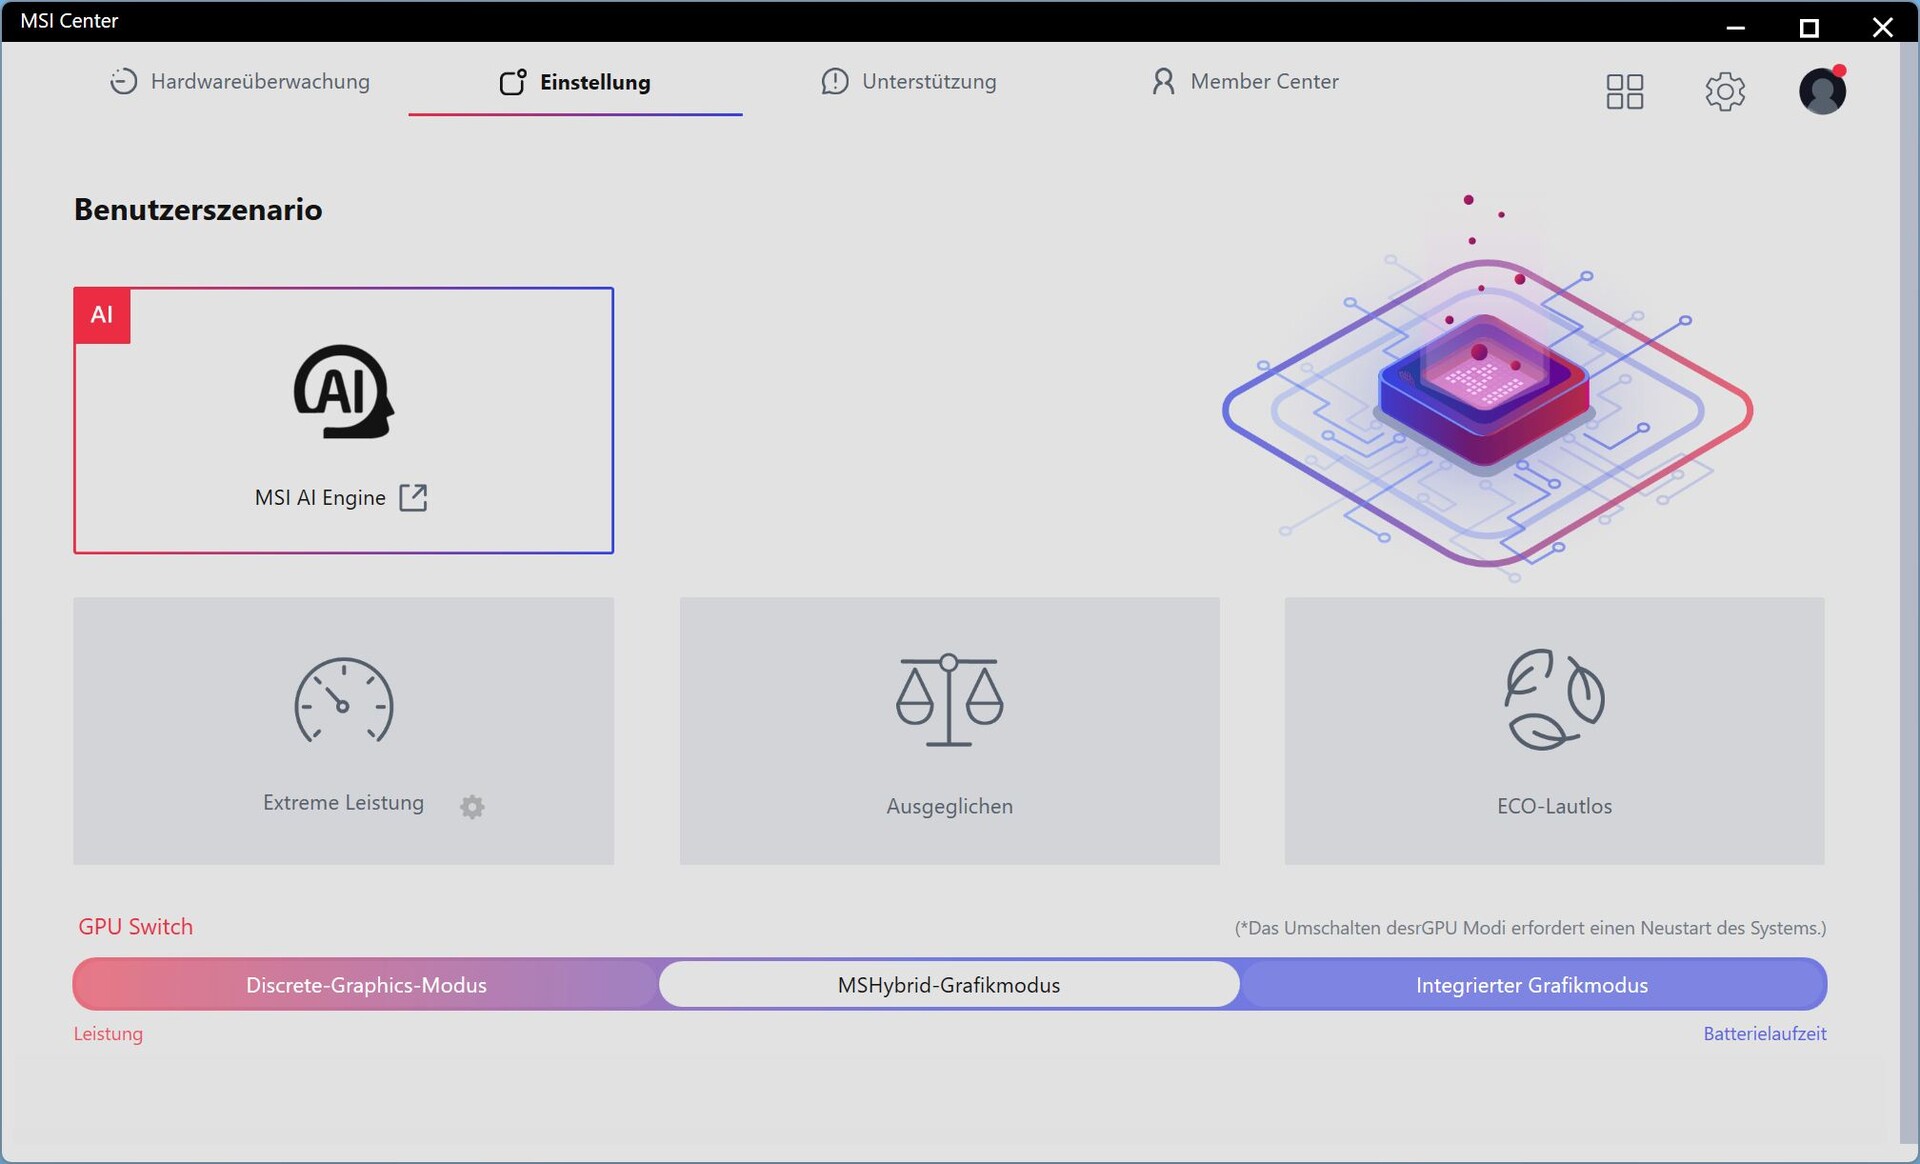
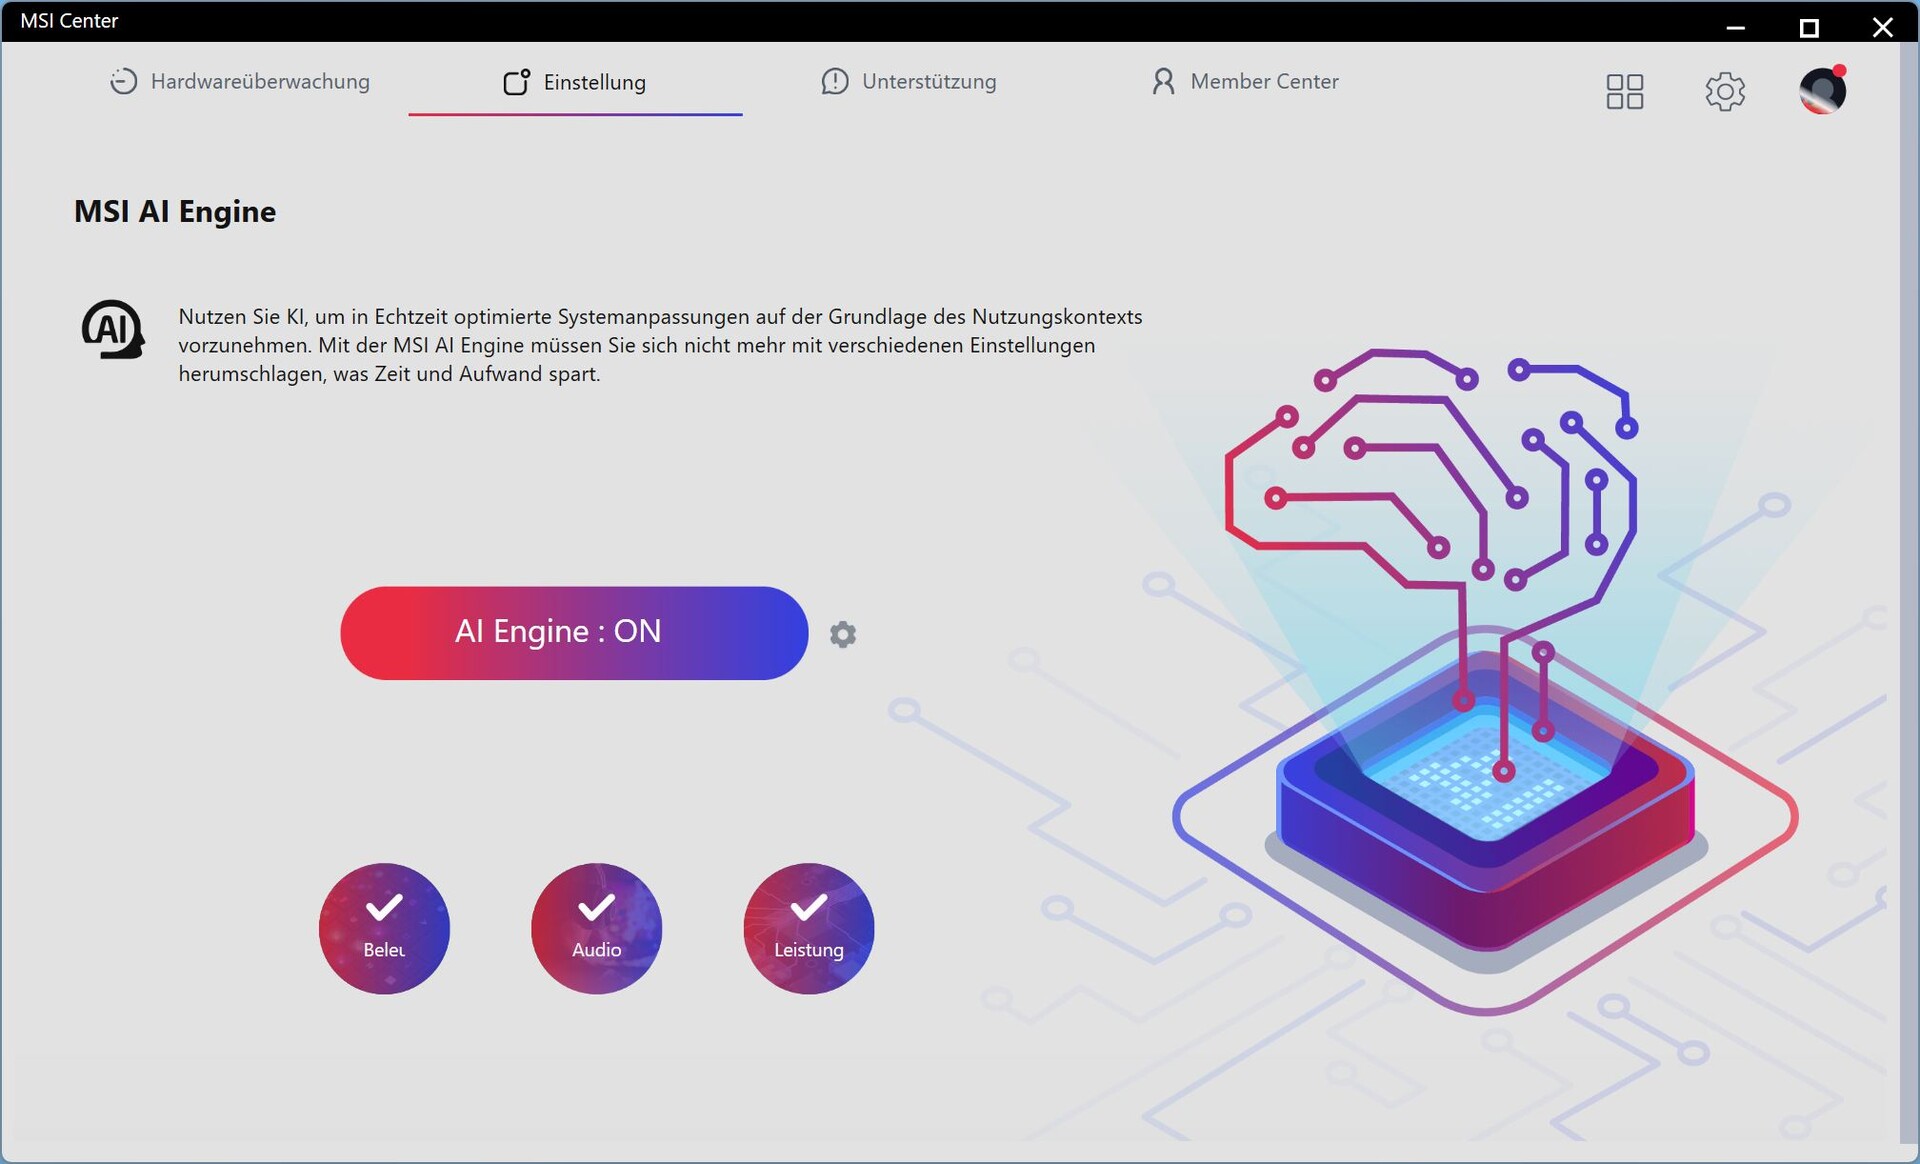
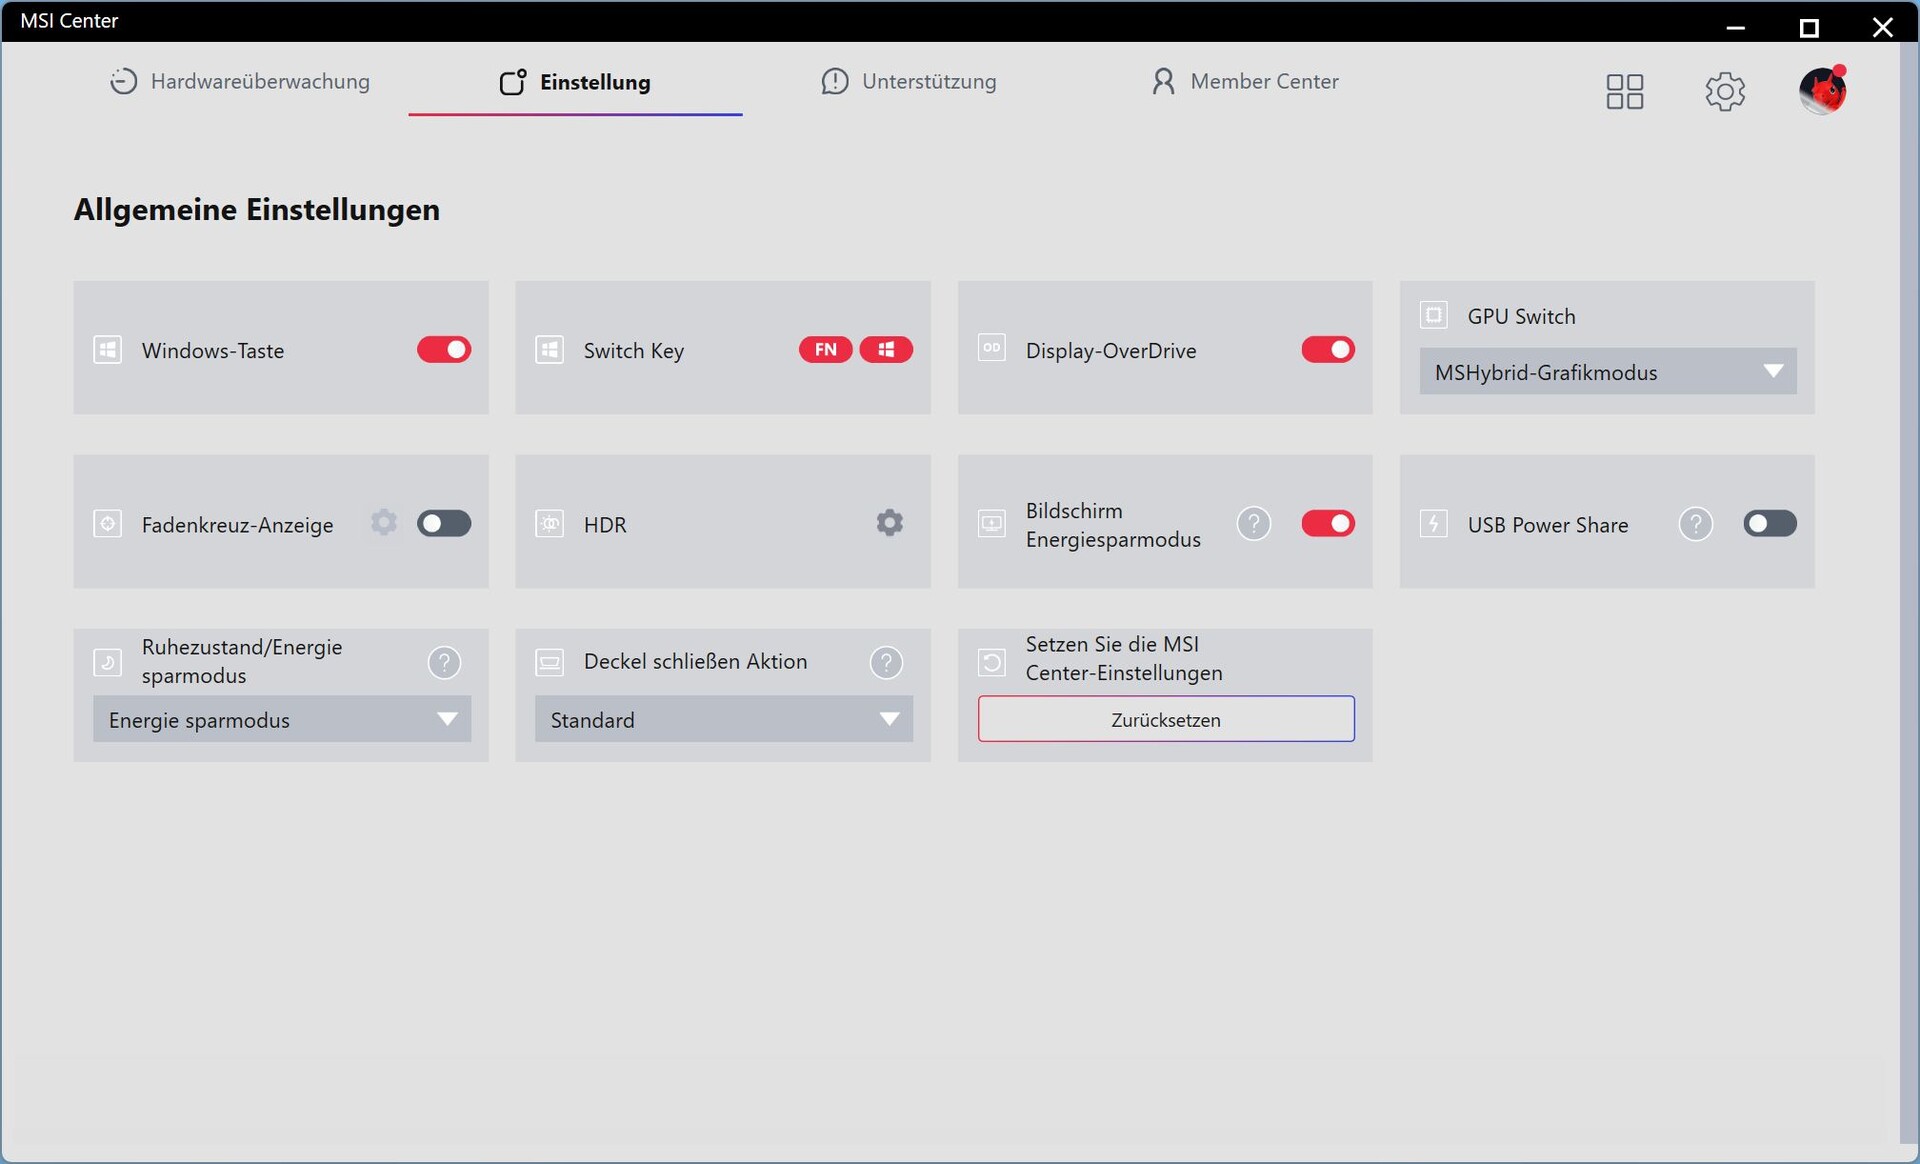
Dei quattro profili di prestazioni, selezioniamo il motore AI; in MSI Center è integrato anche un MUX.
Inizialmente abbiamo dovuto fare i conti con un consumo in idle molto elevato, fino a 60 W, e con livelli di rumore eccessivi durante il test. Un aggiornamento del BIOS e di MSI Center inizialmente non ha portato alcun miglioramento. Il problema è stato risolto solo dopo un'ulteriore reinstallazione di Windows. Abbiamo dovuto effettuare nuovamente diverse misurazioni.
| MSI Center Mode | MSI AI Engine | Prestazioni estreme | Bilanciato | ECO Silent |
| Cyberpunk 2077 Rumore in dB(A) | 60,35 | 60,35 | 47,4 | 36,21 |
| Consumo energetico Cyberpunk | 313 W | 313 W | 253 W | 134 W |
| Consumo della GPU | 160 W | 160 W | 130 W | 80 W |
| Prestazioni di Cyberpunk 2077 (FHD/Ultra) | 134,6 fps | 134,5 fps | 123 fps | 78,4 fps |
| Punteggio Cinebench R15 Multi | 5112 Punti | 5430 Punti | 4813 Punti | 2019 Punti |
| CPU PL1 | 110 watt | 150 watt | 65 watt | 20 watt |
| CPU PL2 | 150 watt | 150 watt | 110 watt | 25 watt |
Processore
Il Core Ultra 9 275HX con 24 core (8 core P e 16 core E, fino a 5,4 GHz) è strozzato sotto carico continuo: mantiene una prestazione media per 2 cicli, dopodiché scende di oltre 1.000 punti. Le prestazioni a lungo termine sono quindi più deboli di quelle di un Core Ultra 7 255HX. In modalità Extreme Performance, tuttavia, le prestazioni sono stabili.
In tutti i test della CPU, il Vector 17 HX è circa il 6 percento indietro rispetto alla media con la stessa CPU. Circa il 59 percento delle prestazioni della CPU si perde in modalità batteria.
Cinebench R15 Multi Endurance test
Cinebench R23: Multi Core | Single Core
Cinebench R20: CPU (Multi Core) | CPU (Single Core)
Cinebench R15: CPU Multi 64Bit | CPU Single 64Bit
Blender: v2.79 BMW27 CPU
7-Zip 18.03: 7z b 4 | 7z b 4 -mmt1
Geekbench 6.4: Multi-Core | Single-Core
Geekbench 5.5: Multi-Core | Single-Core
HWBOT x265 Benchmark v2.2: 4k Preset
LibreOffice : 20 Documents To PDF
R Benchmark 2.5: Overall mean
| CPU Performance Rating | |
| SCHENKER XMG Neo 16 A25 5090 | |
| MSI Raider A18 HX A9WIG-080 | |
| MSI Titan 18 HX AI A2XWJG | |
| Media Intel Core Ultra 9 275HX | |
| Aorus MASTER 16 AM6H | |
| MSI Vector 17 HX AI A2XWIG | |
| Alienware 16 Area-51 | |
| Media della classe Gaming | |
| Cinebench R23 / Multi Core | |
| MSI Titan 18 HX AI A2XWJG | |
| SCHENKER XMG Neo 16 A25 5090 | |
| MSI Raider A18 HX A9WIG-080 | |
| Aorus MASTER 16 AM6H | |
| Media Intel Core Ultra 9 275HX (30712 - 40970, n=18) | |
| MSI Vector 17 HX AI A2XWIG | |
| Alienware 16 Area-51 | |
| Media della classe Gaming (5668 - 40970, n=145, ultimi 2 anni) | |
| Cinebench R23 / Single Core | |
| Aorus MASTER 16 AM6H | |
| Media Intel Core Ultra 9 275HX (2009 - 2267, n=18) | |
| MSI Titan 18 HX AI A2XWJG | |
| MSI Vector 17 HX AI A2XWIG | |
| SCHENKER XMG Neo 16 A25 5090 | |
| MSI Raider A18 HX A9WIG-080 | |
| Alienware 16 Area-51 | |
| Media della classe Gaming (1136 - 2267, n=145, ultimi 2 anni) | |
| Cinebench R20 / CPU (Multi Core) | |
| MSI Titan 18 HX AI A2XWJG | |
| SCHENKER XMG Neo 16 A25 5090 | |
| MSI Raider A18 HX A9WIG-080 | |
| Aorus MASTER 16 AM6H | |
| Media Intel Core Ultra 9 275HX (12026 - 16108, n=18) | |
| Alienware 16 Area-51 | |
| MSI Vector 17 HX AI A2XWIG | |
| Media della classe Gaming (2179 - 16108, n=145, ultimi 2 anni) | |
| Cinebench R20 / CPU (Single Core) | |
| Aorus MASTER 16 AM6H | |
| MSI Raider A18 HX A9WIG-080 | |
| SCHENKER XMG Neo 16 A25 5090 | |
| Media Intel Core Ultra 9 275HX (774 - 870, n=18) | |
| MSI Titan 18 HX AI A2XWJG | |
| MSI Vector 17 HX AI A2XWIG | |
| Alienware 16 Area-51 | |
| Media della classe Gaming (439 - 870, n=145, ultimi 2 anni) | |
| Cinebench R15 / CPU Multi 64Bit | |
| MSI Titan 18 HX AI A2XWJG | |
| SCHENKER XMG Neo 16 A25 5090 | |
| MSI Raider A18 HX A9WIG-080 | |
| Aorus MASTER 16 AM6H | |
| Media Intel Core Ultra 9 275HX (4756 - 6271, n=18) | |
| MSI Vector 17 HX AI A2XWIG | |
| Alienware 16 Area-51 | |
| Media della classe Gaming (1537 - 6271, n=145, ultimi 2 anni) | |
| Cinebench R15 / CPU Single 64Bit | |
| MSI Vector 17 HX AI A2XWIG | |
| MSI Vector 17 HX AI A2XWIG | |
| SCHENKER XMG Neo 16 A25 5090 | |
| Media Intel Core Ultra 9 275HX (306 - 343, n=19) | |
| Aorus MASTER 16 AM6H | |
| MSI Titan 18 HX AI A2XWJG | |
| MSI Raider A18 HX A9WIG-080 | |
| Alienware 16 Area-51 | |
| Media della classe Gaming (191.9 - 343, n=144, ultimi 2 anni) | |
| Blender / v2.79 BMW27 CPU | |
| Media della classe Gaming (80 - 517, n=142, ultimi 2 anni) | |
| MSI Vector 17 HX AI A2XWIG | |
| Alienware 16 Area-51 | |
| Media Intel Core Ultra 9 275HX (82 - 116, n=18) | |
| Aorus MASTER 16 AM6H | |
| MSI Titan 18 HX AI A2XWJG | |
| MSI Raider A18 HX A9WIG-080 | |
| SCHENKER XMG Neo 16 A25 5090 | |
| 7-Zip 18.03 / 7z b 4 | |
| SCHENKER XMG Neo 16 A25 5090 | |
| MSI Raider A18 HX A9WIG-080 | |
| MSI Titan 18 HX AI A2XWJG | |
| Media Intel Core Ultra 9 275HX (98236 - 124155, n=18) | |
| Aorus MASTER 16 AM6H | |
| Alienware 16 Area-51 | |
| MSI Vector 17 HX AI A2XWIG | |
| Media della classe Gaming (23795 - 148086, n=143, ultimi 2 anni) | |
| 7-Zip 18.03 / 7z b 4 -mmt1 | |
| SCHENKER XMG Neo 16 A25 5090 | |
| MSI Raider A18 HX A9WIG-080 | |
| MSI Titan 18 HX AI A2XWJG | |
| Media Intel Core Ultra 9 275HX (6063 - 7149, n=18) | |
| Aorus MASTER 16 AM6H | |
| MSI Vector 17 HX AI A2XWIG | |
| Media della classe Gaming (4199 - 7573, n=143, ultimi 2 anni) | |
| Alienware 16 Area-51 | |
| Geekbench 6.4 / Multi-Core | |
| MSI Titan 18 HX AI A2XWJG | |
| SCHENKER XMG Neo 16 A25 5090 | |
| MSI Raider A18 HX A9WIG-080 | |
| Media Intel Core Ultra 9 275HX (16033 - 21668, n=19) | |
| Aorus MASTER 16 AM6H | |
| MSI Vector 17 HX AI A2XWIG | |
| Alienware 16 Area-51 | |
| Media della classe Gaming (5340 - 22104, n=140, ultimi 2 anni) | |
| Geekbench 6.4 / Single-Core | |
| SCHENKER XMG Neo 16 A25 5090 | |
| MSI Raider A18 HX A9WIG-080 | |
| MSI Vector 17 HX AI A2XWIG | |
| MSI Titan 18 HX AI A2XWJG | |
| Media Intel Core Ultra 9 275HX (2886 - 3160, n=19) | |
| Aorus MASTER 16 AM6H | |
| Alienware 16 Area-51 | |
| Media della classe Gaming (1490 - 3219, n=140, ultimi 2 anni) | |
| Geekbench 5.5 / Multi-Core | |
| MSI Titan 18 HX AI A2XWJG | |
| SCHENKER XMG Neo 16 A25 5090 | |
| MSI Raider A18 HX A9WIG-080 | |
| Media Intel Core Ultra 9 275HX (19105 - 25855, n=18) | |
| Aorus MASTER 16 AM6H | |
| Alienware 16 Area-51 | |
| MSI Vector 17 HX AI A2XWIG | |
| Media della classe Gaming (4557 - 27010, n=142, ultimi 2 anni) | |
| Geekbench 5.5 / Single-Core | |
| MSI Raider A18 HX A9WIG-080 | |
| SCHENKER XMG Neo 16 A25 5090 | |
| MSI Titan 18 HX AI A2XWJG | |
| MSI Vector 17 HX AI A2XWIG | |
| Aorus MASTER 16 AM6H | |
| Media Intel Core Ultra 9 275HX (2033 - 2292, n=18) | |
| Alienware 16 Area-51 | |
| Media della classe Gaming (986 - 2423, n=142, ultimi 2 anni) | |
| HWBOT x265 Benchmark v2.2 / 4k Preset | |
| MSI Titan 18 HX AI A2XWJG | |
| MSI Raider A18 HX A9WIG-080 | |
| SCHENKER XMG Neo 16 A25 5090 | |
| Media Intel Core Ultra 9 275HX (30.7 - 43.8, n=18) | |
| Aorus MASTER 16 AM6H | |
| MSI Vector 17 HX AI A2XWIG | |
| Alienware 16 Area-51 | |
| Media della classe Gaming (7.7 - 44.3, n=143, ultimi 2 anni) | |
| LibreOffice / 20 Documents To PDF | |
| Media della classe Gaming (19 - 96.6, n=141, ultimi 2 anni) | |
| MSI Titan 18 HX AI A2XWJG | |
| SCHENKER XMG Neo 16 A25 5090 | |
| MSI Raider A18 HX A9WIG-080 | |
| Media Intel Core Ultra 9 275HX (33.2 - 62.1, n=18) | |
| Aorus MASTER 16 AM6H | |
| MSI Vector 17 HX AI A2XWIG | |
| Alienware 16 Area-51 | |
| R Benchmark 2.5 / Overall mean | |
| Aorus MASTER 16 AM6H | |
| Media della classe Gaming (0.3551 - 0.759, n=144, ultimi 2 anni) | |
| Alienware 16 Area-51 | |
| Media Intel Core Ultra 9 275HX (0.3943 - 0.4568, n=18) | |
| MSI Vector 17 HX AI A2XWIG | |
| MSI Titan 18 HX AI A2XWJG | |
| MSI Raider A18 HX A9WIG-080 | |
| SCHENKER XMG Neo 16 A25 5090 | |
* ... Meglio usare valori piccoli
AIDA64: FP32 Ray-Trace | FPU Julia | CPU SHA3 | CPU Queen | FPU SinJulia | FPU Mandel | CPU AES | CPU ZLib | FP64 Ray-Trace | CPU PhotoWorxx
| Performance Rating | |
| SCHENKER XMG Neo 16 E25 RTX 5090 Laptop | |
| Medion Erazer Beast 16 X1 Ultimate | |
| Aorus MASTER 16 AM6H | |
| Lenovo Legion 5 Pro 16IAX10H | |
| Media Intel Core Ultra 9 275HX | |
| Alienware 16 Area-51 | |
| MSI Vector 17 HX AI A2XWIG | |
| Media della classe Gaming | |
| MSI Vector 16 HX AI A2XWHG | |
| AIDA64 / FP32 Ray-Trace | |
| SCHENKER XMG Neo 16 E25 RTX 5090 Laptop | |
| Medion Erazer Beast 16 X1 Ultimate | |
| Aorus MASTER 16 AM6H | |
| Media Intel Core Ultra 9 275HX (28067 - 39895, n=17) | |
| Lenovo Legion 5 Pro 16IAX10H | |
| Alienware 16 Area-51 | |
| MSI Vector 17 HX AI A2XWIG | |
| MSI Vector 16 HX AI A2XWHG | |
| Media della classe Gaming (7192 - 85542, n=142, ultimi 2 anni) | |
| AIDA64 / FPU Julia | |
| SCHENKER XMG Neo 16 E25 RTX 5090 Laptop | |
| Medion Erazer Beast 16 X1 Ultimate | |
| Aorus MASTER 16 AM6H | |
| Media Intel Core Ultra 9 275HX (140254 - 200744, n=17) | |
| Lenovo Legion 5 Pro 16IAX10H | |
| Alienware 16 Area-51 | |
| MSI Vector 17 HX AI A2XWIG | |
| MSI Vector 16 HX AI A2XWHG | |
| Media della classe Gaming (35040 - 252486, n=142, ultimi 2 anni) | |
| AIDA64 / CPU SHA3 | |
| SCHENKER XMG Neo 16 E25 RTX 5090 Laptop | |
| Medion Erazer Beast 16 X1 Ultimate | |
| Aorus MASTER 16 AM6H | |
| Media Intel Core Ultra 9 275HX (6766 - 9734, n=17) | |
| Lenovo Legion 5 Pro 16IAX10H | |
| Alienware 16 Area-51 | |
| MSI Vector 17 HX AI A2XWIG | |
| MSI Vector 16 HX AI A2XWHG | |
| Media della classe Gaming (1728 - 10389, n=142, ultimi 2 anni) | |
| AIDA64 / CPU Queen | |
| SCHENKER XMG Neo 16 E25 RTX 5090 Laptop | |
| Medion Erazer Beast 16 X1 Ultimate | |
| Lenovo Legion 5 Pro 16IAX10H | |
| Aorus MASTER 16 AM6H | |
| Media Intel Core Ultra 9 275HX (113887 - 140937, n=17) | |
| Alienware 16 Area-51 | |
| MSI Vector 17 HX AI A2XWIG | |
| Media della classe Gaming (50699 - 200651, n=142, ultimi 2 anni) | |
| MSI Vector 16 HX AI A2XWHG | |
| AIDA64 / FPU SinJulia | |
| Medion Erazer Beast 16 X1 Ultimate | |
| SCHENKER XMG Neo 16 E25 RTX 5090 Laptop | |
| Media della classe Gaming (5020 - 33636, n=142, ultimi 2 anni) | |
| Lenovo Legion 5 Pro 16IAX10H | |
| Alienware 16 Area-51 | |
| Aorus MASTER 16 AM6H | |
| Media Intel Core Ultra 9 275HX (11172 - 14415, n=17) | |
| MSI Vector 17 HX AI A2XWIG | |
| MSI Vector 16 HX AI A2XWHG | |
| AIDA64 / FPU Mandel | |
| SCHENKER XMG Neo 16 E25 RTX 5090 Laptop | |
| Aorus MASTER 16 AM6H | |
| Medion Erazer Beast 16 X1 Ultimate | |
| Media Intel Core Ultra 9 275HX (72596 - 104217, n=17) | |
| Lenovo Legion 5 Pro 16IAX10H | |
| Alienware 16 Area-51 | |
| MSI Vector 17 HX AI A2XWIG | |
| MSI Vector 16 HX AI A2XWHG | |
| Media della classe Gaming (17585 - 134044, n=142, ultimi 2 anni) | |
| AIDA64 / CPU AES | |
| SCHENKER XMG Neo 16 E25 RTX 5090 Laptop | |
| Medion Erazer Beast 16 X1 Ultimate | |
| Lenovo Legion 5 Pro 16IAX10H | |
| Alienware 16 Area-51 | |
| Aorus MASTER 16 AM6H | |
| Media Intel Core Ultra 9 275HX (107195 - 136847, n=17) | |
| Media della classe Gaming (19065 - 328679, n=142, ultimi 2 anni) | |
| MSI Vector 17 HX AI A2XWIG | |
| MSI Vector 16 HX AI A2XWHG | |
| AIDA64 / CPU ZLib | |
| SCHENKER XMG Neo 16 E25 RTX 5090 Laptop | |
| Medion Erazer Beast 16 X1 Ultimate | |
| Lenovo Legion 5 Pro 16IAX10H | |
| Aorus MASTER 16 AM6H | |
| Media Intel Core Ultra 9 275HX (1599 - 2263, n=17) | |
| Alienware 16 Area-51 | |
| MSI Vector 17 HX AI A2XWIG | |
| MSI Vector 16 HX AI A2XWHG | |
| Media della classe Gaming (373 - 2531, n=142, ultimi 2 anni) | |
| AIDA64 / FP64 Ray-Trace | |
| SCHENKER XMG Neo 16 E25 RTX 5090 Laptop | |
| Medion Erazer Beast 16 X1 Ultimate | |
| Aorus MASTER 16 AM6H | |
| Media Intel Core Ultra 9 275HX (14847 - 21542, n=17) | |
| Lenovo Legion 5 Pro 16IAX10H | |
| Alienware 16 Area-51 | |
| MSI Vector 16 HX AI A2XWHG | |
| MSI Vector 17 HX AI A2XWIG | |
| Media della classe Gaming (3856 - 45446, n=142, ultimi 2 anni) | |
| AIDA64 / CPU PhotoWorxx | |
| SCHENKER XMG Neo 16 E25 RTX 5090 Laptop | |
| Alienware 16 Area-51 | |
| Media Intel Core Ultra 9 275HX (39524 - 62916, n=17) | |
| Lenovo Legion 5 Pro 16IAX10H | |
| Medion Erazer Beast 16 X1 Ultimate | |
| MSI Vector 17 HX AI A2XWIG | |
| Aorus MASTER 16 AM6H | |
| Media della classe Gaming (10805 - 62916, n=142, ultimi 2 anni) | |
| MSI Vector 16 HX AI A2XWHG | |
Prestazioni del sistema
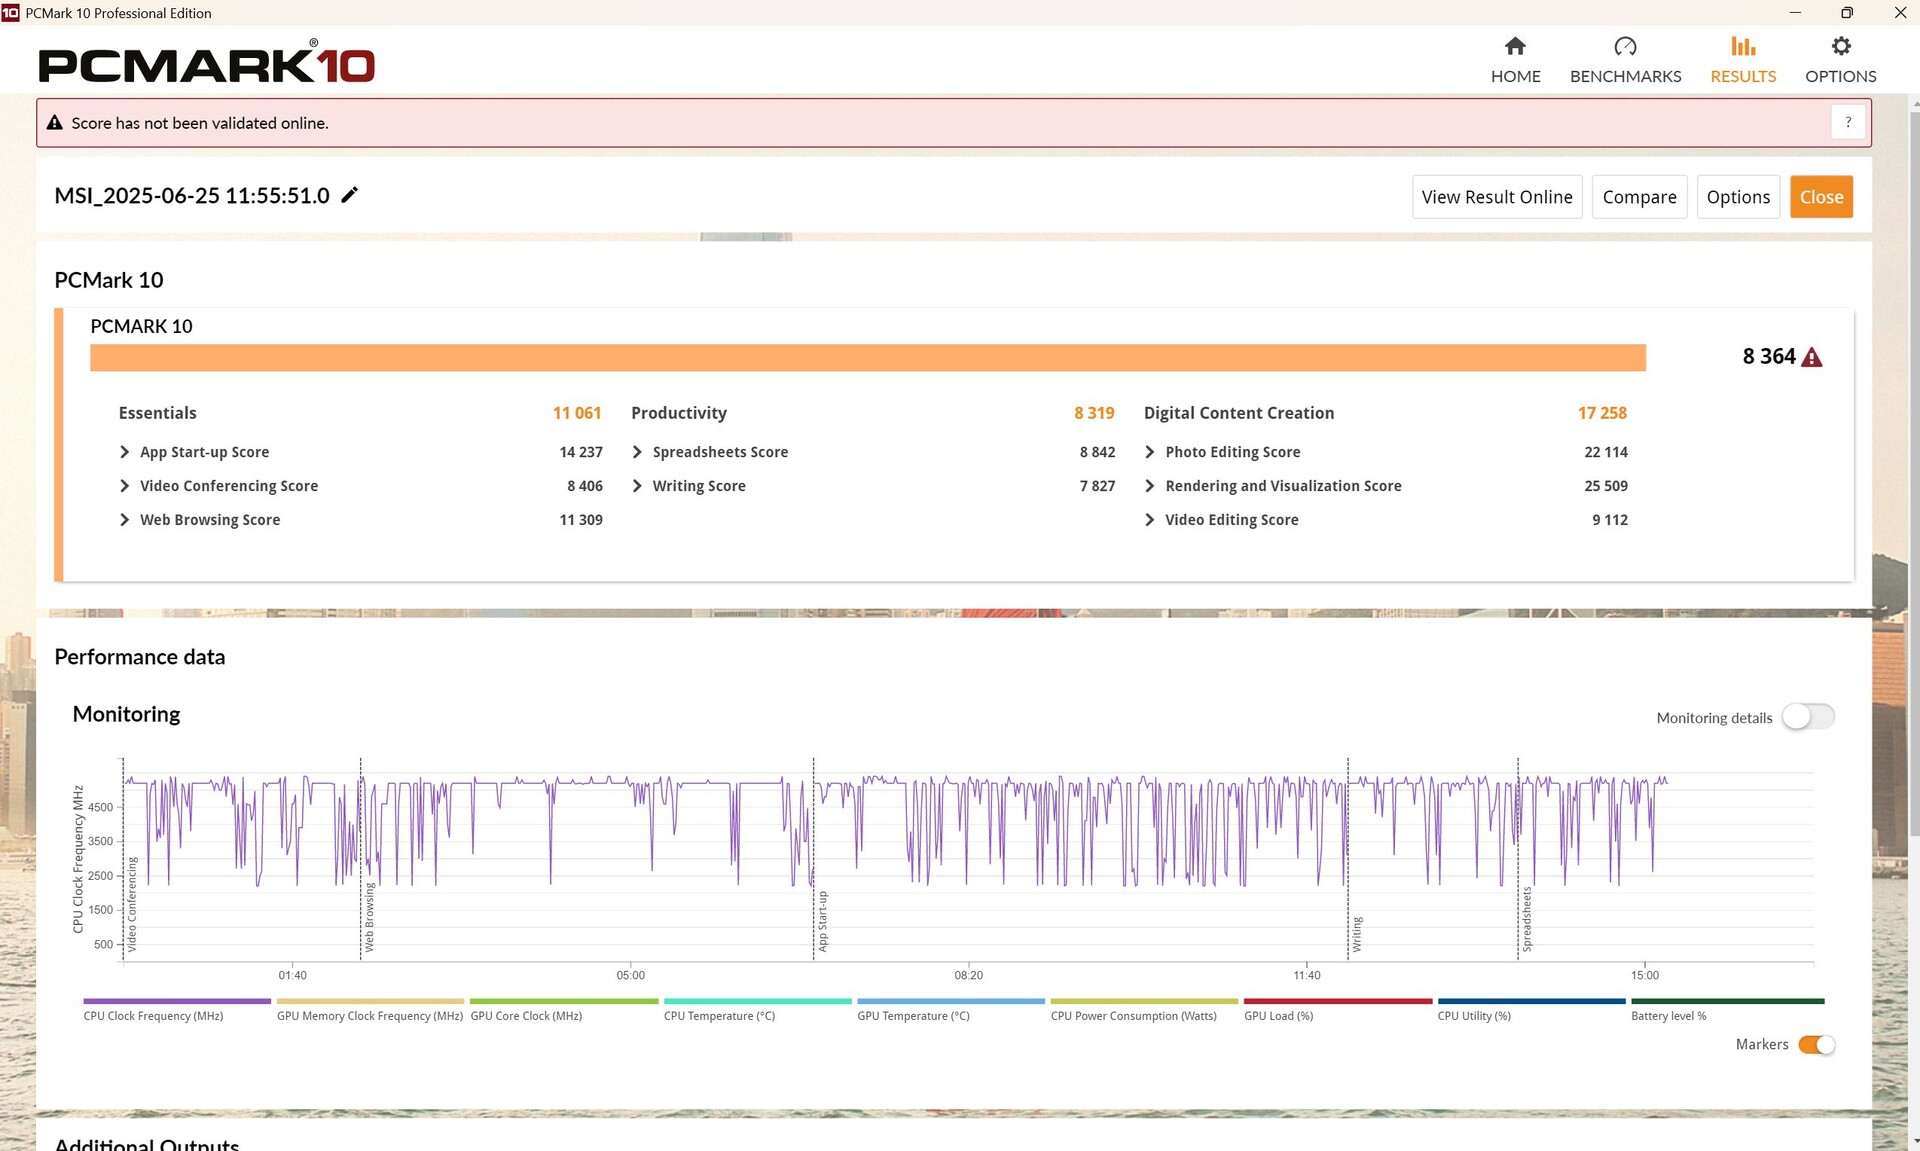
Il Vector 17 si comporta leggermente al di sotto della media in PCMark 10, ma leggermente al di sopra della media in CrossMark, per cui vediamo una prestazione complessiva al livello atteso.
PCMark 10: Score | Essentials | Productivity | Digital Content Creation
CrossMark: Overall | Productivity | Creativity | Responsiveness
WebXPRT 3: Overall
WebXPRT 4: Overall
Mozilla Kraken 1.1: Total
| Performance Rating | |
| MSI Raider A18 HX A9WIG-080 | |
| Lenovo Legion 5 Pro 16IAX10H | |
| Alienware 16 Area-51 | |
| Lenovo Legion Pro 7i 16 Gen 10 | |
| MSI Vector 17 HX AI A2XWIG | |
| Media Intel Core Ultra 9 275HX, Nvidia GeForce RTX 5080 Laptop | |
| Medion Erazer Beast 18 X1 MD62731 | |
| Media della classe Gaming | |
| MSI Vector 16 HX AI A2XWHG | |
| PCMark 10 / Score | |
| Lenovo Legion Pro 7i 16 Gen 10 | |
| MSI Raider A18 HX A9WIG-080 | |
| Alienware 16 Area-51 | |
| Media Intel Core Ultra 9 275HX, Nvidia GeForce RTX 5080 Laptop (8364 - 9153, n=6) | |
| Medion Erazer Beast 18 X1 MD62731 | |
| MSI Vector 17 HX AI A2XWIG | |
| Lenovo Legion 5 Pro 16IAX10H | |
| Media della classe Gaming (5776 - 9852, n=129, ultimi 2 anni) | |
| MSI Vector 16 HX AI A2XWHG | |
| PCMark 10 / Essentials | |
| MSI Raider A18 HX A9WIG-080 | |
| Lenovo Legion Pro 7i 16 Gen 10 | |
| Alienware 16 Area-51 | |
| MSI Vector 17 HX AI A2XWIG | |
| Media Intel Core Ultra 9 275HX, Nvidia GeForce RTX 5080 Laptop (10423 - 11215, n=6) | |
| Media della classe Gaming (9057 - 12600, n=129, ultimi 2 anni) | |
| Lenovo Legion 5 Pro 16IAX10H | |
| MSI Vector 16 HX AI A2XWHG | |
| Medion Erazer Beast 18 X1 MD62731 | |
| PCMark 10 / Productivity | |
| MSI Raider A18 HX A9WIG-080 | |
| Media della classe Gaming (6662 - 14612, n=129, ultimi 2 anni) | |
| Medion Erazer Beast 18 X1 MD62731 | |
| Lenovo Legion 5 Pro 16IAX10H | |
| Lenovo Legion Pro 7i 16 Gen 10 | |
| MSI Vector 16 HX AI A2XWHG | |
| Media Intel Core Ultra 9 275HX, Nvidia GeForce RTX 5080 Laptop (8319 - 9723, n=6) | |
| Alienware 16 Area-51 | |
| MSI Vector 17 HX AI A2XWIG | |
| PCMark 10 / Digital Content Creation | |
| Lenovo Legion Pro 7i 16 Gen 10 | |
| Alienware 16 Area-51 | |
| Media Intel Core Ultra 9 275HX, Nvidia GeForce RTX 5080 Laptop (15780 - 19351, n=6) | |
| MSI Vector 17 HX AI A2XWIG | |
| Medion Erazer Beast 18 X1 MD62731 | |
| Lenovo Legion 5 Pro 16IAX10H | |
| MSI Raider A18 HX A9WIG-080 | |
| Media della classe Gaming (7440 - 19351, n=129, ultimi 2 anni) | |
| MSI Vector 16 HX AI A2XWHG | |
| CrossMark / Overall | |
| MSI Raider A18 HX A9WIG-080 | |
| MSI Vector 17 HX AI A2XWIG | |
| Lenovo Legion 5 Pro 16IAX10H | |
| Alienware 16 Area-51 | |
| Media Intel Core Ultra 9 275HX, Nvidia GeForce RTX 5080 Laptop (1857 - 2196, n=6) | |
| Lenovo Legion Pro 7i 16 Gen 10 | |
| Media della classe Gaming (1247 - 2344, n=111, ultimi 2 anni) | |
| MSI Vector 16 HX AI A2XWHG | |
| Medion Erazer Beast 18 X1 MD62731 | |
| CrossMark / Productivity | |
| MSI Vector 17 HX AI A2XWIG | |
| Lenovo Legion 5 Pro 16IAX10H | |
| Alienware 16 Area-51 | |
| MSI Raider A18 HX A9WIG-080 | |
| Media Intel Core Ultra 9 275HX, Nvidia GeForce RTX 5080 Laptop (1764 - 2056, n=6) | |
| Lenovo Legion Pro 7i 16 Gen 10 | |
| Media della classe Gaming (1299 - 2211, n=111, ultimi 2 anni) | |
| MSI Vector 16 HX AI A2XWHG | |
| Medion Erazer Beast 18 X1 MD62731 | |
| CrossMark / Creativity | |
| MSI Raider A18 HX A9WIG-080 | |
| Lenovo Legion 5 Pro 16IAX10H | |
| MSI Vector 17 HX AI A2XWIG | |
| Alienware 16 Area-51 | |
| Media Intel Core Ultra 9 275HX, Nvidia GeForce RTX 5080 Laptop (2115 - 2451, n=6) | |
| Lenovo Legion Pro 7i 16 Gen 10 | |
| MSI Vector 16 HX AI A2XWHG | |
| Media della classe Gaming (1275 - 2729, n=111, ultimi 2 anni) | |
| Medion Erazer Beast 18 X1 MD62731 | |
| CrossMark / Responsiveness | |
| Alienware 16 Area-51 | |
| MSI Vector 17 HX AI A2XWIG | |
| Lenovo Legion 5 Pro 16IAX10H | |
| MSI Raider A18 HX A9WIG-080 | |
| Media Intel Core Ultra 9 275HX, Nvidia GeForce RTX 5080 Laptop (1466 - 2016, n=6) | |
| Media della classe Gaming (1030 - 2330, n=111, ultimi 2 anni) | |
| Lenovo Legion Pro 7i 16 Gen 10 | |
| MSI Vector 16 HX AI A2XWHG | |
| Medion Erazer Beast 18 X1 MD62731 | |
| WebXPRT 3 / Overall | |
| Lenovo Legion 5 Pro 16IAX10H | |
| MSI Raider A18 HX A9WIG-080 | |
| Lenovo Legion Pro 7i 16 Gen 10 | |
| Alienware 16 Area-51 | |
| Medion Erazer Beast 18 X1 MD62731 | |
| Media Intel Core Ultra 9 275HX, Nvidia GeForce RTX 5080 Laptop (306 - 359, n=6) | |
| MSI Vector 17 HX AI A2XWIG | |
| MSI Vector 16 HX AI A2XWHG | |
| Media della classe Gaming (237 - 532, n=123, ultimi 2 anni) | |
| WebXPRT 4 / Overall | |
| MSI Vector 17 HX AI A2XWIG | |
| Lenovo Legion Pro 7i 16 Gen 10 | |
| MSI Raider A18 HX A9WIG-080 | |
| Alienware 16 Area-51 | |
| Lenovo Legion 5 Pro 16IAX10H | |
| Media Intel Core Ultra 9 275HX, Nvidia GeForce RTX 5080 Laptop (285 - 336, n=6) | |
| Medion Erazer Beast 18 X1 MD62731 | |
| MSI Vector 16 HX AI A2XWHG | |
| Media della classe Gaming (176.4 - 341, n=110, ultimi 2 anni) | |
| Mozilla Kraken 1.1 / Total | |
| Media della classe Gaming (397 - 674, n=133, ultimi 2 anni) | |
| MSI Vector 16 HX AI A2XWHG | |
| MSI Vector 17 HX AI A2XWIG | |
| Medion Erazer Beast 18 X1 MD62731 | |
| Media Intel Core Ultra 9 275HX, Nvidia GeForce RTX 5080 Laptop (405 - 432, n=6) | |
| Lenovo Legion 5 Pro 16IAX10H | |
| Alienware 16 Area-51 | |
| Lenovo Legion Pro 7i 16 Gen 10 | |
| MSI Raider A18 HX A9WIG-080 | |
* ... Meglio usare valori piccoli
| PCMark 10 Score | 8364 punti | |
Aiuto | ||
| AIDA64 / Memory Copy | |
| Alienware 16 Area-51 | |
| Lenovo Legion Pro 7i 16 Gen 10 | |
| Media Intel Core Ultra 9 275HX (63022 - 94460, n=17) | |
| Lenovo Legion 5 Pro 16IAX10H | |
| MSI Vector 17 HX AI A2XWIG | |
| Medion Erazer Beast 18 X1 MD62731 | |
| Media della classe Gaming (21750 - 97515, n=142, ultimi 2 anni) | |
| MSI Vector 16 HX AI A2XWHG | |
| MSI Raider A18 HX A9WIG-080 | |
| AIDA64 / Memory Read | |
| Lenovo Legion Pro 7i 16 Gen 10 | |
| Alienware 16 Area-51 | |
| Media Intel Core Ultra 9 275HX (65869 - 97151, n=17) | |
| Lenovo Legion 5 Pro 16IAX10H | |
| Medion Erazer Beast 18 X1 MD62731 | |
| MSI Vector 17 HX AI A2XWIG | |
| MSI Vector 16 HX AI A2XWHG | |
| Media della classe Gaming (22956 - 104349, n=142, ultimi 2 anni) | |
| MSI Raider A18 HX A9WIG-080 | |
| AIDA64 / Memory Write | |
| Lenovo Legion Pro 7i 16 Gen 10 | |
| Alienware 16 Area-51 | |
| Media Intel Core Ultra 9 275HX (61633 - 105456, n=17) | |
| Lenovo Legion 5 Pro 16IAX10H | |
| Medion Erazer Beast 18 X1 MD62731 | |
| MSI Vector 17 HX AI A2XWIG | |
| Media della classe Gaming (22297 - 133486, n=142, ultimi 2 anni) | |
| MSI Vector 16 HX AI A2XWHG | |
| MSI Raider A18 HX A9WIG-080 | |
| AIDA64 / Memory Latency | |
| Alienware 16 Area-51 | |
| Media Intel Core Ultra 9 275HX (105.8 - 151.7, n=17) | |
| MSI Vector 17 HX AI A2XWIG | |
| Lenovo Legion 5 Pro 16IAX10H | |
| Medion Erazer Beast 18 X1 MD62731 | |
| Lenovo Legion Pro 7i 16 Gen 10 | |
| MSI Vector 16 HX AI A2XWHG | |
| Media della classe Gaming (59.5 - 259, n=142, ultimi 2 anni) | |
| MSI Raider A18 HX A9WIG-080 | |
* ... Meglio usare valori piccoli
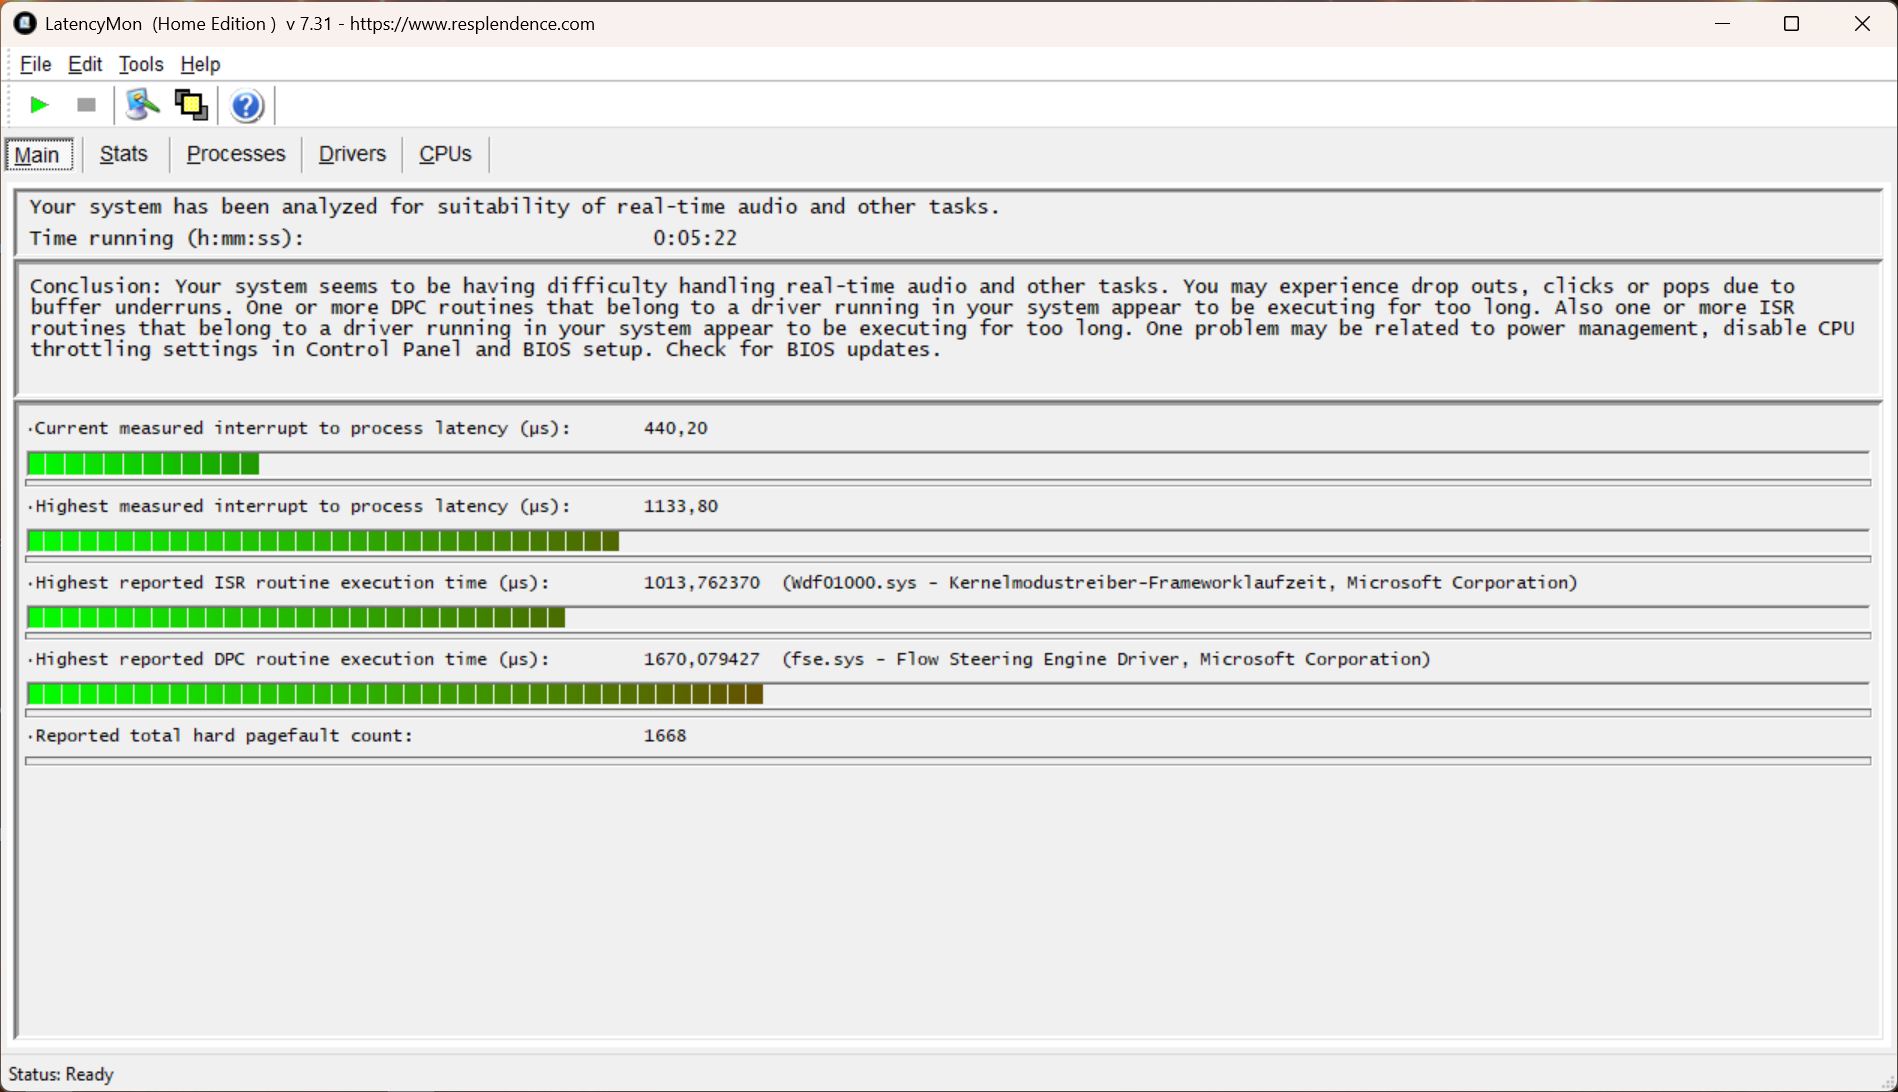
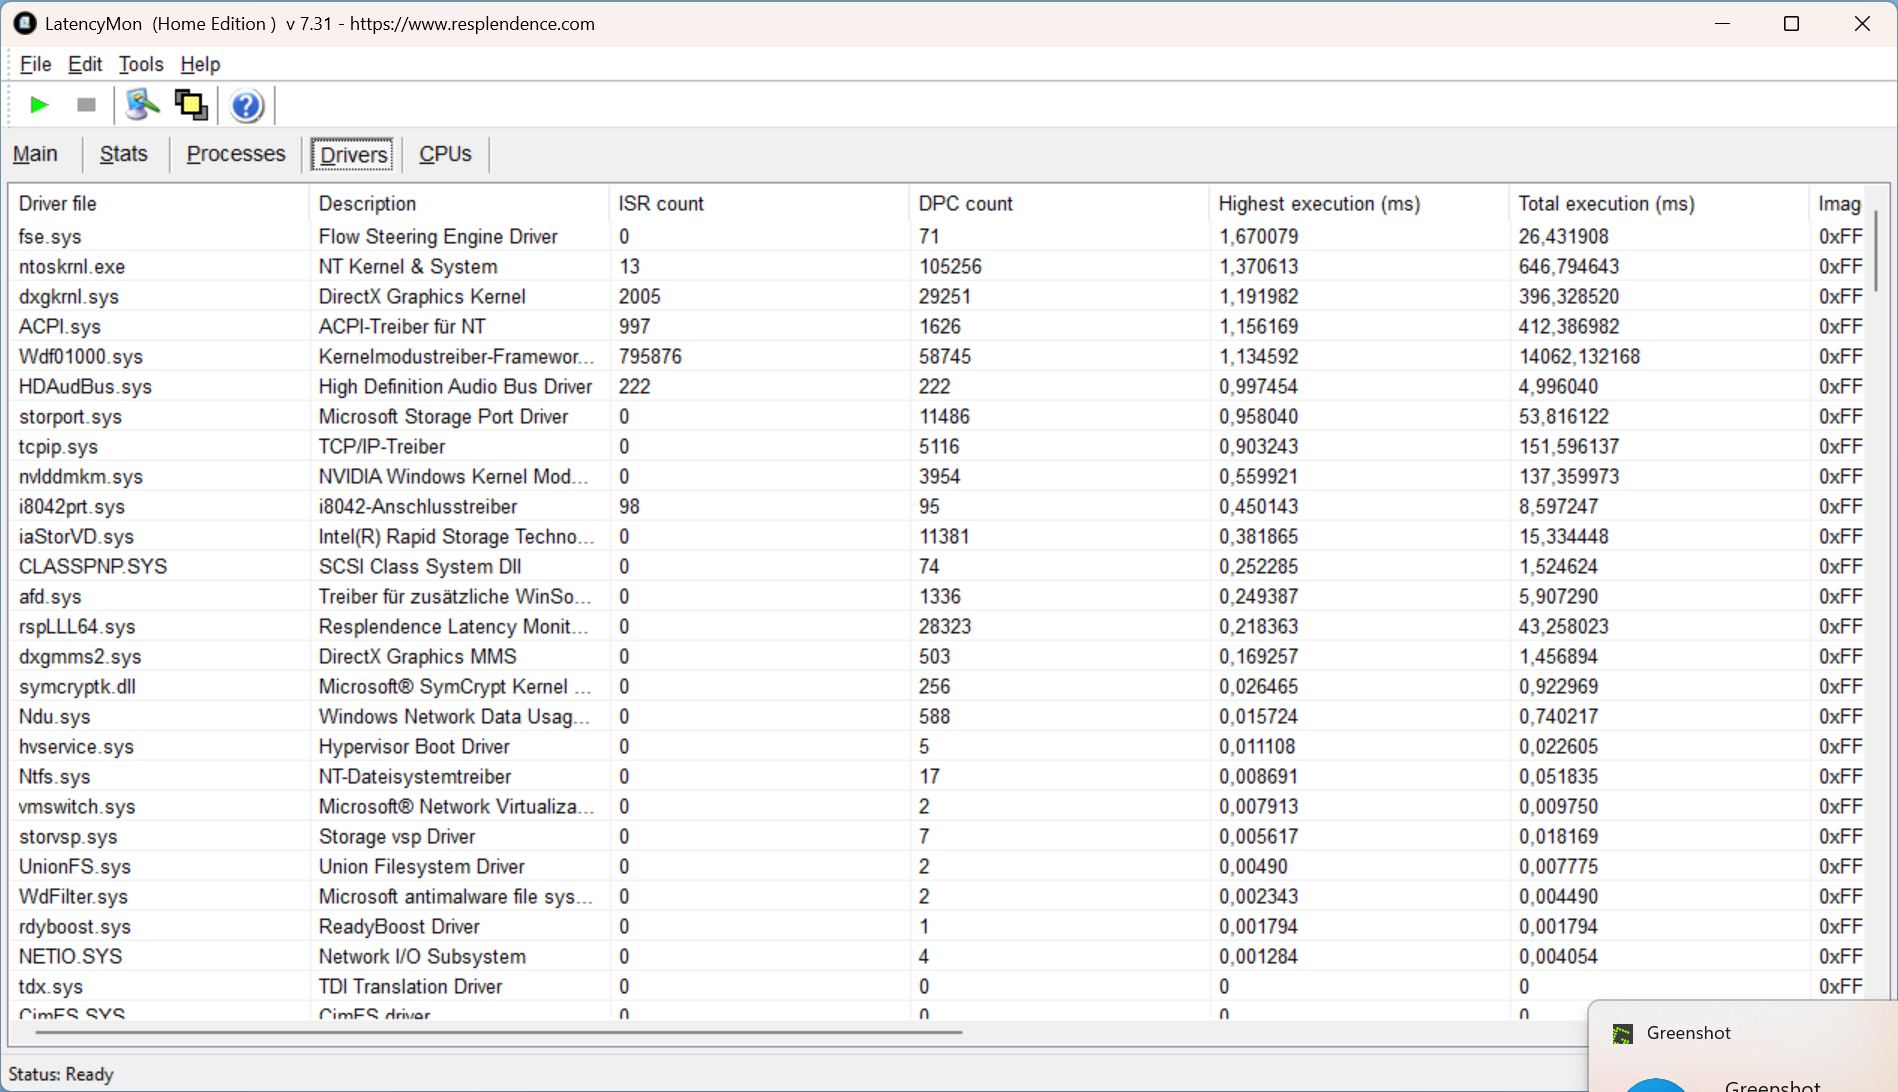
Latenze DPC
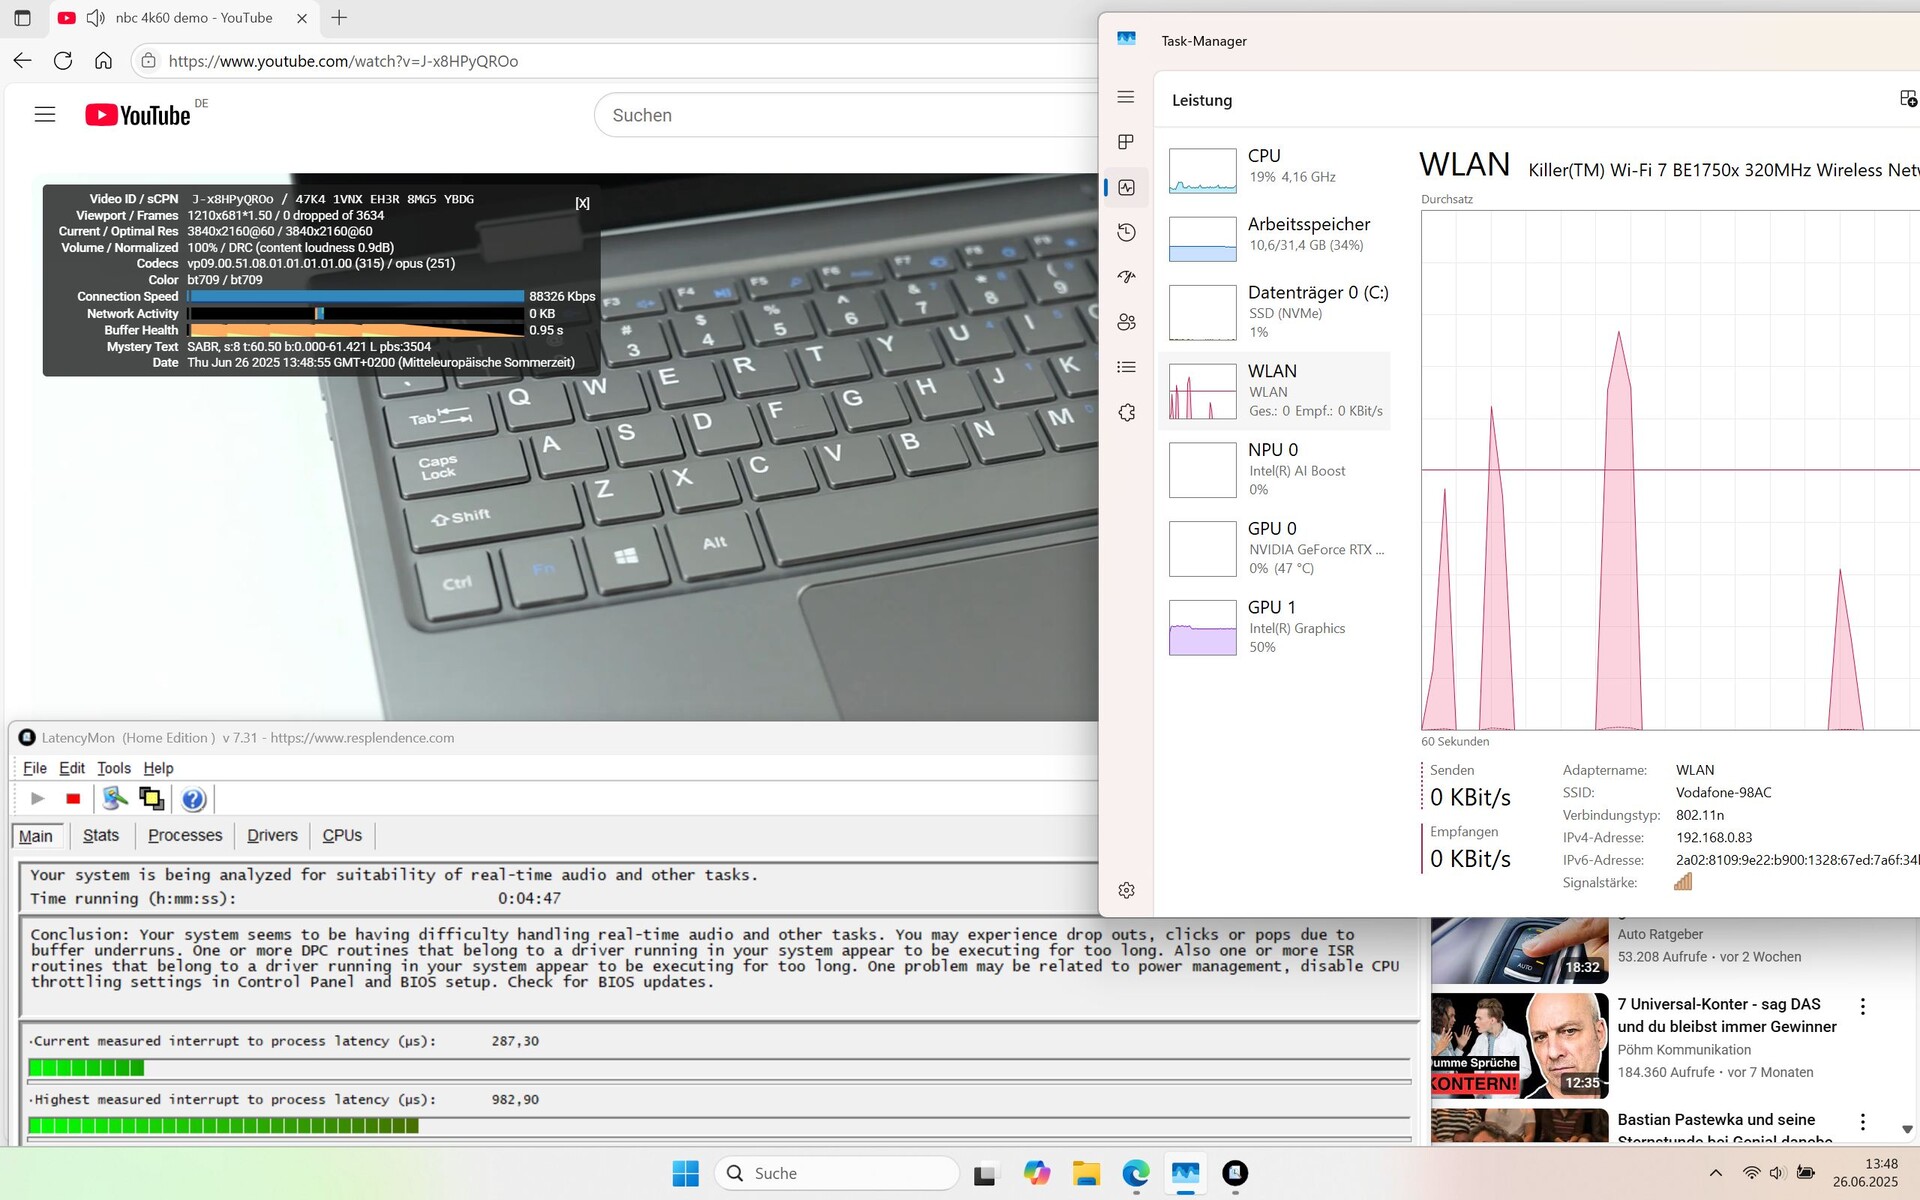
Le latenze si verificano solo quando si aprono diverse schede del browser e sono relativamente basse anche in seguito. Il nostro video a 4K/60 fps viene riprodotto senza alcuna caduta di fotogrammi.
| DPC Latencies / LatencyMon - interrupt to process latency (max), Web, Youtube, Prime95 | |
| Medion Erazer Beast 18 X1 MD62731 | |
| MSI Vector 16 HX AI A2XWHG | |
| Alienware 16 Area-51 | |
| MSI Vector 17 HX AI A2XWIG | |
| Lenovo Legion 5 Pro 16IAX10H | |
| MSI Raider A18 HX A9WIG-080 | |
| Lenovo Legion Pro 7i 16 Gen 10 | |
* ... Meglio usare valori piccoli
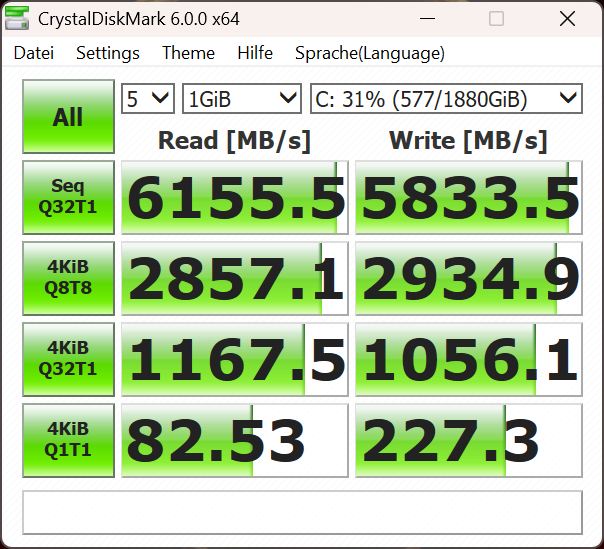
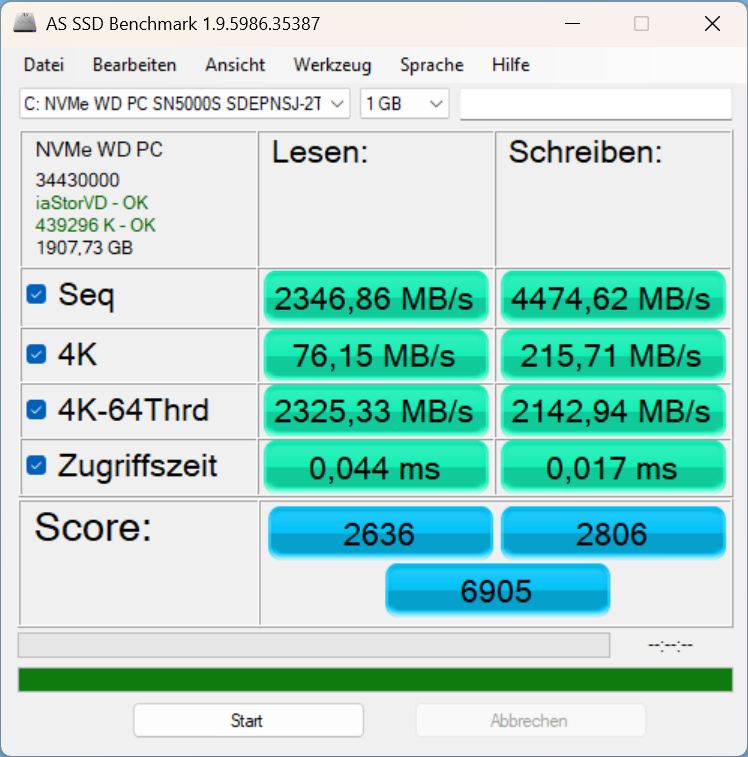
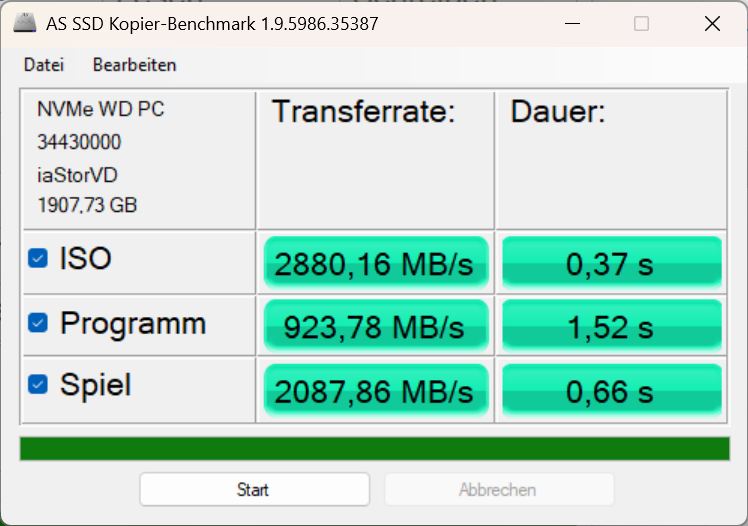
Memoria di massa
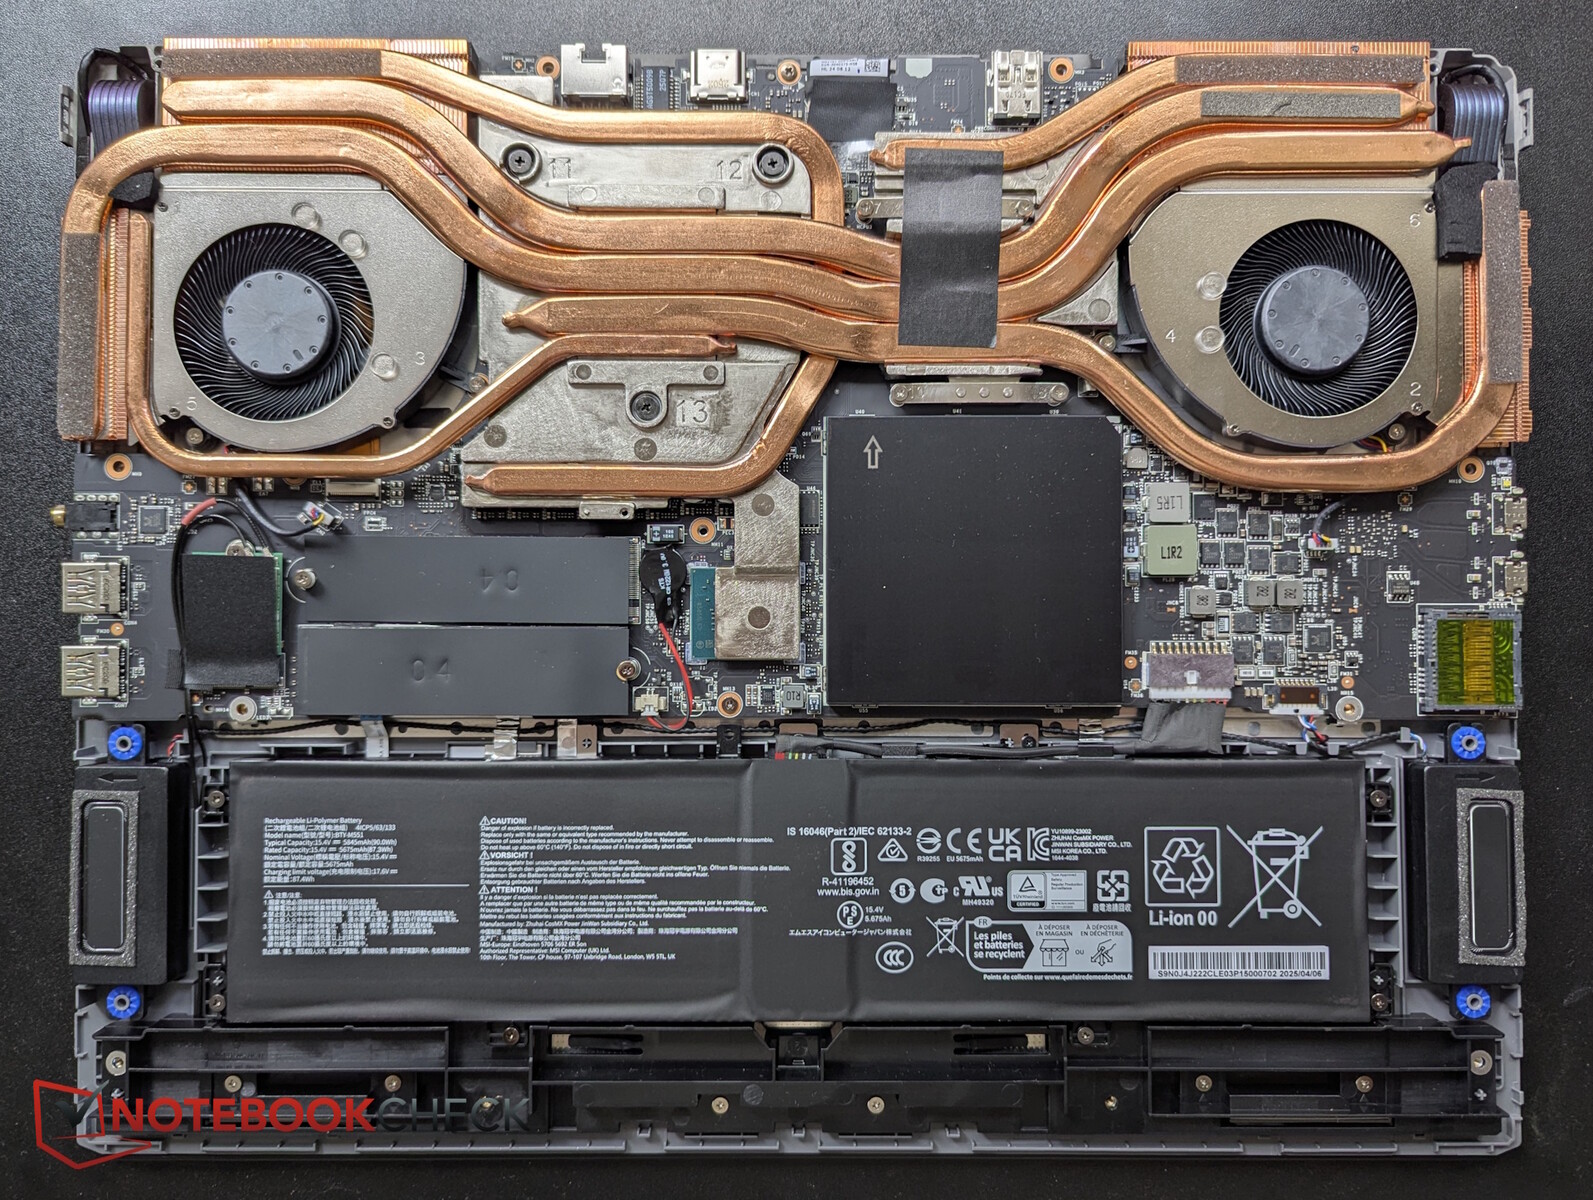
L'SSD Western Digital da 2 TB raggiunge valori medio-buoni e non subisce strozzature nemmeno in caso di carico prolungato.

* ... Meglio usare valori piccoli
Continuous Reading: DiskSpd Read Loop, Queue Depth 8
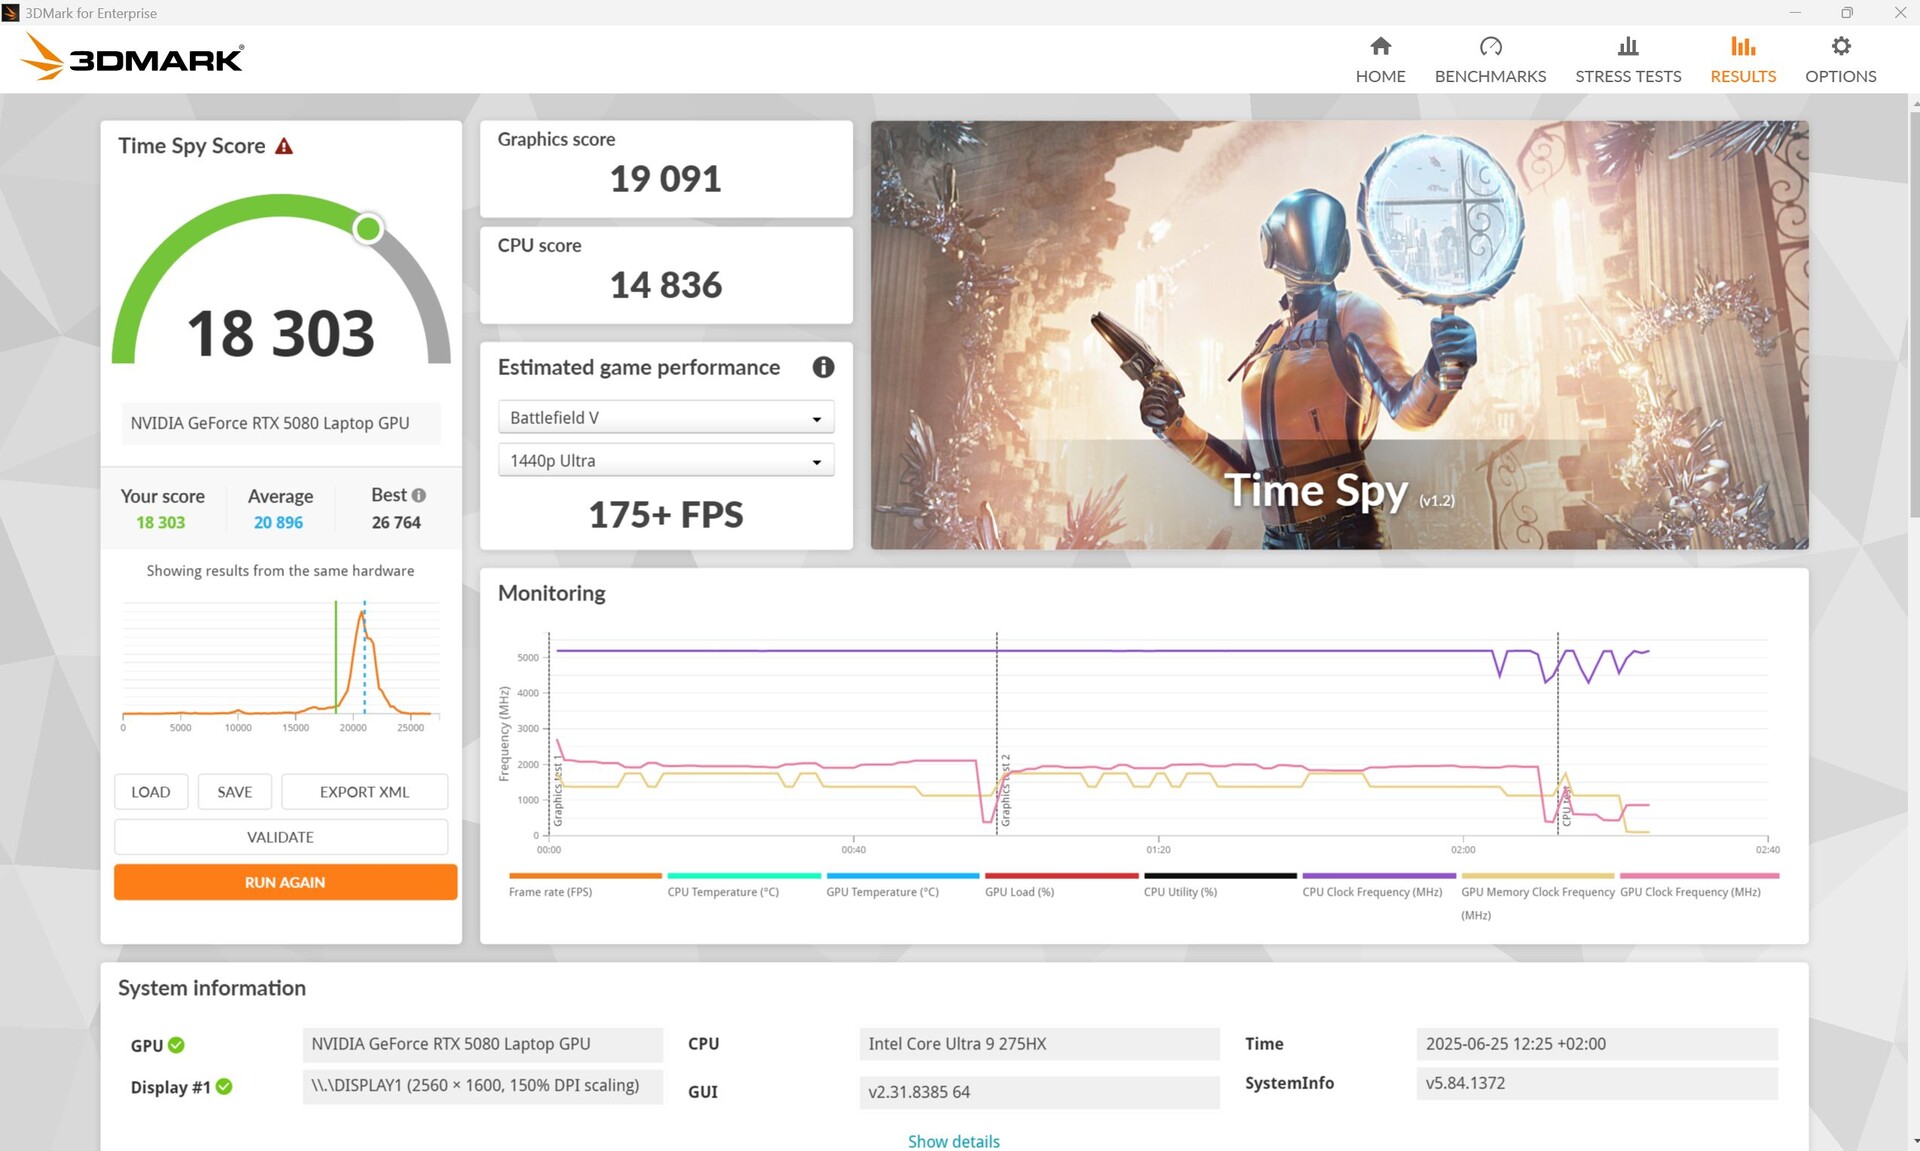
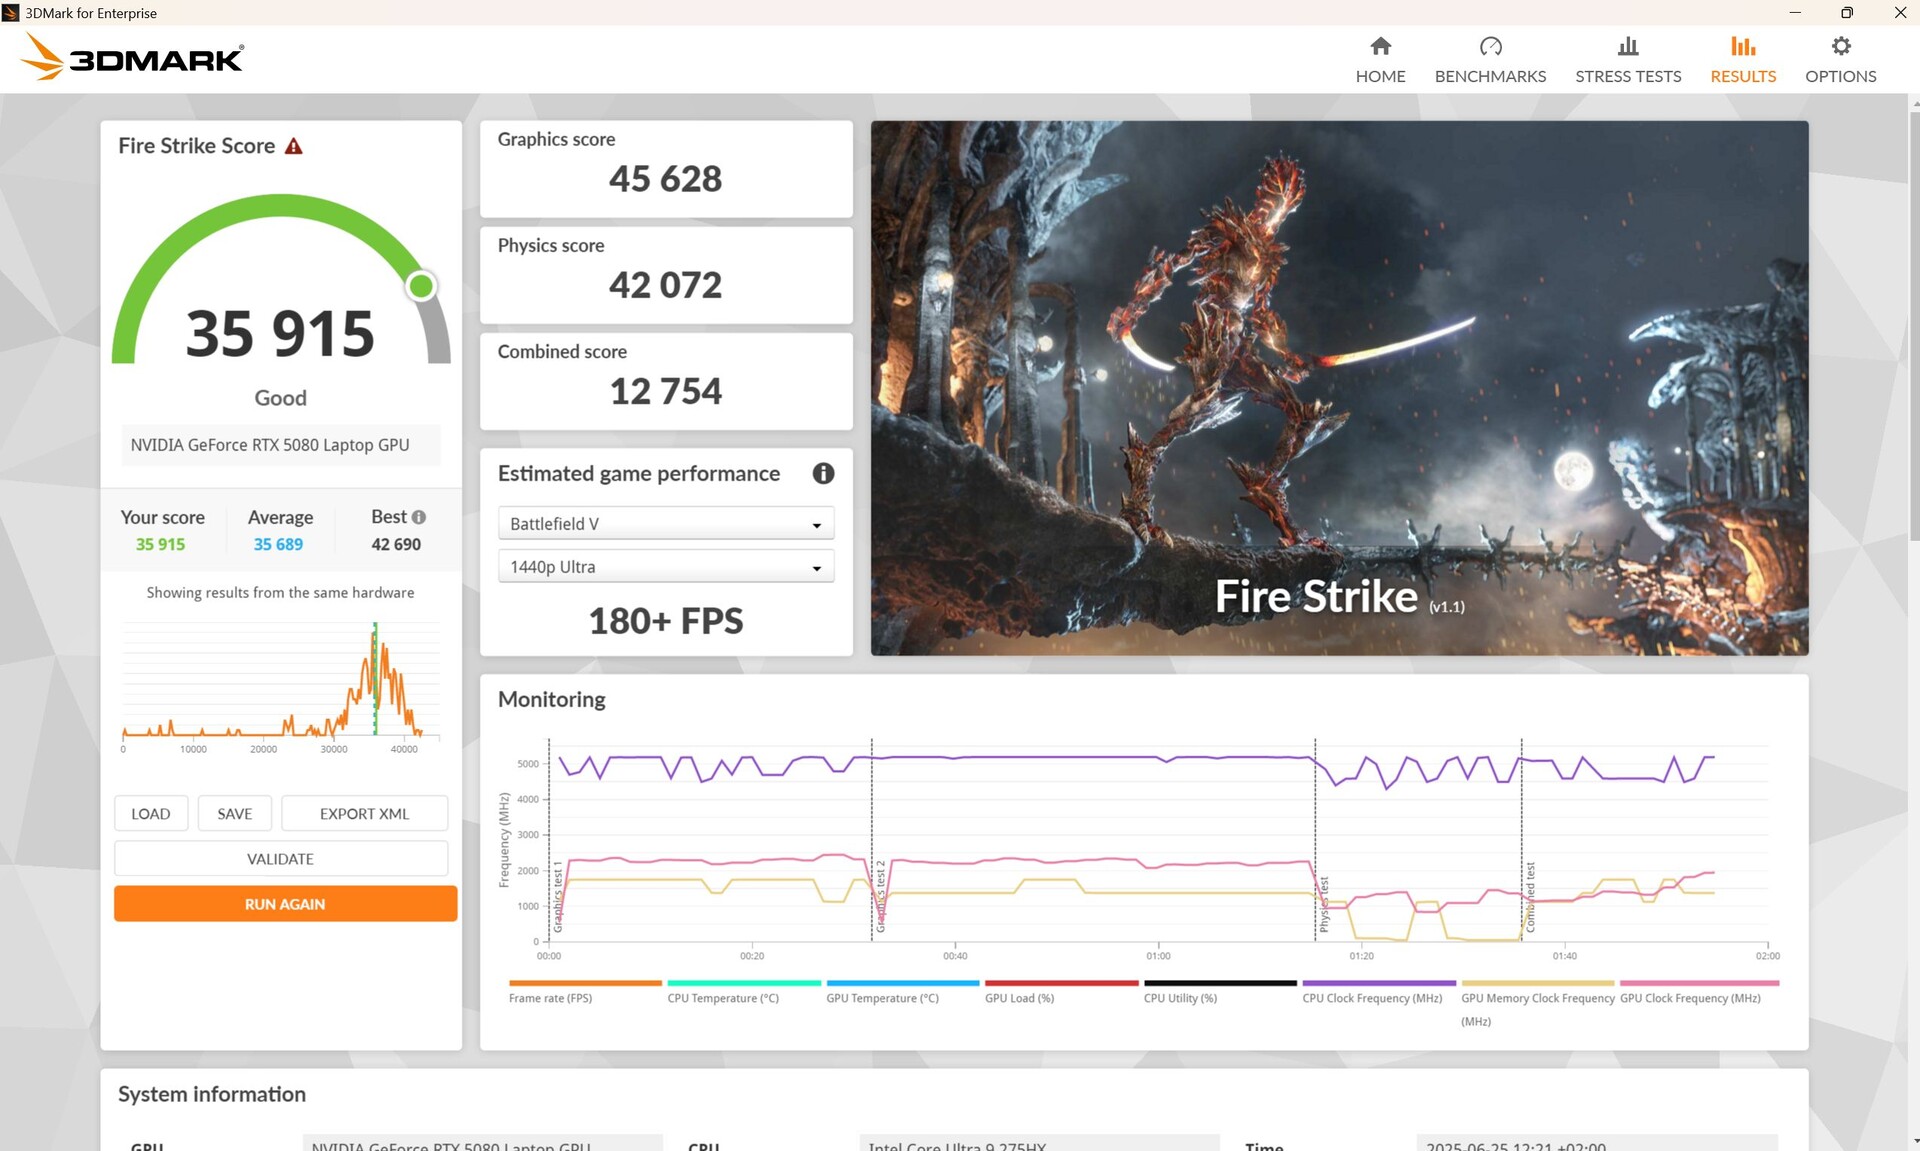
Prestazioni della GPU
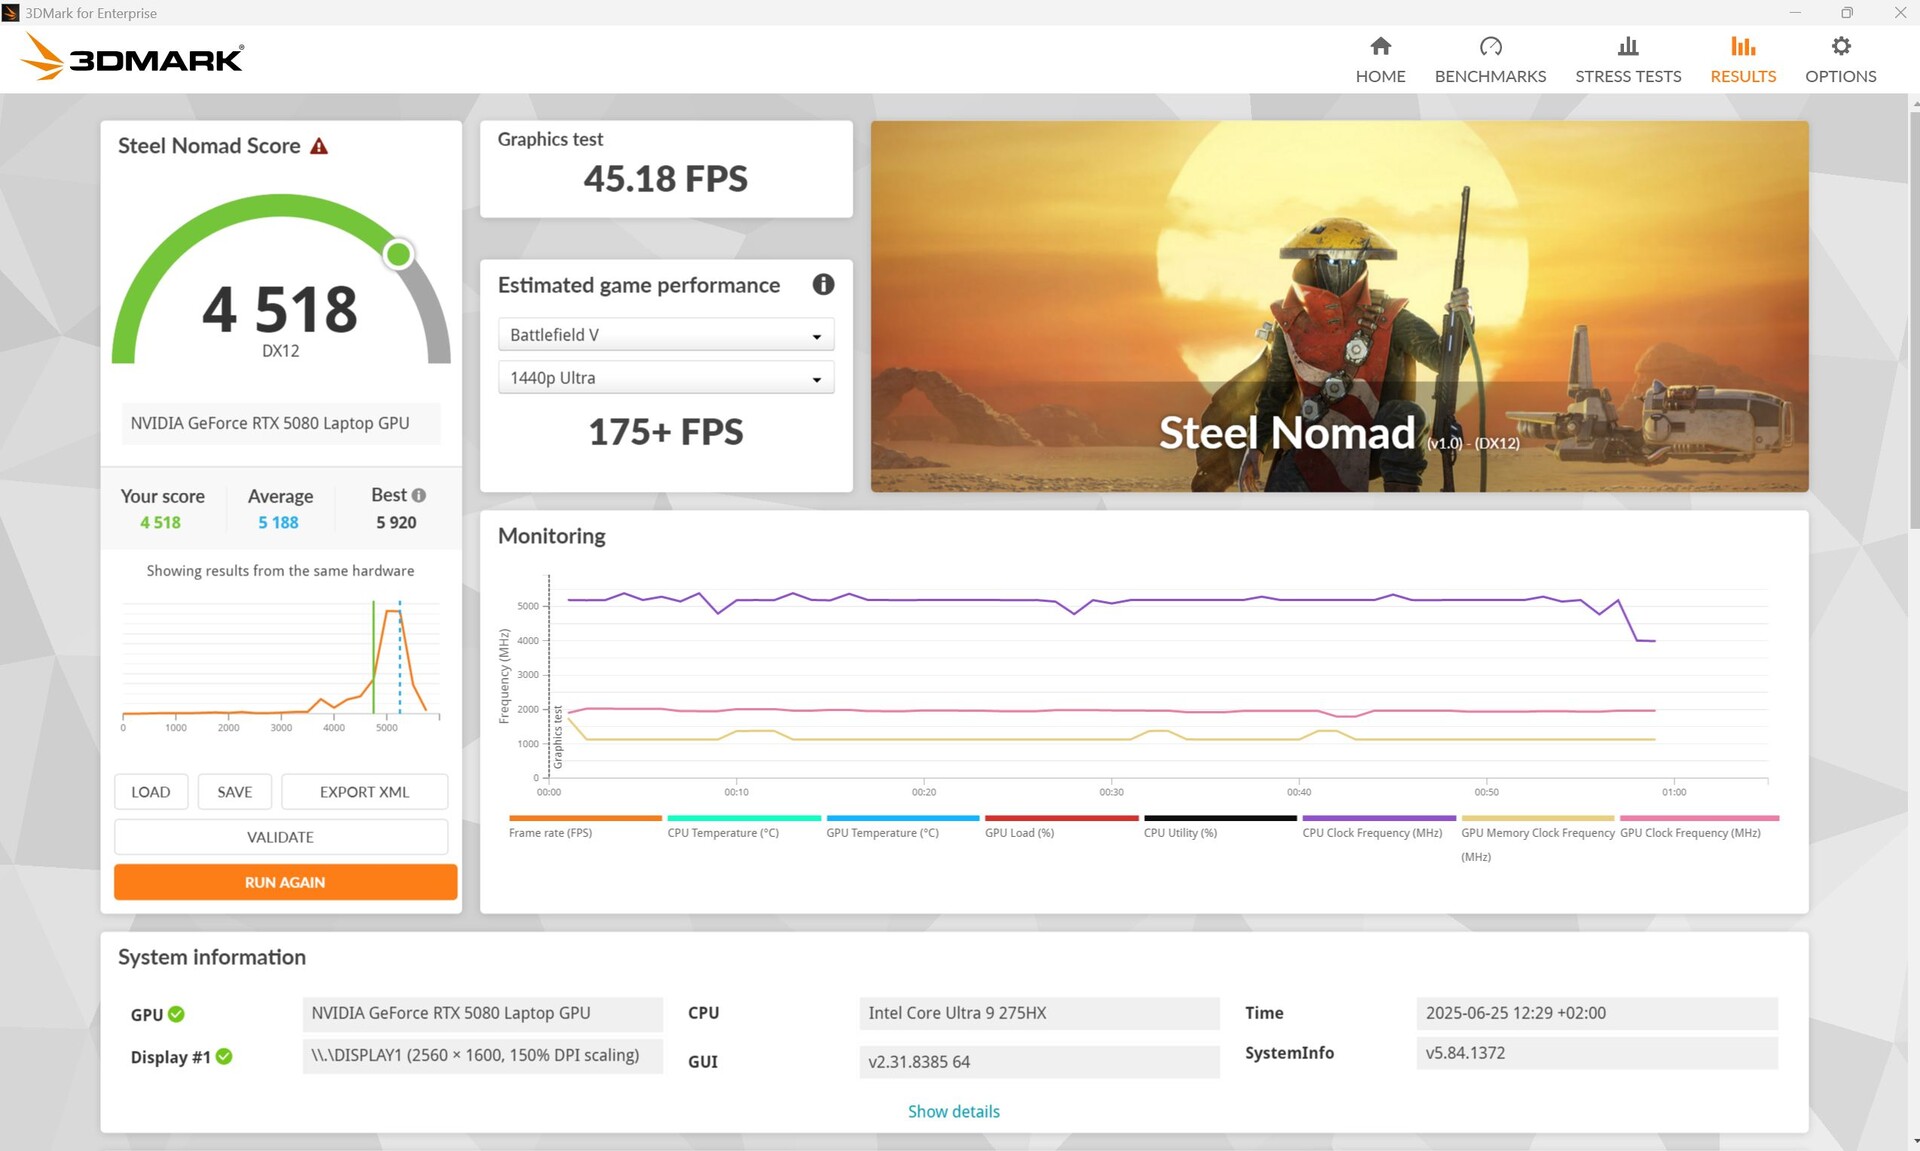
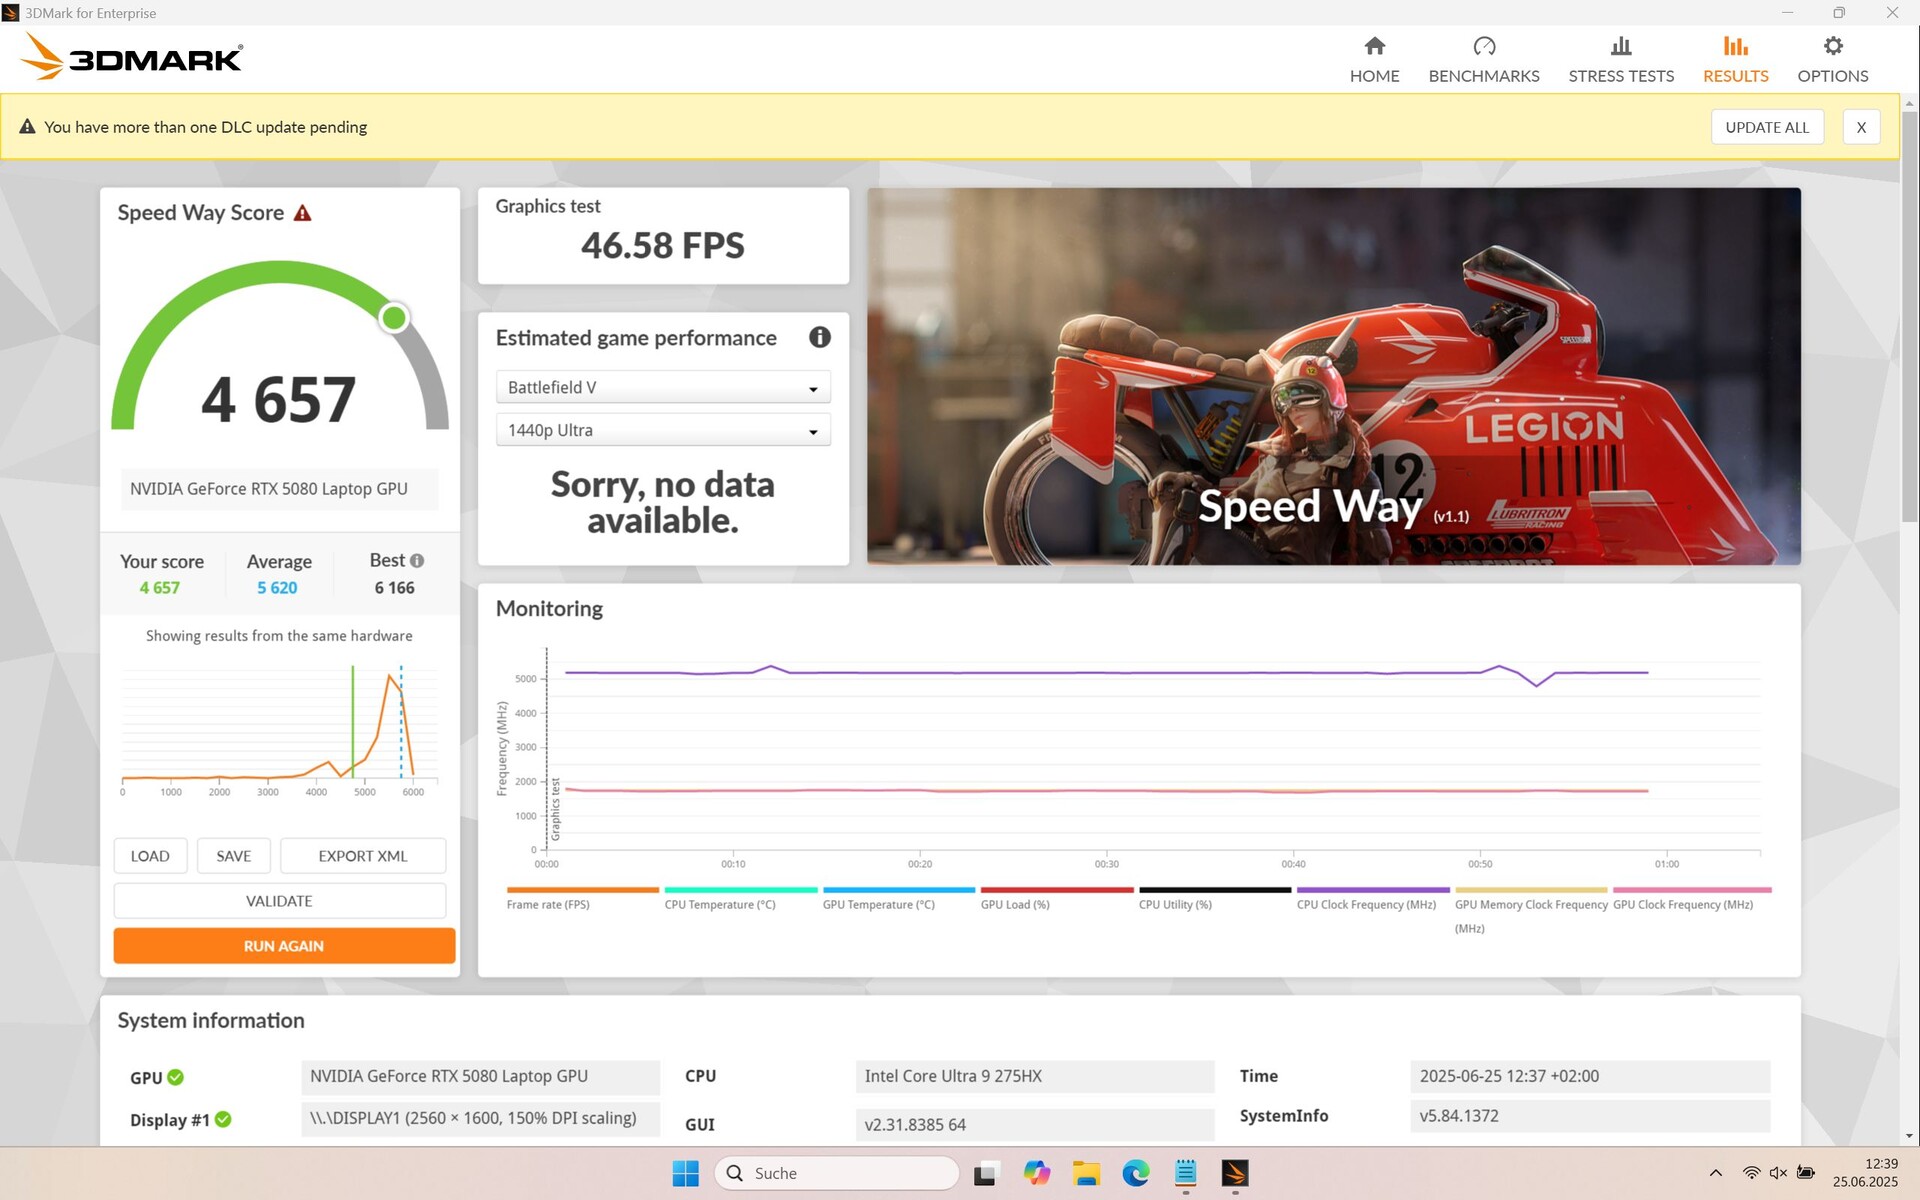
Il RTX 5080 Laptop ha prestazioni del 4 percento inferiori alla media nel 3DMarks. Un test di Fire Strike in modalità batteria rivela una perdita di prestazioni 3D del 50 percento.
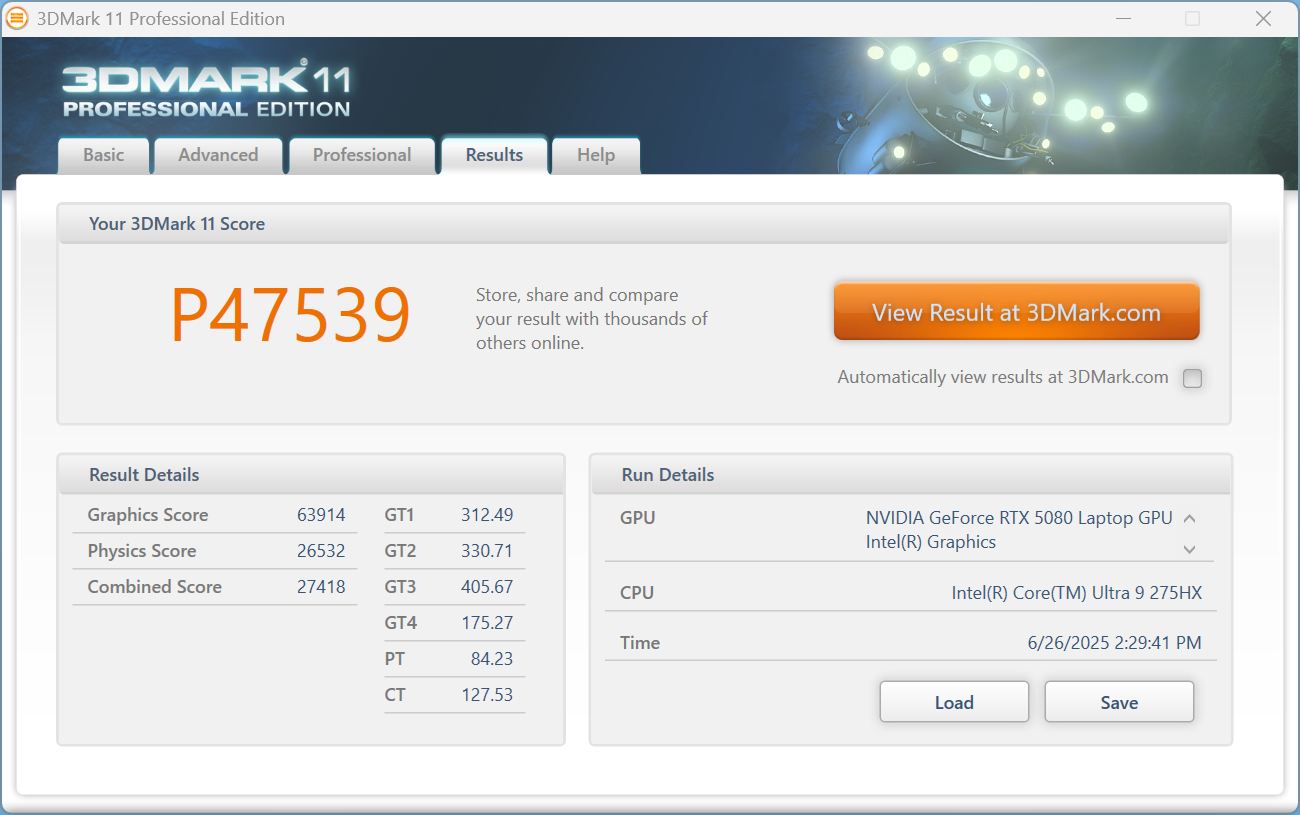
| 3DMark 11 Performance | 47539 punti | |
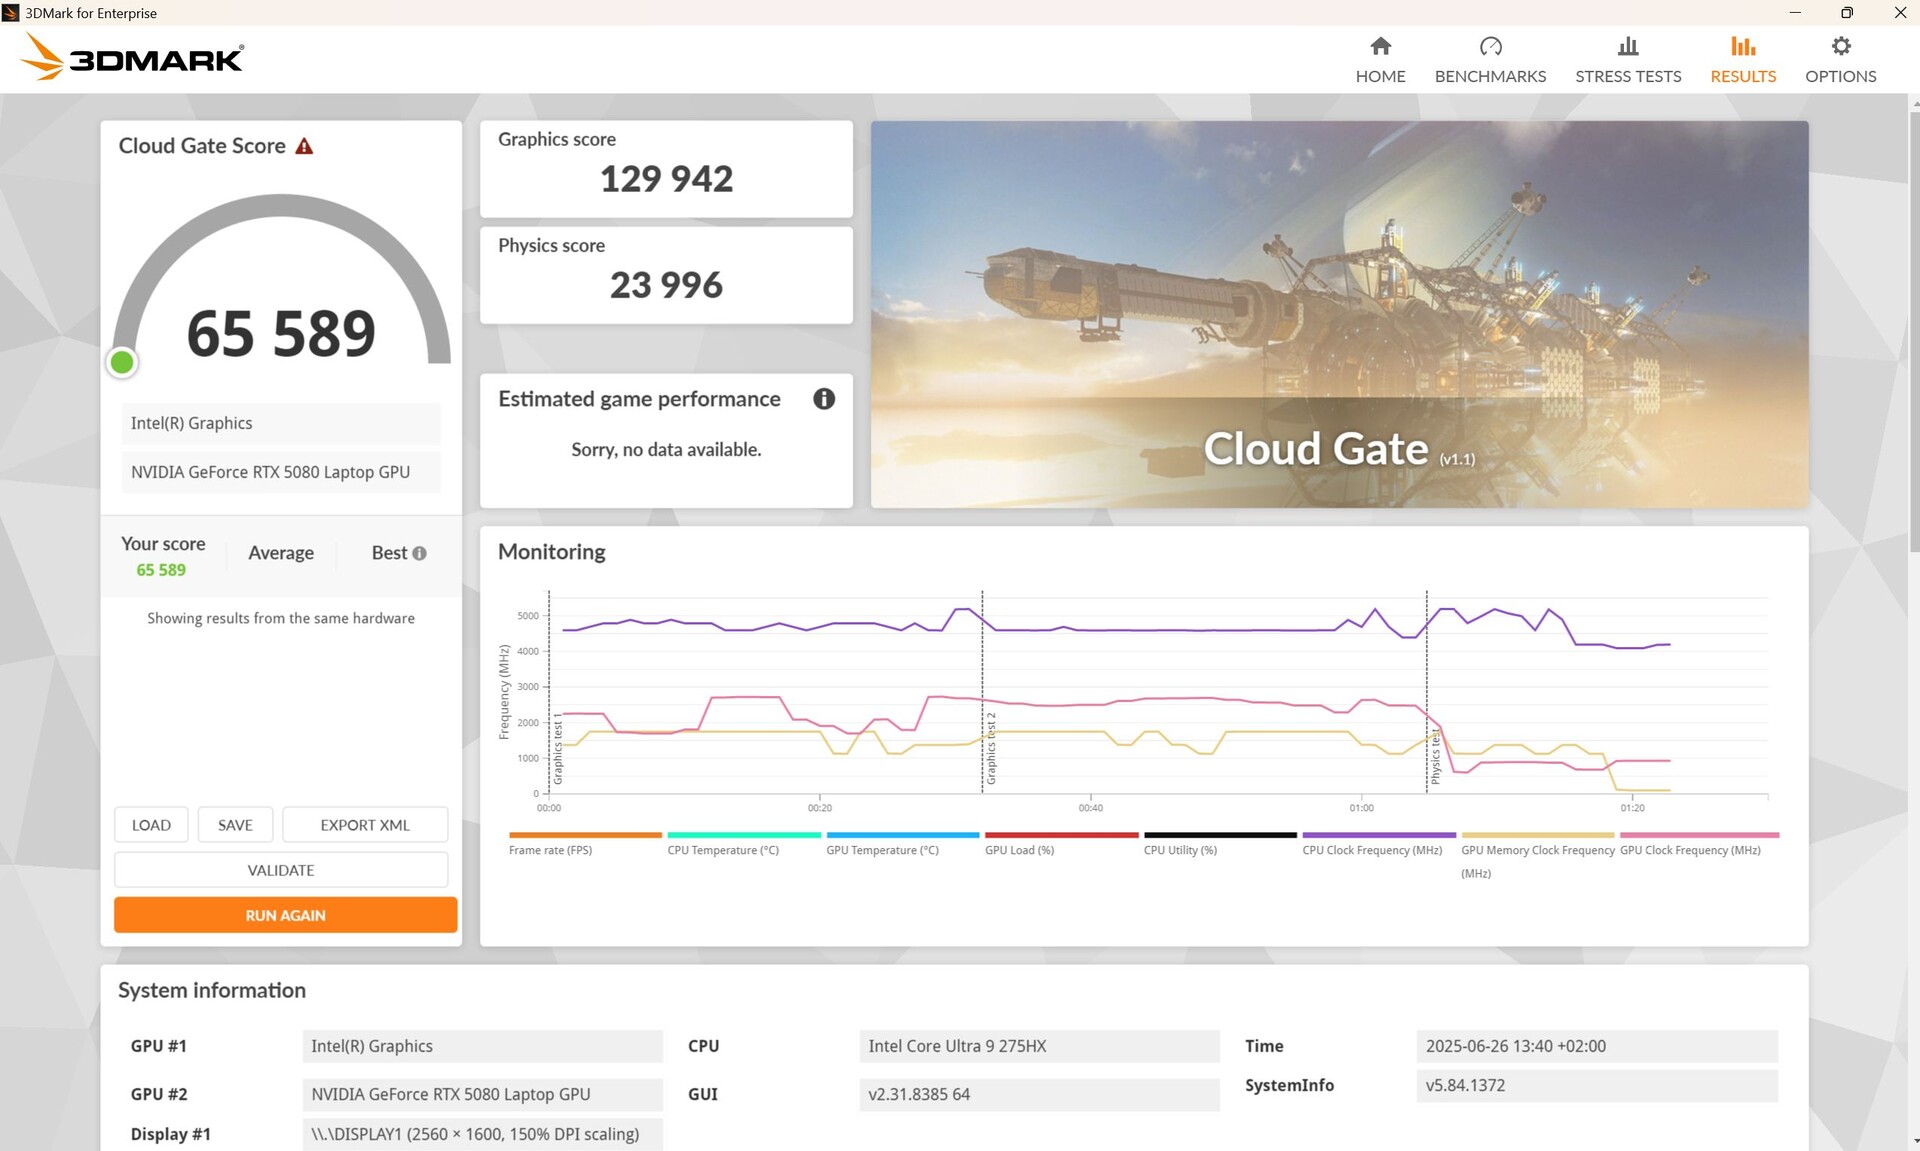
| 3DMark Cloud Gate Standard Score | 65589 punti | |
| 3DMark Fire Strike Score | 35915 punti | |
| 3DMark Time Spy Score | 18303 punti | |
| 3DMark Steel Nomad Score | 4518 punti | |
Aiuto | ||
* ... Meglio usare valori piccoli
Prestazioni di gioco
Nei nostri giochi, il Vector 17 in Full HD è alla pari con un Medion Erazer Beast 18 X1 e quindi leggermente al di sotto della media dei giocatori RTX 5080. Le prestazioni continue in Cyberpunk sono molto consistenti.
Si sente più a suo agio in QHD, soprattutto grazie al DLSS. Ad esempio, Doom: The Dark Ages può essere giocato in QHD con DLSS a una frequenza di fotogrammi più o meno uguale a quella in Full HD (85-88 fps). In combinazione con la generazione di fotogrammi 4x, il nostro Vector 17 riesce persino a raggiungere 214 fps, che si avvicina alla frequenza di aggiornamento nativa del display. Non abbiamo notato un aumento della latenza, ma l'esperienza soggettiva può variare.
| Cyberpunk 2077 2.2 Phantom Liberty - 1920x1080 Ultra Preset (FSR off) | |
| Lenovo Legion Pro 7i 16 Gen 10 | |
| MSI Raider A18 HX A9WIG-080 | |
| Medion Erazer Beast 18 X1 MD62731 | |
| MSI Vector 17 HX AI A2XWIG | |
| Alienware 16 Area-51 | |
| Lenovo Legion 5 Pro 16IAX10H | |
| MSI Vector 16 HX AI A2XWHG | |
| Media della classe Gaming (6.76 - 166.5, n=121, ultimi 2 anni) | |
| GTA V - 1920x1080 Highest Settings possible AA:4xMSAA + FX AF:16x | |
| MSI Raider A18 HX A9WIG-080 | |
| MSI Vector 17 HX AI A2XWIG | |
| Lenovo Legion 5 Pro 16IAX10H | |
| MSI Vector 16 HX AI A2XWHG | |
| Medion Erazer Beast 18 X1 MD62731 | |
| Media della classe Gaming (12.1 - 186.9, n=124, ultimi 2 anni) | |
| Strange Brigade - 1920x1080 ultra AA:ultra AF:16 | |
| Lenovo Legion Pro 7i 16 Gen 10 | |
| Alienware 16 Area-51 | |
| Medion Erazer Beast 18 X1 MD62731 | |
| MSI Vector 17 HX AI A2XWIG | |
| Lenovo Legion 5 Pro 16IAX10H | |
| Media della classe Gaming (38.9 - 456, n=132, ultimi 2 anni) | |
Cyberpunk 2077 ultra FPS-Diagram
Dati GPU di Cyberpunk 2077

| basso | medio | alto | ultra | QHD DLSS | QHD | 4K DLSS | 4K | |
|---|---|---|---|---|---|---|---|---|
| GTA V (2015) | 186.5 | 184.1 | 181.5 | 158.7 | 151.7 | |||
| Dota 2 Reborn (2015) | 220 | 193.1 | 185.9 | 171.7 | 167.9 | |||
| Final Fantasy XV Benchmark (2018) | 231 | 207 | 183.7 | 111.2 | 68.6 | |||
| X-Plane 11.11 (2018) | 163.7 | 139.5 | 108.8 | 98.7 | ||||
| Strange Brigade (2018) | 549 | 429 | 393 | 356 | 265 | 144 | ||
| Baldur's Gate 3 (2023) | 203 | 160 | 141 | 166.3 | 167.3 | 118.3 | 83.2 | 55.7 |
| Cyberpunk 2077 2.2 Phantom Liberty (2023) | 171.8 | 136.6 | 103.9 | 90 | 59.3 | 39.1 | ||
| Doom: The Dark Ages (2025) | 88 | 85 | 64 |
Emissioni ed energia - Fino a 60 dB(A) è abbastanza rumoroso in confronto
Emissioni di rumore
Le ventole sono spesso spente quando sono al minimo, ma non si spengono completamente per molto tempo dopo un carico, nemmeno in modalità Eco. Durante i giochi, tendono ad essere più rumorose della concorrenza, nonostante le prestazioni 3D medie.
Rumorosità
| Idle |
| 24 / 30.82 / 31.31 dB(A) |
| Sotto carico |
| 31.12 / 59.24 dB(A) |
 | ||
30 dB silenzioso 40 dB(A) udibile 50 dB(A) rumoroso |
||
min: | ||
| MSI Vector 17 HX AI A2XWIG GeForce RTX 5080 Laptop, Ultra 9 275HX, Western Digital PC SN5000S SDEPNSJ-2T00-1032 | Alienware 16 Area-51 GeForce RTX 5080 Laptop, Ultra 9 275HX | MSI Vector 16 HX AI A2XWHG GeForce RTX 5070 Ti Laptop, Ultra 7 255HX, Micron 2400 MTFDKBA512QFM | Lenovo Legion Pro 7i 16 Gen 10 GeForce RTX 5080 Laptop, Ultra 9 275HX, SK Hynix HFS001TEJ9X115N | Lenovo Legion 5 Pro 16IAX10H GeForce RTX 5070 Ti Laptop, Ultra 9 275HX, Western Digital PC SN8000S SDEPNRK-1T00 | MSI Raider A18 HX A9WIG-080 GeForce RTX 5080 Laptop, R9 9955HX3D, Samsung PM9E1 MZVLC2T0HBLD | Medion Erazer Beast 18 X1 MD62731 GeForce RTX 5080 Laptop, Ultra 9 275HX, Phison E31 2 TB | |
|---|---|---|---|---|---|---|---|
| Noise | 6% | -12% | 12% | -7% | -4% | -17% | |
| off /ambiente * | 24 | 23.6 2% | 25 -4% | 22.9 5% | 24 -0% | 25.1 -5% | 25 -4% |
| Idle Minimum * | 24 | 25.4 -6% | 33 -38% | 22.9 5% | 24 -0% | 28.6 -19% | 25 -4% |
| Idle Average * | 30.82 | 27.8 10% | 34 -10% | 22.9 26% | 24 22% | 28.9 6% | 39 -27% |
| Idle Maximum * | 31.31 | 28.1 10% | 38 -21% | 26.3 16% | 30.9 1% | 29.2 7% | 42 -34% |
| Load Average * | 31.12 | 28.8 7% | 46 -48% | 27.8 11% | 55.9 -80% | 45.6 -47% | 52 -67% |
| Cyberpunk 2077 ultra * | 59.24 | 50.4 15% | 47 21% | 54.2 9% | 56.72 4% | 55.6 6% | 53 11% |
| Load Maximum * | 59.24 | 56.4 5% | 49 17% | 53.9 9% | 56.72 4% | 45.8 23% | 55 7% |
* ... Meglio usare valori piccoli
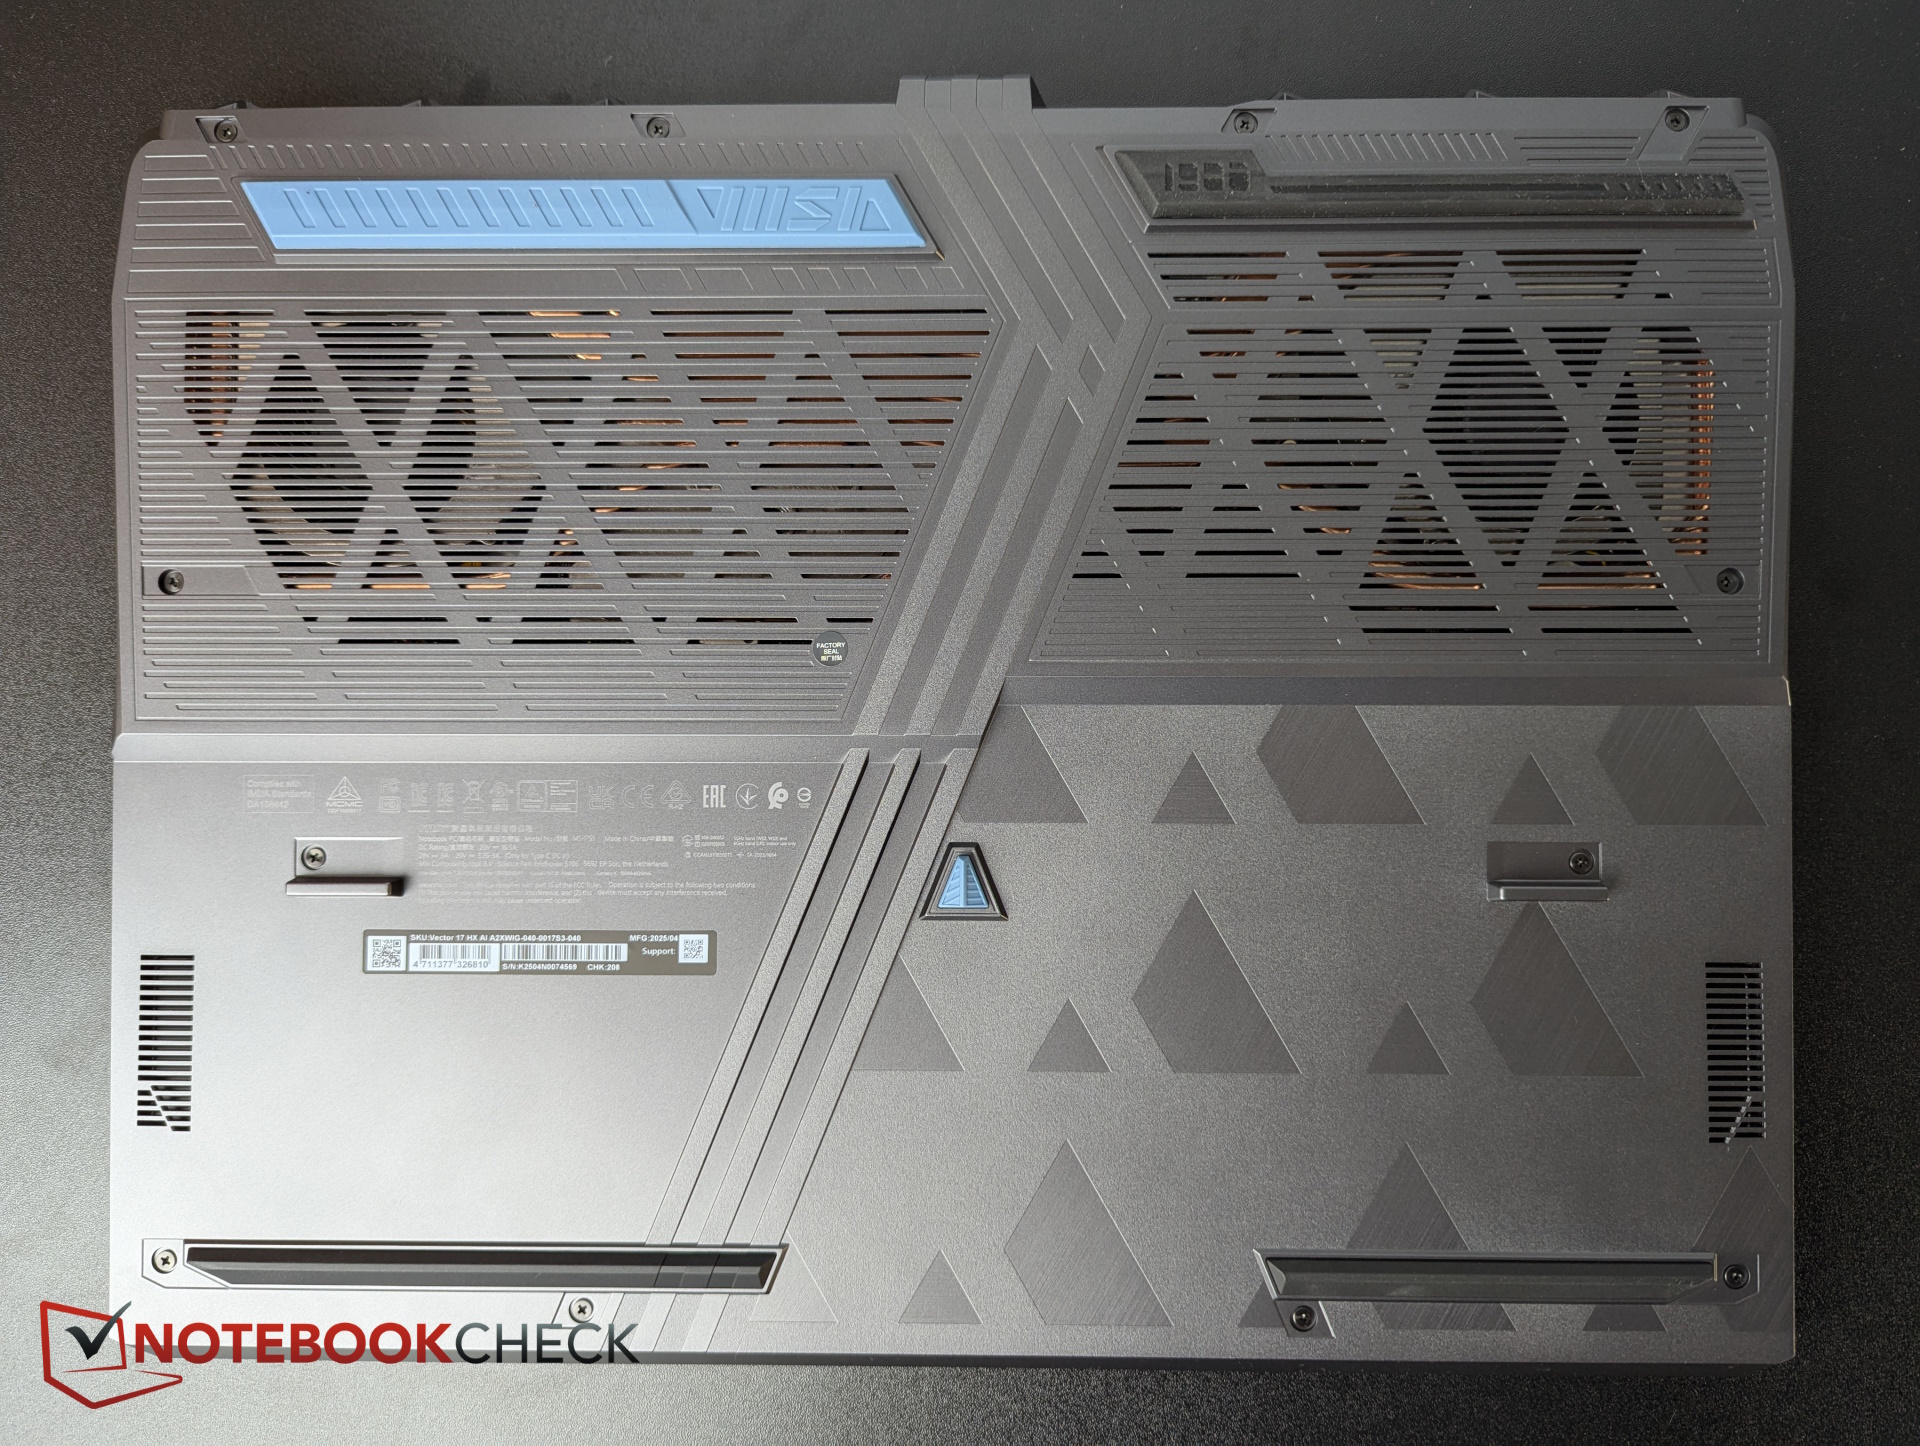
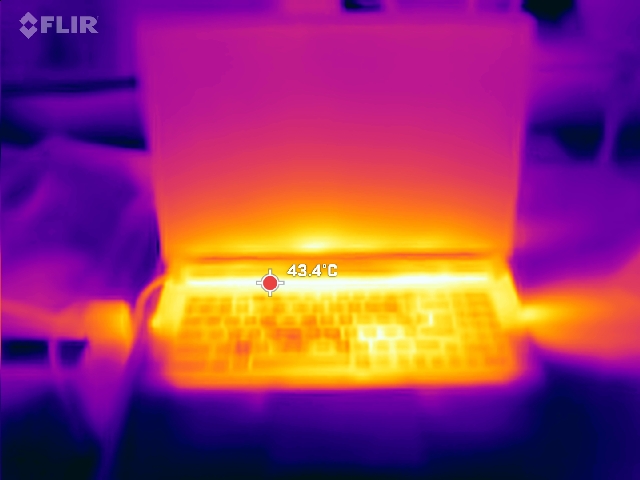
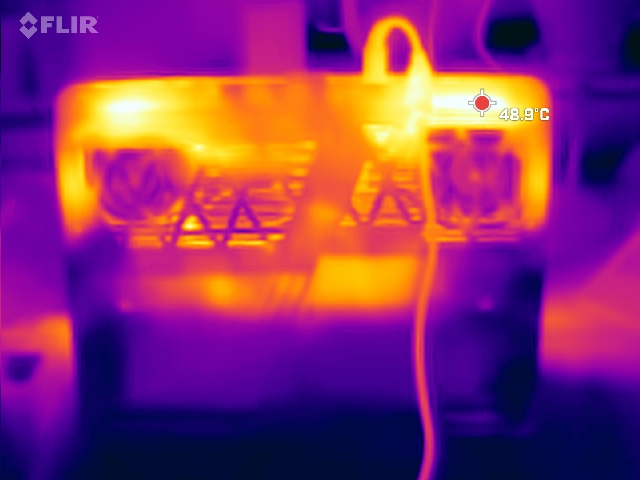
Temperatura
Sotto stress, le temperature di superficie raggiungono i 53 °C (127,4 °F), mentre le temperature di gioco sono più moderate, 47 °C (116,6 °F), con l'area chiave WASD a 38 °C (100,4 °F).
(-) La temperatura massima sul lato superiore è di 53 °C / 127 F, rispetto alla media di 40.5 °C / 105 F, che varia da 21.2 a 68.8 °C per questa classe Gaming.
(-) Il lato inferiore si riscalda fino ad un massimo di 54 °C / 129 F, rispetto alla media di 43.3 °C / 110 F
(+) In idle, la temperatura media del lato superiore è di 31.4 °C / 89 F, rispetto alla media deld ispositivo di 33.9 °C / 93 F.
(±) 3: The average temperature for the upper side is 36.4 °C / 98 F, compared to the average of 33.9 °C / 93 F for the class Gaming.
(+) I poggiapolsi e il touchpad sono piu' freddi della temperatura della pelle con un massimo di 29 °C / 84.2 F e sono quindi freddi al tatto.
(±) La temperatura media della zona del palmo della mano di dispositivi simili e'stata di 28.9 °C / 84 F (-0.1 °C / -0.2 F).
| MSI Vector 17 HX AI A2XWIG Intel Core Ultra 9 275HX, Nvidia GeForce RTX 5080 Laptop | Alienware 16 Area-51 Intel Core Ultra 9 275HX, Nvidia GeForce RTX 5080 Laptop | MSI Vector 16 HX AI A2XWHG Intel Core Ultra 7 255HX, Nvidia GeForce RTX 5070 Ti Laptop | Lenovo Legion Pro 7i 16 Gen 10 Intel Core Ultra 9 275HX, Nvidia GeForce RTX 5080 Laptop | Lenovo Legion 5 Pro 16IAX10H Intel Core Ultra 9 275HX, Nvidia GeForce RTX 5070 Ti Laptop | MSI Raider A18 HX A9WIG-080 AMD Ryzen 9 9955HX3D, Nvidia GeForce RTX 5080 Laptop | Medion Erazer Beast 18 X1 MD62731 Intel Core Ultra 9 275HX, Nvidia GeForce RTX 5080 Laptop | |
|---|---|---|---|---|---|---|---|
| Heat | 12% | 9% | 16% | -1% | 6% | 13% | |
| Maximum Upper Side * | 53 | 43.8 17% | 53 -0% | 42.6 20% | 48 9% | 49.3 7% | 47 11% |
| Maximum Bottom * | 54 | 40 26% | 52 4% | 41.2 24% | 50 7% | 50.9 6% | 48 11% |
| Idle Upper Side * | 39 | 35.8 8% | 33 15% | 32.6 16% | 38 3% | 35.2 10% | 29 26% |
| Idle Bottom * | 34 | 35.2 -4% | 29 15% | 32.4 5% | 42 -24% | 33.5 1% | 33 3% |
* ... Meglio usare valori piccoli
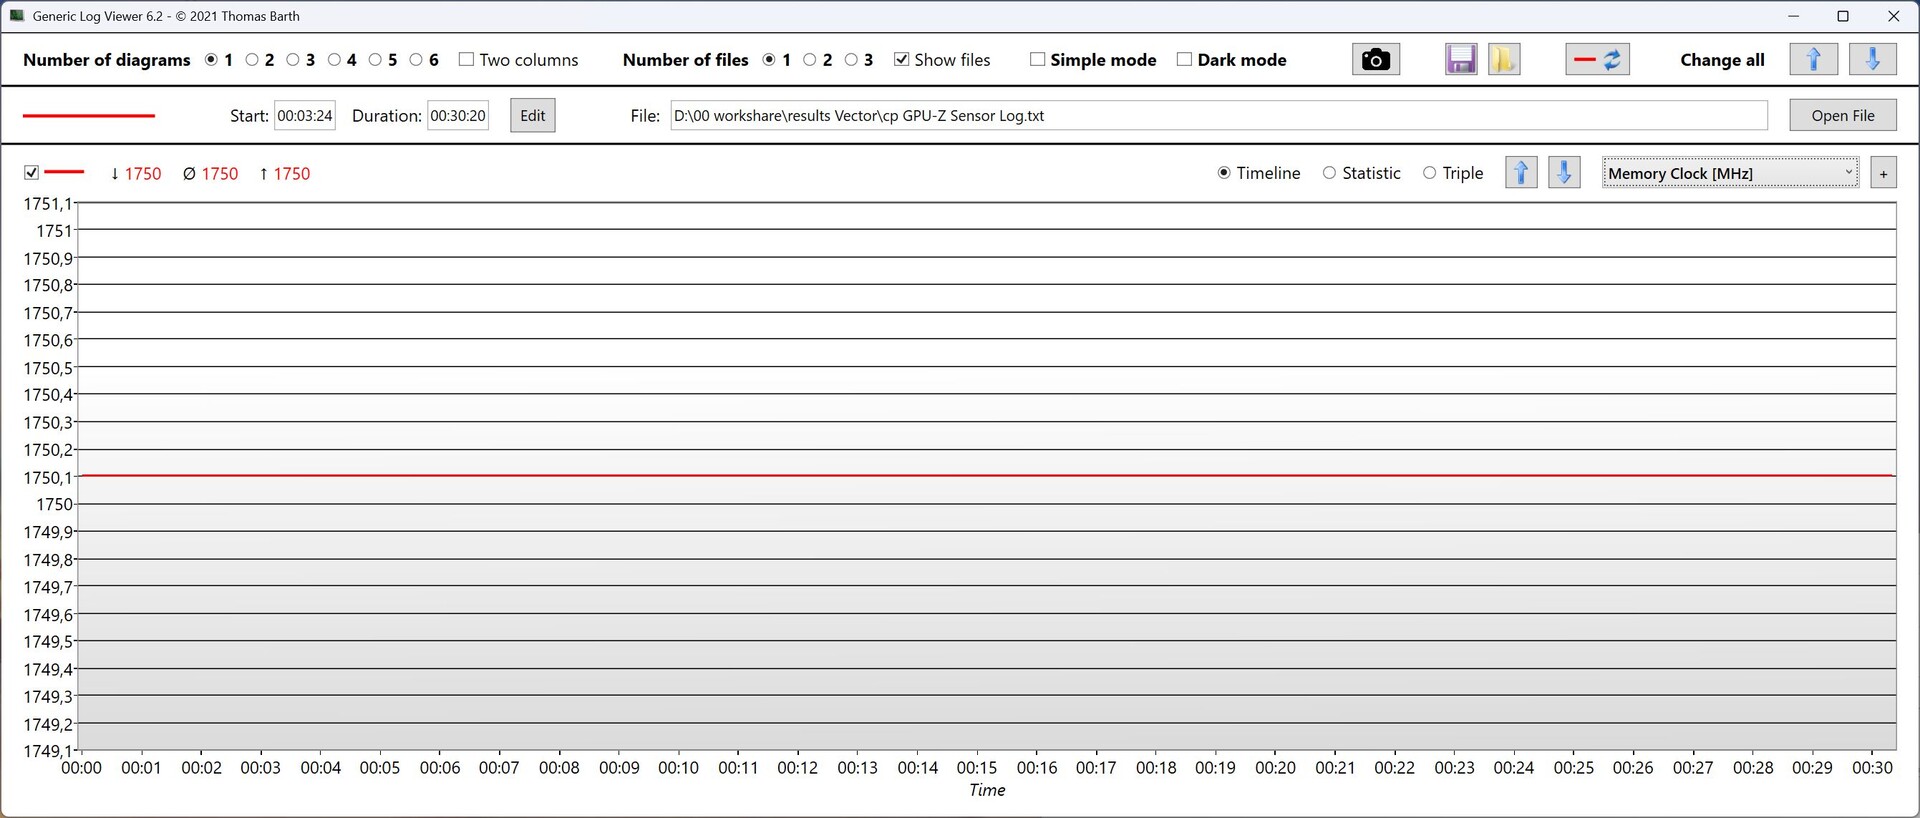
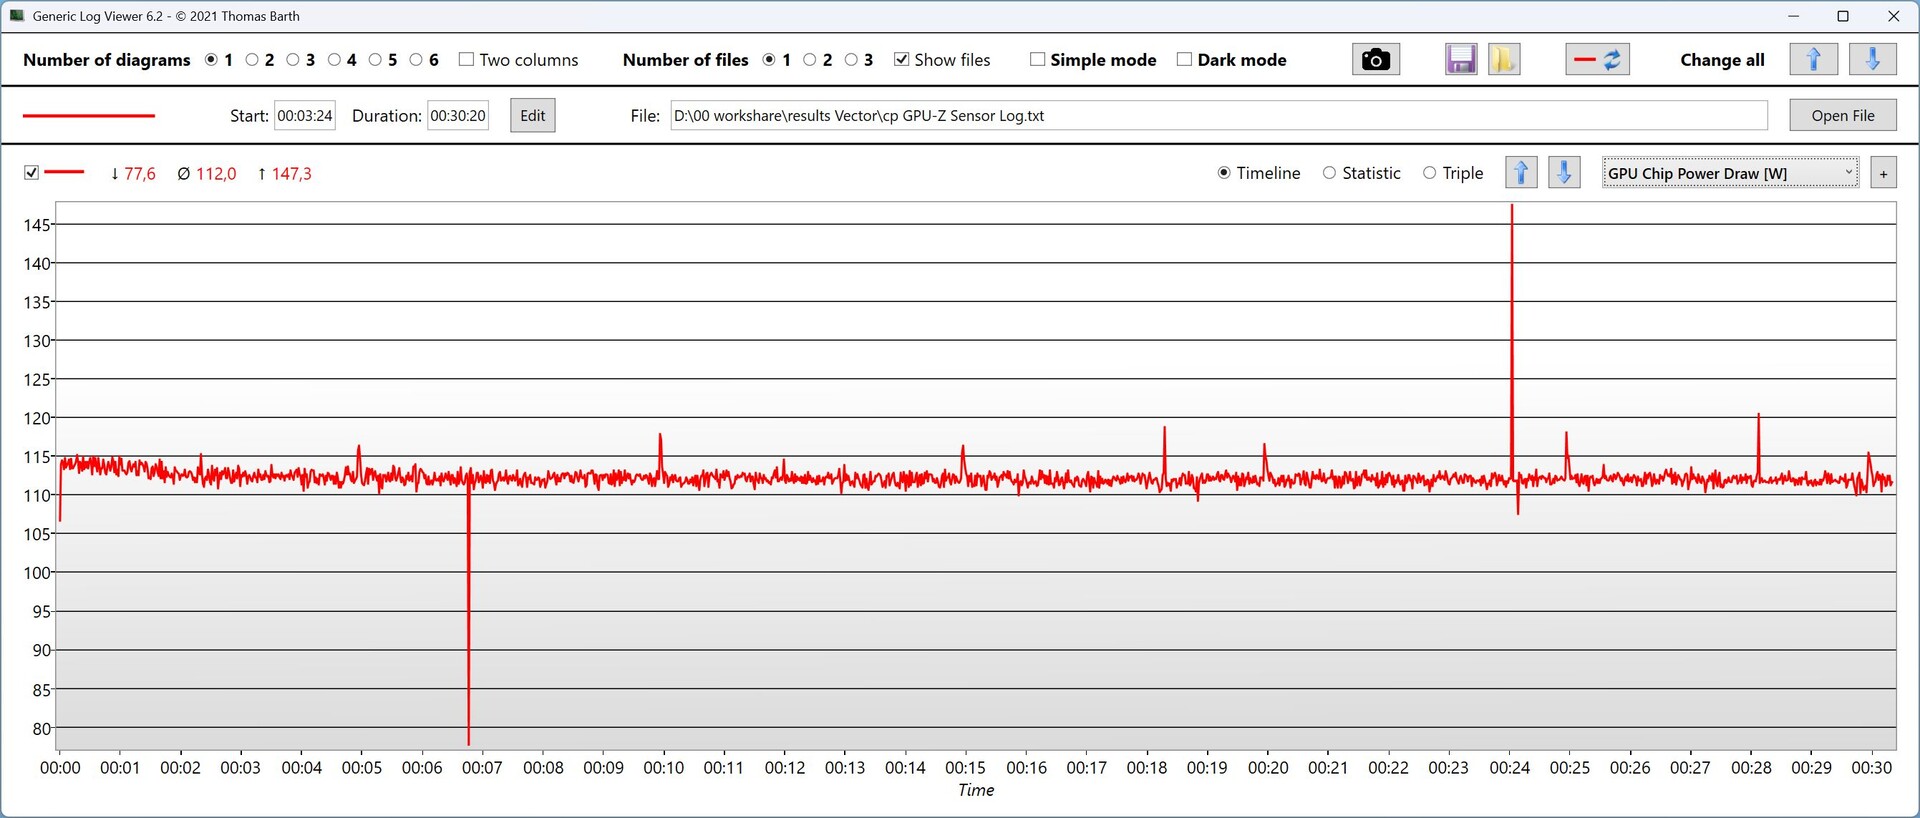
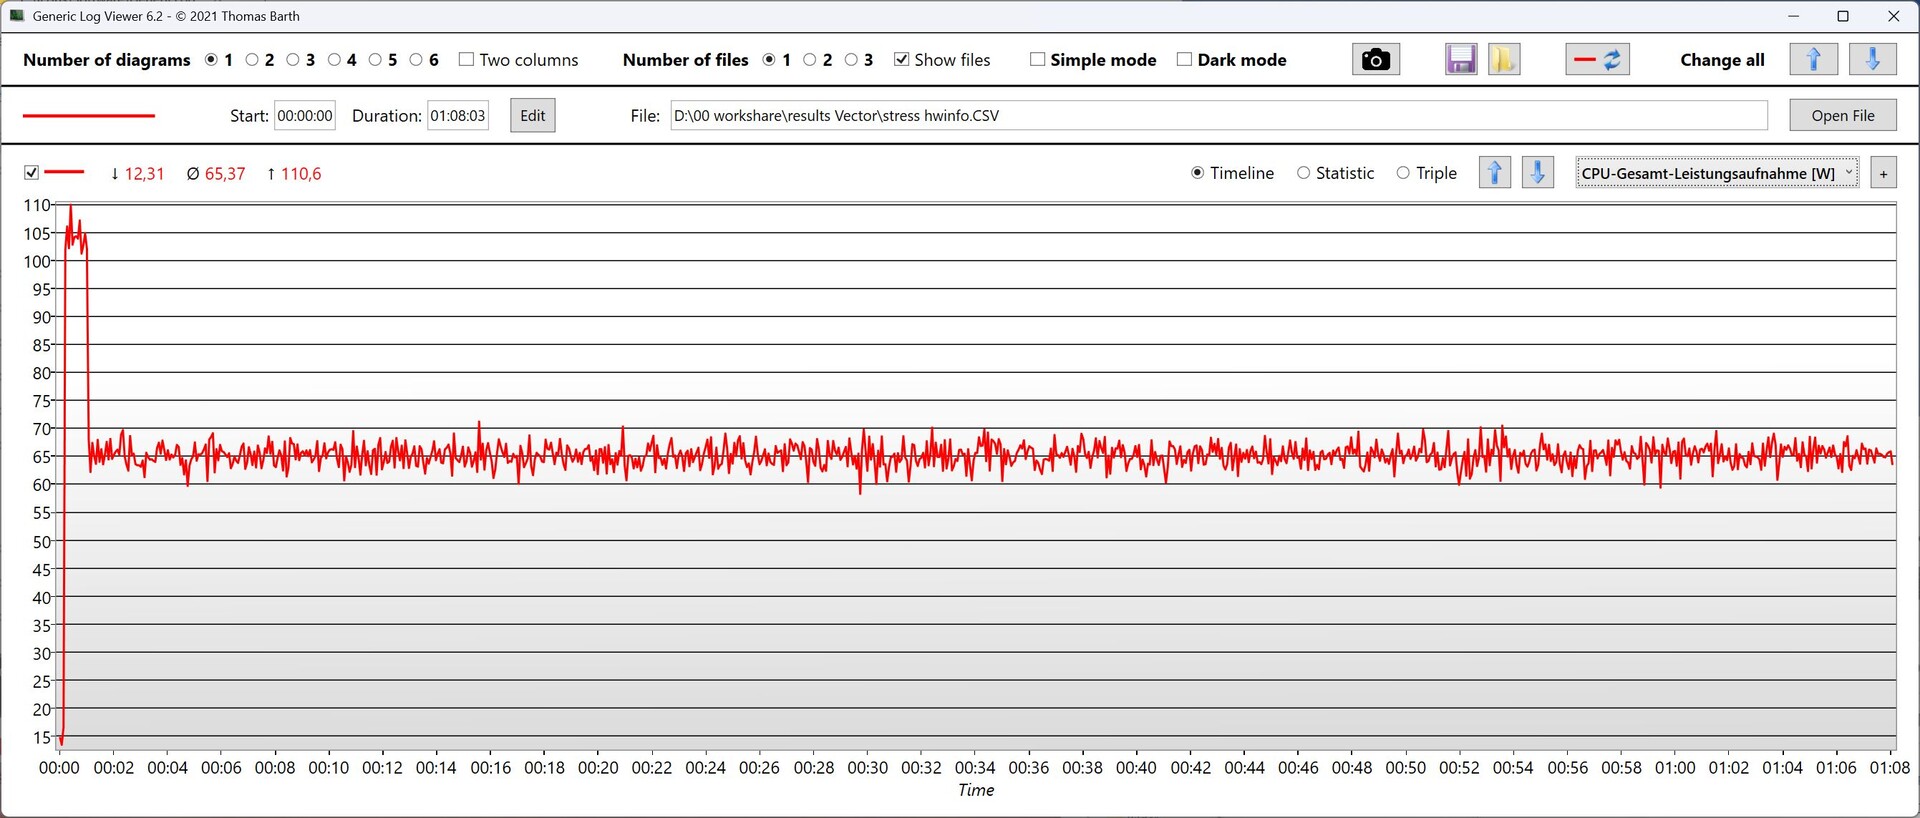
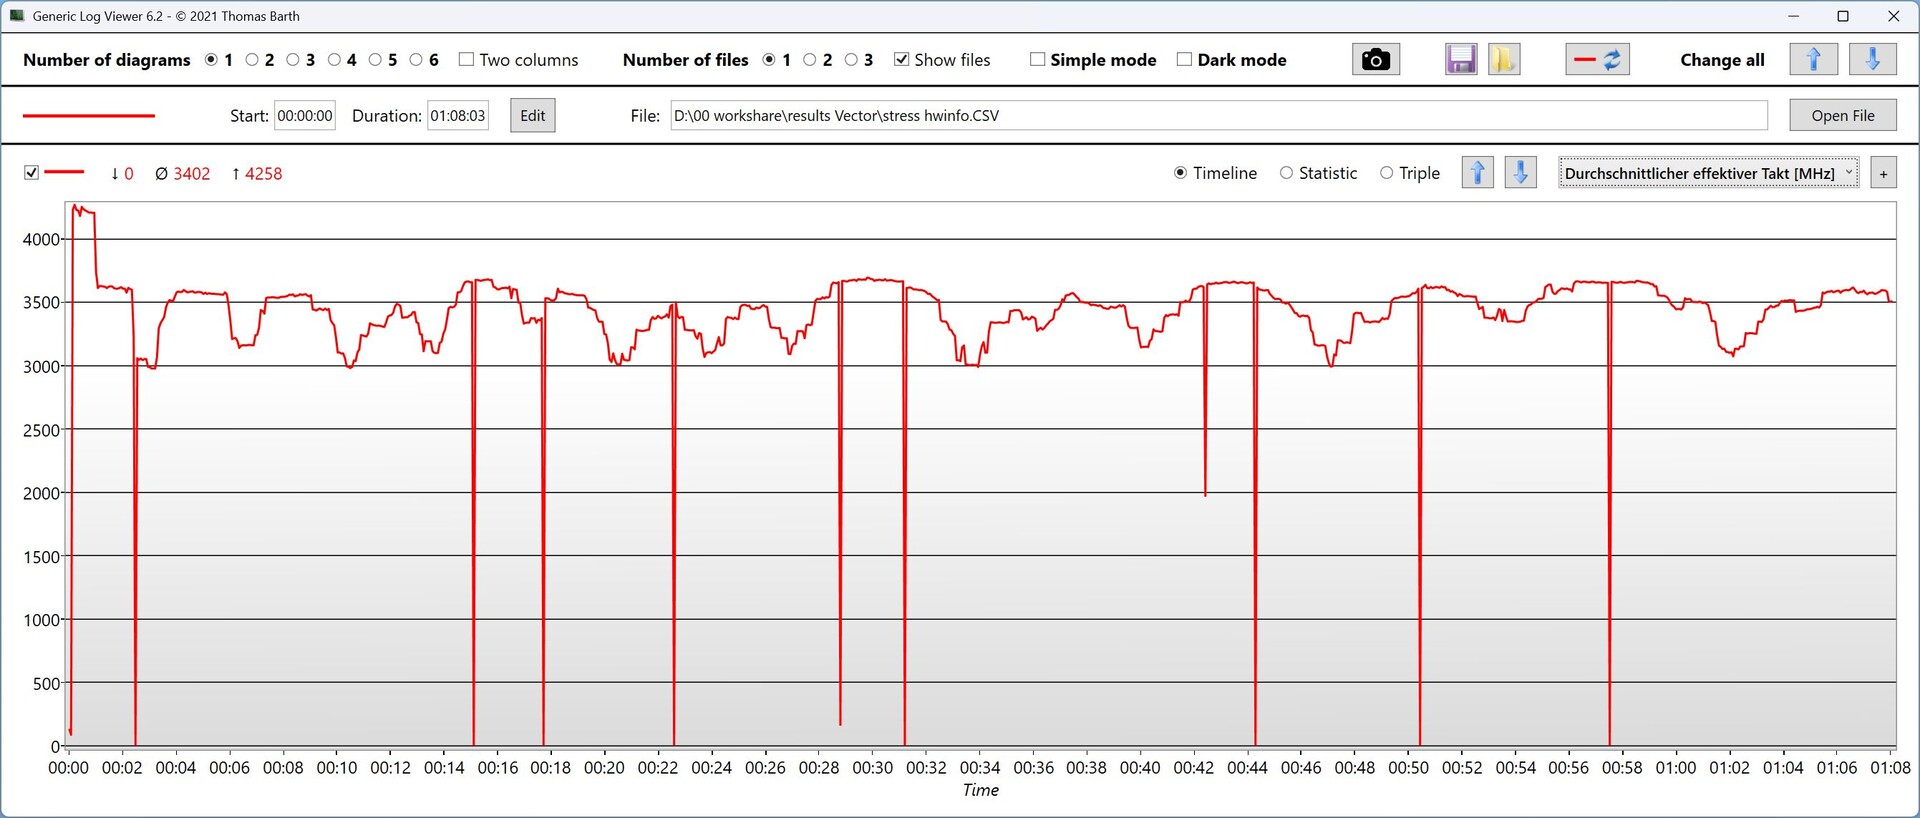
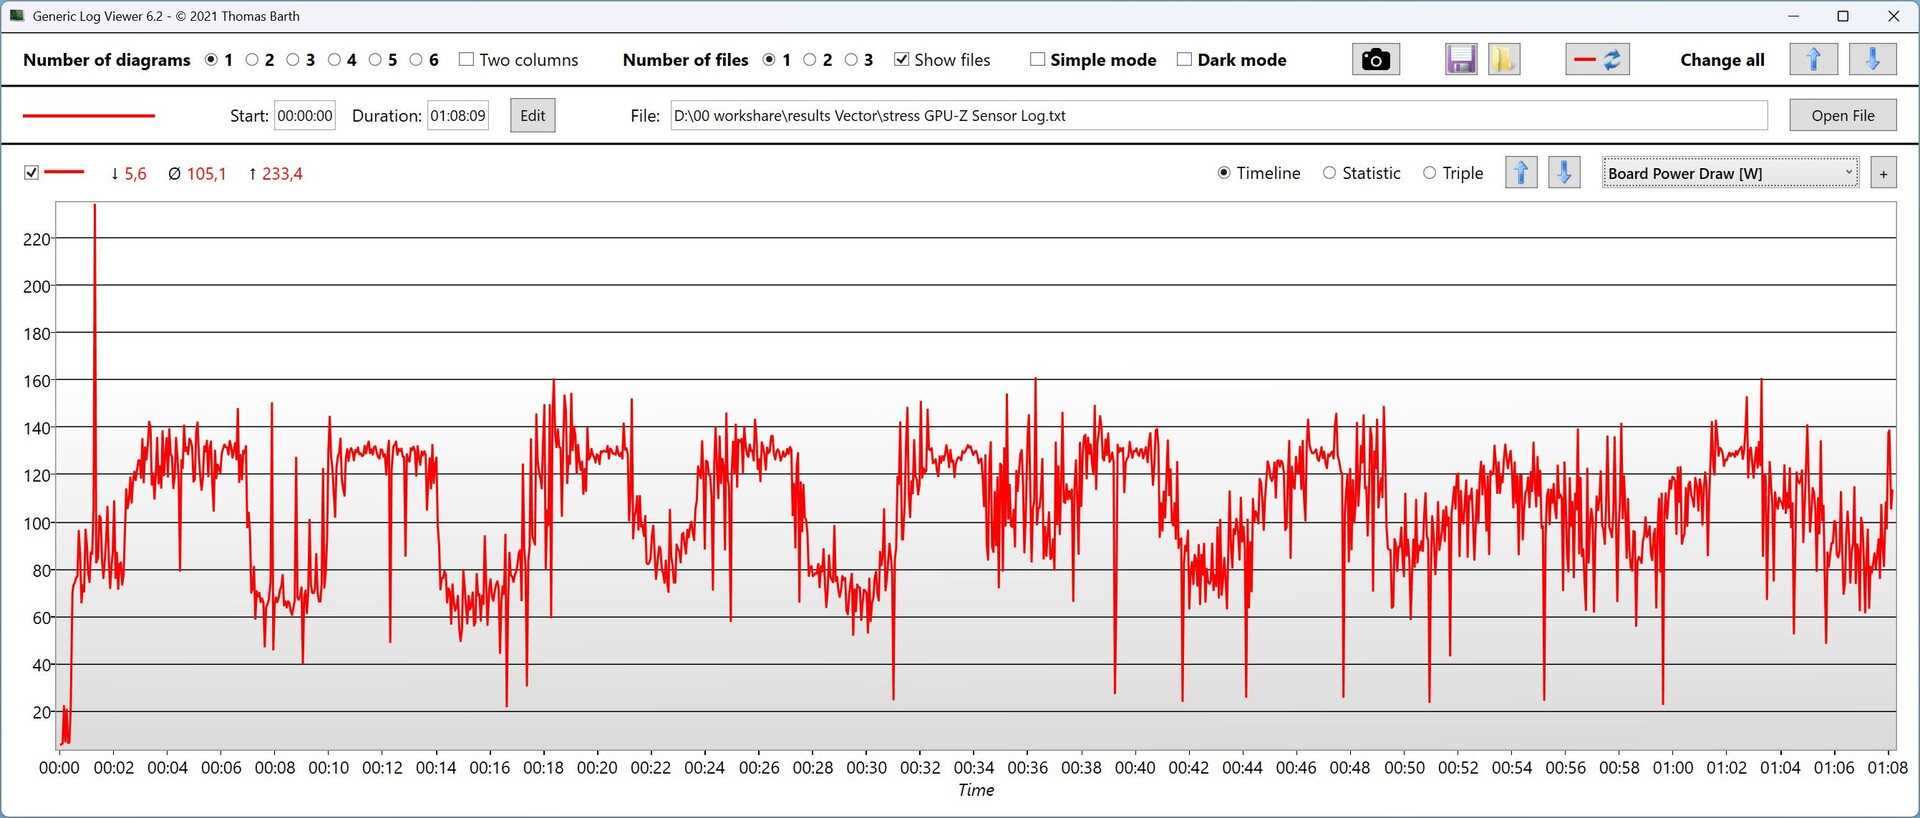
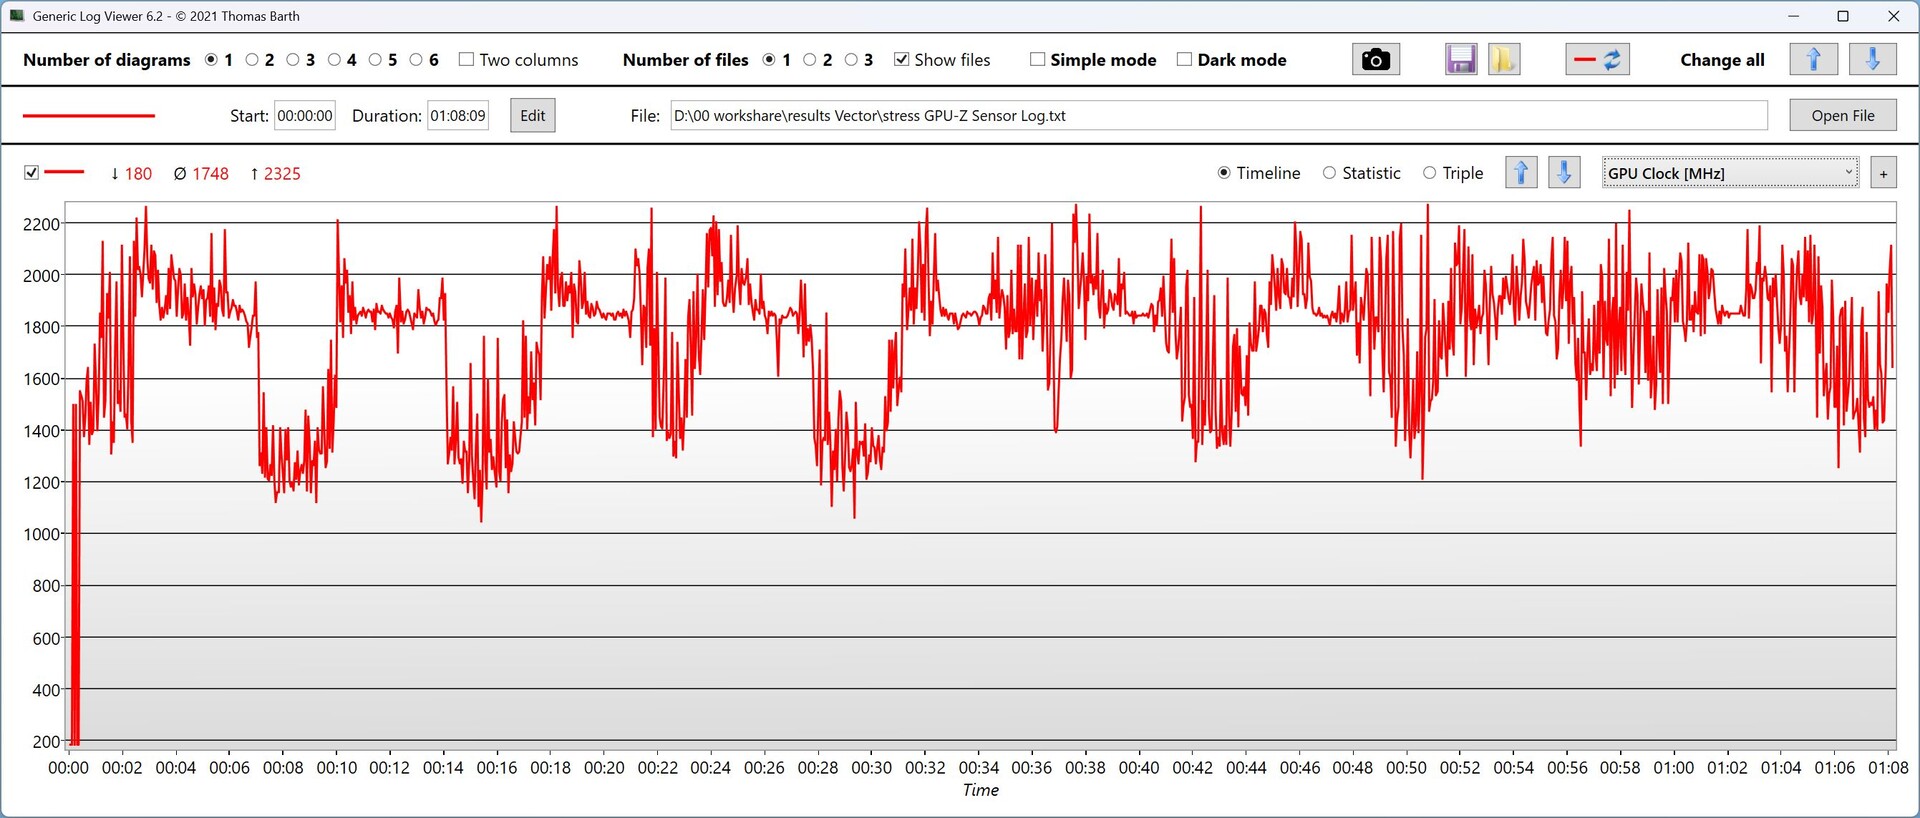
| Clock della CPU (GHz) | Clock della GPU (MHz) | Temperatura media della CPU (°C) | Temperatura media della GPU (°C) | |
| Prime95 Stress | 4,25 | 750 | 80 | 45 |
| Prime95 + FurMark Stress | 3,4 | 1.750 | 74 - 81 | 70 - 87 |
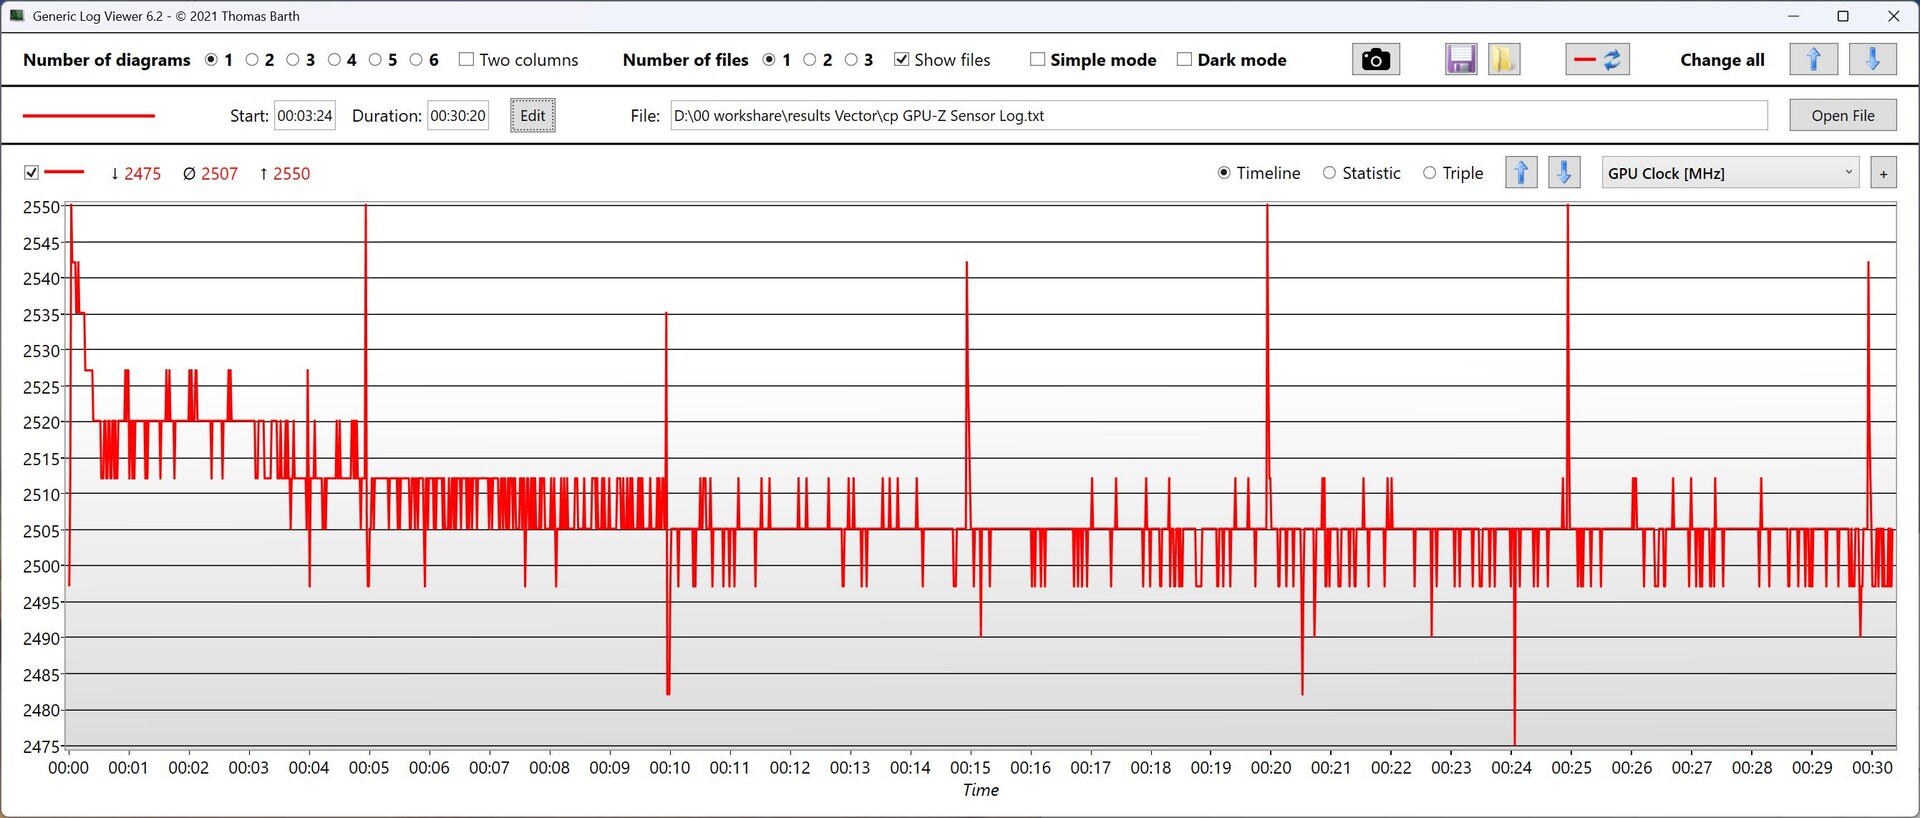
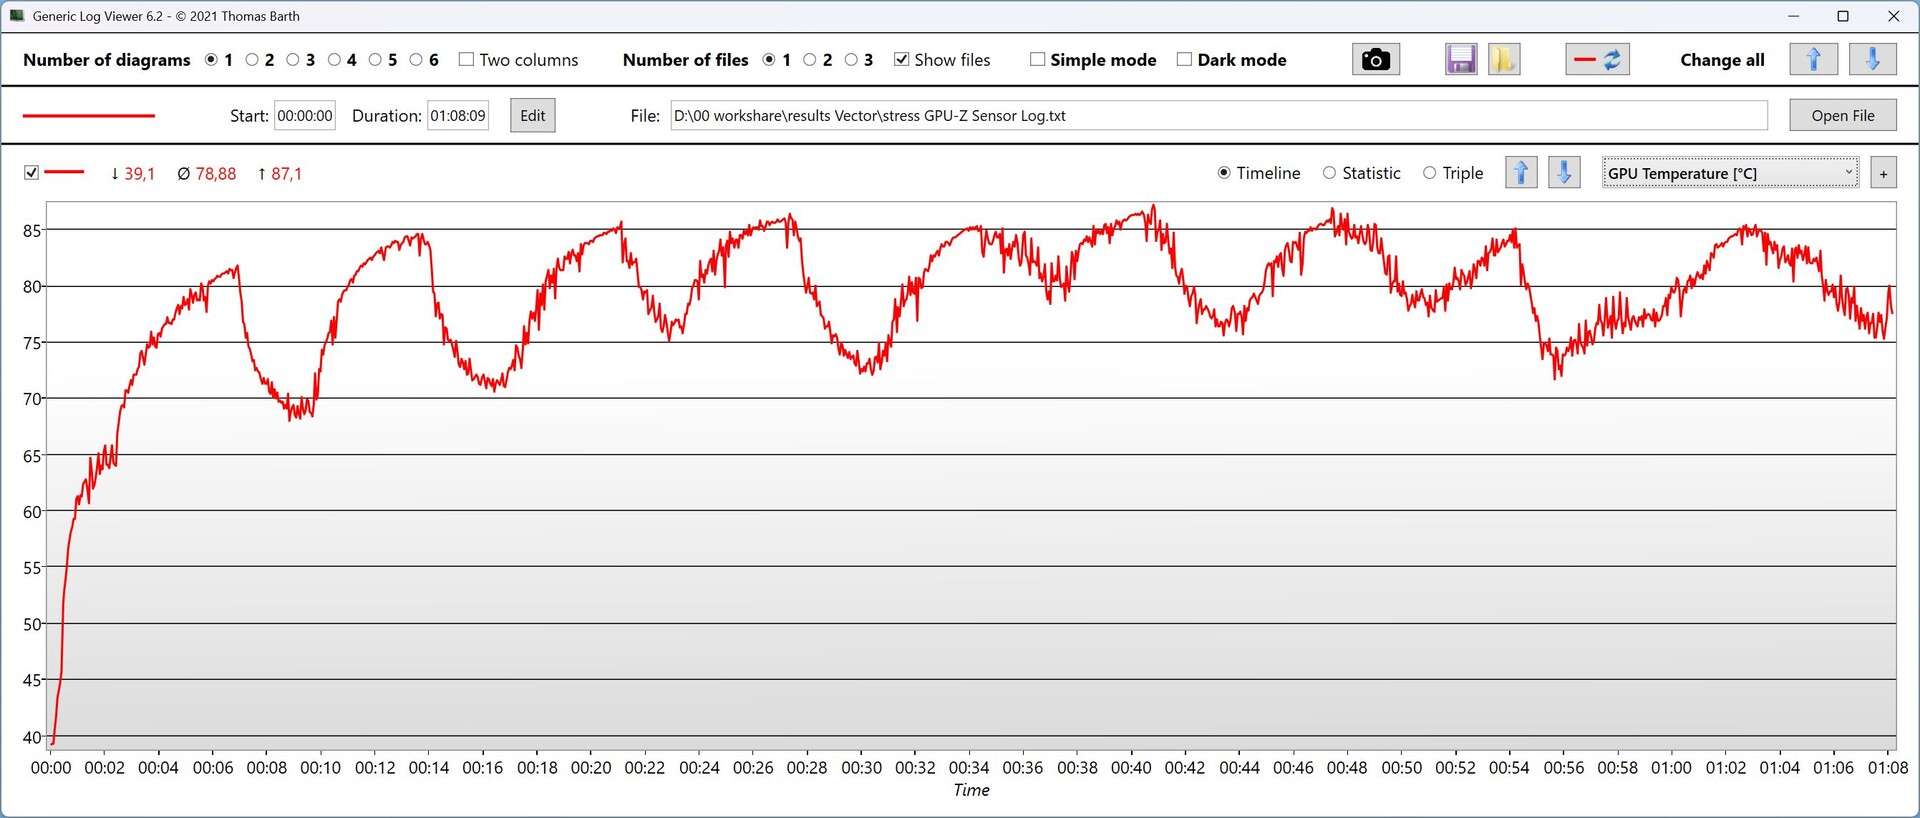
| Cyberpunk 2077 Stress | 1,9 | 2.500 | 81 - 89 | fino all'80 |
Test da sforzo

Altoparlante
Gli altoparlanti fanno un lavoro medio. È disponibile una porta jack da 3,5 mm per cuffie e simili.
MSI Vector 17 HX AI A2XWIG analisi audio
(±) | potenza degli altiparlanti media ma buona (80.39 dB)
Bassi 100 - 315 Hz
(±) | bassi ridotti - in media 10.4% inferiori alla media
(±) | la linearità dei bassi è media (7.4% delta rispetto alla precedente frequenza)
Medi 400 - 2000 Hz
(±) | medi elevati - circa 6.2% superiore alla media
(+) | medi lineari (4.7% delta rispetto alla precedente frequenza)
Alti 2 - 16 kHz
(+) | Alti bilanciati - appena 4.3% dalla media
(±) | la linearità degli alti è media (8.7% delta rispetto alla precedente frequenza)
Nel complesso 100 - 16.000 Hz
(±) | la linearità complessiva del suono è media (15.6% di differenza rispetto alla media
Rispetto alla stessa classe
» 35% di tutti i dispositivi testati in questa classe è stato migliore, 6% simile, 58% peggiore
» Il migliore ha avuto un delta di 6%, medio di 18%, peggiore di 132%
Rispetto a tutti i dispositivi testati
» 22% di tutti i dispositivi testati in questa classe è stato migliore, 4% similare, 74% peggiore
» Il migliore ha avuto un delta di 4%, medio di 24%, peggiore di 134%
Lenovo Legion 5 Pro 16IAX10H analisi audio
(±) | potenza degli altiparlanti media ma buona (78.2 dB)
Bassi 100 - 315 Hz
(-) | quasi nessun basso - in media 21.1% inferiori alla media
(±) | la linearità dei bassi è media (8% delta rispetto alla precedente frequenza)
Medi 400 - 2000 Hz
(±) | medi elevati - circa 6.3% superiore alla media
(+) | medi lineari (6.5% delta rispetto alla precedente frequenza)
Alti 2 - 16 kHz
(+) | Alti bilanciati - appena 1.6% dalla media
(+) | alti lineari (4.9% delta rispetto alla precedente frequenza)
Nel complesso 100 - 16.000 Hz
(±) | la linearità complessiva del suono è media (18.3% di differenza rispetto alla media
Rispetto alla stessa classe
» 57% di tutti i dispositivi testati in questa classe è stato migliore, 8% simile, 34% peggiore
» Il migliore ha avuto un delta di 6%, medio di 18%, peggiore di 132%
Rispetto a tutti i dispositivi testati
» 38% di tutti i dispositivi testati in questa classe è stato migliore, 8% similare, 54% peggiore
» Il migliore ha avuto un delta di 4%, medio di 24%, peggiore di 134%
Consumo di energia
Dopo gli aggiornamenti, il consumo in idle è ora ok. Nei giochi, è ancora troppo elevato rispetto alle prestazioni offerte. Se si collega un monitor esterno tramite HDMI, la dGPU è attiva e si consuma più energia in modalità idle.
| Off / Standby | |
| Idle | |
| Sotto carico |
|
Leggenda:
min: | |
| MSI Vector 17 HX AI A2XWIG Ultra 9 275HX, GeForce RTX 5080 Laptop, Western Digital PC SN5000S SDEPNSJ-2T00-1032, IPS, 2560x1600, 17" | Alienware 16 Area-51 Ultra 9 275HX, GeForce RTX 5080 Laptop, , IPS, 2560x1600, 16" | MSI Vector 16 HX AI A2XWHG Ultra 7 255HX, GeForce RTX 5070 Ti Laptop, Micron 2400 MTFDKBA512QFM, IPS, 2560x1600, 16" | Lenovo Legion Pro 7i 16 Gen 10 Ultra 9 275HX, GeForce RTX 5080 Laptop, SK Hynix HFS001TEJ9X115N, OLED, 2560x1600, 16" | Lenovo Legion 5 Pro 16IAX10H Ultra 9 275HX, GeForce RTX 5070 Ti Laptop, Western Digital PC SN8000S SDEPNRK-1T00, OLED, 2560x1600, 16" | MSI Raider A18 HX A9WIG-080 R9 9955HX3D, GeForce RTX 5080 Laptop, Samsung PM9E1 MZVLC2T0HBLD, MiniLED IPS, 3840x2400, 18" | Medion Erazer Beast 18 X1 MD62731 Ultra 9 275HX, GeForce RTX 5080 Laptop, Phison E31 2 TB, IPS, 2560x1600, 18" | Media Nvidia GeForce RTX 5080 Laptop | Media della classe Gaming | |
|---|---|---|---|---|---|---|---|---|---|
| Power Consumption | -61% | -3% | -80% | -14% | -119% | 6% | -44% | -24% | |
| Idle Minimum * | 10 | 27 -170% | 7.1 29% | 28.5 -185% | 14 -40% | 41.5 -315% | 7.9 21% | 17.4 ? -74% | 14.1 ? -41% |
| Idle Average * | 15.4 | 33.5 -118% | 15.9 -3% | 38.8 -152% | 14.3 7% | 53.5 -247% | 11.5 25% | 24.1 ? -56% | 20.1 ? -31% |
| Idle Maximum * | 18.7 | 41.4 -121% | 29.5 -58% | 45.6 -144% | 20.1 -7% | 53.8 -188% | 16.6 11% | 27.2 ? -45% | 27.1 ? -45% |
| Load Average * | 89.7 | 124.7 -39% | 124 -38% | 132.2 -47% | 177 -97% | 168.5 -88% | 130 -45% | 126.4 ? -41% | 107.6 ? -20% |
| Cyberpunk 2077 ultra * | 308 | 256 17% | 222 28% | 318 -3% | 255 17% | 298 3% | 253 18% | ||
| Cyberpunk 2077 ultra external monitor * | 300 | 249 17% | 217 28% | 319 -6% | 255 15% | 295 2% | 245 18% | ||
| Load Maximum * | 321 | 367.2 -14% | 336 -5% | 384 -20% | 294 8% | 323.7 -1% | 330 -3% | 326 ? -2% | 260 ? 19% |
* ... Meglio usare valori piccoli
Energy consumption Cyberpunk / Stress test
Energy consumption with external Monitor
Durata della batteria
Con la batteria da 90 Wh, il Vector 17 raggiunge circa 6,75 ore nel nostro test Wi-Fi con la luminosità ridotta (modalità Eco). Si tratta di un buon valore in confronto.
| MSI Vector 17 HX AI A2XWIG Ultra 9 275HX, GeForce RTX 5080 Laptop, 90 Wh | Alienware 16 Area-51 Ultra 9 275HX, GeForce RTX 5080 Laptop, 96 Wh | MSI Vector 16 HX AI A2XWHG Ultra 7 255HX, GeForce RTX 5070 Ti Laptop, 90 Wh | Lenovo Legion Pro 7i 16 Gen 10 Ultra 9 275HX, GeForce RTX 5080 Laptop, 99 Wh | Lenovo Legion 5 Pro 16IAX10H Ultra 9 275HX, GeForce RTX 5070 Ti Laptop, 80 Wh | MSI Raider A18 HX A9WIG-080 R9 9955HX3D, GeForce RTX 5080 Laptop, 99 Wh | Medion Erazer Beast 18 X1 MD62731 Ultra 9 275HX, GeForce RTX 5080 Laptop, 99 Wh | Media della classe Gaming | |
|---|---|---|---|---|---|---|---|---|
| Autonomia della batteria | -58% | 4% | -39% | -20% | -57% | 18% | -14% | |
| WiFi v1.3 | 404 | 170 -58% | 419 4% | 323 -20% | 295 -27% | 124 -69% | 476 18% | 387 ? -4% |
| Load | 113 | 48 -58% | 99 -12% | 63 -44% | 86.4 ? -24% | |||
| Reader / Idle | 187 | 572 ? | ||||||
| H.264 | 290 | 459 ? |
Valutazione complessiva di Notebookcheck
MSI Vector 17 HX AI è un computer portatile da gioco nella media, che ottiene qualche punto in più grazie alla doppia Thunderbolt 5 e al Wi-Fi 7.
MSI Vector 17 HX AI A2XWIG
- 07/16/2025 v8
Christian Hintze
 Total Sustainability Score:
 Confronto tra le possibili alternative
Transparency
La selezione dei dispositivi da recensire viene effettuata dalla nostra redazione. Il campione di prova è stato fornito all'autore come prestito dal produttore o dal rivenditore ai fini di questa recensione. L'istituto di credito non ha avuto alcuna influenza su questa recensione, né il produttore ne ha ricevuto una copia prima della pubblicazione. Non vi era alcun obbligo di pubblicare questa recensione. Non accettiamo mai compensi o pagamenti in cambio delle nostre recensioni. In quanto società mediatica indipendente, Notebookcheck non è soggetta all'autorità di produttori, rivenditori o editori.
Ecco come Notebookcheck esegue i test
Ogni anno, Notebookcheck esamina in modo indipendente centinaia di laptop e smartphone utilizzando procedure standardizzate per garantire che tutti i risultati siano comparabili. Da circa 20 anni sviluppiamo continuamente i nostri metodi di prova e nel frattempo stabiliamo gli standard di settore. Nei nostri laboratori di prova, tecnici ed editori esperti utilizzano apparecchiature di misurazione di alta qualità. Questi test comportano un processo di validazione in più fasi. Il nostro complesso sistema di valutazione si basa su centinaia di misurazioni e parametri di riferimento ben fondati, che mantengono l'obiettività.