Verdetto - Il ROG Zephyrus G14 diventa più costoso, ma ancora migliore nel 2026
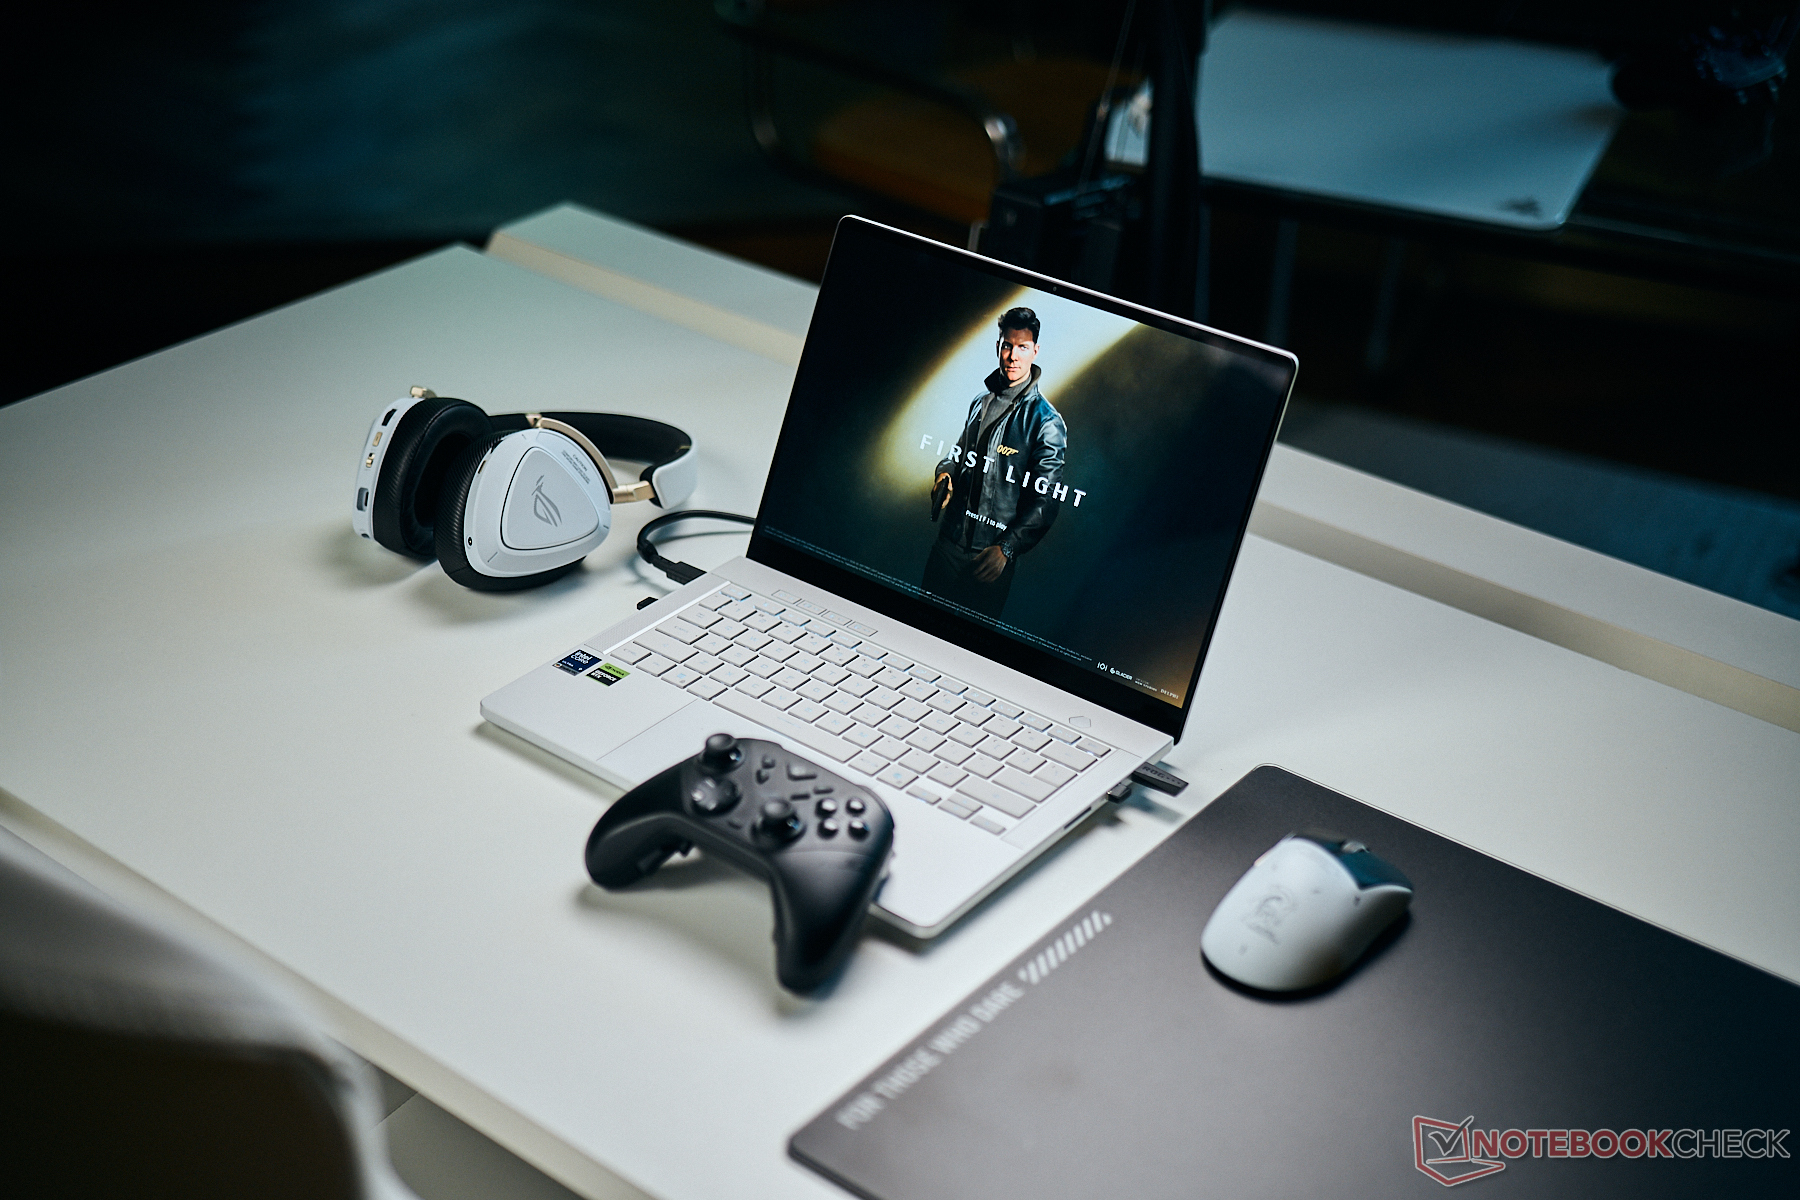
Il ROG Zephyrus G14 era già il dispositivo da 14 pollici più veloce nel settore gaming e multimediale, e Asus ha migliorato alcuni aspetti per il nuovo modello del 2026. Il processore AMD è stato sostituito da una CPU Panther Lake di Intel, che migliora sia le prestazioni single-core sia l’efficienza, garantendo una maggiore autonomia della batteria. Rimane l’unico notebook da gaming da 14 pollici dotato della potente scheda grafica RTX 5070 Ti con tecnologia GeForce, e le prestazioni di gioco non deludono. In combinazione con il nuovo pannello OLED, molto più luminoso rispetto al passato, i giochi appaiono semplicemente straordinari. Asus ha migliorato anche altri aspetti: ora è presente un lettore di schede SD full-size e l’accesso all’interno del dispositivo è stato semplificato grazie a coperchi magnetici anziché incollati. Si tratta inoltre di una delle tastiere più comode che si possano trovare su un portatile.
Tutti questi aspetti positivi hanno però un costo, e oltre all’aumento di prezzo (3199 dollari per la versione con la 5070 Ti e 32 GB di RAM) dovrete anche convivere con ventole rumorose quando vorrete sfruttare appieno le prestazioni della GPU. Ciò significa che probabilmente dovrete indossare delle cuffie durante il gioco. Nelle situazioni di uso quotidiano, tuttavia, il portatile rimane solitamente molto silenzioso.
Tutto sommato, Asus è riuscita a migliorare ulteriormente il ROG Zephyrus G14 e il nuovo pannello OLED risolve uno dei problemi che avevamo riscontrato con il modello precedente. Se però non siete particolarmente interessati ai giochi in HDR, vi consigliamo il modello del 2025, che è ancora disponibile e notevolmente più economico (2599 $).
Pro
Contro
Prezzo e disponibilità
È possibile ordinare la versione 2026 del ROG Zephyrus G14 con la scheda RTX 5070 Ti al prezzo di 3199 $ ( ) su BestBuy.
- $1,499.99EXCaliberPC [2025] ASUS ROG Zephyrus G14 GA403UM-G14.R9HX4 (AMD Ryzen 9 270, 16GB LPDDR5X, 1TB NVMe SSD, NVIDIA GeForce RTX 5060, 14" 3K OLED 120Hz, Windows 11) Gaming Laptop
- $45.99100W USB C Charger Replacement for Asus ROG Zephyrus G16 G14 Duo GU606 GU405 GU606AR GU606AW GU405AR GX651 GX651AR Z13-KJP, Fit for TUF Gaming A14 FA401EA FA401GM Gaming Laptop Power Adapter
- $3,104.10ASUS ROG Zephyrus G14 14" 3K OLED 120Hz Gaming Laptop Copilot+ PC AMD Ryzen AI 9 HX 370 RTX 5080 32GB RAM 2TB SSD Platinum White
Sommario
- Verdetto - Il ROG Zephyrus G14 diventa più costoso, ma ancora migliore nel 2026
- Specifiche tecniche
- Custodia, connettività e dispositivi di input
- Display - OLED più luminoso
- Esibizione - Panther Lake & Blackwell
- Emissioni e consumo energetico
- Valutazione di Notebookcheck
- Confronto tra i potenziali concorrenti
Specifiche tecniche
Custodia, connettività e dispositivi di input
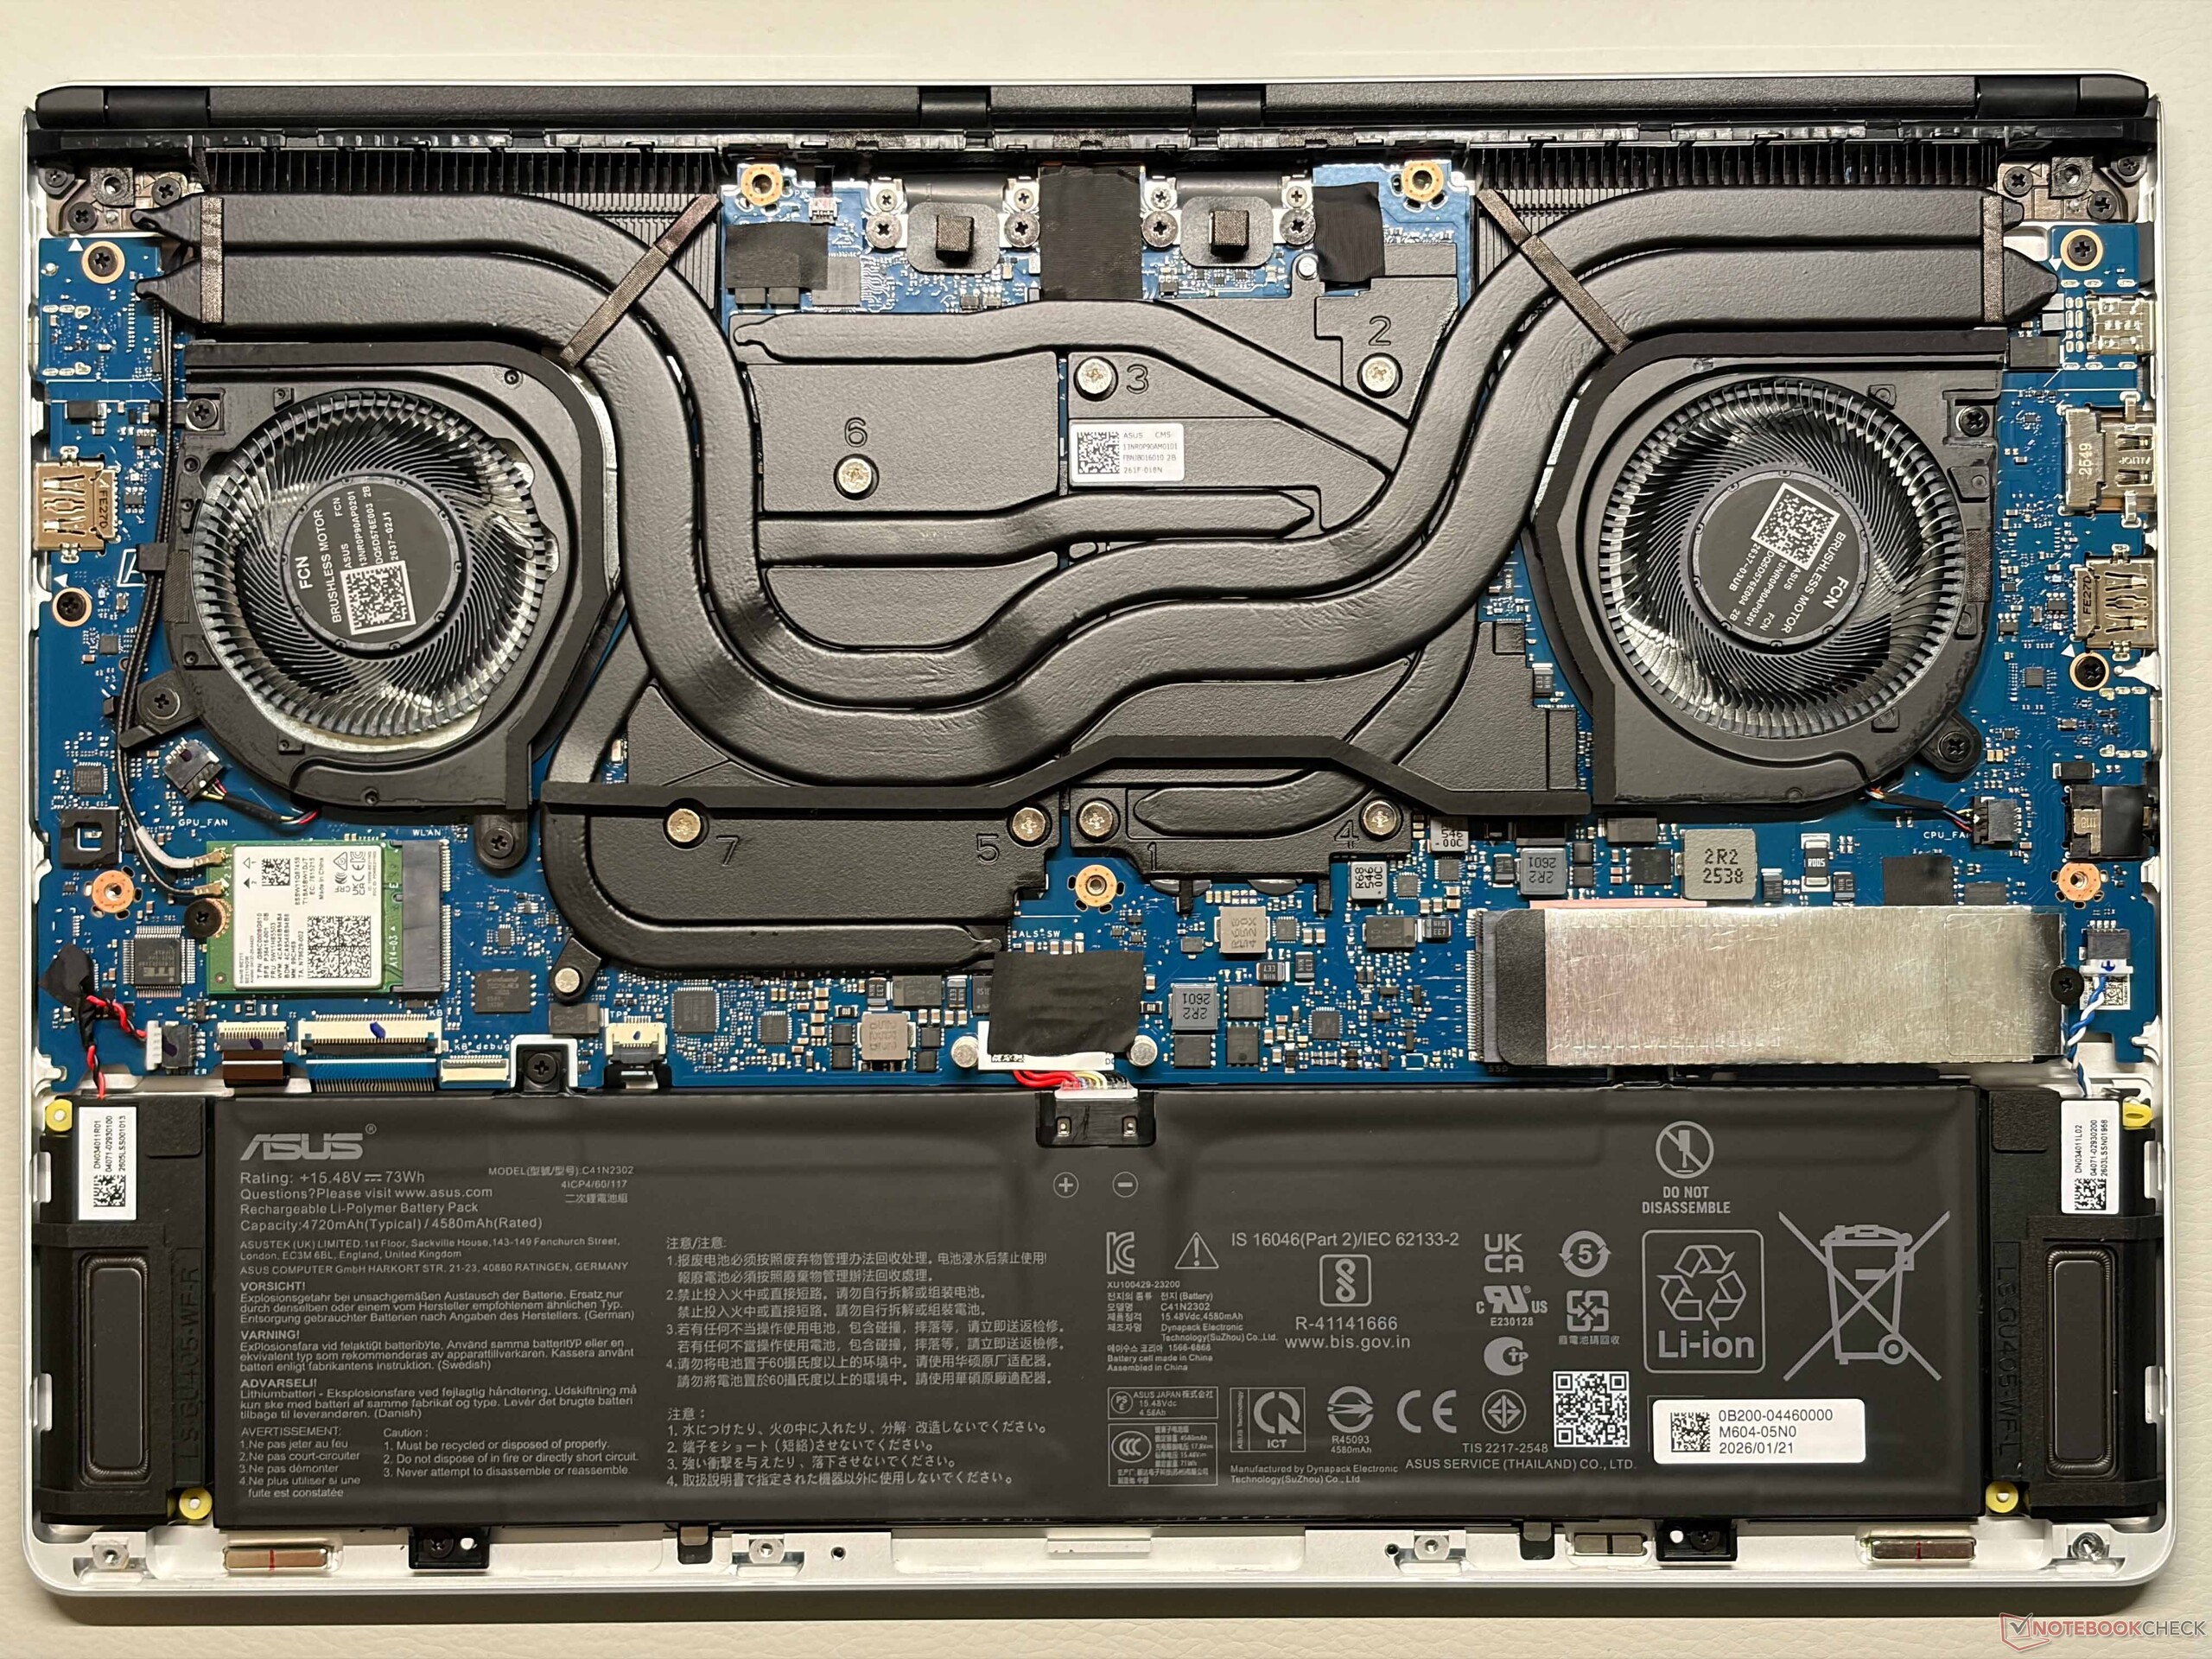
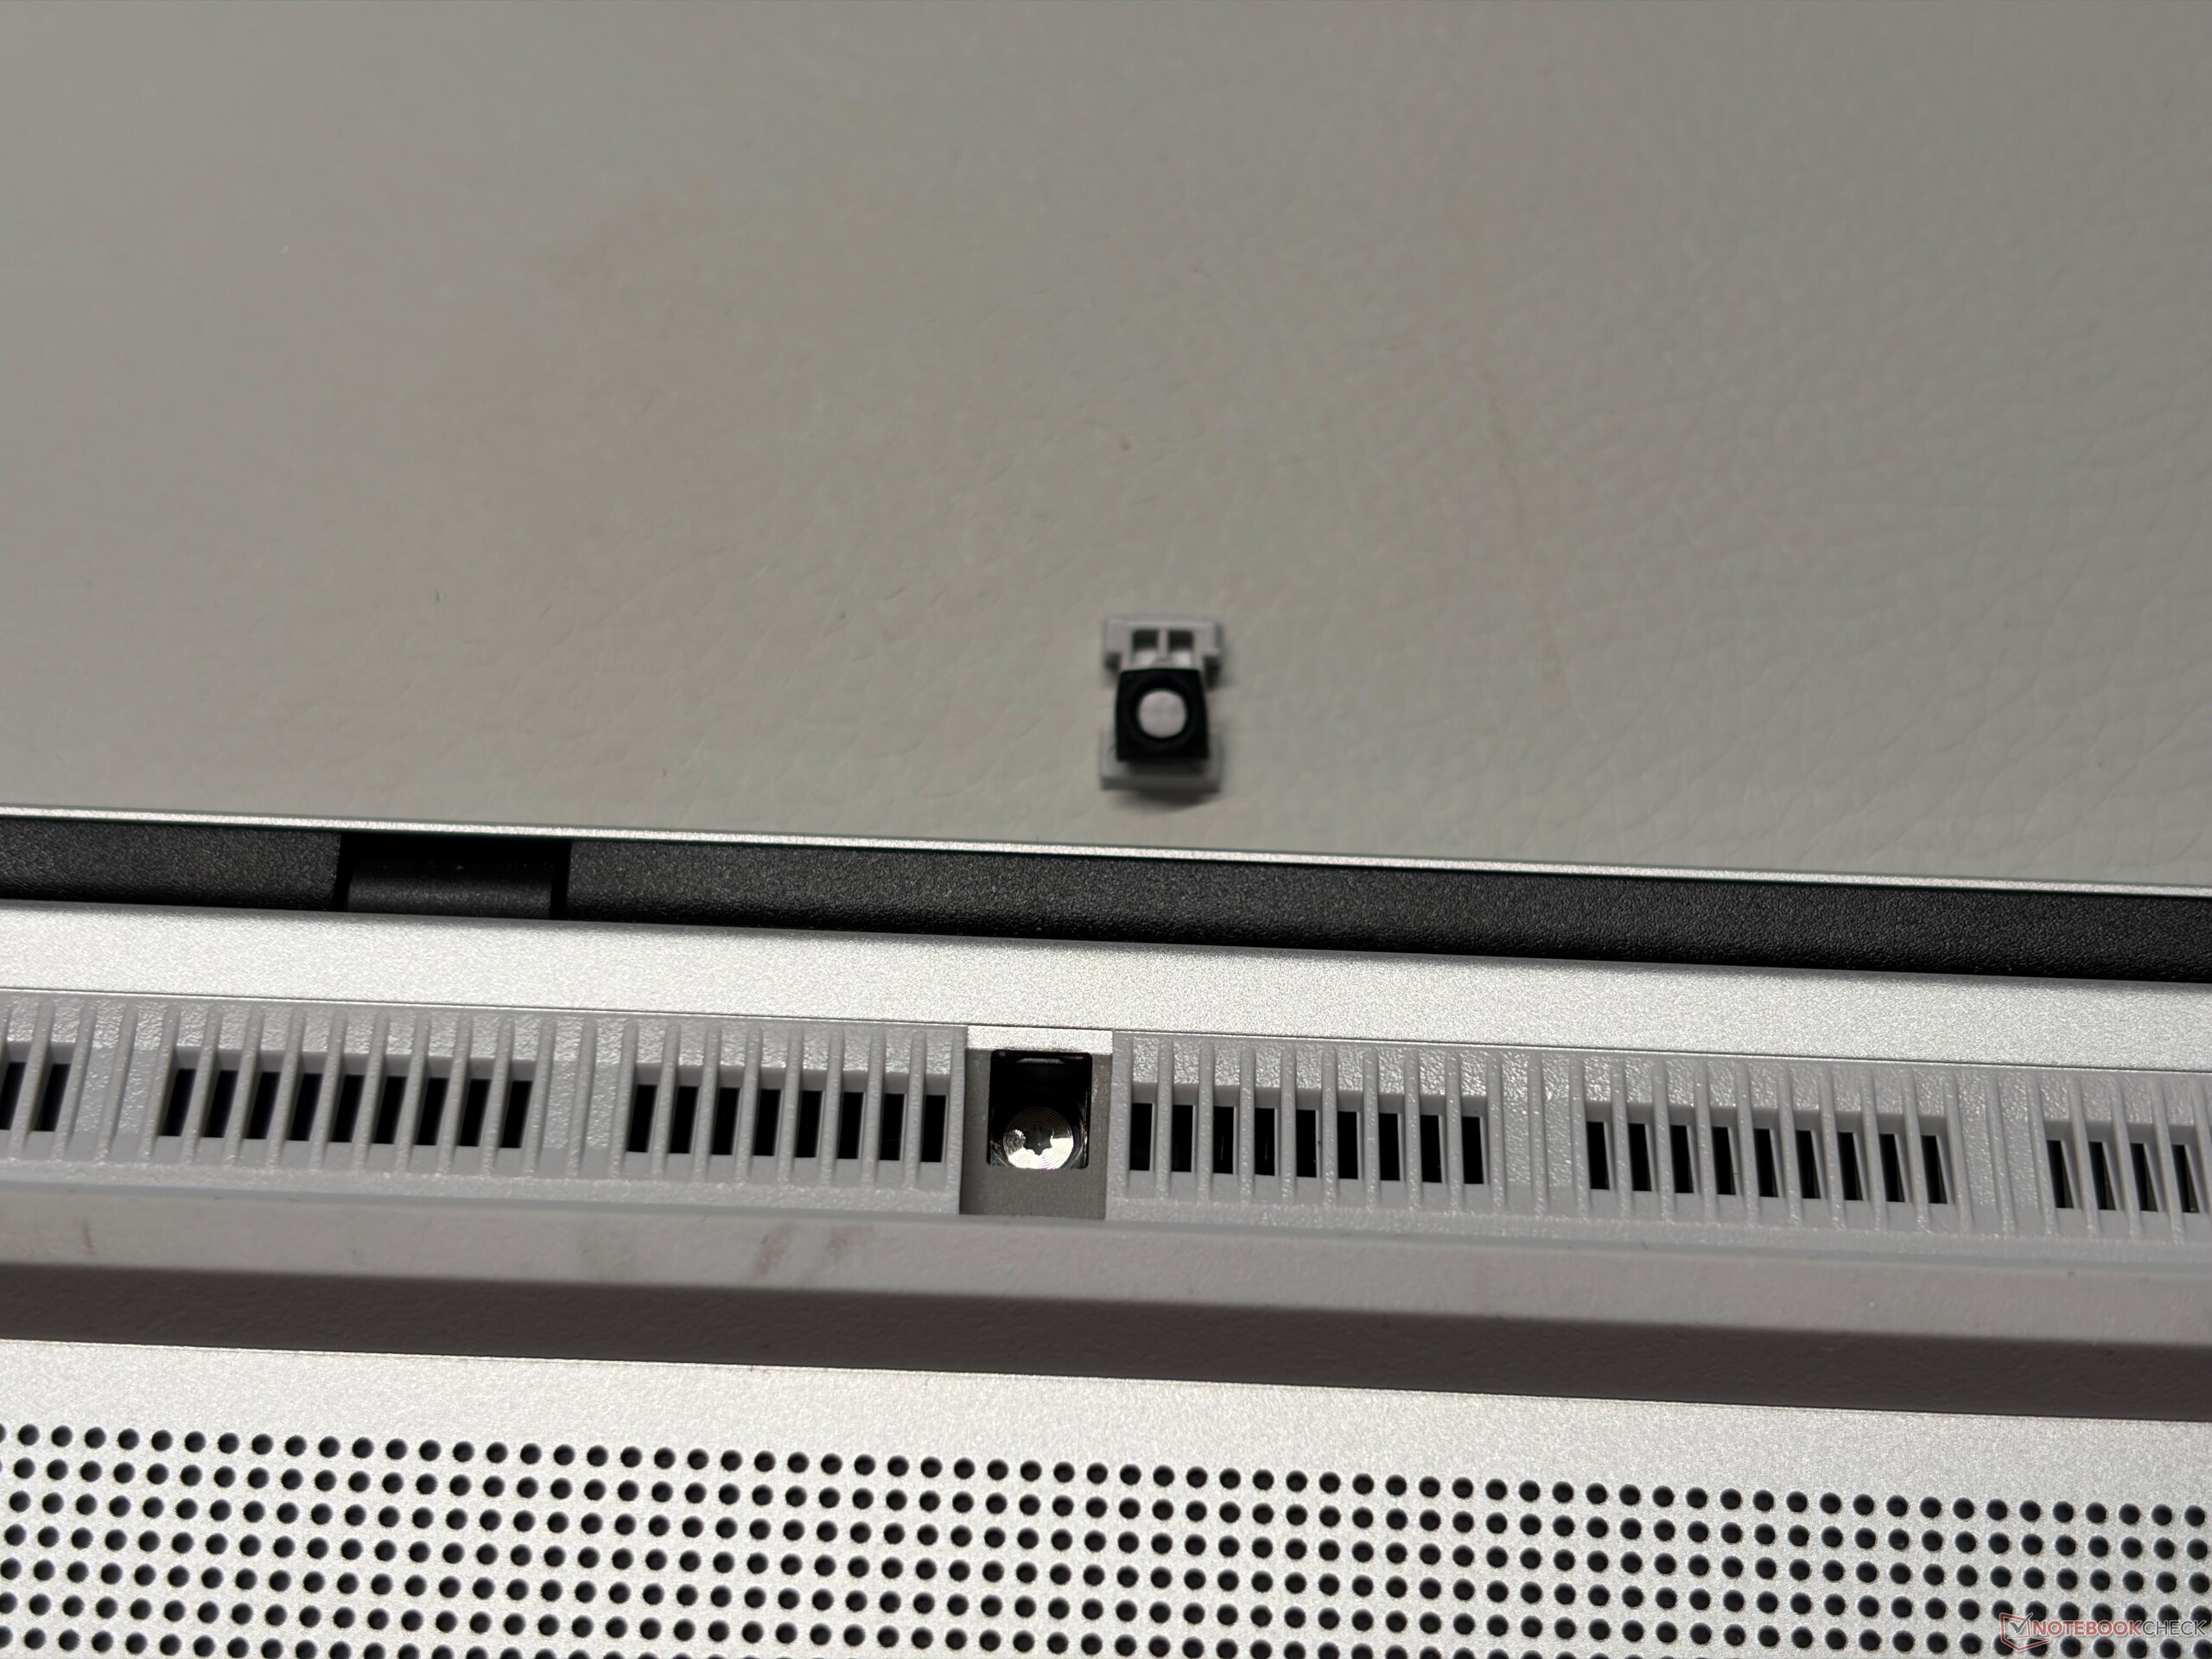
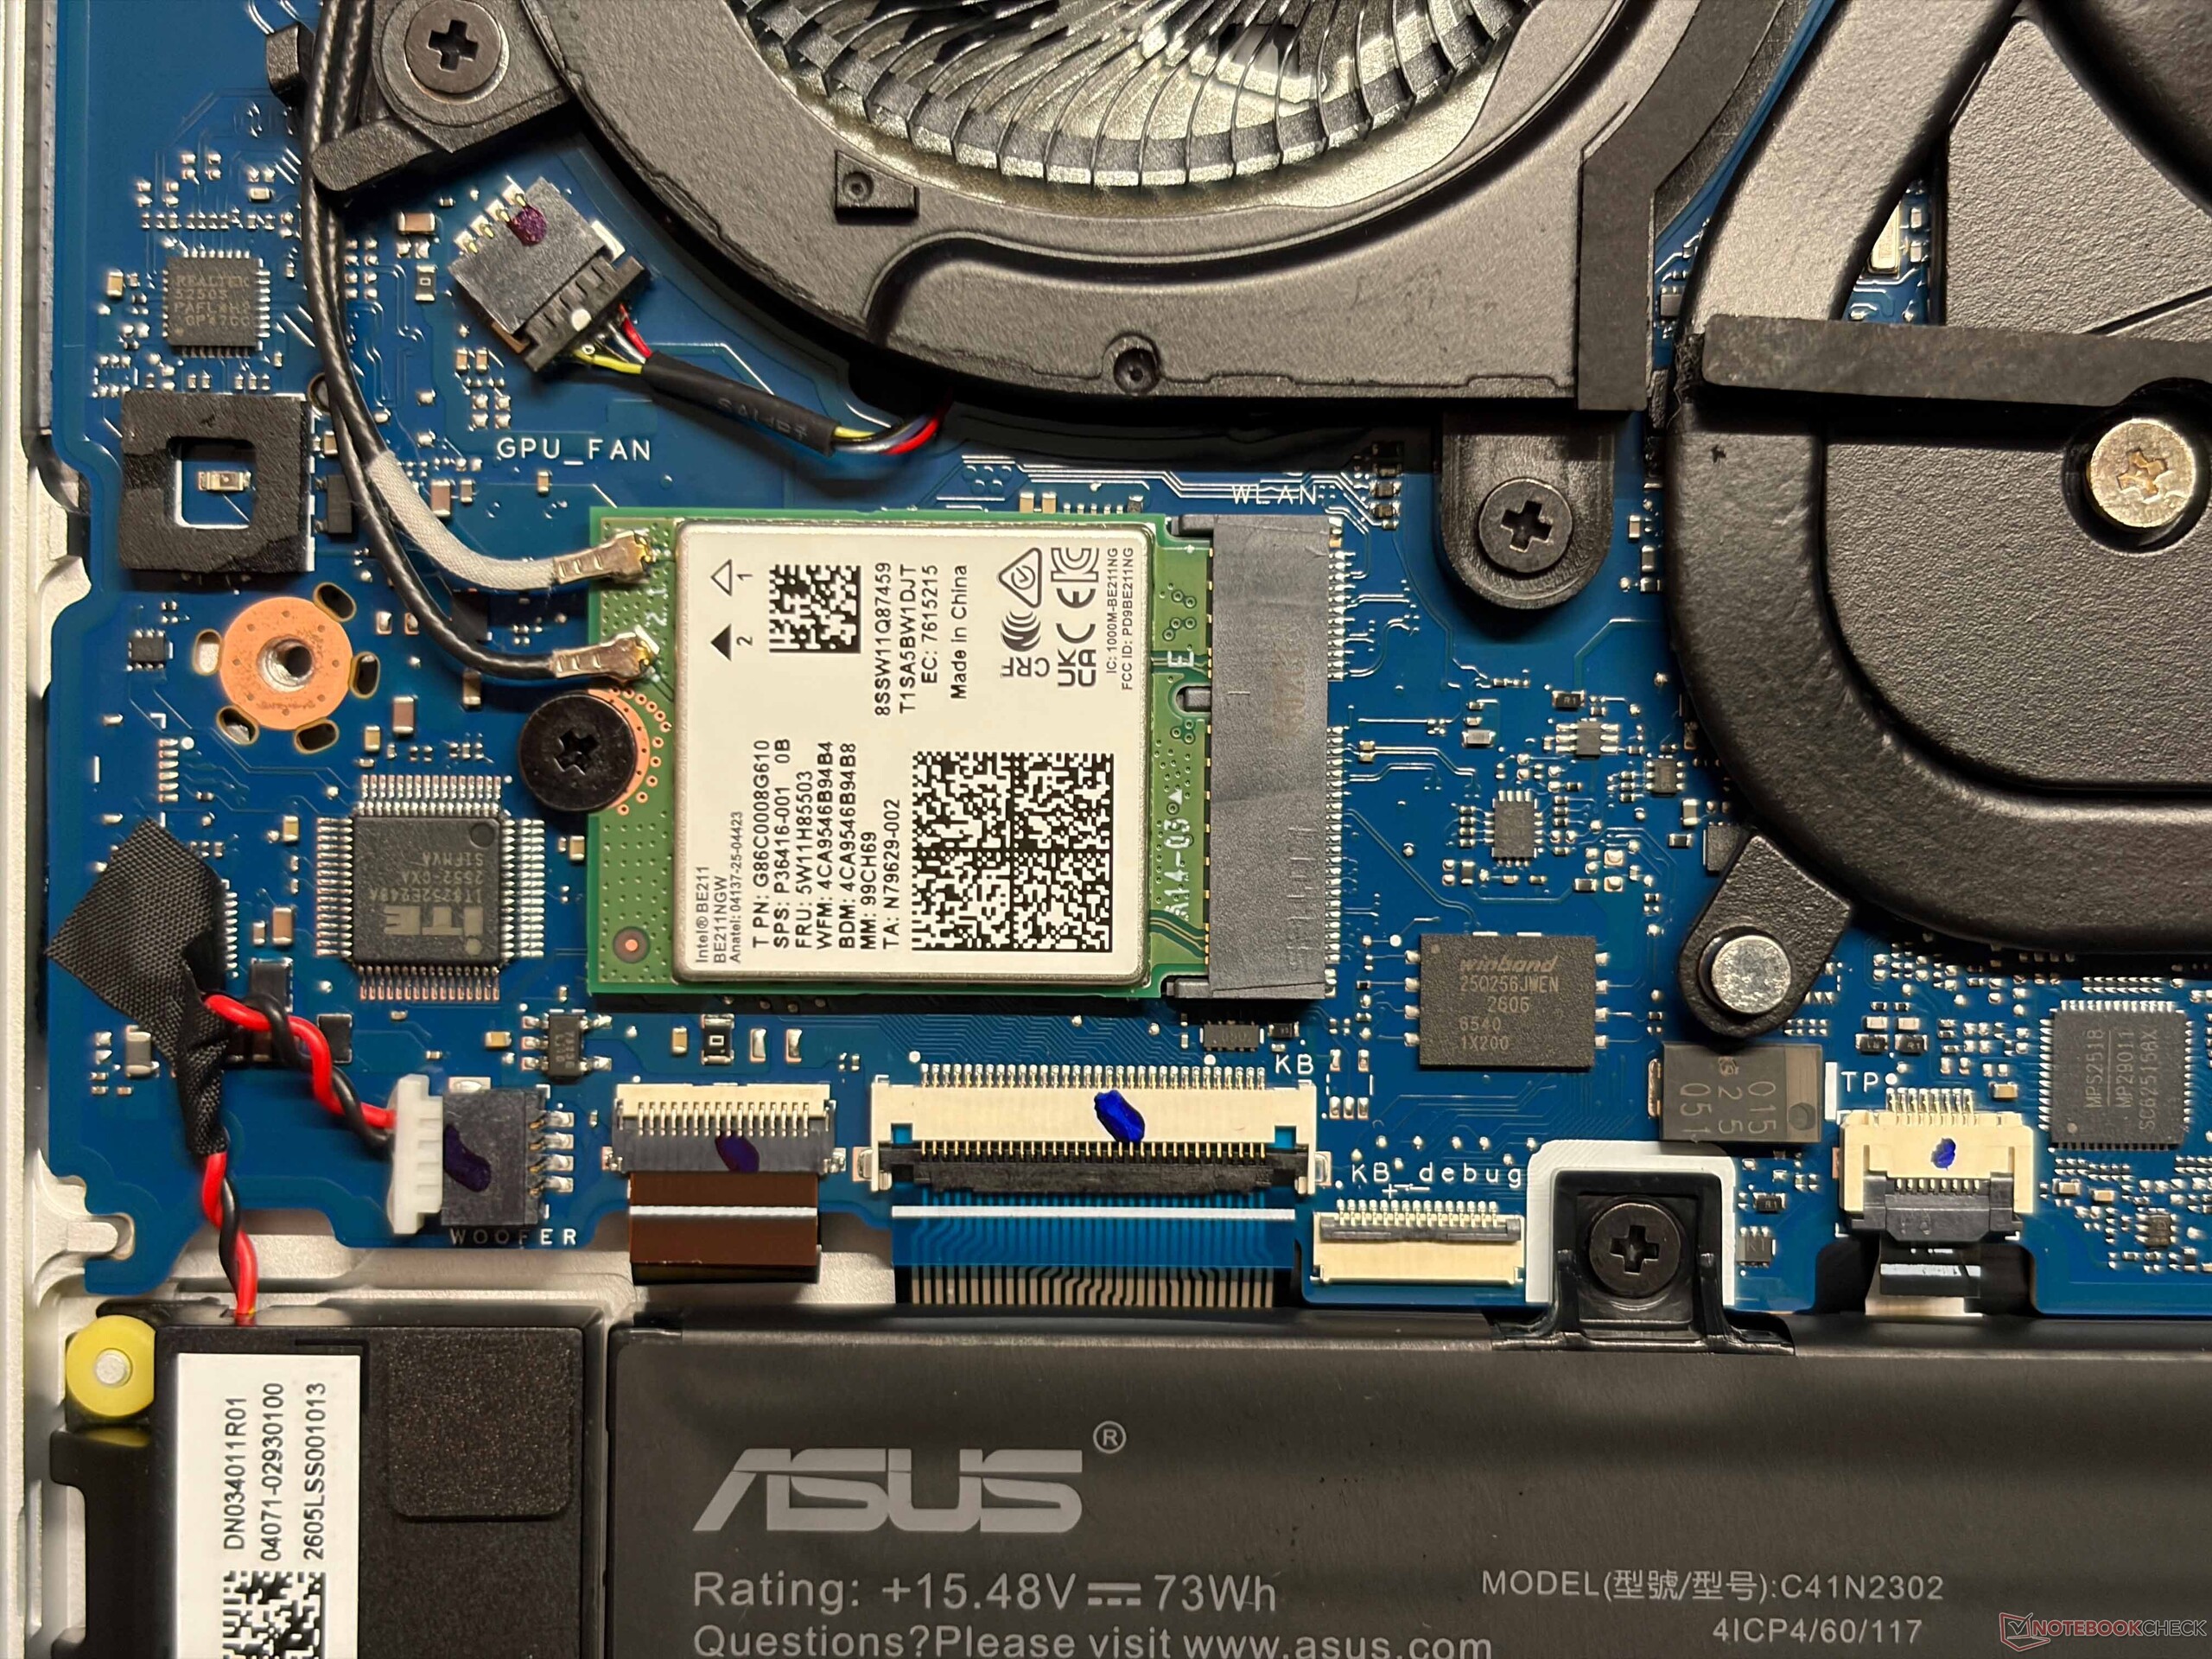
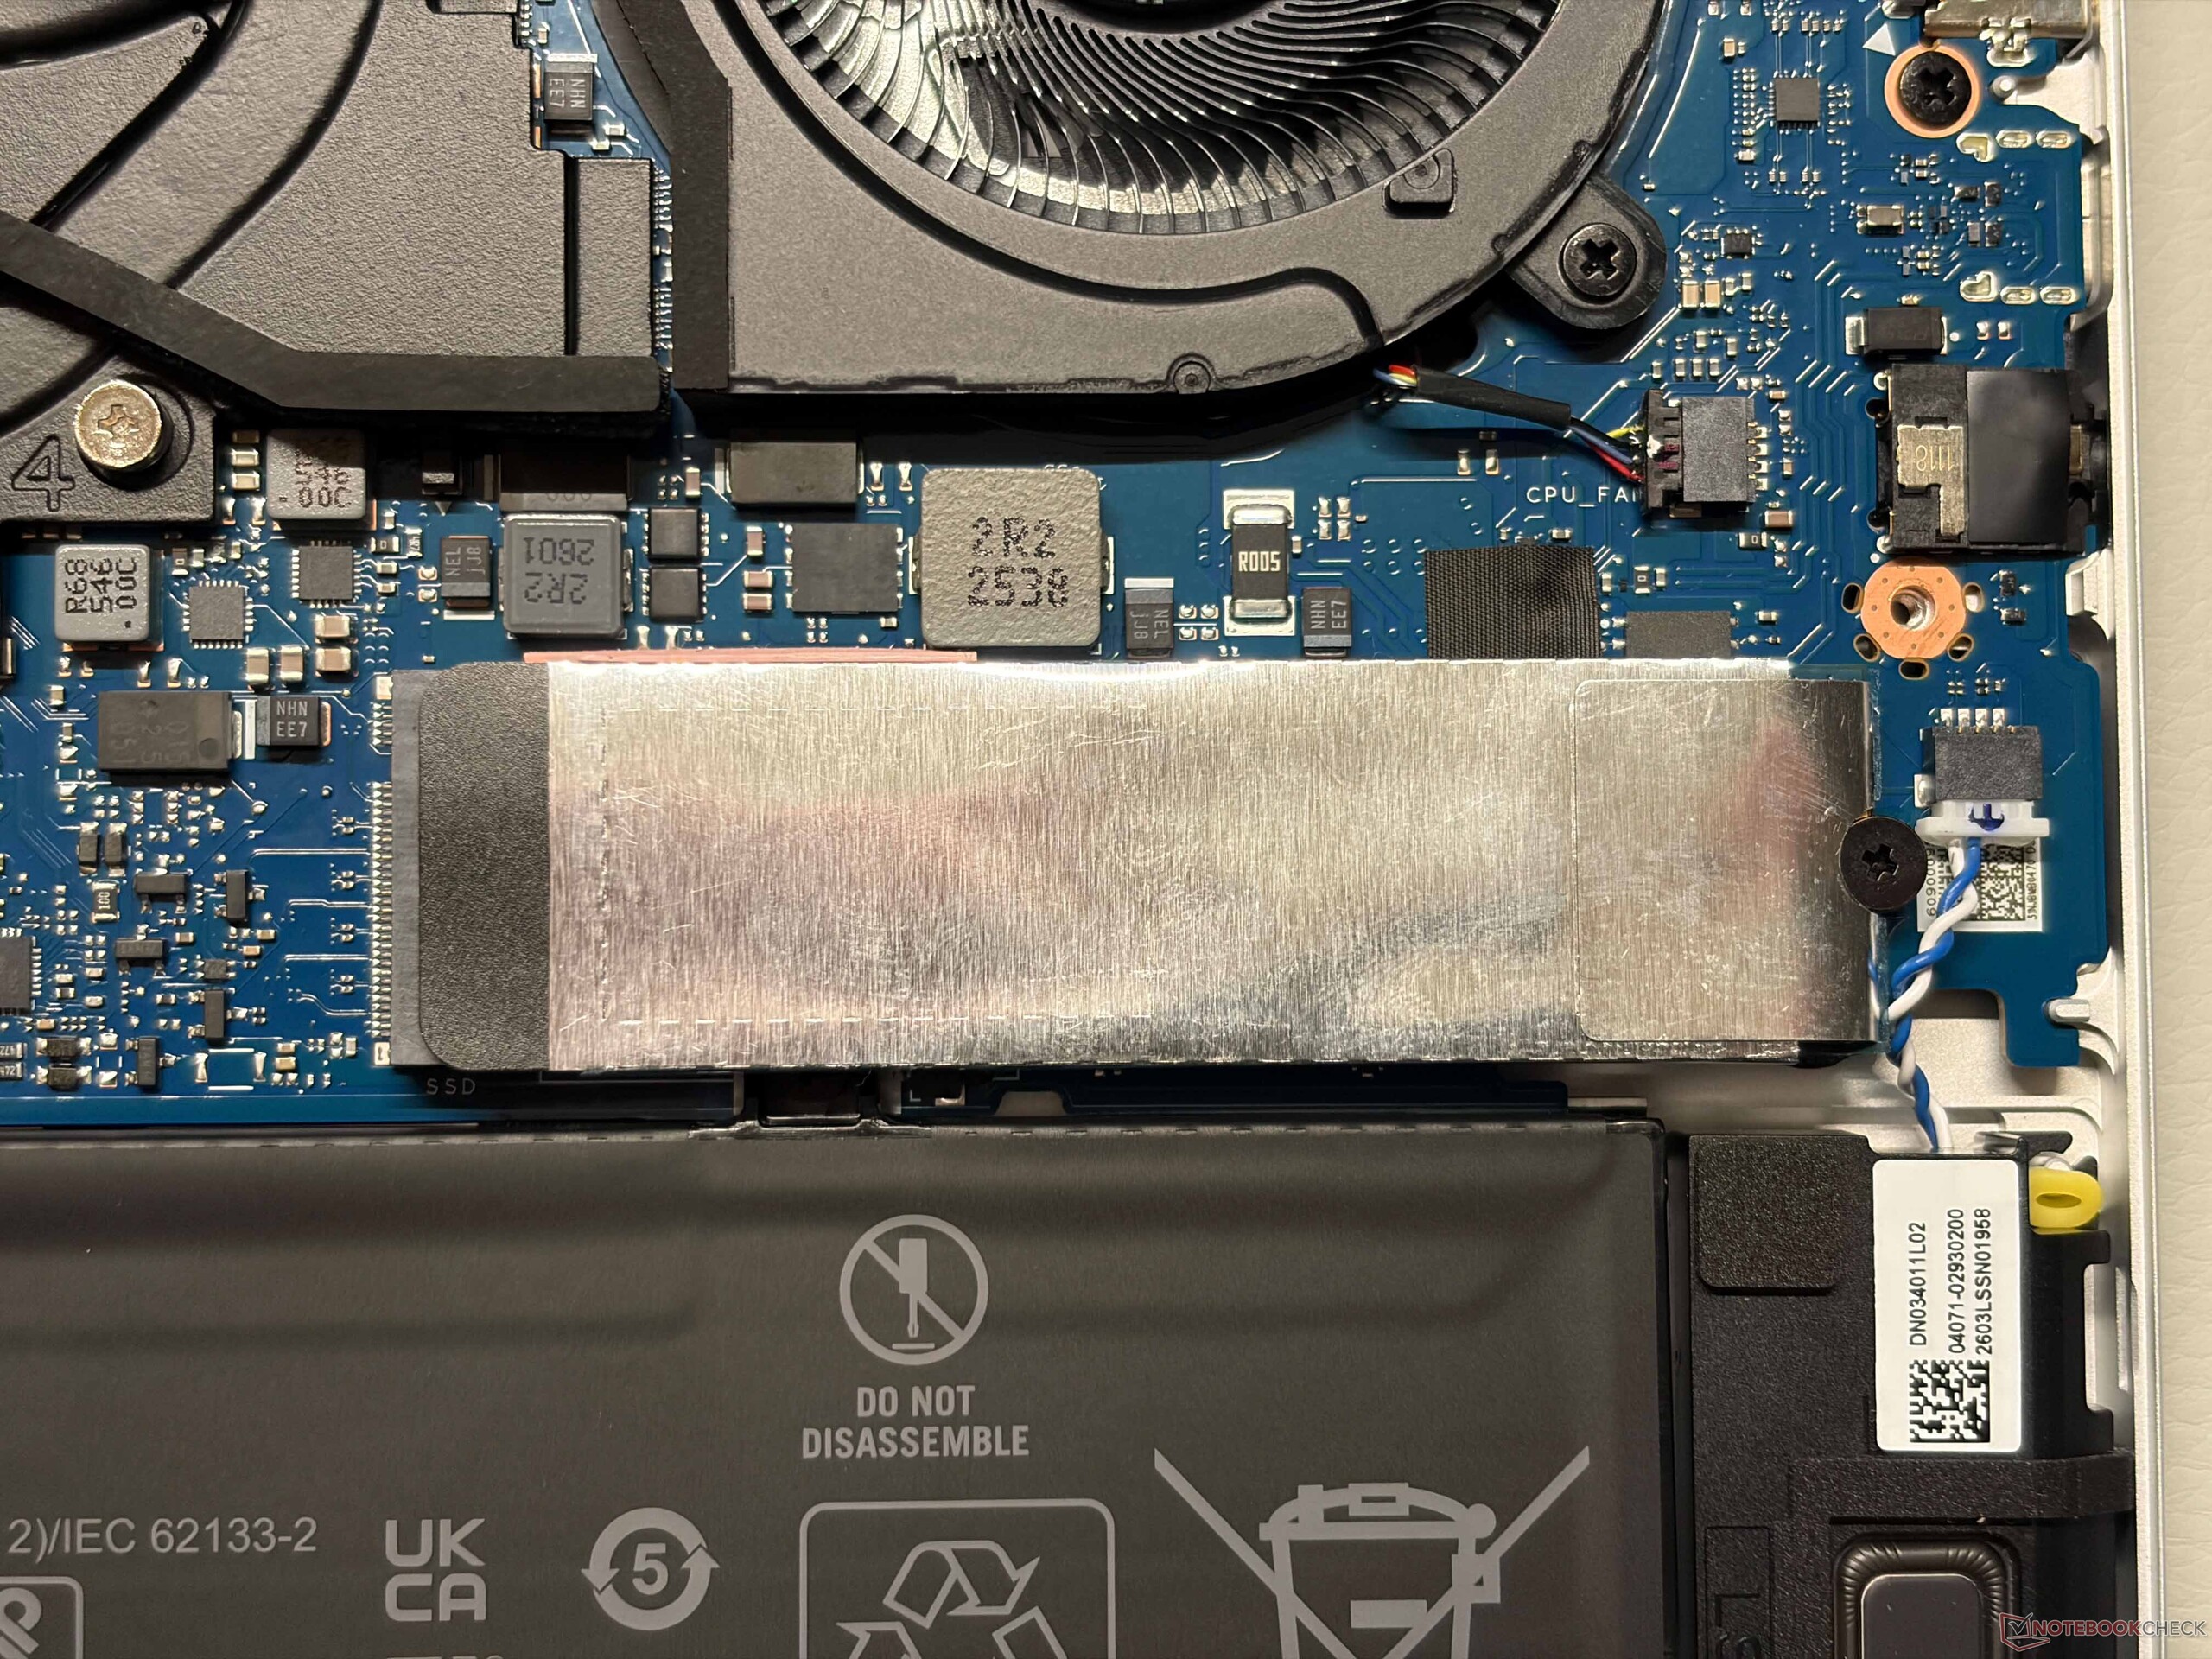
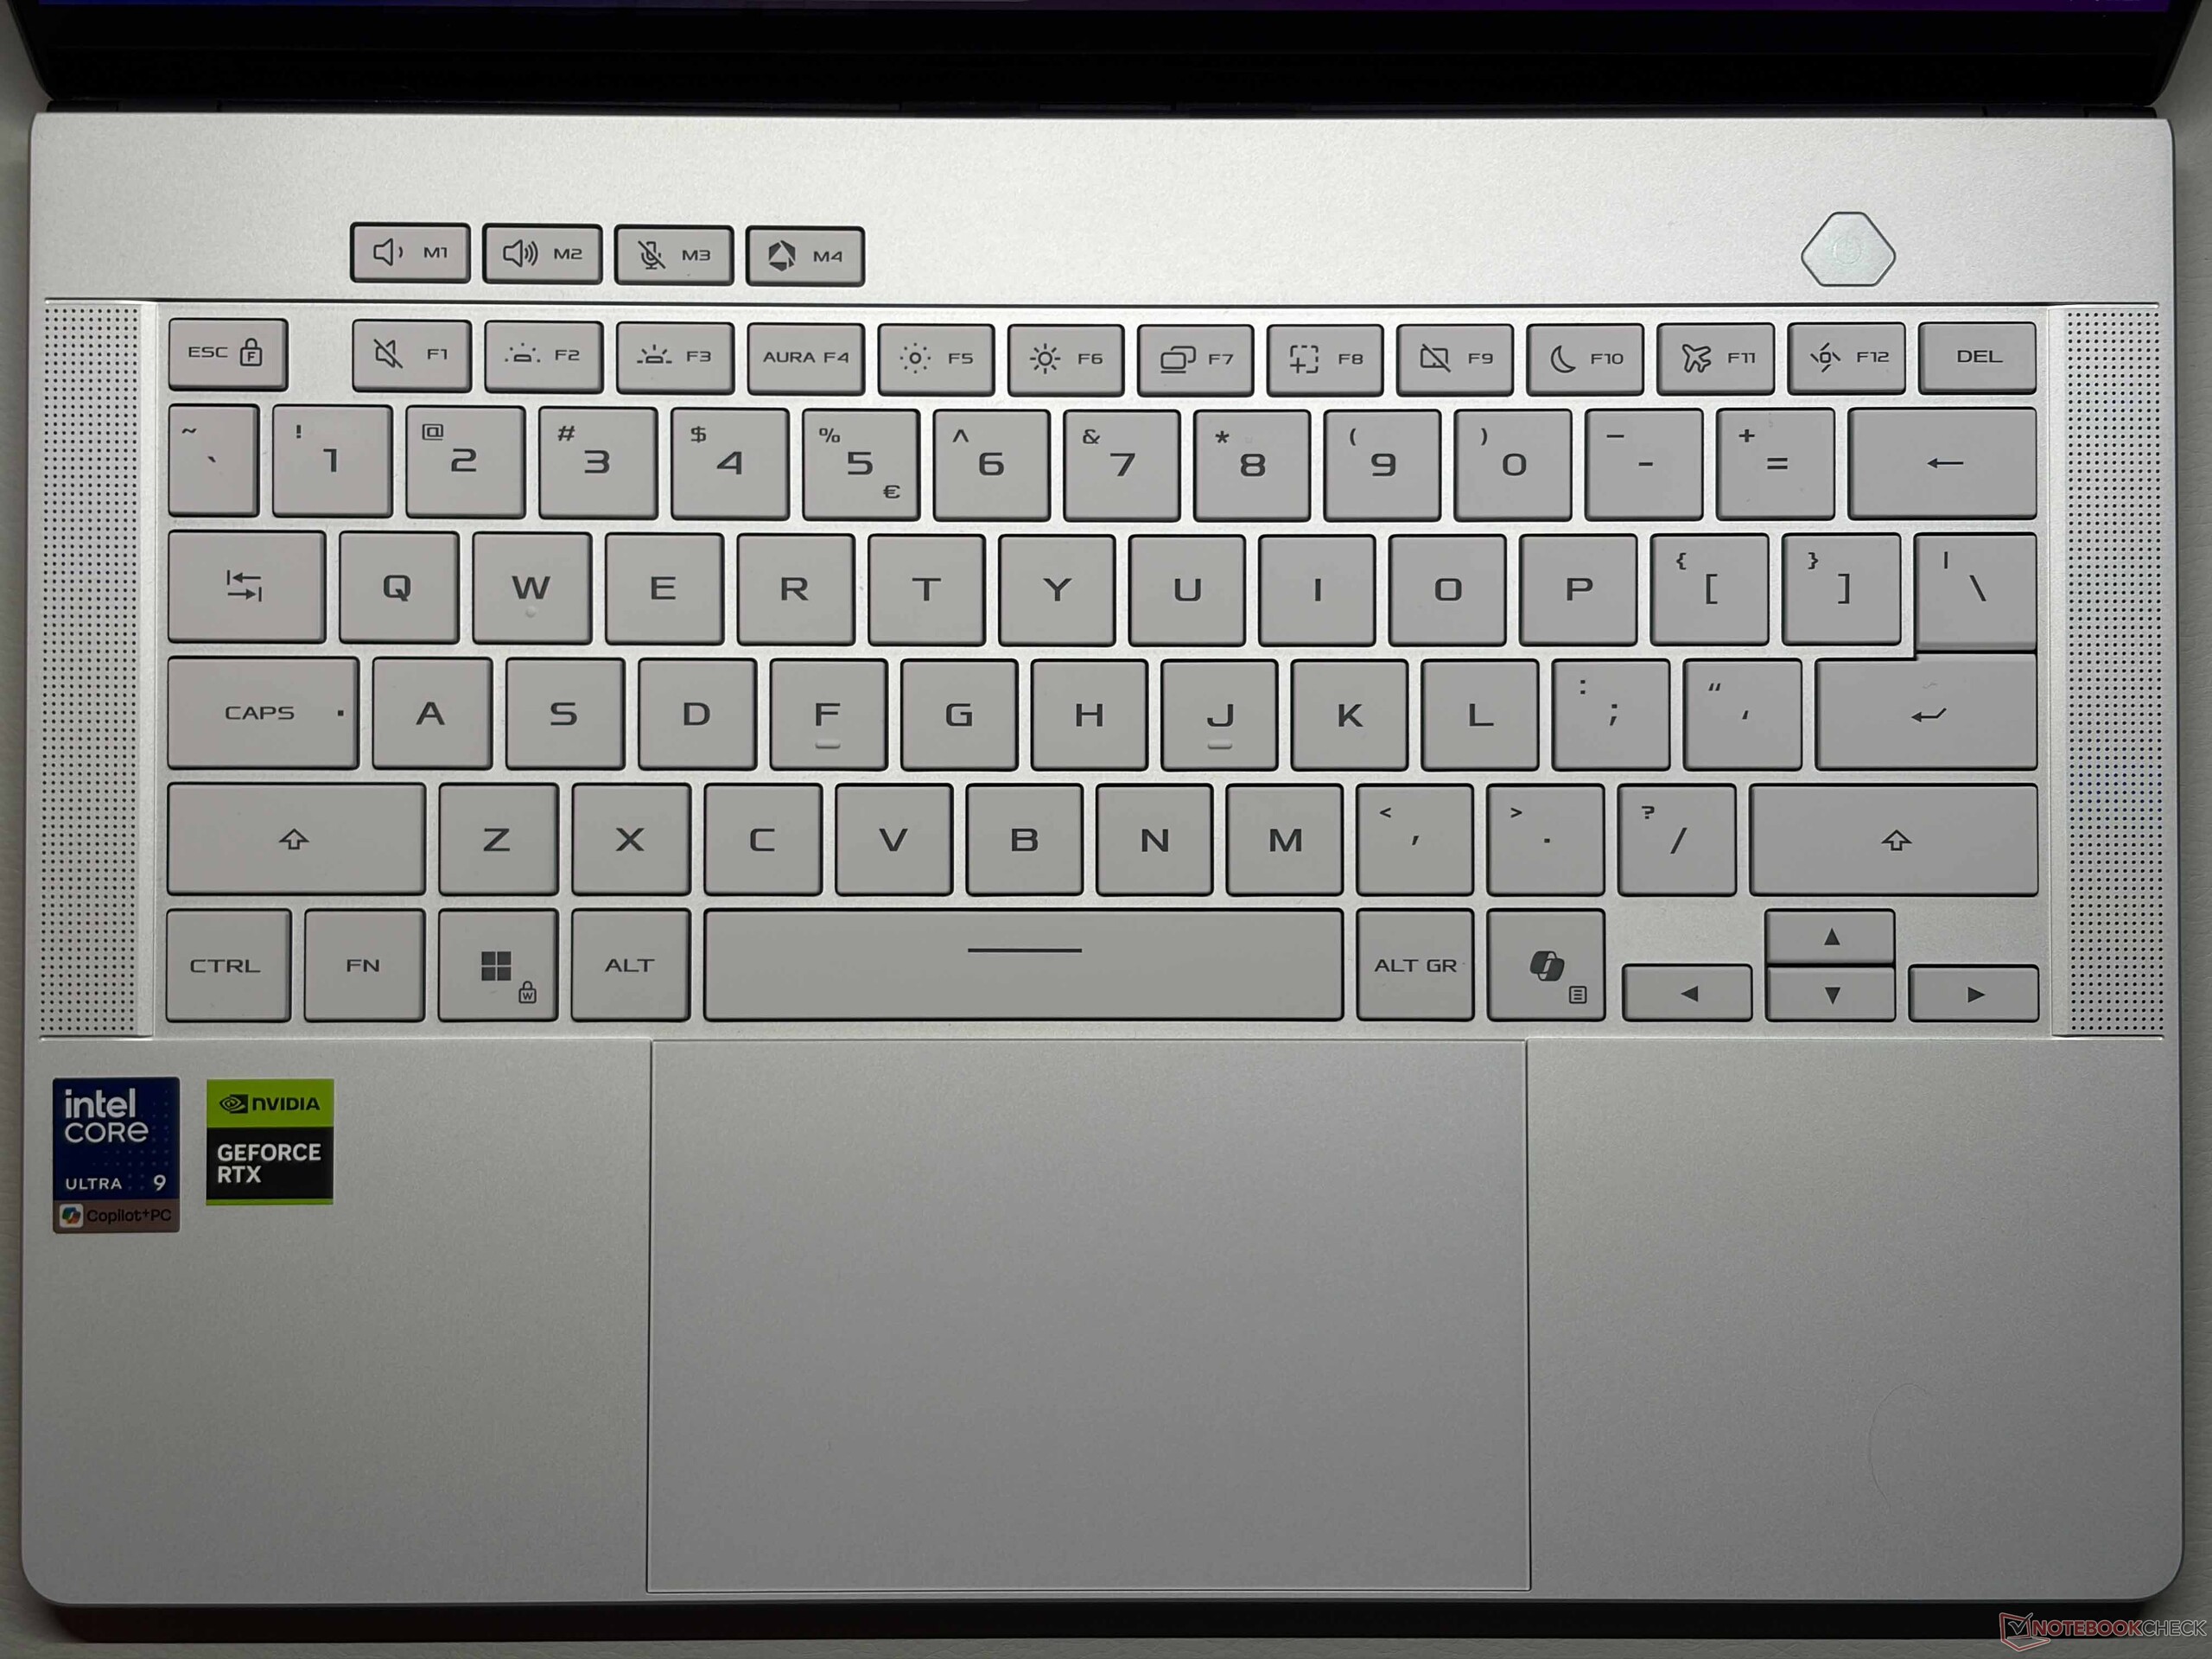
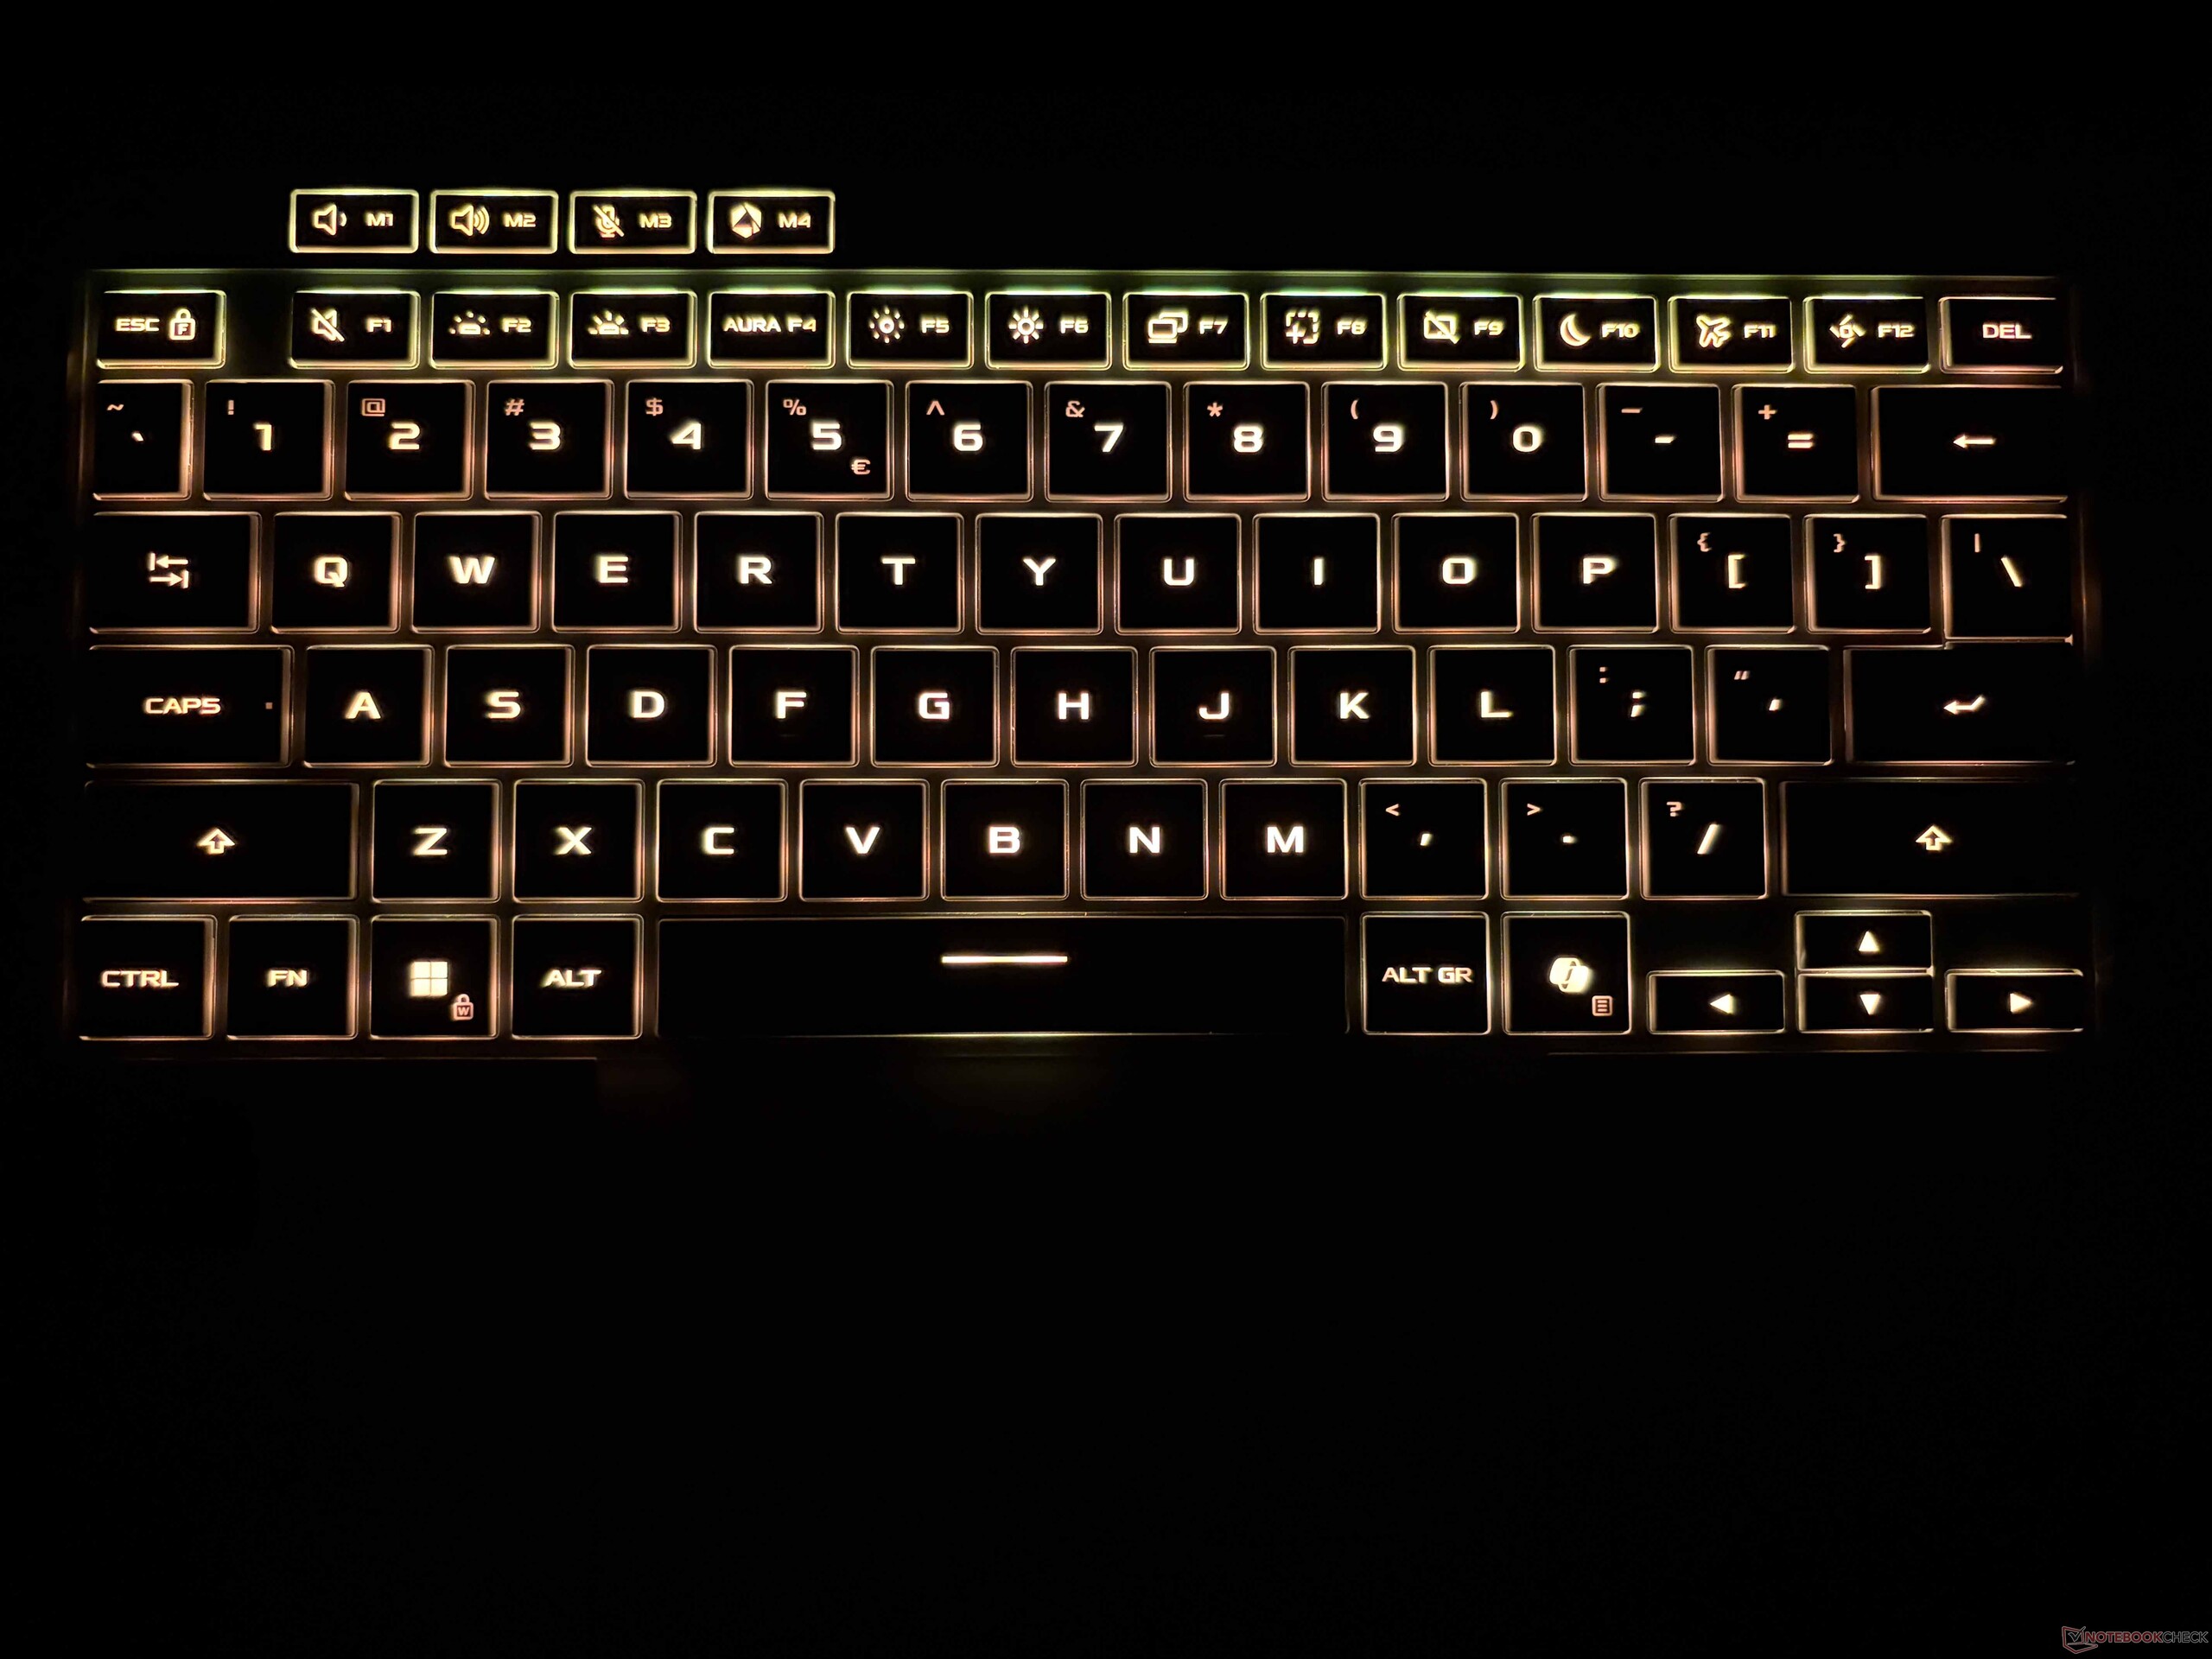
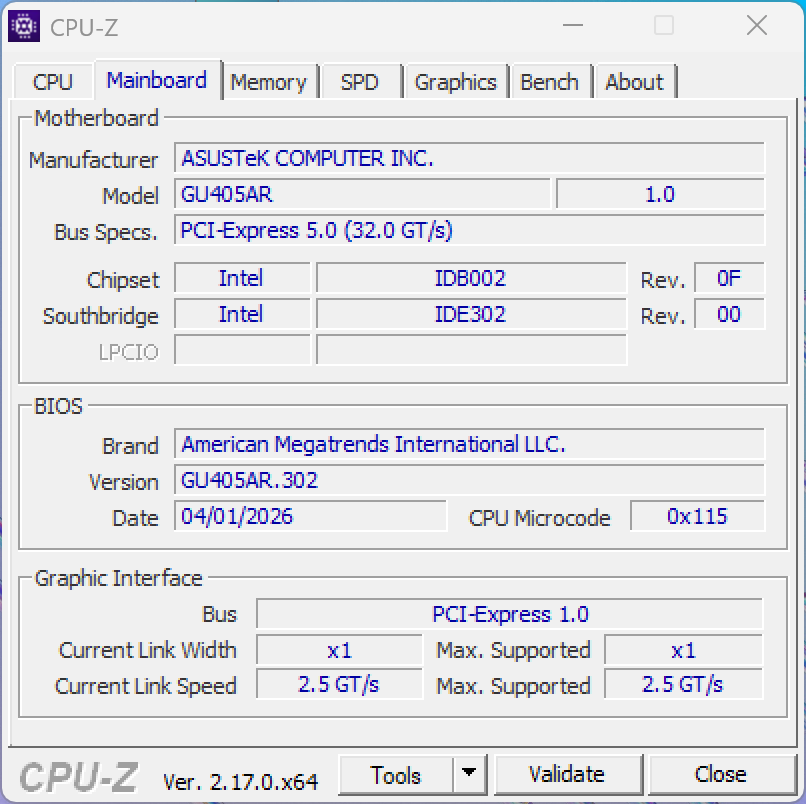
Rispetto alla generazione precedente, il case del ROG Zephyrus G14 2026 è rimasto praticamente invariato dall’esterno e il modello bianco continua a presentare un aspetto magnifico. La qualità complessiva è eccellente e si tratta senza dubbio di un portatile di fascia alta. Asus ha semplificato l’accesso ai componenti interni, poiché i due coperchi delle viti sul retro sono ora fissati magneticamente e non più incollati. La disposizione interna è leggermente cambiata a causa del passaggio a una CPU Intel, ma sia l’SSD M.2-2280 che il modulo Wi-Fi sono ancora sostituibili. La tastiera, con una corsa dei tasti di 1,7 mm, rimane una delle più comode che si possano trovare su qualsiasi portatile, mentre il clickpad convince per la qualità dei clic e per le buone capacità di scorrimento.
Il G14 ora supporta Thunderbolt 4 e un lettore di schede SD full-size. Non supporta lo standard SD-Express, ma le velocità di trasferimento rimangono comunque elevate, superando i 200 MB/s. Anche il modulo Wi-Fi 7 è molto veloce se si dispone di un router compatibile.


| Networking | |
| Asus ROG Zephyrus G14 GU405AR | |
| iperf3 transmit Wi-Fi6/7 RT-BE96U | |
| iperf3 receive Wi-Fi6/7 RT-BE96U | |
| Acer Predator Triton 14 AI PT14-52 | |
| iperf3 receive AXE11000 | |
| iperf3 transmit AXE11000 | |
| Razer Blade 14 2025 | |
| iperf3 receive AXE11000 | |
| iperf3 transmit AXE11000 | |
| Asus ROG Zephyrus G14 2025 GA403WW | |
| iperf3 receive AXE11000 | |
| iperf3 transmit AXE11000 | |
| Apple MacBook Pro 14 2026 M5 Max | |
| iperf3 receive AXE11000 | |
| iperf3 transmit AXE11000 | |


Display - OLED più luminoso
Il pannello OLED del vecchio G14 rappresentava uno dei punti deboli, poiché la luminosità era piuttosto limitata con i contenuti HDR. Il nuovo pannello offre ancora una volta una risoluzione di 2,8K a 120 Hz, ma la luminosità è aumentata in modo sostanziale. La nostra analisi, effettuata con il software professionale CalMAN, dimostra che il nuovo modello 2026 risolve questo problema: la luminosità in modalità SDR è leggermente superiore a 500 nit, mentre per i contenuti HDR abbiamo rilevato valori fino a 1140 nit; non vi sono quindi più motivi di critica. Il pannello lucido non supporta gli input tattili, ma la qualità dell’immagine è eccellente e i contenuti luminosi non appaiono sgranati. È presente uno sfarfallio PWM, ma la frequenza è piuttosto elevata (960 Hz) e l’ampiezza è bassa alla maggior parte dei livelli di luminosità. Asus offre inoltre la regolazione della luminosità OLED senza sfarfallio tramite software. Ancora una volta sono disponibili profili cromatici multipli accurati sia per lo spazio colore P3 che per lo sRGB, pertanto l’editing delle immagini non presenta alcun problema. Non siamo riusciti a migliorare ulteriormente la precisione cromatica con la nostra calibrazione.
| |||||||||||||||||||||||||
Distribuzione della luminosità: 98 %
Al centro con la batteria: 508 cd/m²
Contrasto: 25400:1 (Nero: 0.02 cd/m²)
ΔE ColorChecker Calman: 1.3 | ∀{0.5-29.43 Ø4.73}
ΔE Greyscale Calman: 2 | ∀{0.09-98 Ø4.97}
94.1% AdobeRGB 1998 (Argyll 3D)
100% sRGB (Argyll 3D)
99.8% Display P3 (Argyll 3D)
Gamma: 2.13
CCT: 6588 K
| Asus ROG Zephyrus G14 GU405AR ATNA40HQ06-0, OLED, 2880x1800, 14", 120 Hz | Acer Predator Triton 14 AI PT14-52 ATNA45AF03-0, OLED, 2880x1800, 14.5", 120 Hz | Razer Blade 14 2025 ATNA40CU05-0, OLED, 2880x1800, 14", 120 Hz | Asus ROG Zephyrus G14 2025 GA403WW ATNA40CU05-0, OLED, 2880x1800, 14", 120 Hz | Apple MacBook Pro 14 2025 M5 Mini-LED, 3024x1964, 14.2", 120 Hz | |
|---|---|---|---|---|---|
| Display | 0% | -2% | -1% | -2% | |
| Display P3 Coverage (%) | 99.8 | 99.6 0% | 99.5 0% | 99.6 0% | 99.5 0% |
| sRGB Coverage (%) | 100 | 99.9 0% | 100 0% | 100 0% | 100 0% |
| AdobeRGB 1998 Coverage (%) | 94.1 | 95.1 1% | 89.2 -5% | 89.9 -4% | 88.8 -6% |
| Response Times | 21% | 30% | 11% | -3978% | |
| Response Time Grey 50% / Grey 80% * (ms) | 2 ? | 0.48 ? 76% | 0.59 ? 70% | 0.62 ? 69% | 49.4 ? -2370% |
| Response Time Black / White * (ms) | 0.49 ? | 0.65 ? -33% | 0.63 ? -29% | 0.68 ? -39% | 47 ? -9492% |
| PWM Frequency (Hz) | 960 ? | 240 ? | 960 ? | 960 ? | 14900 |
| PWM Amplitude * (%) | 52 | 41 21% | 26 50% | 50 4% | 90 -73% |
| Screen | -41% | -20% | 30% | 22% | |
| Brightness middle (cd/m²) | 508 | 376 -26% | 361 -29% | 423 -17% | 633 25% |
| Brightness (cd/m²) | 514 | 377 -27% | 363 -29% | 424 -18% | 619 20% |
| Brightness Distribution (%) | 98 | 99 1% | 98 0% | 98 0% | 92 -6% |
| Black Level * (cd/m²) | 0.02 | 0.01 50% | |||
| Contrast (:1) | 25400 | 42300 67% | |||
| Colorchecker dE 2000 * | 1.3 | 2.7 -108% | 1.7 -31% | 0.7 46% | 1 23% |
| Colorchecker dE 2000 max. * | 3.5 | 5.3 -51% | 3.9 -11% | 1.8 49% | 2.2 37% |
| Greyscale dE 2000 * | 2 | 2.7 -35% | 2.4 -20% | 0.8 60% | 1.3 35% |
| Gamma | 2.13 103% | 2.23 99% | 2.14 103% | 2.18 101% | 2.2 100% |
| CCT | 6588 99% | 6138 106% | 6571 99% | 6505 100% | 6549 99% |
| Media totale (Programma / Settaggio) | -7% /
-15% | 3% /
-3% | 13% /
19% | -1319% /
-984% |
* ... Meglio usare valori piccoli


Tempi di risposta del Display
| ↔ Tempi di risposta dal Nero al Bianco | ||
|---|---|---|
| 0.49 ms ... aumenta ↗ e diminuisce ↘ combinato | ↗ 0.27 ms Incremento | 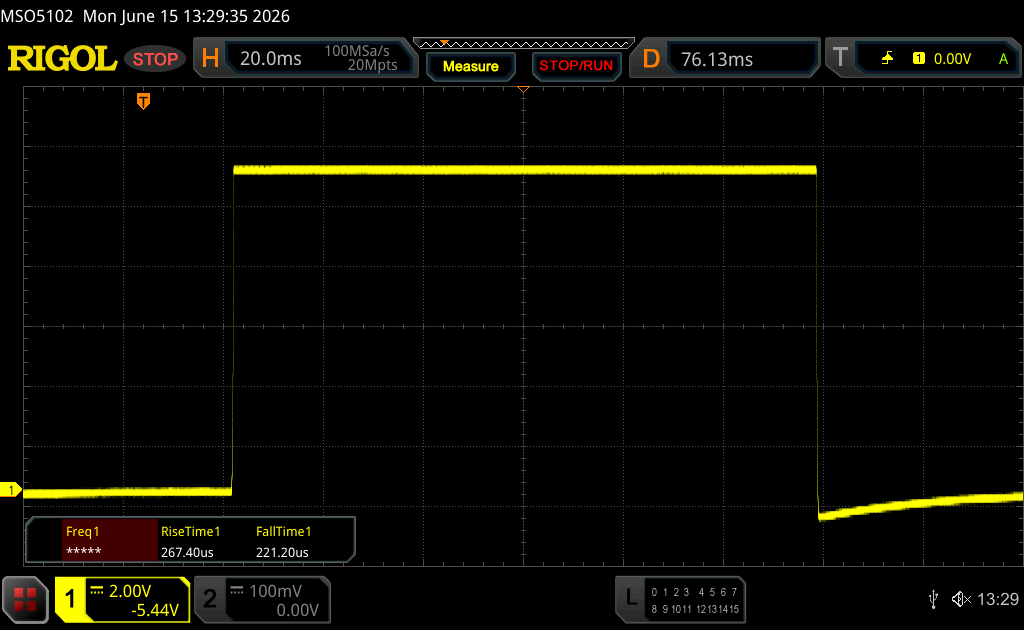 |
| ↘ 0.22 ms Calo | ||
| Lo schermo ha mostrato valori di risposta molto veloci nei nostri tests ed è molto adatto per i gaming veloce. In confronto, tutti i dispositivi di test variano da 0.1 (minimo) a 240 (massimo) ms. » 1 % di tutti i dispositivi è migliore. Questo significa che i tempi di risposta rilevati sono migliori rispettto alla media di tutti i dispositivi testati (19.9 ms). | ||
| ↔ Tempo di risposta dal 50% Grigio all'80% Grigio | ||
| 2 ms ... aumenta ↗ e diminuisce ↘ combinato | ↗ 1 ms Incremento | 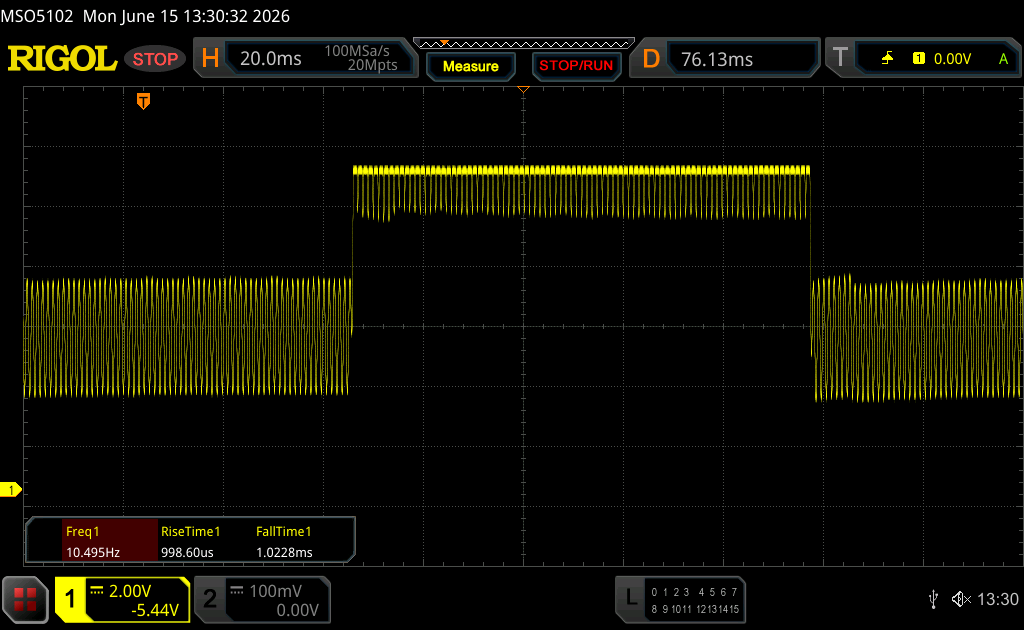 |
| ↘ 1 ms Calo | ||
| Lo schermo ha mostrato valori di risposta molto veloci nei nostri tests ed è molto adatto per i gaming veloce. In confronto, tutti i dispositivi di test variano da 0.165 (minimo) a 636 (massimo) ms. » 10 % di tutti i dispositivi è migliore. Questo significa che i tempi di risposta rilevati sono migliori rispettto alla media di tutti i dispositivi testati (31.1 ms). | ||
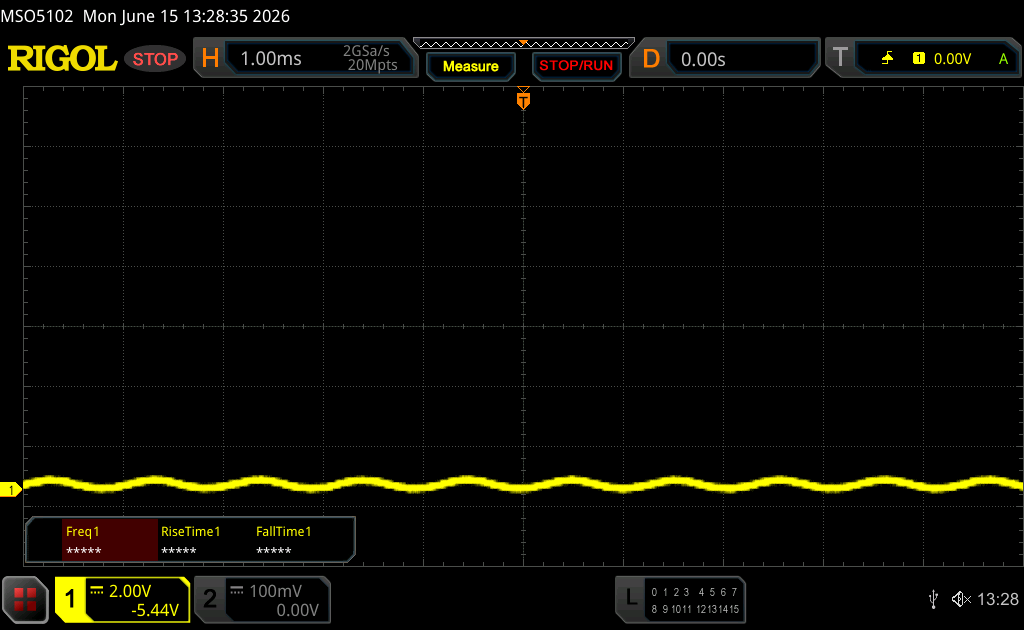
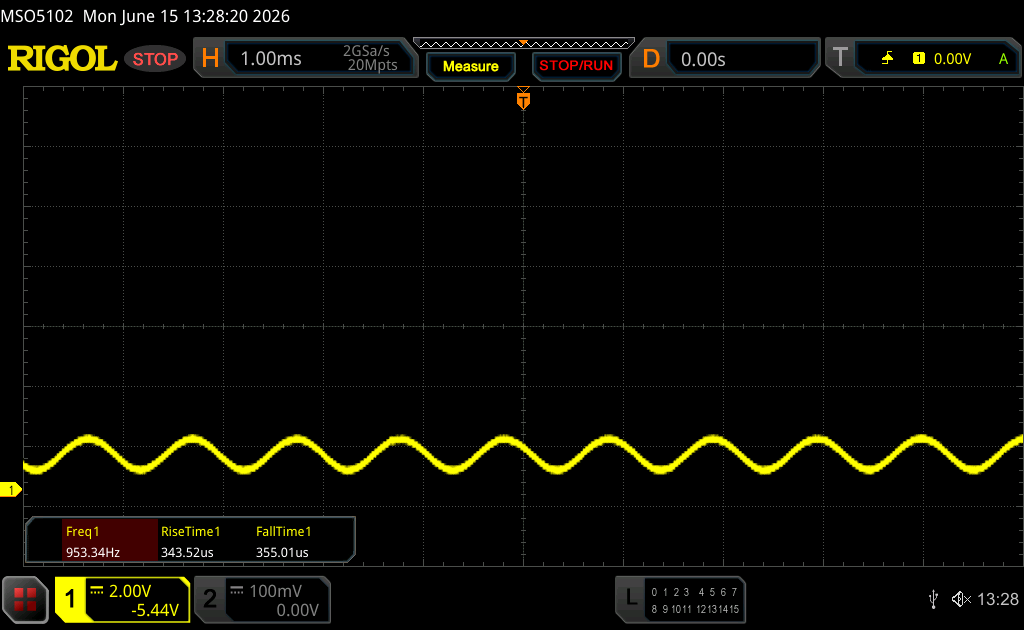
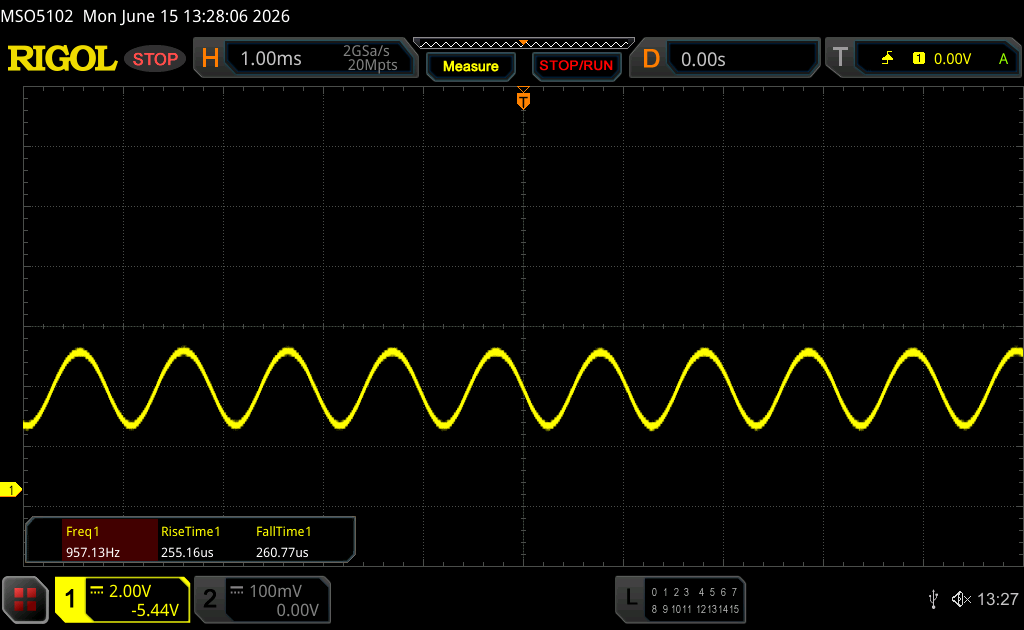
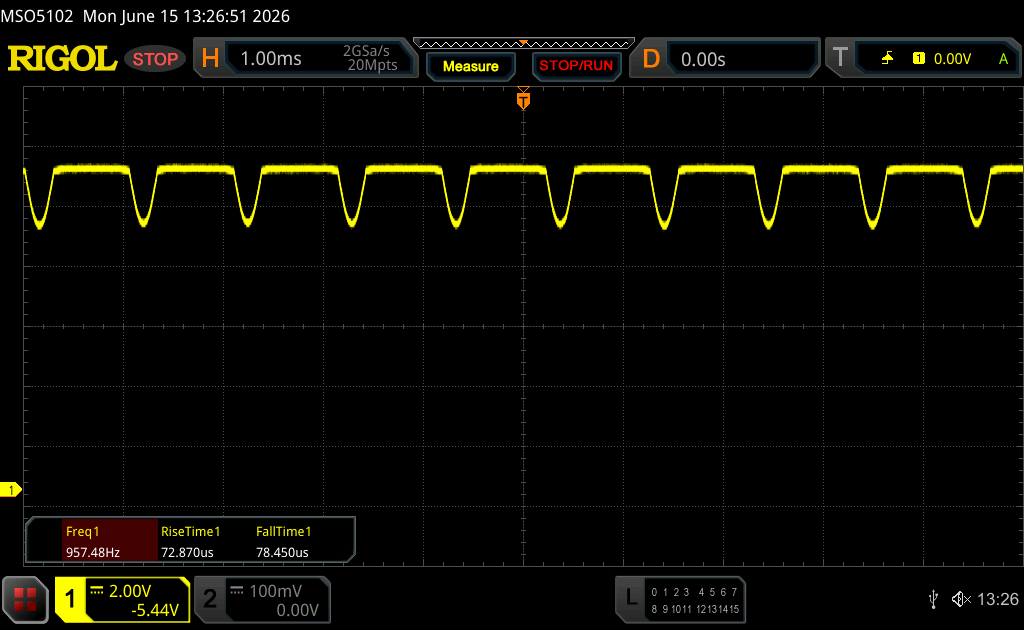
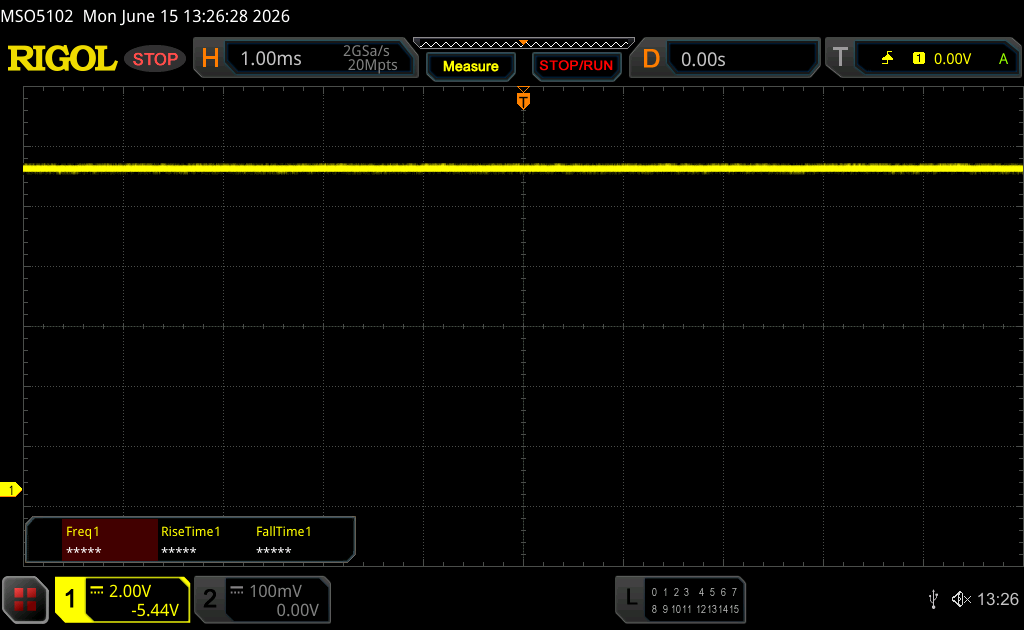
Sfarfallio dello schermo / PWM (Pulse-Width Modulation)
| flickering dello schermo / PWM rilevato | 960 Hz Amplitude: 52 % | ≤ 90 % settaggio luminosita' | 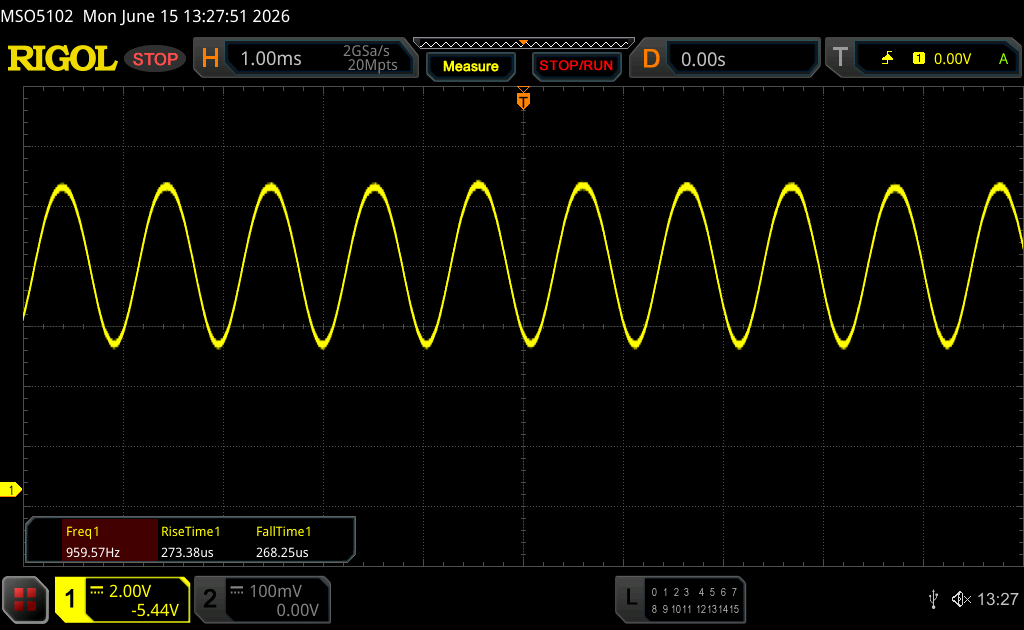 |
Il display sfarfalla a 960 Hz (Probabilmente a causa dell'uso di PWM) Flickering rilevato ad una luminosita' di 90 % o inferiore. Non dovrebbe verificarsi flickering o PWM sopra questo valore di luminosita'. La frequenza di 960 Hz è abbastanza alta, quindi la maggioranza degli utenti sensibili al PWM non dovrebbero notare alcun flickering. In confronto: 52 % di tutti i dispositivi testati non utilizza PWM per ridurre la luminosita' del display. Se è rilevato PWM, una media di 7798 (minimo: 5 - massimo: 343500) Hz è stata rilevata. | |||


Esibizione - Panther Lake & Blackwell
Condizioni di prova
Asus offre le consuete modalità di alimentazione e, per ottenere le massime prestazioni della GPU, è necessario utilizzare la modalità Turbo. Nelle situazioni di utilizzo quotidiano, è possibile ricorrere tranquillamente alla modalità Silent , poiché le prestazioni della CPU sono praticamente identiche e del tutto sufficienti, purché non sia necessaria la GPU dedicata.
| Profilo energetico | TDP della CPU | CB24 Multi | TGP della GPU | Time Spy Grafica | Cyberpunk 2077 QHD Ultra | Rumorosità massima della ventola |
|---|---|---|---|---|---|---|
| Silenzioso | 65/50 W | 1169 punti | 80/45 W | 9267 punti | 43,8 fps | 38,2 dB(A) |
| Prestazioni | 65/50 W | 1173 punti | 95 W | 14774 punti | 69,5 fps | 49,8 dB(A) |
| Turbo | 70 W | 1262 punti | 115 W | 16295 punti | 77,4 fps | 55,5 dB(A) |
| Batteria (Prestazioni) | 54 W | 1209 punti | 45 W | 8115 punti | 39,3 fps | 38,2 dB(A) |
Prestazioni del processore
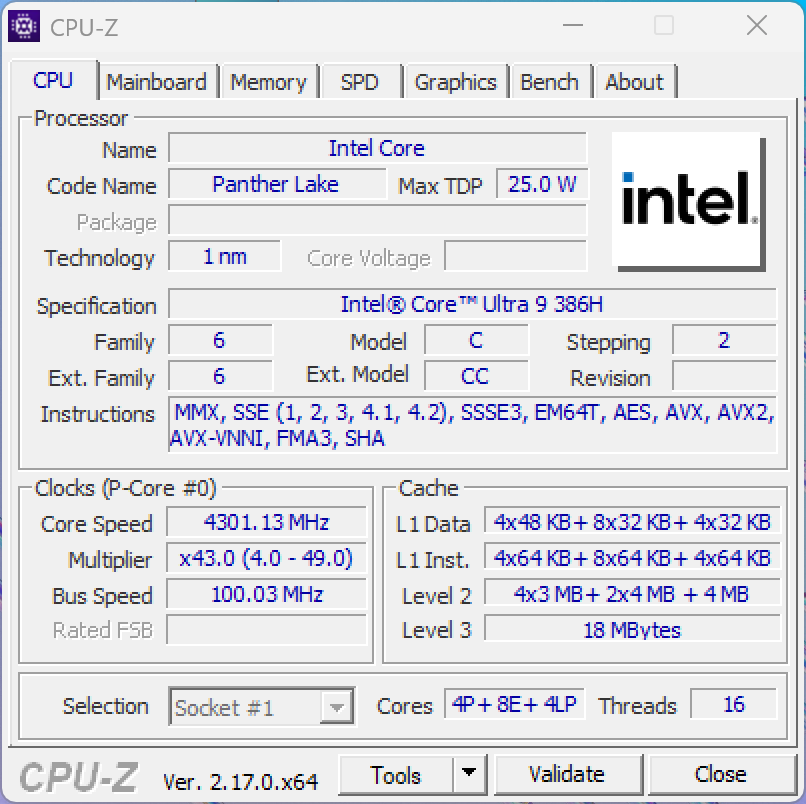
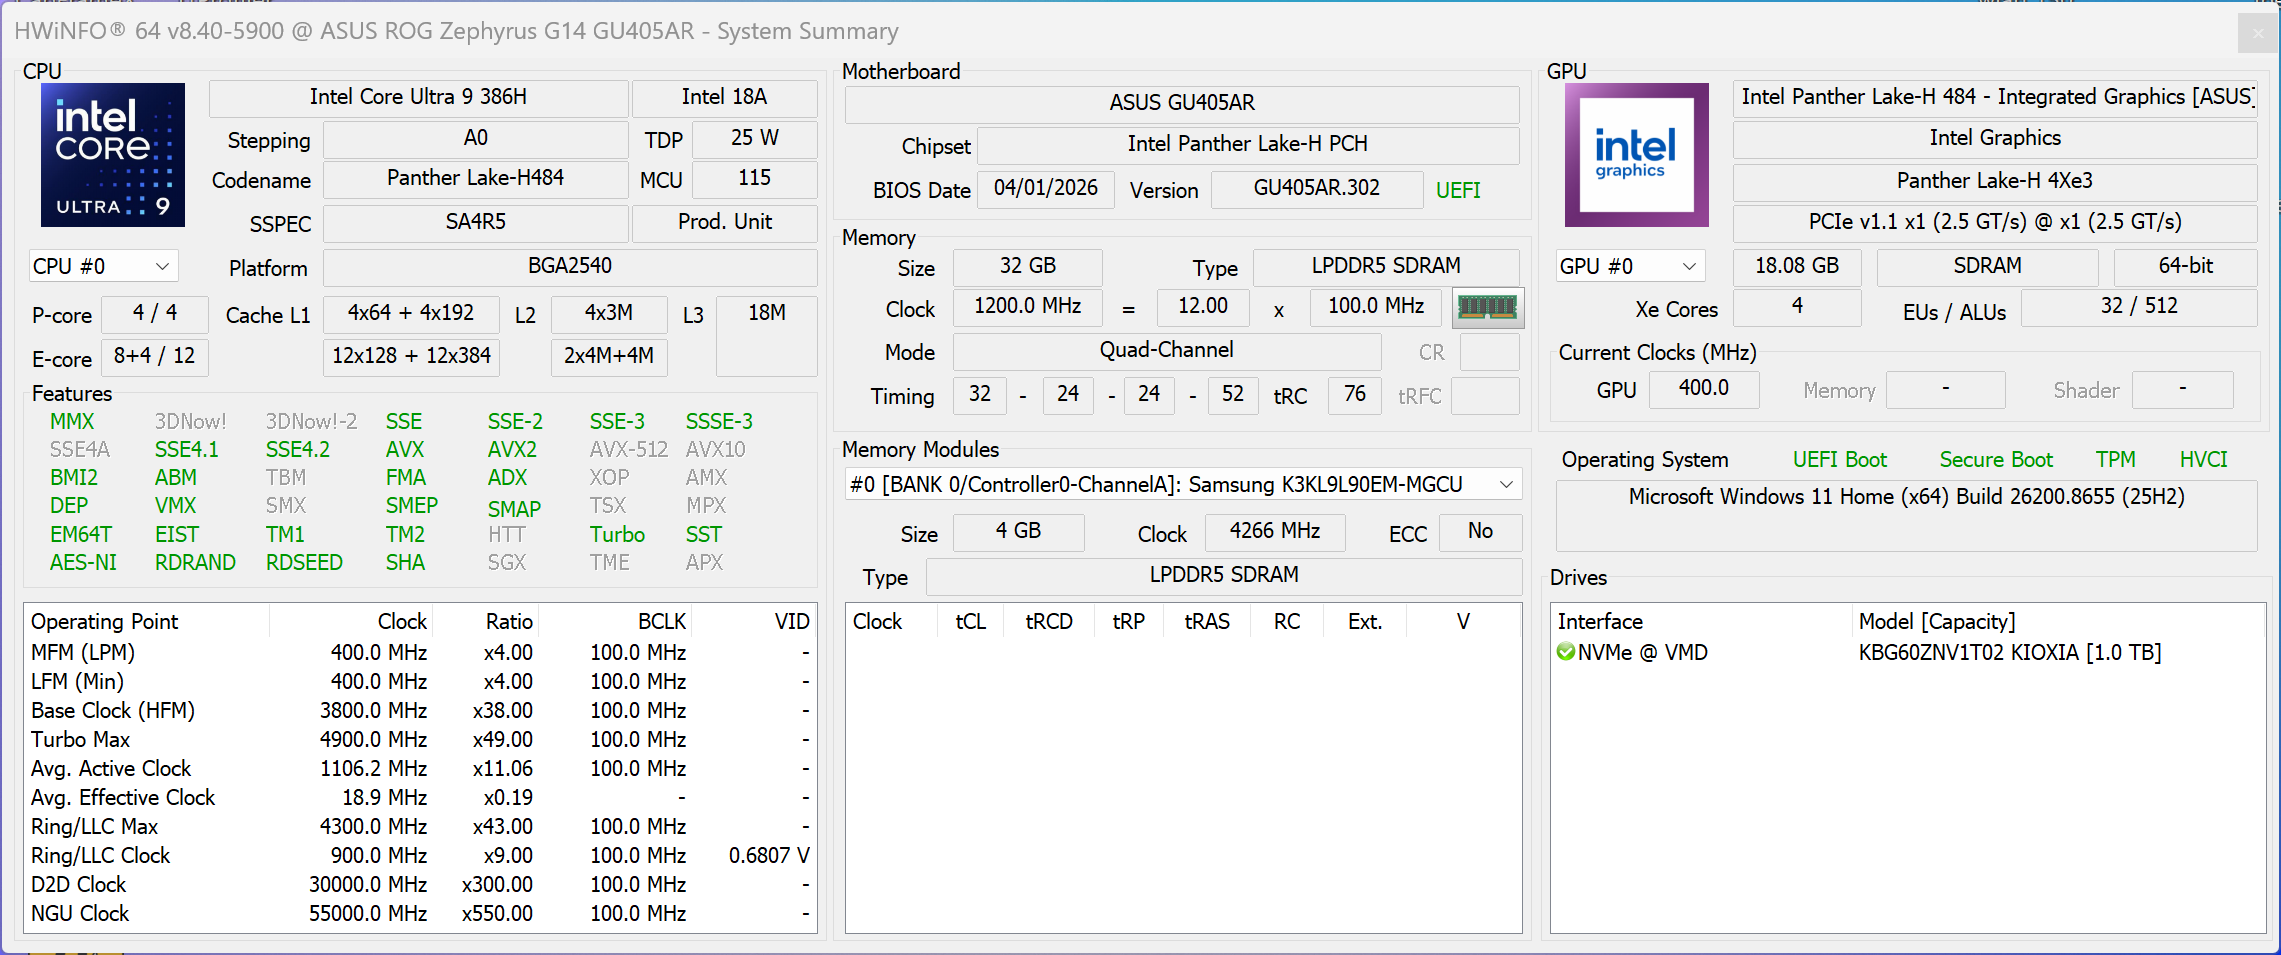
Asus ha sostituito la CPU AMD Ryzen con un nuovo modello Panther Lake di Intel. Sebbene ciò migliori le prestazioni single-core della CPU e l’efficienza (come vedremo più avanti), le prestazioni multi-core lorde risultano simili o inferiori a seconda del benchmark. La nostra tabella relativa alle modalità di alimentazione mostra inoltre che il Core Ultra 9 386H non tragga realmente vantaggio da limiti di potenza più elevati e che il guadagno in termini di prestazioni sia marginale, ad esempio, passando dalla modalità Silent alla modalità Turbo .
Cinebench R15 Multi Loop
Cinebench 2024: CPU Multi Core | CPU Single Core
Cinebench R23: Multi Core | Single Core
Cinebench R20: CPU (Multi Core) | CPU (Single Core)
Cinebench R15: CPU Multi 64Bit | CPU Single 64Bit
Blender: v2.79 BMW27 CPU
7-Zip 18.03: 7z b 4 | 7z b 4 -mmt1
Geekbench 6.7: Multi-Core | Single-Core
Geekbench 5.5: Multi-Core | Single-Core
HWBOT x265 Benchmark v2.2: 4k Preset
LibreOffice : 20 Documents To PDF
R Benchmark 2.5: Overall mean
| CPU Performance rating | |
| Apple MacBook Pro 14 2026 M5 Max -14! | |
| Media della classe Gaming | |
| Asus ROG Zephyrus G14 2025 GA403WW | |
| Asus ROG Zephyrus G14 GU405AR | |
| Media Intel Core Ultra 9 386H | |
| Razer Blade 14 2025 | |
| Acer Predator Triton 14 AI PT14-52 | |
| Cinebench 2024 / CPU Multi Core | |
| Apple MacBook Pro 14 2026 M5 Max | |
| Media della classe Gaming (486 - 2298, n=92, ultimi 2 anni) | |
| Asus ROG Zephyrus G14 GU405AR | |
| Asus ROG Zephyrus G14 2025 GA403WW | |
| Media Intel Core Ultra 9 386H (873 - 1271, n=7) | |
| Razer Blade 14 2025 | |
| Acer Predator Triton 14 AI PT14-52 | |
| Cinebench 2024 / CPU Single Core | |
| Apple MacBook Pro 14 2026 M5 Max | |
| Acer Predator Triton 14 AI PT14-52 | |
| Media Intel Core Ultra 9 386H (118.1 - 126.8, n=7) | |
| Asus ROG Zephyrus G14 GU405AR | |
| Media della classe Gaming (95 - 138.2, n=92, ultimi 2 anni) | |
| Asus ROG Zephyrus G14 2025 GA403WW | |
| Razer Blade 14 2025 | |
| Cinebench R23 / Multi Core | |
| Media della classe Gaming (10488 - 40970, n=113, ultimi 2 anni) | |
| Asus ROG Zephyrus G14 2025 GA403WW | |
| Asus ROG Zephyrus G14 GU405AR | |
| Razer Blade 14 2025 | |
| Media Intel Core Ultra 9 386H (12144 - 21186, n=7) | |
| Acer Predator Triton 14 AI PT14-52 | |
| Cinebench R23 / Single Core | |
| Media Intel Core Ultra 9 386H (2010 - 2101, n=7) | |
| Acer Predator Triton 14 AI PT14-52 | |
| Asus ROG Zephyrus G14 GU405AR | |
| Asus ROG Zephyrus G14 2025 GA403WW | |
| Media della classe Gaming (1166 - 2356, n=113, ultimi 2 anni) | |
| Razer Blade 14 2025 | |
| Cinebench R20 / CPU (Multi Core) | |
| Media della classe Gaming (4029 - 16108, n=112, ultimi 2 anni) | |
| Asus ROG Zephyrus G14 2025 GA403WW | |
| Asus ROG Zephyrus G14 GU405AR | |
| Razer Blade 14 2025 | |
| Media Intel Core Ultra 9 386H (4757 - 8405, n=7) | |
| Acer Predator Triton 14 AI PT14-52 | |
| Cinebench R20 / CPU (Single Core) | |
| Asus ROG Zephyrus G14 2025 GA403WW | |
| Media Intel Core Ultra 9 386H (762 - 796, n=7) | |
| Razer Blade 14 2025 | |
| Acer Predator Triton 14 AI PT14-52 | |
| Media della classe Gaming (442 - 895, n=112, ultimi 2 anni) | |
| Asus ROG Zephyrus G14 GU405AR | |
| Cinebench R15 / CPU Multi 64Bit | |
| Media della classe Gaming (1578 - 6271, n=113, ultimi 2 anni) | |
| Asus ROG Zephyrus G14 2025 GA403WW | |
| Asus ROG Zephyrus G14 GU405AR | |
| Media Intel Core Ultra 9 386H (2197 - 3347, n=7) | |
| Razer Blade 14 2025 | |
| Acer Predator Triton 14 AI PT14-52 | |
| Cinebench R15 / CPU Single 64Bit | |
| Acer Predator Triton 14 AI PT14-52 | |
| Asus ROG Zephyrus G14 2025 GA403WW | |
| Asus ROG Zephyrus G14 GU405AR | |
| Media della classe Gaming (188.8 - 343, n=112, ultimi 2 anni) | |
| Media Intel Core Ultra 9 386H (249 - 314, n=7) | |
| Razer Blade 14 2025 | |
| Blender / v2.79 BMW27 CPU | |
| Acer Predator Triton 14 AI PT14-52 | |
| Media Intel Core Ultra 9 386H (156 - 299, n=7) | |
| Razer Blade 14 2025 | |
| Asus ROG Zephyrus G14 GU405AR | |
| Media della classe Gaming (80 - 330, n=110, ultimi 2 anni) | |
| Asus ROG Zephyrus G14 2025 GA403WW | |
| 7-Zip 18.03 / 7z b 4 | |
| Media della classe Gaming (33491 - 148086, n=111, ultimi 2 anni) | |
| Asus ROG Zephyrus G14 2025 GA403WW | |
| Asus ROG Zephyrus G14 GU405AR | |
| Razer Blade 14 2025 | |
| Media Intel Core Ultra 9 386H (44980 - 72882, n=7) | |
| Acer Predator Triton 14 AI PT14-52 | |
| 7-Zip 18.03 / 7z b 4 -mmt1 | |
| Media della classe Gaming (4199 - 7436, n=111, ultimi 2 anni) | |
| Asus ROG Zephyrus G14 GU405AR | |
| Asus ROG Zephyrus G14 2025 GA403WW | |
| Media Intel Core Ultra 9 386H (5488 - 6493, n=7) | |
| Razer Blade 14 2025 | |
| Acer Predator Triton 14 AI PT14-52 | |
| Geekbench 6.7 / Multi-Core | |
| Apple MacBook Pro 14 2026 M5 Max | |
| Asus ROG Zephyrus G14 GU405AR | |
| Media Intel Core Ultra 9 386H (13776 - 17405, n=9) | |
| Asus ROG Zephyrus G14 2025 GA403WW | |
| Media della classe Gaming (6625 - 22104, n=112, ultimi 2 anni) | |
| Razer Blade 14 2025 | |
| Acer Predator Triton 14 AI PT14-52 | |
| Geekbench 6.7 / Single-Core | |
| Apple MacBook Pro 14 2026 M5 Max | |
| Asus ROG Zephyrus G14 2025 GA403WW | |
| Razer Blade 14 2025 | |
| Acer Predator Triton 14 AI PT14-52 | |
| Media Intel Core Ultra 9 386H (2778 - 2919, n=9) | |
| Media della classe Gaming (1490 - 3259, n=112, ultimi 2 anni) | |
| Asus ROG Zephyrus G14 GU405AR | |
| Geekbench 5.5 / Multi-Core | |
| Asus ROG Zephyrus G14 GU405AR | |
| Media della classe Gaming (6460 - 27010, n=111, ultimi 2 anni) | |
| Media Intel Core Ultra 9 386H (13098 - 17557, n=7) | |
| Asus ROG Zephyrus G14 2025 GA403WW | |
| Razer Blade 14 2025 | |
| Acer Predator Triton 14 AI PT14-52 | |
| Geekbench 5.5 / Single-Core | |
| Asus ROG Zephyrus G14 2025 GA403WW | |
| Razer Blade 14 2025 | |
| Media Intel Core Ultra 9 386H (1992 - 2162, n=7) | |
| Acer Predator Triton 14 AI PT14-52 | |
| Asus ROG Zephyrus G14 GU405AR | |
| Media della classe Gaming (986 - 2474, n=111, ultimi 2 anni) | |
| HWBOT x265 Benchmark v2.2 / 4k Preset | |
| Asus ROG Zephyrus G14 2025 GA403WW | |
| Media della classe Gaming (11.5 - 44.3, n=111, ultimi 2 anni) | |
| Asus ROG Zephyrus G14 GU405AR | |
| Razer Blade 14 2025 | |
| Media Intel Core Ultra 9 386H (13.2 - 25.1, n=7) | |
| Acer Predator Triton 14 AI PT14-52 | |
| LibreOffice / 20 Documents To PDF | |
| Razer Blade 14 2025 | |
| Asus ROG Zephyrus G14 2025 GA403WW | |
| Media della classe Gaming (19 - 88.8, n=111, ultimi 2 anni) | |
| Media Intel Core Ultra 9 386H (38.5 - 56.1, n=7) | |
| Asus ROG Zephyrus G14 GU405AR | |
| Acer Predator Triton 14 AI PT14-52 | |
| R Benchmark 2.5 / Overall mean | |
| Asus ROG Zephyrus G14 GU405AR | |
| Media della classe Gaming (0.3439 - 0.759, n=112, ultimi 2 anni) | |
| Media Intel Core Ultra 9 386H (0.4055 - 0.4384, n=7) | |
| Acer Predator Triton 14 AI PT14-52 | |
| Razer Blade 14 2025 | |
| Asus ROG Zephyrus G14 2025 GA403WW | |
* ... Meglio usare valori piccoli
AIDA64: FP32 Ray-Trace | FPU Julia | CPU SHA3 | CPU Queen | FPU SinJulia | FPU Mandel | CPU AES | CPU ZLib | FP64 Ray-Trace | CPU PhotoWorxx | CPU CheckMate
| Performance rating | |
| Asus ROG Zephyrus G14 2025 GA403WW -1! | |
| Media della classe Gaming | |
| Razer Blade 14 2025 -1! | |
| Asus ROG Zephyrus G14 GU405AR -1! | |
| Media Intel Core Ultra 9 386H -1! | |
| Acer Predator Triton 14 AI PT14-52 -1! | |
| AIDA64 / FP32 Ray-Trace | |
| Asus ROG Zephyrus G14 2025 GA403WW (v6.92.6600) | |
| Media della classe Gaming (10227 - 85542, n=110, ultimi 2 anni) | |
| Razer Blade 14 2025 (v6.92.6600) | |
| Asus ROG Zephyrus G14 GU405AR (v8.20.8100) | |
| Media Intel Core Ultra 9 386H (10001 - 21727, n=7) | |
| Acer Predator Triton 14 AI PT14-52 (v6.92.6600) | |
| AIDA64 / FPU Julia | |
| Asus ROG Zephyrus G14 2025 GA403WW (v6.92.6600) | |
| Media della classe Gaming (51376 - 238426, n=110, ultimi 2 anni) | |
| Razer Blade 14 2025 (v6.92.6600) | |
| Asus ROG Zephyrus G14 GU405AR (v8.20.8100) | |
| Media Intel Core Ultra 9 386H (53370 - 113595, n=7) | |
| Acer Predator Triton 14 AI PT14-52 (v6.92.6600) | |
| AIDA64 / CPU SHA3 | |
| Media della classe Gaming (2180 - 9817, n=110, ultimi 2 anni) | |
| Asus ROG Zephyrus G14 2025 GA403WW (v6.92.6600) | |
| Asus ROG Zephyrus G14 GU405AR (v8.20.8100) | |
| Razer Blade 14 2025 (v6.92.6600) | |
| Media Intel Core Ultra 9 386H (2776 - 5604, n=7) | |
| Acer Predator Triton 14 AI PT14-52 (v6.92.6600) | |
| AIDA64 / CPU Queen | |
| Media della classe Gaming (49785 - 173351, n=101, ultimi 2 anni) | |
| Asus ROG Zephyrus G14 2025 GA403WW (v6.92.6600) | |
| Razer Blade 14 2025 (v6.92.6600) | |
| Acer Predator Triton 14 AI PT14-52 (v6.92.6600) | |
| AIDA64 / FPU SinJulia | |
| Asus ROG Zephyrus G14 2025 GA403WW (v6.92.6600) | |
| Razer Blade 14 2025 (v6.92.6600) | |
| Media della classe Gaming (4424 - 33636, n=110, ultimi 2 anni) | |
| Asus ROG Zephyrus G14 GU405AR (v8.20.8100) | |
| Media Intel Core Ultra 9 386H (5314 - 7332, n=7) | |
| Acer Predator Triton 14 AI PT14-52 (v6.92.6600) | |
| AIDA64 / FPU Mandel | |
| Asus ROG Zephyrus G14 2025 GA403WW (v6.92.6600) | |
| Media della classe Gaming (25115 - 128721, n=110, ultimi 2 anni) | |
| Razer Blade 14 2025 (v6.92.6600) | |
| Asus ROG Zephyrus G14 GU405AR (v8.20.8100) | |
| Media Intel Core Ultra 9 386H (28414 - 61578, n=7) | |
| Acer Predator Triton 14 AI PT14-52 (v6.92.6600) | |
| AIDA64 / CPU AES | |
| Asus ROG Zephyrus G14 2025 GA403WW (v6.92.6600) | |
| Media della classe Gaming (39258 - 247074, n=110, ultimi 2 anni) | |
| Razer Blade 14 2025 (v6.92.6600) | |
| Asus ROG Zephyrus G14 GU405AR (v8.20.8100) | |
| Media Intel Core Ultra 9 386H (46362 - 72112, n=7) | |
| Acer Predator Triton 14 AI PT14-52 (v6.92.6600) | |
| AIDA64 / CPU ZLib | |
| Media della classe Gaming (574 - 2531, n=110, ultimi 2 anni) | |
| Asus ROG Zephyrus G14 2025 GA403WW (v6.92.6600) | |
| Razer Blade 14 2025 (v6.92.6600) | |
| Asus ROG Zephyrus G14 GU405AR (v8.20.8100) | |
| Media Intel Core Ultra 9 386H (669 - 1271, n=7) | |
| Acer Predator Triton 14 AI PT14-52 (v6.92.6600) | |
| AIDA64 / FP64 Ray-Trace | |
| Asus ROG Zephyrus G14 2025 GA403WW (v6.92.6600) | |
| Razer Blade 14 2025 (v6.92.6600) | |
| Media della classe Gaming (5509 - 45446, n=110, ultimi 2 anni) | |
| Asus ROG Zephyrus G14 GU405AR (v8.20.8100) | |
| Media Intel Core Ultra 9 386H (5138 - 11627, n=7) | |
| Acer Predator Triton 14 AI PT14-52 (v6.92.6600) | |
| AIDA64 / CPU PhotoWorxx | |
| Asus ROG Zephyrus G14 GU405AR (v8.20.8100) | |
| Media Intel Core Ultra 9 386H (54042 - 89891, n=7) | |
| Acer Predator Triton 14 AI PT14-52 (v6.92.6600) | |
| Razer Blade 14 2025 (v6.92.6600) | |
| Asus ROG Zephyrus G14 2025 GA403WW (v6.92.6600) | |
| Media della classe Gaming (12271 - 89891, n=110, ultimi 2 anni) | |
| AIDA64 / CPU CheckMate | |
| Media della classe Gaming (2930 - 8322, n=9, ultimi 2 anni) | |
| Asus ROG Zephyrus G14 GU405AR (v8.20.8100) | |
| Media Intel Core Ultra 9 386H (4051 - 4858, n=6) | |
Sistema e dispositivi di archiviazione
Le prestazioni del sistema sono eccellenti e non abbiamo riscontrato alcun problema di stabilità. Anche il nostro test standardizzato sulla latenza non ha evidenziato alcun problema con le applicazioni audio in tempo reale. Asus utilizza un SSD PCIe 4.0 di Kioxia con una capacità di archiviazione di 1 TB (830 GB liberi) e le velocità di trasferimento sono molto buone e stabili anche in presenza di carichi di lavoro prolungati.
PCMark 10: Score | Essentials | Productivity | Digital Content Creation
CrossMark: Overall | Productivity | Creativity | Responsiveness
WebXPRT 3: Overall
WebXPRT 4: Overall
Mozilla Kraken 1.1: Total
| Performance rating | |
| Apple MacBook Pro 14 2026 M5 Max -4! | |
| Asus ROG Zephyrus G14 GU405AR | |
| Media Intel Core Ultra 9 386H, NVIDIA GeForce RTX 5070 Ti Laptop | |
| Media della classe Gaming | |
| Asus ROG Zephyrus G14 2025 GA403WW | |
| Razer Blade 14 2025 | |
| Acer Predator Triton 14 AI PT14-52 | |
| PCMark 10 / Score | |
| Asus ROG Zephyrus G14 GU405AR | |
| Media Intel Core Ultra 9 386H, NVIDIA GeForce RTX 5070 Ti Laptop (n=1) | |
| Media della classe Gaming (5828 - 11574, n=96, ultimi 2 anni) | |
| Asus ROG Zephyrus G14 2025 GA403WW | |
| Razer Blade 14 2025 | |
| Acer Predator Triton 14 AI PT14-52 | |
| PCMark 10 / Essentials | |
| Media della classe Gaming (8810 - 12600, n=100, ultimi 2 anni) | |
| Razer Blade 14 2025 | |
| Asus ROG Zephyrus G14 2025 GA403WW | |
| Asus ROG Zephyrus G14 GU405AR | |
| Media Intel Core Ultra 9 386H, NVIDIA GeForce RTX 5070 Ti Laptop (n=1) | |
| Acer Predator Triton 14 AI PT14-52 | |
| PCMark 10 / Productivity | |
| Asus ROG Zephyrus G14 GU405AR | |
| Media Intel Core Ultra 9 386H, NVIDIA GeForce RTX 5070 Ti Laptop (n=1) | |
| Acer Predator Triton 14 AI PT14-52 | |
| Media della classe Gaming (6845 - 18766, n=98, ultimi 2 anni) | |
| Asus ROG Zephyrus G14 2025 GA403WW | |
| Razer Blade 14 2025 | |
| PCMark 10 / Digital Content Creation | |
| Asus ROG Zephyrus G14 GU405AR | |
| Media Intel Core Ultra 9 386H, NVIDIA GeForce RTX 5070 Ti Laptop (n=1) | |
| Media della classe Gaming (7602 - 19657, n=98, ultimi 2 anni) | |
| Asus ROG Zephyrus G14 2025 GA403WW | |
| Razer Blade 14 2025 | |
| Acer Predator Triton 14 AI PT14-52 | |
| CrossMark / Overall | |
| Apple MacBook Pro 14 2026 M5 Max | |
| Asus ROG Zephyrus G14 GU405AR | |
| Media Intel Core Ultra 9 386H, NVIDIA GeForce RTX 5070 Ti Laptop (n=1) | |
| Asus ROG Zephyrus G14 2025 GA403WW | |
| Media della classe Gaming (1366 - 2409, n=98, ultimi 2 anni) | |
| Razer Blade 14 2025 | |
| Acer Predator Triton 14 AI PT14-52 | |
| CrossMark / Productivity | |
| Apple MacBook Pro 14 2026 M5 Max | |
| Media della classe Gaming (1386 - 2254, n=98, ultimi 2 anni) | |
| Razer Blade 14 2025 | |
| Asus ROG Zephyrus G14 GU405AR | |
| Media Intel Core Ultra 9 386H, NVIDIA GeForce RTX 5070 Ti Laptop (n=1) | |
| Asus ROG Zephyrus G14 2025 GA403WW | |
| Acer Predator Triton 14 AI PT14-52 | |
| CrossMark / Creativity | |
| Apple MacBook Pro 14 2026 M5 Max | |
| Asus ROG Zephyrus G14 GU405AR | |
| Media Intel Core Ultra 9 386H, NVIDIA GeForce RTX 5070 Ti Laptop (n=1) | |
| Asus ROG Zephyrus G14 2025 GA403WW | |
| Razer Blade 14 2025 | |
| Media della classe Gaming (1343 - 2729, n=98, ultimi 2 anni) | |
| Acer Predator Triton 14 AI PT14-52 | |
| CrossMark / Responsiveness | |
| Apple MacBook Pro 14 2026 M5 Max | |
| Asus ROG Zephyrus G14 GU405AR | |
| Media Intel Core Ultra 9 386H, NVIDIA GeForce RTX 5070 Ti Laptop (n=1) | |
| Media della classe Gaming (1226 - 2334, n=98, ultimi 2 anni) | |
| Razer Blade 14 2025 | |
| Asus ROG Zephyrus G14 2025 GA403WW | |
| Acer Predator Triton 14 AI PT14-52 | |
| WebXPRT 3 / Overall | |
| Apple MacBook Pro 14 2026 M5 Max | |
| Asus ROG Zephyrus G14 2025 GA403WW | |
| Media della classe Gaming (242 - 532, n=101, ultimi 2 anni) | |
| Asus ROG Zephyrus G14 GU405AR | |
| Media Intel Core Ultra 9 386H, NVIDIA GeForce RTX 5070 Ti Laptop (n=1) | |
| Acer Predator Triton 14 AI PT14-52 | |
| Razer Blade 14 2025 | |
| WebXPRT 4 / Overall | |
| Apple MacBook Pro 14 2026 M5 Max | |
| Asus ROG Zephyrus G14 GU405AR | |
| Media Intel Core Ultra 9 386H, NVIDIA GeForce RTX 5070 Ti Laptop (n=1) | |
| Media della classe Gaming (176.4 - 354, n=101, ultimi 2 anni) | |
| Acer Predator Triton 14 AI PT14-52 | |
| Asus ROG Zephyrus G14 2025 GA403WW | |
| Razer Blade 14 2025 | |
| Mozilla Kraken 1.1 / Total | |
| Acer Predator Triton 14 AI PT14-52 | |
| Media della classe Gaming (391 - 590, n=106, ultimi 2 anni) | |
| Asus ROG Zephyrus G14 GU405AR | |
| Media Intel Core Ultra 9 386H, NVIDIA GeForce RTX 5070 Ti Laptop (n=1) | |
| Razer Blade 14 2025 | |
| Asus ROG Zephyrus G14 2025 GA403WW | |
| Apple MacBook Pro 14 2026 M5 Max | |
* ... Meglio usare valori piccoli
| PCMark 10 Score | 9049 punti | |
Aiuto | ||
| AIDA64 / Memory Copy | |
| Asus ROG Zephyrus G14 GU405AR | |
| Media Intel Core Ultra 9 386H (75437 - 129946, n=7) | |
| Acer Predator Triton 14 AI PT14-52 | |
| Razer Blade 14 2025 | |
| Asus ROG Zephyrus G14 2025 GA403WW | |
| Media della classe Gaming (21750 - 129946, n=110, ultimi 2 anni) | |
| AIDA64 / Memory Read | |
| Asus ROG Zephyrus G14 GU405AR | |
| Media Intel Core Ultra 9 386H (81021 - 118858, n=7) | |
| Razer Blade 14 2025 | |
| Asus ROG Zephyrus G14 2025 GA403WW | |
| Acer Predator Triton 14 AI PT14-52 | |
| Media della classe Gaming (22956 - 118858, n=110, ultimi 2 anni) | |
| AIDA64 / Memory Write | |
| Asus ROG Zephyrus G14 GU405AR | |
| Acer Predator Triton 14 AI PT14-52 | |
| Media Intel Core Ultra 9 386H (75959 - 135096, n=7) | |
| Asus ROG Zephyrus G14 2025 GA403WW | |
| Razer Blade 14 2025 | |
| Media della classe Gaming (22297 - 135096, n=110, ultimi 2 anni) | |
| AIDA64 / Memory Latency | |
| Asus ROG Zephyrus G14 2025 GA403WW | |
| Media della classe Gaming (75.3 - 259, n=110, ultimi 2 anni) | |
| Razer Blade 14 2025 | |
| Acer Predator Triton 14 AI PT14-52 | |
| Media Intel Core Ultra 9 386H (87.2 - 116.9, n=7) | |
| Asus ROG Zephyrus G14 GU405AR | |
* ... Meglio usare valori piccoli
| DPC Latencies / LatencyMon - interrupt to process latency (max), Web, Youtube, Prime95 | |
| Razer Blade 14 2025 | |
| Media della classe Gaming (410 - 11799, n=100, ultimi 2 anni) | |
| Acer Predator Triton 14 AI PT14-52 | |
| Asus ROG Zephyrus G14 GU405AR | |
| Asus ROG Zephyrus G14 2025 GA403WW | |
* ... Meglio usare valori piccoli

* ... Meglio usare valori piccoli
Limitazione della velocità del disco: ciclo di lettura DiskSpd, profondità della coda 8
Prestazioni della GPU e dei giochi
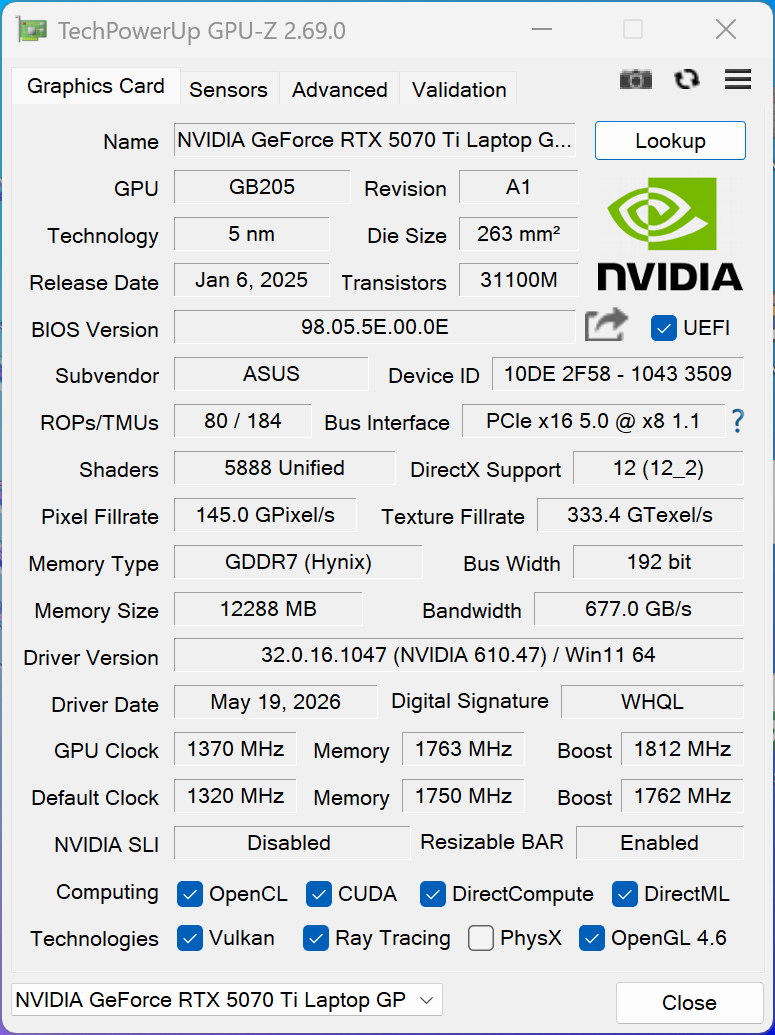
La GeForce e RTX 5070 Ti di Nvidia con 12 GB di VRAM non ha subito modifiche rispetto al modello G14 dello scorso anno, ma la GPU è ora in grado di consumare fino a 115 Watt in modalità Turbo . In modalità manuale può addirittura raggiungere i 130 Watt, ma nei benchmark abbiamo riscontrato solo miglioramenti minimi. Le prestazioni della GPU rimangono eccellenti per un portatile da 14 pollici e non vi è semplicemente alcuna concorrenza (ad eccezione della GPU M5 Max e il Zephyrus G14 del 2025 con RTX 5080). Le prestazioni di gioco sono in realtà migliori rispetto al passato e talvolta alla pari con quelle del G14 dotato di RTX 5080; tuttavia, vi preghiamo di tenere presente che da allora sono stati rilasciati numerosi aggiornamenti dei driver, pertanto parte delle prestazioni aggiuntive è probabilmente attribuibile proprio a questi ultimi. È possibile giocare anche a titoli particolarmente esigenti alla risoluzione QHD, sebbene alcuni giochi possano richiedere l’uso del DLSS e/o della generazione di fotogrammi.
| 3DMark 11 Performance | 41208 punti | |
| 3DMark Fire Strike Score | 32870 punti | |
| 3DMark Time Spy Score | 16242 punti | |
| 3DMark Steel Nomad Score | 3694 punti | |
| 3DMark Steel Nomad Light Score | 16907 punti | |
Aiuto | ||
| Blender / v3.3 Classroom OPTIX/RTX | |
| Acer Predator Triton 14 AI PT14-52 | |
| Razer Blade 14 2025 | |
| Media della classe Gaming (9 - 32, n=112, ultimi 2 anni) | |
| Asus ROG Zephyrus G14 2025 GA403WW | |
| Asus ROG Zephyrus G14 GU405AR | |
| Asus ROG Zephyrus G14 2025 5070 Ti | |
| Media NVIDIA GeForce RTX 5070 Ti Laptop (13 - 19, n=14) | |
| Blender / v3.3 Classroom CUDA | |
| Acer Predator Triton 14 AI PT14-52 | |
| Media della classe Gaming (15 - 228, n=112, ultimi 2 anni) | |
| Razer Blade 14 2025 | |
| Media NVIDIA GeForce RTX 5070 Ti Laptop (24 - 33, n=14) | |
| Asus ROG Zephyrus G14 2025 5070 Ti | |
| Asus ROG Zephyrus G14 GU405AR | |
| Asus ROG Zephyrus G14 2025 GA403WW | |
| Blender / v3.3 Classroom CPU | |
| Acer Predator Triton 14 AI PT14-52 | |
| Razer Blade 14 2025 | |
| Media della classe Gaming (122 - 565, n=108, ultimi 2 anni) | |
| Asus ROG Zephyrus G14 GU405AR | |
| Asus ROG Zephyrus G14 2025 5070 Ti | |
| Asus ROG Zephyrus G14 2025 GA403WW | |
| Media NVIDIA GeForce RTX 5070 Ti Laptop (122 - 361, n=14) | |
| Apple MacBook Pro 14 2026 M5 Max | |
| Blender / v3.3 Classroom METAL | |
| Apple MacBook Pro 14 2026 M5 Max | |
* ... Meglio usare valori piccoli
| Final Fantasy XV Benchmark - 1920x1080 High Quality | |
| Asus ROG Zephyrus G14 GU405AR | |
| Asus ROG Zephyrus G14 2025 GA403WW | |
| Media della classe Gaming (41 - 215, n=104, ultimi 2 anni) | |
| Razer Blade 14 2025 | |
| Asus ROG Zephyrus G14 2025 5070 Ti | |
| Acer Predator Triton 14 AI PT14-52 | |
| Strange Brigade - 1920x1080 ultra AA:ultra AF:16 | |
| Asus ROG Zephyrus G14 2025 GA403WW | |
| Asus ROG Zephyrus G14 GU405AR | |
| Asus ROG Zephyrus G14 2025 5070 Ti | |
| Media della classe Gaming (76.3 - 456, n=94, ultimi 2 anni) | |
| Razer Blade 14 2025 | |
| Acer Predator Triton 14 AI PT14-52 | |
| Dota 2 Reborn - 1920x1080 ultra (3/3) best looking | |
| Media della classe Gaming (84.8 - 248, n=113, ultimi 2 anni) | |
| Asus ROG Zephyrus G14 GU405AR | |
| Razer Blade 14 2025 | |
| Asus ROG Zephyrus G14 2025 GA403WW | |
| Asus ROG Zephyrus G14 2025 5070 Ti | |
| Acer Predator Triton 14 AI PT14-52 | |
| Forza Horizon 6 | |
| 2560x1440 extreme + RT AA:T | |
| Media NVIDIA GeForce RTX 5070 Ti Laptop (42 - 46, n=3) | |
| Asus ROG Zephyrus G14 GU405AR | |
| Media della classe Gaming (15 - 63, n=5, ultimi 2 anni) | |
| 2560x1440 extreme + RT + DLSS perf. AA:T | |
| Media NVIDIA GeForce RTX 5070 Ti Laptop (56 - 66, n=3) | |
| Asus ROG Zephyrus G14 GU405AR | |
| Media della classe Gaming (18 - 88, n=5, ultimi 2 anni) | |
| F1 25 | |
| 2560x1440 Ultra Max Preset AA:T AF:16x | |
| Asus ROG Zephyrus G14 GU405AR | |
| Media NVIDIA GeForce RTX 5070 Ti Laptop (18 - 26, n=7) | |
| Asus ROG Zephyrus G14 2025 5070 Ti | |
| Media della classe Gaming (5 - 37.5, n=24, ultimi 2 anni) | |
| Razer Blade 14 2025 | |
| 2560x1440 Ultra Max Preset + DLSS Quality AA:DLSS AF:16x | |
| Asus ROG Zephyrus G14 GU405AR | |
| Media NVIDIA GeForce RTX 5070 Ti Laptop (32 - 48.1, n=7) | |
| Asus ROG Zephyrus G14 2025 5070 Ti | |
| Media della classe Gaming (9 - 67.5, n=22, ultimi 2 anni) | |
| Razer Blade 14 2025 | |
Grafico dei FPS in modalità Ultra di Cyberpunk 2077
| basso | medio | alto | ultra | QHD DLSS | QHD | |
|---|---|---|---|---|---|---|
| GTA V (2015) | 148.2 | 133.1 | ||||
| Dota 2 Reborn (2015) | 183.9 | 166.5 | 159.2 | 150.1 | ||
| Final Fantasy XV Benchmark (2018) | 219 | 195.8 | 151 | 119.6 | ||
| X-Plane 11.11 (2018) | 122 | 112.3 | 104.5 | |||
| Strange Brigade (2018) | 514 | 324 | 330 | 295 | 209 | |
| Baldur's Gate 3 (2023) | 196.8 | 166.8 | 145.4 | 141.9 | 120 | |
| Cyberpunk 2077 (2023) | 147.3 | 142.4 | 124.5 | 111.9 | 88.5 | 77.4 |
| F1 24 (2024) | 268 | 261 | 101.4 | 102.5 | 66.5 | |
| Assassin's Creed Shadows (2025) | 86 | 80 | 68 | 52 | 52 | 44 |
| F1 25 (2025) | 220 | 207 | 183.3 | 37.9 | 41.3 | 22.6 |
| Forza Horizon 6 (2026) | 182 | 141 | 104 | 62 | 58 | 42 |
| 007 First Light (2026) | 88 | 82.5 | 73.2 | 70 | 50 |
Emissioni e consumo energetico
Rumore del sistema

Il rumore delle ventole dipende in larga misura dalla modalità di alimentazione; in modalità Turbo , infatti, le ventole girano costantemente a circa 35 dB(A), un livello ovviamente molto udibile. Il vantaggio è che i picchi di carico possono essere compensati senza alcun aumento della velocità delle ventole. Per le attività quotidiane, consigliamo vivamente la modalità Silent , poiché le ventole rimarranno disattivate per la maggior parte del tempo. Giocare in modalità Turbo comporta un rumore delle ventole molto forte, pari a 55 dB(A), pertanto saranno necessarie delle cuffie. Giocare in modalità Performance non è molto più silenzioso, con un livello di circa 50 dB(A): questo rappresenta il compromesso da accettare per ottenere prestazioni elevate. Non abbiamo rilevato alcun altro rumore elettronico.
Rumorosità
| Idle |
| 26 / 35.1 / 35.1 dB(A) |
| Sotto carico |
| 35.1 / 55.5 dB(A) |
 | ||
30 dB silenzioso 40 dB(A) udibile 50 dB(A) rumoroso |
||
min: | ||
| Asus ROG Zephyrus G14 GU405AR Ultra 9 386H, GeForce RTX 5070 Ti Laptop | Acer Predator Triton 14 AI PT14-52 Core Ultra 9 288V, GeForce RTX 5070 Laptop | Razer Blade 14 2025 Ryzen AI 9 365, GeForce RTX 5070 Laptop | Asus ROG Zephyrus G14 2025 GA403WW Ryzen AI 9 HX 370, GeForce RTX 5080 Laptop | Apple MacBook Pro 14 2026 M5 Max M5 Max, M5 Max 40-Core GPU | |
|---|---|---|---|---|---|
| Noise | 6% | 7% | -3% | 15% | |
| off /ambiente * (dB) | 26 | 24.9 4% | 23.7 9% | 23.3 10% | 23.1 11% |
| Idle Minimum * (dB) | 26 | 24.9 4% | 23.7 9% | 29.1 -12% | 23.1 11% |
| Idle Average * (dB) | 35.1 | 24.9 29% | 23.7 32% | 29.1 17% | 23.1 34% |
| Idle Maximum * (dB) | 35.1 | 30.5 13% | 27 23% | 29.1 17% | 23.1 34% |
| Load Average * (dB) | 35.1 | 36.1 -3% | 44.9 -28% | 54.4 -55% | 36.8 -5% |
| Cyberpunk 2077 ultra * (dB) | 55.5 | 57.9 -4% | 54.6 2% | 54.4 2% | 47.8 14% |
| Load Maximum * (dB) | 55.5 | 57.9 -4% | 54.6 2% | 54.4 2% | 53.2 4% |
* ... Meglio usare valori piccoli
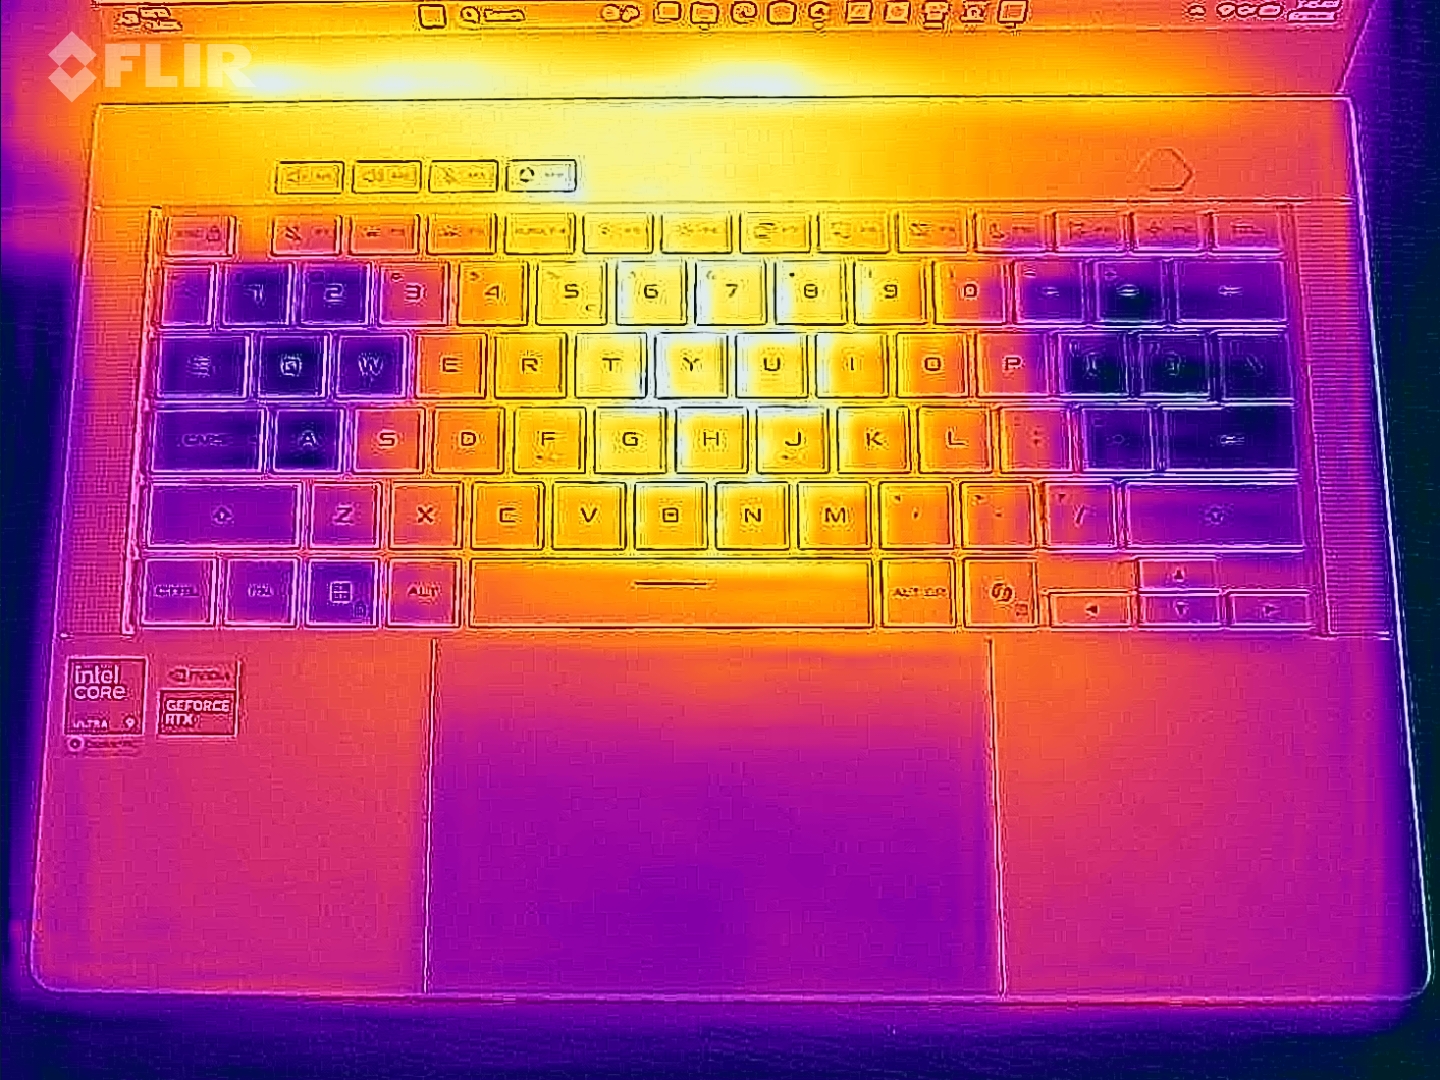
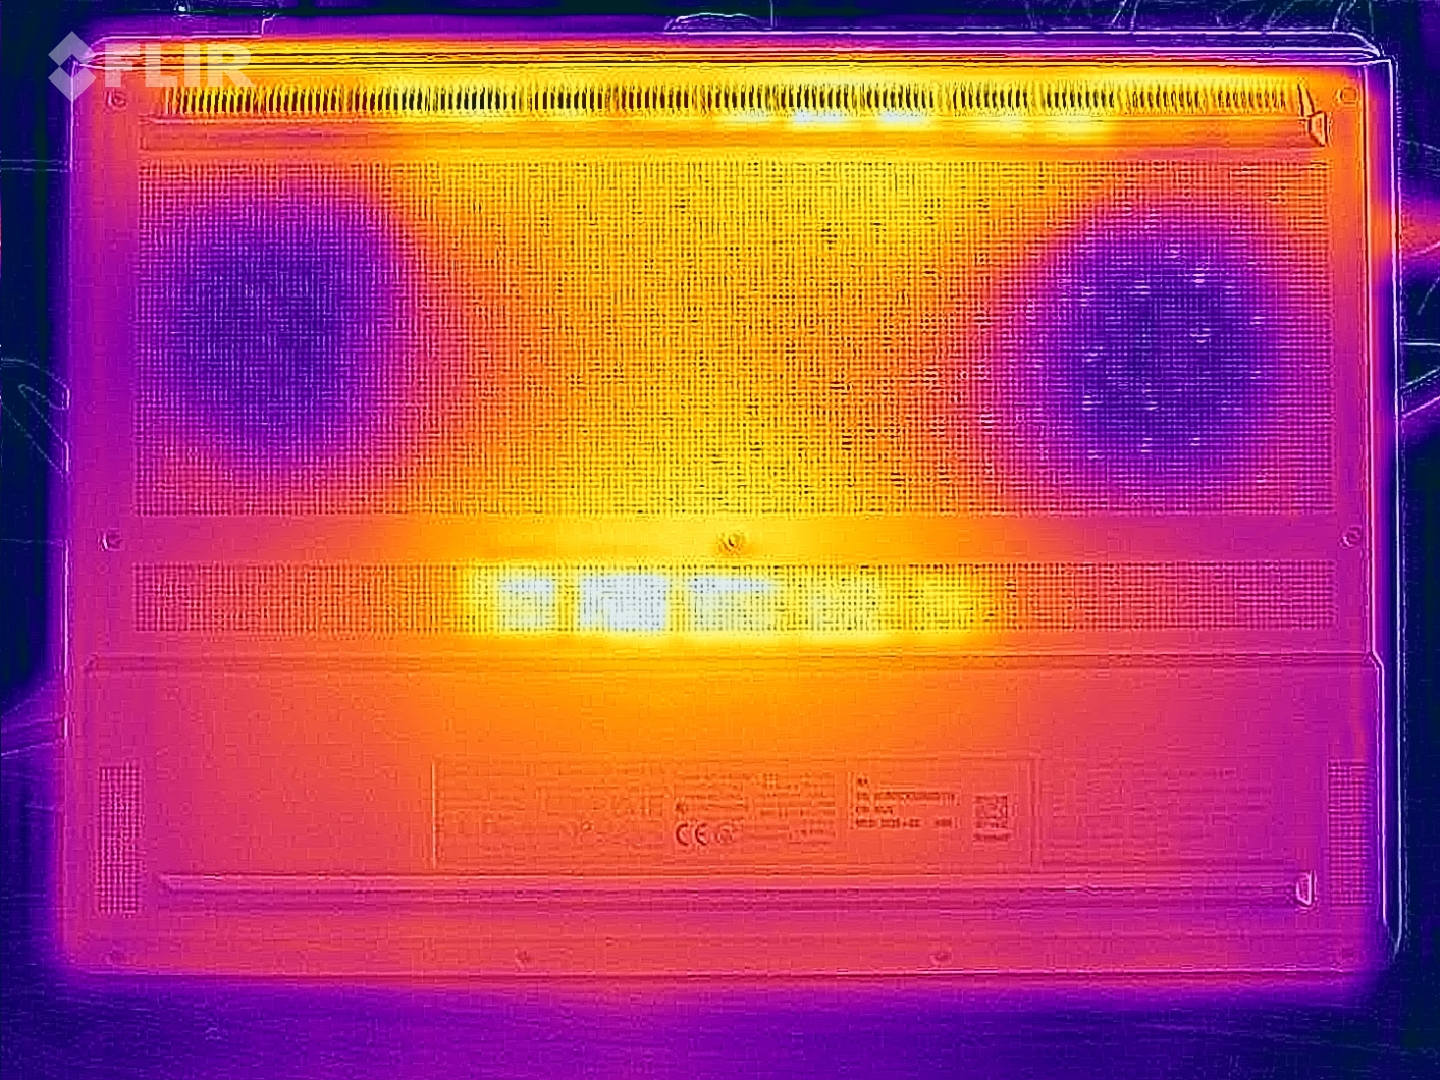
Temperatura
Le temperature superficiali dello Zephyrus G14 non destano alcuna preoccupazione, nemmeno sotto carico massimo. Abbiamo rilevato solo poco più di 40 °C nei punti più caldi della parte inferiore, mentre l’area della tastiera rimane più fresca, quindi non vi sono limitazioni. Durante lo stress test, la GPU mantiene un consumo di 100 Watt (~74 °C) e la CPU di 35 Watt (~79 °C).

(±) La temperatura massima sul lato superiore è di 41.7 °C / 107 F, rispetto alla media di 40.4 °C / 105 F, che varia da 21.2 a 68.8 °C per questa classe Gaming.
(±) Il lato inferiore si riscalda fino ad un massimo di 41.5 °C / 107 F, rispetto alla media di 43.2 °C / 110 F
(+) In idle, la temperatura media del lato superiore è di 24.5 °C / 76 F, rispetto alla media deld ispositivo di 33.9 °C / 93 F.
(±) 3: The average temperature for the upper side is 36.3 °C / 97 F, compared to the average of 33.9 °C / 93 F for the class Gaming.
(+) I poggiapolsi e il touchpad sono piu' freddi della temperatura della pelle con un massimo di 31.5 °C / 88.7 F e sono quindi freddi al tatto.
(-) La temperatura media della zona del palmo della mano di dispositivi simili e'stata di 28.8 °C / 83.8 F (-2.7 °C / -4.9 F).
| Asus ROG Zephyrus G14 GU405AR Ultra 9 386H, GeForce RTX 5070 Ti Laptop | Acer Predator Triton 14 AI PT14-52 Core Ultra 9 288V, GeForce RTX 5070 Laptop | Razer Blade 14 2025 Ryzen AI 9 365, GeForce RTX 5070 Laptop | Asus ROG Zephyrus G14 2025 GA403WW Ryzen AI 9 HX 370, GeForce RTX 5080 Laptop | Apple MacBook Pro 14 2026 M5 Max M5 Max, M5 Max 40-Core GPU | |
|---|---|---|---|---|---|
| Heat | -10% | -19% | -23% | 1% | |
| Maximum Upper Side * (°C) | 41.7 | 42.9 -3% | 47 -13% | 51.2 -23% | 47 -13% |
| Maximum Bottom * (°C) | 41.5 | 47.4 -14% | 49.6 -20% | 50.3 -21% | 40.5 2% |
| Idle Upper Side * (°C) | 25 | 27.3 -9% | 29.8 -19% | 30.2 -21% | 23.3 7% |
| Idle Bottom * (°C) | 24.8 | 28.1 -13% | 30.7 -24% | 30.9 -25% | 23.4 6% |
* ... Meglio usare valori piccoli
Relatori
Le prestazioni degli altoparlanti sono eccellenti e il G14 offre uno dei migliori sistemi audio disponibili su qualsiasi laptop.
Asus ROG Zephyrus G14 GU405AR analisi audio
(+) | gli altoparlanti sono relativamente potenti (85.9 dB)
Bassi 100 - 315 Hz
(+) | bassi buoni - solo 4.3% dalla media
(±) | la linearità dei bassi è media (7.1% delta rispetto alla precedente frequenza)
Medi 400 - 2000 Hz
(+) | medi bilanciati - solo only 2.8% rispetto alla media
(+) | medi lineari (2.8% delta rispetto alla precedente frequenza)
Alti 2 - 16 kHz
(+) | Alti bilanciati - appena 3% dalla media
(+) | alti lineari (3.6% delta rispetto alla precedente frequenza)
Nel complesso 100 - 16.000 Hz
(+) | suono nel complesso lineare (6.7% differenza dalla media)
Rispetto alla stessa classe
» 0% di tutti i dispositivi testati in questa classe è stato migliore, 1% simile, 99% peggiore
» Il migliore ha avuto un delta di 6%, medio di 18%, peggiore di 132%
Rispetto a tutti i dispositivi testati
» 1% di tutti i dispositivi testati in questa classe è stato migliore, 0% similare, 99% peggiore
» Il migliore ha avuto un delta di 4%, medio di 24%, peggiore di 134%
Acer Predator Triton 14 AI PT14-52 analisi audio
(+) | gli altoparlanti sono relativamente potenti (90.7 dB)
Bassi 100 - 315 Hz
(±) | bassi ridotti - in media 11.9% inferiori alla media
(±) | la linearità dei bassi è media (10.3% delta rispetto alla precedente frequenza)
Medi 400 - 2000 Hz
(±) | medi elevati - circa 10.1% superiore alla media
(+) | medi lineari (6.9% delta rispetto alla precedente frequenza)
Alti 2 - 16 kHz
(±) | alti ridotti - circa 5.2% inferiori alla media
(+) | alti lineari (4.4% delta rispetto alla precedente frequenza)
Nel complesso 100 - 16.000 Hz
(±) | la linearità complessiva del suono è media (17.9% di differenza rispetto alla media
Rispetto alla stessa classe
» 54% di tutti i dispositivi testati in questa classe è stato migliore, 9% simile, 37% peggiore
» Il migliore ha avuto un delta di 6%, medio di 18%, peggiore di 132%
Rispetto a tutti i dispositivi testati
» 37% di tutti i dispositivi testati in questa classe è stato migliore, 8% similare, 55% peggiore
» Il migliore ha avuto un delta di 4%, medio di 24%, peggiore di 134%
Razer Blade 14 2025 analisi audio
(±) | potenza degli altiparlanti media ma buona (79.6 dB)
Bassi 100 - 315 Hz
(±) | bassi ridotti - in media 9% inferiori alla media
(±) | la linearità dei bassi è media (7.4% delta rispetto alla precedente frequenza)
Medi 400 - 2000 Hz
(±) | medi elevati - circa 9% superiore alla media
(+) | medi lineari (5.4% delta rispetto alla precedente frequenza)
Alti 2 - 16 kHz
(+) | Alti bilanciati - appena 3.2% dalla media
(+) | alti lineari (5% delta rispetto alla precedente frequenza)
Nel complesso 100 - 16.000 Hz
(±) | la linearità complessiva del suono è media (15.1% di differenza rispetto alla media
Rispetto alla stessa classe
» 32% di tutti i dispositivi testati in questa classe è stato migliore, 6% simile, 62% peggiore
» Il migliore ha avuto un delta di 6%, medio di 18%, peggiore di 132%
Rispetto a tutti i dispositivi testati
» 21% di tutti i dispositivi testati in questa classe è stato migliore, 4% similare, 75% peggiore
» Il migliore ha avuto un delta di 4%, medio di 24%, peggiore di 134%
Asus ROG Zephyrus G14 2025 GA403WW analisi audio
(±) | potenza degli altiparlanti media ma buona (81.2 dB)
Bassi 100 - 315 Hz
(+) | bassi buoni - solo 2.8% dalla media
(±) | la linearità dei bassi è media (8.1% delta rispetto alla precedente frequenza)
Medi 400 - 2000 Hz
(+) | medi bilanciati - solo only 3.9% rispetto alla media
(+) | medi lineari (5.6% delta rispetto alla precedente frequenza)
Alti 2 - 16 kHz
(±) | alti ridotti - circa 5.9% inferiori alla media
(+) | alti lineari (4.3% delta rispetto alla precedente frequenza)
Nel complesso 100 - 16.000 Hz
(+) | suono nel complesso lineare (10.4% differenza dalla media)
Rispetto alla stessa classe
» 6% di tutti i dispositivi testati in questa classe è stato migliore, 2% simile, 92% peggiore
» Il migliore ha avuto un delta di 6%, medio di 18%, peggiore di 132%
Rispetto a tutti i dispositivi testati
» 5% di tutti i dispositivi testati in questa classe è stato migliore, 1% similare, 93% peggiore
» Il migliore ha avuto un delta di 4%, medio di 24%, peggiore di 134%
Apple MacBook Pro 14 2026 M5 Max analisi audio
(+) | gli altoparlanti sono relativamente potenti (83.1 dB)
Bassi 100 - 315 Hz
(+) | bassi buoni - solo 4.5% dalla media
(±) | la linearità dei bassi è media (7.1% delta rispetto alla precedente frequenza)
Medi 400 - 2000 Hz
(+) | medi bilanciati - solo only 1.3% rispetto alla media
(+) | medi lineari (2.5% delta rispetto alla precedente frequenza)
Alti 2 - 16 kHz
(+) | Alti bilanciati - appena 3.3% dalla media
(+) | alti lineari (3.7% delta rispetto alla precedente frequenza)
Nel complesso 100 - 16.000 Hz
(+) | suono nel complesso lineare (6.5% differenza dalla media)
Rispetto alla stessa classe
» 4% di tutti i dispositivi testati in questa classe è stato migliore, 1% simile, 95% peggiore
» Il migliore ha avuto un delta di 5%, medio di 17%, peggiore di 45%
Rispetto a tutti i dispositivi testati
» 1% di tutti i dispositivi testati in questa classe è stato migliore, 0% similare, 99% peggiore
» Il migliore ha avuto un delta di 4%, medio di 24%, peggiore di 134%
Consumo energetico e autonomia della batteria
Le nostre misurazioni dei consumi evidenziano un leggero miglioramento rispetto al modello precedente nei test in modalità inattiva, ma valori leggermente superiori sotto carico a causa del TGP più elevato della GPU GeForce. L’alimentatore da 250 W in dotazione è più che sufficiente, poiché il consumo massimo di 230 Watt durante lo stress test si stabilizza rapidamente intorno ai 170/180 Watt.
La capacità della batteria rimane di 73 Wh, ma il passaggio alla CPU Intel garantisce un’autonomia significativamente maggiore nel nostro test Wi-Fi. A 150 nit, il nuovo modello 2026 raggiunge quasi 14,5 ore, ovvero quattro ore in più. Se si utilizza la luminosità SDR massima (che ora è superiore rispetto a prima), la differenza è minore, ma il nuovo modello garantisce comunque una maggiore autonomia.

| Off / Standby | |
| Idle | |
| Sotto carico |
|
Leggenda:
min: | |
| Asus ROG Zephyrus G14 GU405AR Ultra 9 386H, GeForce RTX 5070 Ti Laptop, Kioxia BG6 KBG60ZNV1T02, OLED, 2880x1800, 14" | Acer Predator Triton 14 AI PT14-52 Core Ultra 9 288V, GeForce RTX 5070 Laptop, Micron 3400 1TB MTFDKBA1T0TFH, OLED, 2880x1800, 14.5" | Razer Blade 14 2025 Ryzen AI 9 365, GeForce RTX 5070 Laptop, Samsung PM9A1 MZVL21T0HCLR, OLED, 2880x1800, 14" | Asus ROG Zephyrus G14 2025 GA403WW Ryzen AI 9 HX 370, GeForce RTX 5080 Laptop, WD PC SN740 SDDPNQE-2T00, OLED, 2880x1800, 14" | Apple MacBook Pro 14 2026 M5 Max M5 Max, M5 Max 40-Core GPU, Apple SSD AP8192Z, Mini-LED, 3024x1964, 14.2" | Media NVIDIA GeForce RTX 5070 Ti Laptop | Media della classe Gaming | |
|---|---|---|---|---|---|---|---|
| Power Consumption | -23% | -32% | -19% | 11% | -129% | -126% | |
| Idle Minimum * (Watt) | 3.9 | 9.3 -138% | 9.3 -138% | 6.7 -72% | 2.5 36% | 12.4 ? -218% | 13.3 ? -241% |
| Idle Average * (Watt) | 7.8 | 12.2 -56% | 11.1 -42% | 8.8 -13% | 11.6 -49% | 19.7 ? -153% | 19 ? -144% |
| Idle Maximum * (Watt) | 8.1 | 12.5 -54% | 11.2 -38% | 9.3 -15% | 11.8 -46% | 24.9 ? -207% | 24.5 ? -202% |
| Load Average * (Watt) | 82.2 | 68.4 17% | 91.9 -12% | 121.5 -48% | 95.6 -16% | 123.6 ? -50% | 108.1 ? -32% |
| Cyberpunk 2077 ultra * (Watt) | 162.9 | 134 18% | 171.5 -5% | 157.4 3% | 89.4 45% | ||
| Cyberpunk 2077 ultra external monitor * (Watt) | 161.6 | 132.2 18% | 168.6 -4% | 155.5 4% | 86.4 47% | ||
| Load Maximum * (Watt) | 230.7 | 145.4 37% | 195 15% | 218.1 5% | 98.8 57% | 272 ? -18% | 254 ? -10% |
* ... Meglio usare valori piccoli
Valutazione di Notebookcheck
Asus ROG Zephyrus G14 GU405AR
- 06/19/2026 v8
Andreas Osthoff
 Total Sustainability Score:
 Confronto tra i potenziali concorrenti
Immagine | Modello | Prezzo | Peso | Altezza | Schermo |
|---|---|---|---|---|---|
1. 89.9%  | Asus ROG Zephyrus G14 GU405AR Intel Core Ultra 9 386H ⎘ NVIDIA GeForce RTX 5070 Ti Laptop ⎘ 32 GB Memoria, 1024 GB SSD | Amazon: 1. $1,499.99 EXCaliberPC [2025] ASUS ROG ... 2. $45.99 100W USB C Charger Replaceme... 3. $3,104.10 ASUS ROG Zephyrus G14 14" 3K... Prezzo di listino: 3299€ | 1.6 kg | 16.3 mm | 14.00" 2880x1800 243 PPI OLED |
2. 82.3% 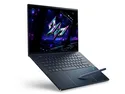 | Acer Predator Triton 14 AI PT14-52 Intel Core Ultra 9 288V ⎘ NVIDIA GeForce RTX 5070 Laptop ⎘ 32 GB Memoria, 1024 GB SSD | Amazon: Prezzo di listino: 2999€ | 1.6 kg | 17.31 mm | 14.50" 2880x1800 234 PPI OLED |
3. 87.2% 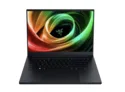 | Razer Blade 14 2025 AMD Ryzen AI 9 365 ⎘ NVIDIA GeForce RTX 5070 Laptop ⎘ 32 GB Memoria, 1024 GB SSD | Amazon: Prezzo di listino: 2399€ | 1.6 kg | 16.2 mm | 14.00" 2880x1800 243 PPI OLED |
4. 88.9% 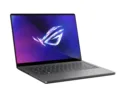 | Asus ROG Zephyrus G14 2025 GA403WW AMD Ryzen AI 9 HX 370 ⎘ NVIDIA GeForce RTX 5080 Laptop ⎘ 64 GB Memoria, 2048 GB SSD | Amazon: Prezzo di listino: 3899€ | 1.6 kg | 18.3 mm | 14.00" 2880x1800 243 PPI OLED |
5. 90.2%  | Apple MacBook Pro 14 2026 M5 Max Apple M5 Max ⎘ Apple M5 Max 40-Core GPU ⎘ 128 GB Memoria, 8192 GB SSD | Amazon: Prezzo di listino: 8589€ | 1.6 kg | 15.5 mm | 14.20" 3024x1964 254 PPI Mini-LED |
6. 88.5% 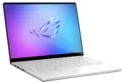 | Asus ROG Zephyrus G14 2025 5070 Ti AMD Ryzen AI 9 HX 370 ⎘ NVIDIA GeForce RTX 5070 Ti Laptop ⎘ 32 GB Memoria, 2048 GB SSD | Amazon: Prezzo di listino: 3399€ | 1.6 kg | 18.3 mm | 14.00" 2880x1800 243 PPI OLED |
Transparency
La selezione dei dispositivi da recensire viene effettuata dalla nostra redazione. Il campione di prova è stato fornito all'autore come prestito dal produttore o dal rivenditore ai fini di questa recensione. L'istituto di credito non ha avuto alcuna influenza su questa recensione, né il produttore ne ha ricevuto una copia prima della pubblicazione. Non vi era alcun obbligo di pubblicare questa recensione. In quanto società mediatica indipendente, Notebookcheck non è soggetta all'autorità di produttori, rivenditori o editori.
Ecco come Notebookcheck esegue i test
Ogni anno, Notebookcheck esamina in modo indipendente centinaia di laptop e smartphone utilizzando procedure standardizzate per garantire che tutti i risultati siano comparabili. Da circa 20 anni sviluppiamo continuamente i nostri metodi di prova e nel frattempo stabiliamo gli standard di settore. Nei nostri laboratori di prova, tecnici ed editori esperti utilizzano apparecchiature di misurazione di alta qualità. Questi test comportano un processo di validazione in più fasi. Il nostro complesso sistema di valutazione si basa su centinaia di misurazioni e parametri di riferimento ben fondati, che mantengono l'obiettività.
