Verdetto - Caratteristiche maggiori per un prezzo maggiore
Una delle nostre principali lamentele sull'Alienware 16X Aurora 2025 era la mancanza di opzioni OLED, supporto HDR e GeForce RTX 5070 Ti. Ora, un anno dopo, il modello 2026 16X Aurora può essere configurato con tutte queste caratteristiche mancanti, più il nuovissimo Core Ultra 9 290HX Plus come opzione di CPU di livello superiore rispetto all'attuale Core Ultra 9 275HX.
In primo luogo, la nuova CPU apporta ben poco al tavolo, soprattutto per i giocatori, e quindi è probabilmente la ragione peggiore per scegliere l'Aurora 2026 16X rispetto al modello 2025. Invece, la nuova opzione RTX 5070 Ti è il principale punto di vendita, poiché funziona in modo ragionevolmente più veloce rispetto alla RTX 5070 dello scorso anno.
Nel frattempo, il pannello OLED opaco è unico nel settore, poiché la maggior parte degli altri sono lucidi. La qualità dell'immagine è migliore rispetto alla già ottima opzione IPS di base, ma la sovrapposizione opaca introduce un po' di granulosità per ridurre i riflessi. Anche la luminosità è solo nella media per un OLED; il concorrente Lenovo Legion Pro 5 è dotato di un pannello OLED lucido e più luminoso.
Per il resto, l'esperienza d'uso è la stessa dell'anno scorso. Il peso rimane più elevato rispetto alla maggior parte dei concorrenti, ma l'espandibilità decente e il design molto rigido compensano parzialmente lo svantaggio. Forse l'aspetto più fastidioso del modello aggiornato è che la nuova opzione RTX 5070 Ti è legata al Core Ultra 9 290HX Plus, anche se la CPU non aggiunge quasi nulla all'esperienza di gioco rispetto al Core Ultra 9 275HX esistente. Con i prezzi dei laptop così alti, una maggiore libertà di configurazione avrebbe reso l'Alienware un acquisto più facile per molti.
Pro
Contro
Prezzo e disponibilità
Dell distribuisce ora l'Alienware 16X Aurora, come configurato in questa recensione, al prezzo di 3000 dollari.
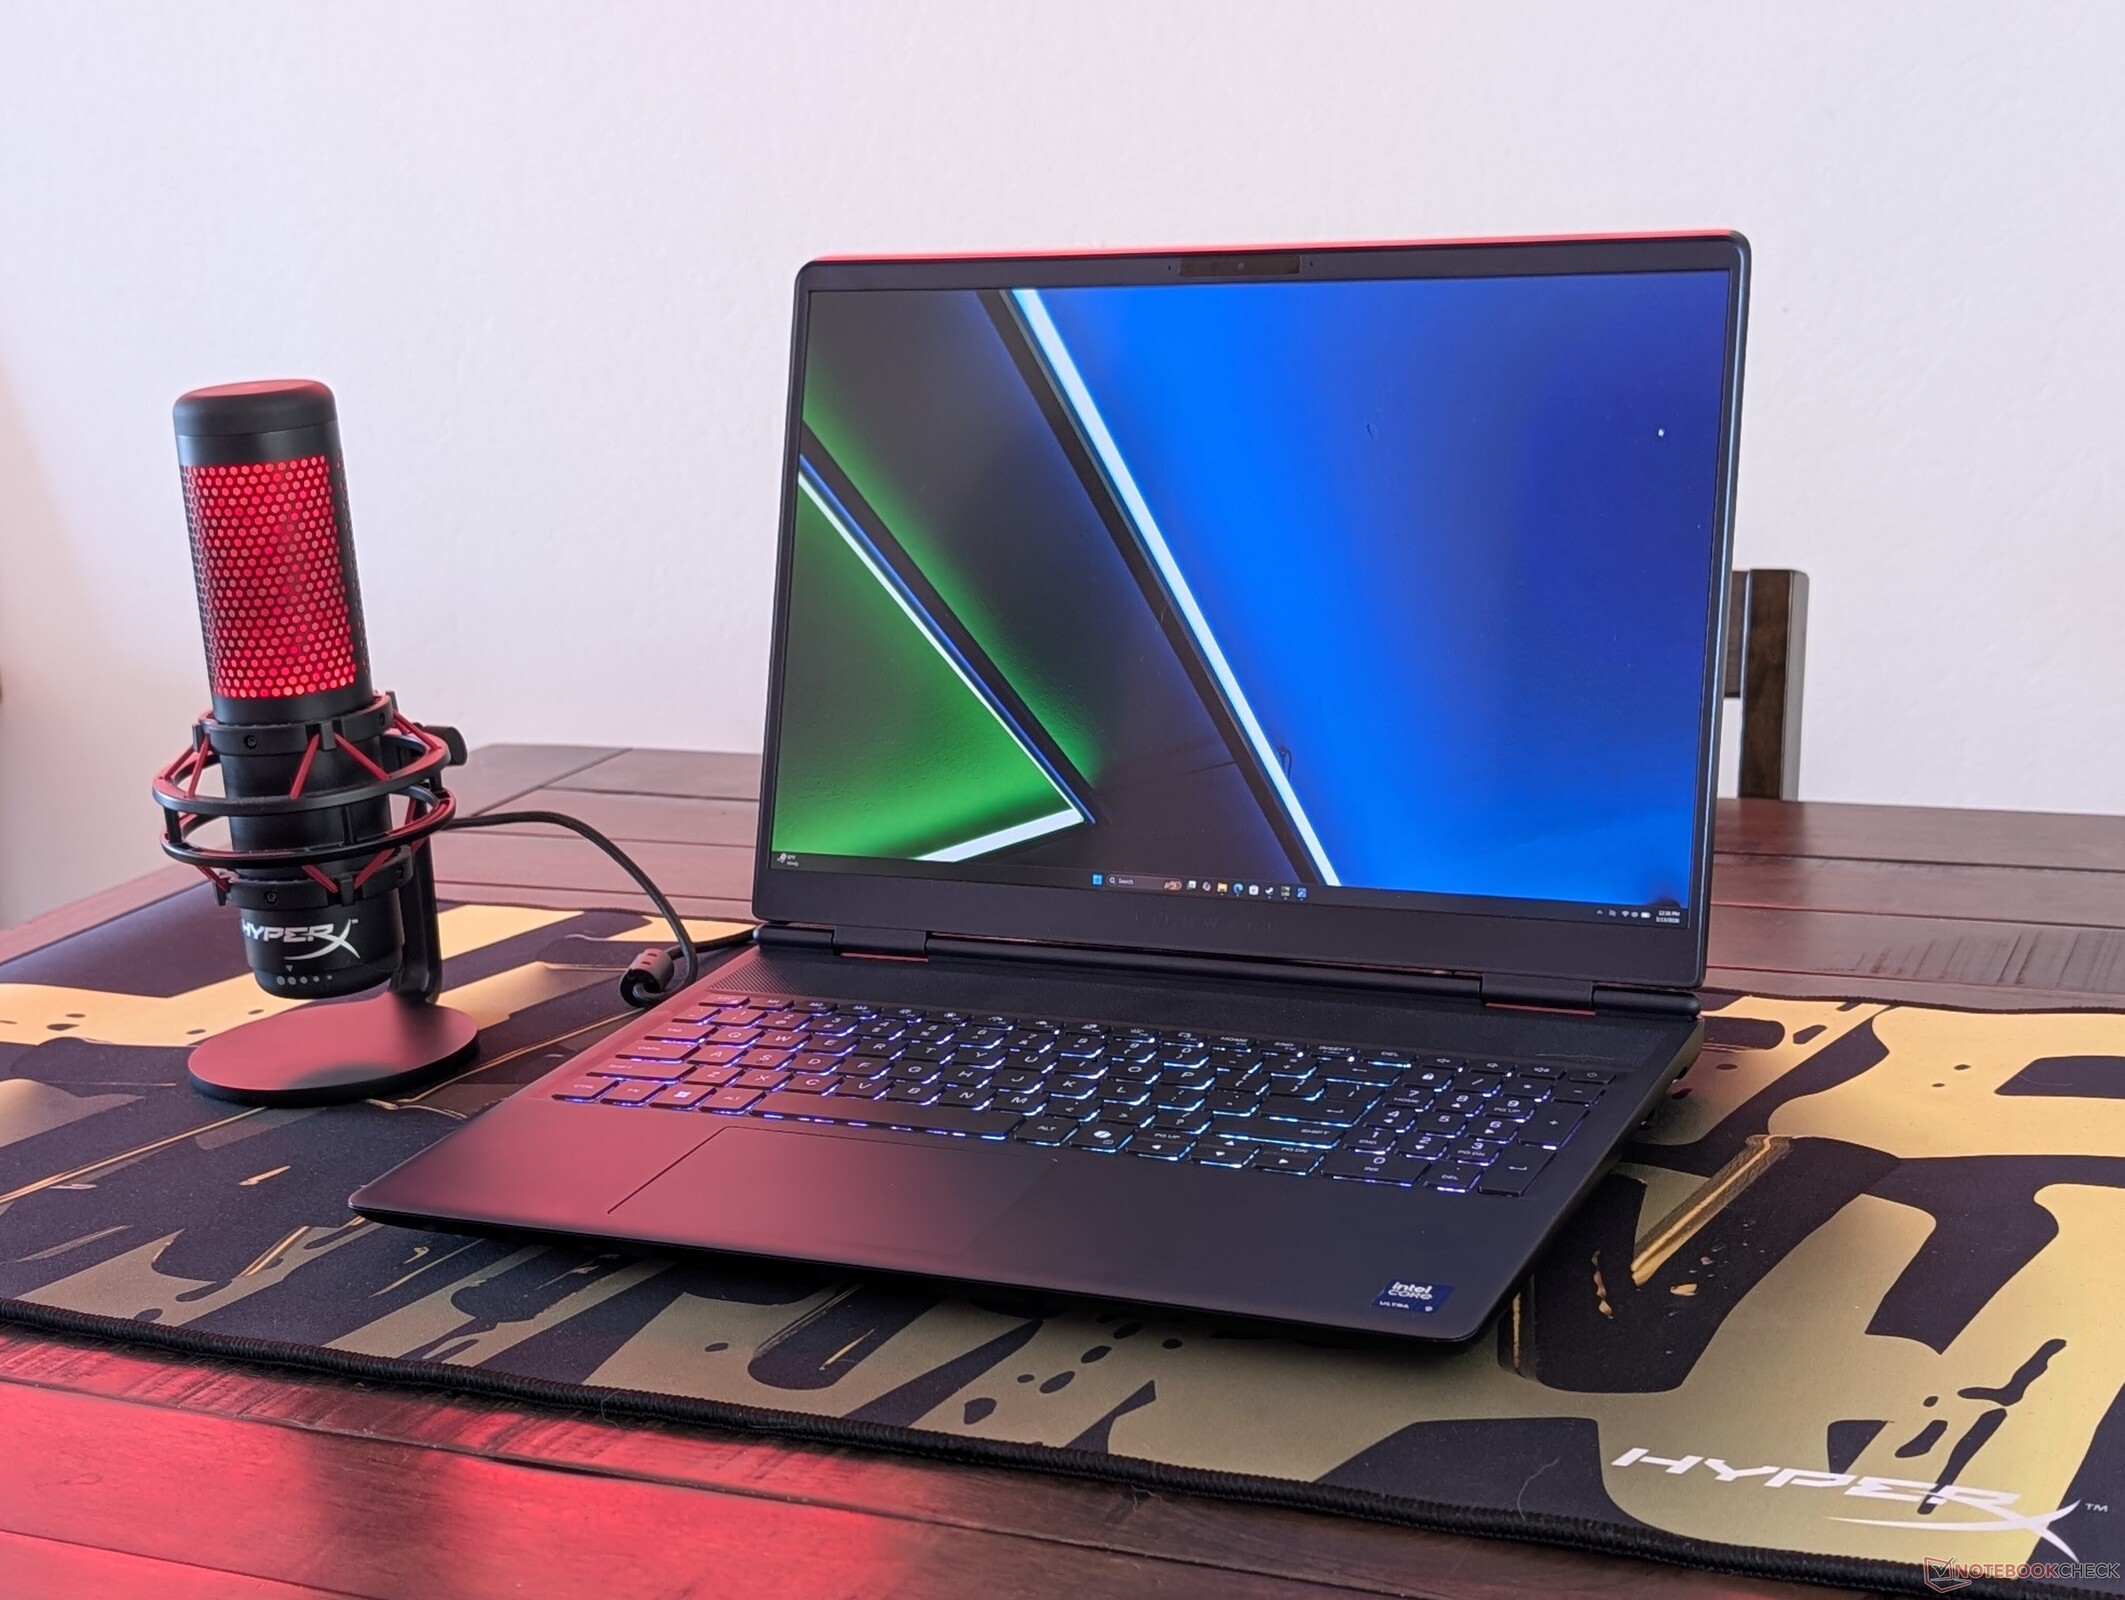
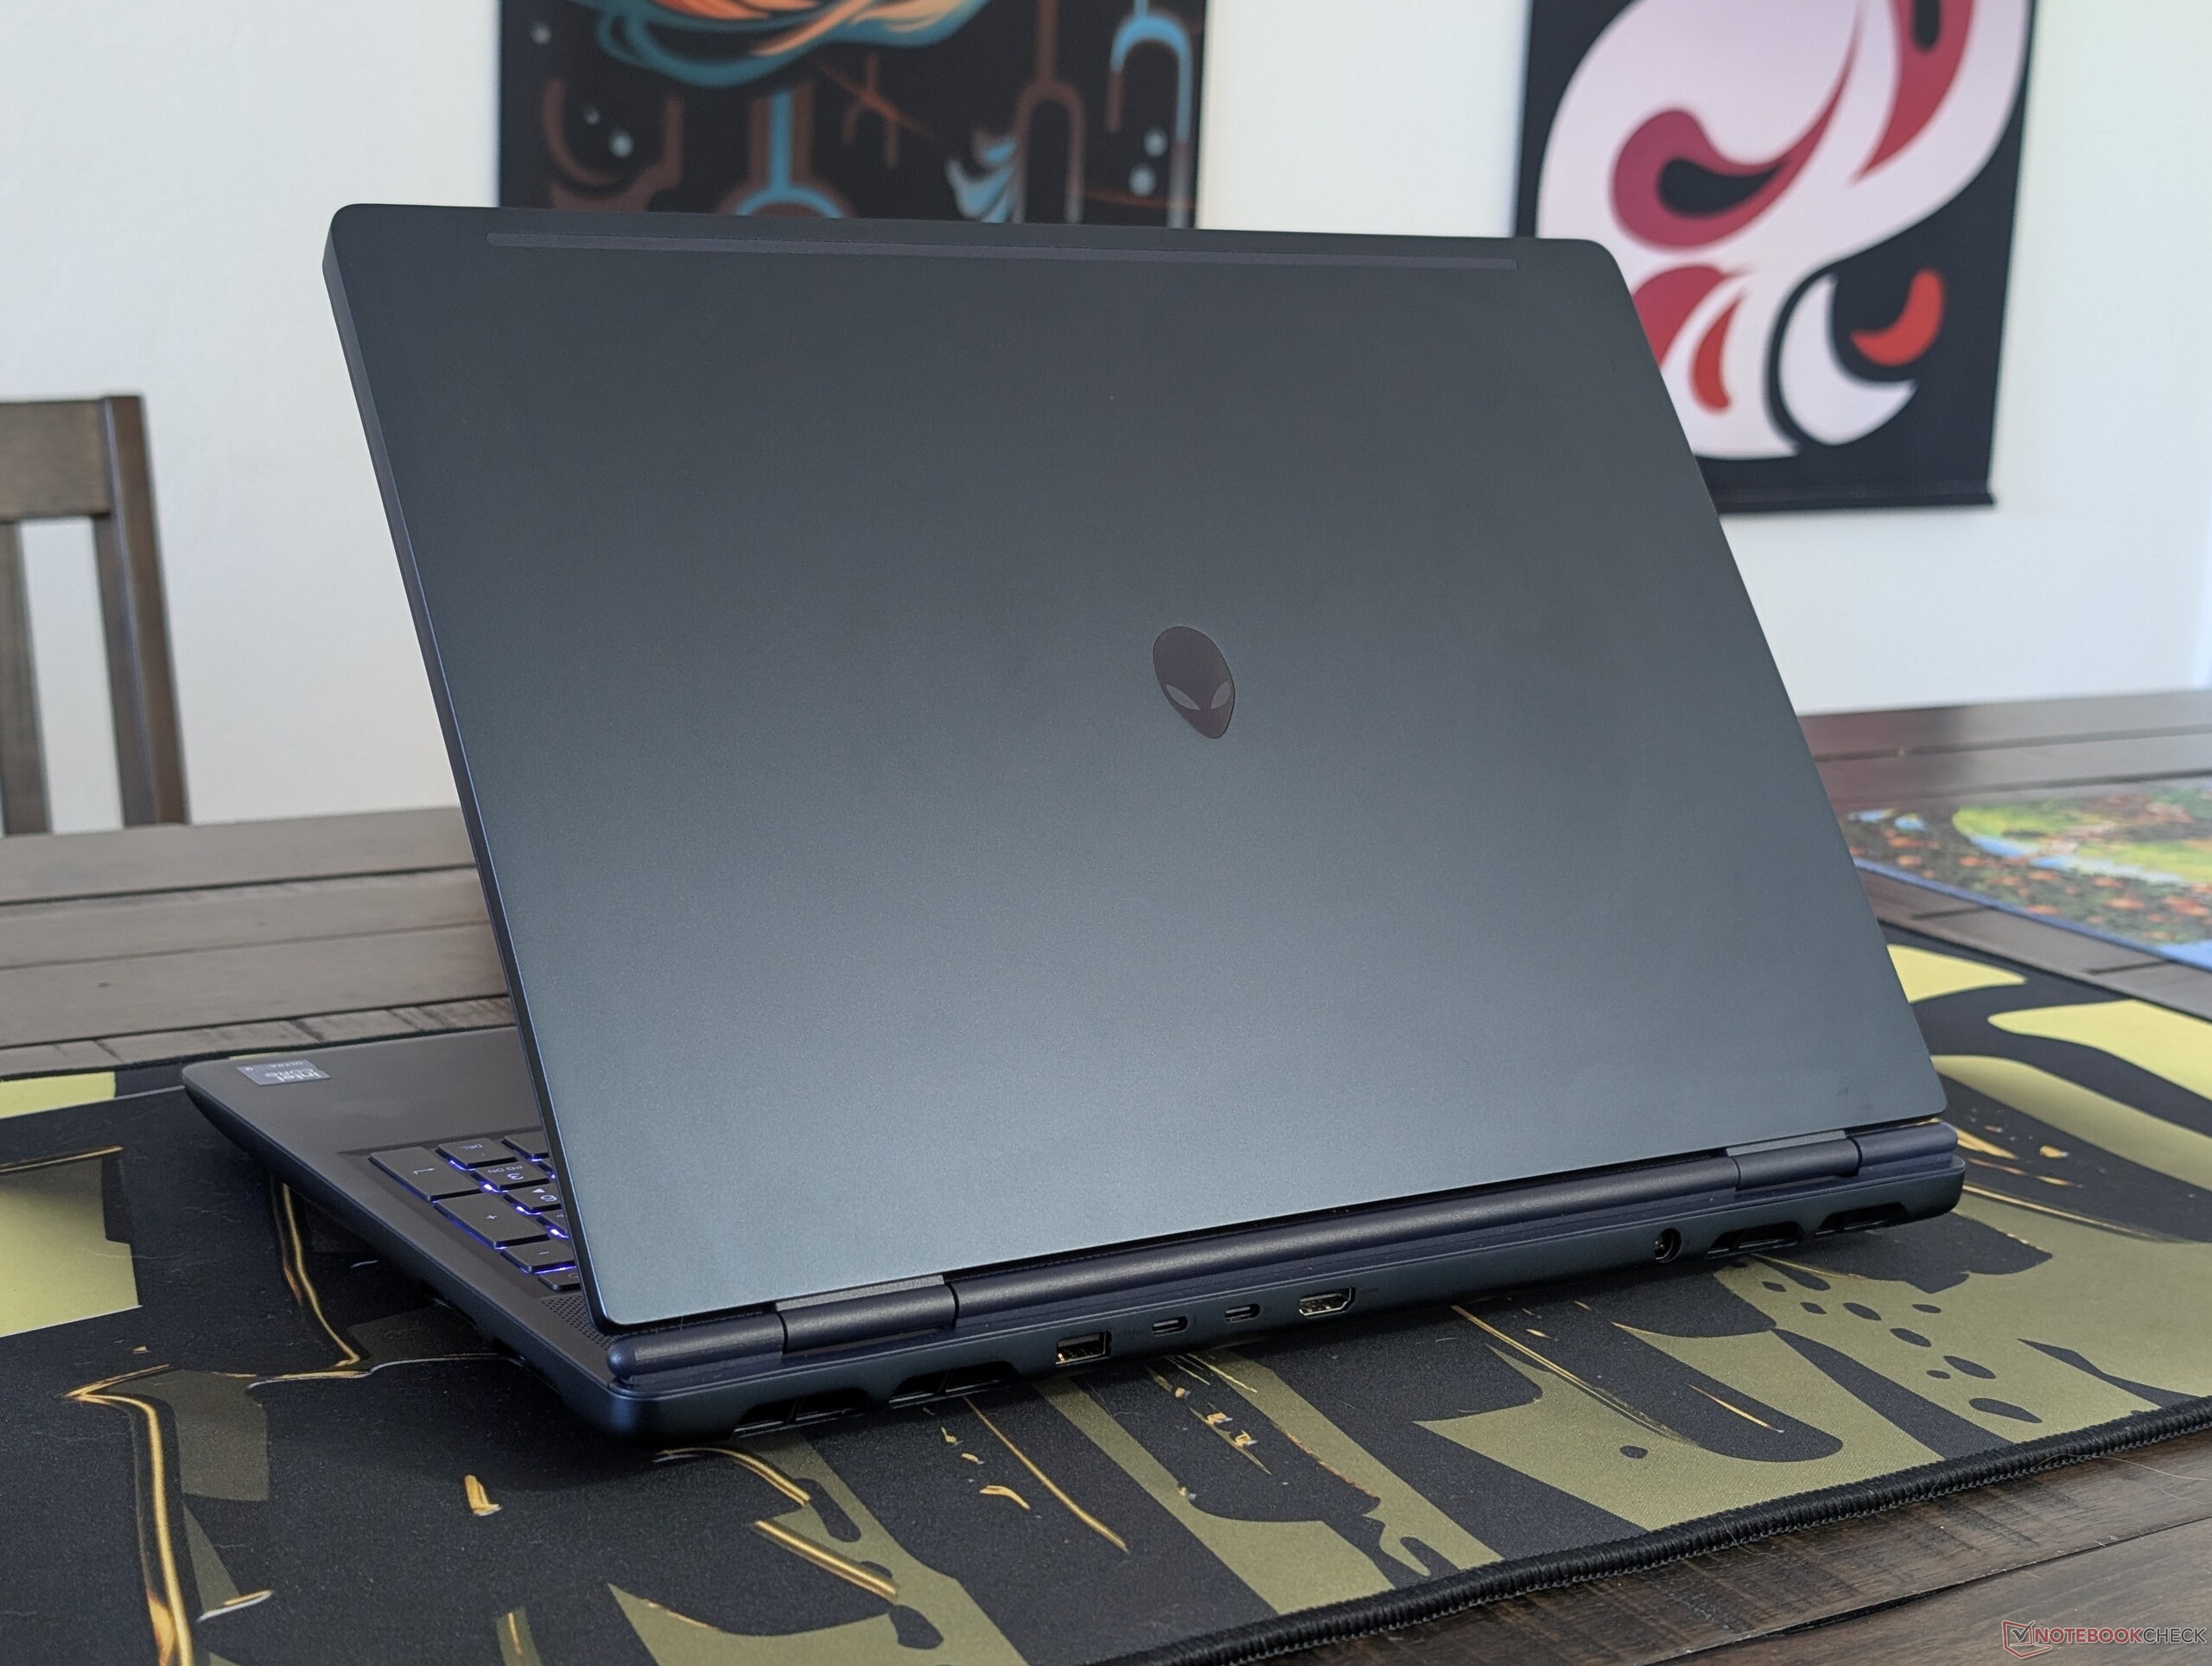
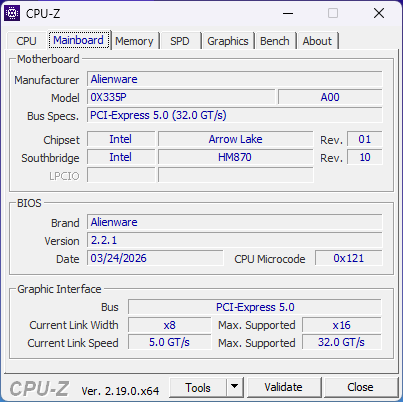
L'Alienware 16X Aurora è tornato quest'anno con nuove opzioni di CPU, GPU e display che vanno ad aggiungersi alle opzioni esistenti sul modello 2025. Per il resto, il telaio è visivamente identico al modello 2025 e per maggiori dettagli può consultare la nostra recensione esistente qui.
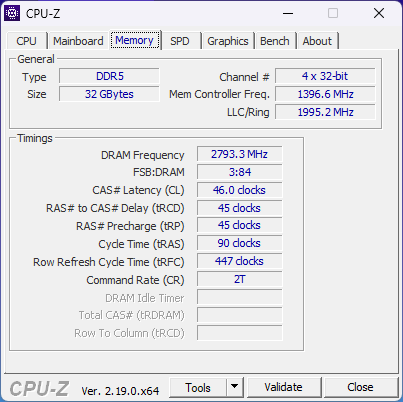
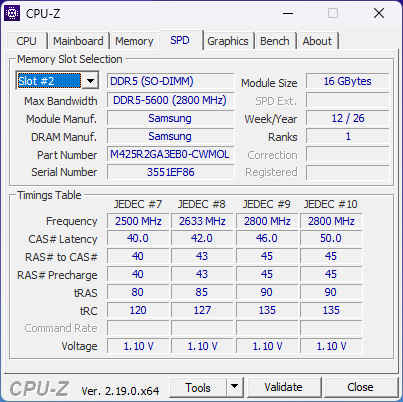
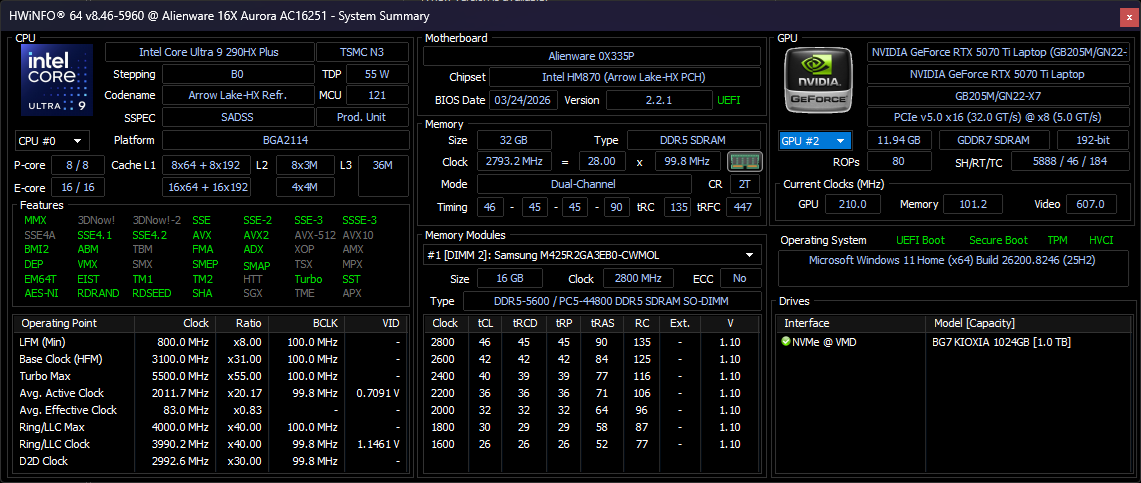
La nostra unità di prova è la configurazione più alta con Arrow Lake Core Ultra 9 290HX Plus, GeForce RTX 5070 Ti e display OLED 1600p per circa 3000 dollari. In precedenza, la 16X Aurora era limitata al Core Ultra 9 275HX, RTX 5070 e display IPS da 1600p.
I concorrenti in questo spazio includono altri computer portatili da gioco da 16 pollici di fascia medio-alta, come l' Asus ROG Zephyrus G16, Acer Predator Helios Neoo MSI Vector 16 HX.
Altre recensioni di Alienware:
Specifiche
Caso
Connettività


Comunicazione
Webcam


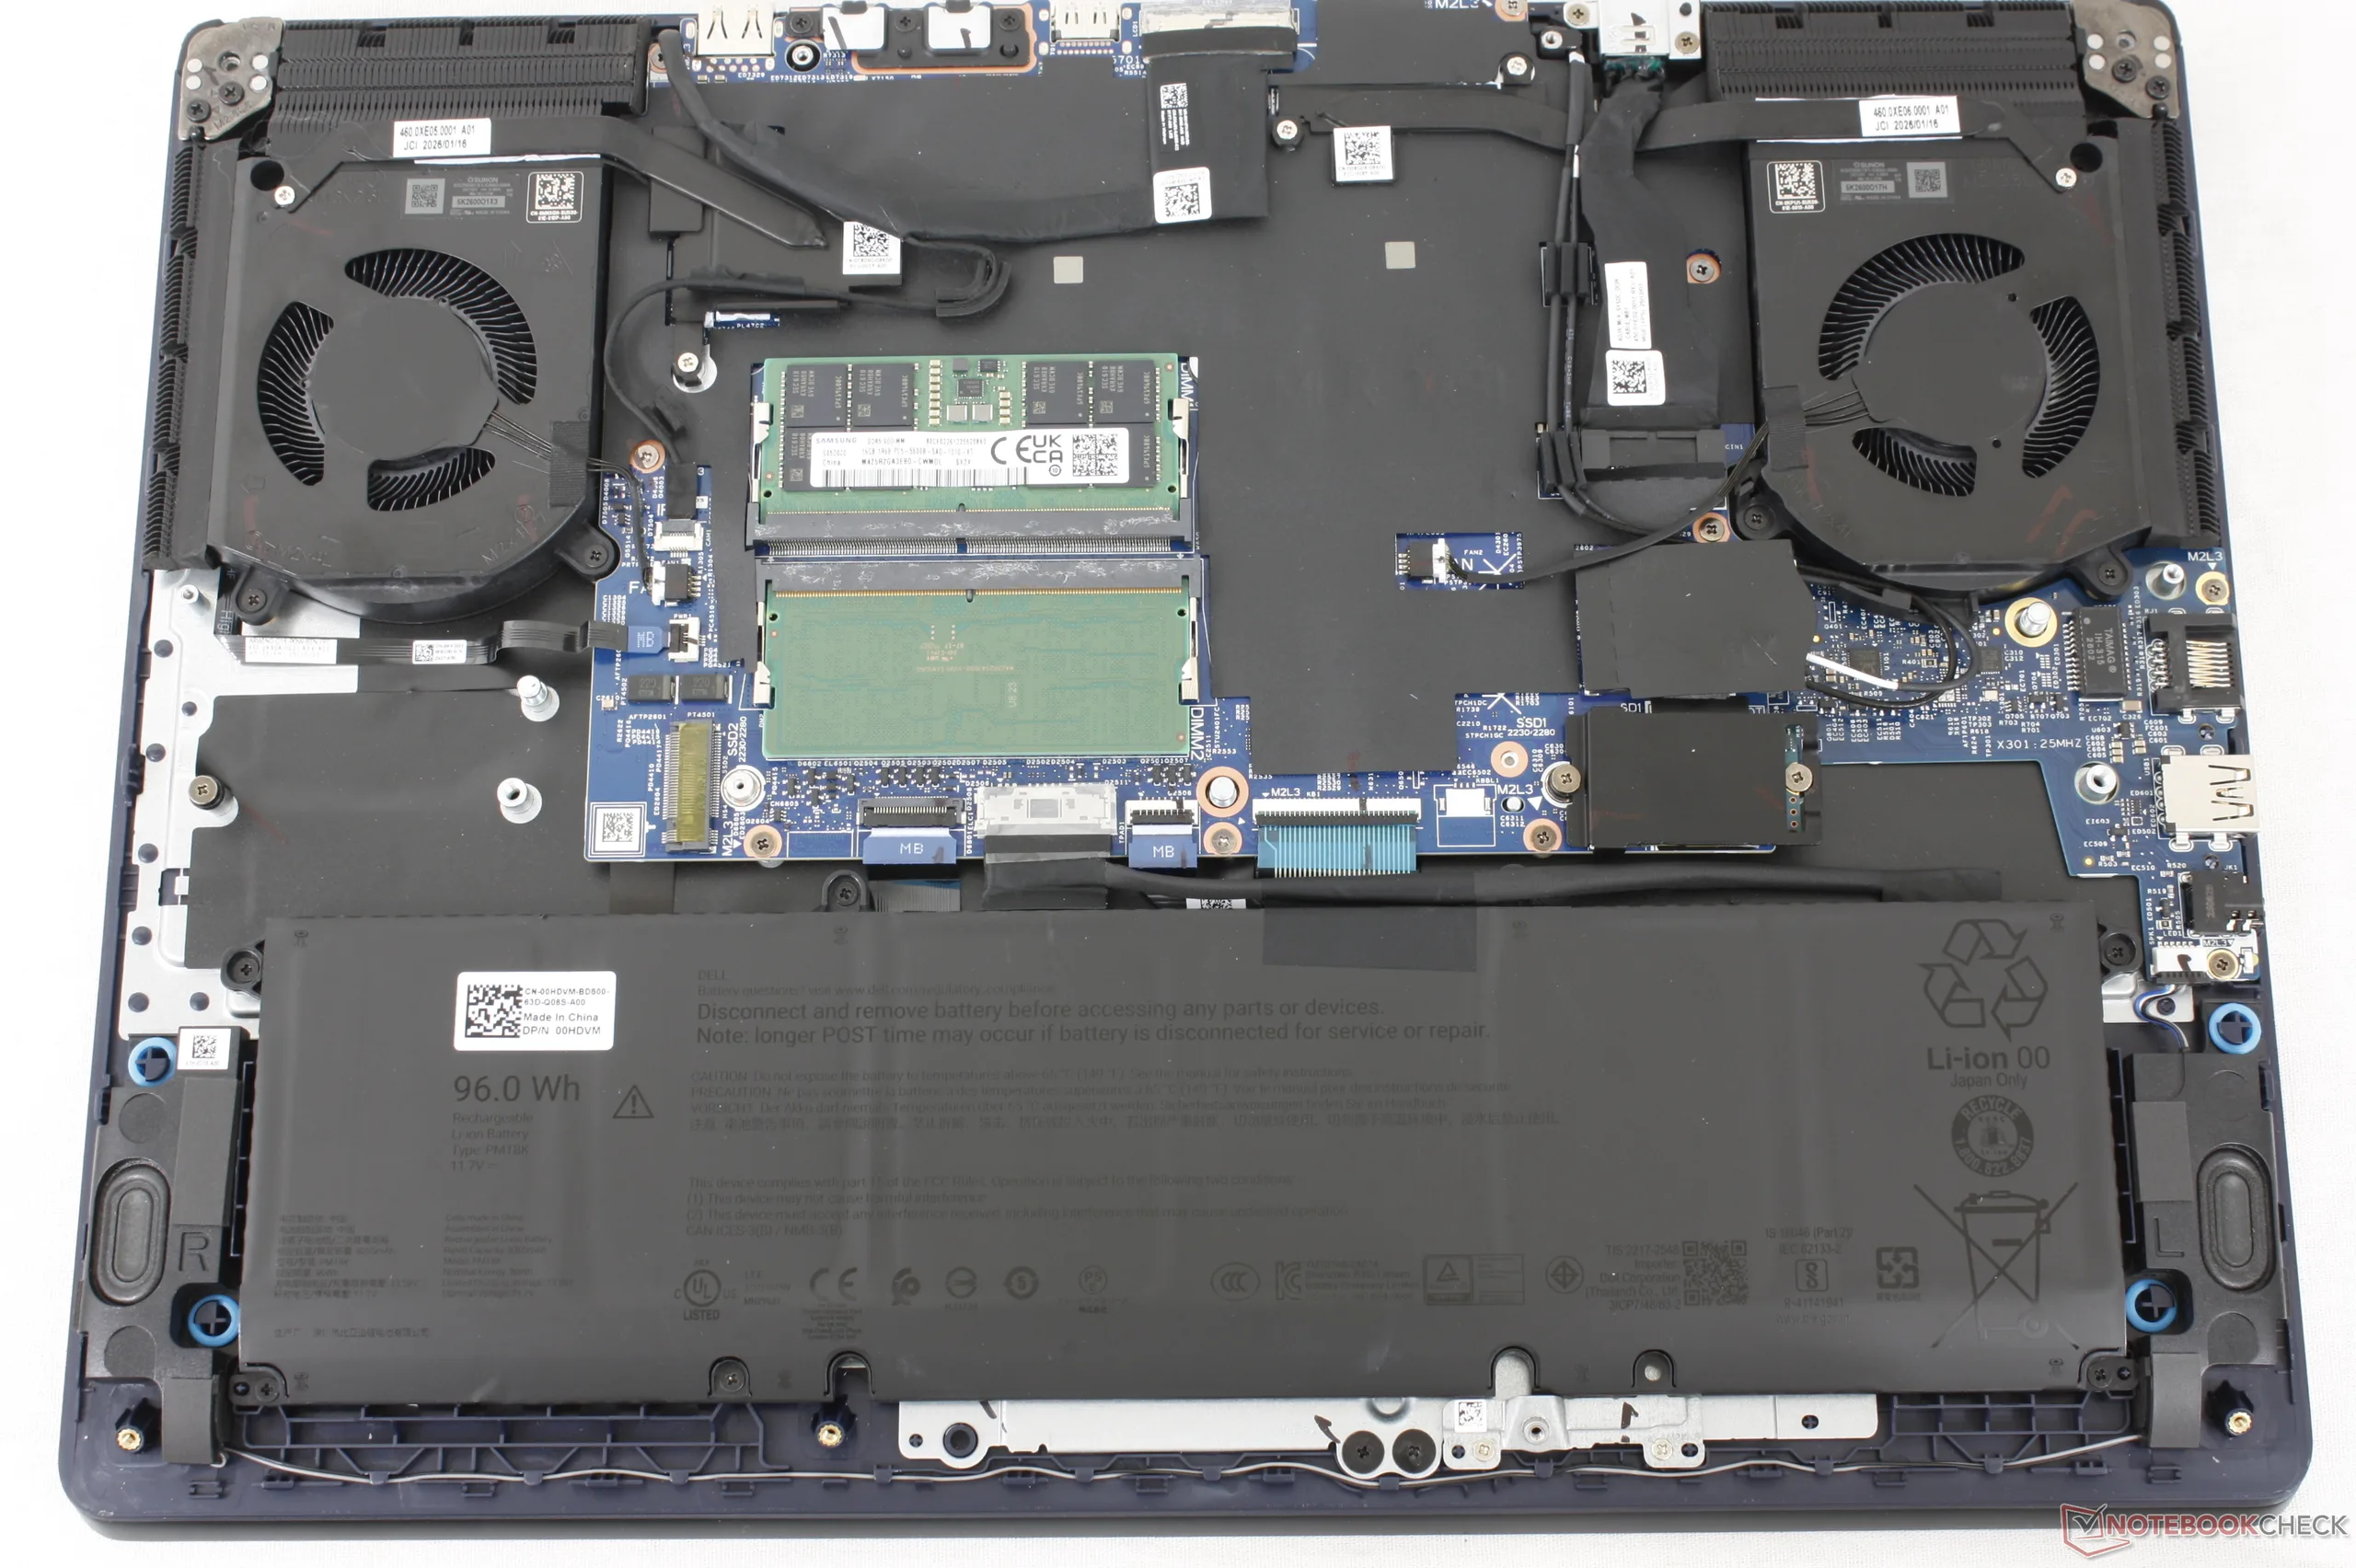
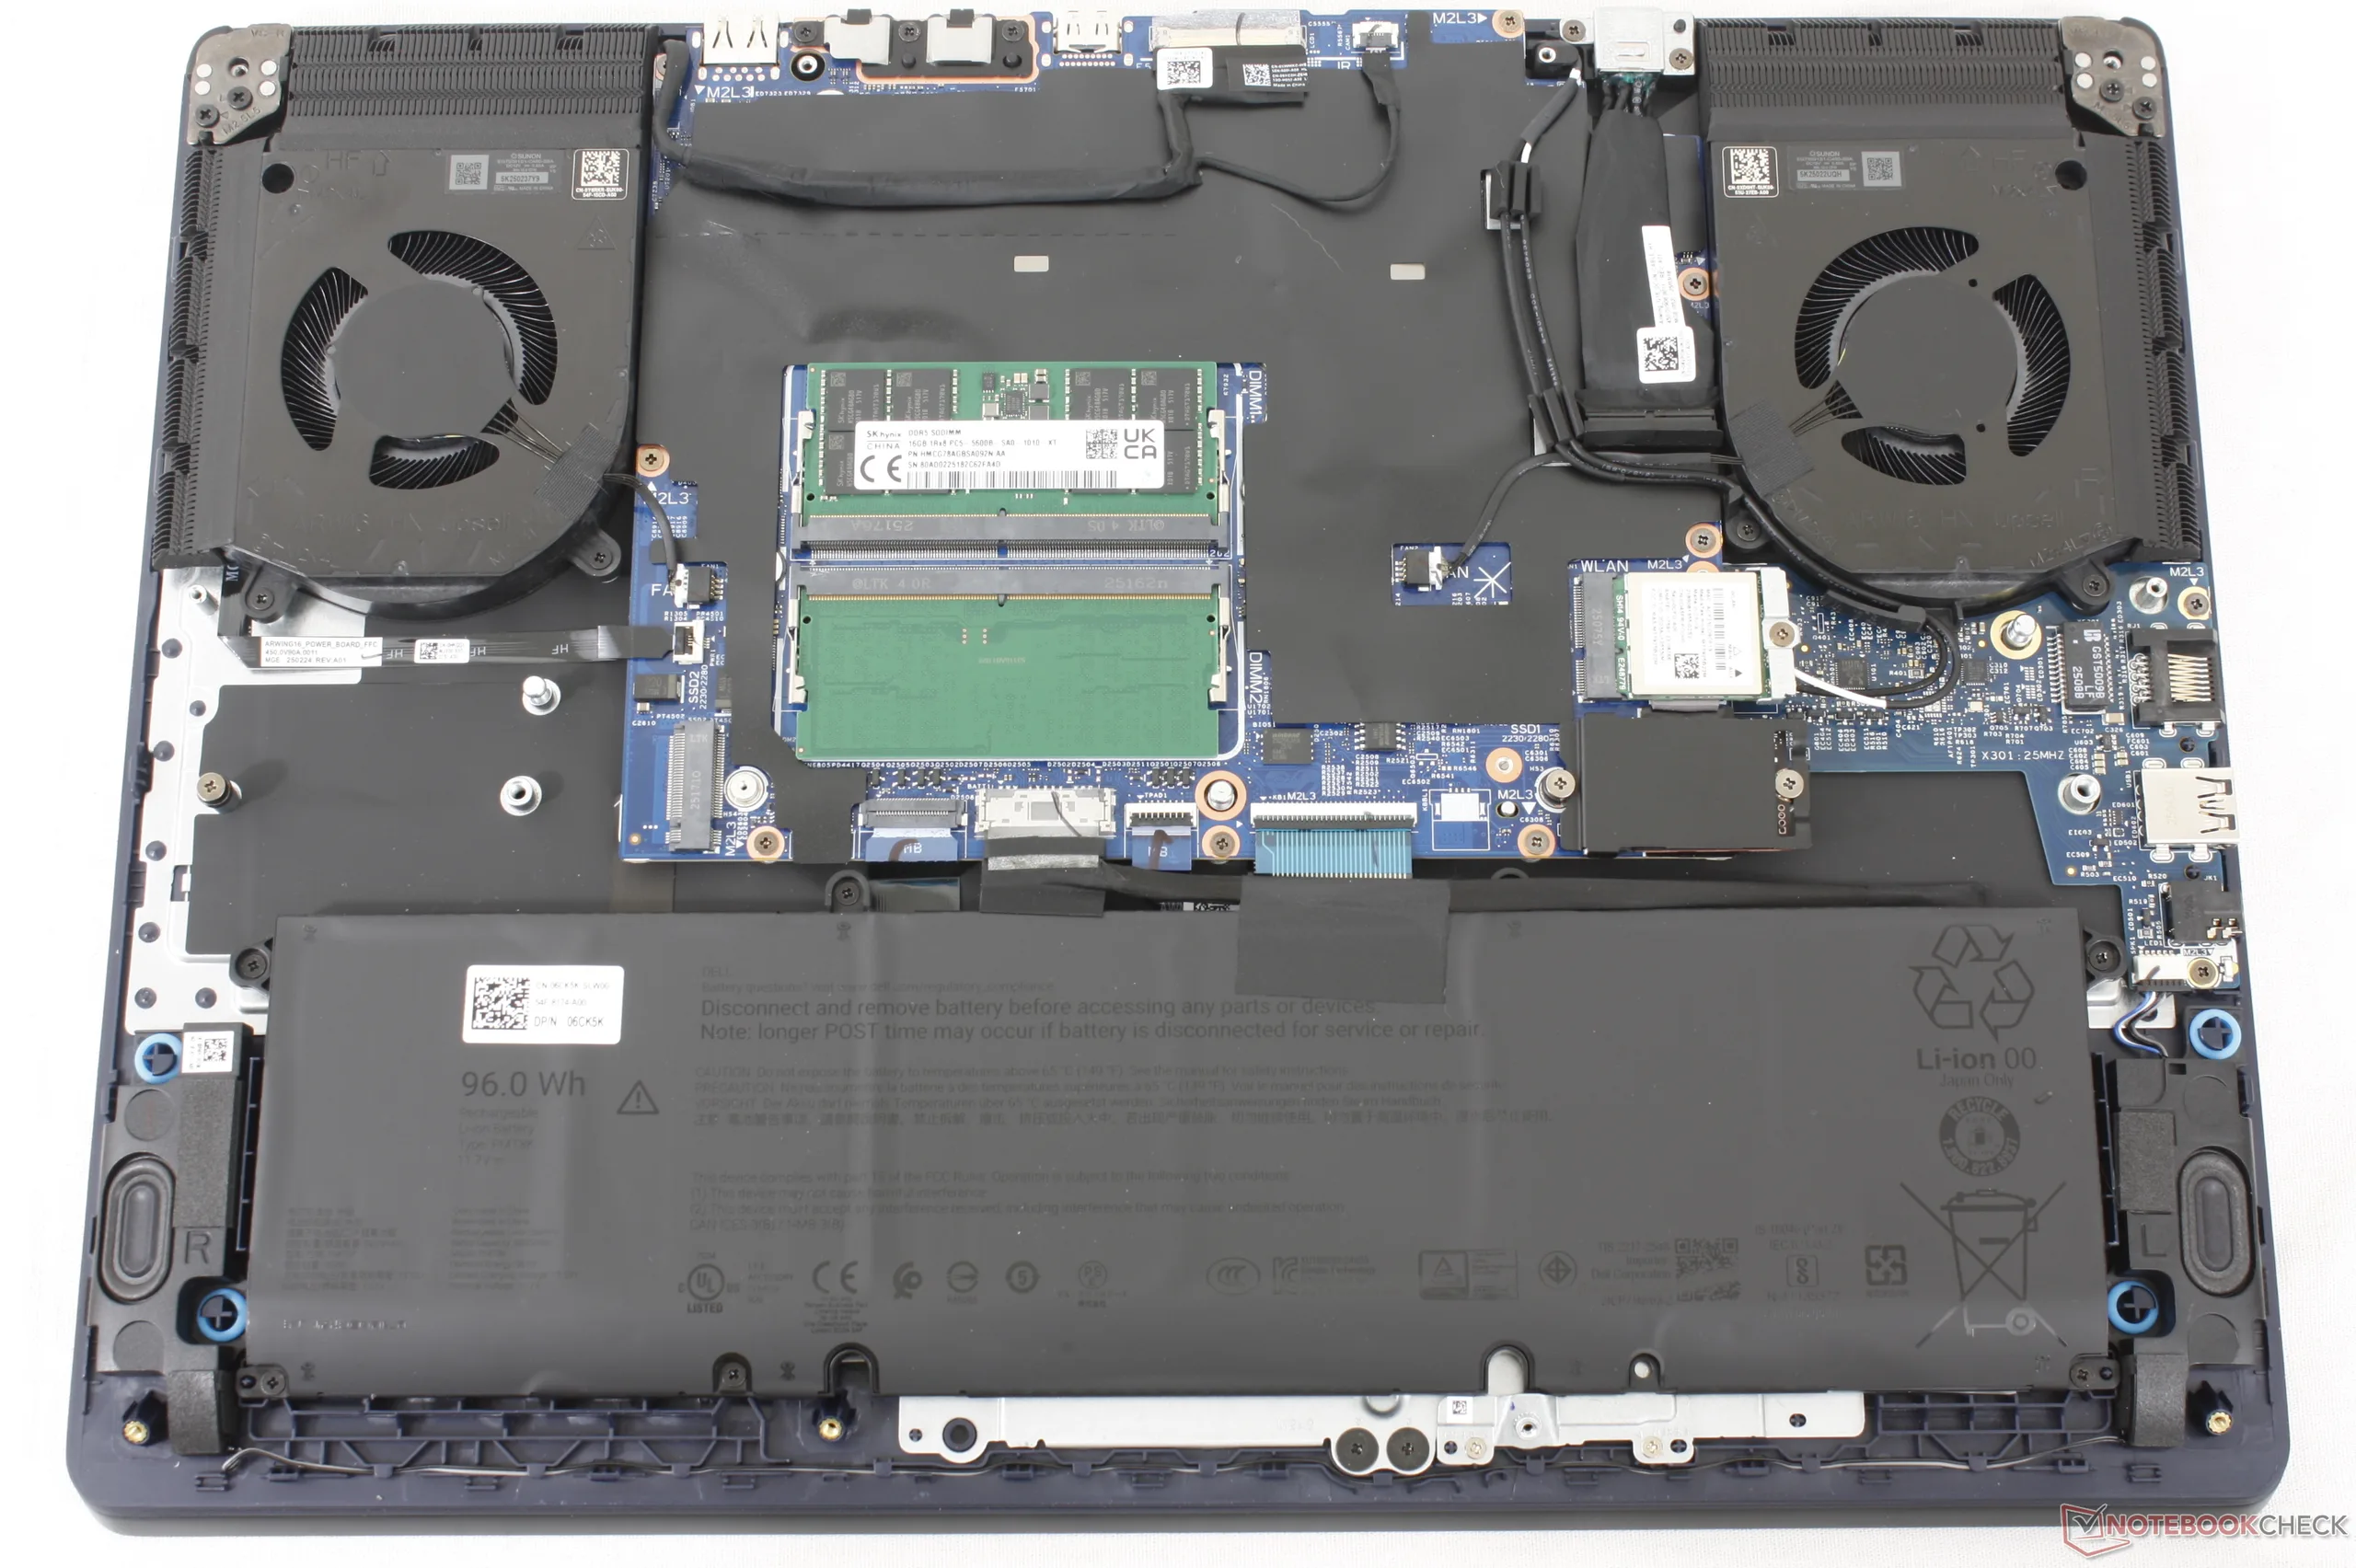
Manutenzione
Dispositivi di ingresso
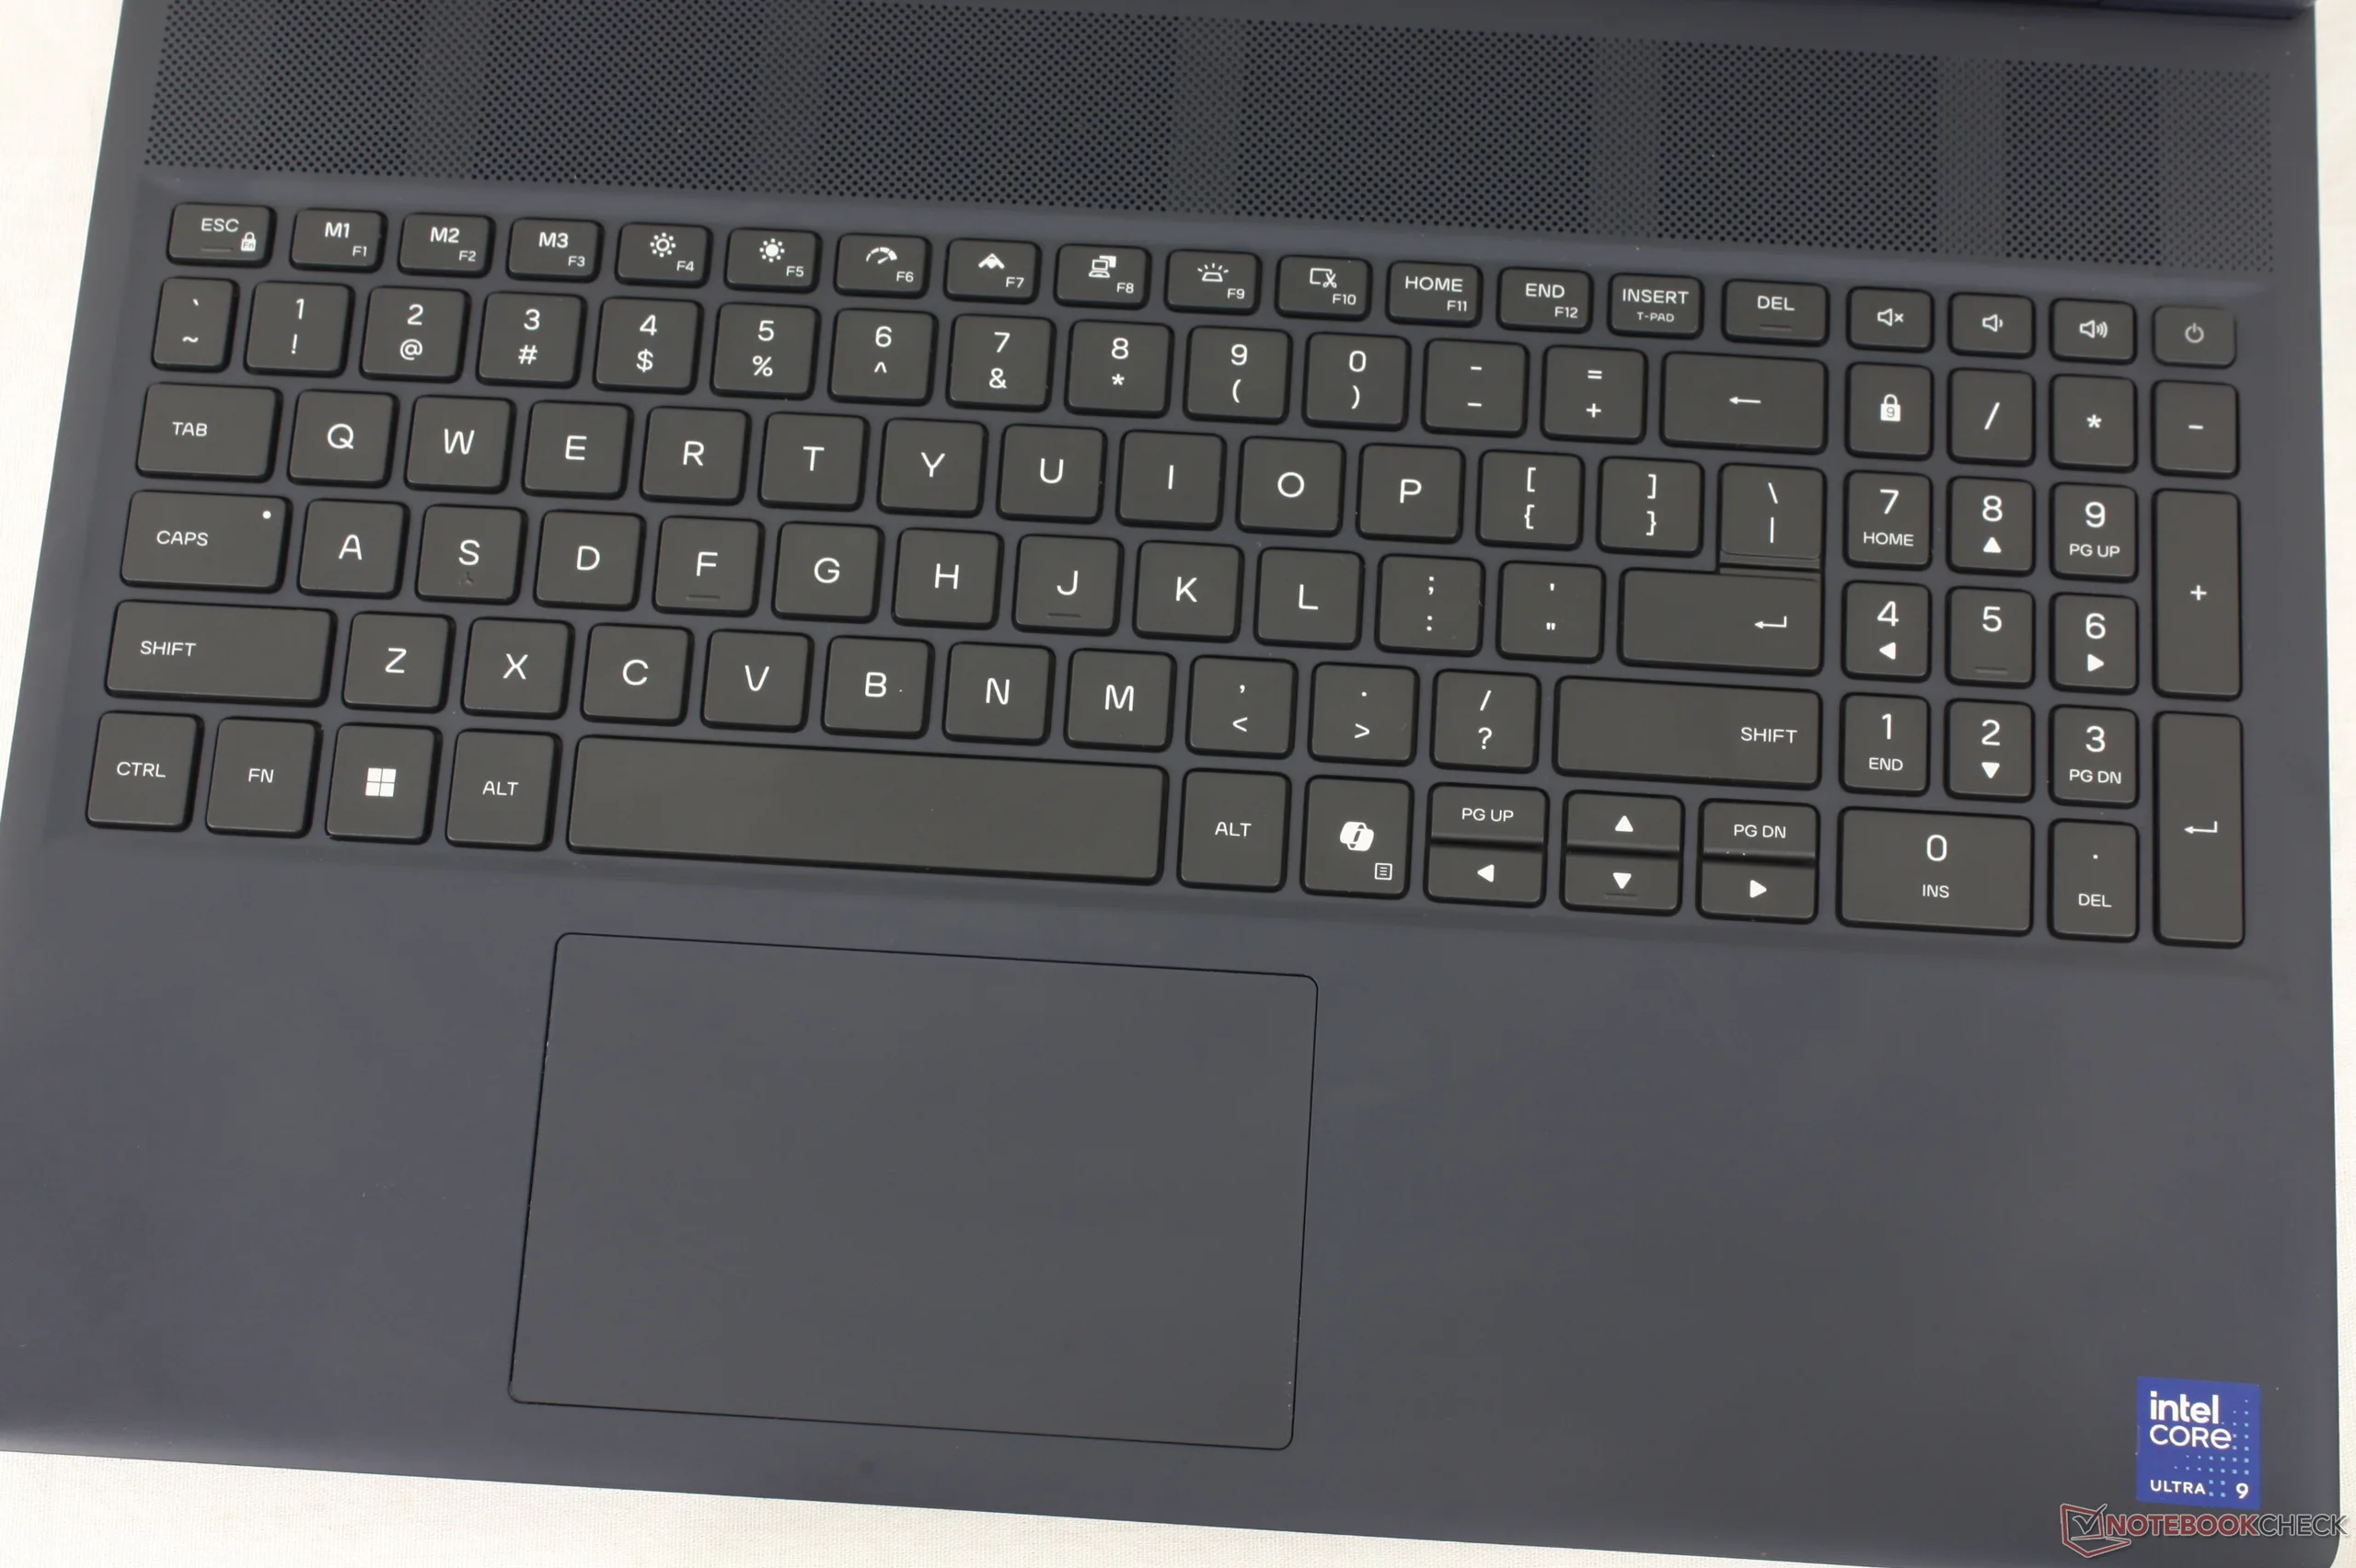
Display

La novità di quest'anno della serie Aurora 16X è il pannello OLED opaco che offre la stessa frequenza di aggiornamento nativa di 240 Hz, la risoluzione di 2560 x 1600 e il supporto G-Sync dell'opzione IPS esistente, ma con tutti i vantaggi dell'OLED, tra cui tempi di risposta più rapidi, livelli di nero più profondi e supporto HDR adeguato.
Uno svantaggio notevole del pannello OLED è che è più debole del pannello IPS di circa 100 nits in modalità SDR, come mostra la nostra tabella di confronto qui sotto. La luminosità massima raggiungerebbe 390 nits in modalità SDR o fino a 621 nits in modalità HDR, che corrisponde all'annuncio del produttore di 620 nits.
Purtroppo, il pannello OLED opaco presenta ancora un livello di granulosità simile a quello che abbiamo notato sul pannello IPS dello scorso anno. Sebbene non sia particolarmente fastidioso, non è certamente nitido o pulito come il pannello OLED lucido del nuovo XPS 16 XPS 16.
| |||||||||||||||||||||||||
Distribuzione della luminosità: 98 %
Al centro con la batteria: 380.5 cd/m²
Contrasto: ∞:1 (Nero: 0 cd/m²)
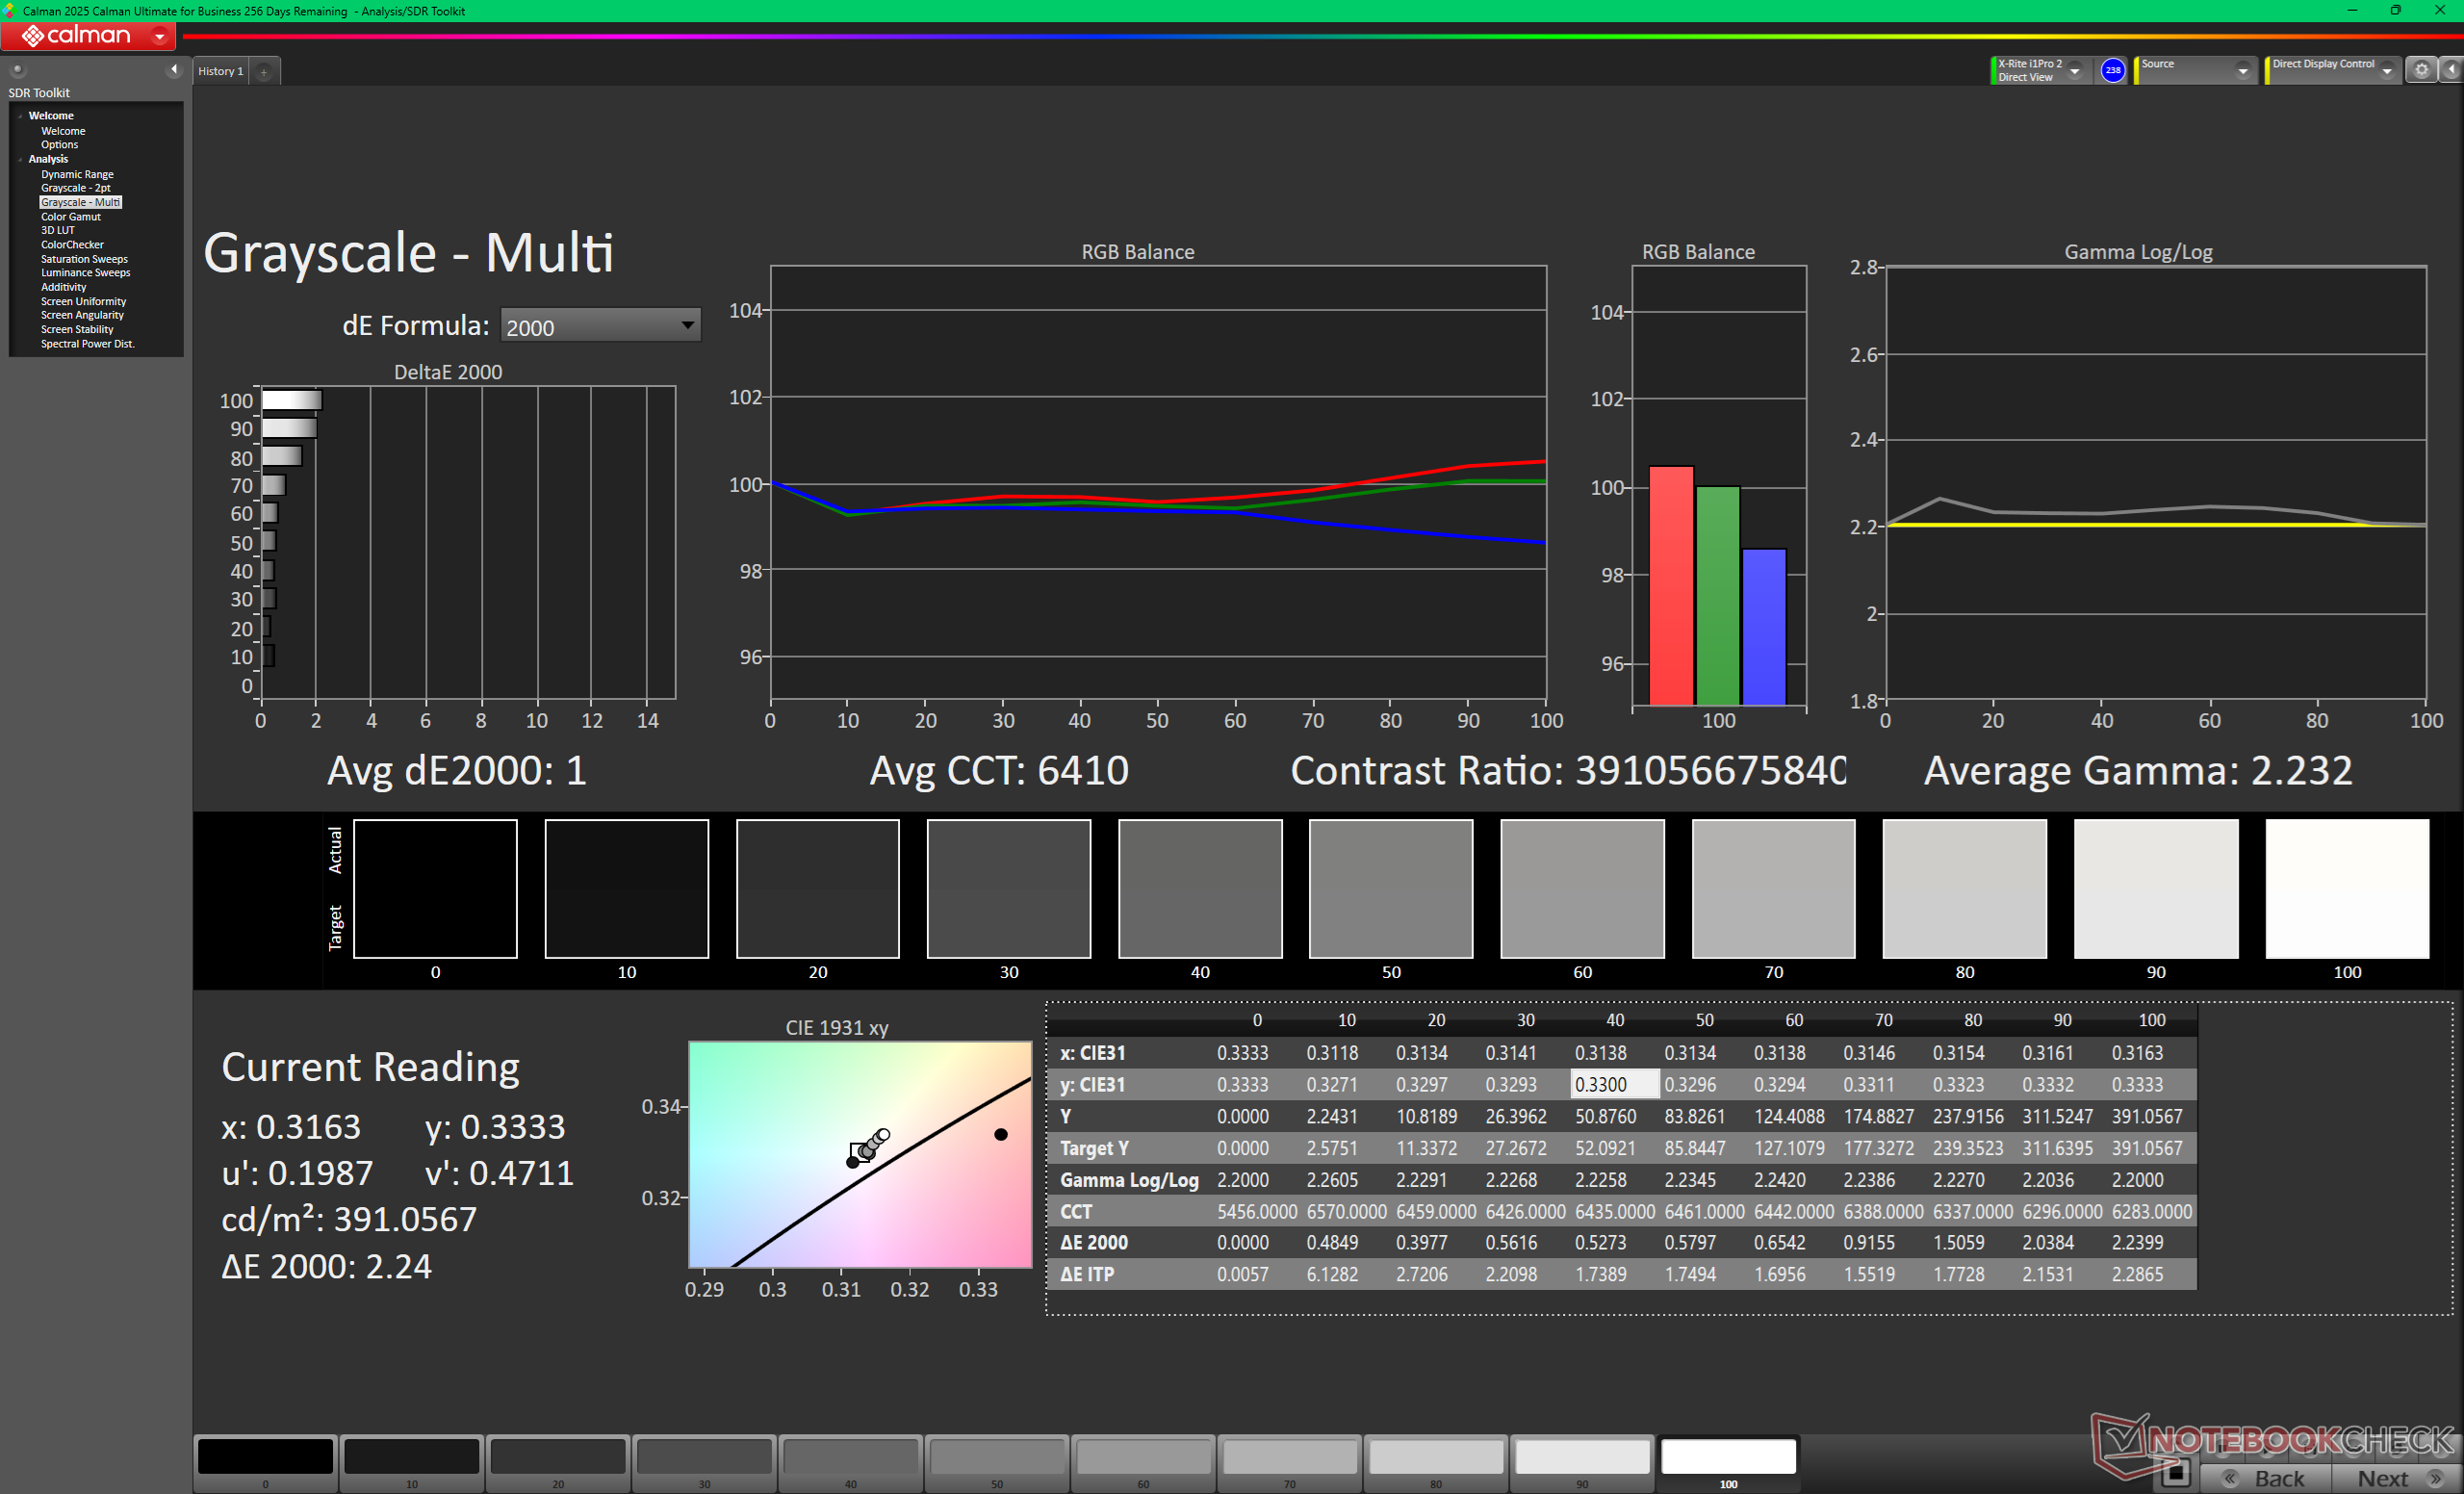
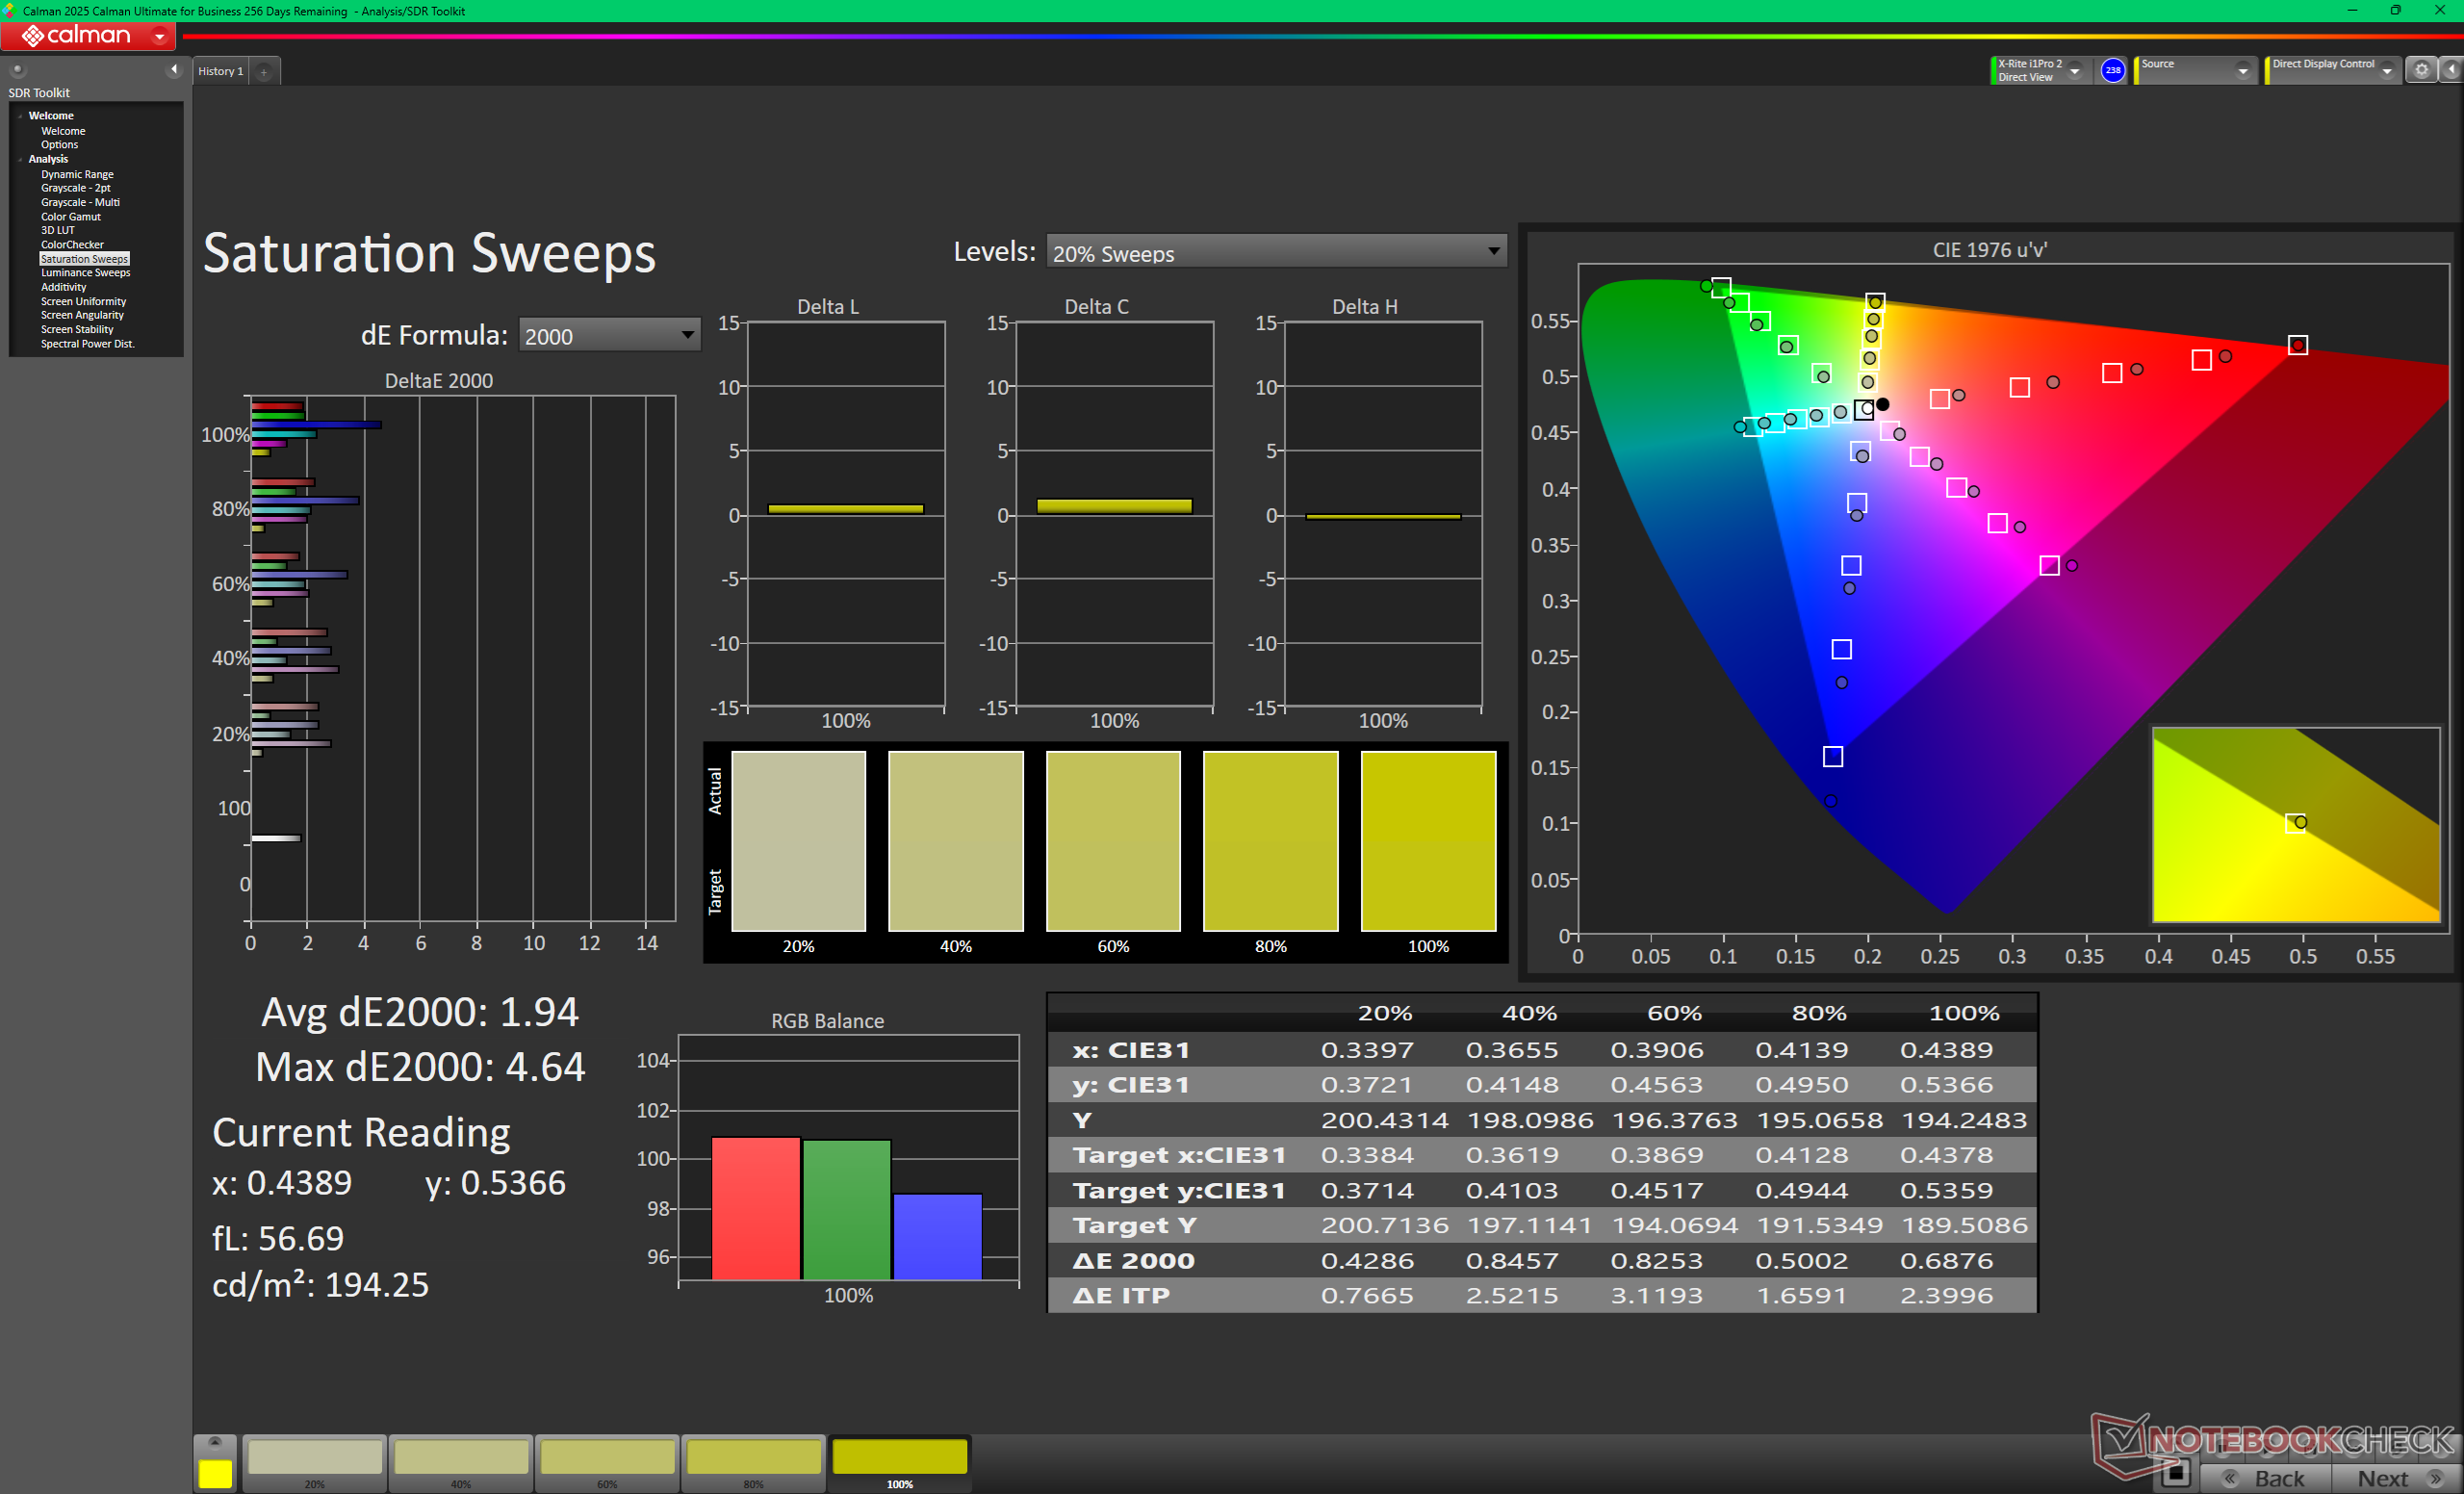
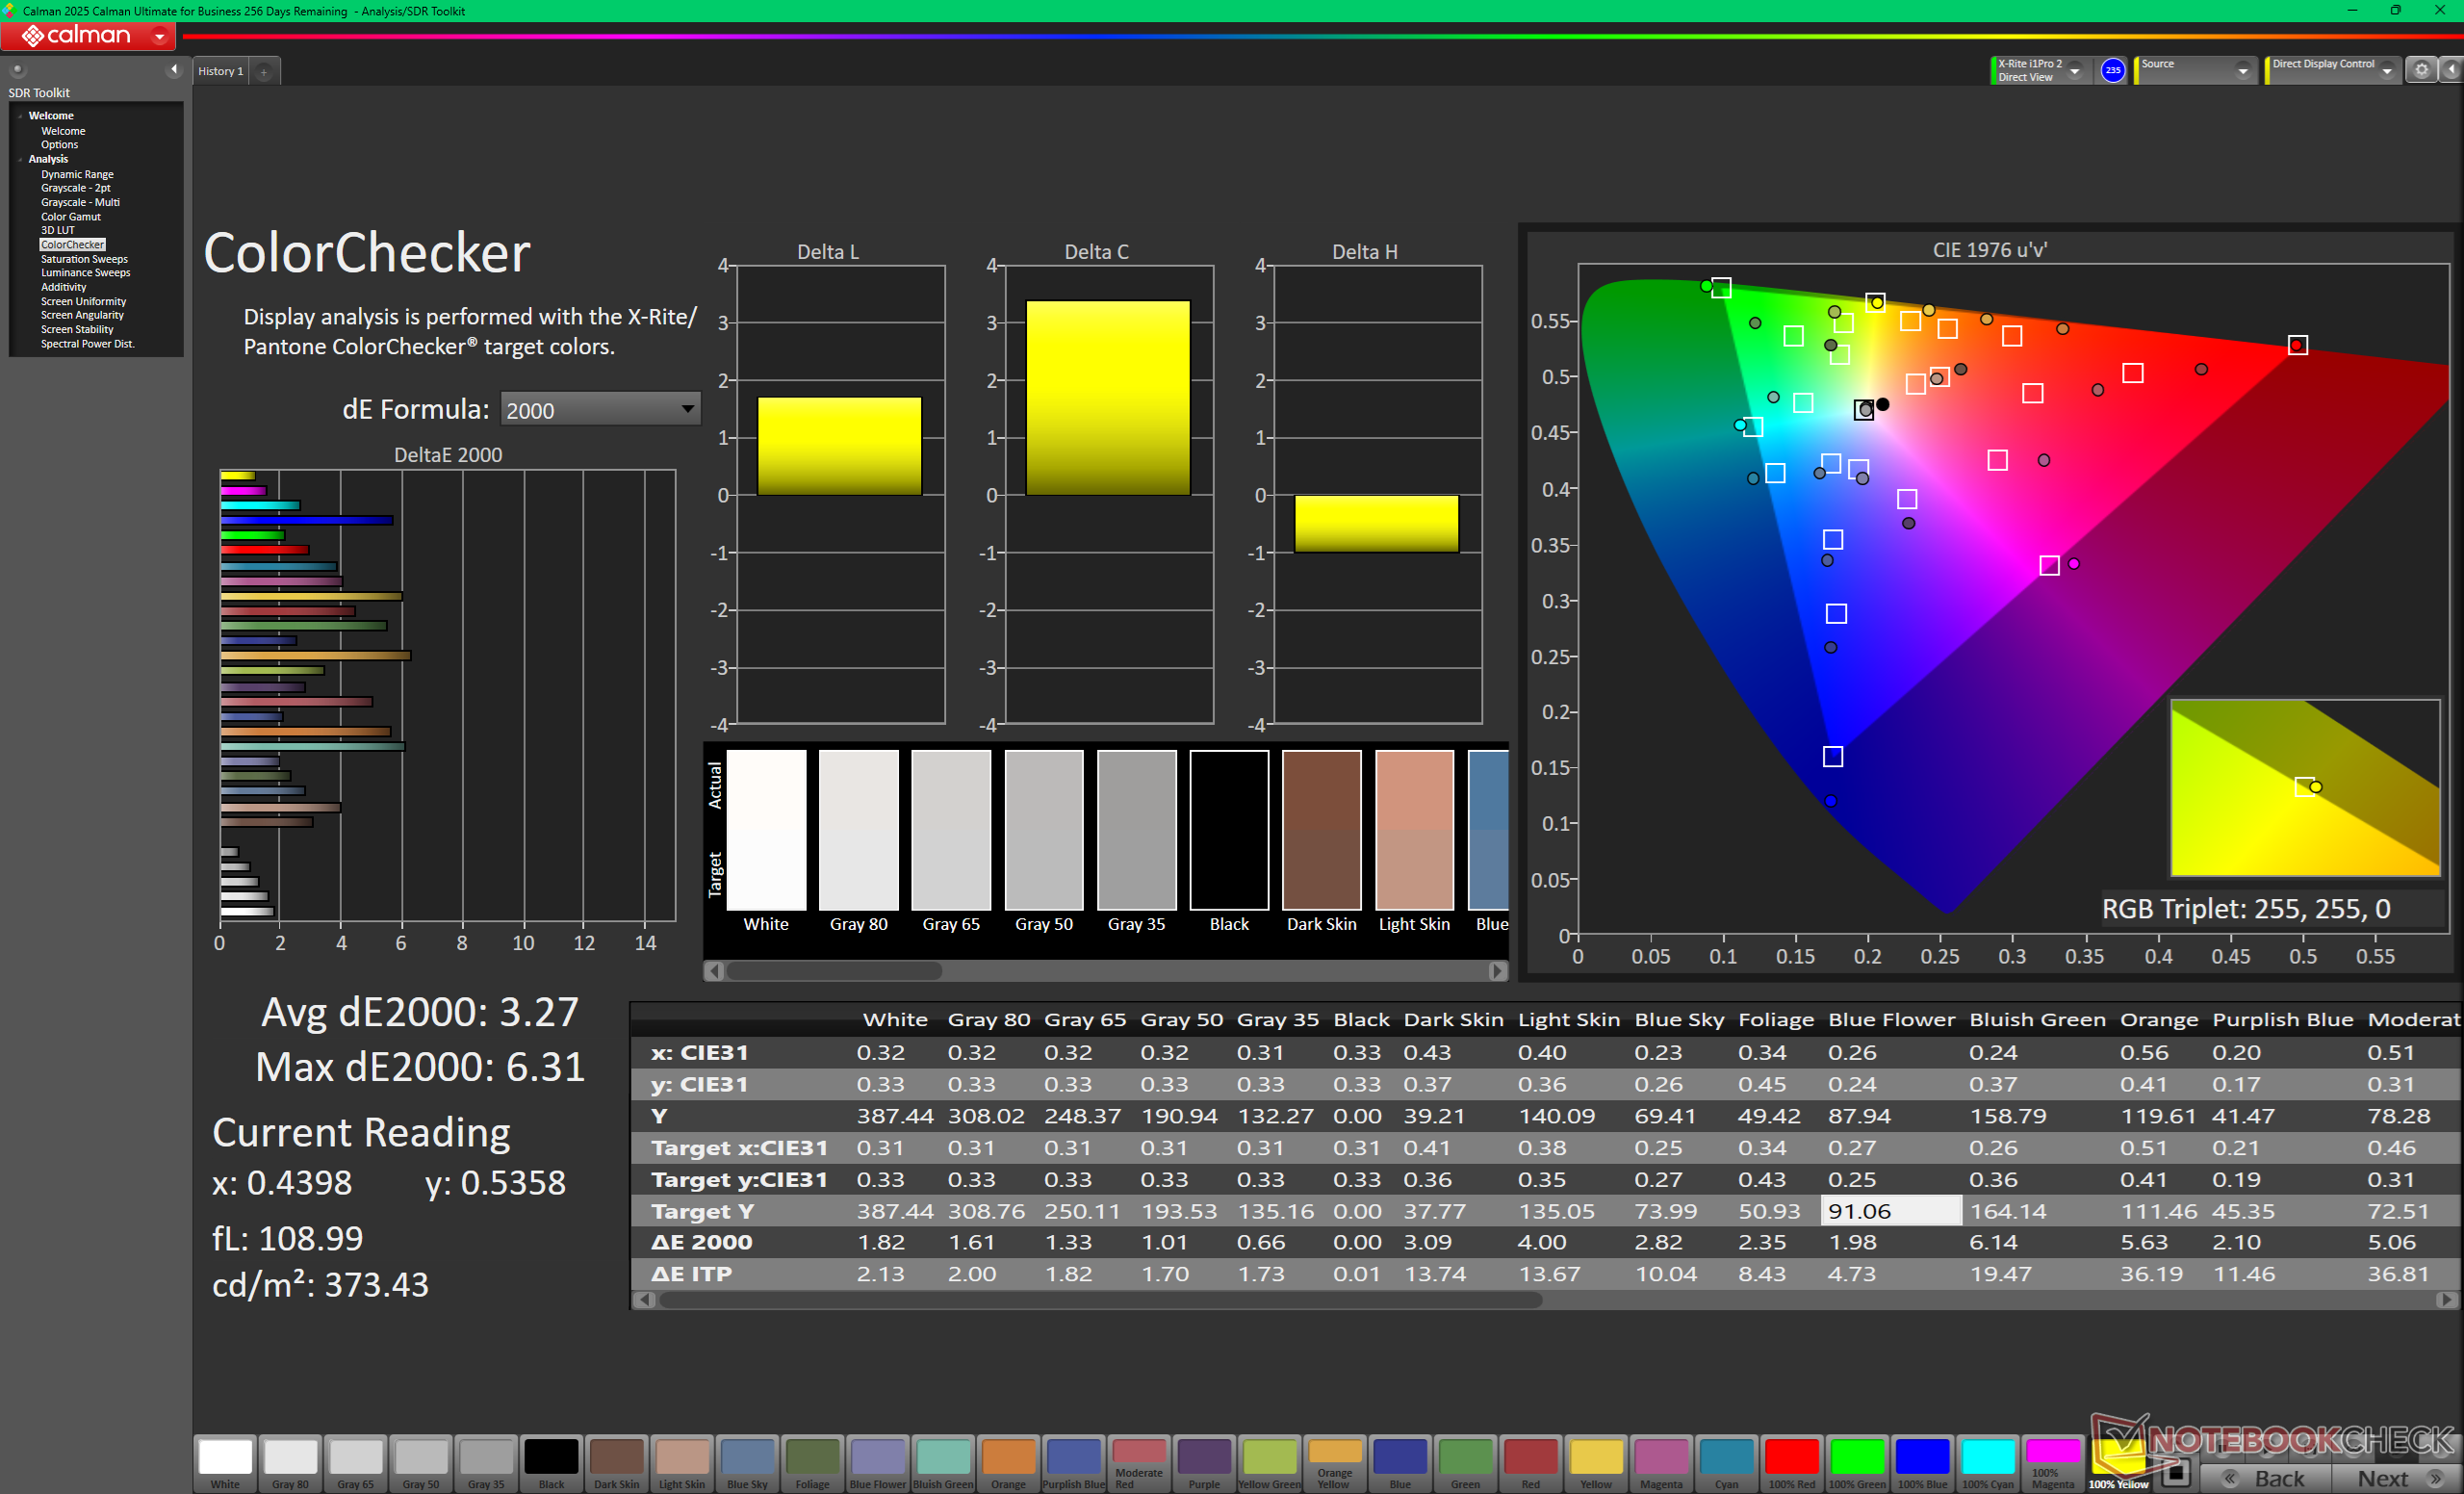
ΔE ColorChecker Calman: 3.27 | ∀{0.5-29.43 Ø4.72}
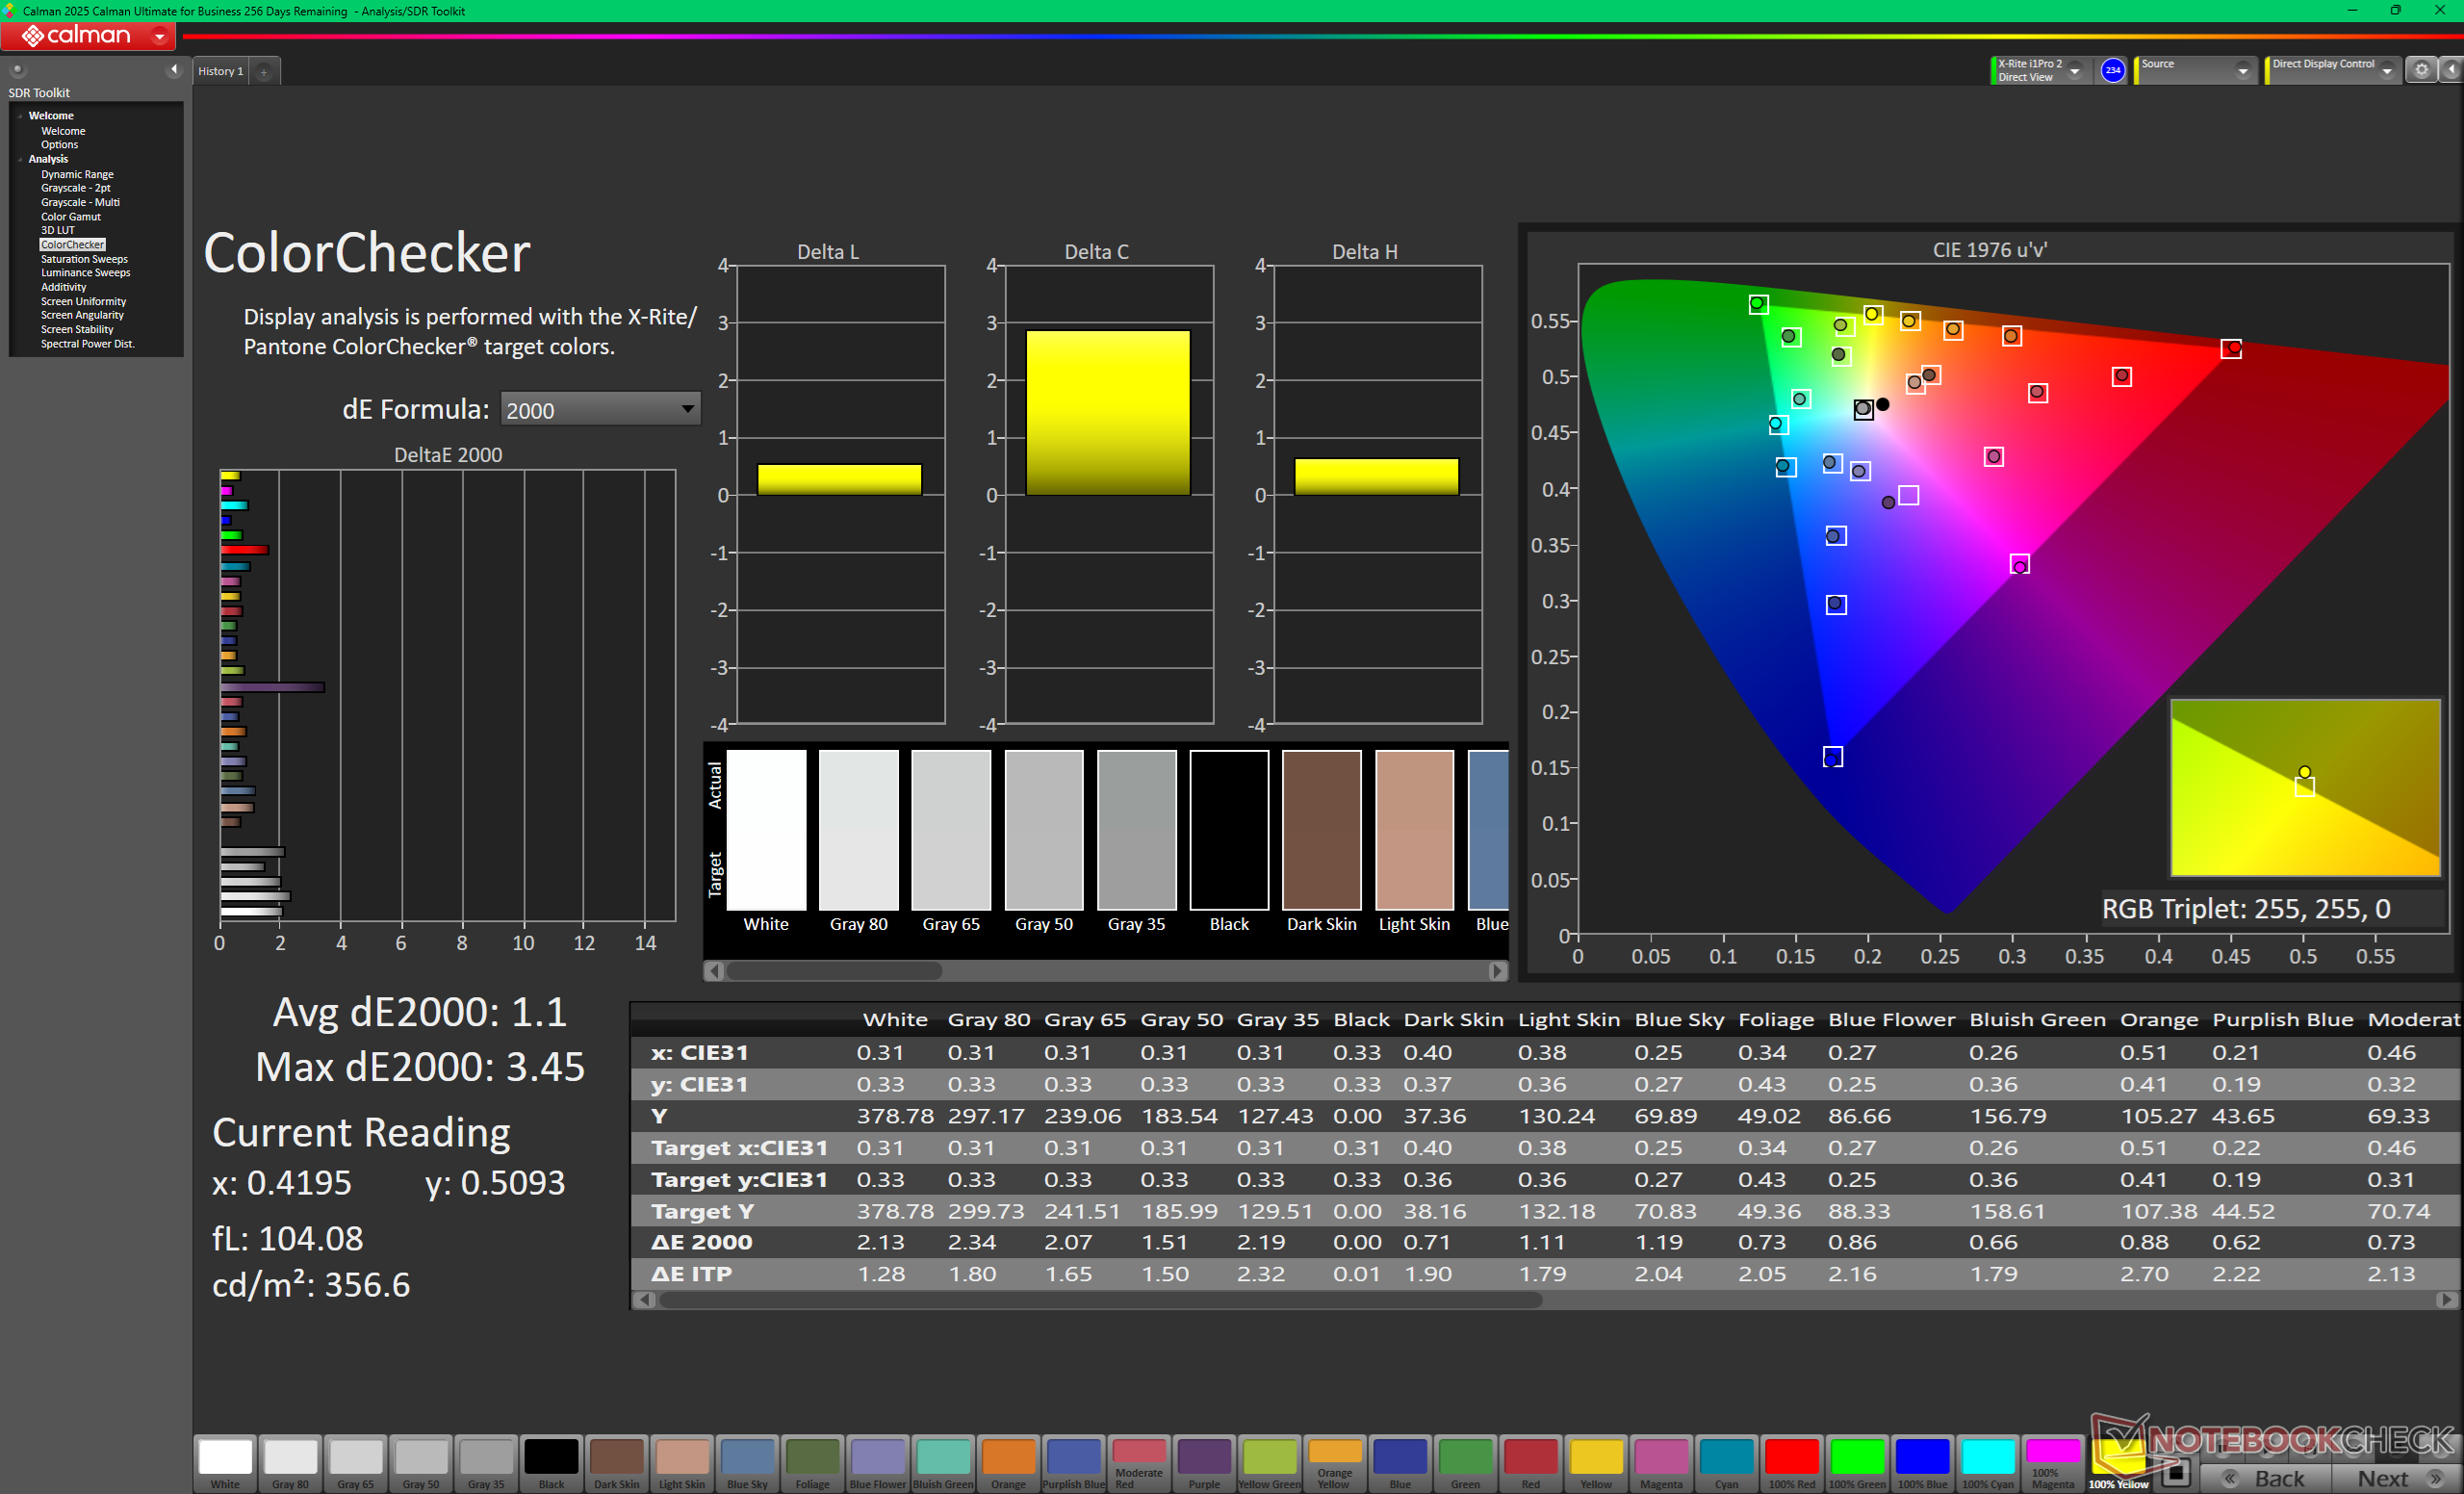
calibrated: 1.1
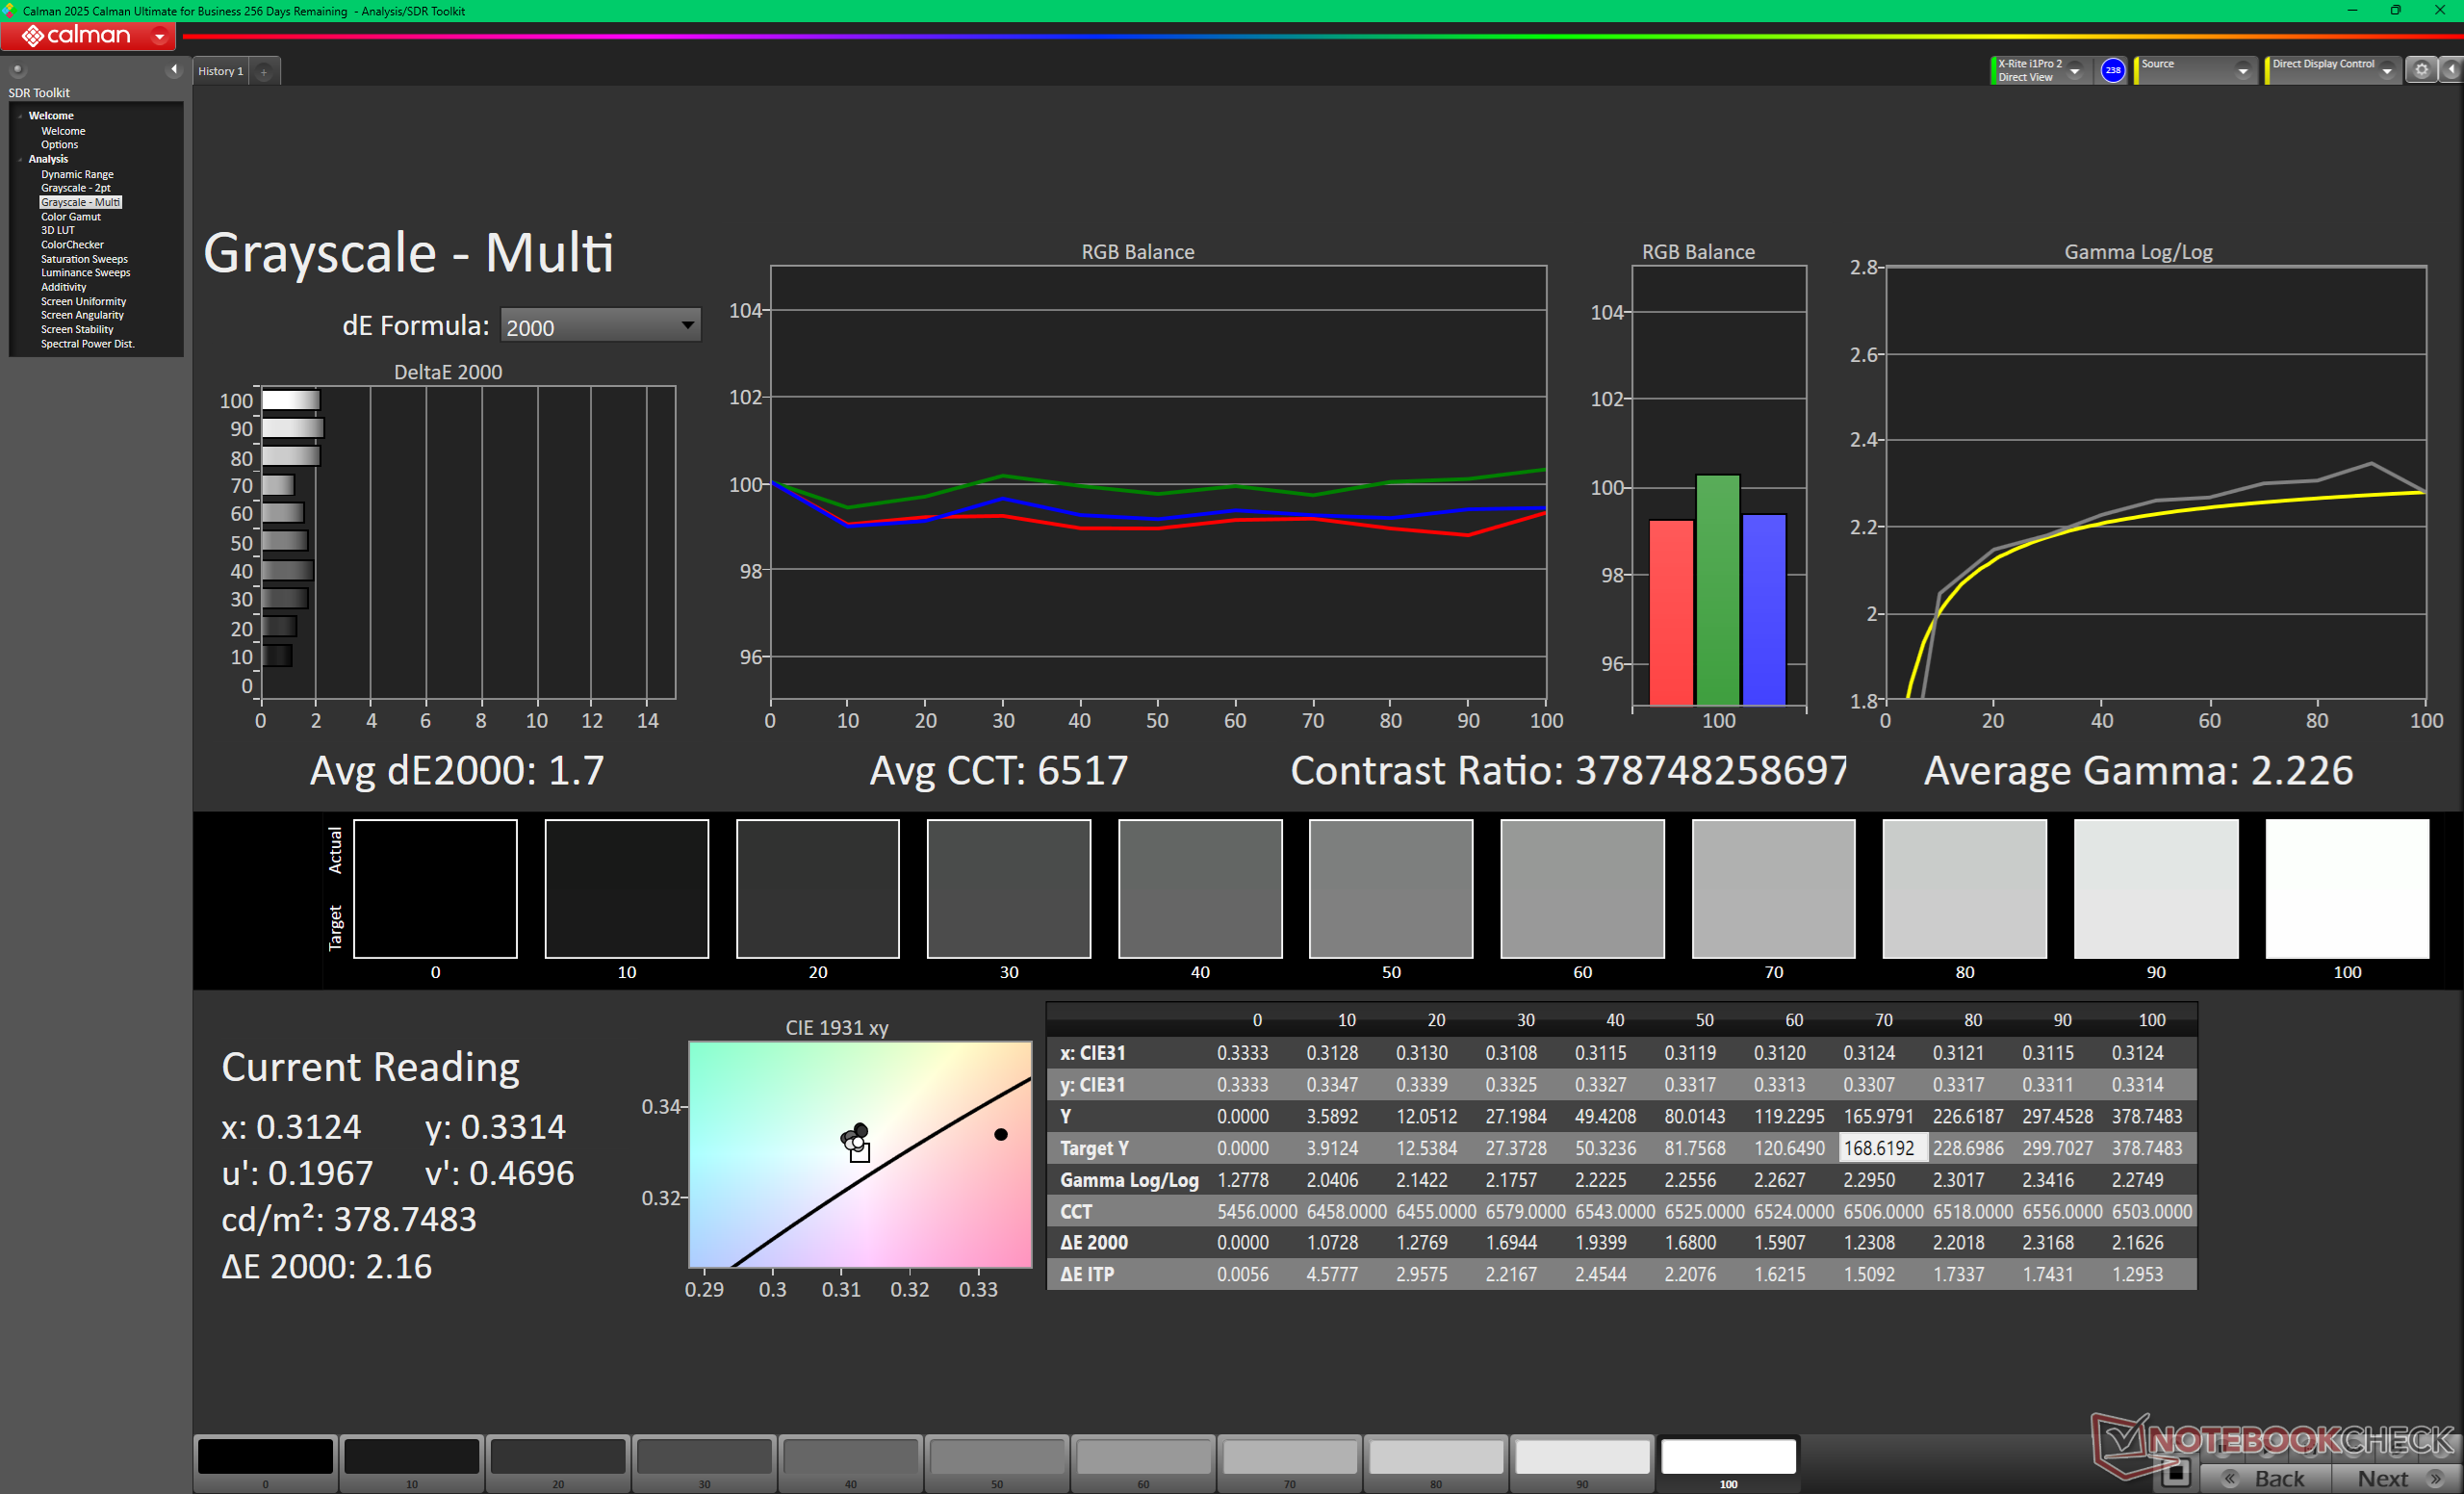
ΔE Greyscale Calman: 1 | ∀{0.09-98 Ø4.97}
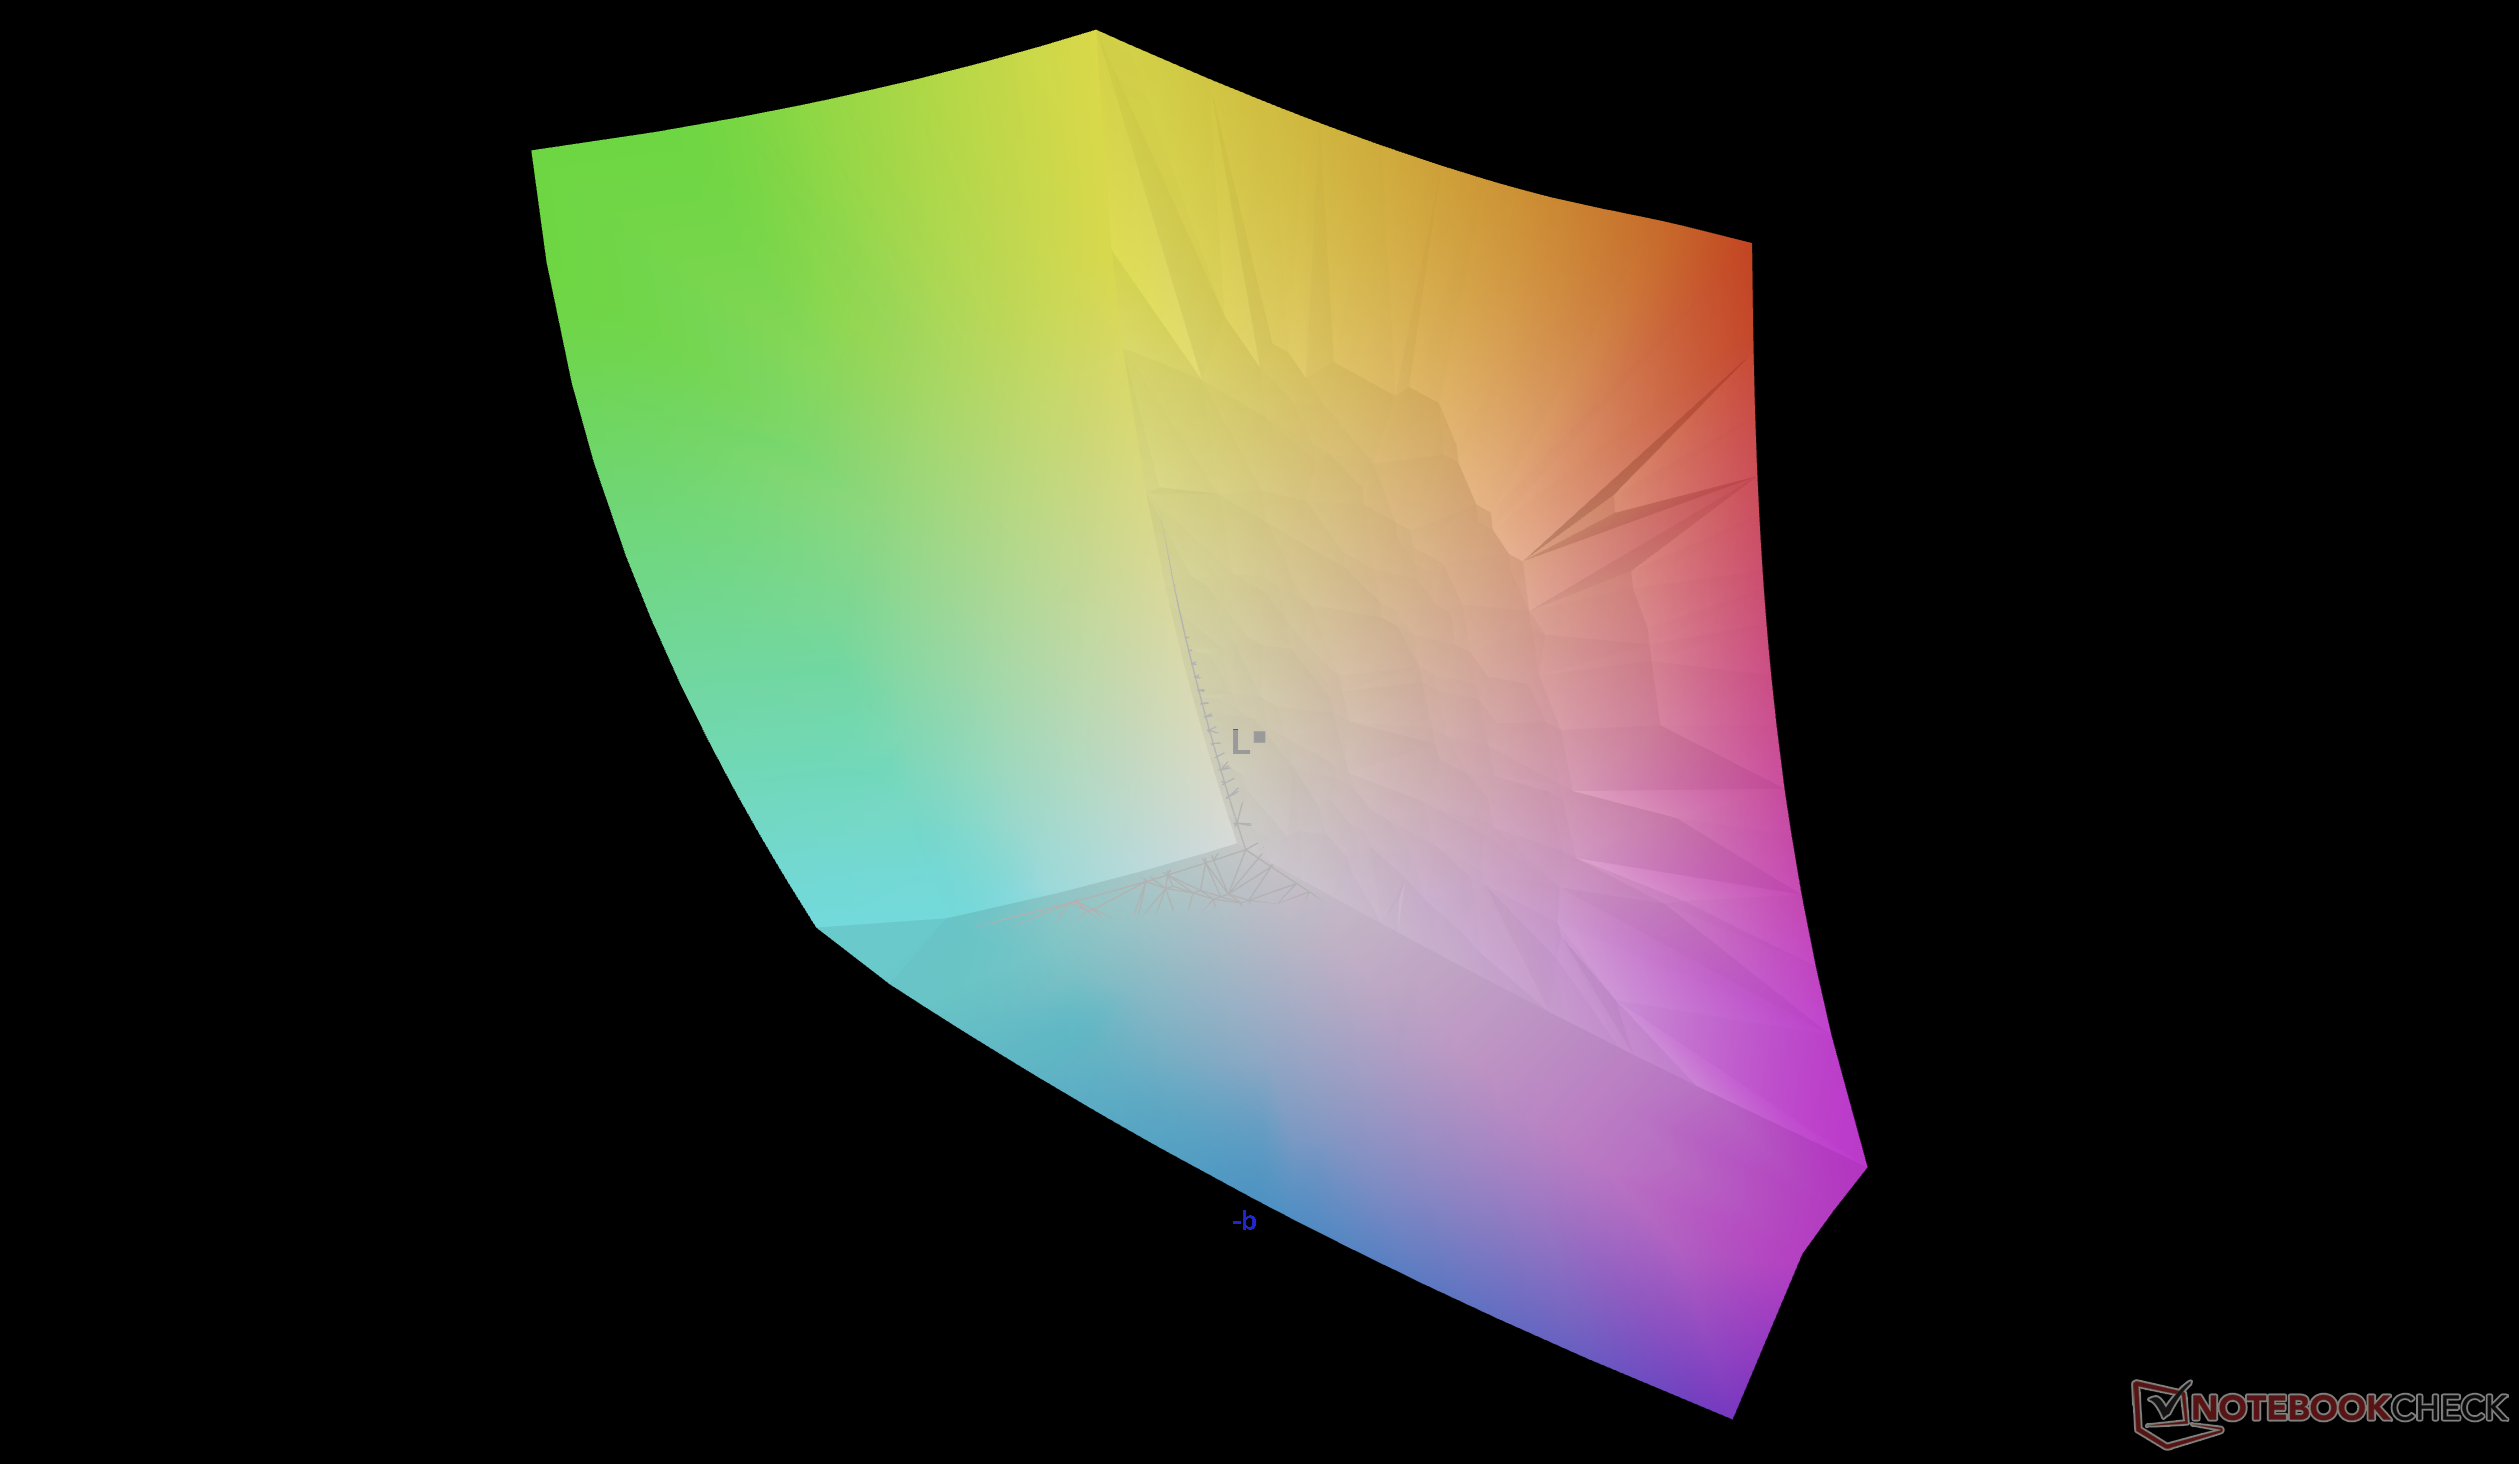
93.9% AdobeRGB 1998 (Argyll 3D)
100% sRGB (Argyll 3D)
99.6% Display P3 (Argyll 3D)
Gamma: 2.23
CCT: 6410 K
| Alienware 16X Aurora Core Ultra 9 290HX Plus Samsung 160HU05, OLED, 2560x1600, 16", 240 Hz | Alienware 16X Aurora, RTX 5070 LG Philips 160WQG, IPS, 2560x1600, 16", 240 Hz | Acer Predator Helios Neo 16S AI PHN16S-71-94L9 Samsung ATNA60DL03-0, OLED, 2560x1600, 16", 240 Hz | Lenovo Legion Pro 5 16IAX10, RTX 5070 ATNA60HS01-0 (Samsung SDC420A), OLED, 2650x1600, 16", 165 Hz | MSI Vector 16 HX AI A2XWHG B160QAN02.3 (AUO7DB2), IPS, 2560x1600, 16", 240 Hz | Asus ROG Zephyrus G16 GU605CW Samsung ATNA60DL01-0, OLED, 2560x1600, 16", 240 Hz | |
|---|---|---|---|---|---|---|
| Display | -2% | 1% | 0% | -4% | -1% | |
| APL18 Peak Brightness (cd/m²) | 609 | |||||
| HDR Peak Brightness (cd/m²) | 609 | |||||
| Display P3 Coverage (%) | 99.6 | 96.9 -3% | 99.9 0% | 99.3 0% | 96.6 -3% | 96.5 -3% |
| sRGB Coverage (%) | 100 | 99.8 0% | 100 0% | 100 0% | 99.8 0% | 99.2 -1% |
| AdobeRGB 1998 Coverage (%) | 93.9 | 89.7 -4% | 96.5 3% | 93.9 0% | 84.4 -10% | 94.5 1% |
| Response Times | -1608% | 1% | -253% | -1308% | -404% | |
| Response Time Grey 50% / Grey 80% * (ms) | 0.29 ? | 4.3 ? -1383% | 0.2 ? 31% | 2 ? -590% | 4.3 ? -1383% | 0.32 ? -10% |
| Response Time Black / White * (ms) | 0.45 ? | 8.7 ? -1833% | 0.25 ? 44% | 1.4 ? -211% | 6 ? -1233% | 6 ? -1233% |
| PWM Frequency (Hz) | 1439.8 ? | 960 | 1300 | 960 | ||
| PWM Amplitude * (%) | 29 | 50 -72% | 16.7 42% | 20 31% | ||
| Screen | -29% | 5% | -32% | -33% | -14% | |
| Brightness middle (cd/m²) | 380.5 | 493.2 30% | 390 2% | 521 37% | 473 24% | 394 4% |
| Brightness (cd/m²) | 384 | 477 24% | 394 3% | 519 35% | 426 11% | 398 4% |
| Brightness Distribution (%) | 98 | 93 -5% | 98 0% | 98 0% | 85 -13% | 98 0% |
| Black Level * (cd/m²) | 0.5 | 0.04 | 0.075 | 0.42 | 0.0084 | |
| Colorchecker dE 2000 * | 3.27 | 3.57 -9% | 1.61 51% | 2.5 24% | 3.47 -6% | 2.41 26% |
| Colorchecker dE 2000 max. * | 6.31 | 7.03 -11% | 3.49 45% | 4.85 23% | 7.24 -15% | 3.82 39% |
| Colorchecker dE 2000 calibrated * | 1.1 | 0.68 38% | 1.59 -45% | 2.5 -127% | 1.36 -24% | 1.41 -28% |
| Greyscale dE 2000 * | 1 | 3.7 -270% | 1.2 -20% | 3.17 -217% | 3.1 -210% | 2.4 -140% |
| Gamma | 2.23 99% | 2.16 102% | 2.235 98% | 2.35 94% | 2.486 88% | 2.16 102% |
| CCT | 6410 101% | 5876 111% | 6580 99% | 6454 101% | 6832 95% | 6544 99% |
| Contrast (:1) | 986 | 9750 | 6947 | 1126 | 46905 | |
| Media totale (Programma / Settaggio) | -546% /
-286% | 2% /
3% | -95% /
-76% | -448% /
-239% | -140% /
-101% |
* ... Meglio usare valori piccoli


Tempi di risposta del Display
| ↔ Tempi di risposta dal Nero al Bianco | ||
|---|---|---|
| 0.45 ms ... aumenta ↗ e diminuisce ↘ combinato | ↗ 0.23 ms Incremento | 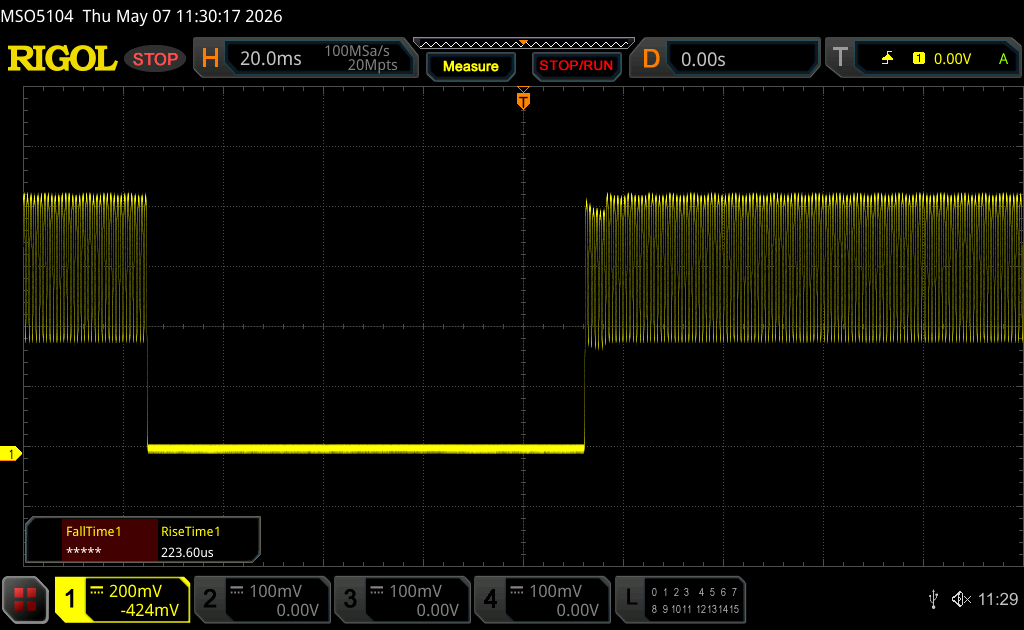 |
| ↘ 0.22 ms Calo | ||
| Lo schermo ha mostrato valori di risposta molto veloci nei nostri tests ed è molto adatto per i gaming veloce. In confronto, tutti i dispositivi di test variano da 0.1 (minimo) a 240 (massimo) ms. » 1 % di tutti i dispositivi è migliore. Questo significa che i tempi di risposta rilevati sono migliori rispettto alla media di tutti i dispositivi testati (19.8 ms). | ||
| ↔ Tempo di risposta dal 50% Grigio all'80% Grigio | ||
| 0.29 ms ... aumenta ↗ e diminuisce ↘ combinato | ↗ 0.15 ms Incremento | 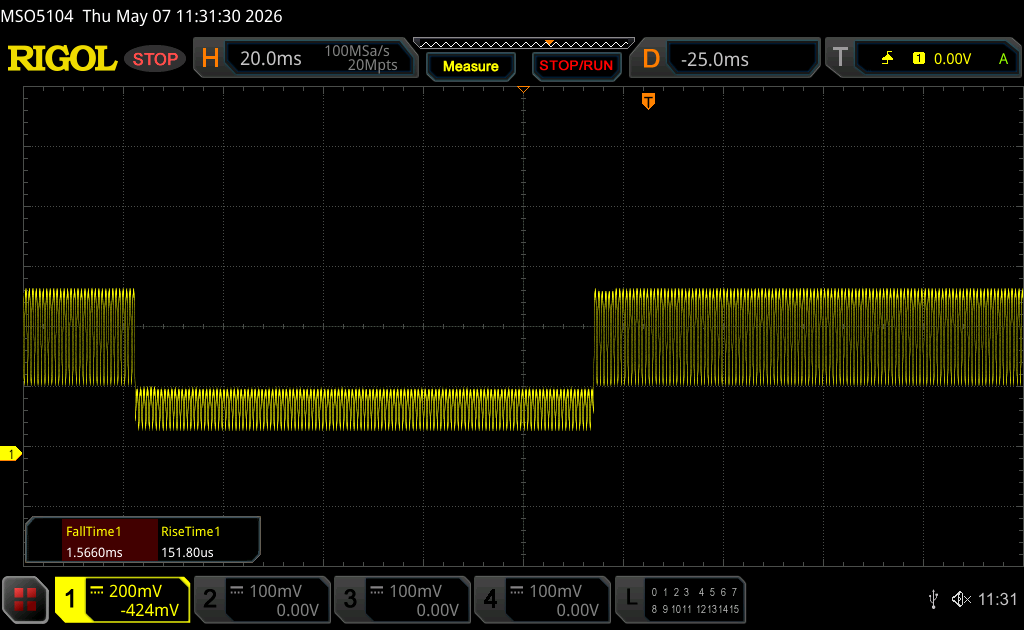 |
| ↘ 0.14 ms Calo | ||
| Lo schermo ha mostrato valori di risposta molto veloci nei nostri tests ed è molto adatto per i gaming veloce. In confronto, tutti i dispositivi di test variano da 0.165 (minimo) a 636 (massimo) ms. » 0 % di tutti i dispositivi è migliore. Questo significa che i tempi di risposta rilevati sono migliori rispettto alla media di tutti i dispositivi testati (31 ms). | ||
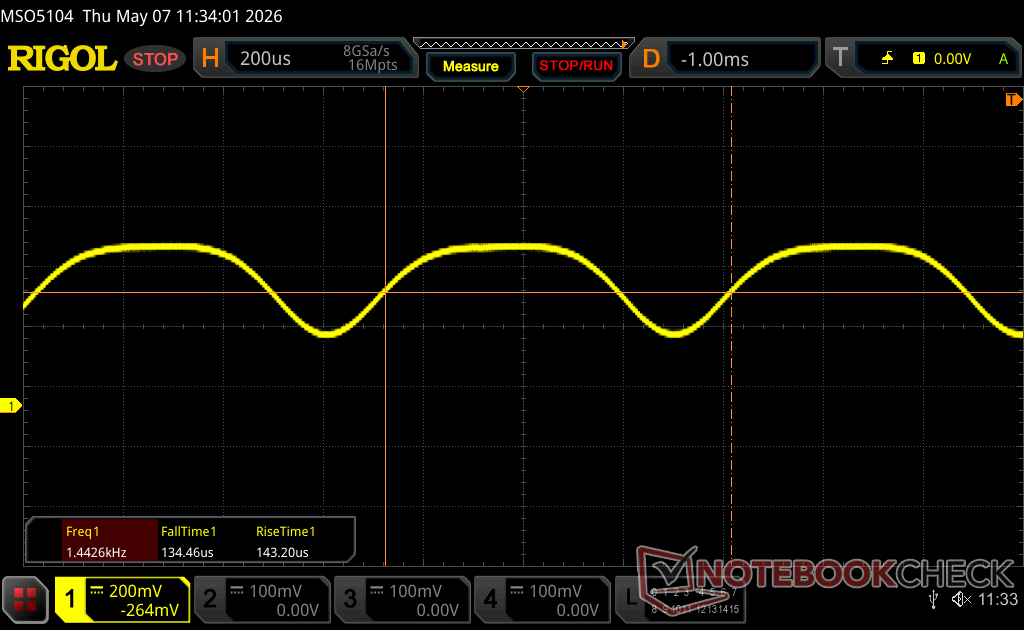
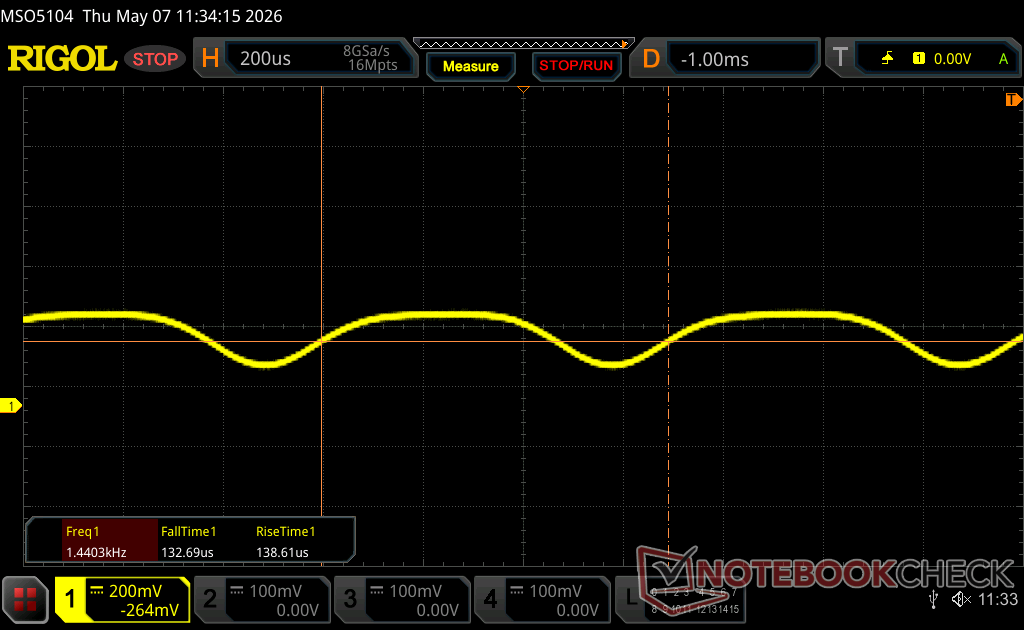
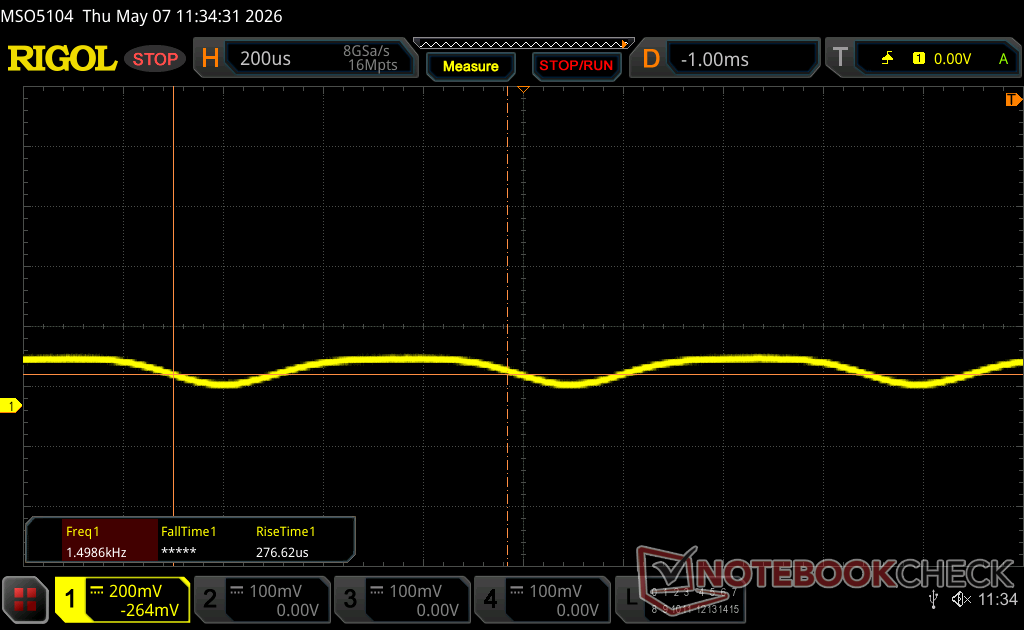
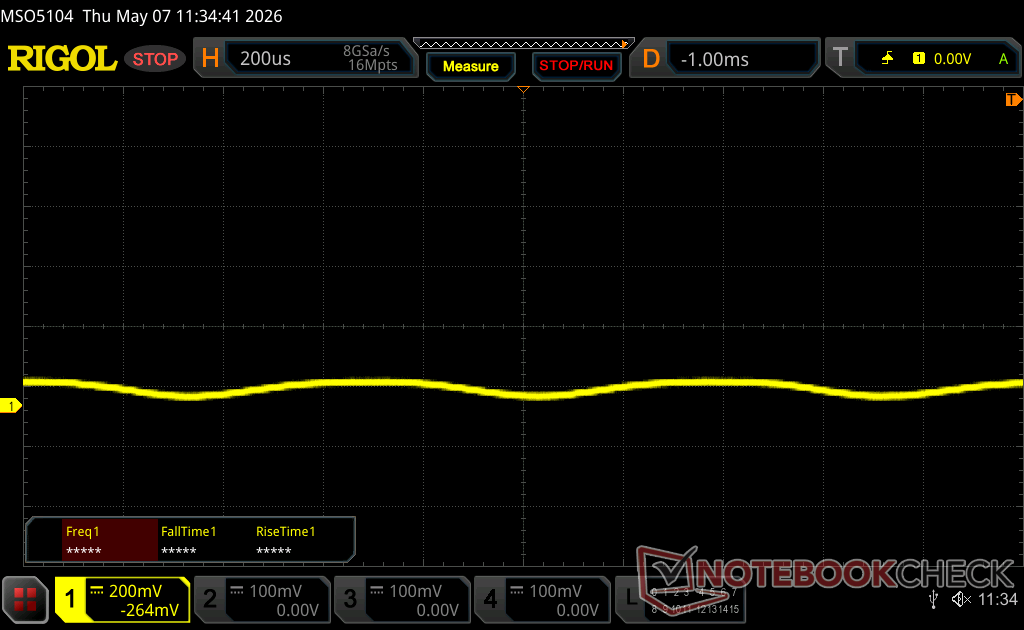
Sfarfallio dello schermo / PWM (Pulse-Width Modulation)
| flickering dello schermo / PWM rilevato | 1439.8 Hz Amplitude: 29 % | ≤ 100 % settaggio luminosita' | 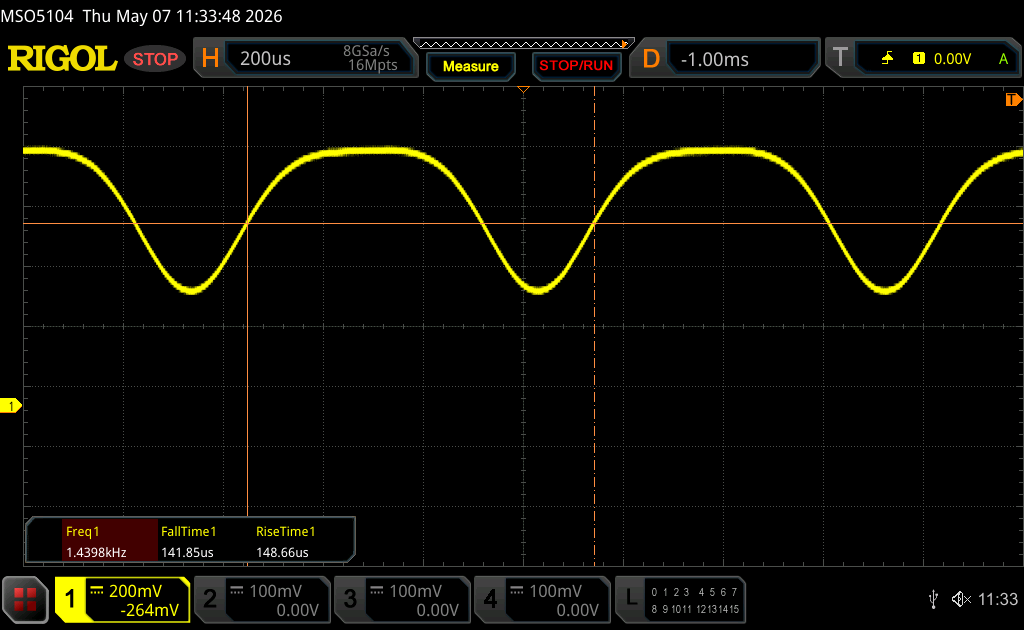 |
Il display sfarfalla a 1439.8 Hz (Probabilmente a causa dell'uso di PWM) Flickering rilevato ad una luminosita' di 100 % o inferiore. Non dovrebbe verificarsi flickering o PWM sopra questo valore di luminosita'. La frequenza di 1439.8 Hz è abbastanza alta, quindi la maggioranza degli utenti sensibili al PWM non dovrebbero notare alcun flickering. In confronto: 52 % di tutti i dispositivi testati non utilizza PWM per ridurre la luminosita' del display. Se è rilevato PWM, una media di 7769 (minimo: 5 - massimo: 343500) Hz è stata rilevata. | |||


Prestazioni
Condizioni del test
Abbiamo impostato Alienware Command Center sulla modalità Performance prima di eseguire i benchmark qui sotto. È disponibile anche una "modalità Overdrive" che aumenta il numero di giri della ventola al massimo, ma i vantaggi in termini di prestazioni rispetto alla modalità Prestazioni sono minimi.
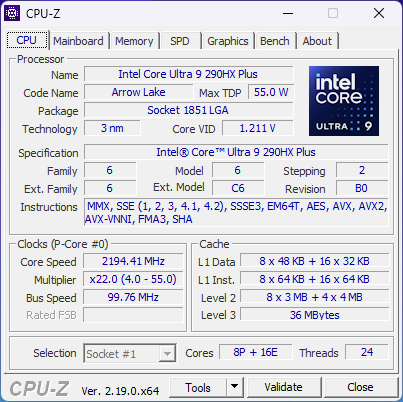
Processore
Il Core Ultra 9 290HX Plus è solo fino a 5 punti percentuali più veloce del Core Ultra 9 275HX del modello dello scorso anno. L'esecuzione in modalità Overdrive non migliorerebbe i risultati in modo più significativo.
Cinebench R15 Multi Loop
Cinebench R23: Multi Core | Single Core
Cinebench R20: CPU (Multi Core) | CPU (Single Core)
Cinebench R15: CPU Multi 64Bit | CPU Single 64Bit
Blender: v2.79 BMW27 CPU
7-Zip 18.03: 7z b 4 | 7z b 4 -mmt1
Geekbench 6.7: Multi-Core | Single-Core
Geekbench 5.5: Multi-Core | Single-Core
HWBOT x265 Benchmark v2.2: 4k Preset
LibreOffice : 20 Documents To PDF
R Benchmark 2.5: Overall mean
* ... Meglio usare valori piccoli
AIDA64: FP32 Ray-Trace | FPU Julia | CPU SHA3 | CPU Queen | FPU SinJulia | FPU Mandel | CPU AES | CPU ZLib | FP64 Ray-Trace | CPU PhotoWorxx | CPU CheckMate
| Performance rating | |
| Media Intel Core Ultra 9 290HX Plus -1! | |
| Alienware 16X Aurora Core Ultra 9 290HX Plus -1! | |
| Lenovo Legion Pro 5 16IAX10, RTX 5070 -1! | |
| Alienware 16X Aurora, RTX 5070 -1! | |
| Acer Predator Helios Neo 16S AI PHN16S-71-94L9 -1! | |
| MSI Vector 16 HX AI A2XWHG -1! | |
| Asus ROG Zephyrus G16 GU605CW -1! | |
| AIDA64 / FP32 Ray-Trace | |
| Media Intel Core Ultra 9 290HX Plus (34761 - 40761, n=3) | |
| Alienware 16X Aurora Core Ultra 9 290HX Plus (v8.20.8100) | |
| Lenovo Legion Pro 5 16IAX10, RTX 5070 (v6.92.6600) | |
| Alienware 16X Aurora, RTX 5070 (v6.92.6600) | |
| Acer Predator Helios Neo 16S AI PHN16S-71-94L9 (v6.92.6600) | |
| MSI Vector 16 HX AI A2XWHG (v6.92.6600) | |
| Asus ROG Zephyrus G16 GU605CW (v6.92.6600) | |
| AIDA64 / FPU Julia | |
| Media Intel Core Ultra 9 290HX Plus (174665 - 208083, n=3) | |
| Alienware 16X Aurora Core Ultra 9 290HX Plus (v8.20.8100) | |
| Lenovo Legion Pro 5 16IAX10, RTX 5070 (v6.92.6600) | |
| Alienware 16X Aurora, RTX 5070 (v6.92.6600) | |
| Acer Predator Helios Neo 16S AI PHN16S-71-94L9 (v6.92.6600) | |
| MSI Vector 16 HX AI A2XWHG (v6.92.6600) | |
| Asus ROG Zephyrus G16 GU605CW (v6.92.6600) | |
| AIDA64 / CPU SHA3 | |
| Media Intel Core Ultra 9 290HX Plus (8352 - 9784, n=3) | |
| Alienware 16X Aurora Core Ultra 9 290HX Plus (v8.20.8100) | |
| Alienware 16X Aurora, RTX 5070 (v6.92.6600) | |
| Lenovo Legion Pro 5 16IAX10, RTX 5070 (v6.92.6600) | |
| Acer Predator Helios Neo 16S AI PHN16S-71-94L9 (v6.92.6600) | |
| MSI Vector 16 HX AI A2XWHG (v6.92.6600) | |
| Asus ROG Zephyrus G16 GU605CW (v6.92.6600) | |
| AIDA64 / CPU Queen | |
| Lenovo Legion Pro 5 16IAX10, RTX 5070 (v6.92.6600) | |
| Alienware 16X Aurora, RTX 5070 (v6.92.6600) | |
| Acer Predator Helios Neo 16S AI PHN16S-71-94L9 (v6.92.6600) | |
| MSI Vector 16 HX AI A2XWHG (v6.92.6600) | |
| Asus ROG Zephyrus G16 GU605CW (v6.92.6600) | |
| AIDA64 / FPU SinJulia | |
| Media Intel Core Ultra 9 290HX Plus (13612 - 14461, n=3) | |
| Alienware 16X Aurora Core Ultra 9 290HX Plus (v8.20.8100) | |
| Alienware 16X Aurora, RTX 5070 (v6.92.6600) | |
| Lenovo Legion Pro 5 16IAX10, RTX 5070 (v6.92.6600) | |
| Acer Predator Helios Neo 16S AI PHN16S-71-94L9 (v6.92.6600) | |
| MSI Vector 16 HX AI A2XWHG (v6.92.6600) | |
| Asus ROG Zephyrus G16 GU605CW (v6.92.6600) | |
| AIDA64 / FPU Mandel | |
| Media Intel Core Ultra 9 290HX Plus (91215 - 108275, n=3) | |
| Alienware 16X Aurora Core Ultra 9 290HX Plus (v8.20.8100) | |
| Lenovo Legion Pro 5 16IAX10, RTX 5070 (v6.92.6600) | |
| Alienware 16X Aurora, RTX 5070 (v6.92.6600) | |
| Acer Predator Helios Neo 16S AI PHN16S-71-94L9 (v6.92.6600) | |
| MSI Vector 16 HX AI A2XWHG (v6.92.6600) | |
| Asus ROG Zephyrus G16 GU605CW (v6.92.6600) | |
| AIDA64 / CPU AES | |
| Media Intel Core Ultra 9 290HX Plus (127585 - 136781, n=3) | |
| Alienware 16X Aurora Core Ultra 9 290HX Plus (v8.20.8100) | |
| Alienware 16X Aurora, RTX 5070 (v6.92.6600) | |
| Lenovo Legion Pro 5 16IAX10, RTX 5070 (v6.92.6600) | |
| Acer Predator Helios Neo 16S AI PHN16S-71-94L9 (v6.92.6600) | |
| MSI Vector 16 HX AI A2XWHG (v6.92.6600) | |
| Asus ROG Zephyrus G16 GU605CW (v6.92.6600) | |
| AIDA64 / CPU ZLib | |
| Media Intel Core Ultra 9 290HX Plus (1967 - 2206, n=3) | |
| Alienware 16X Aurora Core Ultra 9 290HX Plus (v8.20.8100) | |
| Alienware 16X Aurora, RTX 5070 (v6.92.6600) | |
| Lenovo Legion Pro 5 16IAX10, RTX 5070 (v6.92.6600) | |
| Acer Predator Helios Neo 16S AI PHN16S-71-94L9 (v6.92.6600) | |
| MSI Vector 16 HX AI A2XWHG (v6.92.6600) | |
| Asus ROG Zephyrus G16 GU605CW (v6.92.6600) | |
| AIDA64 / FP64 Ray-Trace | |
| Media Intel Core Ultra 9 290HX Plus (18611 - 21949, n=3) | |
| Alienware 16X Aurora Core Ultra 9 290HX Plus (v8.20.8100) | |
| Lenovo Legion Pro 5 16IAX10, RTX 5070 (v6.92.6600) | |
| Alienware 16X Aurora, RTX 5070 (v6.92.6600) | |
| Acer Predator Helios Neo 16S AI PHN16S-71-94L9 (v6.92.6600) | |
| MSI Vector 16 HX AI A2XWHG (v6.92.6600) | |
| Asus ROG Zephyrus G16 GU605CW (v6.92.6600) | |
| AIDA64 / CPU PhotoWorxx | |
| Asus ROG Zephyrus G16 GU605CW (v6.92.6600) | |
| Lenovo Legion Pro 5 16IAX10, RTX 5070 (v6.92.6600) | |
| Acer Predator Helios Neo 16S AI PHN16S-71-94L9 (v6.92.6600) | |
| Media Intel Core Ultra 9 290HX Plus (51134 - 55731, n=3) | |
| Alienware 16X Aurora Core Ultra 9 290HX Plus (v8.20.8100) | |
| Alienware 16X Aurora, RTX 5070 (v6.92.6600) | |
| MSI Vector 16 HX AI A2XWHG (v6.92.6600) | |
| AIDA64 / CPU CheckMate | |
| Media Intel Core Ultra 9 290HX Plus (7624 - 8322, n=3) | |
| Alienware 16X Aurora Core Ultra 9 290HX Plus (v8.20.8100) | |
Prestazioni del sistema
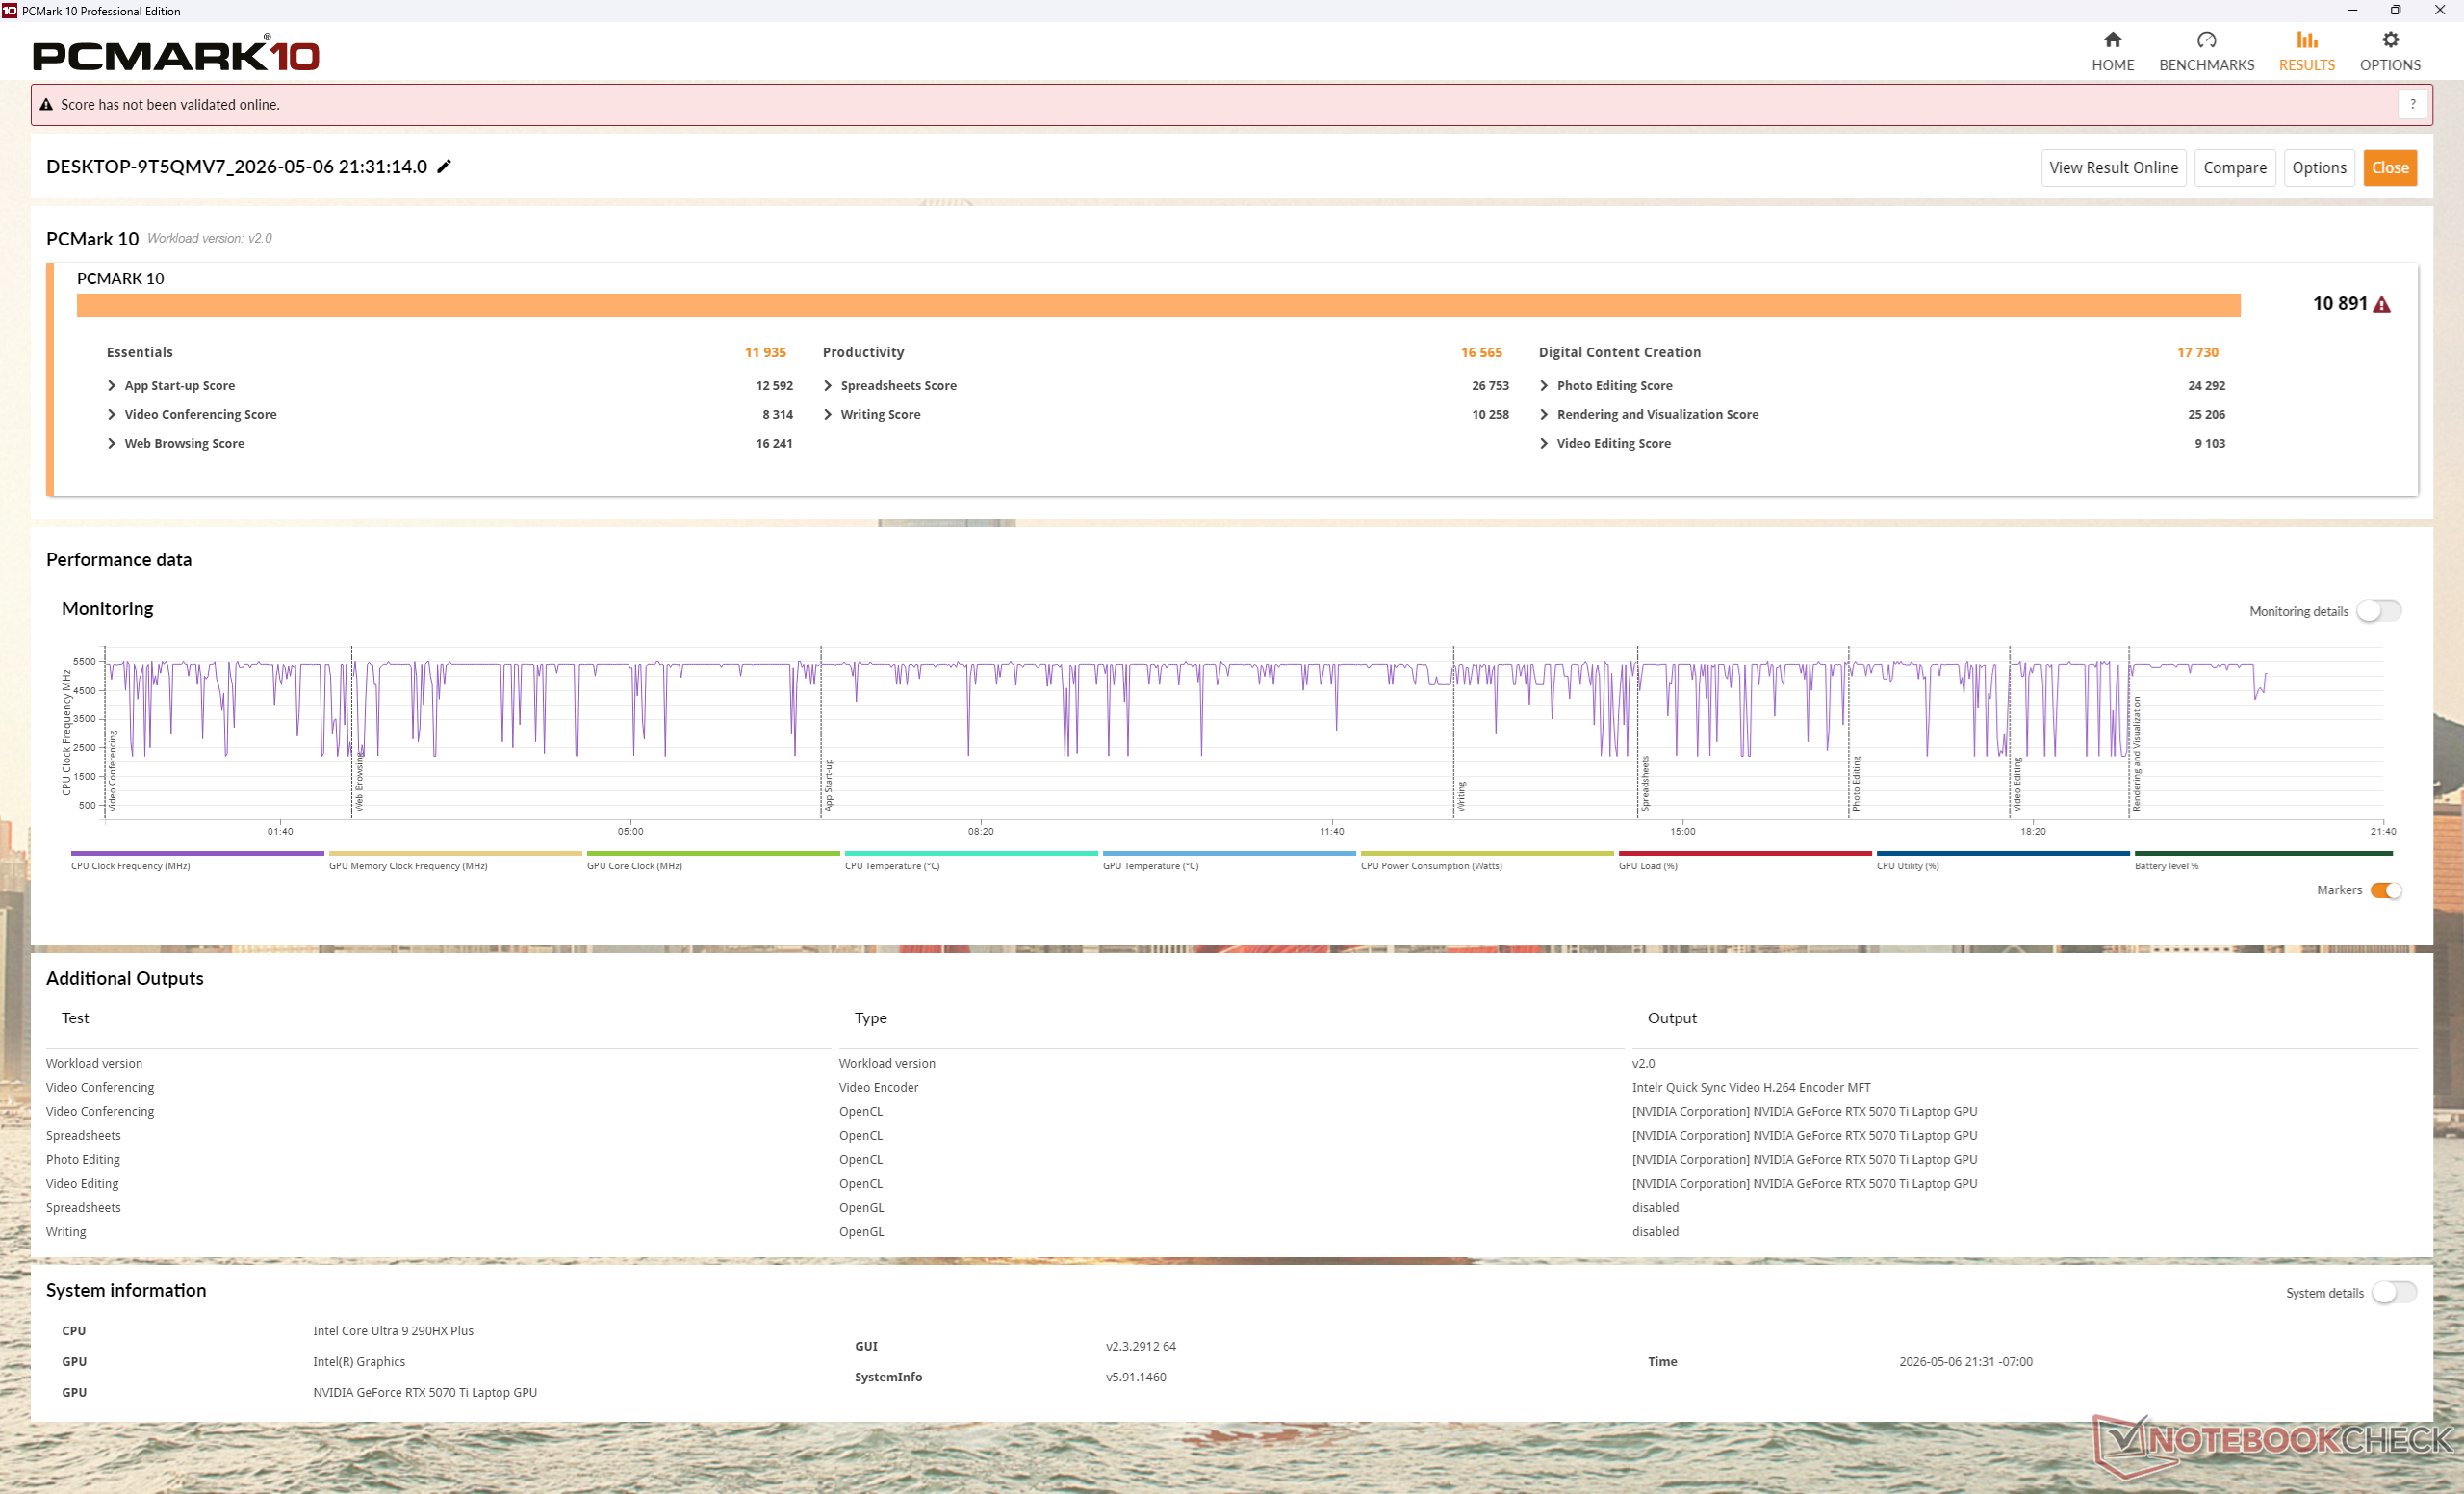
PCMark 10: Score | Essentials | Productivity | Digital Content Creation
CrossMark: Overall | Productivity | Creativity | Responsiveness
WebXPRT 3: Overall
WebXPRT 4: Overall
Mozilla Kraken 1.1: Total
Geekbench AI: Quantized GPU 1.7 | Half Precision GPU 1.7 | Single Precision GPU 1.7
| Performance rating | |
| Alienware 16X Aurora Core Ultra 9 290HX Plus | |
| Media Intel Core Ultra 9 290HX Plus, NVIDIA GeForce RTX 5070 Ti Laptop | |
| Alienware 16X Aurora, RTX 5070 -4! | |
| Lenovo Legion Pro 5 16IAX10, RTX 5070 | |
| Acer Predator Helios Neo 16S AI PHN16S-71-94L9 -3! | |
| MSI Vector 16 HX AI A2XWHG -3! | |
| Asus ROG Zephyrus G16 GU605CW -3! | |
| PCMark 10 / Score | |
| Alienware 16X Aurora Core Ultra 9 290HX Plus | |
| Media Intel Core Ultra 9 290HX Plus, NVIDIA GeForce RTX 5070 Ti Laptop (n=1) | |
| Lenovo Legion Pro 5 16IAX10, RTX 5070 | |
| Acer Predator Helios Neo 16S AI PHN16S-71-94L9 | |
| MSI Vector 16 HX AI A2XWHG | |
| Asus ROG Zephyrus G16 GU605CW | |
| PCMark 10 / Essentials | |
| Alienware 16X Aurora Core Ultra 9 290HX Plus | |
| Media Intel Core Ultra 9 290HX Plus, NVIDIA GeForce RTX 5070 Ti Laptop (n=1) | |
| Lenovo Legion Pro 5 16IAX10, RTX 5070 | |
| Acer Predator Helios Neo 16S AI PHN16S-71-94L9 | |
| MSI Vector 16 HX AI A2XWHG | |
| Asus ROG Zephyrus G16 GU605CW | |
| PCMark 10 / Productivity | |
| Alienware 16X Aurora Core Ultra 9 290HX Plus | |
| Media Intel Core Ultra 9 290HX Plus, NVIDIA GeForce RTX 5070 Ti Laptop (n=1) | |
| Lenovo Legion Pro 5 16IAX10, RTX 5070 | |
| Acer Predator Helios Neo 16S AI PHN16S-71-94L9 | |
| MSI Vector 16 HX AI A2XWHG | |
| Asus ROG Zephyrus G16 GU605CW | |
| PCMark 10 / Digital Content Creation | |
| Alienware 16X Aurora Core Ultra 9 290HX Plus | |
| Media Intel Core Ultra 9 290HX Plus, NVIDIA GeForce RTX 5070 Ti Laptop (n=1) | |
| Lenovo Legion Pro 5 16IAX10, RTX 5070 | |
| Acer Predator Helios Neo 16S AI PHN16S-71-94L9 | |
| Asus ROG Zephyrus G16 GU605CW | |
| MSI Vector 16 HX AI A2XWHG | |
| CrossMark / Overall | |
| Alienware 16X Aurora Core Ultra 9 290HX Plus | |
| Media Intel Core Ultra 9 290HX Plus, NVIDIA GeForce RTX 5070 Ti Laptop (n=1) | |
| Alienware 16X Aurora, RTX 5070 | |
| Acer Predator Helios Neo 16S AI PHN16S-71-94L9 | |
| Lenovo Legion Pro 5 16IAX10, RTX 5070 | |
| MSI Vector 16 HX AI A2XWHG | |
| Asus ROG Zephyrus G16 GU605CW | |
| CrossMark / Productivity | |
| Alienware 16X Aurora Core Ultra 9 290HX Plus | |
| Media Intel Core Ultra 9 290HX Plus, NVIDIA GeForce RTX 5070 Ti Laptop (n=1) | |
| Alienware 16X Aurora, RTX 5070 | |
| Acer Predator Helios Neo 16S AI PHN16S-71-94L9 | |
| Lenovo Legion Pro 5 16IAX10, RTX 5070 | |
| MSI Vector 16 HX AI A2XWHG | |
| Asus ROG Zephyrus G16 GU605CW | |
| CrossMark / Creativity | |
| Alienware 16X Aurora Core Ultra 9 290HX Plus | |
| Media Intel Core Ultra 9 290HX Plus, NVIDIA GeForce RTX 5070 Ti Laptop (n=1) | |
| Acer Predator Helios Neo 16S AI PHN16S-71-94L9 | |
| Alienware 16X Aurora, RTX 5070 | |
| Lenovo Legion Pro 5 16IAX10, RTX 5070 | |
| MSI Vector 16 HX AI A2XWHG | |
| Asus ROG Zephyrus G16 GU605CW | |
| CrossMark / Responsiveness | |
| Alienware 16X Aurora Core Ultra 9 290HX Plus | |
| Media Intel Core Ultra 9 290HX Plus, NVIDIA GeForce RTX 5070 Ti Laptop (n=1) | |
| Alienware 16X Aurora, RTX 5070 | |
| Lenovo Legion Pro 5 16IAX10, RTX 5070 | |
| Acer Predator Helios Neo 16S AI PHN16S-71-94L9 | |
| MSI Vector 16 HX AI A2XWHG | |
| Asus ROG Zephyrus G16 GU605CW | |
| WebXPRT 3 / Overall | |
| Alienware 16X Aurora Core Ultra 9 290HX Plus | |
| Media Intel Core Ultra 9 290HX Plus, NVIDIA GeForce RTX 5070 Ti Laptop (n=1) | |
| Alienware 16X Aurora, RTX 5070 | |
| Lenovo Legion Pro 5 16IAX10, RTX 5070 | |
| Acer Predator Helios Neo 16S AI PHN16S-71-94L9 | |
| MSI Vector 16 HX AI A2XWHG | |
| Asus ROG Zephyrus G16 GU605CW | |
| WebXPRT 4 / Overall | |
| Alienware 16X Aurora Core Ultra 9 290HX Plus | |
| Media Intel Core Ultra 9 290HX Plus, NVIDIA GeForce RTX 5070 Ti Laptop (n=1) | |
| Alienware 16X Aurora, RTX 5070 | |
| Lenovo Legion Pro 5 16IAX10, RTX 5070 | |
| Acer Predator Helios Neo 16S AI PHN16S-71-94L9 | |
| MSI Vector 16 HX AI A2XWHG | |
| Asus ROG Zephyrus G16 GU605CW | |
| Mozilla Kraken 1.1 / Total | |
| Asus ROG Zephyrus G16 GU605CW | |
| Lenovo Legion Pro 5 16IAX10, RTX 5070 | |
| MSI Vector 16 HX AI A2XWHG | |
| Alienware 16X Aurora, RTX 5070 | |
| Acer Predator Helios Neo 16S AI PHN16S-71-94L9 | |
| Alienware 16X Aurora Core Ultra 9 290HX Plus | |
| Media Intel Core Ultra 9 290HX Plus, NVIDIA GeForce RTX 5070 Ti Laptop (n=1) | |
| Geekbench AI / Quantized GPU 1.7 | |
| Alienware 16X Aurora Core Ultra 9 290HX Plus | |
| Media Intel Core Ultra 9 290HX Plus, NVIDIA GeForce RTX 5070 Ti Laptop (n=1) | |
| Alienware 16X Aurora, RTX 5070 | |
| Lenovo Legion Pro 5 16IAX10, RTX 5070 | |
| Geekbench AI / Half Precision GPU 1.7 | |
| Alienware 16X Aurora Core Ultra 9 290HX Plus | |
| Media Intel Core Ultra 9 290HX Plus, NVIDIA GeForce RTX 5070 Ti Laptop (n=1) | |
| Alienware 16X Aurora, RTX 5070 | |
| Lenovo Legion Pro 5 16IAX10, RTX 5070 | |
| Geekbench AI / Single Precision GPU 1.7 | |
| Alienware 16X Aurora Core Ultra 9 290HX Plus | |
| Media Intel Core Ultra 9 290HX Plus, NVIDIA GeForce RTX 5070 Ti Laptop (n=1) | |
| Alienware 16X Aurora, RTX 5070 | |
| Lenovo Legion Pro 5 16IAX10, RTX 5070 | |
* ... Meglio usare valori piccoli
| PCMark 10 Score | 10891 punti | |
Aiuto | ||
| AIDA64 / Memory Copy | |
| Asus ROG Zephyrus G16 GU605CW | |
| Acer Predator Helios Neo 16S AI PHN16S-71-94L9 | |
| Lenovo Legion Pro 5 16IAX10, RTX 5070 | |
| Media Intel Core Ultra 9 290HX Plus (76912 - 85698, n=3) | |
| Alienware 16X Aurora, RTX 5070 | |
| Alienware 16X Aurora Core Ultra 9 290HX Plus | |
| MSI Vector 16 HX AI A2XWHG | |
| AIDA64 / Memory Read | |
| Acer Predator Helios Neo 16S AI PHN16S-71-94L9 | |
| Lenovo Legion Pro 5 16IAX10, RTX 5070 | |
| Media Intel Core Ultra 9 290HX Plus (84638 - 93496, n=3) | |
| Alienware 16X Aurora, RTX 5070 | |
| Alienware 16X Aurora Core Ultra 9 290HX Plus | |
| MSI Vector 16 HX AI A2XWHG | |
| Asus ROG Zephyrus G16 GU605CW | |
| AIDA64 / Memory Write | |
| Acer Predator Helios Neo 16S AI PHN16S-71-94L9 | |
| Lenovo Legion Pro 5 16IAX10, RTX 5070 | |
| Alienware 16X Aurora, RTX 5070 | |
| Media Intel Core Ultra 9 290HX Plus (76094 - 81688, n=3) | |
| Alienware 16X Aurora Core Ultra 9 290HX Plus | |
| Asus ROG Zephyrus G16 GU605CW | |
| MSI Vector 16 HX AI A2XWHG | |
| AIDA64 / Memory Latency | |
| Asus ROG Zephyrus G16 GU605CW | |
| Alienware 16X Aurora, RTX 5070 | |
| Acer Predator Helios Neo 16S AI PHN16S-71-94L9 | |
| Alienware 16X Aurora Core Ultra 9 290HX Plus | |
| MSI Vector 16 HX AI A2XWHG | |
| Media Intel Core Ultra 9 290HX Plus (105.3 - 108.4, n=3) | |
| Lenovo Legion Pro 5 16IAX10, RTX 5070 | |
* ... Meglio usare valori piccoli
Latenza DPC
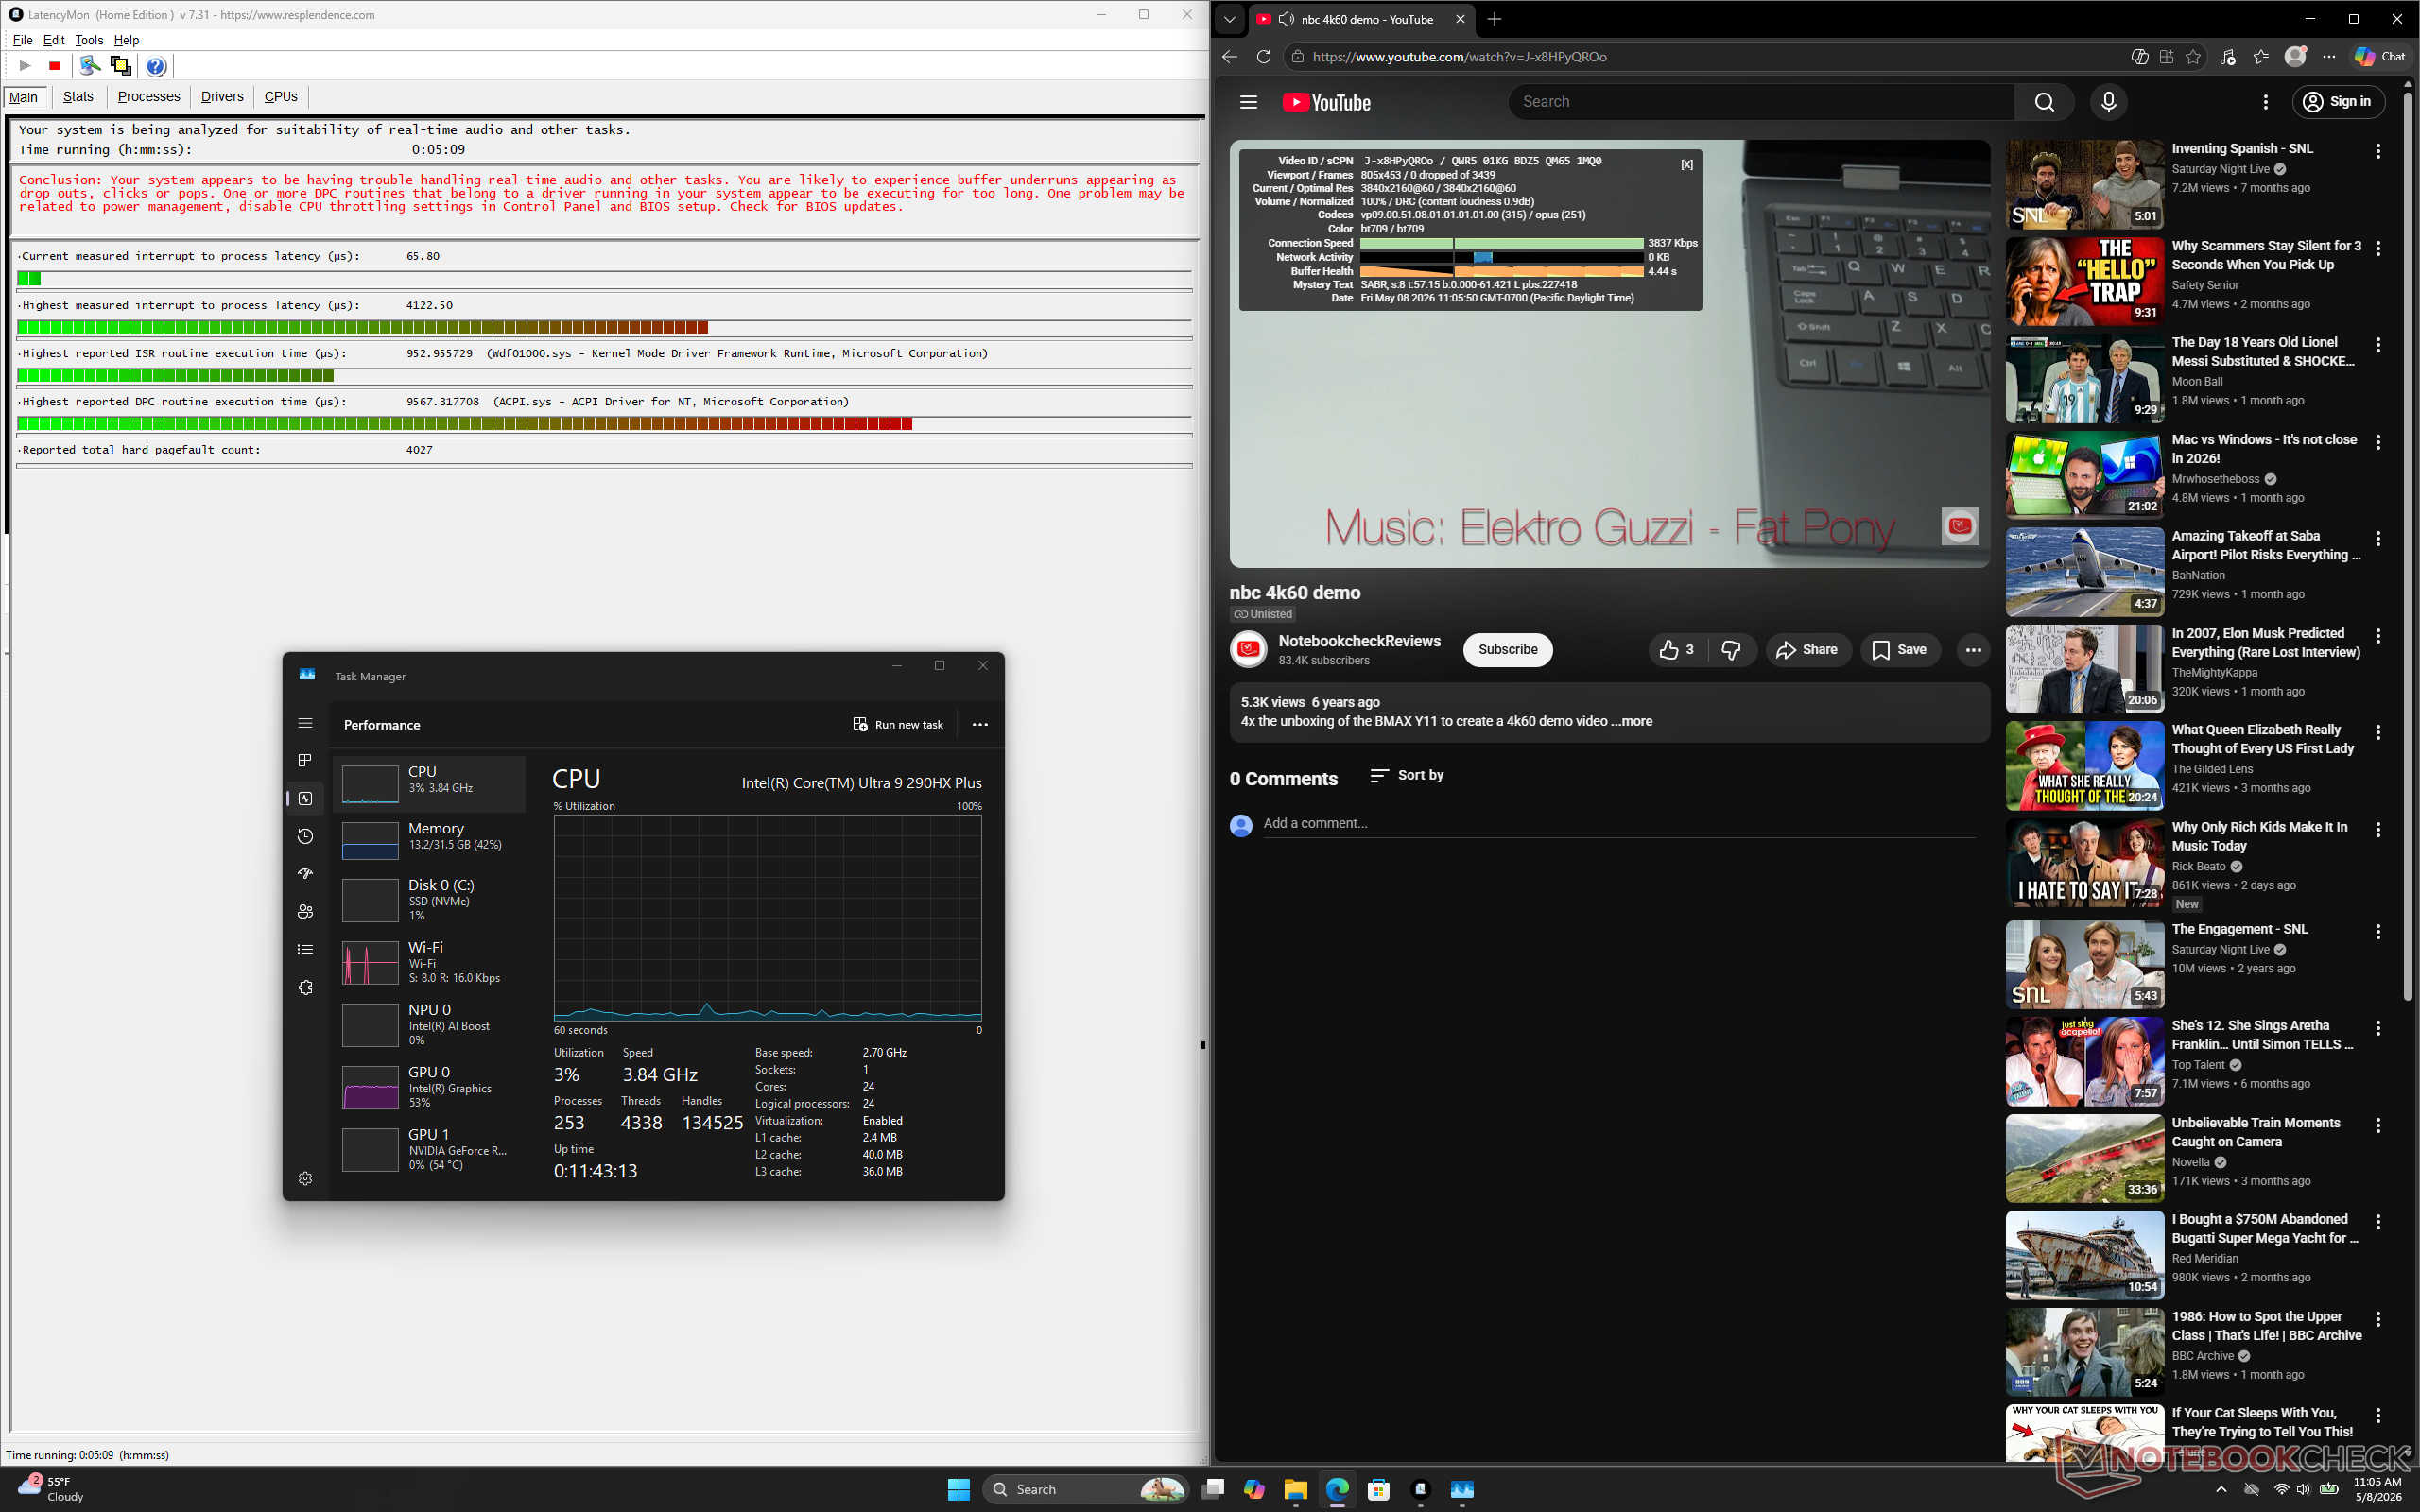
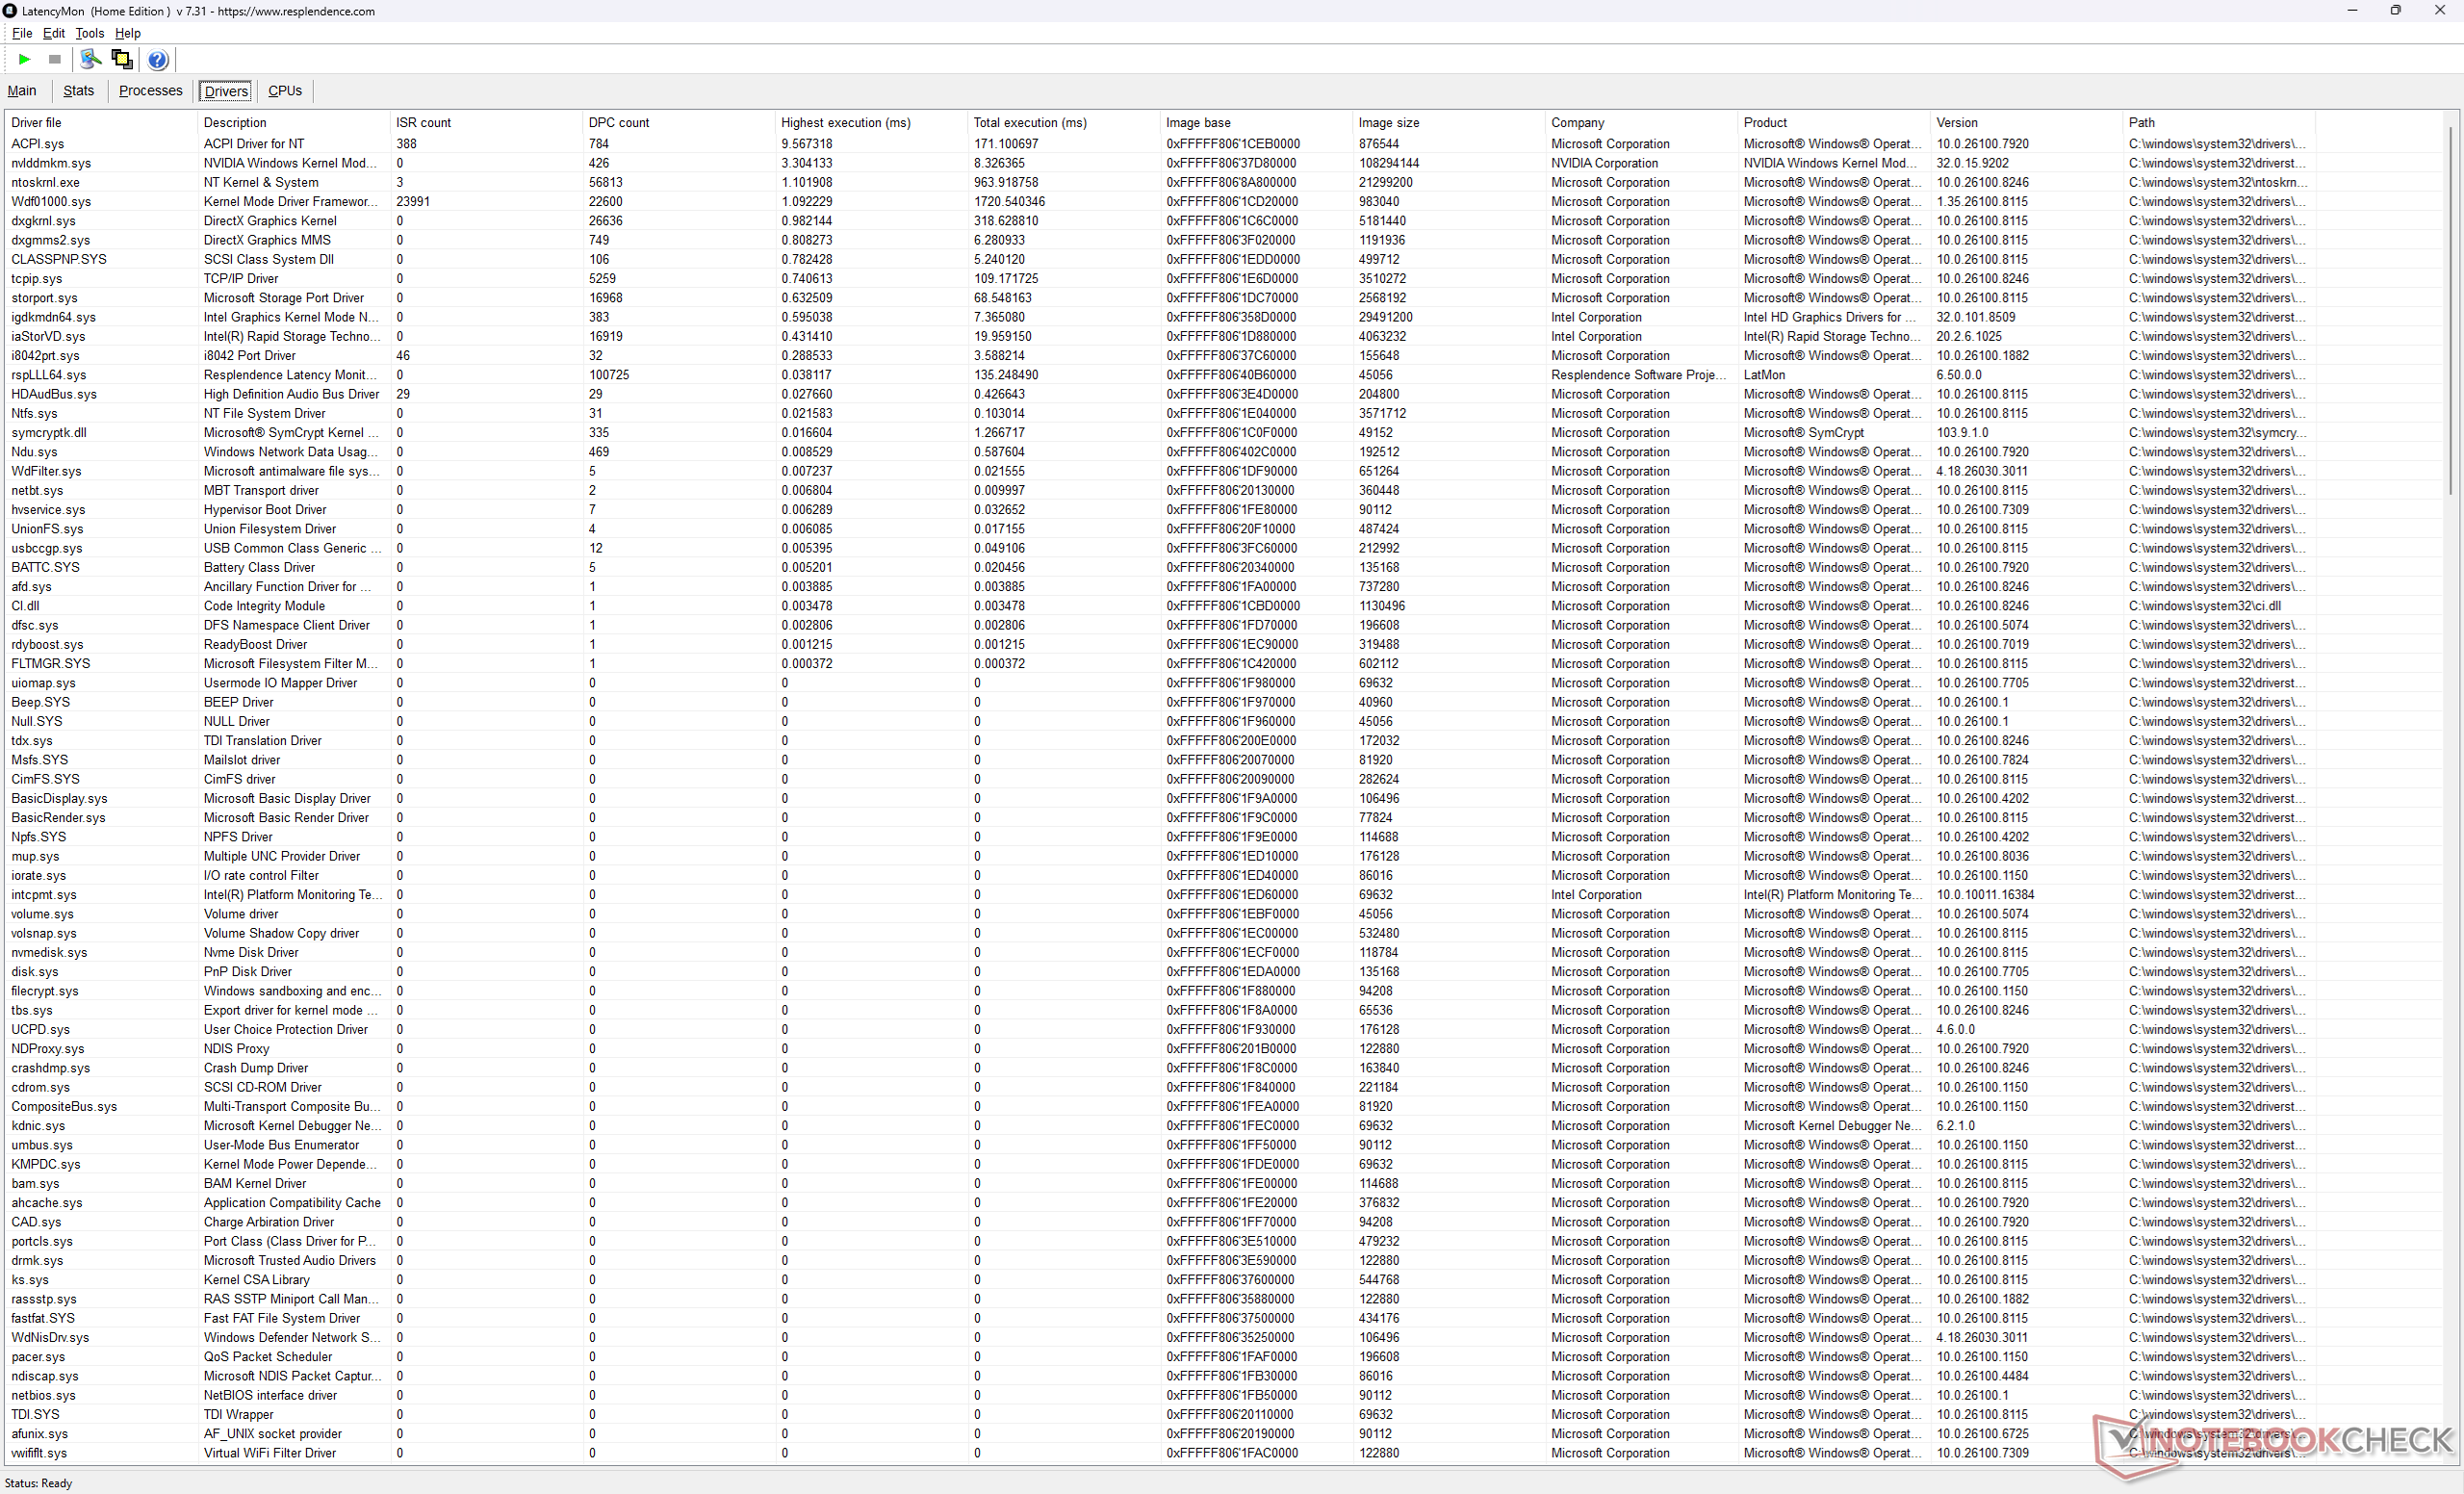
| DPC Latencies / LatencyMon - interrupt to process latency (max), Web, Youtube, Prime95 | |
| MSI Vector 16 HX AI A2XWHG | |
| Alienware 16X Aurora Core Ultra 9 290HX Plus | |
| Acer Predator Helios Neo 16S AI PHN16S-71-94L9 | |
| Alienware 16X Aurora, RTX 5070 | |
| Asus ROG Zephyrus G16 GU605CW | |
| Lenovo Legion Pro 5 16IAX10, RTX 5070 | |
* ... Meglio usare valori piccoli
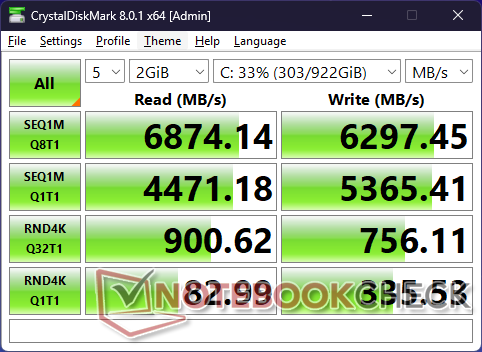
Dispositivi di archiviazione
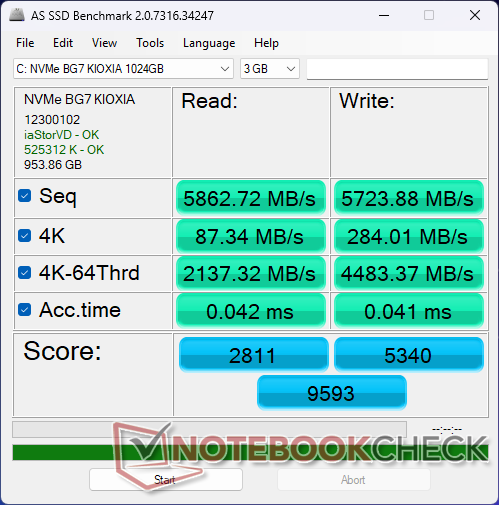
Mentre il modello dell'anno scorso veniva consegnato con una Micron 2650, il nostro modello 2026 verrà consegnato con la Kioxia BG7 al suo posto. Questa unità SSD M.2 2242 PCIe4 x4 NVMe offre velocità di trasferimento stabili di ~7000 MB/s senza problemi di throttling e rappresenta un miglioramento rispetto alla Micron.

* ... Meglio usare valori piccoli
Strozzatura del disco: DiskSpd Lettura in loop, Profondità coda 8
Prestazioni della GPU
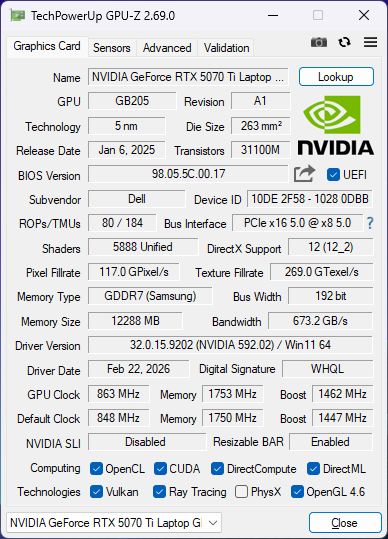
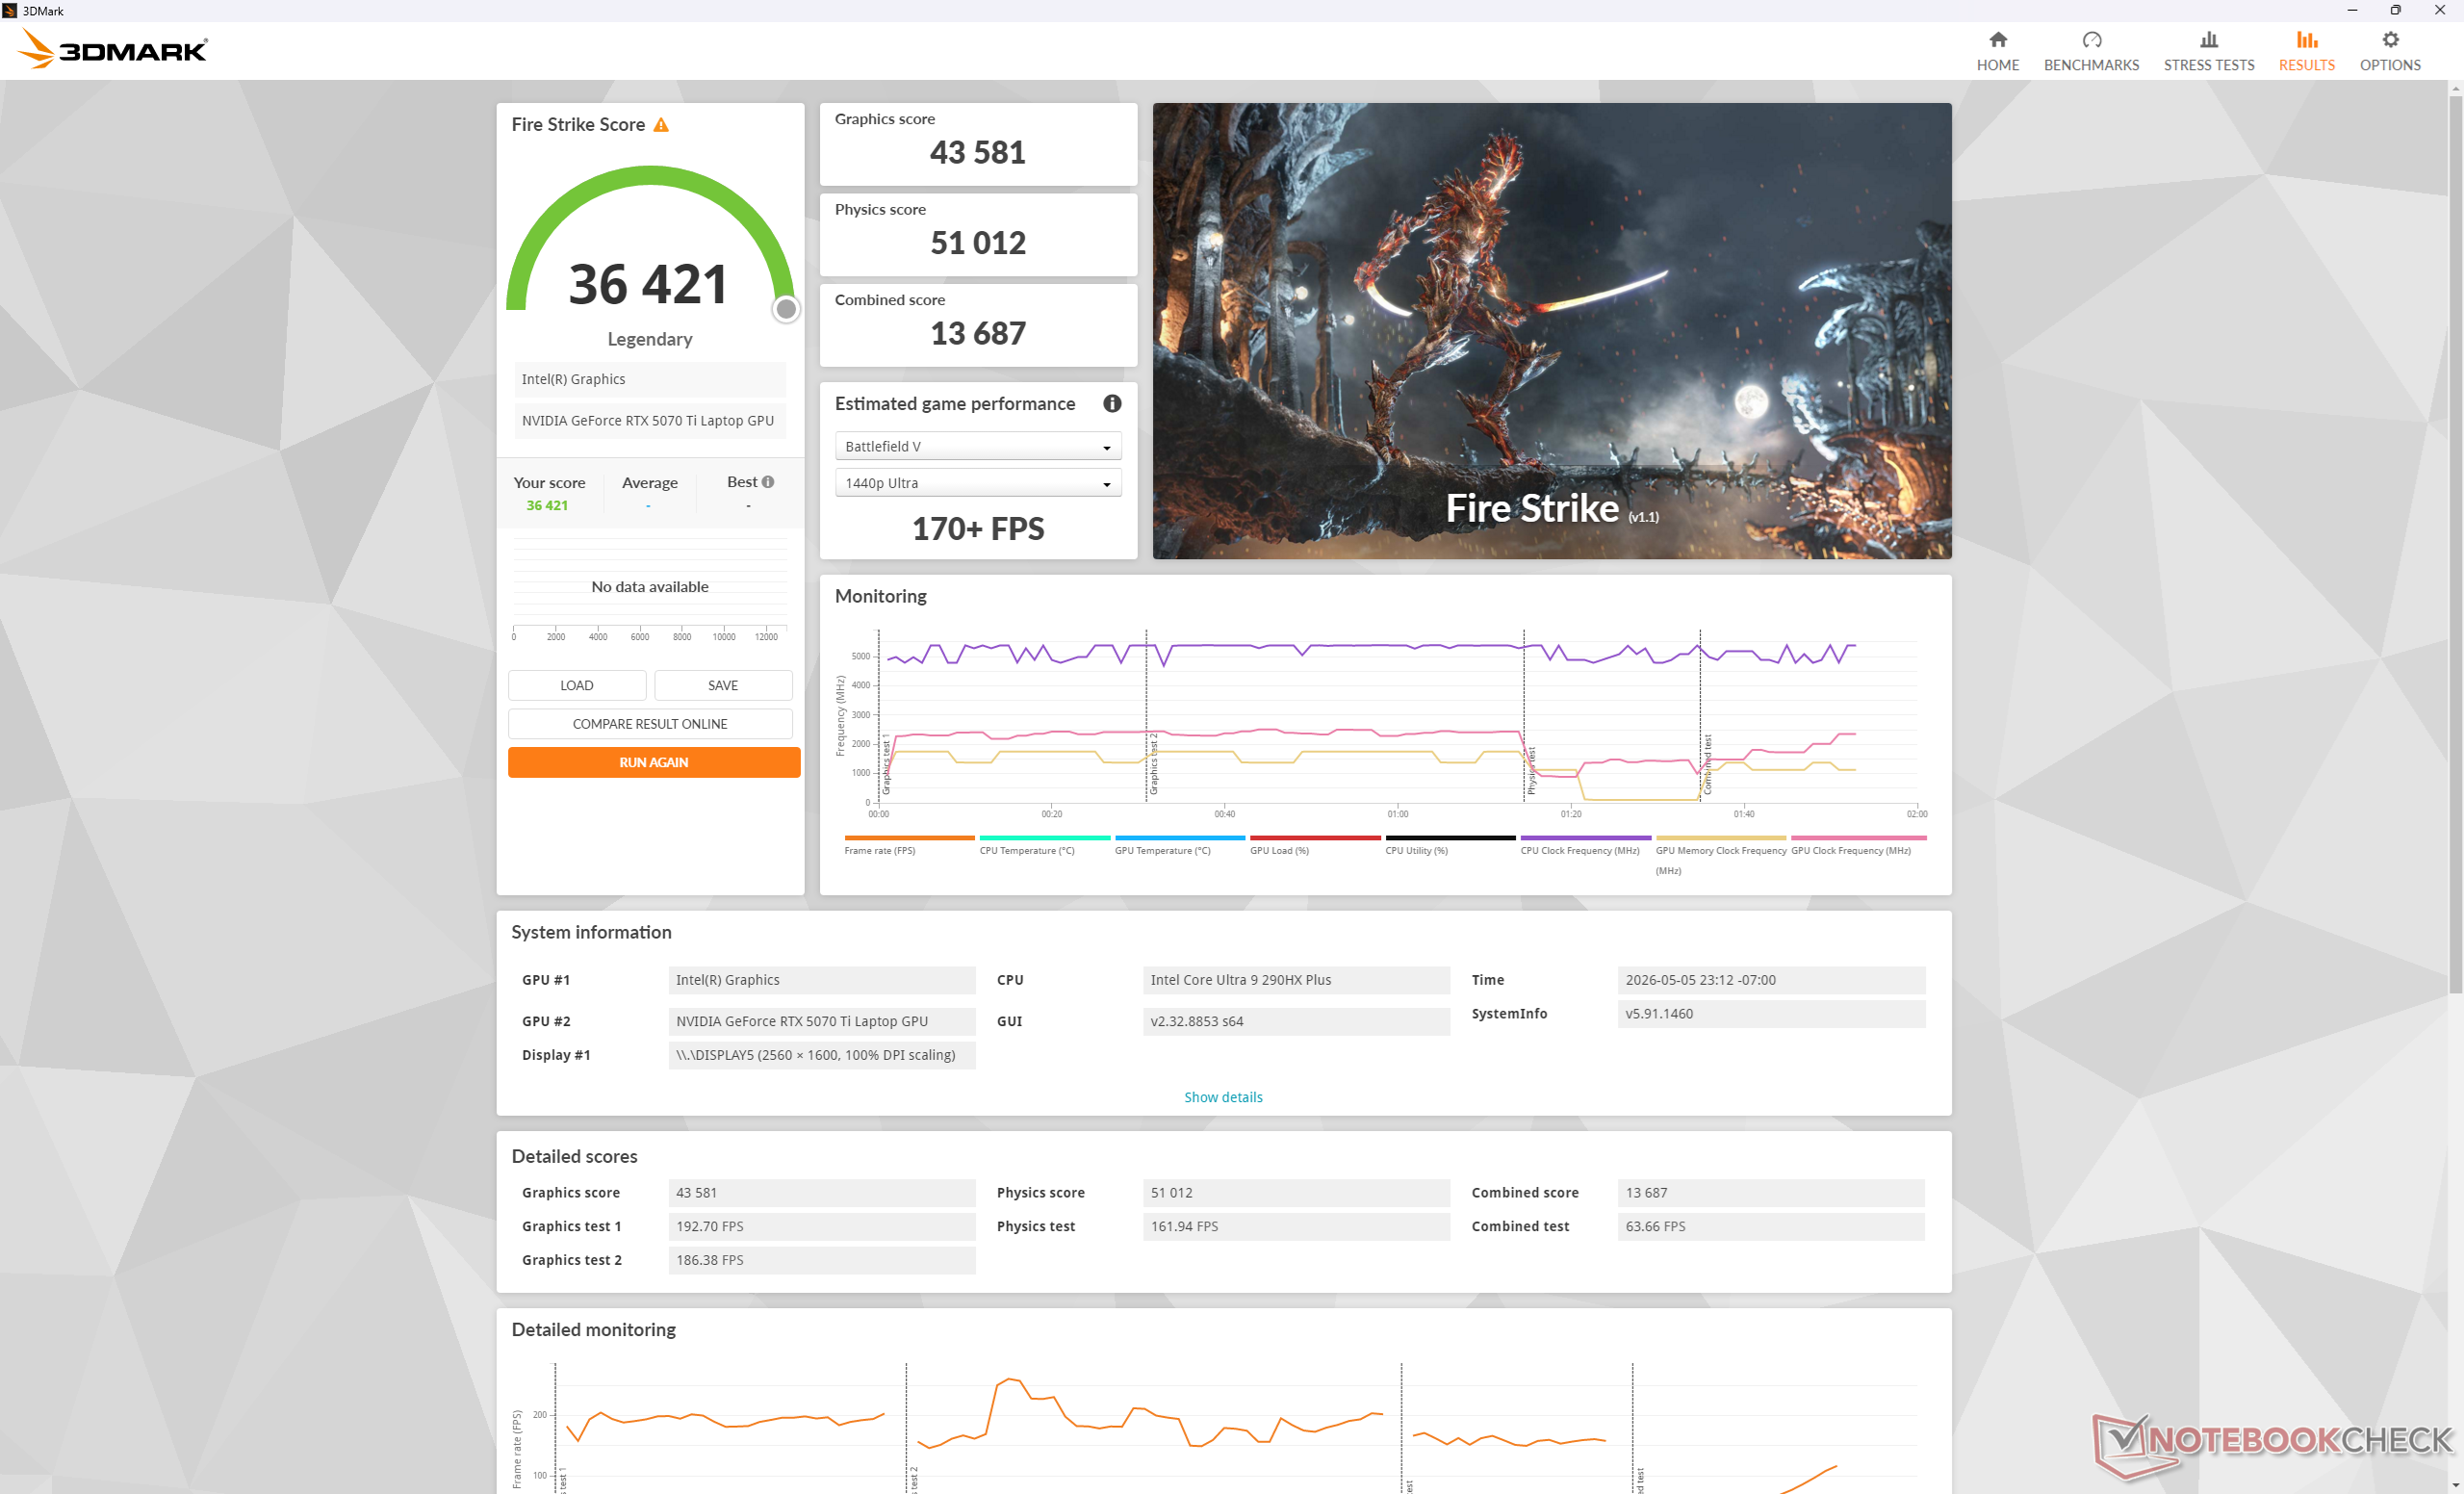
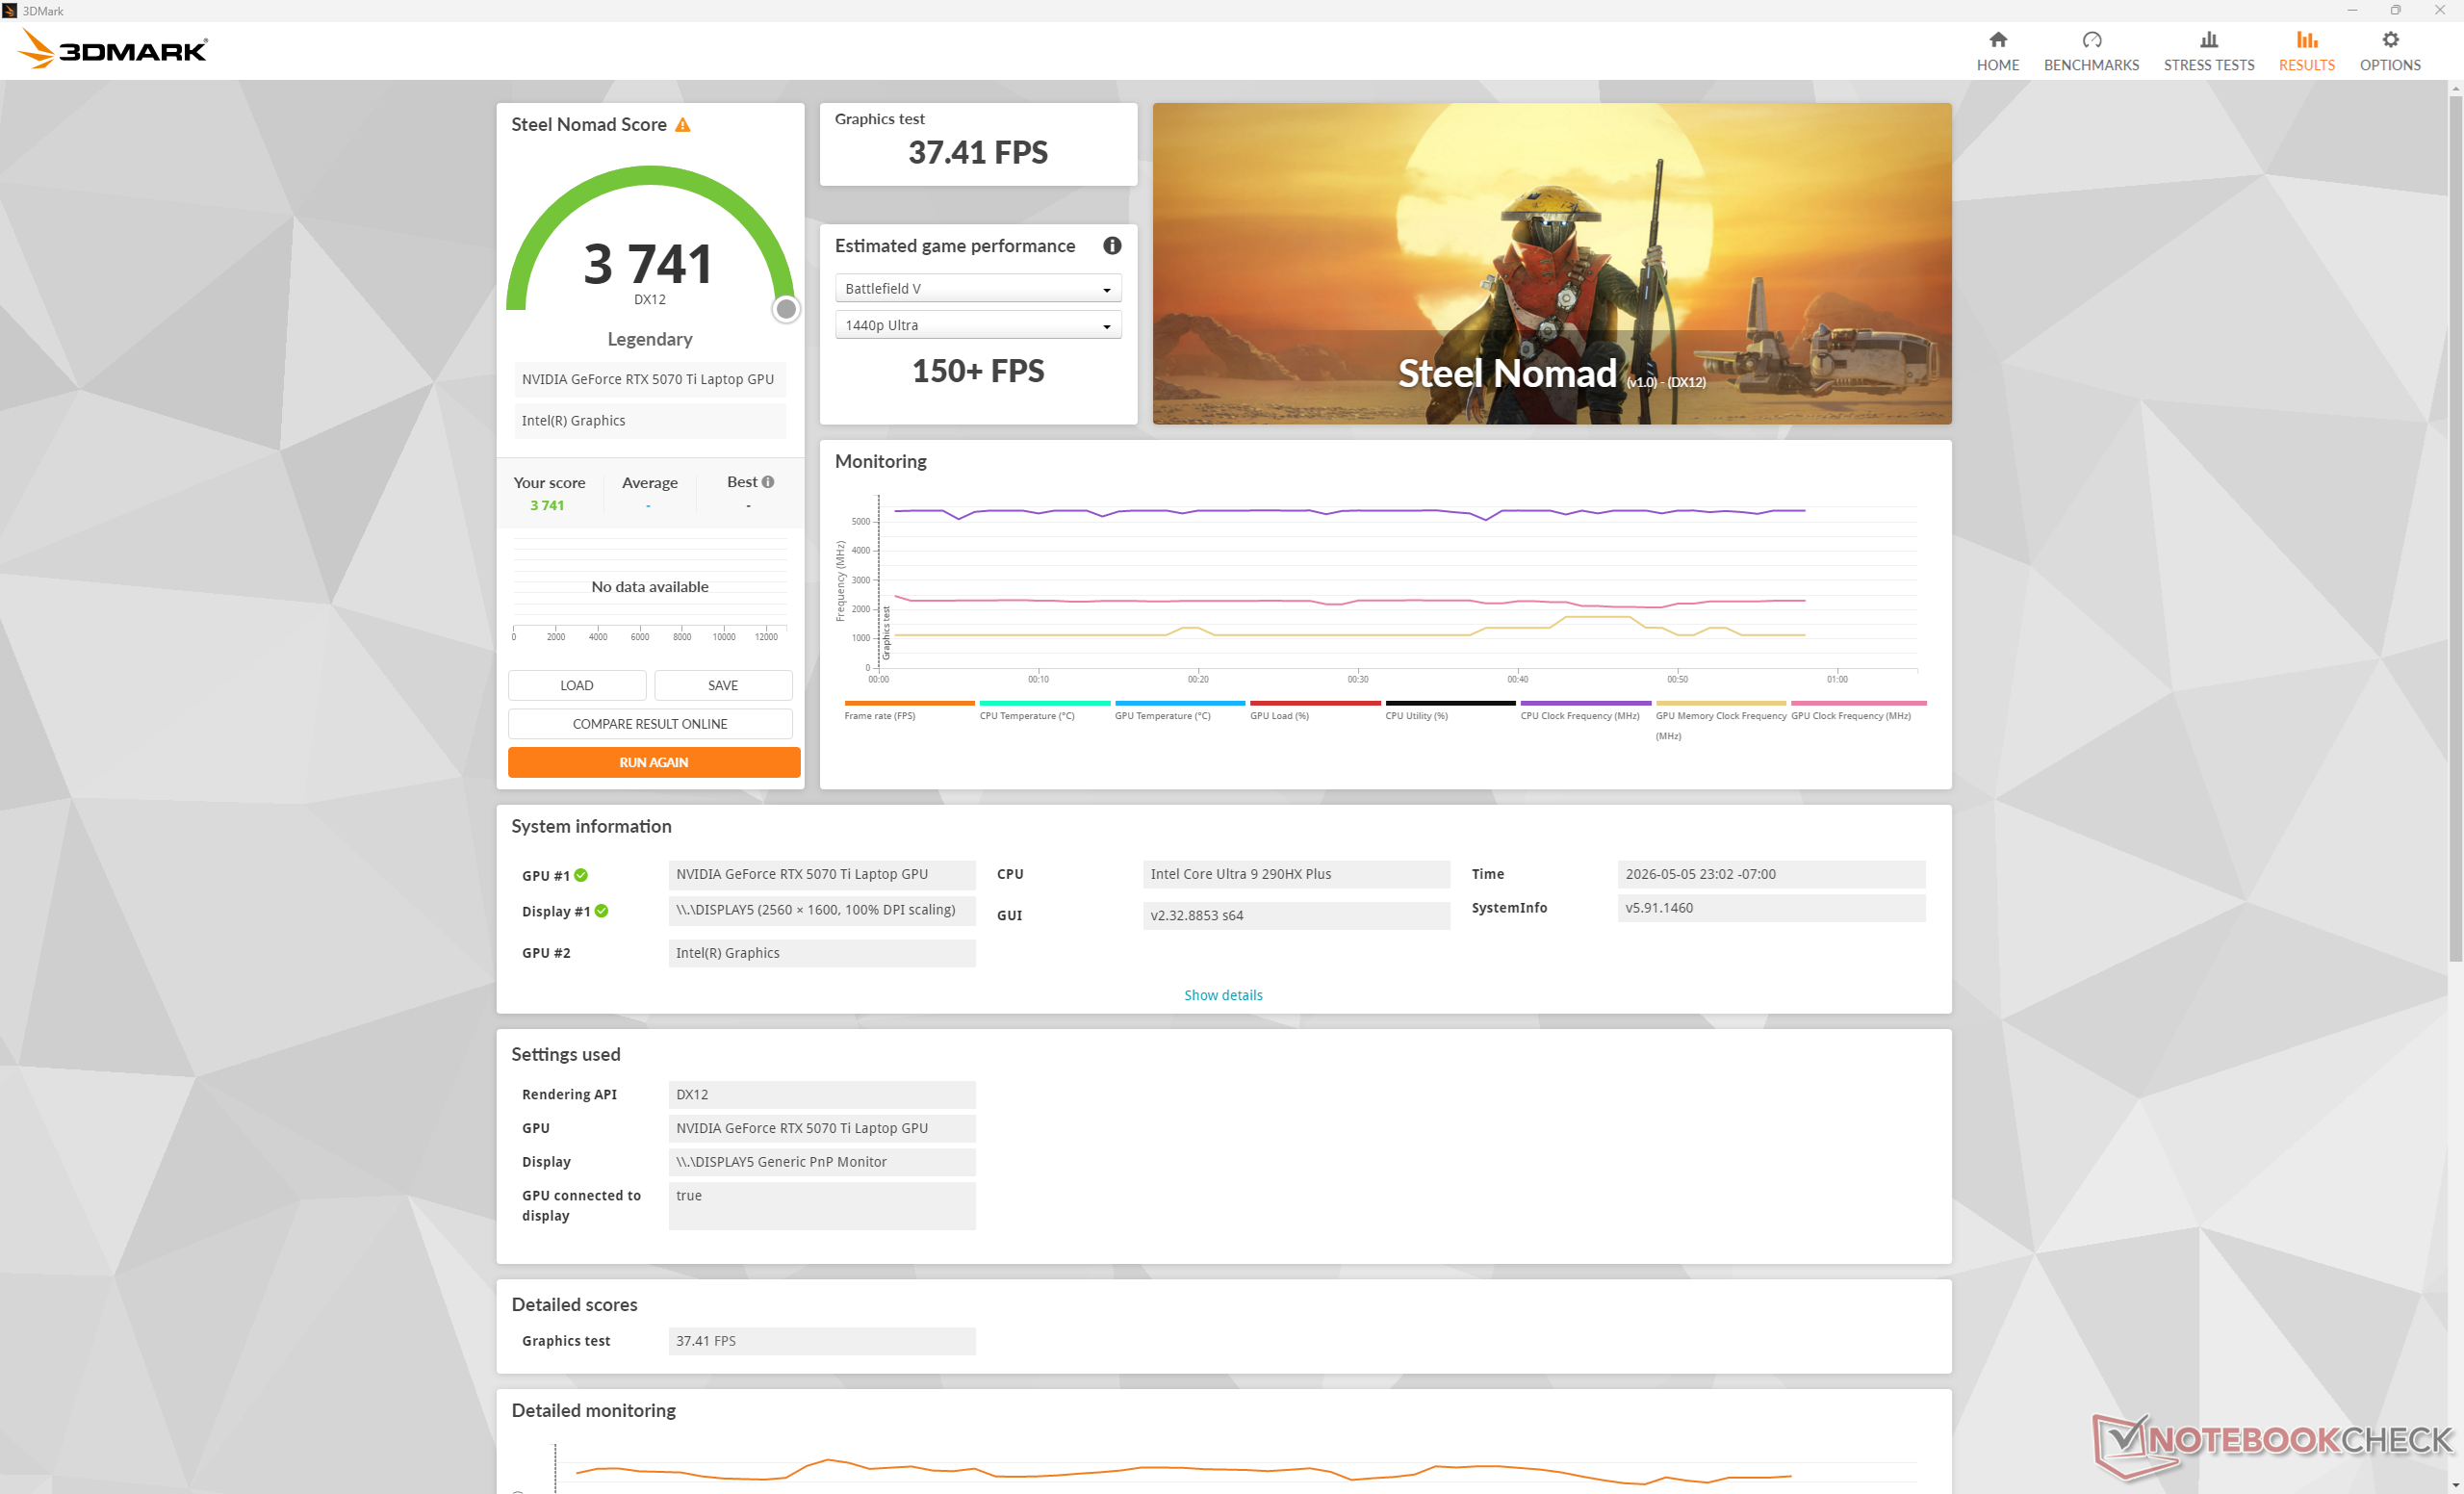
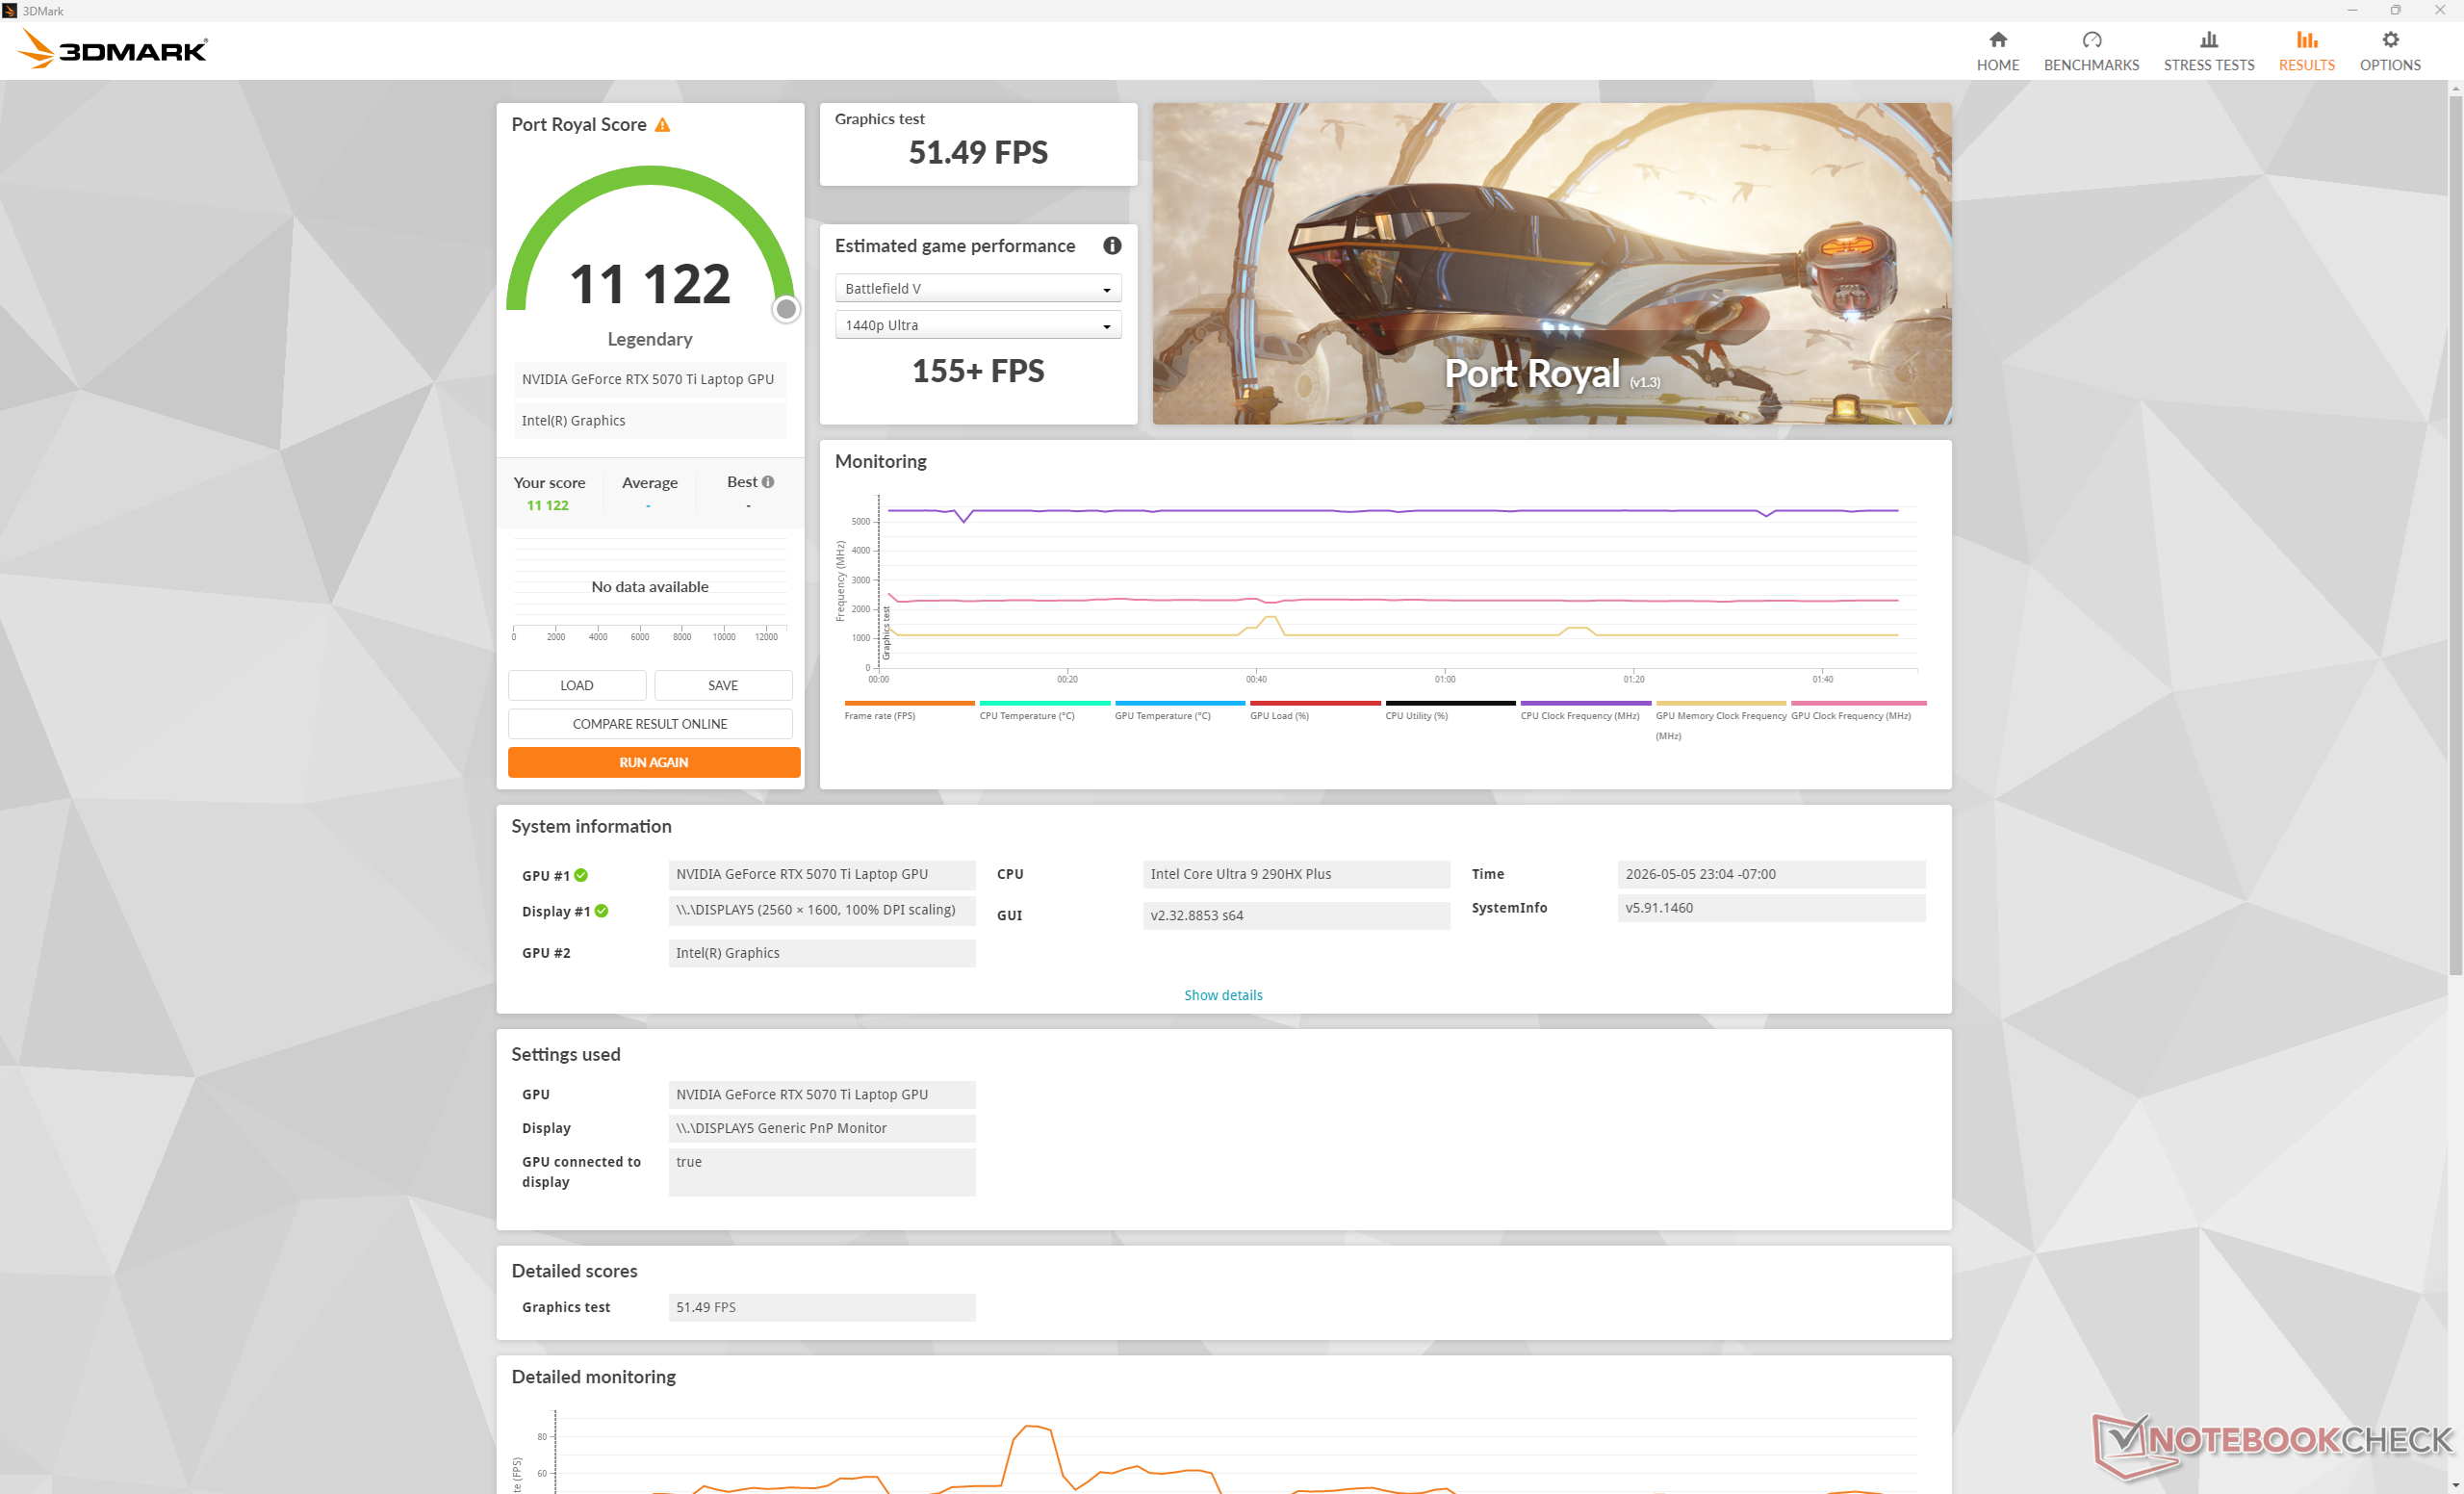
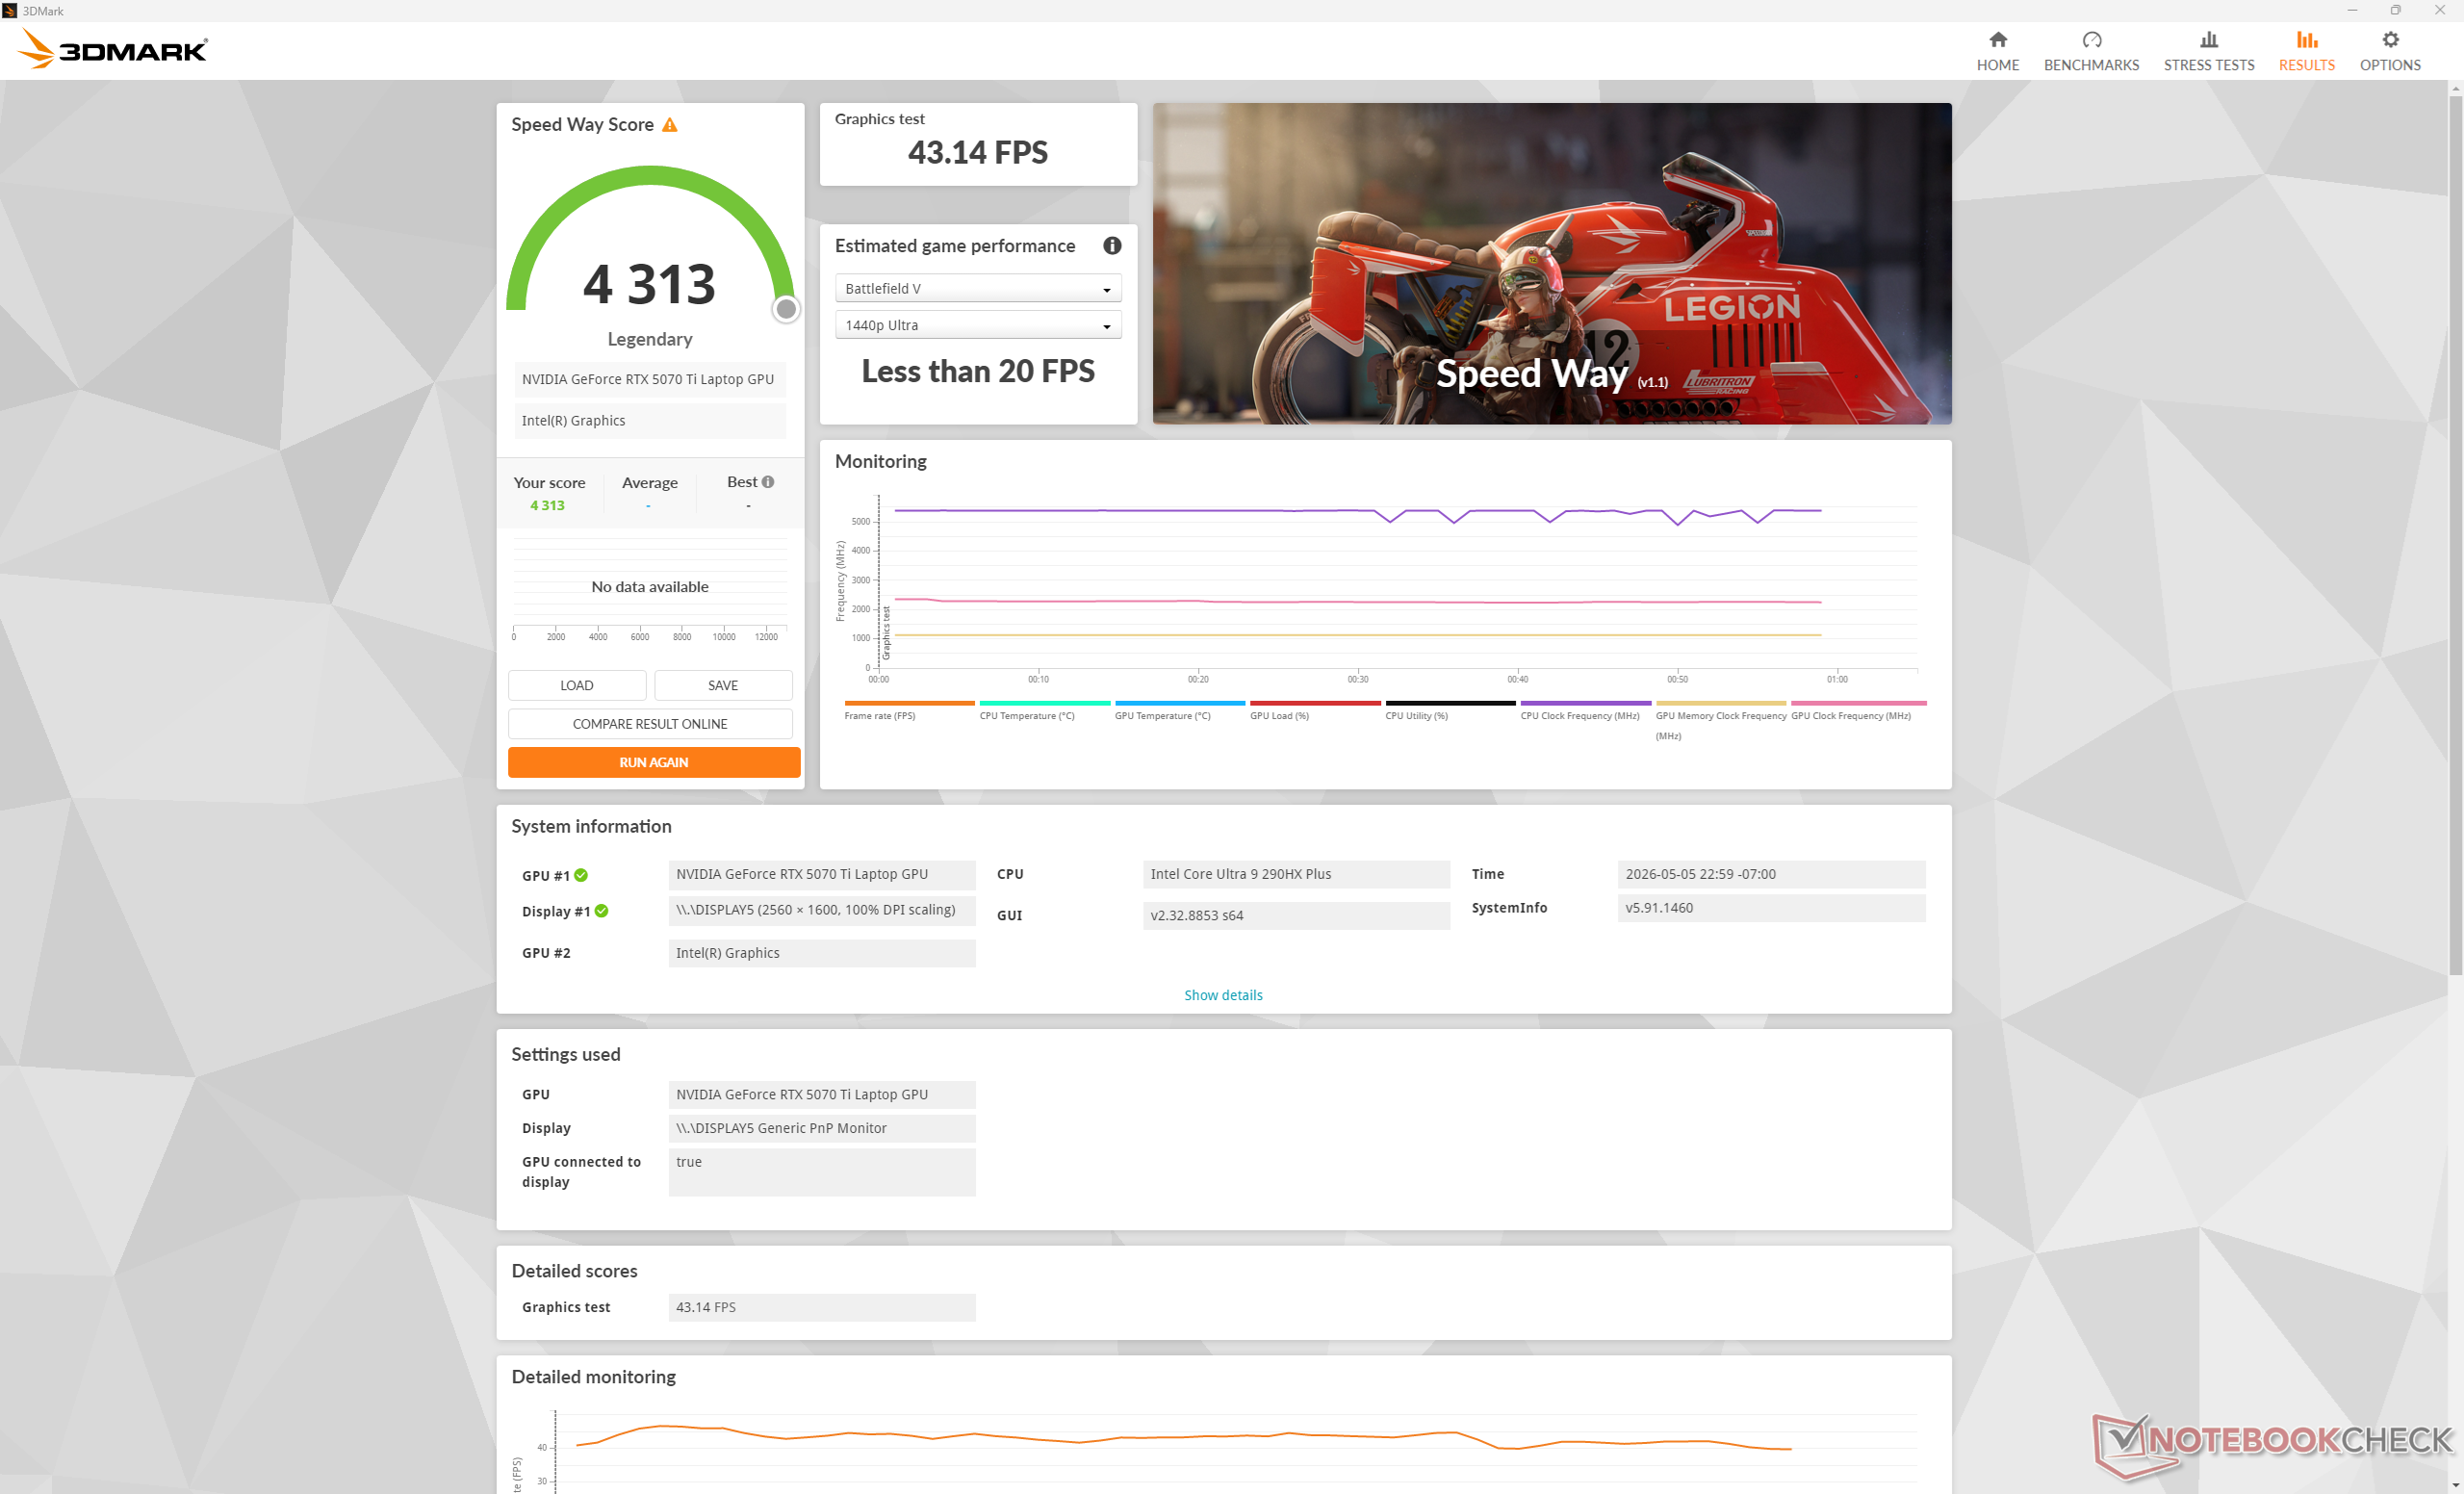
Il GeForce RTX 5070 Ti mobile è circa il 20 percento più veloce della rTX 5070 mobile nella versione 16X Aurora dello scorso anno. In particolare, la RTX 5070 Ti mobile offre più VRAM rispetto alla RTX 5070 mobile rTX 5070 mobile o inferiore.
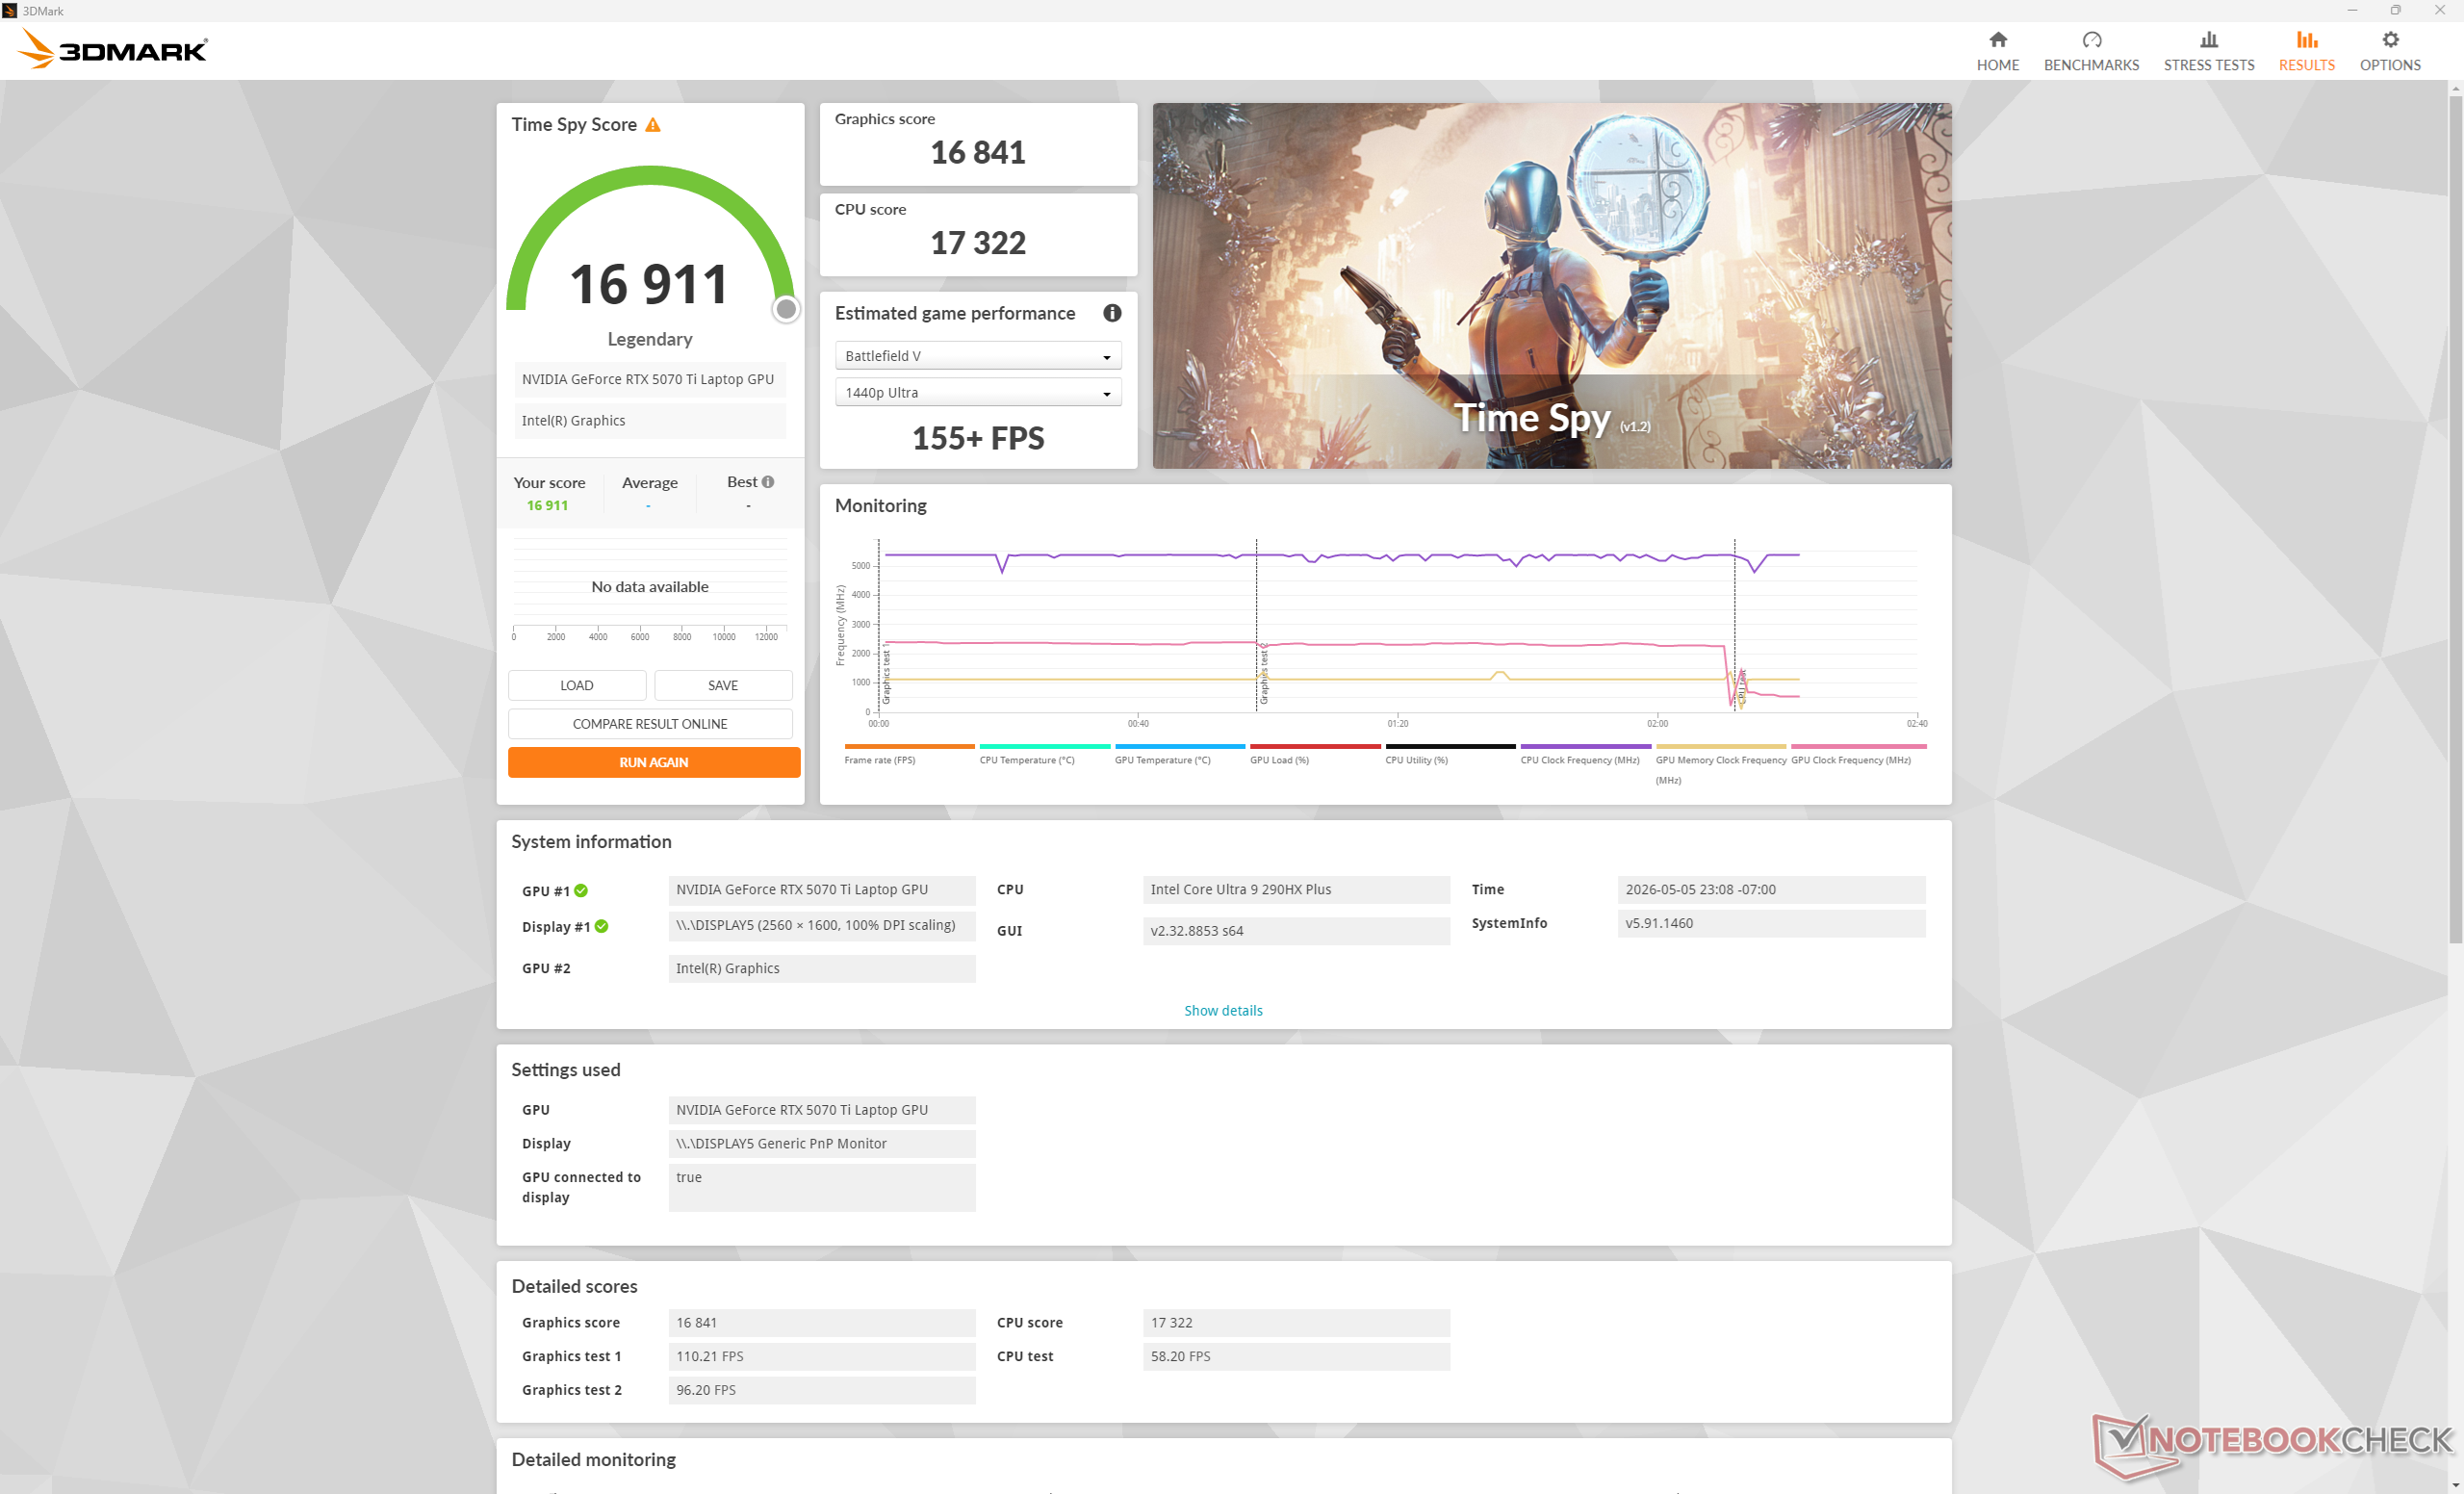
Si noti che l'esecuzione in modalità Performance invece che in modalità Overdrive ha un impatto minimo sulle prestazioni, come dimostrano i risultati di Time Spy qui sotto. Solo quando si scende ulteriormente alla modalità Bilanciata, si nota un impatto sulle prestazioni di gioco.
| Profilo energetico | Punteggio grafico | Punteggio Fisica | Punteggio combinato |
| Modalità Overdrive | 16841 | 17322 | 16911 |
| Modalità Performance | 16458 (-2%) | 17318 (-0%) | 16581 (-2%) |
| Modalità Bilanciata | 15234 (-10%) | 17079 (-1%) | 15484 (-8%) |
| Potenza della batteria | 11934 (-29%) | 14833 (-14%) | 12294 (-27%) |
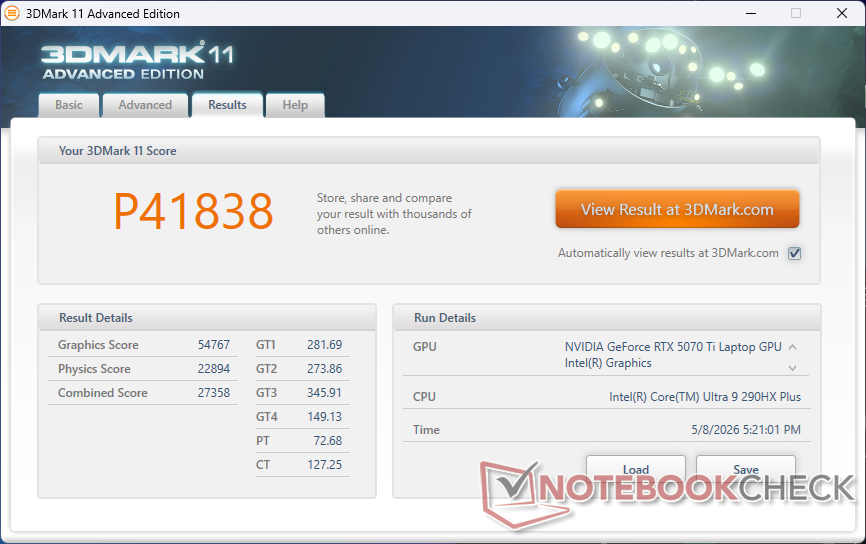
| 3DMark 11 Performance | 41838 punti | |
| 3DMark Cloud Gate Standard Score | 72346 punti | |
| 3DMark Fire Strike Score | 36421 punti | |
| 3DMark Time Spy Score | 16581 punti | |
| 3DMark Steel Nomad Score | 3741 punti | |
Aiuto | ||
* ... Meglio usare valori piccoli
Prestazioni di gioco
Le prestazioni nei giochi sono più veloci del 15% circa in media rispetto a 2025 16X Aurora con GeForce RTX 5070.
| GTA V - 1920x1080 Highest AA:4xMSAA + FX AF:16x | |
| Alienware 16X Aurora Core Ultra 9 290HX Plus | |
| Alienware 16X Aurora, RTX 5070 | |
| Lenovo Legion Pro 5 16IAX10, RTX 5070 | |
| Acer Predator Helios Neo 16S AI PHN16S-71-94L9 | |
| MSI Vector 16 HX AI A2XWHG | |
| Final Fantasy XV Benchmark - 1920x1080 High Quality | |
| MSI Vector 16 HX AI A2XWHG | |
| Alienware 16X Aurora Core Ultra 9 290HX Plus | |
| Alienware 16X Aurora, RTX 5070 | |
| Lenovo Legion Pro 5 16IAX10, RTX 5070 | |
| Asus ROG Zephyrus G16 2025 5070 Ti | |
| Strange Brigade - 1920x1080 ultra AA:ultra AF:16 | |
| Alienware 16X Aurora Core Ultra 9 290HX Plus | |
| Asus ROG Zephyrus G16 2025 5070 Ti | |
| Alienware 16X Aurora, RTX 5070 | |
| Lenovo Legion Pro 5 16IAX10, RTX 5070 | |
Grafico Cyberpunk 2077 ultra FPS
| basso | medio | alto | ultra | QHD DLSS | QHD | |
|---|---|---|---|---|---|---|
| GTA V (2015) | 187.6 | 187.2 | 184.9 | 159.2 | 134.4 | |
| Dota 2 Reborn (2015) | 236 | 207 | 199.9 | 184.7 | ||
| Final Fantasy XV Benchmark (2018) | 233 | 209 | 161.1 | 120.3 | ||
| X-Plane 11.11 (2018) | 154.1 | 137.3 | 110.4 | |||
| Strange Brigade (2018) | 572 | 337 | 281 | 314 | 210 | |
| Baldur's Gate 3 (2023) | 181.6 | 162.4 | 159.3 | 157.7 | 109.5 | |
| Cyberpunk 2077 (2023) | 171.3 | 146.5 | 126.1 | 114.9 | 86.9 | 75.1 |
| F1 24 (2024) | 324 | 318 | 268 | 97.7 | 99 | 62.8 |
| Black Myth: Wukong (2024) | 126 | 94 | 73 | 42 | 47 | 31 |
| Assassin's Creed Shadows (2025) | 89 | 83 | 71 | 52 | 54 | 44 |
Emissioni
Rumore del sistema
Le variazioni dei giri della ventola sono rapide e improvvise quando si introducono carichi più elevati, anche quando è impostato su Optimus e sul profilo energetico Bilanciato. Per il resto, le letture del rumore del soffitto della ventola sono quasi identiche a quelle del modello 2025 e quindi il modello 2026 non è più rumoroso o più silenzioso durante il gioco.
Il rumore della ventola durante l'esecuzione di Cyberpunk 2077 in modalità Bilanciata, Prestazioni e Overdrive si stabilizzava rispettivamente a circa 48,7 dB(A), 51,5 dB(A) e 59,8 dB(A). Poiché i guadagni in termini di prestazioni quando si gioca in modalità Overdrive sono così modesti, consigliamo di giocare in modalità Performance per ottenere ventole significativamente più silenziose.
Rumorosità
| Idle |
| 23.8 / 23.8 / 31.4 dB(A) |
| Sotto carico |
| 48.7 / 59.8 dB(A) |
 | ||
30 dB silenzioso 40 dB(A) udibile 50 dB(A) rumoroso |
||
min: | ||
| Alienware 16X Aurora Core Ultra 9 290HX Plus Ultra 9 290HX Plus, GeForce RTX 5070 Ti Laptop | Alienware 16X Aurora, RTX 5070 Ultra 9 275HX, GeForce RTX 5070 Laptop | Acer Predator Helios Neo 16S AI PHN16S-71-94L9 Ultra 9 275HX, GeForce RTX 5070 Ti Laptop | Lenovo Legion Pro 5 16IAX10, RTX 5070 Ultra 7 255HX, GeForce RTX 5070 Laptop | MSI Vector 16 HX AI A2XWHG Ultra 7 255HX, GeForce RTX 5070 Ti Laptop | Asus ROG Zephyrus G16 GU605CW Ultra 9 285H, GeForce RTX 5080 Laptop | |
|---|---|---|---|---|---|---|
| Noise | 9% | -6% | 8% | -11% | -9% | |
| off /ambiente * (dB) | 23.4 | 23.7 -1% | 24 -3% | 23 2% | 25 -7% | 25.56 -9% |
| Idle Minimum * (dB) | 23.8 | 23.9 -0% | 24 -1% | 23 3% | 33 -39% | 30 -26% |
| Idle Average * (dB) | 23.8 | 23.9 -0% | 30 -26% | 23 3% | 34 -43% | 30 -26% |
| Idle Maximum * (dB) | 31.4 | 26.1 17% | 35 -11% | 23 27% | 38 -21% | 30 4% |
| Load Average * (dB) | 48.7 | 26.8 45% | 53 -9% | 43.85 10% | 46 6% | 53.55 -10% |
| Cyberpunk 2077 ultra * (dB) | 51.5 | 51.8 -1% | 52 -1% | 50.27 2% | 47 9% | 53.5 -4% |
| Load Maximum * (dB) | 59.8 | 58 3% | 54 10% | 52.9 12% | 49 18% | 54.02 10% |
* ... Meglio usare valori piccoli
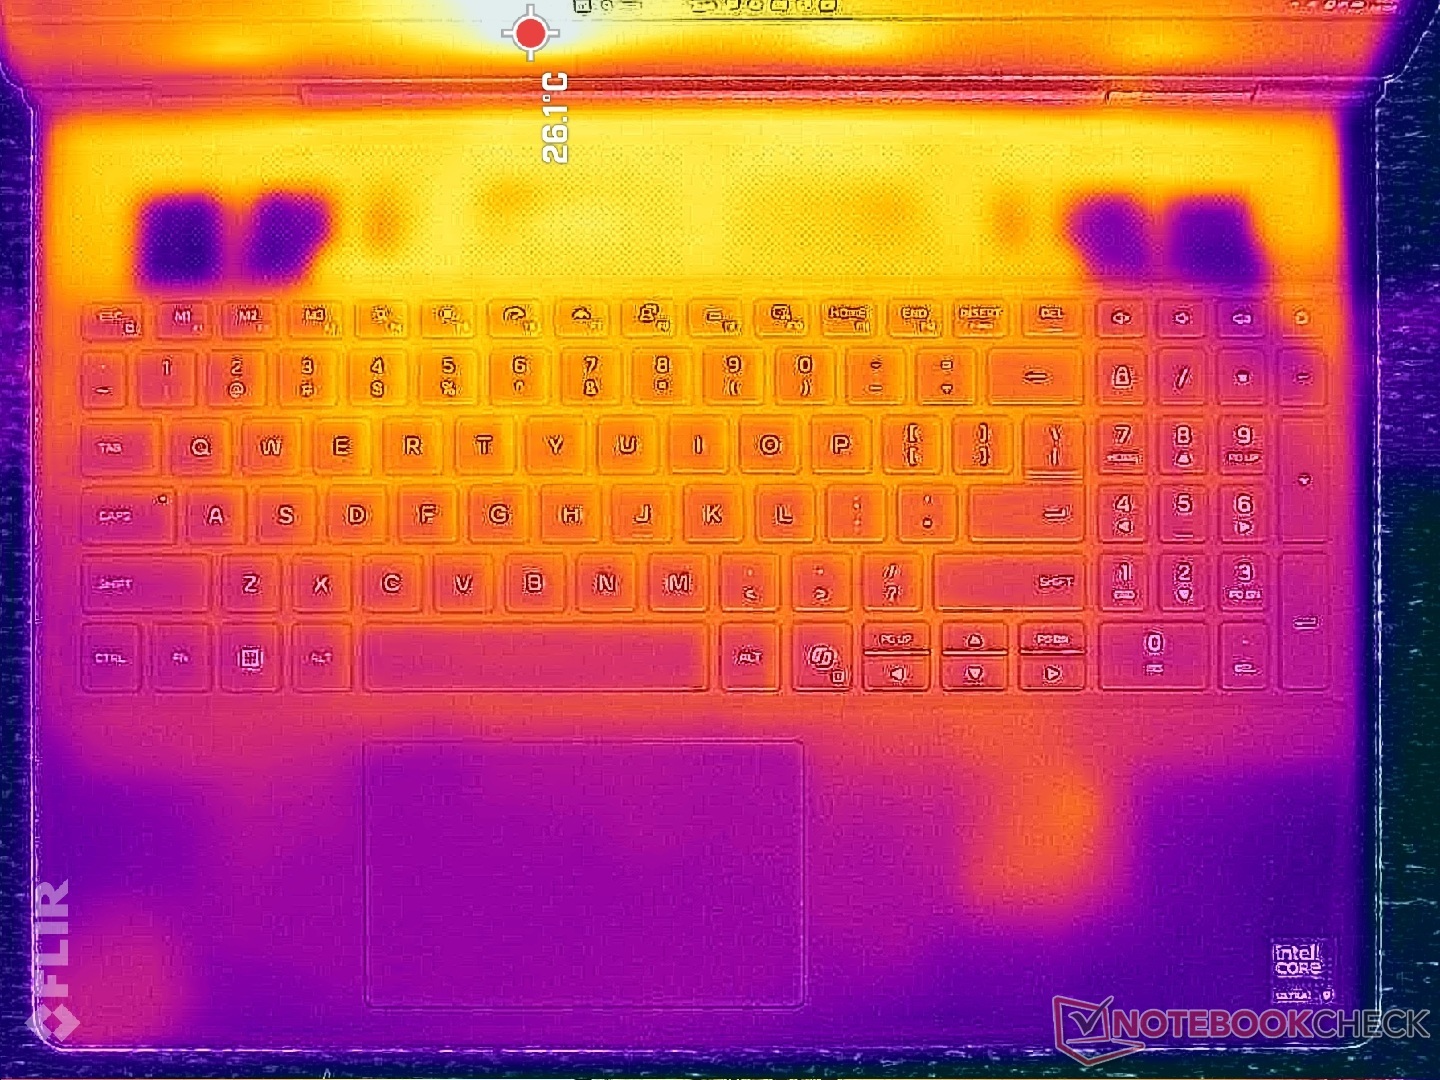
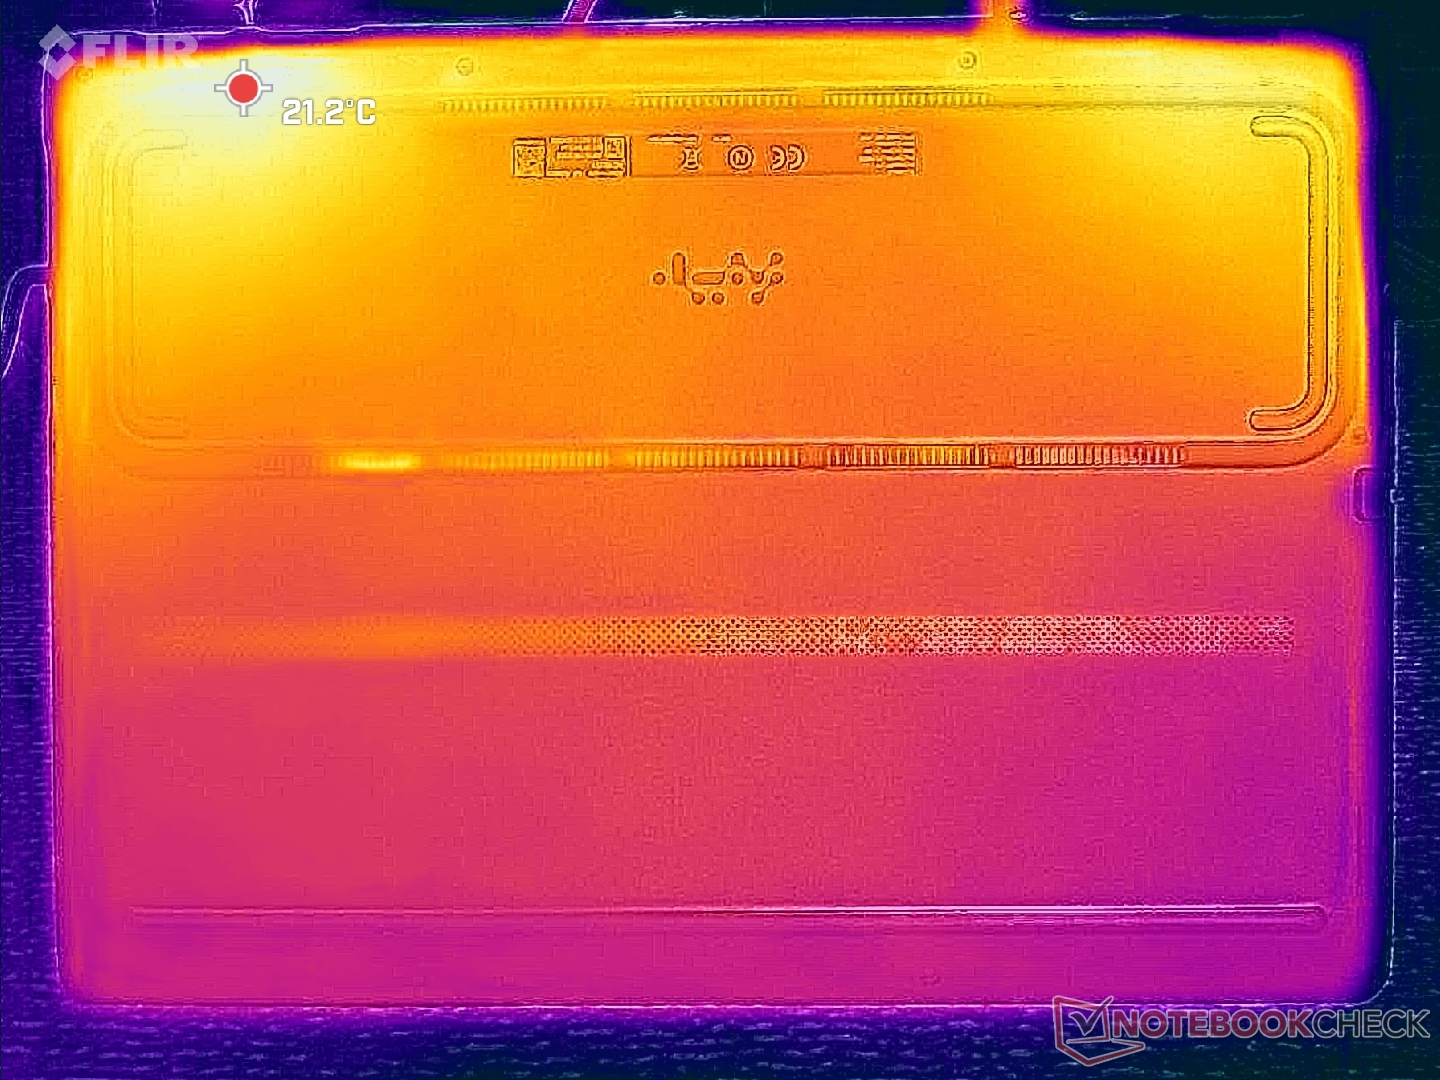
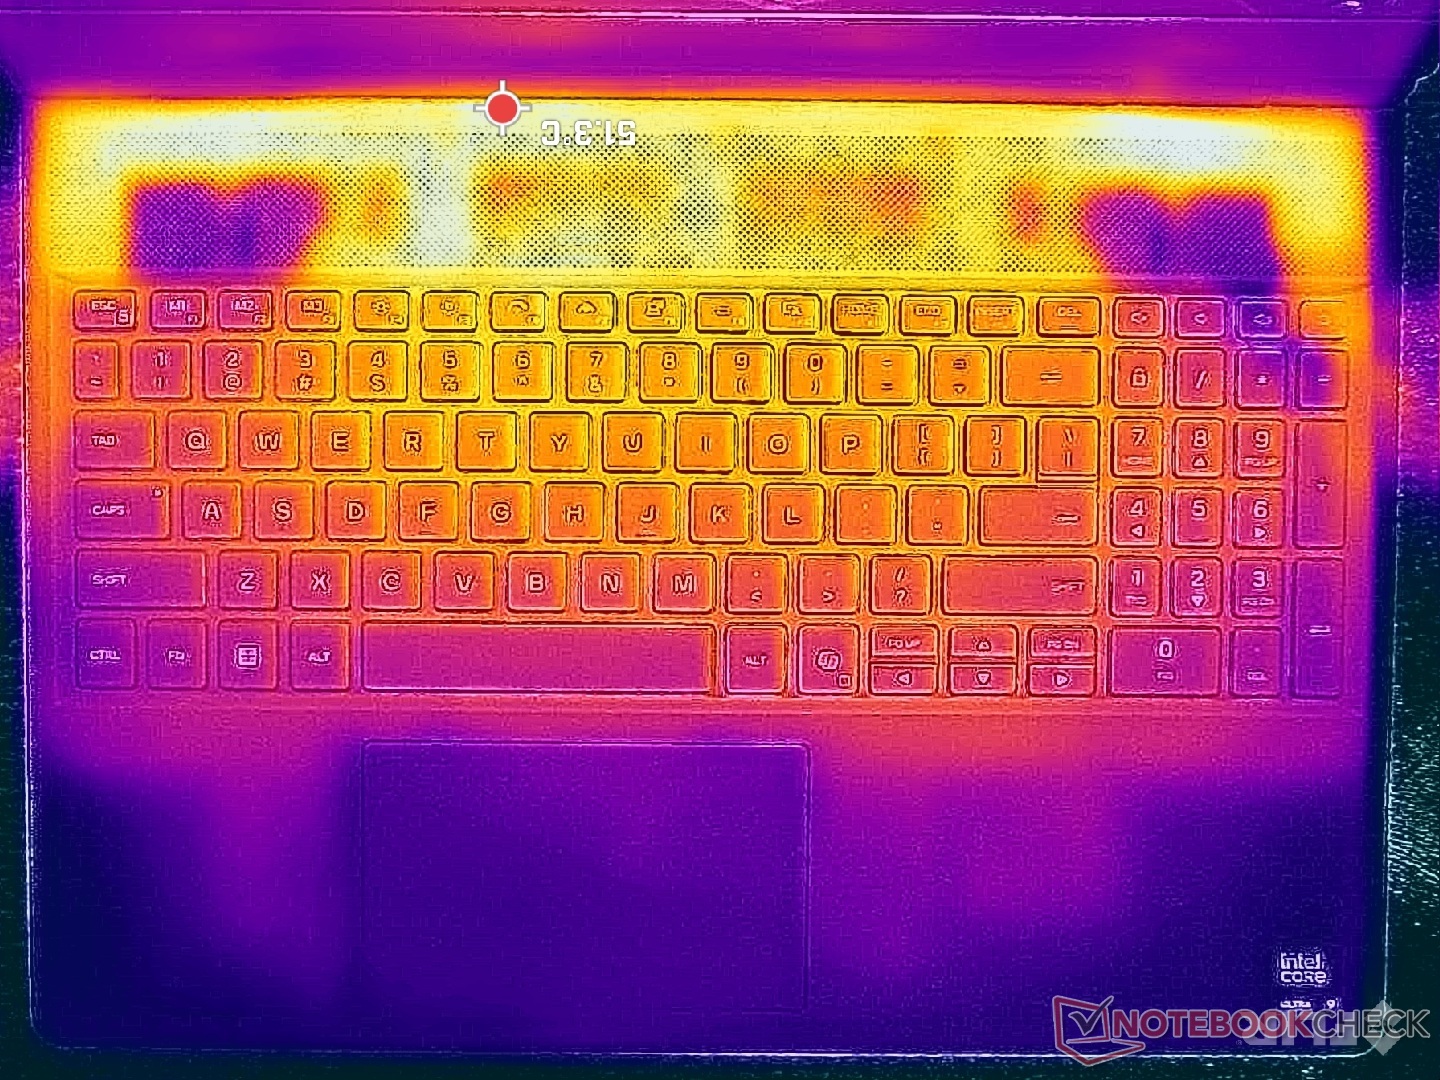
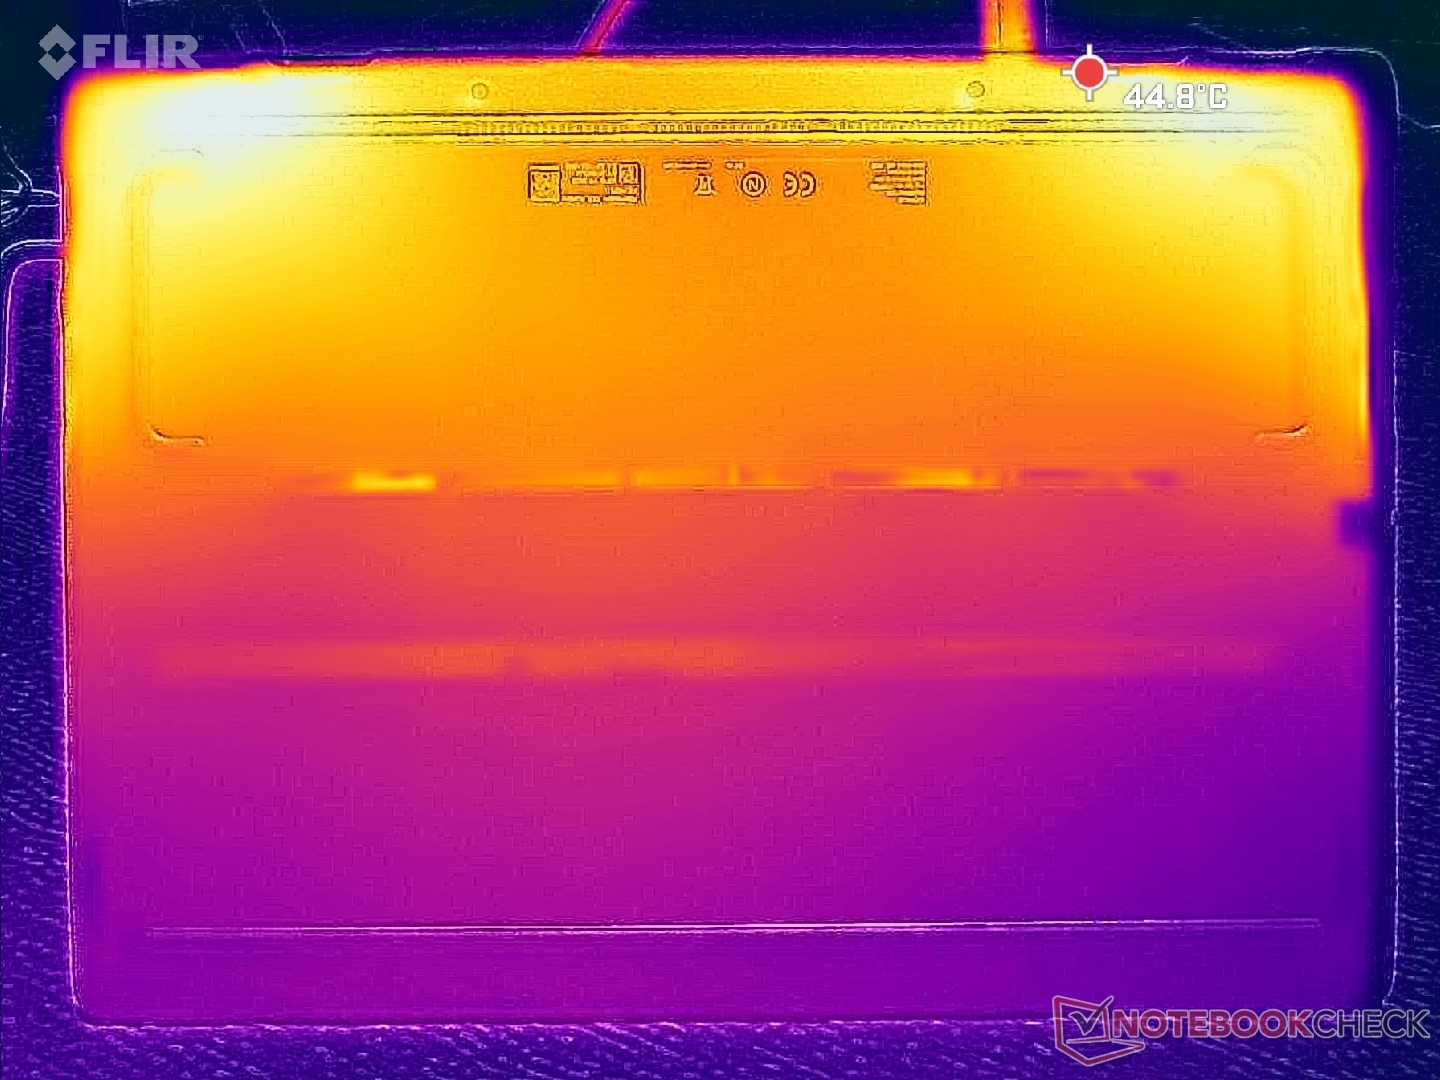
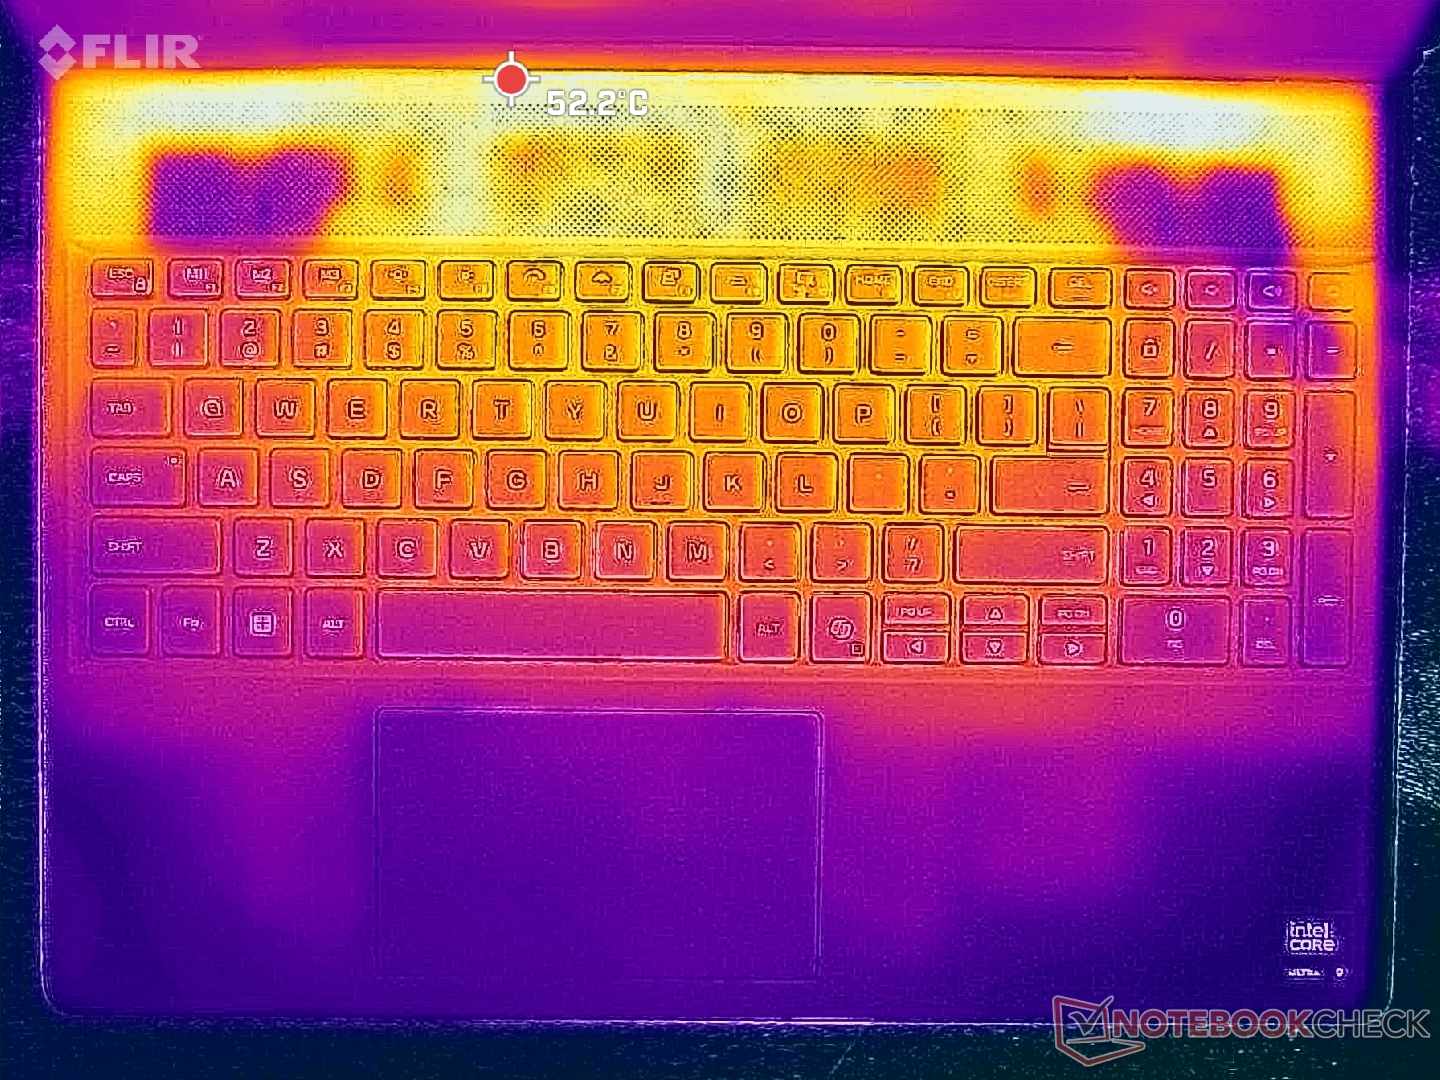
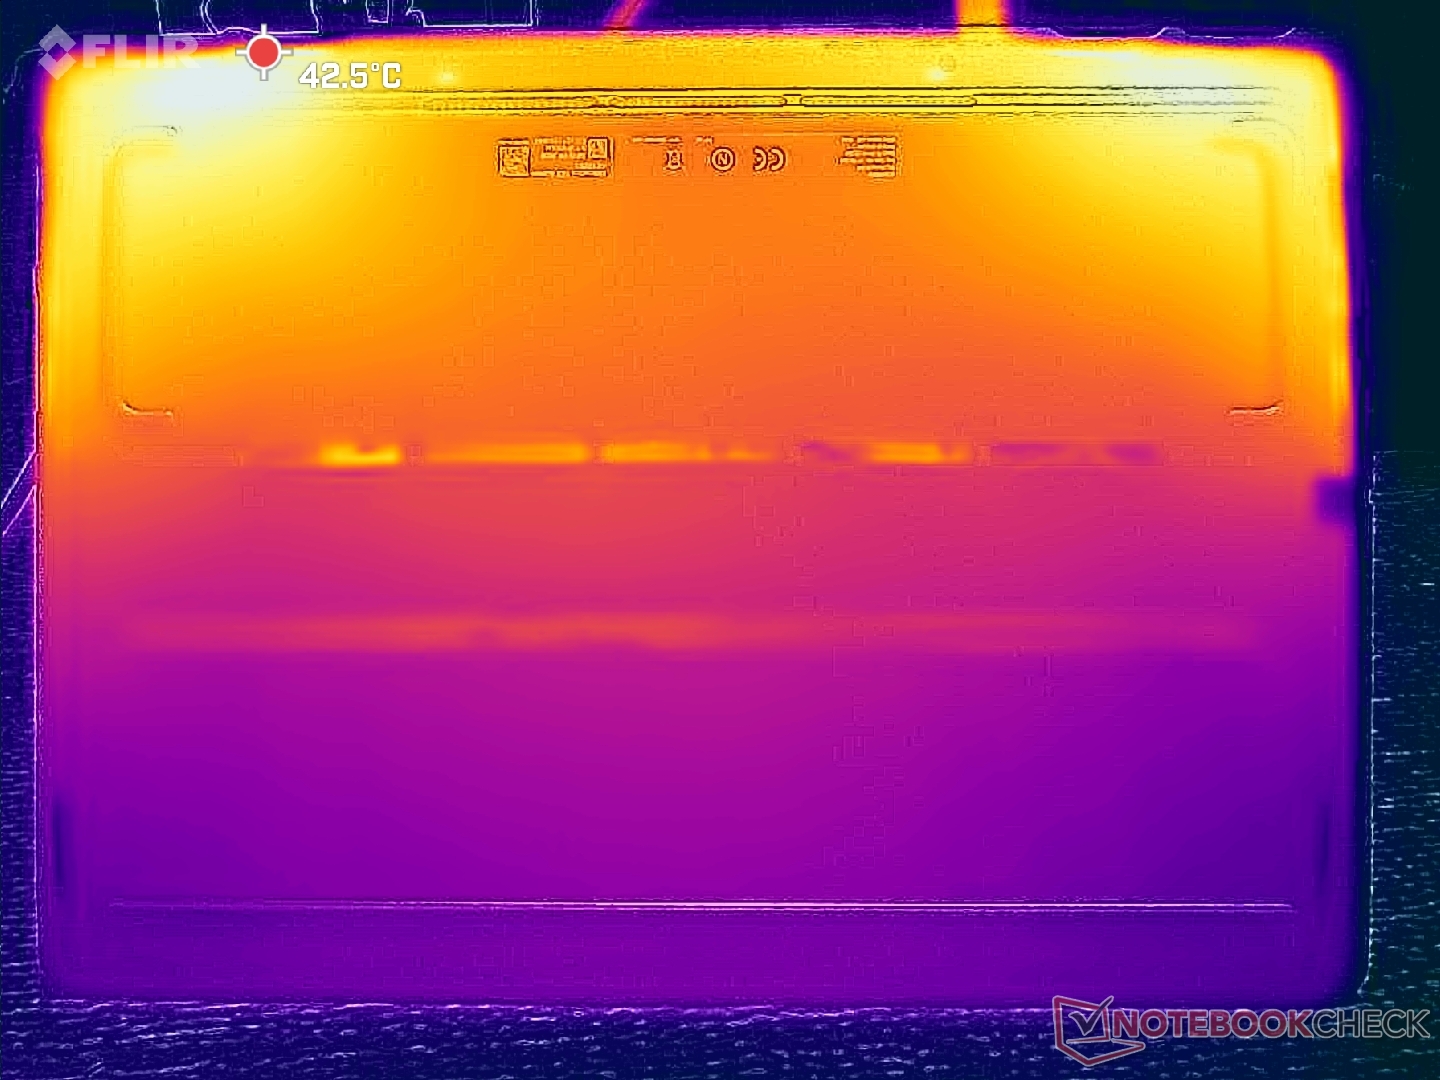
Temperatura
Le temperature di superficie sono leggermente più fredde, in media di qualche grado C, rispetto a quanto abbiamo registrato nella configurazione dello scorso anno. I risultati sono correlati alle nostre analisi nella sezione Stress Test qui sotto.
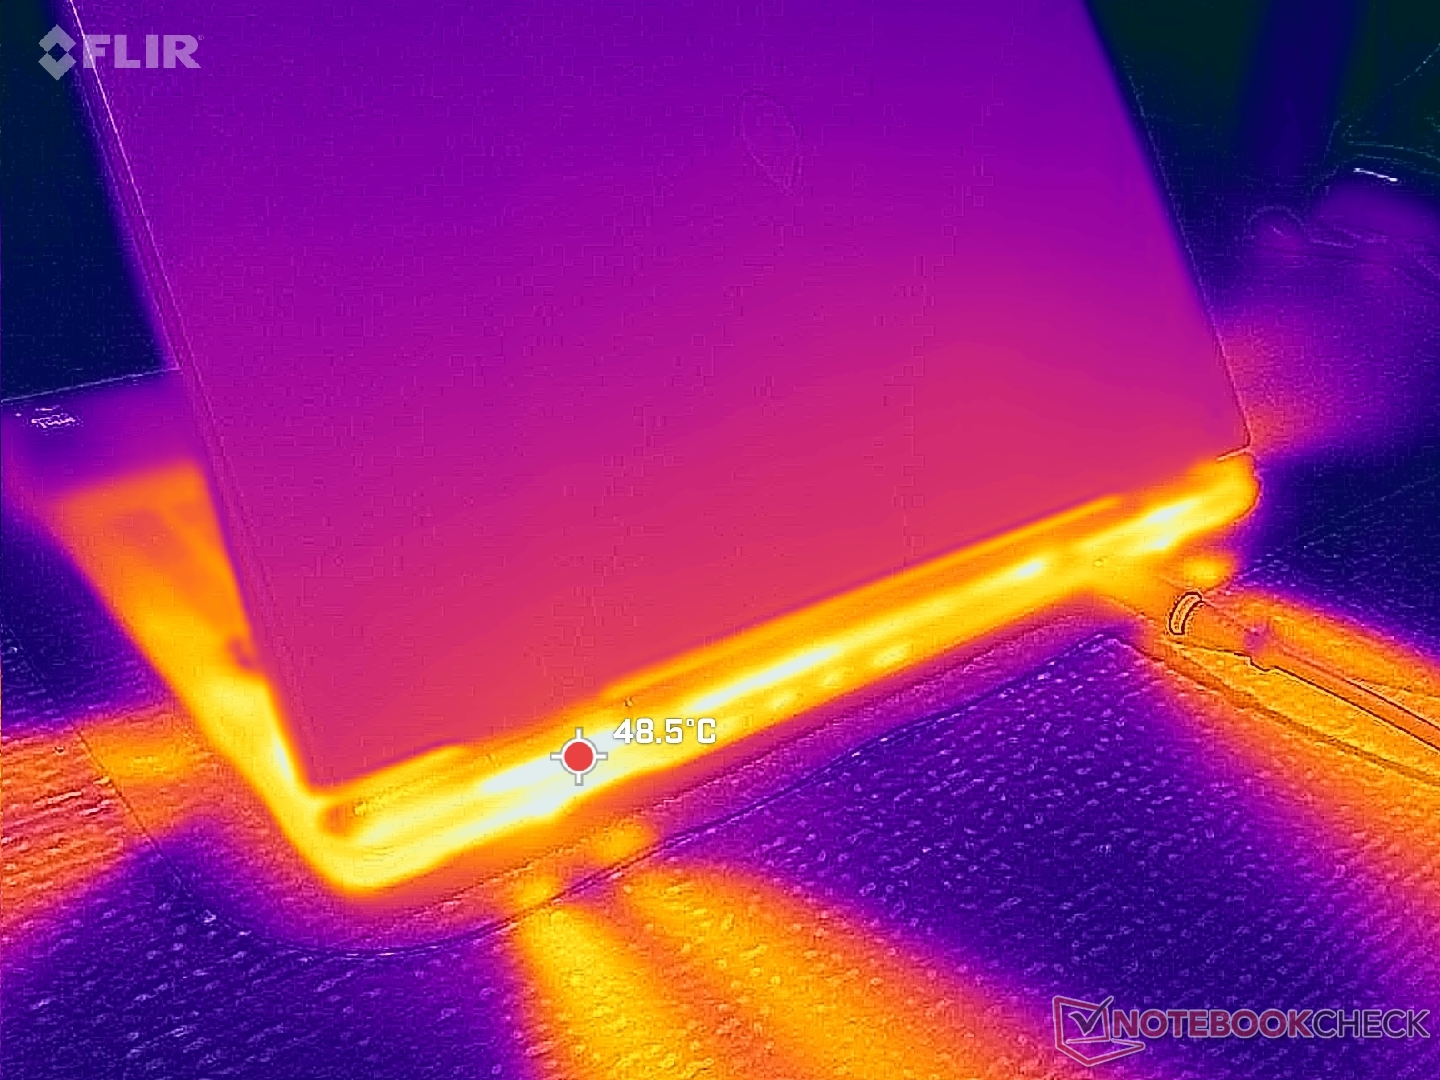
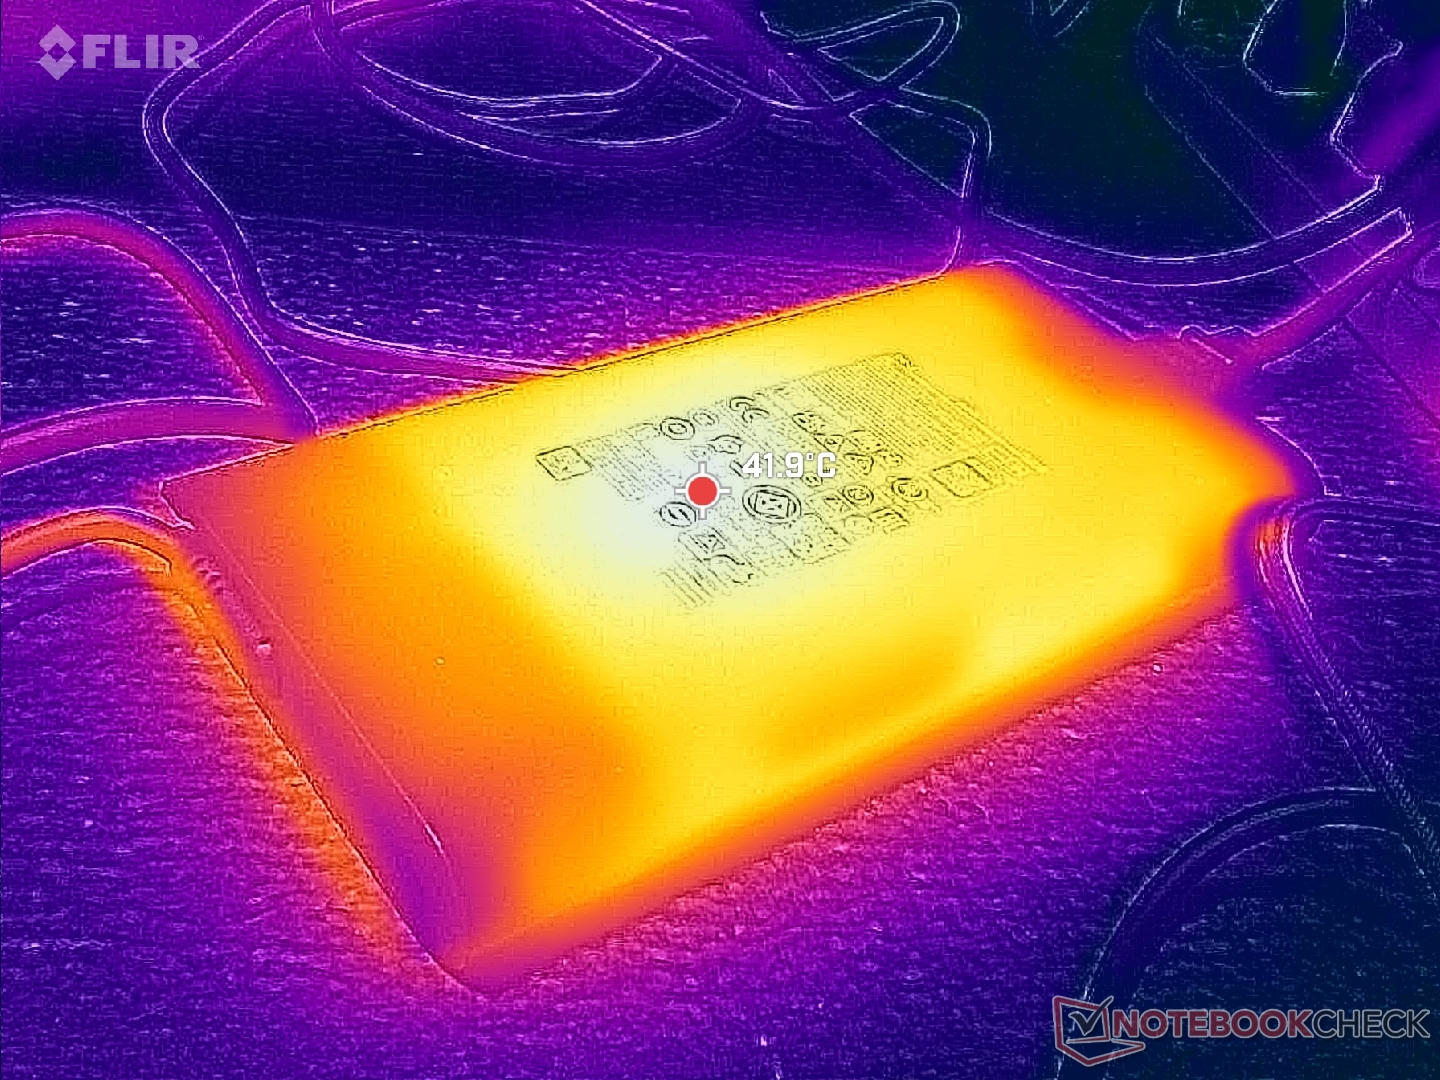
(-) La temperatura massima sul lato superiore è di 48.2 °C / 119 F, rispetto alla media di 40.4 °C / 105 F, che varia da 21.2 a 68.8 °C per questa classe Gaming.
(±) Il lato inferiore si riscalda fino ad un massimo di 41 °C / 106 F, rispetto alla media di 43.2 °C / 110 F
(+) In idle, la temperatura media del lato superiore è di 26 °C / 79 F, rispetto alla media deld ispositivo di 33.9 °C / 93 F.
(-) 3: The average temperature for the upper side is 39.4 °C / 103 F, compared to the average of 33.9 °C / 93 F for the class Gaming.
(+) I poggiapolsi e il touchpad sono piu' freddi della temperatura della pelle con un massimo di 31 °C / 87.8 F e sono quindi freddi al tatto.
(-) La temperatura media della zona del palmo della mano di dispositivi simili e'stata di 28.8 °C / 83.8 F (-2.2 °C / -4 F).
| Alienware 16X Aurora Core Ultra 9 290HX Plus Ultra 9 290HX Plus, GeForce RTX 5070 Ti Laptop | Alienware 16X Aurora, RTX 5070 Ultra 9 275HX, GeForce RTX 5070 Laptop | Acer Predator Helios Neo 16S AI PHN16S-71-94L9 Ultra 9 275HX, GeForce RTX 5070 Ti Laptop | Lenovo Legion Pro 5 16IAX10, RTX 5070 Ultra 7 255HX, GeForce RTX 5070 Laptop | MSI Vector 16 HX AI A2XWHG Ultra 7 255HX, GeForce RTX 5070 Ti Laptop | Asus ROG Zephyrus G16 GU605CW Ultra 9 285H, GeForce RTX 5080 Laptop | |
|---|---|---|---|---|---|---|
| Heat | -7% | -11% | -10% | -16% | -25% | |
| Maximum Upper Side * (°C) | 48.2 | 51 -6% | 47 2% | 42 13% | 53 -10% | 49.2 -2% |
| Maximum Bottom * (°C) | 41 | 45.6 -11% | 55 -34% | 44 -7% | 52 -27% | 50.2 -22% |
| Idle Upper Side * (°C) | 28.2 | 29.8 -6% | 28 1% | 33 -17% | 33 -17% | 37.2 -32% |
| Idle Bottom * (°C) | 26.2 | 27.4 -5% | 29 -11% | 34 -30% | 29 -11% | 37.4 -43% |
* ... Meglio usare valori piccoli
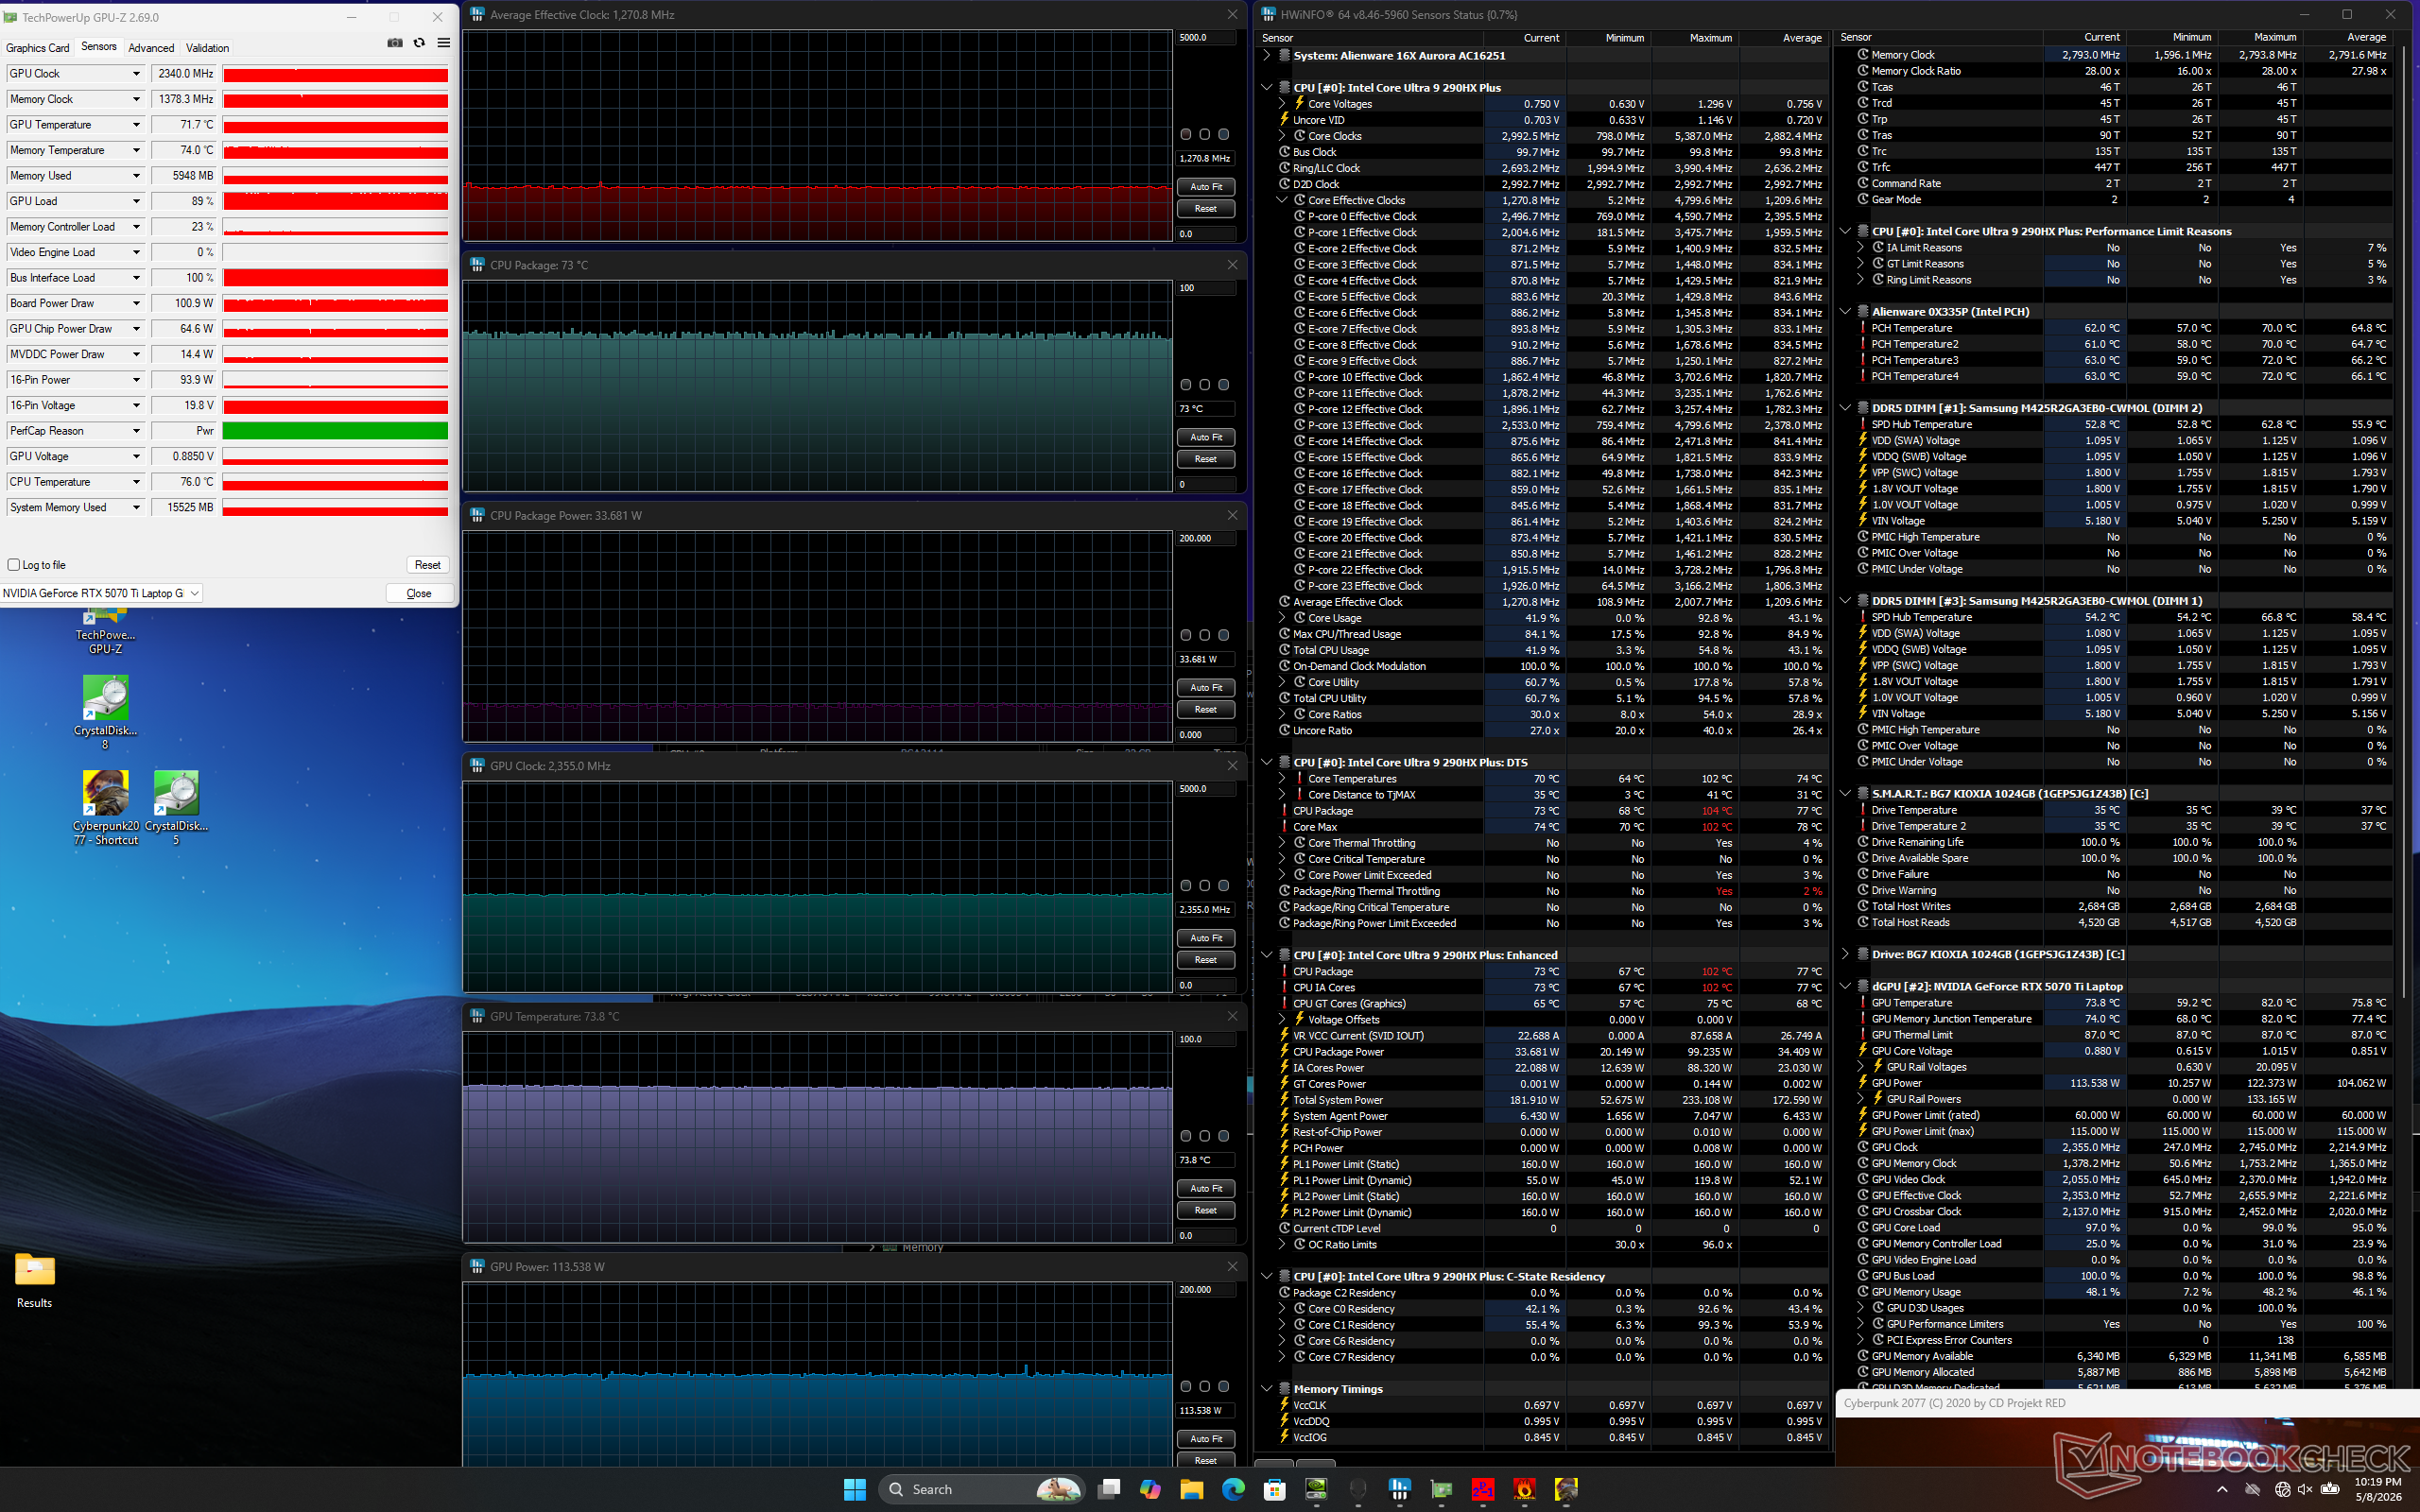
Test da sforzo
La temperatura del core durante l'esecuzione di Prime95 su un'unità 16X Aurora avrebbe raggiunto quasi 100 C. Il Core Ultra 9 290HX Plus nel modello 2026 16X Aurora punta a velocità di clock ancora più elevate che, senza sorpresa, avrebbero raggiunto quasi 100 C durante l'esecuzione di Prime95. Probabilmente la CPU avrebbe potuto ottenere prestazioni migliori se la soluzione di raffreddamento del portatile fosse stata più efficace. Ad esempio, la CPU avrebbe raggiunto i 4,3 GHz e 163 W solo per uno o due secondi, prima di scendere costantemente a 3,4 GHz e 97 W, a indicare un potenziale Turbo Boost limitato.
Le temperature del core durante il gioco sono altrimenti più basse sul modello di quest'anno rispetto a quello precedente, a causa delle differenze di configurazione. Più precisamente, la RTX 5070 Ti punta a velocità di clock più basse rispetto alla RTX 5070 per temperature di esercizio che sono costantemente di qualche grado C più fredde. L'assorbimento di potenza della GPU in modalità Overdrive, Performance e Balanced si stabilizzerebbe a 114 W, 97 W e 84 W, rispettivamente.
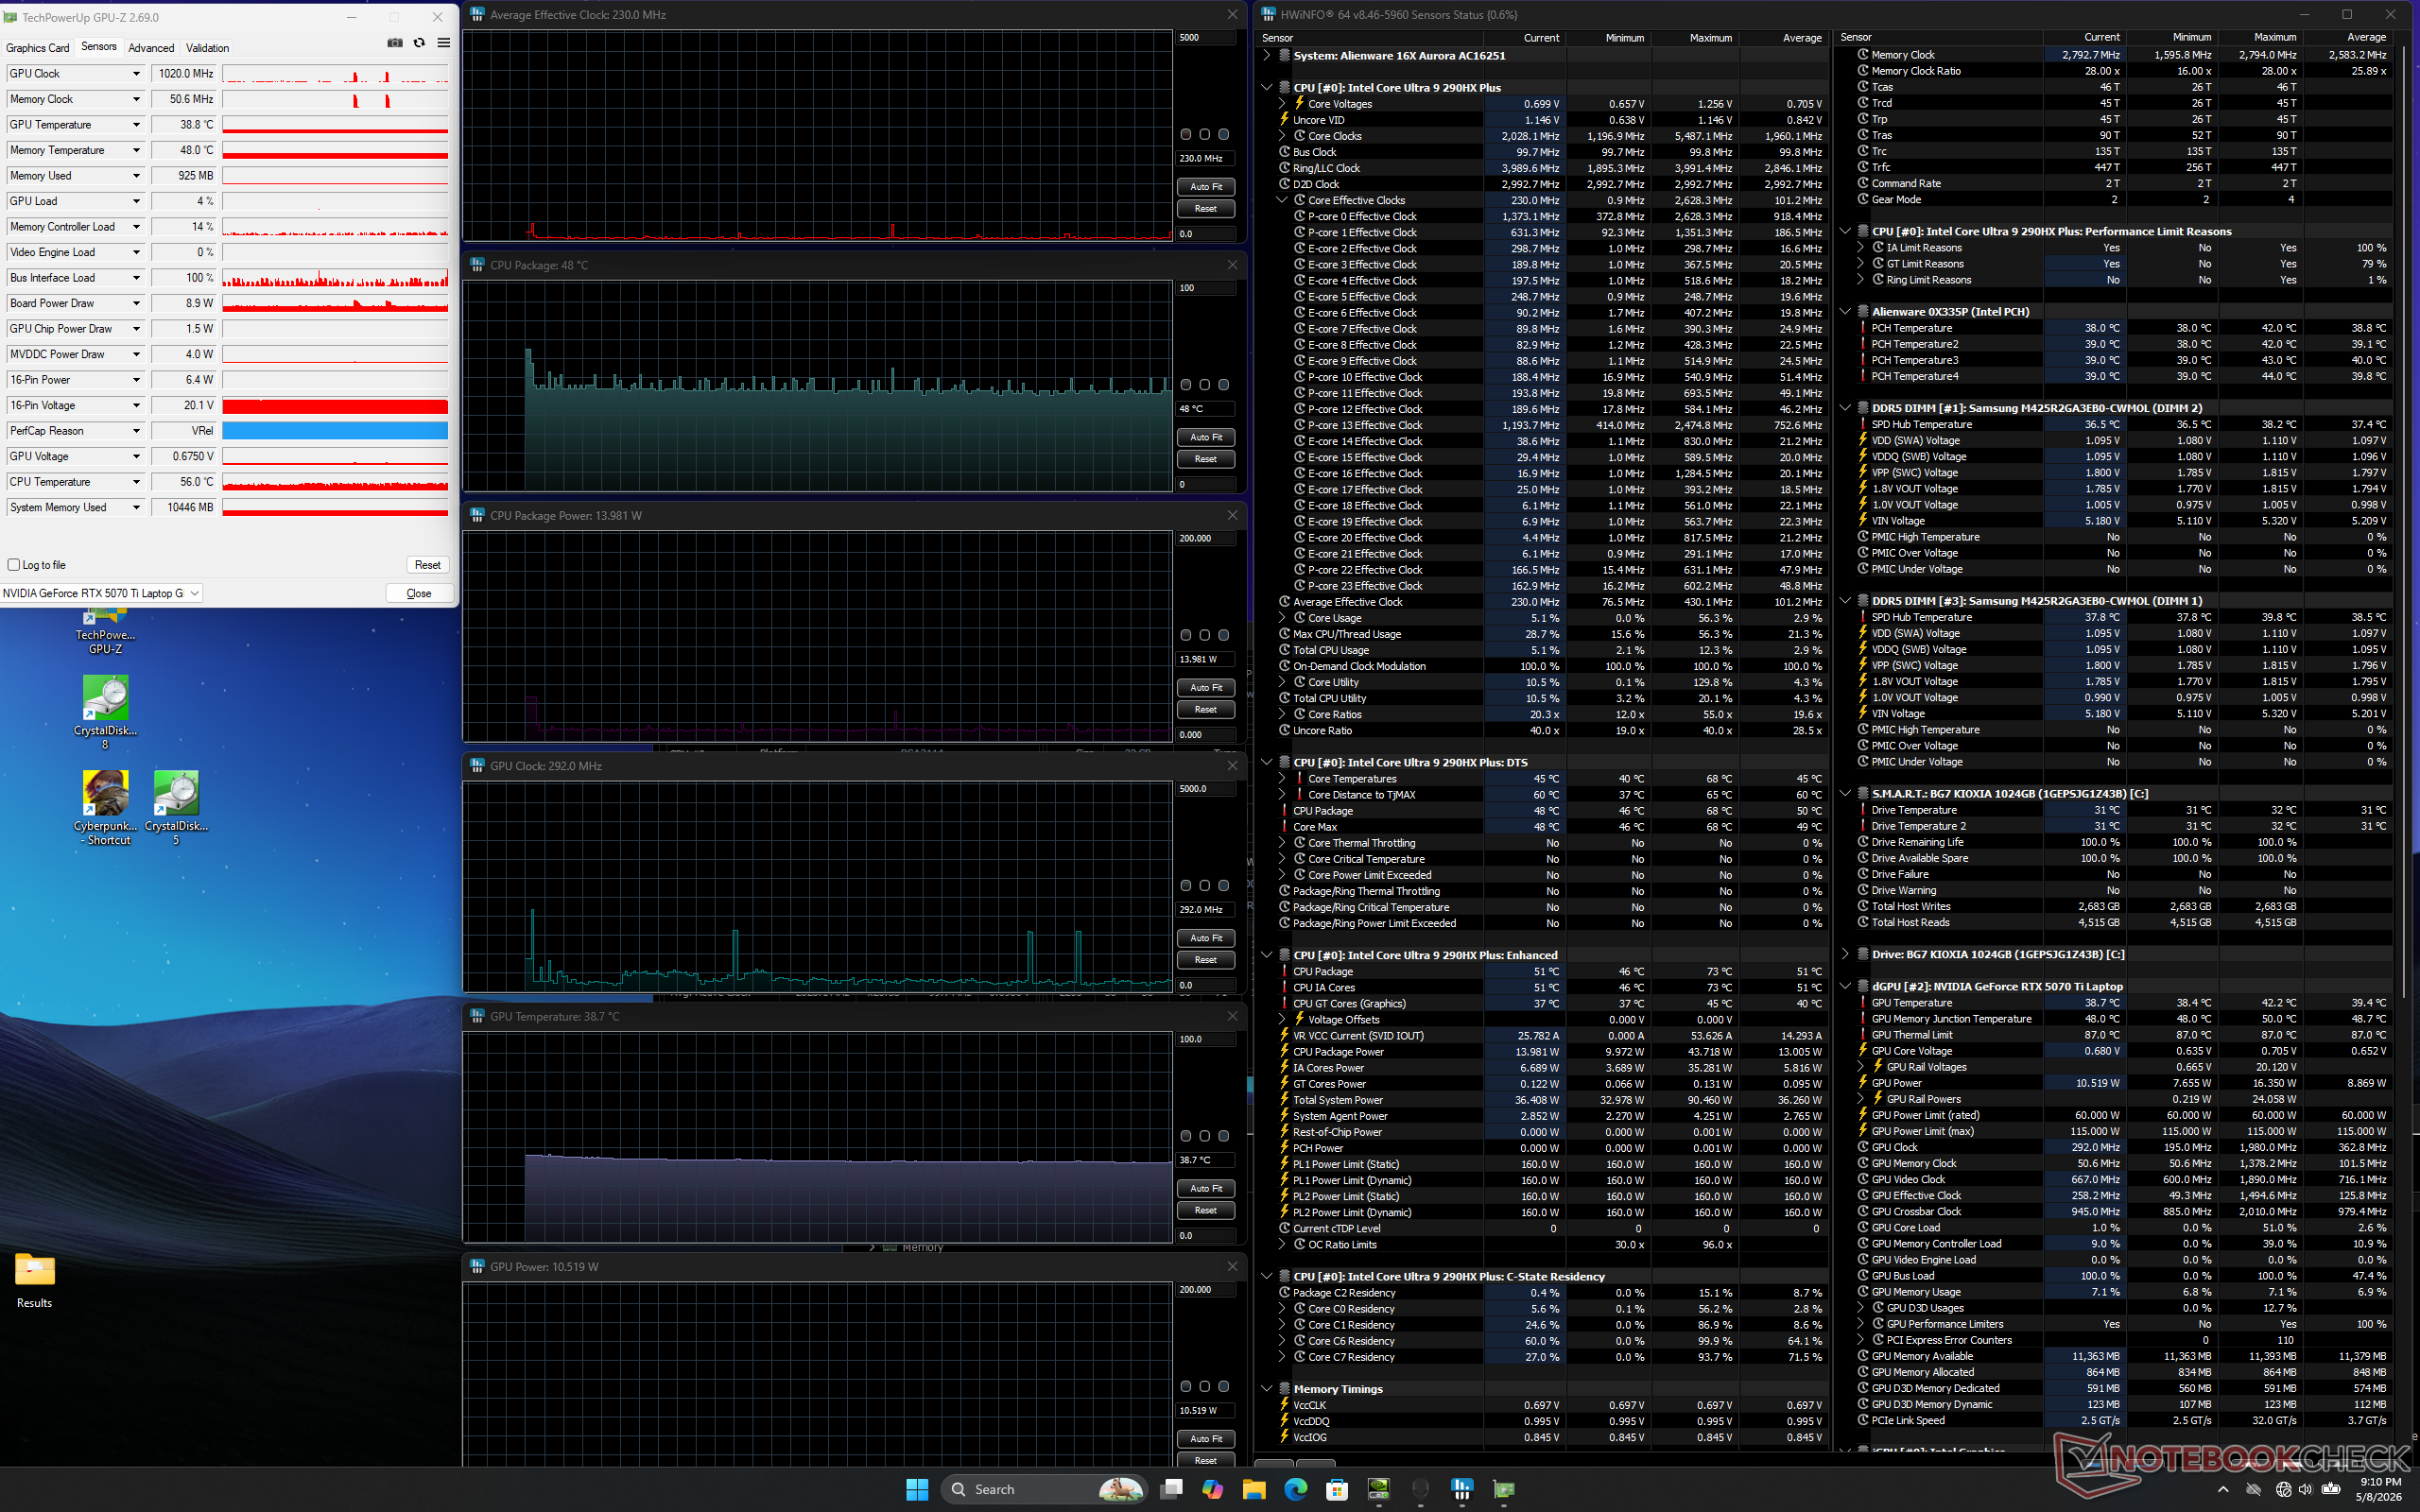
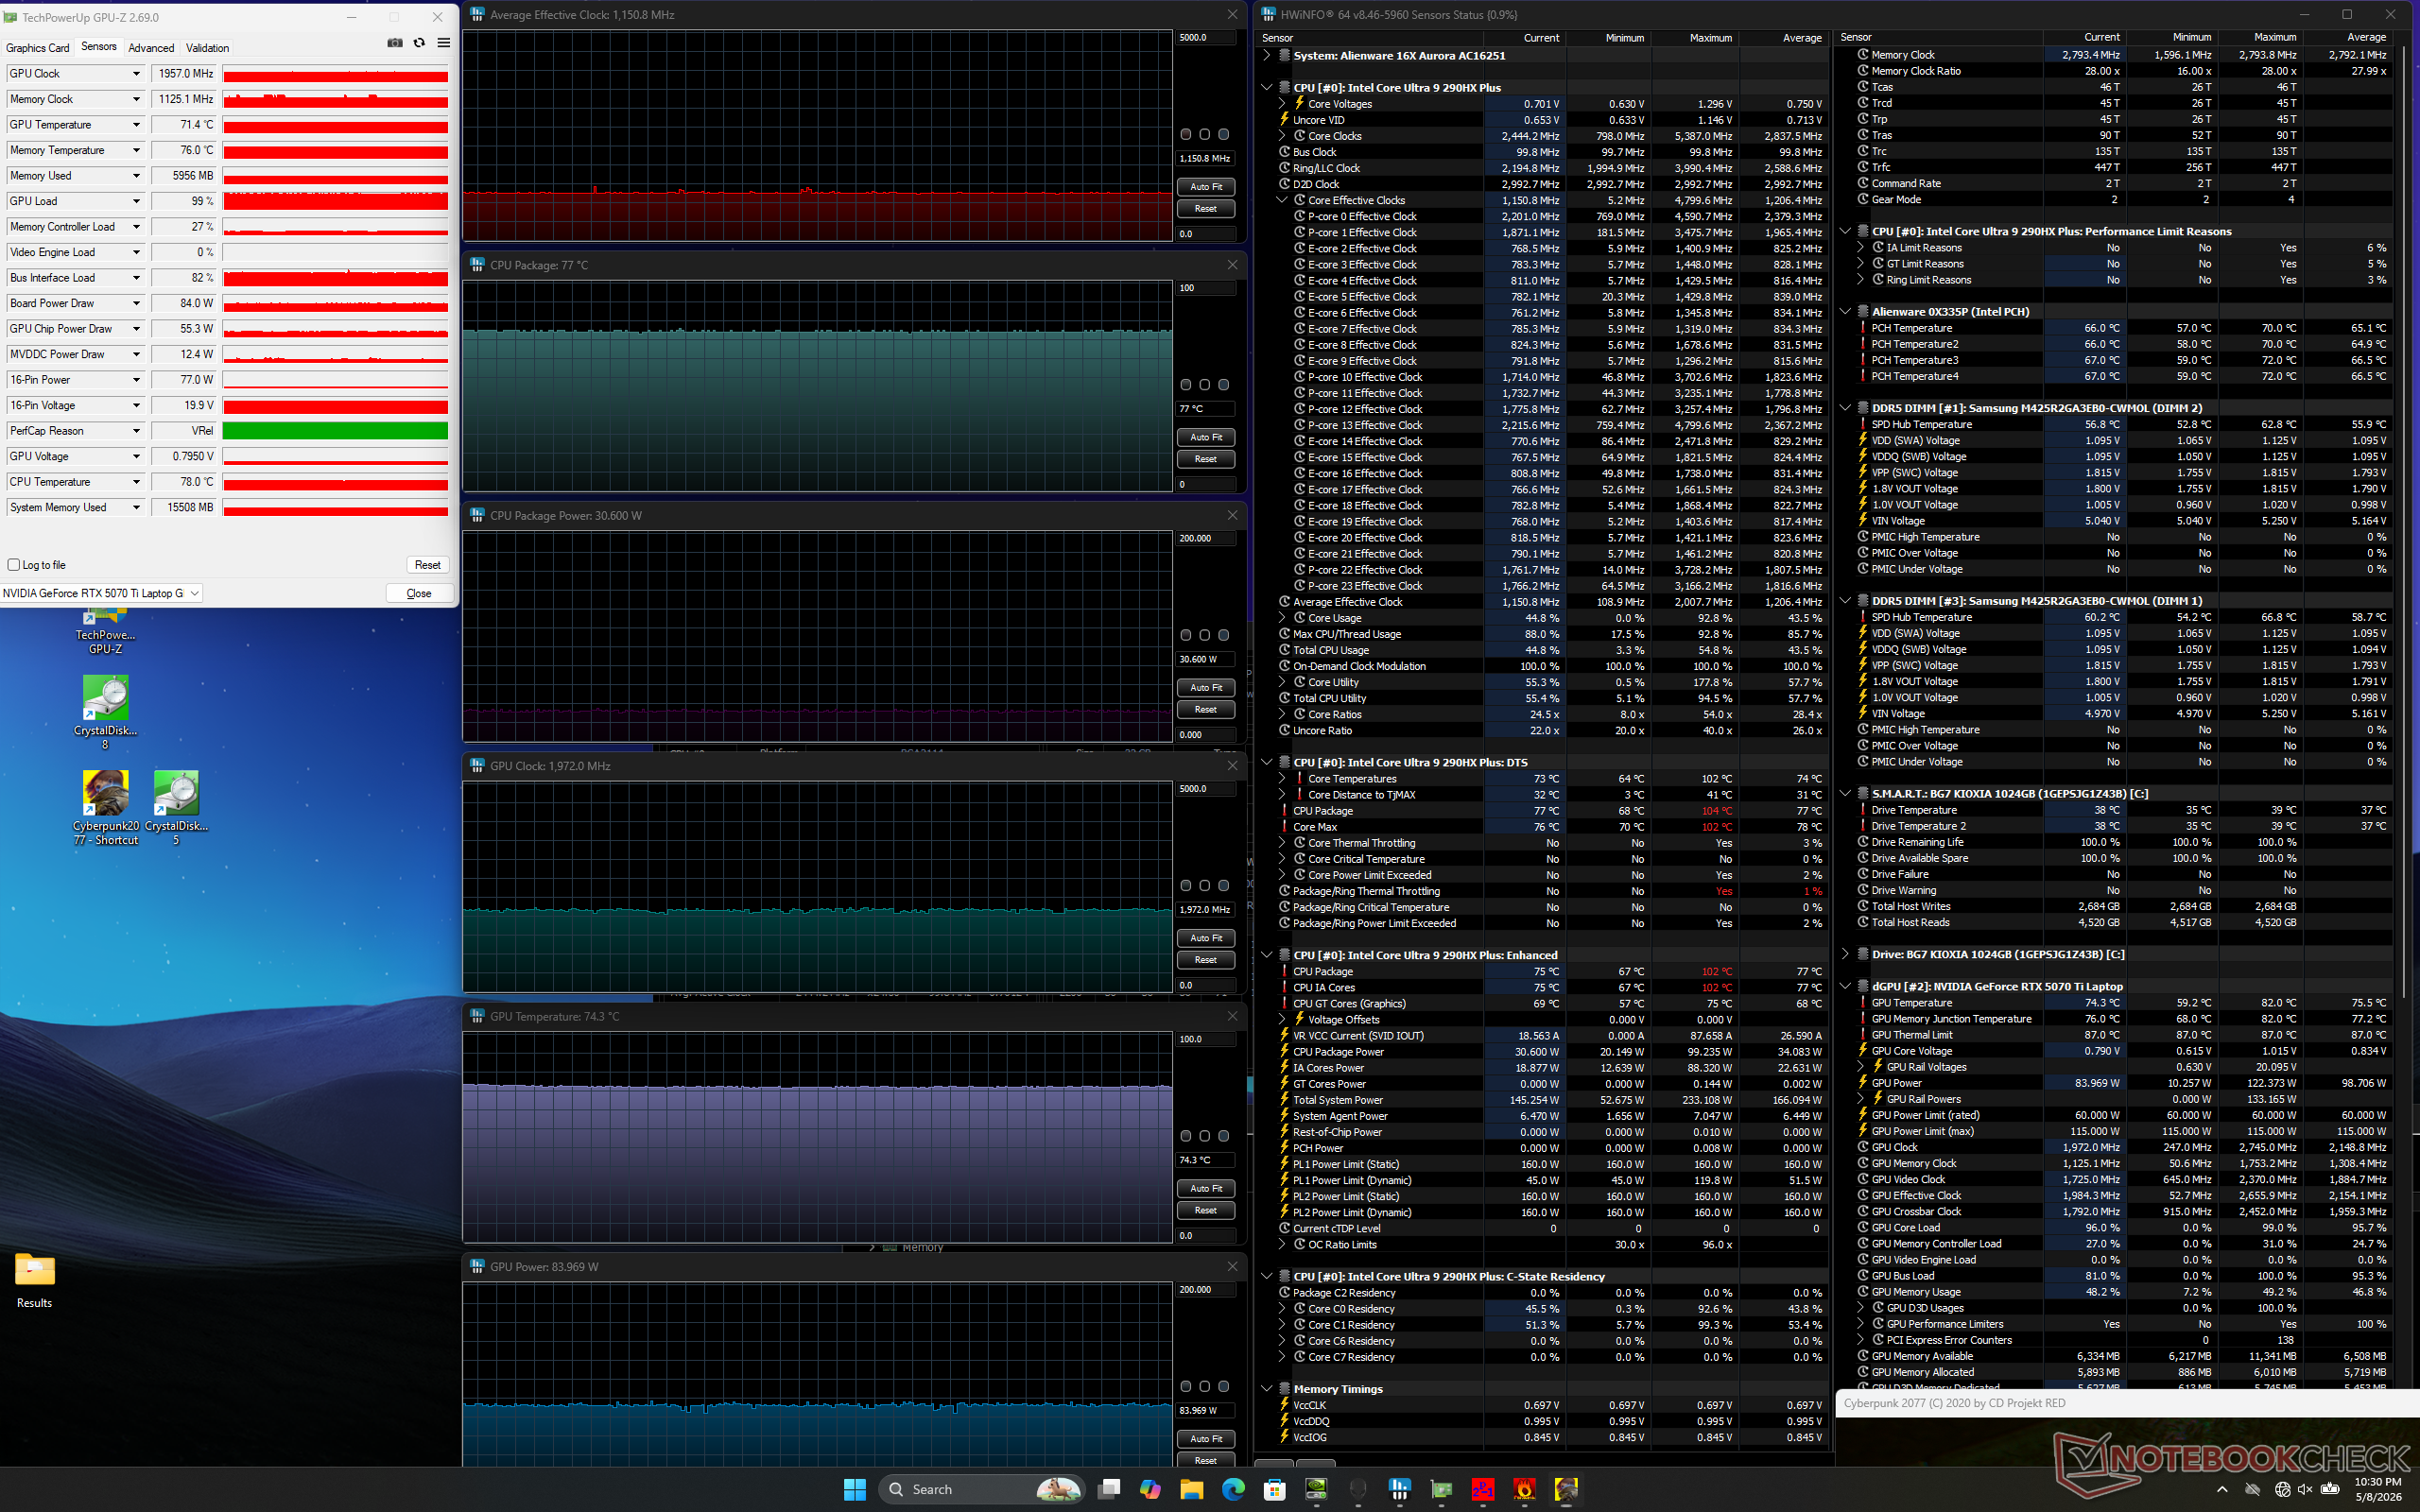
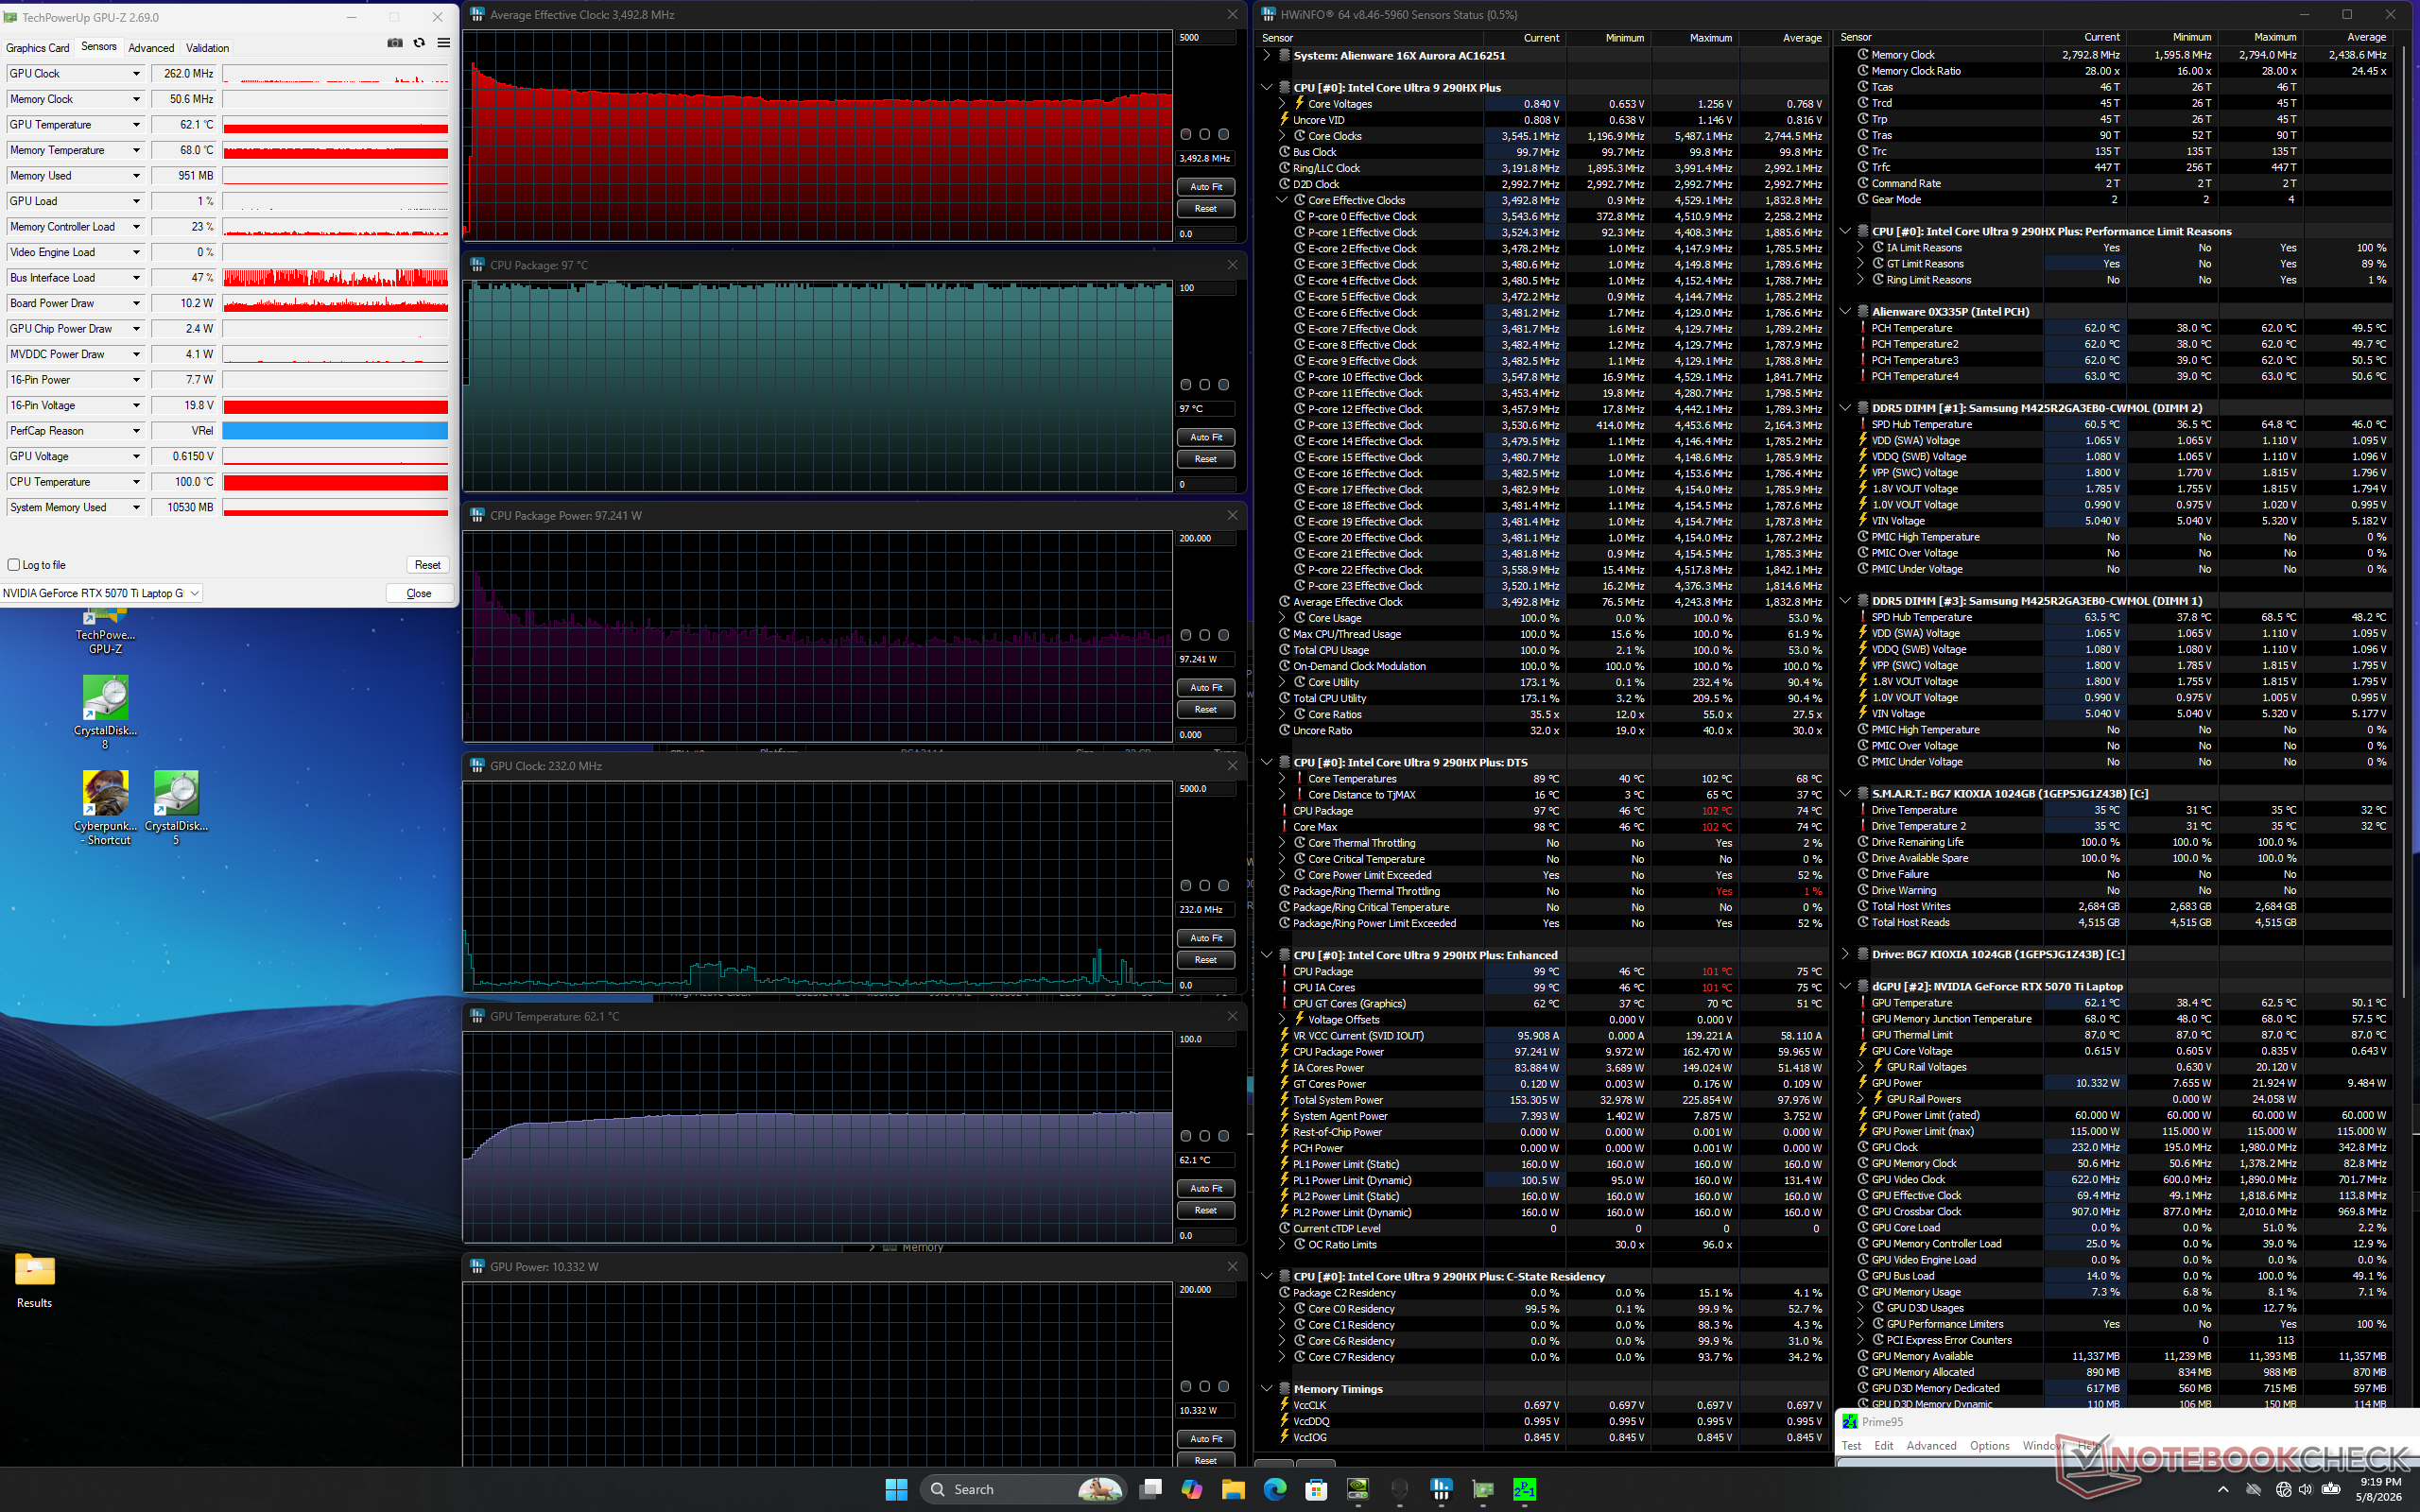
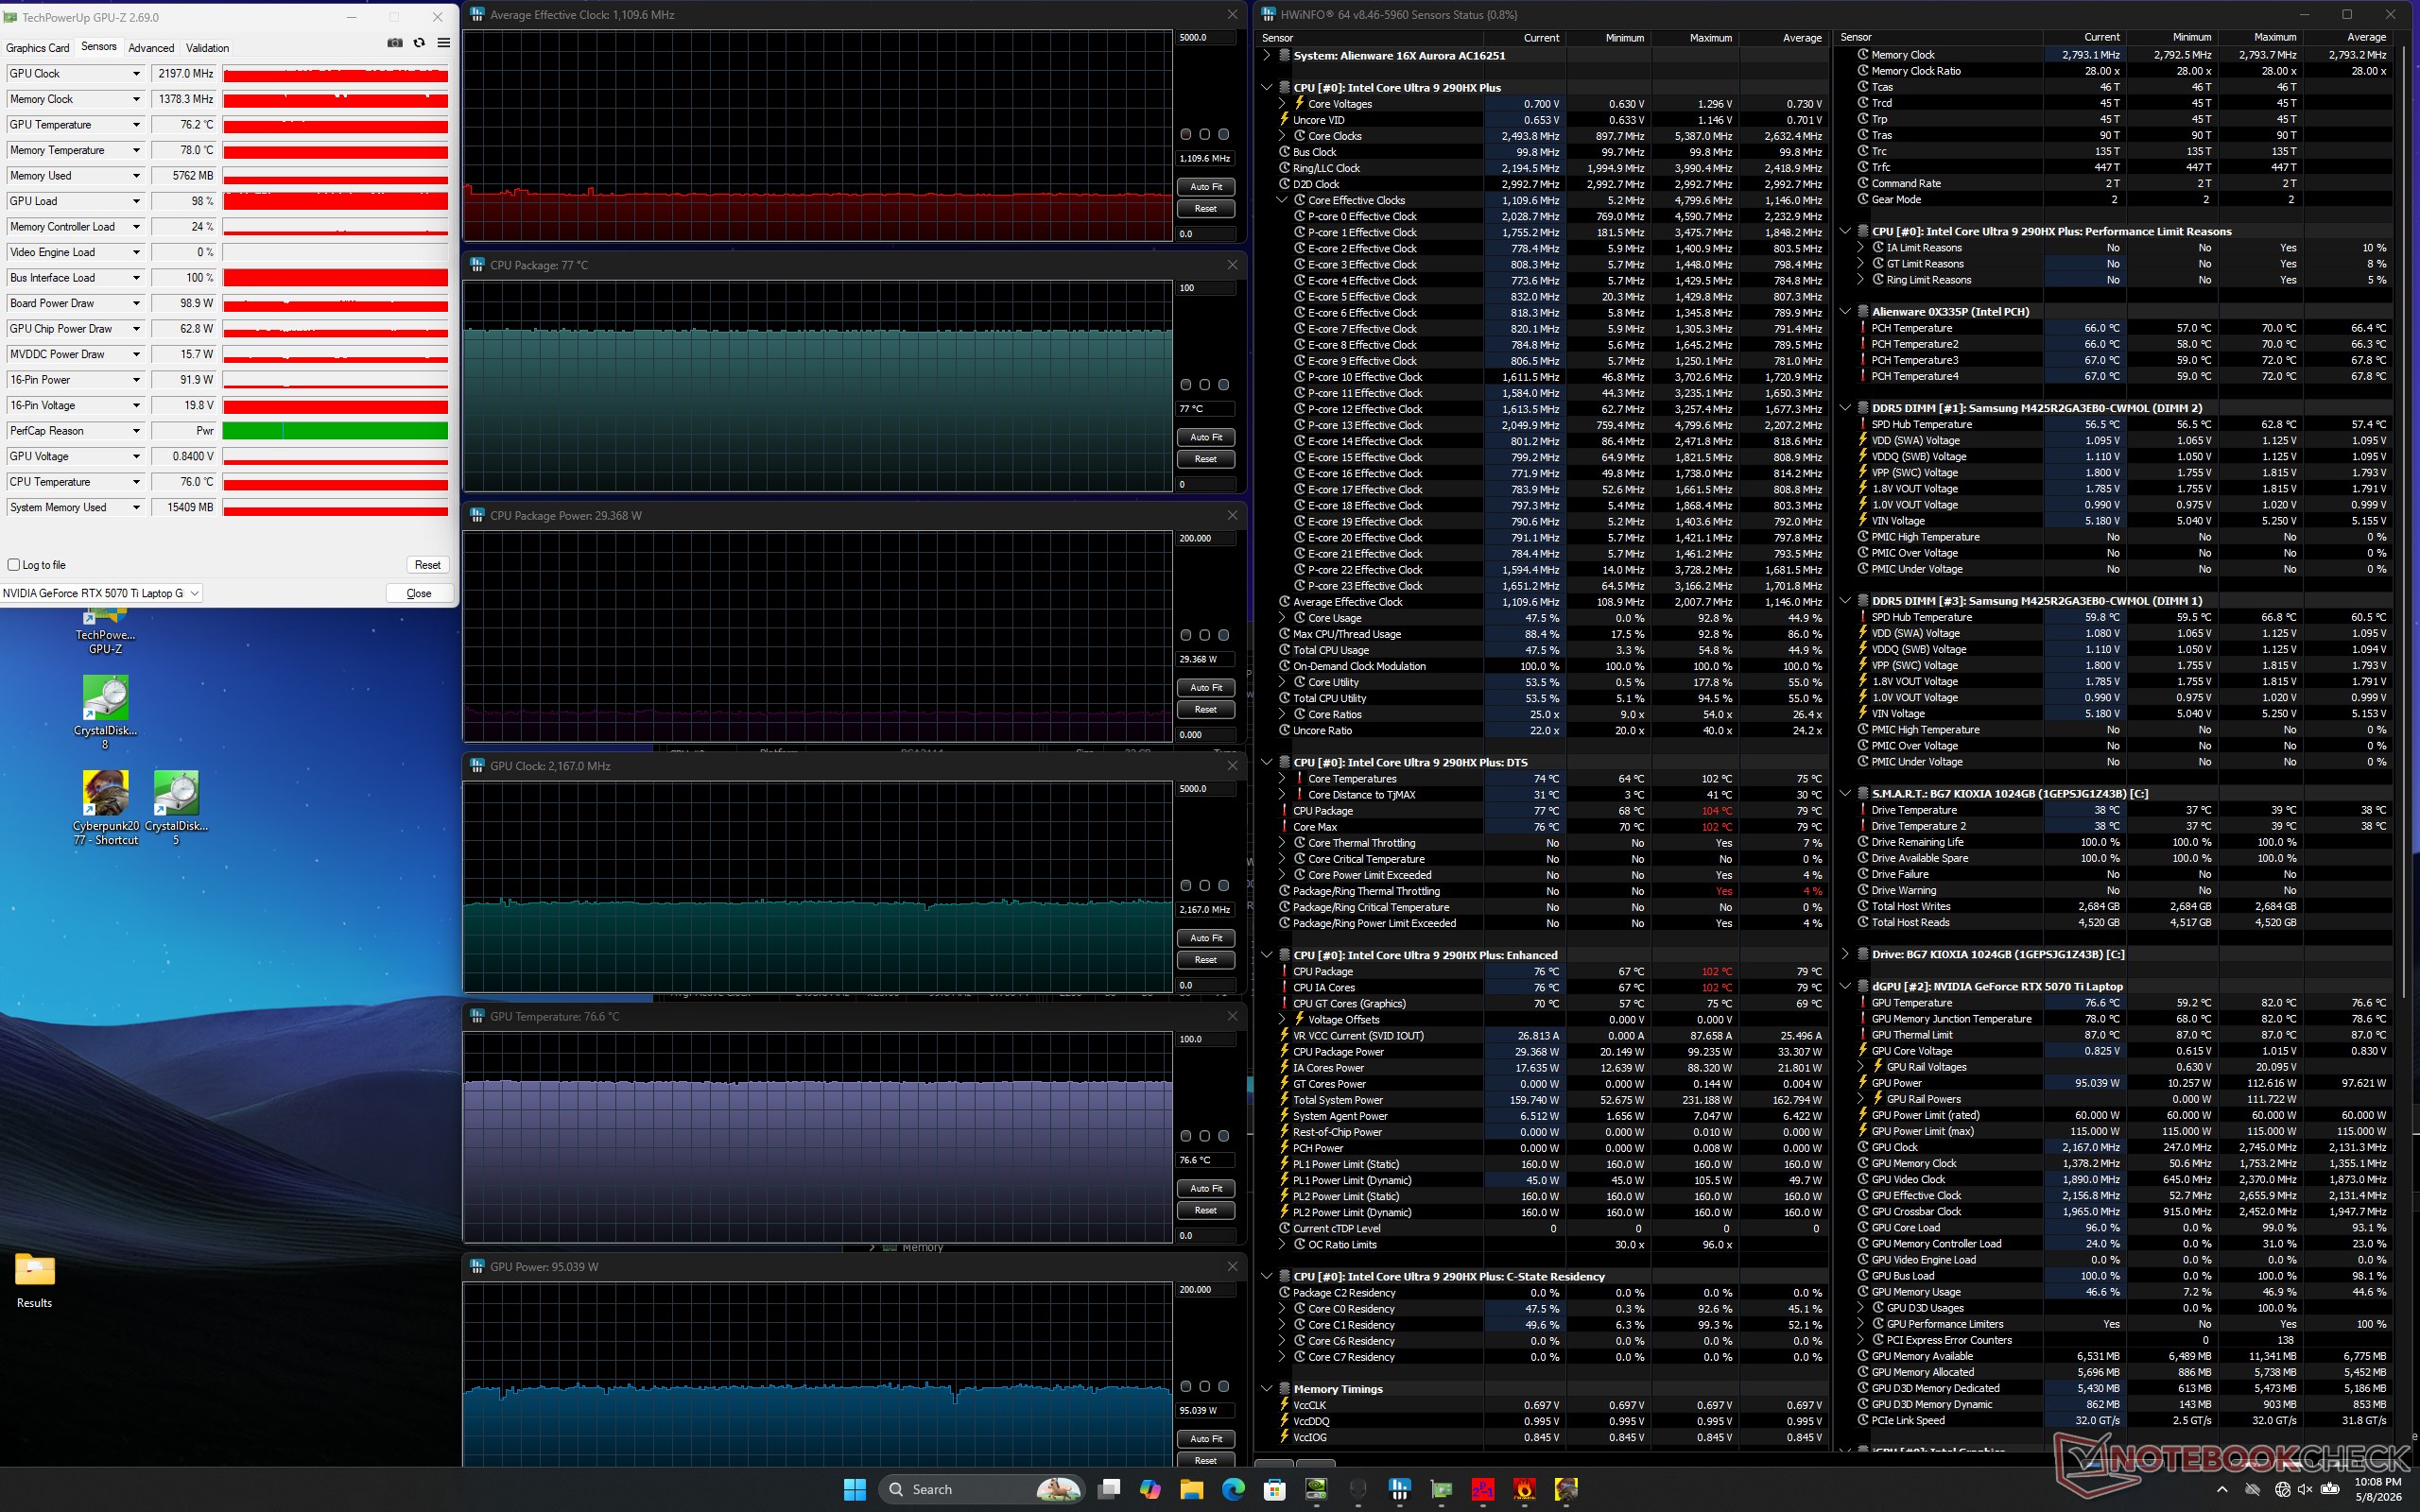
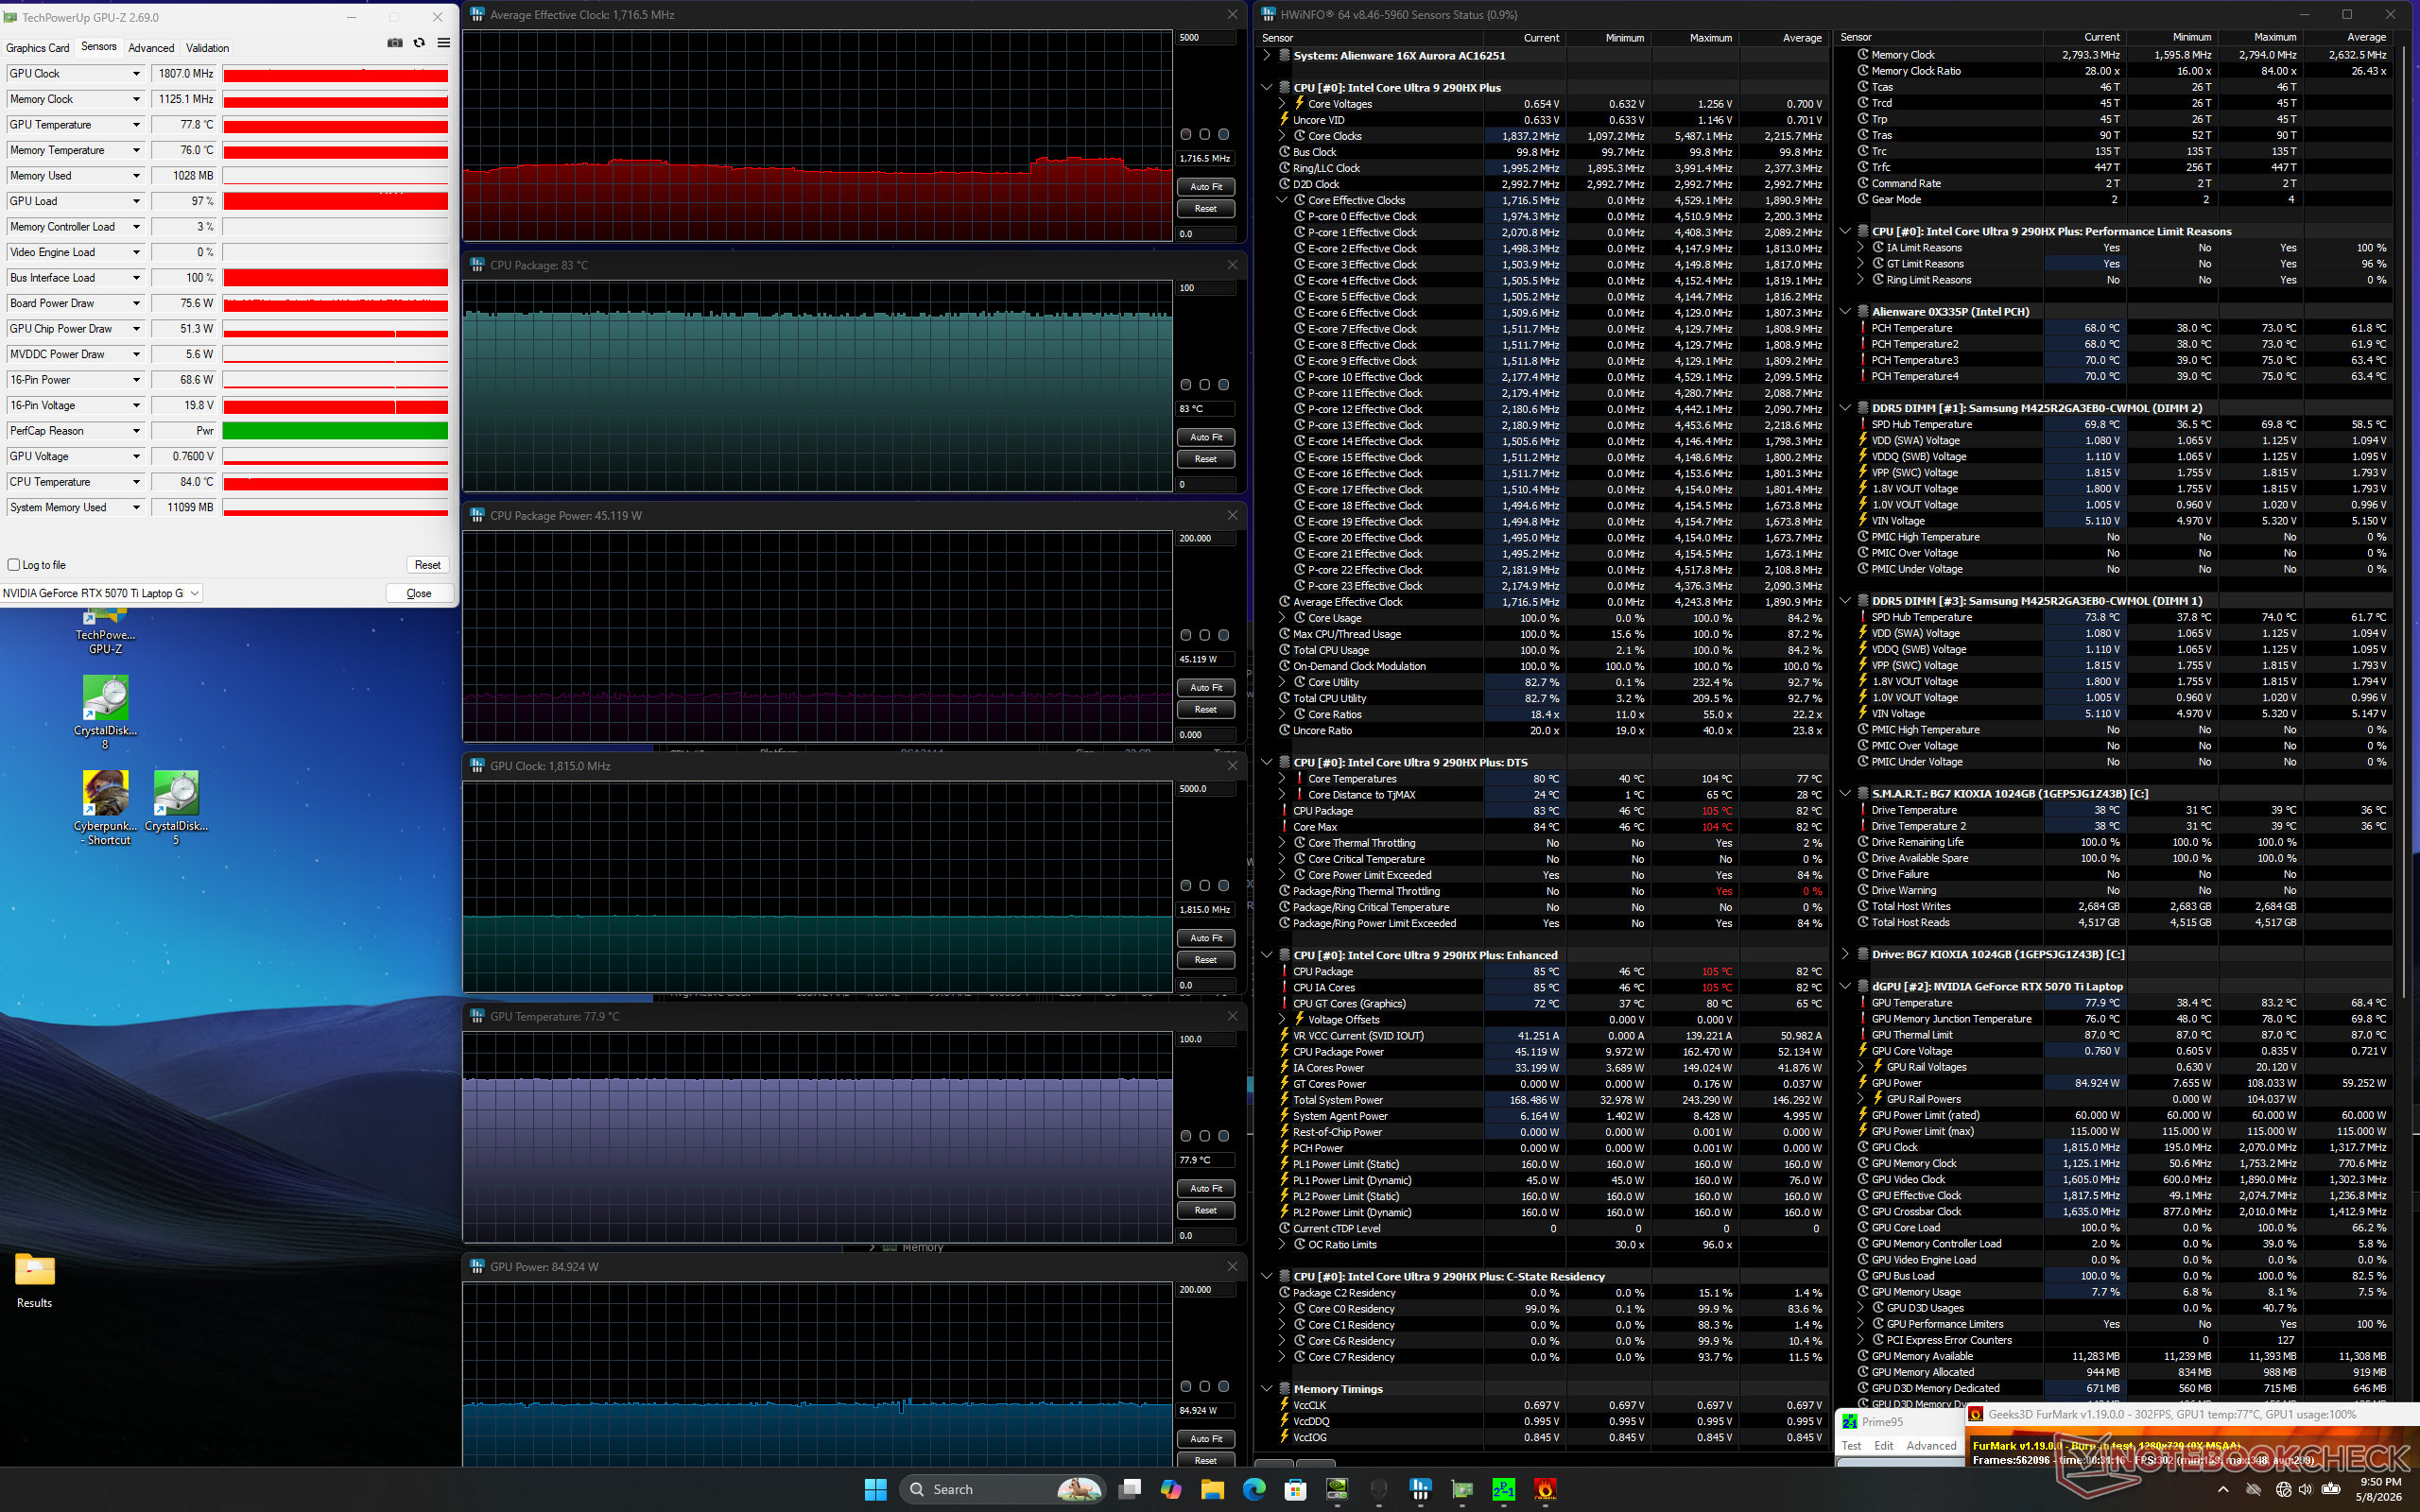
| Clock medio della CPU (GHz) | Clock della GPU (MHz) | Temperatura media della CPU (°C) | Temperatura media della GPU (°C) | |
| Sistema inattivo | -- | -- | 48 | 39 |
| Stress Prime95 | 3,5 | -- | 97 | 62 |
| Prime95 + FurMark Stress | 1,7 | 1815 | 83 | 78 |
| Cyberpunk 2077 Stress (modalità Bilanciata) | 1,2 | 1972 | 77 | 74 |
| Cyberpunk 2077 Stress (modalità Performance) | 1.1 | 2167 | 77 | 77 |
| Cyberpunk 2077 Stress (modalità Overdrive) | 1.3 | 2355 | 73 | 74 |
Altoparlanti
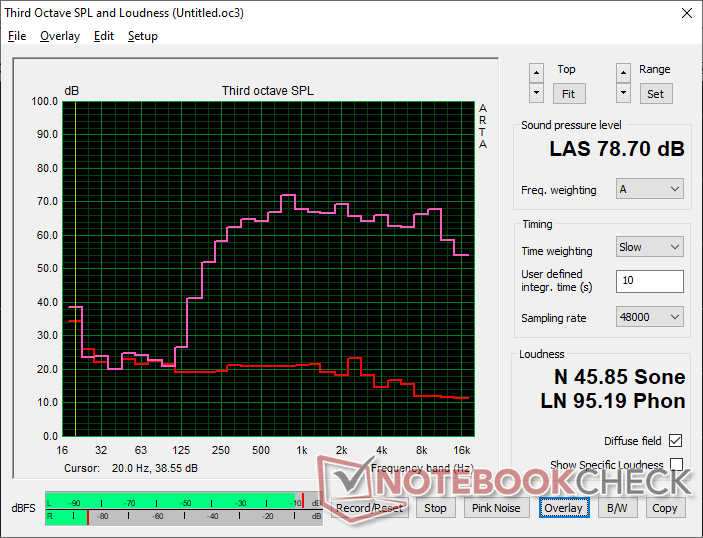
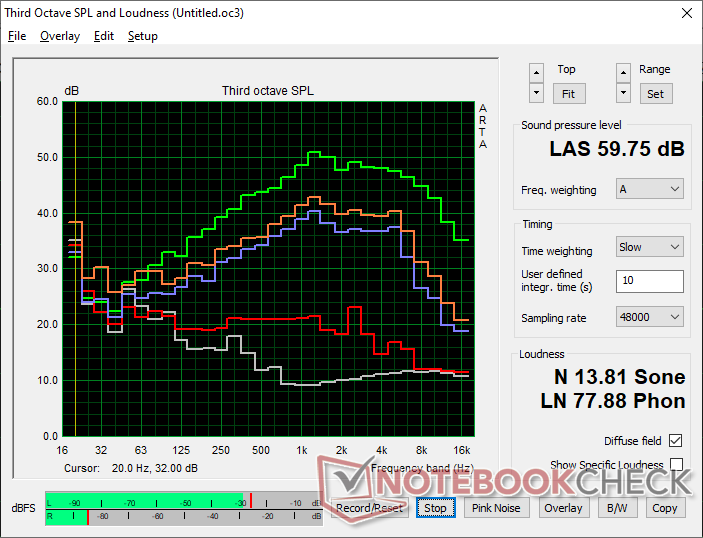
Alienware 16X Aurora Core Ultra 9 290HX Plus analisi audio
(±) | potenza degli altiparlanti media ma buona (78.7 dB)
Bassi 100 - 315 Hz
(-) | quasi nessun basso - in media 20.8% inferiori alla media
(-) | bassi non lineari (16% delta rispetto alla precedente frequenza)
Medi 400 - 2000 Hz
(+) | medi bilanciati - solo only 3% rispetto alla media
(+) | medi lineari (5.1% delta rispetto alla precedente frequenza)
Alti 2 - 16 kHz
(+) | Alti bilanciati - appena 1.7% dalla media
(+) | alti lineari (4.9% delta rispetto alla precedente frequenza)
Nel complesso 100 - 16.000 Hz
(±) | la linearità complessiva del suono è media (18.5% di differenza rispetto alla media
Rispetto alla stessa classe
» 60% di tutti i dispositivi testati in questa classe è stato migliore, 8% simile, 32% peggiore
» Il migliore ha avuto un delta di 6%, medio di 18%, peggiore di 132%
Rispetto a tutti i dispositivi testati
» 41% di tutti i dispositivi testati in questa classe è stato migliore, 8% similare, 51% peggiore
» Il migliore ha avuto un delta di 4%, medio di 24%, peggiore di 134%
Apple MacBook Pro 16 2021 M1 Pro analisi audio
(+) | gli altoparlanti sono relativamente potenti (84.7 dB)
Bassi 100 - 315 Hz
(+) | bassi buoni - solo 3.8% dalla media
(+) | bassi in lineaa (5.2% delta rispetto alla precedente frequenza)
Medi 400 - 2000 Hz
(+) | medi bilanciati - solo only 1.3% rispetto alla media
(+) | medi lineari (2.1% delta rispetto alla precedente frequenza)
Alti 2 - 16 kHz
(+) | Alti bilanciati - appena 1.9% dalla media
(+) | alti lineari (2.7% delta rispetto alla precedente frequenza)
Nel complesso 100 - 16.000 Hz
(+) | suono nel complesso lineare (4.6% differenza dalla media)
Rispetto alla stessa classe
» 0% di tutti i dispositivi testati in questa classe è stato migliore, 0% simile, 100% peggiore
» Il migliore ha avuto un delta di 5%, medio di 17%, peggiore di 45%
Rispetto a tutti i dispositivi testati
» 0% di tutti i dispositivi testati in questa classe è stato migliore, 0% similare, 100% peggiore
» Il migliore ha avuto un delta di 4%, medio di 24%, peggiore di 134%
Gestione dell'energia
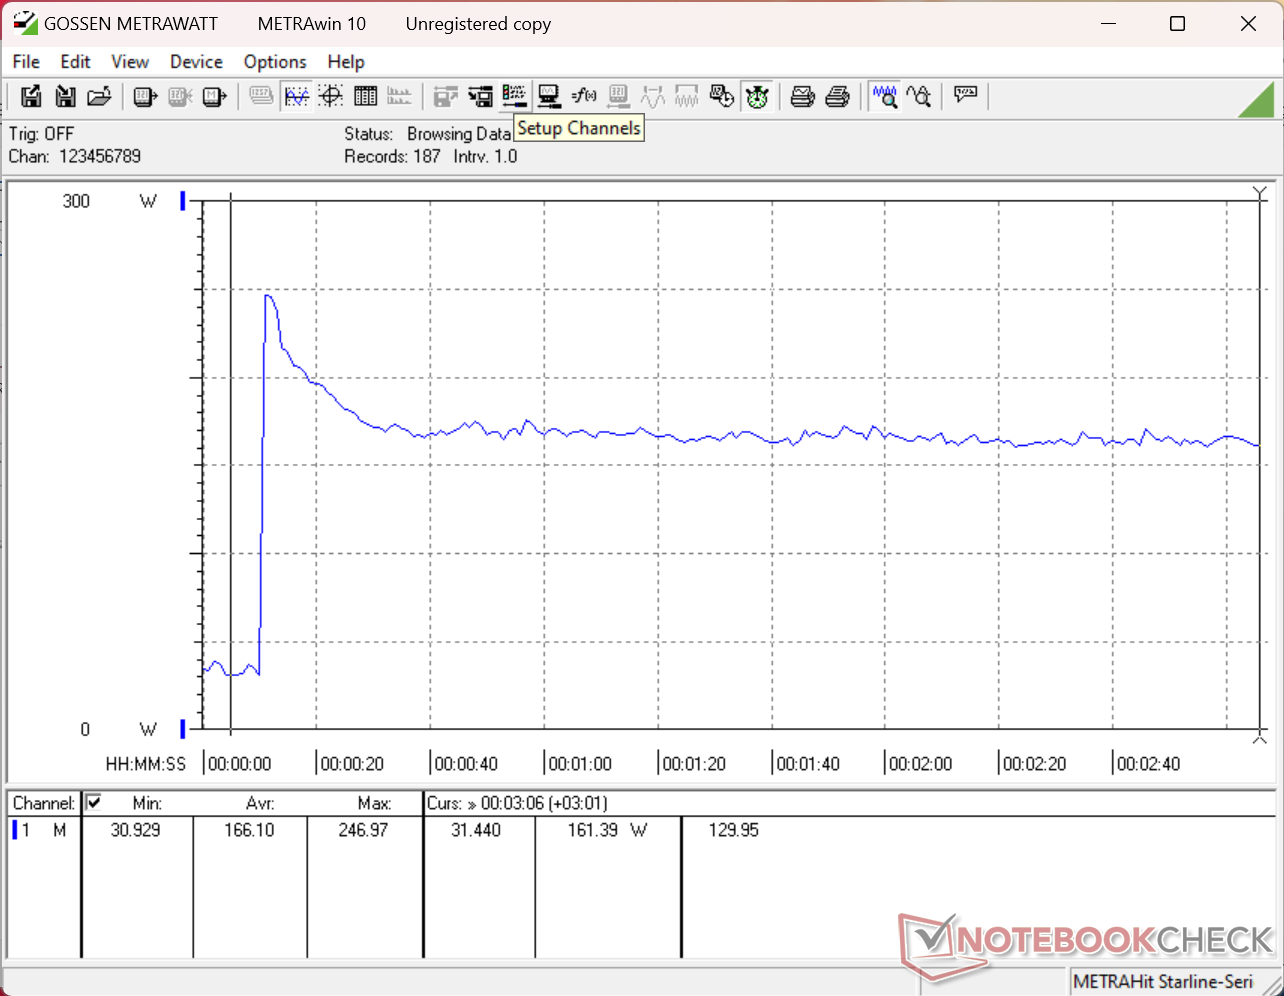
Consumo di energia
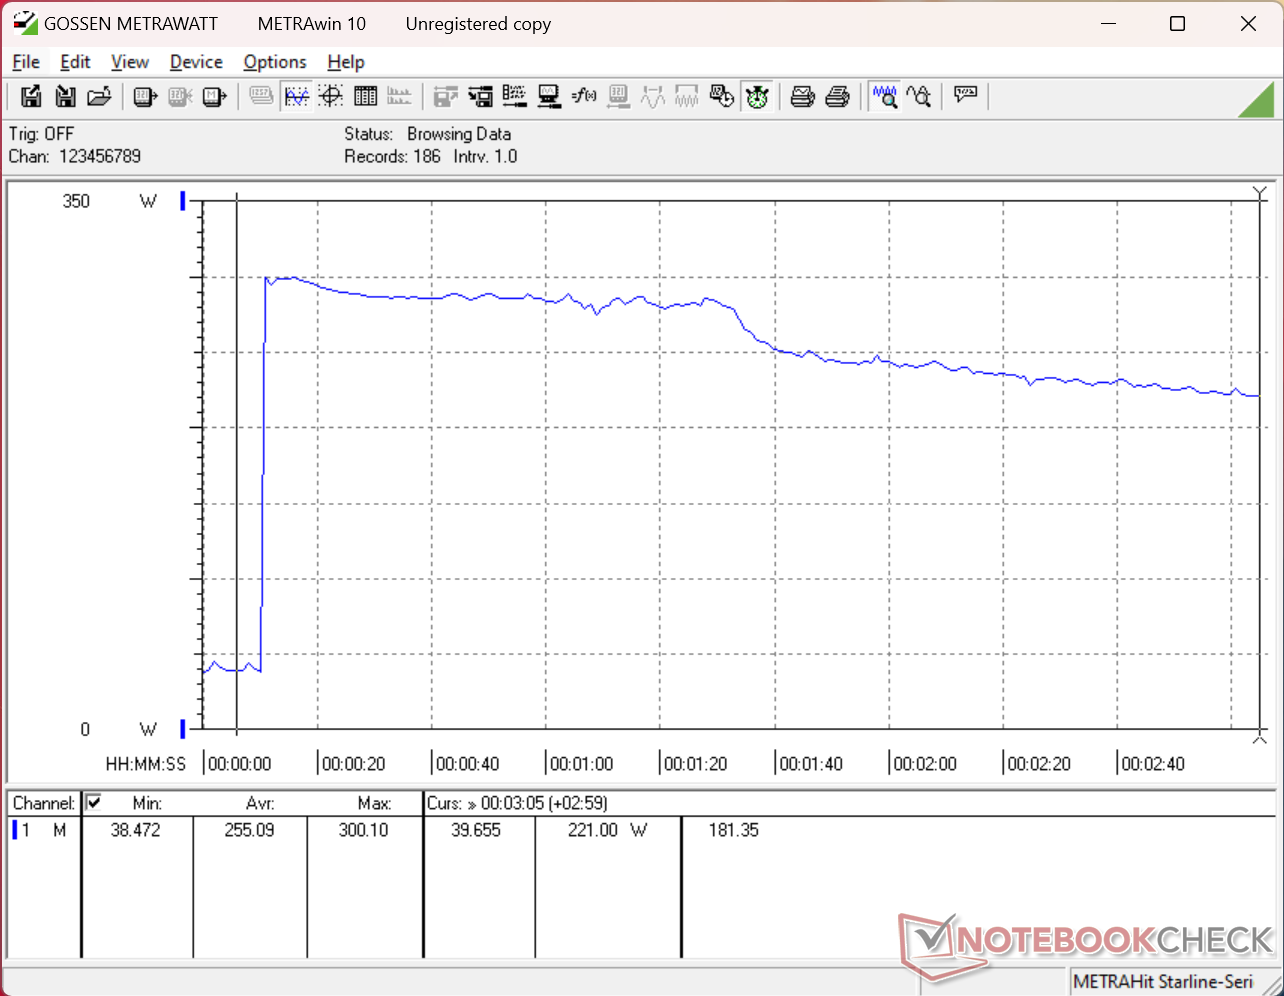
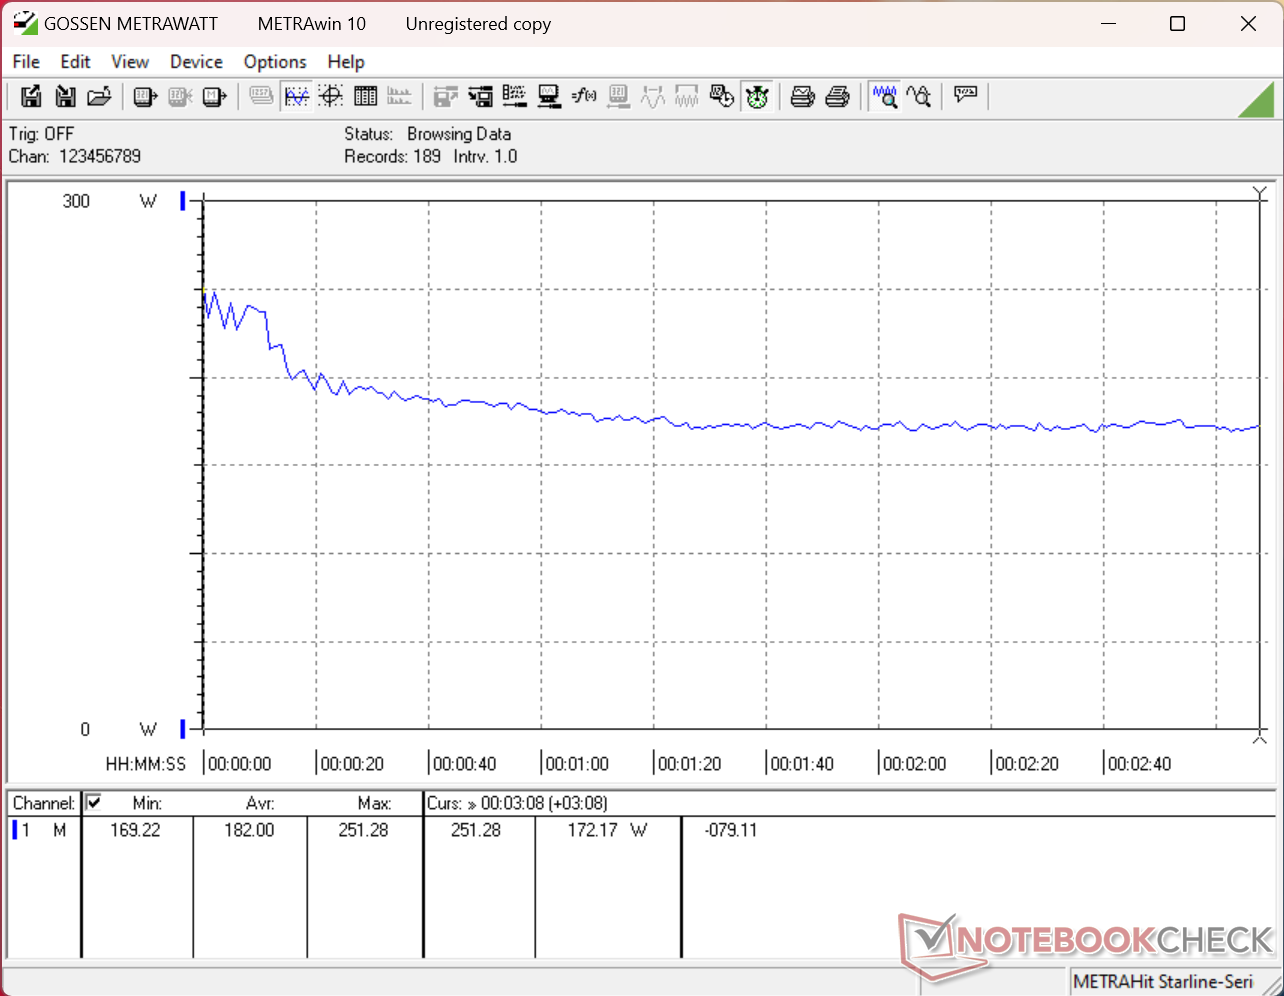
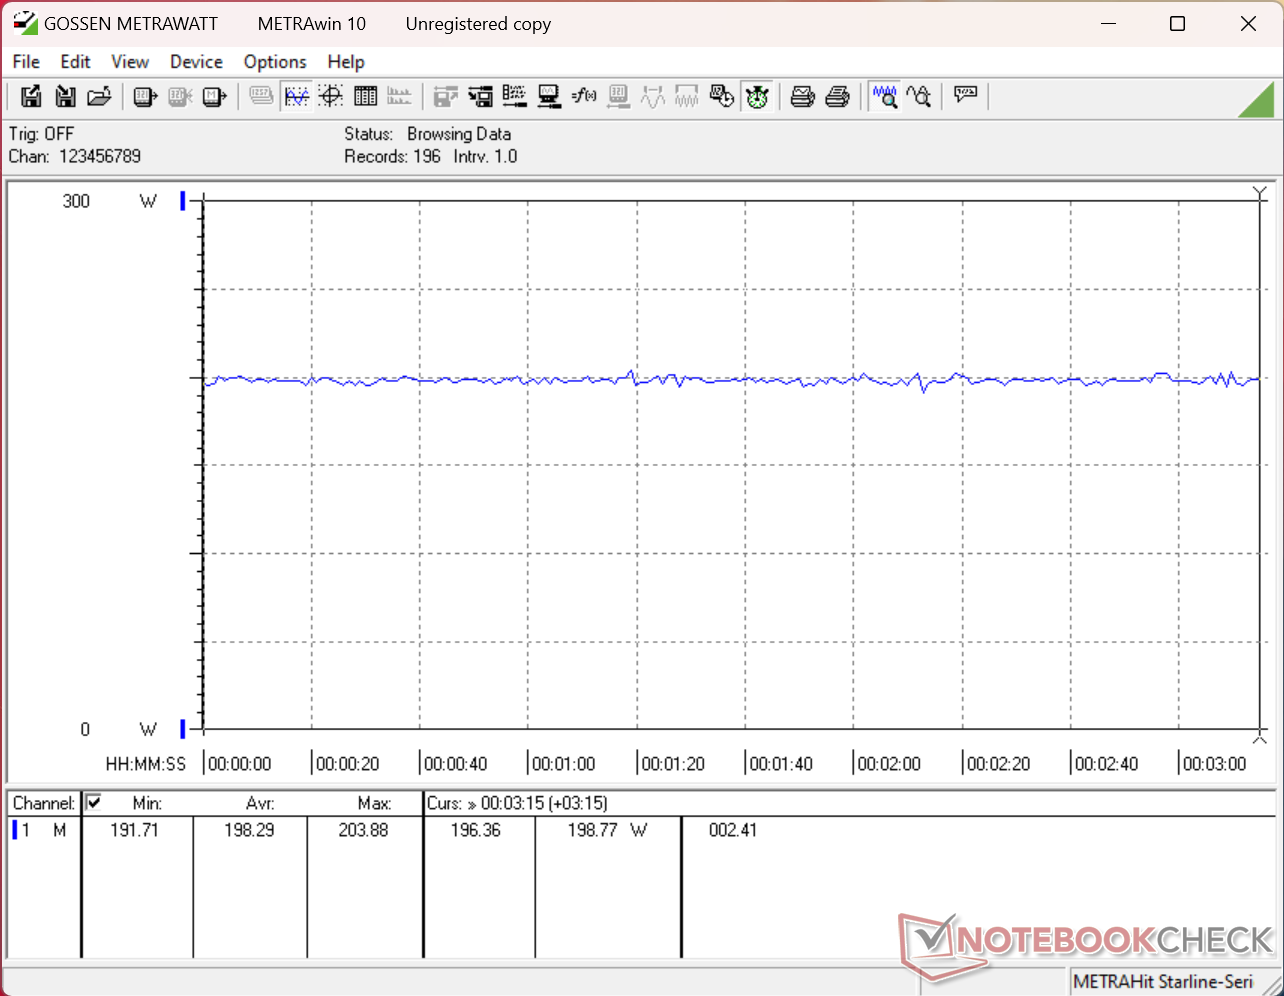
Il consumo al minimo può essere a una cifra, molto più basso di quello che abbiamo registrato sul modello 2025. Per il resto, i risultati sono quasi identici tra i due modelli quando si introducono carichi più elevati, compreso il picco e la graduale diminuzione con Prime95 e/o FurMark.
Il consumo durante l'esecuzione di Cyberpunk 2077 sarebbe in media di 172 W e 199 W in modalità Performance e Overdrive, rispettivamente, che sarebbe di qualche watt in più rispetto a quanto abbiamo registrato sul modello dello scorso anno. Tuttavia, il piccolo aumento del 4 percento dei consumi vale il 20 percento in più di frame rate.
| Off / Standby | |
| Idle | |
| Sotto carico |
|
Leggenda:
min: | |
| Alienware 16X Aurora Core Ultra 9 290HX Plus Ultra 9 290HX Plus, GeForce RTX 5070 Ti Laptop, , OLED, 2560x1600, 16" | Alienware 16X Aurora, RTX 5070 Ultra 9 275HX, GeForce RTX 5070 Laptop, , IPS, 2560x1600, 16" | Acer Predator Helios Neo 16S AI PHN16S-71-94L9 Ultra 9 275HX, GeForce RTX 5070 Ti Laptop, Micron 3500 1TB MTFDKBA1T0TGD, OLED, 2560x1600, 16" | Lenovo Legion Pro 5 16IAX10, RTX 5070 Ultra 7 255HX, GeForce RTX 5070 Laptop, SK Hynix HFS001TEJ9X115N, OLED, 2650x1600, 16" | MSI Vector 16 HX AI A2XWHG Ultra 7 255HX, GeForce RTX 5070 Ti Laptop, Micron 2400 MTFDKBA512QFM, IPS, 2560x1600, 16" | Asus ROG Zephyrus G16 GU605CW Ultra 9 285H, GeForce RTX 5080 Laptop, Micron 2500 2TB MTFDKBA2T0QGN-1BN1AABGA, OLED, 2560x1600, 16" | |
|---|---|---|---|---|---|---|
| Power Consumption | -62% | 17% | -11% | -20% | -3% | |
| Idle Minimum * (Watt) | 6.9 | 20.1 -191% | 3.9 43% | 10.6 -54% | 7.1 -3% | 12.6 -83% |
| Idle Average * (Watt) | 8.1 | 27.6 -241% | 11 -36% | 12.3 -52% | 15.9 -96% | 13.4 -65% |
| Idle Maximum * (Watt) | 31 | 31.8 -3% | 16.9 45% | 18.6 40% | 29.5 5% | 15.1 51% |
| Load Average * (Watt) | 131.6 | 102.7 22% | 123 7% | 104 21% | 124 6% | 116.3 12% |
| Cyberpunk 2077 ultra * (Watt) | 198.3 | 217 -9% | 152.7 23% | 231 -16% | 222 -12% | 156.4 21% |
| Cyberpunk 2077 ultra external monitor * (Watt) | 172.1 | 192.3 -12% | 144.9 16% | 227 -32% | 217 -26% | 157.9 8% |
| Load Maximum * (Watt) | 300.1 | 292 3% | 229 24% | 248 17% | 336 -12% | 199 34% |
* ... Meglio usare valori piccoli
Consumo di energia Cyberpunk / Stress Test
Consumo di energia del monitor esterno
Durata della batteria
Il minore consumo al minimo menzionato sopra ha portato a una maggiore durata della batteria rispetto al modello dello scorso anno, nonostante il passaggio da IPS a OLED. Tuttavia, si assicuri di impostare la GPU su "Automatico", il display su 60 Hz e il profilo energetico su "Bilanciato" o inferiore per raggiungere tempi di esecuzione WLAN di oltre 7 ore.
| Alienware 16X Aurora Core Ultra 9 290HX Plus Ultra 9 290HX Plus, GeForce RTX 5070 Ti Laptop, 96 Wh | Alienware 16X Aurora, RTX 5070 Ultra 9 275HX, GeForce RTX 5070 Laptop, 96 Wh | Acer Predator Helios Neo 16S AI PHN16S-71-94L9 Ultra 9 275HX, GeForce RTX 5070 Ti Laptop, 76 Wh | Lenovo Legion Pro 5 16IAX10, RTX 5070 Ultra 7 255HX, GeForce RTX 5070 Laptop, 80 Wh | MSI Vector 16 HX AI A2XWHG Ultra 7 255HX, GeForce RTX 5070 Ti Laptop, 90 Wh | Asus ROG Zephyrus G16 GA605WV Ryzen AI 9 HX 370, GeForce RTX 4060 Laptop GPU, 90 Wh | |
|---|---|---|---|---|---|---|
| Autonomia della batteria | -42% | -32% | -16% | -5% | 8% | |
| WiFi v1.3 (h) | 7.4 | 4.3 -42% | 5 -32% | 6.2 -16% | 7 -5% | 8 8% |
| H.264 (h) | 6.1 | 13.7 | ||||
| Load (h) | 1.8 | 1.7 |
Valutazione Notebookcheck
L'Alienware 16X Aurora 2026 offre configurazioni più avanzate rispetto all'anno precedente, ma alcune opzioni sono purtroppo legate o in bundle con altre a prezzi gonfiati.
Alienware 16X Aurora Core Ultra 9 290HX Plus
- 05/14/2026 v8
Allen Ngo
 Total Sustainability Score:
 Potenziali concorrenti a confronto
Immagine | Modello | Prezzo | Peso | Altezza | Schermo |
|---|---|---|---|---|---|
1. 85.9%  | Alienware 16X Aurora Core Ultra 9 290HX Plus Intel Core Ultra 9 290HX Plus ⎘ NVIDIA GeForce RTX 5070 Ti Laptop ⎘ 32 GB Memoria | Amazon: Prezzo di listino: 3000 USD | 2.6 kg | 23.4 mm | 16.00" 2560x1600 189 PPI OLED |
2. 84.9%  | Alienware 16X Aurora, RTX 5070 Intel Core Ultra 9 275HX ⎘ NVIDIA GeForce RTX 5070 Laptop ⎘ 32 GB Memoria | Amazon: Prezzo di listino: 1800 USD | 2.5 kg | 23.4 mm | 16.00" 2560x1600 189 PPI IPS |
3. 82%  | Acer Predator Helios Neo 16S AI PHN16S-71-94L9 Intel Core Ultra 9 275HX ⎘ NVIDIA GeForce RTX 5070 Ti Laptop ⎘ 32 GB Memoria, 1024 GB SSD | Amazon: Prezzo di listino: 2400 EUR | 2.2 kg | 19.9 mm | 16.00" 2560x1600 189 PPI OLED |
4. 86.2%  | Lenovo Legion Pro 5 16IAX10, RTX 5070 Intel Core Ultra 7 255HX ⎘ NVIDIA GeForce RTX 5070 Laptop ⎘ 32 GB Memoria, 1024 GB SSD | Amazon: Prezzo di listino: 1800 Euro | 2.3 kg | 25.95 mm | 16.00" 2650x1600 189 PPI OLED |
5. 84%  | MSI Vector 16 HX AI A2XWHG Intel Core Ultra 7 255HX ⎘ NVIDIA GeForce RTX 5070 Ti Laptop ⎘ 16 GB Memoria, 512 GB SSD | Amazon: Prezzo di listino: 2000 EUR | 2.6 kg | 28.6 mm | 16.00" 2560x1600 189 PPI IPS |
6.  | Asus ROG Zephyrus G16 GU605CW Intel Core Ultra 9 285H ⎘ NVIDIA GeForce RTX 5080 Laptop ⎘ 32 GB Memoria, 2048 GB SSD | Amazon: Prezzo di listino: 3800€ | 2 kg | 14.9 mm | 16.00" 2560x1600 189 PPI OLED |
Transparency
La selezione dei dispositivi da recensire viene effettuata dalla nostra redazione. Il campione di prova è stato fornito all'autore come prestito dal produttore o dal rivenditore ai fini di questa recensione. L'istituto di credito non ha avuto alcuna influenza su questa recensione, né il produttore ne ha ricevuto una copia prima della pubblicazione. Non vi era alcun obbligo di pubblicare questa recensione. In quanto società mediatica indipendente, Notebookcheck non è soggetta all'autorità di produttori, rivenditori o editori.
Ecco come Notebookcheck esegue i test
Ogni anno, Notebookcheck esamina in modo indipendente centinaia di laptop e smartphone utilizzando procedure standardizzate per garantire che tutti i risultati siano comparabili. Da circa 20 anni sviluppiamo continuamente i nostri metodi di prova e nel frattempo stabiliamo gli standard di settore. Nei nostri laboratori di prova, tecnici ed editori esperti utilizzano apparecchiature di misurazione di alta qualità. Questi test comportano un processo di validazione in più fasi. Il nostro complesso sistema di valutazione si basa su centinaia di misurazioni e parametri di riferimento ben fondati, che mantengono l'obiettività.
