

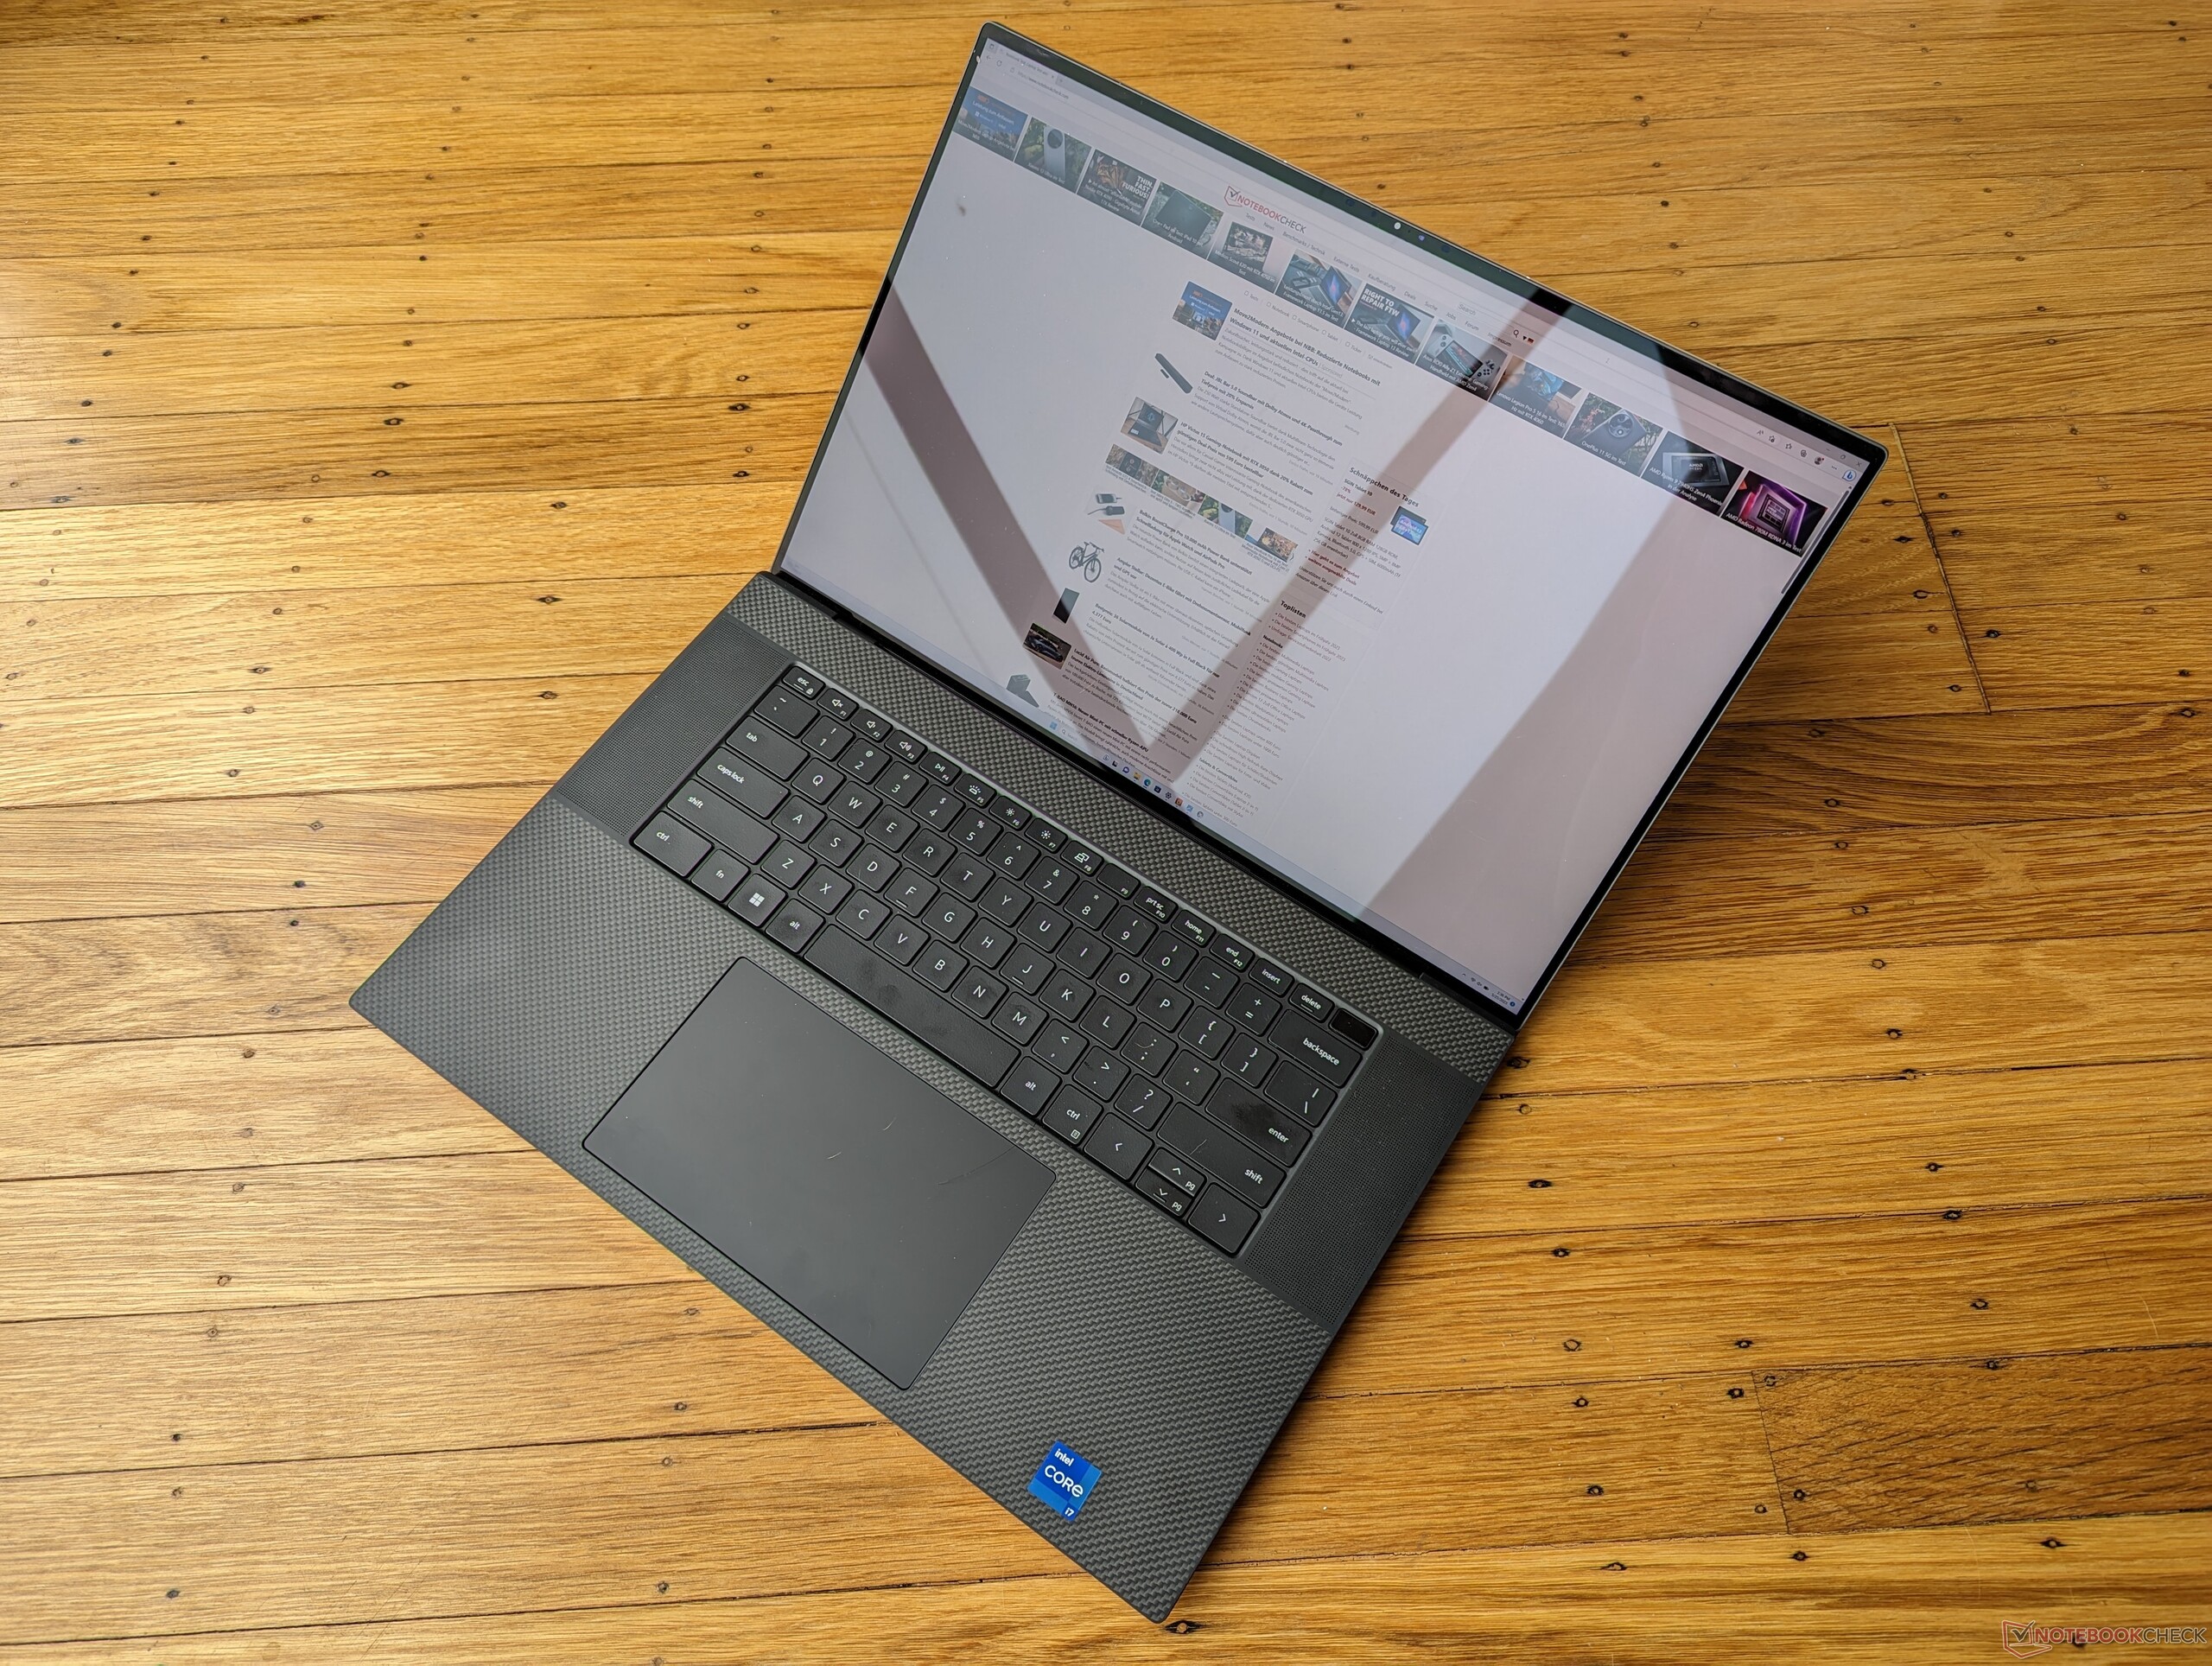
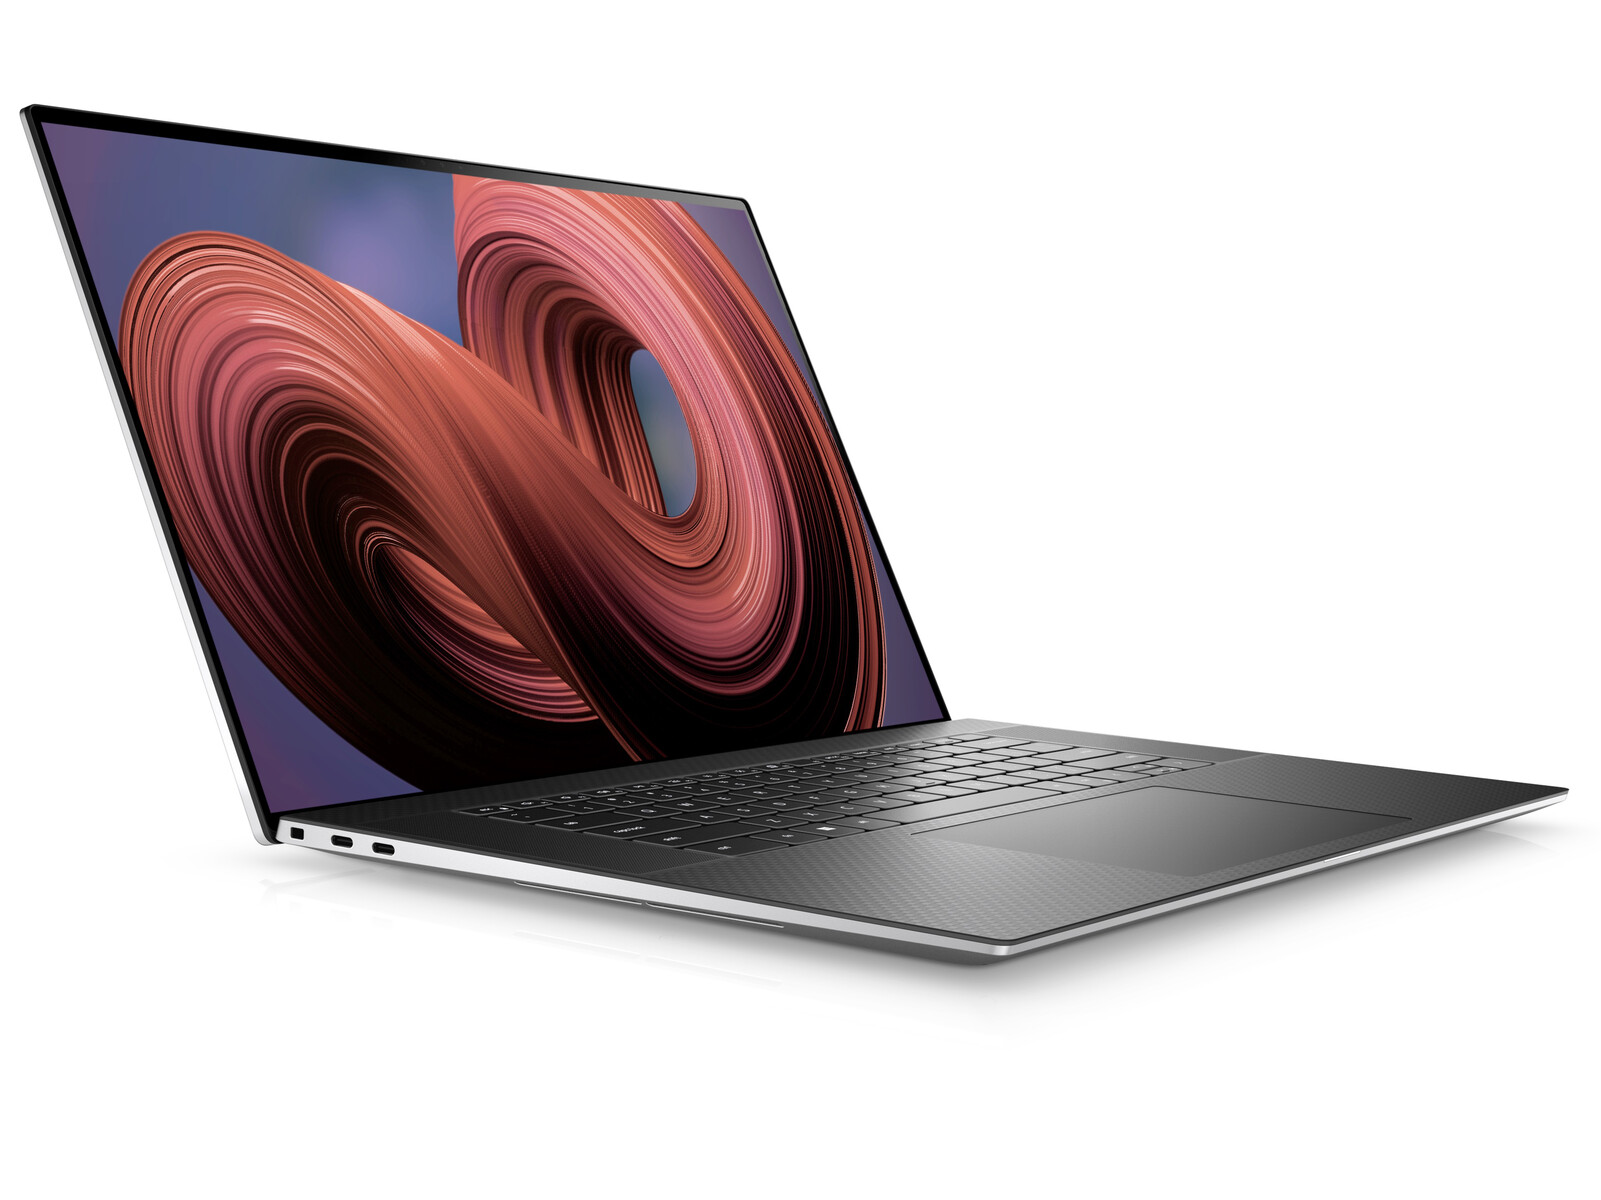
Recensione del portatile Dell XPS 17 9730: un mostro del multimedia con GeForce RTX 4070

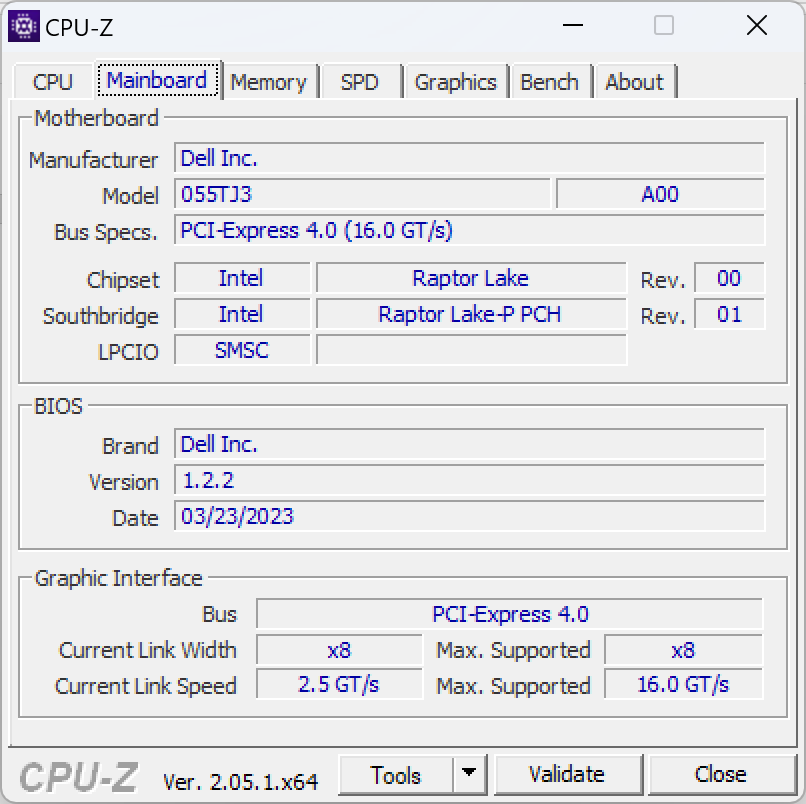
L'XPS 17 9730 del 2023 è la quarta iterazione dell'originale XPS 17 9700 del 2020 xPS 17 9700 del 2020 del 2020. Si tratta di un aggiornamento interno con CPU Intel Raptor Lake-H di 13a generazione e GPU Nvidia Ada Lovelace che sostituiscono rispettivamente le opzioni Alder Lake-H e Ampere di 12a generazione dello scorso anno. Per il resto non ci sono grandi cambiamenti superficiali e quindi vi consigliamo di consultare la nostra recensione dell'XPS 17 9700 originale xPS 17 9700 originale per saperne di più sulle caratteristiche fisiche del portatile. Eventuali riprogettazioni future saranno probabilmente ispirate alla recente serie XPS 13 Plus.
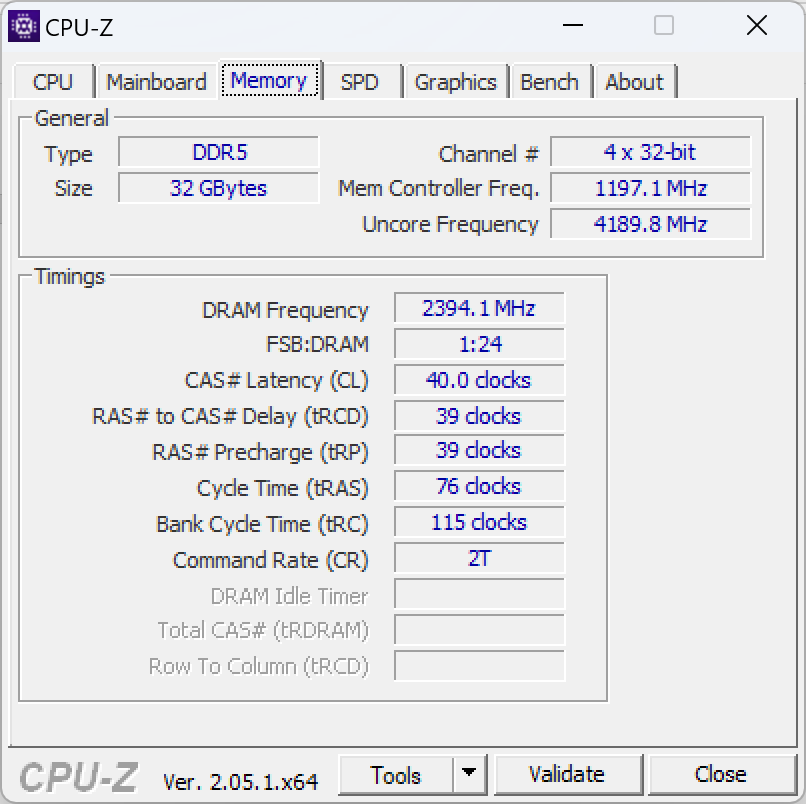
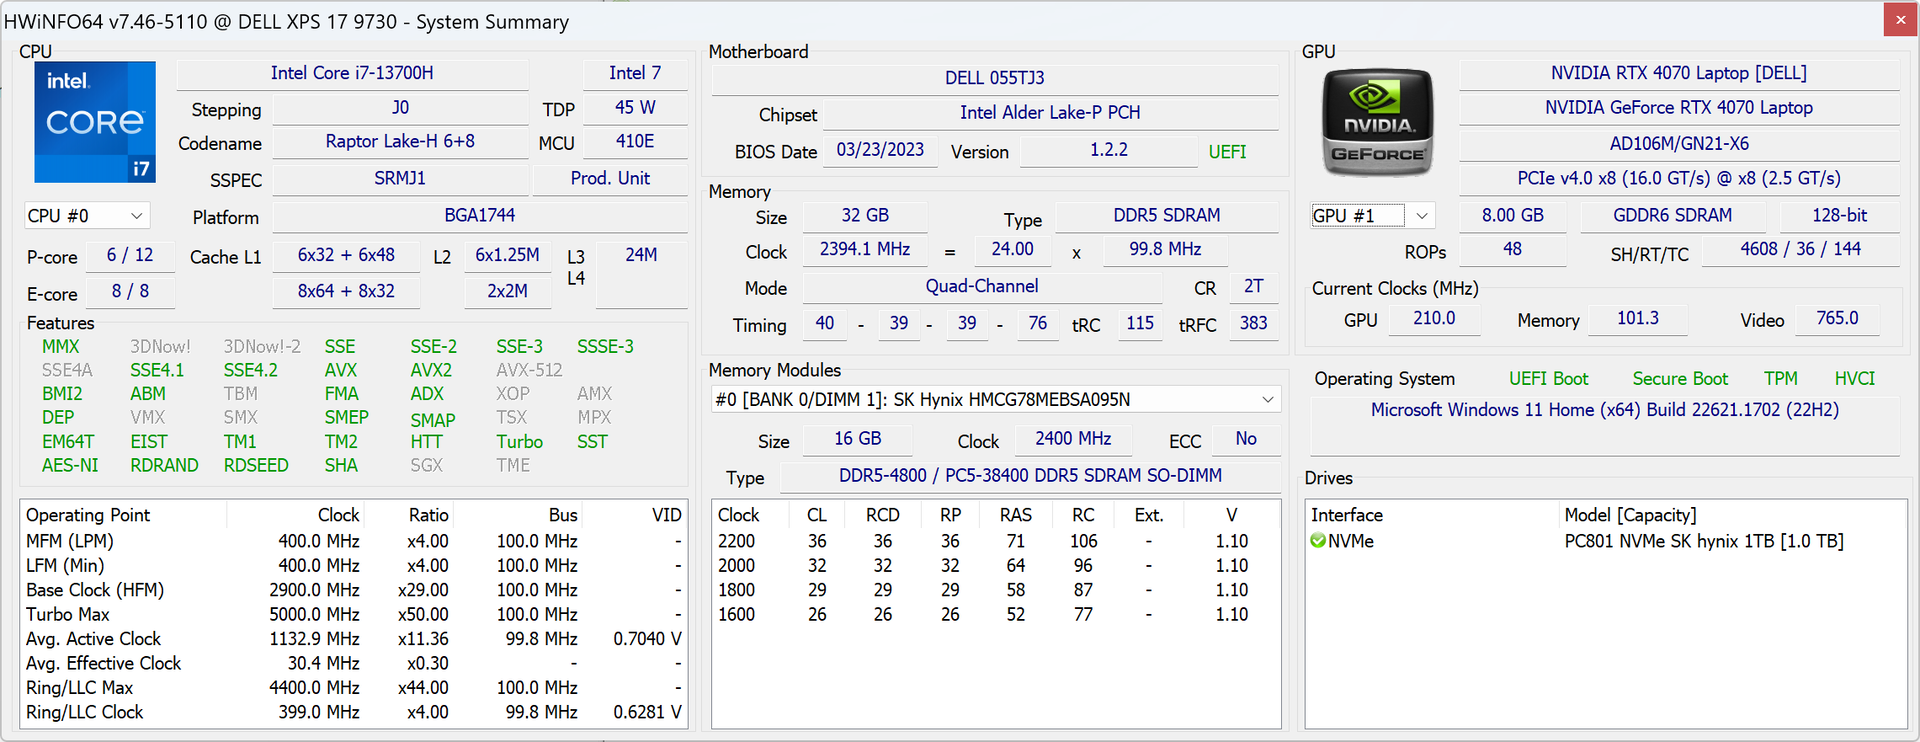
La nostra configurazione specifica in esame è una SKU di fascia alta con Core i7-13700H, GeForce RTX 4070 e schermo touchscreen lucido UHD+ 2400p per circa 3500 dollari al dettaglio. Altre SKU sono disponibili con RTX 4050, RTX 4060, RTX 4080, Core i9-13900H o display opaco a 1200p. È interessante notare che tutte le configurazioni devono essere dotate di grafica discreta, mentre i precedenti modelli XPS 17 avevano opzioni UHD o Iris Xe integrate più economiche.
I concorrenti in questo spazio includono altri laptop multimediali da 17 pollici di punta come il modello LG Gram 17, HP Envy 17,MSI Creator Z17o il MacBook Pro 16 polliciApple MacBook Pro 16.
Altre recensioni Dell:
Potenziali concorrenti a confronto
Punteggio | Data | Modello | Peso | Altezza | Dimensione | Risoluzione | Prezzo |
|---|---|---|---|---|---|---|---|
| 90 % v7 (old) | 05/2023 | Dell XPS 17 9730 RTX 4070 i7-13700H, NVIDIA GeForce RTX 4070 Laptop GPU | 2.5 kg | 19.5 mm | 17.00" | 3840x2400 | |
| 88.8 % v7 (old) | 06/2022 | Dell XPS 17 9720 RTX 3060 i7-12700H, GeForce RTX 3060 Laptop GPU | 2.5 kg | 19.5 mm | 17.00" | 3840x2400 | |
| 86.4 % v7 (old) | 05/2023 | LG Gram 17 (2023) i7-1360P, Iris Xe G7 96EUs | 1.4 kg | 17.8 mm | 17.00" | 2560x1600 | |
| 86.3 % v7 (old) | 04/2023 | HP Envy 17-cr0079ng i7-1255U, GeForce RTX 2050 Mobile | 2.6 kg | 19.6 mm | 17.30" | 3840x2160 | |
| 83.8 % v7 (old) | 09/2022 | MSI Creator Z17 A12UGST-054 i9-12900H, GeForce RTX 3070 Ti Laptop GPU | 2.5 kg | 19 mm | 17.00" | 2560x1600 | |
| 93.7 % v7 (old) | 03/2023 | Apple MacBook Pro 16 2023 M2 Max M2 Max, M2 Max 38-Core GPU | 2.2 kg | 16.8 mm | 16.20" | 3456x2234 |
Caso - Stesso design per tre anni consecutivi
Lettore di schede SD
| SD Card Reader | |
| average JPG Copy Test (av. of 3 runs) | |
| Dell XPS 17 9720 RTX 3060 (Toshiba Exceria Pro SDXC 64 GB UHS-II) | |
| Dell XPS 17 9730 RTX 4070 (Toshiba Exceria Pro SDXC 64 GB UHS-II) | |
| Apple MacBook Pro 16 2023 M2 Max (Angelbird AV Pro V60) | |
| MSI Creator Z17 A12UGST-054 (AV Pro SD microSD 128 GB V60) | |
| HP Envy 17-cr0079ng (AV Pro SD microSD 128 GB V60) | |
| LG Gram 17 (2023) (AV Pro SD microSD 128 GB V60) | |
| maximum AS SSD Seq Read Test (1GB) | |
| Apple MacBook Pro 16 2023 M2 Max (Angelbird AV Pro V60) | |
| Dell XPS 17 9730 RTX 4070 (Toshiba Exceria Pro SDXC 64 GB UHS-II) | |
| Dell XPS 17 9720 RTX 3060 (Toshiba Exceria Pro SDXC 64 GB UHS-II) | |
| LG Gram 17 (2023) (AV Pro SD microSD 128 GB V60) | |
| MSI Creator Z17 A12UGST-054 (AV Pro SD microSD 128 GB V60) | |
| HP Envy 17-cr0079ng (AV Pro SD microSD 128 GB V60) | |
Comunicazione - No Wi-Fi 6E
L'XPS 15 e l'XPS 17 continuano a essere gli unici computer portatili a memoria recente a essere forniti con moduli WLAN Wi-Fi 6E e a NON supportare la connettività Wi-Fi 6E. Pertanto, non sarà possibile connettersi a nessuna rete Wi-Fi a 6 GHz. Questo non dovrebbe essere un problema importante per la maggior parte degli utenti, ma è comunque deludente per un portatile che costa oltre 3500 dollari.
| Networking | |
| iperf3 transmit AXE11000 | |
| LG Gram 17 (2023) | |
| Dell XPS 17 9720 RTX 3060 | |
| HP Envy 17-cr0079ng | |
| Dell XPS 17 9730 RTX 4070 | |
| iperf3 receive AXE11000 | |
| LG Gram 17 (2023) | |
| HP Envy 17-cr0079ng | |
| Dell XPS 17 9720 RTX 3060 | |
| Dell XPS 17 9730 RTX 4070 | |
| iperf3 transmit AXE11000 6GHz | |
| Apple MacBook Pro 16 2023 M2 Max | |
| LG Gram 17 (2023) | |
| HP Envy 17-cr0079ng | |
| MSI Creator Z17 A12UGST-054 | |
| iperf3 receive AXE11000 6GHz | |
| Apple MacBook Pro 16 2023 M2 Max | |
| MSI Creator Z17 A12UGST-054 | |
| HP Envy 17-cr0079ng | |
| LG Gram 17 (2023) | |
Webcam - Solo 720p
L'XPS 15 e l'XPS 17 sono probabilmente gli unici portatili di punta ancora in commercio con webcam a bassa risoluzione da 1 MP o 720p e senza otturatore privacy. Produttori concorrenti come Lenovo, HP, Asus e altri sono già passati a soluzioni da 2 MP o addirittura da 8 MP. Dell sostiene che la cornice super stretta del display dell'XPS limita la qualità del sensore della webcam.


Manutenzione
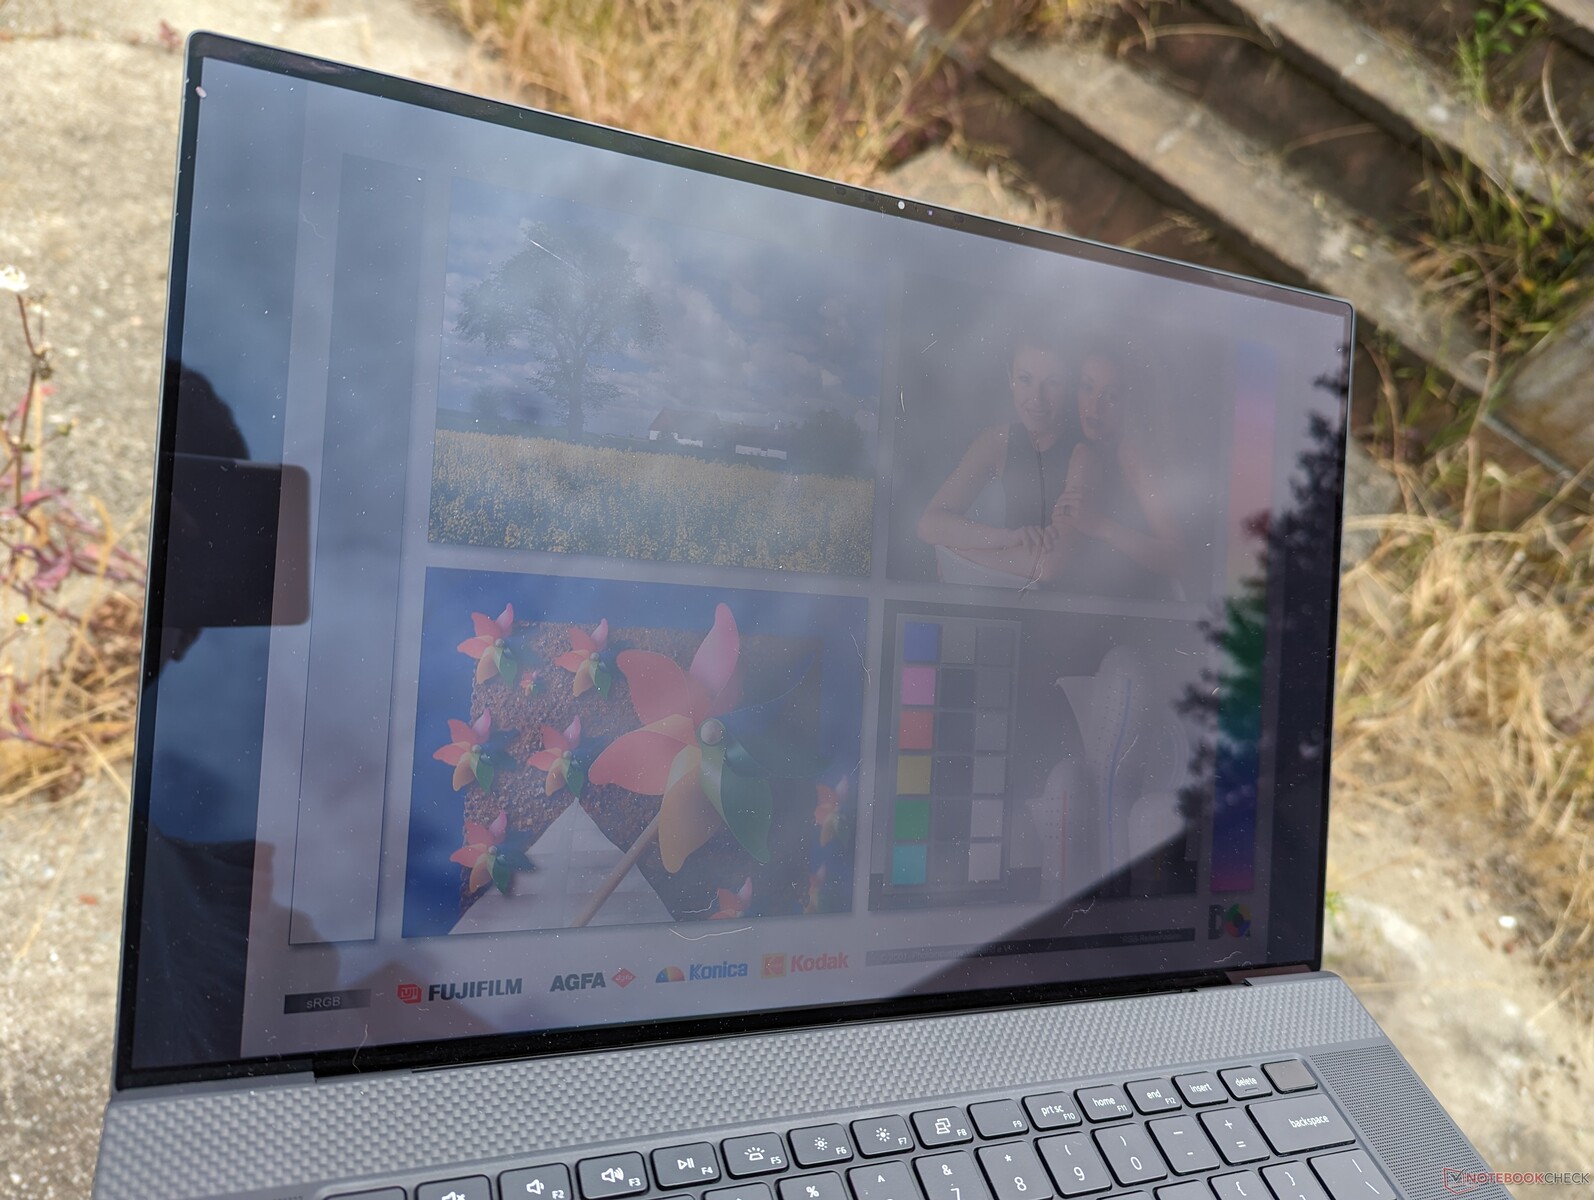
Display: ancora buono, ma senza opzione a 120 Hz
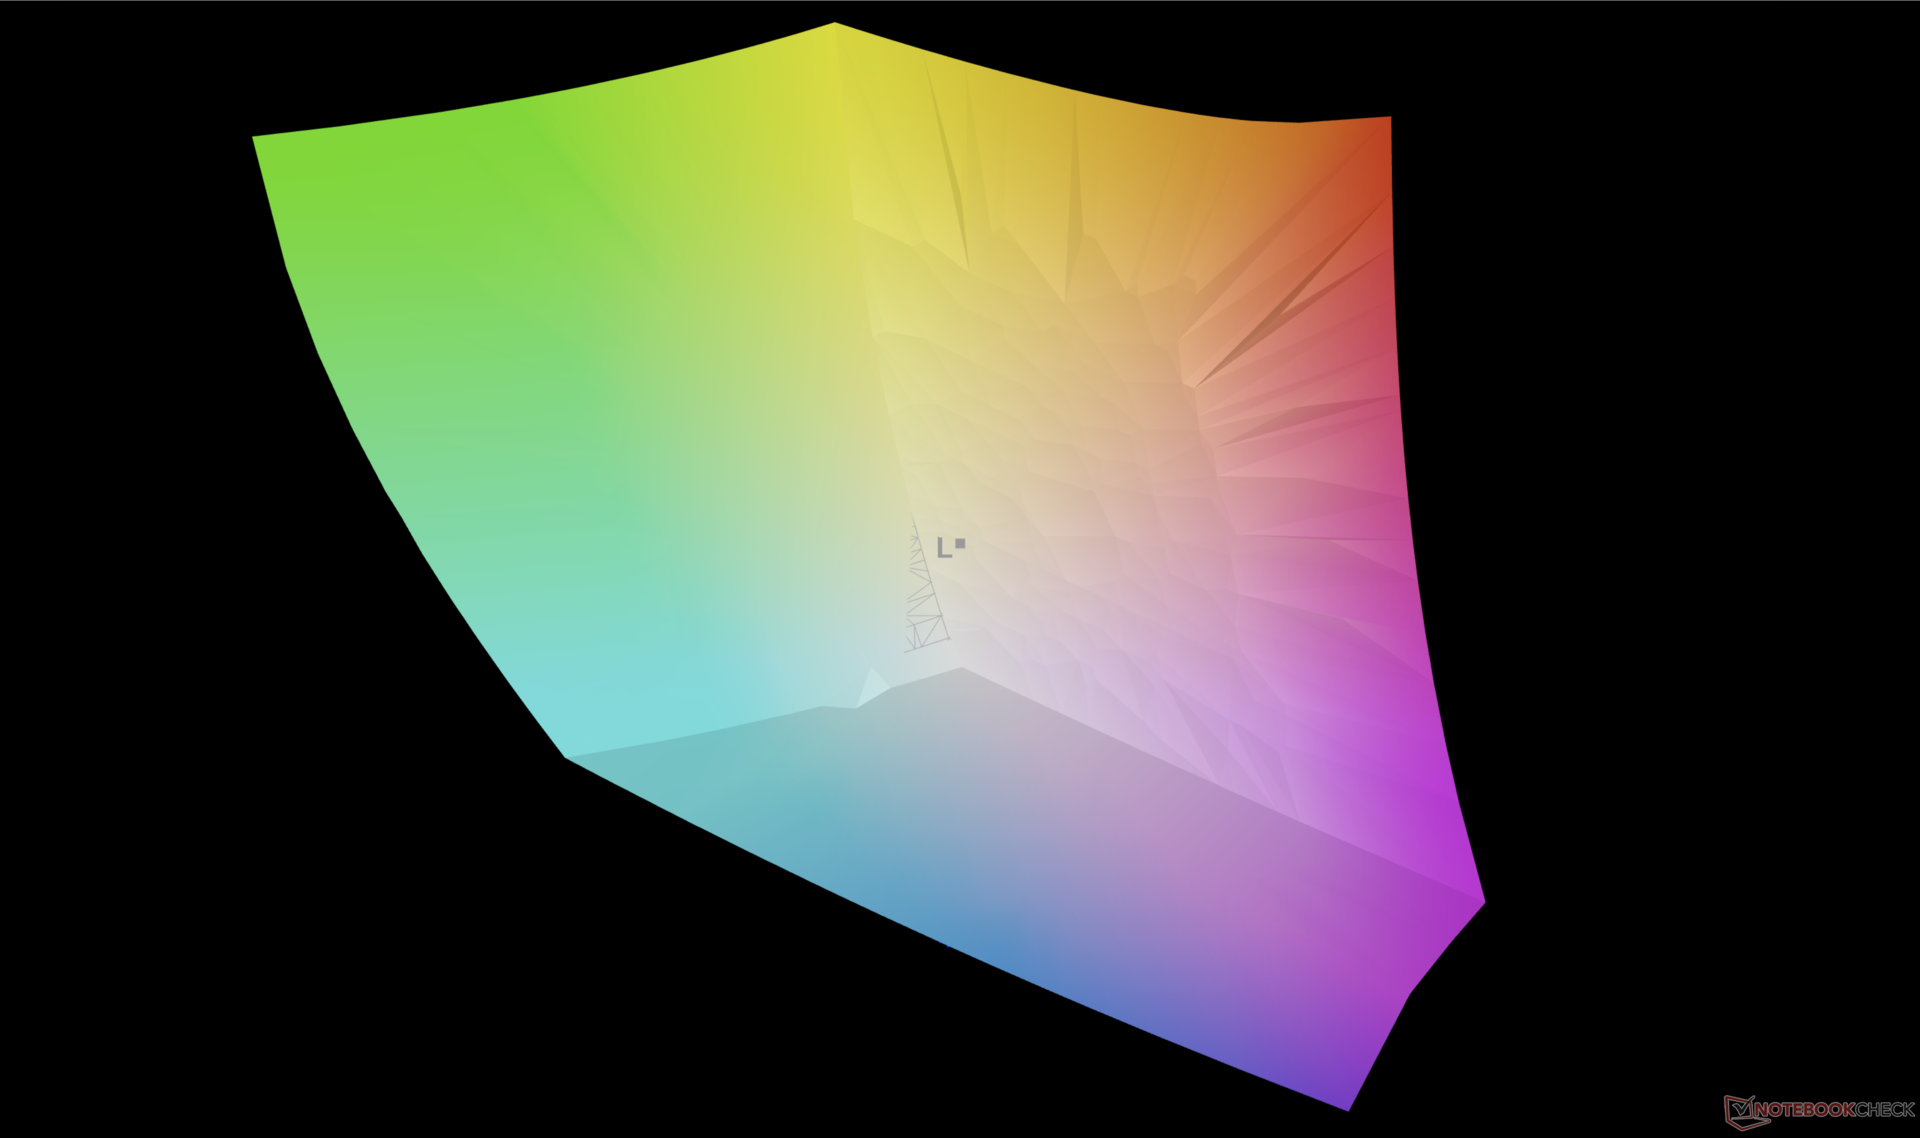
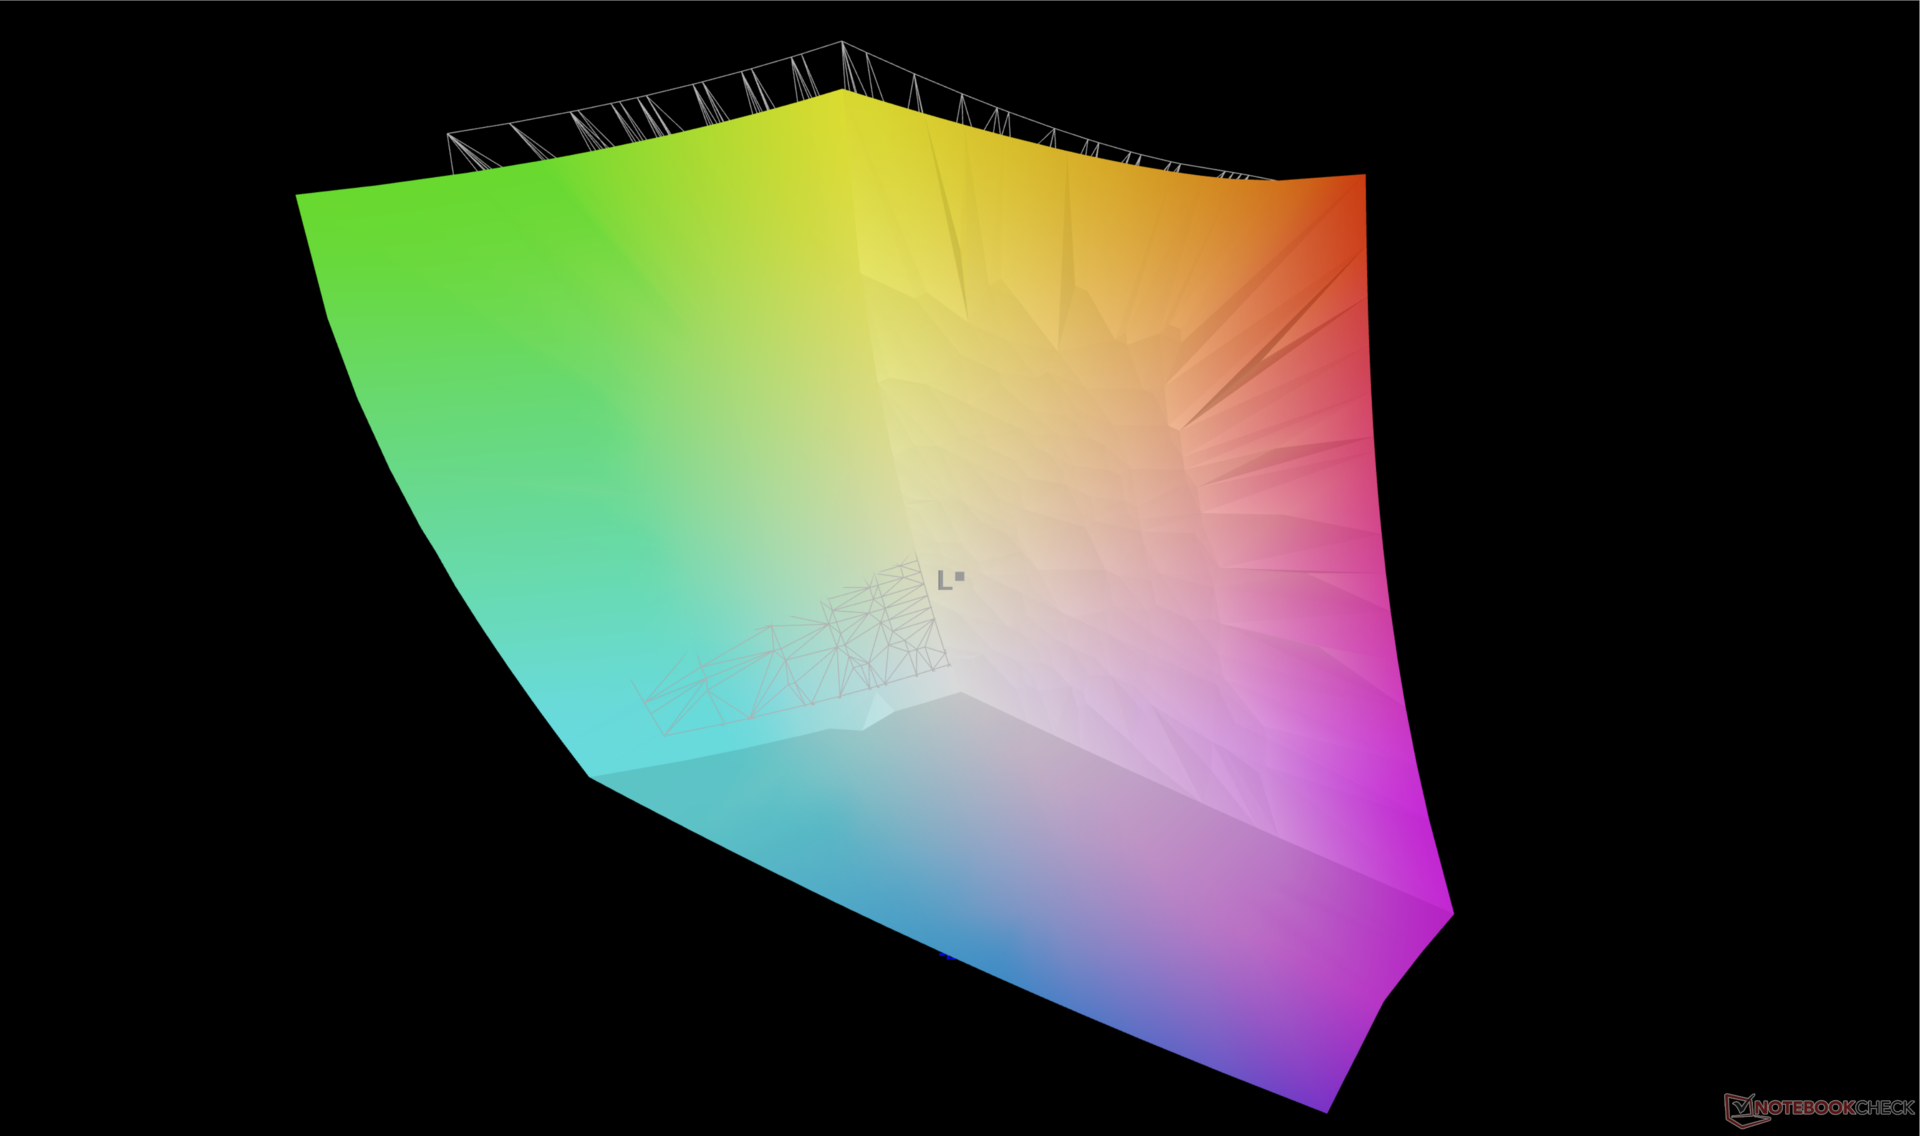
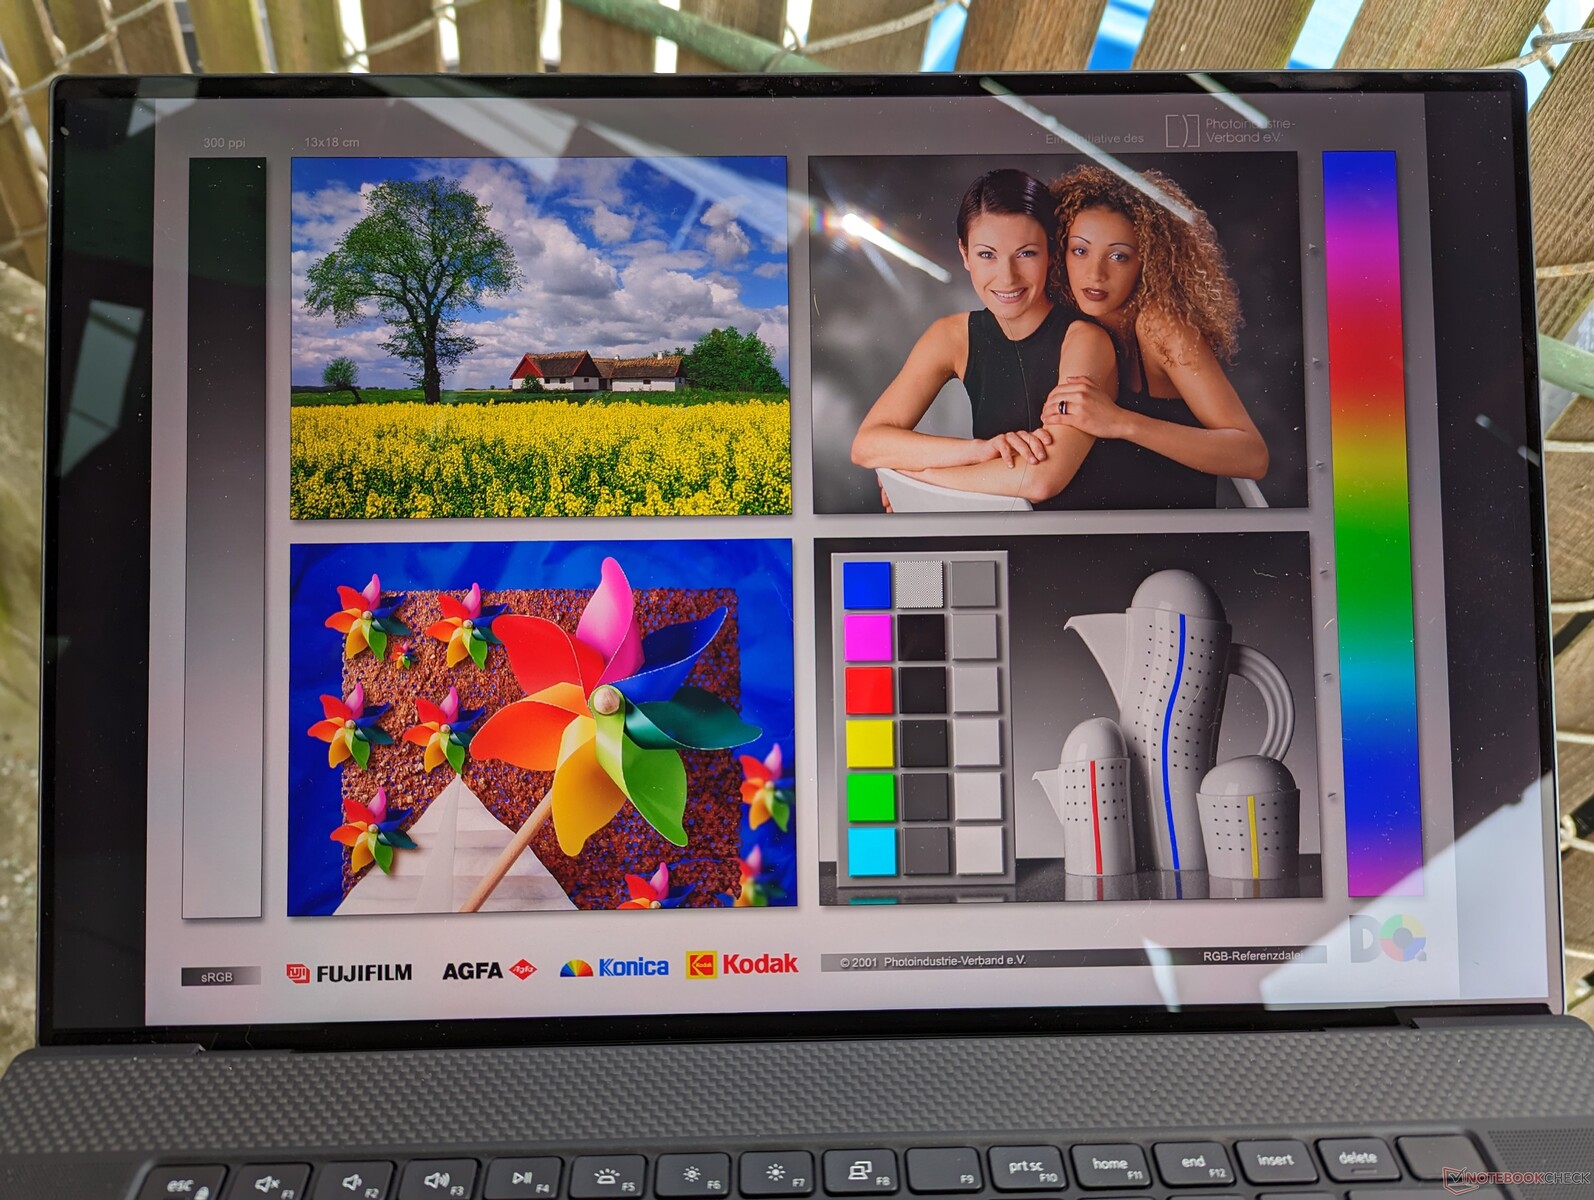
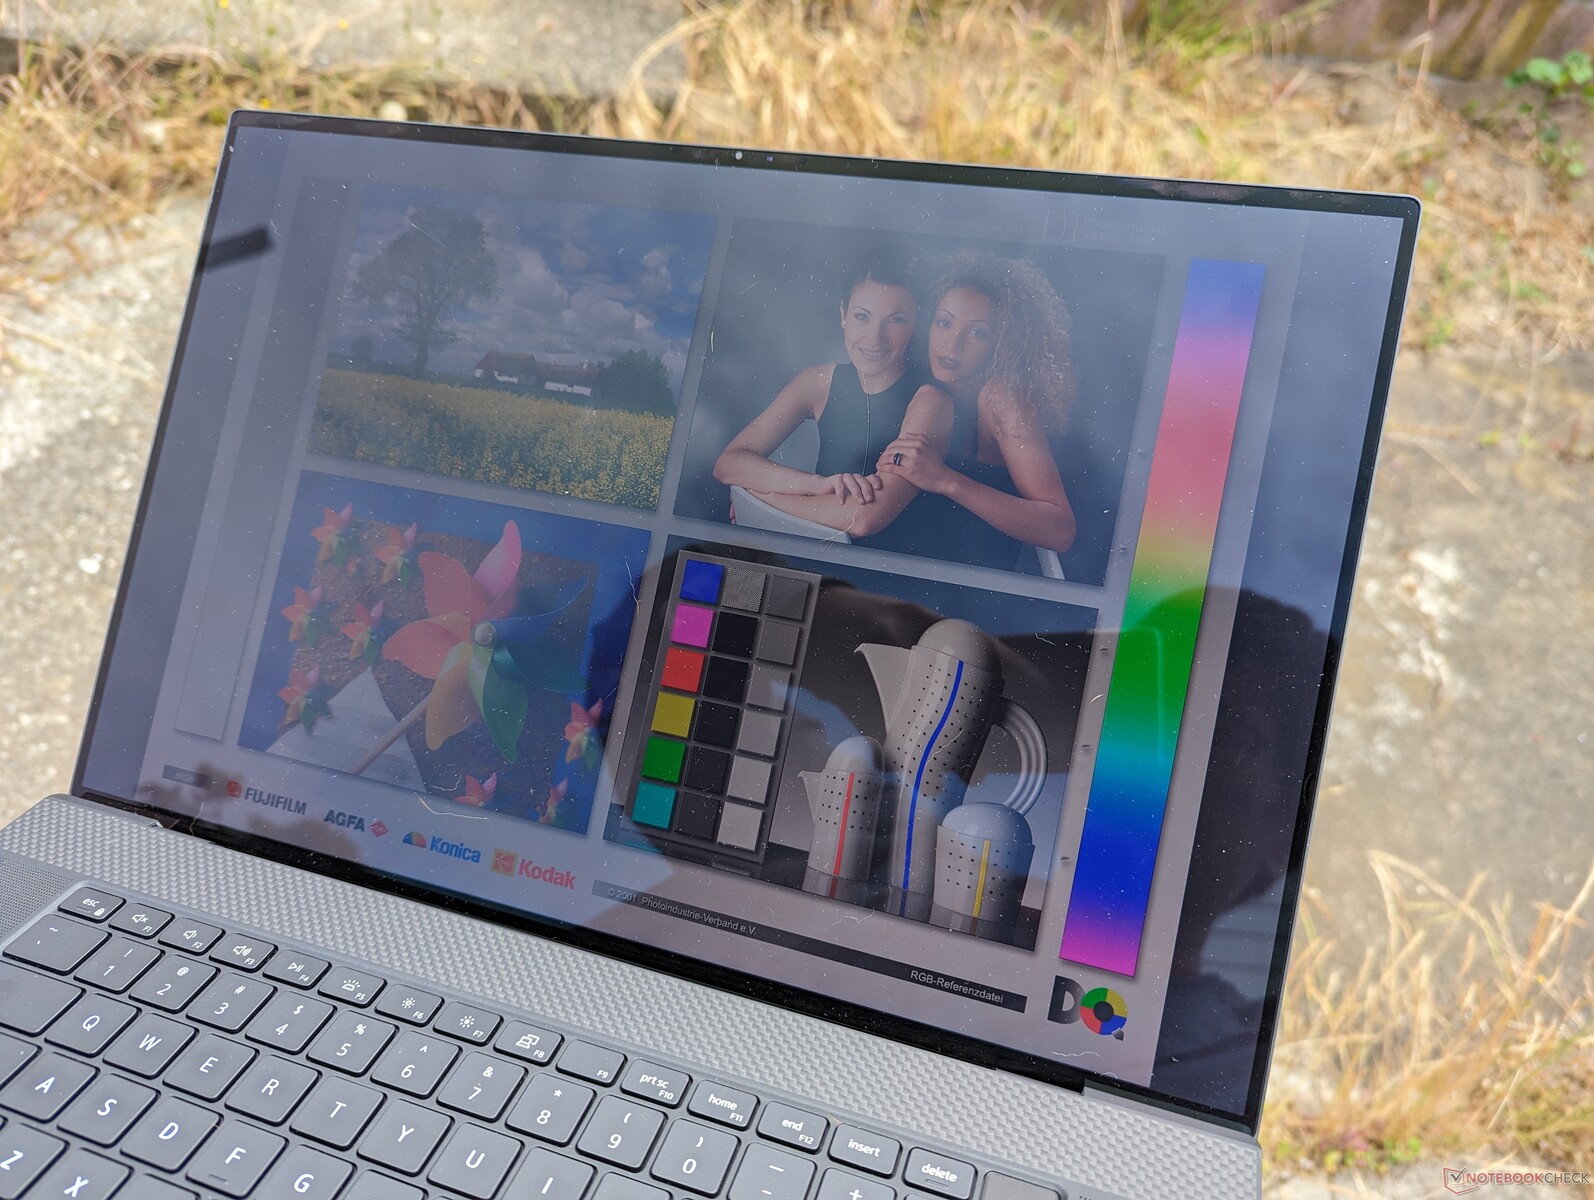
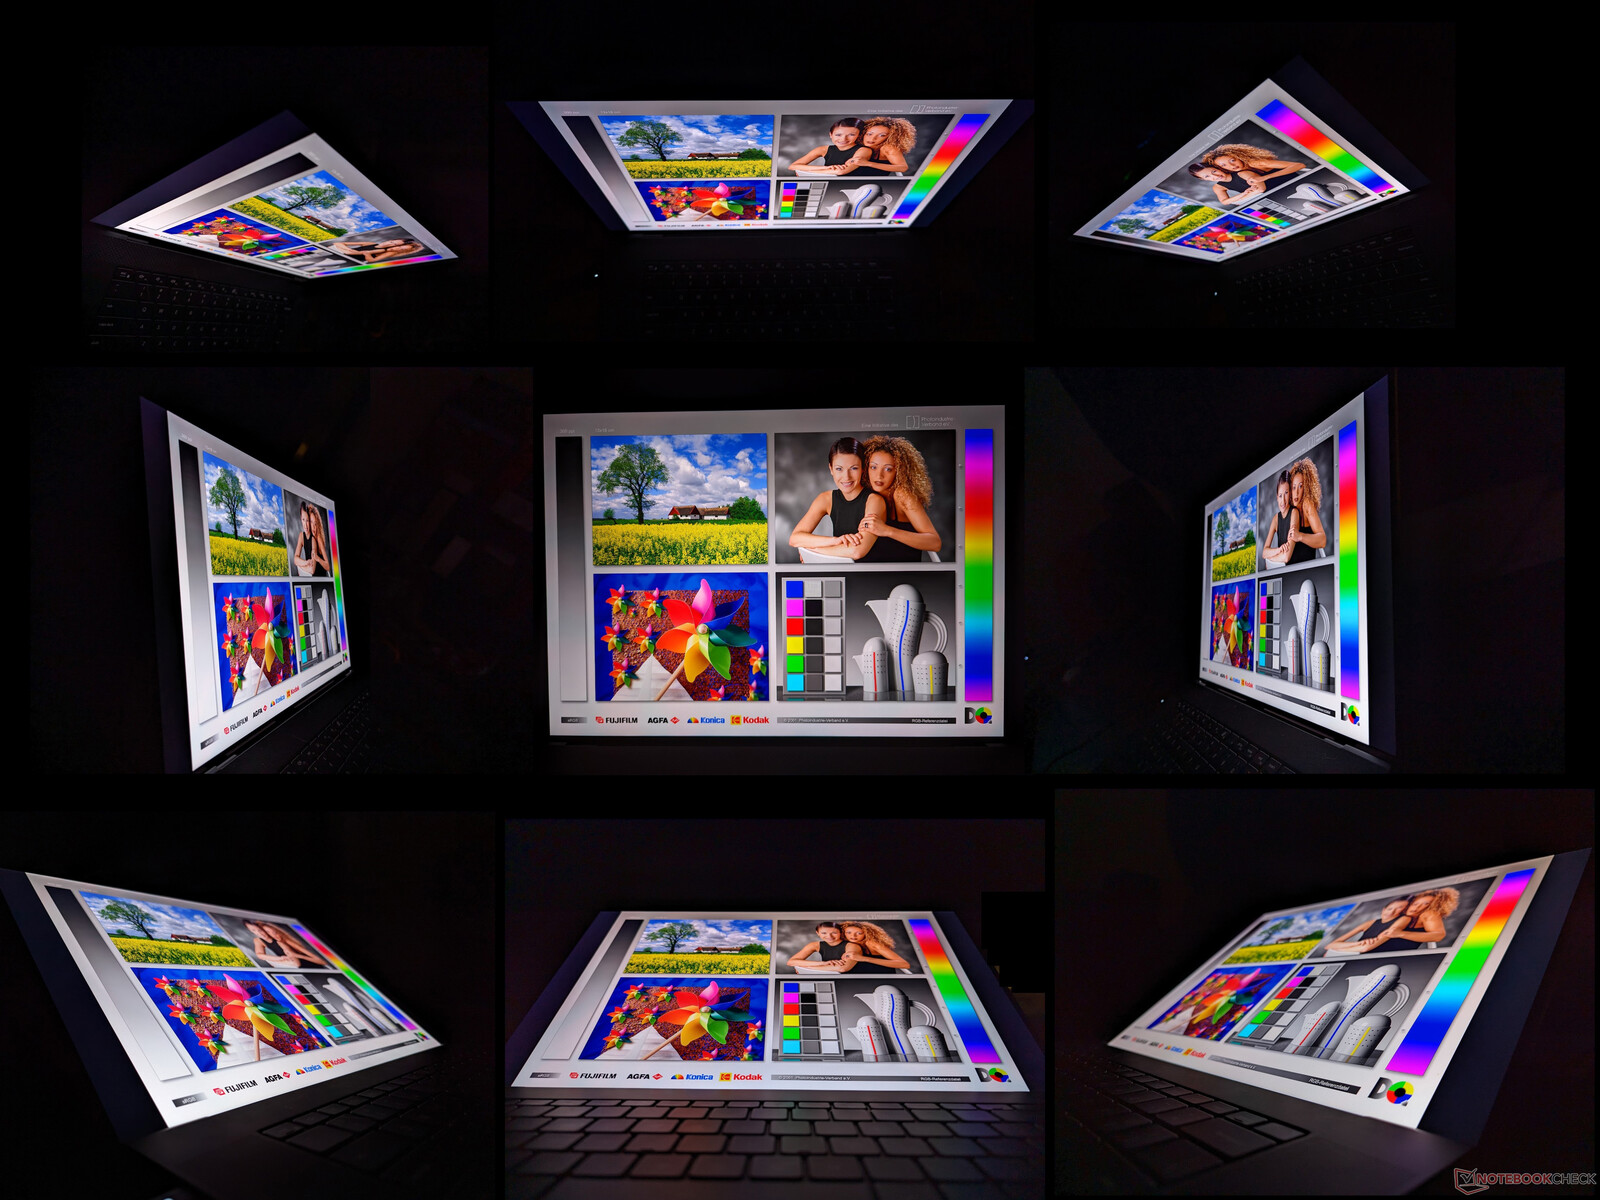
Dell utilizza lo stesso pannello touchscreen Sharp LQ170R1 IPS da 17,0 pollici per la serie XPS 17 sin dal modello originale del 2020. Pertanto, l'esperienza visiva è rimasta identica da allora e consigliamo di consultare le nostre recensioni esistenti sul modello 9720, 9710o 9700 per saperne di più sul display. Sebbene gli ampi colori DCI-P3, la buona luminosità massima, la nitida risoluzione UHD+ e il buon rapporto di contrasto di 1500:1 siano ancora ottimi, la frequenza di aggiornamento di 60 Hz comincia a mostrare la sua età, dato che i pannelli da 90 Hz o più veloci stanno diventando comuni su altri portatili multimediali come l' Asus ZenBook 14 o Lenovo Slim 7i.

| |||||||||||||||||||||||||
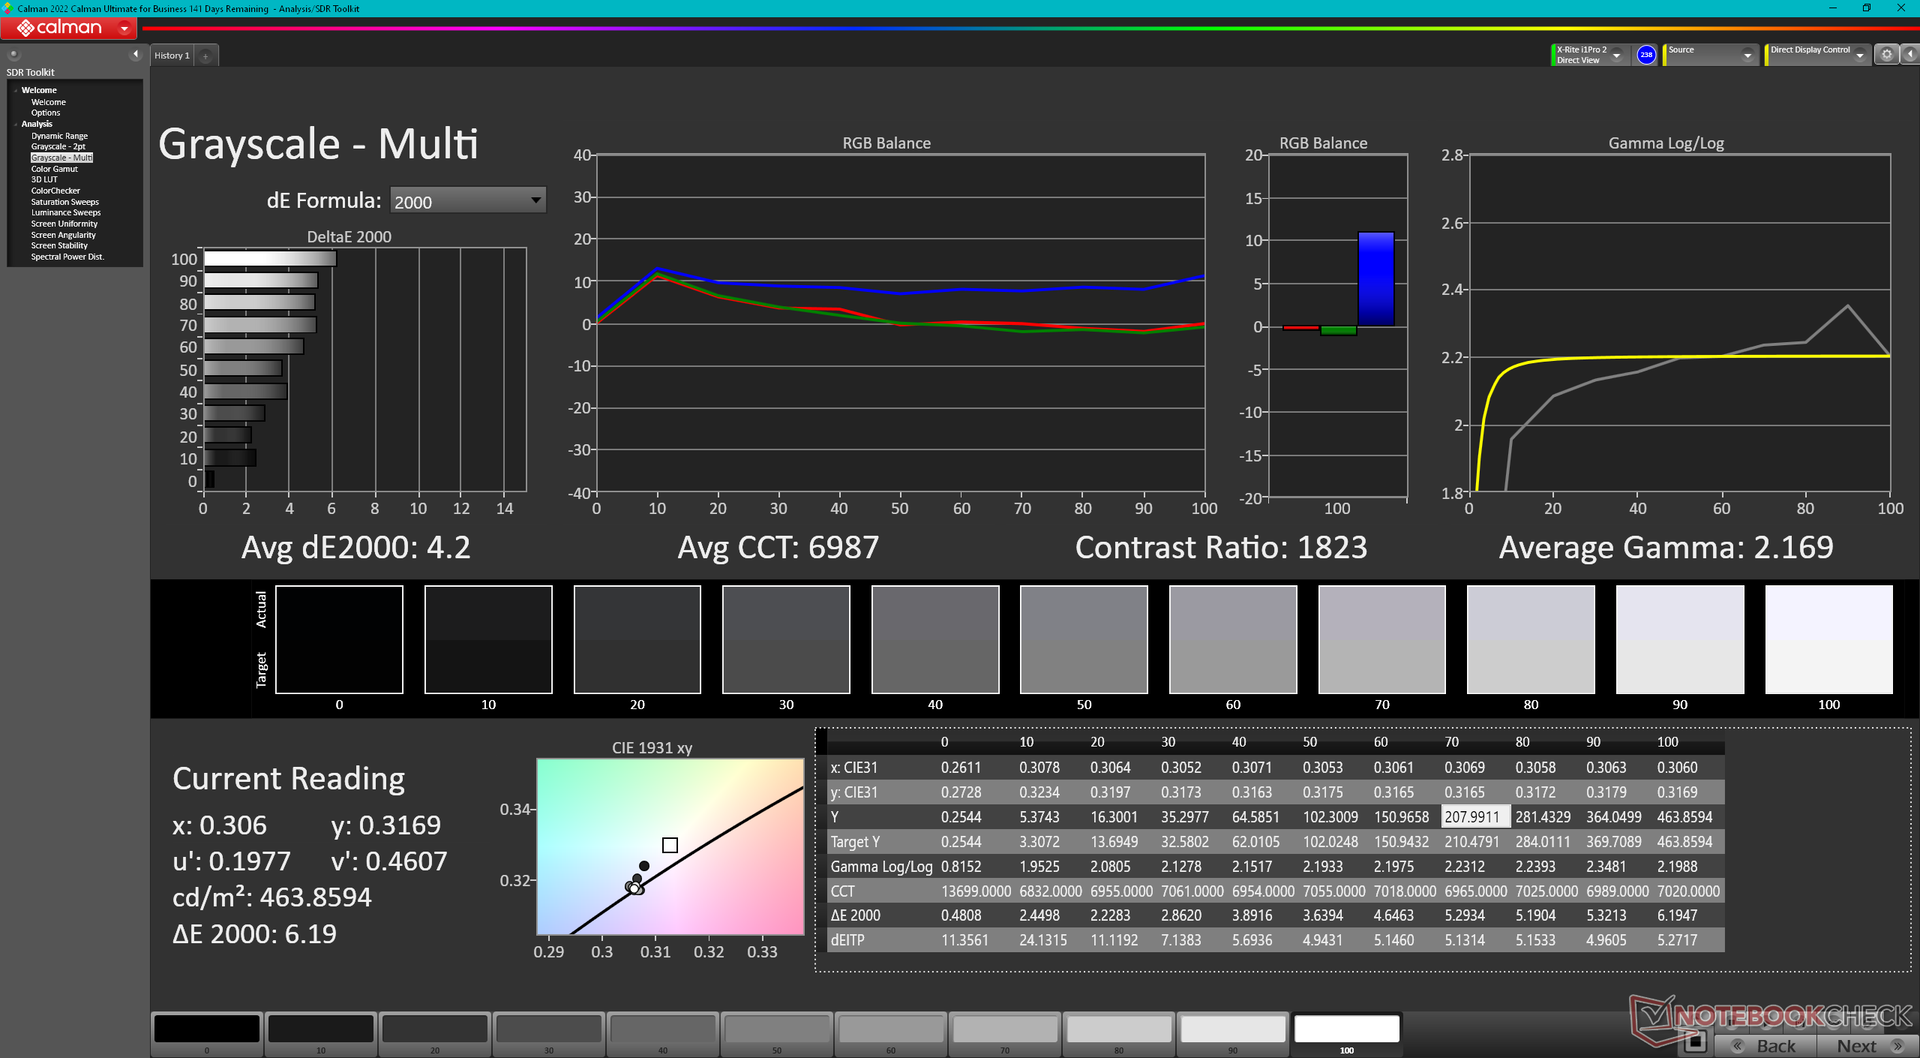
Distribuzione della luminosità: 85 %
Al centro con la batteria: 457.4 cd/m²
Contrasto: 1475:1 (Nero: 0.31 cd/m²)
ΔE Color 3.16 | 0.5-29.43 Ø4.86
ΔE Greyscale 4.2 | 0.5-98 Ø5.1
100% AdobeRGB 1998 (Argyll 2.2.0 3D)
100% sRGB (Argyll 2.2.0 3D)
95.2% Display P3 (Argyll 2.2.0 3D)
Gamma: 2.17
| Dell XPS 17 9730 RTX 4070 10-point capacitive, Sharp LQ170R1, 3840x2400, 17" | Dell XPS 17 9720 RTX 3060 Sharp LQ170R1, IPS, 3840x2400, 17" | LG Gram 17 (2023) LG Display LP170WQ1-SPF2, IPS, 2560x1600, 17" | HP Envy 17-cr0079ng BOE0A66, IPS, 3840x2160, 17.3" | MSI Creator Z17 A12UGST-054 AUO3C9B (B170QAN01.0), IPS, 2560x1600, 17" | Apple MacBook Pro 16 2023 M2 Max Mini-LED, 3456x2234, 16.2" | |
|---|---|---|---|---|---|---|
| Display | -6% | -4% | -3% | -3% | -2% | |
| Display P3 Coverage | 95.2 | 92.9 -2% | 97 2% | 98.31 3% | 98.9 4% | 99 4% |
| sRGB Coverage | 100 | 100 0% | 99.8 0% | 100 0% | 99.9 0% | 100 0% |
| AdobeRGB 1998 Coverage | 100 | 85.3 -15% | 84.9 -15% | 87.03 -13% | 86.4 -14% | 88.5 -11% |
| Response Times | -16% | 80% | 88% | 79% | -70% | |
| Response Time Grey 50% / Grey 80% * | 42.9 ? | 51.2 ? -19% | 2 ? 95% | 1 98% | 11 ? 74% | 80.5 ? -88% |
| Response Time Black / White * | 31.3 ? | 35.2 ? -12% | 11 ? 65% | 7 ? 78% | 5 ? 84% | 47.2 ? -51% |
| PWM Frequency | 14880 ? | |||||
| Screen | -30% | -6% | 9% | -13% | 4294% | |
| Brightness middle | 457.4 | 512.7 12% | 405 -11% | 390 -15% | 444 -3% | 504 10% |
| Brightness | 430 | 463 8% | 363 -16% | 385 -10% | 415 -3% | 487 13% |
| Brightness Distribution | 85 | 85 0% | 82 -4% | 86 1% | 88 4% | 94 11% |
| Black Level * | 0.31 | 0.32 -3% | 0.225 27% | 0.395 -27% | 0.7 -126% | 0.001 100% |
| Contrast | 1475 | 1602 9% | 1800 22% | 987 -33% | 634 -57% | 504000 34069% |
| Colorchecker dE 2000 * | 3.16 | 5.98 -89% | 3.35 -6% | 1.66 47% | 2.48 22% | 1.5 53% |
| Colorchecker dE 2000 max. * | 5.8 | 12.09 -108% | 7.96 -37% | 2.9 50% | 3.52 39% | 3.3 43% |
| Greyscale dE 2000 * | 4.2 | 7.2 -71% | 5.28 -26% | 1.83 56% | 3.33 21% | 2.1 50% |
| Gamma | 2.17 101% | 2.54 87% | 2.43 91% | 2.25 98% | 2.33 94% | 2.25 98% |
| CCT | 6987 93% | 6914 94% | 7424 88% | 6727 97% | 6230 104% | 6882 94% |
| Colorchecker dE 2000 calibrated * | 1.34 | 1.16 | 2.91 | |||
| Media totale (Programma / Settaggio) | -17% /
-22% | 23% /
7% | 31% /
18% | 21% /
3% | 1407% /
2631% |
* ... Meglio usare valori piccoli
Tempi di risposta del Display
| ↔ Tempi di risposta dal Nero al Bianco | ||
|---|---|---|
| 31.3 ms ... aumenta ↗ e diminuisce ↘ combinato | ↗ 16.9 ms Incremento | 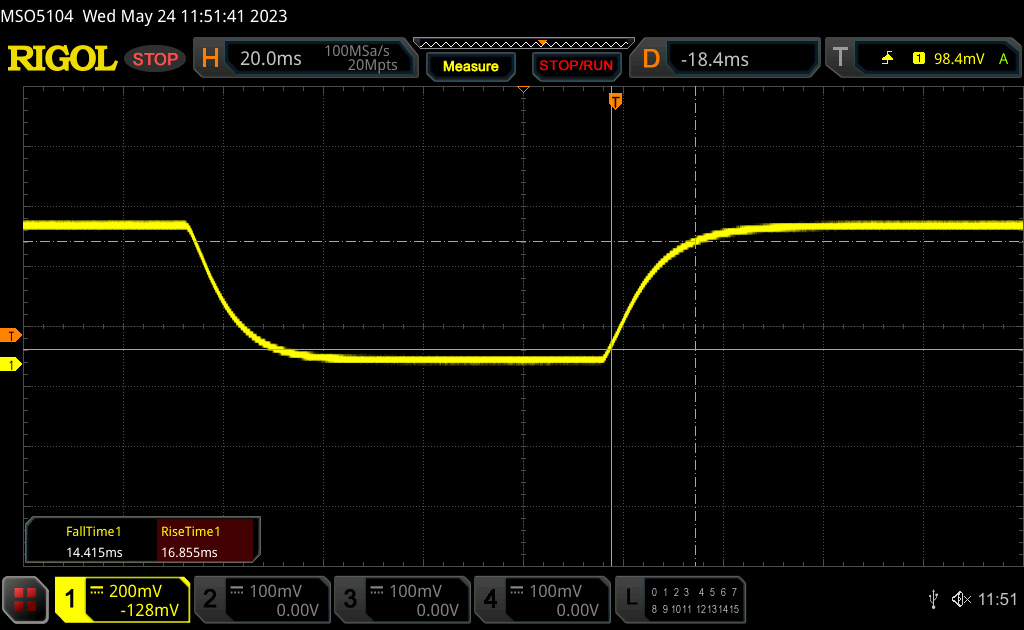 |
| ↘ 14.4 ms Calo | ||
| Lo schermo mostra tempi di risposta lenti nei nostri tests e sarà insoddisfacente per i gamers. In confronto, tutti i dispositivi di test variano da 0.1 (minimo) a 240 (massimo) ms. » 84 % di tutti i dispositivi è migliore. Questo significa che i tempi di risposta rilevati sono peggiori rispetto alla media di tutti i dispositivi testati (20.7 ms). | ||
| ↔ Tempo di risposta dal 50% Grigio all'80% Grigio | ||
| 42.9 ms ... aumenta ↗ e diminuisce ↘ combinato | ↗ 19.9 ms Incremento | 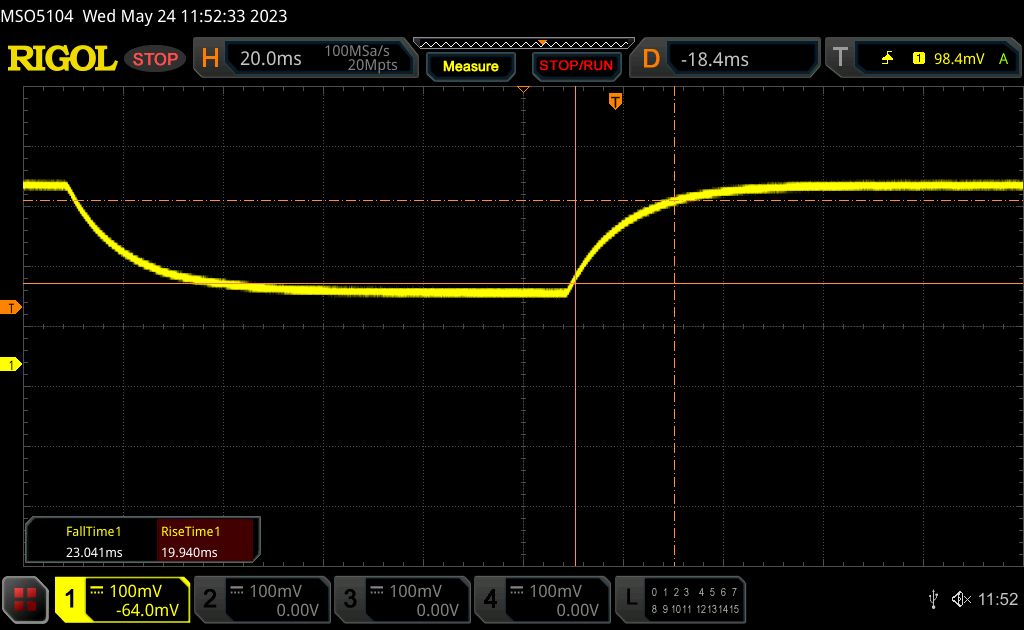 |
| ↘ 23 ms Calo | ||
| Lo schermo mostra tempi di risposta lenti nei nostri tests e sarà insoddisfacente per i gamers. In confronto, tutti i dispositivi di test variano da 0.165 (minimo) a 636 (massimo) ms. » 69 % di tutti i dispositivi è migliore. Questo significa che i tempi di risposta rilevati sono peggiori rispetto alla media di tutti i dispositivi testati (32.4 ms). | ||
Sfarfallio dello schermo / PWM (Pulse-Width Modulation)
| flickering dello schermo / PWM non rilevato | 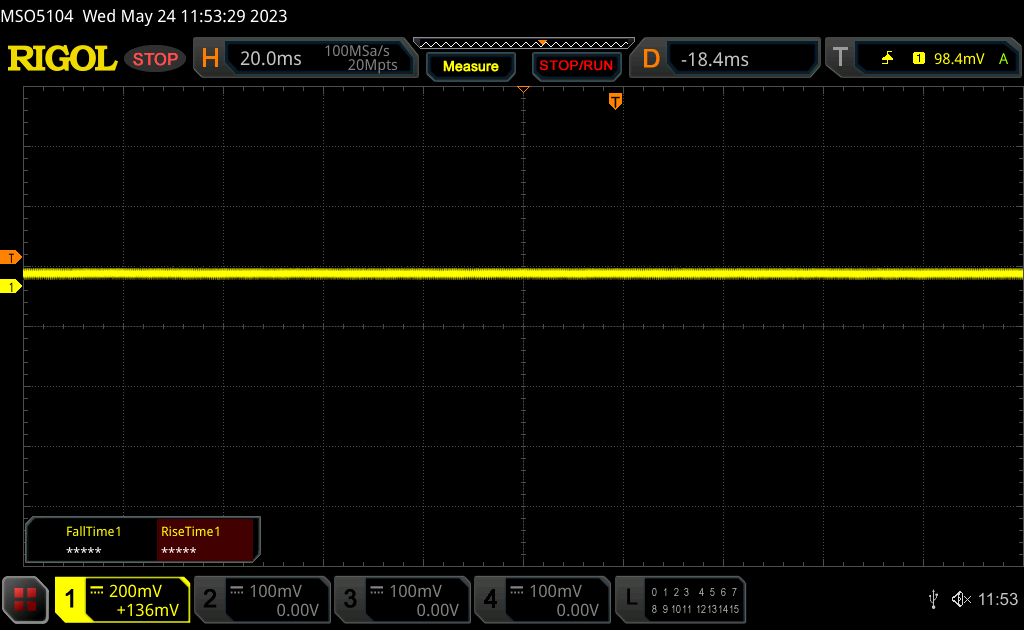 | ||
In confronto: 53 % di tutti i dispositivi testati non utilizza PWM per ridurre la luminosita' del display. Se è rilevato PWM, una media di 8455 (minimo: 5 - massimo: 343500) Hz è stata rilevata. | |||
Prestazioni - Intel di 13a generazione + Nvidia Ada Lovelace
Condizioni di test
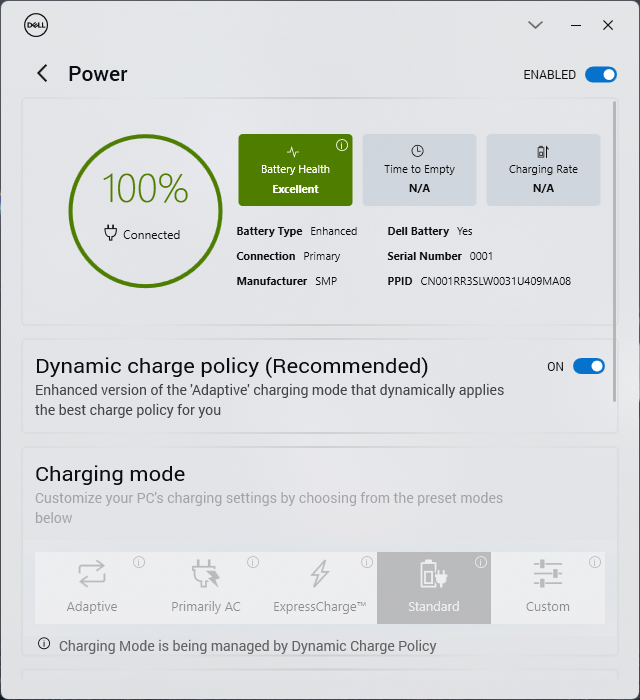
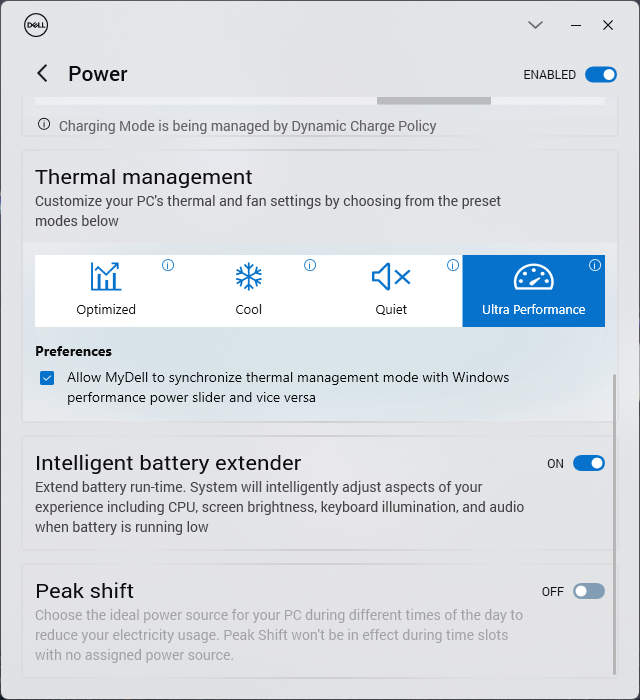
Abbiamo impostato la nostra unità in modalità Performance tramite il software MyDell prima di eseguire i benchmark qui sotto. Le impostazioni del profilo energetico di Dell sono comodamente sincronizzate con quelle di Windows, a differenza di quanto avviene sulla maggior parte dei portatili.
Si consiglia agli utenti di familiarizzare con MyDell, in quanto è l'hub centrale per regolare l'audio, i colori, l'alimentazione e altre applicazioni Dell preinstallate come SupportAssist. Dell ha ridisegnato ancora una volta l'interfaccia utente di MyDell per renderla più simile al software Dell Optimizer fornito con molti portatili business dello stesso produttore. Purtroppo, la finestra dell'applicazione è molto piccola e non può essere massimizzata.
Optimus è dotato di serie di commutazione automatica tra iGPU e dGPU. Non c'è supporto per Advanced Optimus o MUX.
Processore
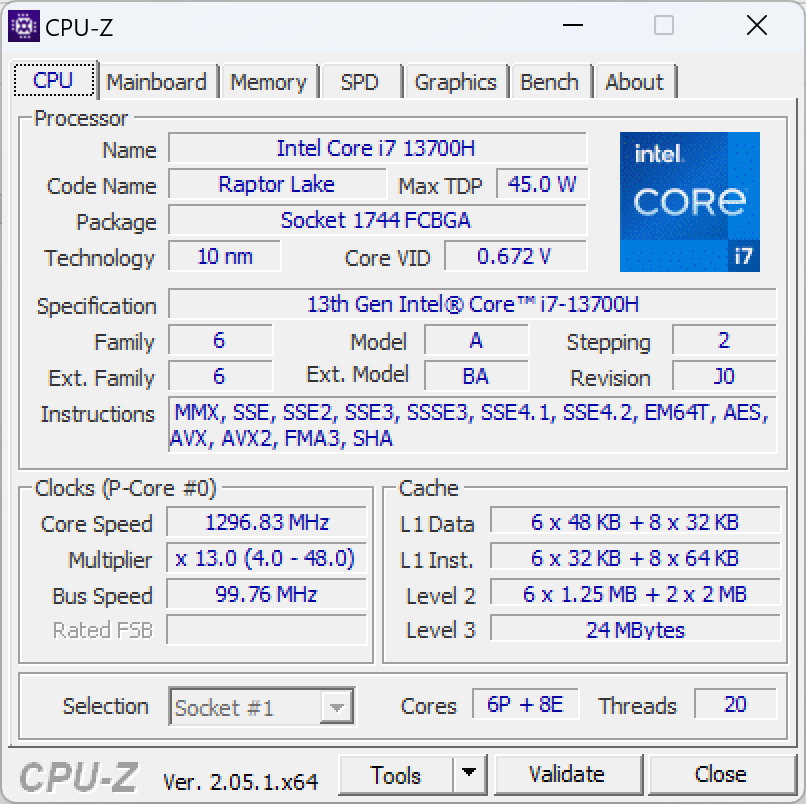
Il Core i7-13700H nell'XPS 17 si comporta molto bene con risultati di benchmark leggermente superiori a quelli della maggior parte degli altri portatili del nostro database dotati dello stesso processore, tra cui il recente XPS 15 9530. Il Turbo Boost, in particolare, è impressionante, con un vantaggio di prestazioni del 25% rispetto al Core i7-12700H del modello XPS 17 9720 dello scorso anno XPS 17 9720 dello scorso anno.
Tuttavia, c'è un problema notevole da tenere presente. Il Turbo Boost della CPU non è indefinito, come mostra il nostro grafico qui sotto quando si esegue CineBench R15 xT in loop. Le prestazioni si riducono di circa il 25% dopo 9 o 10 esecuzioni, un calo maggiore rispetto alla maggior parte degli altri portatili con CPU della serie H. Tenendo conto di questo throttling, il Core i7-13700H ha prestazioni quasi identiche al Core i7-12700H. Pertanto, il Core i7-13700H dà il meglio di sé quando sono necessarie prestazioni elevate per brevi periodi, ad esempio quando si avviano programmi, si modificano immagini o si codificano brevi video. Per il resto, offre solo piccoli vantaggi in termini di prestazioni rispetto al Core i7-12700H dello scorso anno.
L'aggiornamento al Core i9-13900H dovrebbe aumentare le prestazioni multi-thread di circa il 10-20%, in base alla nostra esperienza con l'MSI Stealth 17 Studio.MSI Stealth 17 Studio. Le prestazioni in single-thread, tuttavia, rimarrebbero invariate, se non leggermente più lente con il Core i9.
Cinebench R15 Multi Loop
Cinebench R23: Multi Core | Single Core
Cinebench R20: CPU (Multi Core) | CPU (Single Core)
Cinebench R15: CPU Multi 64Bit | CPU Single 64Bit
Blender: v2.79 BMW27 CPU
7-Zip 18.03: 7z b 4 | 7z b 4 -mmt1
Geekbench 5.5: Multi-Core | Single-Core
HWBOT x265 Benchmark v2.2: 4k Preset
LibreOffice : 20 Documents To PDF
R Benchmark 2.5: Overall mean
* ... Meglio usare valori piccoli
AIDA64: FP32 Ray-Trace | FPU Julia | CPU SHA3 | CPU Queen | FPU SinJulia | FPU Mandel | CPU AES | CPU ZLib | FP64 Ray-Trace | CPU PhotoWorxx
| Performance Rating | |
| Dell XPS 17 9730 RTX 4070 | |
| Media Intel Core i7-13700H | |
| MSI Creator Z17 A12UGST-054 | |
| Dell XPS 17 9720 RTX 3060 | |
| LG Gram 17 (2023) | |
| HP Envy 17-cr0079ng | |
| AIDA64 / FP32 Ray-Trace | |
| Dell XPS 17 9730 RTX 4070 | |
| Media Intel Core i7-13700H (4986 - 18908, n=29) | |
| LG Gram 17 (2023) | |
| MSI Creator Z17 A12UGST-054 | |
| HP Envy 17-cr0079ng | |
| Dell XPS 17 9720 RTX 3060 | |
| AIDA64 / FPU Julia | |
| Dell XPS 17 9730 RTX 4070 | |
| Media Intel Core i7-13700H (25360 - 92359, n=29) | |
| HP Envy 17-cr0079ng | |
| LG Gram 17 (2023) | |
| MSI Creator Z17 A12UGST-054 | |
| Dell XPS 17 9720 RTX 3060 | |
| AIDA64 / CPU SHA3 | |
| Dell XPS 17 9730 RTX 4070 | |
| Media Intel Core i7-13700H (1339 - 4224, n=29) | |
| MSI Creator Z17 A12UGST-054 | |
| Dell XPS 17 9720 RTX 3060 | |
| HP Envy 17-cr0079ng | |
| LG Gram 17 (2023) | |
| AIDA64 / CPU Queen | |
| MSI Creator Z17 A12UGST-054 | |
| Dell XPS 17 9720 RTX 3060 | |
| Dell XPS 17 9730 RTX 4070 | |
| Media Intel Core i7-13700H (59324 - 107159, n=29) | |
| LG Gram 17 (2023) | |
| HP Envy 17-cr0079ng | |
| AIDA64 / FPU SinJulia | |
| Dell XPS 17 9730 RTX 4070 | |
| MSI Creator Z17 A12UGST-054 | |
| Dell XPS 17 9720 RTX 3060 | |
| Media Intel Core i7-13700H (4800 - 11050, n=29) | |
| LG Gram 17 (2023) | |
| HP Envy 17-cr0079ng | |
| AIDA64 / FPU Mandel | |
| Dell XPS 17 9730 RTX 4070 | |
| Media Intel Core i7-13700H (12321 - 45118, n=29) | |
| MSI Creator Z17 A12UGST-054 | |
| LG Gram 17 (2023) | |
| Dell XPS 17 9720 RTX 3060 | |
| HP Envy 17-cr0079ng | |
| AIDA64 / CPU AES | |
| MSI Creator Z17 A12UGST-054 | |
| Dell XPS 17 9720 RTX 3060 | |
| Media Intel Core i7-13700H (28769 - 151254, n=29) | |
| Dell XPS 17 9730 RTX 4070 | |
| LG Gram 17 (2023) | |
| HP Envy 17-cr0079ng | |
| AIDA64 / CPU ZLib | |
| Dell XPS 17 9730 RTX 4070 | |
| MSI Creator Z17 A12UGST-054 | |
| Media Intel Core i7-13700H (389 - 1215, n=29) | |
| Dell XPS 17 9720 RTX 3060 | |
| HP Envy 17-cr0079ng | |
| LG Gram 17 (2023) | |
| AIDA64 / FP64 Ray-Trace | |
| Dell XPS 17 9730 RTX 4070 | |
| Media Intel Core i7-13700H (2540 - 10135, n=29) | |
| LG Gram 17 (2023) | |
| MSI Creator Z17 A12UGST-054 | |
| Dell XPS 17 9720 RTX 3060 | |
| HP Envy 17-cr0079ng | |
| AIDA64 / CPU PhotoWorxx | |
| LG Gram 17 (2023) | |
| Dell XPS 17 9730 RTX 4070 | |
| Dell XPS 17 9720 RTX 3060 | |
| Media Intel Core i7-13700H (12872 - 52727, n=29) | |
| MSI Creator Z17 A12UGST-054 | |
| HP Envy 17-cr0079ng | |
Prestazioni del sistema
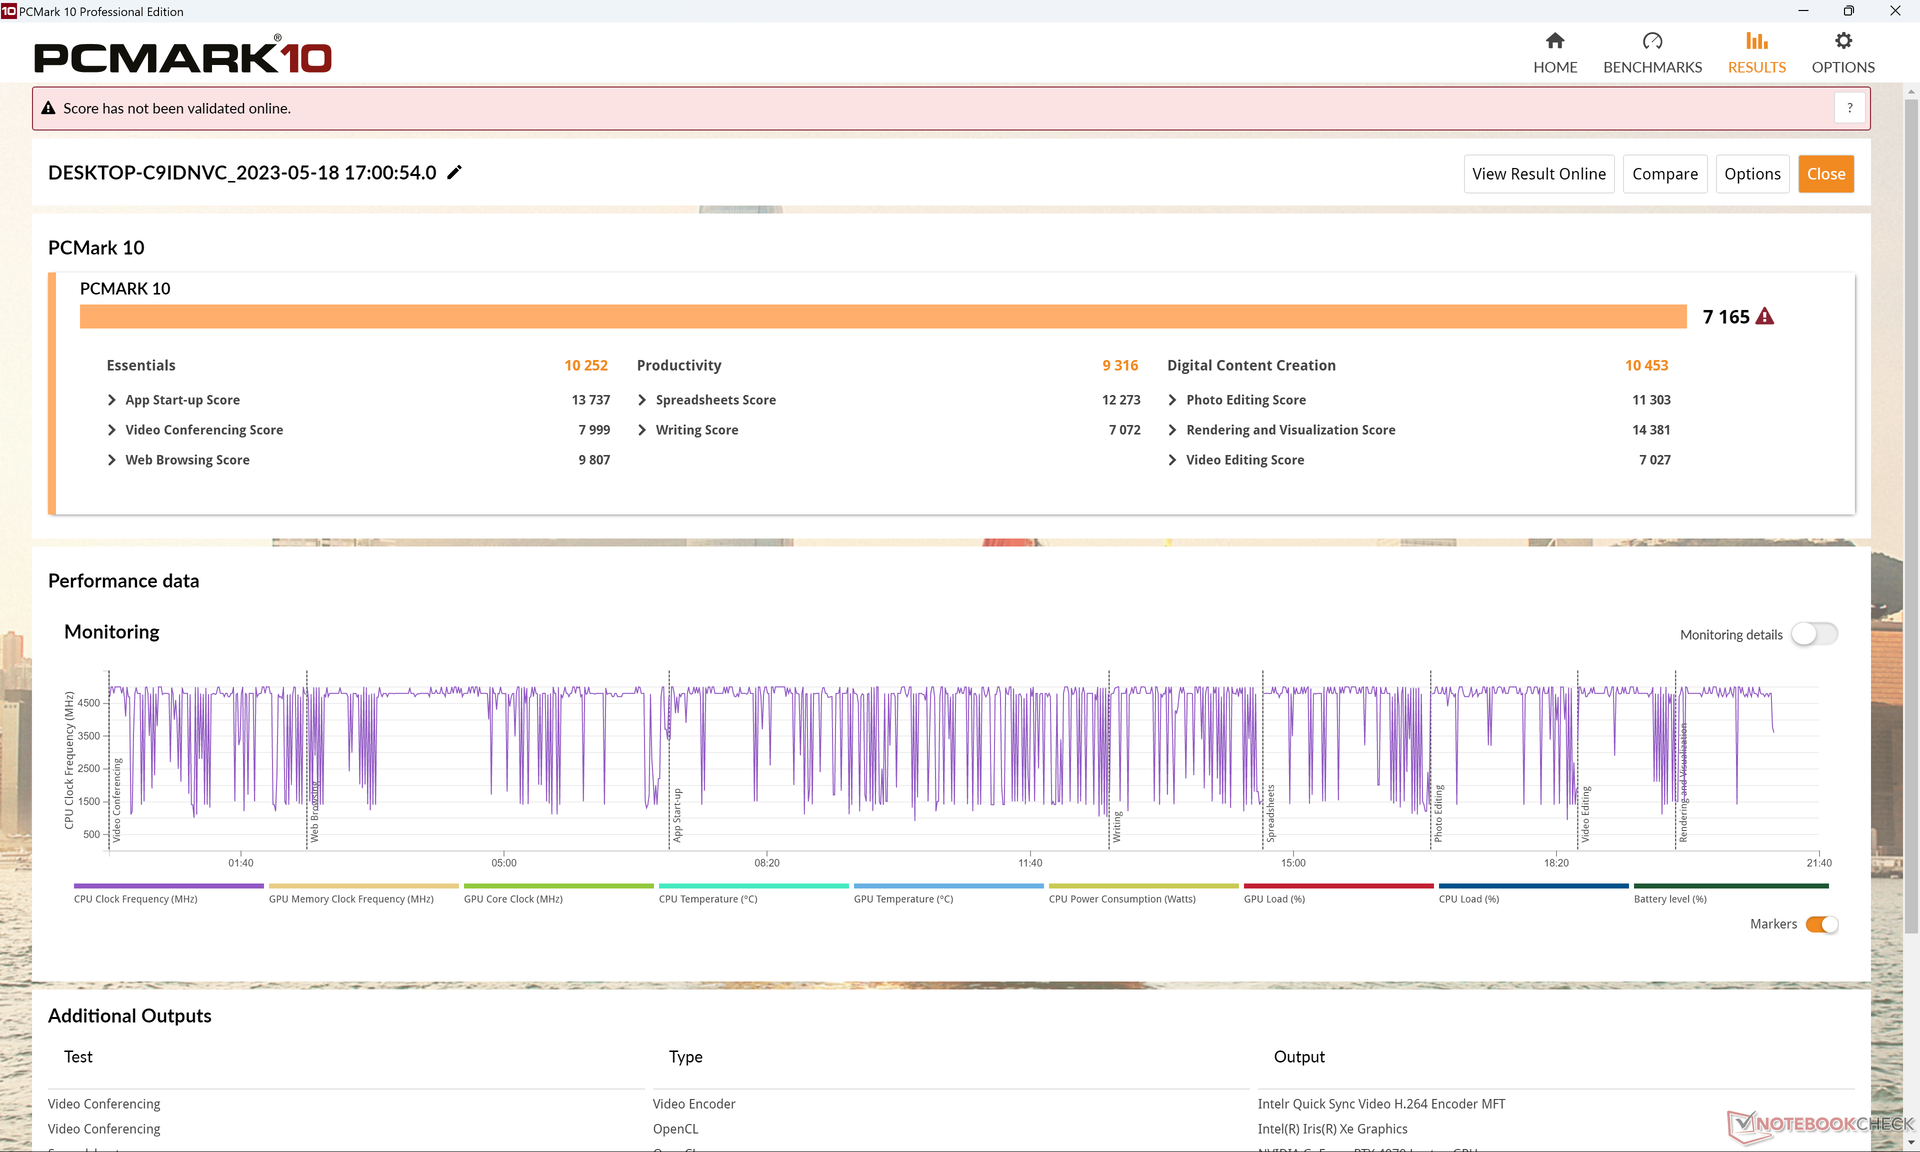
I punteggi di PCMark sono quasi identici a quelli dell'XPS 17 9720 dell'anno scorso, nonostante i miglioramenti delle prestazioni rispetto all'anno precedente. Ciò suggerisce che i carichi di lavoro quotidiani e le attività d'ufficio leggere non sono sensibilmente più veloci con l'ultimo modello. Se i vostri carichi di lavoro consistono principalmente nella navigazione web, nei fogli di calcolo e nell'elaborazione di testi, allora una configurazione XPS 17 inferiore con RTX 4050 potrebbe essere più appropriata della nostra configurazione con RTX 4070.
CrossMark: Overall | Productivity | Creativity | Responsiveness
| PCMark 10 / Score | |
| Media Intel Core i7-13700H, NVIDIA GeForce RTX 4070 Laptop GPU (7158 - 7956, n=8) | |
| Dell XPS 17 9720 RTX 3060 | |
| Dell XPS 17 9730 RTX 4070 | |
| MSI Creator Z17 A12UGST-054 | |
| HP Envy 17-cr0079ng | |
| LG Gram 17 (2023) | |
| PCMark 10 / Essentials | |
| LG Gram 17 (2023) | |
| Dell XPS 17 9720 RTX 3060 | |
| Media Intel Core i7-13700H, NVIDIA GeForce RTX 4070 Laptop GPU (10252 - 11449, n=8) | |
| HP Envy 17-cr0079ng | |
| MSI Creator Z17 A12UGST-054 | |
| Dell XPS 17 9730 RTX 4070 | |
| PCMark 10 / Productivity | |
| Media Intel Core i7-13700H, NVIDIA GeForce RTX 4070 Laptop GPU (8501 - 10769, n=8) | |
| MSI Creator Z17 A12UGST-054 | |
| Dell XPS 17 9720 RTX 3060 | |
| Dell XPS 17 9730 RTX 4070 | |
| HP Envy 17-cr0079ng | |
| LG Gram 17 (2023) | |
| PCMark 10 / Digital Content Creation | |
| Media Intel Core i7-13700H, NVIDIA GeForce RTX 4070 Laptop GPU (10358 - 12908, n=8) | |
| Dell XPS 17 9730 RTX 4070 | |
| Dell XPS 17 9720 RTX 3060 | |
| MSI Creator Z17 A12UGST-054 | |
| HP Envy 17-cr0079ng | |
| LG Gram 17 (2023) | |
| CrossMark / Overall | |
| MSI Creator Z17 A12UGST-054 | |
| Apple MacBook Pro 16 2023 M2 Max | |
| Media Intel Core i7-13700H, NVIDIA GeForce RTX 4070 Laptop GPU (1768 - 2073, n=6) | |
| Dell XPS 17 9720 RTX 3060 | |
| Dell XPS 17 9730 RTX 4070 | |
| LG Gram 17 (2023) | |
| HP Envy 17-cr0079ng | |
| CrossMark / Productivity | |
| MSI Creator Z17 A12UGST-054 | |
| Media Intel Core i7-13700H, NVIDIA GeForce RTX 4070 Laptop GPU (1645 - 2006, n=6) | |
| Dell XPS 17 9720 RTX 3060 | |
| Dell XPS 17 9730 RTX 4070 | |
| Apple MacBook Pro 16 2023 M2 Max | |
| LG Gram 17 (2023) | |
| HP Envy 17-cr0079ng | |
| CrossMark / Creativity | |
| Apple MacBook Pro 16 2023 M2 Max | |
| MSI Creator Z17 A12UGST-054 | |
| Dell XPS 17 9720 RTX 3060 | |
| Media Intel Core i7-13700H, NVIDIA GeForce RTX 4070 Laptop GPU (1936 - 2137, n=6) | |
| Dell XPS 17 9730 RTX 4070 | |
| LG Gram 17 (2023) | |
| HP Envy 17-cr0079ng | |
| CrossMark / Responsiveness | |
| MSI Creator Z17 A12UGST-054 | |
| Media Intel Core i7-13700H, NVIDIA GeForce RTX 4070 Laptop GPU (1451 - 2202, n=6) | |
| Dell XPS 17 9720 RTX 3060 | |
| Dell XPS 17 9730 RTX 4070 | |
| LG Gram 17 (2023) | |
| Apple MacBook Pro 16 2023 M2 Max | |
| HP Envy 17-cr0079ng | |
| PCMark 10 Score | 7165 punti | |
Aiuto | ||
| AIDA64 / Memory Copy | |
| LG Gram 17 (2023) | |
| Dell XPS 17 9730 RTX 4070 | |
| Dell XPS 17 9720 RTX 3060 | |
| MSI Creator Z17 A12UGST-054 | |
| Media Intel Core i7-13700H (24334 - 78081, n=29) | |
| HP Envy 17-cr0079ng | |
| AIDA64 / Memory Read | |
| Dell XPS 17 9730 RTX 4070 | |
| Dell XPS 17 9720 RTX 3060 | |
| MSI Creator Z17 A12UGST-054 | |
| Media Intel Core i7-13700H (23681 - 79656, n=29) | |
| LG Gram 17 (2023) | |
| HP Envy 17-cr0079ng | |
| AIDA64 / Memory Write | |
| LG Gram 17 (2023) | |
| Dell XPS 17 9730 RTX 4070 | |
| Media Intel Core i7-13700H (22986 - 99898, n=29) | |
| MSI Creator Z17 A12UGST-054 | |
| Dell XPS 17 9720 RTX 3060 | |
| HP Envy 17-cr0079ng | |
| AIDA64 / Memory Latency | |
| LG Gram 17 (2023) | |
| MSI Creator Z17 A12UGST-054 | |
| Dell XPS 17 9730 RTX 4070 | |
| Media Intel Core i7-13700H (82.4 - 136.8, n=29) | |
| Dell XPS 17 9720 RTX 3060 | |
| HP Envy 17-cr0079ng | |
* ... Meglio usare valori piccoli
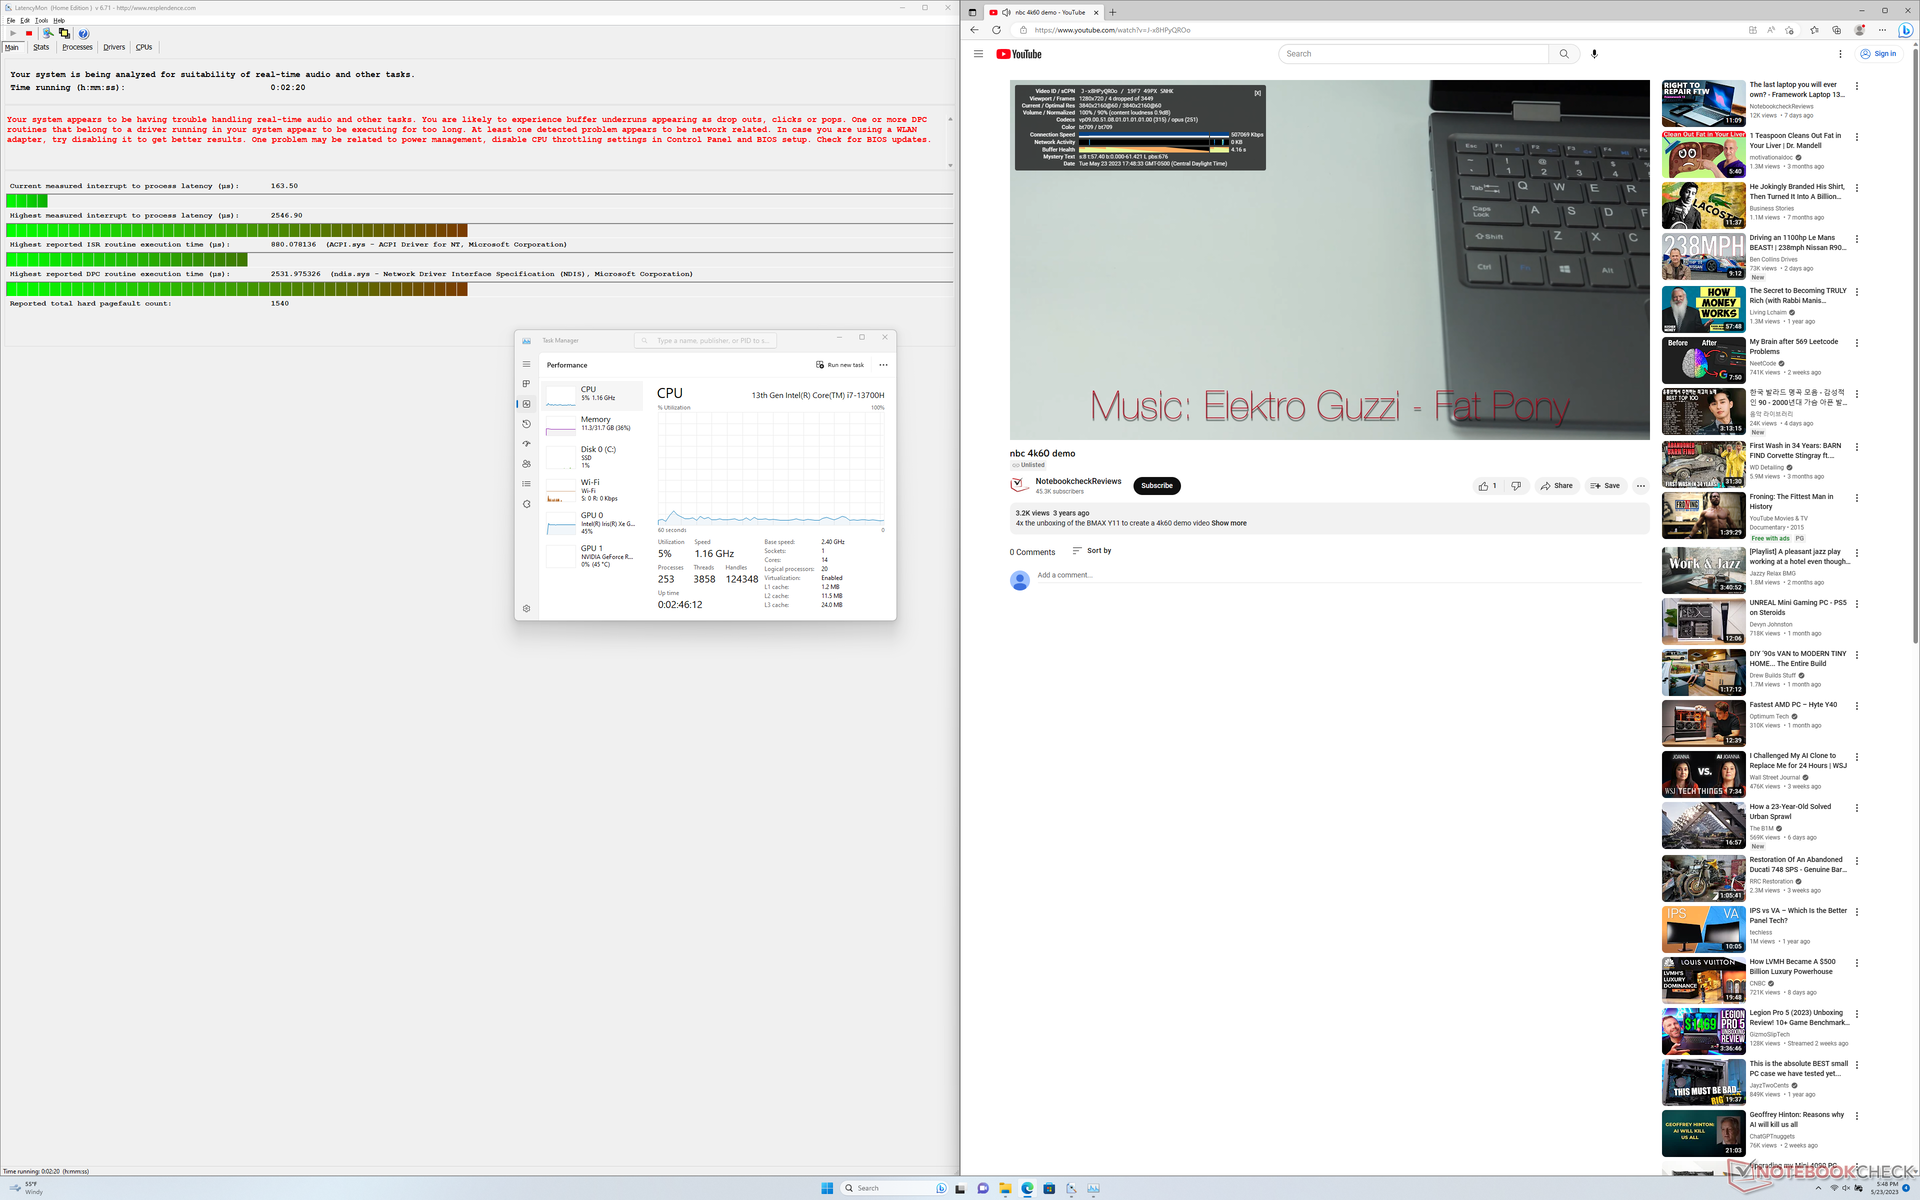
Latenza DPC
LatencyMon rivela problemi di DPC quando si aprono più schede del browser della nostra homepage, anche dopo vari tentativi. I risultati sono deludenti se si considera che non abbiamo riscontrato alcun problema con il recente XPS 15 9530 o sull'XPS 17 9720 dello scorso anno.
la riproduzione di video 4K a 60 FPS è perfetta, tranne che all'inizio, dove perde sempre 4 fotogrammi. È interessante notare che lo stesso problema si presentava anche sull'XPS 15 9530.
| DPC Latencies / LatencyMon - interrupt to process latency (max), Web, Youtube, Prime95 | |
| HP Envy 17-cr0079ng | |
| Dell XPS 17 9730 RTX 4070 | |
| LG Gram 17 (2023) | |
| MSI Creator Z17 A12UGST-054 | |
| Dell XPS 15 9530 RTX 4070 | |
| Dell XPS 17 9720 RTX 3060 | |
* ... Meglio usare valori piccoli
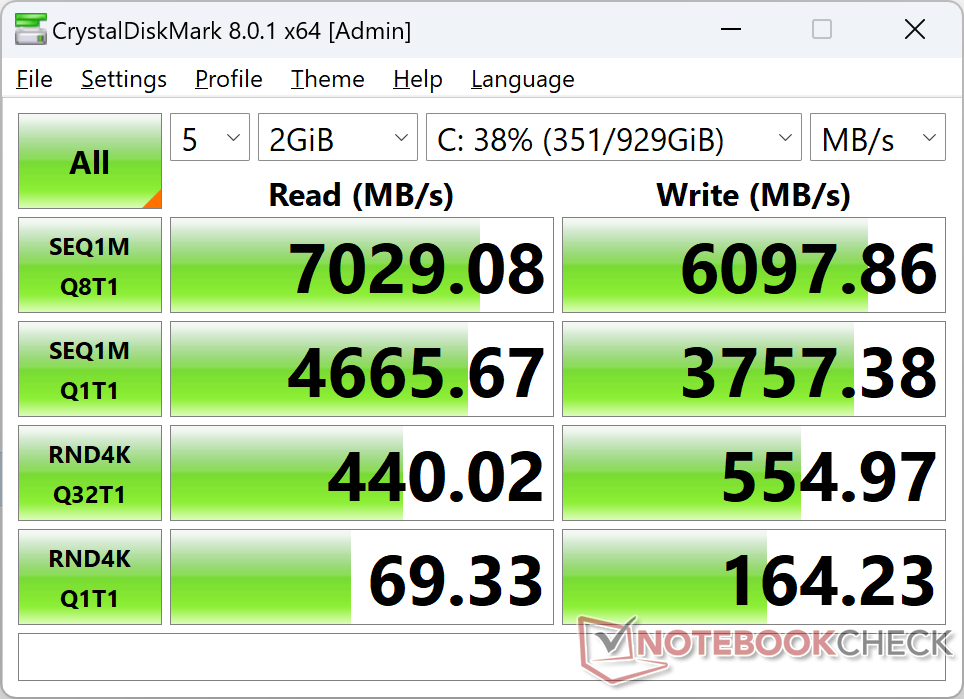
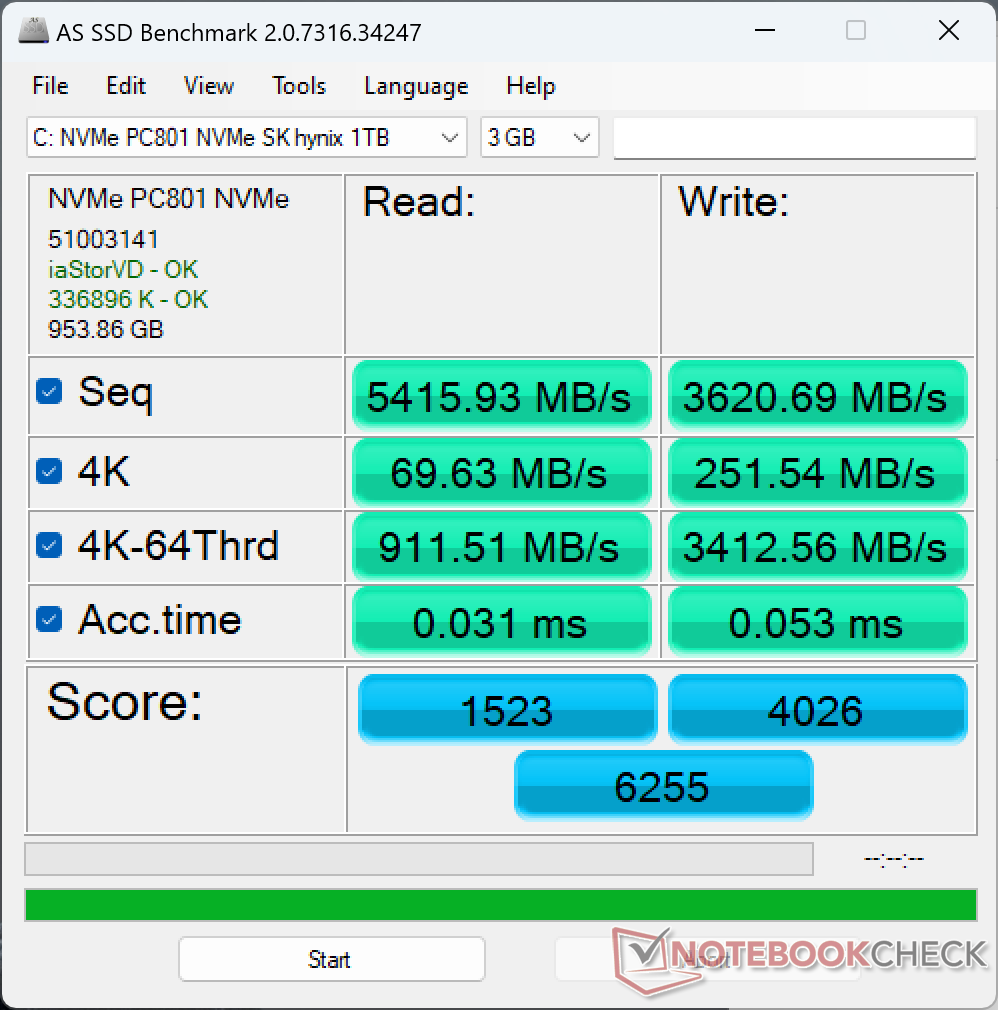
Dispositivi di archiviazione
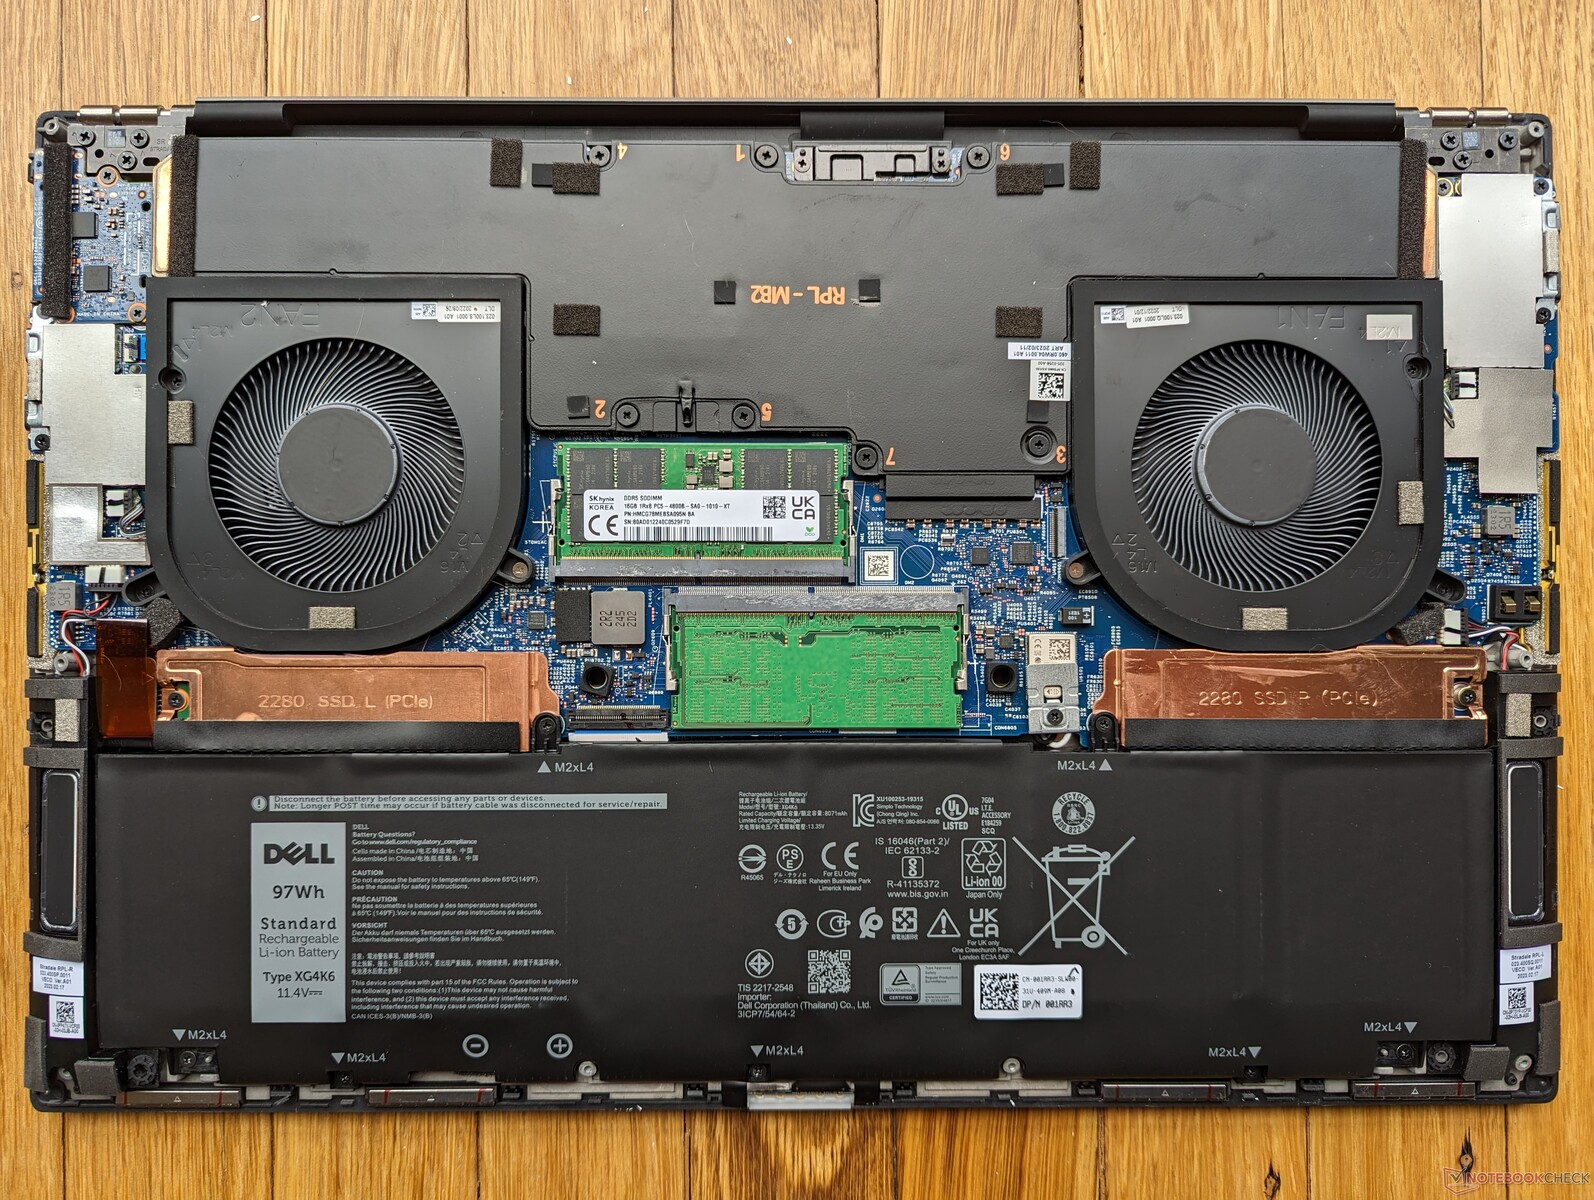
Le unità XPS possono essere fornite con unità SSD di Samsung, Micron, Western Digital o SK Hynix. Nel nostro caso specifico, l'unità di prova è dotata di un'unità SSD SK Hynix PC801 SSD PCIe4 x4 NVMe. Le prestazioni sono eccellenti e paragonabili a quelle dell'unità Samsung PM9A1, senza cali di velocità di trasferimento in caso di stress.
Se necessario, è possibile installare una seconda unità SSD M.2. Ciascuno dei due slot M.2 è dotato di un diffusore di calore che aiuta a raffreddare le unità.

| Drive Performance Rating - Percent | |
| LG Gram 17 (2023) | |
| MSI Creator Z17 A12UGST-054 | |
| Dell XPS 17 9730 RTX 4070 | |
| Dell XPS 17 9720 RTX 3060 | |
| HP Envy 17-cr0079ng | |
* ... Meglio usare valori piccoli
Disk Throttling: DiskSpd Read Loop, Queue Depth 8
Prestazioni della GPU - Molto più veloce dell'XPS 15 9530
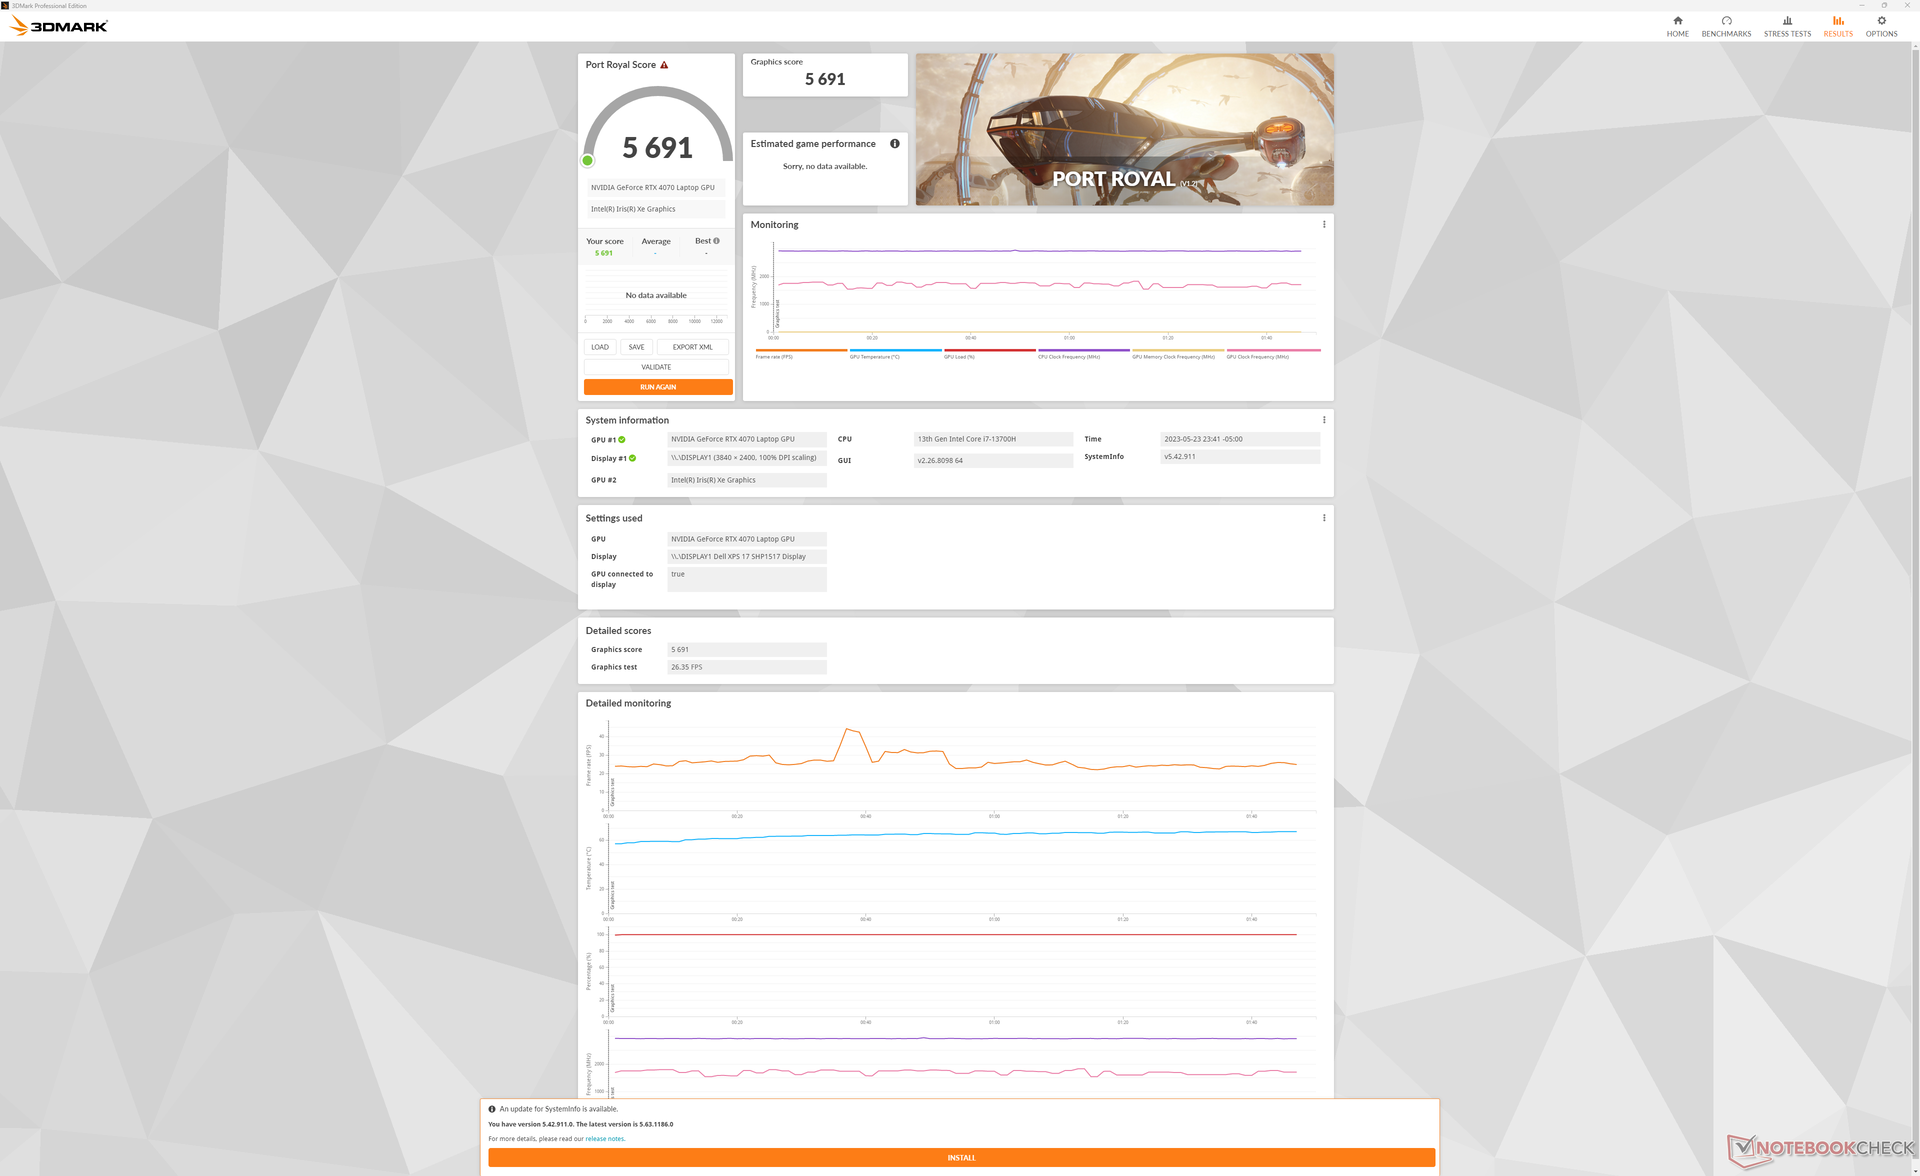
Il mobile GeForce RTX 4070 nell'XPS 17 punta a un TGP di 60-70 W, mentre la stessa GPU nel più piccolo XPS 15 punta a 40 W. Questo cambiamento, apparentemente piccolo, fa una differenza enorme: i punteggi di 3DMark per i benchmark DirectX e ray-tracing sono più veloci del 50-60% nell'XPS 17 9730 rispetto all'XPS 15. L'aumento delle prestazioni è così grande che la RTX 4070 nell'XPS 17 è solo dal 10 al 15% dietro al portatile da gioco medio dotato della stessa GPU. Questa è la gamma di prestazioni che speravamo di vedere dall'XPS 15 9530.
Anche l'accelerazione della GPU di Blender ottiene un incremento rispetto alla stessa GPU dell'XPS 15. L'aumento del 20% delle prestazioni porta l'XPS 17 in linea con la maggior parte degli altri laptop RTX 4070.
Dell offre un'opzione RTX 4080 ancora più elevata per l'XPS 17, ma ci aspettiamo che le prestazioni siano inferiori a quelle della maggior parte degli altri laptop RTX 4080 a causa dell'alimentazione USB-C da 130 W limitata. IlMSI Stealth 17 Studioad esempio, offre la RTX 4080 ma con un adattatore AC da 240 W molto più performante.
L'opzione di GPU più alta per la serie XPS 17 prima dell'XPS 17 9730 era la RTX 3060. Rispetto a questa configurazione, la nostra RTX 4070 è in grado di offrire prestazioni grafiche e di creazione di contenuti superiori rispettivamente del 20% e del 30%.
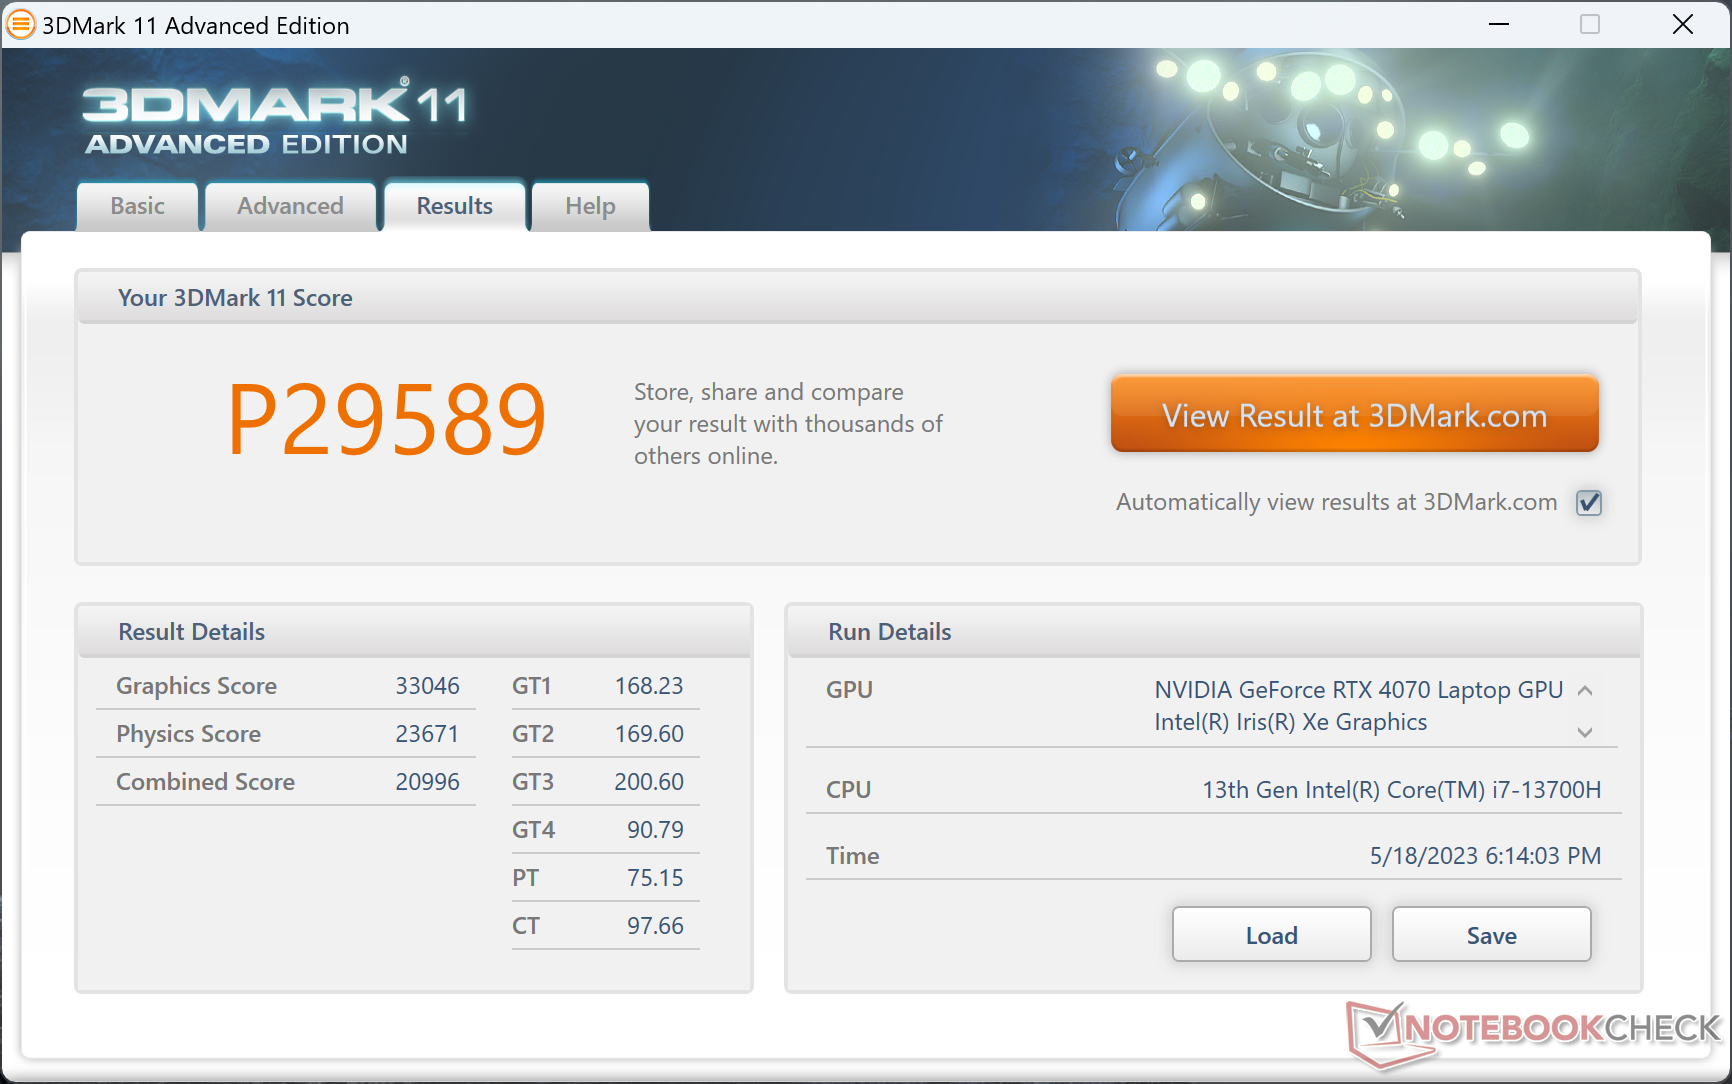
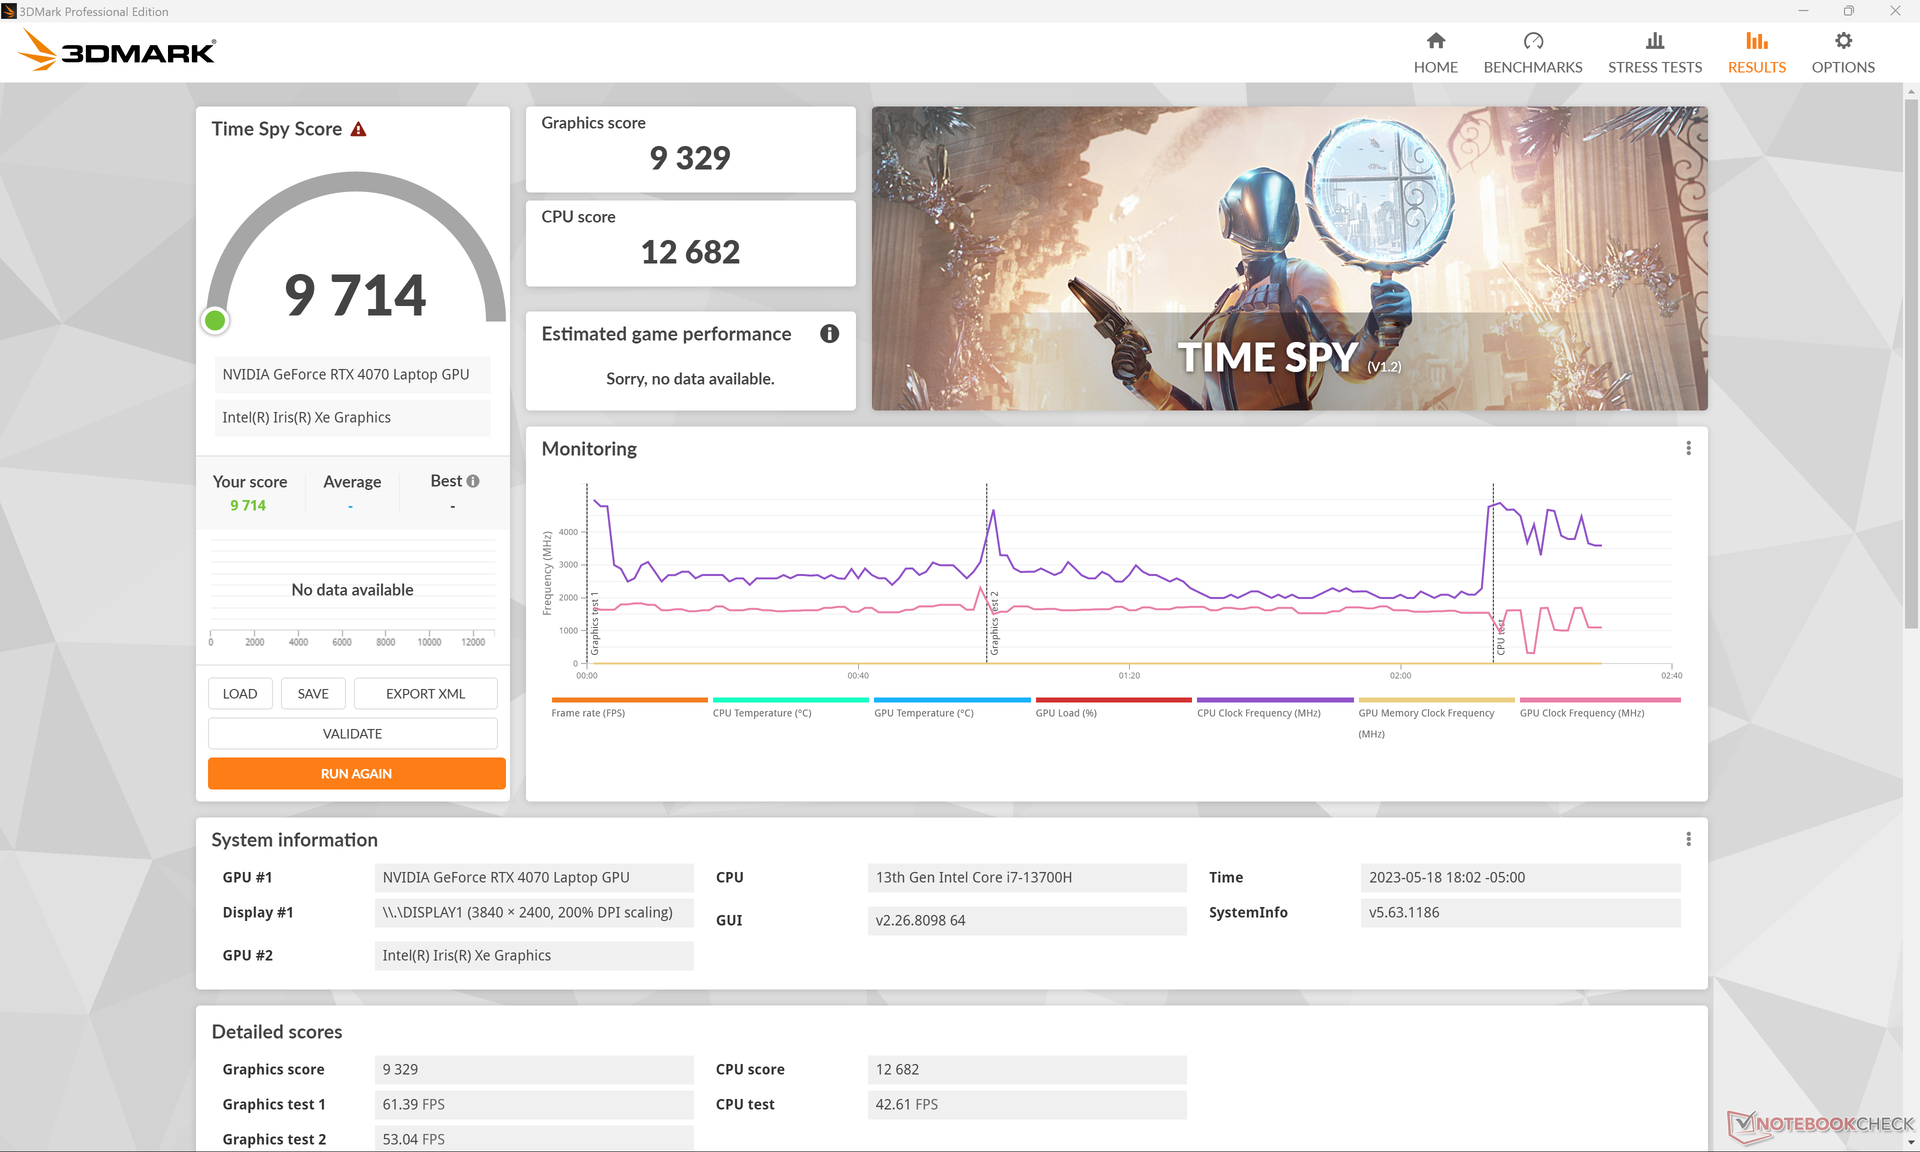
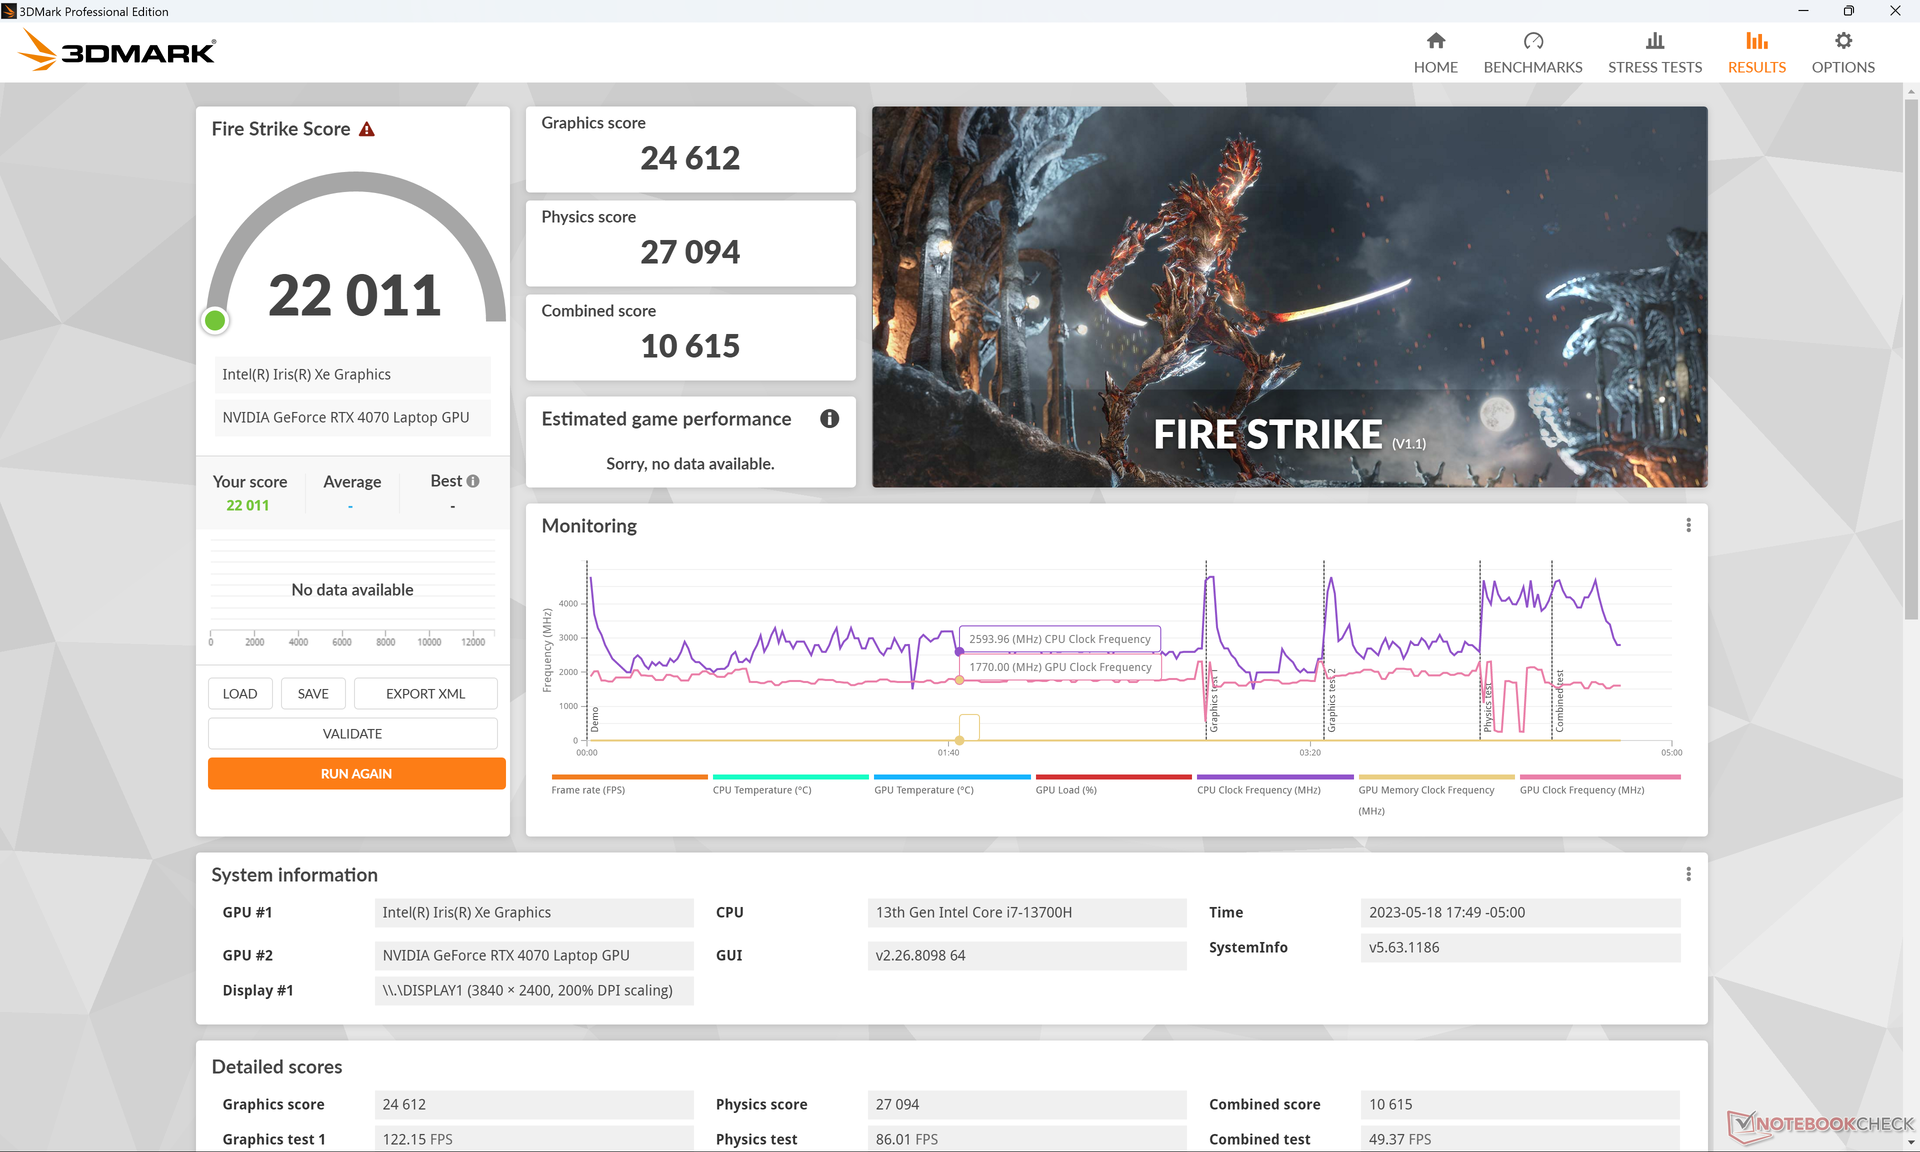
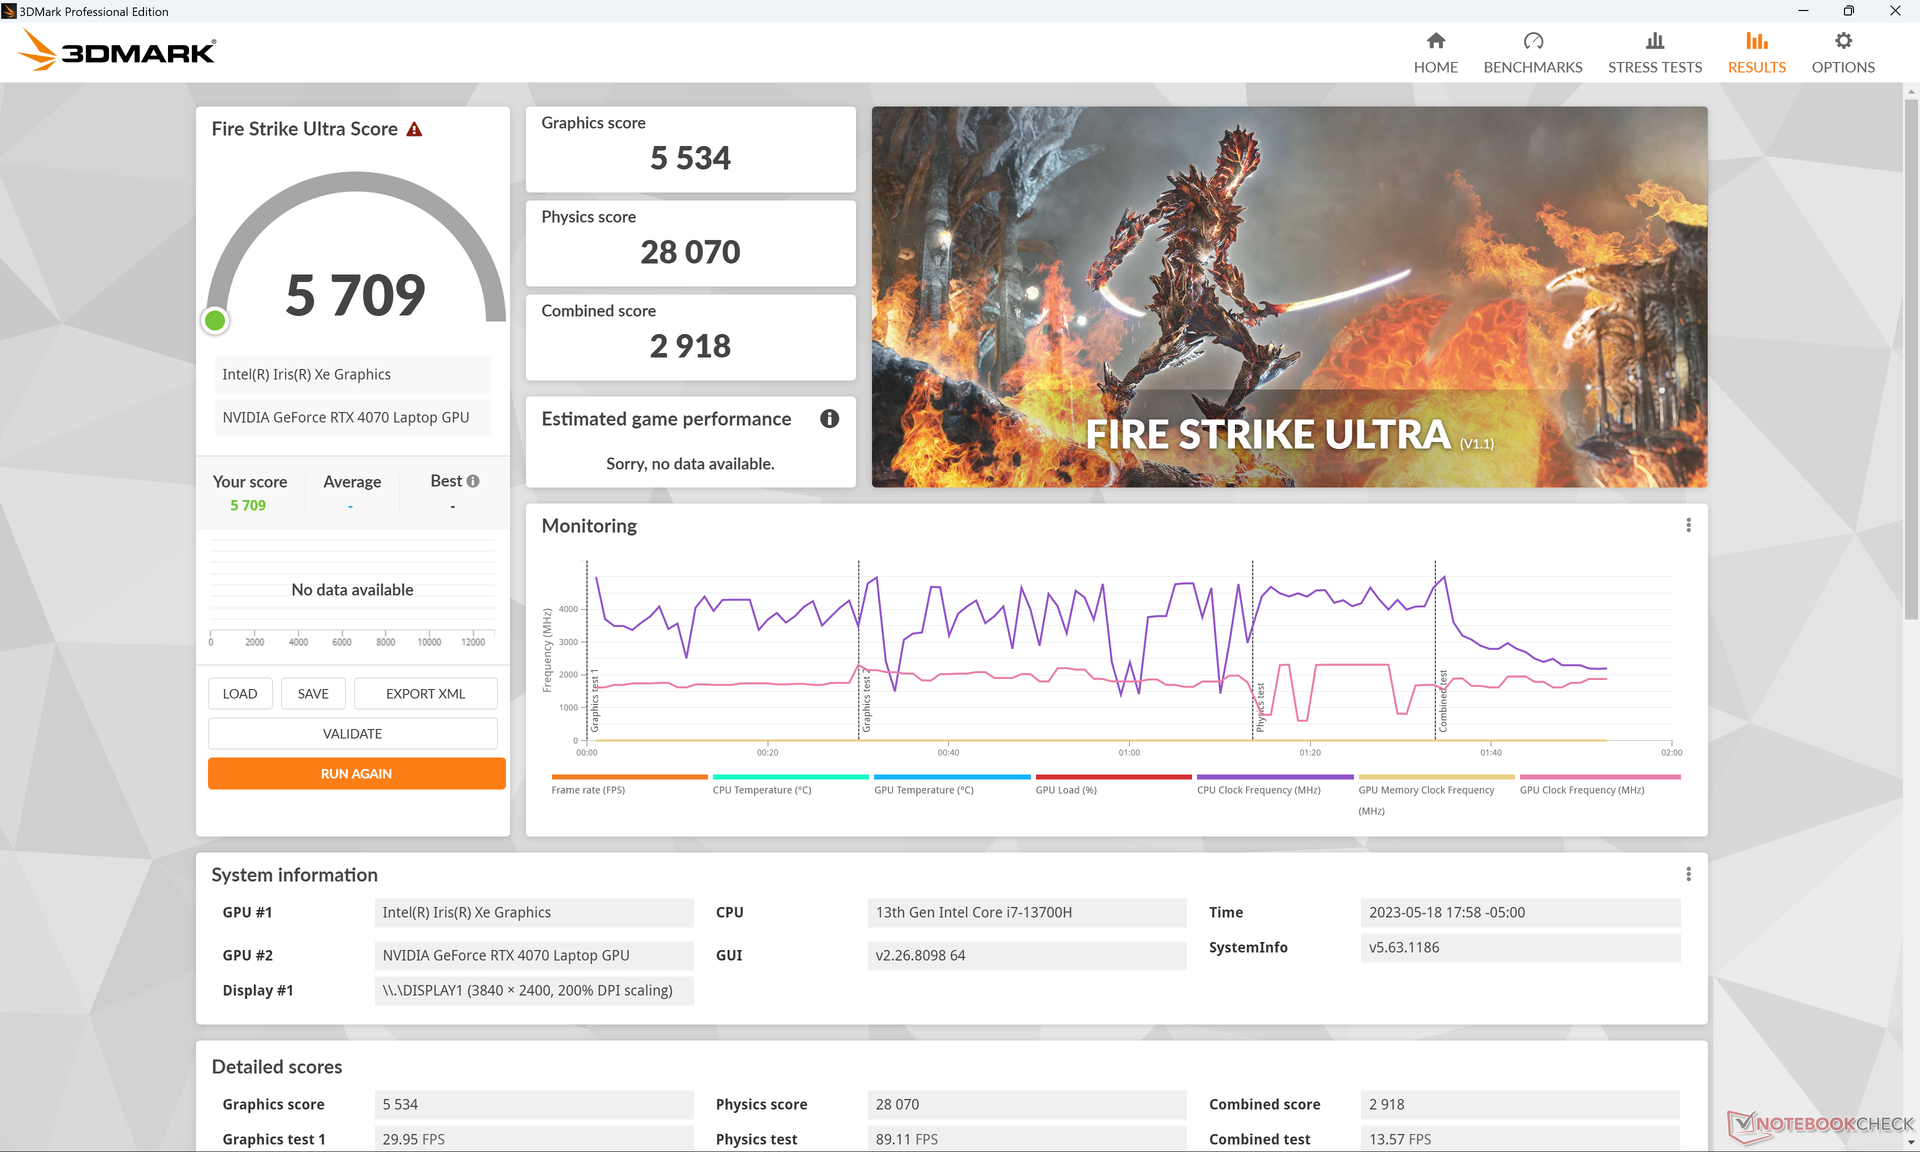
| 3DMark 11 Performance | 29589 punti | |
| 3DMark Fire Strike Score | 22011 punti | |
| 3DMark Time Spy Score | 9714 punti | |
Aiuto | ||
* ... Meglio usare valori piccoli
Prestazioni di gioco
Il sistema funziona bene come macchina da gioco secondaria. Poiché la RTX 4070 da 70 W non è così sottopotenziata come la versione da 40 W dell'XPS 15, l'XPS 17 è in grado di eseguire i giochi più recenti con una risoluzione QHD e 60 FPS con impostazioni medio-alte. il 4K UHD è ancora fuori portata per la maggior parte, ma la GPU si abbinerebbe bene a monitor esterni FHD o QHD per i giochi.
Forse i due fattori più rilevanti che impediscono all'XPS 17 di essere un portatile da gioco "vero e proprio" sono i tempi di risposta del display relativamente lenti e la mancanza del supporto G-Sync per il display interno. I cali di frame, lo screen tearing e l'effetto ghosting sono quindi più diffusi quando si gioca con l'XPS 17. Naturalmente, molti di questi problemi possono essere evitati semplicemente utilizzando un monitor esterno.
| Returnal | |
| 1280x720 Low Preset | |
| Aorus 17X AZF | |
| Media NVIDIA GeForce RTX 4070 Laptop GPU (126 - 150, n=5) | |
| 1920x1080 Low Preset | |
| Aorus 17X AZF | |
| Media NVIDIA GeForce RTX 4070 Laptop GPU (65 - 119, n=11) | |
| Dell XPS 17 9730 RTX 4070 | |
| 1920x1080 Medium Preset | |
| Aorus 17X AZF | |
| Media NVIDIA GeForce RTX 4070 Laptop GPU (69 - 117, n=12) | |
| Dell XPS 17 9730 RTX 4070 | |
| 1920x1080 High Preset | |
| Aorus 17X AZF | |
| Media NVIDIA GeForce RTX 4070 Laptop GPU (64 - 106, n=12) | |
| Dell XPS 17 9730 RTX 4070 | |
| 1920x1080 Epic Preset | |
| Aorus 17X AZF | |
| Media NVIDIA GeForce RTX 4070 Laptop GPU (54 - 90, n=12) | |
| Dell XPS 17 9730 RTX 4070 | |
| 2560x1440 Epic Preset | |
| Aorus 17X AZF | |
| Media NVIDIA GeForce RTX 4070 Laptop GPU (39 - 66, n=12) | |
| Dell XPS 17 9730 RTX 4070 | |
| 3840x2160 Epic Preset | |
| Aorus 17X AZF | |
| Media NVIDIA GeForce RTX 4070 Laptop GPU (21 - 39, n=8) | |
| Dell XPS 17 9730 RTX 4070 | |
| Tiny Tina's Wonderlands | |
| 1920x1080 Low Preset (DX12) | |
| Aorus 17X AZF | |
| Media NVIDIA GeForce RTX 4070 Laptop GPU (98.1 - 283, n=14) | |
| Dell XPS 17 9730 RTX 4070 | |
| 1920x1080 Medium Preset (DX12) | |
| Aorus 17X AZF | |
| Media NVIDIA GeForce RTX 4070 Laptop GPU (92.5 - 231, n=14) | |
| Dell XPS 17 9730 RTX 4070 | |
| 1920x1080 High Preset (DX12) | |
| Aorus 17X AZF | |
| Media NVIDIA GeForce RTX 4070 Laptop GPU (74.3 - 151.4, n=14) | |
| Dell XPS 17 9730 RTX 4070 | |
| 1920x1080 Badass Preset (DX12) | |
| Aorus 17X AZF | |
| Media NVIDIA GeForce RTX 4070 Laptop GPU (58.6 - 115.9, n=17) | |
| Dell XPS 17 9730 RTX 4070 | |
| 2560x1440 Badass Preset (DX12) | |
| Aorus 17X AZF | |
| Media NVIDIA GeForce RTX 4070 Laptop GPU (49.8 - 79.5, n=16) | |
| Dell XPS 17 9730 RTX 4070 | |
| 3840x2160 Badass Preset (DX12) | |
| Aorus 17X AZF | |
| Media NVIDIA GeForce RTX 4070 Laptop GPU (28.3 - 39.7, n=12) | |
| Dell XPS 17 9730 RTX 4070 | |
Witcher 3 FPS Chart
| basso | medio | alto | ultra | QHD | 4K | |
|---|---|---|---|---|---|---|
| GTA V (2015) | 186.6 | 182.5 | 167.9 | 102.7 | 75.5 | 76.9 |
| The Witcher 3 (2015) | 415.2 | 297.6 | 181.4 | 96.2 | 59 | |
| Dota 2 Reborn (2015) | 193.5 | 174.5 | 165.9 | 156.9 | 108 | |
| Final Fantasy XV Benchmark (2018) | 174.8 | 128.3 | 94.7 | 69.9 | 38.2 | |
| X-Plane 11.11 (2018) | 154.6 | 133.1 | 106.4 | 90 | ||
| Strange Brigade (2018) | 431 | 238 | 192 | 165.4 | 113.6 | 61.7 |
| Cyberpunk 2077 1.6 (2022) | 102.1 | 99.4 | 85.6 | 71 | 43 | 18.7 |
| Tiny Tina's Wonderlands (2022) | 183.5 | 153.3 | 104.9 | 82.4 | 55.7 | 28.3 |
| F1 22 (2022) | 206 | 196.4 | 158.2 | 60.7 | 39.4 | 18.8 |
| Returnal (2023) | 72 | 71 | 67 | 59 | 41 | 21 |
Emissioni
Rumore del sistema - Forte solo quando serve
Il rumore della ventola non è cambiato drasticamente nonostante i miglioramenti delle prestazioni. L'XPS 17 si aggira in genere intorno ai 25,6 dB(A), appena udibili, a fronte di uno sfondo silenzioso di 22,7 dB(A) durante la navigazione sul web o lo streaming video. Tuttavia, se si eseguono carichi molto impegnativi come i giochi, il rumore della ventola inizia ad avvicinarsi al livello di alcuni portatili da gioco, fino a 50 dB(A). Dopotutto, il modello XPS offre specifiche di livello videoludico.
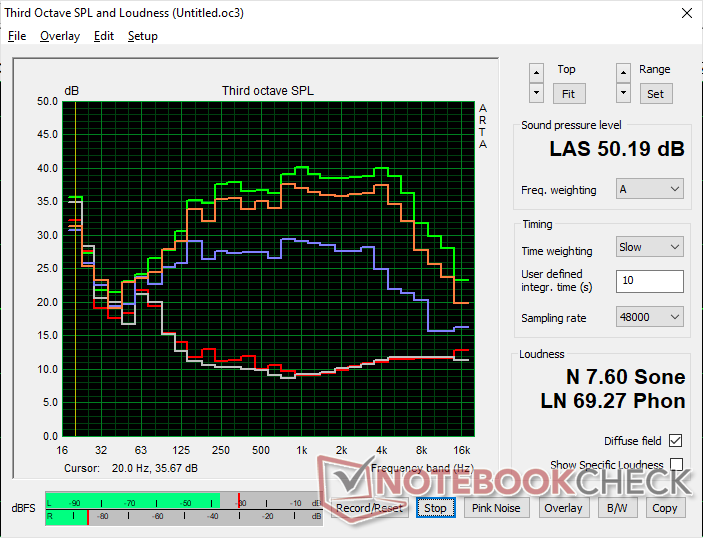
Rumorosità
| Idle |
| 22.8 / 22.8 / 22.8 dB(A) |
| Sotto carico |
| 38.9 / 50.2 dB(A) |
 | ||
30 dB silenzioso 40 dB(A) udibile 50 dB(A) rumoroso |
||
min: | ||
| Dell XPS 17 9730 RTX 4070 NVIDIA GeForce RTX 4070 Laptop GPU, i7-13700H, SK hynix PC801 HFS001TEJ9X101N | Dell XPS 17 9720 RTX 3060 GeForce RTX 3060 Laptop GPU, i7-12700H, Samsung PM9A1 MZVL21T0HCLR | LG Gram 17 (2023) Iris Xe G7 96EUs, i7-1360P, Samsung PM9A1 MZVL21T0HCLR | HP Envy 17-cr0079ng GeForce RTX 2050 Mobile, i7-1255U, Samsung PM991a MZVLQ1T0HBLB | MSI Creator Z17 A12UGST-054 GeForce RTX 3070 Ti Laptop GPU, i9-12900H, Micron 3400 1TB MTFDKBA1T0TFH | Apple MacBook Pro 16 2023 M2 Max M2 Max 38-Core GPU, M2 Max, Apple SSD AP2048Z | |
|---|---|---|---|---|---|---|
| Noise | -4% | -11% | -16% | -28% | 4% | |
| off /ambiente * | 22.7 | 23.8 -5% | 25.2 -11% | 26.5 -17% | 26 -15% | 23.9 -5% |
| Idle Minimum * | 22.8 | 24.1 -6% | 25.2 -11% | 28.5 -25% | 31.8 -39% | 23.9 -5% |
| Idle Average * | 22.8 | 24.1 -6% | 25.7 -13% | 28.5 -25% | 31.8 -39% | 23.9 -5% |
| Idle Maximum * | 22.8 | 24.1 -6% | 29.3 -29% | 29.7 -30% | 31.8 -39% | 23.9 -5% |
| Load Average * | 38.9 | 43.2 -11% | 44.4 -14% | 39.5 -2% | 53.9 -39% | 36.6 6% |
| Witcher 3 ultra * | 47.4 | 48 -1% | 53.9 -14% | 35.1 26% | ||
| Load Maximum * | 50.2 | 48 4% | 45.2 10% | 48 4% | 54.9 -9% | 43.2 14% |
* ... Meglio usare valori piccoli
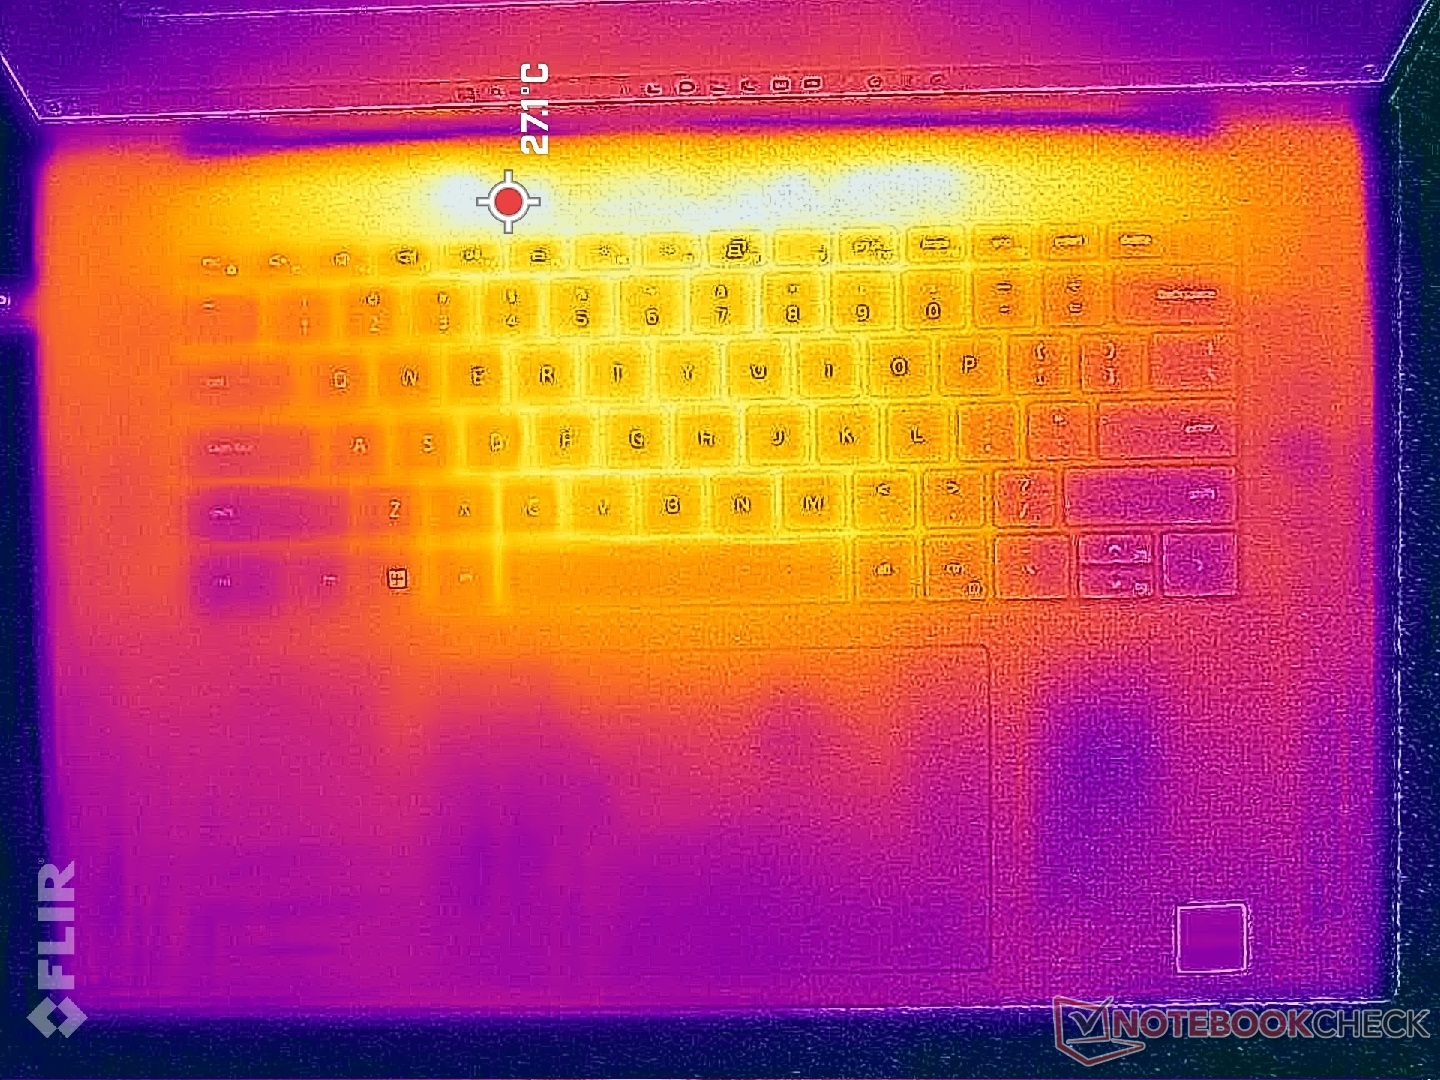
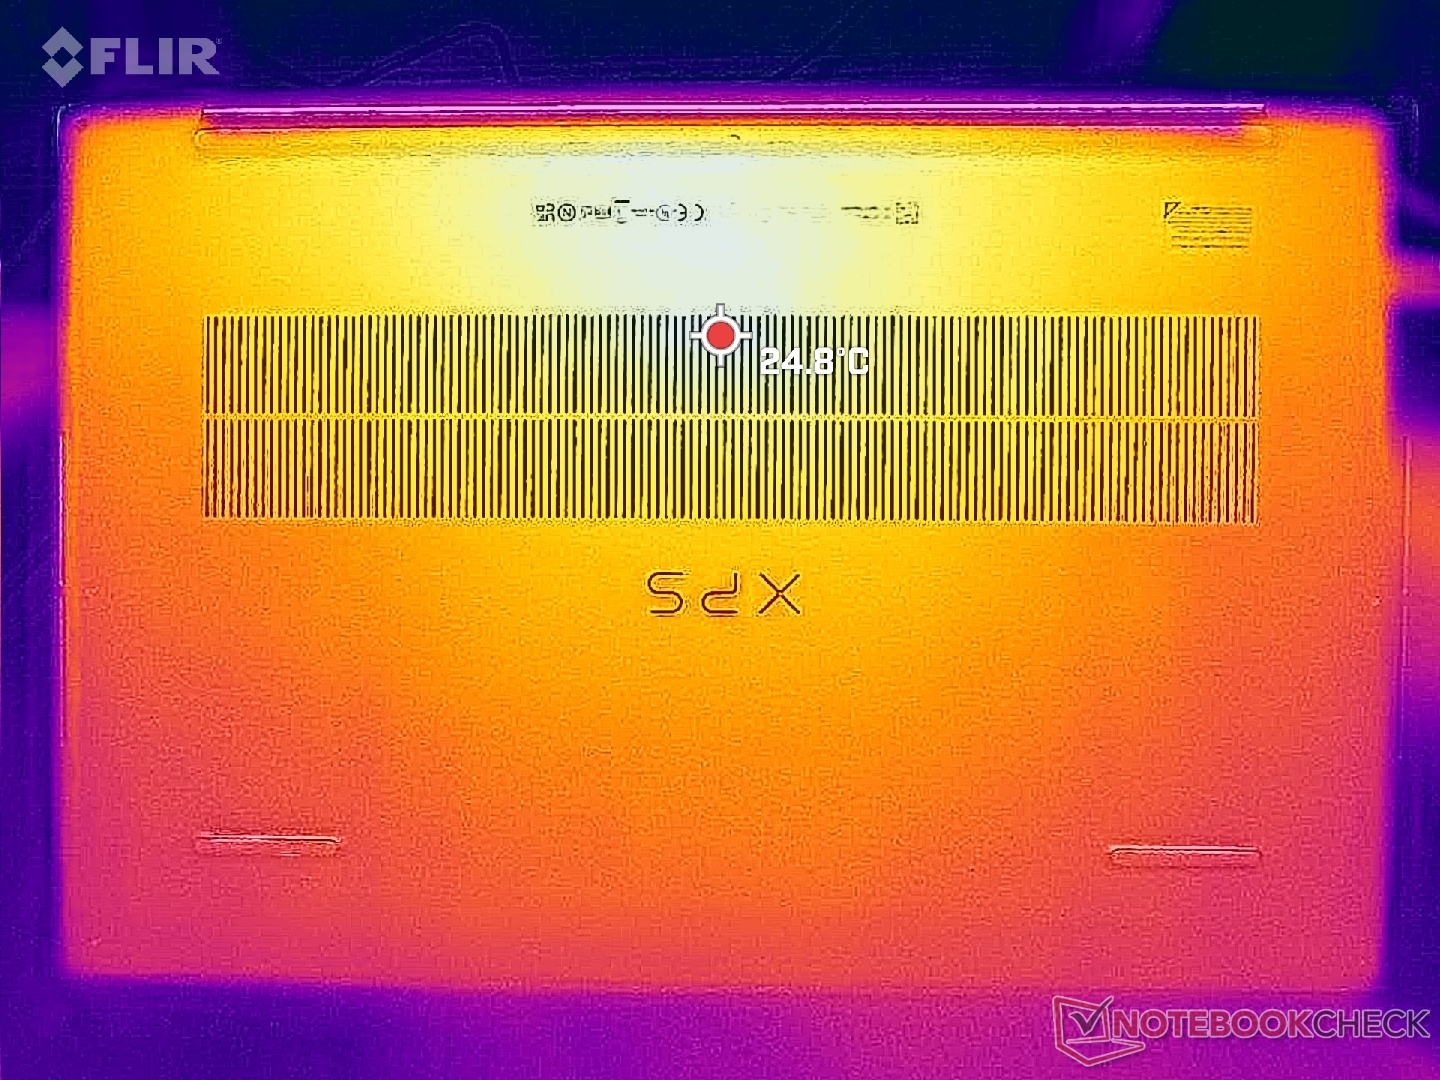
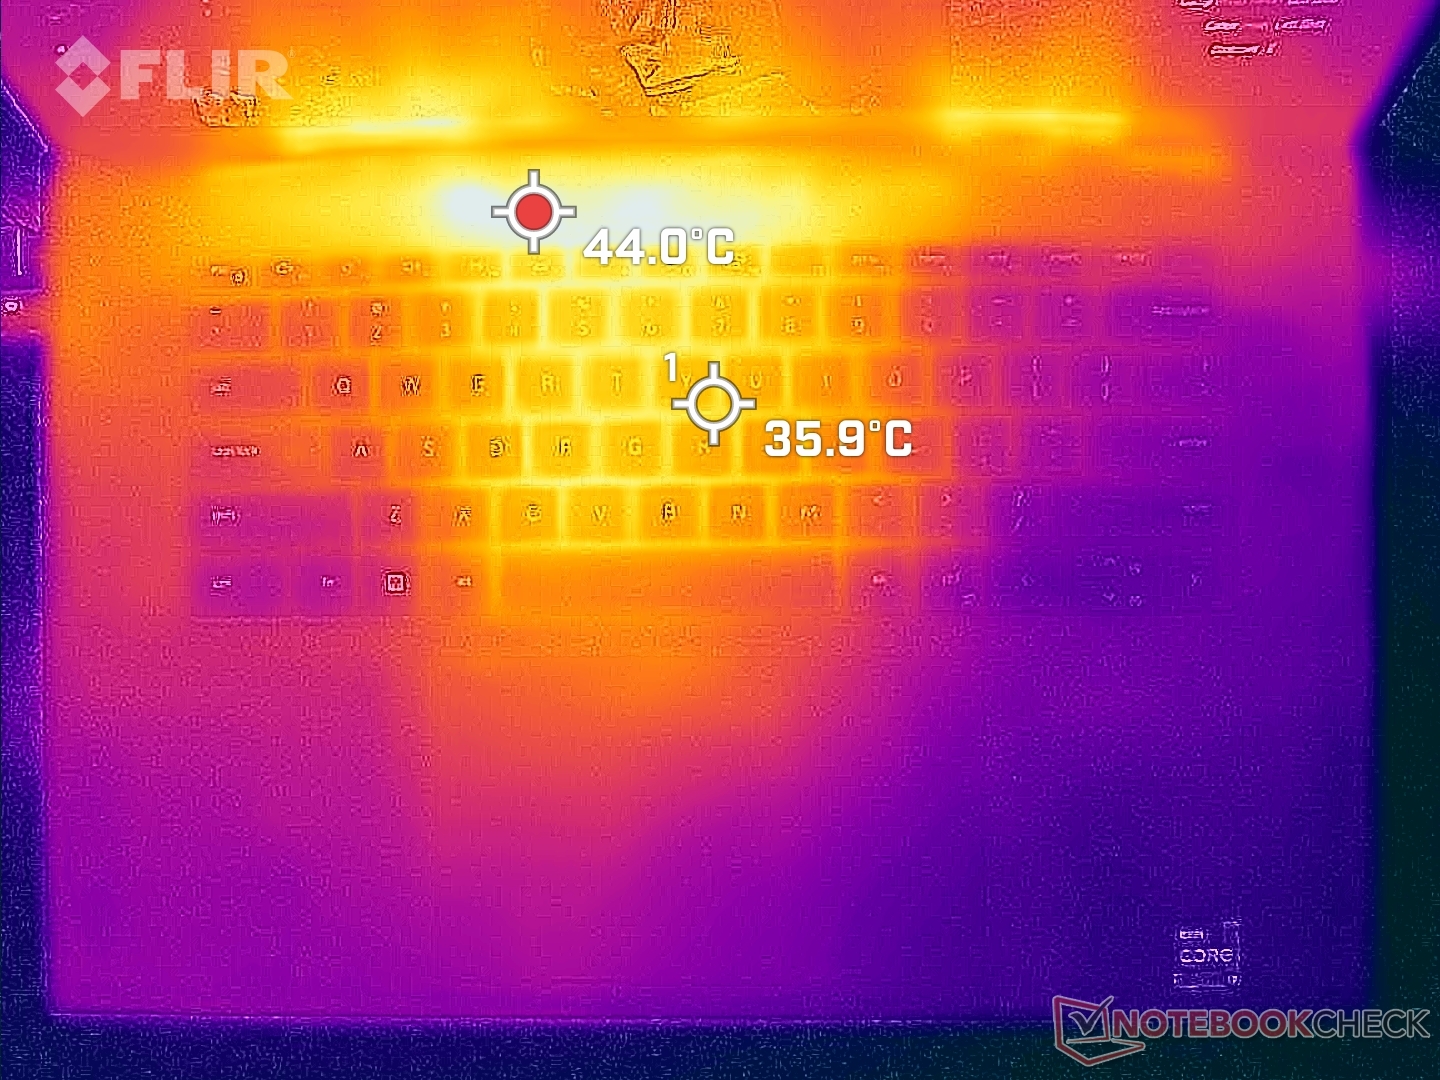
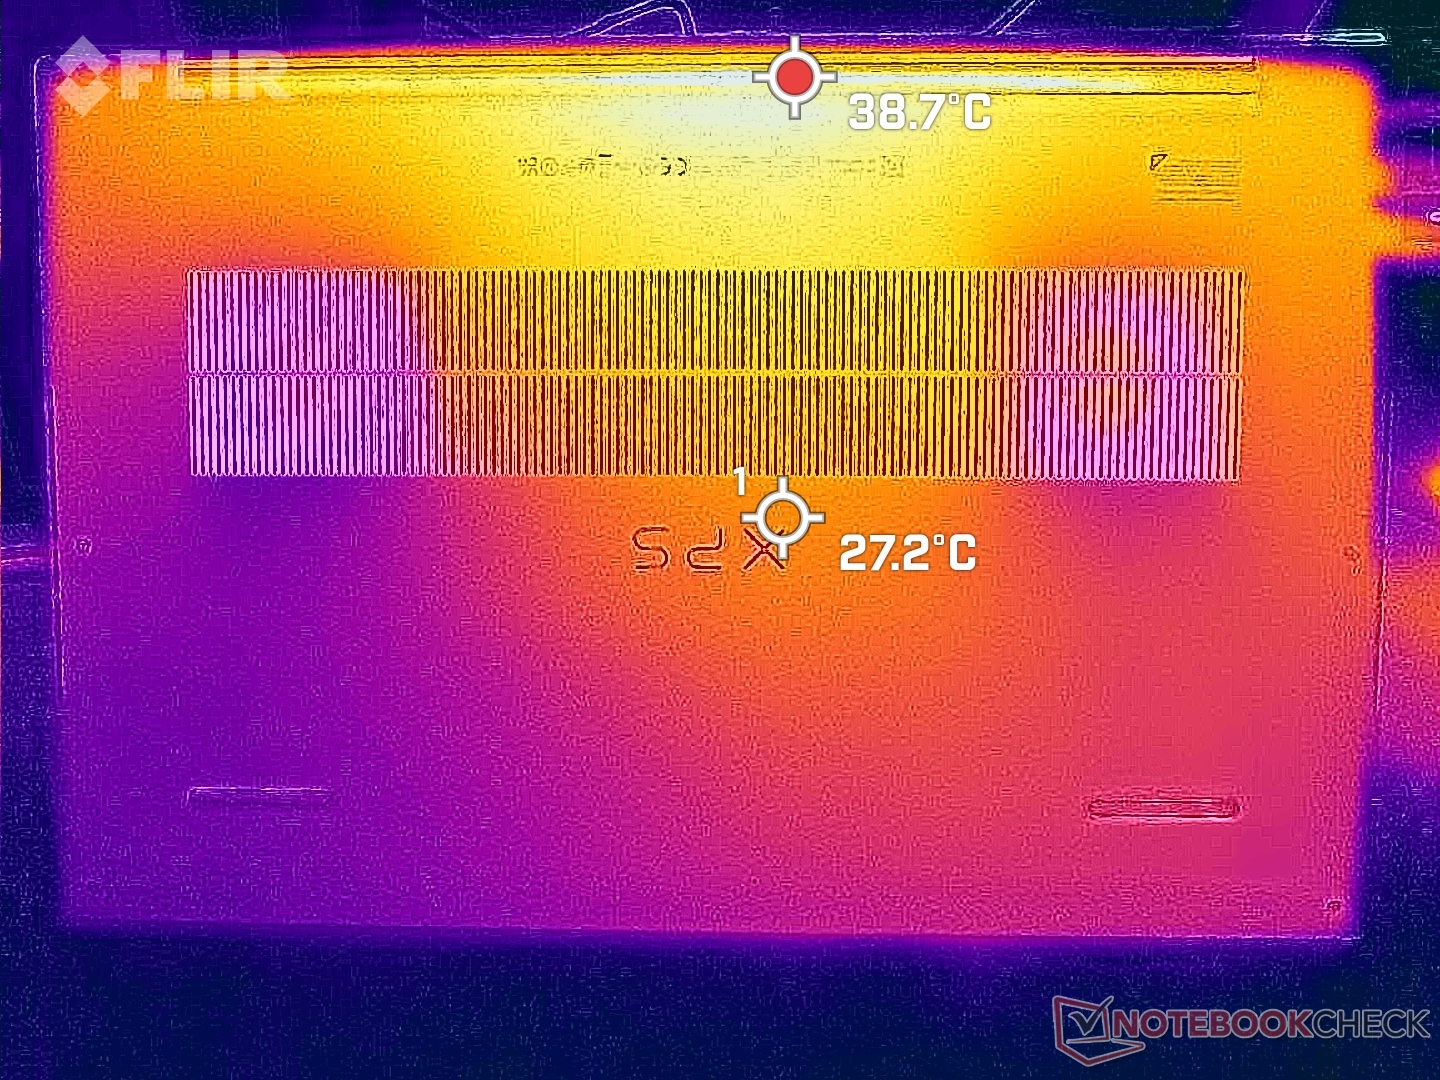
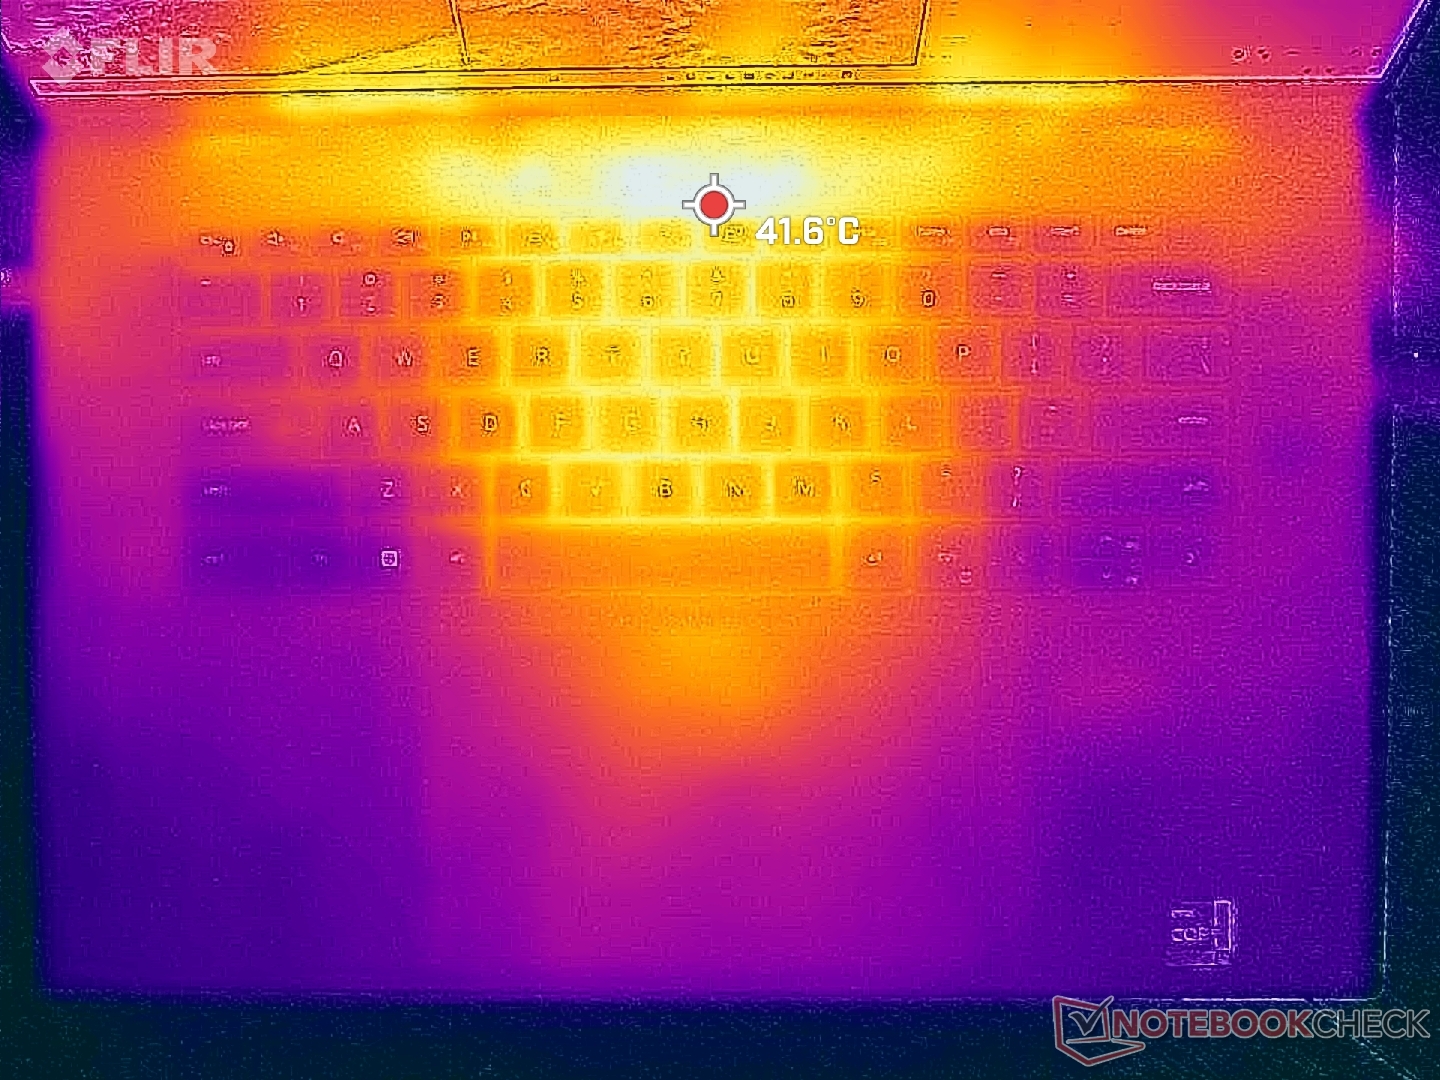
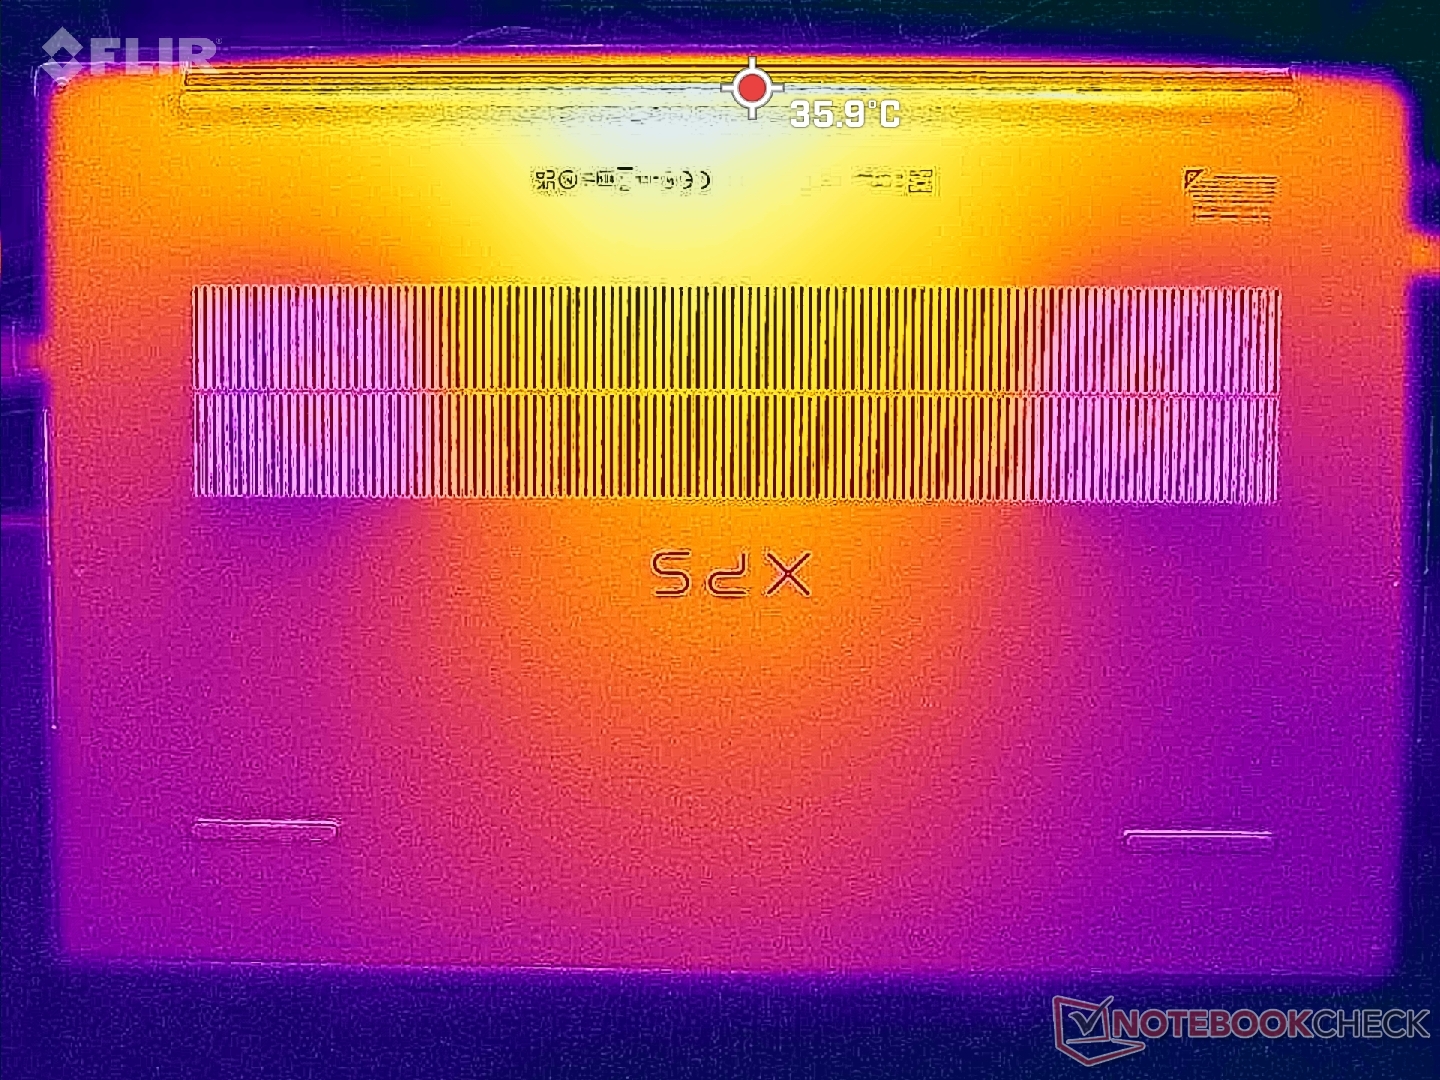
Temperatura
Le temperature del Surface sono più fresche del previsto se confrontate con quelle di altri portatili dotati di CPU Core serie H simili e GPU RTX GeForce. Il concorrenteMSI Creator Z17ad esempio, presenta punti caldi di oltre 60°C, mentre il nostro Dell raggiunge solo i 43°C con carichi pesanti simili. Le temperature superficiali più basse del Dell possono essere attribuite al sistema di raffreddamento a camera di vapore, all'isolamento termico GORE e al consumo energetico generalmente inferiore.
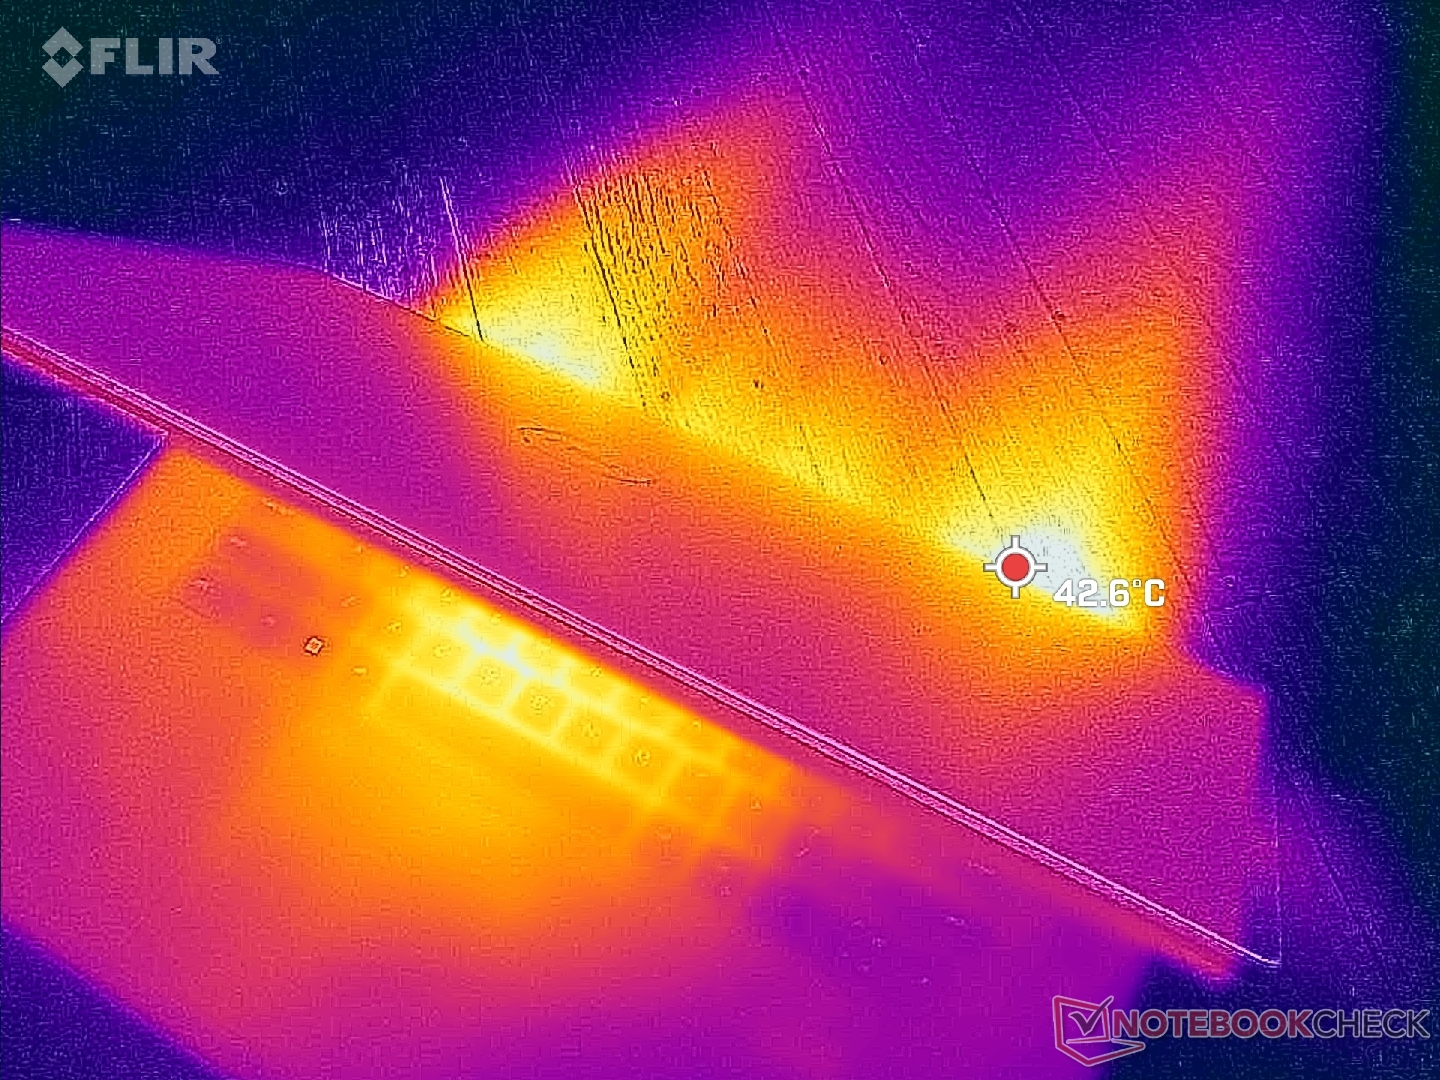
(±) La temperatura massima sul lato superiore è di 43.2 °C / 110 F, rispetto alla media di 36.9 °C / 98 F, che varia da 21.1 a 71 °C per questa classe Multimedia.
(+) Il lato inferiore si riscalda fino ad un massimo di 31.8 °C / 89 F, rispetto alla media di 39.2 °C / 103 F
(+) In idle, la temperatura media del lato superiore è di 28.2 °C / 83 F, rispetto alla media deld ispositivo di 31.3 °C / 88 F.
(±) Riproducendo The Witcher 3, la temperatura media per il lato superiore e' di 33.7 °C / 93 F, rispetto alla media del dispositivo di 31.3 °C / 88 F.
(+) I poggiapolsi e il touchpad sono piu' freddi della temperatura della pelle con un massimo di 31 °C / 87.8 F e sono quindi freddi al tatto.
(-) La temperatura media della zona del palmo della mano di dispositivi simili e'stata di 28.8 °C / 83.8 F (-2.2 °C / -4 F).
| Dell XPS 17 9730 RTX 4070 Intel Core i7-13700H, NVIDIA GeForce RTX 4070 Laptop GPU | Dell XPS 17 9720 RTX 3060 Intel Core i7-12700H, NVIDIA GeForce RTX 3060 Laptop GPU | LG Gram 17 (2023) Intel Core i7-1360P, Intel Iris Xe Graphics G7 96EUs | HP Envy 17-cr0079ng Intel Core i7-1255U, NVIDIA GeForce RTX 2050 Mobile | MSI Creator Z17 A12UGST-054 Intel Core i9-12900H, NVIDIA GeForce RTX 3070 Ti Laptop GPU | Apple MacBook Pro 16 2023 M2 Max Apple M2 Max, Apple M2 Max 38-Core GPU | |
|---|---|---|---|---|---|---|
| Heat | -19% | -7% | -3% | -37% | 5% | |
| Maximum Upper Side * | 43.2 | 51.8 -20% | 43.9 -2% | 47.1 -9% | 63.9 -48% | 44.2 -2% |
| Maximum Bottom * | 31.8 | 44.2 -39% | 45.5 -43% | 43.8 -38% | 68 -114% | 42.9 -35% |
| Idle Upper Side * | 32.8 | 34.8 -6% | 28.4 13% | 25.2 23% | 28.3 14% | 22.4 32% |
| Idle Bottom * | 29.8 | 33.2 -11% | 28.2 5% | 25.9 13% | 30.2 -1% | 22.3 25% |
* ... Meglio usare valori piccoli
Stress test
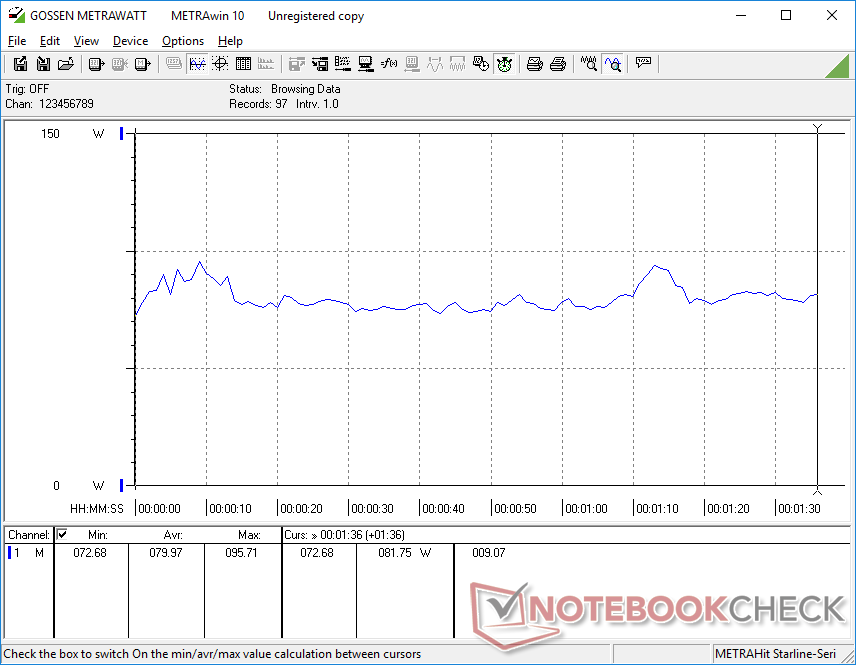
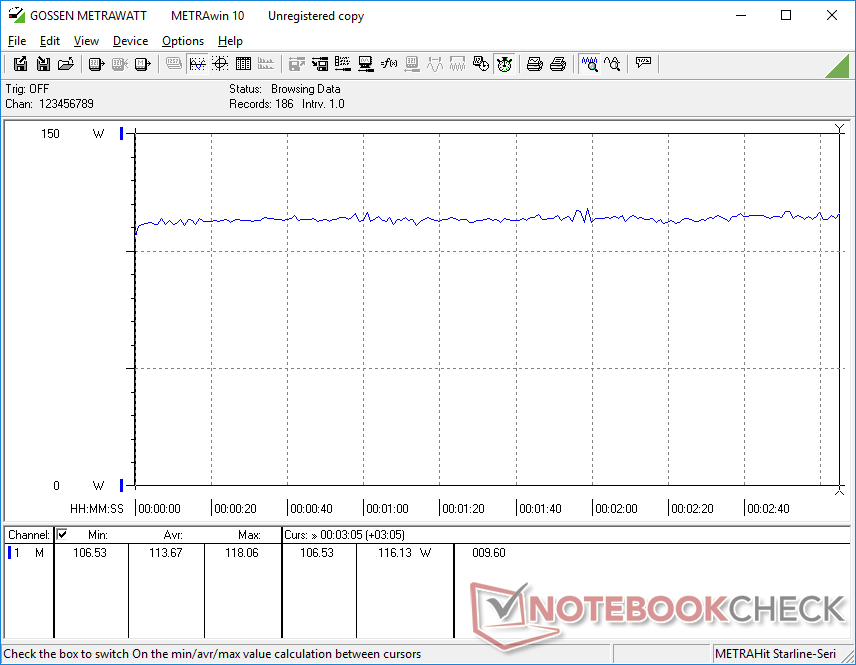
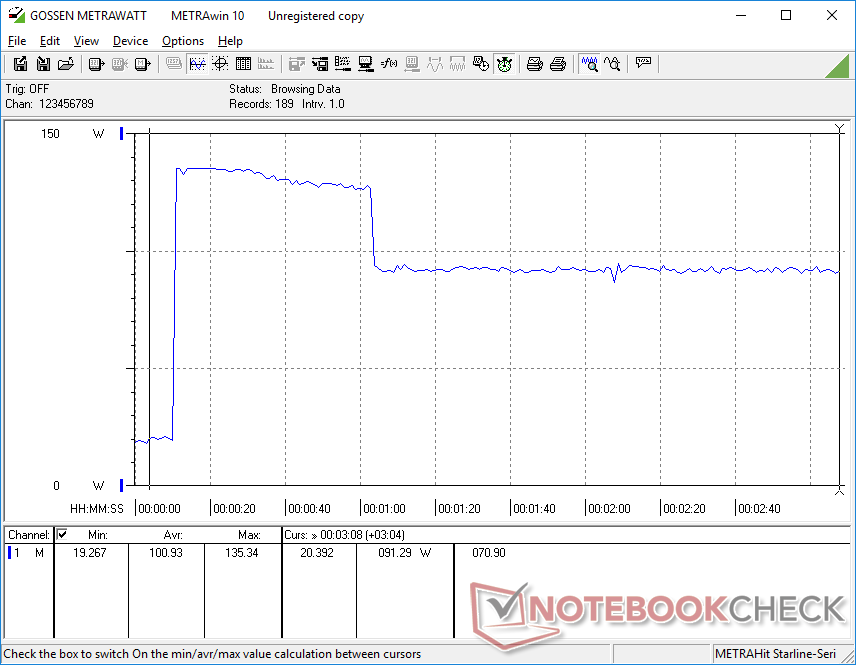
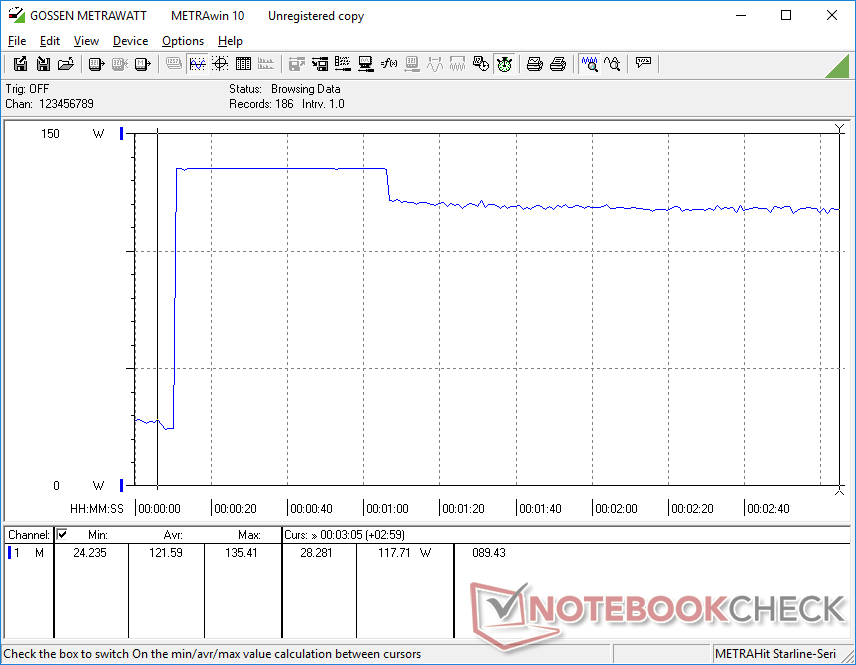
Quando si esegue Prime95 per stressare la CPU, la velocità di clock e la potenza del pacchetto raggiungono rispettivamente 4,1 GHz e 122 W, per pochi secondi. Il processore scendeva poi costantemente a 3,4 GHz e 80 W e infine a 2,6 GHz e 55 W pochi minuti dopo. Il consumo finale stabile di 55 W corrisponde a quello osservato sul modello XPS 19 9720 dello scorso anno XPS 19 9720 il che spiegherebbe le prestazioni simili del processore dopo aver tenuto conto del throttling come menzionato sopra. La temperatura del core è stata molto alta, tra i 95 e i 100 C durante i primi minuti del test, quando Turbo Boost è più attivo, prima di scendere e stabilizzarsi a 74 C.
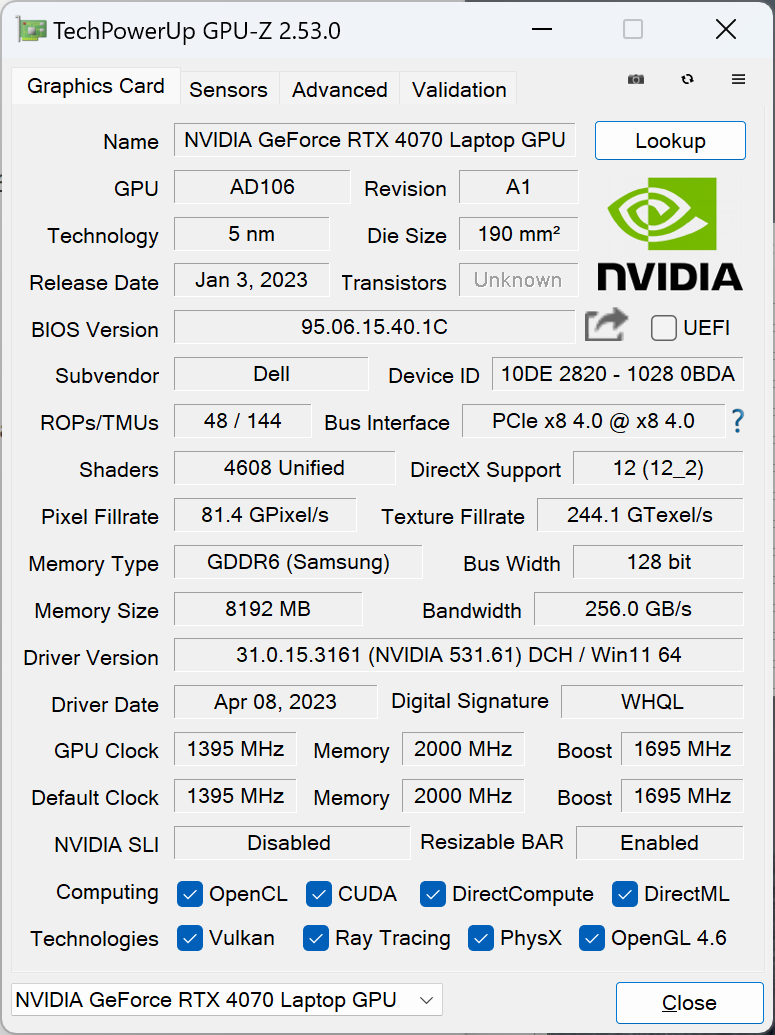
La velocità di clock della GPU e la temperatura Witcher 3 si stabilizzerebbero rispettivamente a 2115 MHz e 67 C, quest'ultimo valore corrisponde a quello osservato sull'XPS 17 9720 con RTX 3060 dello scorso anno. È interessante notare che GPU-Z riporta un consumo energetico inferiore di 52 W, mentre HWiNFO riporta 70 W, come mostrato dallo screenshot qui sotto. Entrambi i valori sembrano comunque stabili.
Il funzionamento a batteria limita le prestazioni. Un test di Fire Strike a batteria restituirebbe punteggi di Fisica e Grafica rispettivamente di 24847 e 21172 punti, rispetto a 27094 e 24612 punti con l'alimentazione di rete.
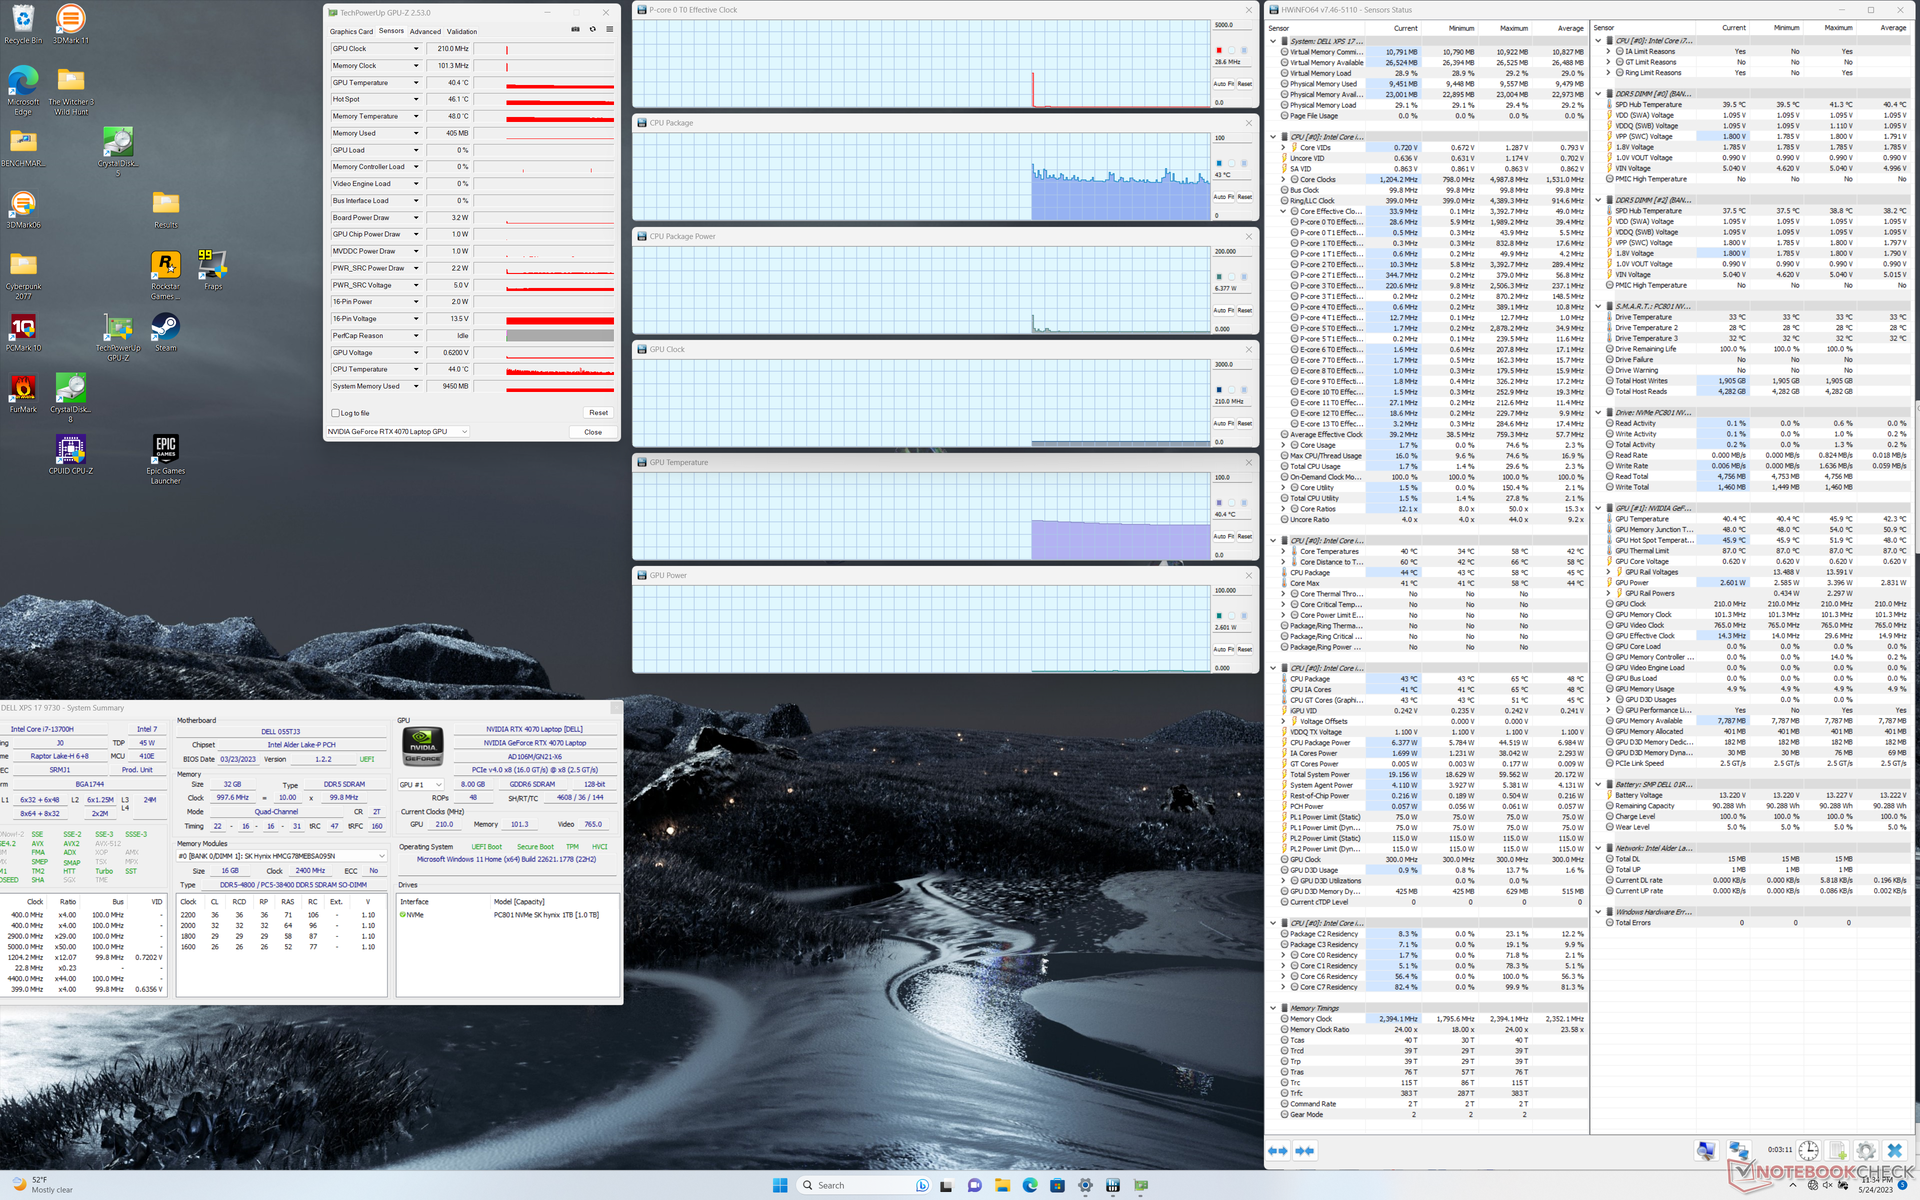
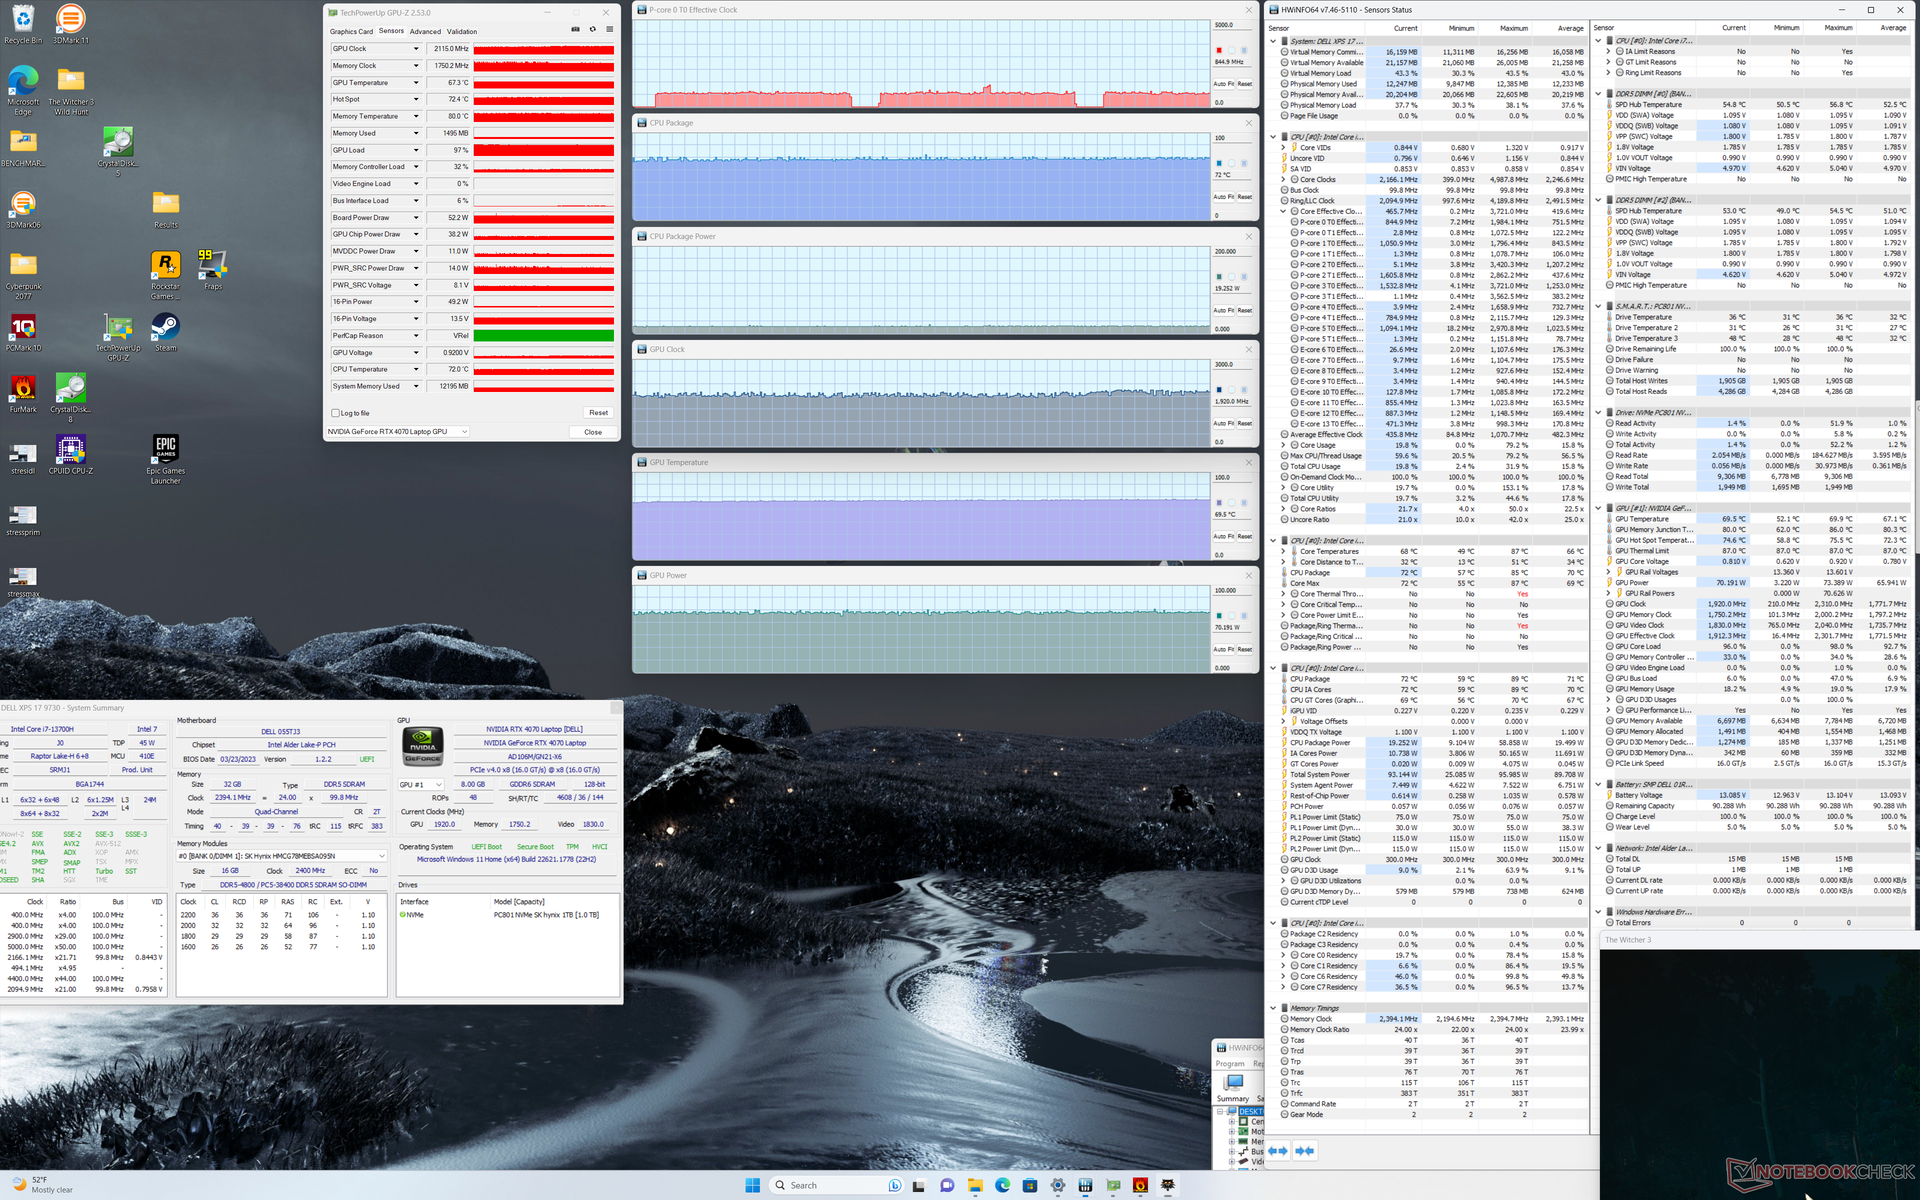
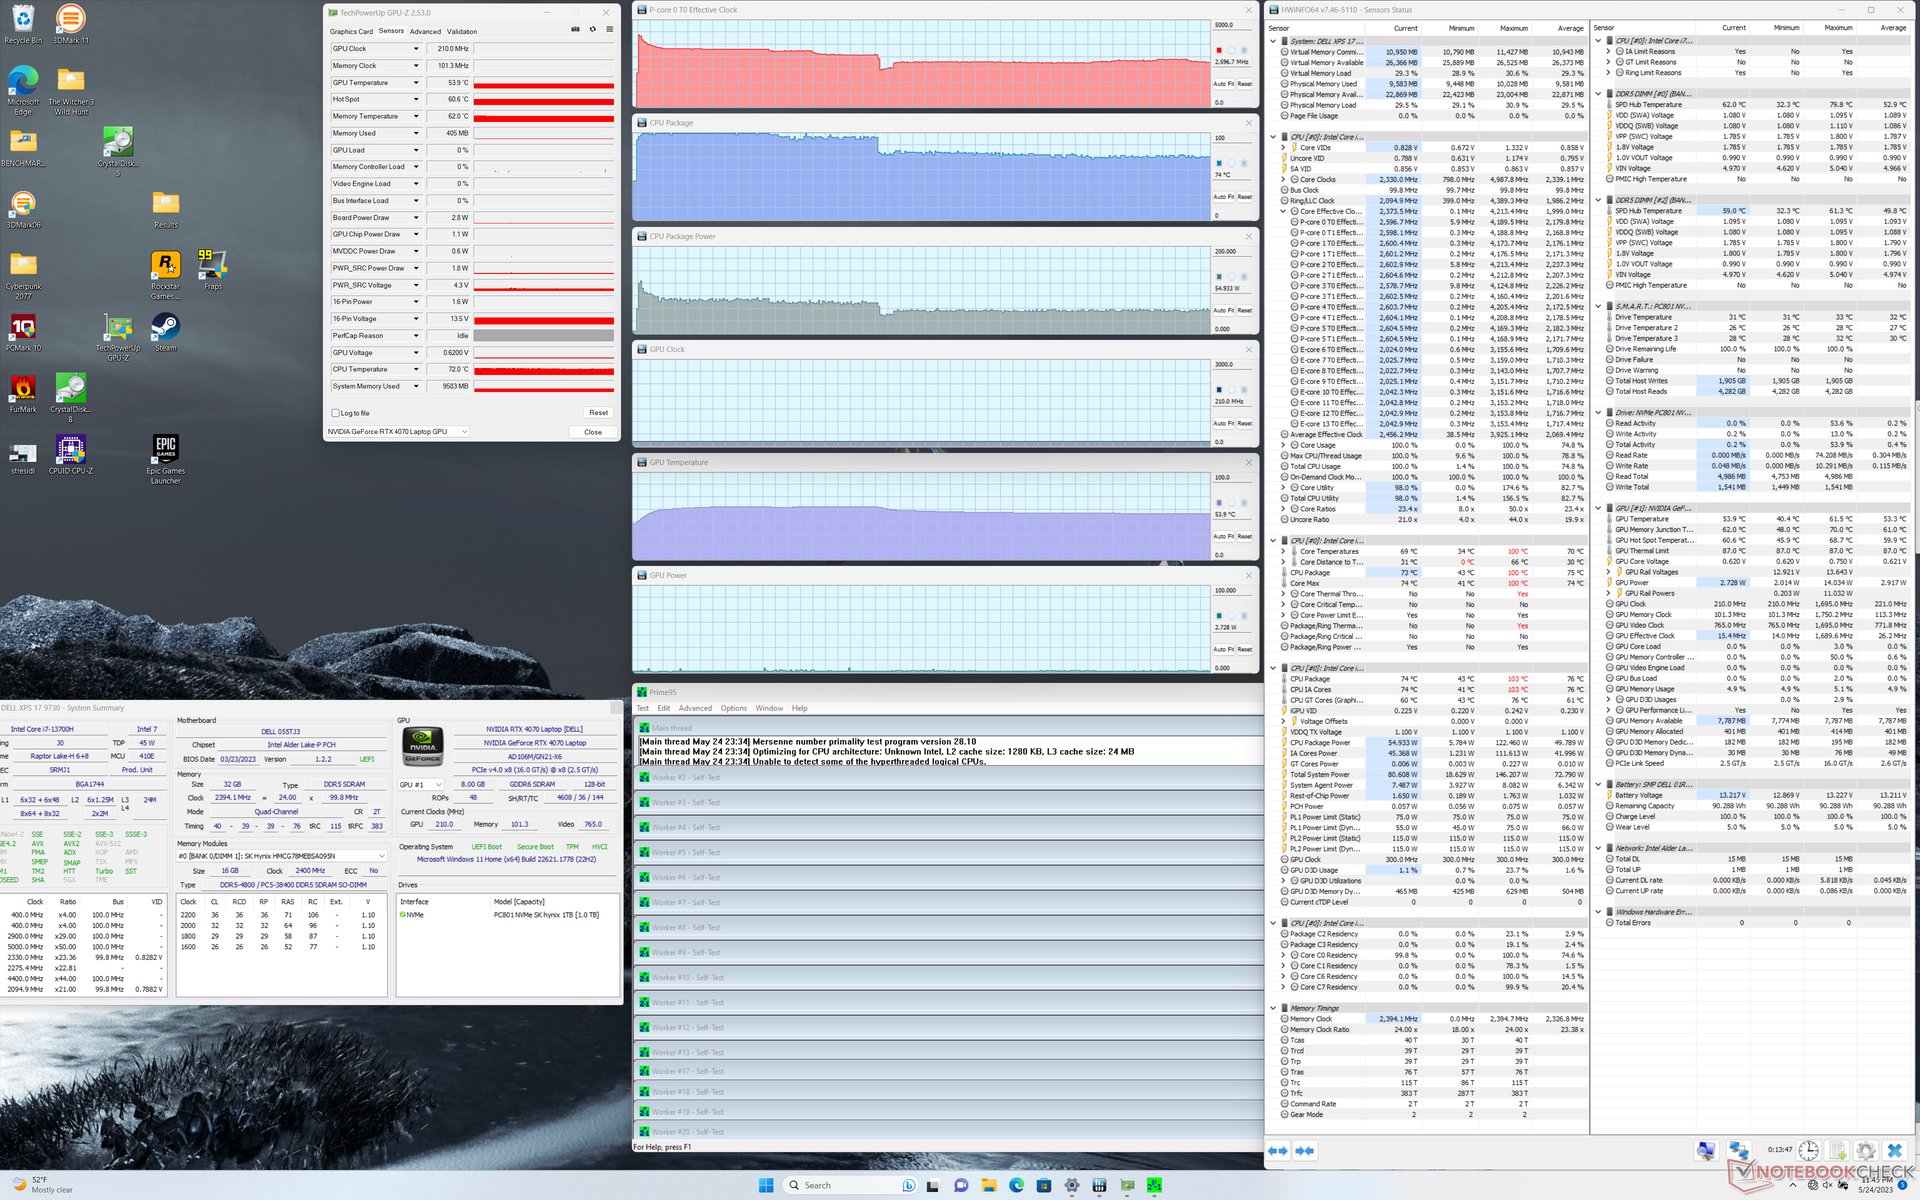
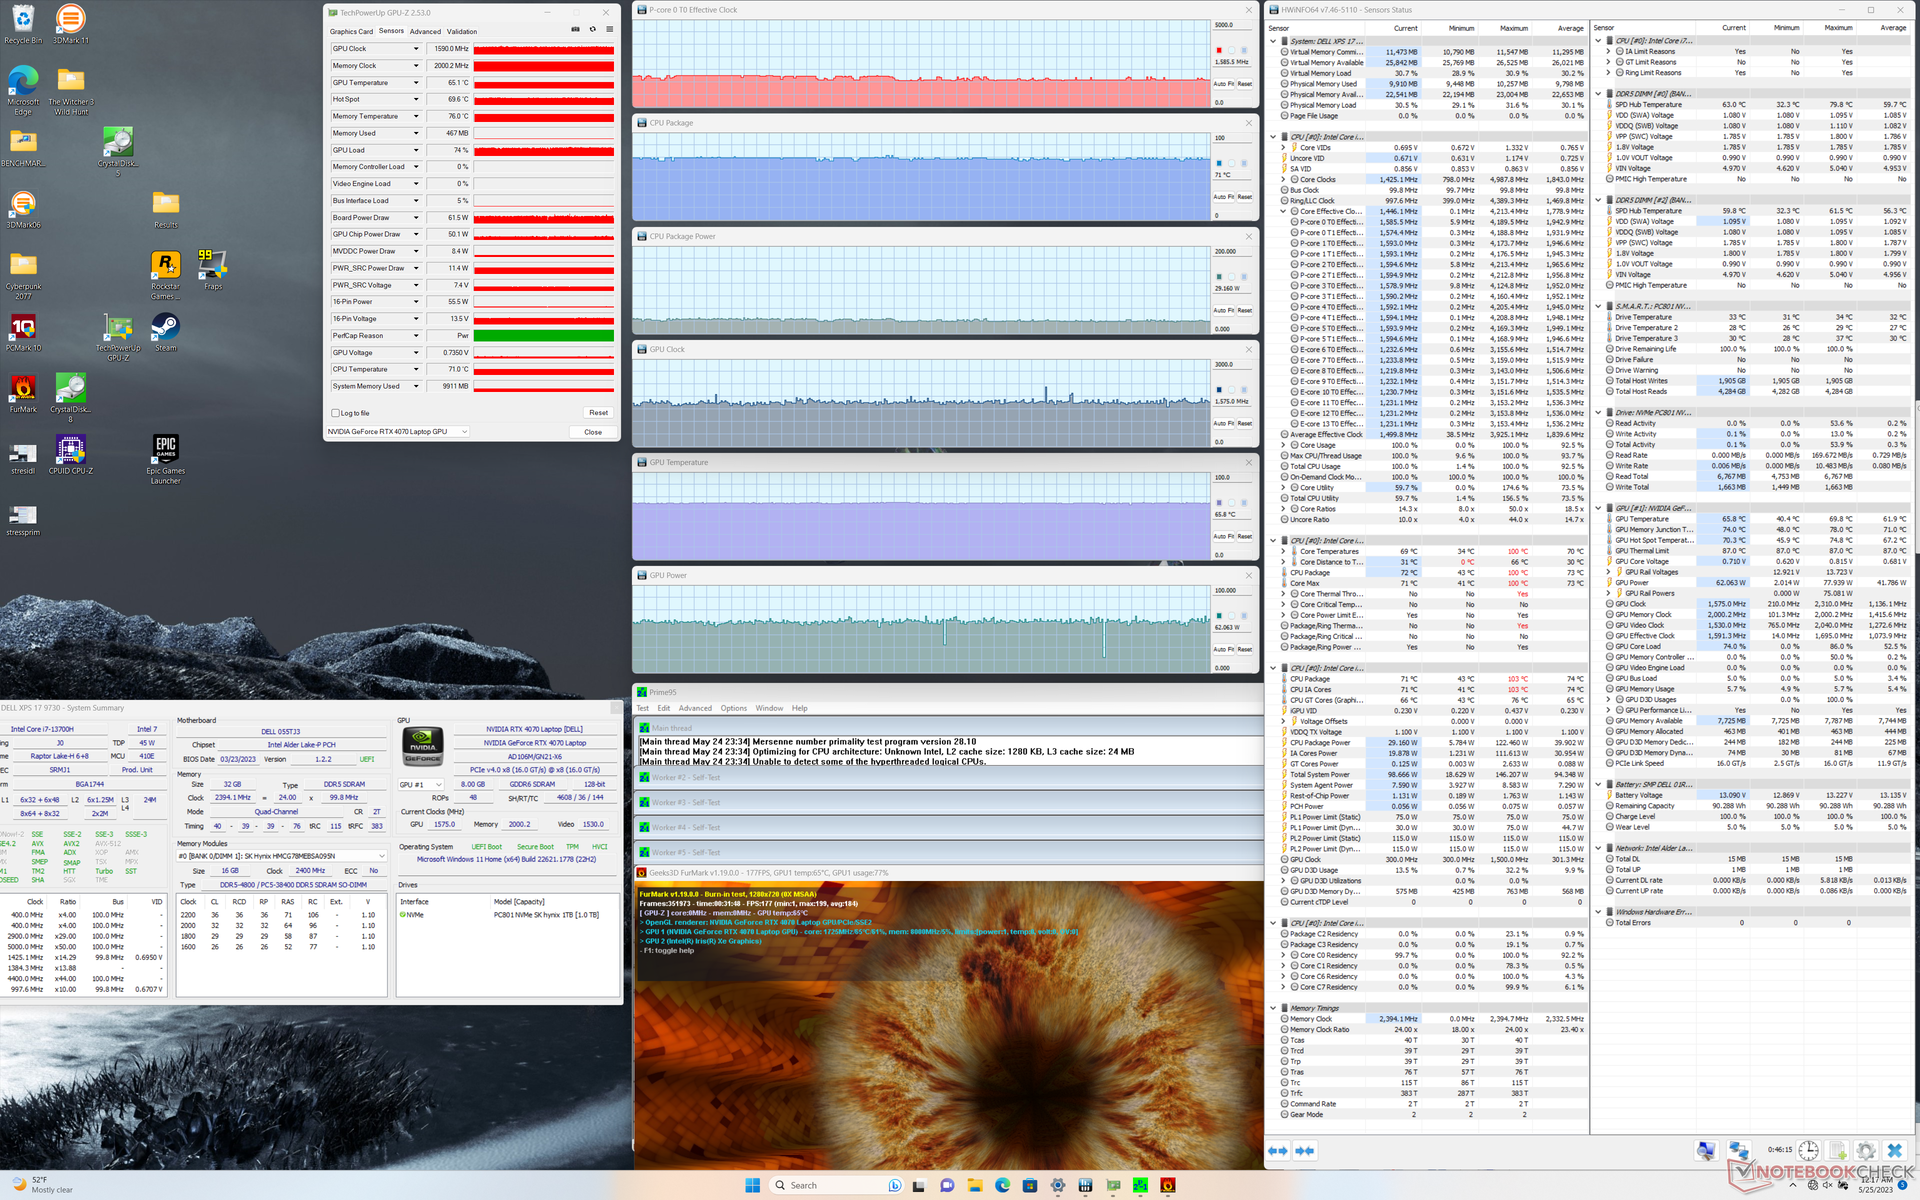
| Clock della CPU (GHz) | Clock della GPU (MHz) | Temperatura media della CPU (°C) | Temperatura media della GPU (°C) | |
| Sistema inattivo | -- | -- | 43 | 40 |
| Stress Prime95 | 2,6 | -- | 74 | 54 |
| Prime95 + FurMark Stress | 1,6 | 1590 | 71 | 65 |
| Witcher 3 Stress | 0,8 | 2115 | 72 | 67 |
Altoparlanti
Dell XPS 17 9730 RTX 4070 analisi audio
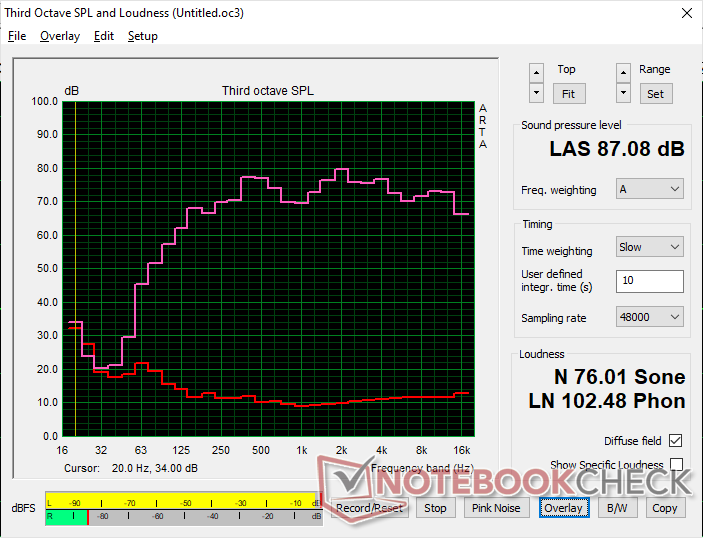
(+) | gli altoparlanti sono relativamente potenti (87.1 dB)
Bassi 100 - 315 Hz
(±) | bassi ridotti - in media 7.2% inferiori alla media
(+) | bassi in lineaa (5.9% delta rispetto alla precedente frequenza)
Medi 400 - 2000 Hz
(+) | medi bilanciati - solo only 3.3% rispetto alla media
(+) | medi lineari (5.1% delta rispetto alla precedente frequenza)
Alti 2 - 16 kHz
(+) | Alti bilanciati - appena 1.9% dalla media
(+) | alti lineari (3.4% delta rispetto alla precedente frequenza)
Nel complesso 100 - 16.000 Hz
(+) | suono nel complesso lineare (7% differenza dalla media)
Rispetto alla stessa classe
» 4% di tutti i dispositivi testati in questa classe è stato migliore, 1% simile, 96% peggiore
» Il migliore ha avuto un delta di 5%, medio di 18%, peggiore di 45%
Rispetto a tutti i dispositivi testati
» 1% di tutti i dispositivi testati in questa classe è stato migliore, 0% similare, 99% peggiore
» Il migliore ha avuto un delta di 4%, medio di 24%, peggiore di 134%
Apple MacBook Pro 16 2021 M1 Pro analisi audio
(+) | gli altoparlanti sono relativamente potenti (84.7 dB)
Bassi 100 - 315 Hz
(+) | bassi buoni - solo 3.8% dalla media
(+) | bassi in lineaa (5.2% delta rispetto alla precedente frequenza)
Medi 400 - 2000 Hz
(+) | medi bilanciati - solo only 1.3% rispetto alla media
(+) | medi lineari (2.1% delta rispetto alla precedente frequenza)
Alti 2 - 16 kHz
(+) | Alti bilanciati - appena 1.9% dalla media
(+) | alti lineari (2.7% delta rispetto alla precedente frequenza)
Nel complesso 100 - 16.000 Hz
(+) | suono nel complesso lineare (4.6% differenza dalla media)
Rispetto alla stessa classe
» 0% di tutti i dispositivi testati in questa classe è stato migliore, 0% simile, 100% peggiore
» Il migliore ha avuto un delta di 5%, medio di 18%, peggiore di 45%
Rispetto a tutti i dispositivi testati
» 0% di tutti i dispositivi testati in questa classe è stato migliore, 0% similare, 100% peggiore
» Il migliore ha avuto un delta di 4%, medio di 24%, peggiore di 134%
Gestione dell'energia - USB-C al lavoro
Consumo di energia: 130 W sono sufficienti?
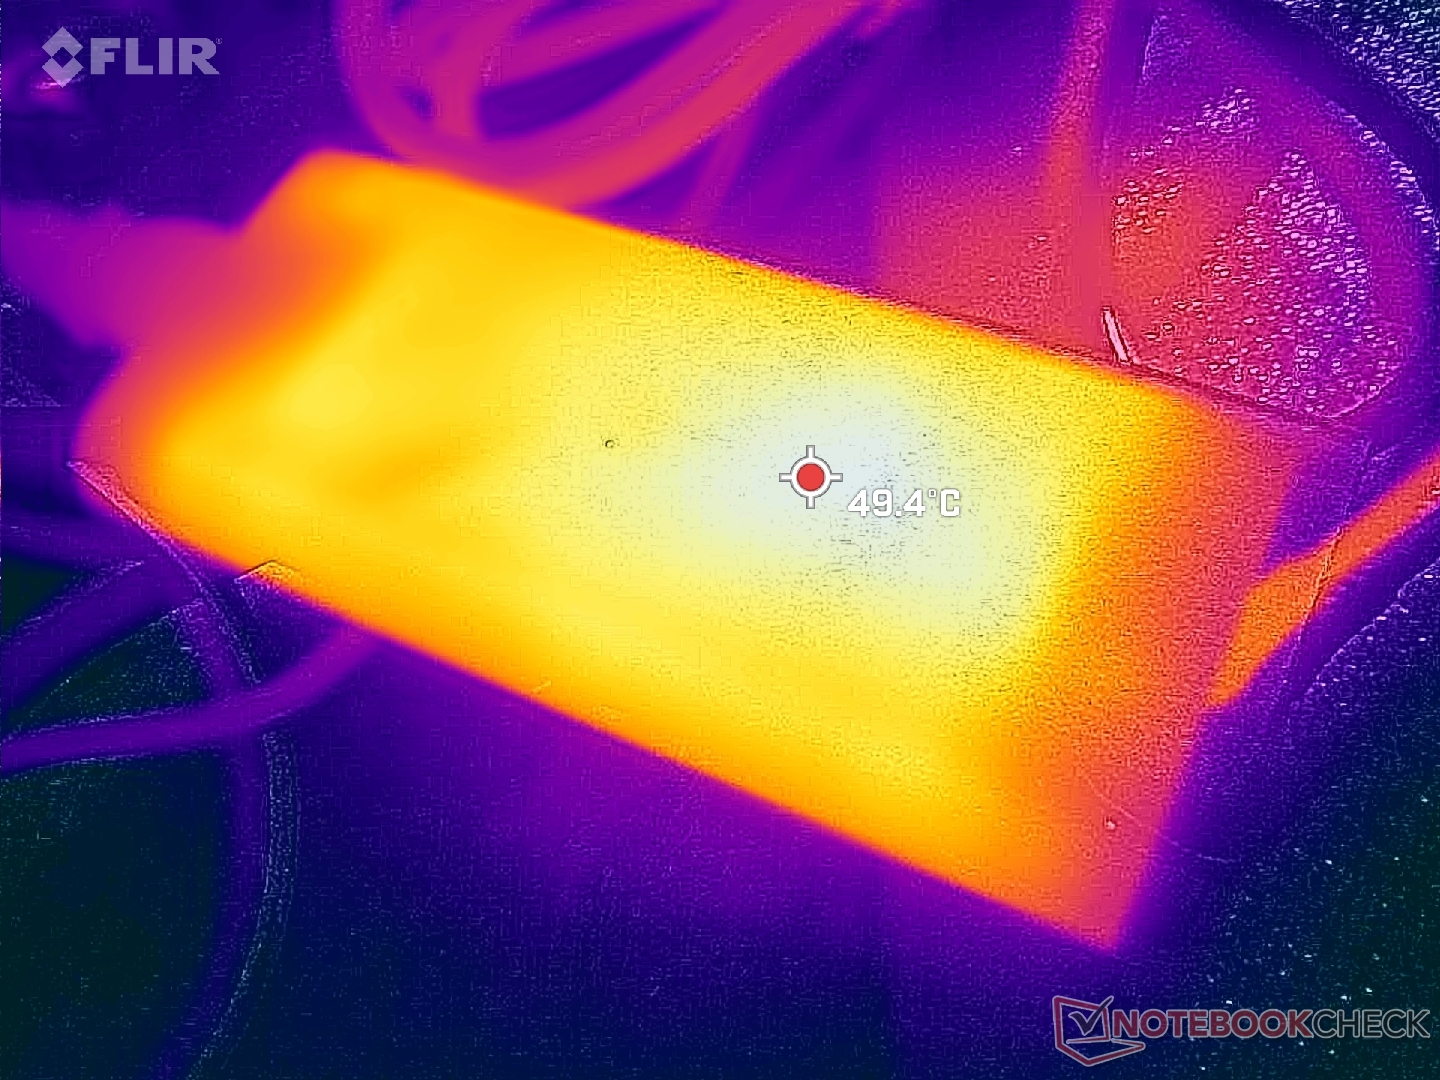
Il consumo di energia non è cambiato drasticamente rispetto al precedente XPS 17 9720, poiché tutti i modelli XPS 17 finora vengono forniti con lo stesso adattatore CA USB-C da 130 W. Rispetto ad altri portatili con CPU serie H e GPU RTX GeForce, l'adattatore Dell da 130 W è uno dei più piccoli sia per dimensioni che per potenza. Il piccolo adattatore rinuncia a prestazioni più elevate e a una ricarica più rapida a favore della portabilità.
Tuttavia, le maggiori prestazioni per watt di Ada Lovelace rispetto agli Ampere consentono all'XPS 17 9730 di ottenere prestazioni migliori rispetto al modello dell'anno scorso a parità di potenza. In esecuzione Witcher 3ad esempio, consuma circa 114 W sia sull'XPS 17 9720 che sul 9730, nonostante quest'ultimo offra prestazioni grafiche superiori del 30%. Anche il consumo energetico della CPU sarebbe più costante grazie alla maggiore durata del Turbo Boost rispetto al Core i7-12700H, come già detto. Dell ha sicuramente ottimizzato al meglio la CPU e la GPU per rientrare nei limiti del budget energetico.
| Off / Standby | |
| Idle | |
| Sotto carico |
|
Leggenda:
min: | |
| Dell XPS 17 9730 RTX 4070 i7-13700H, NVIDIA GeForce RTX 4070 Laptop GPU, SK hynix PC801 HFS001TEJ9X101N, Sharp LQ170R1, 3840x2400, 17" | Dell XPS 17 9720 RTX 3060 i7-12700H, GeForce RTX 3060 Laptop GPU, Samsung PM9A1 MZVL21T0HCLR, IPS, 3840x2400, 17" | LG Gram 17 (2023) i7-1360P, Iris Xe G7 96EUs, Samsung PM9A1 MZVL21T0HCLR, IPS, 2560x1600, 17" | HP Envy 17-cr0079ng i7-1255U, GeForce RTX 2050 Mobile, Samsung PM991a MZVLQ1T0HBLB, IPS, 3840x2160, 17.3" | MSI Creator Z17 A12UGST-054 i9-12900H, GeForce RTX 3070 Ti Laptop GPU, Micron 3400 1TB MTFDKBA1T0TFH, IPS, 2560x1600, 17" | Apple MacBook Pro 16 2023 M2 Max M2 Max, M2 Max 38-Core GPU, Apple SSD AP2048Z, Mini-LED, 3456x2234, 16.2" | |
|---|---|---|---|---|---|---|
| Power Consumption | 6% | 59% | 34% | -79% | 16% | |
| Idle Minimum * | 15 | 5.9 61% | 2.2 85% | 5.8 61% | 34.6 -131% | 5.2 65% |
| Idle Average * | 23.6 | 15.8 33% | 8.9 62% | 14.3 39% | 43 -82% | 16.5 30% |
| Idle Maximum * | 24.3 | 26.7 -10% | 11 55% | 18.4 24% | 44.9 -85% | 16.8 31% |
| Load Average * | 80 | 117.4 -47% | 53 34% | 70 12% | 145 -81% | 113 -41% |
| Witcher 3 ultra * | 113.7 | 114.8 -1% | 42.5 63% | 69.4 39% | 152.4 -34% | 92 19% |
| Load Maximum * | 135.4 | 136.6 -1% | 64 53% | 93 31% | 220 -62% | 145 -7% |
* ... Meglio usare valori piccoli
Power Consumption Witcher 3 / Stresstest
Power Consumption external Monitor
Durata della batteria - Lunga durata, ricarica lenta
L'autonomia della WLAN è di circa un'ora superiore a quella dell'XPS 17 9720 dello scorso anno, per un totale di 10 ore di navigazione nel mondo reale. È positivo vedere che la durata della batteria non ha subito contraccolpi nonostante gli aumenti annuali delle prestazioni complessive.
La ricarica da vuoto a pieno regime è lenta, circa 2-2,5 ore rispetto a 1,5 ore della maggior parte degli altri portatili. Tenete presente che la ricarica sarebbe ancora più lenta se si eseguono carichi impegnativi come i giochi, a causa dell'adattatore CA da 130 W limitato.
Vale la pena notare che la batteria non si scarica lentamente quando è collegata alla rete elettrica e si eseguono giochi o altri carichi impegnativi. Questo problema era specifico dell'XPS 9700 originale ed è stato risolto a partire dal modello XPS 17 9710.
| Dell XPS 17 9730 RTX 4070 i7-13700H, NVIDIA GeForce RTX 4070 Laptop GPU, 97 Wh | Dell XPS 17 9720 RTX 3060 i7-12700H, GeForce RTX 3060 Laptop GPU, 97 Wh | LG Gram 17 (2023) i7-1360P, Iris Xe G7 96EUs, 80 Wh | HP Envy 17-cr0079ng i7-1255U, GeForce RTX 2050 Mobile, 55 Wh | MSI Creator Z17 A12UGST-054 i9-12900H, GeForce RTX 3070 Ti Laptop GPU, 90 Wh | Apple MacBook Pro 16 2023 M2 Max M2 Max, M2 Max 38-Core GPU, 99.6 Wh | |
|---|---|---|---|---|---|---|
| Autonomia della batteria | -13% | 61% | -6% | 26% | 24% | |
| Reader / Idle | 1147 | 1543 35% | ||||
| WiFi v1.3 | 600 | 524 -13% | 770 28% | 279 -53% | 332 -45% | 887 48% |
| Load | 67 | 58 -13% | 148 121% | 95 42% | 132 97% | 66 -1% |
| H.264 | 869 | 332 | 329 | 1124 |
Pro
Contro
Verdetto: equilibrato e ottimizzato
Un proverbio dice che non bisogna lanciarsi in un prodotto o in un progetto di prima generazione, a causa di potenziali problemi o di problemi che devono essere risolti. Il xPS 17 9700 originalead esempio, aveva problemi di scaricamento della batteria, problemi di stabilità della frequenza dei fotogrammi e scarse prestazioni del Turbo Boost della CPU. Dopo tre anni di ottimizzazioni costanti, l'ultimo XPS 17 9730 ha affrontato direttamente tutti questi difetti per essere un prodotto molto più semplice da consigliare. Il consumo energetico non è più un problema, i frame rate sono stabili e il Turbo Boost è più duraturo e costante.
L'XPS 17 9730 è in grado di bilanciare le prestazioni elevate con un budget energetico limitato a 130 W molto meglio rispetto all'XPS 15 9530 XPS 15 9530. Se equipaggiato con la stessa CPU Core i7 e la GPU RTX 4070 di GeForce, il nostro XPS 17 supera il fratello minore rispettivamente del 10-15% e del 50-60%. L'aumento della GPU in particolare è enorme, semplicemente perché l'XPS 17 ha un obiettivo TGP più elevato. Se siete indecisi tra l'XPS 15 e l'XPS 17 e le prestazioni grafiche sono di estrema importanza, l'XPS 17 è il chiaro vincitore.
L'XPS 17 9730 ha le prestazioni, la portabilità, il display e il potenziale di gioco per soddisfare la maggior parte degli utenti domestici e d'ufficio. Tuttavia, alcuni aspetti del design di tre anni fa stanno diventando obsoleti.
Gli svantaggi del modello non possono essere ignorati. Per un portatile da oltre 3.000 dollari, la misera webcam da 1 MP senza privacy shutter e l'assenza di supporto Wi-Fi 6E sono imbarazzanti per questa fascia di prezzo. Anche il display IPS a 60 Hz sta diventando obsoleto, visto che i pannelli OLED e con una frequenza di aggiornamento più elevata sono ormai comuni. L'adattatore CA da 130 W è più che altro un muro di mattoni che impedisce alla serie XPS 17 di raggiungere velocità di ricarica più elevate e obiettivi TGP più alti. Ci sono molte cose che possono essere migliorate, senza dubbio, ma almeno le prestazioni sono a un livello confortevole considerando il design sottile.
Prezzo e disponibilità
L'XPS 17 9730 non è ancora disponibile presso i rivenditori. Per ottenere le opzioni più configurabili e la spedizione immediata, si consiglia di acquistare direttamente da Dell. I prezzi partono da 2450 dollari per la SKU di fascia bassa fino a 4300-5100 dollari se completamente configurato.
Dell XPS 17 9730 RTX 4070
- 05/27/2023 v7 (old)
Allen Ngo
Transparency
La selezione dei dispositivi da recensire viene effettuata dalla nostra redazione. Il campione di prova è stato fornito all'autore come prestito dal produttore o dal rivenditore ai fini di questa recensione. L'istituto di credito non ha avuto alcuna influenza su questa recensione, né il produttore ne ha ricevuto una copia prima della pubblicazione. Non vi era alcun obbligo di pubblicare questa recensione. Non accettiamo mai compensi o pagamenti in cambio delle nostre recensioni. In quanto società mediatica indipendente, Notebookcheck non è soggetta all'autorità di produttori, rivenditori o editori.
Ecco come Notebookcheck esegue i test
Ogni anno, Notebookcheck esamina in modo indipendente centinaia di laptop e smartphone utilizzando procedure standardizzate per garantire che tutti i risultati siano comparabili. Da circa 20 anni sviluppiamo continuamente i nostri metodi di prova e nel frattempo stabiliamo gli standard di settore. Nei nostri laboratori di prova, tecnici ed editori esperti utilizzano apparecchiature di misurazione di alta qualità. Questi test comportano un processo di validazione in più fasi. Il nostro complesso sistema di valutazione si basa su centinaia di misurazioni e parametri di riferimento ben fondati, che mantengono l'obiettività.Price comparison

