

Notebookcheck Logo
Teaser

Intel batte nettamente Snapdragon - Recensione del Microsoft Surface Laptop 15 Gen 8

Core Ultra X vs. Snapdragon X2.

L'attuale Surface Laptop 15 for Business di Microsoft è disponibile con le potenti CPU Core Ultra X di Intel, che includono anche la veloce iGPU Arc B390. Il risultato è il miglior laptop Windows attualmente disponibile, superiore anche ai modelli Snapdragon destinati ai clienti privati.
Andreas Osthoff, 👁 Andreas Osthoff (traduzione a cura di DeepL / Ninh Duy) Pubblicato 🇺🇸 🇳🇱 ...
Arc Business Laptop / Notebook MS Surface Microsoft Panther Lake Thunderbolt Touchscreen Wi-Fi 7 Windows

Verdetto - Surface Laptop 15 è migliore con Intel

Il Surface Laptop 15 Gen 8 è un buon portatile multimediale e la versione Intel offre prestazioni GPU superiori, una migliore compatibilità con app e giochi e la connettività Thunderbolt 4. Le prestazioni pure della CPU sono probabilmente migliori nella variante Snapdragon, ma il pacchetto complessivo della versione Intel, con la sua iGPU superiore, è decisamente migliore per la maggior parte degli utenti. L'approccio di Microsoft con i modelli Snapdragon per gli utenti privati è sbagliato a nostro avviso e riteniamo che gli utenti debbano poter scegliere a prezzi competitivi, cosa che solitamente non avviene con i modelli aziendali (anche se possono essere acquistati anche da utenti privati).

Apprezziamo la qualità costruttiva premium, la tastiera comoda, i buoni altoparlanti e la qualità della webcam. È anche uno dei pochi dispositivi premium con un touchscreen IPS. Offre una buona qualità dell'immagine con colori accurati, 120 Hz e nessuno sfarfallio PWM, il che è ottimo per chi è sensibile allo sfarfallio degli schermi OLED. Anche l'autonomia della variante Intel è molto buona (Microsoft dichiara in realtà un'autonomia leggermente inferiore per il modello Snapdragon).

Questo non significa che il Surface Laptop 15 sia il dispositivo perfetto, perché ci sono sicuramente dei problemi. Le prestazioni del sistema di raffreddamento con una sola ventola non sono eccezionali e le prestazioni sotto carico prolungato ne risentono un po'. Era adeguato per il vecchio processore Lunar Lake, ma non riesce a sfruttare appieno il potenziale del veloce chip Panther Lake. Anche l'alimentatore da 65W è insufficiente sotto carico, almeno per alcuni minuti prima che le prestazioni vengano ridotte. Vorremmo anche SSD M.2-2280 standard, dato che all'interno dello chassis c'è molto spazio libero. La porta Surface Connect è piuttosto grande e preferiremmo un'altra porta USB-C e magari un lettore di schede SD standard invece di uno microSD. Anche i prezzi degli upgrade di RAM e archiviazione sono astronomici.

Nel complesso, il Surface Laptop 15 Gen 8 è un buon portatile multimediale e la versione Intel è la scelta migliore per la maggior parte degli utenti, ma concorrenti come il Lenovo ThinkPad X9-15p offrono soluzioni complessivamente migliori. Speriamo che Microsoft aggiorni il dispositivo il prossimo anno e risolva alcuni dei problemi menzionati, senza concentrarsi soltanto sul prossimo Surface Laptop Ultra con RTX Spark.

Pro

+ scocca stabile e di alta qualità
+ buone prestazioni del sistema
+ buona autonomia della batteria
+ lettore di schede microSD-Express veloce
+ dispositivi di input confortevoli
+ eccellenti profili colore di fabbrica
+ molto silenzioso nell'uso quotidiano
+ buone possibilità di manutenzione/accessibilità

Contro

- La RAM non può essere aggiornata
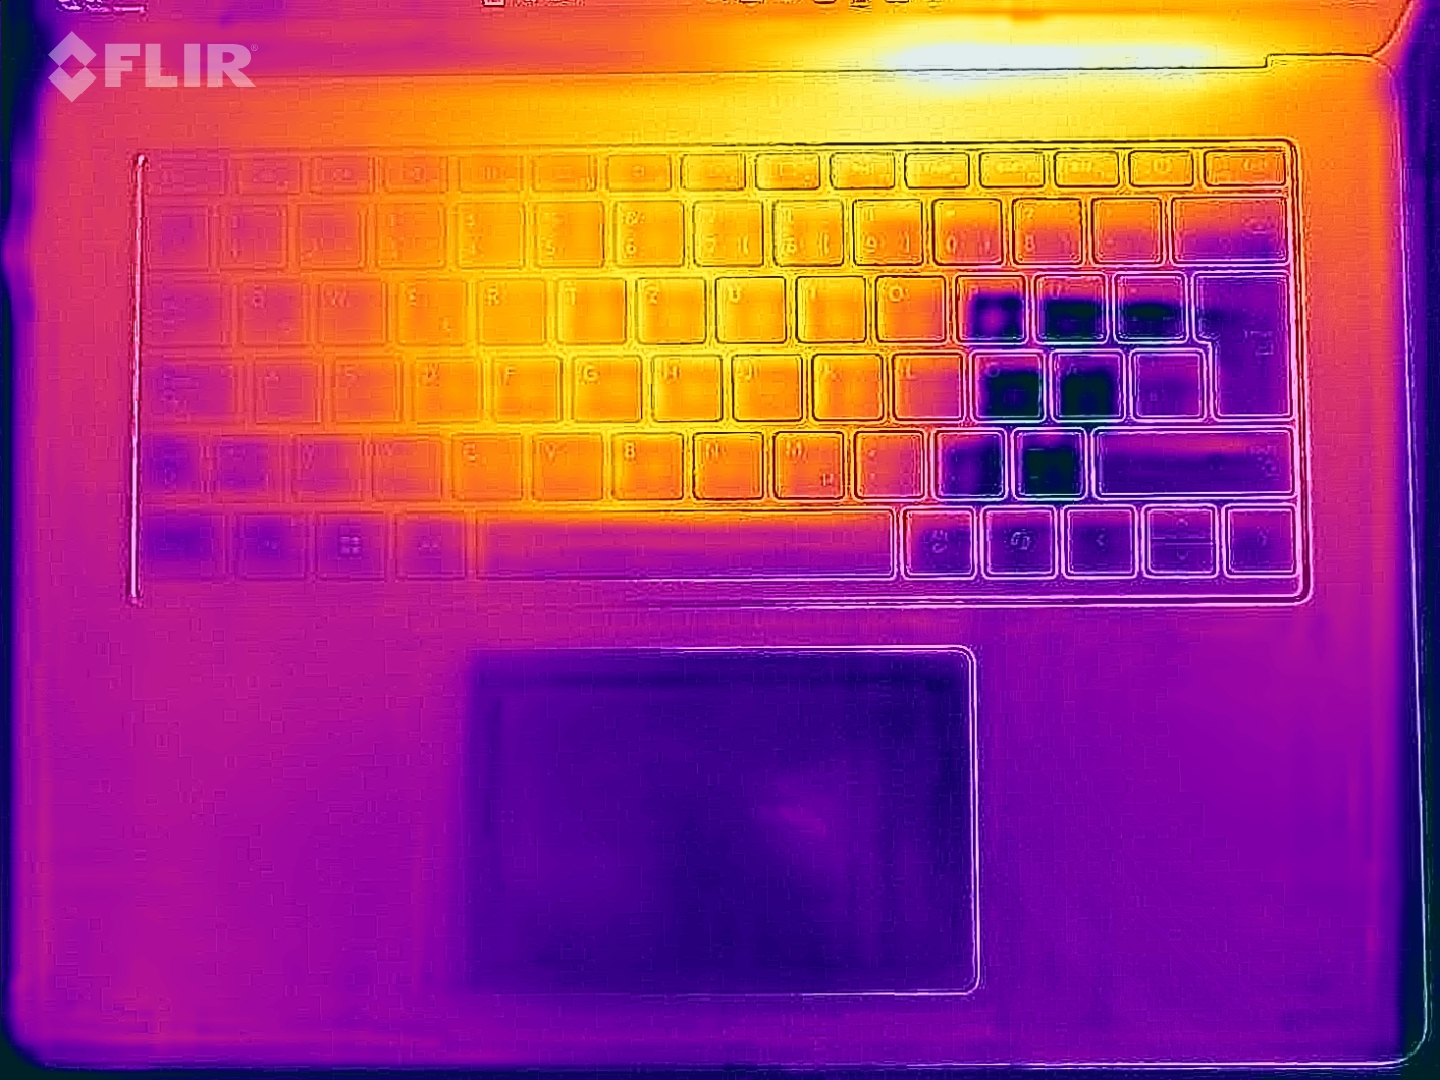
- la tastiera si scalda notevolmente sotto carico
- coil whine
- alimentatore insufficiente
- aggiornamenti costosi
- nessun modulo WWAN
- solo 1 anno di garanzia

Prezzo e disponibilità

Puoi ordinare il Surface Laptop 8 15 for Business con la CPU Core Ultra X direttamente da Microsoft a partire da $2749.99.

Amazon Logo
  • $238.94
    Microsoft Surface Laptop 3 15" Touch-Screen - CORE I5 1035G7 - 8GB Memory - 128GB Solid State Drive Platinum (Renewed)
  • $483.98
    Microsoft Surface Laptop 5 13.5" Touchscreen Notebook - 2256 x 1504 - Intel Core i7 12th Gen i7-1265U - Intel Evo Platform - 16 GB Total RAM - 512 GB SSD (Platinum) (Renewed)
  • $685.00
    Microsoft Surface Laptop 4 15” Touch-Screen – Intel Core i7 - 32GB - 1TB Solid State Drive - Matte Black

Specifiche

Microsoft Surface Laptop 15 Gen 8 (Surface Laptop Serie)
Processore
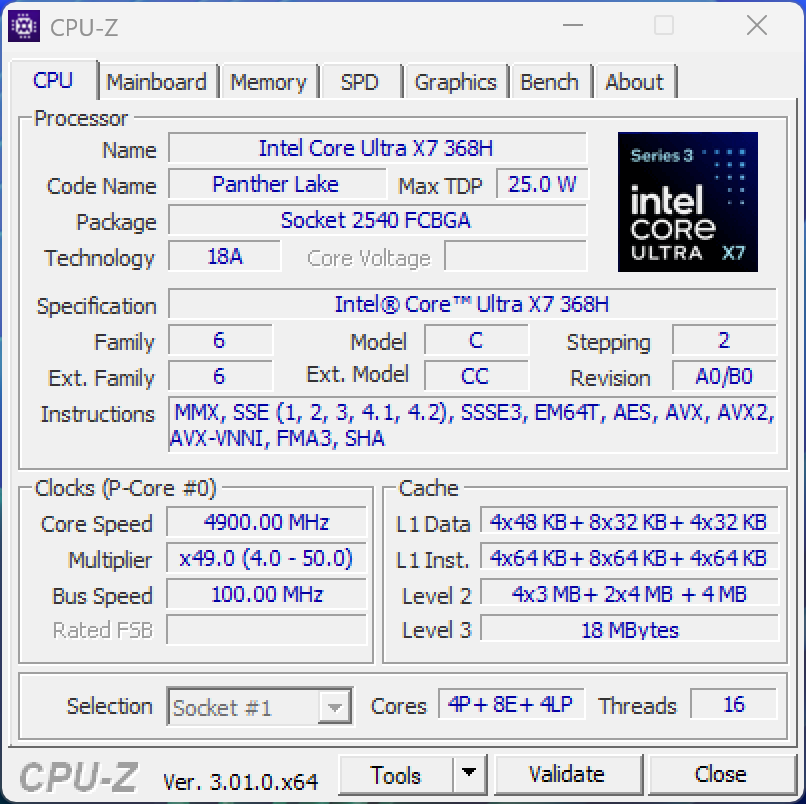
Intel Core Ultra X7 368H 16c/16t, 4 x 4.9 GHz Intel Cougar Cove P-Core, 8 x 4.0 GHz Intel Darkmont E-Core, 4 x 3.6 GHz Intel Darkmont E-Core, 65 W PL2 / Short Burst, 35 W PL1 / Sustained, Panther Lake
Scheda grafica
Intel Arc B390 12 Xe3 Panther Lake iGPU, Core: 2500 MHz, RAM: 800 MHz, 32.0.101.8738
Memoria
16 GB 
, LPDDR5x-8533, Dual-Channel, onboard
Schermo
15.00 pollici 3:2, 3270 x 2180 pixel 262 PPI, capacitive, LP150UD2-SPA1, IPS, lucido: si, 120 Hz
Scheda madre
Intel Panther Lake-H PCH
Harddisk
SK hynix PVC10 HFS256GEM4X182N, 256 GB 
, 188 GB libera
Scheda audio
Intel Panther Lake-H PCH - High Definition Audio - AVS (Audio, Voice, Speech)
Porte di connessione
1 USB 3.0 / 3.1, 2 Thunderbolt 4, USB-C Power Delivery (PD), 2 DisplayPort, 1 Porta Docking, Connessioni Audio: 3.5 mm stereo, Lettore schede: microSD Express, Sensore luminosità
Rete
Intel BE201 320MHz (a/b/g/h/n = Wi-Fi 4/ac = Wi-Fi 5/ax = Wi-Fi 6/ Wi-Fi 6E 6 GHz be = Wi-Fi 7), Bluetooth 5.4
Dimensioni
altezza x larghezza x profondità (in mm): 18.3 x 329 x 239
Batteria
66 Wh polimeri di litio
Sistema Operativo
Microsoft Windows 11 Home
Camera
Webcam: IR
Fotocamera Principale: 2 MPix
Altre caratteristiche
Casse: Stereo, Tastiera: Chiclet, 65W PSU, 12 Mesi Garanzia
Peso
1.651 kg, Alimentazione: 255 gr
Prezzo
2400 Euro
Nota: il produttore potrebbe usare componenti di fornitori diversi pannelli dei diplay, drive o banchi di memoria con specifiche simili.


Case, connettività e dispositivi di input

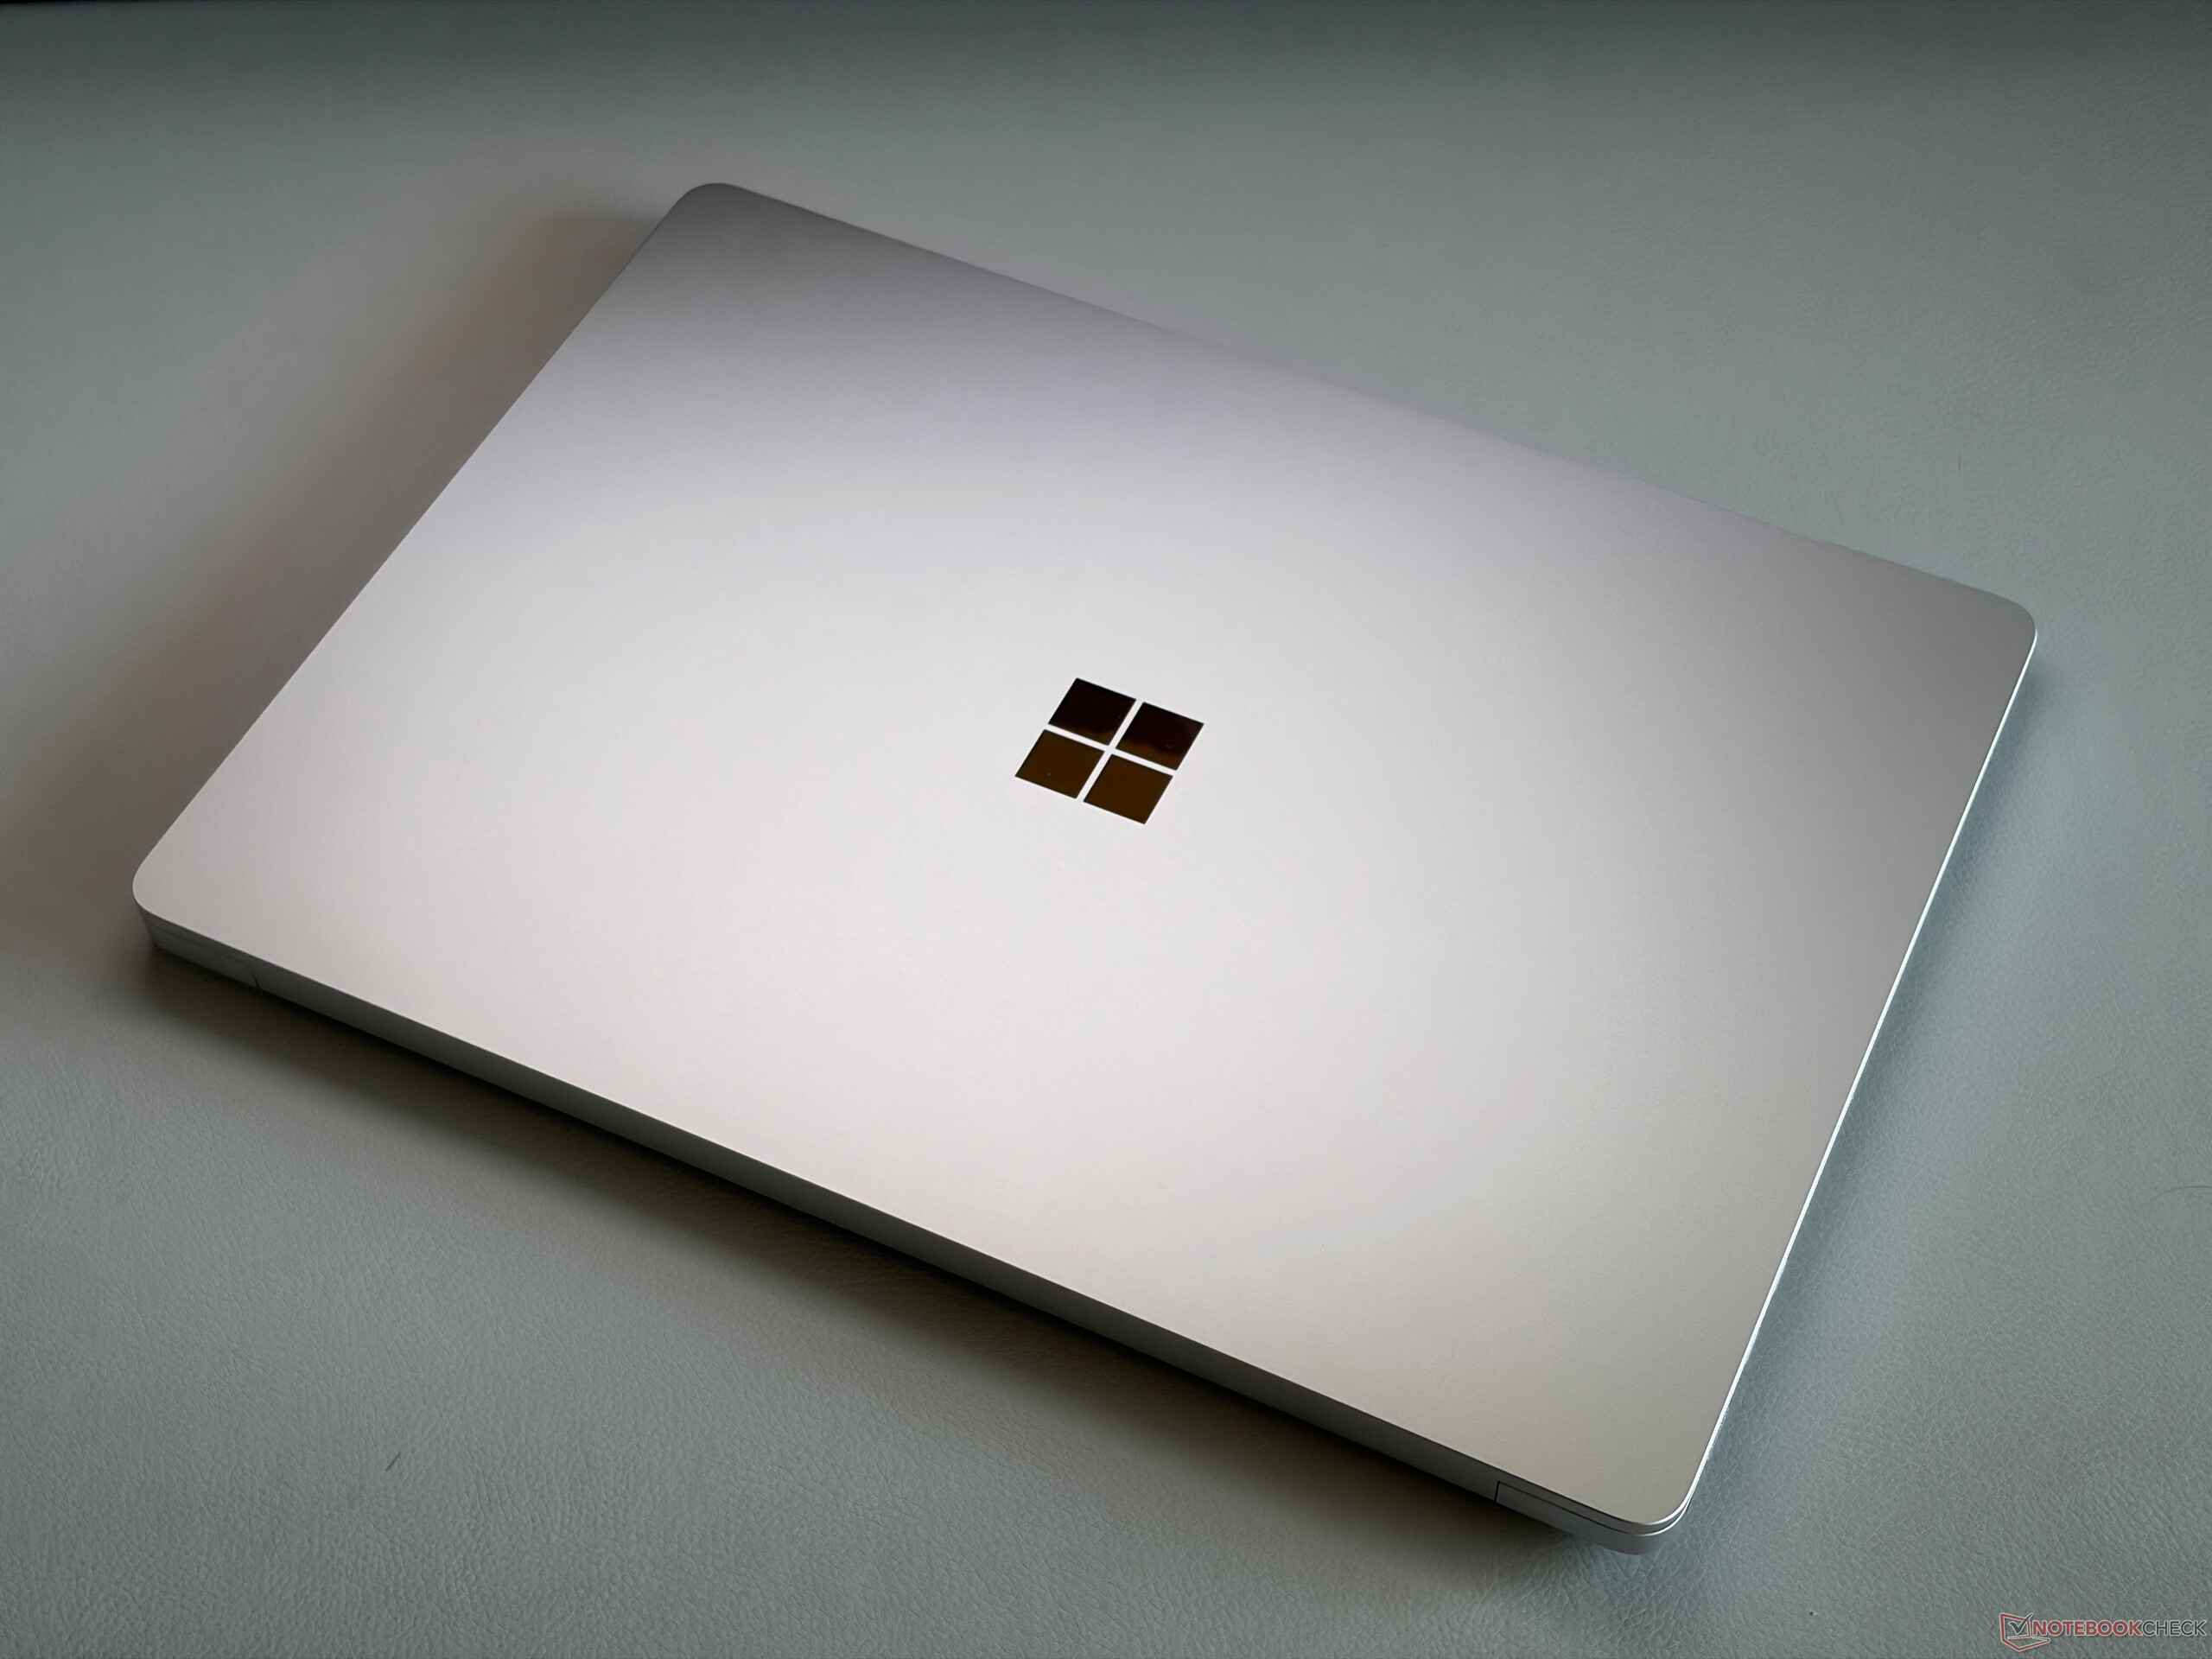
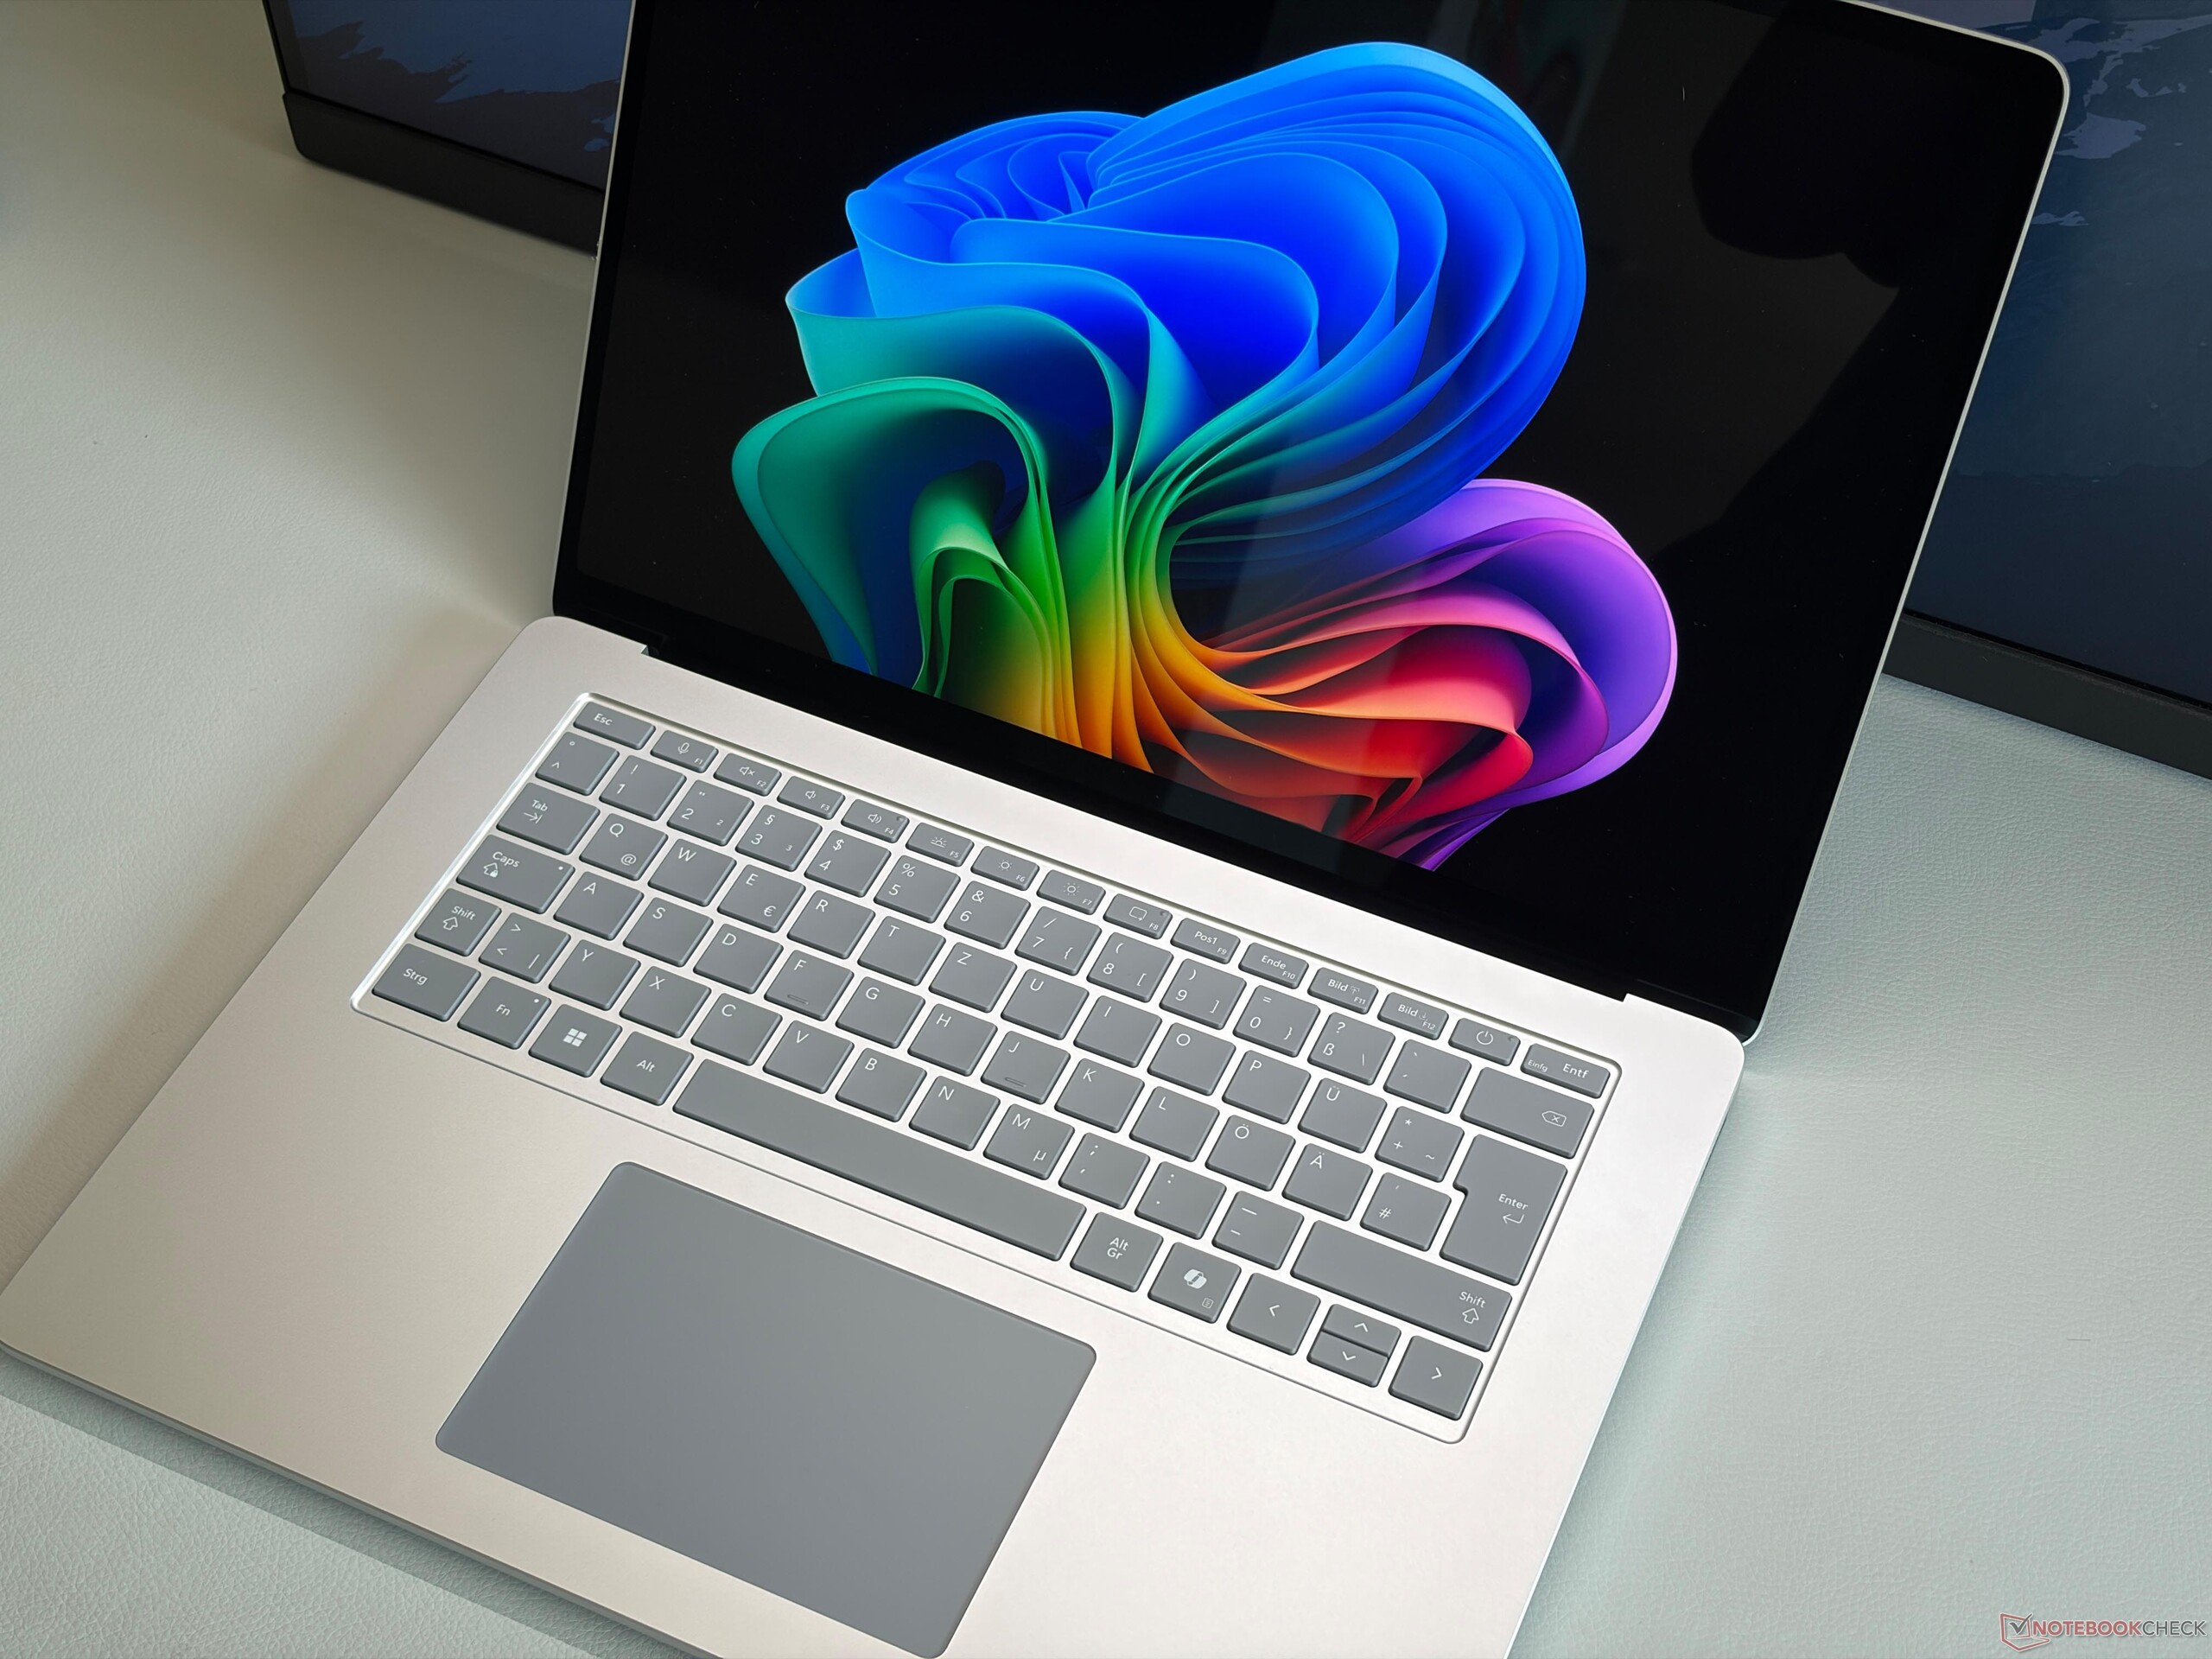
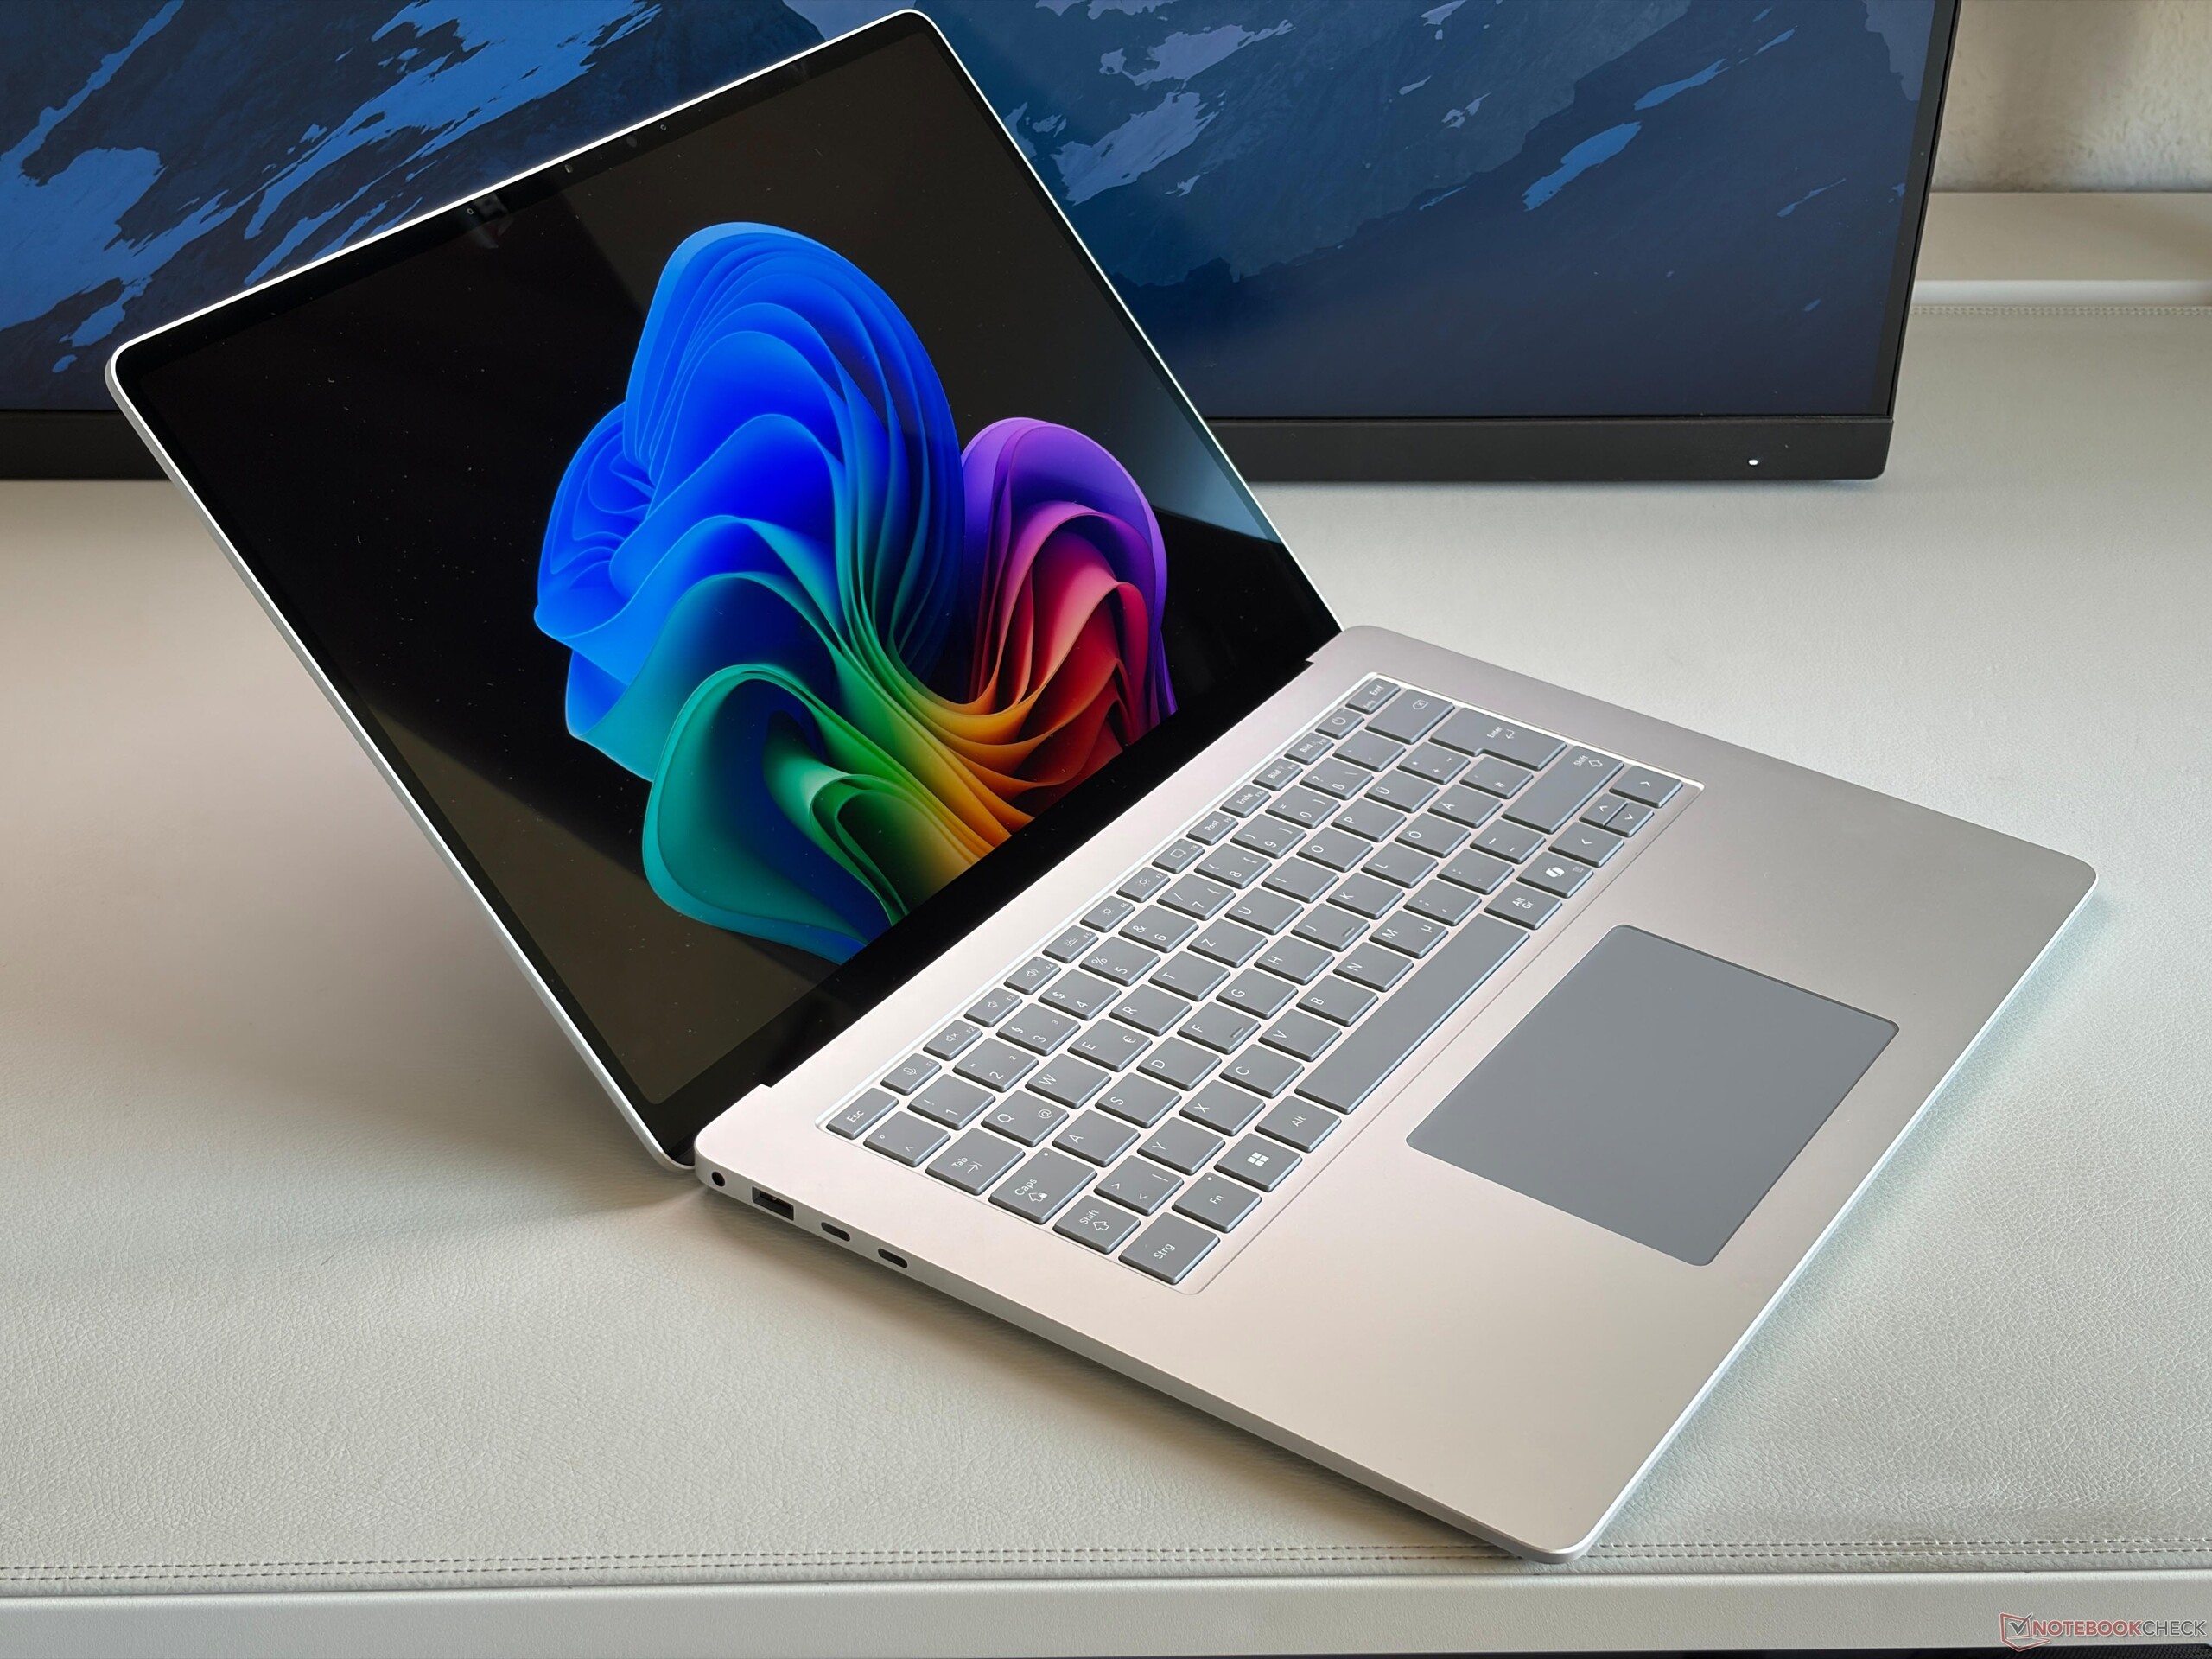
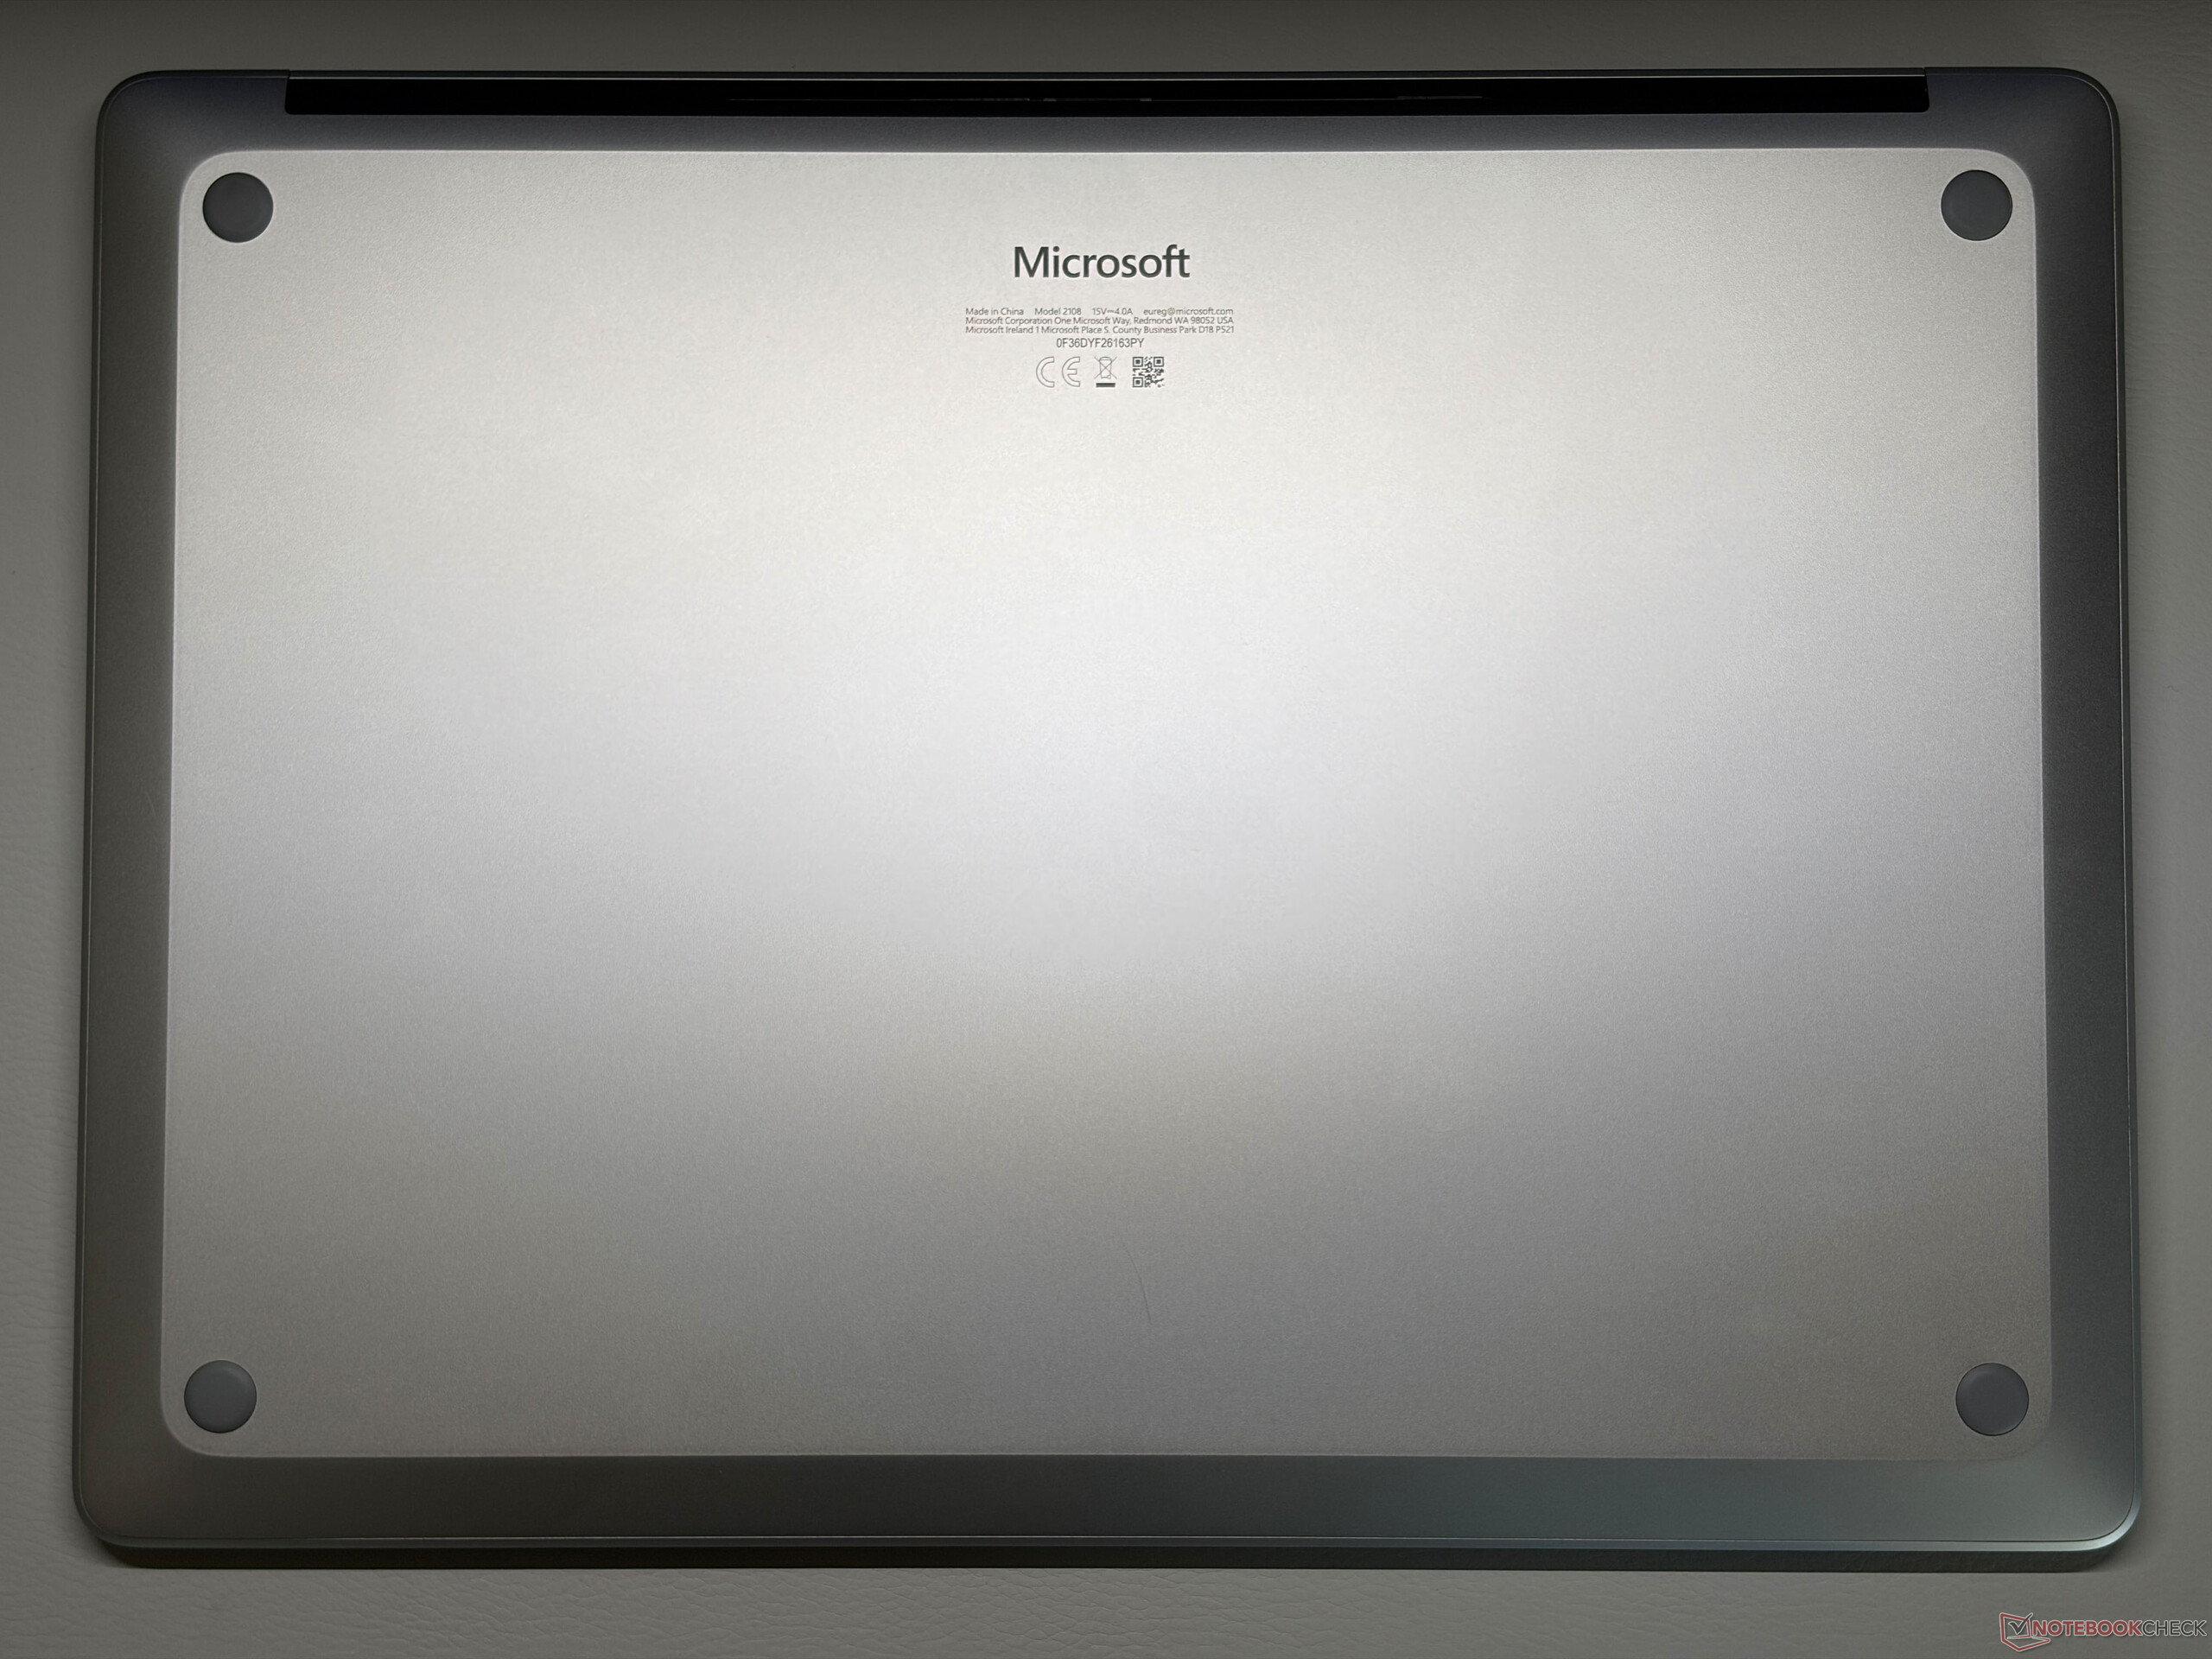
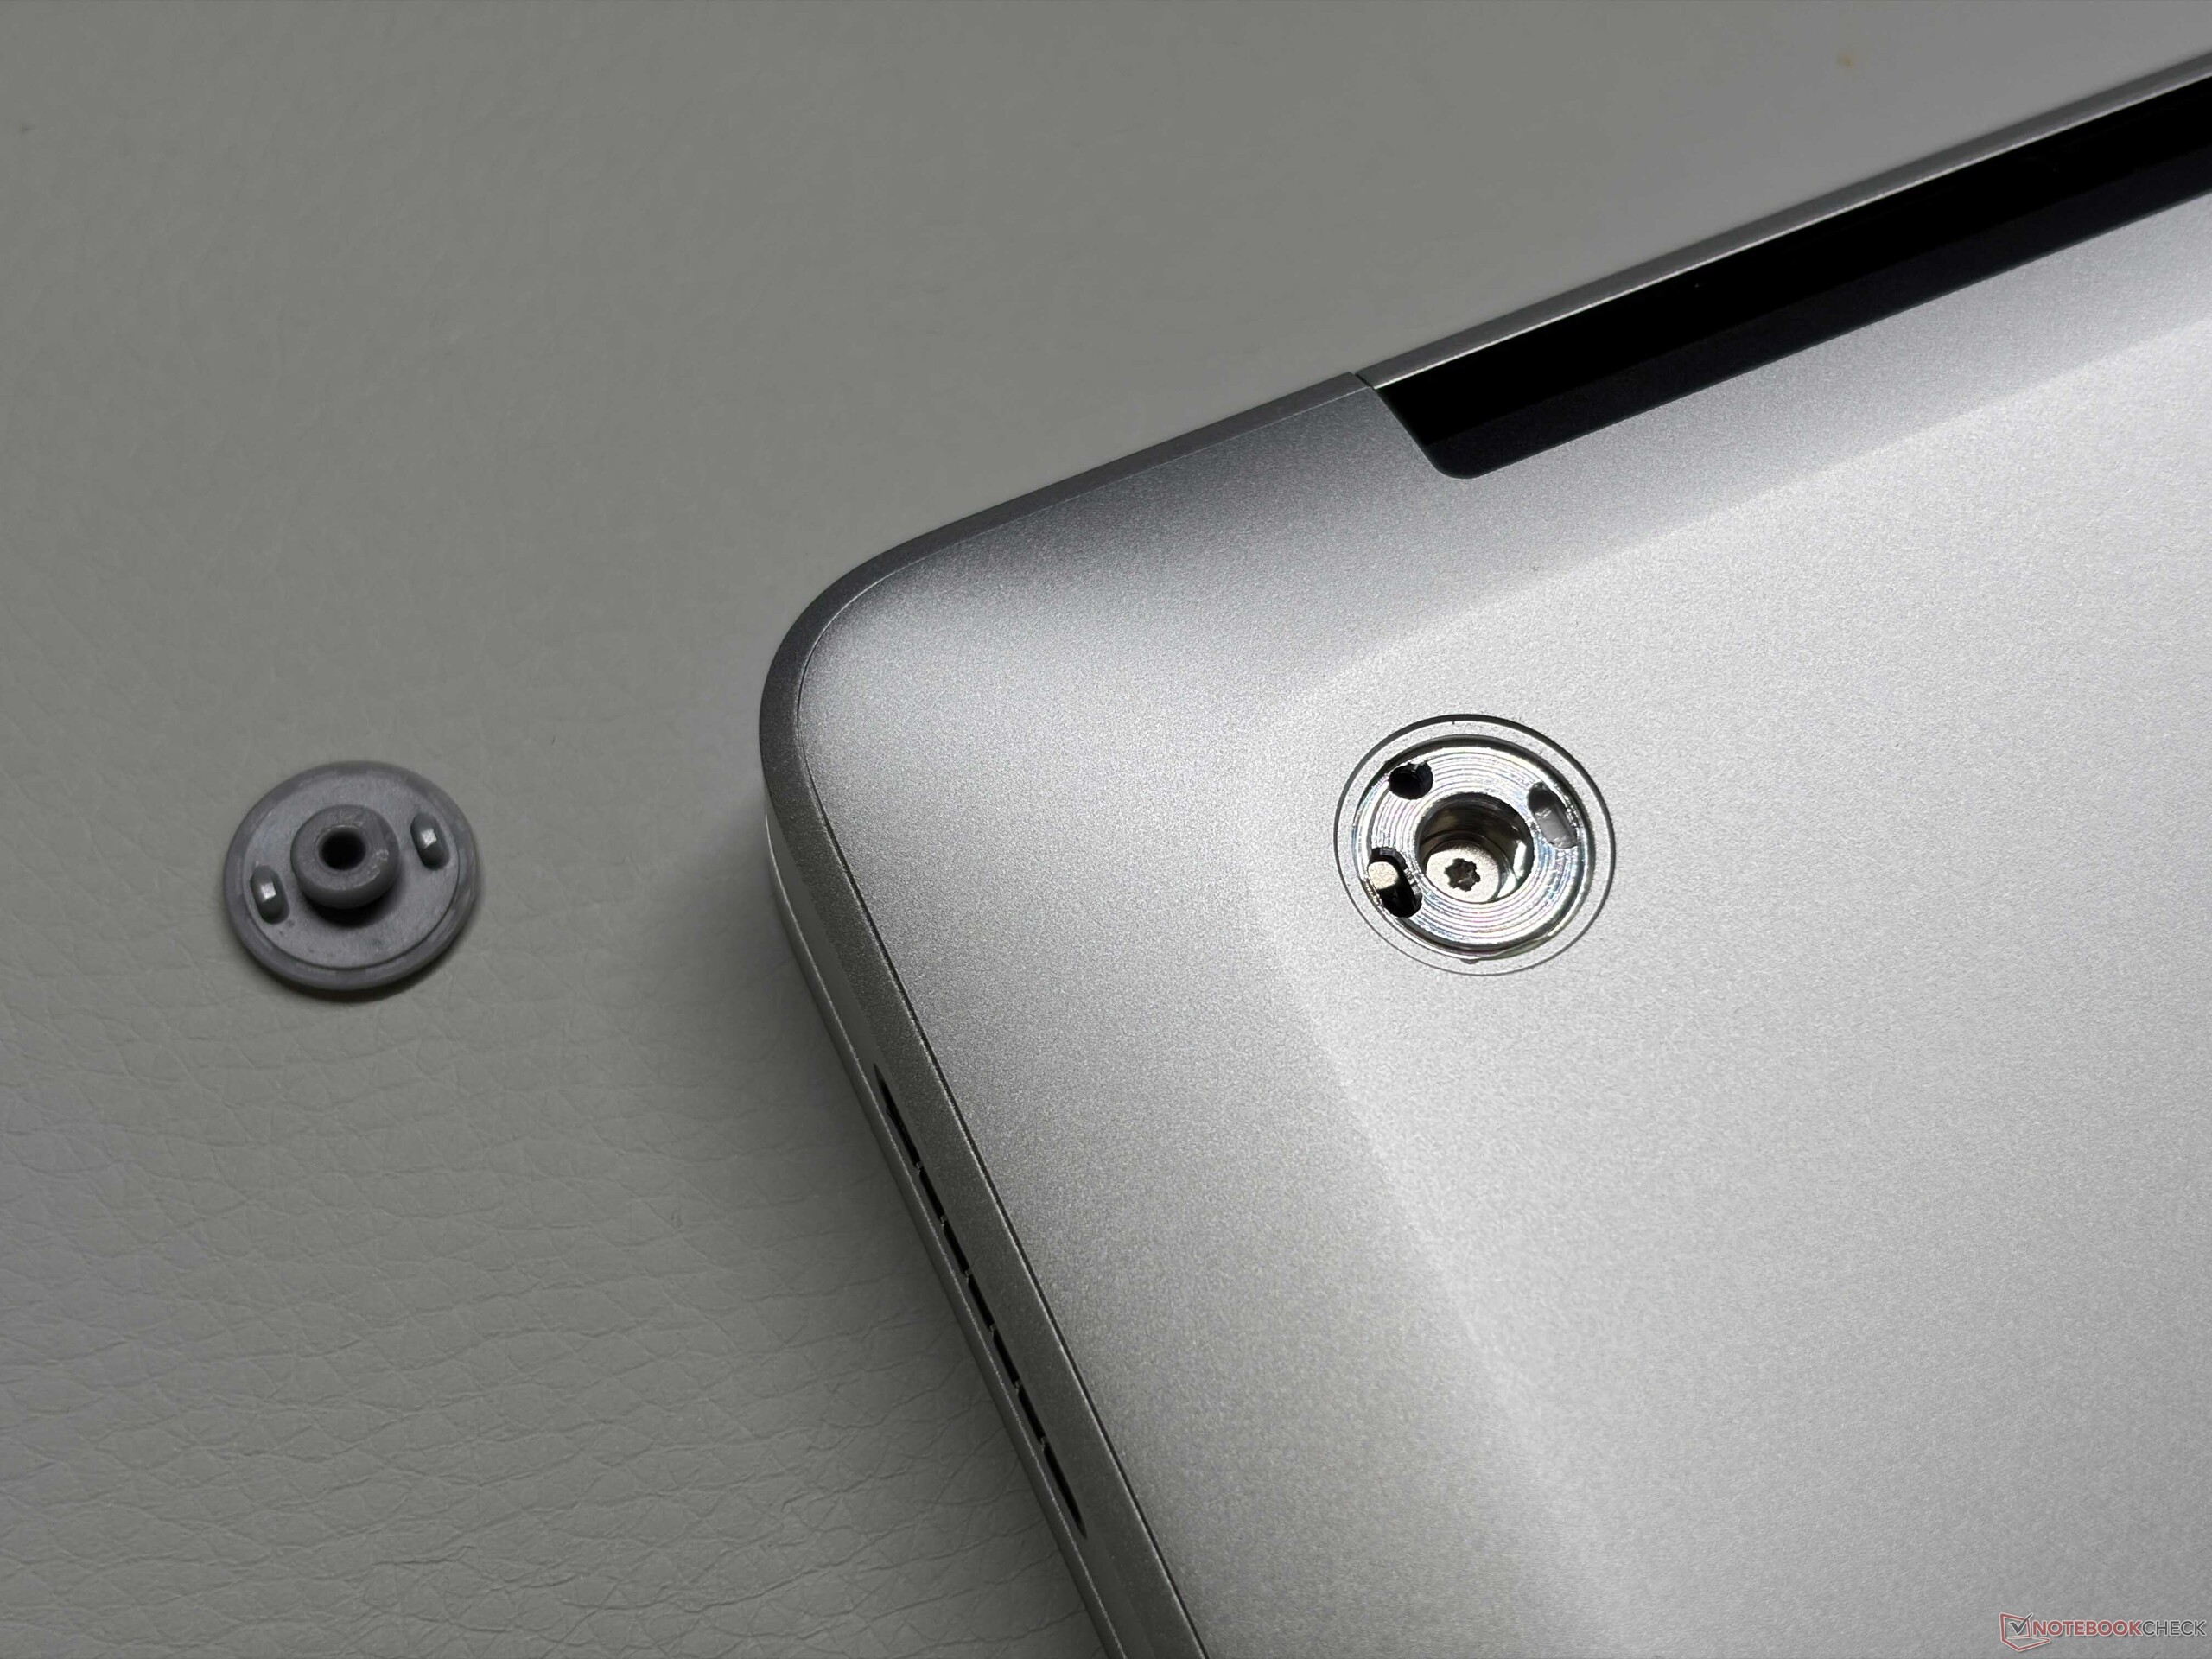
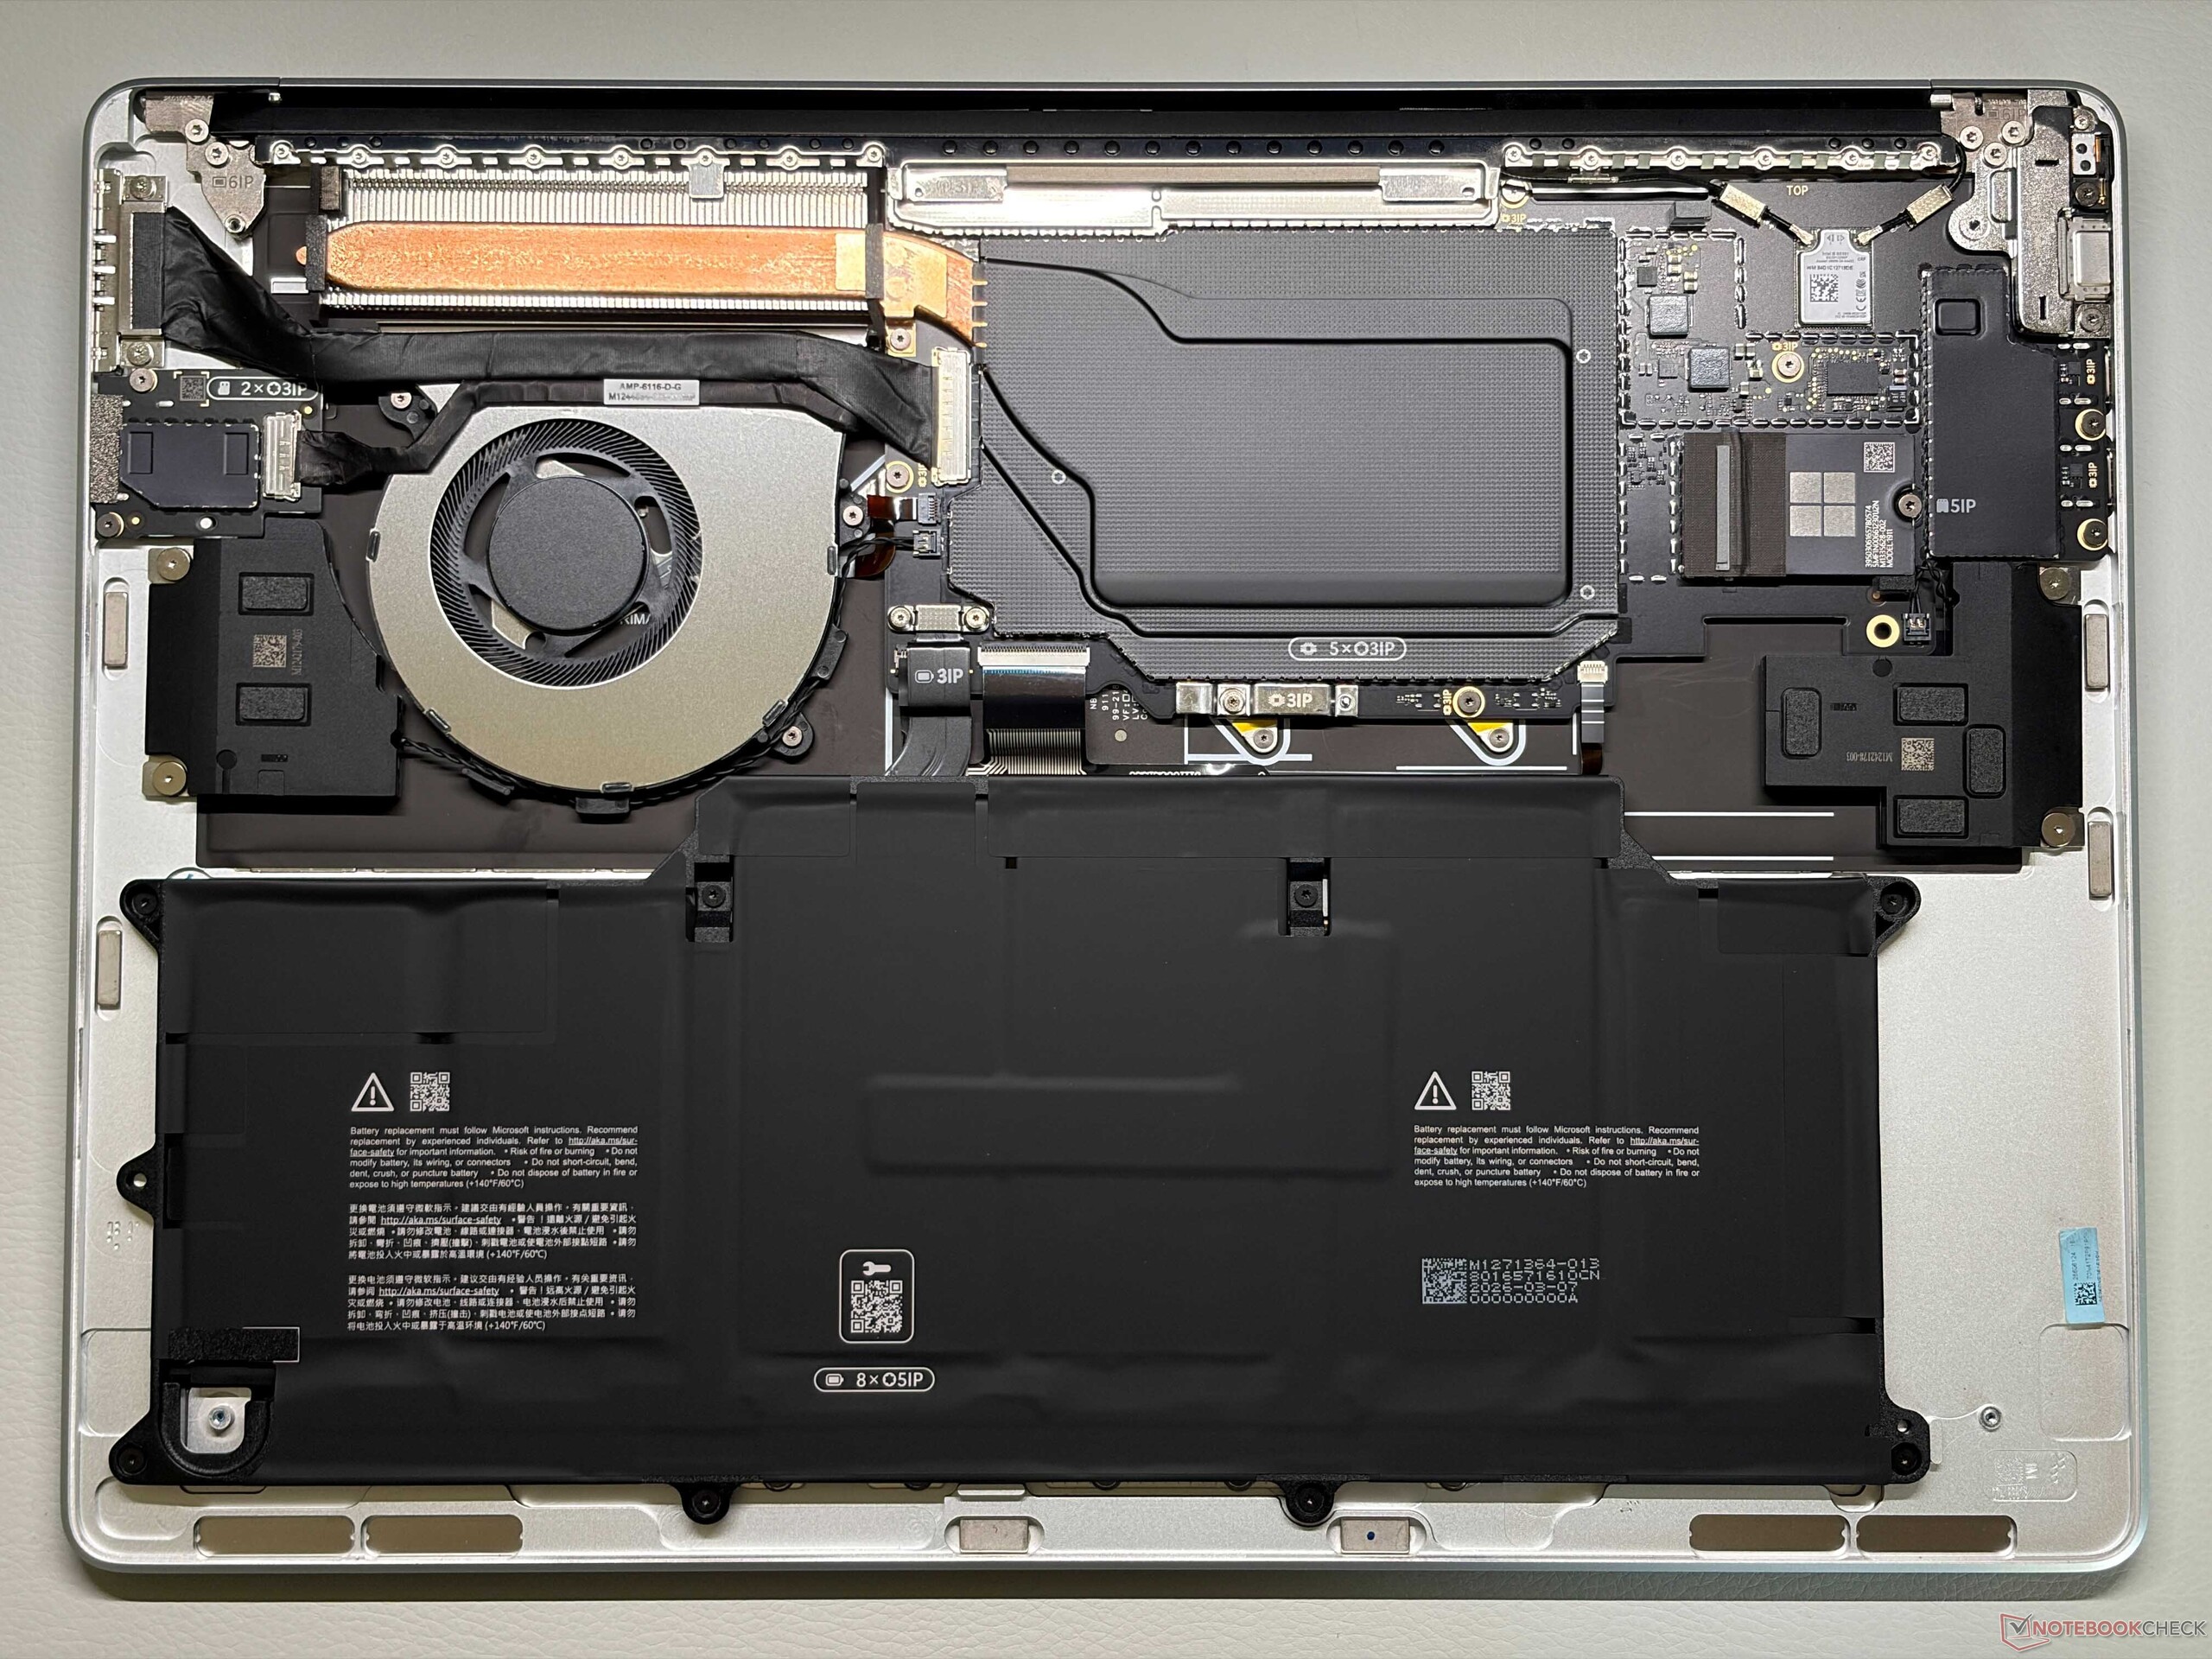
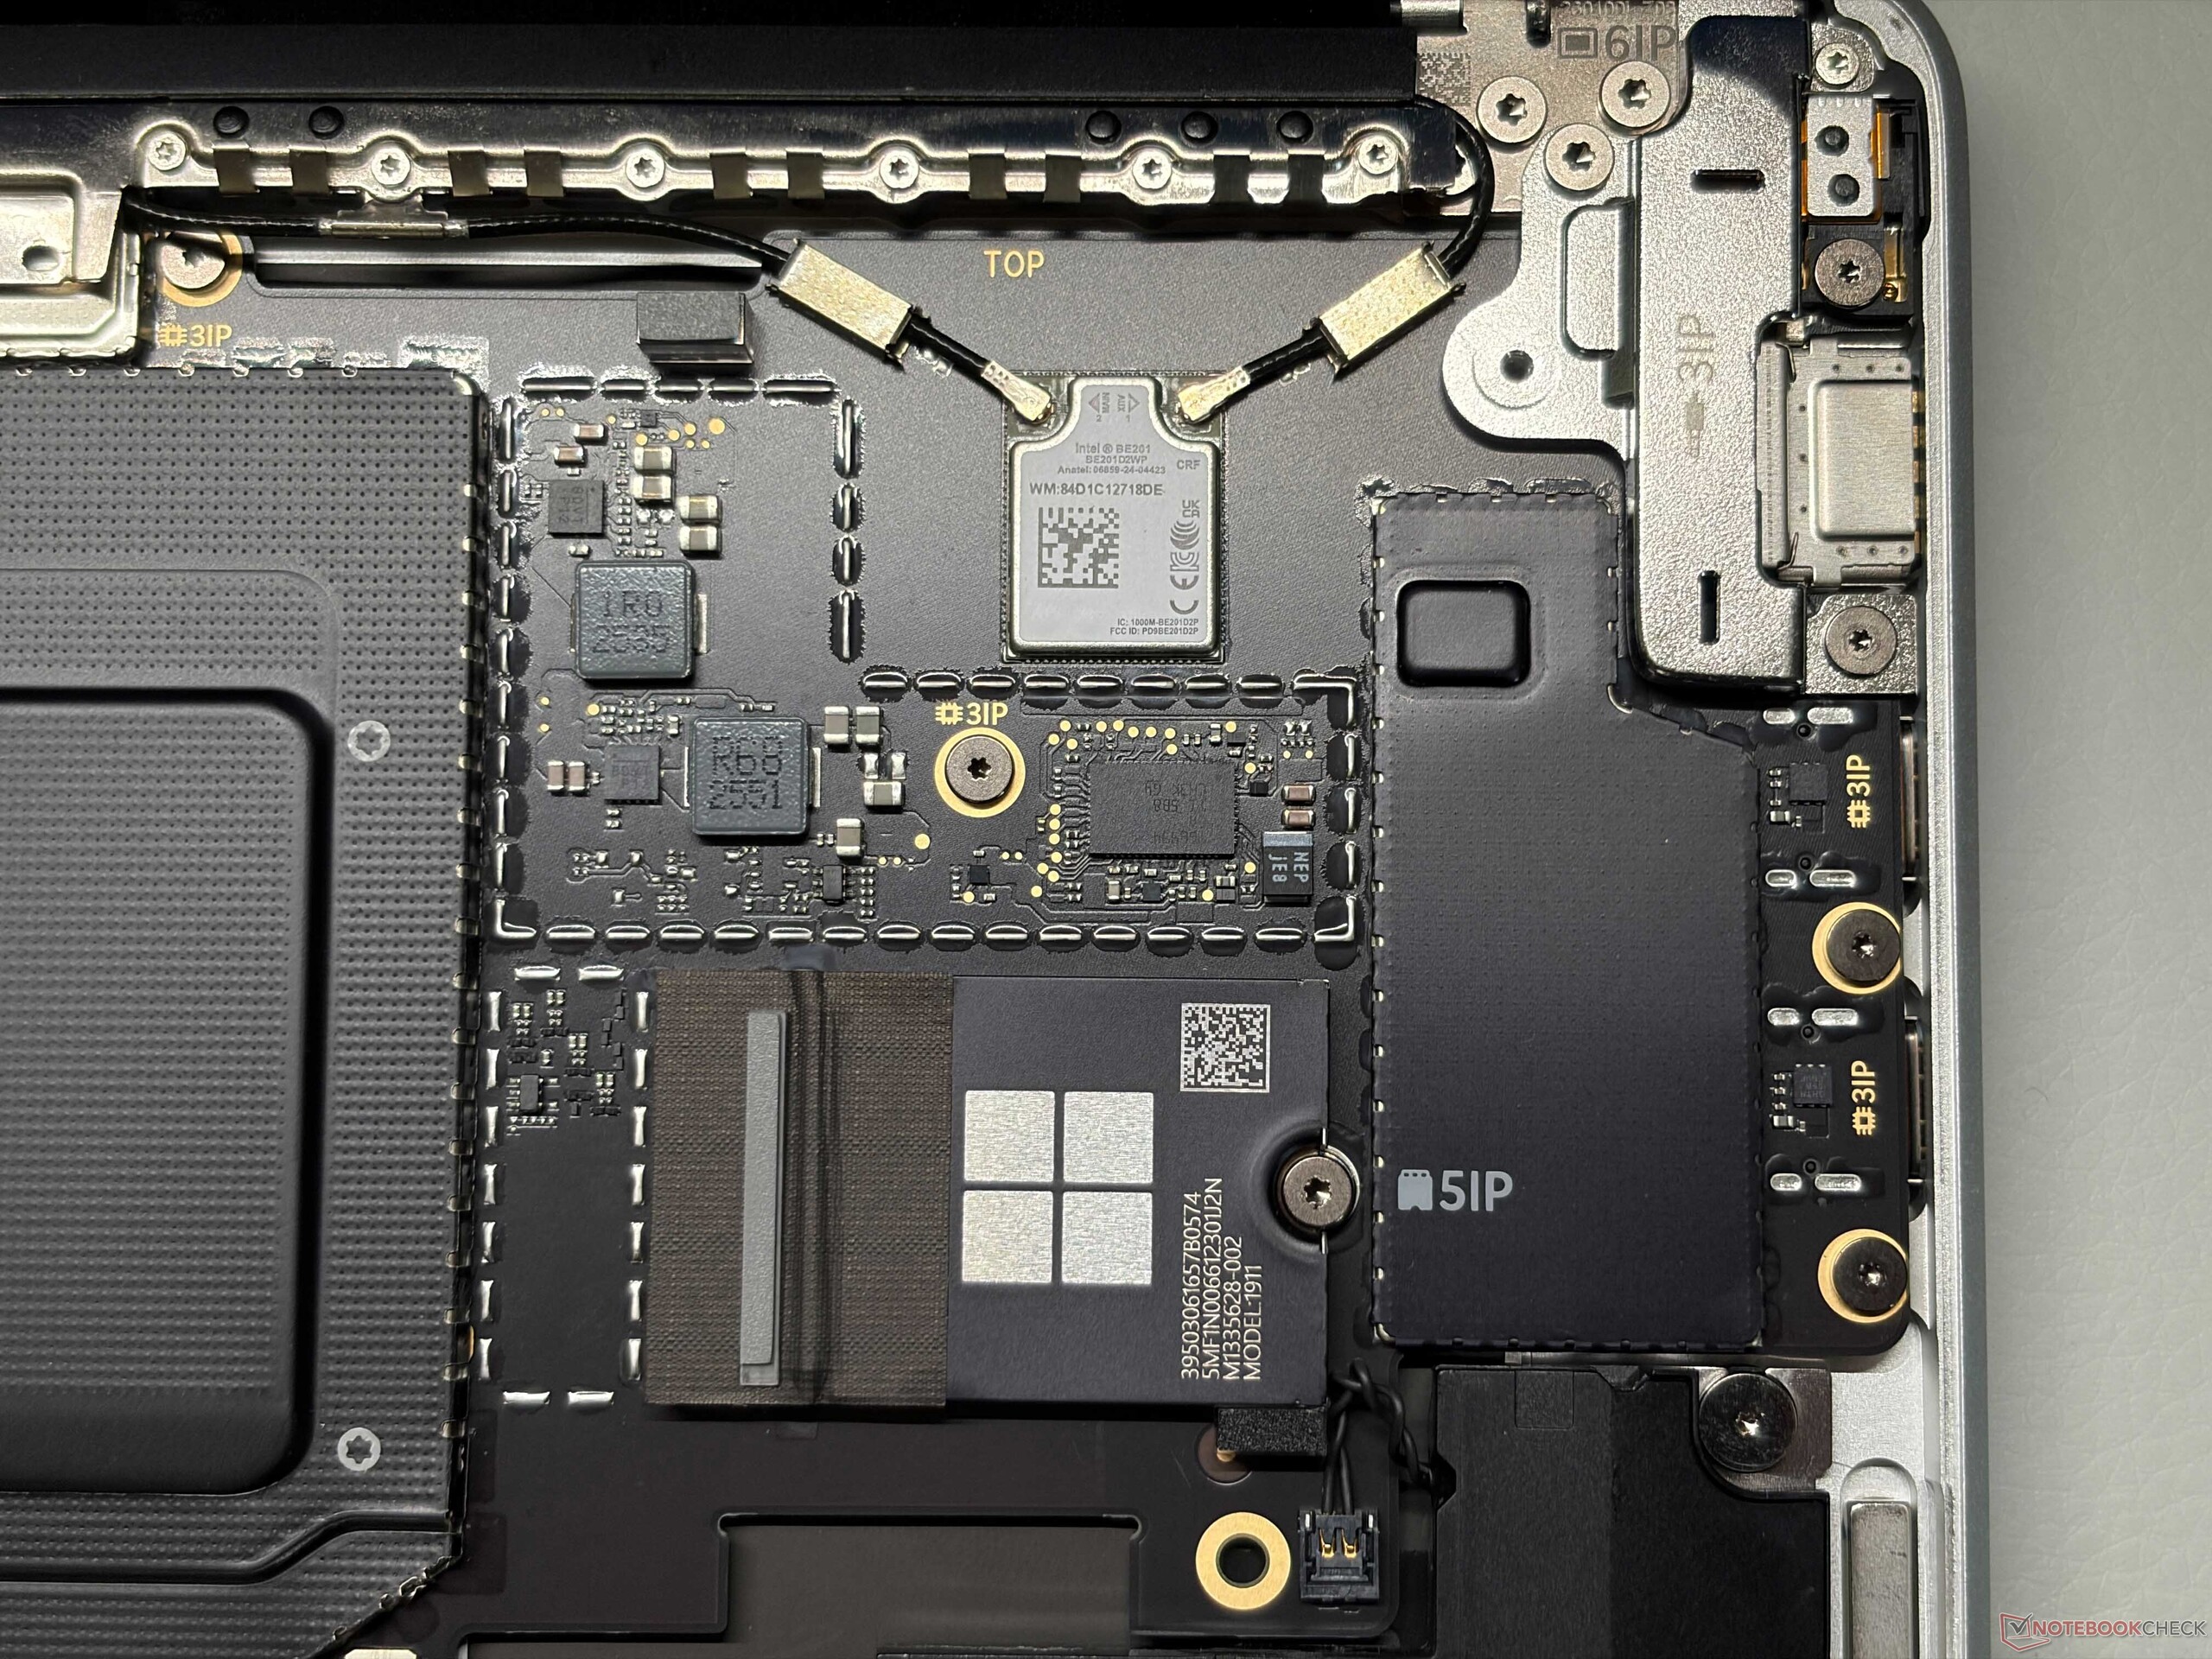
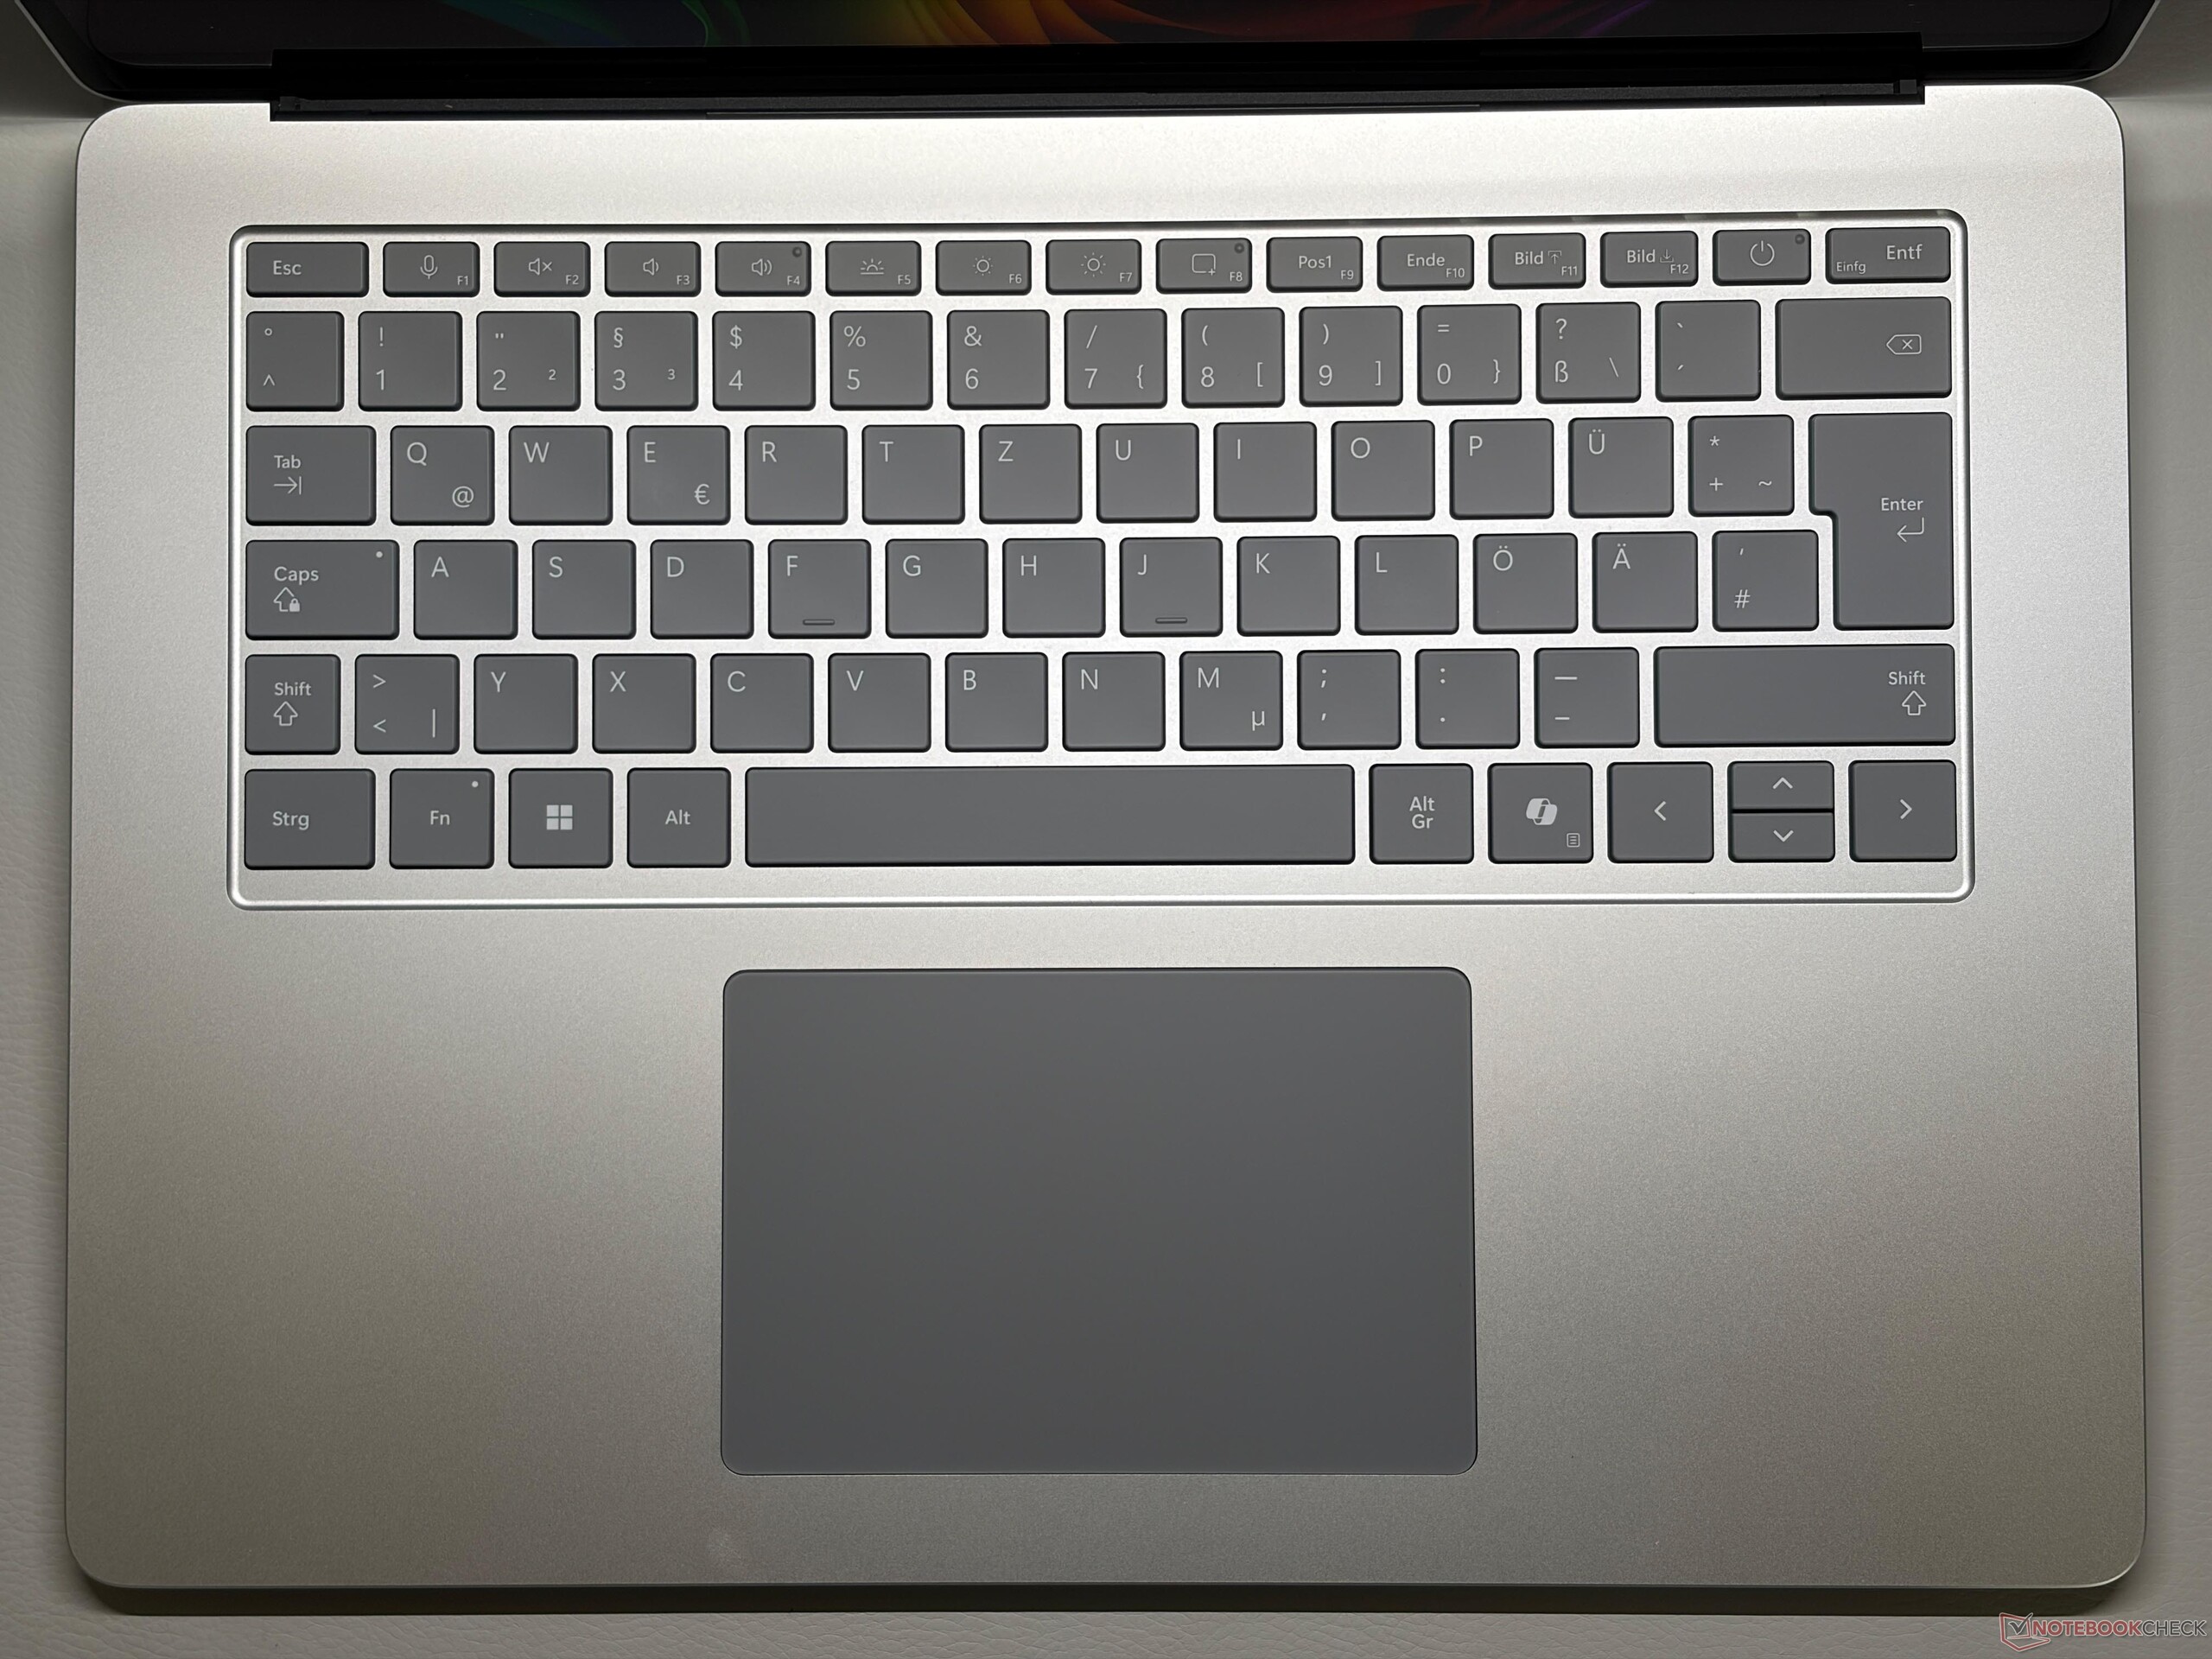
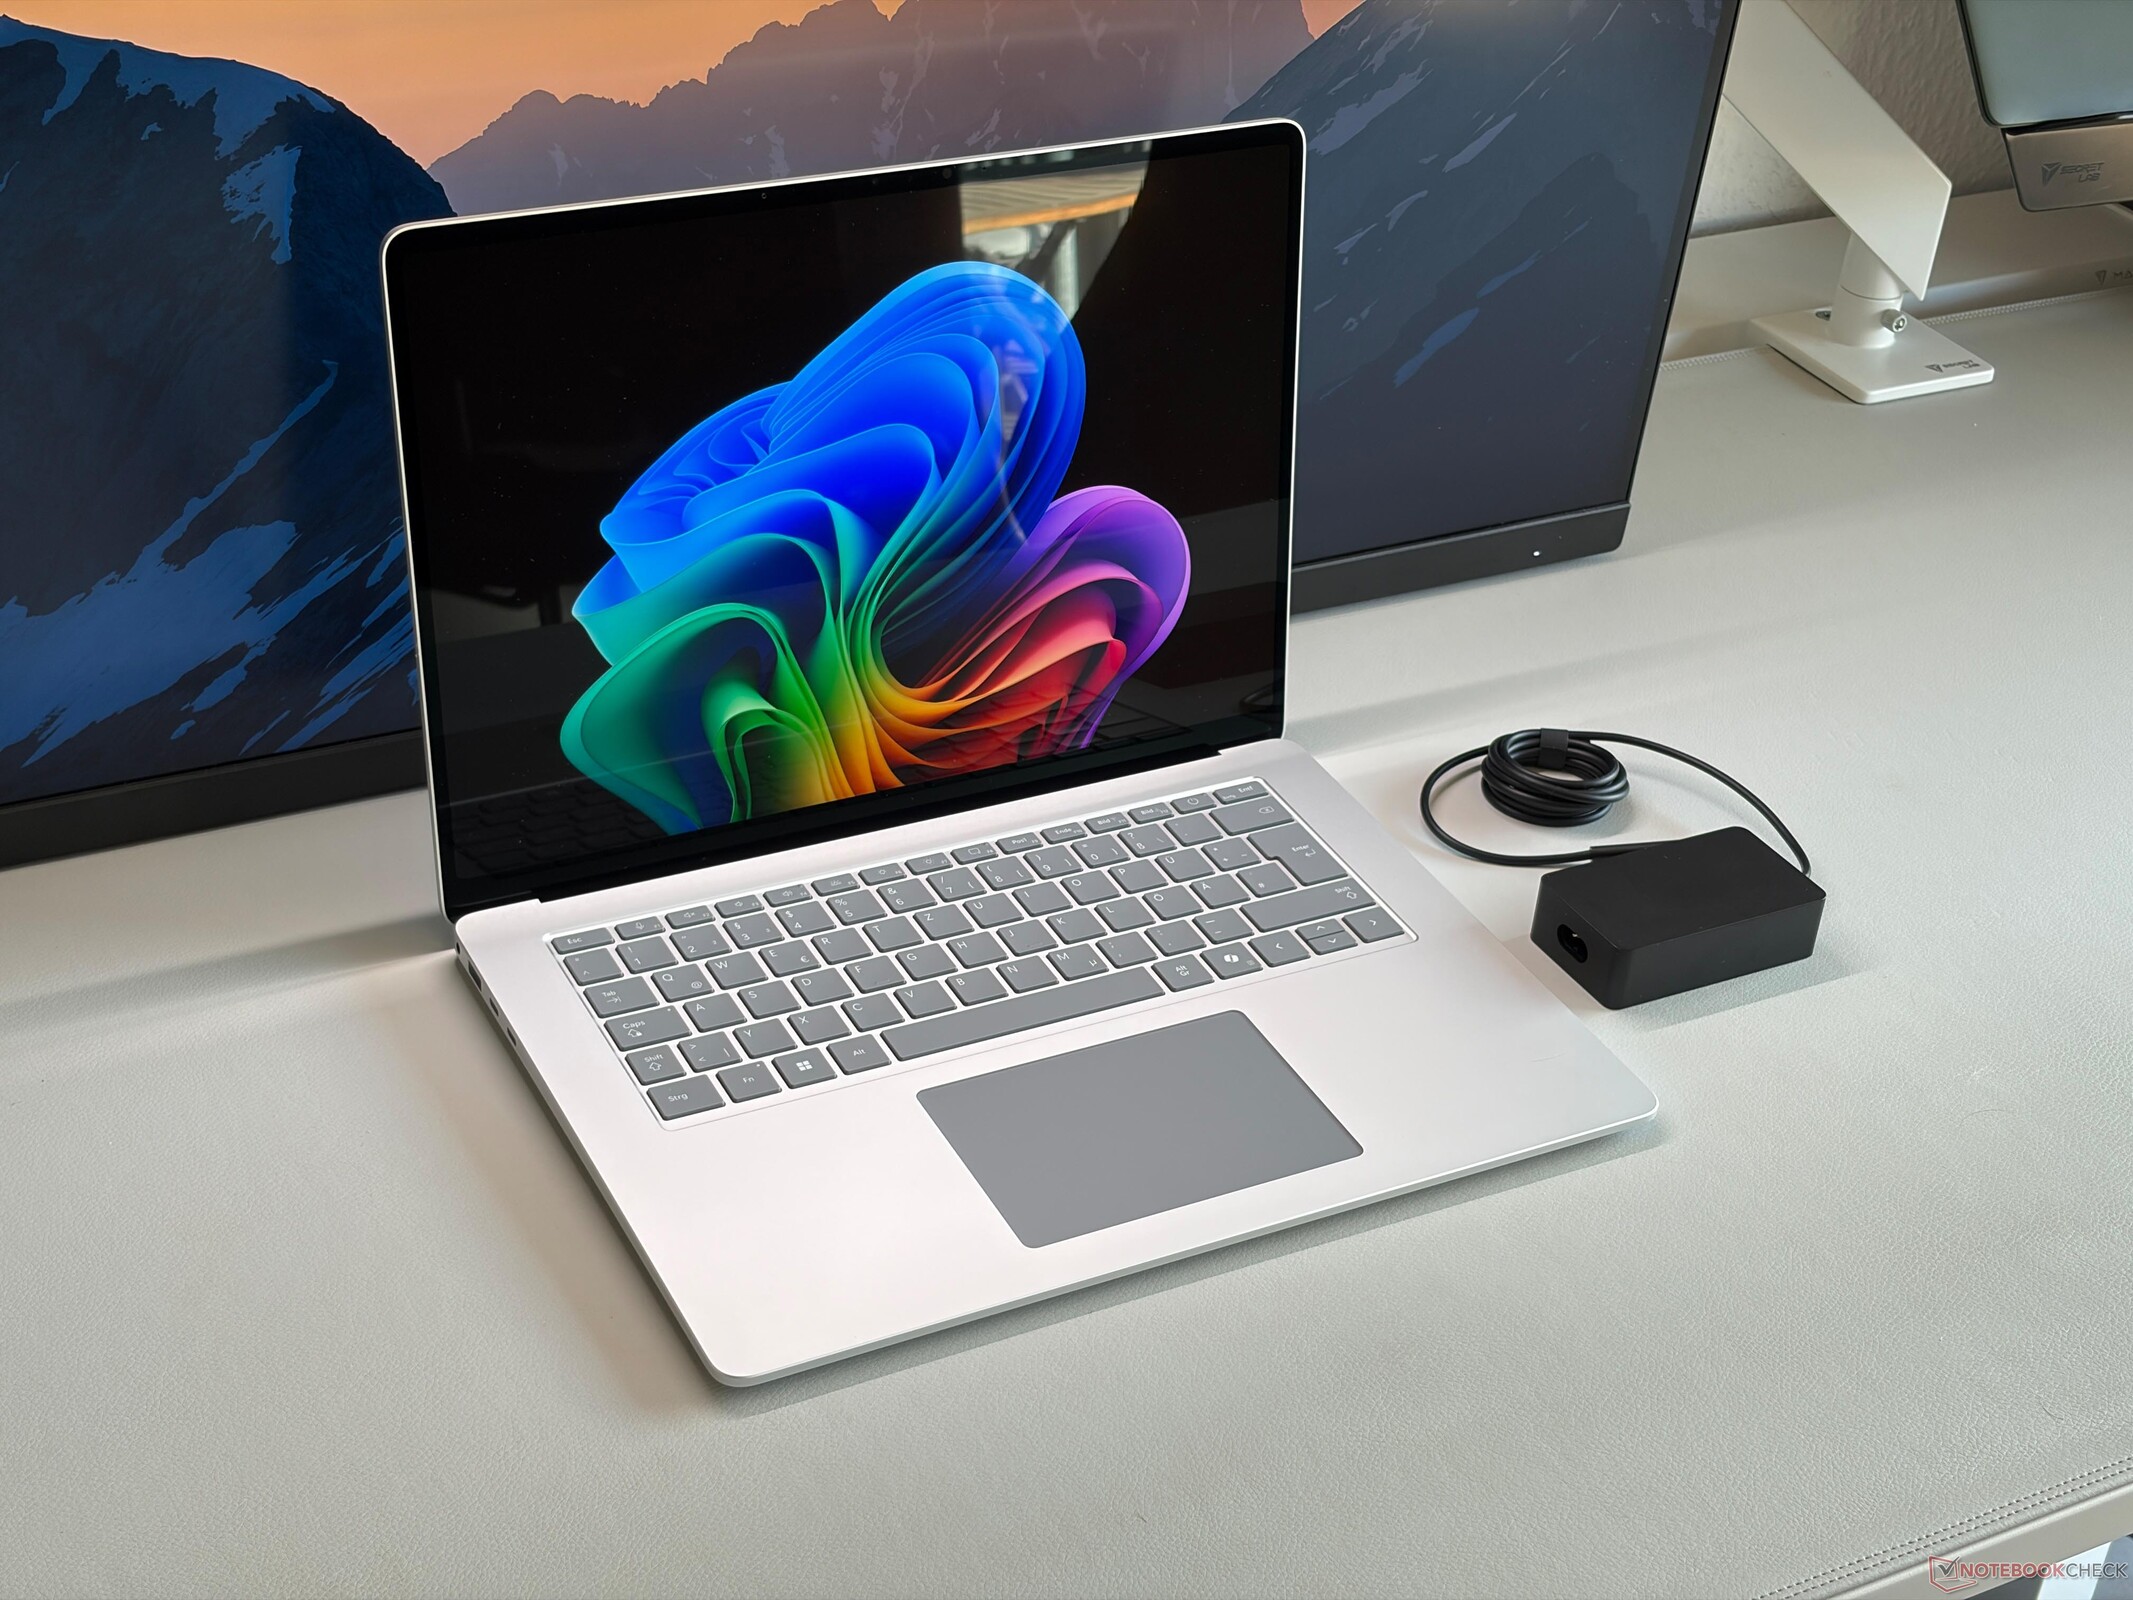
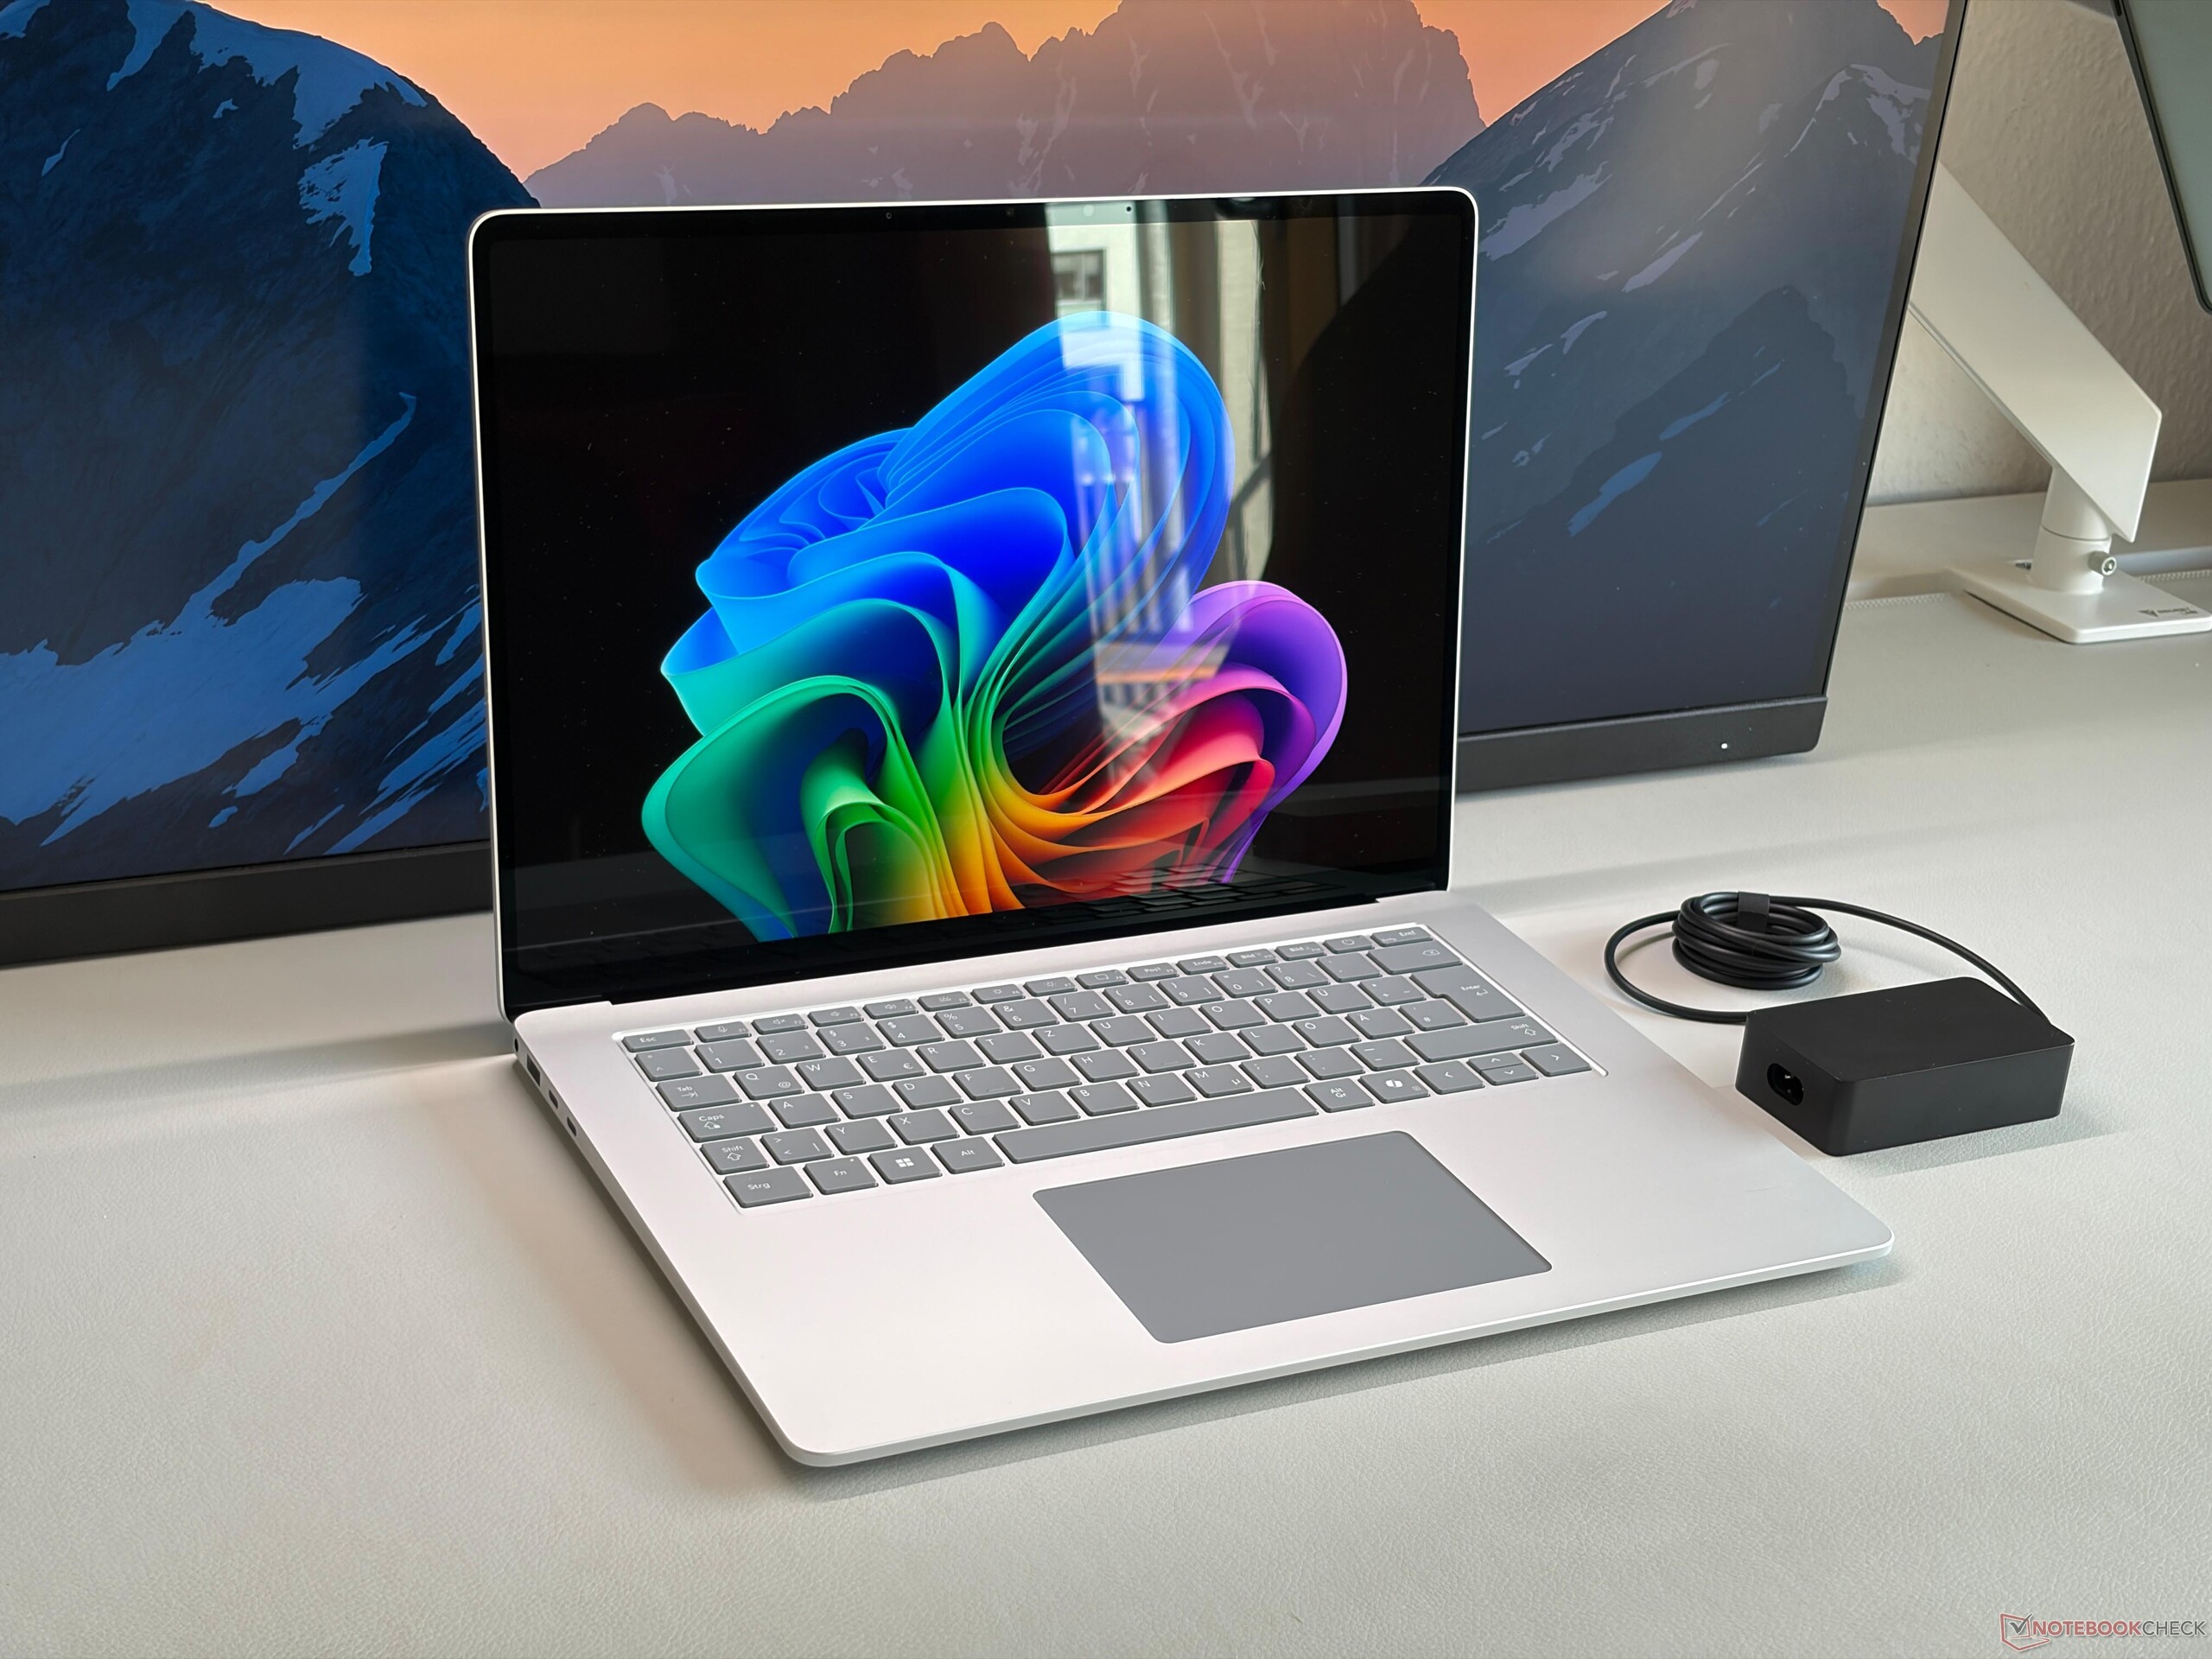
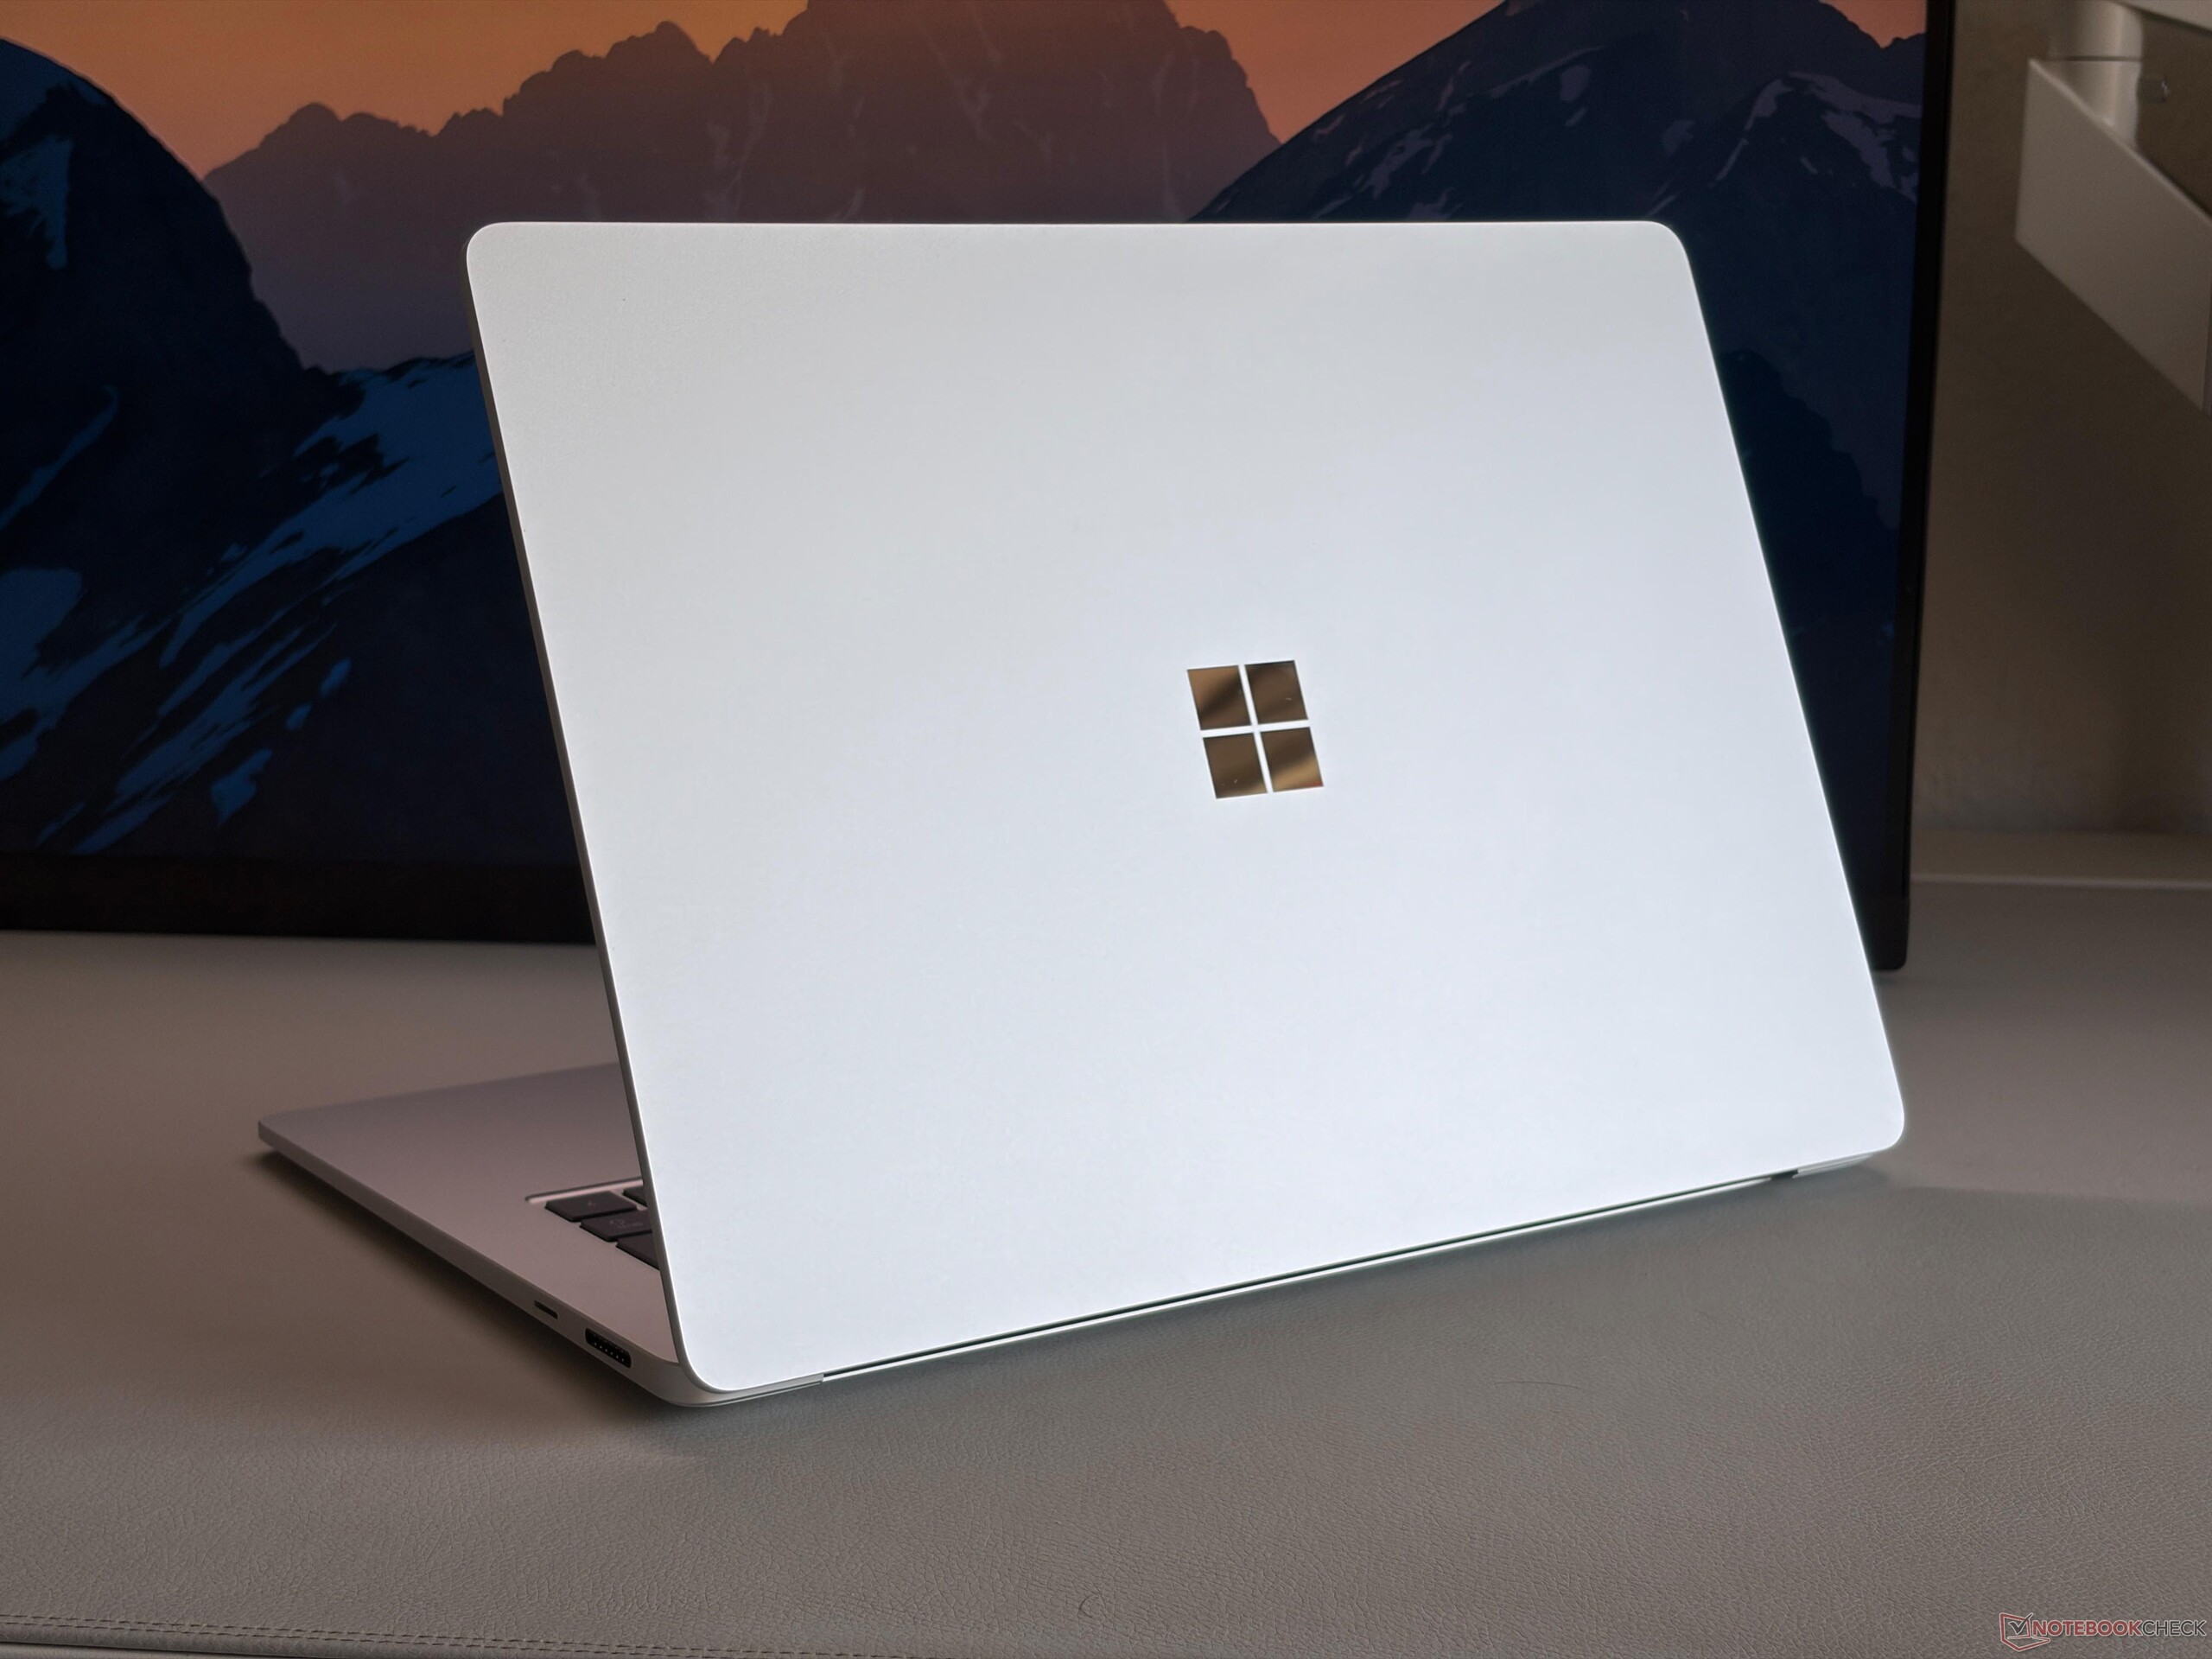
Microsoft non ha modificato lo chassis del Surface Laptop 15, quindi continua a offrire uno chassis in alluminio di alta qualità con un'eccellente stabilità e qualità costruttiva. L'esperienza di digitazione è molto confortevole e il trackpad aptico funziona molto bene, anche se potrebbe essere un po' più grande. Anche lo schermo è molto stabile, ma le cerniere potrebbero essere un po' più rigide. La nostra unità di prova argentata non mostra impronte digitali. I componenti interni sono facilmente accessibili e si può sostituire l'SSD M.2-2242, ma si nota anche molto spazio inutilizzato, che potrebbe essere sfruttato per porte aggiuntive, un normale SSD M.2-2280 o una ventola di raffreddamento aggiuntiva.

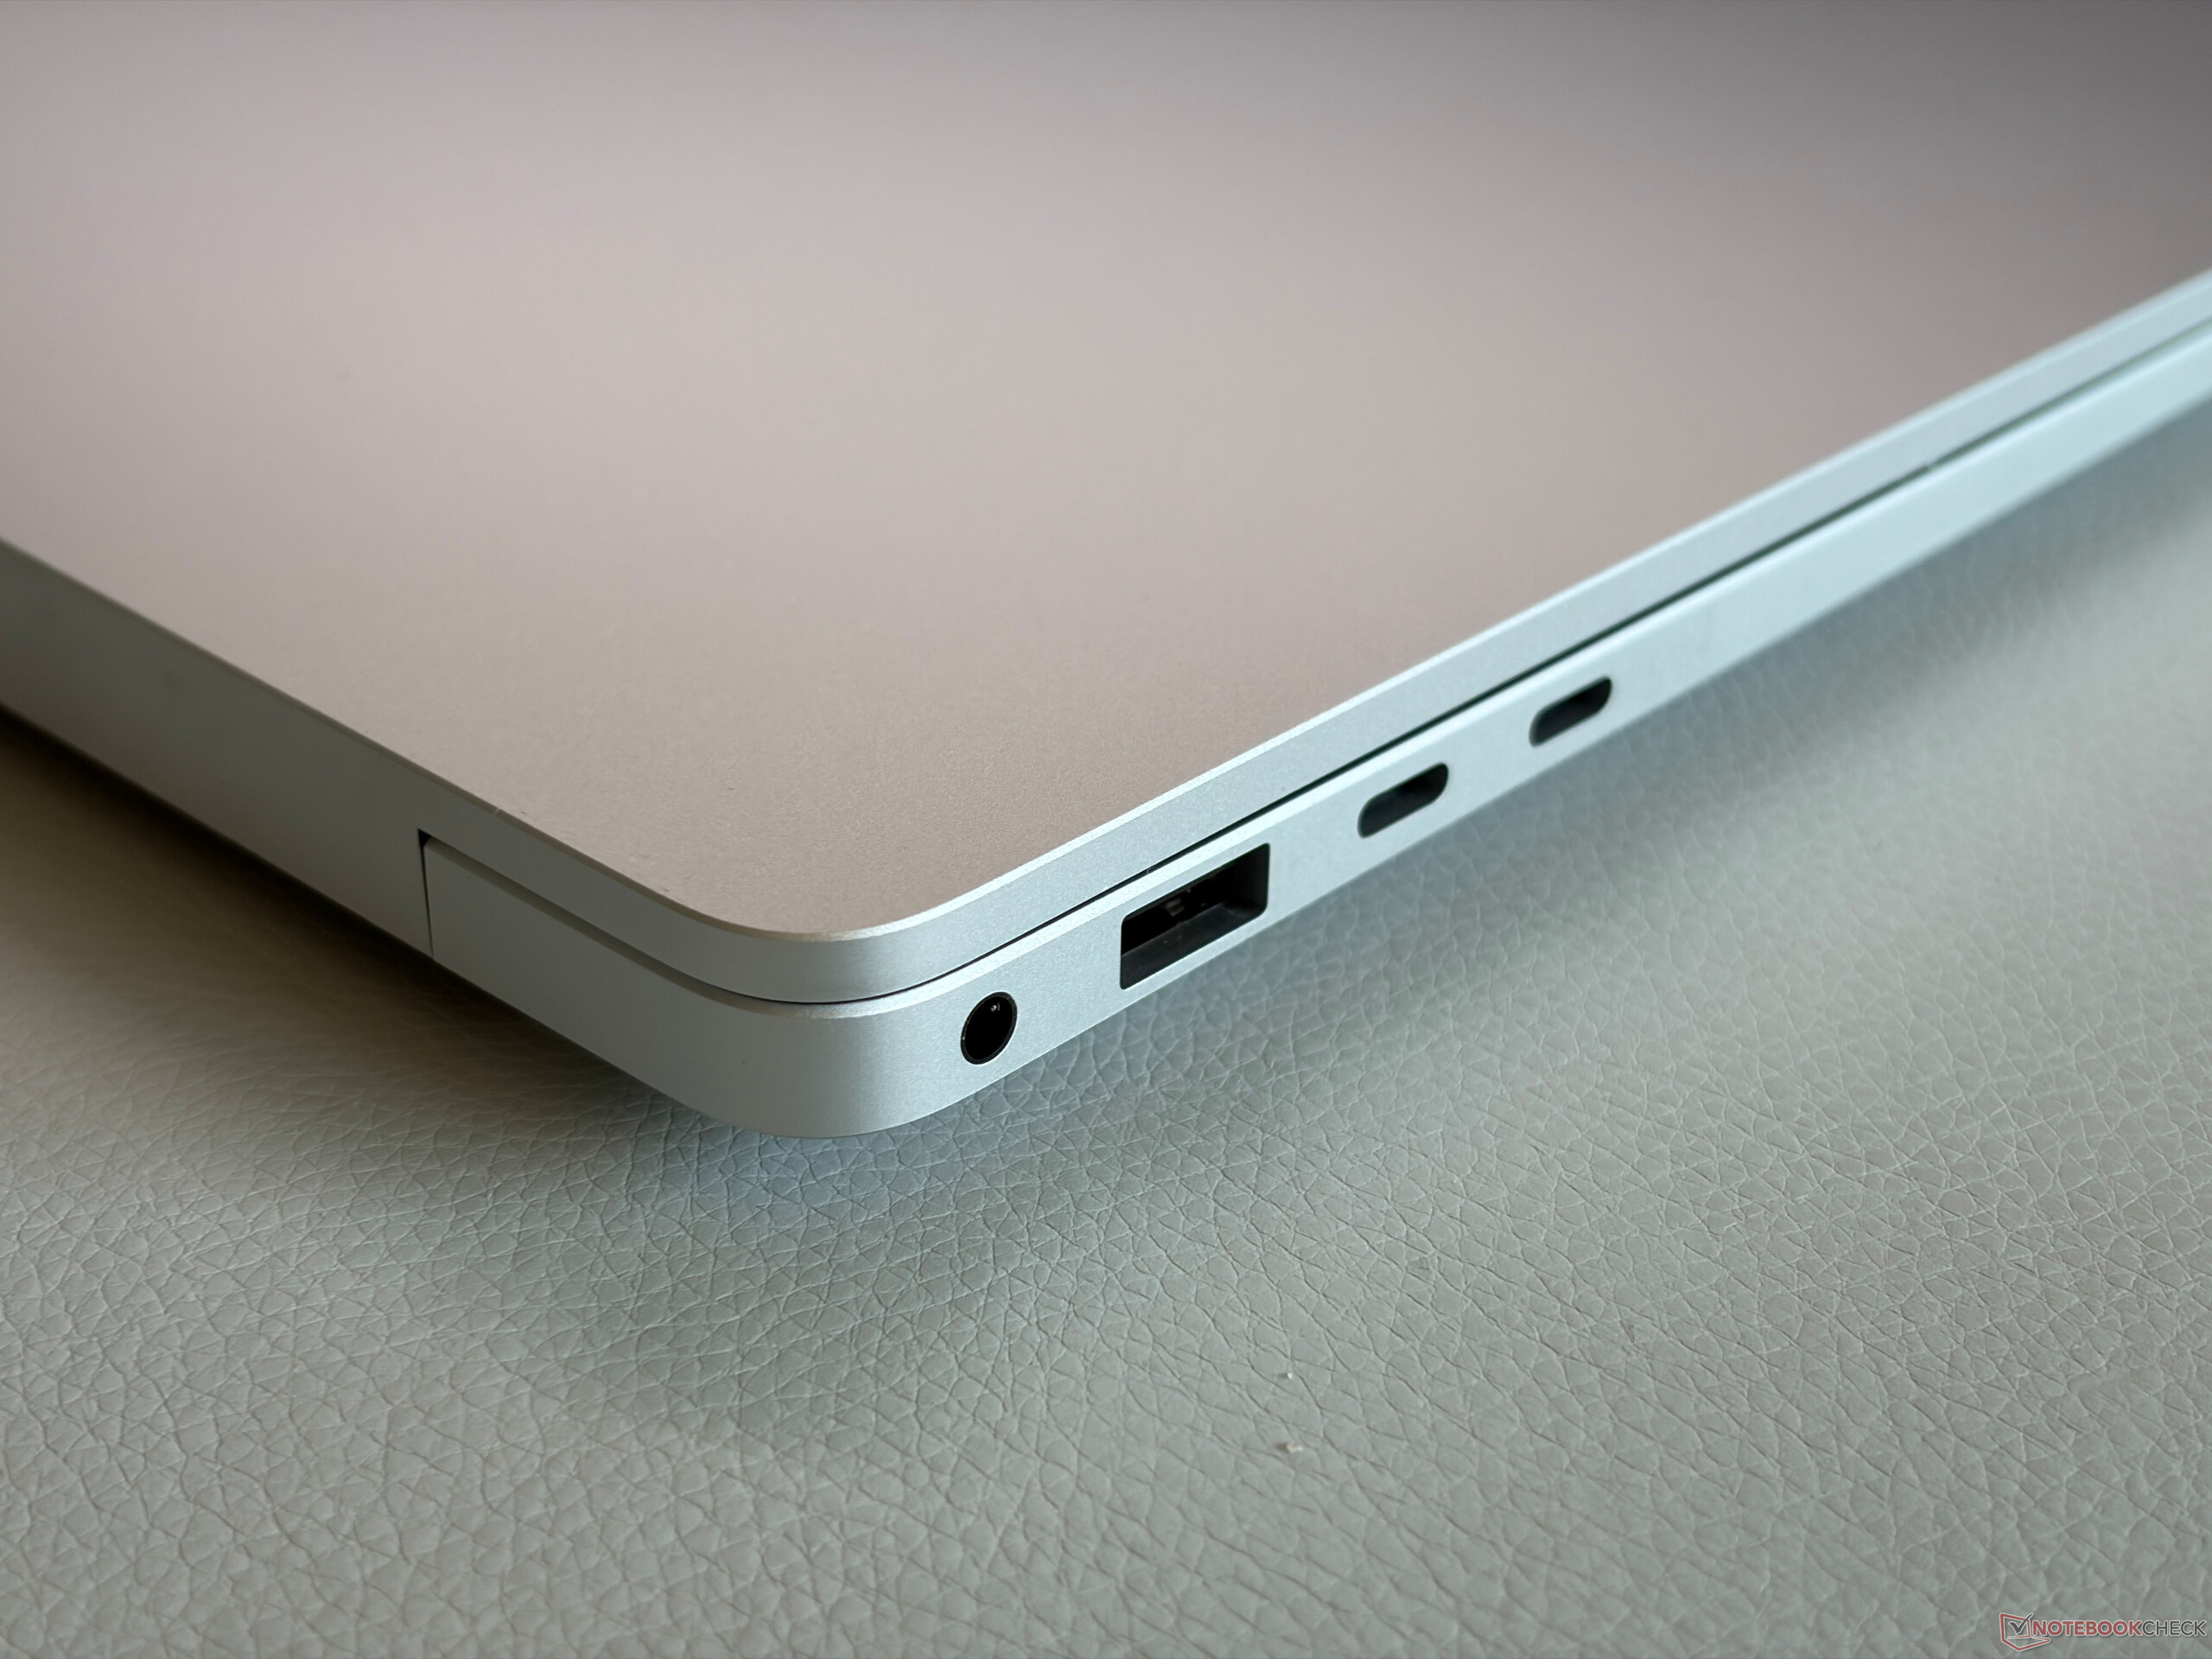
Il modello Intel offre due porte Thunderbolt 4 (il modello Snapdragon solo USB 4) e può persino essere dotato di un lettore di SmartCard. La porta Surface Connect sul lato destro è un po' obsoleta a nostro avviso ed è anche piuttosto grande; avremmo preferito una porta USB-C aggiuntiva e magari un normale lettore di schede SD. Il lettore microSD è comunque molto veloce (velocità di trasferimento fino a 834 MB/s) grazie al supporto SD-Express e la qualità della fotocamera è molto buona. Il modulo Wi-Fi 7 garantisce velocità di trasferimento stabili.
Confronto delle dimensioni

❌
353.5 mm 242.4 mm 16.5 mm 1.2 kg352.58 mm 237.47 mm 14.62 mm 1.7 kg339.5 mm 228.5 mm 18 mm 1.5 kg340.4 mm 237.6 mm 11.5 mm 1.5 kg329 mm 239 mm 18.3 mm 1.7 kg329 mm 239 mm 18.3 mm 1.7 kg297 mm 210 mm 1 mm 5.7 g
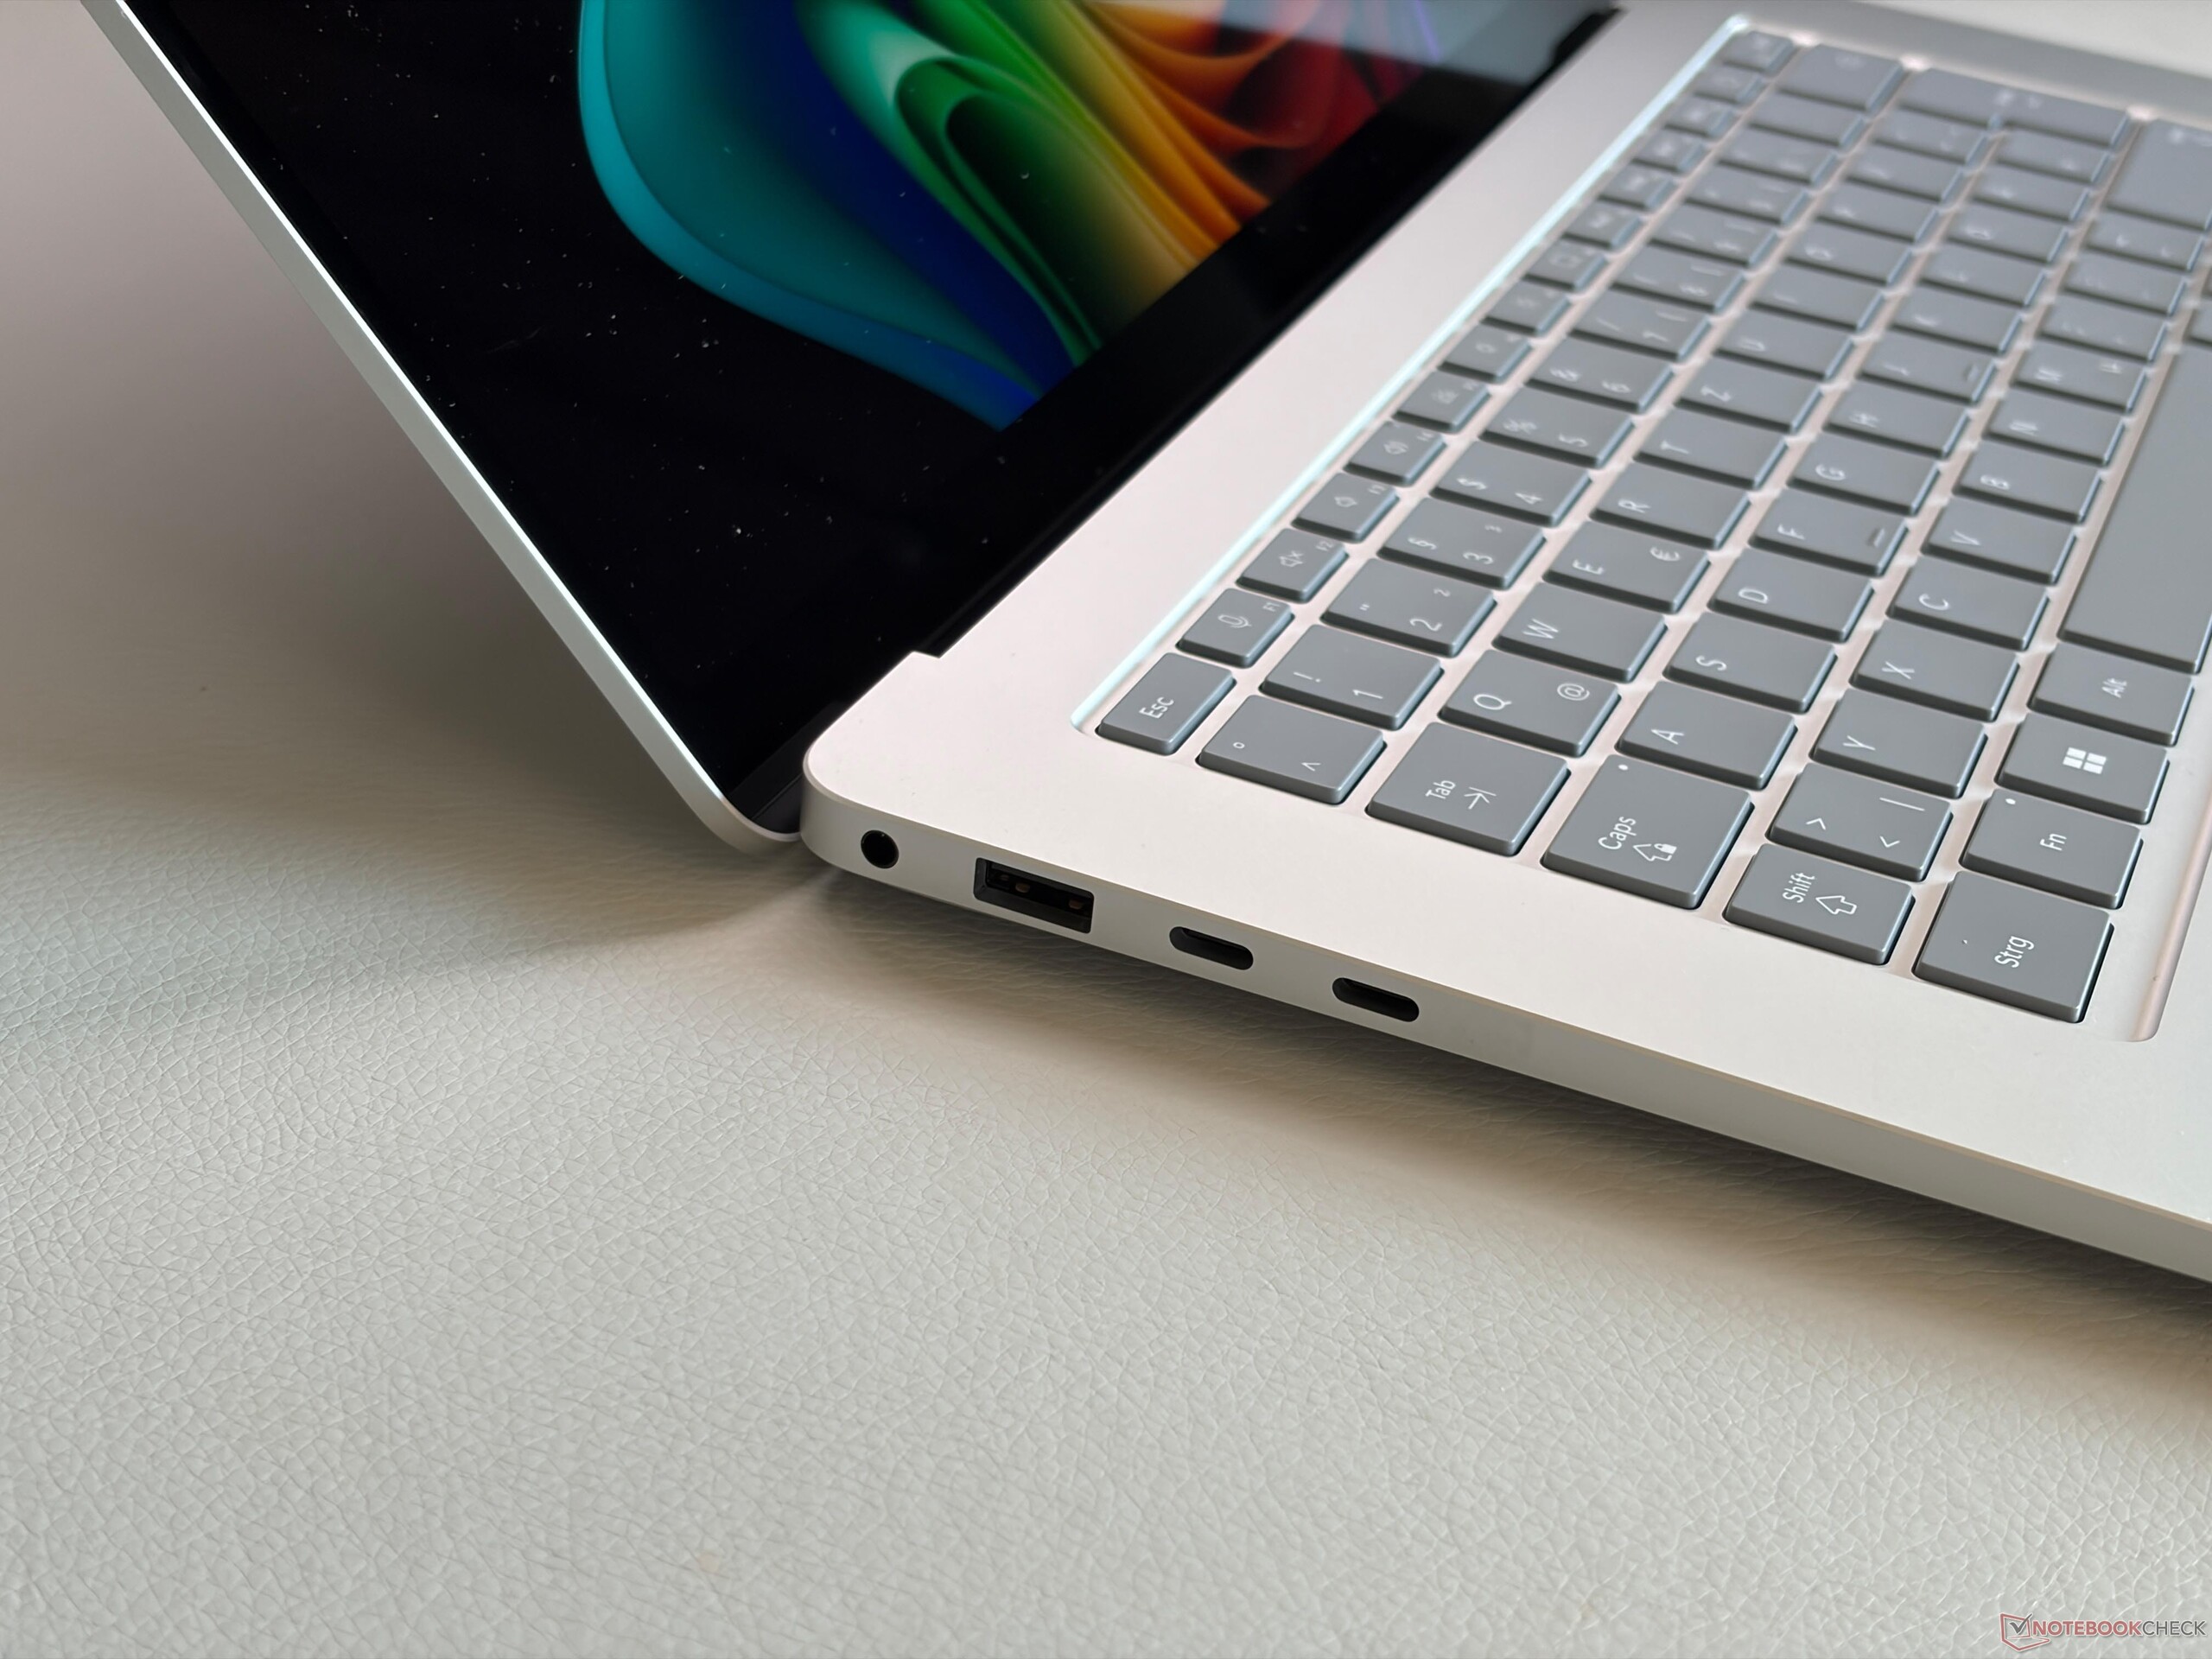
Sinistra: audio da 3,5 mm, USB-A 3.2 Gen 1 (5 Gbit/s), 2x USB-C 4.0 con Thunderbolt 4 (40 Gbit/s, DisplayPort ALT Mode 2.1, Power Delivery 3.0)
Destra: lettore di schede microSD-Express, porta Surface Connect
SD Card Reader
average JPG Copy Test (av. of 3 runs)
Microsoft Surface Laptop 15 Gen 8
Intel Core Ultra X7 368H (SanDisk microSD Express 256 GB)
567 MB/s
Asus Zenbook A16 UX3607
Qualcomm Snapdragon X2 Elite Extreme X2E-94-100 (Angelbird AV Pro V60)
211 MB/s -63%
Media della classe Multimedia
  (22.3 - 567, n=34, ultimi 2 anni)
140.2 MB/s -75%
Microsoft Surface Laptop 7 15 Lunar Lake
Intel Core Ultra 7 268V (Angelbird AV Pro V60)
86.2 MB/s -85%
Lenovo ThinkPad X9-15p Gen 1
Intel Core Ultra X7 358H
22.3 MB/s -96%
maximum AS SSD Seq Read Test (1GB)
Microsoft Surface Laptop 15 Gen 8
Intel Core Ultra X7 368H (SanDisk microSD Express 256 GB)
833.8 MB/s
Asus Zenbook A16 UX3607
Qualcomm Snapdragon X2 Elite Extreme X2E-94-100 (Angelbird AV Pro V60)
246.4 MB/s -70%
Media della classe Multimedia
  (37.3 - 1455, n=33, ultimi 2 anni)
218 MB/s -74%
Lenovo ThinkPad X9-15p Gen 1
Intel Core Ultra X7 358H
91.9 MB/s -89%
Microsoft Surface Laptop 7 15 Lunar Lake
Intel Core Ultra 7 268V (Angelbird AV Pro V60)
88.5 MB/s -89%
Networking
Microsoft Surface Laptop 15 Gen 8
Intel BE201 320MHz
iperf3 transmit Wi-Fi6/7 RT-BE96U
2440 (min: 2250) MBit/s ∼67%
iperf3 receive Wi-Fi6/7 RT-BE96U
2038 (min: 1980) MBit/s ∼71%
Lenovo ThinkPad X9-15p Gen 1
Intel Wi-Fi 7 BE211 320MHz
iperf3 transmit Wi-Fi6/7 RT-BE96U
3618 (min: 2749) MBit/s ∼100%
iperf3 receive Wi-Fi6/7 RT-BE96U
2878 (min: 2594) MBit/s ∼100%
Dell XPS 16 Core Ultra X7 358H
Intel Wi-Fi 7 BE211 320MHz
iperf3 receive AXE11000 6GHz
1735 (min: 1715) MBit/s ∼100%
iperf3 transmit AXE11000 6GHz
1619 (min: 1525) MBit/s ∼100%
iperf3 receive AXE11000
852 (min: 701) MBit/s ∼47%
iperf3 transmit AXE11000
875 (min: 459) MBit/s ∼49%
Apple MacBook Air 15 M5
Wi-Fi 7
iperf3 receive AXE11000
1827 (min: 1707) MBit/s ∼100%
iperf3 transmit AXE11000
1794 (min: 1717) MBit/s ∼100%
Microsoft Surface Laptop 7 15 Lunar Lake
Intel BE201 320MHz
iperf3 receive AXE11000
1562 (min: 1469) MBit/s ∼85%
iperf3 transmit AXE11000
1640 (min: 1449) MBit/s ∼91%
01002003004005006007008009001000110012001300140015001600170018001900200021002200230024002500Tooltip
Microsoft Surface Laptop 15 Gen 8; iperf3 transmit Wi-Fi6/7 RT-BE96U; iperf 3.1.3: Ø2440 (2250-2581) MBit/s
Microsoft Surface Laptop 15 Gen 8; iperf3 receive Wi-Fi6/7 RT-BE96U; iperf 3.1.3: Ø2038 (1980-2077) MBit/s
ColorChecker
10.8 ∆E
10.6 ∆E
14.9 ∆E
12.7 ∆E
10.3 ∆E
10.4 ∆E
9.7 ∆E
17.1 ∆E
13.9 ∆E
7.8 ∆E
11.8 ∆E
6.6 ∆E
9.7 ∆E
13.2 ∆E
18.6 ∆E
4.4 ∆E
12.9 ∆E
15.9 ∆E
5 ∆E
4.9 ∆E
8.6 ∆E
9.4 ∆E
4.3 ∆E
4.2 ∆E
ColorChecker Microsoft Surface Laptop 15 Gen 8: 10.32 ∆E min: 4.22 - max: 18.55 ∆E

Display - touchscreen IPS con risoluzione più elevata

Matrice di subpixel
Matrice di subpixel
Solo lievi perdite di luce dalla retroilluminazione

Microsoft ha aggiornato il touchscreen IPS lucido. Il rapporto d'aspetto è ancora 3:2, ma la risoluzione è più elevata, pari a 3270 x 2180 pixel. La qualità percepita dell'immagine è molto buona, con immagini nitide e colori ricchi, ma la profondità dei neri ovviamente non può competere con quella dei rivali OLED. Il pannello supporta 120 Hz, ma notiamo ancora un po' di ghosting a causa dei tempi di risposta lenti. Non è presente sfarfallio PWM e nemmeno il backlight bleeding rappresenta un problema. Lo schermo è molto lucido, il che costituisce una vera sfida all'aperto e in ambienti luminosi. Sia la luminosità sia il colore possono essere regolati automaticamente.

La nostra analisi con il software professionale CalMAN rivela colori accurati già con le impostazioni di fabbrica (profili accurati per sRGB e P3) e il rapporto di contrasto è migliore di quello dichiarato, pari a ~1800:1, ma la luminosità massima è inferiore rispetto al modello dell'anno scorso. Misuriamo fino a 537 nit e 520 in media. L'HDR è supportato, ma la luminosità non aumenta.

530
cd/m²
516
cd/m²
505
cd/m²
533
cd/m²
537
cd/m²
505
cd/m²
534
cd/m²
525
cd/m²
498
cd/m²
Distribuzione della luminosità
LP150UD2-SPA1 testato con X-Rite i1Pro 3
Massima: 537 cd/m² (Nits) Media: 520.3 cd/m² Minimum: 1.7 cd/m²
Distribuzione della luminosità: 93 %
Al centro con la batteria: 537 cd/m²
Contrasto: 1852:1 (Nero: 0.29 cd/m²)
ΔE ColorChecker Calman: 1 | ∀{0.5-29.43 Ø4.69}
ΔE Greyscale Calman: 1.6 | ∀{0.09-98 Ø4.94}
86.3% AdobeRGB 1998 (Argyll 3D)
100% sRGB (Argyll 3D)
97.9% Display P3 (Argyll 3D)
Gamma: 2.2
CCT: 6804 K
Microsoft Surface Laptop 15 Gen 8
LP150UD2-SPA1, IPS, 3270x2180, 15", 120 Hz
Lenovo ThinkPad X9-15p Gen 1
ATNA53JB03-0, OLED, 2880x1800, 15.3", 120 Hz
Asus Zenbook A16 UX3607
ATNA60HR07-0, OLED, 2880x1800, 16", 120 Hz
Dell XPS 16 Core Ultra X7 358H
LG Philips 160WV1, OLED, 3200x2000, 16", 120 Hz
Apple MacBook Air 15 M5
IPS, 2880x1864, 15.3", 60 Hz
Microsoft Surface Laptop 7 15 Lunar Lake
LQ150P1JX61, IPS, 2496x1664, 15", 120 Hz
Display
3%
2%
5%
-1%
0%
HDR Peak Brightness (cd/m²)
518
Display P3 Coverage (%)
97.9
99.1
1%
99.8
2%
99.5
2%
97.5
0%
98.1
0%
sRGB Coverage (%)
100
100
0%
100
0%
100
0%
98.3
-2%
100
0%
AdobeRGB 1998 Coverage (%)
86.3
94.3
9%
89
3%
96.5
12%
86.3
0%
87.2
1%
Response Times
96%
97%
98%
34%
30%
Response Time Grey 50% / Grey 80% * (ms)
45.7
1.1 ?(0.5, 0.6)
98%
2 ?(1, 1)
96%
0.65 ?(0.36, 0.29)
99%
26.9 ?(13.4, 13.5)
41%
33.4 ?(12.5, 20.9)
27%
Response Time Black / White * (ms)
21.5
1.4 ?(0.7, 0.7)
93%
0.48 ?(0.23, 0.25)
98%
0.87 ?(0.43, 0.44)
96%
15.9 ?(4.9, 11)
26%
14.7 ?(5.5, 9.2)
32%
PWM Frequency (Hz)
1194 ?(100)
960 ?(100)
240.2 ?(100)
PWM Amplitude * (%)
35
56
31
Screen
-112%
152%
-95%
-46%
18%
Brightness middle (cd/m²)
537
489
-9%
493
-8%
395.4
-26%
538
0%
599
12%
Brightness (cd/m²)
520
492
-5%
495
-5%
392
-25%
521
0%
590
13%
Brightness Distribution (%)
93
98
5%
98
5%
95
2%
90
-3%
93
0%
Black Level * (cd/m²)
0.29
0.02
93%
0.44
-52%
0.4
-38%
Contrast (:1)
1852
24650
1231%
1223
-34%
1498
-19%
Colorchecker dE 2000 *
1
4.6
-360%
1.1
-10%
3.69
-269%
2.1
-110%
0.5
50%
Colorchecker dE 2000 max. *
2.4
8.2
-242%
3.9
-63%
7.94
-231%
4.1
-71%
0.9
62%
Greyscale dE 2000 *
1.6
2.6
-63%
2.1
-31%
1.9
-19%
3.1
-94%
0.6
63%
Gamma
2.2 100%
2.18 101%
2.15 102%
2.28 96%
2.19 100%
2.16 102%
CCT
6804 96%
6334 103%
6544 99%
6274 104%
7075 92%
6543 99%
Colorchecker dE 2000 calibrated *
5
0.68
0.7
Media totale (Programma / Settaggio)
-4% / -43%
84% / 109%
3% / -33%
-4% / -23%
16% / 16%

* ... Meglio usare valori piccoli

Scala di grigi CalMAN
CalMAN Colorchecker
CalMAN Colorchecker
rispetto a sRGB
rispetto a sRGB
vs. P3
vs. P3
vs. AdobeRGB
vs. AdobeRGB

Tempi di risposta del Display

ℹ
I tempi di risposta del display mostrano quanto sia veloce lo schermo a cambaire da un colore all'altro. Tempi di risposta lenti possono creare sovrapposizioni negloi oggetti in movimento. Specialmente i giocatori patiti del 3D dovrebbero usare uno schermo con tempi di risposta bassi.
   ↔    Tempi di risposta dal Nero al Bianco
21.5 ms ... aumenta ↗ e diminuisce ↘ combinato↗ ms Incremento
↘ ms Calo
Lo schermo mostra buoni tempi di risposta durante i nostri tests, ma potrebbe essere troppo lento per i gamers competitivi.
In confronto, tutti i dispositivi di test variano da 0.1 (minimo) a 240 (massimo) ms. » 48 % di tutti i dispositivi è migliore.
Questo significa che i tempi di risposta rilevati sono simili alla media di tutti i dispositivi testati (19.7 ms).
   ↔    Tempo di risposta dal 50% Grigio all'80% Grigio
45.7 ms ... aumenta ↗ e diminuisce ↘ combinato↗ ms Incremento
↘ ms Calo
Lo schermo mostra tempi di risposta lenti nei nostri tests e sarà insoddisfacente per i gamers.
In confronto, tutti i dispositivi di test variano da 0.13 (minimo) a 636 (massimo) ms. » 79 % di tutti i dispositivi è migliore.
Questo significa che i tempi di risposta rilevati sono peggiori rispetto alla media di tutti i dispositivi testati (30.7 ms).

Sfarfallio dello schermo / PWM (Pulse-Width Modulation)

ℹ
Per ridurre la luminosità dello schermo, alcuni portatili accendono e spengono la retroilluminazione in rapida successione - un metodo chiamato Pulse Width Modulation (PWM). Questa frequenza di ciclo a livello ideale non dovrebbe essere percepibile dall'occhi umano. Se tale frequenza è troppo bassa, gli utenti con occhi sensibili potrebbero stancarsi gli occhi o avere mal di testa o anche notare uno sfarfallio.
flickering dello schermo / PWM non rilevato

In confronto: 52 % di tutti i dispositivi testati non utilizza PWM per ridurre la luminosita' del display. Se è rilevato PWM, una media di 7611 (minimo: 5 - massimo: 343500) Hz è stata rilevata.

Al sole
Al sole
All'aperto (giornata luminosa, senza luce solare diretta)
Angoli di visione
Angoli di visione

Prestazioni - Intel Core Ultra X7
Condizioni di test

Abbiamo utilizzato la modalità Prestazioni migliori per i nostri benchmark e le nostre misurazioni.

Processor Performance

The Intel Core Ultra X7 368H is one of the fastest Panther Lake mobile processors and it can consume 65/35 Watts. This is not great for a 15-inch laptop and the multi-core performance could be a bit better. However, Panther Lake has a bigger focus on efficiency and not raw multi-core performance. The performance is very similar to the Dell XPS 16 with comparable power limits. The Snapdragon model uses Snapdragon X2 Plus or X2 Elite (X2E-78-100) CPUs, which should offer slightly more multi-core CPU performance. 

CPU Performance rating: Percent
Cinebench 2024: CPU Multi Core | CPU Single Core
Geekbench 6.7: Multi-Core | Single-Core
CPU Performance rating
Asus Zenbook A16 UX3607
Qualcomm Snapdragon X2 Elite Extreme X2E-94-100
91.8 pt
Apple MacBook Air 15 M5
Apple M5 10-Core
82 pt
Lenovo ThinkPad X9-15p Gen 1 -2!
Intel Core Ultra X7 358H
70.9 pt
Microsoft Surface Pro 13 OLED
Qualcomm Snapdragon X2 Elite X2E-78-100
67.9 pt
Media della classe Multimedia
 
67.1 pt
Microsoft Surface Laptop 15 Gen 8
Intel Core Ultra X7 368H
65.6 pt
Dell XPS 16 Core Ultra X7 358H
Intel Core Ultra X7 358H
65.3 pt
Media Intel Core Ultra X7 368H
 
65 pt
Microsoft Surface Laptop 8 13.8
Qualcomm Snapdragon X2 Plus X2P-64-100
63.8 pt
Microsoft Surface Laptop 7 15 Lunar Lake
Intel Core Ultra 7 268V
53.3 pt
Cinebench 2024 / CPU Multi Core
Asus Zenbook A16 UX3607
Qualcomm Snapdragon X2 Elite Extreme X2E-94-100
1761 Points +83%
Media della classe Multimedia
  (327 - 2490, n=61, ultimi 2 anni)
1120 Points +17%
Microsoft Surface Pro 13 OLED
Qualcomm Snapdragon X2 Elite X2E-78-100
1078 Points +12%
Media Intel Core Ultra X7 368H
  (960 - 1104, n=2)
1032 Points +8%
Dell XPS 16 Core Ultra X7 358H
Intel Core Ultra X7 358H
1004 Points +5%
Apple MacBook Air 15 M5
Apple M5 10-Core
962 Points 0%
Microsoft Surface Laptop 15 Gen 8
Intel Core Ultra X7 368H
960 Points
Microsoft Surface Laptop 8 13.8
Qualcomm Snapdragon X2 Plus X2P-64-100
854 Points -11%
Microsoft Surface Laptop 7 15 Lunar Lake
Intel Core Ultra 7 268V
600 Points -37%
Cinebench 2024 / CPU Single Core
Apple MacBook Air 15 M5
Apple M5 10-Core
199 Points +57%
Asus Zenbook A16 UX3607
Qualcomm Snapdragon X2 Elite Extreme X2E-94-100
151 Points +19%
Microsoft Surface Laptop 8 13.8
Qualcomm Snapdragon X2 Plus X2P-64-100
134 Points +5%
Microsoft Surface Pro 13 OLED
Qualcomm Snapdragon X2 Elite X2E-78-100
133 Points +5%
Media della classe Multimedia
  (72.5 - 201, n=55, ultimi 2 anni)
130.6 Points +3%
Media Intel Core Ultra X7 368H
  (127.1 - 128.8, n=2)
128 Points +1%
Microsoft Surface Laptop 15 Gen 8
Intel Core Ultra X7 368H
127.1 Points
Dell XPS 16 Core Ultra X7 358H
Intel Core Ultra X7 358H
123.7 Points -3%
Microsoft Surface Laptop 7 15 Lunar Lake
Intel Core Ultra 7 268V
123.3 Points -3%
Geekbench 6.7 / Multi-Core
Asus Zenbook A16 UX3607
Qualcomm Snapdragon X2 Elite Extreme X2E-94-100
23204 Points +37%
Apple MacBook Air 15 M5
Apple M5 10-Core
16995 Points 0%
Dell XPS 16 Core Ultra X7 358H
Intel Core Ultra X7 358H
16943 Points 0%
Microsoft Surface Laptop 15 Gen 8
Intel Core Ultra X7 368H
16943 Points
Lenovo ThinkPad X9-15p Gen 1
Intel Core Ultra X7 358H
16876 Points 0%
Media della classe Multimedia
  (4983 - 30057, n=61, ultimi 2 anni)
15748 Points -7%
Media Intel Core Ultra X7 368H
  (12050 - 17352, n=4)
15438 Points -9%
Microsoft Surface Pro 13 OLED
Qualcomm Snapdragon X2 Elite X2E-78-100
15102 Points -11%
Microsoft Surface Laptop 8 13.8
Qualcomm Snapdragon X2 Plus X2P-64-100
14277 Points -16%
Microsoft Surface Laptop 7 15 Lunar Lake
Intel Core Ultra 7 268V
11279 Points -33%
Geekbench 6.7 / Single-Core
Apple MacBook Air 15 M5
Apple M5 10-Core
4195 Points +41%
Asus Zenbook A16 UX3607
Qualcomm Snapdragon X2 Elite Extreme X2E-94-100
3826 Points +28%
Microsoft Surface Pro 13 OLED
Qualcomm Snapdragon X2 Elite X2E-78-100
3287 Points +10%
Microsoft Surface Laptop 8 13.8
Qualcomm Snapdragon X2 Plus X2P-64-100
3265 Points +10%
Media della classe Multimedia
  (1591 - 4336, n=61, ultimi 2 anni)
2990 Points 0%
Microsoft Surface Laptop 15 Gen 8
Intel Core Ultra X7 368H
2980 Points
Media Intel Core Ultra X7 368H
  (2924 - 2983, n=3)
2962 Points -1%
Dell XPS 16 Core Ultra X7 358H
Intel Core Ultra X7 358H
2903 Points -3%
Lenovo ThinkPad X9-15p Gen 1
Intel Core Ultra X7 358H
2901 Points -3%
Microsoft Surface Laptop 7 15 Lunar Lake
Intel Core Ultra 7 268V
2871 Points -4%

Cinebench R15 Multi Loop

075150225300375450525600675750825900975105011251200127513501425150015751650172518001875195020252100217522502325240024752550262527002775285029253000307531503225330033753450352536003675Tooltip
Microsoft Surface Laptop 15 Gen 8 Intel Core Ultra X7 368H: Ø2462 (2121.79-3156.32) Points
Lenovo ThinkPad X9-15p Gen 1 Intel Core Ultra X7 358H: Ø2913 (2846.57-3015.45) Points
Asus Zenbook A16 UX3607 Qualcomm Snapdragon X2 Elite Extreme X2E-94-100: Ø3638 (3524.54-3682.9) Points
Dell XPS 16 Core Ultra X7 358H Intel Core Ultra X7 358H: Ø2543 (2491.75-2985.52) Points
Microsoft Surface Laptop 7 15 Lunar Lake Intel Core Ultra 7 268V: Ø1469 (1435.9-1615.7) Points
CPU Performance rating: Percent
Cinebench R23: Multi Core | Single Core
Cinebench R20: CPU (Multi Core) | CPU (Single Core)
Cinebench R15: CPU Multi 64Bit | CPU Single 64Bit
Blender: v2.79 BMW27 CPU
7-Zip 18.03: 7z b 4 | 7z b 4 -mmt1
HWBOT x265 Benchmark v2.2: 4k Preset
LibreOffice : 20 Documents To PDF
R Benchmark 2.5: Overall mean
CPU Performance rating
Lenovo ThinkPad X9-15p Gen 1
Intel Core Ultra X7 358H
77.9 pt
Media Intel Core Ultra X7 368H
 
76.2 pt
Microsoft Surface Laptop 15 Gen 8
Intel Core Ultra X7 368H
75.8 pt
Dell XPS 16 Core Ultra X7 358H
Intel Core Ultra X7 358H
75.2 pt
Media della classe Multimedia
 
69.1 pt
Asus Zenbook A16 UX3607 -1!
Qualcomm Snapdragon X2 Elite Extreme X2E-94-100
68.9 pt
Microsoft Surface Laptop 7 15 Lunar Lake
Intel Core Ultra 7 268V
53.1 pt
Cinebench R23 / Multi Core
Lenovo ThinkPad X9-15p Gen 1
Intel Core Ultra X7 358H
19360 Points +14%
Asus Zenbook A16 UX3607
Qualcomm Snapdragon X2 Elite Extreme X2E-94-100
19037 Points +12%
Dell XPS 16 Core Ultra X7 358H
Intel Core Ultra X7 358H
17884 (15984.6min - 17883.7max) Points +5%
Media Intel Core Ultra X7 368H
  (17052 - 17350, n=2)
17201 Points +1%
Microsoft Surface Laptop 15 Gen 8
Intel Core Ultra X7 368H
17052 Points
Media della classe Multimedia
  (4861 - 33362, n=60, ultimi 2 anni)
17050 Points 0%
Microsoft Surface Laptop 7 15 Lunar Lake
Intel Core Ultra 7 268V
10535 Points -38%
Cinebench R23 / Single Core
Media Intel Core Ultra X7 368H
  (2140 - 2169, n=2)
2155 Points +1%
Microsoft Surface Laptop 15 Gen 8
Intel Core Ultra X7 368H
2140 Points
Dell XPS 16 Core Ultra X7 358H
Intel Core Ultra X7 358H
2087 Points -2%
Lenovo ThinkPad X9-15p Gen 1
Intel Core Ultra X7 358H
2080 Points -3%
Media della classe Multimedia
  (1237 - 2459, n=59, ultimi 2 anni)
1982 Points -7%
Microsoft Surface Laptop 7 15 Lunar Lake
Intel Core Ultra 7 268V
1910 Points -11%
Asus Zenbook A16 UX3607
Qualcomm Snapdragon X2 Elite Extreme X2E-94-100
1622 Points -24%
Cinebench R20 / CPU (Multi Core)
Lenovo ThinkPad X9-15p Gen 1
Intel Core Ultra X7 358H
7531 Points +13%
Media Intel Core Ultra X7 368H
  (6681 - 7938, n=2)
7310 Points +9%
Asus Zenbook A16 UX3607
Qualcomm Snapdragon X2 Elite Extreme X2E-94-100
7298 Points +9%
Dell XPS 16 Core Ultra X7 358H
Intel Core Ultra X7 358H
7195 Points +8%
Microsoft Surface Laptop 15 Gen 8
Intel Core Ultra X7 368H
6681 Points
Media della classe Multimedia
  (1887 - 12912, n=51, ultimi 2 anni)
6585 Points -1%
Microsoft Surface Laptop 7 15 Lunar Lake
Intel Core Ultra 7 268V
4129 Points -38%
Cinebench R20 / CPU (Single Core)
Media Intel Core Ultra X7 368H
  (809 - 820, n=2)
815 Points +1%
Microsoft Surface Laptop 15 Gen 8
Intel Core Ultra X7 368H
809 Points
Lenovo ThinkPad X9-15p Gen 1
Intel Core Ultra X7 358H
785 Points -3%
Dell XPS 16 Core Ultra X7 358H
Intel Core Ultra X7 358H
780 Points -4%
Media della classe Multimedia
  (482 - 833, n=51, ultimi 2 anni)
744 Points -8%
Microsoft Surface Laptop 7 15 Lunar Lake
Intel Core Ultra 7 268V
736 Points -9%
Asus Zenbook A16 UX3607
Qualcomm Snapdragon X2 Elite Extreme X2E-94-100
620 Points -23%
Cinebench R15 / CPU Multi 64Bit
Asus Zenbook A16 UX3607
Qualcomm Snapdragon X2 Elite Extreme X2E-94-100
3683 (3524.54min - 3682.9max) Points +17%
Microsoft Surface Laptop 15 Gen 8
Intel Core Ultra X7 368H
3156 (2121.79min - 3156.32max) Points
Media Intel Core Ultra X7 368H
  (2976 - 3156, n=2)
3066 Points -3%
Lenovo ThinkPad X9-15p Gen 1
Intel Core Ultra X7 358H
3015 (2846.57min - 3015.45max) Points -4%
Dell XPS 16 Core Ultra X7 358H
Intel Core Ultra X7 358H
2986 (2491.75min - 2985.52max) Points -5%
Media della classe Multimedia
  (856 - 5224, n=56, ultimi 2 anni)
2713 Points -14%
Microsoft Surface Laptop 7 15 Lunar Lake
Intel Core Ultra 7 268V
1616 (1435.9min - 1615.7max) Points -49%
Cinebench R15 / CPU Single 64Bit
Media Intel Core Ultra X7 368H
  (308 - 323, n=2)
316 Points +3%
Microsoft Surface Laptop 15 Gen 8
Intel Core Ultra X7 368H
308 Points
Dell XPS 16 Core Ultra X7 358H
Intel Core Ultra X7 358H
304 Points -1%
Asus Zenbook A16 UX3607
Qualcomm Snapdragon X2 Elite Extreme X2E-94-100
303 Points -2%
Lenovo ThinkPad X9-15p Gen 1
Intel Core Ultra X7 358H
299 Points -3%
Microsoft Surface Laptop 7 15 Lunar Lake
Intel Core Ultra 7 268V
287 Points -7%
Media della classe Multimedia
  (184.8 - 326, n=53, ultimi 2 anni)
285 Points -7%
Blender / v2.79 BMW27 CPU
Microsoft Surface Laptop 7 15 Lunar Lake
Intel Core Ultra 7 268V
337 Seconds * -66%
Media della classe Multimedia
  (100 - 557, n=52, ultimi 2 anni)
239 Seconds * -18%
Microsoft Surface Laptop 15 Gen 8
Intel Core Ultra X7 368H
203 Seconds *
Dell XPS 16 Core Ultra X7 358H
Intel Core Ultra X7 358H
196 Seconds * +3%
Media Intel Core Ultra X7 368H
  (179 - 203, n=2)
191 Seconds * +6%
Lenovo ThinkPad X9-15p Gen 1
Intel Core Ultra X7 358H
175 Seconds * +14%
Asus Zenbook A16 UX3607
Qualcomm Snapdragon X2 Elite Extreme X2E-94-100
172 Seconds * +15%
7-Zip 18.03 / 7z b 4
Lenovo ThinkPad X9-15p Gen 1
Intel Core Ultra X7 358H
68930 MIPS +11%
Dell XPS 16 Core Ultra X7 358H
Intel Core Ultra X7 358H
64852 MIPS +4%
Media Intel Core Ultra X7 368H
  (62173 - 63679, n=2)
62926 MIPS +1%
Microsoft Surface Laptop 15 Gen 8
Intel Core Ultra X7 368H
62173 MIPS
Media della classe Multimedia
  (26062 - 130368, n=49, ultimi 2 anni)
58487 MIPS -6%
Microsoft Surface Laptop 7 15 Lunar Lake
Intel Core Ultra 7 268V
35687 MIPS -43%
7-Zip 18.03 / 7z b 4 -mmt1
Microsoft Surface Laptop 15 Gen 8
Intel Core Ultra X7 368H
6637 MIPS
Media Intel Core Ultra X7 368H
  (6434 - 6637, n=2)
6536 MIPS -2%
Lenovo ThinkPad X9-15p Gen 1
Intel Core Ultra X7 358H
6449 MIPS -3%
Dell XPS 16 Core Ultra X7 358H
Intel Core Ultra X7 358H
6441 MIPS -3%
Asus Zenbook A16 UX3607
Qualcomm Snapdragon X2 Elite Extreme X2E-94-100
6247 MIPS -6%
Microsoft Surface Laptop 7 15 Lunar Lake
Intel Core Ultra 7 268V
6021 MIPS -9%
Media della classe Multimedia
  (4526 - 7337, n=50, ultimi 2 anni)
5944 MIPS -10%
HWBOT x265 Benchmark v2.2 / 4k Preset
Lenovo ThinkPad X9-15p Gen 1
Intel Core Ultra X7 358H
22.1 fps +18%
Dell XPS 16 Core Ultra X7 358H
Intel Core Ultra X7 358H
21 fps +12%
Media della classe Multimedia
  (6.08 - 36.1, n=50, ultimi 2 anni)
19.3 fps +3%
Microsoft Surface Laptop 15 Gen 8
Intel Core Ultra X7 368H
18.7 fps
Media Intel Core Ultra X7 368H
  (14.1 - 18.7, n=2)
16.4 fps -12%
Asus Zenbook A16 UX3607
Qualcomm Snapdragon X2 Elite Extreme X2E-94-100
13.6 fps -27%
Microsoft Surface Laptop 7 15 Lunar Lake
Intel Core Ultra 7 268V
12.9 fps -31%
LibreOffice / 20 Documents To PDF
Dell XPS 16 Core Ultra X7 358H
Intel Core Ultra X7 358H
49.5 s * -22%
Microsoft Surface Laptop 7 15 Lunar Lake
Intel Core Ultra 7 268V
48 s * -19%
Media della classe Multimedia
  (23.9 - 72.5, n=51, ultimi 2 anni)
47.9 s * -18%
Lenovo ThinkPad X9-15p Gen 1
Intel Core Ultra X7 358H
47.6 s * -18%
Asus Zenbook A16 UX3607
Qualcomm Snapdragon X2 Elite Extreme X2E-94-100
44.2 s * -9%
Microsoft Surface Laptop 15 Gen 8
Intel Core Ultra X7 368H
40.5 s *
Media Intel Core Ultra X7 368H
  (39.1 - 40.5, n=2)
39.8 s * +2%
R Benchmark 2.5 / Overall mean
Asus Zenbook A16 UX3607
Qualcomm Snapdragon X2 Elite Extreme X2E-94-100
0.507 sec * -22%
Microsoft Surface Laptop 7 15 Lunar Lake
Intel Core Ultra 7 268V
0.4565 sec * -10%
Media della classe Multimedia
  (0.3903 - 0.609, n=50, ultimi 2 anni)
0.4464 sec * -8%
Lenovo ThinkPad X9-15p Gen 1
Intel Core Ultra X7 358H
0.4236 sec * -2%
Dell XPS 16 Core Ultra X7 358H
Intel Core Ultra X7 358H
0.4216 sec * -2%
Microsoft Surface Laptop 15 Gen 8
Intel Core Ultra X7 368H
0.4144 sec *
Media Intel Core Ultra X7 368H
  (0.4137 - 0.4144, n=2)
0.4141 sec * -0%

* ... Meglio usare valori piccoli

Cinebench R15 CPU Multi 64Bit
3156 Points
Cinebench R15 OpenGL 64Bit
253 fps
Cinebench R15 Ref. Match 64Bit
97.8 %
Cinebench R15 CPU Single 64Bit
308 Points
Cinebench R20 CPU (Multi Core)
6681 Points
Cinebench R20 CPU (Single Core)
809 Points
Cinebench R23 Single Core
2140 Points
Cinebench R23 Multi Core
17052 Points
Cinebench 2024 CPU Single Core
127.1 Points
Cinebench 2024 CPU Multi Core
960 Points
Aiuto
Performance rating
Lenovo ThinkPad X9-15p Gen 1 -1!
Intel Core Ultra X7 358H, Arc B390 Panther Lake iGPU
91.4 pt
Media Intel Core Ultra X7 368H -1!
 
84.2 pt
Media della classe Multimedia
 
83.6 pt
Dell XPS 16 Core Ultra X7 358H -1!
Intel Core Ultra X7 358H, Arc B390 Panther Lake iGPU
82.6 pt
Microsoft Surface Laptop 15 Gen 8 -1!
Intel Core Ultra X7 368H, Arc B390 Panther Lake iGPU
79.2 pt
Asus Zenbook A16 UX3607 -1!
Qualcomm Snapdragon X2 Elite Extreme X2E-94-100, X2-90
70 pt
Microsoft Surface Laptop 7 15 Lunar Lake -1!
Intel Core Ultra 7 268V, Arc 140V
55 pt
AIDA64 / FP32 Ray-Trace
Lenovo ThinkPad X9-15p Gen 1
Intel Core Ultra X7 358H, Arc B390 Panther Lake iGPU (v8.20.8100)
18710 KRay/s +21%
Media della classe Multimedia
  (2214 - 50388, n=48, ultimi 2 anni)
18202 KRay/s +18%
Media Intel Core Ultra X7 368H
  (15419 - 17245, n=2)
16332 KRay/s +6%
Dell XPS 16 Core Ultra X7 358H
Intel Core Ultra X7 358H, Arc B390 Panther Lake iGPU (v8.20.8100)
15681 KRay/s +2%
Microsoft Surface Laptop 15 Gen 8
Intel Core Ultra X7 368H, Arc B390 Panther Lake iGPU (v8.20.8100)
15419 KRay/s
Asus Zenbook A16 UX3607
Qualcomm Snapdragon X2 Elite Extreme X2E-94-100, X2-90 (v8.20.8100)
12578 KRay/s -18%
Microsoft Surface Laptop 7 15 Lunar Lake
Intel Core Ultra 7 268V, Arc 140V (v6.92.6600)
11547 KRay/s -25%
AIDA64 / FPU Julia
Lenovo ThinkPad X9-15p Gen 1
Intel Core Ultra X7 358H, Arc B390 Panther Lake iGPU (v8.20.8100)
96559 Points +15%
Media Intel Core Ultra X7 368H
  (84167 - 90689, n=2)
87428 Points +4%
Media della classe Multimedia
  (12867 - 201874, n=48, ultimi 2 anni)
85899 Points +2%
Microsoft Surface Laptop 15 Gen 8
Intel Core Ultra X7 368H, Arc B390 Panther Lake iGPU (v8.20.8100)
84167 Points
Dell XPS 16 Core Ultra X7 358H
Intel Core Ultra X7 358H, Arc B390 Panther Lake iGPU (v8.20.8100)
83114 Points -1%
Microsoft Surface Laptop 7 15 Lunar Lake
Intel Core Ultra 7 268V, Arc 140V (v6.92.6600)
56299 Points -33%
Asus Zenbook A16 UX3607
Qualcomm Snapdragon X2 Elite Extreme X2E-94-100, X2-90 (v8.20.8100)
49008 Points -42%
AIDA64 / CPU SHA3
Asus Zenbook A16 UX3607
Qualcomm Snapdragon X2 Elite Extreme X2E-94-100, X2-90 (v8.20.8100)
5433 MB/s +34%
Lenovo ThinkPad X9-15p Gen 1
Intel Core Ultra X7 358H, Arc B390 Panther Lake iGPU (v8.20.8100)
4955 MB/s +22%
Media Intel Core Ultra X7 368H
  (4052 - 4537, n=2)
4295 MB/s +6%
Dell XPS 16 Core Ultra X7 358H
Intel Core Ultra X7 358H, Arc B390 Panther Lake iGPU (v8.20.8100)
4200 MB/s +4%
Microsoft Surface Laptop 15 Gen 8
Intel Core Ultra X7 368H, Arc B390 Panther Lake iGPU (v8.20.8100)
4052 MB/s
Media della classe Multimedia
  (626 - 8623, n=48, ultimi 2 anni)
3988 MB/s -2%
Microsoft Surface Laptop 7 15 Lunar Lake
Intel Core Ultra 7 268V, Arc 140V (v6.92.6600)
2538 MB/s -37%
AIDA64 / CPU Queen
Media della classe Multimedia
  (13483 - 181505, n=31, ultimi 2 anni)
70972 Points
Microsoft Surface Laptop 7 15 Lunar Lake
Intel Core Ultra 7 268V, Arc 140V (v6.92.6600)
49645 Points
AIDA64 / FPU SinJulia
Media della classe Multimedia
  (886 - 28794, n=48, ultimi 2 anni)
8498 Points +26%
Media Intel Core Ultra X7 368H
  (6765 - 7511, n=2)
7138 Points +6%
Lenovo ThinkPad X9-15p Gen 1
Intel Core Ultra X7 358H, Arc B390 Panther Lake iGPU (v8.20.8100)
7033 Points +4%
Dell XPS 16 Core Ultra X7 358H
Intel Core Ultra X7 358H, Arc B390 Panther Lake iGPU (v8.20.8100)
6892 Points +2%
Microsoft Surface Laptop 15 Gen 8
Intel Core Ultra X7 368H, Arc B390 Panther Lake iGPU (v8.20.8100)
6765 Points
Microsoft Surface Laptop 7 15 Lunar Lake
Intel Core Ultra 7 268V, Arc 140V (v6.92.6600)
4426 Points -35%
Asus Zenbook A16 UX3607
Qualcomm Snapdragon X2 Elite Extreme X2E-94-100, X2-90 (v8.20.8100)
4199 Points -38%
AIDA64 / FPU Mandel
Lenovo ThinkPad X9-15p Gen 1
Intel Core Ultra X7 358H, Arc B390 Panther Lake iGPU (v8.20.8100)
50766 Points +13%
Media Intel Core Ultra X7 368H
  (44784 - 48562, n=2)
46673 Points +4%
Media della classe Multimedia
  (6395 - 105740, n=48, ultimi 2 anni)
45242 Points +1%
Microsoft Surface Laptop 15 Gen 8
Intel Core Ultra X7 368H, Arc B390 Panther Lake iGPU (v8.20.8100)
44784 Points
Dell XPS 16 Core Ultra X7 358H
Intel Core Ultra X7 358H, Arc B390 Panther Lake iGPU (v8.20.8100)
44733 Points 0%
Microsoft Surface Laptop 7 15 Lunar Lake
Intel Core Ultra 7 268V, Arc 140V (v6.92.6600)
29637 Points -34%
Asus Zenbook A16 UX3607
Qualcomm Snapdragon X2 Elite Extreme X2E-94-100, X2-90 (v8.20.8100)
26387 Points -41%
AIDA64 / CPU AES
Asus Zenbook A16 UX3607
Qualcomm Snapdragon X2 Elite Extreme X2E-94-100, X2-90 (v8.20.8100)
110260 MB/s +88%
Lenovo ThinkPad X9-15p Gen 1
Intel Core Ultra X7 358H, Arc B390 Panther Lake iGPU (v8.20.8100)
68737 MB/s +17%
Media della classe Multimedia
  (8171 - 126790, n=48, ultimi 2 anni)
64193 MB/s +10%
Media Intel Core Ultra X7 368H
  (58572 - 68180, n=2)
63376 MB/s +8%
Dell XPS 16 Core Ultra X7 358H
Intel Core Ultra X7 358H, Arc B390 Panther Lake iGPU (v8.20.8100)
61102 MB/s +4%
Microsoft Surface Laptop 15 Gen 8
Intel Core Ultra X7 368H, Arc B390 Panther Lake iGPU (v8.20.8100)
58572 MB/s
Microsoft Surface Laptop 7 15 Lunar Lake
Intel Core Ultra 7 268V, Arc 140V (v6.92.6600)
38706 MB/s -34%
AIDA64 / CPU ZLib
Asus Zenbook A16 UX3607
Qualcomm Snapdragon X2 Elite Extreme X2E-94-100, X2-90 (v8.20.8100)
1337 MB/s +67%
Lenovo ThinkPad X9-15p Gen 1
Intel Core Ultra X7 358H, Arc B390 Panther Lake iGPU (v8.20.8100)
1111 MB/s +38%
Dell XPS 16 Core Ultra X7 358H
Intel Core Ultra X7 358H, Arc B390 Panther Lake iGPU (v8.20.8100)
991 MB/s +23%
Media della classe Multimedia
  (143.8 - 2022, n=48, ultimi 2 anni)
982 MB/s +22%
Media Intel Core Ultra X7 368H
  (803 - 1130, n=2)
967 MB/s +20%
Microsoft Surface Laptop 15 Gen 8
Intel Core Ultra X7 368H, Arc B390 Panther Lake iGPU (v8.20.8100)
803 MB/s
Microsoft Surface Laptop 7 15 Lunar Lake
Intel Core Ultra 7 268V, Arc 140V (v6.92.6600)
583 MB/s -27%
AIDA64 / FP64 Ray-Trace
Media della classe Multimedia
  (1014 - 26875, n=48, ultimi 2 anni)
9692 KRay/s +19%
Lenovo ThinkPad X9-15p Gen 1
Intel Core Ultra X7 358H, Arc B390 Panther Lake iGPU (v8.20.8100)
9612 KRay/s +18%
Media Intel Core Ultra X7 368H
  (8151 - 9131, n=2)
8641 KRay/s +6%
Dell XPS 16 Core Ultra X7 358H
Intel Core Ultra X7 358H, Arc B390 Panther Lake iGPU (v8.20.8100)
8285 KRay/s +2%
Microsoft Surface Laptop 15 Gen 8
Intel Core Ultra X7 368H, Arc B390 Panther Lake iGPU (v8.20.8100)
8151 KRay/s
Asus Zenbook A16 UX3607
Qualcomm Snapdragon X2 Elite Extreme X2E-94-100, X2-90 (v8.20.8100)
6811 KRay/s -16%
Microsoft Surface Laptop 7 15 Lunar Lake
Intel Core Ultra 7 268V, Arc 140V (v6.92.6600)
6214 KRay/s -24%
AIDA64 / CPU PhotoWorxx
Lenovo ThinkPad X9-15p Gen 1
Intel Core Ultra X7 358H, Arc B390 Panther Lake iGPU (v8.20.8100)
88533 MPixel/s +17%
Dell XPS 16 Core Ultra X7 358H
Intel Core Ultra X7 358H, Arc B390 Panther Lake iGPU (v8.20.8100)
88154 MPixel/s +16%
Media Intel Core Ultra X7 368H
  (75761 - 84065, n=2)
79913 MPixel/s +5%
Microsoft Surface Laptop 15 Gen 8
Intel Core Ultra X7 368H, Arc B390 Panther Lake iGPU (v8.20.8100)
75761 MPixel/s
Asus Zenbook A16 UX3607
Qualcomm Snapdragon X2 Elite Extreme X2E-94-100, X2-90 (v8.20.8100)
66951 MPixel/s -12%
Microsoft Surface Laptop 7 15 Lunar Lake
Intel Core Ultra 7 268V, Arc 140V (v6.92.6600)
53540 MPixel/s -29%
Media della classe Multimedia
  (8187 - 88533, n=48, ultimi 2 anni)
53006 MPixel/s -30%
AIDA64 / CPU CheckMate
Media Intel Core Ultra X7 368H
  (4328 - 4613, n=2)
4471 MP/s +3%
Microsoft Surface Laptop 15 Gen 8
Intel Core Ultra X7 368H, Arc B390 Panther Lake iGPU (v8.20.8100)
4328 MP/s
Lenovo ThinkPad X9-15p Gen 1
Intel Core Ultra X7 358H, Arc B390 Panther Lake iGPU (v8.20.8100)
4279 MP/s -1%
Dell XPS 16 Core Ultra X7 358H
Intel Core Ultra X7 358H, Arc B390 Panther Lake iGPU (v8.20.8100)
4269 MP/s -1%
Media della classe Multimedia
  (569 - 4742, n=20, ultimi 2 anni)
3548 MP/s -18%
Asus Zenbook A16 UX3607
Qualcomm Snapdragon X2 Elite Extreme X2E-94-100, X2-90 (v8.20.8100)
1570 MP/s -64%

Sistema e dispositivi di archiviazione

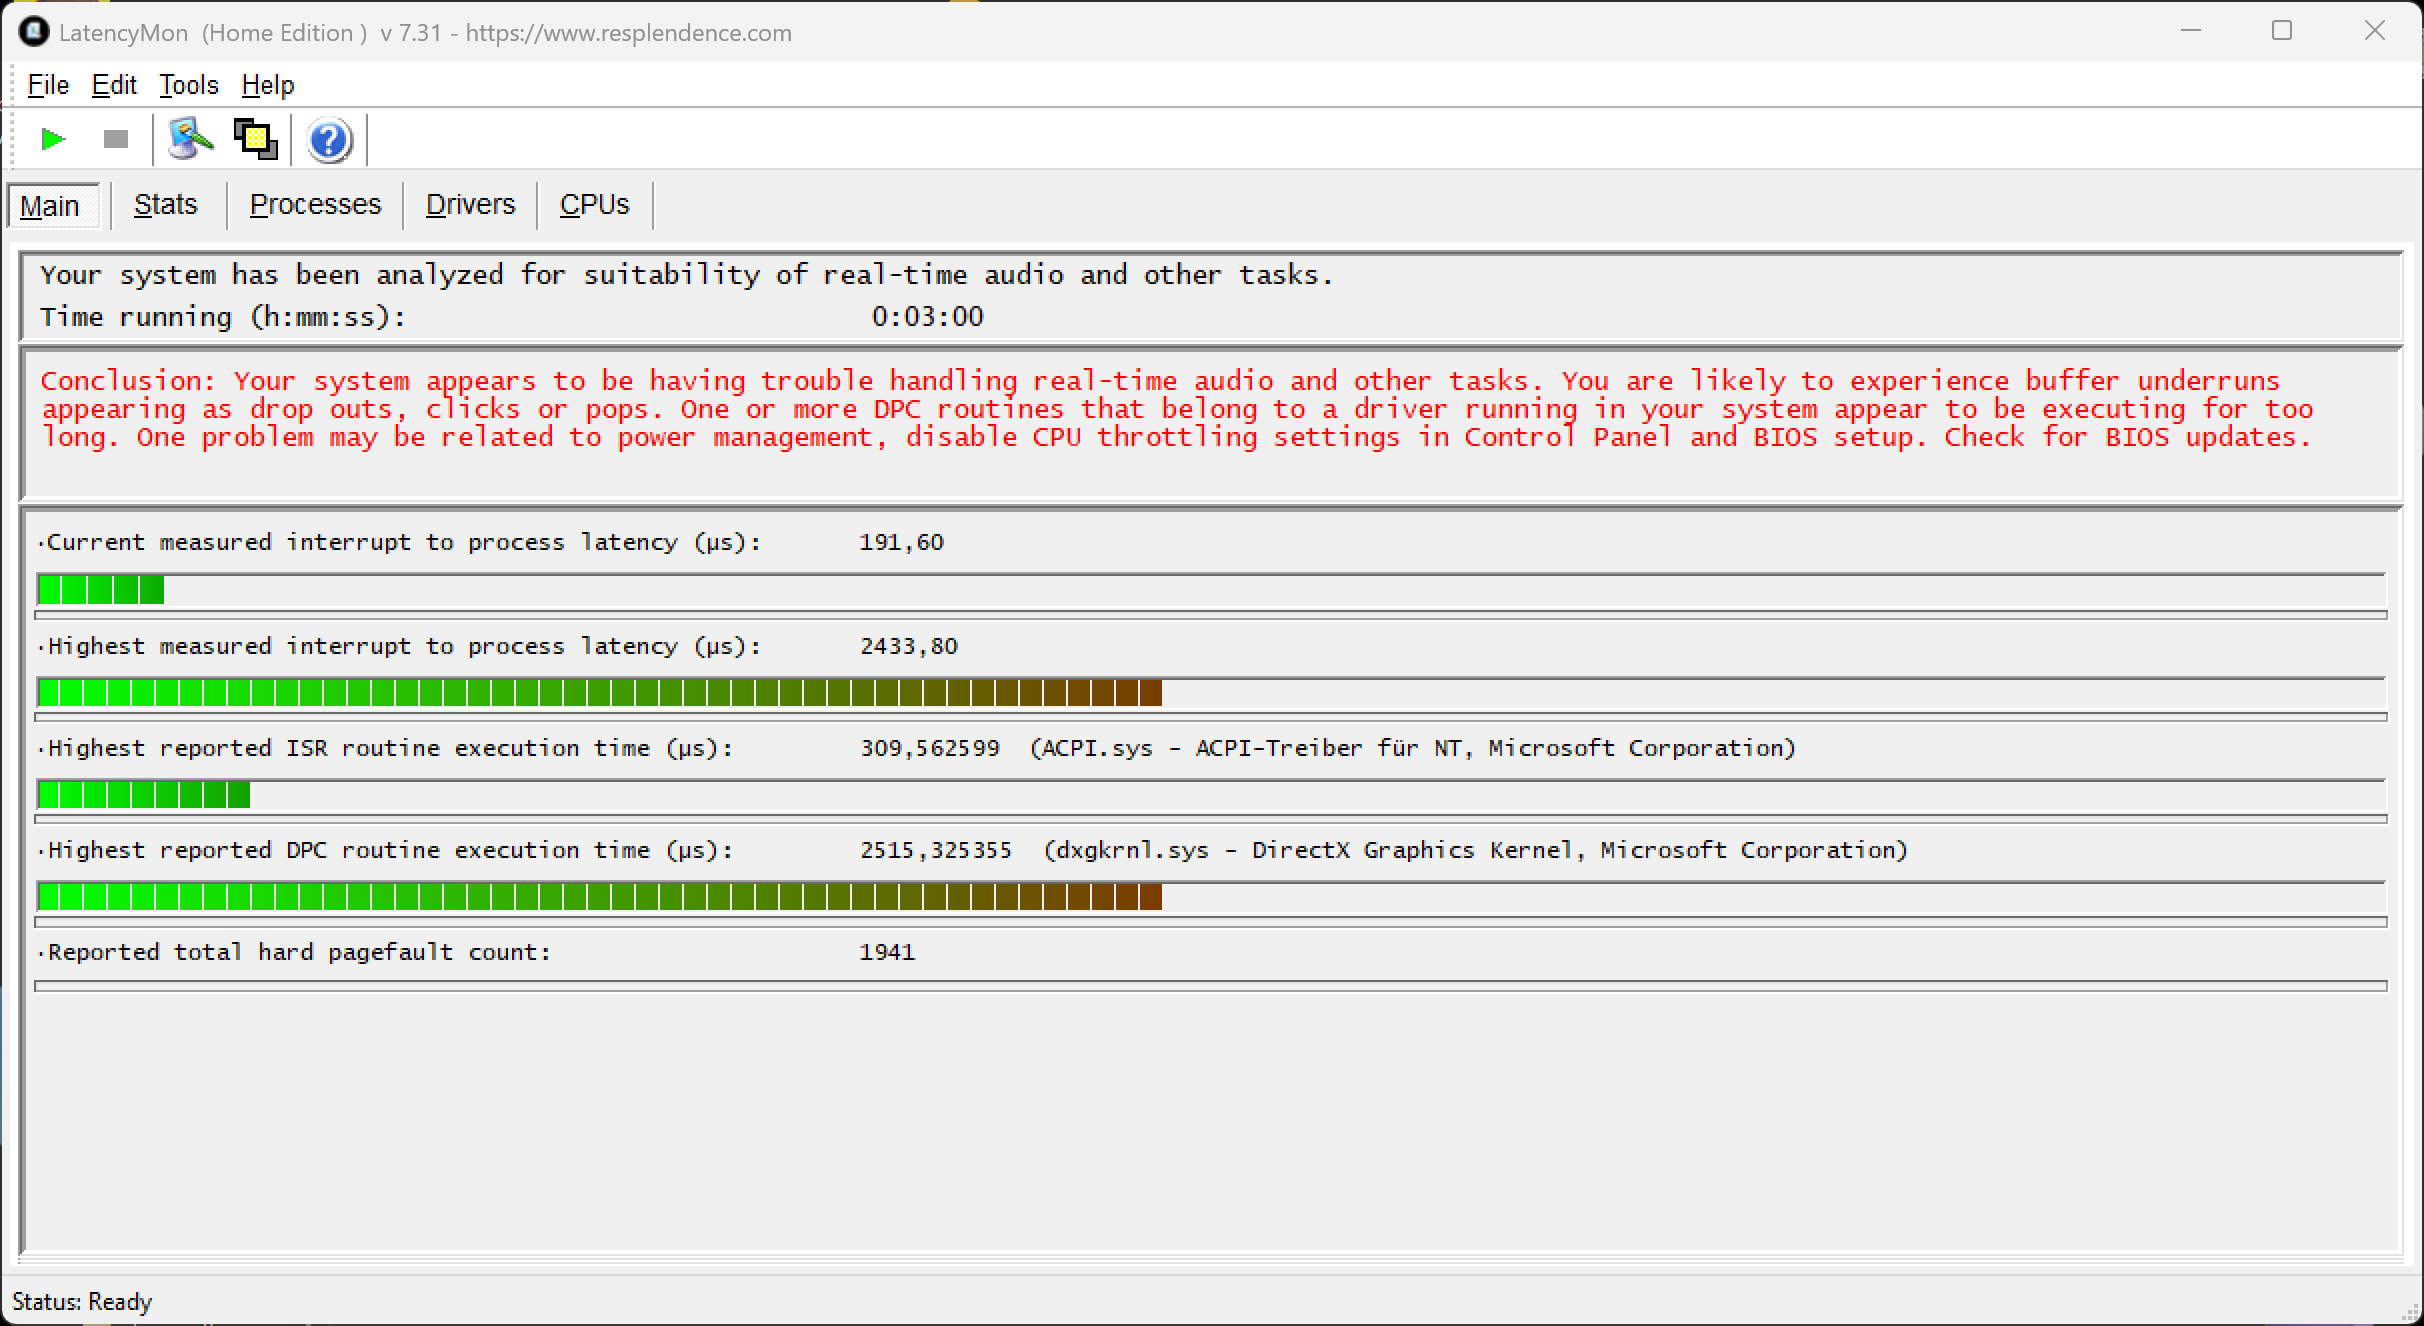
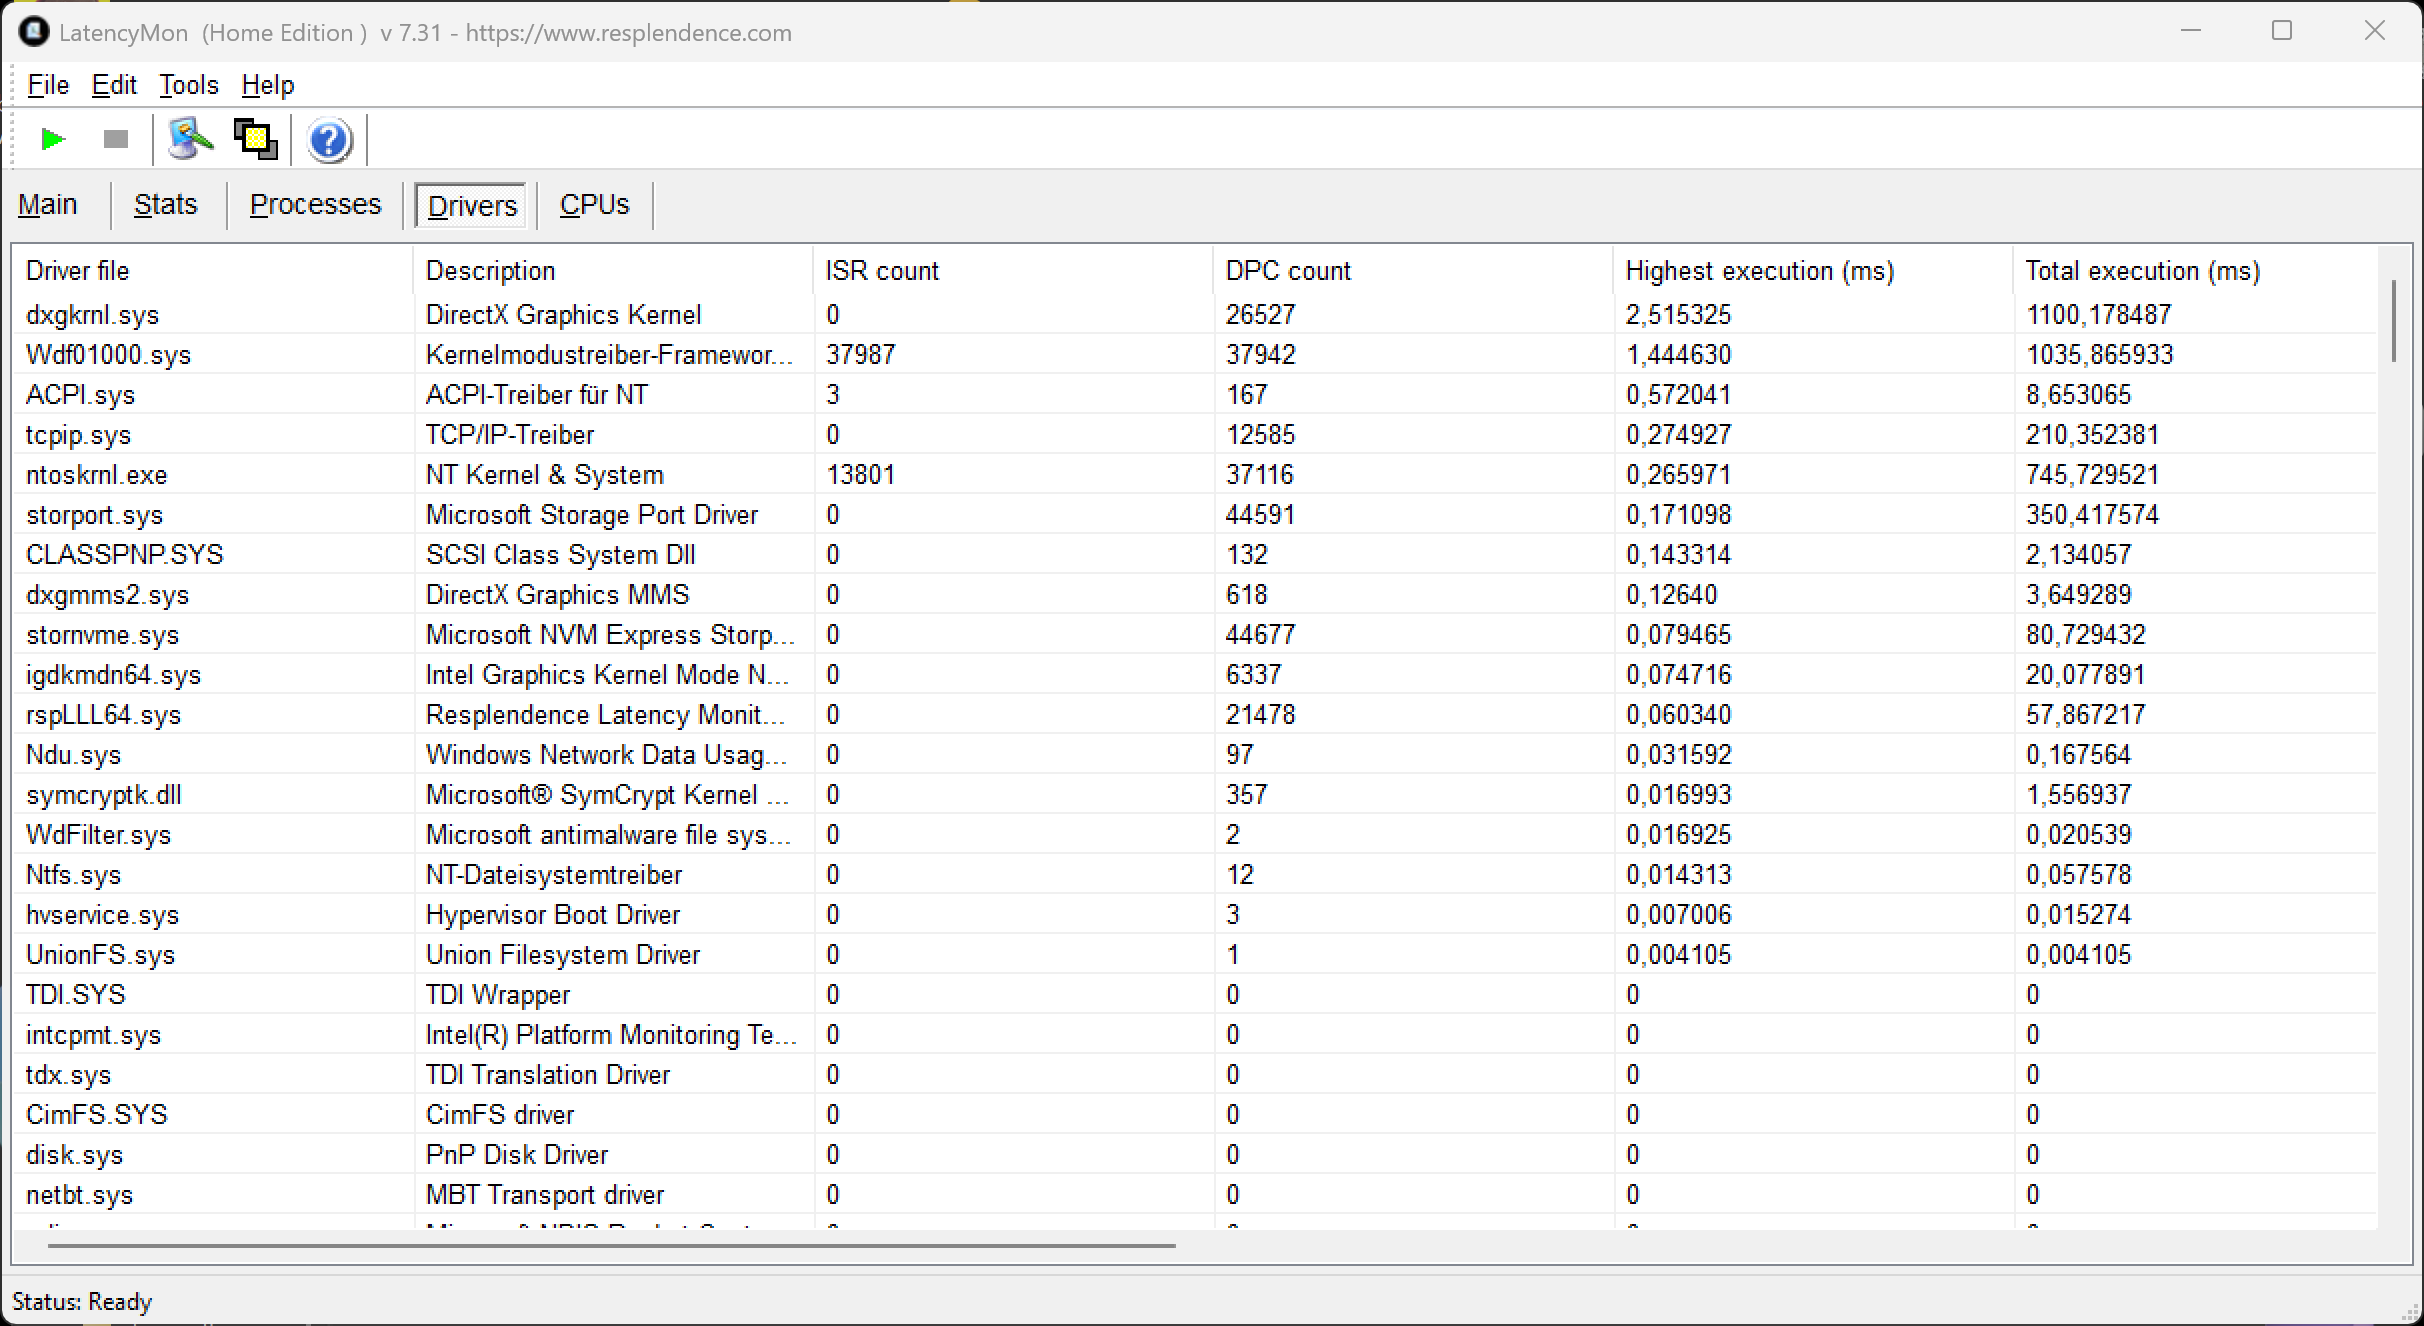
Le prestazioni complessive del sistema sono eccellenti e non abbiamo riscontrato nemmeno problemi di stabilità. Ovviamente non ci sono problemi di compatibilità con la variante Intel, il che rappresenta un vantaggio rispetto alla versione Snapdragon. La nostra unità di test offre solo 16 GB di RAM, ma non abbiamo riscontrato problemi e, se non esagerate con il multitasking, questa versione più economica dovrebbe andare bene. 32 GB sarebbero ovviamente meglio (è possibile configurare fino a 64 GB), ma i sovrapprezzi sono elevati. Il nostro test di latenza ha evidenziato alcuni problemi con le applicazioni audio in tempo reale. Le prestazioni dell'SSD (PCIe 4.0) sono buone e stabili.

Performance rating: Percent
PCMark 10: Score | Essentials | Productivity | Digital Content Creation
CrossMark: Overall | Productivity | Creativity | Responsiveness
WebXPRT 3: Overall
WebXPRT 4: Overall
Mozilla Kraken 1.1: Total
Performance rating
Apple MacBook Air 15 M5 -4!
M5 10-Core GPU, M5 10-Core, Apple SSD AP2048Z
91.1 pt
Asus Zenbook A16 UX3607 -4!
X2-90, X2E-94-100, Samsung PM9C1b MZVL81T0HFLB-00BTW
83.5 pt
Microsoft Surface Laptop 15 Gen 8
Arc B390 Panther Lake iGPU, Ultra X7 368H, SK hynix PVC10 HFS256GEM4X182N
83.3 pt
Media Intel Core Ultra X7 368H, Intel Arc B390 12 Xe3 Panther Lake iGPU
 
83.1 pt
Lenovo ThinkPad X9-15p Gen 1
Arc B390 Panther Lake iGPU, Ultra X7 358H, Samsung PM9E1 1 TB MZVLC1T0HFLU
80.6 pt
Dell XPS 16 Core Ultra X7 358H
Arc B390 Panther Lake iGPU, Ultra X7 358H
80 pt
Media della classe Multimedia
 
72.5 pt
Microsoft Surface Laptop 7 15 Lunar Lake
Arc 140V, Core Ultra 7 268V, Samsung PM9C1a MZ9L81T0HDLB
64.9 pt
PCMark 10 / Score
Media Intel Core Ultra X7 368H, Intel Arc B390 12 Xe3 Panther Lake iGPU
  (9923 - 10456, n=2)
10190 Points +3%
Microsoft Surface Laptop 15 Gen 8
Arc B390 Panther Lake iGPU, Ultra X7 368H, SK hynix PVC10 HFS256GEM4X182N
9923 Points
Dell XPS 16 Core Ultra X7 358H
Arc B390 Panther Lake iGPU, Ultra X7 358H
9717 Points -2%
Lenovo ThinkPad X9-15p Gen 1
Arc B390 Panther Lake iGPU, Ultra X7 358H, Samsung PM9E1 1 TB MZVLC1T0HFLU
9303 Points -6%
Media della classe Multimedia
  (4325 - 10386, n=48, ultimi 2 anni)
8022 Points -19%
Microsoft Surface Laptop 7 15 Lunar Lake
Arc 140V, Core Ultra 7 268V, Samsung PM9C1a MZ9L81T0HDLB
7236 Points -27%
PCMark 10 / Essentials
Media Intel Core Ultra X7 368H, Intel Arc B390 12 Xe3 Panther Lake iGPU
  (11288 - 11715, n=2)
11502 Points +2%
Microsoft Surface Laptop 15 Gen 8
Arc B390 Panther Lake iGPU, Ultra X7 368H, SK hynix PVC10 HFS256GEM4X182N
11288 Points
Dell XPS 16 Core Ultra X7 358H
Arc B390 Panther Lake iGPU, Ultra X7 358H
11122 Points -1%
Lenovo ThinkPad X9-15p Gen 1
Arc B390 Panther Lake iGPU, Ultra X7 358H, Samsung PM9E1 1 TB MZVLC1T0HFLU
10762 Points -5%
Microsoft Surface Laptop 7 15 Lunar Lake
Arc 140V, Core Ultra 7 268V, Samsung PM9C1a MZ9L81T0HDLB
10701 Points -5%
Media della classe Multimedia
  (8025 - 11664, n=47, ultimi 2 anni)
10507 Points -7%
PCMark 10 / Productivity
Media Intel Core Ultra X7 368H, Intel Arc B390 12 Xe3 Panther Lake iGPU
  (17463 - 18738, n=2)
18101 Points +4%
Microsoft Surface Laptop 15 Gen 8
Arc B390 Panther Lake iGPU, Ultra X7 368H, SK hynix PVC10 HFS256GEM4X182N
17463 Points
Dell XPS 16 Core Ultra X7 358H
Arc B390 Panther Lake iGPU, Ultra X7 358H
16422 Points -6%
Lenovo ThinkPad X9-15p Gen 1
Arc B390 Panther Lake iGPU, Ultra X7 358H, Samsung PM9E1 1 TB MZVLC1T0HFLU
14870 Points -15%
Media della classe Multimedia
  (7323 - 18233, n=47, ultimi 2 anni)
12568 Points -28%
Microsoft Surface Laptop 7 15 Lunar Lake
Arc 140V, Core Ultra 7 268V, Samsung PM9C1a MZ9L81T0HDLB
9217 Points -47%
PCMark 10 / Digital Content Creation
Media Intel Core Ultra X7 368H, Intel Arc B390 12 Xe3 Panther Lake iGPU
  (13454 - 14129, n=2)
13792 Points +3%
Lenovo ThinkPad X9-15p Gen 1
Arc B390 Panther Lake iGPU, Ultra X7 358H, Samsung PM9E1 1 TB MZVLC1T0HFLU
13652 Points +1%
Dell XPS 16 Core Ultra X7 358H
Arc B390 Panther Lake iGPU, Ultra X7 358H
13633 Points +1%
Microsoft Surface Laptop 15 Gen 8
Arc B390 Panther Lake iGPU, Ultra X7 368H, SK hynix PVC10 HFS256GEM4X182N
13454 Points
Media della classe Multimedia
  (3738 - 16240, n=47, ultimi 2 anni)
10853 Points -19%
Microsoft Surface Laptop 7 15 Lunar Lake
Arc 140V, Core Ultra 7 268V, Samsung PM9C1a MZ9L81T0HDLB
10427 Points -22%
CrossMark / Overall
Apple MacBook Air 15 M5
M5 10-Core GPU, M5 10-Core, Apple SSD AP2048Z
2356 Points +8%
Lenovo ThinkPad X9-15p Gen 1
Arc B390 Panther Lake iGPU, Ultra X7 358H, Samsung PM9E1 1 TB MZVLC1T0HFLU
2182 Points 0%
Microsoft Surface Laptop 15 Gen 8
Arc B390 Panther Lake iGPU, Ultra X7 368H, SK hynix PVC10 HFS256GEM4X182N
2182 Points
Dell XPS 16 Core Ultra X7 358H
Arc B390 Panther Lake iGPU, Ultra X7 358H
2114 Points -3%
Media Intel Core Ultra X7 368H, Intel Arc B390 12 Xe3 Panther Lake iGPU
  (2032 - 2182, n=2)
2107 Points -3%
Asus Zenbook A16 UX3607
X2-90, X2E-94-100, Samsung PM9C1b MZVL81T0HFLB-00BTW
1978 Points -9%
Media della classe Multimedia
  (866 - 3231, n=56, ultimi 2 anni)
1949 Points -11%
Microsoft Surface Laptop 7 15 Lunar Lake
Arc 140V, Core Ultra 7 268V, Samsung PM9C1a MZ9L81T0HDLB
1738 Points -20%
CrossMark / Productivity
Apple MacBook Air 15 M5
M5 10-Core GPU, M5 10-Core, Apple SSD AP2048Z
2277 Points +14%
Microsoft Surface Laptop 15 Gen 8
Arc B390 Panther Lake iGPU, Ultra X7 368H, SK hynix PVC10 HFS256GEM4X182N
1995 Points
Lenovo ThinkPad X9-15p Gen 1
Arc B390 Panther Lake iGPU, Ultra X7 358H, Samsung PM9E1 1 TB MZVLC1T0HFLU
1960 Points -2%
Media Intel Core Ultra X7 368H, Intel Arc B390 12 Xe3 Panther Lake iGPU
  (1916 - 1995, n=2)
1956 Points -2%
Dell XPS 16 Core Ultra X7 358H
Arc B390 Panther Lake iGPU, Ultra X7 358H
1898 Points -5%
Media della classe Multimedia
  (931 - 2677, n=56, ultimi 2 anni)
1817 Points -9%
Asus Zenbook A16 UX3607
X2-90, X2E-94-100, Samsung PM9C1b MZVL81T0HFLB-00BTW
1732 Points -13%
Microsoft Surface Laptop 7 15 Lunar Lake
Arc 140V, Core Ultra 7 268V, Samsung PM9C1a MZ9L81T0HDLB
1680 Points -16%
CrossMark / Creativity
Apple MacBook Air 15 M5
M5 10-Core GPU, M5 10-Core, Apple SSD AP2048Z
2743 Points +8%
Lenovo ThinkPad X9-15p Gen 1
Arc B390 Panther Lake iGPU, Ultra X7 358H, Samsung PM9E1 1 TB MZVLC1T0HFLU
2563 Points +1%
Microsoft Surface Laptop 15 Gen 8
Arc B390 Panther Lake iGPU, Ultra X7 368H, SK hynix PVC10 HFS256GEM4X182N
2530 Points
Dell XPS 16 Core Ultra X7 358H
Arc B390 Panther Lake iGPU, Ultra X7 358H
2529 Points 0%
Media Intel Core Ultra X7 368H, Intel Arc B390 12 Xe3 Panther Lake iGPU
  (2241 - 2530, n=2)
2386 Points -6%
Asus Zenbook A16 UX3607
X2-90, X2E-94-100, Samsung PM9C1b MZVL81T0HFLB-00BTW
2327 Points -8%
Media della classe Multimedia
  (907 - 4522, n=56, ultimi 2 anni)
2261 Points -11%
Microsoft Surface Laptop 7 15 Lunar Lake
Arc 140V, Core Ultra 7 268V, Samsung PM9C1a MZ9L81T0HDLB
1976 Points -22%
CrossMark / Responsiveness
Lenovo ThinkPad X9-15p Gen 1
Arc B390 Panther Lake iGPU, Ultra X7 358H, Samsung PM9E1 1 TB MZVLC1T0HFLU
1855 Points +1%
Microsoft Surface Laptop 15 Gen 8
Arc B390 Panther Lake iGPU, Ultra X7 368H, SK hynix PVC10 HFS256GEM4X182N
1832 Points
Media Intel Core Ultra X7 368H, Intel Arc B390 12 Xe3 Panther Lake iGPU
  (1808 - 1832, n=2)
1820 Points -1%
Asus Zenbook A16 UX3607
X2-90, X2E-94-100, Samsung PM9C1b MZVL81T0HFLB-00BTW
1811 Points -1%
Dell XPS 16 Core Ultra X7 358H
Arc B390 Panther Lake iGPU, Ultra X7 358H
1706 Points -7%
Apple MacBook Air 15 M5
M5 10-Core GPU, M5 10-Core, Apple SSD AP2048Z
1657 Points -10%
Media della classe Multimedia
  (605 - 2073, n=56, ultimi 2 anni)
1568 Points -14%
Microsoft Surface Laptop 7 15 Lunar Lake
Arc 140V, Core Ultra 7 268V, Samsung PM9C1a MZ9L81T0HDLB
1311 Points -28%
WebXPRT 3 / Overall
Apple MacBook Air 15 M5
M5 10-Core GPU, M5 10-Core, Apple SSD AP2048Z
530 Points +57%
Asus Zenbook A16 UX3607
X2-90, X2E-94-100, Samsung PM9C1b MZVL81T0HFLB-00BTW
514 Points +52%
Lenovo ThinkPad X9-15p Gen 1
Arc B390 Panther Lake iGPU, Ultra X7 358H, Samsung PM9E1 1 TB MZVLC1T0HFLU
350 Points +4%
Media della classe Multimedia
  (197.4 - 622, n=59, ultimi 2 anni)
346 Points +2%
Media Intel Core Ultra X7 368H, Intel Arc B390 12 Xe3 Panther Lake iGPU
  (338 - 342, n=2)
340 Points +1%
Microsoft Surface Laptop 15 Gen 8
Arc B390 Panther Lake iGPU, Ultra X7 368H, SK hynix PVC10 HFS256GEM4X182N
338 Points
Microsoft Surface Laptop 7 15 Lunar Lake
Arc 140V, Core Ultra 7 268V, Samsung PM9C1a MZ9L81T0HDLB
310 Points -8%
Dell XPS 16 Core Ultra X7 358H
Arc B390 Panther Lake iGPU, Ultra X7 358H
304 Points -10%
WebXPRT 4 / Overall
Asus Zenbook A16 UX3607
X2-90, X2E-94-100, Samsung PM9C1b MZVL81T0HFLB-00BTW
383 Points +22%
Apple MacBook Air 15 M5
M5 10-Core GPU, M5 10-Core, Apple SSD AP2048Z
378 Points +20%
Microsoft Surface Laptop 15 Gen 8
Arc B390 Panther Lake iGPU, Ultra X7 368H, SK hynix PVC10 HFS256GEM4X182N
314 Points
Media Intel Core Ultra X7 368H, Intel Arc B390 12 Xe3 Panther Lake iGPU
  (304 - 314, n=2)
309 Points -2%
Lenovo ThinkPad X9-15p Gen 1
Arc B390 Panther Lake iGPU, Ultra X7 358H, Samsung PM9E1 1 TB MZVLC1T0HFLU
307 Points -2%
Dell XPS 16 Core Ultra X7 358H
Arc B390 Panther Lake iGPU, Ultra X7 358H
300 Points -4%
Media della classe Multimedia
  (167.3 - 415, n=59, ultimi 2 anni)
295 Points -6%
Microsoft Surface Laptop 7 15 Lunar Lake
Arc 140V, Core Ultra 7 268V, Samsung PM9C1a MZ9L81T0HDLB
287 Points -9%
Mozilla Kraken 1.1 / Total
Microsoft Surface Laptop 7 15 Lunar Lake
Arc 140V, Core Ultra 7 268V, Samsung PM9C1a MZ9L81T0HDLB
475 ms * -11%
Lenovo ThinkPad X9-15p Gen 1
Arc B390 Panther Lake iGPU, Ultra X7 358H, Samsung PM9E1 1 TB MZVLC1T0HFLU
465 ms * -8%
Dell XPS 16 Core Ultra X7 358H
Arc B390 Panther Lake iGPU, Ultra X7 358H
450 ms * -5%
Media della classe Multimedia
  (228 - 835, n=60, ultimi 2 anni)
440 ms * -3%
Media Intel Core Ultra X7 368H, Intel Arc B390 12 Xe3 Panther Lake iGPU
  (429 - 437, n=2)
433 ms * -1%
Microsoft Surface Laptop 15 Gen 8
Arc B390 Panther Lake iGPU, Ultra X7 368H, SK hynix PVC10 HFS256GEM4X182N
429 ms *
Asus Zenbook A16 UX3607
X2-90, X2E-94-100, Samsung PM9C1b MZVL81T0HFLB-00BTW
261.4 ms * +39%
Apple MacBook Air 15 M5
M5 10-Core GPU, M5 10-Core, Apple SSD AP2048Z
238.6 ms * +44%

* ... Meglio usare valori piccoli

PCMark 10 Score
9923 punti
Aiuto
AIDA64 / Memory Copy
Dell XPS 16 Core Ultra X7 358H
Intel Core Ultra X7 358H, Arc B390 Panther Lake iGPU
132135 MB/s +20%
Lenovo ThinkPad X9-15p Gen 1
Intel Core Ultra X7 358H, Arc B390 Panther Lake iGPU
129389 MB/s +18%
Media Intel Core Ultra X7 368H
  (109931 - 114339, n=2)
112135 MB/s +2%
Microsoft Surface Laptop 15 Gen 8
Intel Core Ultra X7 368H, Arc B390 Panther Lake iGPU
109931 MB/s
Microsoft Surface Laptop 7 15 Lunar Lake
Intel Core Ultra 7 268V, Arc 140V
107108 MB/s -3%
Asus Zenbook A16 UX3607
Qualcomm Snapdragon X2 Elite Extreme X2E-94-100, X2-90
104879 MB/s -5%
Media della classe Multimedia
  (11299 - 132135, n=48, ultimi 2 anni)
85254 MB/s -22%
AIDA64 / Memory Read
Asus Zenbook A16 UX3607
Qualcomm Snapdragon X2 Elite Extreme X2E-94-100, X2-90
174586 MB/s +55%
Lenovo ThinkPad X9-15p Gen 1
Intel Core Ultra X7 358H, Arc B390 Panther Lake iGPU
120727 MB/s +7%
Dell XPS 16 Core Ultra X7 358H
Intel Core Ultra X7 358H, Arc B390 Panther Lake iGPU
118888 MB/s +6%
Microsoft Surface Laptop 15 Gen 8
Intel Core Ultra X7 368H, Arc B390 Panther Lake iGPU
112338 MB/s
Media Intel Core Ultra X7 368H
  (106702 - 112338, n=2)
109520 MB/s -3%
Microsoft Surface Laptop 7 15 Lunar Lake
Intel Core Ultra 7 268V, Arc 140V
88341 MB/s -21%
Media della classe Multimedia
  (11624 - 174586, n=48, ultimi 2 anni)
81379 MB/s -28%
AIDA64 / Memory Write
Dell XPS 16 Core Ultra X7 358H
Intel Core Ultra X7 358H, Arc B390 Panther Lake iGPU
134998 MB/s +12%
Lenovo ThinkPad X9-15p Gen 1
Intel Core Ultra X7 358H, Arc B390 Panther Lake iGPU
134848 MB/s +12%
Media Intel Core Ultra X7 368H
  (120698 - 120732, n=2)
120715 MB/s 0%
Microsoft Surface Laptop 15 Gen 8
Intel Core Ultra X7 368H, Arc B390 Panther Lake iGPU
120698 MB/s
Microsoft Surface Laptop 7 15 Lunar Lake
Intel Core Ultra 7 268V, Arc 140V
117888 MB/s -2%
Media della classe Multimedia
  (11755 - 134998, n=48, ultimi 2 anni)
86357 MB/s -28%
Asus Zenbook A16 UX3607
Qualcomm Snapdragon X2 Elite Extreme X2E-94-100, X2-90
73995 MB/s -39%
AIDA64 / Memory Latency
Media della classe Multimedia
  (84.1 - 535, n=47, ultimi 2 anni)
127.5 ns * -43%
Microsoft Surface Laptop 7 15 Lunar Lake
Intel Core Ultra 7 268V, Arc 140V
97.4 ns * -10%
Media Intel Core Ultra X7 368H
  (88.9 - 90.3, n=2)
89.6 ns * -1%
Microsoft Surface Laptop 15 Gen 8
Intel Core Ultra X7 368H, Arc B390 Panther Lake iGPU
88.9 ns *
Dell XPS 16 Core Ultra X7 358H
Intel Core Ultra X7 358H, Arc B390 Panther Lake iGPU
84.6 ns * +5%
Lenovo ThinkPad X9-15p Gen 1
Intel Core Ultra X7 358H, Arc B390 Panther Lake iGPU
84.1 ns * +5%

* ... Meglio usare valori piccoli

LatencyMon - Panoramica
LatencyMon - Driver
LatencyMon - Driver
DPC Latencies / LatencyMon - interrupt to process latency (max), Web, Youtube, Prime95
Lenovo ThinkPad X9-15p Gen 1
Arc B390 Panther Lake iGPU, Ultra X7 358H, Samsung PM9E1 1 TB MZVLC1T0HFLU
3844.3 μs * -58%
Microsoft Surface Laptop 15 Gen 8
Arc B390 Panther Lake iGPU, Ultra X7 368H, SK hynix PVC10 HFS256GEM4X182N
2433.8 μs *
Media della classe Multimedia
  (327 - 7067, n=46, ultimi 2 anni)
1815 μs * +25%
Microsoft Surface Laptop 7 15 Lunar Lake
Arc 140V, Core Ultra 7 268V, Samsung PM9C1a MZ9L81T0HDLB
891.9 μs * +63%
Dell XPS 16 Core Ultra X7 358H
Arc B390 Panther Lake iGPU, Ultra X7 358H
513.7 μs * +79%

* ... Meglio usare valori piccoli

SK hynix PVC10 HFS256GEM4X182N
CDM 5/6 Read Seq Q32T1: 5688 MB/s
CDM 5/6 Write Seq Q32T1: 2845 MB/s
CDM 5/6 Read 4K Q32T1: 602 MB/s
CDM 5/6 Write 4K Q32T1: 766 MB/s
CDM 5/6 Read 4K: 81.8 MB/s
CDM 5/6 Write 4K: 151.3 MB/s
CDM 6 Write 4K Q8T8: 2141 MB/s
CDM 6 Read 4K Q8T8: 1777 MB/s
Drive Performance rating - Percent
Lenovo ThinkPad X9-15p Gen 1
Samsung PM9E1 1 TB MZVLC1T0HFLU
93.3 pt
Asus Zenbook A16 UX3607
Samsung PM9C1b MZVL81T0HFLB-00BTW
54.4 pt
Microsoft Surface Laptop 15 Gen 8
SK hynix PVC10 HFS256GEM4X182N
51.3 pt
Media della classe Multimedia
 
47.5 pt
Dell XPS 16 Core Ultra X7 358H
 
43.4 pt
Microsoft Surface Laptop 7 15 Lunar Lake
Samsung PM9C1a MZ9L81T0HDLB
42.9 pt
Media SK hynix PVC10 HFS256GEM4X182N
 
41.3 pt
DiskSpd
seq read
Lenovo ThinkPad X9-15p Gen 1
Samsung PM9E1 1 TB MZVLC1T0HFLU
7663 (7579.05min - 7663.4max) MB/s +241%
Dell XPS 16 Core Ultra X7 358H
 
3600 (3100.64min - 3600.18max) MB/s +60%
Asus Zenbook A16 UX3607
Samsung PM9C1b MZVL81T0HFLB-00BTW
3256 (3194.8min - 3255.62max) MB/s +45%
Media della classe Multimedia
  (453 - 7811, n=51, ultimi 2 anni)
3140 MB/s +40%
Media SK hynix PVC10 HFS256GEM4X182N
  (2249 - 3278, n=2)
2764 MB/s +23%
Microsoft Surface Laptop 7 15 Lunar Lake
Samsung PM9C1a MZ9L81T0HDLB
2302 (2064.86min - 2301.62max) MB/s +2%
Microsoft Surface Laptop 15 Gen 8
SK hynix PVC10 HFS256GEM4X182N
2249 (2210.19min - 2248.78max) MB/s
seq write
Lenovo ThinkPad X9-15p Gen 1
Samsung PM9E1 1 TB MZVLC1T0HFLU
9312 (3040.03min - 9311.98max) MB/s +433%
Asus Zenbook A16 UX3607
Samsung PM9C1b MZVL81T0HFLB-00BTW
3644 (3588.65min - 3643.8max) MB/s +109%
Media della classe Multimedia
  (384 - 9952, n=51, ultimi 2 anni)
3319 MB/s +90%
Dell XPS 16 Core Ultra X7 358H
 
2599 (796.92min - 2599.25max) MB/s +49%
Media SK hynix PVC10 HFS256GEM4X182N
  (1747 - 2155, n=2)
1951 MB/s +12%
Microsoft Surface Laptop 15 Gen 8
SK hynix PVC10 HFS256GEM4X182N
1747 (1666.63min - 1747.42max) MB/s
Microsoft Surface Laptop 7 15 Lunar Lake
Samsung PM9C1a MZ9L81T0HDLB
1718 (1595.51min - 1717.99max) MB/s -2%
seq q8 t1 read
Lenovo ThinkPad X9-15p Gen 1
Samsung PM9E1 1 TB MZVLC1T0HFLU
14162 (13273.2min - 14161.6max) MB/s +133%
Dell XPS 16 Core Ultra X7 358H
 
7039 (5536.1min - 7039.48max) MB/s +16%
Asus Zenbook A16 UX3607
Samsung PM9C1b MZVL81T0HFLB-00BTW
6940 (5727.82min - 6940.07max) MB/s +14%
Microsoft Surface Laptop 7 15 Lunar Lake
Samsung PM9C1a MZ9L81T0HDLB
6158 (5002.91min - 6158.13max) MB/s +1%
Media della classe Multimedia
  (467 - 14162, n=51, ultimi 2 anni)
6122 MB/s +1%
Microsoft Surface Laptop 15 Gen 8
SK hynix PVC10 HFS256GEM4X182N
6074 (4968.99min - 6073.77max) MB/s
Media SK hynix PVC10 HFS256GEM4X182N
  (5911 - 6074, n=2)
5993 MB/s -1%
seq q8 t1 write
Lenovo ThinkPad X9-15p Gen 1
Samsung PM9E1 1 TB MZVLC1T0HFLU
13512 (13475.9min - 13511.8max) MB/s +305%
Dell XPS 16 Core Ultra X7 358H
 
6101 (5938.22min - 6101.03max) MB/s +83%
Media della classe Multimedia
  (247 - 13512, n=51, ultimi 2 anni)
5102 MB/s +53%
Asus Zenbook A16 UX3607
Samsung PM9C1b MZVL81T0HFLB-00BTW
4986 (4743.29min - 4986.07max) MB/s +50%
Microsoft Surface Laptop 7 15 Lunar Lake
Samsung PM9C1a MZ9L81T0HDLB
4651 (3142.37min - 4651.2max) MB/s +40%
Microsoft Surface Laptop 15 Gen 8
SK hynix PVC10 HFS256GEM4X182N
3333 (2050.9min - 3333.21max) MB/s
Media SK hynix PVC10 HFS256GEM4X182N
  (3041 - 3333, n=2)
3187 MB/s -4%
4k q1 t1 read
Lenovo ThinkPad X9-15p Gen 1
Samsung PM9E1 1 TB MZVLC1T0HFLU
85.1 (79.62min - 85.09max) MB/s +35%
Asus Zenbook A16 UX3607
Samsung PM9C1b MZVL81T0HFLB-00BTW
81.4 (73.37min - 81.4max) MB/s +29%
Media SK hynix PVC10 HFS256GEM4X182N
  (63 - 68, n=2)
65.5 MB/s +4%
Media della classe Multimedia
  (18.8 - 94.1, n=51, ultimi 2 anni)
64.4 MB/s +2%
Microsoft Surface Laptop 15 Gen 8
SK hynix PVC10 HFS256GEM4X182N
63 (62.83min - 63max) MB/s
Dell XPS 16 Core Ultra X7 358H
 
59.1 (53.74min - 59.08max) MB/s -6%
Microsoft Surface Laptop 7 15 Lunar Lake
Samsung PM9C1a MZ9L81T0HDLB
55 (51.05min - 55.02max) MB/s -13%
4k q1 t1 write
Asus Zenbook A16 UX3607
Samsung PM9C1b MZVL81T0HFLB-00BTW
249 (236.18min - 248.88max) MB/s +33%
Lenovo ThinkPad X9-15p Gen 1
Samsung PM9E1 1 TB MZVLC1T0HFLU
206 (194.33min - 205.81max) MB/s +10%
Microsoft Surface Laptop 15 Gen 8
SK hynix PVC10 HFS256GEM4X182N
186.6 (149.98min - 186.58max) MB/s
Media della classe Multimedia
  (40.3 - 278, n=51, ultimi 2 anni)
161.6 MB/s -13%
Media SK hynix PVC10 HFS256GEM4X182N
  (115.1 - 186.6, n=2)
150.9 MB/s -19%
Dell XPS 16 Core Ultra X7 358H
 
145.5 (139.46min - 145.49max) MB/s -22%
Microsoft Surface Laptop 7 15 Lunar Lake
Samsung PM9C1a MZ9L81T0HDLB
113.9 (108.41min - 113.89max) MB/s -39%
4k q32 t16 read
Lenovo ThinkPad X9-15p Gen 1
Samsung PM9E1 1 TB MZVLC1T0HFLU
5278 (5224.04min - 5277.98max) MB/s +116%
Microsoft Surface Laptop 15 Gen 8
SK hynix PVC10 HFS256GEM4X182N
2446 (2400.1min - 2445.99max) MB/s
Media SK hynix PVC10 HFS256GEM4X182N
  (1450 - 2446, n=2)
1948 MB/s -20%
Media della classe Multimedia
  (190.3 - 6121, n=51, ultimi 2 anni)
1626 MB/s -34%
Microsoft Surface Laptop 7 15 Lunar Lake
Samsung PM9C1a MZ9L81T0HDLB
1546 (1446.52min - 1545.71max) MB/s -37%
Asus Zenbook A16 UX3607
Samsung PM9C1b MZVL81T0HFLB-00BTW
1184 (1174.4min - 1183.69max) MB/s -52%
Dell XPS 16 Core Ultra X7 358H
 
652 (602.16min - 651.54max) MB/s -73%
4k q32 t16 write
Lenovo ThinkPad X9-15p Gen 1
Samsung PM9E1 1 TB MZVLC1T0HFLU
3134 (3116.91min - 3133.98max) MB/s +30%
Microsoft Surface Laptop 15 Gen 8
SK hynix PVC10 HFS256GEM4X182N
2414 (735.3min - 2413.9max) MB/s
Media SK hynix PVC10 HFS256GEM4X182N
  (635 - 2414, n=2)
1525 MB/s -37%
Microsoft Surface Laptop 7 15 Lunar Lake
Samsung PM9C1a MZ9L81T0HDLB
1244 (771.44min - 1244.07max) MB/s -48%
Media della classe Multimedia
  (154.9 - 4447, n=51, ultimi 2 anni)
1148 MB/s -52%
Asus Zenbook A16 UX3607
Samsung PM9C1b MZVL81T0HFLB-00BTW
805 (790.83min - 804.52max) MB/s -67%
Dell XPS 16 Core Ultra X7 358H
 
447 (308.53min - 447.08max) MB/s -81%
AS SSD
Score Total
Lenovo ThinkPad X9-15p Gen 1
Samsung PM9E1 1 TB MZVLC1T0HFLU
11377 Points +108%
Microsoft Surface Laptop 15 Gen 8
SK hynix PVC10 HFS256GEM4X182N
5467 Points
Media della classe Multimedia
  (482 - 11377, n=49, ultimi 2 anni)
5379 Points -2%
Dell XPS 16 Core Ultra X7 358H
 
5309 Points -3%
Asus Zenbook A16 UX3607
Samsung PM9C1b MZVL81T0HFLB-00BTW
5124 Points -6%
Media SK hynix PVC10 HFS256GEM4X182N
  (2859 - 5467, n=2)
4163 Points -24%
Microsoft Surface Laptop 7 15 Lunar Lake
Samsung PM9C1a MZ9L81T0HDLB
3869 Points -29%
Score Read
Lenovo ThinkPad X9-15p Gen 1
Samsung PM9E1 1 TB MZVLC1T0HFLU
4351 Points +99%
Microsoft Surface Laptop 15 Gen 8
SK hynix PVC10 HFS256GEM4X182N
2182 Points
Media SK hynix PVC10 HFS256GEM4X182N
  (1628 - 2182, n=2)
1905 Points -13%
Media della classe Multimedia
  (192 - 4351, n=49, ultimi 2 anni)
1761 Points -19%
Microsoft Surface Laptop 7 15 Lunar Lake
Samsung PM9C1a MZ9L81T0HDLB
1470 Points -33%
Dell XPS 16 Core Ultra X7 358H
 
1423 Points -35%
Asus Zenbook A16 UX3607
Samsung PM9C1b MZVL81T0HFLB-00BTW
1188 Points -46%
Score Write
Lenovo ThinkPad X9-15p Gen 1
Samsung PM9E1 1 TB MZVLC1T0HFLU
4851 Points +113%
Asus Zenbook A16 UX3607
Samsung PM9C1b MZVL81T0HFLB-00BTW
3402 Points +49%
Dell XPS 16 Core Ultra X7 358H
 
3277 Points +44%
Media della classe Multimedia
  (191 - 4851, n=49, ultimi 2 anni)
2777 Points +22%
Microsoft Surface Laptop 15 Gen 8
SK hynix PVC10 HFS256GEM4X182N
2278 Points
Microsoft Surface Laptop 7 15 Lunar Lake
Samsung PM9C1a MZ9L81T0HDLB
1716 Points -25%
Media SK hynix PVC10 HFS256GEM4X182N
  (506 - 2278, n=2)
1392 Points -39%
Seq Read
Lenovo ThinkPad X9-15p Gen 1
Samsung PM9E1 1 TB MZVLC1T0HFLU
10401 MB/s +120%
Asus Zenbook A16 UX3607
Samsung PM9C1b MZVL81T0HFLB-00BTW
5391 MB/s +14%
Dell XPS 16 Core Ultra X7 358H
 
5083.41 MB/s +7%
Media della classe Multimedia
  (484 - 10494, n=49, ultimi 2 anni)
4775 MB/s +1%
Microsoft Surface Laptop 15 Gen 8
SK hynix PVC10 HFS256GEM4X182N
4734 MB/s
Microsoft Surface Laptop 7 15 Lunar Lake
Samsung PM9C1a MZ9L81T0HDLB
4668 MB/s -1%
Media SK hynix PVC10 HFS256GEM4X182N
  (3681 - 4734, n=2)
4208 MB/s -11%
Seq Write
Lenovo ThinkPad X9-15p Gen 1
Samsung PM9E1 1 TB MZVLC1T0HFLU
9596 MB/s +329%
Asus Zenbook A16 UX3607
Samsung PM9C1b MZVL81T0HFLB-00BTW
3527 MB/s +58%
Media della classe Multimedia
  (344 - 9596, n=49, ultimi 2 anni)
3353 MB/s +50%
Microsoft Surface Laptop 7 15 Lunar Lake
Samsung PM9C1a MZ9L81T0HDLB
3049 MB/s +36%
Dell XPS 16 Core Ultra X7 358H
 
2509.02 MB/s +12%
Microsoft Surface Laptop 15 Gen 8
SK hynix PVC10 HFS256GEM4X182N
2239 MB/s
Media SK hynix PVC10 HFS256GEM4X182N
  (1427 - 2239, n=2)
1833 MB/s -18%
4K Read
Microsoft Surface Laptop 15 Gen 8
SK hynix PVC10 HFS256GEM4X182N
80.7 MB/s
Lenovo ThinkPad X9-15p Gen 1
Samsung PM9E1 1 TB MZVLC1T0HFLU
78.9 MB/s -2%
Asus Zenbook A16 UX3607
Samsung PM9C1b MZVL81T0HFLB-00BTW
65.7 MB/s -19%
Media SK hynix PVC10 HFS256GEM4X182N
  (47.2 - 80.7, n=2)
64 MB/s -21%
Media della classe Multimedia
  (17.5 - 89.9, n=49, ultimi 2 anni)
63.4 MB/s -21%
Microsoft Surface Laptop 7 15 Lunar Lake
Samsung PM9C1a MZ9L81T0HDLB
57.6 MB/s -29%
Dell XPS 16 Core Ultra X7 358H
 
52.53 MB/s -35%
4K Write
Asus Zenbook A16 UX3607
Samsung PM9C1b MZVL81T0HFLB-00BTW
225 MB/s +50%
Lenovo ThinkPad X9-15p Gen 1
Samsung PM9E1 1 TB MZVLC1T0HFLU
181.3 MB/s +20%
Media della classe Multimedia
  (43.1 - 265, n=49, ultimi 2 anni)
181 MB/s +20%
Microsoft Surface Laptop 15 Gen 8
SK hynix PVC10 HFS256GEM4X182N
150.5 MB/s
Media SK hynix PVC10 HFS256GEM4X182N
  (110.8 - 150.5, n=2)
130.7 MB/s -13%
Microsoft Surface Laptop 7 15 Lunar Lake
Samsung PM9C1a MZ9L81T0HDLB
130.6 MB/s -13%
Dell XPS 16 Core Ultra X7 358H
 
125.58 MB/s -17%
4K-64 Read
Lenovo ThinkPad X9-15p Gen 1
Samsung PM9E1 1 TB MZVLC1T0HFLU
3232 MB/s +99%
Microsoft Surface Laptop 15 Gen 8
SK hynix PVC10 HFS256GEM4X182N
1628 MB/s
Media SK hynix PVC10 HFS256GEM4X182N
  (1213 - 1628, n=2)
1421 MB/s -13%
Media della classe Multimedia
  (125.7 - 3394, n=49, ultimi 2 anni)
1220 MB/s -25%
Microsoft Surface Laptop 7 15 Lunar Lake
Samsung PM9C1a MZ9L81T0HDLB
945 MB/s -42%
Dell XPS 16 Core Ultra X7 358H
 
862.49 MB/s -47%
Asus Zenbook A16 UX3607
Samsung PM9C1b MZVL81T0HFLB-00BTW
583 MB/s -64%
4K-64 Write
Lenovo ThinkPad X9-15p Gen 1
Samsung PM9E1 1 TB MZVLC1T0HFLU
3710 MB/s +95%
Dell XPS 16 Core Ultra X7 358H
 
2900.39 MB/s +52%
Asus Zenbook A16 UX3607
Samsung PM9C1b MZVL81T0HFLB-00BTW
2825 MB/s +48%
Media della classe Multimedia
  (75.2 - 4042, n=49, ultimi 2 anni)
2261 MB/s +19%
Microsoft Surface Laptop 15 Gen 8
SK hynix PVC10 HFS256GEM4X182N
1903 MB/s
Microsoft Surface Laptop 7 15 Lunar Lake
Samsung PM9C1a MZ9L81T0HDLB
1281 MB/s -33%
Media SK hynix PVC10 HFS256GEM4X182N
  (252 - 1903, n=2)
1078 MB/s -43%
Access Time Read
Media SK hynix PVC10 HFS256GEM4X182N
  (0.087 - 0.162, n=2)
0.1245 ms * -43%
Microsoft Surface Laptop 15 Gen 8
SK hynix PVC10 HFS256GEM4X182N
0.087 ms *
Lenovo ThinkPad X9-15p Gen 1
Samsung PM9E1 1 TB MZVLC1T0HFLU
0.077 ms * +11%
Asus Zenbook A16 UX3607
Samsung PM9C1b MZVL81T0HFLB-00BTW
0.075 ms * +14%
Media della classe Multimedia
  (0.018 - 0.168, n=49, ultimi 2 anni)
0.06484 ms * +25%
Dell XPS 16 Core Ultra X7 358H
 
0.059 ms * +32%
Microsoft Surface Laptop 7 15 Lunar Lake
Samsung PM9C1a MZ9L81T0HDLB
0.034 ms * +61%
Access Time Write
Dell XPS 16 Core Ultra X7 358H
 
0.082 ms * -273%
Media della classe Multimedia
  (0.015 - 0.754, n=49, ultimi 2 anni)
0.0771 ms * -250%
Media SK hynix PVC10 HFS256GEM4X182N
  (0.022 - 0.045, n=2)
0.0335 ms * -52%
Microsoft Surface Laptop 7 15 Lunar Lake
Samsung PM9C1a MZ9L81T0HDLB
0.03 ms * -36%
Microsoft Surface Laptop 15 Gen 8
SK hynix PVC10 HFS256GEM4X182N
0.022 ms *
Lenovo ThinkPad X9-15p Gen 1
Samsung PM9E1 1 TB MZVLC1T0HFLU
0.021 ms * +5%
Asus Zenbook A16 UX3607
Samsung PM9C1b MZVL81T0HFLB-00BTW
0.019 ms * +14%

* ... Meglio usare valori piccoli

Limitazione del disco: ciclo di lettura DiskSpd, profondità della coda 8

0285570855114014251710199522802565285031353420370539904275456048455130541557005985627065556840712574107695798082658550883591209405969099751026010545108301111511400116851197012255125401282513110133951368013965Tooltip
Microsoft Surface Laptop 15 Gen 8 SK hynix PVC10 HFS256GEM4X182N; diskspd 2.0.17 f: Ø6131 (5502.51-6156.25) MB/s
Lenovo ThinkPad X9-15p Gen 1 Samsung PM9E1 1 TB MZVLC1T0HFLU; diskspd 2.0.17 f: Ø8537 (5788.93-14160.38) MB/s
Asus Zenbook A16 UX3607 Samsung PM9C1b MZVL81T0HFLB-00BTW; diskspd 2.0.17 f: Ø6739 (2925.13-6893.49) MB/s
Dell XPS 16 Core Ultra X7 358H  ; diskspd 2.0.17 f: Ø7017 (6000.16-7049.37) MB/s
Microsoft Surface Laptop 7 15 Lunar Lake Samsung PM9C1a MZ9L81T0HDLB; diskspd 2.0.17 f: Ø6146 (4937.32-6171.08) MB/s

Prestazioni della GPU e nei giochi

Il punto di forza della CPU Core Ultra X è la potente iGPU Arc B390, che è molto più veloce dell'Adreno X2-85 presente nelle versioni con Snapdragon. Tuttavia, il Surface Laptop non può sfruttarne appieno il potenziale a causa del calo a 35 Watt sotto carichi di lavoro prolungati, che comporta una riduzione delle prestazioni di circa il 20 % dopo un paio di minuti, chiaramente percepibile anche nel nostro test di gioco con Cyberpunk. Non è l'ideale, ma l'Arc B390 rimane la scelta migliore per un portatile multimediale e non presenta nemmeno problemi di compatibilità con i giochi. 

3DMark Performance rating - Percent
Lenovo ThinkPad X9-15p Gen 1 -2!
Intel Arc B390 12 Xe3 Panther Lake iGPU, Intel Core Ultra X7 358H
98.5 pt
Dell XPS 16 Core Ultra X7 358H -2!
Intel Arc B390 12 Xe3 Panther Lake iGPU, Intel Core Ultra X7 358H
95.4 pt
Media della classe Multimedia
 
94.8 pt
Media Intel Arc B390 12 Xe3 Panther Lake iGPU
 
85.4 pt
Microsoft Surface Laptop 15 Gen 8
Intel Arc B390 12 Xe3 Panther Lake iGPU, Intel Core Ultra X7 368H
83.5 pt
Asus Zenbook A16 UX3607
Qualcomm Adreno X2-90, Qualcomm Snapdragon X2 Elite Extreme X2E-94-100
64.5 pt
Apple MacBook Air 15 M5 -3!
Apple M5 10-Core GPU, Apple M5 10-Core
57.2 pt
Microsoft Surface Laptop 7 15 Lunar Lake
Intel Arc Graphics 140V, Intel Core Ultra 7 268V
54.7 pt
Microsoft Surface Pro 13 OLED
Qualcomm Adreno X2-85, Qualcomm Snapdragon X2 Elite X2E-78-100
40 pt
Microsoft Surface Laptop 8 13.8
Qualcomm SD X2 Adreno X2-45, Qualcomm Snapdragon X2 Plus X2P-64-100
34.8 pt
3DMark 11 - 1280x720 Performance GPU
Media della classe Multimedia
  (3749 - 60002, n=49, ultimi 2 anni)
19892 Points +3%
Microsoft Surface Laptop 15 Gen 8
Intel Arc B390 12 Xe3 Panther Lake iGPU, Intel Core Ultra X7 368H
19256 Points
Lenovo ThinkPad X9-15p Gen 1
Intel Arc B390 12 Xe3 Panther Lake iGPU, Intel Core Ultra X7 358H
18972 Points -1%
Media Intel Arc B390 12 Xe3 Panther Lake iGPU
  (14637 - 19804, n=16)
18495 Points -4%
Dell XPS 16 Core Ultra X7 358H
Intel Arc B390 12 Xe3 Panther Lake iGPU, Intel Core Ultra X7 358H
18308 Points -5%
Asus Zenbook A16 UX3607
Qualcomm Adreno X2-90, Qualcomm Snapdragon X2 Elite Extreme X2E-94-100
13847 Points -28%
Microsoft Surface Laptop 7 15 Lunar Lake
Intel Arc Graphics 140V, Intel Core Ultra 7 268V
12772 Points -34%
Microsoft Surface Pro 13 OLED
Qualcomm Adreno X2-85, Qualcomm Snapdragon X2 Elite X2E-78-100
8565 Points -56%
Microsoft Surface Laptop 8 13.8
Qualcomm SD X2 Adreno X2-45, Qualcomm Snapdragon X2 Plus X2P-64-100
7647 Points -60%
3DMark
1920x1080 Fire Strike Graphics
Lenovo ThinkPad X9-15p Gen 1
Intel Arc B390 12 Xe3 Panther Lake iGPU, Intel Core Ultra X7 358H
17351 Points +3%
Dell XPS 16 Core Ultra X7 358H
Intel Arc B390 12 Xe3 Panther Lake iGPU, Intel Core Ultra X7 358H
17018 Points +1%
Microsoft Surface Laptop 15 Gen 8
Intel Arc B390 12 Xe3 Panther Lake iGPU, Intel Core Ultra X7 368H
16839 Points
Media Intel Arc B390 12 Xe3 Panther Lake iGPU
  (13410 - 18327, n=16)
16743 Points -1%
Media della classe Multimedia
  (2328 - 48907, n=53, ultimi 2 anni)
15695 Points -7%
Asus Zenbook A16 UX3607
Qualcomm Adreno X2-90, Qualcomm Snapdragon X2 Elite Extreme X2E-94-100
11834 Points -30%
Microsoft Surface Laptop 7 15 Lunar Lake
Intel Arc Graphics 140V, Intel Core Ultra 7 268V
10476 Points -38%
Microsoft Surface Pro 13 OLED
Qualcomm Adreno X2-85, Qualcomm Snapdragon X2 Elite X2E-78-100
7617 Points -55%
Microsoft Surface Laptop 8 13.8
Qualcomm SD X2 Adreno X2-45, Qualcomm Snapdragon X2 Plus X2P-64-100
6626 Points -61%
2560x1440 Time Spy Graphics
Lenovo ThinkPad X9-15p Gen 1
Intel Arc B390 12 Xe3 Panther Lake iGPU, Intel Core Ultra X7 358H
7257 Points +13%
Dell XPS 16 Core Ultra X7 358H
Intel Arc B390 12 Xe3 Panther Lake iGPU, Intel Core Ultra X7 358H
6972 Points +9%
Media Intel Arc B390 12 Xe3 Panther Lake iGPU
  (4567 - 7257, n=23)
6497 Points +1%
Microsoft Surface Laptop 15 Gen 8
Intel Arc B390 12 Xe3 Panther Lake iGPU, Intel Core Ultra X7 368H
6407 Points
Media della classe Multimedia
  (696 - 19403, n=53, ultimi 2 anni)
6065 Points -5%
Microsoft Surface Laptop 7 15 Lunar Lake
Intel Arc Graphics 140V, Intel Core Ultra 7 268V
4415 Points -31%
Asus Zenbook A16 UX3607
Qualcomm Adreno X2-90, Qualcomm Snapdragon X2 Elite Extreme X2E-94-100
4064 Points -37%
Microsoft Surface Pro 13 OLED
Qualcomm Adreno X2-85, Qualcomm Snapdragon X2 Elite X2E-78-100
2605 Points -59%
Microsoft Surface Laptop 8 13.8
Qualcomm SD X2 Adreno X2-45, Qualcomm Snapdragon X2 Plus X2P-64-100
2262 Points -65%
Steel Nomad Score
Media della classe Multimedia
  (342 - 4959, n=39, ultimi 2 anni)
2011 Points +55%
Media Intel Arc B390 12 Xe3 Panther Lake iGPU
  (1301 - 1667, n=11)
1539 Points +18%
Microsoft Surface Laptop 15 Gen 8
Intel Arc B390 12 Xe3 Panther Lake iGPU, Intel Core Ultra X7 368H
1301 Points
Asus Zenbook A16 UX3607
Qualcomm Adreno X2-90, Qualcomm Snapdragon X2 Elite Extreme X2E-94-100
1264 Points -3%
Apple MacBook Air 15 M5
Apple M5 10-Core GPU, Apple M5 10-Core
1070 Points -18%
Microsoft Surface Laptop 7 15 Lunar Lake
Intel Arc Graphics 140V, Intel Core Ultra 7 268V
910 Points -30%
Microsoft Surface Pro 13 OLED
Qualcomm Adreno X2-85, Qualcomm Snapdragon X2 Elite X2E-78-100
711 Points -45%
Microsoft Surface Laptop 8 13.8
Qualcomm SD X2 Adreno X2-45, Qualcomm Snapdragon X2 Plus X2P-64-100
622 Points -52%
Steel Nomad Light Score
Media della classe Multimedia
  (2001 - 21012, n=38, ultimi 2 anni)
8315 Points +41%
Media Intel Arc B390 12 Xe3 Panther Lake iGPU
  (5562 - 6338, n=8)
5927 Points +1%
Microsoft Surface Laptop 15 Gen 8
Intel Arc B390 12 Xe3 Panther Lake iGPU, Intel Core Ultra X7 368H
5878 Points
Asus Zenbook A16 UX3607
Qualcomm Adreno X2-90, Qualcomm Snapdragon X2 Elite Extreme X2E-94-100
5492 Points -7%
Apple MacBook Air 15 M5
Apple M5 10-Core GPU, Apple M5 10-Core
5084 Points -14%
Microsoft Surface Laptop 7 15 Lunar Lake
Intel Arc Graphics 140V, Intel Core Ultra 7 268V
3555 Points -40%
Microsoft Surface Pro 13 OLED
Qualcomm Adreno X2-85, Qualcomm Snapdragon X2 Elite X2E-78-100
3464 Points -41%
Microsoft Surface Laptop 8 13.8
Qualcomm SD X2 Adreno X2-45, Qualcomm Snapdragon X2 Plus X2P-64-100
2935 Points -50%
3DMark 11 Performance
18531 punti
3DMark Fire Strike Score
13306 punti
3DMark Time Spy Score
6854 punti
3DMark Steel Nomad Score
1301 punti
3DMark Steel Nomad Light Score
5878 punti
Aiuto
Blender / v3.3 Classroom CPU
Microsoft Surface Laptop 7 15 Lunar Lake
Intel Arc Graphics 140V, Intel Core Ultra 7 268V
555 Seconds * -62%
Media della classe Multimedia
  (133 - 1042, n=57, ultimi 2 anni)
372 Seconds * -8%
Apple MacBook Air 15 M5
Apple M5 10-Core GPU, Apple M5 10-Core
344 Seconds * -0%
Microsoft Surface Laptop 15 Gen 8
Intel Arc B390 12 Xe3 Panther Lake iGPU, Intel Core Ultra X7 368H
343 Seconds *
Dell XPS 16 Core Ultra X7 358H
Intel Arc B390 12 Xe3 Panther Lake iGPU, Intel Core Ultra X7 358H
328 Seconds * +4%
Media Intel Arc B390 12 Xe3 Panther Lake iGPU
  (282 - 409, n=16)
327 Seconds * +5%
Asus Zenbook A16 UX3607
Qualcomm Adreno X2-90, Qualcomm Snapdragon X2 Elite Extreme X2E-94-100
320 Seconds * +7%
Lenovo ThinkPad X9-15p Gen 1
Intel Arc B390 12 Xe3 Panther Lake iGPU, Intel Core Ultra X7 358H
288 Seconds * +16%
Blender / v3.3 Classroom METAL
Apple MacBook Air 15 M5
Apple M5 10-Core GPU, Apple M5 10-Core
76.3 Seconds *
Media della classe Multimedia
  (17.8 - 68, n=6, ultimi 2 anni)
37.2 Seconds *
Blender / v3.3 Classroom oneAPI/Intel
Media della classe Multimedia
  (105 - 492, n=17, ultimi 2 anni)
249 Seconds *
Media Intel Arc B390 12 Xe3 Panther Lake iGPU
  (105 - 254, n=6)
131.5 Seconds *
Dell XPS 16 Core Ultra X7 358H
Intel Arc B390 12 Xe3 Panther Lake iGPU, Intel Core Ultra X7 358H
105 Seconds *

* ... Meglio usare valori piccoli

Performance rating - Percent
Media della classe Multimedia
 
95 pt
Lenovo ThinkPad X9-15p Gen 1 -1!
Intel Core Ultra X7 358H, Intel Arc B390 12 Xe3 Panther Lake iGPU
93 pt
Dell XPS 16 Core Ultra X7 358H
Intel Core Ultra X7 358H, Intel Arc B390 12 Xe3 Panther Lake iGPU
88.9 pt
Microsoft Surface Laptop 15 Gen 8
Intel Core Ultra X7 368H, Intel Arc B390 12 Xe3 Panther Lake iGPU
79.3 pt
Asus Zenbook A16 UX3607
Qualcomm Snapdragon X2 Elite Extreme X2E-94-100, Qualcomm Adreno X2-90
73.1 pt
Microsoft Surface Laptop 7 15 Lunar Lake
Intel Core Ultra 7 268V, Intel Arc Graphics 140V
60.5 pt
Apple MacBook Air 15 M5 -5!
Apple M5 10-Core, Apple M5 10-Core GPU
58.3 pt
Cyberpunk 2077 - 1920x1080 Ultra Preset (FSR off)
Lenovo ThinkPad X9-15p Gen 1
Intel Core Ultra X7 358H, Intel Arc B390 12 Xe3 Panther Lake iGPU
50.4 (41.6min, 39.8P1) fps +19%
Dell XPS 16 Core Ultra X7 358H
Intel Core Ultra X7 358H, Intel Arc B390 12 Xe3 Panther Lake iGPU
48.7 (40min, 37.6P1) fps +15%
Media della classe Multimedia
  (6.41 - 112.3, n=64, ultimi 2 anni)
45.3 fps +7%
Microsoft Surface Laptop 15 Gen 8
Intel Core Ultra X7 368H, Intel Arc B390 12 Xe3 Panther Lake iGPU
42.3 (33.3min) fps
Asus Zenbook A16 UX3607
Qualcomm Snapdragon X2 Elite Extreme X2E-94-100, Qualcomm Adreno X2-90
38.2 (30.9min) fps -10%
Microsoft Surface Laptop 7 15 Lunar Lake
Intel Core Ultra 7 268V, Intel Arc Graphics 140V
29.6 (25min) fps -30%
Apple MacBook Air 15 M5
Apple M5 10-Core, Apple M5 10-Core GPU
23.3 fps -45%
Baldur's Gate 3 - 1920x1080 Ultra Preset AA:T
Media della classe Multimedia
  (7.8 - 158.7, n=61, ultimi 2 anni)
56 fps +20%
Dell XPS 16 Core Ultra X7 358H
Intel Core Ultra X7 358H, Intel Arc B390 12 Xe3 Panther Lake iGPU
54.3 (48.6min, 49.6P0.1, 51P1) fps +17%
Lenovo ThinkPad X9-15p Gen 1
Intel Core Ultra X7 358H, Intel Arc B390 12 Xe3 Panther Lake iGPU
50.1 (29.6min, 29.8P0.1, 29.9P1) fps +8%
Microsoft Surface Laptop 15 Gen 8
Intel Core Ultra X7 368H, Intel Arc B390 12 Xe3 Panther Lake iGPU
46.6 (42.1min, 42.2P0.1, 43.4P1) fps
Asus Zenbook A16 UX3607
Qualcomm Snapdragon X2 Elite Extreme X2E-94-100, Qualcomm Adreno X2-90
42.5 (28.7min, 29.8P0.1, 39.3P1) fps -9%
Apple MacBook Air 15 M5
Apple M5 10-Core, Apple M5 10-Core GPU
39.4 fps -15%
Microsoft Surface Laptop 7 15 Lunar Lake
Intel Core Ultra 7 268V, Intel Arc Graphics 140V
27.4 fps -41%
GTA V - 1920x1080 Highest AA:4xMSAA + FX AF:16x
Media della classe Multimedia
  (7.92 - 141.6, n=48, ultimi 2 anni)
55 fps +66%
Lenovo ThinkPad X9-15p Gen 1
Intel Core Ultra X7 358H, Intel Arc B390 12 Xe3 Panther Lake iGPU
46.2 (9.48min, 35.7P1) fps +39%
Dell XPS 16 Core Ultra X7 358H
Intel Core Ultra X7 358H, Intel Arc B390 12 Xe3 Panther Lake iGPU
45.2 (6.18min, 34.5P1) fps +36%
Asus Zenbook A16 UX3607
Qualcomm Snapdragon X2 Elite Extreme X2E-94-100, Qualcomm Adreno X2-90
41.1 (4.34min, 23.8P1) fps +24%
Microsoft Surface Laptop 15 Gen 8
Intel Core Ultra X7 368H, Intel Arc B390 12 Xe3 Panther Lake iGPU
33.2 (4.78min, 24.4P1) fps
Microsoft Surface Laptop 7 15 Lunar Lake
Intel Core Ultra 7 268V, Intel Arc Graphics 140V
25.3 (11.4min, 14.5P1) fps -24%
Final Fantasy XV Benchmark - 1920x1080 High Quality
Lenovo ThinkPad X9-15p Gen 1
Intel Core Ultra X7 358H, Intel Arc B390 12 Xe3 Panther Lake iGPU
57.9 fps +16%
Dell XPS 16 Core Ultra X7 358H
Intel Core Ultra X7 358H, Intel Arc B390 12 Xe3 Panther Lake iGPU
56.2 fps +12%
Media della classe Multimedia
  (7.61 - 144.4, n=51, ultimi 2 anni)
55.6 fps +11%
Microsoft Surface Laptop 15 Gen 8
Intel Core Ultra X7 368H, Intel Arc B390 12 Xe3 Panther Lake iGPU
50 fps
Microsoft Surface Laptop 7 15 Lunar Lake
Intel Core Ultra 7 268V, Intel Arc Graphics 140V
36.4 fps -27%
Asus Zenbook A16 UX3607
Qualcomm Snapdragon X2 Elite Extreme X2E-94-100, Qualcomm Adreno X2-90
34.5 fps -31%
Strange Brigade - 1920x1080 ultra AA:ultra AF:16
Media della classe Multimedia
  (13.3 - 303, n=50, ultimi 2 anni)
100.4 fps +13%
Dell XPS 16 Core Ultra X7 358H
Intel Core Ultra X7 358H, Intel Arc B390 12 Xe3 Panther Lake iGPU
90.6 (24.7min, 39.3P1) fps +2%
Microsoft Surface Laptop 15 Gen 8
Intel Core Ultra X7 368H, Intel Arc B390 12 Xe3 Panther Lake iGPU
89.2 (28.1min, 39.2P1) fps
Asus Zenbook A16 UX3607
Qualcomm Snapdragon X2 Elite Extreme X2E-94-100, Qualcomm Adreno X2-90
81.7 (17min, 25.1P1) fps -8%
Microsoft Surface Laptop 7 15 Lunar Lake
Intel Core Ultra 7 268V, Intel Arc Graphics 140V
61.7 (41.5min, 46.9P1) fps -31%
Dota 2 Reborn - 1920x1080 ultra (3/3) best looking
Lenovo ThinkPad X9-15p Gen 1
Intel Core Ultra X7 358H, Intel Arc B390 12 Xe3 Panther Lake iGPU
117.2 (87.1min) fps +47%
Dell XPS 16 Core Ultra X7 358H
Intel Core Ultra X7 358H, Intel Arc B390 12 Xe3 Panther Lake iGPU
96.9 (57min) fps +21%
Media della classe Multimedia
  (30.3 - 170.9, n=52, ultimi 2 anni)
92.8 fps +16%
Microsoft Surface Laptop 7 15 Lunar Lake
Intel Core Ultra 7 268V, Intel Arc Graphics 140V
82.4 (50.6min) fps +3%
Microsoft Surface Laptop 15 Gen 8
Intel Core Ultra X7 368H, Intel Arc B390 12 Xe3 Panther Lake iGPU
80 (48.4min) fps
Asus Zenbook A16 UX3607
Qualcomm Snapdragon X2 Elite Extreme X2E-94-100, Qualcomm Adreno X2-90
70.7 (51.1min) fps -12%
X-Plane 11.11 - 1920x1080 high (fps_test=3)
Media della classe Multimedia
  (16.9 - 103, n=50, ultimi 2 anni)
50.6 fps +19%
Lenovo ThinkPad X9-15p Gen 1
Intel Core Ultra X7 358H, Intel Arc B390 12 Xe3 Panther Lake iGPU
42.8 fps +1%
Asus Zenbook A16 UX3607
Qualcomm Snapdragon X2 Elite Extreme X2E-94-100, Qualcomm Adreno X2-90
42.6 fps 0%
Microsoft Surface Laptop 15 Gen 8
Intel Core Ultra X7 368H, Intel Arc B390 12 Xe3 Panther Lake iGPU
42.4 fps
Dell XPS 16 Core Ultra X7 358H
Intel Core Ultra X7 358H, Intel Arc B390 12 Xe3 Panther Lake iGPU
38.8 fps -8%
Microsoft Surface Laptop 7 15 Lunar Lake
Intel Core Ultra 7 268V, Intel Arc Graphics 140V
37.9 fps -11%

Grafico FPS di Cyberpunk 2077 con impostazioni ultra

051015202530354045Tooltip
Microsoft Surface Laptop 15 Gen 8 Ultra X7 368H, Arc B390 Panther Lake iGPU: Ø34.9 (28.4-37.5) fps
Lenovo ThinkPad X9-15p Gen 1 Ultra X7 358H, Arc B390 Panther Lake iGPU: Ø44.9 (42.5-46.2) fps
Asus Zenbook A16 UX3607 X2E-94-100, X2-90: Ø32.7 (31.5-33.5) fps
Dell XPS 16 Core Ultra X7 358H Ultra X7 358H, Arc B390 Panther Lake iGPU: Ø46 (42.5-47) fps
Microsoft Surface Laptop 7 15 Lunar Lake Core Ultra 7 268V, Arc 140V: Ø26.8 (25-28) fps
bassomedioaltoultra
GTA V (2015) 176.4 170.4 87.7 33.2
Dota 2 Reborn (2015) 127 85.6 86.9 80
Final Fantasy XV Benchmark (2018) 116.7 68.7 50
X-Plane 11.11 (2018) 61.8 50.2 42.4
Strange Brigade (2018) 307 120.8 101.7 89.2
Baldur's Gate 3 (2023) 71.6 54.3 47.7 46.6
Cyberpunk 2077 (2023) 67.9 60.4 50 42.3
F1 24 (2024) 111.5 109.1 82 28.5

Emissioni e consumo energetico

Rumore del sistema

Unità di raffreddamento

Il Surface Laptop 15 è generalmente un portatile molto silenzioso, ma il sistema di raffreddamento con una sola ventola ha difficoltà a gestire l'elevato TDP a breve termine di 65 watt, quindi la ventola diventa udibile piuttosto rapidamente con carichi di lavoro più intensi. Durante il gioco e il nostro stress test, misuriamo fino a 41,3 dB(A) e circa 36-37 dB(A) nelle due modalità operative meno potenti. Il carico sulla GPU ha inoltre causato un leggero coil whine sul nostro sistema di prova.

Rumorosità

Idle
24.9 / 24.9 / 24.9 dB(A)
Sotto carico
32.2 / 41.3 dB(A)
  red to green bar
 
 
30 dB
silenzioso
40 dB(A)
udibile
50 dB(A)
rumoroso
 
min: dark, med: mid, max: light   Earthworks M23R, Arta (15 cm di distanza)   Rumorosità ambientale: 24.9 dB(A)
dB(A) 0102030405060708090Deep BassMiddle BassHigh BassLower RangeMidsHigher MidsLower HighsMid HighsUpper HighsSuper Highs2042.340.438.242.72533.333.93533.93138.940.440.136.14040.841.439.639.55039.139.237.339.16335.735.832.532.18031.430.826.925.110028.632.927.324.612525.130.120.822.316025.527.52220.820026.228.524.121.225026.130.624.321.831528.42518.319.14003121.514.416.350031.422.312.614.163030.522.612.413.880028211112.1100027.319.810.912.8125029.319.910.712.616003320.710.412.2200032.62110.111.8250031.520.610.411.8315028.514.910.812.1400025.313.911.212.3500024.71811.512.4630023.816.911.812.6800027.713.711.612.61000018.213.211.612.41250015.313.311.412.21600013.212.410.611.5SPL41.332.224.925.5N3.81.70.70.7median 27.7median 20.7median 11.6median 12.6Delta2.66.13.32.9hearing rangehide median Fan NoiseMicrosoft Surface Laptop 15 Gen 8
Microsoft Surface Laptop 15 Gen 8
Ultra X7 368H, Arc B390 Panther Lake iGPU
Lenovo ThinkPad X9-15p Gen 1
Ultra X7 358H, Arc B390 Panther Lake iGPU
Asus Zenbook A16 UX3607
X2E-94-100, X2-90
Dell XPS 16 Core Ultra X7 358H
Ultra X7 358H, Arc B390 Panther Lake iGPU
Apple MacBook Air 15 M5
M5 10-Core, M5 10-Core GPU
Microsoft Surface Laptop 7 15 Lunar Lake
Core Ultra 7 268V, Arc 140V
Noise
3%
-5%
-2%
3%
off /ambiente * (dB)
24.9
22.9
8%
24.9
-0%
23.3
6%
23.9
4%
Idle Minimum * (dB)
24.9
22.9
8%
24.9
-0%
23.4
6%
23.9
4%
Idle Average * (dB)
24.9
22.9
8%
24.9
-0%
23.4
6%
23.9
4%
Idle Maximum * (dB)
24.9
22.9
8%
24.9
-0%
25.8
-4%
23.9
4%
Load Average * (dB)
32.2
31.4
2%
27.9
13%
38
-18%
31.8
1%
Cyberpunk 2077 ultra * (dB)
41.3
43.8
-6%
51.1
-24%
38.1
8%
38
8%
Load Maximum * (dB)
41.3
43.7
-6%
51.1
-24%
48.6
-18%
41.9
-1%

* ... Meglio usare valori piccoli

Temperatura

Le superfici in alluminio possono diventare piuttosto calde sotto carichi elevati, e lo si avverte chiaramente durante la digitazione. Il pannello inferiore rimane sensibilmente più fresco e non ci sono problemi a tenerlo sulle ginocchia. Durante il nostro stress test, la CPU si stabilizza rapidamente a 28 Watt (~79 °C).

Test di stress dei dati CPU/iGPU
Carico massimo
40.7 °C44.2 °C43 °C
40.2 °C41.5 °C35.6 °C
31.7 °C29.2 °C30.7 °C
Massima: 44.2 °C
Media: 37.4 °C
39.9 °C41 °C39.4 °C
37.2 °C38.2 °C37.2 °C
31.7 °C32.5 °C32 °C
Massima: 40.3 °C
Media: 36.3 °C
Alimentazione (max)  42.4 °C | Temperatura della stanza 21 °C | Fluke t3000FC (calibrated), Voltcraft IR-900
(±) La temperatura media del lato superiore sotto carico massimo e' di 37.4 °C / 99 F, rispetto alla media di 31.3 °C / 88 F per i dispositivi di questa classe Multimedia.
(±) La temperatura massima sul lato superiore è di 44.2 °C / 112 F, rispetto alla media di 36.8 °C / 98 F, che varia da 21 a 71 °C per questa classe Multimedia.
(±) Il lato inferiore si riscalda fino ad un massimo di 40.3 °C / 105 F, rispetto alla media di 39.1 °C / 102 F
(+) In idle, la temperatura media del lato superiore è di 25.4 °C / 78 F, rispetto alla media deld ispositivo di 31.3 °C / 88 F.
(±) 3: The average temperature for the upper side is 37.1 °C / 99 F, compared to the average of 31.3 °C / 88 F for the class Multimedia.
(+) I poggiapolsi e il touchpad sono piu' freddi della temperatura della pelle con un massimo di 31.7 °C / 89.1 F e sono quindi freddi al tatto.
(-) La temperatura media della zona del palmo della mano di dispositivi simili e'stata di 28.7 °C / 83.7 F (-3 °C / -5.4 F).
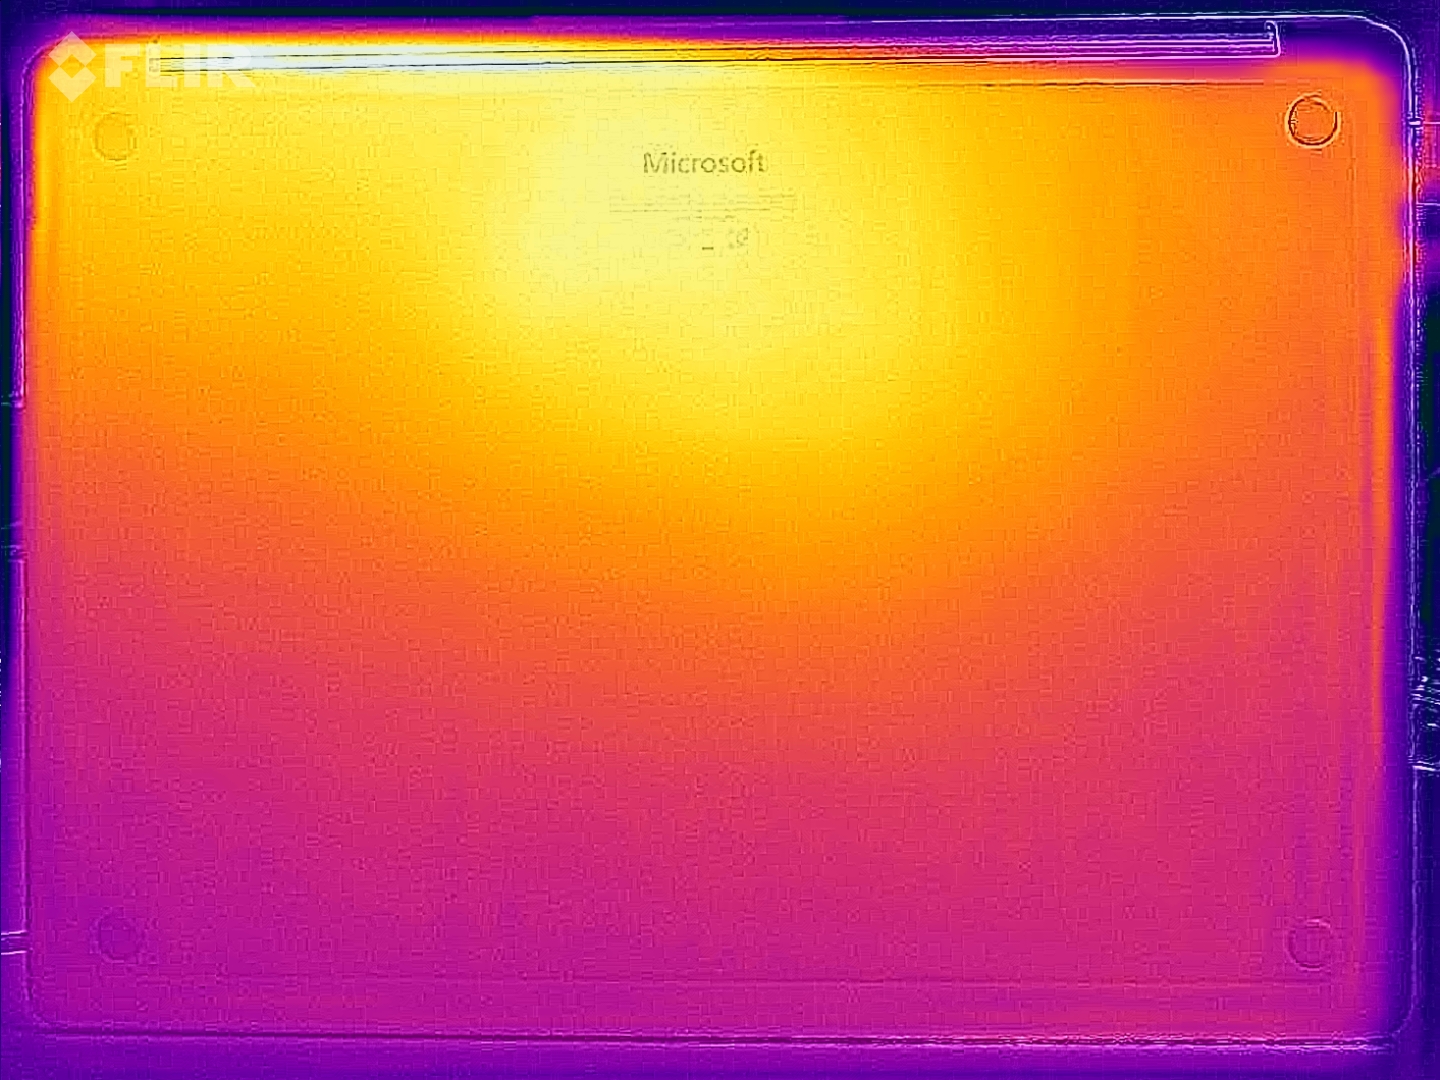
Stress test della mappa termica (in alto)
Stress test con mappa di calore (in basso)
Microsoft Surface Laptop 15 Gen 8
Ultra X7 368H, Arc B390 Panther Lake iGPU
Lenovo ThinkPad X9-15p Gen 1
Ultra X7 358H, Arc B390 Panther Lake iGPU
Asus Zenbook A16 UX3607
X2E-94-100, X2-90
Dell XPS 16 Core Ultra X7 358H
Ultra X7 358H, Arc B390 Panther Lake iGPU
Apple MacBook Air 15 M5
M5 10-Core, M5 10-Core GPU
Microsoft Surface Laptop 7 15 Lunar Lake
Core Ultra 7 268V, Arc 140V
Heat
-9%
-2%
7%
2%
3%
Maximum Upper Side * (°C)
44.2
43.3
2%
43.2
2%
40.6
8%
44.1
-0%
45.7
-3%
Maximum Bottom * (°C)
40.3
38.6
4%
43.3
-7%
39.8
1%
43.1
-7%
42.9
-6%
Idle Upper Side * (°C)
26
32.6
-25%
26.7
-3%
23.2
11%
24
8%
23.6
9%
Idle Bottom * (°C)
25.8
30.4
-18%
26
-1%
23.8
8%
23.9
7%
23.1
10%

* ... Meglio usare valori piccoli

Speakers

The sound system is still very good, even though the rivals are slightly superior.

dB(A) 0102030405060708090Deep BassMiddle BassHigh BassLower RangeMidsHigher MidsLower HighsMid HighsUpper HighsSuper Highs2038.242.4253533.43140.140.54039.642.15037.339.66332.534.68026.937.110027.34212520.847.51602251.320024.158.125024.360.531518.364.740014.463.150012.665.963012.464.68001168.4100010.971.6125010.770.8160010.471.1200010.170250010.468.3315010.871.7400011.267500011.565.1630011.866.2800011.665.31000011.662.11250011.4621600010.661.8SPL24.980.8N0.750.4median 11.6median 65.1Delta3.34.332.233.127.830.126.326.32829.135.135.621.822.81941.718.454.715.761.618.464.914.470.320.167.112.468.91371.31369.512.373.31275.411.971.312.367.712.467.911.762.812.461.312.360.512.760.612.660.112.664.714.566.412.465.812.370.11270.225.180.30.651.3median 12.4median 67.10.74.337.338.429.33024.725.526.131.42729.526.136.121.545.418.953.61860.116.76219.268.721.570.415.473.313.269.410.469.51173.19.978.510.574.610.874.710.574.410.672.811.972.512.871.913.669.41465.314.466.11468.713.26013.458.413.25524.984.50.665median 13.2median 69.435.134.430.125.621.323.921.219.421.428.424.821.432.619.852.916.560.314.161.514.464.614.464.11468.914.274.212.473.710.977.910.373.110.274.49.475.29.675.41073.41070.510.8731172.611.473.312.369.412.167.712.766.112.772.712.672.812.472.323.485.10.570median 12.3median 72.71.82.744.343.434.933.735.236.733.532.227.330.334.739.425.149.92254.918.260.918.159.720.466.322.268.41770.414.568.413.368.613.370.412.268.11267.911.773.211.773.911.571.31270.212.36912.373.612.775.112.775.912.876.612.973.612.870.212.759.625.284.80.766.8median 12.8median 70.223.240.442.830.834.230.432.534.935.728.63326.533.92139.318.84418.650.916.350.71857.918.761.215.564.912.562.711.366.411.467.210.769.910.168.710.368.810.670.210.969.711.365.311.46611.964.412.263.912.159.912.158.612.260.712.261.811.859.123.978.80.545.3median 12.1median 63.92.14.1hearing rangehide median Pink NoiseMicrosoft Surface Laptop 15 Gen 8Lenovo ThinkPad X9-15p Gen 1Asus Zenbook A16 UX3607Dell XPS 16 Core Ultra X7 358HApple MacBook Air 15 M5Microsoft Surface Laptop 7 15 Lunar Lake
Diagramma frequenza (le caselle possono essere selezionate/deselezionate per confrontare i dispositivi)
Microsoft Surface Laptop 15 Gen 8 analisi audio

(±) | potenza degli altiparlanti media ma buona (80.8 dB)
Bassi 100 - 315 Hz
(±) | bassi ridotti - in media 11.1% inferiori alla media
(±) | la linearità dei bassi è media (8.6% delta rispetto alla precedente frequenza)
Medi 400 - 2000 Hz
(+) | medi bilanciati - solo only 3.7% rispetto alla media
(+) | medi lineari (3.5% delta rispetto alla precedente frequenza)
Alti 2 - 16 kHz
(+) | Alti bilanciati - appena 2.3% dalla media
(+) | alti lineari (4.5% delta rispetto alla precedente frequenza)
Nel complesso 100 - 16.000 Hz
(+) | suono nel complesso lineare (11.1% differenza dalla media)
Rispetto alla stessa classe
» 17% di tutti i dispositivi testati in questa classe è stato migliore, 3% simile, 80% peggiore
» Il migliore ha avuto un delta di 5%, medio di 17%, peggiore di 45%
Rispetto a tutti i dispositivi testati
» 7% di tutti i dispositivi testati in questa classe è stato migliore, 2% similare, 91% peggiore
» Il migliore ha avuto un delta di 4%, medio di 23%, peggiore di 136%

Lenovo ThinkPad X9-15p Gen 1 analisi audio

(±) | potenza degli altiparlanti media ma buona (80.3 dB)
Bassi 100 - 315 Hz
(+) | bassi buoni - solo 4.2% dalla media
(±) | la linearità dei bassi è media (10.2% delta rispetto alla precedente frequenza)
Medi 400 - 2000 Hz
(+) | medi bilanciati - solo only 3.9% rispetto alla media
(+) | medi lineari (5.2% delta rispetto alla precedente frequenza)
Alti 2 - 16 kHz
(+) | Alti bilanciati - appena 4.3% dalla media
(+) | alti lineari (2.6% delta rispetto alla precedente frequenza)
Nel complesso 100 - 16.000 Hz
(+) | suono nel complesso lineare (8.9% differenza dalla media)
Rispetto alla stessa classe
» 11% di tutti i dispositivi testati in questa classe è stato migliore, 2% simile, 87% peggiore
» Il migliore ha avuto un delta di 5%, medio di 17%, peggiore di 45%
Rispetto a tutti i dispositivi testati
» 3% di tutti i dispositivi testati in questa classe è stato migliore, 1% similare, 96% peggiore
» Il migliore ha avuto un delta di 4%, medio di 23%, peggiore di 136%

Asus Zenbook A16 UX3607 analisi audio

(+) | gli altoparlanti sono relativamente potenti (84.5 dB)
Bassi 100 - 315 Hz
(±) | bassi ridotti - in media 6.4% inferiori alla media
(±) | la linearità dei bassi è media (8.3% delta rispetto alla precedente frequenza)
Medi 400 - 2000 Hz
(+) | medi bilanciati - solo only 3.9% rispetto alla media
(+) | medi lineari (4.2% delta rispetto alla precedente frequenza)
Alti 2 - 16 kHz
(+) | Alti bilanciati - appena 3.3% dalla media
(+) | alti lineari (5% delta rispetto alla precedente frequenza)
Nel complesso 100 - 16.000 Hz
(+) | suono nel complesso lineare (9.8% differenza dalla media)
Rispetto alla stessa classe
» 14% di tutti i dispositivi testati in questa classe è stato migliore, 2% simile, 84% peggiore
» Il migliore ha avuto un delta di 5%, medio di 17%, peggiore di 45%
Rispetto a tutti i dispositivi testati
» 4% di tutti i dispositivi testati in questa classe è stato migliore, 1% similare, 95% peggiore
» Il migliore ha avuto un delta di 4%, medio di 23%, peggiore di 136%

Dell XPS 16 Core Ultra X7 358H analisi audio

(+) | gli altoparlanti sono relativamente potenti (85.1 dB)
Bassi 100 - 315 Hz
(±) | bassi ridotti - in media 7.6% inferiori alla media
(+) | bassi in lineaa (6.1% delta rispetto alla precedente frequenza)
Medi 400 - 2000 Hz
(+) | medi bilanciati - solo only 2.1% rispetto alla media
(+) | medi lineari (3.4% delta rispetto alla precedente frequenza)
Alti 2 - 16 kHz
(+) | Alti bilanciati - appena 2.3% dalla media
(+) | alti lineari (4.1% delta rispetto alla precedente frequenza)
Nel complesso 100 - 16.000 Hz
(+) | suono nel complesso lineare (6.2% differenza dalla media)
Rispetto alla stessa classe
» 4% di tutti i dispositivi testati in questa classe è stato migliore, 0% simile, 96% peggiore
» Il migliore ha avuto un delta di 5%, medio di 17%, peggiore di 45%
Rispetto a tutti i dispositivi testati
» 0% di tutti i dispositivi testati in questa classe è stato migliore, 0% similare, 99% peggiore
» Il migliore ha avuto un delta di 4%, medio di 23%, peggiore di 136%

Apple MacBook Air 15 M5 analisi audio

(+) | gli altoparlanti sono relativamente potenti (84.8 dB)
Bassi 100 - 315 Hz
(±) | bassi ridotti - in media 6.8% inferiori alla media
(+) | bassi in lineaa (6.6% delta rispetto alla precedente frequenza)
Medi 400 - 2000 Hz
(+) | medi bilanciati - solo only 2% rispetto alla media
(+) | medi lineari (3.3% delta rispetto alla precedente frequenza)
Alti 2 - 16 kHz
(+) | Alti bilanciati - appena 3.6% dalla media
(+) | alti lineari (3.2% delta rispetto alla precedente frequenza)
Nel complesso 100 - 16.000 Hz
(+) | suono nel complesso lineare (7.7% differenza dalla media)
Rispetto alla stessa classe
» 2% di tutti i dispositivi testati in questa classe è stato migliore, 0% simile, 98% peggiore
» Il migliore ha avuto un delta di 5%, medio di 18%, peggiore di 53%
Rispetto a tutti i dispositivi testati
» 1% di tutti i dispositivi testati in questa classe è stato migliore, 0% similare, 98% peggiore
» Il migliore ha avuto un delta di 4%, medio di 23%, peggiore di 136%

Microsoft Surface Laptop 7 15 Lunar Lake analisi audio

(±) | potenza degli altiparlanti media ma buona (78.8 dB)
Bassi 100 - 315 Hz
(±) | bassi ridotti - in media 9.3% inferiori alla media
(±) | la linearità dei bassi è media (8.4% delta rispetto alla precedente frequenza)
Medi 400 - 2000 Hz
(+) | medi bilanciati - solo only 4.4% rispetto alla media
(+) | medi lineari (3% delta rispetto alla precedente frequenza)
Alti 2 - 16 kHz
(+) | Alti bilanciati - appena 2.4% dalla media
(+) | alti lineari (4.1% delta rispetto alla precedente frequenza)
Nel complesso 100 - 16.000 Hz
(+) | suono nel complesso lineare (11.4% differenza dalla media)
Rispetto alla stessa classe
» 4% di tutti i dispositivi testati in questa classe è stato migliore, 2% simile, 95% peggiore
» Il migliore ha avuto un delta di 7%, medio di 21%, peggiore di 53%
Rispetto a tutti i dispositivi testati
» 8% di tutti i dispositivi testati in questa classe è stato migliore, 2% similare, 90% peggiore
» Il migliore ha avuto un delta di 4%, medio di 23%, peggiore di 136%

Consumo energetico e durata della batteria

L'alimentatore da 65W è insufficiente.

La SKU Panther Lake è più efficiente in idle rispetto al vecchio modello Lunar Lake, nonostante il display aggiornato. L'autonomia della batteria nel nostro test Wi-Fi è comunque leggermente inferiore, a causa del TDP più elevato nel breve periodo. Tuttavia, i risultati sono ancora molto buoni, con quasi 16 ore nel nostro test Wi-Fi a 150 nit e 8,5 ore alla massima luminosità. L'alimentatore da 65W, però, è insufficiente, il che non sorprende considerando il TDP di breve durata pari a 65 watt. Ciò significa che la batteria deve essere utilizzata negli scenari di carico di picco. Abbiamo provato anche un alimentatore da 140W, ma il dispositivo semplicemente non accetta più potenza.

Consumo di corrente
Off / Standbydarklight 0.28 / 0.38 Watt
Idledarkmidlight 2 / 7.6 / 8.1 Watt
Sotto carico midlight 54.4 / 62.6 Watt
 color bar
Leggenda: min: dark, med: mid, max: light        Metrahit Energy

Consumo energetico Cyberpunk / Test di stress

051015202530354045505560Tooltip
Microsoft Surface Laptop 15 Gen 8; 1280x720 Prime95 28.10 and Furmark 1.25: Ø51.8 (46.4-62.3) Watt
Microsoft Surface Laptop 15 Gen 8; Idle 150cd/m2: Ø4.01 (3.89-4.61) Watt
Microsoft Surface Laptop 15 Gen 8; Cyberpunk 2077 FHD ultra no FSR 150cd: Ø51.1 (47.7-57.2) Watt

Consumo energetico del monitor esterno

051015202530354045505560Tooltip
Microsoft Surface Laptop 15 Gen 8; Prime95 V2810 Stress (external Monitor): Ø54.6 (38.9-62.5) Watt
Microsoft Surface Laptop 15 Gen 8; Cinebench R23 Single (external Monitor): Ø25.1 (23.8-34.4) Watt
Microsoft Surface Laptop 15 Gen 8; Cinebench R23 Multi (external Monitor): Ø57.3 (53.5-62.6) Watt
Microsoft Surface Laptop 15 Gen 8; 1280x720 FurMark 1.19 GPU Stress Test (external Monitor): Ø56.4 (50.3-61.2) Watt
Microsoft Surface Laptop 15 Gen 8; Idle 1min (external Monitor): Ø6.93 (6.67-7.61) Watt
Microsoft Surface Laptop 15 Gen 8; Cyberpunk 2077 FHD ultra no FSR (external Monitor): Ø51.8 (50.9-55.1) Watt
Autonomia della batteria
WiFi Websurfing
15ore 46minuti
WiFi Websurfing max. Brightness
8ore 35minuti
Battery Runtime
WiFi Websurfing
Lenovo ThinkPad X9-15p Gen 1
Ultra X7 358H, Arc B390 Panther Lake iGPU, 88 Wh (Edge 150, 60 Hz)
18.3 h +16%
Microsoft Surface Laptop 7 15 Lunar Lake
Core Ultra 7 268V, Arc 140V, 64 Wh
17.7 h +12%
Apple MacBook Air 15 M5
M5 10-Core, M5 10-Core GPU, 66.5 Wh
17.2 h +9%
Microsoft Surface Laptop 15 Gen 8
Ultra X7 368H, Arc B390 Panther Lake iGPU, 66 Wh
15.8 h
Asus Zenbook A16 UX3607
X2E-94-100, X2-90, 70 Wh
13 h -18%
Media della classe Multimedia
  (4.37 - 26.6, n=59, ultimi 2 anni)
13 h -18%
Dell XPS 16 Core Ultra X7 358H
Ultra X7 358H, Arc B390 Panther Lake iGPU, 70 Wh
10.3 h -35%
WiFi Websurfing max. Brightness
Lenovo ThinkPad X9-15p Gen 1
Ultra X7 358H, Arc B390 Panther Lake iGPU, 88 Wh (Edge 150, 30 - 120 Hz VRR)
9.6 h +12%
Lenovo ThinkPad X9-15p Gen 1
Ultra X7 358H, Arc B390 Panther Lake iGPU, 88 Wh (Edge 150, 60 Hz)
9.2 h +7%
Microsoft Surface Laptop 7 15 Lunar Lake
Core Ultra 7 268V, Arc 140V, 64 Wh
8.8 h +2%
Microsoft Surface Laptop 15 Gen 8
Ultra X7 368H, Arc B390 Panther Lake iGPU, 66 Wh
8.6 h
Media della classe Multimedia
  (3.53 - 11.6, n=30, ultimi 2 anni)
7.28 h -15%
Apple MacBook Air 15 M5
M5 10-Core, M5 10-Core GPU, 66.5 Wh
6.7 h -22%
Asus Zenbook A16 UX3607
X2E-94-100, X2-90, 70 Wh
6.4 h -26%

Valutazione Notebookcheck

Microsoft Surface Laptop 15 Gen 8 - 10/05/2026 v8
Andreas Osthoff

Chassis
84 / 98 → 86%
Tastiera
85%
Dispositivo di puntamento
94%
Connettività
75 / 80 → 93%
Peso
67 / 20-74 → 87%
Batteria
90 / 95 → 95%
Display
84%
Prestazioni di gioco
58 / 88 → 65%
Prestazioni Applicazioni
89 / 92 → 96%
AI Performance
90%
Temperatura
91%
Rumorosità
77 / 95 → 81%
Audio
87%
Fotocamera
40 / 75 → 53%
Media
75%
85%
Multimedia - Media ponderata
CO2 Emissions
77.1%
Materials
50%
Packaging
100%
Power Use
88.7%
Repairability
60%
Software Updates
22.3%
Recycle Logo Total Sustainability Score: 66.4%

Potenziali concorrenti a confronto

Immagine
Modello
Prezzo
Peso
Altezza
Schermo
1.
85.3%
Microsoft Surface Laptop 15 Gen 8
Intel Core Ultra X7 368H ⎘
Intel Arc B390 12 Xe3 Panther Lake iGPU ⎘
16 GB Memoria, 256 GB SSD
Amazon:
1. $238.94
Microsoft Surface Laptop 3 1...
2. $483.98
Microsoft Surface Laptop 5 1...
3. $685.00
Microsoft Surface Laptop 4 1...
Prezzo di listino: 2400€
1.7 kg18.3 mm15.00"
3270x2180
262 PPI
IPS
2.
89.9%
Lenovo ThinkPad X9-15p Gen 1
Intel Core Ultra X7 358H ⎘
Intel Arc B390 12 Xe3 Panther Lake iGPU ⎘
32 GB Memoria, 1024 GB SSD
Prezzo di listino: 2500 Euro1.5 kg18 mm15.30"
2880x1800
222 PPI
OLED
3.
87.5%
Asus Zenbook A16 UX3607
Qualcomm Snapdragon X2 Elite Extreme X2E-94-100 ⎘
Qualcomm Adreno X2-90 ⎘
48 GB Memoria, 1000 GB SSD
Amazon:
1. $2,299.99
ASUS Zenbook A16 AI Laptop, ...
2. $2,299.99
ASUS Zenbook A16 16" Laptop,...
3. $2,059.99
ASUS Zenbook A16 AI Laptop, ...
1.2 kg16.5 mm16.00"
2880x1800
212 PPI
OLED
4.
87.2%
Dell XPS 16 Core Ultra X7 358H
Intel Core Ultra X7 358H ⎘
Intel Arc B390 12 Xe3 Panther Lake iGPU ⎘
32 GB Memoria
Amazon:
1. $1,977.99
Dell Premium 16 (Previously ...
2. $2,599.00
Dell Premium 16 (XPS 16 2025...
3. $3,624.48
Dell 16 Premium (XPS 16 2025...
Prezzo di listino: 2350 USD
1.7 kg14.62 mm16.00"
3200x2000
236 PPI
OLED
5.
91.6%
Apple MacBook Air 15 M5
Apple M5 10-Core ⎘
Apple M5 10-Core GPU ⎘
32 GB Memoria, 2048 GB SSD
1.5 kg11.5 mm15.30"
2880x1864
224 PPI
IPS
6.
87.4%
Microsoft Surface Laptop 7 15 Lunar Lake
Intel Core Ultra 7 268V ⎘
Intel Arc Graphics 140V ⎘
32 GB Memoria, 1024 GB SSD
Prezzo di listino: 2760€1.7 kg18.3 mm15.00"
2496x1664
200 PPI
IPS

Transparency

La selezione dei dispositivi da recensire viene effettuata dalla nostra redazione. Il campione di prova è stato fornito all'autore come prestito dal produttore o dal rivenditore ai fini di questa recensione. L'istituto di credito non ha avuto alcuna influenza su questa recensione, né il produttore ne ha ricevuto una copia prima della pubblicazione. Non vi era alcun obbligo di pubblicare questa recensione. In quanto società mediatica indipendente, Notebookcheck non è soggetta all'autorità di produttori, rivenditori o editori.

Ecco come Notebookcheck esegue i test

Ogni anno, Notebookcheck esamina in modo indipendente centinaia di laptop e smartphone utilizzando procedure standardizzate per garantire che tutti i risultati siano comparabili. Da circa 20 anni sviluppiamo continuamente i nostri metodi di prova e nel frattempo stabiliamo gli standard di settore. Nei nostri laboratori di prova, tecnici ed editori esperti utilizzano apparecchiature di misurazione di alta qualità. Questi test comportano un processo di validazione in più fasi. Il nostro complesso sistema di valutazione si basa su centinaia di misurazioni e parametri di riferimento ben fondati, che mantengono l'obiettività.
Google LogoAdd as a preferred source on Google
Mail Logo
> Recensioni e prove di notebook, tablets e smartphones > Recensioni e prove > Recensioni e prove > Intel batte nettamente Snapdragon - Recensione del Microsoft Surface Laptop 15 Gen 8
Andreas Osthoff, 2026-10- 6 (Update: 2026-10- 6)