Verdetto - Apex 16 Max con prestazioni di gioco complete e pochi compromessi
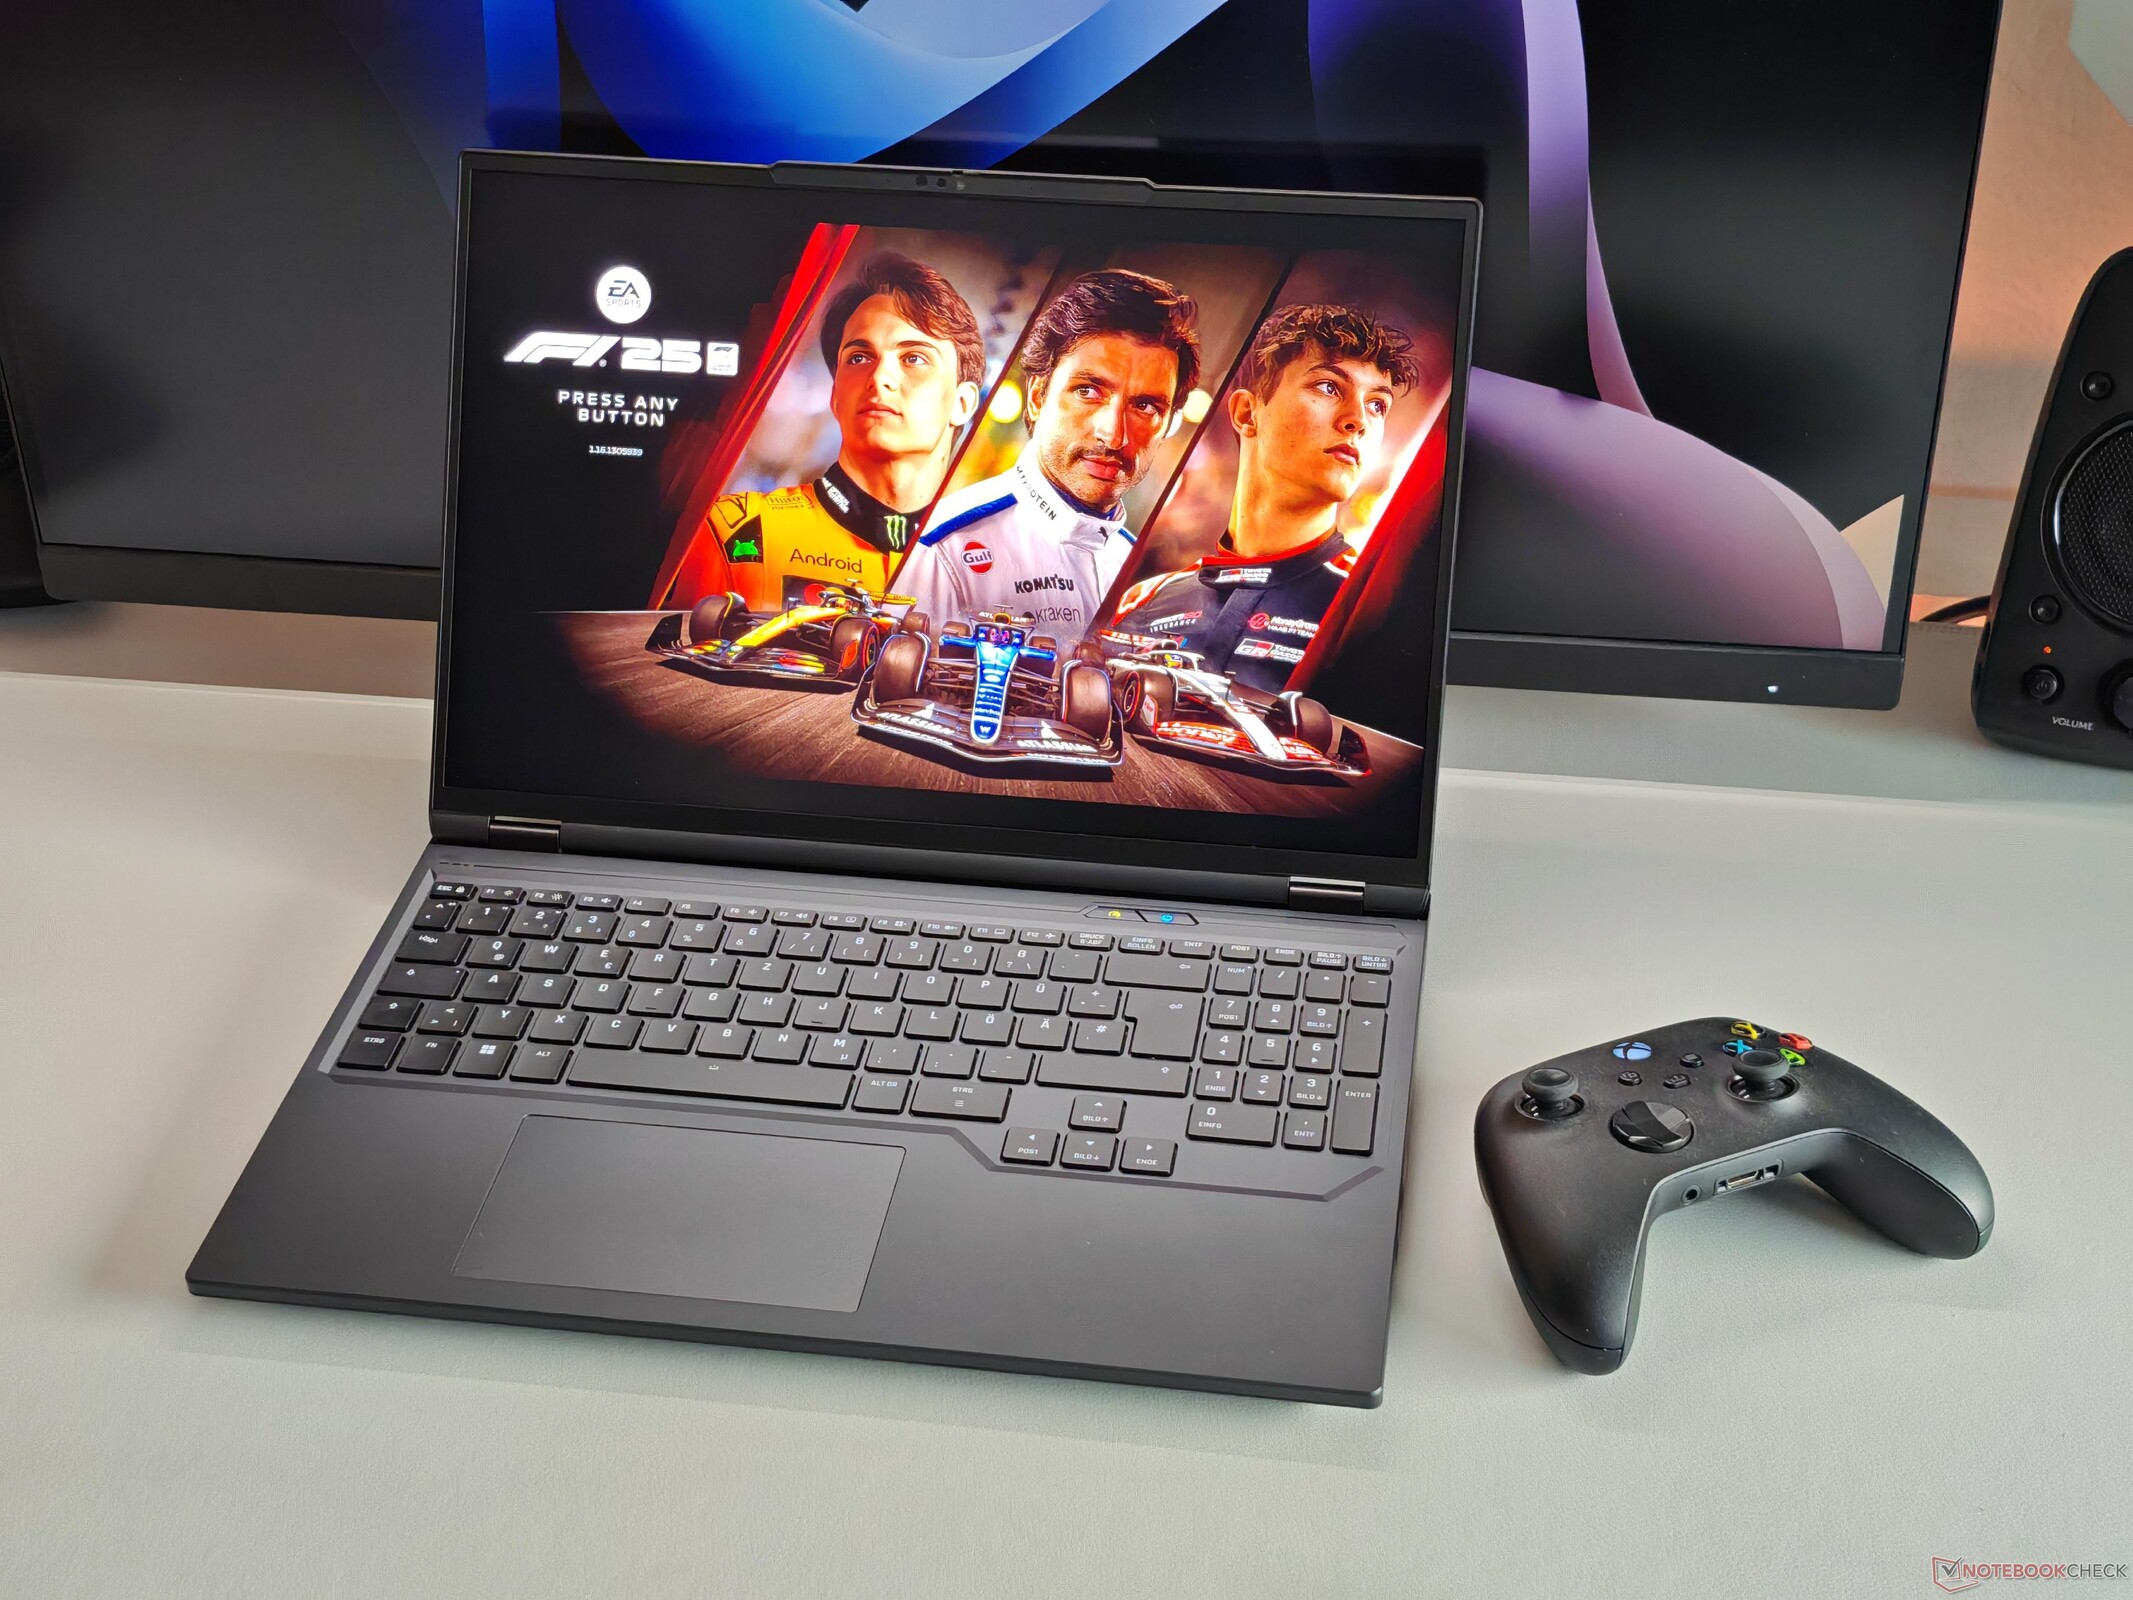
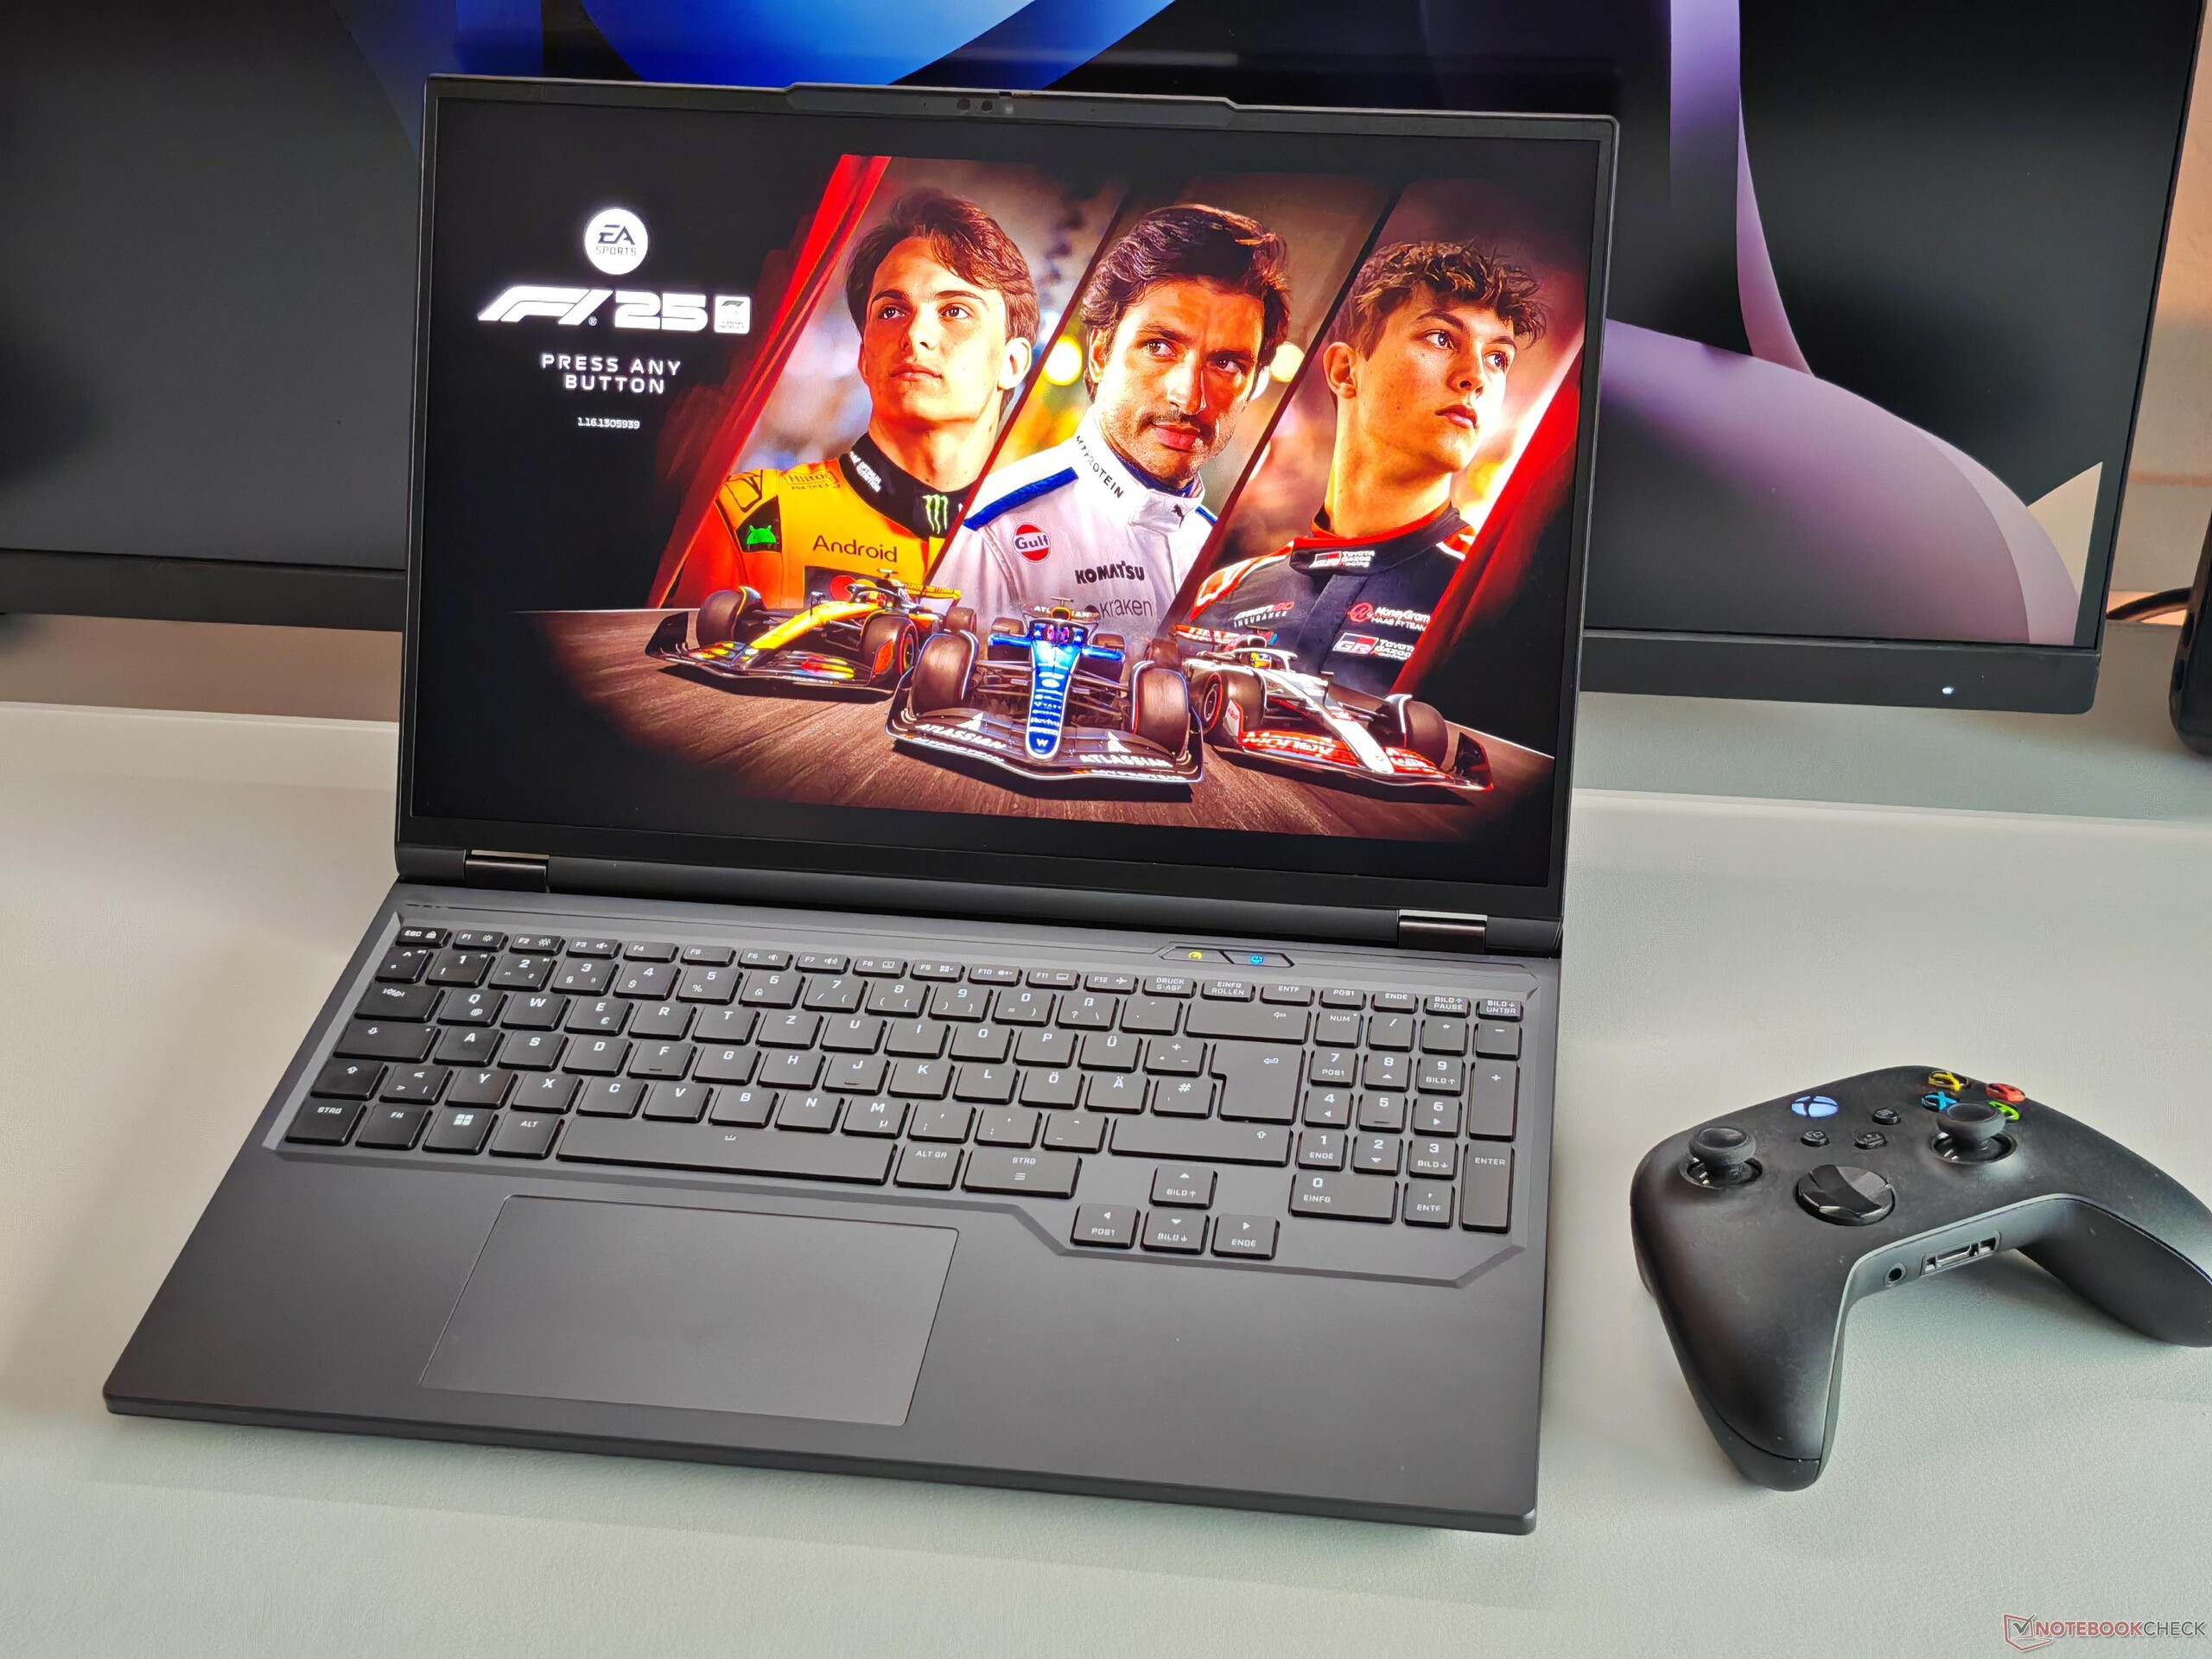
Grazie ai suoi componenti veloci, Apex 16 Max si concentra interamente sulle prestazioni di gioco e offre risultati convincenti. In combinazione con il pannello Mini-LED, i giochi HDR in particolare sono molto divertenti. Tuttavia, il display luminoso consuma anche molta energia e compromette la durata della batteria. Se ha bisogno di tempi di esecuzione più lunghi, dovrebbe optare per il pannello IPS.
Per mantenere il prezzo entry-level basso, XMG ha fatto alcuni compromessi (niente USB-C 4.0, niente Wi-Fi 7, niente Advanced Optimus e una base in plastica). Onestamente, però, nessuno di questi è un problema reale nel gioco di tutti i giorni, e accetteremmo volentieri questi compromessi in cambio di una RTX 5070 Ti con 12 GB di VRAM. Nel complesso, si tratta di un ottimo portatile da gioco a un prezzo equo.
Pro
Contro
Prezzo e disponibilità
XMG Apex 16 Max può essere configurato da Bestware a partire da 2.099 euro (circa 2.461 dollari).
Nota del traduttore: i computer portatili XMG non sono ufficialmente disponibili in Nord America.
Sommario
- Verdetto - Apex 16 Max con prestazioni di gioco complete e pochi compromessi
- Specifiche
- Valigetta e attrezzatura
- Dispositivi di input - Tastiera con illuminazione a tasto singolo
- Display - Mini LED da 1.000 cd/m²
- Prestazioni
- Emissioni ed energia
- Valutazione complessiva di Notebookcheck
- Possibili alternative a confronto
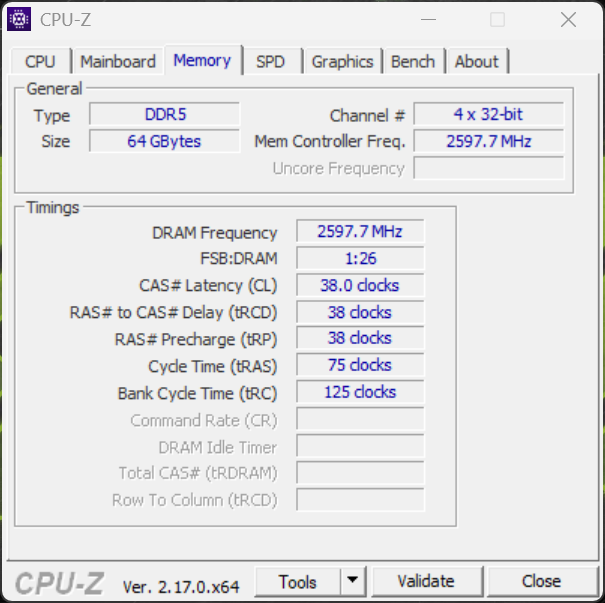
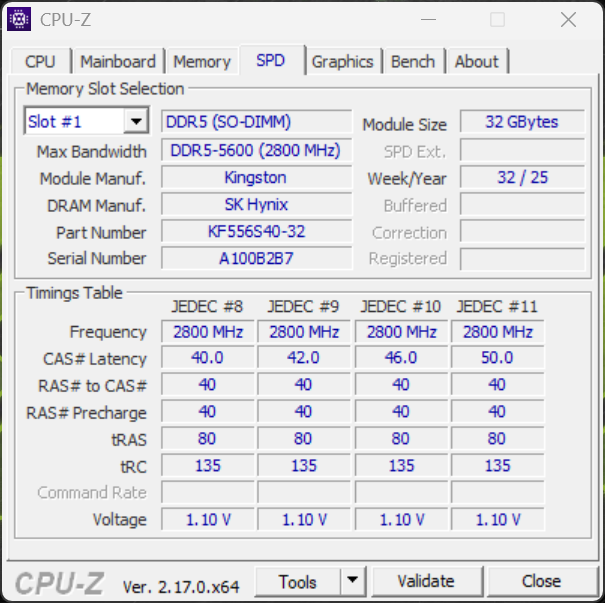
Con Apex 16 Max, XMG offre un potente computer portatile da gioco che dovrebbe interessare gli acquirenti più attenti al prezzo. Il prezzo di partenza con display IPS e RTX 5070 Ti è attualmente di circa 2.090 euro, mentre il nostro dispositivo di prova costa circa 2.800 euro, soprattutto grazie alla generosa configurazione di memoria (64 GB di RAM, 2 TB di SSD) e al pannello mini LED.
Con l'Apex 16 Max, XMG offre un potente computer portatile da gioco rivolto agli acquirenti più attenti al prezzo. Il prezzo di partenza con display IPS e RTX 5070 Ti è attualmente di circa 2.090 euro, mentre la nostra unità di recensione costa circa 2.800 euro (circa 3x283 dollari) - soprattutto grazie alla generosa configurazione di memoria (64 GB di RAM, 2 TB SSD) e al pannello Mini-LED.
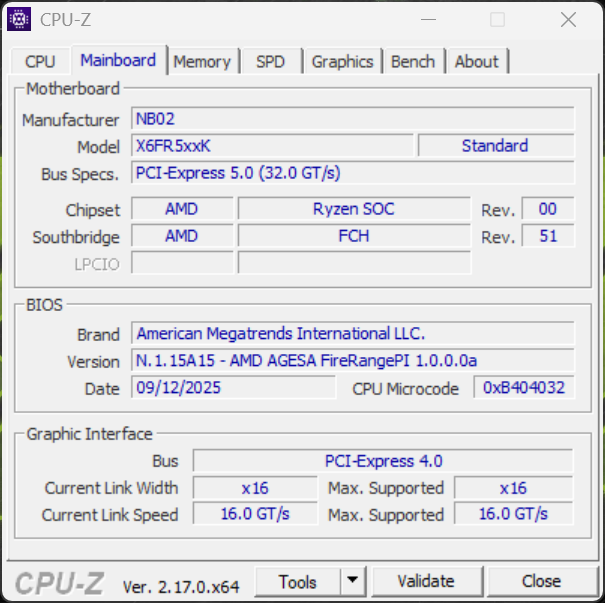
Specifiche
Valigetta e attrezzatura
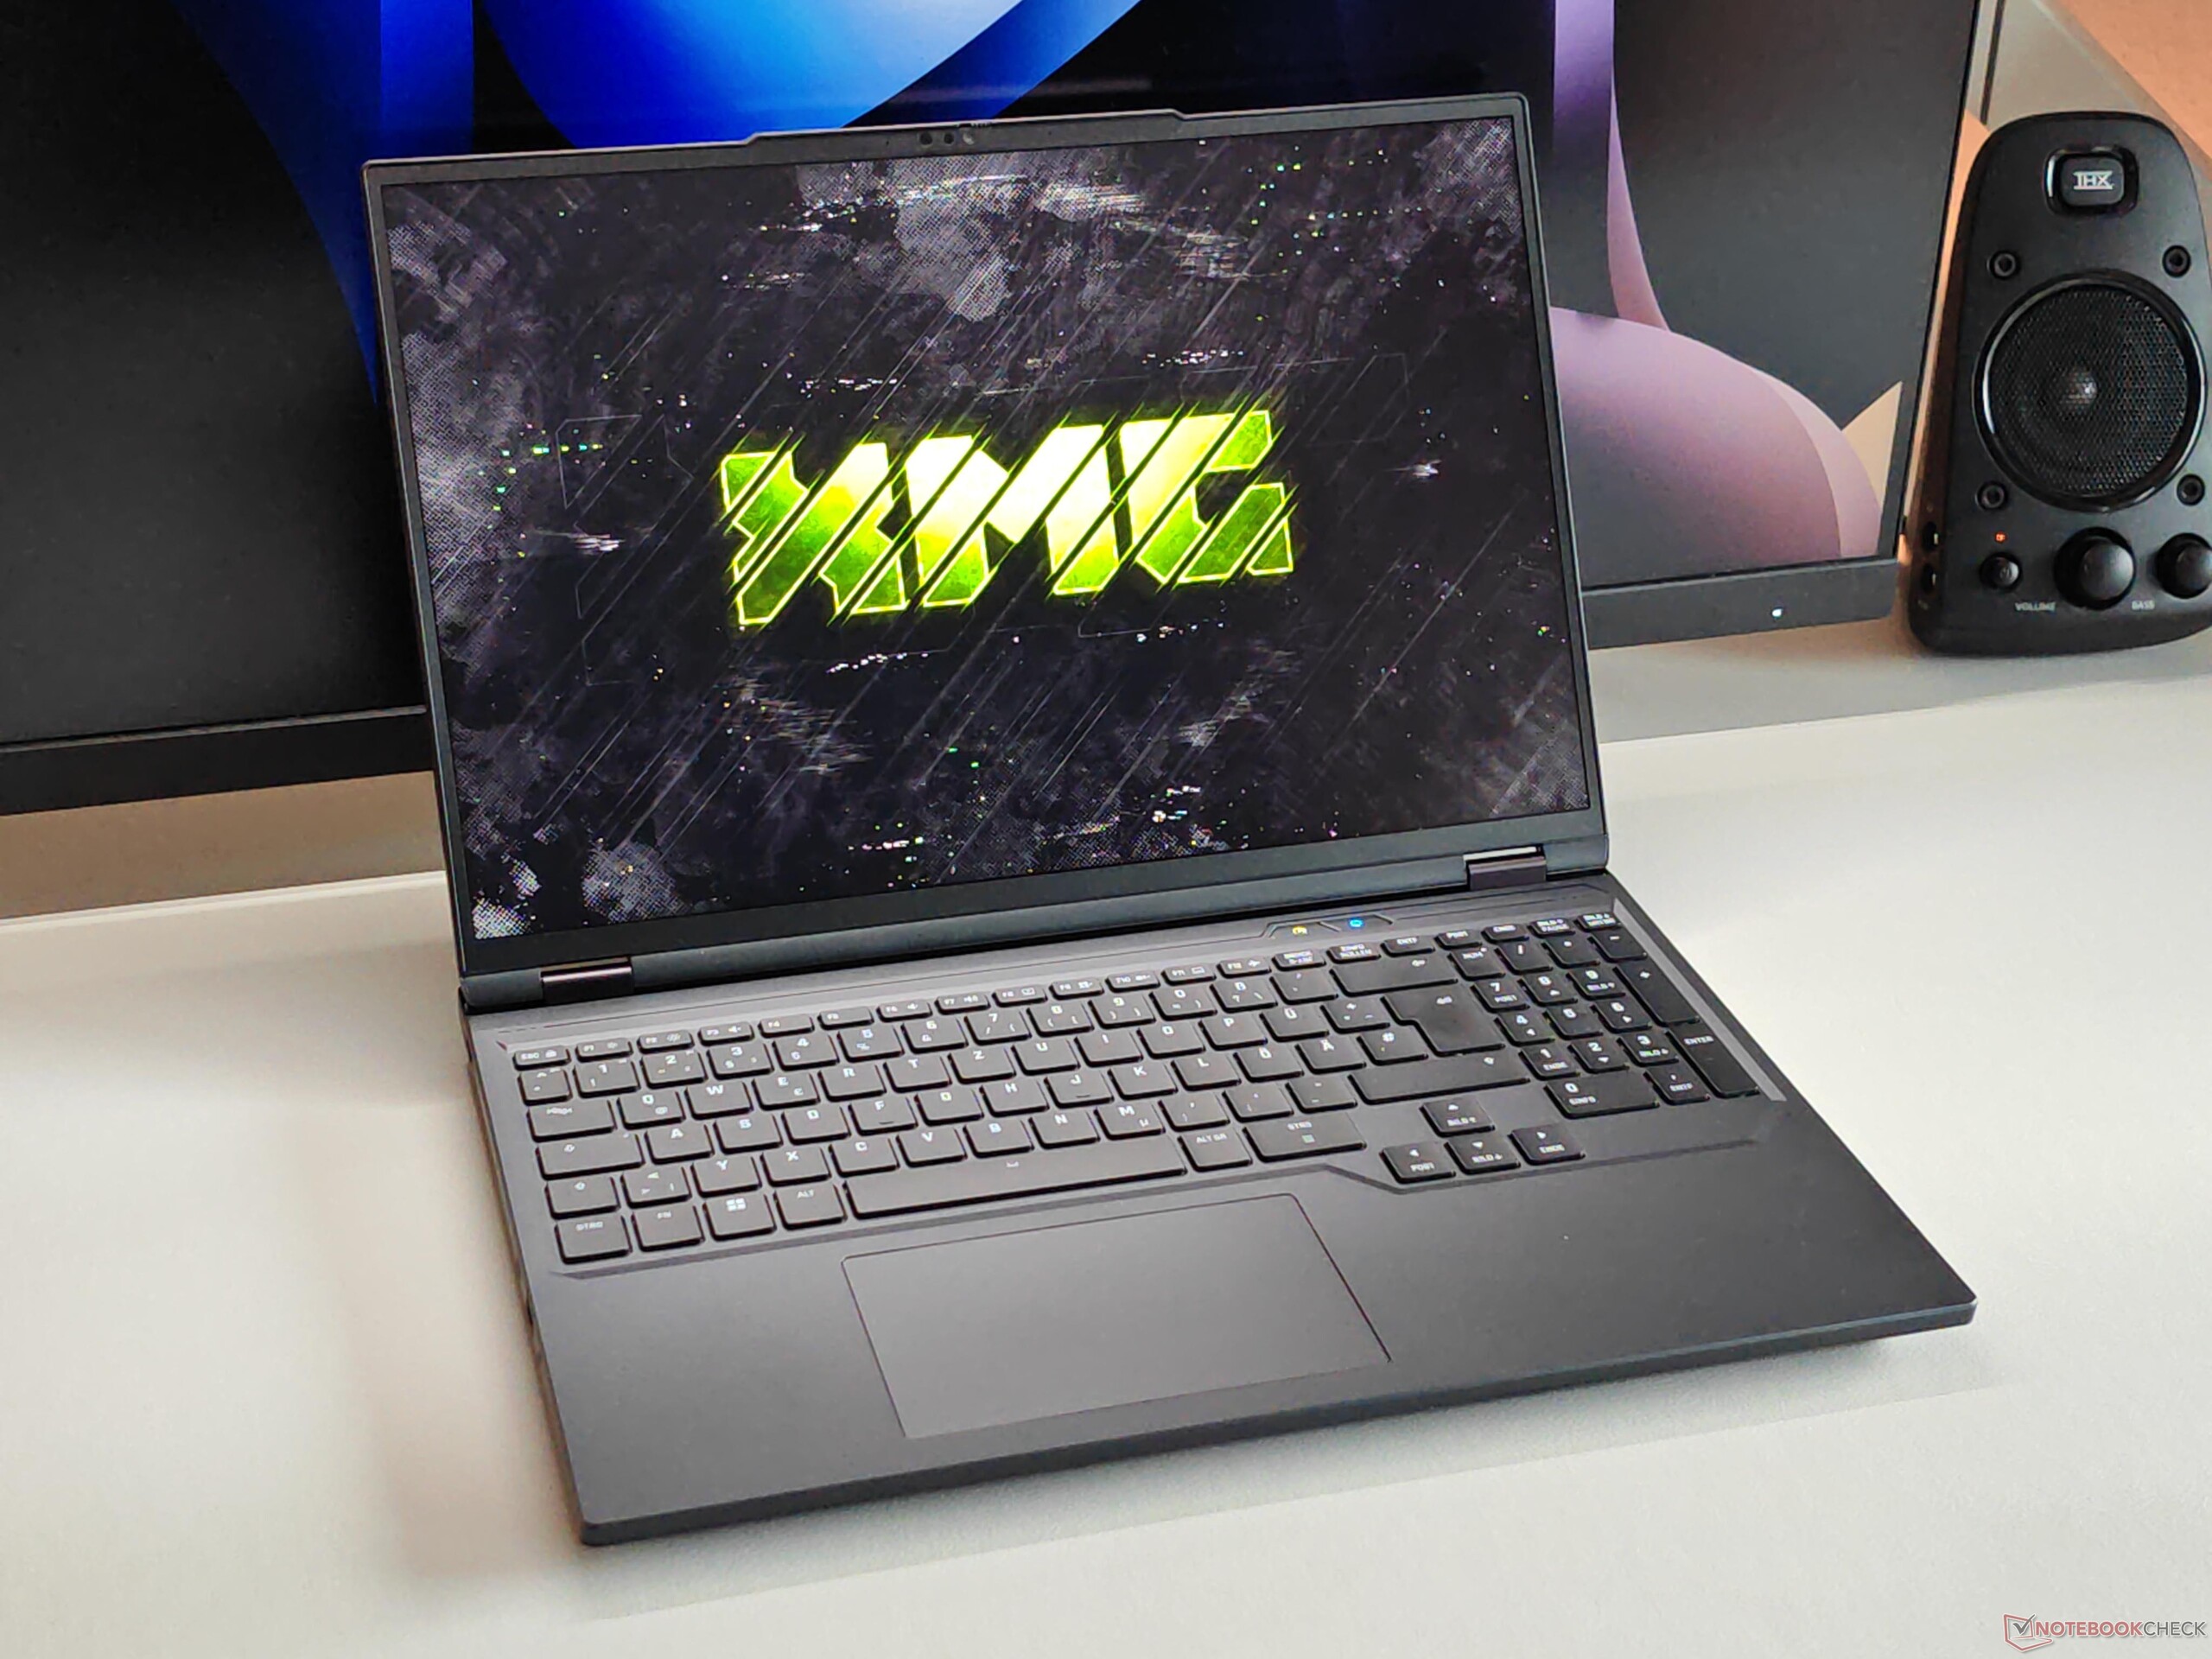
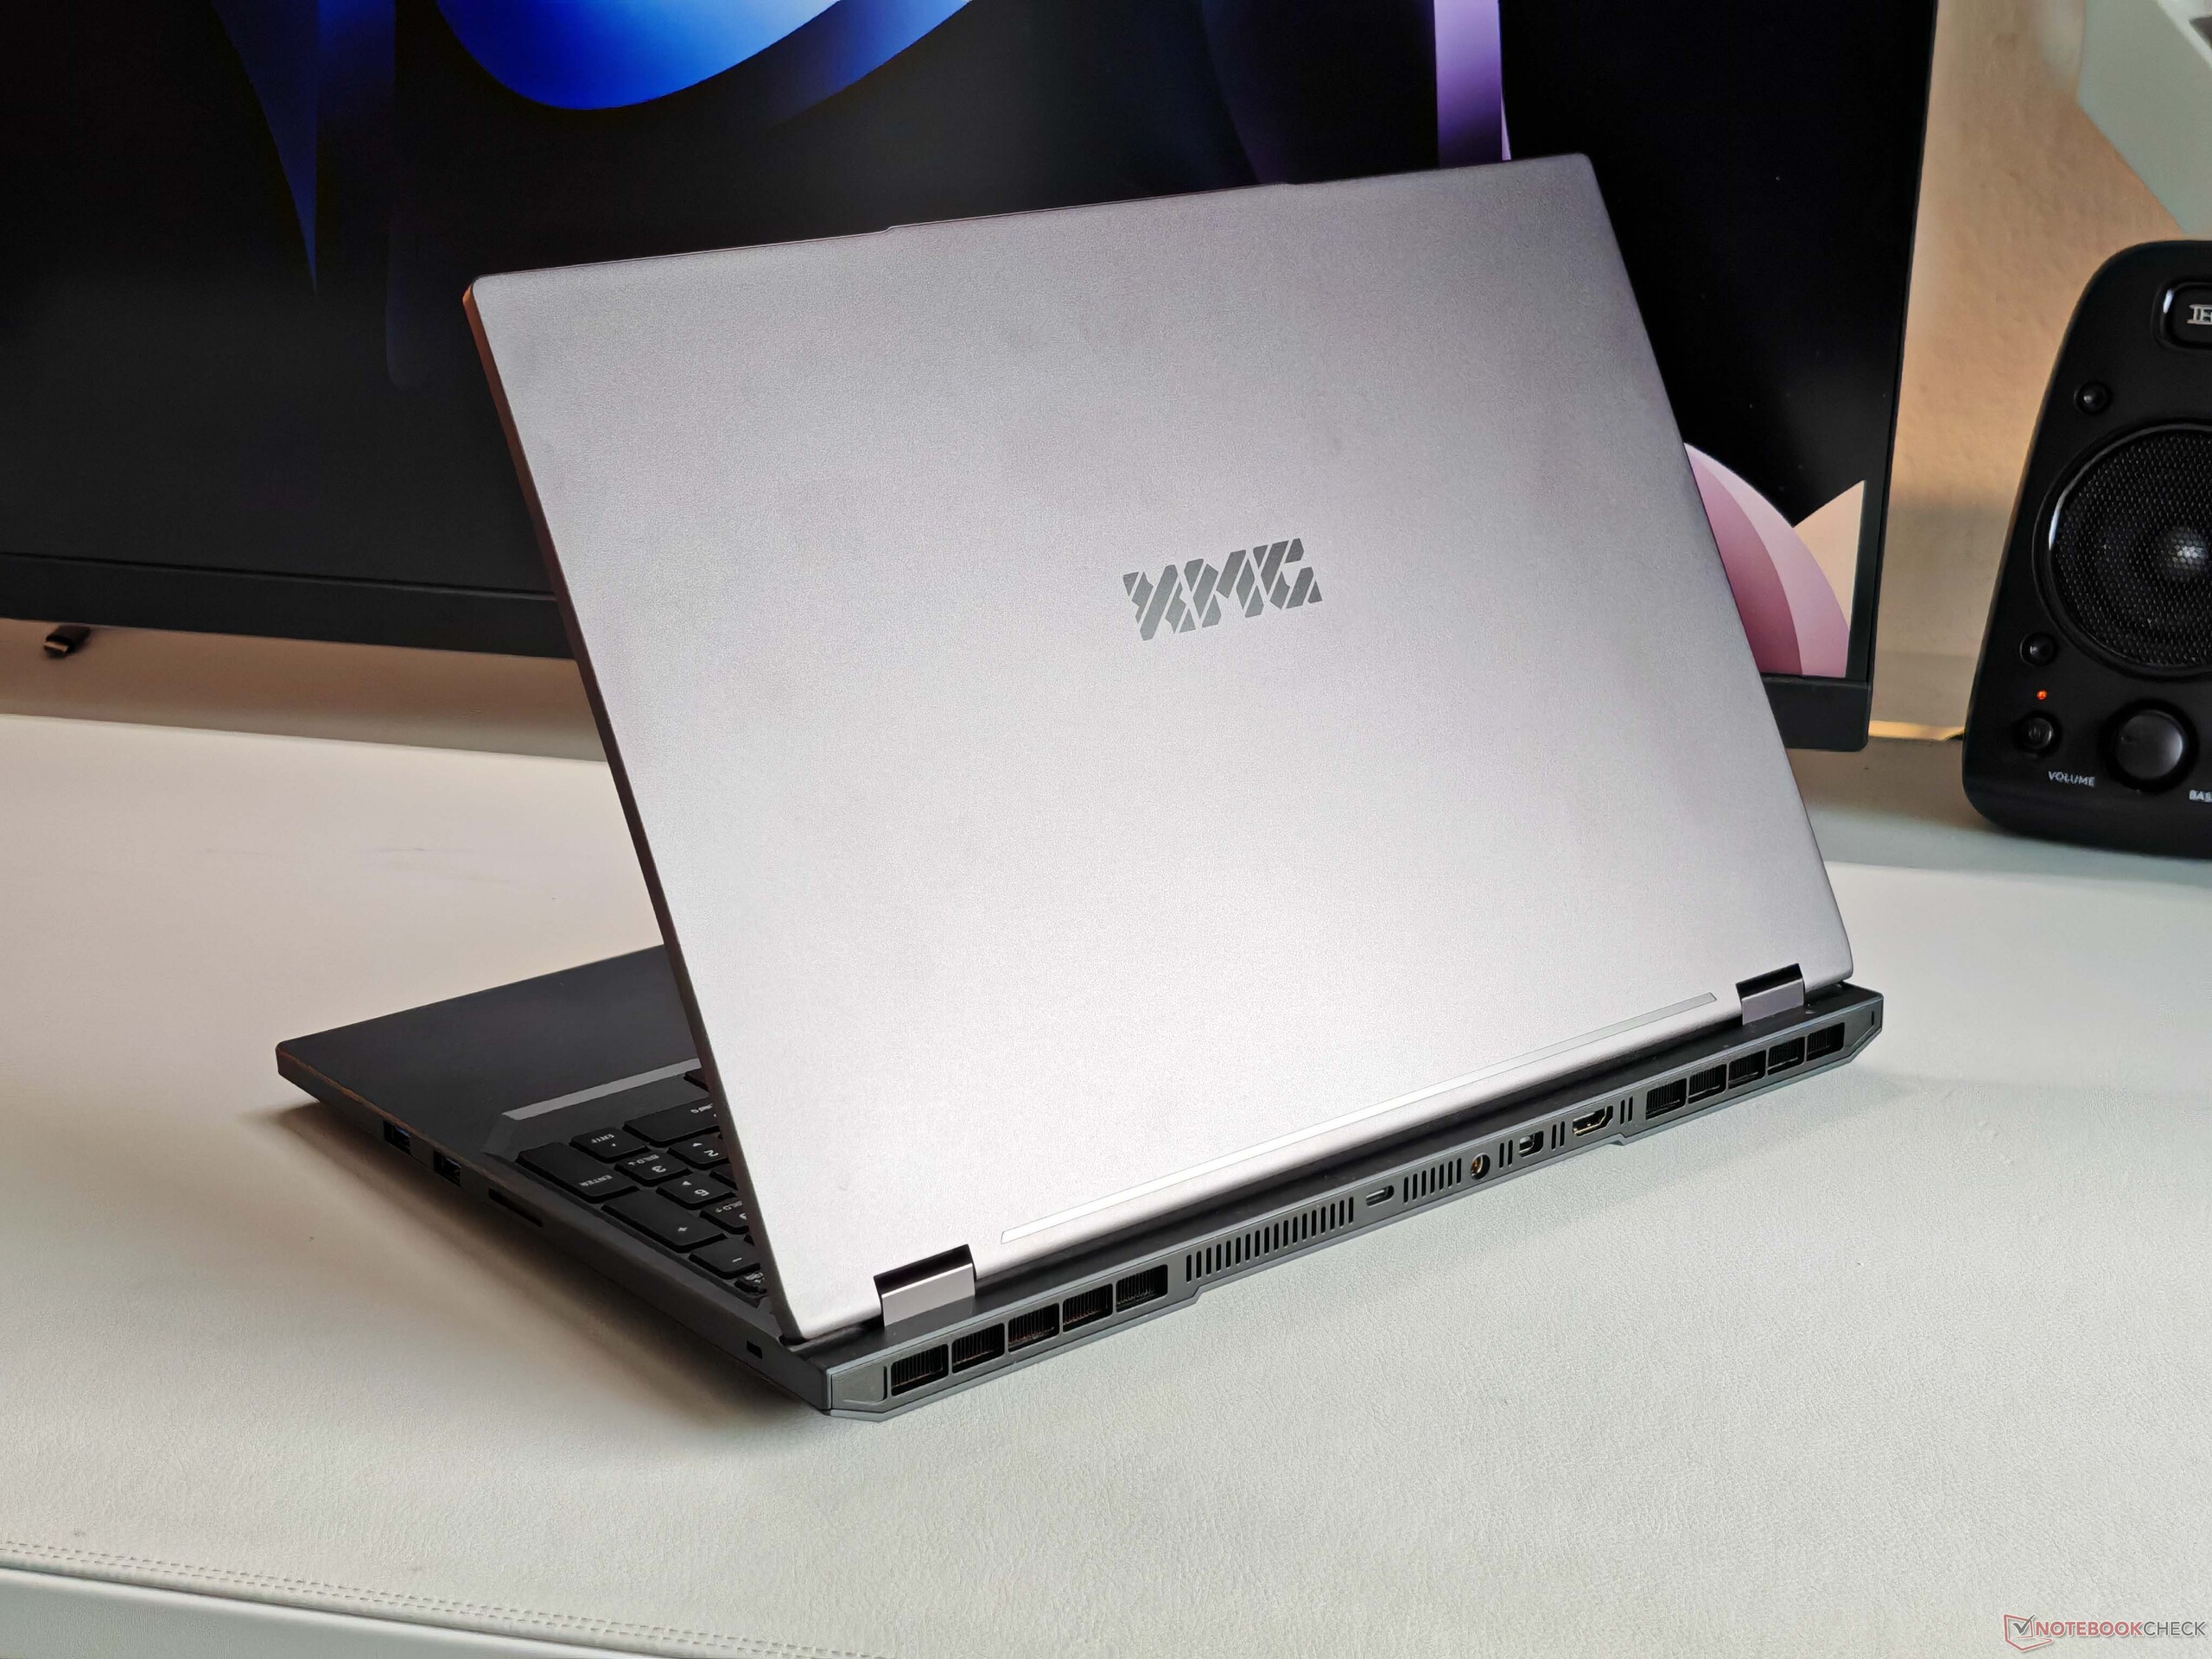
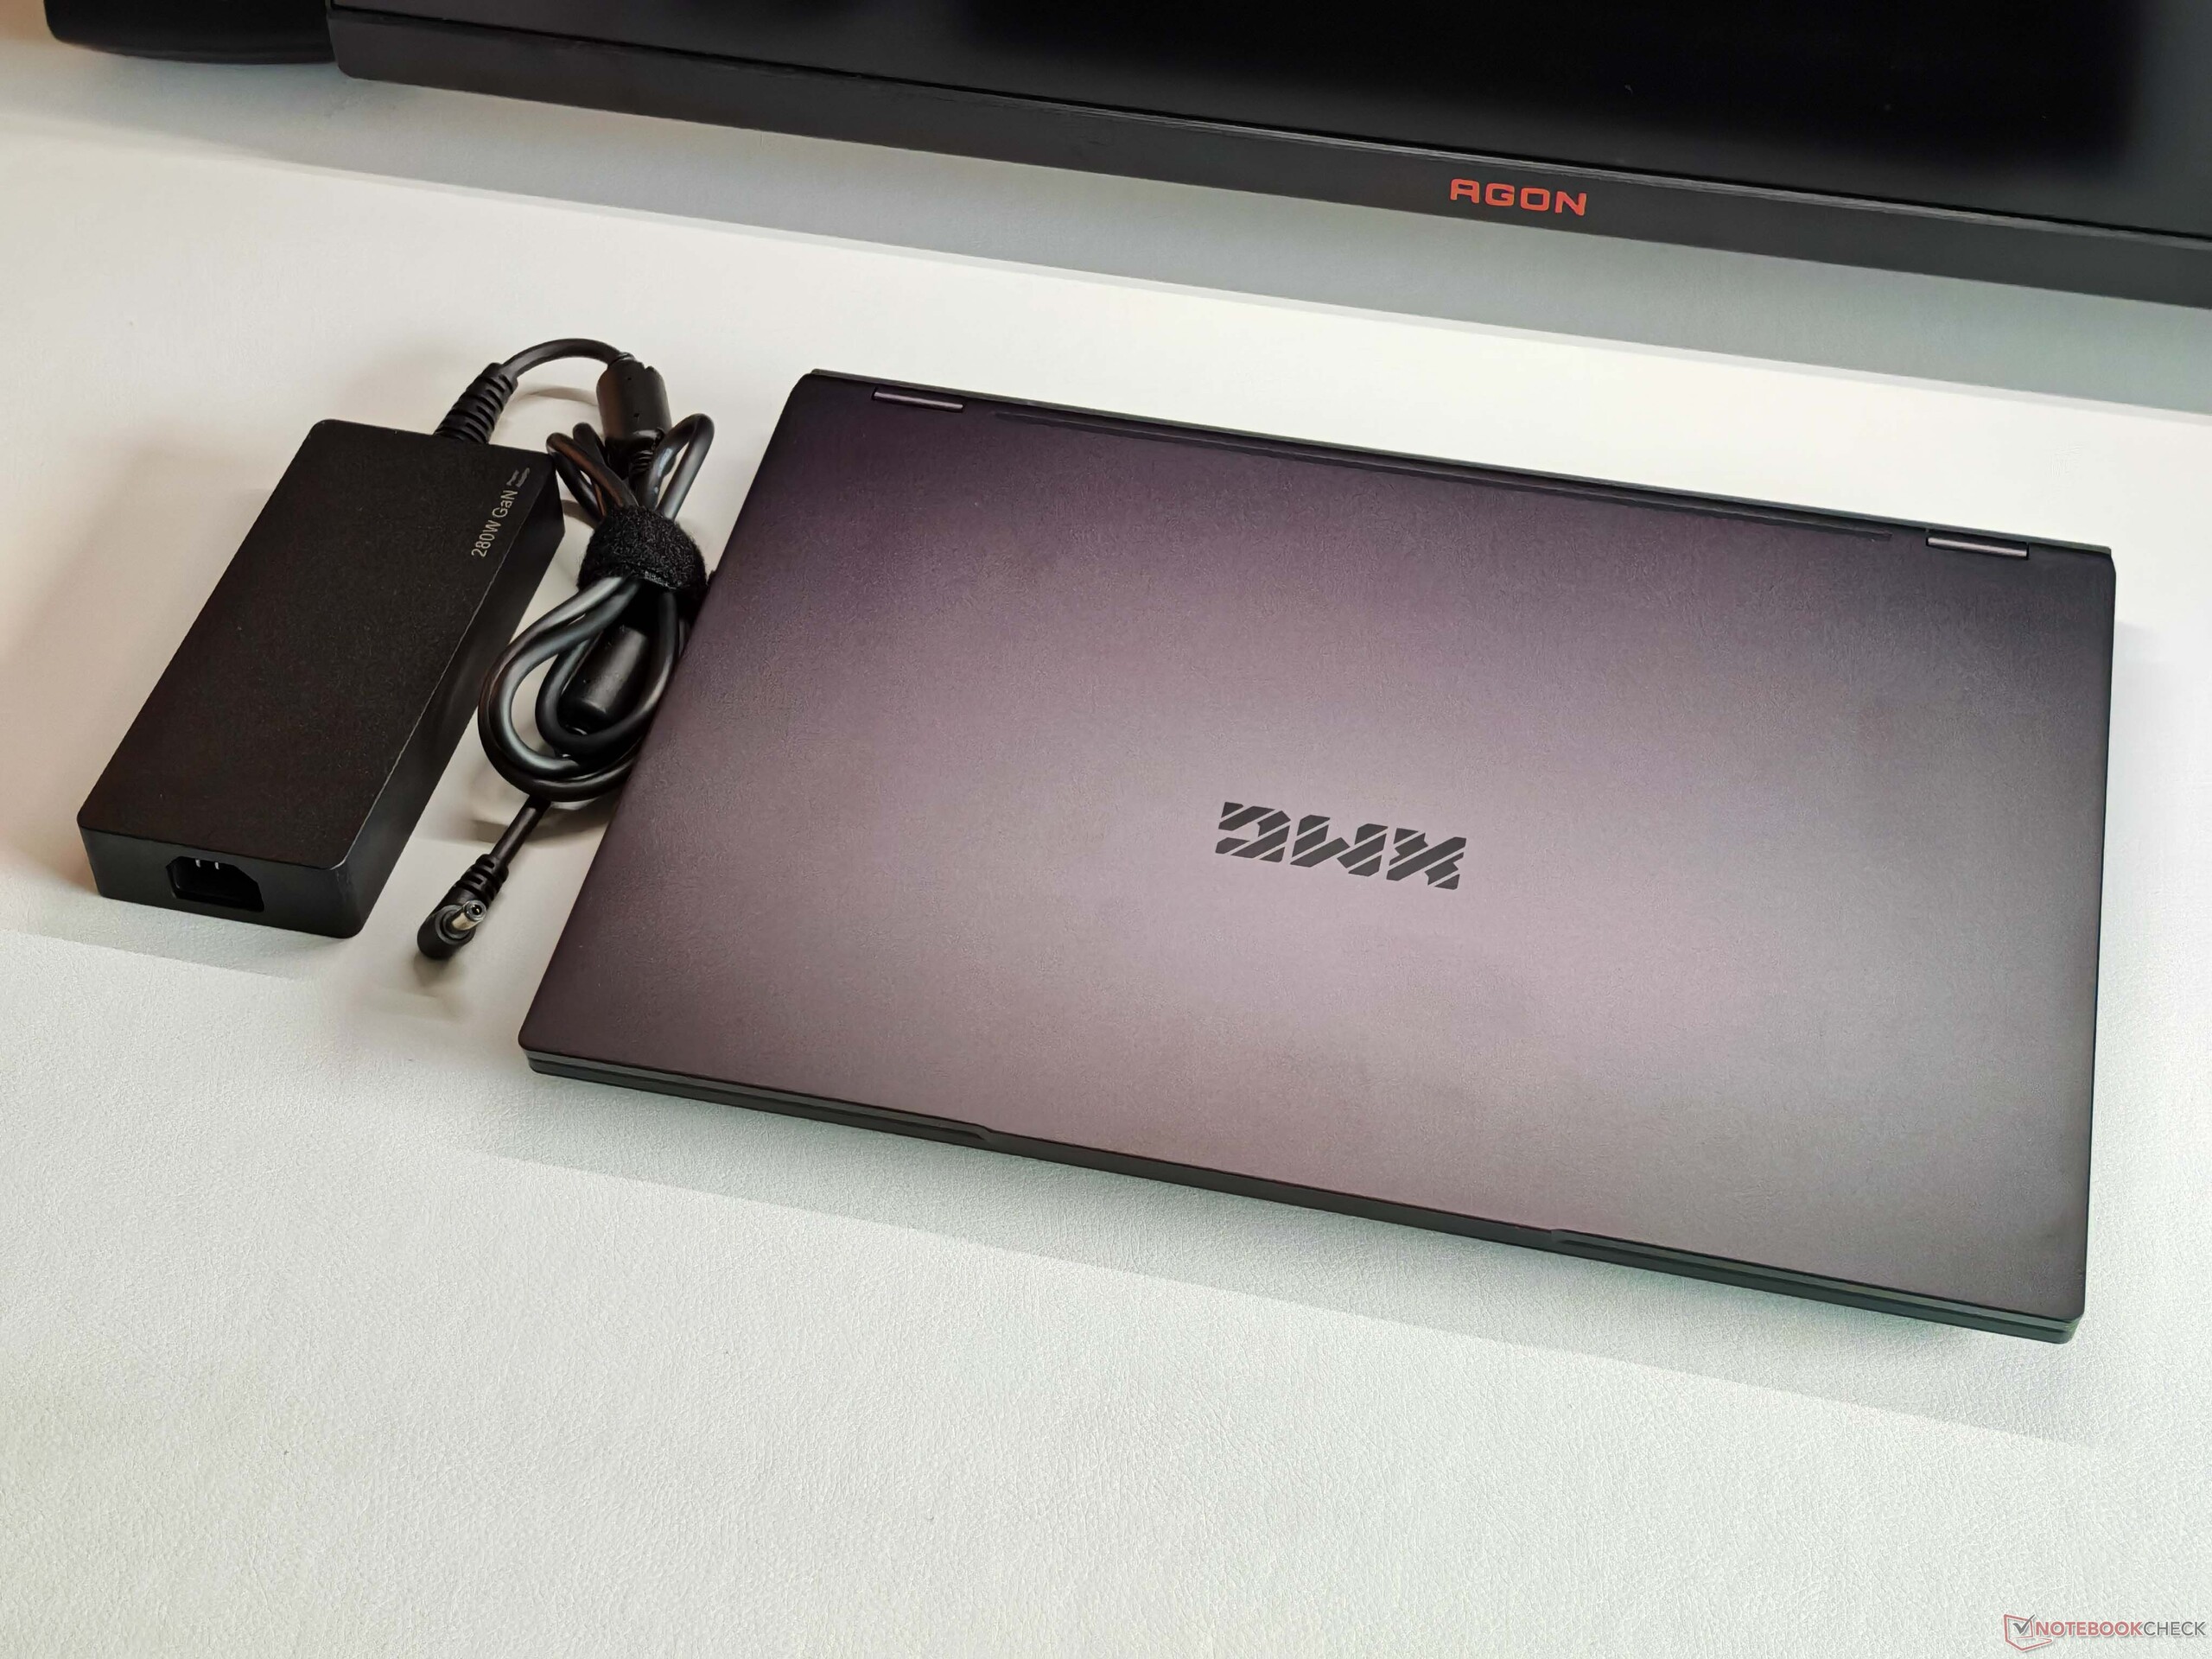
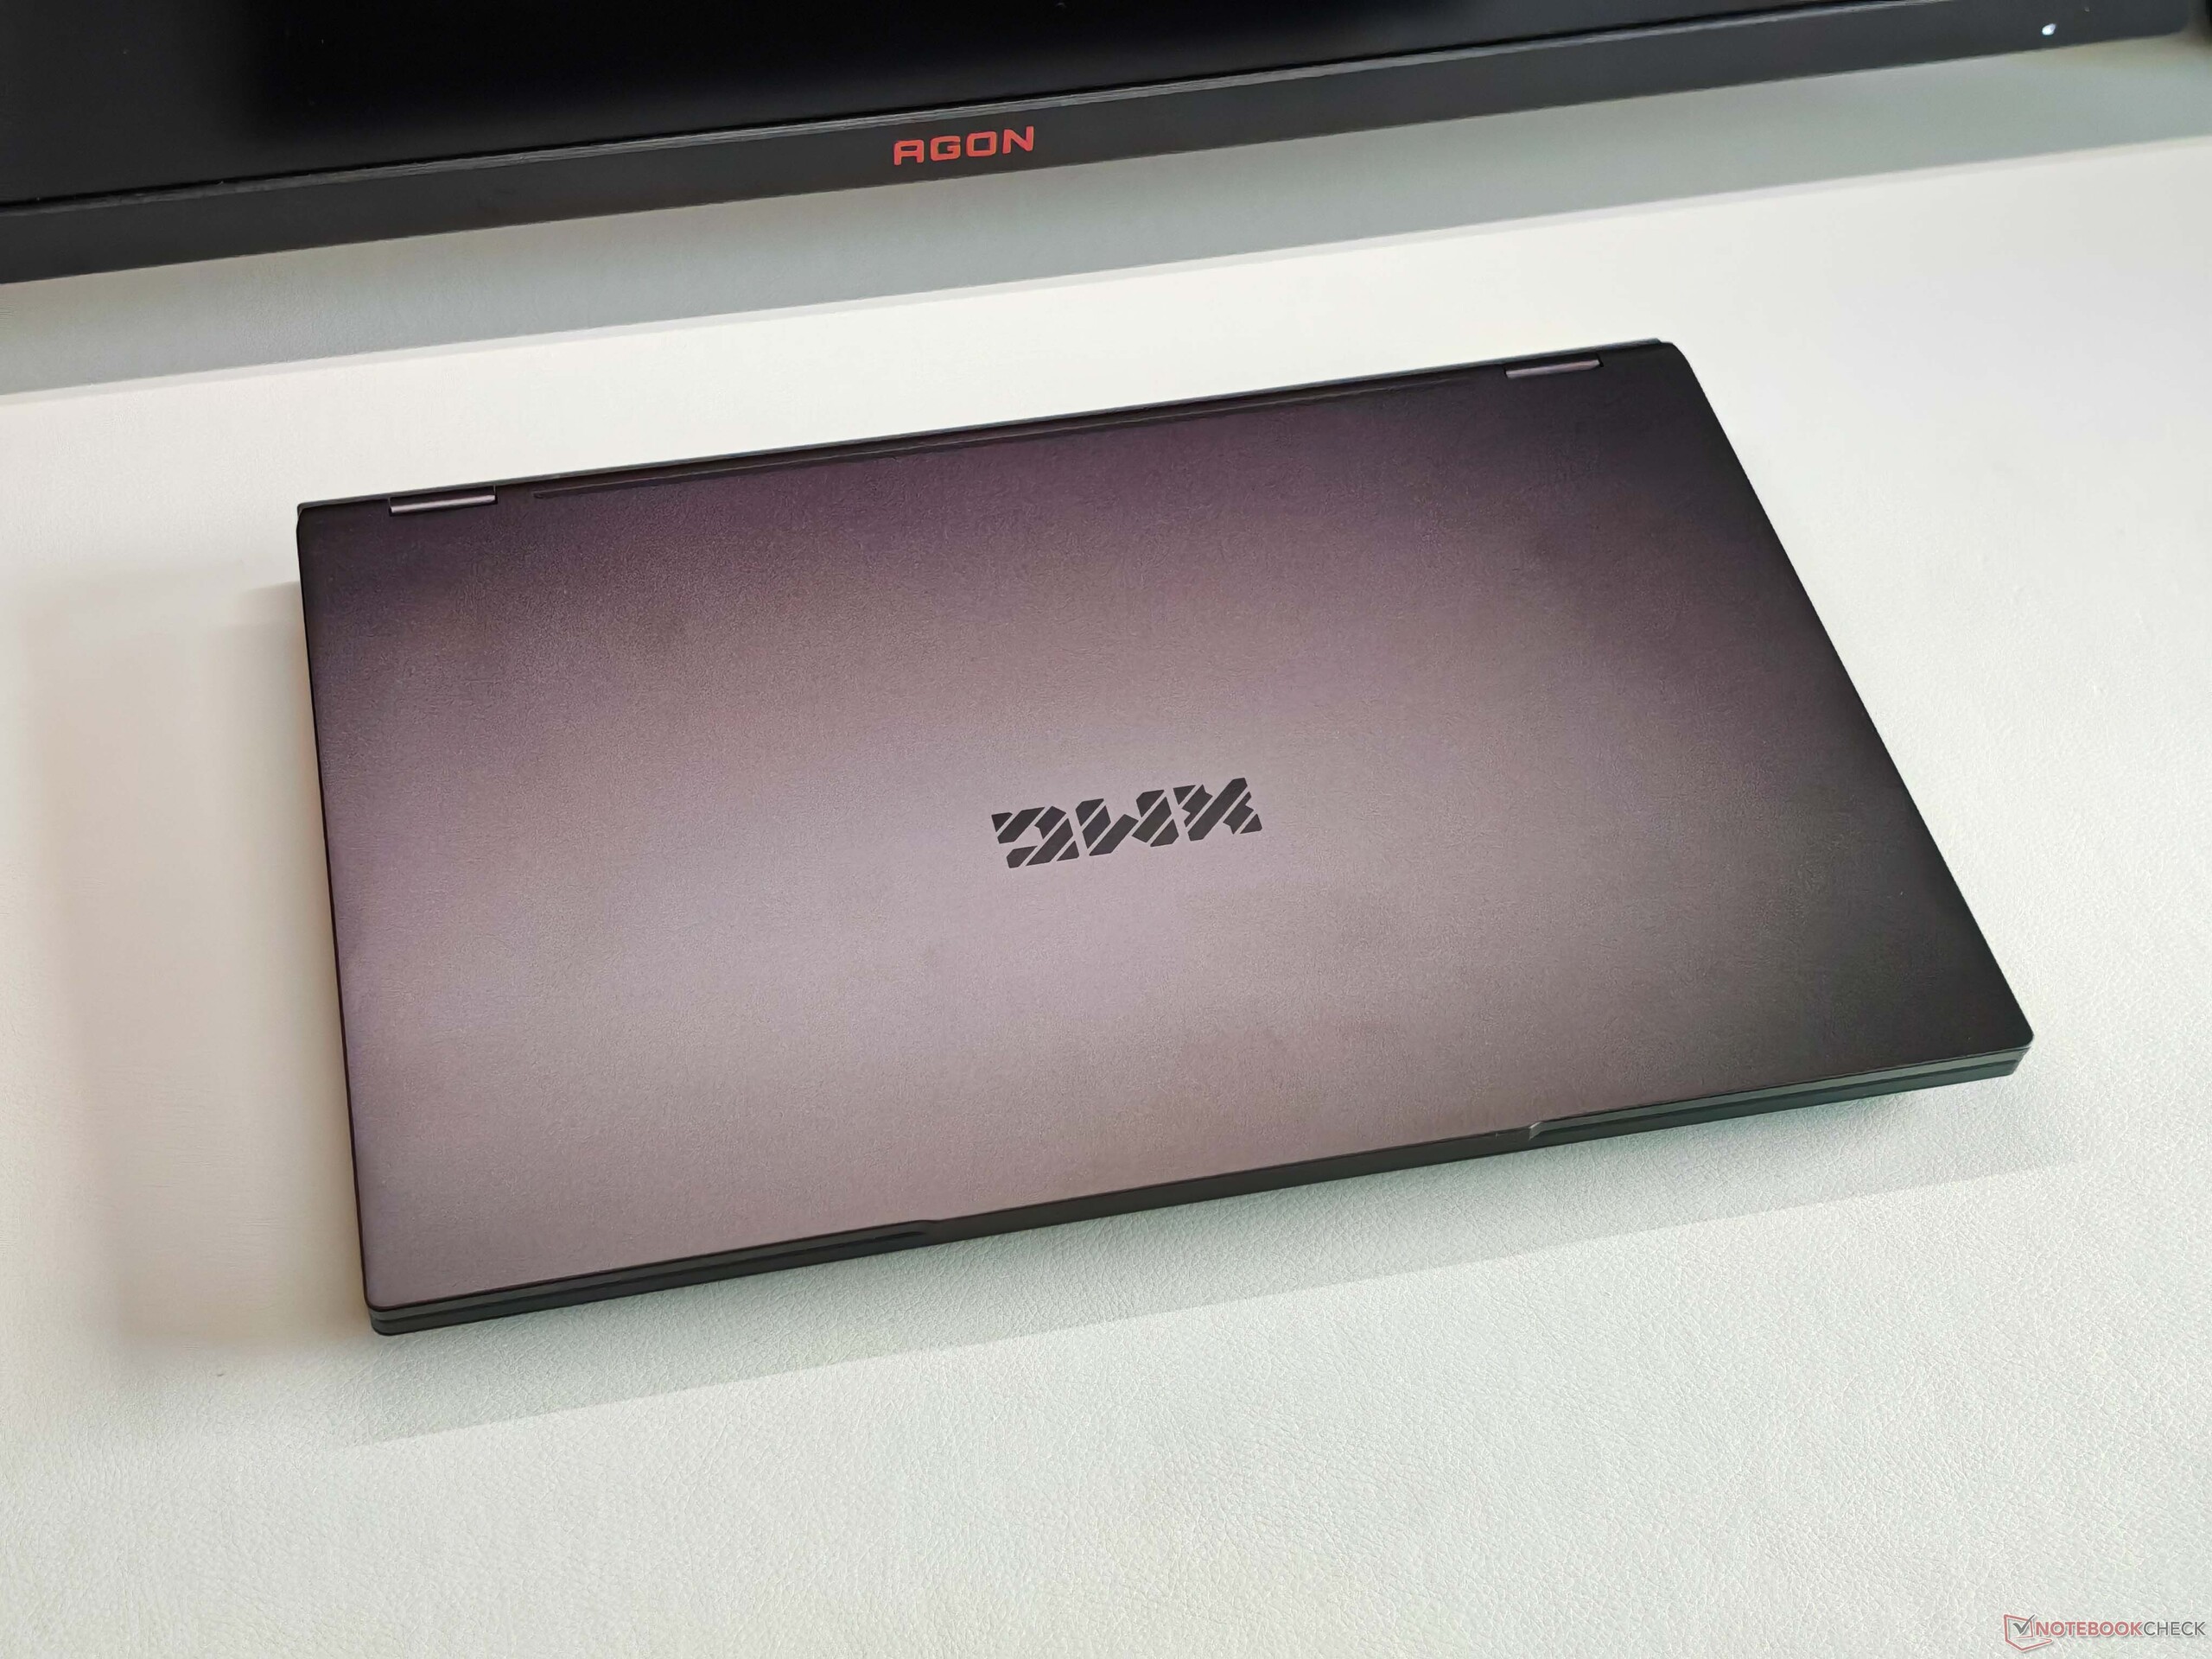
Conosciamo già questo telaio, in una forma molto simile, dall'attuale XMG Pro 16. Nel complesso, il design è sobrio e non ci sono elementi di illuminazione sullo chassis. Per mantenere il prezzo più basso possibile, solo il coperchio del display è realizzato in alluminio, mentre il telaio inferiore è in plastica. Nonostante ciò, la stabilità complessiva è ancora molto buona e le cerniere (fino a 180 gradi) consentono solo una leggera oscillazione.
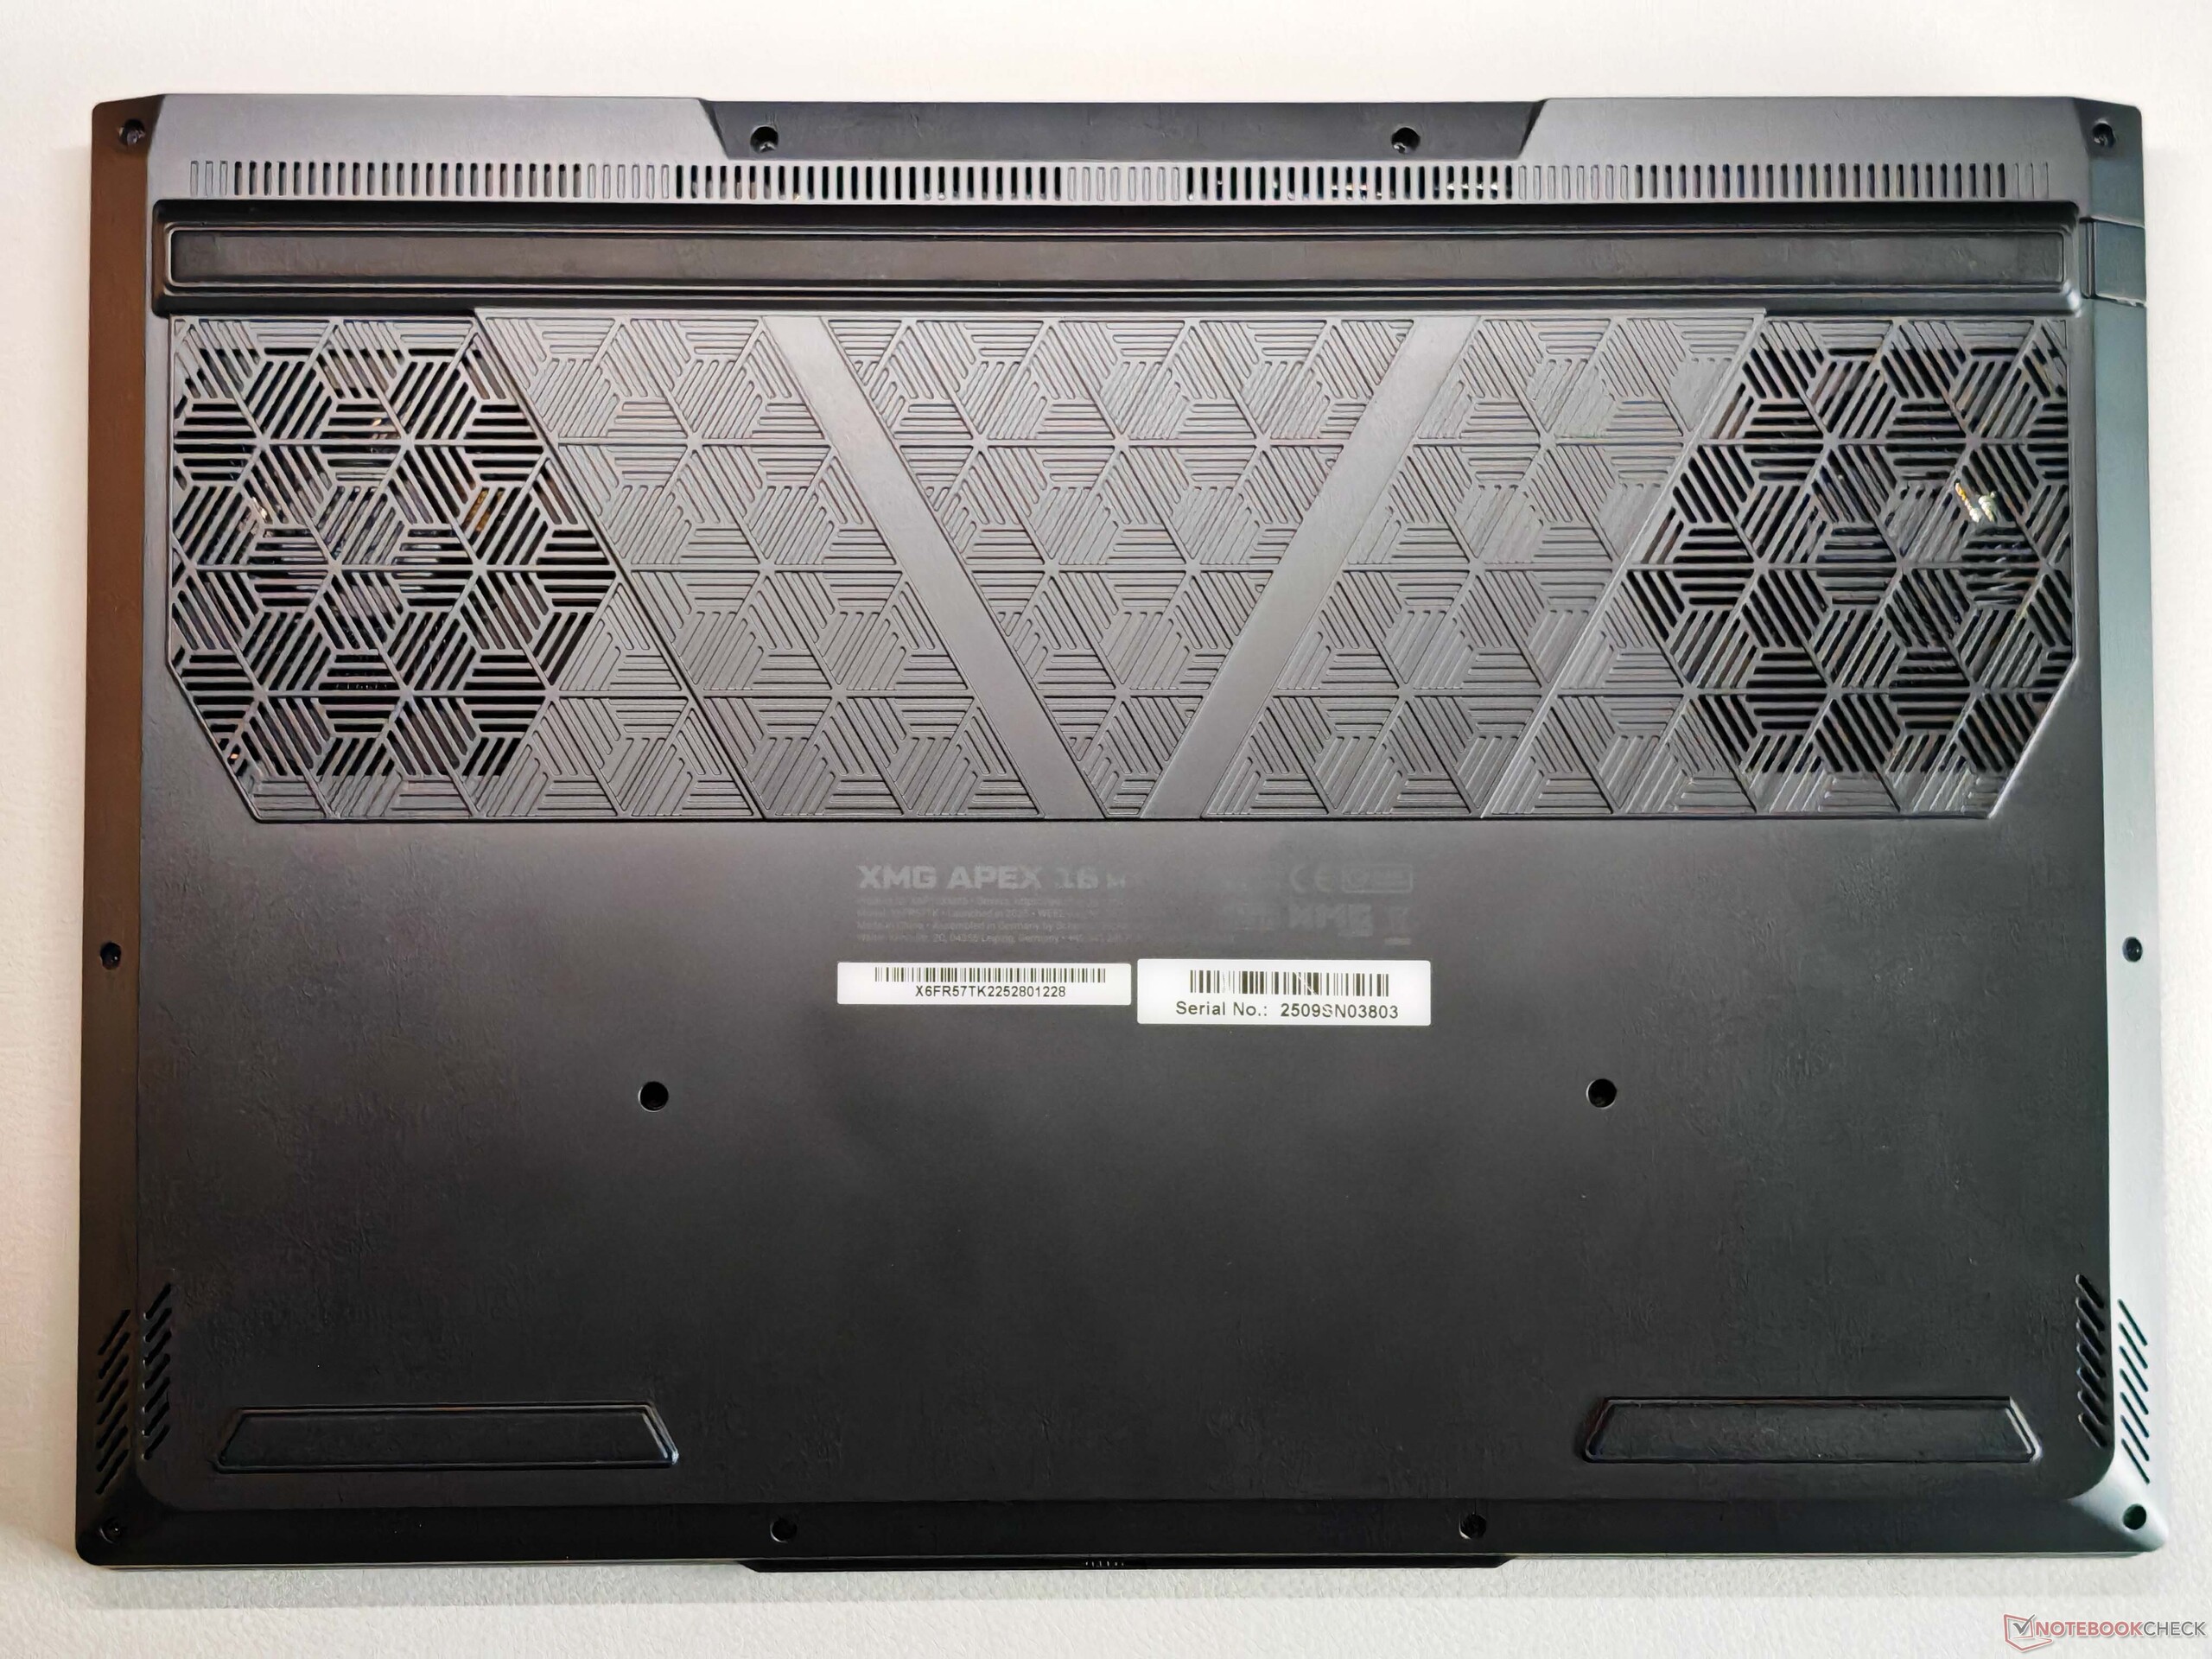
Le opzioni di manutenzione sono ampie (2× RAM, 2× SSD), e sono disponibili numerose porte - anche se non c'è USB 4.0. Oltre al Wi-Fi 6E, il portatile offre anche Gigabit Ethernet e un lettore di schede full-size. La webcam a 1080p (con otturatore per la privacy e IR) soddisfa il suo scopo.


| SD Card Reader | |
| average JPG Copy Test (av. of 3 runs) | |
| Medion Erazer Major 16 X1 MD62736 (AV PRO microSD 128 GB V60) | |
| Schenker XMG Pro 16 (E25) (Angelbird AV Pro V60) | |
| Media della classe Gaming (20.9 - 210, n=60, ultimi 2 anni) | |
| MSI Vector 16 HX AI A2XWHG (AV PRO microSD 128 GB V60) | |
| Acer Predator Helios Neo 16S AI PHN16S-71-94L9 (AV PRO microSD 128 GB V60) | |
| Schenker XMG APEX 16 MAX (Angelbird AV Pro V60) | |
| maximum AS SSD Seq Read Test (1GB) | |
| Schenker XMG Pro 16 (E25) (Angelbird AV Pro V60) | |
| Medion Erazer Major 16 X1 MD62736 (AV PRO microSD 128 GB V60) | |
| Media della classe Gaming (25.5 - 261, n=57, ultimi 2 anni) | |
| MSI Vector 16 HX AI A2XWHG (AV PRO microSD 128 GB V60) | |
| Schenker XMG APEX 16 MAX (Angelbird AV Pro V60) | |
| Acer Predator Helios Neo 16S AI PHN16S-71-94L9 (AV PRO microSD 128 GB V60) | |
| Networking | |
| Schenker XMG APEX 16 MAX | |
| iperf3 transmit AXE11000 | |
| iperf3 receive AXE11000 | |
| Acer Predator Helios Neo 16S AI PHN16S-71-94L9 | |
| iperf3 transmit AXE11000 | |
| iperf3 receive AXE11000 | |
| Chuwi Gamebook, R9 9955HX | |
| iperf3 transmit AXE11000 | |
| iperf3 receive AXE11000 | |
| iperf3 transmit AXE11000 6GHz | |
| iperf3 receive AXE11000 6GHz | |
| Medion Erazer Major 16 X1 MD62736 | |
| iperf3 transmit AXE11000 | |
| iperf3 receive AXE11000 | |
| Lenovo Legion 5 Pro 16IAX10H | |
| iperf3 transmit AXE11000 | |
| iperf3 receive AXE11000 | |
| MSI Vector 16 HX AI A2XWHG | |
| iperf3 transmit AXE11000 | |
| iperf3 receive AXE11000 | |
| Schenker XMG Pro 16 (E25) | |
| iperf3 transmit AXE11000 | |
| iperf3 receive AXE11000 | |


Dispositivi di input - Tastiera con illuminazione a tasto singolo
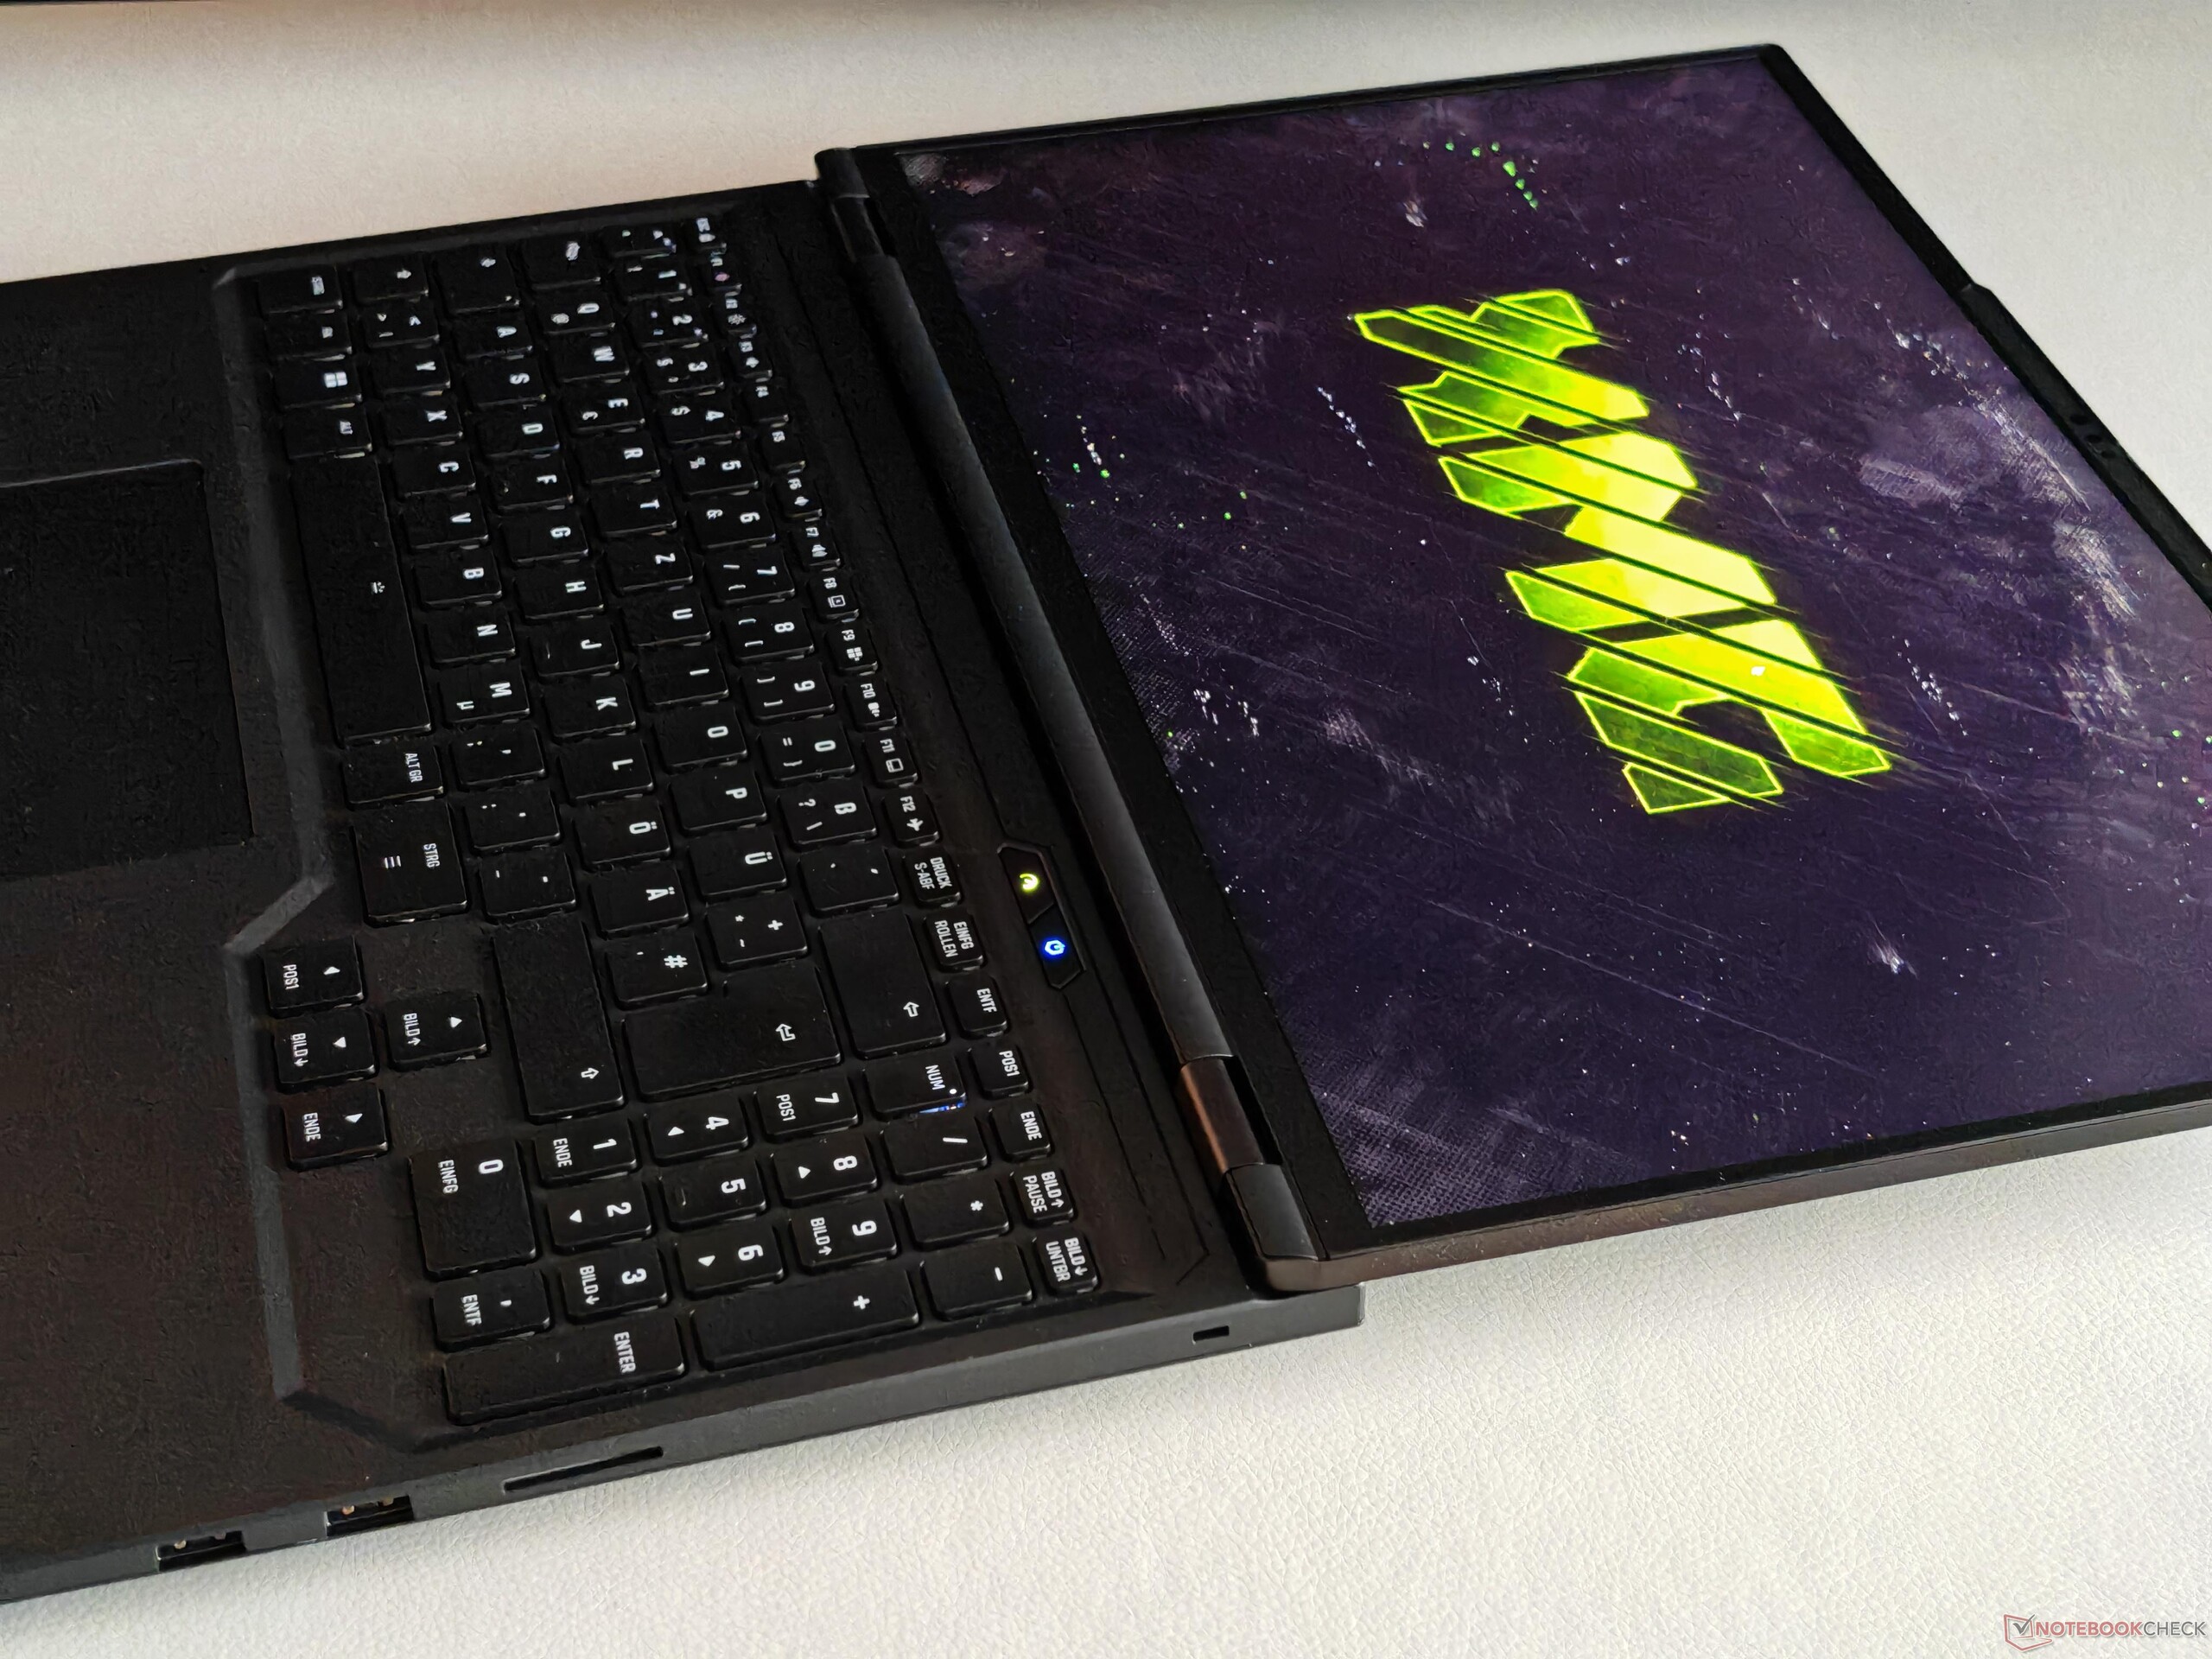
Conosciamo già questa tastiera con la sua retroilluminazione per tasto da altri modelli XMG, e non delude nemmeno su Apex 16 Max. La corsa dei tasti è sufficientemente lunga, il feedback è preciso e c'è un tastierino numerico dedicato. Anche il clickpad funziona bene, anche se i clic meccanici nell'area inferiore sono un po' rumorosi.


Display - Mini LED da 1.000 cd/m²
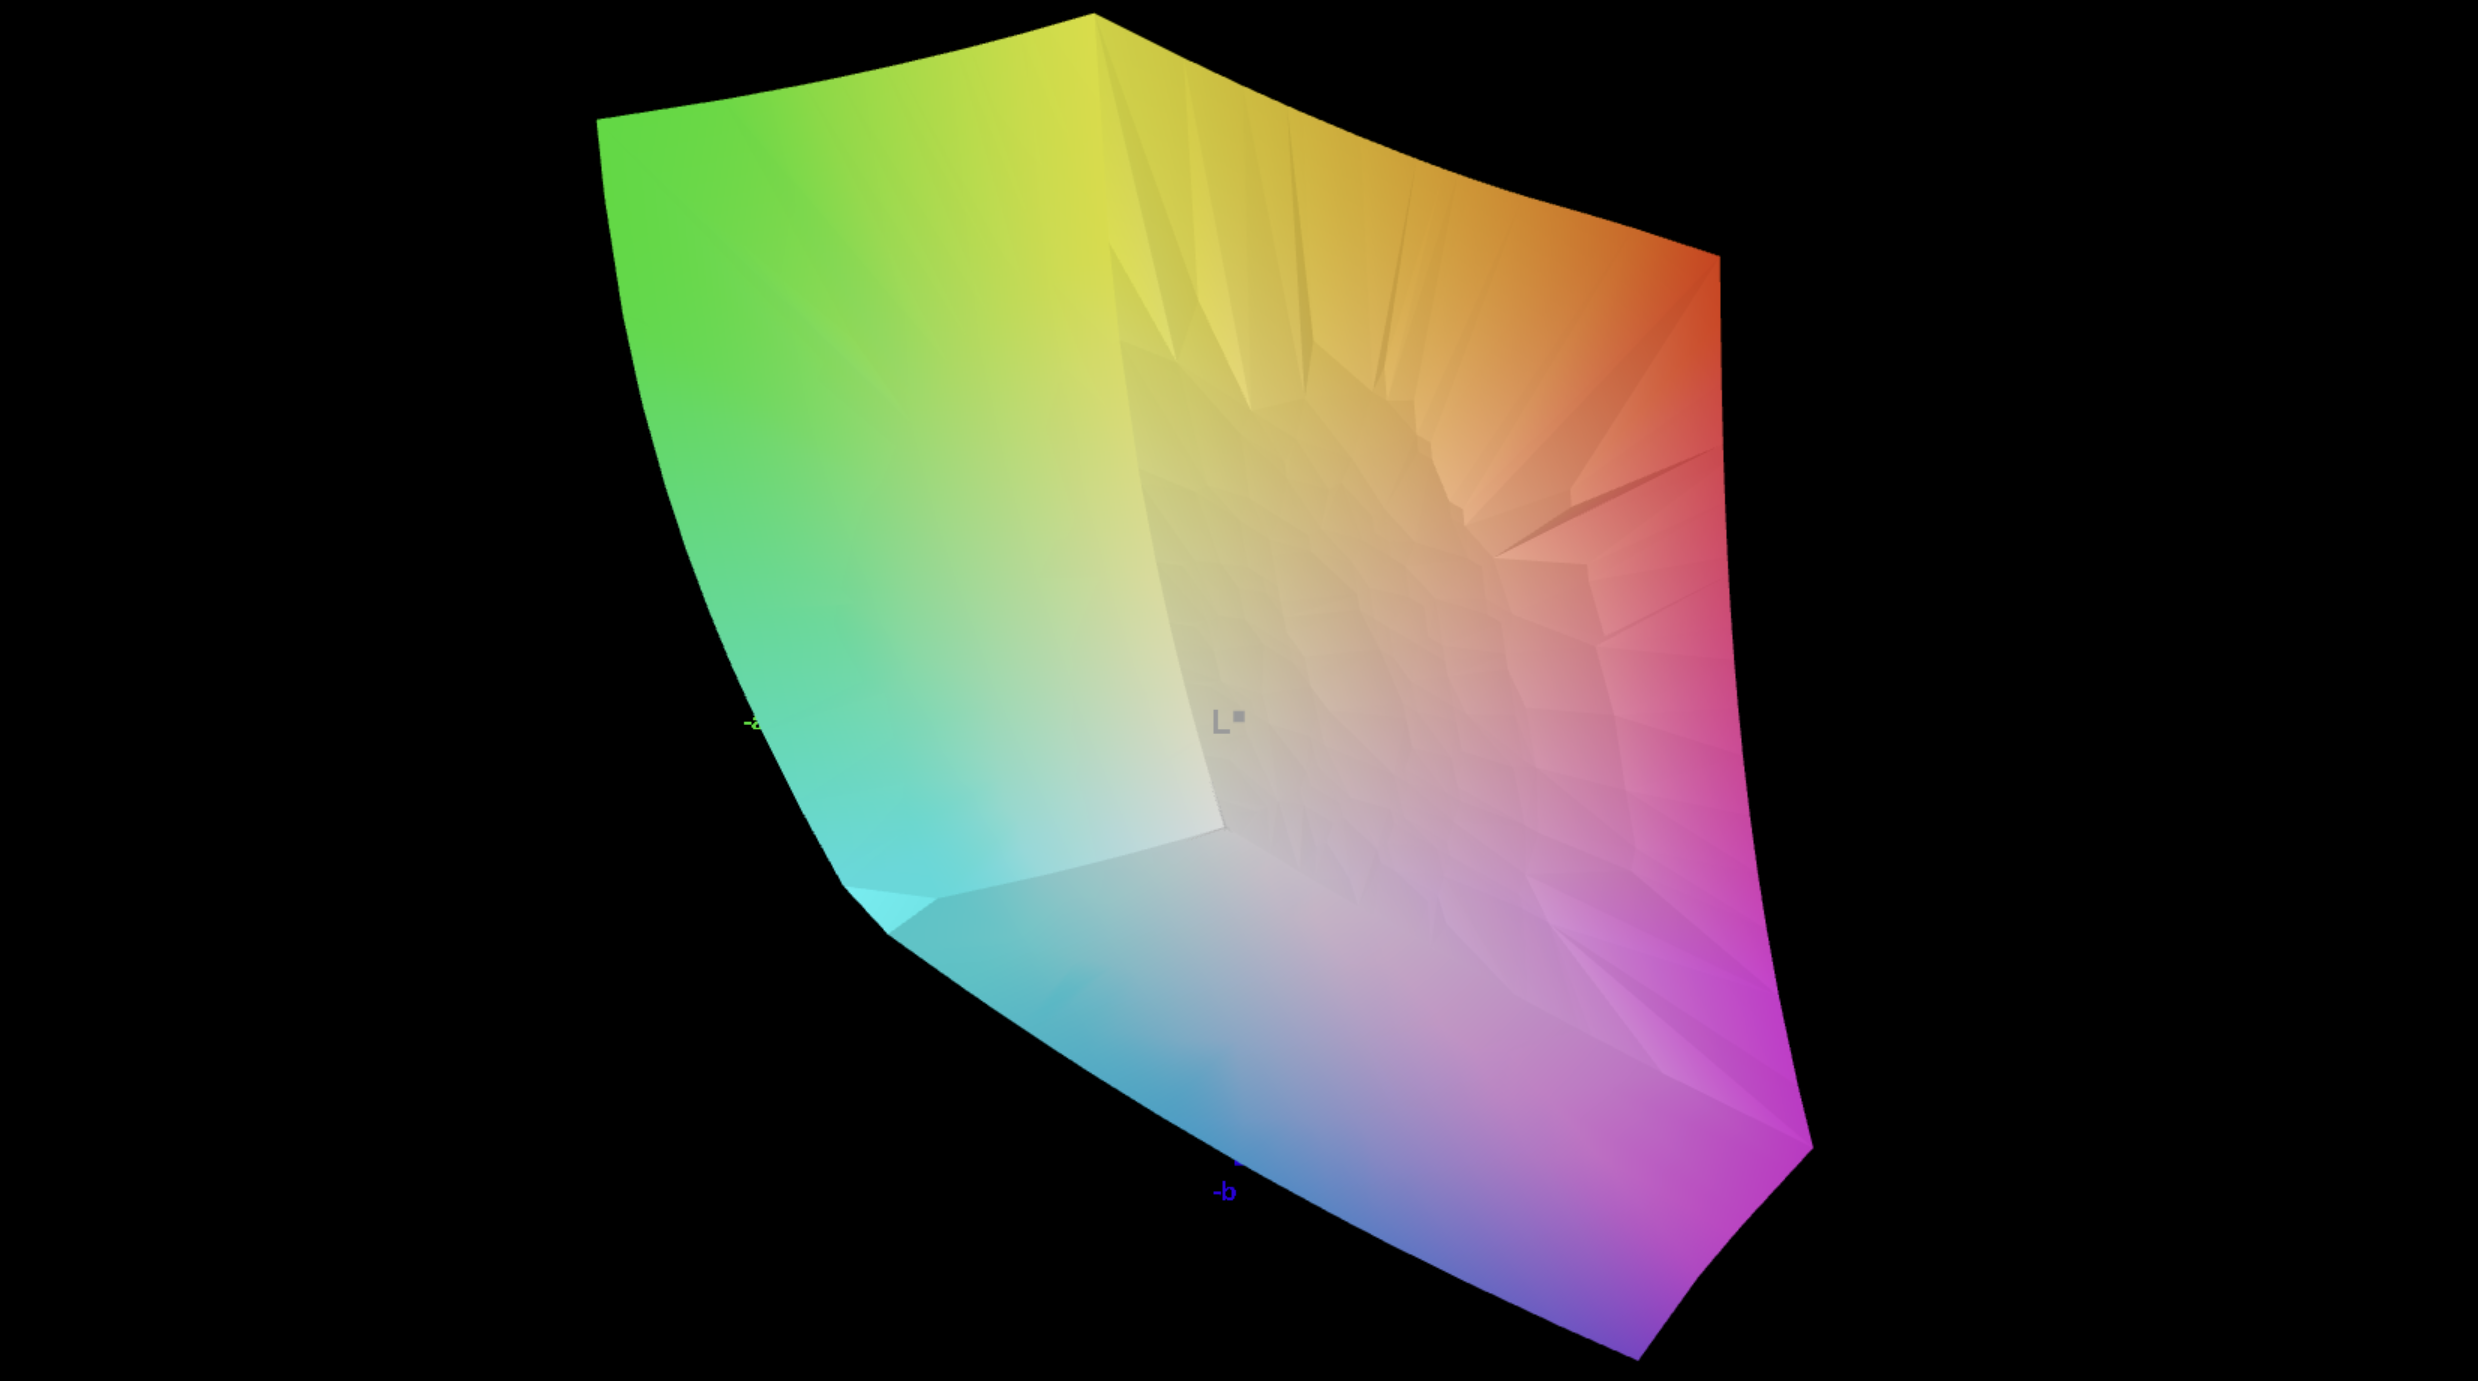
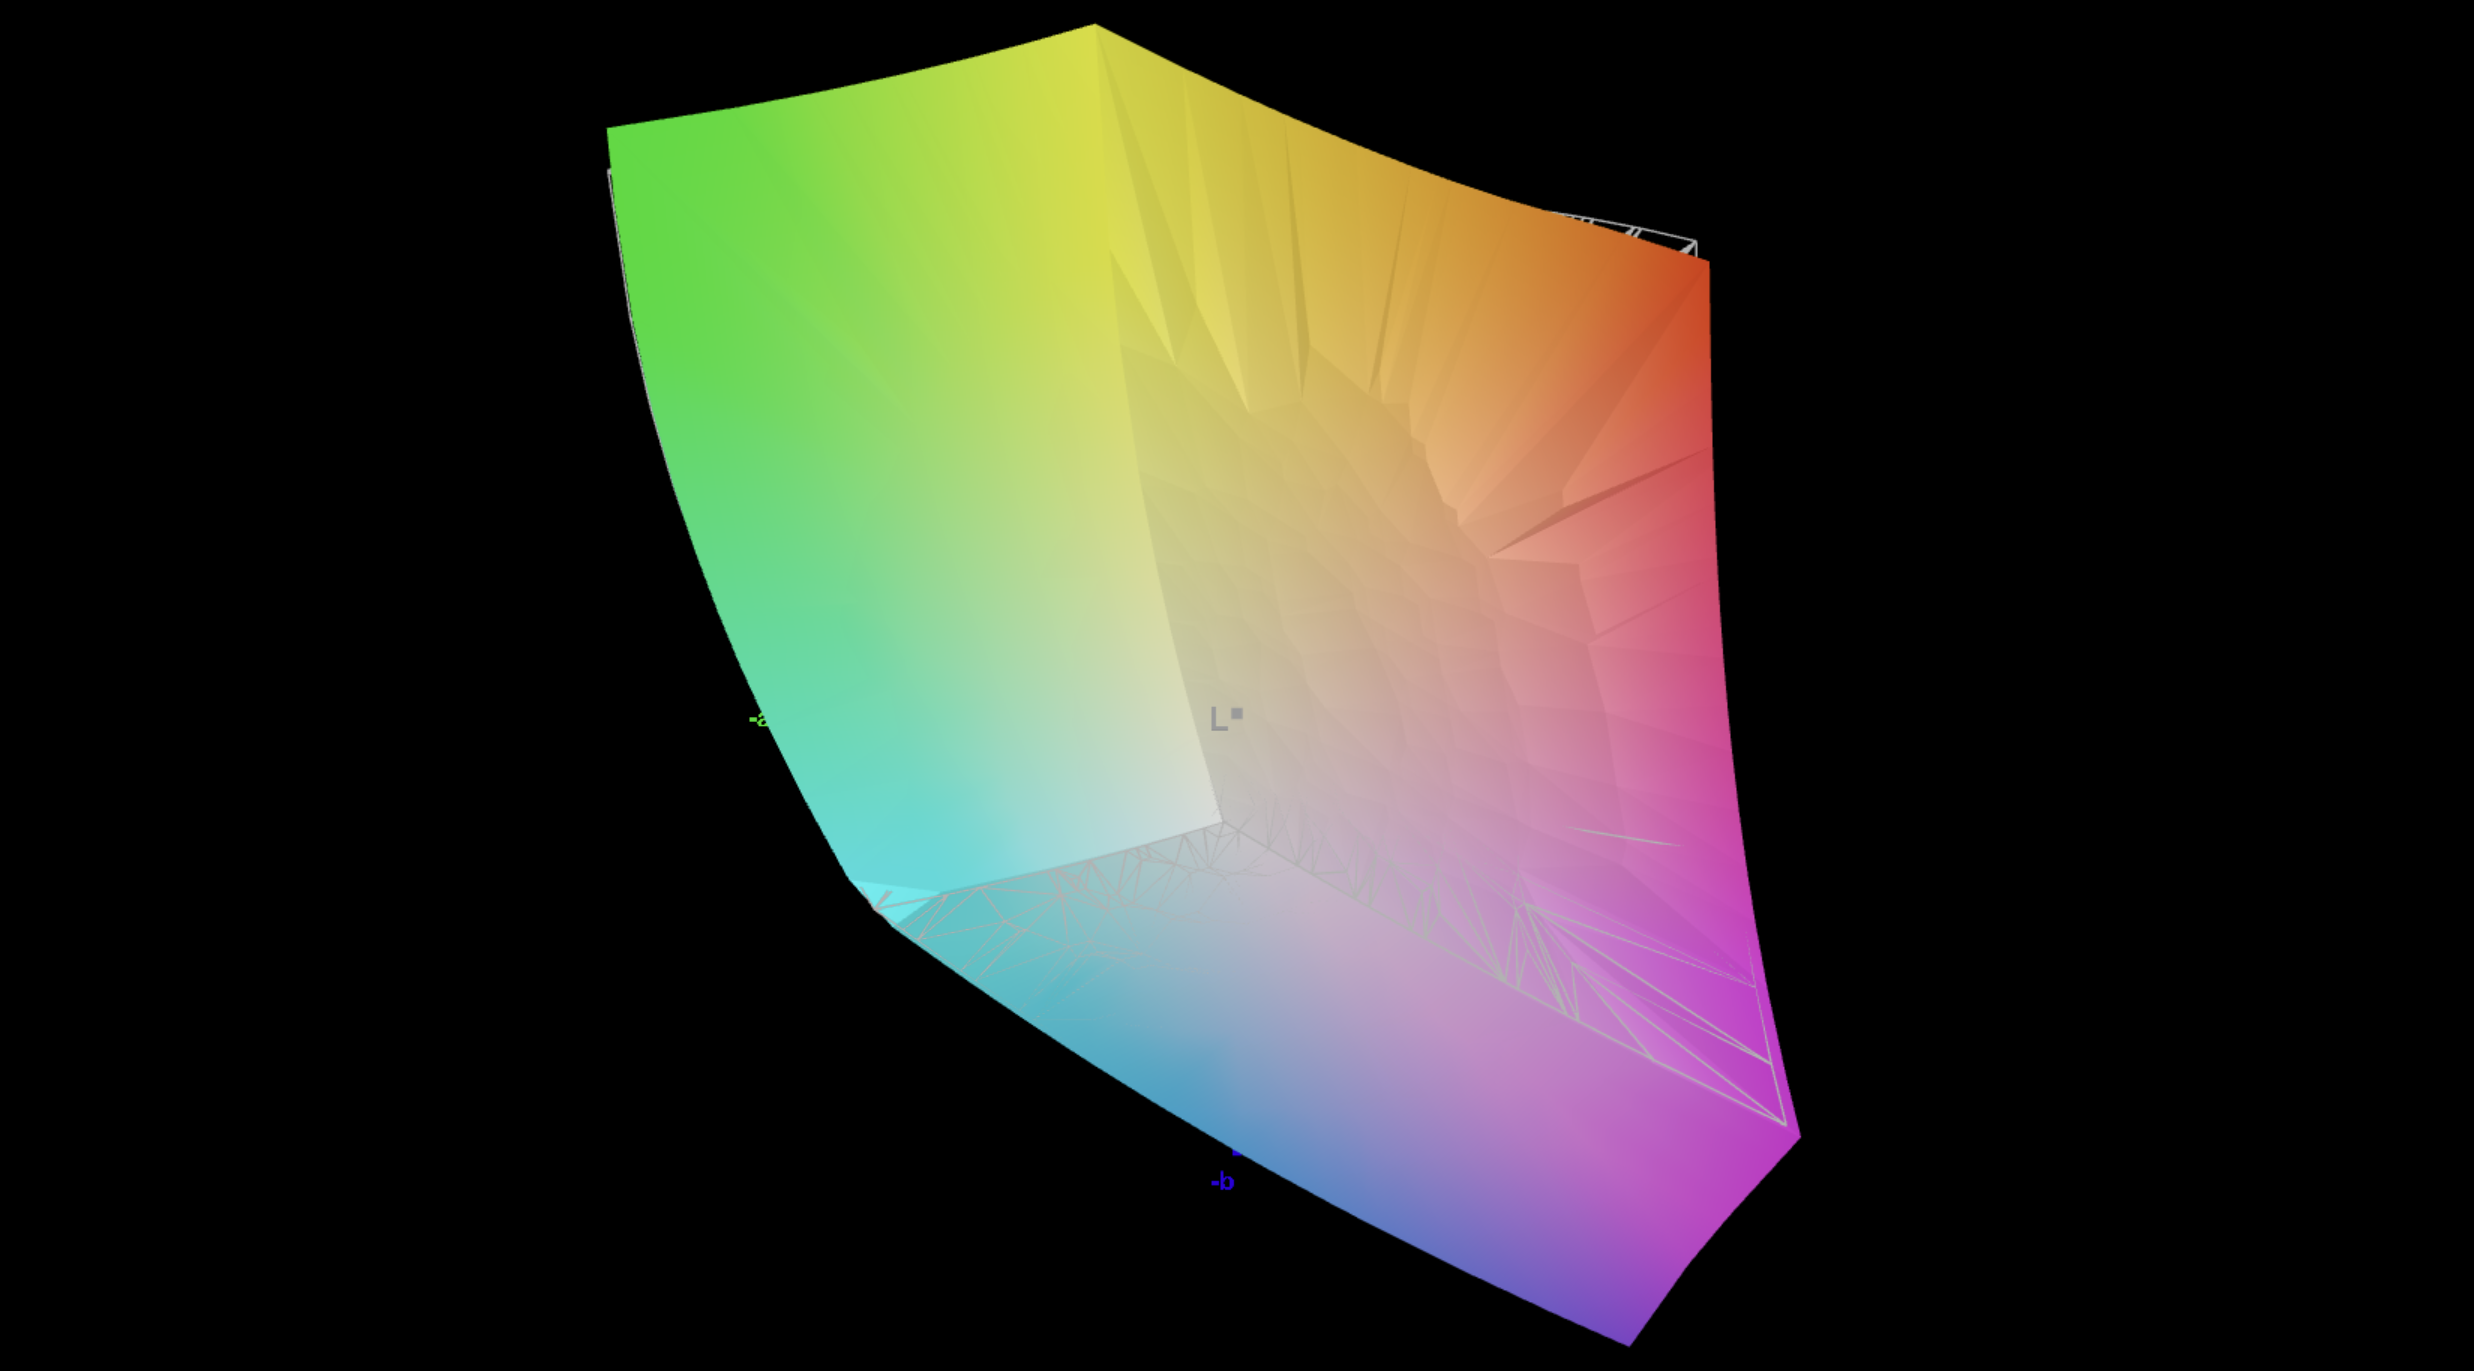
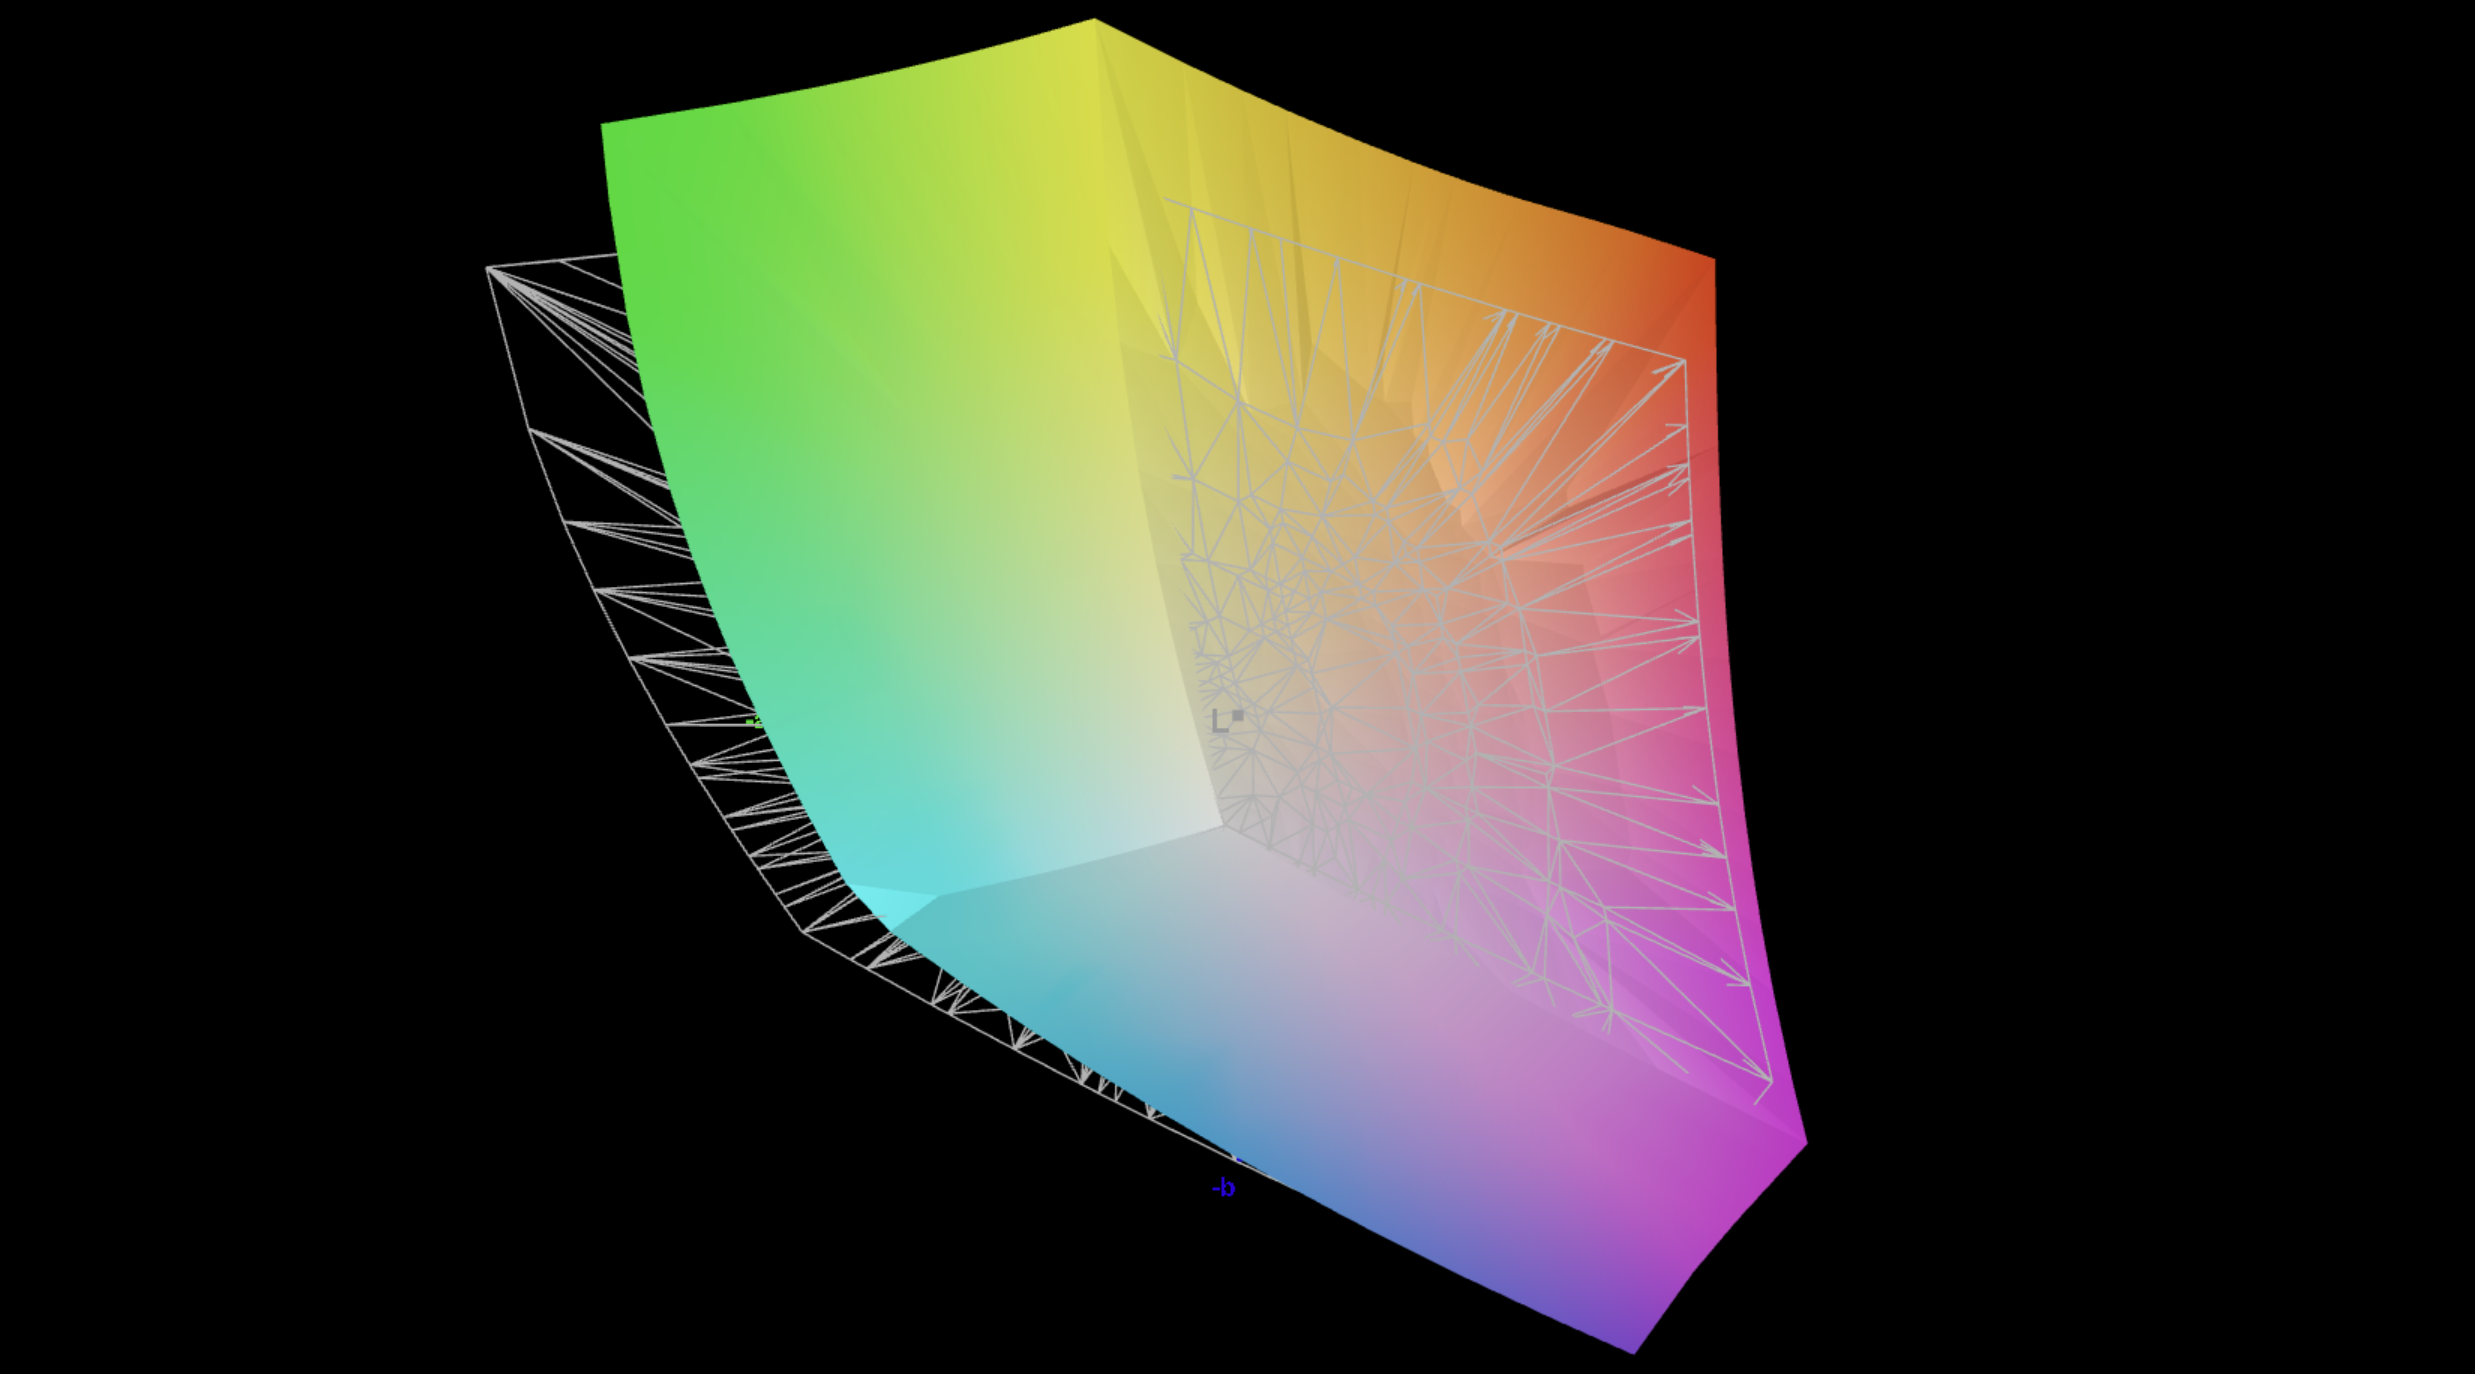
Il nostro dispositivo di prova è dotato del pannello Mini-LED opaco (2.560 × 1.600 pixel, 16:10, 300 Hz) che conosciamo già dal modello XMG Neo 16. La qualità dell'immagine è eccellente e, soprattutto in termini di luminosità (fino a 752 cd/m² in SDR e 974 cd/m² in HDR), supera chiaramente il pannello IPS standard. L'oscuramento locale può essere disattivato, il che è utile per attività come l'editing fotografico.
Tuttavia, i profili colore inclusi (per P3 e sRGB) non sono ottimali, anche se la precisione del colore migliora leggermente a livelli di luminosità inferiori. La nostra calibrazione mostra che c'è ancora spazio per un miglioramento. I tempi di risposta sono difficili da misurare a causa del costante sfarfallio PWM (anche se a 20 kHz), ma nel complesso si tratta di un pannello di tipo IPS veloce e non abbiamo avuto problemi durante il gioco.


| |||||||||||||||||||||||||
Distribuzione della luminosità: 93 %
Al centro con la batteria: 742 cd/m²
Contrasto: 74200:1 (Nero: 0.01 cd/m²)
ΔE ColorChecker Calman: 3 | ∀{0.5-29.43 Ø4.75}
calibrated: 1.2
ΔE Greyscale Calman: 3.6 | ∀{0.09-98 Ø5}
87.9% AdobeRGB 1998 (Argyll 3D)
100% sRGB (Argyll 3D)
99.7% Display P3 (Argyll 3D)
Gamma: 2.43
CCT: 6559 K
| Schenker XMG APEX 16 MAX NE160QDM-NM9, Mini-LED, 2560x1600, 16", 300 Hz | Acer Predator Helios Neo 16S AI PHN16S-71-94L9 Samsung ATNA60DL03-0, OLED, 2560x1600, 16", 240 Hz | Chuwi Gamebook, R9 9955HX BOE0D55, IPS, 2560x1600, 16", 300 Hz | Medion Erazer Major 16 X1 MD62736 NE160QDM-NZL (BOE0D55), IPS, 2560x1600, 16", 300 Hz | Lenovo Legion 5 Pro 16IAX10H ATNA60HS01-0 (Samsung SDC420A), OLED, 2560x1600, 16", 165 Hz | MSI Vector 16 HX AI A2XWHG B160QAN02.3 (AUO7DB2), IPS, 2560x1600, 16", 240 Hz | Schenker XMG Pro 16 (E25) NE160QDM-NZL, IPS, 2560x1600, 16", 300 Hz | |
|---|---|---|---|---|---|---|---|
| Display | 3% | -16% | -14% | 2% | -2% | -13% | |
| Display P3 Coverage (%) | 99.7 | 99.9 0% | 72.5 -27% | 73.2 -27% | 99.9 0% | 96.6 -3% | 74.7 -25% |
| sRGB Coverage (%) | 100 | 100 0% | 97.9 -2% | 99.8 0% | 100 0% | 99.8 0% | 99.8 0% |
| AdobeRGB 1998 Coverage (%) | 87.9 | 96.5 10% | 72.5 -18% | 73.9 -16% | 94.1 7% | 84.4 -4% | 75.4 -14% |
| Response Times | 77% | 39% | 52% | 85% | 65% | 49% | |
| Response Time Grey 50% / Grey 80% * (ms) | 17.4 ? | 0.2 ? 99% | 12.4 ? 29% | 10 ? 43% | 2 ? 89% | 4.3 ? 75% | 10.5 ? 40% |
| Response Time Black / White * (ms) | 13 ? | 0.25 ? 98% | 6.8 ? 48% | 5.2 ? 60% | 1.4 ? 89% | 6 ? 54% | 5.4 ? 58% |
| PWM Frequency (Hz) | 20253 ? | 960 | 1300 | ||||
| PWM Amplitude * (%) | 75 | 50 33% | 16.7 78% | ||||
| Screen | -42% | -557% | -553% | -18% | -485% | -587% | |
| Brightness middle (cd/m²) | 742 | 390 -47% | 576 -22% | 577 -22% | 518 -30% | 473 -36% | 538 -27% |
| Brightness (cd/m²) | 733 | 394 -46% | 545 -26% | 539 -26% | 522 -29% | 426 -42% | 508 -31% |
| Brightness Distribution (%) | 93 | 98 5% | 88 -5% | 85 -9% | 97 4% | 85 -9% | 88 -5% |
| Black Level * (cd/m²) | 0.01 | 0.04 -300% | 0.5 -4900% | 0.5 -4900% | 0.42 -4100% | 0.47 -4600% | |
| Contrast (:1) | 74200 | 9750 -87% | 1152 -98% | 1154 -98% | 1126 -98% | 1145 -98% | |
| Colorchecker dE 2000 * | 3 | 1.61 46% | 2.04 32% | 2.12 29% | 2.49 17% | 3.47 -16% | 1.9 37% |
| Colorchecker dE 2000 max. * | 4.3 | 3.49 19% | 3.56 17% | 3.32 23% | 5.25 -22% | 7.24 -68% | 4 7% |
| Colorchecker dE 2000 calibrated * | 1.2 | 1.59 -33% | 1.85 -54% | 1.33 -11% | 2.15 -79% | 1.36 -13% | |
| Greyscale dE 2000 * | 3.6 | 1.2 67% | 2.09 42% | 2.2 39% | 3.02 16% | 3.1 14% | 2.7 25% |
| Gamma | 2.43 91% | 2.235 98% | 2.3 96% | 2.123 104% | 2.37 93% | 2.486 88% | 2.24 98% |
| CCT | 6559 99% | 6580 99% | 6492 100% | 6457 101% | 6426 101% | 6832 95% | 7027 93% |
| Media totale (Programma / Settaggio) | 13% /
-9% | -178% /
-356% | -172% /
-351% | 23% /
11% | -141% /
-303% | -184% /
-356% |
* ... Meglio usare valori piccoli


Tempi di risposta del Display
| ↔ Tempi di risposta dal Nero al Bianco | ||
|---|---|---|
| 13 ms ... aumenta ↗ e diminuisce ↘ combinato | ↗ 4.6 ms Incremento | 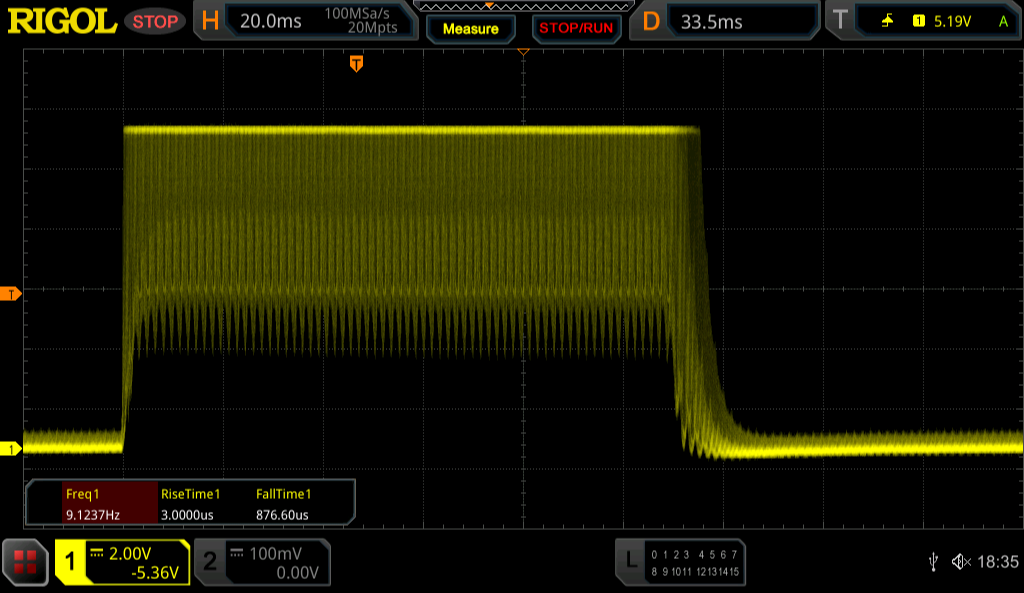 |
| ↘ 8.4 ms Calo | ||
| Lo schermo mostra buoni tempi di risposta durante i nostri tests, ma potrebbe essere troppo lento per i gamers competitivi. In confronto, tutti i dispositivi di test variano da 0.1 (minimo) a 240 (massimo) ms. » 33 % di tutti i dispositivi è migliore. Questo significa che i tempi di risposta rilevati sono migliori rispettto alla media di tutti i dispositivi testati (20 ms). | ||
| ↔ Tempo di risposta dal 50% Grigio all'80% Grigio | ||
| 17.4 ms ... aumenta ↗ e diminuisce ↘ combinato | ↗ 8.4 ms Incremento | 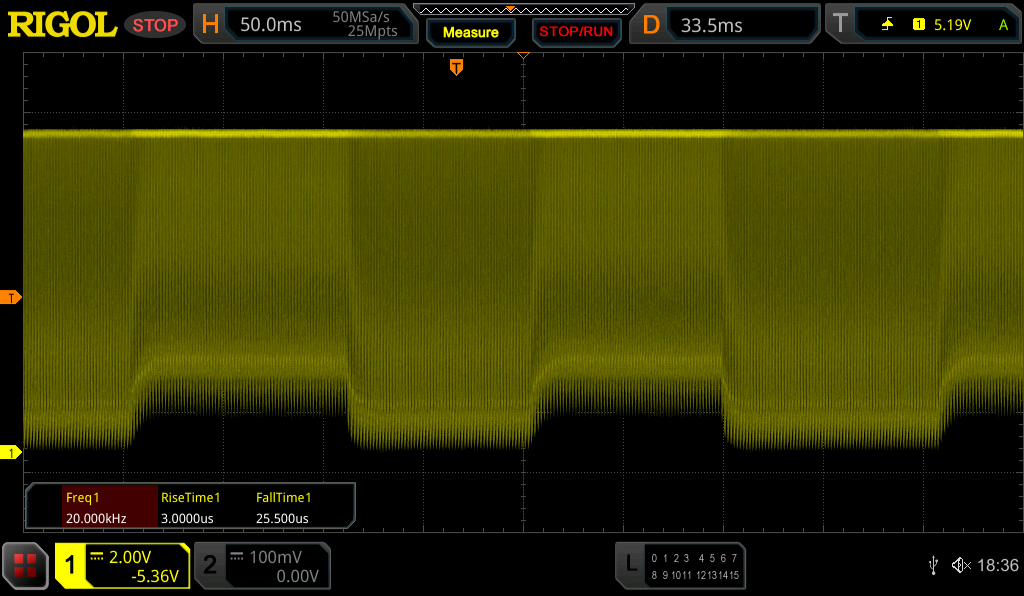 |
| ↘ 9 ms Calo | ||
| Lo schermo mostra buoni tempi di risposta durante i nostri tests, ma potrebbe essere troppo lento per i gamers competitivi. In confronto, tutti i dispositivi di test variano da 0.165 (minimo) a 636 (massimo) ms. » 31 % di tutti i dispositivi è migliore. Questo significa che i tempi di risposta rilevati sono migliori rispettto alla media di tutti i dispositivi testati (31.3 ms). | ||
Sfarfallio dello schermo / PWM (Pulse-Width Modulation)
| flickering dello schermo / PWM rilevato | 20253 Hz Amplitude: 75 % | ≤ 100 % settaggio luminosita' | 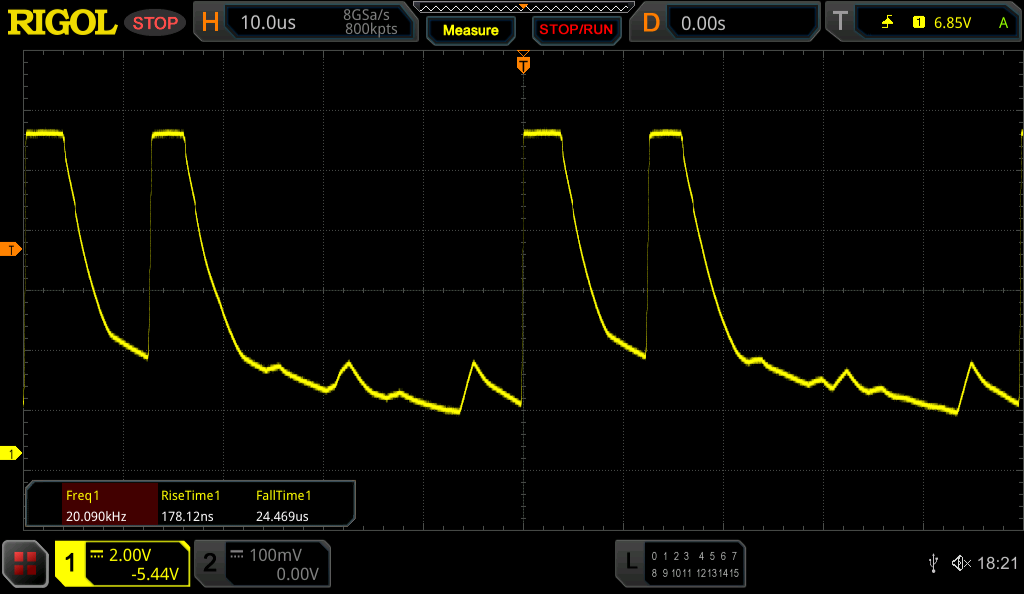 |
Il display sfarfalla a 20253 Hz (Probabilmente a causa dell'uso di PWM) Flickering rilevato ad una luminosita' di 100 % o inferiore. Non dovrebbe verificarsi flickering o PWM sopra questo valore di luminosita'. La frequenza di 20253 Hz è abbastanza alta, quindi la maggioranza degli utenti sensibili al PWM non dovrebbero notare alcun flickering. In confronto: 53 % di tutti i dispositivi testati non utilizza PWM per ridurre la luminosita' del display. Se è rilevato PWM, una media di 7952 (minimo: 5 - massimo: 343500) Hz è stata rilevata. | |||


Prestazioni
Condizioni del test
Abbiamo eseguito i seguenti benchmark inmodalità Overboost (Normale). Quando si utilizza l'alimentazione a batteria, la modalità Enthusiast è l'impostazione più alta disponibile.
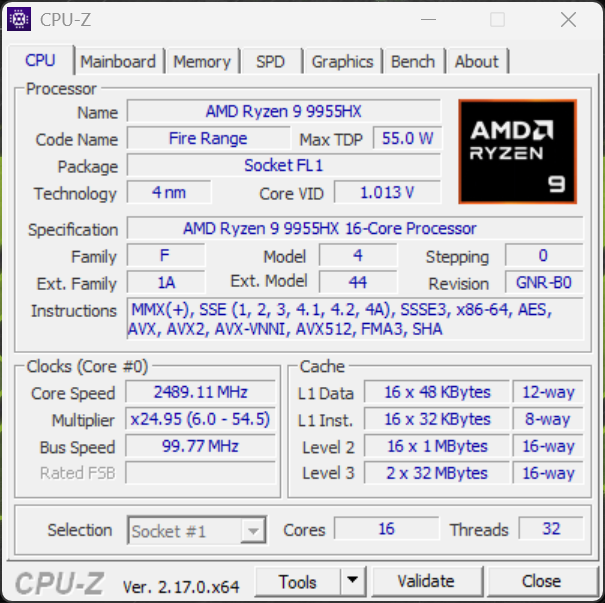
Processore
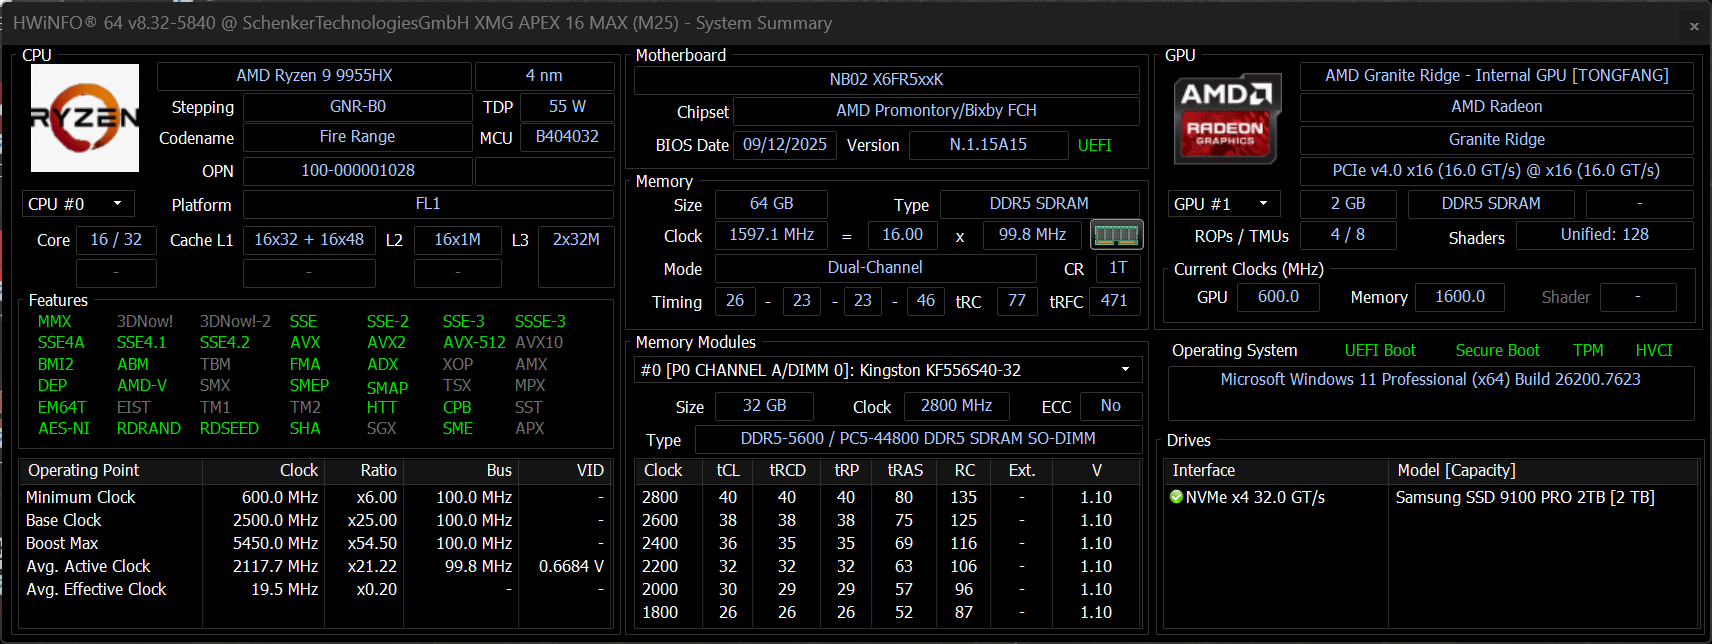
L'AMD Ryzen 9 9955HX AMD Ryzen 9 9955HX (Zen 5) è un processore mobile molto veloce e può assorbire fino a 135/130 watt, il che lo aiuta a fornire prestazioni molto costanti. Nei nostri benchmark, ad esempio, è in grado di superare persino l'Intel Core Ultra 9 275HX Intel Core Ultra 9 275HXnonostante il chip Intel consumi più energia. Con l'alimentazione a batteria (35 watt), tuttavia, le prestazioni multi-core si riducono notevolmente (-55%).
Test di resistenza multipla Cinebench R15
Cinebench R23: Multi Core | Single Core
Cinebench R20: CPU (Multi Core) | CPU (Single Core)
Cinebench R15: CPU Multi 64Bit | CPU Single 64Bit
Blender: v2.79 BMW27 CPU
7-Zip 18.03: 7z b 4 | 7z b 4 -mmt1
Geekbench 6.6: Multi-Core | Single-Core
Geekbench 5.5: Multi-Core | Single-Core
HWBOT x265 Benchmark v2.2: 4k Preset
LibreOffice : 20 Documents To PDF
R Benchmark 2.5: Overall mean
| CPU Performance rating | |
| Media AMD Ryzen 9 9955HX | |
| Schenker XMG APEX 16 MAX | |
| Chuwi Gamebook, R9 9955HX | |
| Lenovo Legion 5 Pro 16IAX10H | |
| Schenker XMG Pro 16 (E25) | |
| Acer Predator Helios Neo 16S AI PHN16S-71-94L9 | |
| Medion Erazer Major 16 X1 MD62736 | |
| MSI Vector 16 HX AI A2XWHG | |
| Media della classe Gaming | |
| Cinebench R23 / Multi Core | |
| Media AMD Ryzen 9 9955HX (35960 - 39690, n=9) | |
| Lenovo Legion 5 Pro 16IAX10H | |
| Schenker XMG Pro 16 (E25) | |
| Chuwi Gamebook, R9 9955HX | |
| Schenker XMG APEX 16 MAX | |
| Medion Erazer Major 16 X1 MD62736 | |
| Acer Predator Helios Neo 16S AI PHN16S-71-94L9 | |
| MSI Vector 16 HX AI A2XWHG | |
| Media della classe Gaming (10488 - 40970, n=125, ultimi 2 anni) | |
| Cinebench R23 / Single Core | |
| Acer Predator Helios Neo 16S AI PHN16S-71-94L9 | |
| Lenovo Legion 5 Pro 16IAX10H | |
| Schenker XMG Pro 16 (E25) | |
| Chuwi Gamebook, R9 9955HX | |
| Schenker XMG APEX 16 MAX | |
| MSI Vector 16 HX AI A2XWHG | |
| Media AMD Ryzen 9 9955HX (1828 - 2183, n=9) | |
| Medion Erazer Major 16 X1 MD62736 | |
| Media della classe Gaming (1166 - 2267, n=125, ultimi 2 anni) | |
| Cinebench R20 / CPU (Multi Core) | |
| Lenovo Legion 5 Pro 16IAX10H | |
| Media AMD Ryzen 9 9955HX (13963 - 15524, n=9) | |
| Schenker XMG Pro 16 (E25) | |
| Chuwi Gamebook, R9 9955HX | |
| Schenker XMG APEX 16 MAX | |
| Acer Predator Helios Neo 16S AI PHN16S-71-94L9 | |
| Medion Erazer Major 16 X1 MD62736 | |
| MSI Vector 16 HX AI A2XWHG | |
| Media della classe Gaming (4029 - 16108, n=124, ultimi 2 anni) | |
| Cinebench R20 / CPU (Single Core) | |
| Acer Predator Helios Neo 16S AI PHN16S-71-94L9 | |
| Lenovo Legion 5 Pro 16IAX10H | |
| Schenker XMG Pro 16 (E25) | |
| Schenker XMG APEX 16 MAX | |
| Chuwi Gamebook, R9 9955HX | |
| Media AMD Ryzen 9 9955HX (819 - 856, n=9) | |
| MSI Vector 16 HX AI A2XWHG | |
| Medion Erazer Major 16 X1 MD62736 | |
| Media della classe Gaming (442 - 870, n=124, ultimi 2 anni) | |
| Cinebench R15 / CPU Multi 64Bit | |
| Lenovo Legion 5 Pro 16IAX10H | |
| Media AMD Ryzen 9 9955HX (5624 - 6103, n=9) | |
| Chuwi Gamebook, R9 9955HX | |
| Schenker XMG APEX 16 MAX | |
| Schenker XMG Pro 16 (E25) | |
| Medion Erazer Major 16 X1 MD62736 | |
| Acer Predator Helios Neo 16S AI PHN16S-71-94L9 | |
| MSI Vector 16 HX AI A2XWHG | |
| Media della classe Gaming (1578 - 6271, n=125, ultimi 2 anni) | |
| Cinebench R15 / CPU Single 64Bit | |
| Chuwi Gamebook, R9 9955HX | |
| Schenker XMG APEX 16 MAX | |
| Schenker XMG Pro 16 (E25) | |
| Acer Predator Helios Neo 16S AI PHN16S-71-94L9 | |
| Media AMD Ryzen 9 9955HX (320 - 338, n=9) | |
| Lenovo Legion 5 Pro 16IAX10H | |
| MSI Vector 16 HX AI A2XWHG | |
| Medion Erazer Major 16 X1 MD62736 | |
| Media della classe Gaming (188.8 - 343, n=124, ultimi 2 anni) | |
| Blender / v2.79 BMW27 CPU | |
| Media della classe Gaming (80 - 330, n=121, ultimi 2 anni) | |
| MSI Vector 16 HX AI A2XWHG | |
| Acer Predator Helios Neo 16S AI PHN16S-71-94L9 | |
| Medion Erazer Major 16 X1 MD62736 | |
| Lenovo Legion 5 Pro 16IAX10H | |
| Schenker XMG Pro 16 (E25) | |
| Chuwi Gamebook, R9 9955HX | |
| Schenker XMG APEX 16 MAX | |
| Media AMD Ryzen 9 9955HX (80 - 91, n=9) | |
| 7-Zip 18.03 / 7z b 4 | |
| Schenker XMG APEX 16 MAX | |
| Media AMD Ryzen 9 9955HX (132435 - 144064, n=9) | |
| Chuwi Gamebook, R9 9955HX | |
| Schenker XMG Pro 16 (E25) | |
| Lenovo Legion 5 Pro 16IAX10H | |
| Acer Predator Helios Neo 16S AI PHN16S-71-94L9 | |
| Medion Erazer Major 16 X1 MD62736 | |
| Media della classe Gaming (33491 - 148086, n=122, ultimi 2 anni) | |
| MSI Vector 16 HX AI A2XWHG | |
| 7-Zip 18.03 / 7z b 4 -mmt1 | |
| Schenker XMG APEX 16 MAX | |
| Media AMD Ryzen 9 9955HX (7061 - 7462, n=9) | |
| Chuwi Gamebook, R9 9955HX | |
| Schenker XMG Pro 16 (E25) | |
| Acer Predator Helios Neo 16S AI PHN16S-71-94L9 | |
| Lenovo Legion 5 Pro 16IAX10H | |
| Medion Erazer Major 16 X1 MD62736 | |
| MSI Vector 16 HX AI A2XWHG | |
| Media della classe Gaming (4199 - 7508, n=122, ultimi 2 anni) | |
| Geekbench 6.6 / Multi-Core | |
| Schenker XMG Pro 16 (E25) | |
| Lenovo Legion 5 Pro 16IAX10H | |
| Schenker XMG APEX 16 MAX | |
| Acer Predator Helios Neo 16S AI PHN16S-71-94L9 | |
| Chuwi Gamebook, R9 9955HX | |
| Media AMD Ryzen 9 9955HX (16313 - 19725, n=9) | |
| Medion Erazer Major 16 X1 MD62736 | |
| MSI Vector 16 HX AI A2XWHG | |
| Media della classe Gaming (6625 - 22104, n=123, ultimi 2 anni) | |
| Geekbench 6.6 / Single-Core | |
| Schenker XMG APEX 16 MAX | |
| Media AMD Ryzen 9 9955HX (3156 - 3259, n=9) | |
| Chuwi Gamebook, R9 9955HX | |
| Acer Predator Helios Neo 16S AI PHN16S-71-94L9 | |
| Schenker XMG Pro 16 (E25) | |
| Lenovo Legion 5 Pro 16IAX10H | |
| Medion Erazer Major 16 X1 MD62736 | |
| MSI Vector 16 HX AI A2XWHG | |
| Media della classe Gaming (1490 - 3259, n=123, ultimi 2 anni) | |
| Geekbench 5.5 / Multi-Core | |
| Schenker XMG Pro 16 (E25) | |
| Schenker XMG APEX 16 MAX | |
| Lenovo Legion 5 Pro 16IAX10H | |
| Acer Predator Helios Neo 16S AI PHN16S-71-94L9 | |
| Media AMD Ryzen 9 9955HX (20576 - 22716, n=9) | |
| Chuwi Gamebook, R9 9955HX | |
| Medion Erazer Major 16 X1 MD62736 | |
| MSI Vector 16 HX AI A2XWHG | |
| Media della classe Gaming (6460 - 27010, n=122, ultimi 2 anni) | |
| Geekbench 5.5 / Single-Core | |
| Schenker XMG APEX 16 MAX | |
| Media AMD Ryzen 9 9955HX (2307 - 2474, n=9) | |
| Chuwi Gamebook, R9 9955HX | |
| Schenker XMG Pro 16 (E25) | |
| Lenovo Legion 5 Pro 16IAX10H | |
| Acer Predator Helios Neo 16S AI PHN16S-71-94L9 | |
| MSI Vector 16 HX AI A2XWHG | |
| Medion Erazer Major 16 X1 MD62736 | |
| Media della classe Gaming (986 - 2474, n=122, ultimi 2 anni) | |
| HWBOT x265 Benchmark v2.2 / 4k Preset | |
| Media AMD Ryzen 9 9955HX (38.9 - 43, n=9) | |
| Chuwi Gamebook, R9 9955HX | |
| Schenker XMG APEX 16 MAX | |
| Schenker XMG Pro 16 (E25) | |
| Lenovo Legion 5 Pro 16IAX10H | |
| Medion Erazer Major 16 X1 MD62736 | |
| Acer Predator Helios Neo 16S AI PHN16S-71-94L9 | |
| MSI Vector 16 HX AI A2XWHG | |
| Media della classe Gaming (11.5 - 44.3, n=122, ultimi 2 anni) | |
| LibreOffice / 20 Documents To PDF | |
| Schenker XMG Pro 16 (E25) | |
| Media della classe Gaming (19 - 88.8, n=122, ultimi 2 anni) | |
| Schenker XMG APEX 16 MAX | |
| Media AMD Ryzen 9 9955HX (42.2 - 52.4, n=9) | |
| Chuwi Gamebook, R9 9955HX | |
| Acer Predator Helios Neo 16S AI PHN16S-71-94L9 | |
| Medion Erazer Major 16 X1 MD62736 | |
| MSI Vector 16 HX AI A2XWHG | |
| Lenovo Legion 5 Pro 16IAX10H | |
| R Benchmark 2.5 / Overall mean | |
| Media della classe Gaming (0.3439 - 0.759, n=123, ultimi 2 anni) | |
| MSI Vector 16 HX AI A2XWHG | |
| Medion Erazer Major 16 X1 MD62736 | |
| Lenovo Legion 5 Pro 16IAX10H | |
| Schenker XMG Pro 16 (E25) | |
| Acer Predator Helios Neo 16S AI PHN16S-71-94L9 | |
| Chuwi Gamebook, R9 9955HX | |
| Media AMD Ryzen 9 9955HX (0.3439 - 0.3737, n=9) | |
| Schenker XMG APEX 16 MAX | |
* ... Meglio usare valori piccoli
AIDA64: FP32 Ray-Trace | FPU Julia | CPU SHA3 | CPU Queen | FPU SinJulia | FPU Mandel | CPU AES | CPU ZLib | FP64 Ray-Trace | CPU PhotoWorxx
| Performance rating | |
| Schenker XMG APEX 16 MAX | |
| Media AMD Ryzen 9 9955HX | |
| Chuwi Gamebook, R9 9955HX | |
| Lenovo Legion 5 Pro 16IAX10H | |
| Schenker XMG Pro 16 (E25) | |
| Medion Erazer Major 16 X1 MD62736 | |
| Acer Predator Helios Neo 16S AI PHN16S-71-94L9 | |
| Media della classe Gaming | |
| MSI Vector 16 HX AI A2XWHG | |
| AIDA64 / FP32 Ray-Trace | |
| Schenker XMG APEX 16 MAX | |
| Chuwi Gamebook, R9 9955HX | |
| Media AMD Ryzen 9 9955HX (66596 - 85542, n=9) | |
| Lenovo Legion 5 Pro 16IAX10H | |
| Schenker XMG Pro 16 (E25) | |
| Medion Erazer Major 16 X1 MD62736 | |
| Media della classe Gaming (10227 - 85542, n=122, ultimi 2 anni) | |
| Acer Predator Helios Neo 16S AI PHN16S-71-94L9 | |
| MSI Vector 16 HX AI A2XWHG | |
| AIDA64 / FPU Julia | |
| Schenker XMG APEX 16 MAX | |
| Media AMD Ryzen 9 9955HX (191535 - 232031, n=9) | |
| Chuwi Gamebook, R9 9955HX | |
| Lenovo Legion 5 Pro 16IAX10H | |
| Schenker XMG Pro 16 (E25) | |
| Medion Erazer Major 16 X1 MD62736 | |
| Acer Predator Helios Neo 16S AI PHN16S-71-94L9 | |
| MSI Vector 16 HX AI A2XWHG | |
| Media della classe Gaming (51376 - 238426, n=122, ultimi 2 anni) | |
| AIDA64 / CPU SHA3 | |
| Schenker XMG APEX 16 MAX | |
| Media AMD Ryzen 9 9955HX (8489 - 9780, n=9) | |
| Chuwi Gamebook, R9 9955HX | |
| Schenker XMG Pro 16 (E25) | |
| Lenovo Legion 5 Pro 16IAX10H | |
| Medion Erazer Major 16 X1 MD62736 | |
| Acer Predator Helios Neo 16S AI PHN16S-71-94L9 | |
| MSI Vector 16 HX AI A2XWHG | |
| Media della classe Gaming (2180 - 9817, n=122, ultimi 2 anni) | |
| AIDA64 / CPU Queen | |
| Media AMD Ryzen 9 9955HX (153027 - 164154, n=9) | |
| Schenker XMG APEX 16 MAX | |
| Chuwi Gamebook, R9 9955HX | |
| Lenovo Legion 5 Pro 16IAX10H | |
| Schenker XMG Pro 16 (E25) | |
| Medion Erazer Major 16 X1 MD62736 | |
| Acer Predator Helios Neo 16S AI PHN16S-71-94L9 | |
| Media della classe Gaming (49785 - 173351, n=120, ultimi 2 anni) | |
| MSI Vector 16 HX AI A2XWHG | |
| AIDA64 / FPU SinJulia | |
| Schenker XMG APEX 16 MAX | |
| Media AMD Ryzen 9 9955HX (29876 - 32647, n=9) | |
| Chuwi Gamebook, R9 9955HX | |
| Media della classe Gaming (4424 - 33636, n=122, ultimi 2 anni) | |
| Schenker XMG Pro 16 (E25) | |
| Lenovo Legion 5 Pro 16IAX10H | |
| Medion Erazer Major 16 X1 MD62736 | |
| Acer Predator Helios Neo 16S AI PHN16S-71-94L9 | |
| MSI Vector 16 HX AI A2XWHG | |
| AIDA64 / FPU Mandel | |
| Schenker XMG APEX 16 MAX | |
| Media AMD Ryzen 9 9955HX (101131 - 128721, n=9) | |
| Chuwi Gamebook, R9 9955HX | |
| Schenker XMG Pro 16 (E25) | |
| Lenovo Legion 5 Pro 16IAX10H | |
| Medion Erazer Major 16 X1 MD62736 | |
| Acer Predator Helios Neo 16S AI PHN16S-71-94L9 | |
| MSI Vector 16 HX AI A2XWHG | |
| Media della classe Gaming (25115 - 128721, n=122, ultimi 2 anni) | |
| AIDA64 / CPU AES | |
| Schenker XMG APEX 16 MAX | |
| Media AMD Ryzen 9 9955HX (146979 - 218385, n=9) | |
| Chuwi Gamebook, R9 9955HX | |
| Lenovo Legion 5 Pro 16IAX10H | |
| Schenker XMG Pro 16 (E25) | |
| Medion Erazer Major 16 X1 MD62736 | |
| Media della classe Gaming (39258 - 247074, n=122, ultimi 2 anni) | |
| Acer Predator Helios Neo 16S AI PHN16S-71-94L9 | |
| MSI Vector 16 HX AI A2XWHG | |
| AIDA64 / CPU ZLib | |
| Media AMD Ryzen 9 9955HX (2186 - 2531, n=9) | |
| Schenker XMG APEX 16 MAX | |
| Chuwi Gamebook, R9 9955HX | |
| Lenovo Legion 5 Pro 16IAX10H | |
| Schenker XMG Pro 16 (E25) | |
| Medion Erazer Major 16 X1 MD62736 | |
| Acer Predator Helios Neo 16S AI PHN16S-71-94L9 | |
| Media della classe Gaming (574 - 2531, n=122, ultimi 2 anni) | |
| MSI Vector 16 HX AI A2XWHG | |
| AIDA64 / FP64 Ray-Trace | |
| Schenker XMG APEX 16 MAX | |
| Chuwi Gamebook, R9 9955HX | |
| Media AMD Ryzen 9 9955HX (35252 - 45446, n=9) | |
| Lenovo Legion 5 Pro 16IAX10H | |
| Schenker XMG Pro 16 (E25) | |
| Medion Erazer Major 16 X1 MD62736 | |
| Media della classe Gaming (5509 - 45446, n=122, ultimi 2 anni) | |
| Acer Predator Helios Neo 16S AI PHN16S-71-94L9 | |
| MSI Vector 16 HX AI A2XWHG | |
| AIDA64 / CPU PhotoWorxx | |
| Acer Predator Helios Neo 16S AI PHN16S-71-94L9 | |
| Schenker XMG Pro 16 (E25) | |
| Medion Erazer Major 16 X1 MD62736 | |
| Lenovo Legion 5 Pro 16IAX10H | |
| Media della classe Gaming (12271 - 62916, n=122, ultimi 2 anni) | |
| Schenker XMG APEX 16 MAX | |
| Chuwi Gamebook, R9 9955HX | |
| Media AMD Ryzen 9 9955HX (35974 - 42495, n=9) | |
| MSI Vector 16 HX AI A2XWHG | |
Prestazioni del sistema
Non sorprende che le prestazioni del sistema siano eccellenti e che anche i risultati dei benchmark siano molto buoni.
PCMark 10: Score | Essentials | Productivity | Digital Content Creation
CrossMark: Overall | Productivity | Creativity | Responsiveness
WebXPRT 3: Overall
WebXPRT 4: Overall
Mozilla Kraken 1.1: Total
| Performance rating | |
| Lenovo Legion 5 Pro 16IAX10H | |
| Media AMD Ryzen 9 9955HX, NVIDIA GeForce RTX 5070 Ti Laptop | |
| Chuwi Gamebook, R9 9955HX | |
| Schenker XMG APEX 16 MAX | |
| Schenker XMG Pro 16 (E25) | |
| Acer Predator Helios Neo 16S AI PHN16S-71-94L9 | |
| Medion Erazer Major 16 X1 MD62736 | |
| Media della classe Gaming | |
| MSI Vector 16 HX AI A2XWHG | |
| PCMark 10 / Score | |
| Schenker XMG APEX 16 MAX | |
| Media AMD Ryzen 9 9955HX, NVIDIA GeForce RTX 5070 Ti Laptop (9208 - 10060, n=3) | |
| Chuwi Gamebook, R9 9955HX | |
| Schenker XMG Pro 16 (E25) | |
| Acer Predator Helios Neo 16S AI PHN16S-71-94L9 | |
| Lenovo Legion 5 Pro 16IAX10H | |
| Media della classe Gaming (5828 - 10060, n=104, ultimi 2 anni) | |
| Medion Erazer Major 16 X1 MD62736 | |
| MSI Vector 16 HX AI A2XWHG | |
| PCMark 10 / Essentials | |
| Schenker XMG APEX 16 MAX | |
| Media AMD Ryzen 9 9955HX, NVIDIA GeForce RTX 5070 Ti Laptop (11178 - 11719, n=3) | |
| Schenker XMG Pro 16 (E25) | |
| Chuwi Gamebook, R9 9955HX | |
| Acer Predator Helios Neo 16S AI PHN16S-71-94L9 | |
| Medion Erazer Major 16 X1 MD62736 | |
| Lenovo Legion 5 Pro 16IAX10H | |
| MSI Vector 16 HX AI A2XWHG | |
| Media della classe Gaming (8810 - 12600, n=108, ultimi 2 anni) | |
| PCMark 10 / Productivity | |
| Schenker XMG APEX 16 MAX | |
| Media AMD Ryzen 9 9955HX, NVIDIA GeForce RTX 5070 Ti Laptop (10734 - 16314, n=3) | |
| Chuwi Gamebook, R9 9955HX | |
| Media della classe Gaming (6662 - 16716, n=106, ultimi 2 anni) | |
| Acer Predator Helios Neo 16S AI PHN16S-71-94L9 | |
| Lenovo Legion 5 Pro 16IAX10H | |
| Schenker XMG Pro 16 (E25) | |
| MSI Vector 16 HX AI A2XWHG | |
| Medion Erazer Major 16 X1 MD62736 | |
| PCMark 10 / Digital Content Creation | |
| Chuwi Gamebook, R9 9955HX | |
| Media AMD Ryzen 9 9955HX, NVIDIA GeForce RTX 5070 Ti Laptop (14454 - 18192, n=3) | |
| Schenker XMG Pro 16 (E25) | |
| Lenovo Legion 5 Pro 16IAX10H | |
| Acer Predator Helios Neo 16S AI PHN16S-71-94L9 | |
| Schenker XMG APEX 16 MAX | |
| Media della classe Gaming (7602 - 19351, n=106, ultimi 2 anni) | |
| Medion Erazer Major 16 X1 MD62736 | |
| MSI Vector 16 HX AI A2XWHG | |
| CrossMark / Overall | |
| Chuwi Gamebook, R9 9955HX | |
| Schenker XMG Pro 16 (E25) | |
| Lenovo Legion 5 Pro 16IAX10H | |
| Media AMD Ryzen 9 9955HX, NVIDIA GeForce RTX 5070 Ti Laptop (2111 - 2215, n=3) | |
| Acer Predator Helios Neo 16S AI PHN16S-71-94L9 | |
| Schenker XMG APEX 16 MAX | |
| Medion Erazer Major 16 X1 MD62736 | |
| Media della classe Gaming (1366 - 2344, n=106, ultimi 2 anni) | |
| MSI Vector 16 HX AI A2XWHG | |
| CrossMark / Productivity | |
| Lenovo Legion 5 Pro 16IAX10H | |
| Schenker XMG Pro 16 (E25) | |
| Chuwi Gamebook, R9 9955HX | |
| Acer Predator Helios Neo 16S AI PHN16S-71-94L9 | |
| Medion Erazer Major 16 X1 MD62736 | |
| Media AMD Ryzen 9 9955HX, NVIDIA GeForce RTX 5070 Ti Laptop (1882 - 1999, n=3) | |
| Schenker XMG APEX 16 MAX | |
| Media della classe Gaming (1386 - 2211, n=106, ultimi 2 anni) | |
| MSI Vector 16 HX AI A2XWHG | |
| CrossMark / Creativity | |
| Media AMD Ryzen 9 9955HX, NVIDIA GeForce RTX 5070 Ti Laptop (2592 - 2660, n=3) | |
| Chuwi Gamebook, R9 9955HX | |
| Schenker XMG APEX 16 MAX | |
| Schenker XMG Pro 16 (E25) | |
| Lenovo Legion 5 Pro 16IAX10H | |
| Acer Predator Helios Neo 16S AI PHN16S-71-94L9 | |
| Medion Erazer Major 16 X1 MD62736 | |
| MSI Vector 16 HX AI A2XWHG | |
| Media della classe Gaming (1343 - 2729, n=106, ultimi 2 anni) | |
| CrossMark / Responsiveness | |
| Chuwi Gamebook, R9 9955HX | |
| Lenovo Legion 5 Pro 16IAX10H | |
| Schenker XMG Pro 16 (E25) | |
| Acer Predator Helios Neo 16S AI PHN16S-71-94L9 | |
| Medion Erazer Major 16 X1 MD62736 | |
| Media AMD Ryzen 9 9955HX, NVIDIA GeForce RTX 5070 Ti Laptop (1608 - 1854, n=3) | |
| Media della classe Gaming (1226 - 2330, n=106, ultimi 2 anni) | |
| Schenker XMG APEX 16 MAX | |
| MSI Vector 16 HX AI A2XWHG | |
| WebXPRT 3 / Overall | |
| Lenovo Legion 5 Pro 16IAX10H | |
| Schenker XMG Pro 16 (E25) | |
| Media AMD Ryzen 9 9955HX, NVIDIA GeForce RTX 5070 Ti Laptop (328 - 361, n=3) | |
| Chuwi Gamebook, R9 9955HX | |
| Acer Predator Helios Neo 16S AI PHN16S-71-94L9 | |
| Schenker XMG APEX 16 MAX | |
| Medion Erazer Major 16 X1 MD62736 | |
| MSI Vector 16 HX AI A2XWHG | |
| Media della classe Gaming (237 - 532, n=109, ultimi 2 anni) | |
| WebXPRT 4 / Overall | |
| Schenker XMG Pro 16 (E25) | |
| Lenovo Legion 5 Pro 16IAX10H | |
| Medion Erazer Major 16 X1 MD62736 | |
| Acer Predator Helios Neo 16S AI PHN16S-71-94L9 | |
| MSI Vector 16 HX AI A2XWHG | |
| Media AMD Ryzen 9 9955HX, NVIDIA GeForce RTX 5070 Ti Laptop (282 - 322, n=3) | |
| Chuwi Gamebook, R9 9955HX | |
| Schenker XMG APEX 16 MAX | |
| Media della classe Gaming (176.4 - 345, n=108, ultimi 2 anni) | |
| Mozilla Kraken 1.1 / Total | |
| Media della classe Gaming (397 - 594, n=115, ultimi 2 anni) | |
| Schenker XMG APEX 16 MAX | |
| MSI Vector 16 HX AI A2XWHG | |
| Medion Erazer Major 16 X1 MD62736 | |
| Media AMD Ryzen 9 9955HX, NVIDIA GeForce RTX 5070 Ti Laptop (403 - 440, n=3) | |
| Lenovo Legion 5 Pro 16IAX10H | |
| Acer Predator Helios Neo 16S AI PHN16S-71-94L9 | |
| Schenker XMG Pro 16 (E25) | |
| Chuwi Gamebook, R9 9955HX | |
* ... Meglio usare valori piccoli
| PCMark 10 Score | 10060 punti | |
Aiuto | ||
| AIDA64 / Memory Copy | |
| Acer Predator Helios Neo 16S AI PHN16S-71-94L9 | |
| Schenker XMG Pro 16 (E25) | |
| Lenovo Legion 5 Pro 16IAX10H | |
| Medion Erazer Major 16 X1 MD62736 | |
| Media della classe Gaming (21750 - 108104, n=122, ultimi 2 anni) | |
| MSI Vector 16 HX AI A2XWHG | |
| Schenker XMG APEX 16 MAX | |
| Chuwi Gamebook, R9 9955HX | |
| Media AMD Ryzen 9 9955HX (53598 - 62777, n=9) | |
| AIDA64 / Memory Read | |
| Schenker XMG Pro 16 (E25) | |
| Acer Predator Helios Neo 16S AI PHN16S-71-94L9 | |
| Lenovo Legion 5 Pro 16IAX10H | |
| Medion Erazer Major 16 X1 MD62736 | |
| MSI Vector 16 HX AI A2XWHG | |
| Media della classe Gaming (22956 - 104349, n=122, ultimi 2 anni) | |
| Schenker XMG APEX 16 MAX | |
| Media AMD Ryzen 9 9955HX (63953 - 67256, n=9) | |
| Chuwi Gamebook, R9 9955HX | |
| AIDA64 / Memory Write | |
| Medion Erazer Major 16 X1 MD62736 | |
| Acer Predator Helios Neo 16S AI PHN16S-71-94L9 | |
| Schenker XMG Pro 16 (E25) | |
| Lenovo Legion 5 Pro 16IAX10H | |
| Media della classe Gaming (22297 - 133486, n=122, ultimi 2 anni) | |
| Schenker XMG APEX 16 MAX | |
| Media AMD Ryzen 9 9955HX (65421 - 72060, n=9) | |
| Chuwi Gamebook, R9 9955HX | |
| MSI Vector 16 HX AI A2XWHG | |
| AIDA64 / Memory Latency | |
| Lenovo Legion 5 Pro 16IAX10H | |
| Acer Predator Helios Neo 16S AI PHN16S-71-94L9 | |
| Medion Erazer Major 16 X1 MD62736 | |
| MSI Vector 16 HX AI A2XWHG | |
| Schenker XMG Pro 16 (E25) | |
| Media della classe Gaming (75.3 - 259, n=122, ultimi 2 anni) | |
| Chuwi Gamebook, R9 9955HX | |
| Media AMD Ryzen 9 9955HX (92.1 - 103.5, n=9) | |
| Schenker XMG APEX 16 MAX | |
* ... Meglio usare valori piccoli
Latenze DPC
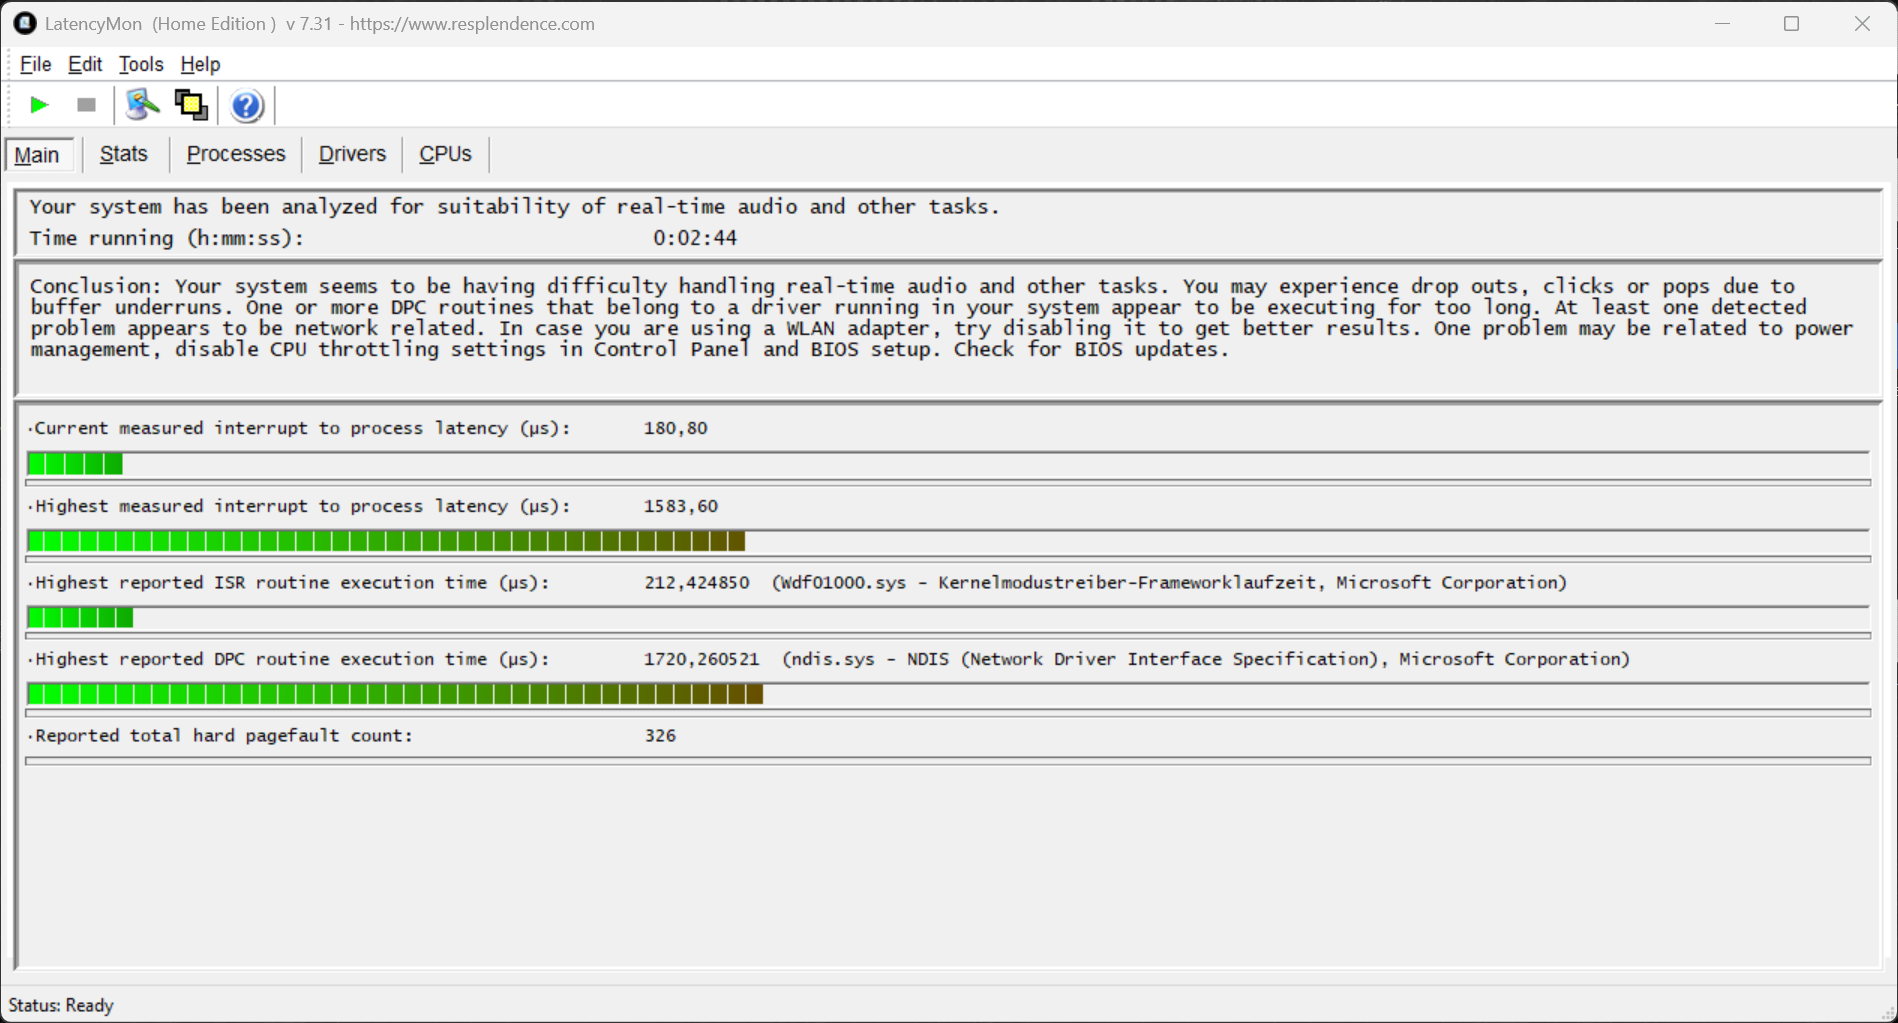
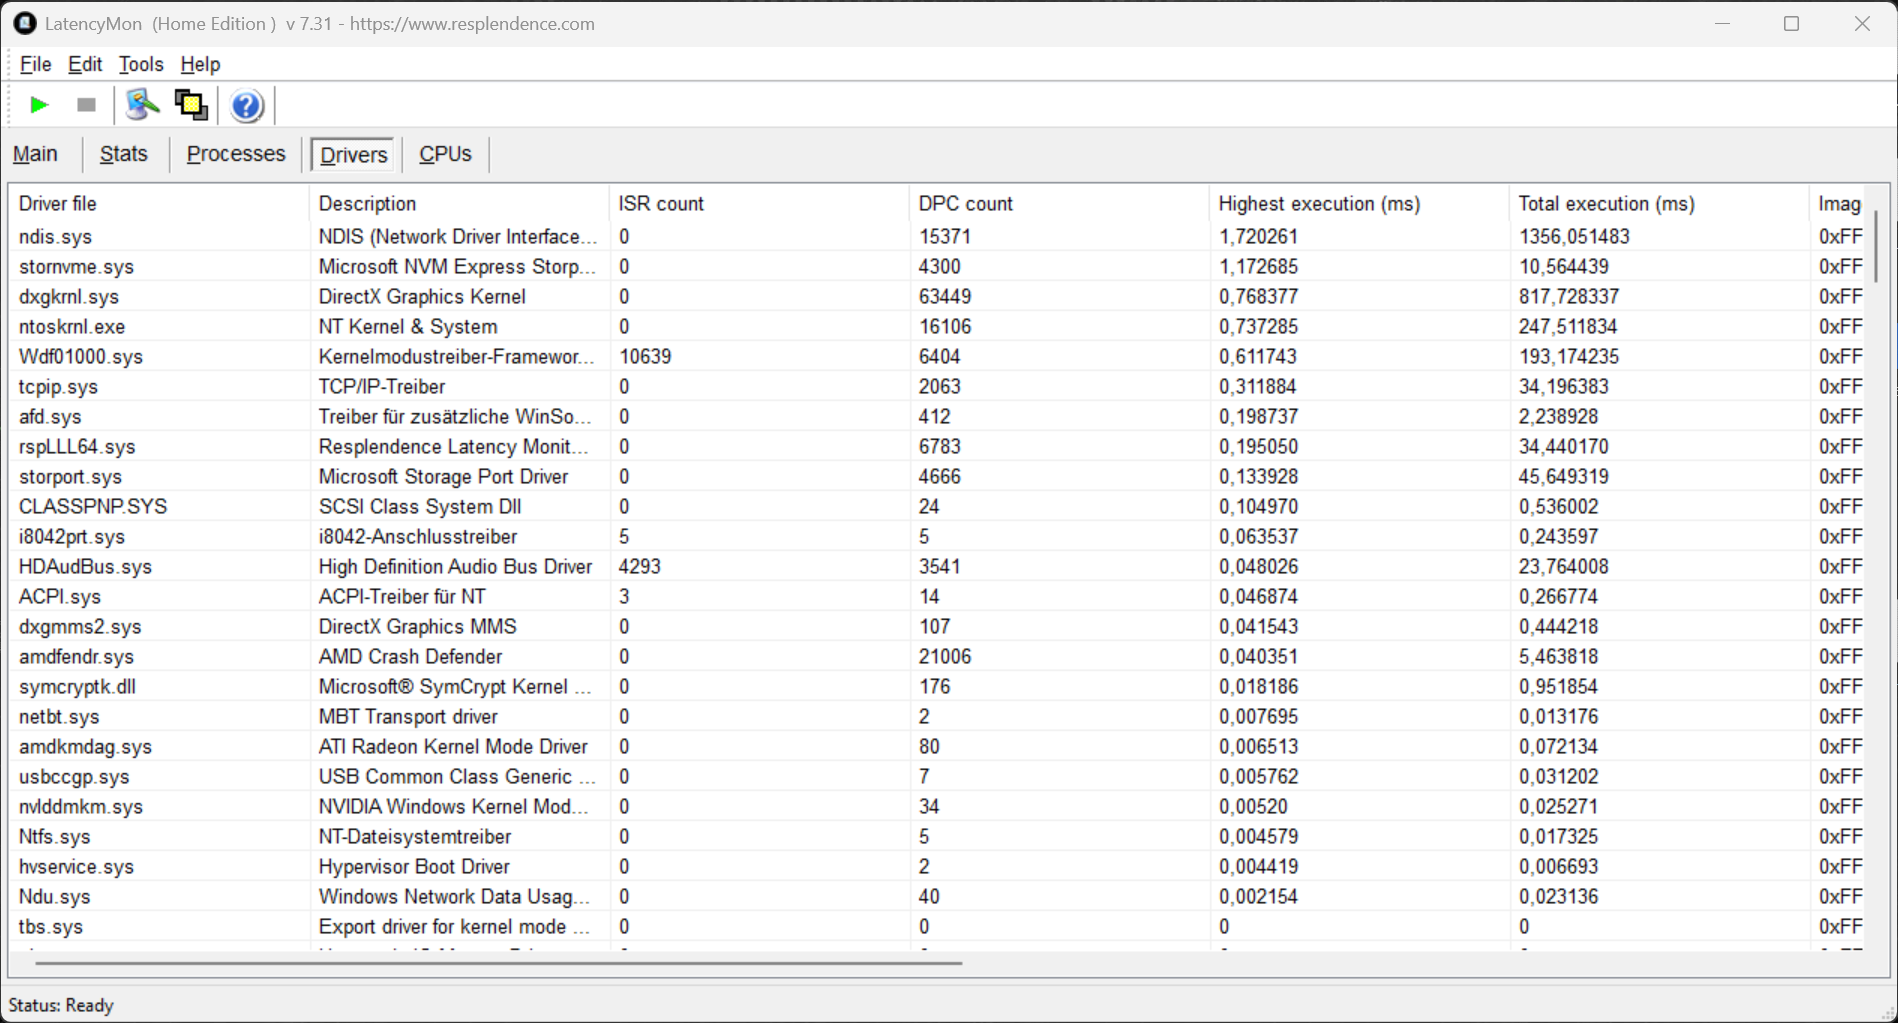
| DPC Latencies / LatencyMon - interrupt to process latency (max), Web, Youtube, Prime95 | |
| Chuwi Gamebook, R9 9955HX | |
| MSI Vector 16 HX AI A2XWHG | |
| Medion Erazer Major 16 X1 MD62736 | |
| Acer Predator Helios Neo 16S AI PHN16S-71-94L9 | |
| Schenker XMG Pro 16 (E25) | |
| Schenker XMG APEX 16 MAX | |
| Lenovo Legion 5 Pro 16IAX10H | |
* ... Meglio usare valori piccoli
Conservazione
L'Apex 16 Max supporta già PCIe 5.0 e nel sistema di test è installato un corrispondente Samsung 9100 Pro (2 TB, 1,73 TB utilizzabili). Le prestazioni sono molto buone e rimangono stabili. Il secondo slot M.2 2280 è collegato tramite PCIe 4.0.

* ... Meglio usare valori piccoli
Prestazioni in lettura continua: Loop di lettura DiskSpd, profondità della coda 8
Prestazioni della GPU
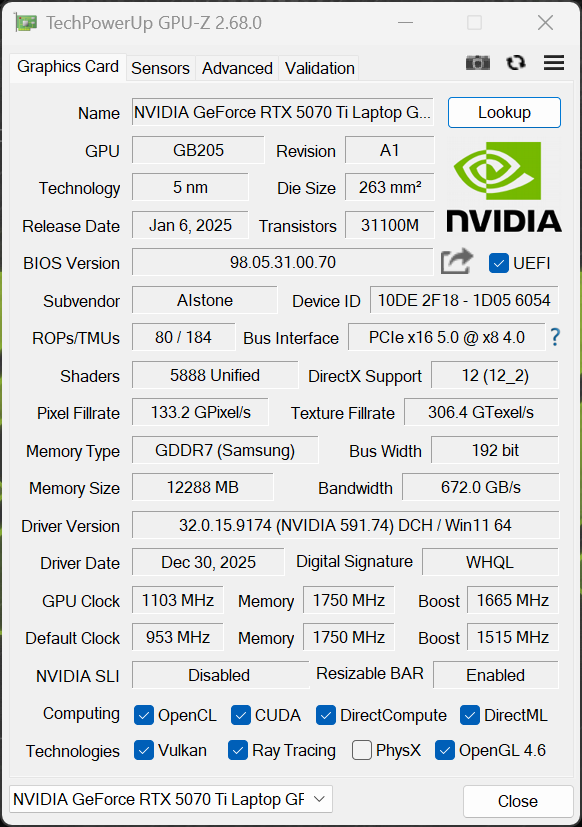
XMG utilizza la versione più veloce da 140 watt della mobile GeForce RTX 5070 Ti con 12 GB di VRAM. La commutazione grafica è gestita tramite Optimus, ma è incluso un interruttore MUX. Le prestazioni grafiche complessive sono molto buone e rimangono completamente stabili anche sotto carico prolungato. Con l'alimentazione a batteria (40 watt), le prestazioni sono inferiori di circa il 60%.
| 3DMark 11 Performance | 45731 punti | |
| 3DMark Fire Strike Score | 39568 punti | |
| 3DMark Time Spy Score | 17095 punti | |
| 3DMark Steel Nomad Score | 3953 punti | |
| 3DMark Steel Nomad Light Score | 18188 punti | |
Aiuto | ||
| Blender / v3.3 Classroom OPTIX/RTX | |
| Media della classe Gaming (9 - 32, n=122, ultimi 2 anni) | |
| Acer Predator Helios Neo 16S AI PHN16S-71-94L9 | |
| MSI Vector 16 HX AI A2XWHG | |
| Medion Erazer Major 16 X1 MD62736 | |
| Schenker XMG APEX 16 MAX | |
| Media NVIDIA GeForce RTX 5070 Ti Laptop (13 - 19, n=12) | |
| Lenovo Legion 5 Pro 16IAX10H | |
| Schenker XMG Pro 16 (E25) | |
| Chuwi Gamebook, R9 9955HX | |
| Blender / v3.3 Classroom CUDA | |
| Media della classe Gaming (15 - 228, n=122, ultimi 2 anni) | |
| Acer Predator Helios Neo 16S AI PHN16S-71-94L9 | |
| Schenker XMG APEX 16 MAX | |
| Media NVIDIA GeForce RTX 5070 Ti Laptop (24 - 33, n=12) | |
| Schenker XMG Pro 16 (E25) | |
| Medion Erazer Major 16 X1 MD62736 | |
| MSI Vector 16 HX AI A2XWHG | |
| Lenovo Legion 5 Pro 16IAX10H | |
| Chuwi Gamebook, R9 9955HX | |
| Blender / v3.3 Classroom CPU | |
| Media della classe Gaming (122 - 565, n=119, ultimi 2 anni) | |
| MSI Vector 16 HX AI A2XWHG | |
| Media NVIDIA GeForce RTX 5070 Ti Laptop (122 - 361, n=12) | |
| Acer Predator Helios Neo 16S AI PHN16S-71-94L9 | |
| Medion Erazer Major 16 X1 MD62736 | |
| Lenovo Legion 5 Pro 16IAX10H | |
| Schenker XMG Pro 16 (E25) | |
| Chuwi Gamebook, R9 9955HX | |
| Schenker XMG APEX 16 MAX | |
* ... Meglio usare valori piccoli
Prestazioni di gioco
Le prestazioni di gioco sono molto buone e tutti i giochi moderni funzionano senza problemi con le impostazioni di dettaglio più elevate e la risoluzione nativa. Solo il ray-tracing a volte richiede il DLSS o la generazione di fotogrammi. Le prestazioni rimangono completamente stabili anche durante sessioni di gioco prolungate.
| Final Fantasy XV Benchmark - 1920x1080 High Quality | |
| Lenovo Legion 5 Pro 16IAX10H | |
| Medion Erazer Major 16 X1 MD62736 | |
| Chuwi Gamebook, R9 9955HX | |
| MSI Vector 16 HX AI A2XWHG | |
| Schenker XMG APEX 16 MAX | |
| Schenker XMG Pro 16 (E25) | |
| Media della classe Gaming (41 - 215, n=116, ultimi 2 anni) | |
| Strange Brigade - 1920x1080 ultra AA:ultra AF:16 | |
| Lenovo Legion 5 Pro 16IAX10H | |
| Schenker XMG APEX 16 MAX | |
| Chuwi Gamebook, R9 9955HX | |
| Media della classe Gaming (76.3 - 456, n=106, ultimi 2 anni) | |
| Schenker XMG Pro 16 (E25) | |
| F1 24 | |
| 2560x1440 Ultra High Preset AA:T AF:16x | |
| Schenker XMG APEX 16 MAX | |
| Schenker XMG Pro 16 (E25) | |
| Media della classe Gaming (29.8 - 106.9, n=57, ultimi 2 anni) | |
| Chuwi Gamebook, R9 9955HX | |
| Media NVIDIA GeForce RTX 5070 Ti Laptop (53.2 - 72.1, n=8) | |
| 2560x1440 Ultra High Preset + Quality DLSS AF:16x | |
| Schenker XMG APEX 16 MAX | |
| Chuwi Gamebook, R9 9955HX | |
| Media della classe Gaming (14.3 - 159.3, n=45, ultimi 2 anni) | |
| Media NVIDIA GeForce RTX 5070 Ti Laptop (78.1 - 115.8, n=7) | |
| F1 25 | |
| 2560x1440 Ultra Max Preset AA:T AF:16x | |
| Schenker XMG APEX 16 MAX | |
| Chuwi Gamebook, R9 9955HX | |
| Media NVIDIA GeForce RTX 5070 Ti Laptop (18 - 26, n=6) | |
| Media della classe Gaming (5 - 37.5, n=21, ultimi 2 anni) | |
| Lenovo Legion 5 Pro 16IAX10H | |
| 2560x1440 Ultra Max Preset + DLSS Quality AA:DLSS AF:16x | |
| Schenker XMG APEX 16 MAX | |
| Chuwi Gamebook, R9 9955HX | |
| Media NVIDIA GeForce RTX 5070 Ti Laptop (32 - 48.1, n=6) | |
| Media della classe Gaming (9 - 67.5, n=19, ultimi 2 anni) | |
| Lenovo Legion 5 Pro 16IAX10H | |

Cyberpunk 2077 grafico FPS ultra
| basso | medio | alto | ultra | QHD DLSS | QHD | |
|---|---|---|---|---|---|---|
| GTA V (2015) | 166.3 | 157.3 | ||||
| Dota 2 Reborn (2015) | 259 | 240 | 209 | 188.4 | ||
| Final Fantasy XV Benchmark (2018) | 232 | 211 | 158.2 | 121.8 | ||
| X-Plane 11.11 (2018) | 155.8 | 123.9 | 105.6 | |||
| Strange Brigade (2018) | 579 | 468 | 387 | 340 | 236 | |
| Baldur's Gate 3 (2023) | 221 | 178.7 | 157.5 | 155.6 | 110.5 | |
| Cyberpunk 2077 (2023) | 183.7 | 164.6 | 140.6 | 128 | 96.1 | 82.9 |
| F1 24 (2024) | 315 | 270 | 110.6 | 112.4 | 72 | |
| F1 25 (2025) | 249 | 231 | 218 | 42.9 | 48.1 | 26 |
| Call of Duty Black Ops 7 (2025) | 239 | 188 | 151 | 60 | 39 |
Emissioni ed energia
Emissioni di rumore

Il rumore della ventola dipende in gran parte dalla modalità di prestazione selezionata. La modalità Bilanciata è la più sensata per l'uso quotidiano, in quanto le ventole sono inattive o producono solo un silenzioso fruscio. In modalità Overboost Normal, tuttavia, il portatile diventa molto rumoroso durante il gioco, con 51 dB(A)(Overboost Extreme: 55 dB(A), Enthusiast: 47,9 dB(A), Balanced: 43,3 dB(A), Battery: 35,8 dB(A)). Non abbiamo notato alcun fruscio della bobina sulla nostra unità di prova.
Rumorosità
| Idle |
| 25.9 / 26.5 / 26.5 dB(A) |
| Sotto carico |
| 42.1 / 51 dB(A) |
 | ||
30 dB silenzioso 40 dB(A) udibile 50 dB(A) rumoroso |
||
min: | ||
| Schenker XMG APEX 16 MAX R9 9955HX, GeForce RTX 5070 Ti Laptop | Acer Predator Helios Neo 16S AI PHN16S-71-94L9 Ultra 9 275HX, GeForce RTX 5070 Ti Laptop | Chuwi Gamebook, R9 9955HX R9 9955HX, GeForce RTX 5070 Ti Laptop | Medion Erazer Major 16 X1 MD62736 Ultra 7 255HX, GeForce RTX 5070 Ti Laptop | Lenovo Legion 5 Pro 16IAX10H Ultra 9 275HX, GeForce RTX 5070 Ti Laptop | MSI Vector 16 HX AI A2XWHG Ultra 7 255HX, GeForce RTX 5070 Ti Laptop | Schenker XMG Pro 16 (E25) Ultra 9 275HX, GeForce RTX 5070 Ti Laptop | |
|---|---|---|---|---|---|---|---|
| Noise | -9% | -3% | -7% | -7% | -13% | 1% | |
| off /ambiente * (dB) | 25.9 | 24 7% | 25 3% | 25 3% | 24 7% | 25 3% | 23.3 10% |
| Idle Minimum * (dB) | 25.9 | 24 7% | 26.3 -2% | 26 -0% | 24 7% | 33 -27% | 25 3% |
| Idle Average * (dB) | 26.5 | 30 -13% | 26.5 -0% | 27 -2% | 24 9% | 34 -28% | 25 6% |
| Idle Maximum * (dB) | 26.5 | 35 -32% | 27.3 -3% | 30 -13% | 30.9 -17% | 38 -43% | 25 6% |
| Load Average * (dB) | 42.1 | 53 -26% | 50.4 -20% | 53 -26% | 55.9 -33% | 46 -9% | 45.5 -8% |
| Cyberpunk 2077 ultra * (dB) | 51 | 52 -2% | 50.3 1% | 54 -6% | 56.72 -11% | 47 8% | 53.3 -5% |
| Load Maximum * (dB) | 51 | 54 -6% | 50.4 1% | 54 -6% | 56.72 -11% | 49 4% | 53.3 -5% |
| Witcher 3 ultra * (dB) | 50.4 |
* ... Meglio usare valori piccoli
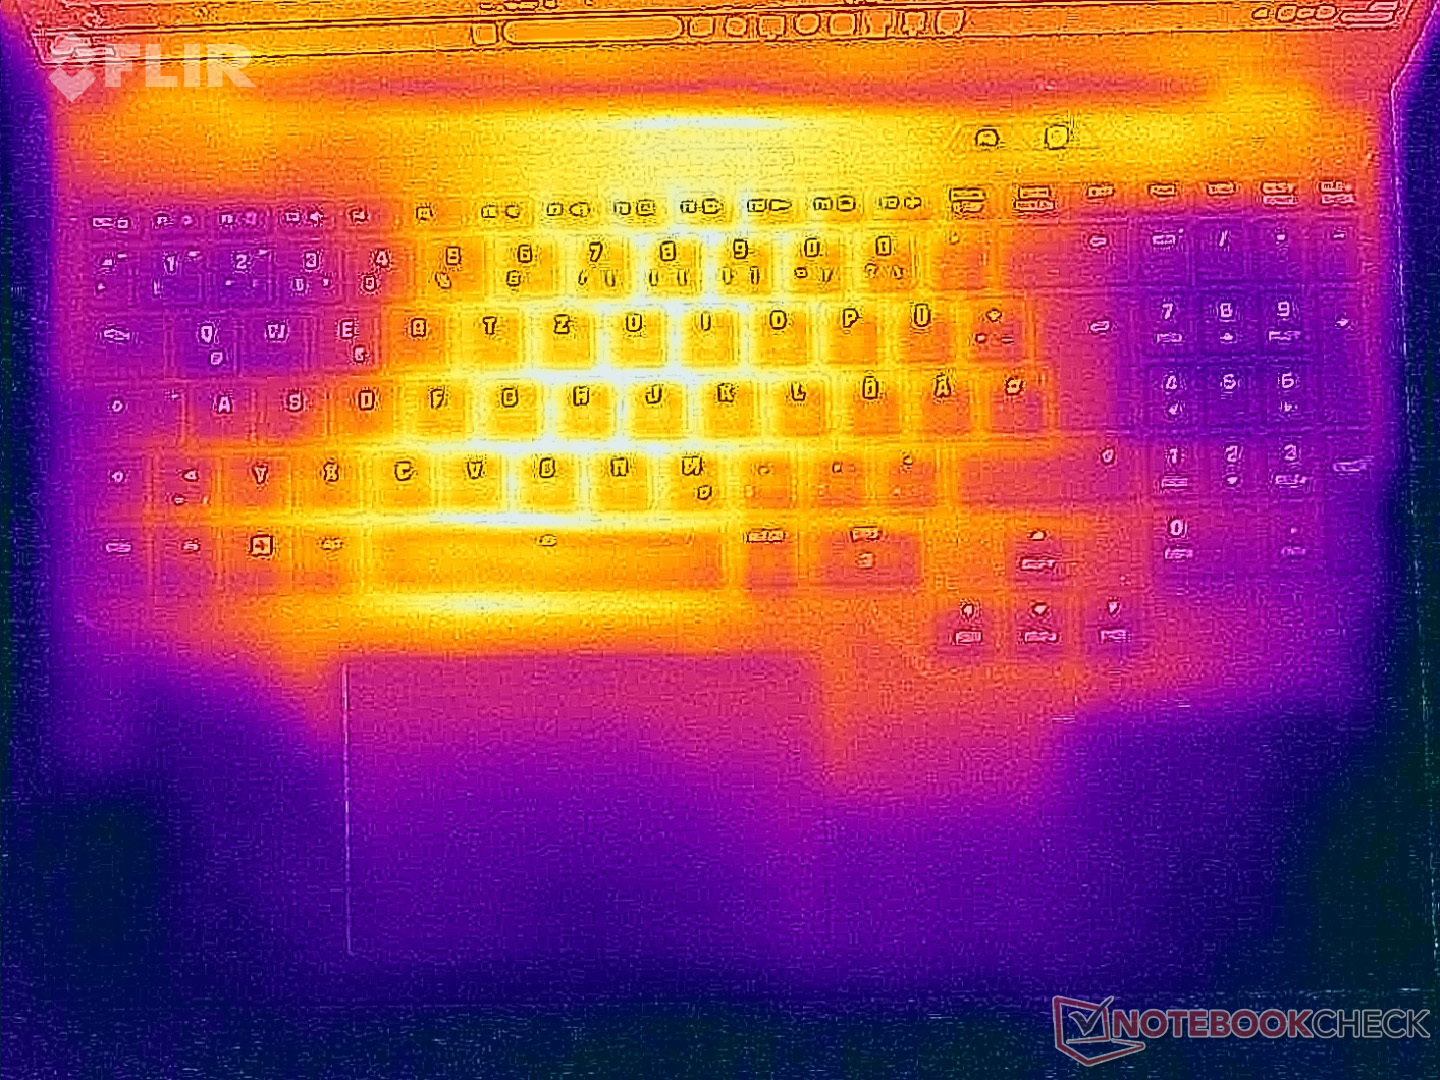
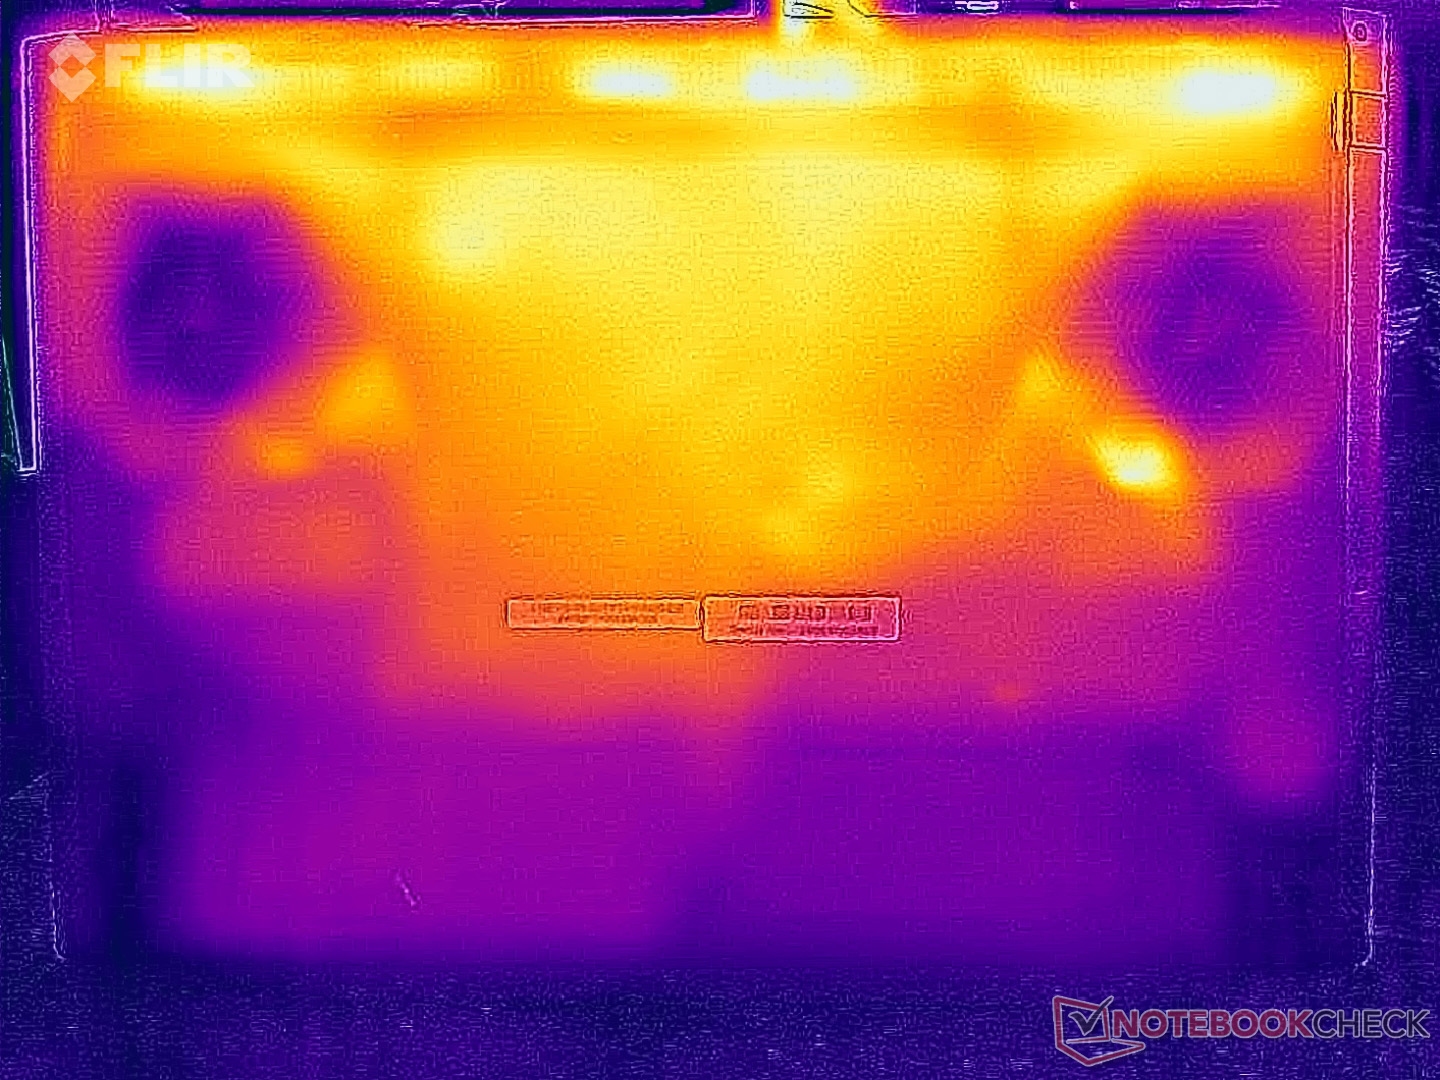
Temperatura
Le temperature di superficie sono generalmente prive di problemi. Anche se abbiamo misurato fino a 46 °C sia sulla parte superiore che su quella inferiore in condizioni di carico elevato, questo non causa alcuna limitazione reale. Nel test di stress, la GPU ha la priorità (ben 140 watt a 80 °C), mentre la CPU si assesta a 45 watt (70 °C).

(-) La temperatura massima sul lato superiore è di 46.5 °C / 116 F, rispetto alla media di 40.4 °C / 105 F, che varia da 21.2 a 68.8 °C per questa classe Gaming.
(-) Il lato inferiore si riscalda fino ad un massimo di 46.4 °C / 116 F, rispetto alla media di 43.3 °C / 110 F
(+) In idle, la temperatura media del lato superiore è di 30.1 °C / 86 F, rispetto alla media deld ispositivo di 33.9 °C / 93 F.
(-) 3: The average temperature for the upper side is 40 °C / 104 F, compared to the average of 33.9 °C / 93 F for the class Gaming.
(+) I poggiapolsi e il touchpad raggiungono la temperatura massima della pelle (35.4 °C / 95.7 F) e quindi non sono caldi.
(-) La temperatura media della zona del palmo della mano di dispositivi simili e'stata di 28.8 °C / 83.8 F (-6.6 °C / -11.9 F).
| Schenker XMG APEX 16 MAX R9 9955HX, GeForce RTX 5070 Ti Laptop | Acer Predator Helios Neo 16S AI PHN16S-71-94L9 Ultra 9 275HX, GeForce RTX 5070 Ti Laptop | Chuwi Gamebook, R9 9955HX R9 9955HX, GeForce RTX 5070 Ti Laptop | Medion Erazer Major 16 X1 MD62736 Ultra 7 255HX, GeForce RTX 5070 Ti Laptop | Lenovo Legion 5 Pro 16IAX10H Ultra 9 275HX, GeForce RTX 5070 Ti Laptop | MSI Vector 16 HX AI A2XWHG Ultra 7 255HX, GeForce RTX 5070 Ti Laptop | Schenker XMG Pro 16 (E25) Ultra 9 275HX, GeForce RTX 5070 Ti Laptop | |
|---|---|---|---|---|---|---|---|
| Heat | 2% | -5% | -9% | -14% | -4% | -167% | |
| Maximum Upper Side * (°C) | 46.5 | 47 -1% | 51.8 -11% | 49 -5% | 48 -3% | 53 -14% | 43.2 7% |
| Maximum Bottom * (°C) | 46.4 | 55 -19% | 46.6 -0% | 50 -8% | 50 -8% | 52 -12% | 46 1% |
| Idle Upper Side * (°C) | 32.1 | 28 13% | 34.9 -9% | 36 -12% | 38 -18% | 33 -3% | 27.7 14% |
| Idle Bottom * (°C) | 33.5 | 29 13% | 33.4 -0% | 37 -10% | 42 -25% | 29 13% | 264 -688% |
* ... Meglio usare valori piccoli
Altoparlanti
Schenker XMG APEX 16 MAX analisi audio
(±) | potenza degli altiparlanti media ma buona (78.3 dB)
Bassi 100 - 315 Hz
(-) | quasi nessun basso - in media 16.7% inferiori alla media
(±) | la linearità dei bassi è media (10.3% delta rispetto alla precedente frequenza)
Medi 400 - 2000 Hz
(±) | medi elevati - circa 5.6% superiore alla media
(+) | medi lineari (4.2% delta rispetto alla precedente frequenza)
Alti 2 - 16 kHz
(+) | Alti bilanciati - appena 2.2% dalla media
(+) | alti lineari (6.2% delta rispetto alla precedente frequenza)
Nel complesso 100 - 16.000 Hz
(±) | la linearità complessiva del suono è media (16.8% di differenza rispetto alla media
Rispetto alla stessa classe
» 43% di tutti i dispositivi testati in questa classe è stato migliore, 11% simile, 46% peggiore
» Il migliore ha avuto un delta di 6%, medio di 18%, peggiore di 132%
Rispetto a tutti i dispositivi testati
» 29% di tutti i dispositivi testati in questa classe è stato migliore, 8% similare, 63% peggiore
» Il migliore ha avuto un delta di 4%, medio di 24%, peggiore di 134%
Acer Predator Helios Neo 16S AI PHN16S-71-94L9 analisi audio
(+) | gli altoparlanti sono relativamente potenti (86 dB)
Bassi 100 - 315 Hz
(-) | quasi nessun basso - in media 24.8% inferiori alla media
(±) | la linearità dei bassi è media (12.6% delta rispetto alla precedente frequenza)
Medi 400 - 2000 Hz
(±) | medi elevati - circa 5.9% superiore alla media
(+) | medi lineari (6.4% delta rispetto alla precedente frequenza)
Alti 2 - 16 kHz
(+) | Alti bilanciati - appena 2.8% dalla media
(+) | alti lineari (5.9% delta rispetto alla precedente frequenza)
Nel complesso 100 - 16.000 Hz
(±) | la linearità complessiva del suono è media (17.3% di differenza rispetto alla media
Rispetto alla stessa classe
» 47% di tutti i dispositivi testati in questa classe è stato migliore, 12% simile, 41% peggiore
» Il migliore ha avuto un delta di 6%, medio di 18%, peggiore di 132%
Rispetto a tutti i dispositivi testati
» 32% di tutti i dispositivi testati in questa classe è stato migliore, 8% similare, 60% peggiore
» Il migliore ha avuto un delta di 4%, medio di 24%, peggiore di 134%
Chuwi Gamebook, R9 9955HX analisi audio
(±) | potenza degli altiparlanti media ma buona (75.7 dB)
Bassi 100 - 315 Hz
(-) | quasi nessun basso - in media 18.7% inferiori alla media
(±) | la linearità dei bassi è media (10.3% delta rispetto alla precedente frequenza)
Medi 400 - 2000 Hz
(±) | medi elevati - circa 7.2% superiore alla media
(±) | linearità dei medi adeguata (9.9% delta rispetto alla precedente frequenza)
Alti 2 - 16 kHz
(+) | Alti bilanciati - appena 3.2% dalla media
(±) | la linearità degli alti è media (8.1% delta rispetto alla precedente frequenza)
Nel complesso 100 - 16.000 Hz
(±) | la linearità complessiva del suono è media (21.2% di differenza rispetto alla media
Rispetto alla stessa classe
» 76% di tutti i dispositivi testati in questa classe è stato migliore, 4% simile, 20% peggiore
» Il migliore ha avuto un delta di 6%, medio di 18%, peggiore di 132%
Rispetto a tutti i dispositivi testati
» 59% di tutti i dispositivi testati in questa classe è stato migliore, 7% similare, 34% peggiore
» Il migliore ha avuto un delta di 4%, medio di 24%, peggiore di 134%
Medion Erazer Major 16 X1 MD62736 analisi audio
(+) | gli altoparlanti sono relativamente potenti (82 dB)
Bassi 100 - 315 Hz
(-) | quasi nessun basso - in media 19.4% inferiori alla media
(±) | la linearità dei bassi è media (13.5% delta rispetto alla precedente frequenza)
Medi 400 - 2000 Hz
(±) | medi elevati - circa 8.4% superiore alla media
(±) | linearità dei medi adeguata (9.1% delta rispetto alla precedente frequenza)
Alti 2 - 16 kHz
(+) | Alti bilanciati - appena 4.2% dalla media
(+) | alti lineari (6.4% delta rispetto alla precedente frequenza)
Nel complesso 100 - 16.000 Hz
(±) | la linearità complessiva del suono è media (20.8% di differenza rispetto alla media
Rispetto alla stessa classe
» 75% di tutti i dispositivi testati in questa classe è stato migliore, 4% simile, 21% peggiore
» Il migliore ha avuto un delta di 6%, medio di 18%, peggiore di 132%
Rispetto a tutti i dispositivi testati
» 56% di tutti i dispositivi testati in questa classe è stato migliore, 8% similare, 36% peggiore
» Il migliore ha avuto un delta di 4%, medio di 24%, peggiore di 134%
Lenovo Legion 5 Pro 16IAX10H analisi audio
(±) | potenza degli altiparlanti media ma buona (78.2 dB)
Bassi 100 - 315 Hz
(-) | quasi nessun basso - in media 21.1% inferiori alla media
(±) | la linearità dei bassi è media (8% delta rispetto alla precedente frequenza)
Medi 400 - 2000 Hz
(±) | medi elevati - circa 6.3% superiore alla media
(+) | medi lineari (6.5% delta rispetto alla precedente frequenza)
Alti 2 - 16 kHz
(+) | Alti bilanciati - appena 1.6% dalla media
(+) | alti lineari (4.9% delta rispetto alla precedente frequenza)
Nel complesso 100 - 16.000 Hz
(±) | la linearità complessiva del suono è media (18.3% di differenza rispetto alla media
Rispetto alla stessa classe
» 57% di tutti i dispositivi testati in questa classe è stato migliore, 9% simile, 34% peggiore
» Il migliore ha avuto un delta di 6%, medio di 18%, peggiore di 132%
Rispetto a tutti i dispositivi testati
» 40% di tutti i dispositivi testati in questa classe è stato migliore, 8% similare, 53% peggiore
» Il migliore ha avuto un delta di 4%, medio di 24%, peggiore di 134%
MSI Vector 16 HX AI A2XWHG analisi audio
(+) | gli altoparlanti sono relativamente potenti (86 dB)
Bassi 100 - 315 Hz
(±) | bassi ridotti - in media 12.3% inferiori alla media
(±) | la linearità dei bassi è media (8.5% delta rispetto alla precedente frequenza)
Medi 400 - 2000 Hz
(±) | medi elevati - circa 9.9% superiore alla media
(+) | medi lineari (6.8% delta rispetto alla precedente frequenza)
Alti 2 - 16 kHz
(+) | Alti bilanciati - appena 1.8% dalla media
(+) | alti lineari (2.9% delta rispetto alla precedente frequenza)
Nel complesso 100 - 16.000 Hz
(±) | la linearità complessiva del suono è media (15.8% di differenza rispetto alla media
Rispetto alla stessa classe
» 36% di tutti i dispositivi testati in questa classe è stato migliore, 7% simile, 57% peggiore
» Il migliore ha avuto un delta di 6%, medio di 18%, peggiore di 132%
Rispetto a tutti i dispositivi testati
» 24% di tutti i dispositivi testati in questa classe è stato migliore, 5% similare, 71% peggiore
» Il migliore ha avuto un delta di 4%, medio di 24%, peggiore di 134%
Schenker XMG Pro 16 (E25) analisi audio
(±) | potenza degli altiparlanti media ma buona (79.2 dB)
Bassi 100 - 315 Hz
(±) | bassi ridotti - in media 14.2% inferiori alla media
(±) | la linearità dei bassi è media (10.6% delta rispetto alla precedente frequenza)
Medi 400 - 2000 Hz
(±) | medi elevati - circa 8.2% superiore alla media
(±) | linearità dei medi adeguata (9.9% delta rispetto alla precedente frequenza)
Alti 2 - 16 kHz
(+) | Alti bilanciati - appena 3.8% dalla media
(+) | alti lineari (5.9% delta rispetto alla precedente frequenza)
Nel complesso 100 - 16.000 Hz
(±) | la linearità complessiva del suono è media (18.5% di differenza rispetto alla media
Rispetto alla stessa classe
» 60% di tutti i dispositivi testati in questa classe è stato migliore, 8% simile, 32% peggiore
» Il migliore ha avuto un delta di 6%, medio di 18%, peggiore di 132%
Rispetto a tutti i dispositivi testati
» 41% di tutti i dispositivi testati in questa classe è stato migliore, 8% similare, 51% peggiore
» Il migliore ha avuto un delta di 4%, medio di 24%, peggiore di 134%
Consumo di energia
Il luminoso pannello Mini-LED è particolarmente evidente in termini di consumo energetico al minimo. All'inizio dello stress test, abbiamo misurato brevemente fino a 320 watt, prima che il consumo si stabilizzasse a 242 watt. L'alimentatore da 280 watt è quindi adeguatamente dimensionato. Tuttavia, il consumo in standby di oltre 3 watt è troppo elevato.
| Off / Standby | |
| Idle | |
| Sotto carico |
|
Leggenda:
min: | |
| Schenker XMG APEX 16 MAX R9 9955HX, GeForce RTX 5070 Ti Laptop, Samsung 9100 Pro 2 TB, Mini-LED, 2560x1600, 16" | Acer Predator Helios Neo 16S AI PHN16S-71-94L9 Ultra 9 275HX, GeForce RTX 5070 Ti Laptop, Micron 3500 1TB MTFDKBA1T0TGD, OLED, 2560x1600, 16" | Chuwi Gamebook, R9 9955HX R9 9955HX, GeForce RTX 5070 Ti Laptop, YMTC PC41Q-1TB-B, IPS, 2560x1600, 16" | Medion Erazer Major 16 X1 MD62736 Ultra 7 255HX, GeForce RTX 5070 Ti Laptop, Phison E31 2 TB, IPS, 2560x1600, 16" | Lenovo Legion 5 Pro 16IAX10H Ultra 9 275HX, GeForce RTX 5070 Ti Laptop, Western Digital PC SN8000S SDEPNRK-1T00, OLED, 2560x1600, 16" | MSI Vector 16 HX AI A2XWHG Ultra 7 255HX, GeForce RTX 5070 Ti Laptop, Micron 2400 MTFDKBA512QFM, IPS, 2560x1600, 16" | Schenker XMG Pro 16 (E25) Ultra 9 275HX, GeForce RTX 5070 Ti Laptop, Samsung 9100 Pro 1 TB, IPS, 2560x1600, 16" | Media NVIDIA GeForce RTX 5070 Ti Laptop | Media della classe Gaming | |
|---|---|---|---|---|---|---|---|---|---|
| Power Consumption | 41% | 6% | 8% | 7% | 16% | 16% | 12% | 21% | |
| Idle Minimum * (Watt) | 15.4 | 3.9 75% | 16.4 -6% | 17.8 -16% | 14 9% | 7.1 54% | 11.7 24% | 14.1 ? 8% | 13.5 ? 12% |
| Idle Average * (Watt) | 29.9 | 11 63% | 21.2 29% | 20.7 31% | 14.3 52% | 15.9 47% | 16.6 44% | 22.8 ? 24% | 19.3 ? 35% |
| Idle Maximum * (Watt) | 30.1 | 16.9 44% | 28.3 6% | 23.4 22% | 20.1 33% | 29.5 2% | 17.1 43% | 26.4 ? 12% | 24.7 ? 18% |
| Load Average * (Watt) | 136.4 | 123 10% | 145.6 -7% | 110 19% | 177 -30% | 124 9% | 122.4 10% | 129.9 ? 5% | 108.6 ? 20% |
| Cyberpunk 2077 ultra * (Watt) | 231 | 152.7 34% | 221 4% | 233 -1% | 255 -10% | 222 4% | 245 -6% | ||
| Cyberpunk 2077 ultra external monitor * (Watt) | 226 | 144.9 36% | 218 4% | 232 -3% | 255 -13% | 217 4% | 241 -7% | ||
| Load Maximum * (Watt) | 315 | 229 27% | 284 10% | 297 6% | 294 7% | 336 -7% | 291.5 7% | 283 ? 10% | 254 ? 19% |
* ... Meglio usare valori piccoli
consumo energetico Cyberpunk / Stress test
consumo energetico con monitor esterno
Durata della batteria
Nonostante l'ampia batteria da 99 Wh, l'elevato consumo energetico si traduce in una breve autonomia della batteria. Nel test Wi-Fi a 150 cd/m², abbiamo misurato poco meno di 5 ore, scendendo a poco meno di 3 ore a piena luminosità.
| Schenker XMG APEX 16 MAX R9 9955HX, GeForce RTX 5070 Ti Laptop, 99.8 Wh | Acer Predator Helios Neo 16S AI PHN16S-71-94L9 Ultra 9 275HX, GeForce RTX 5070 Ti Laptop, 76 Wh | Chuwi Gamebook, R9 9955HX R9 9955HX, GeForce RTX 5070 Ti Laptop, 77 Wh | Medion Erazer Major 16 X1 MD62736 Ultra 7 255HX, GeForce RTX 5070 Ti Laptop, 80 Wh | Lenovo Legion 5 Pro 16IAX10H Ultra 9 275HX, GeForce RTX 5070 Ti Laptop, 80 Wh | MSI Vector 16 HX AI A2XWHG Ultra 7 255HX, GeForce RTX 5070 Ti Laptop, 90 Wh | Schenker XMG Pro 16 (E25) Ultra 9 275HX, GeForce RTX 5070 Ti Laptop, 99.8 Wh | Media della classe Gaming | |
|---|---|---|---|---|---|---|---|---|
| Battery Runtime | 2% | 0% | 29% | -4% | 43% | 100% | 59% | |
| WiFi Websurfing (h) | 4.9 | 5 2% | 4.9 0% | 6.3 29% | 4.9 0% | 7 43% | 9.1 86% | 6.8 ? 39% |
| WiFi Websurfing max. Brightness (h) | 2.9 | 2.7 -7% | 6.2 114% | 5.16 ? 78% |
Valutazione complessiva di Notebookcheck
Schenker XMG APEX 16 MAX
- 01/16/2026 v8
Andreas Osthoff
 Total Sustainability Score:
 Possibili alternative a confronto
Immagine | Modello | Prezzo | Peso | Altezza | Schermo |
|---|---|---|---|---|---|
1. 87.8%  | Schenker XMG APEX 16 MAX AMD Ryzen 9 9955HX ⎘ NVIDIA GeForce RTX 5070 Ti Laptop ⎘ 64 GB Memoria, 2048 GB SSD | Amazon: Prezzo di listino: 2815€ | 2.7 kg | 26 mm | 16.00" 2560x1600 189 PPI Mini-LED |
2. 82%  | Acer Predator Helios Neo 16S AI PHN16S-71-94L9 Intel Core Ultra 9 275HX ⎘ NVIDIA GeForce RTX 5070 Ti Laptop ⎘ 32 GB Memoria, 1024 GB SSD | Amazon: Prezzo di listino: 2400 EUR | 2.2 kg | 19.9 mm | 16.00" 2560x1600 189 PPI OLED |
3. 84.9%  | Chuwi Gamebook, R9 9955HX AMD Ryzen 9 9955HX ⎘ NVIDIA GeForce RTX 5070 Ti Laptop ⎘ 32 GB Memoria, 1024 GB SSD | Amazon: 1. $379.89 CHUWI MiniBook X 2-in-1 Lapt... 2. $378.99 CHUWI 2-in-1 Touchscreen Lap... 3. $278.99 CHUWI 2 in 1 Laptop 10.1", I... Prezzo di listino: 2300 EUR | 2.5 kg | 21.4 mm | 16.00" 2560x1600 189 PPI IPS |
4. 85.2%  | Medion Erazer Major 16 X1 MD62736 Intel Core Ultra 7 255HX ⎘ NVIDIA GeForce RTX 5070 Ti Laptop ⎘ 32 GB Memoria, SSD | Amazon: Prezzo di listino: 2600 EUR | 2.5 kg | 22.7 mm | 16.00" 2560x1600 189 PPI IPS |
5. 84.5%  | Lenovo Legion 5 Pro 16IAX10H Intel Core Ultra 9 275HX ⎘ NVIDIA GeForce RTX 5070 Ti Laptop ⎘ 32 GB Memoria, 1024 GB SSD | Amazon: 1. $1,549.00 Lenovo Legion 5 Pro Gaming A... 2. $99.99 Lenovo Slim 245W AC Adapter ... 3. $1,699.99 Lenovo Legion 5 Pro 5i Gen 1... Prezzo di listino: 2500 Euro | 2.4 kg | 25.95 mm | 16.00" 2560x1600 189 PPI OLED |
6. 84%  | MSI Vector 16 HX AI A2XWHG Intel Core Ultra 7 255HX ⎘ NVIDIA GeForce RTX 5070 Ti Laptop ⎘ 16 GB Memoria, 512 GB SSD | Amazon: Prezzo di listino: 2000 EUR | 2.6 kg | 28.6 mm | 16.00" 2560x1600 189 PPI IPS |
7. 87.4%  | Schenker XMG Pro 16 (E25) Intel Core Ultra 9 275HX ⎘ NVIDIA GeForce RTX 5070 Ti Laptop ⎘ 32 GB Memoria, 1024 GB SSD | Prezzo di listino: 2480€ | 2.5 kg | 26.5 mm | 16.00" 2560x1600 189 PPI IPS |
Transparency
La selezione dei dispositivi da recensire viene effettuata dalla nostra redazione. Il campione di prova è stato fornito all'autore come prestito dal produttore o dal rivenditore ai fini di questa recensione. L'istituto di credito non ha avuto alcuna influenza su questa recensione, né il produttore ne ha ricevuto una copia prima della pubblicazione. Non vi era alcun obbligo di pubblicare questa recensione. In quanto società mediatica indipendente, Notebookcheck non è soggetta all'autorità di produttori, rivenditori o editori.
Ecco come Notebookcheck esegue i test
Ogni anno, Notebookcheck esamina in modo indipendente centinaia di laptop e smartphone utilizzando procedure standardizzate per garantire che tutti i risultati siano comparabili. Da circa 20 anni sviluppiamo continuamente i nostri metodi di prova e nel frattempo stabiliamo gli standard di settore. Nei nostri laboratori di prova, tecnici ed editori esperti utilizzano apparecchiature di misurazione di alta qualità. Questi test comportano un processo di validazione in più fasi. Il nostro complesso sistema di valutazione si basa su centinaia di misurazioni e parametri di riferimento ben fondati, che mantengono l'obiettività.