

Verdetto - Veloce, ma potrebbe essere più veloce
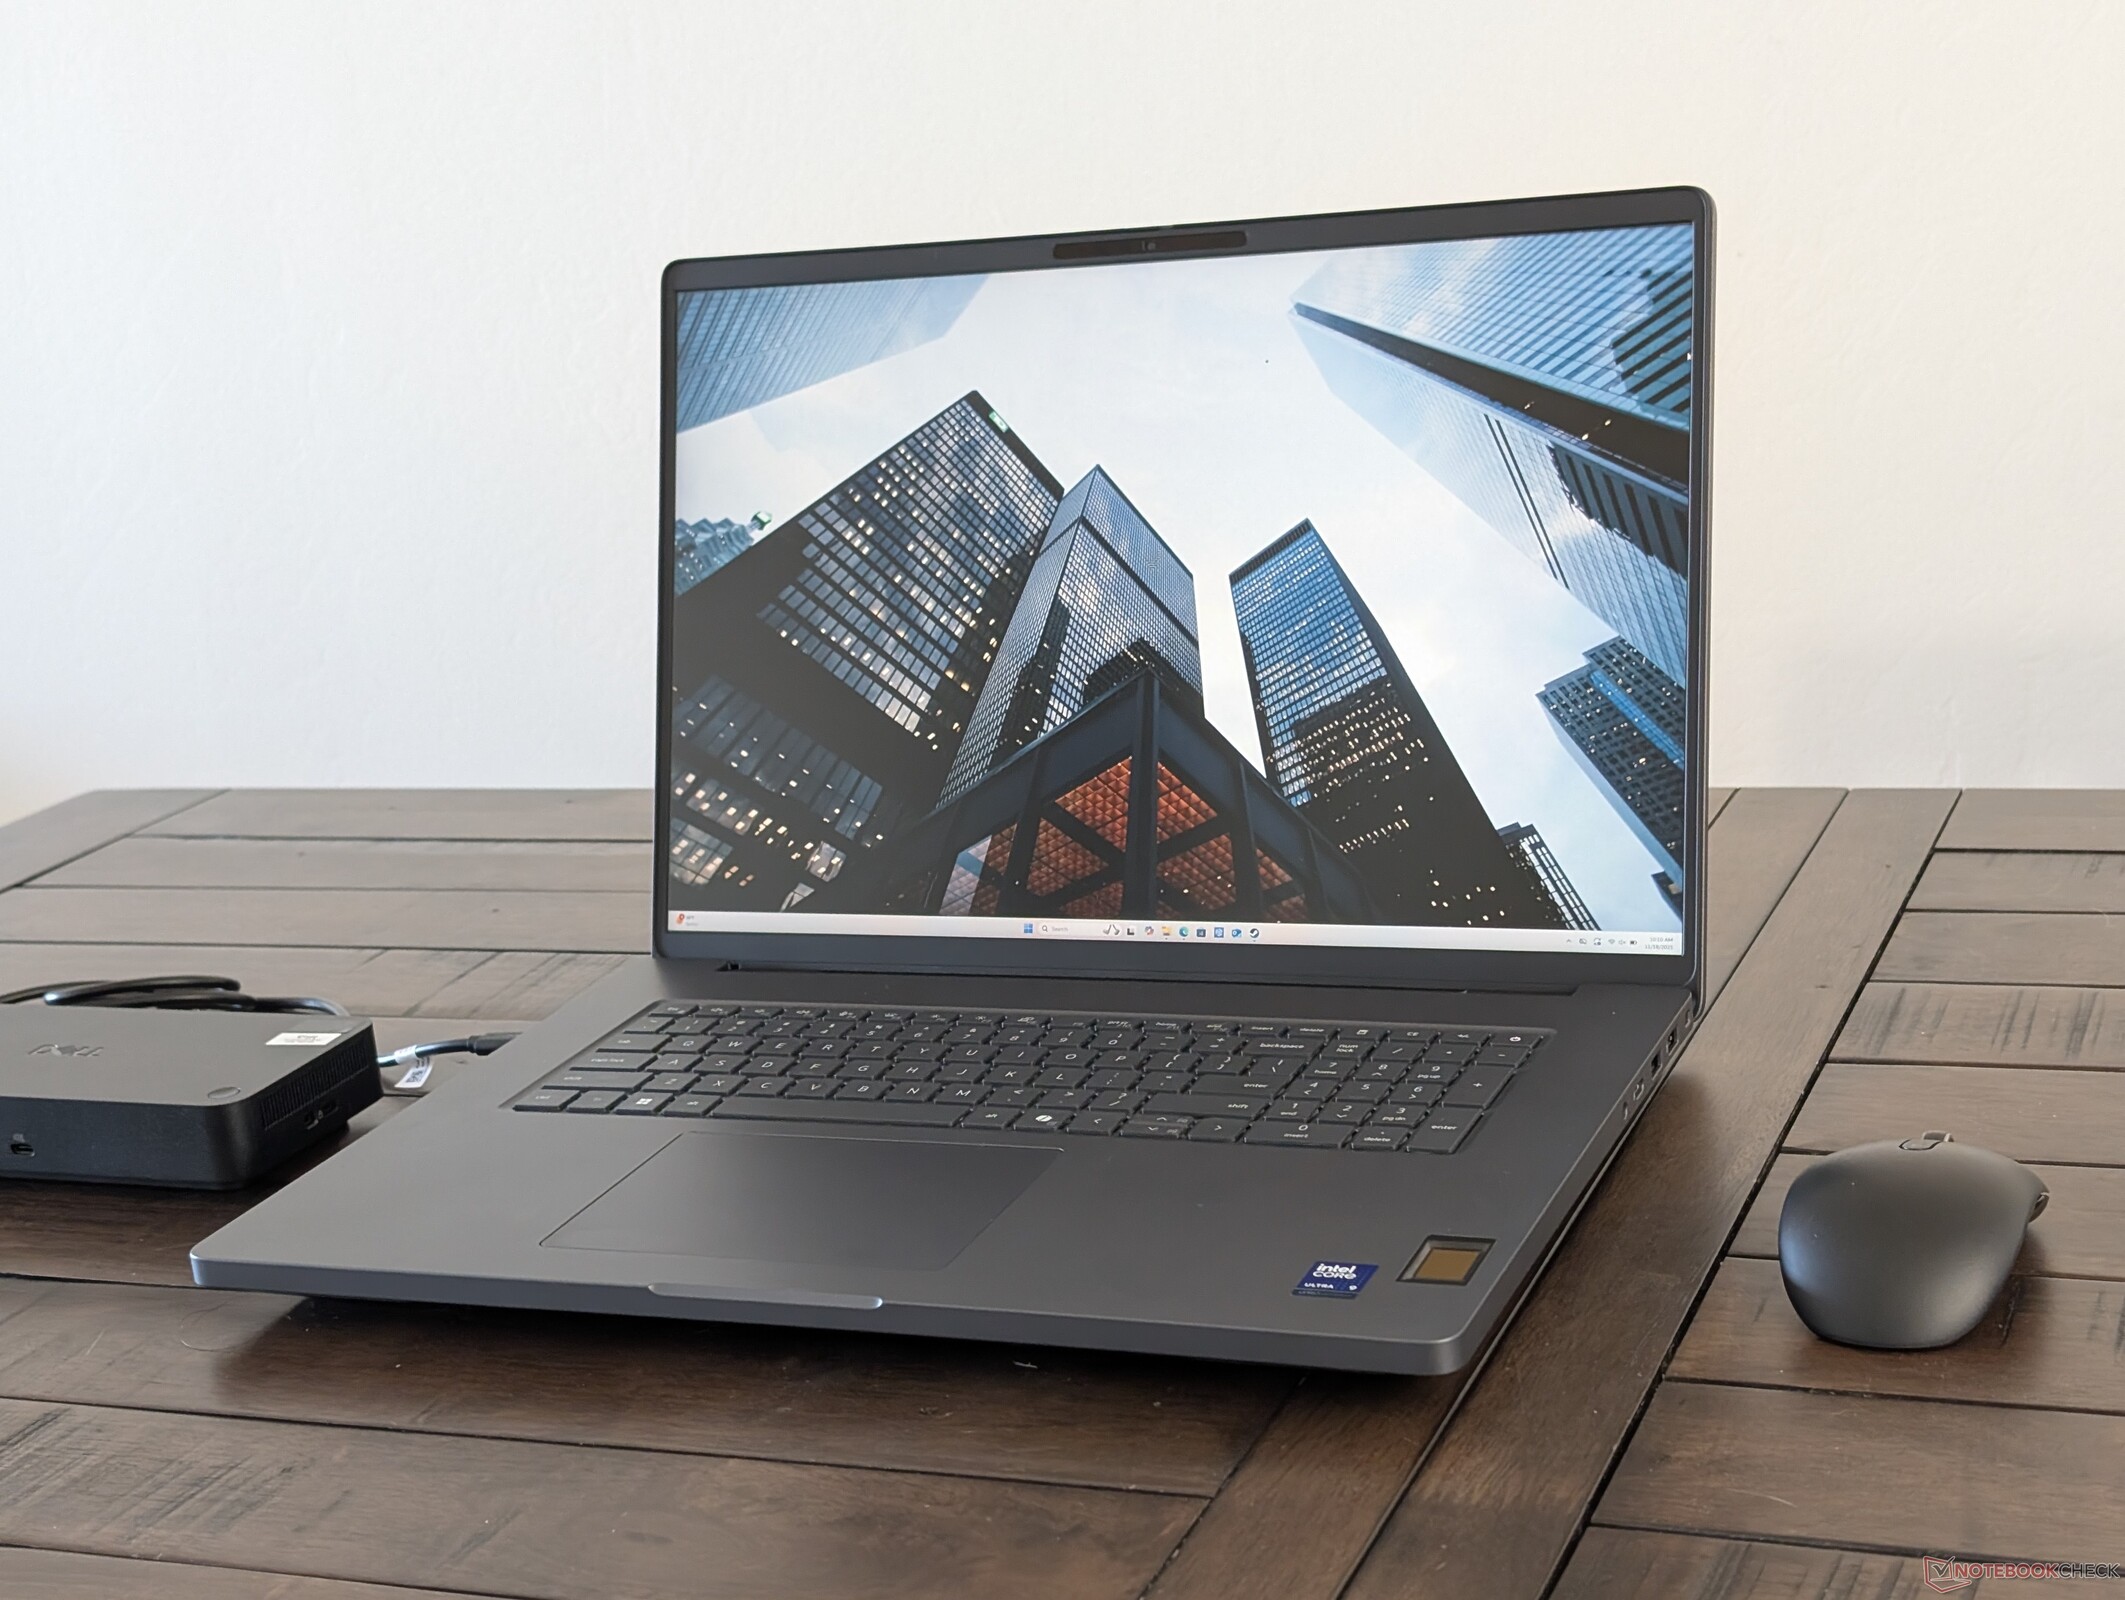
Dell Pro Max 18 Plus è un hardware impressionante e ben costruito, che riflette il suo prezzo di partenza a quattro cifre. I suoi componenti unici come CAMM2, DGFF e le porte USB-C modulari per una maggiore riparabilità contribuiscono a distinguere il modello dalla concorrenza. Non si tratta di un laptop da gioco trasformato in workstation, ma di un laptop ottimizzato da zero specificamente per i carichi di lavoro professionali. Dal punto di vista delle prestazioni, Dell è facilmente una delle workstation mobili più veloci grazie alla CPU Arrow Lake-HX, alla GPU Nvidia Pro RTX 5000 Blackwell da 175 W e all'ampia RAM da 128 a 256 GB che le applicazioni AI possono utilizzare. L'intero sistema è alimentato da un adattatore universale 280 USB-C, un'altra caratteristica degna di nota che non abbiamo ancora visto nei principali concorrenti.
Per quanto la qualità costruttiva e l'hardware siano sorprendenti, le prestazioni potrebbero essere leggermente migliori. La CPU si riscalda troppo, a circa 100 C, quando è sotto sforzo, il che influisce sulle prestazioni Turbo Boost. Caratteristiche come la soluzione di raffreddamento, la tastiera e le opzioni delle porte rimangono essenzialmente le stesse del modello più piccolo Dell Pro Max 16 Plus nonostante le differenze di dimensioni. La mancanza di opzioni di visualizzazione, in particolare, potrebbe deludere gli utenti, soprattutto perché il modello da 16 pollici è dotato di almeno tre pannelli tra cui scegliere, tra cui l'OLED 4K.
Altri svantaggi includono la mancanza di illuminazione RGB per tasto o di pulsanti del mouse dedicati, entrambi disponibili su HP ZBook Fury G1i 18, ma si tratta di difetti relativamente minori su una workstation DTR altrimenti solida.
Pro
Contro
Prezzo e disponibilità
Il Dell Pro Max 18 Plus viene ora spedito direttamente dal produttore a partire da 3790 dollari per la configurazione base fino a oltre 6000 dollari.
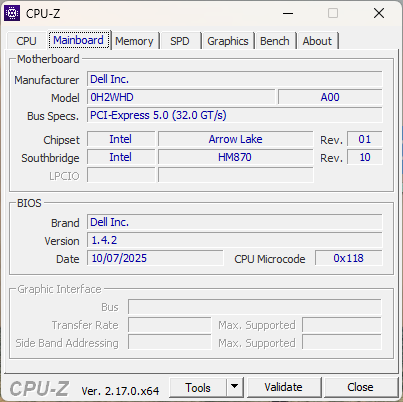
Dell Pro Max 18 Plus succede alla serie di workstation mobili di vecchia generazione Precision. Pur essendo uno dei modelli più veloci e più grandi della linea Dell, è costruito sulla stessa piattaforma del modello più piccolo da 16 pollici Dell Pro Max 16 Plus e quindi i due modelli condividono molte caratteristiche fisiche. La maggior parte dei nostri commenti sul Dell Pro Max 16 Plus valgono anche per il modello da 18 pollici.
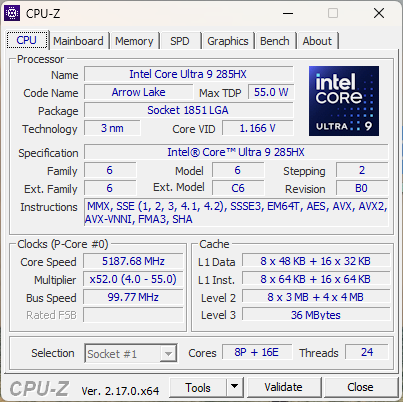
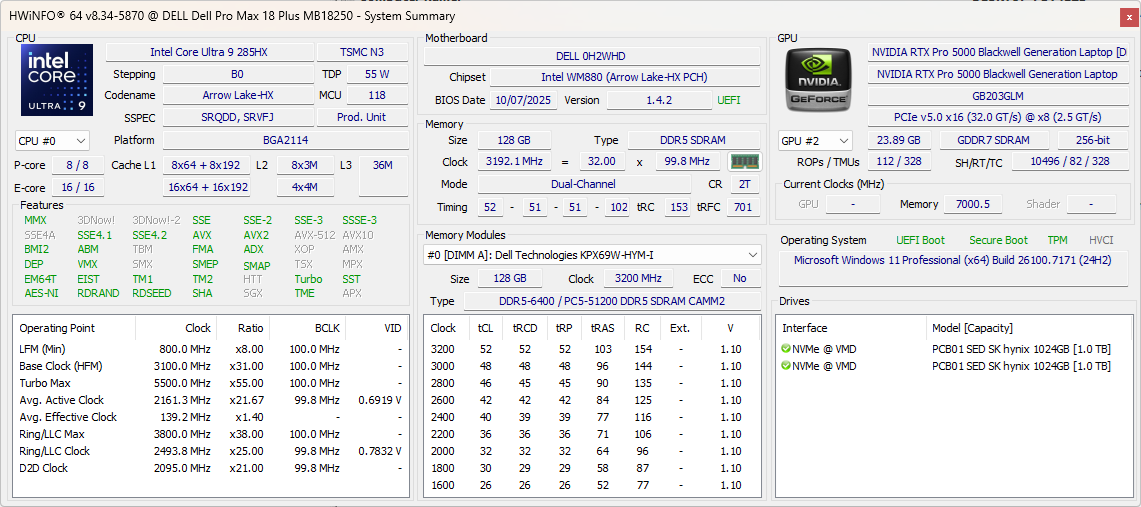
La nostra unità di prova è una configurazione di fascia alta con CPU Arrow Lake-HX Core Ultra 9 285HX vPro, GPU Nvidia RTX Pro 5000 Blackwell da 175 W e due SSD PCIe5 in RAID 0, per un prezzo ben superiore a 6000 dollari. Per il resto, tutte le opzioni vengono fornite con lo stesso display QHD+ 1600p non-touch.
Le alternative sono poche, poiché le workstation DTR da 18 pollici sono poco diffuse. L'HP ZBook Fury G1i 18 è uno dei principali concorrenti.
Altre recensioni di Dell:
Specifiche
Custodia - Approvato MIL-STD
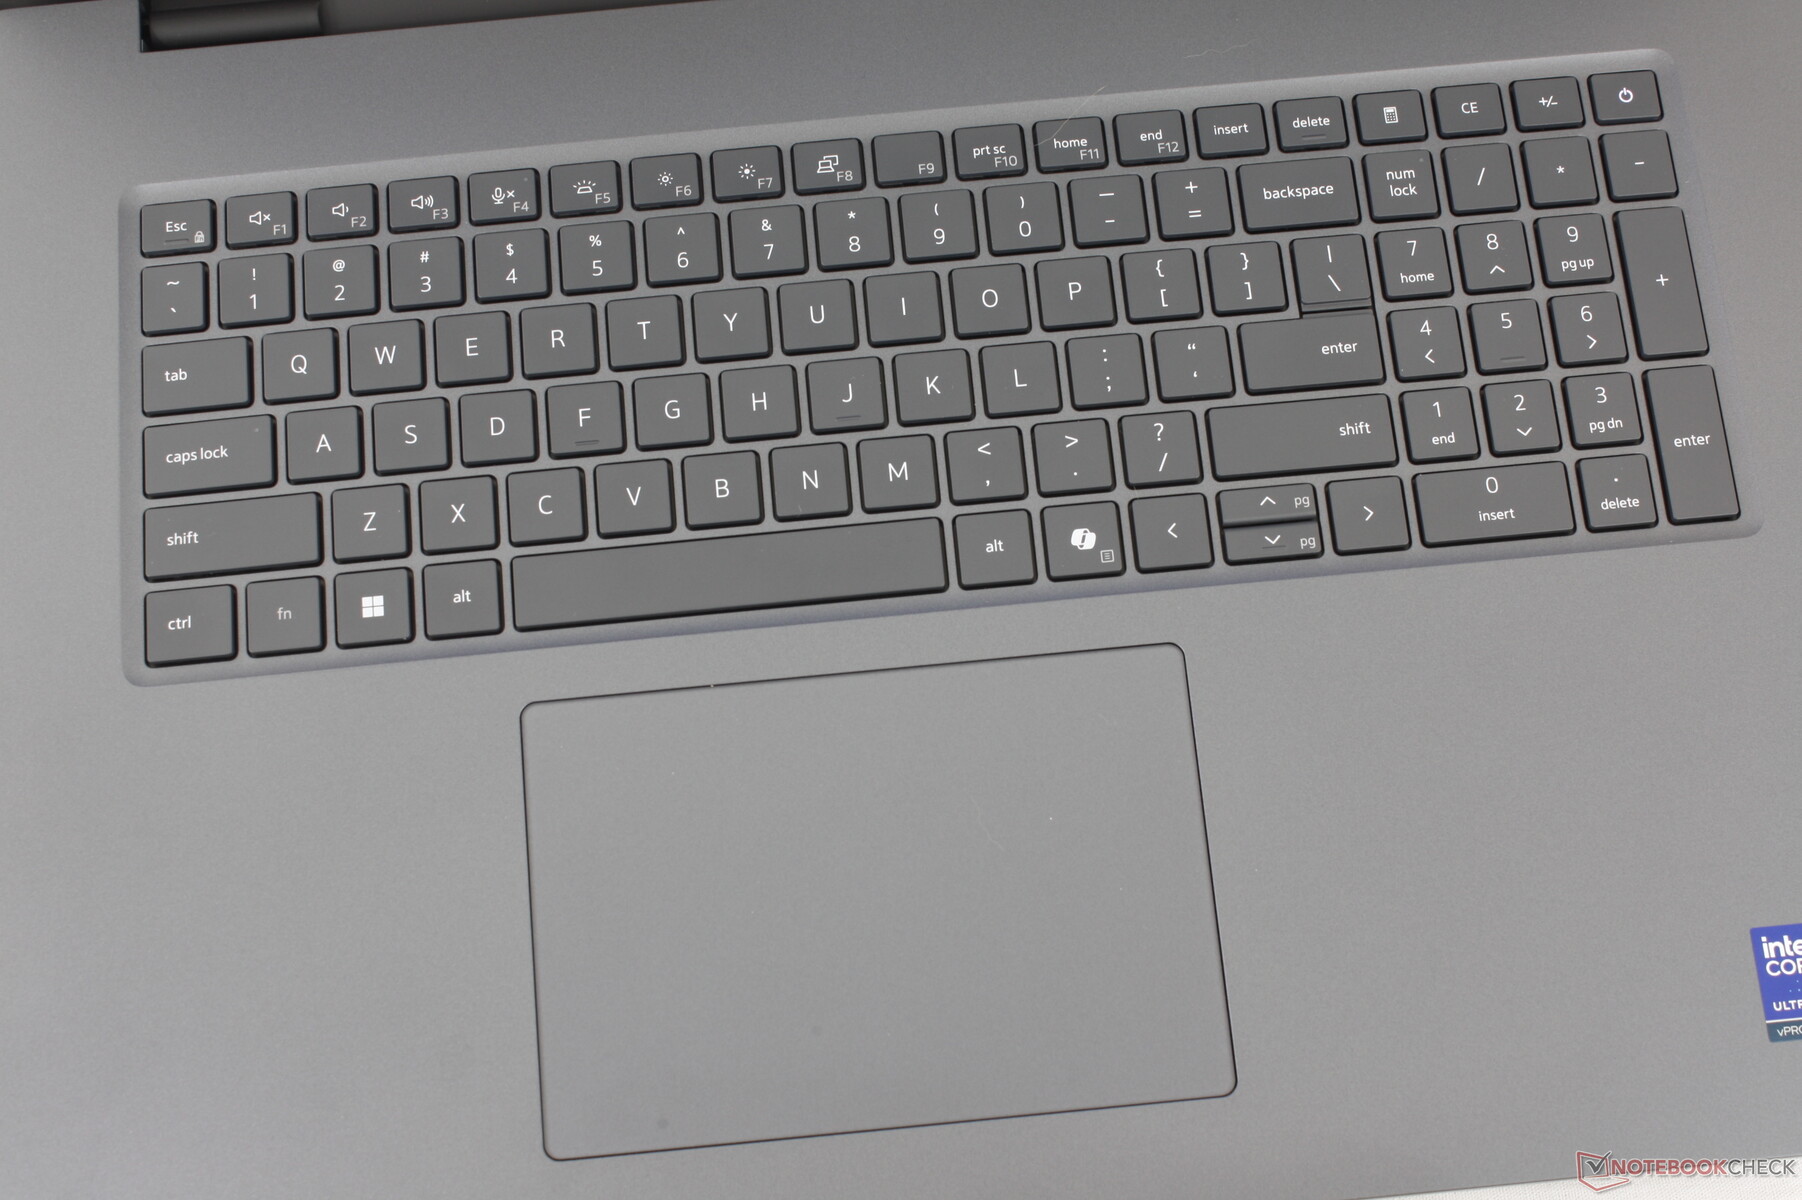
Il telaio è essenzialmente una versione ingrandita del Dell Pro Max 16 Plus da 16 pollici, con un aumento di peso di quasi il 30%. La maggior parte delle caratteristiche fisiche, come la tastiera, il clickpad e persino le porte, rimangono identiche, con solo piccole differenze nella scheda madre.

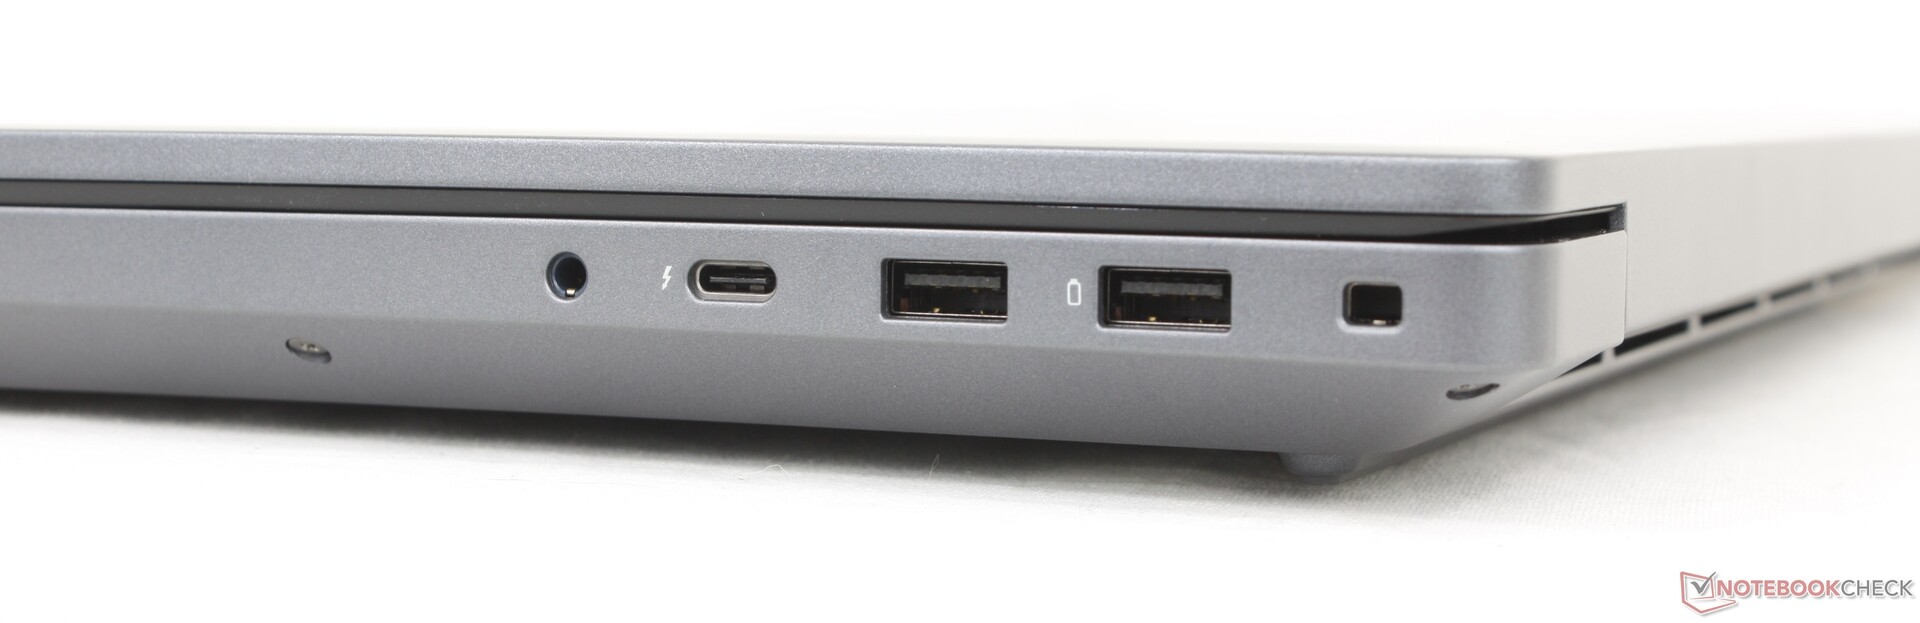
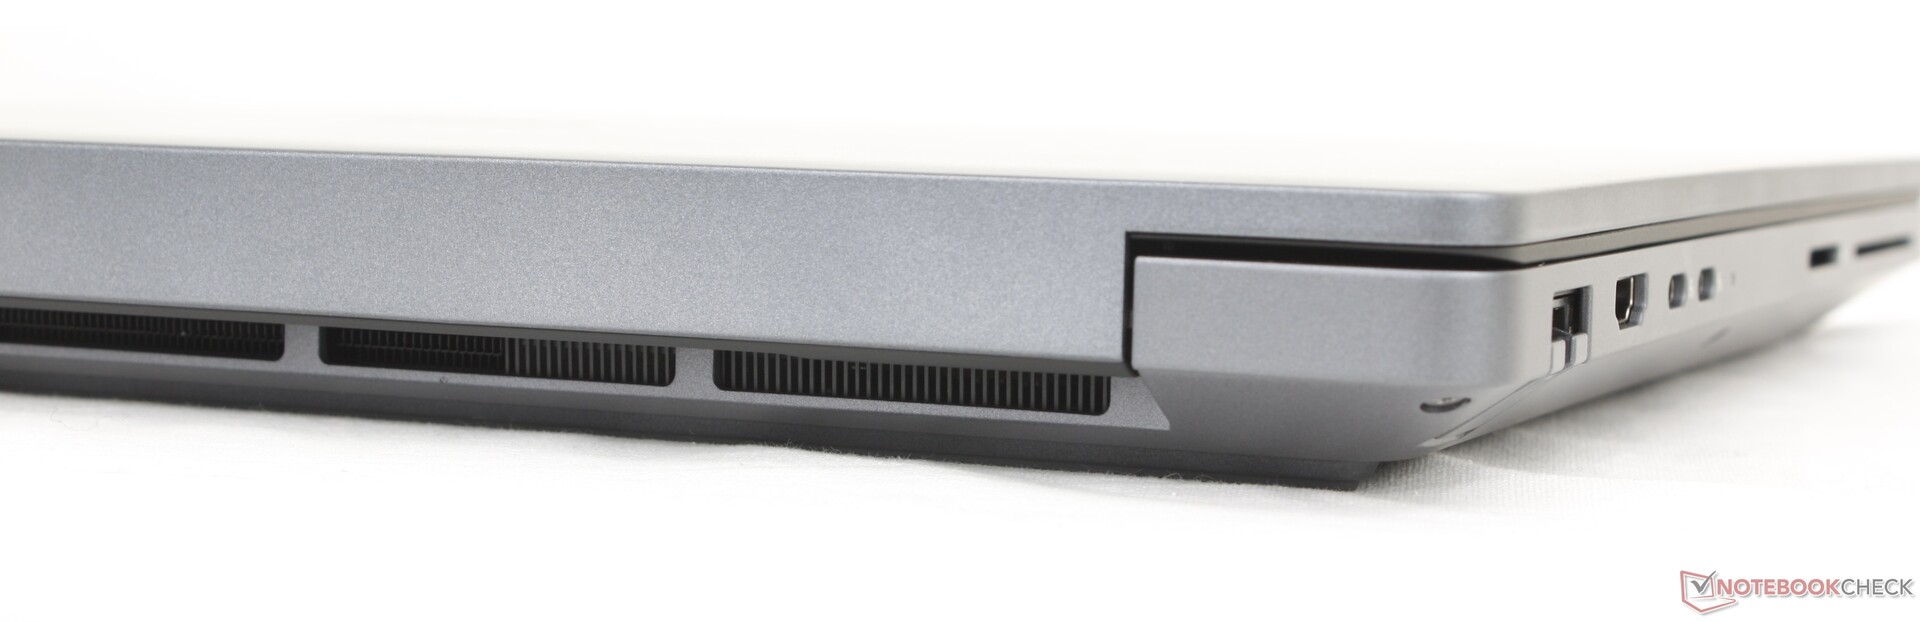
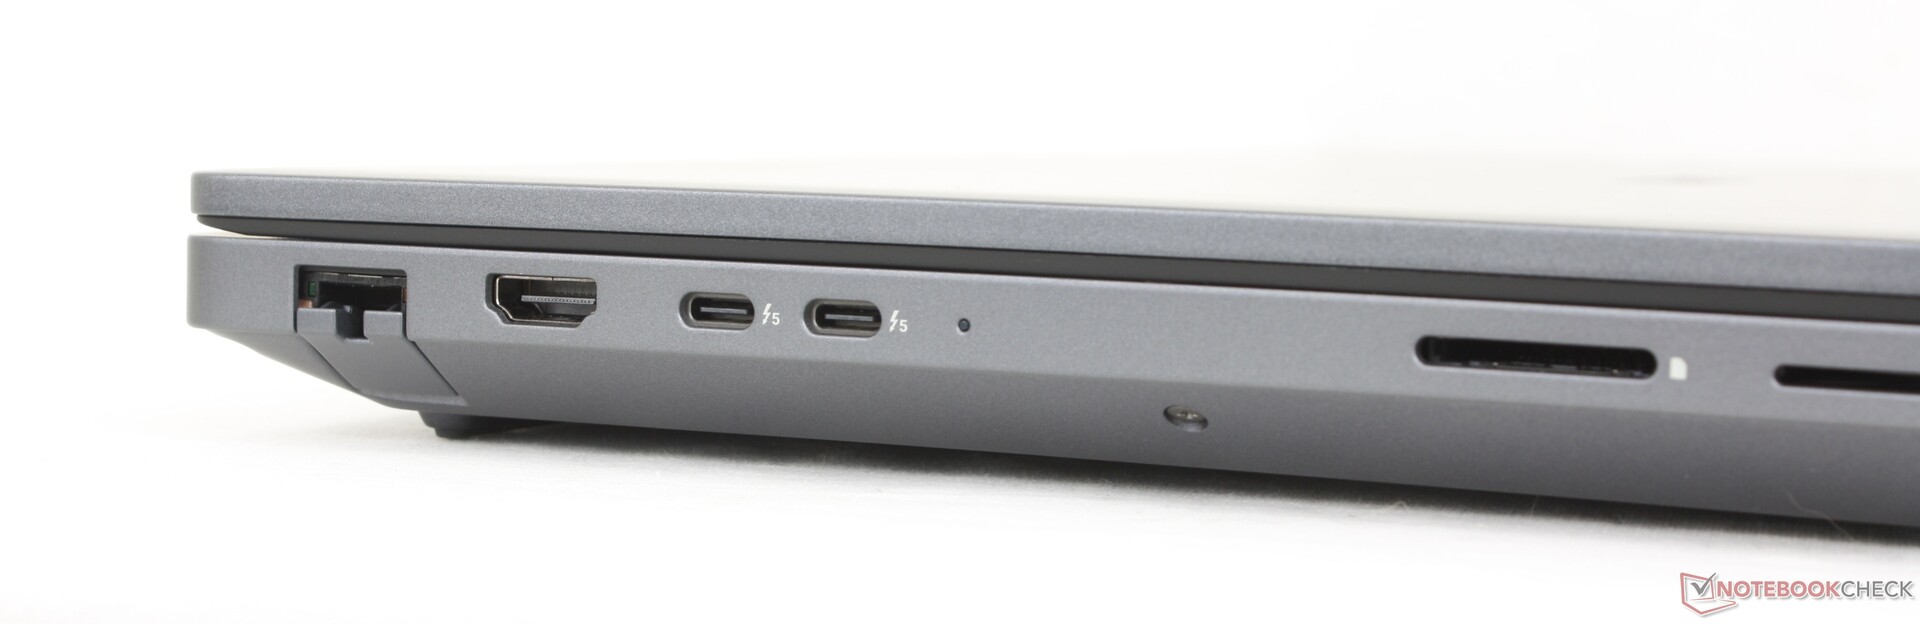
Connettività
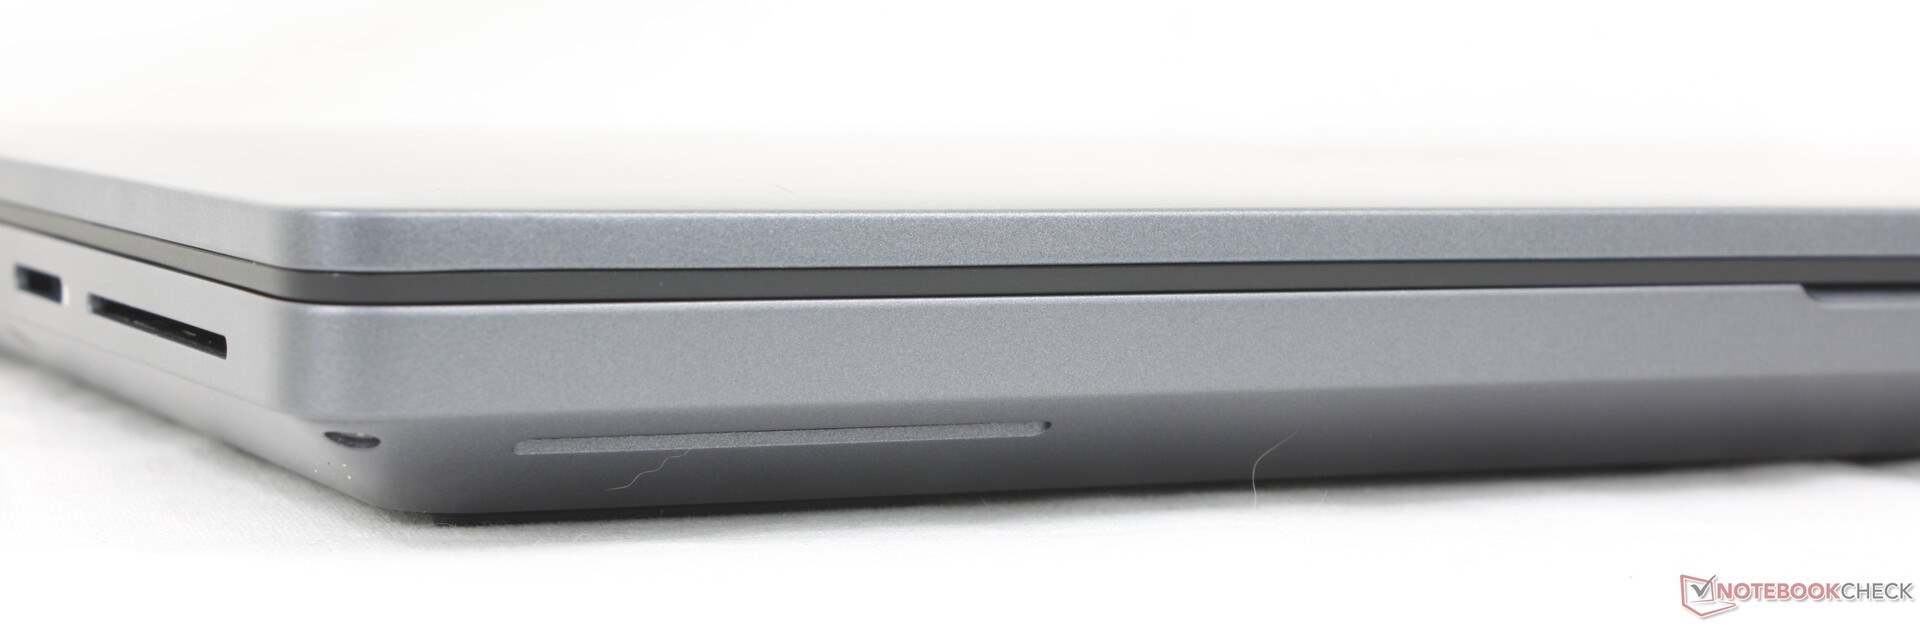
Lettore di schede SD
| SD Card Reader | |
| average JPG Copy Test (av. of 3 runs) | |
| HP ZBook X G1i 16 (Toshiba Exceria Pro SDXC 64 GB UHS-II) | |
| Dell Pro Max 18 Plus MB18250 (Toshiba Exceria Pro SDXC 64 GB UHS-II) | |
| Schenker Key 18 Pro M25 RTX 5090 (Angelbird AV Pro V60) | |
| Dell Pro Max 16 Plus (Toshiba Exceria Pro SDXC 64 GB UHS-II) | |
| maximum AS SSD Seq Read Test (1GB) | |
| HP ZBook X G1i 16 (Toshiba Exceria Pro SDXC 64 GB UHS-II) | |
| Dell Pro Max 18 Plus MB18250 (Toshiba Exceria Pro SDXC 64 GB UHS-II) | |
| Dell Pro Max 16 Plus (Toshiba Exceria Pro SDXC 64 GB UHS-II) | |
| Schenker Key 18 Pro M25 RTX 5090 (Angelbird AV Pro V60) | |
Comunicazione
| Networking | |
| iperf3 transmit AXE11000 | |
| Schenker Key 18 Pro M25 RTX 5090 | |
| Lenovo ThinkPad P16s Gen 4 AMD | |
| Dell Pro Max 18 Plus MB18250 | |
| Dell Pro Max 16 Plus | |
| HP ZBook Studio 16 G11 | |
| HP ZBook X G1i 16 | |
| iperf3 receive AXE11000 | |
| Lenovo ThinkPad P16s Gen 4 AMD | |
| Schenker Key 18 Pro M25 RTX 5090 | |
| Dell Pro Max 16 Plus | |
| Dell Pro Max 18 Plus MB18250 | |
| HP ZBook Studio 16 G11 | |
| HP ZBook X G1i 16 | |
| iperf3 transmit AXE11000 6GHz | |
| Lenovo ThinkPad P16s Gen 4 AMD | |
| HP ZBook Studio 16 G11 | |
| HP ZBook X G1i 16 | |
| Dell Pro Max 16 Plus | |
| Dell Pro Max 18 Plus MB18250 | |
| iperf3 receive AXE11000 6GHz | |
| Lenovo ThinkPad P16s Gen 4 AMD | |
| HP ZBook Studio 16 G11 | |
| HP ZBook X G1i 16 | |
| Dell Pro Max 18 Plus MB18250 | |
| Dell Pro Max 16 Plus | |
Webcam
La webcam IR da 8 MP è un upgrade opzionale rispetto alla webcam base da 2 MP.


Manutenzione
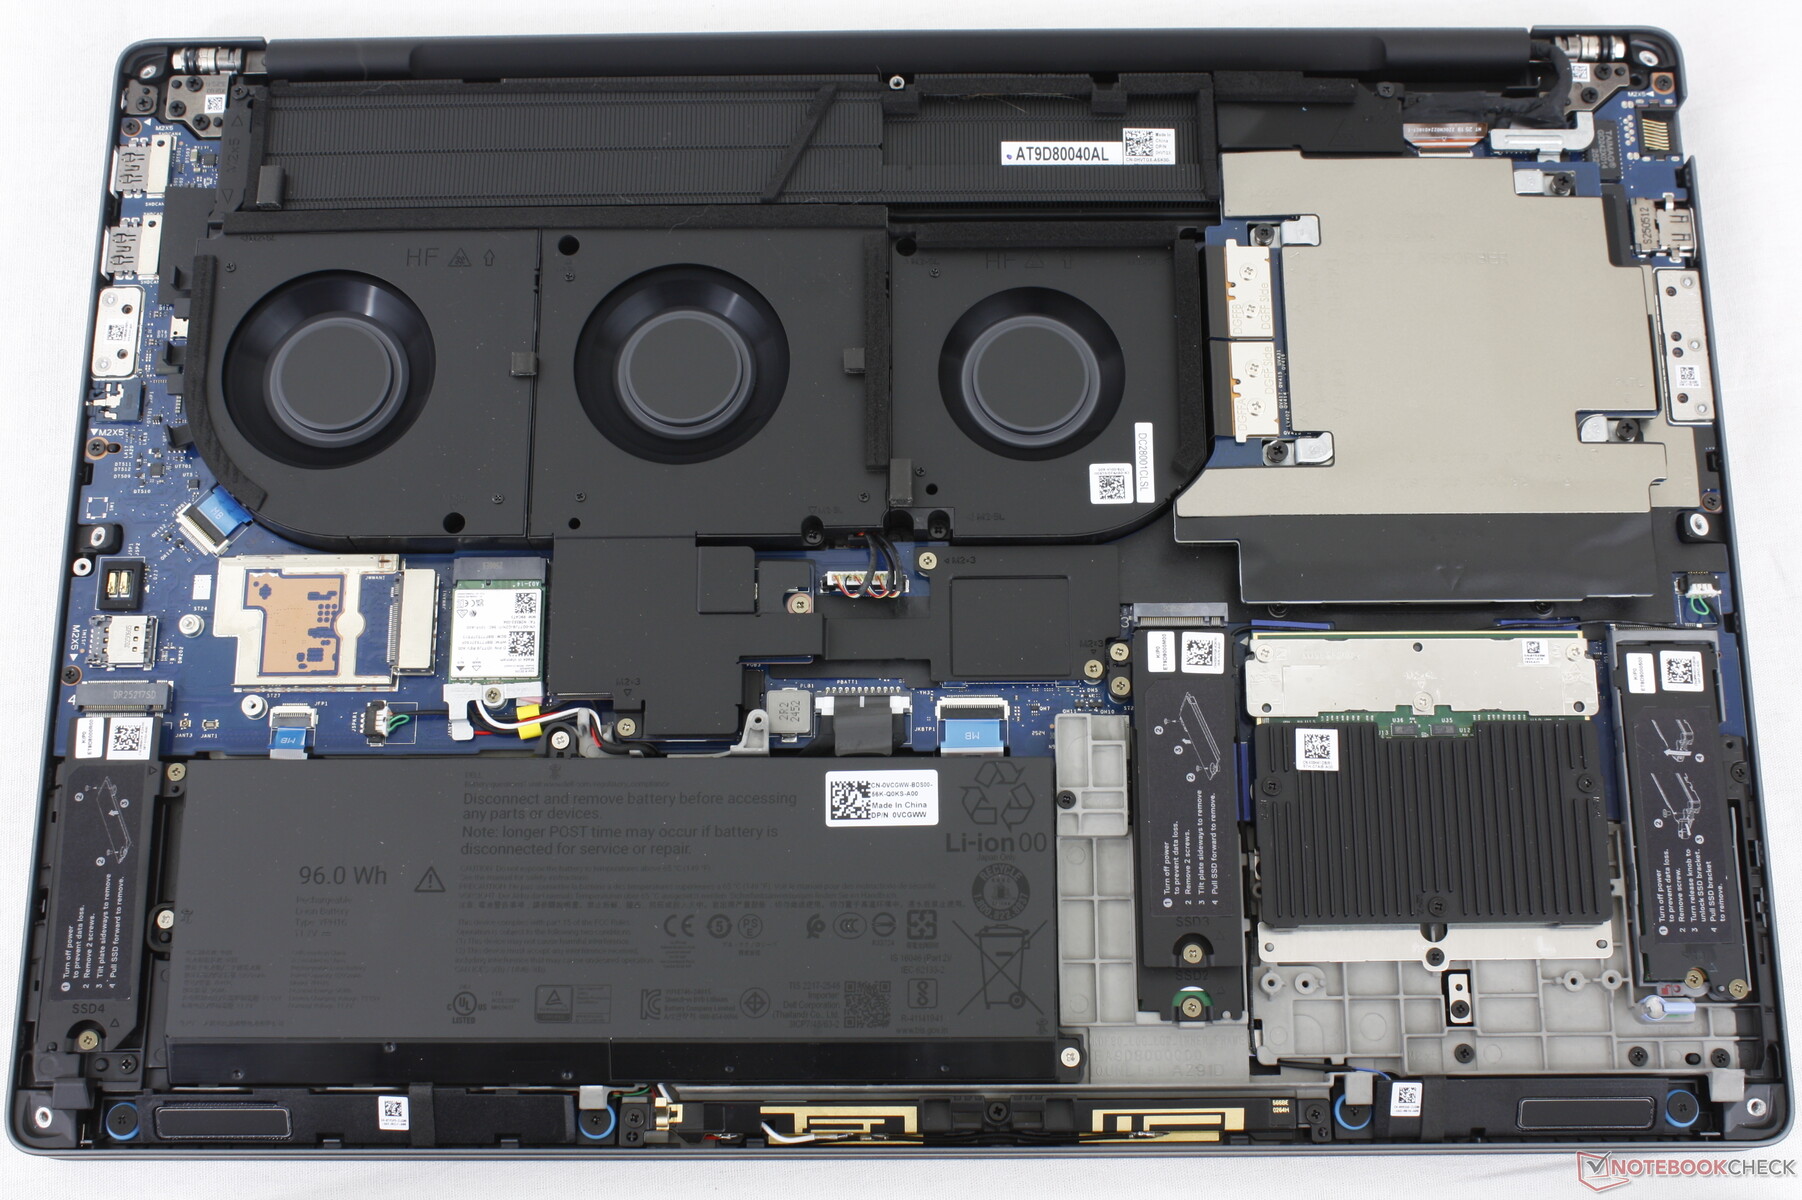
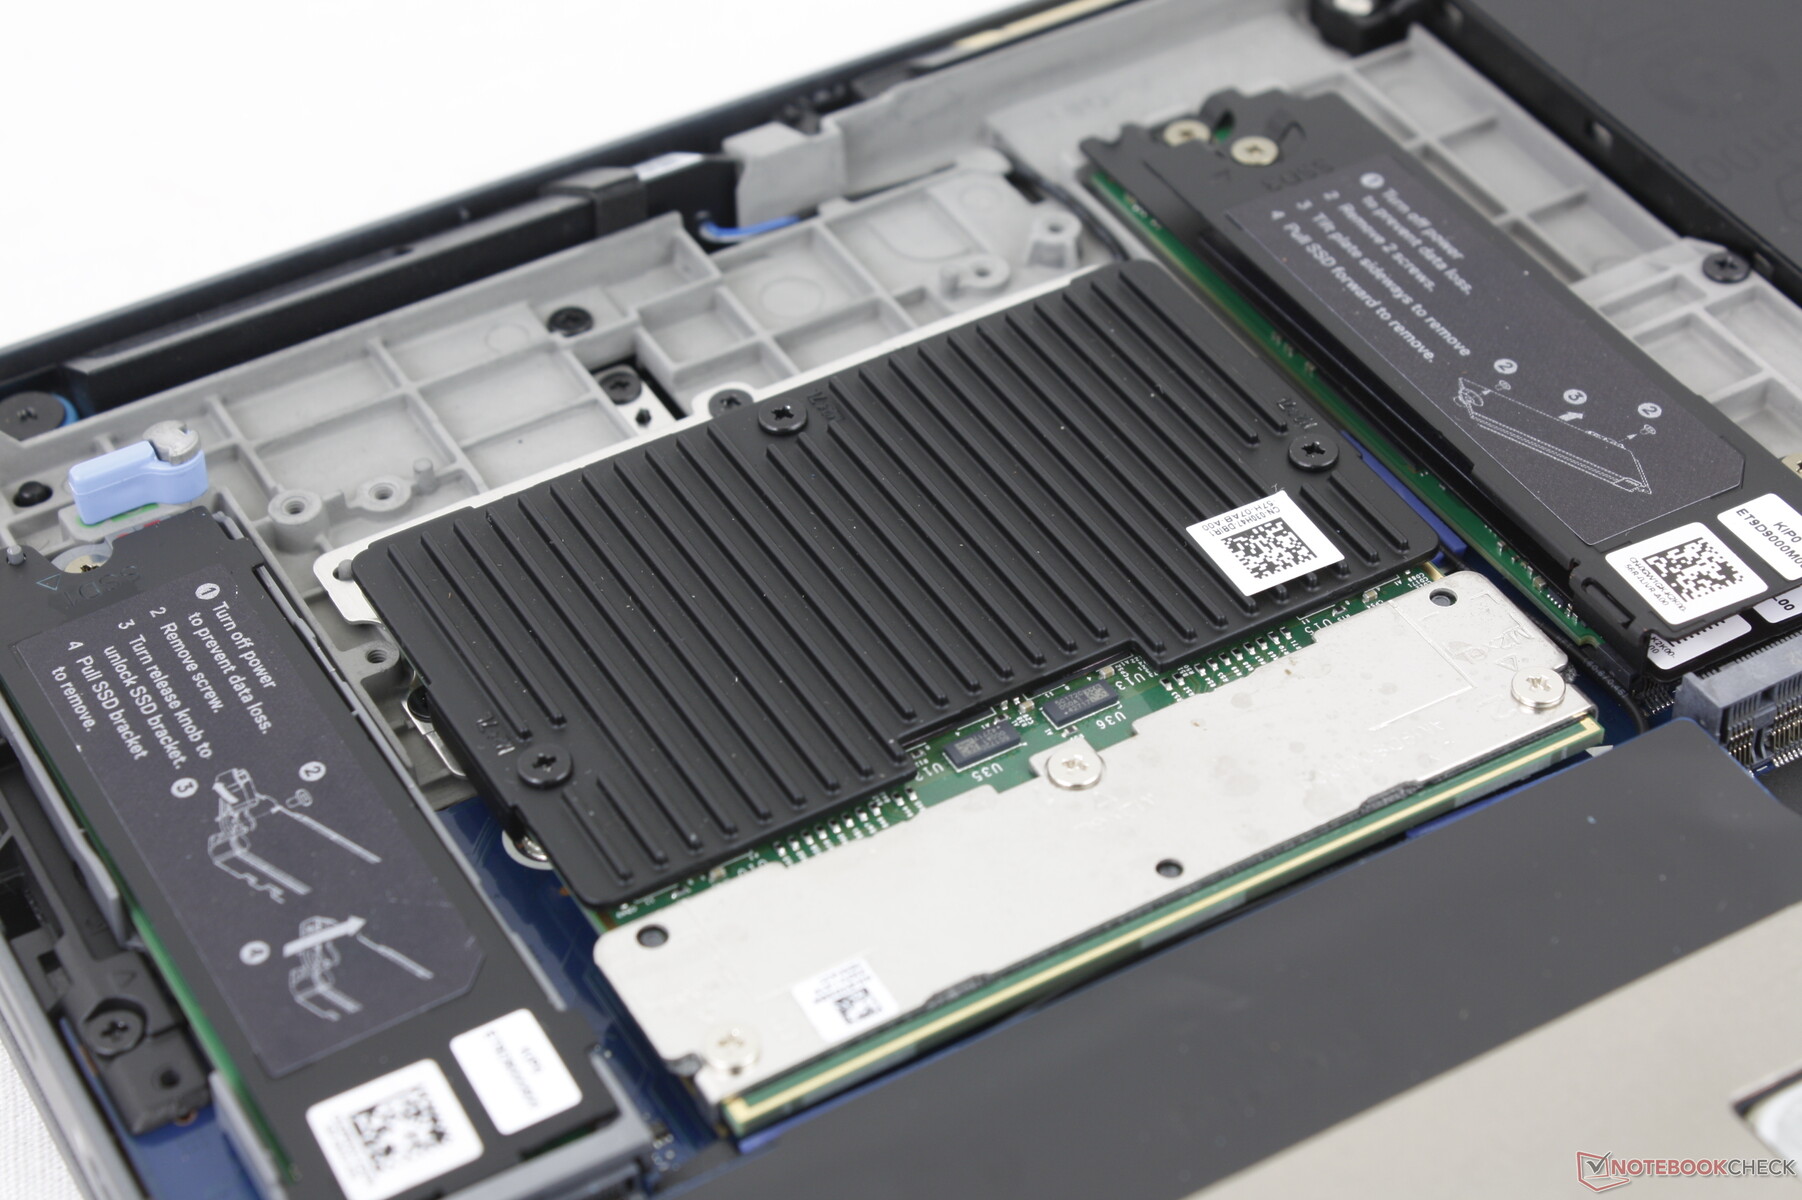
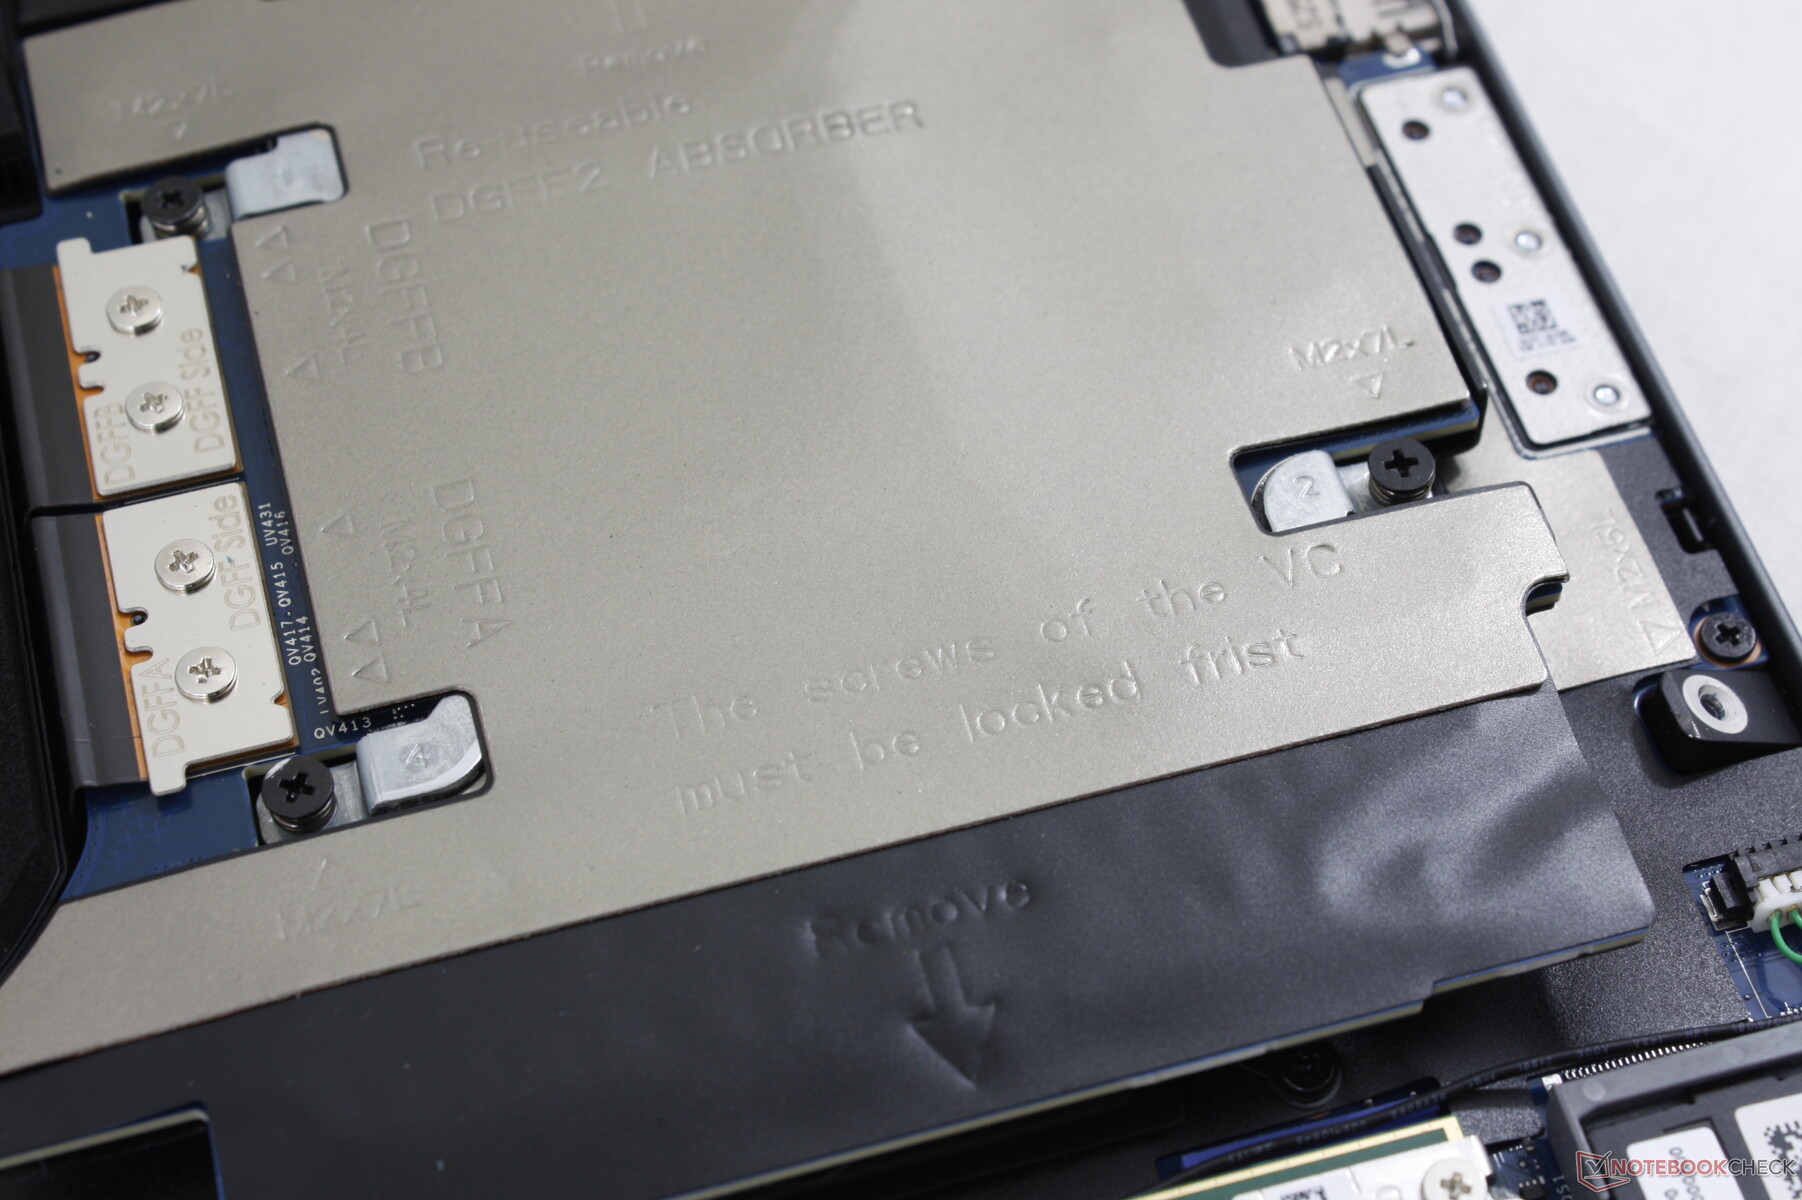
La rimozione del pannello inferiore rivela due slot SSD M.2 2280 PCIe5 x4, lo slot RAM CAMM2, il modulo WLAN rimovibile, la GPU DGFF e lo slot WAN. Se gli utenti preferiscono il vecchio standard, è disponibile un adattatore da CAMM2 a SODIMM.
Sostenibilità
Circa il 90 percento del magnesio riciclato è stato utilizzato per le coperture superiori e inferiori, dal 30 al 50 percento di plastica riciclata per i poggiapolsi e i paraurti inferiori, e il 50 percento di cobalto riciclato per la batteria. L'imballaggio è tutto di carta e riciclabile.
Accessori e garanzia
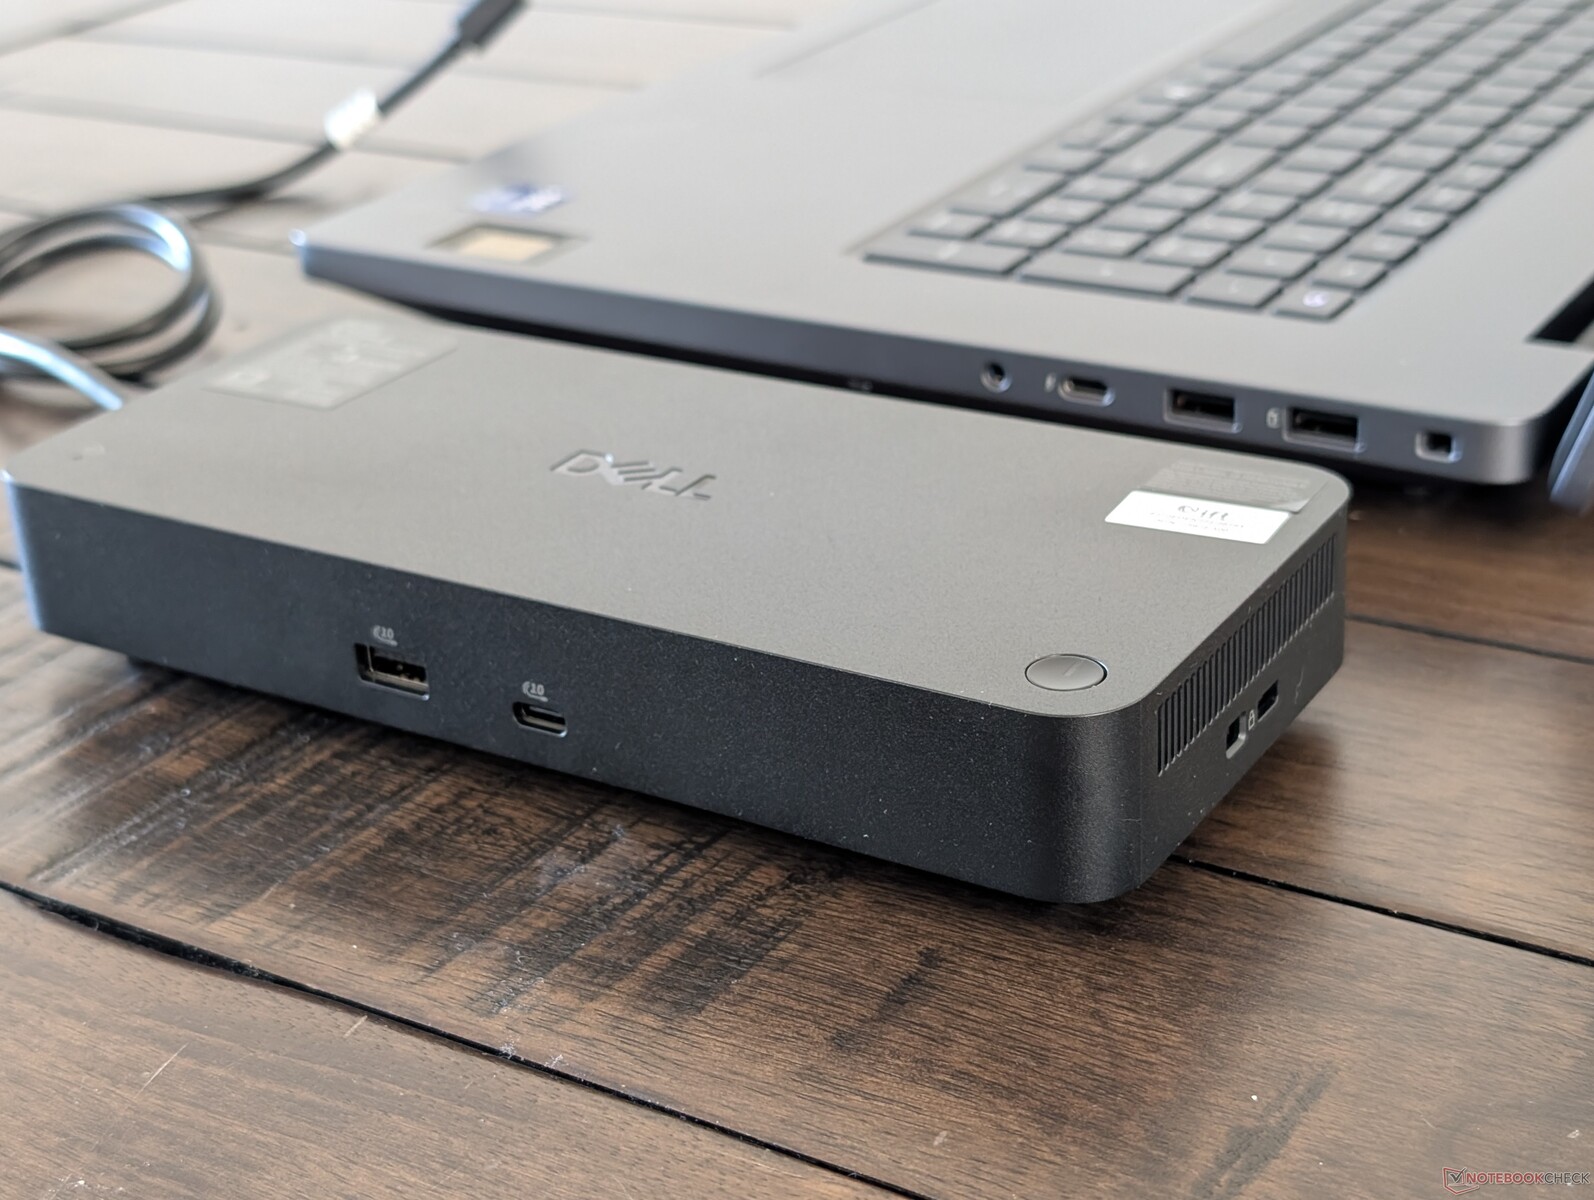
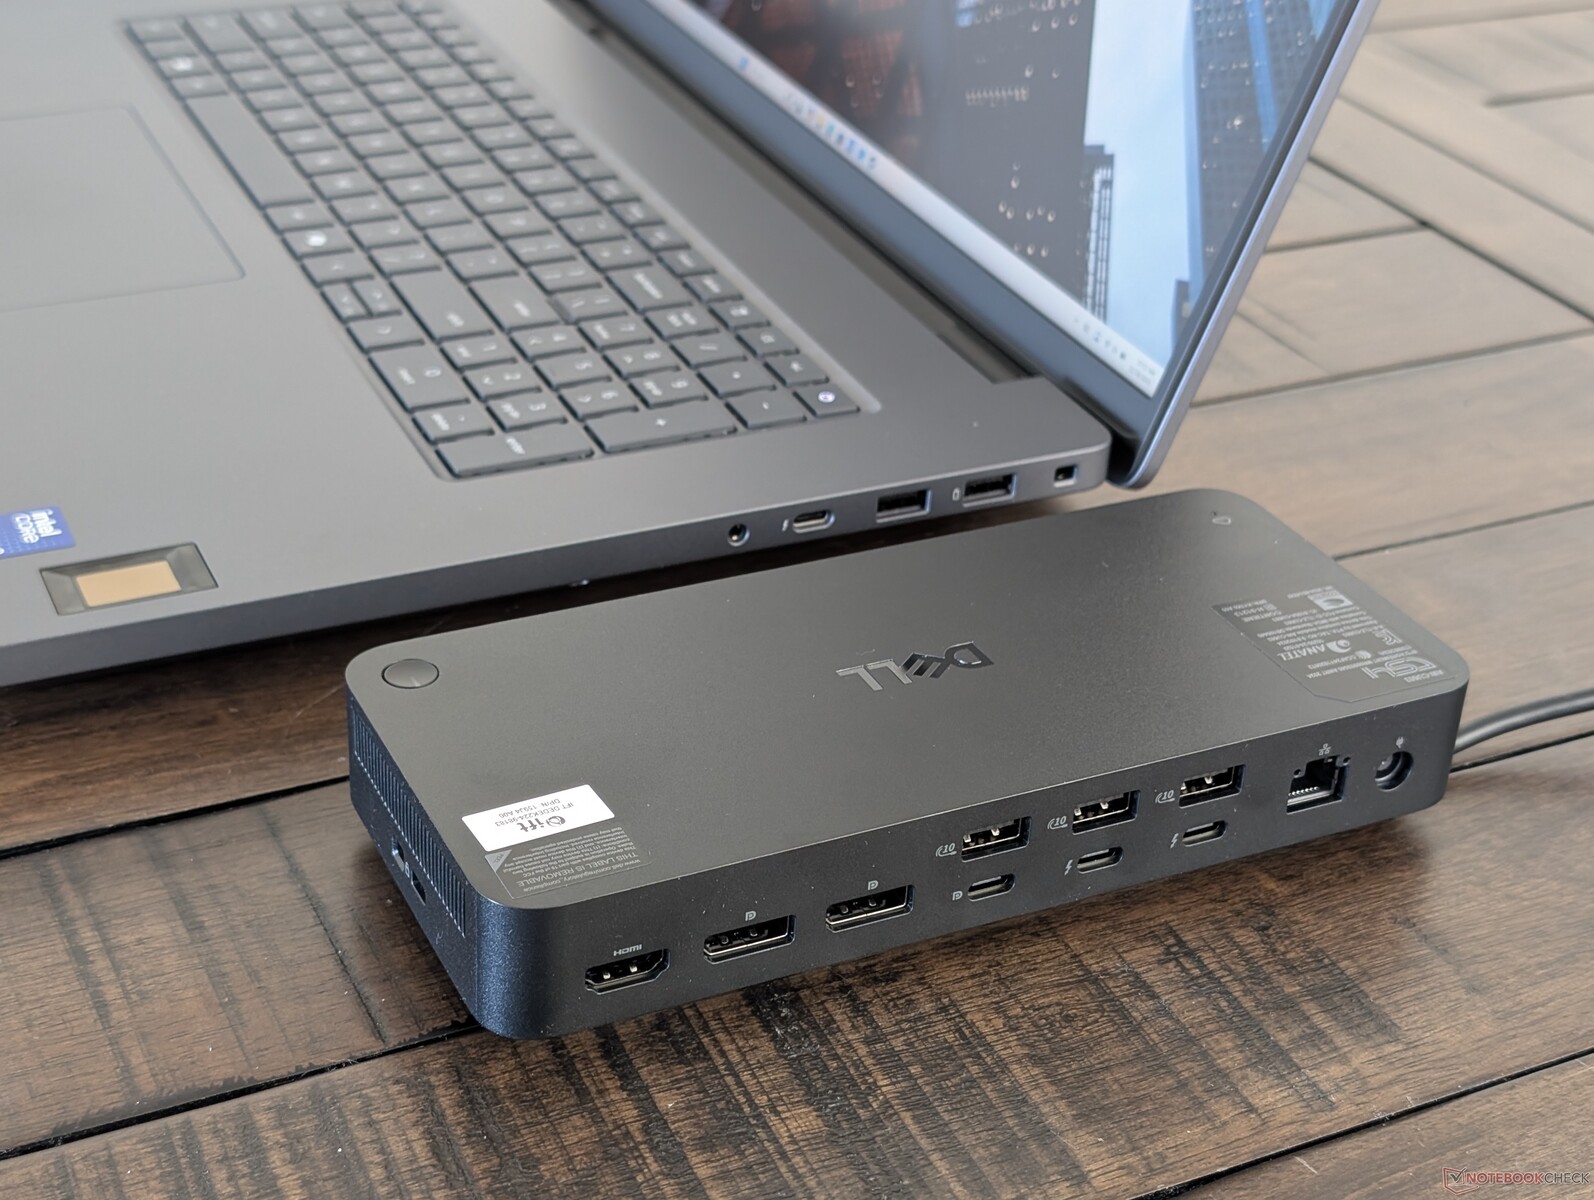
Tra gli extra opzionali c'è il Dell Pro Thunderbolt 5 Smart Dock come mostrato di seguito. La docking station è una soluzione con un solo cavo che fornisce sia il passaggio di energia (fino a 300 W) che porte aggiuntive per il portatile. Tuttavia, viene fornita con il proprio adattatore CA, che è grande quanto la docking station stessa.
La garanzia limitata di tre anni del produttore è standard per il laptop e la docking station opzionale.
Dispositivi di ingresso
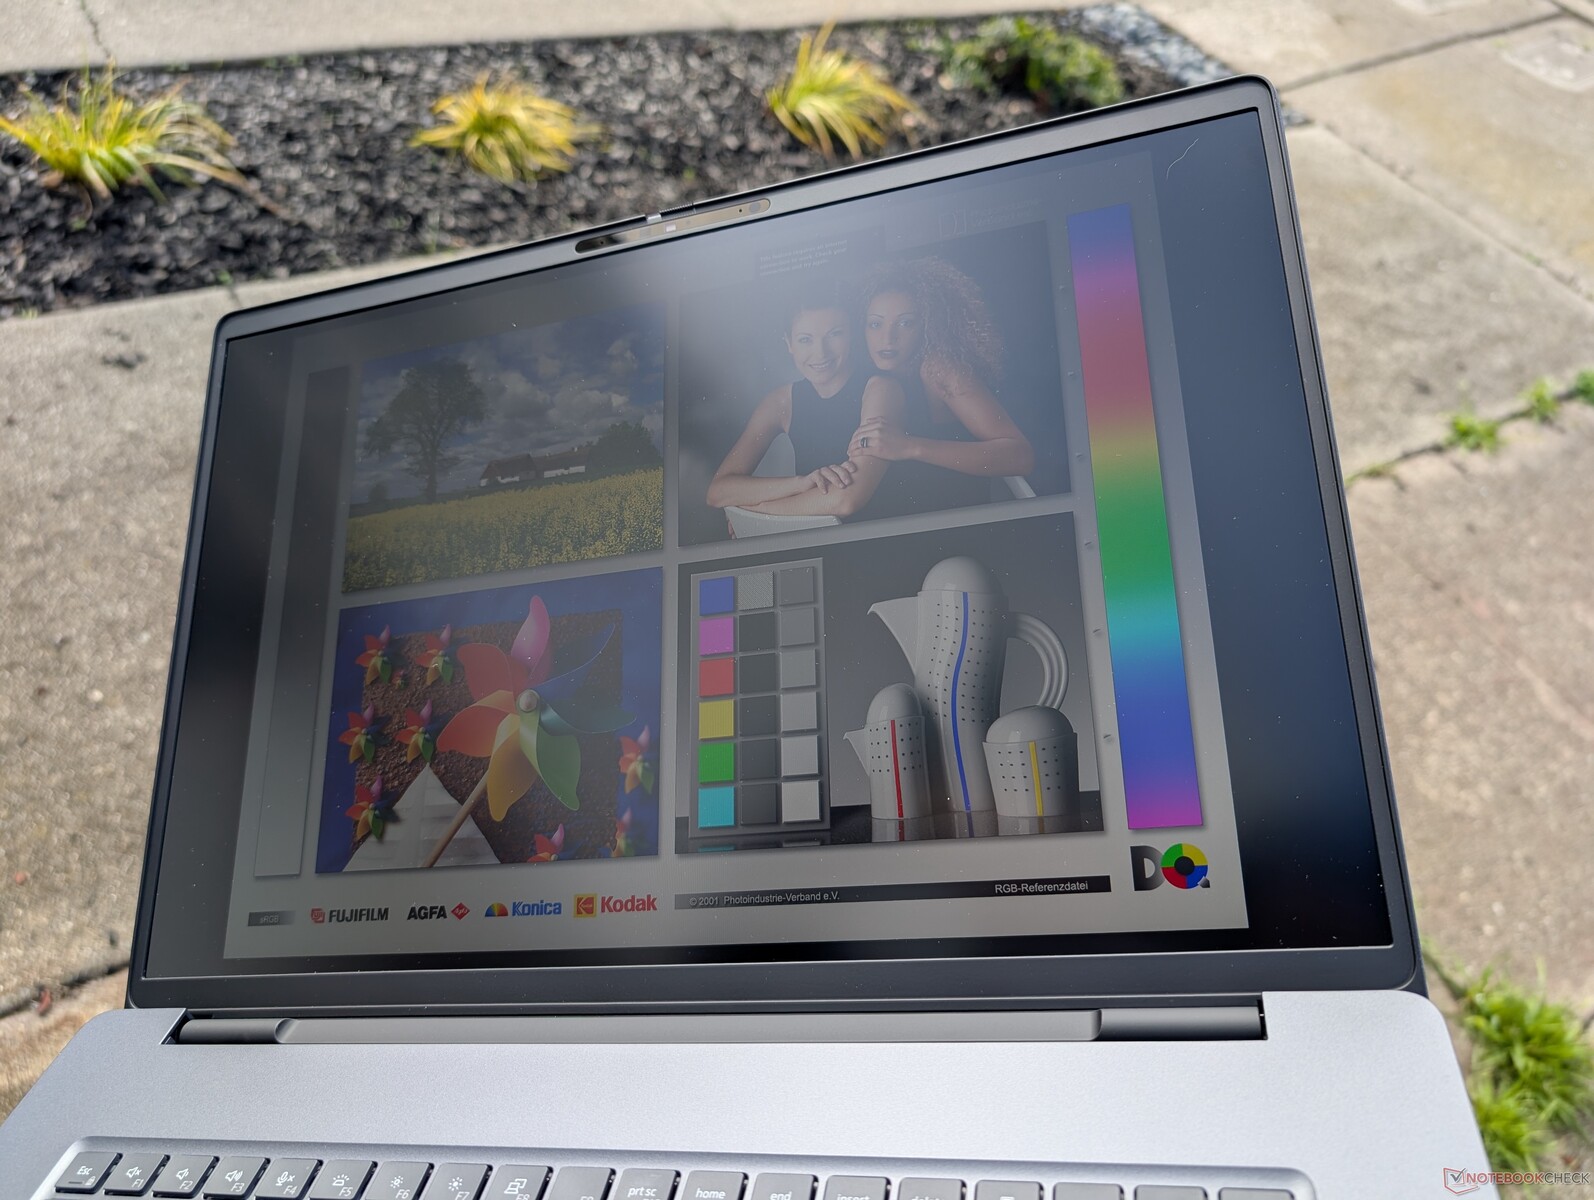
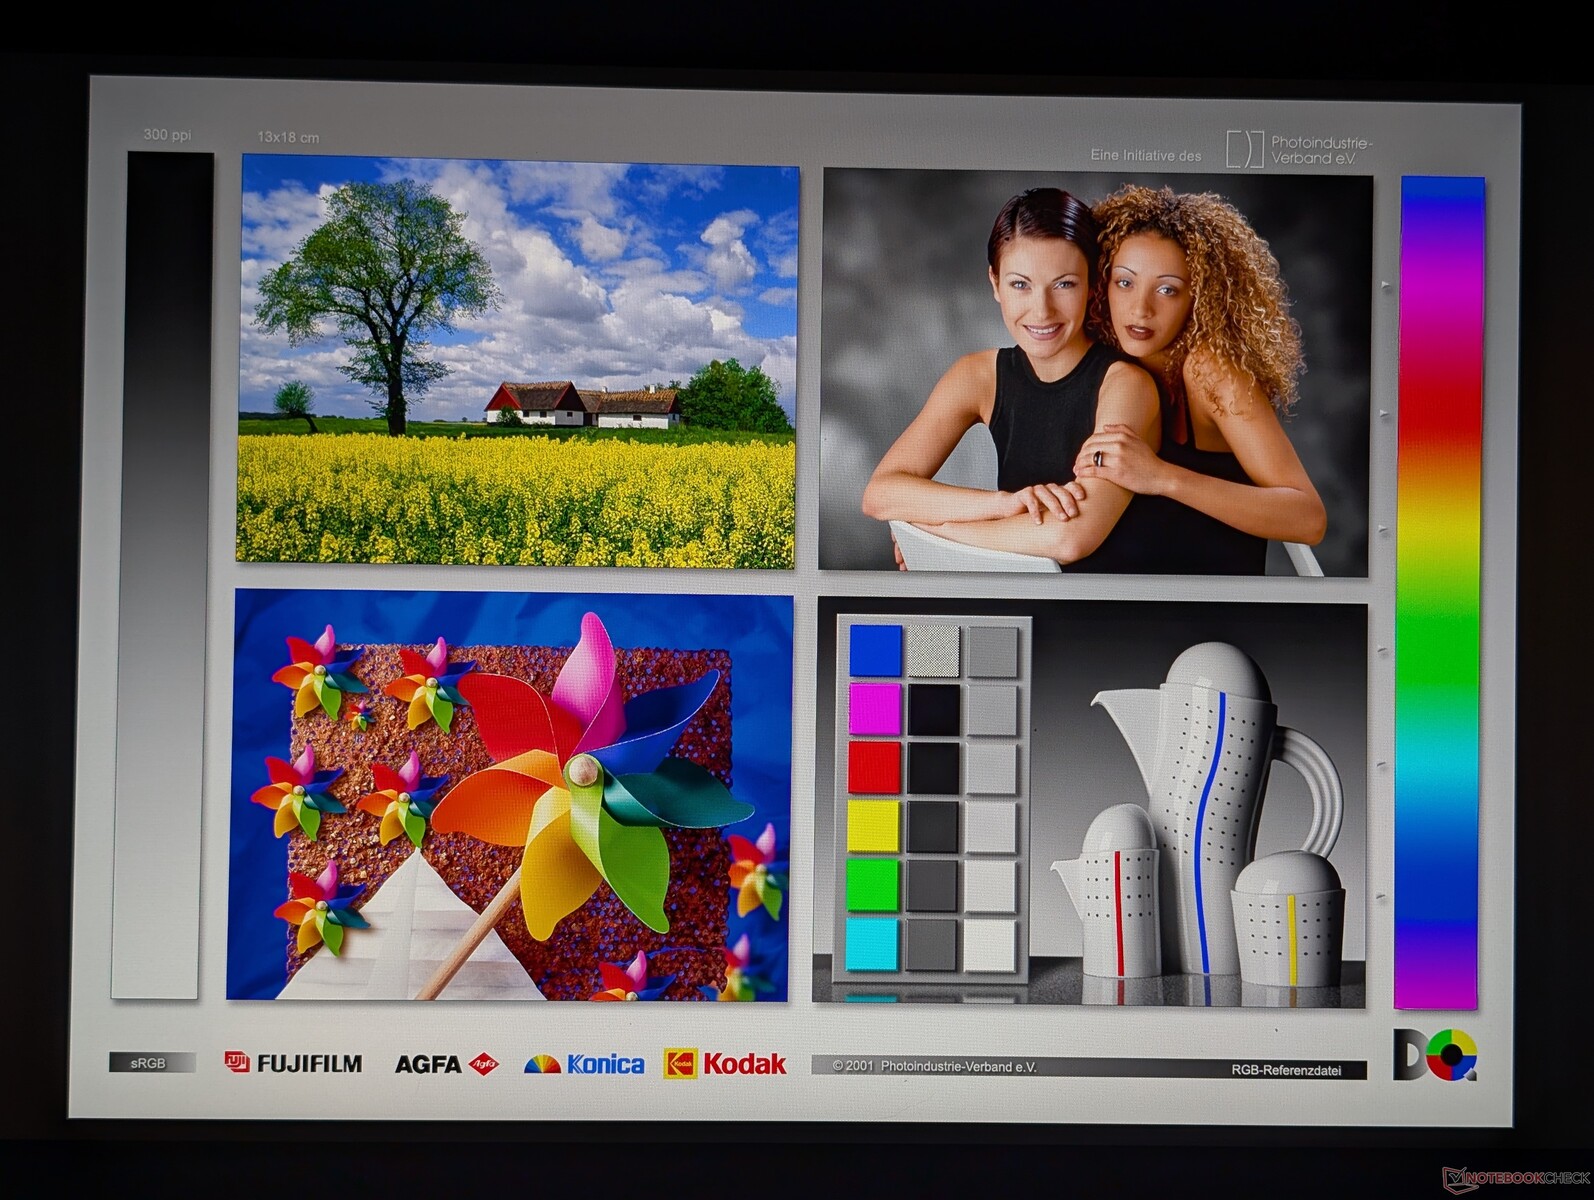
Display - P3 Colori e 120 Hz con IPS
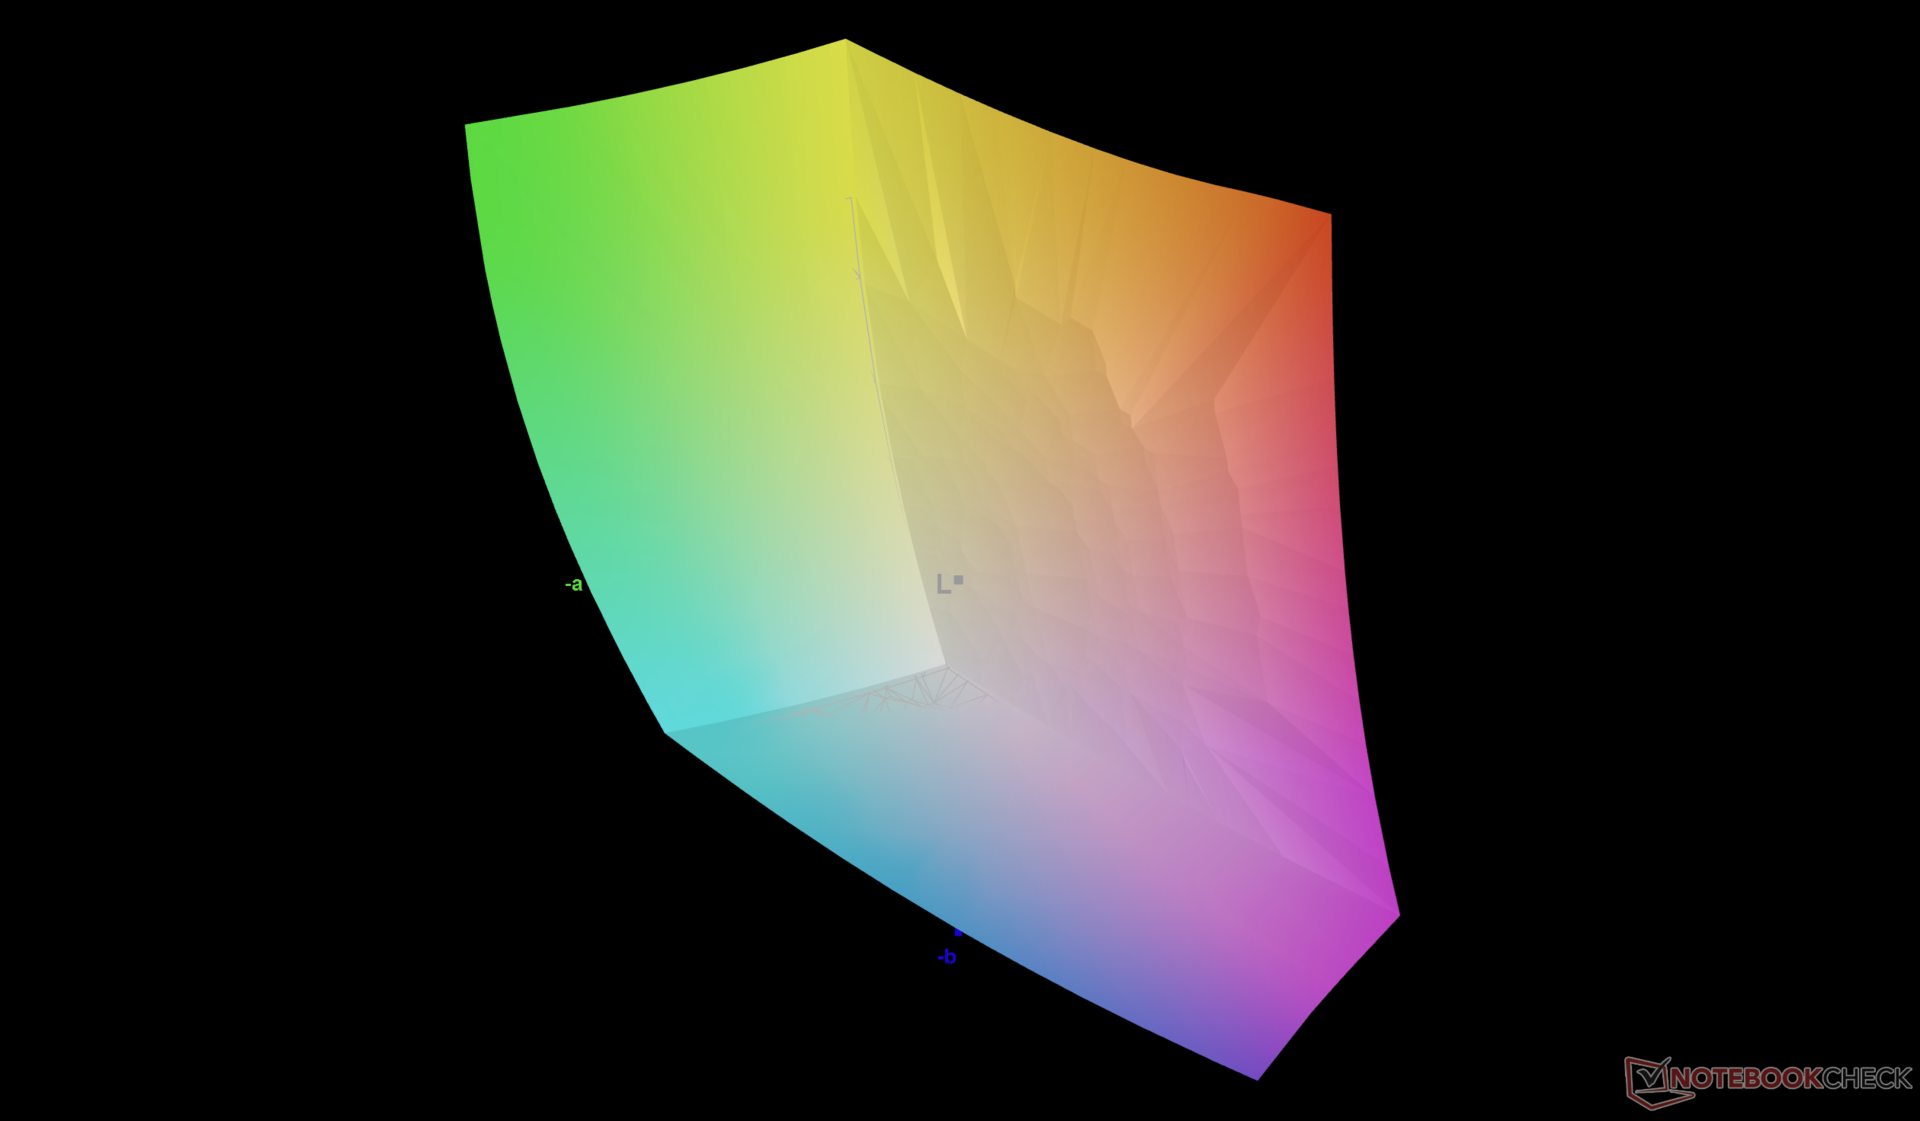
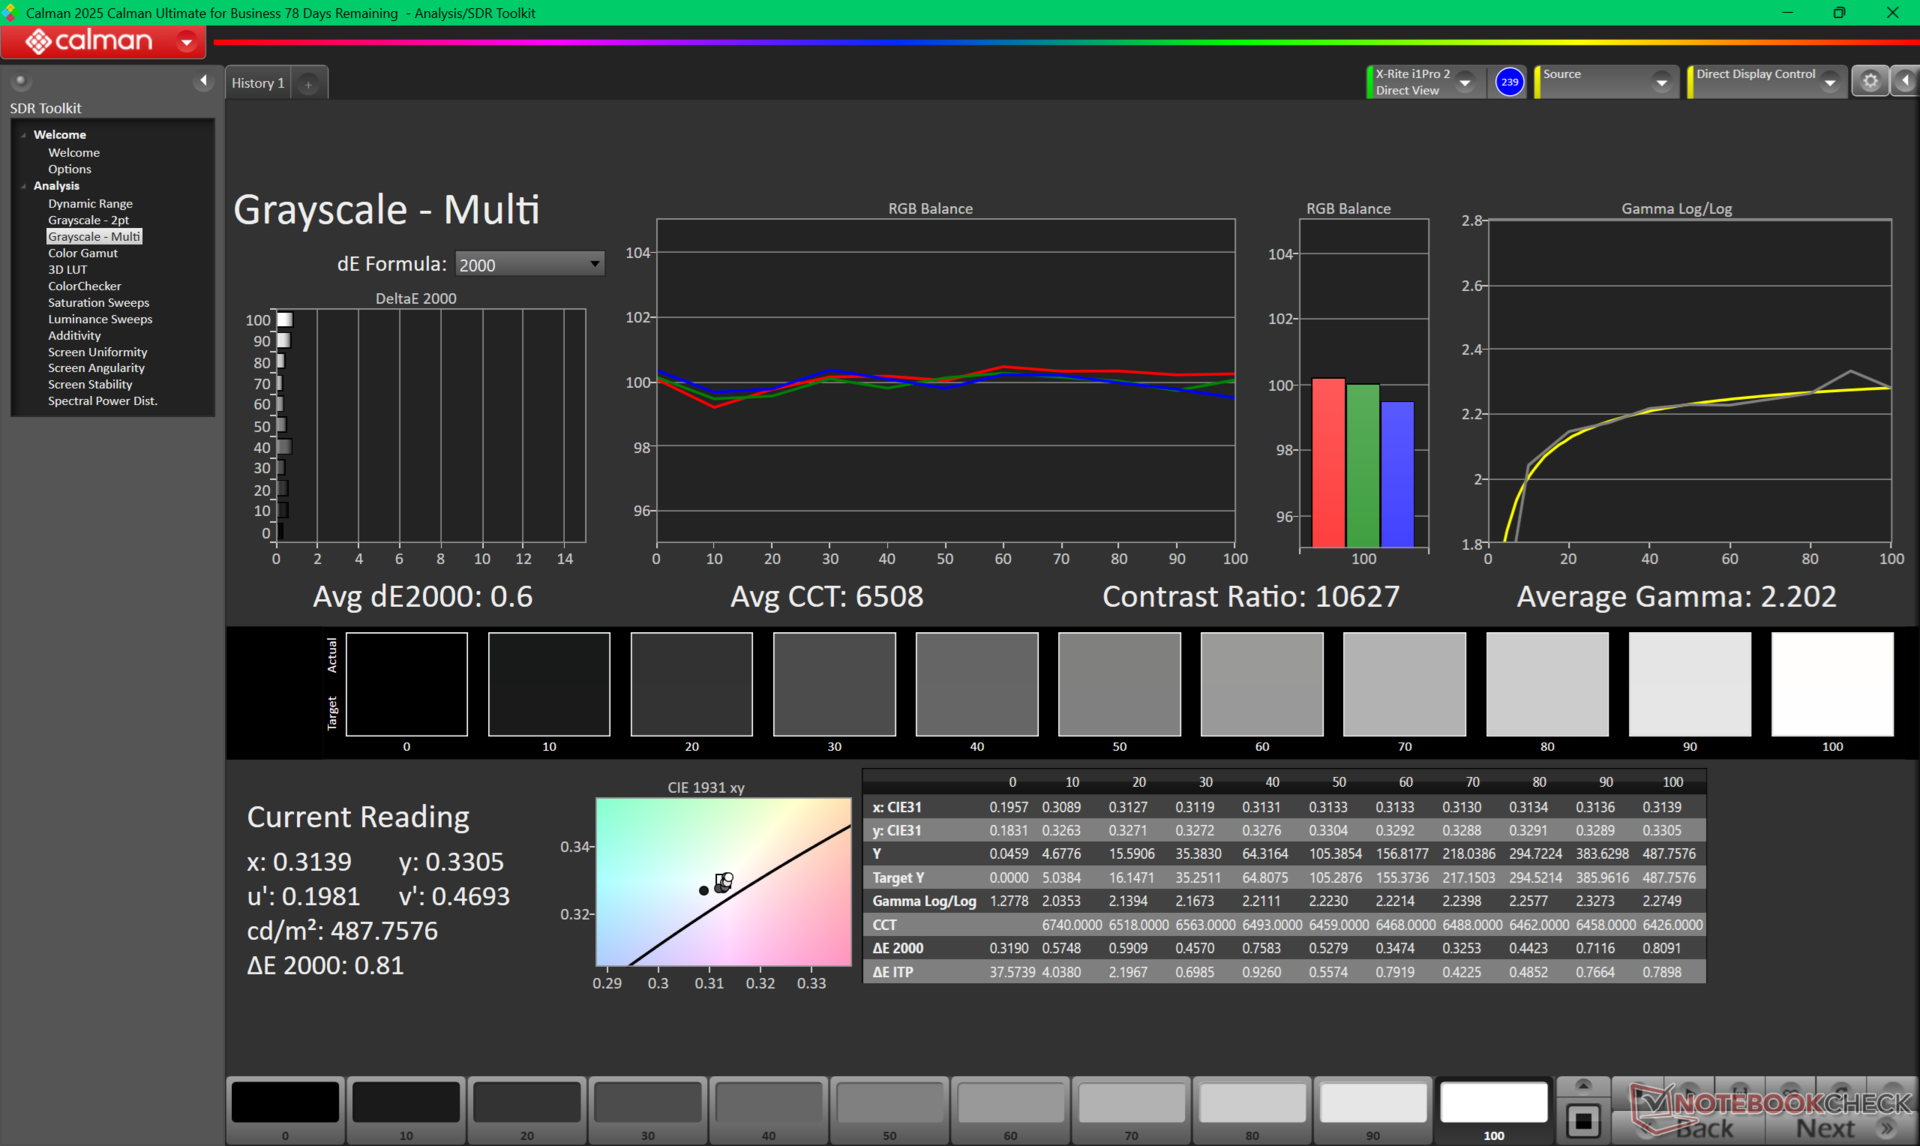
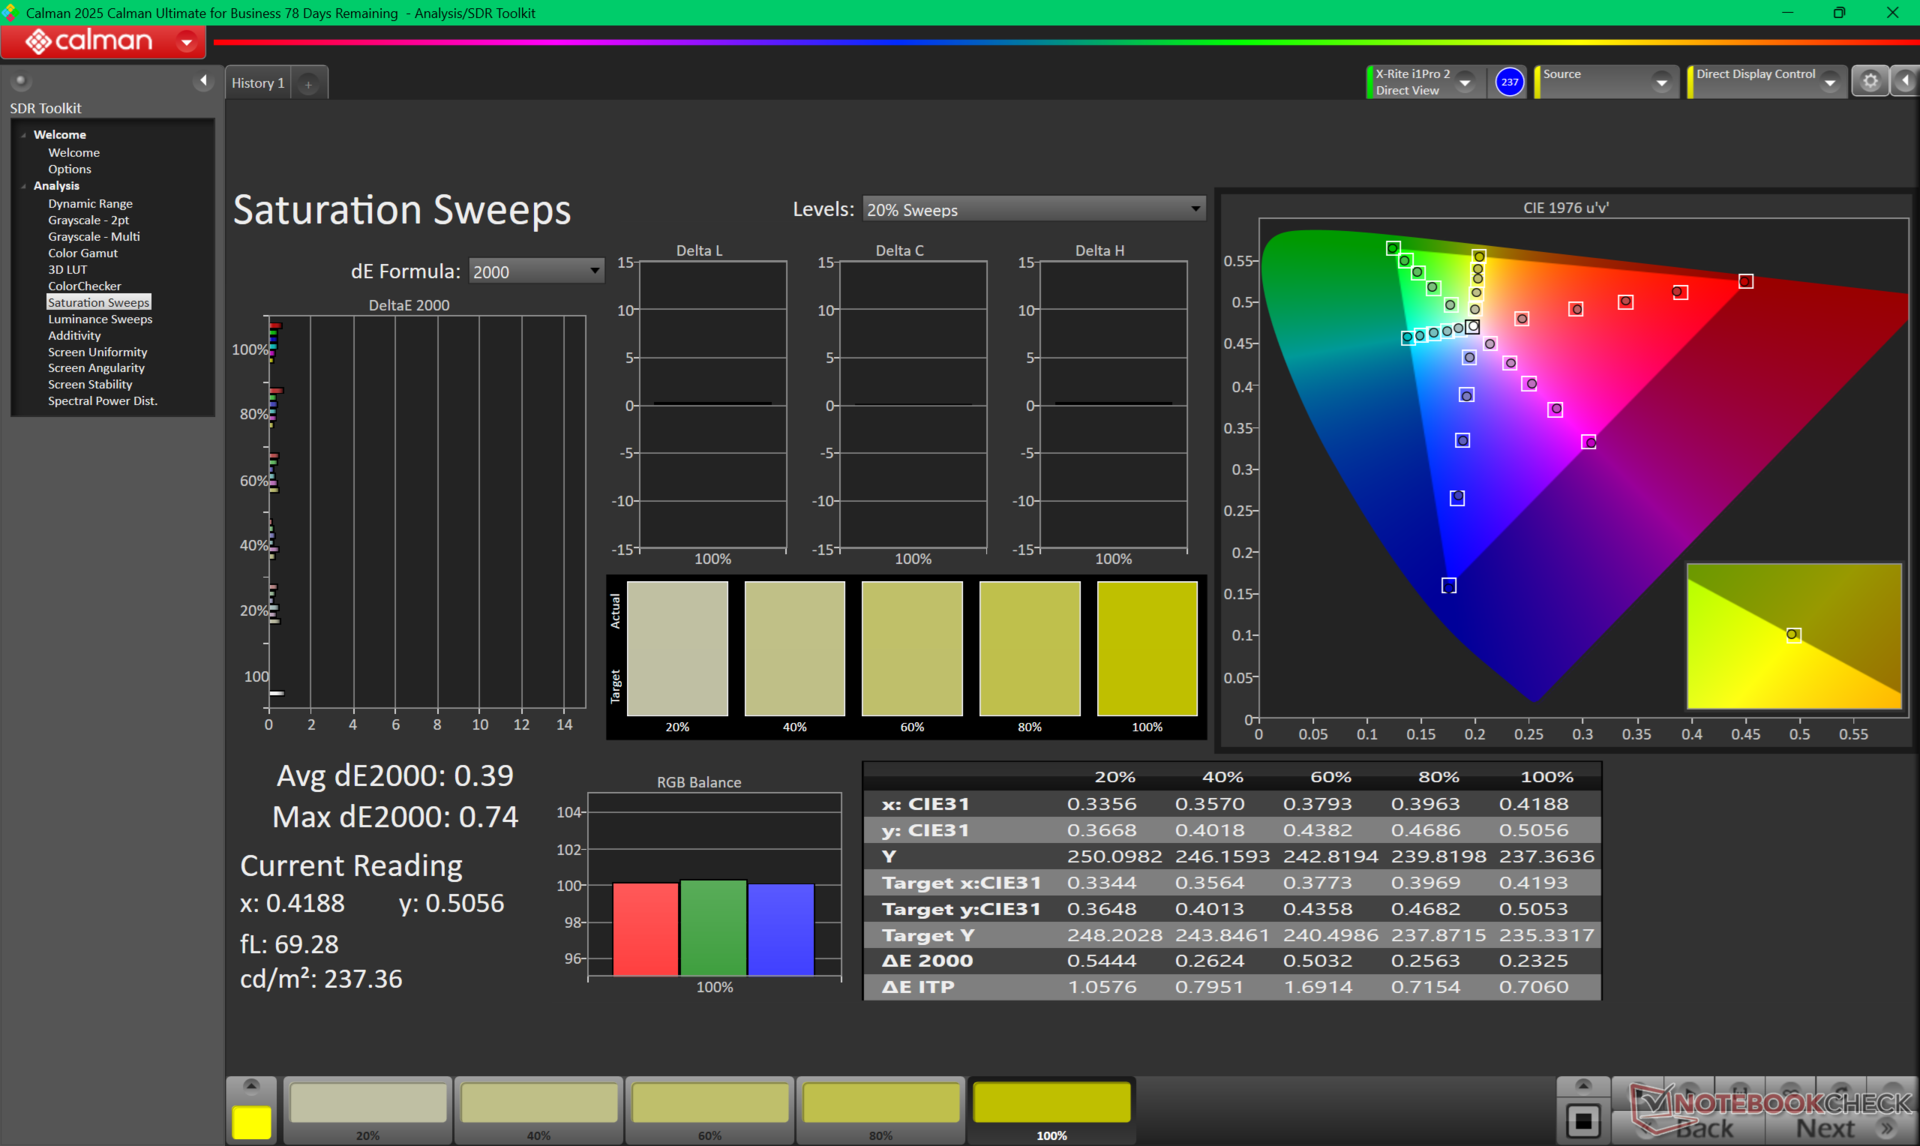
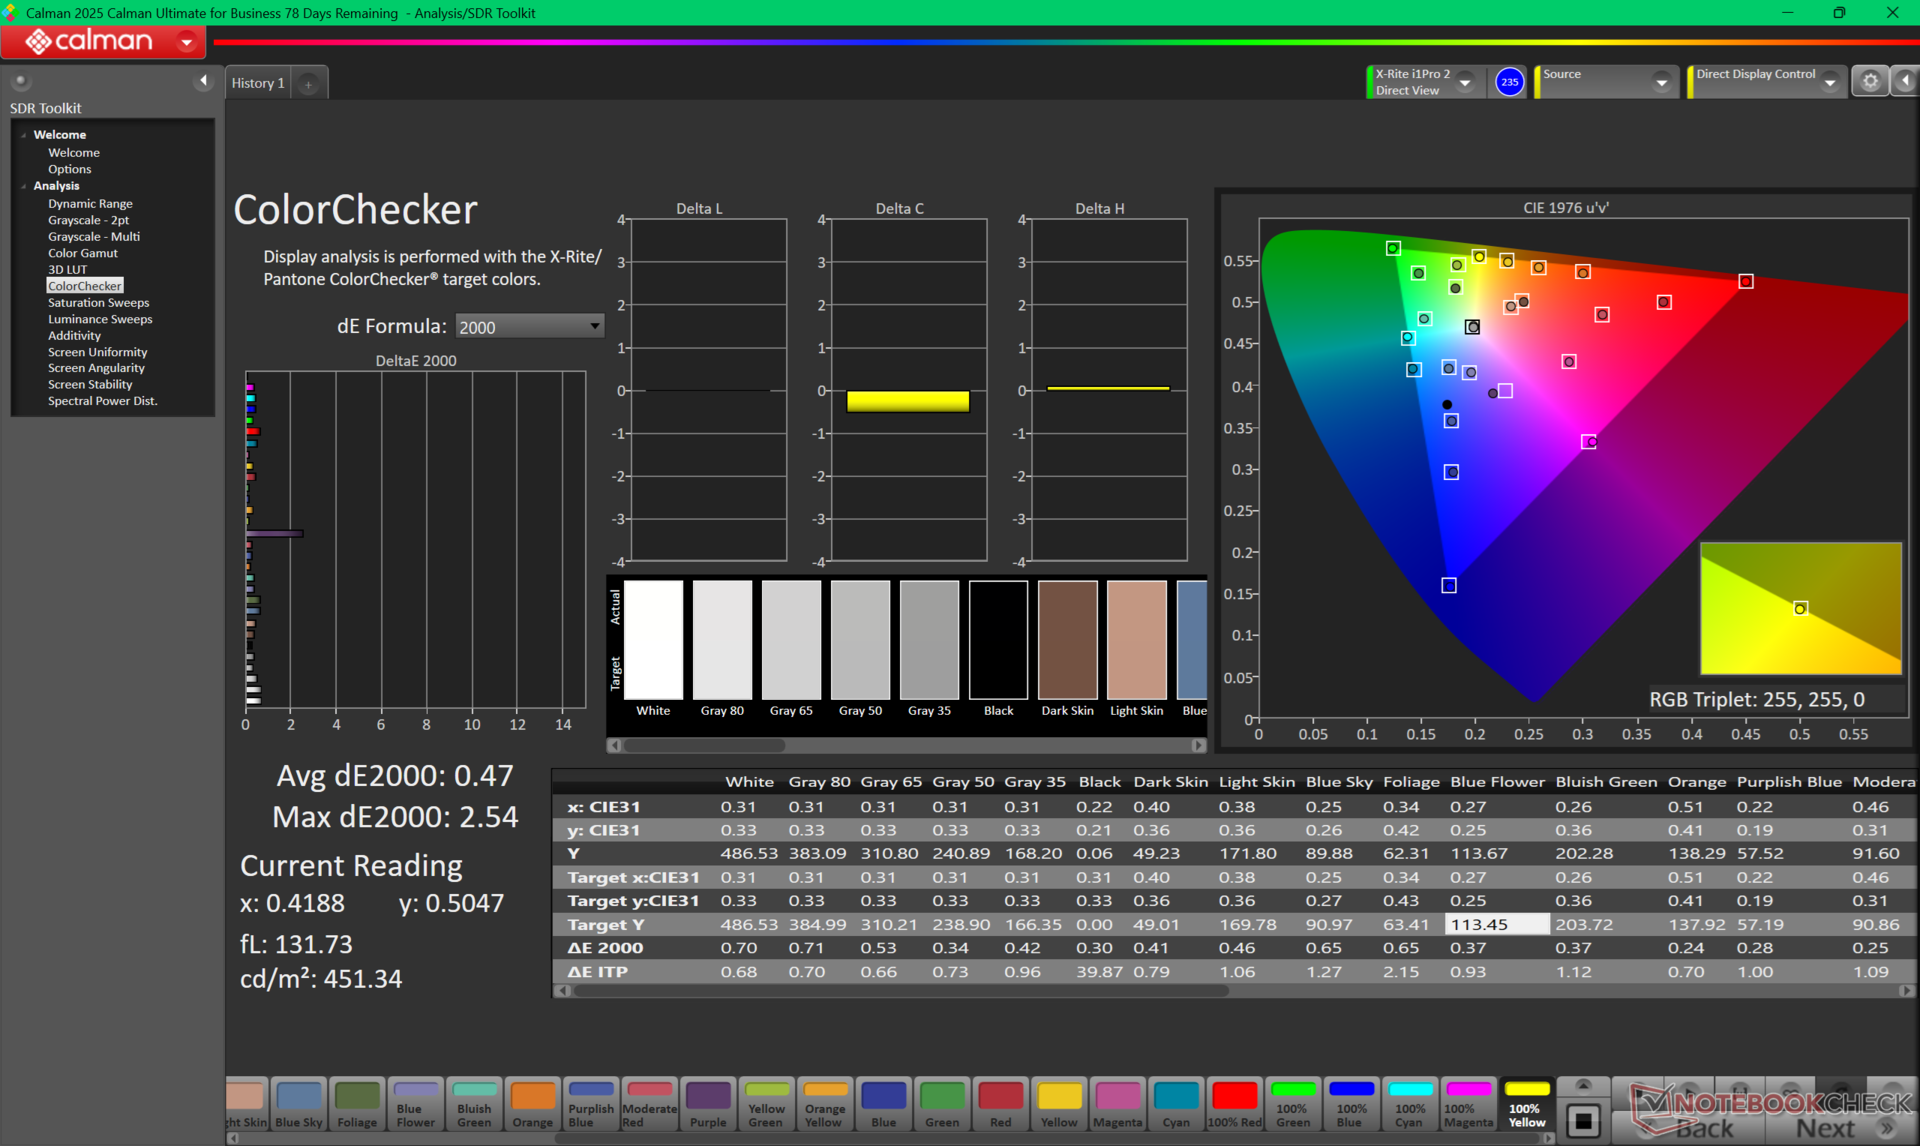
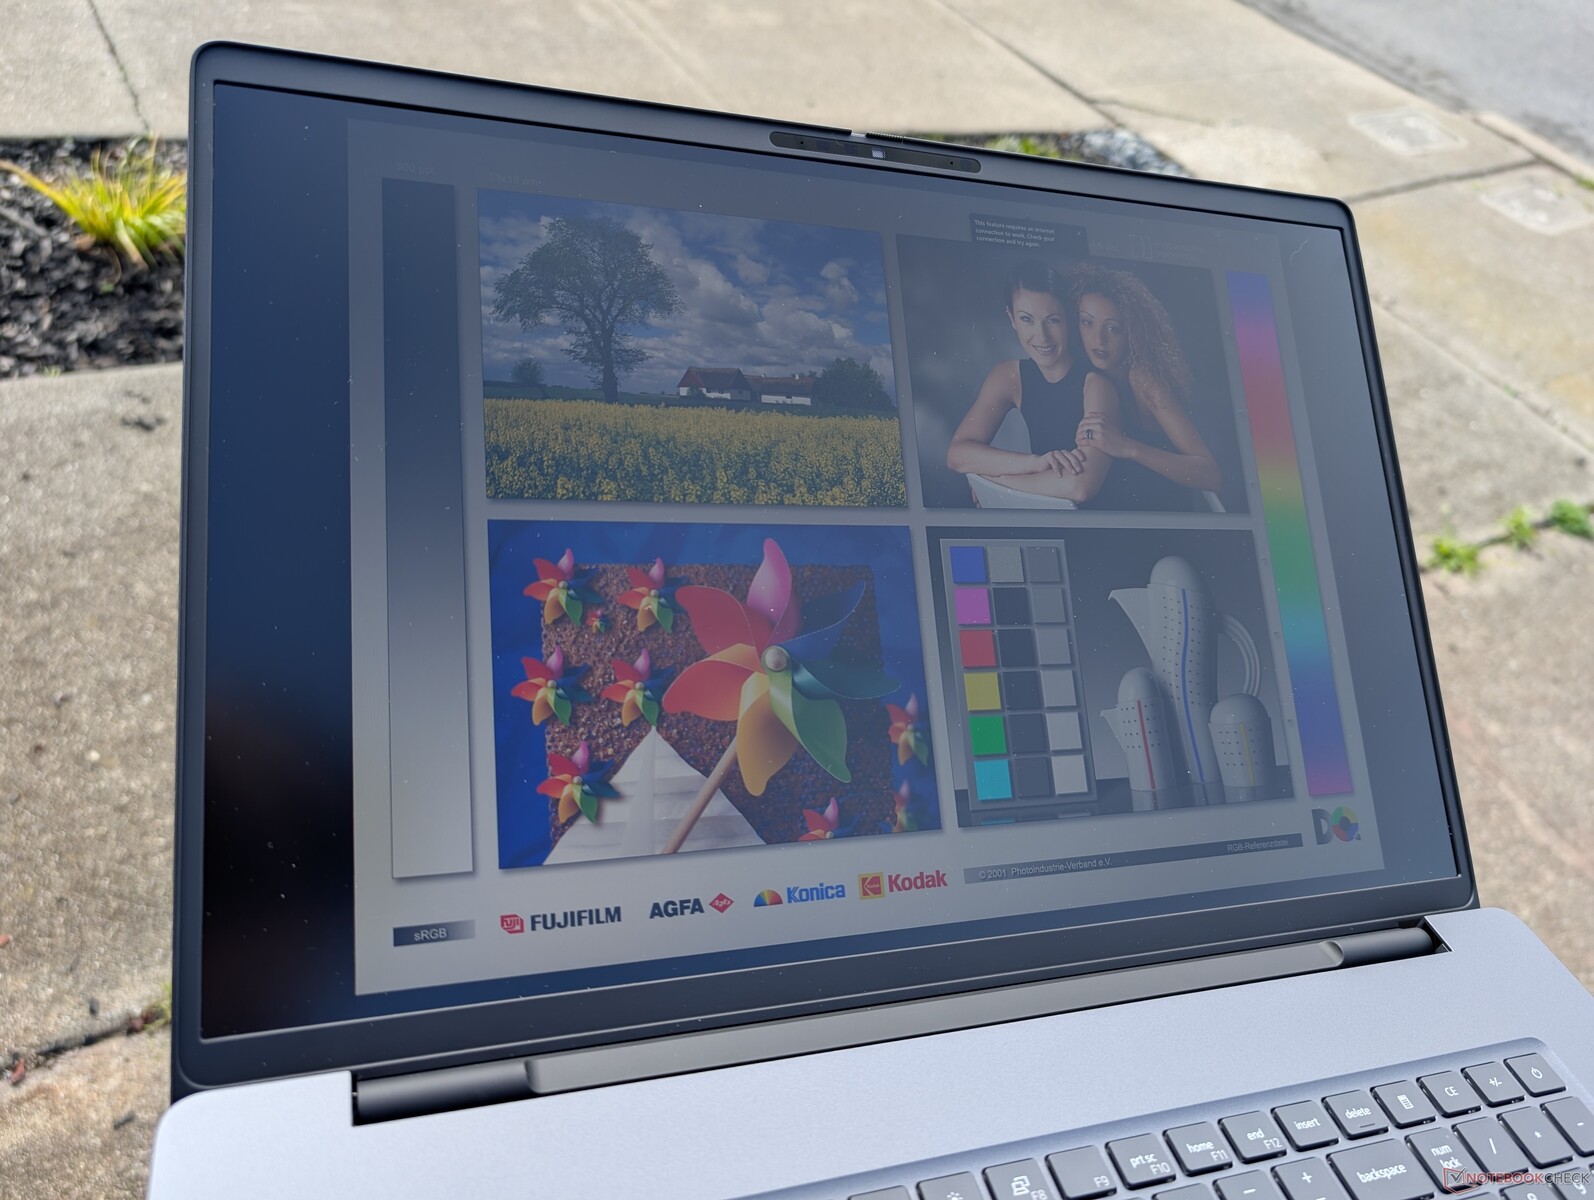
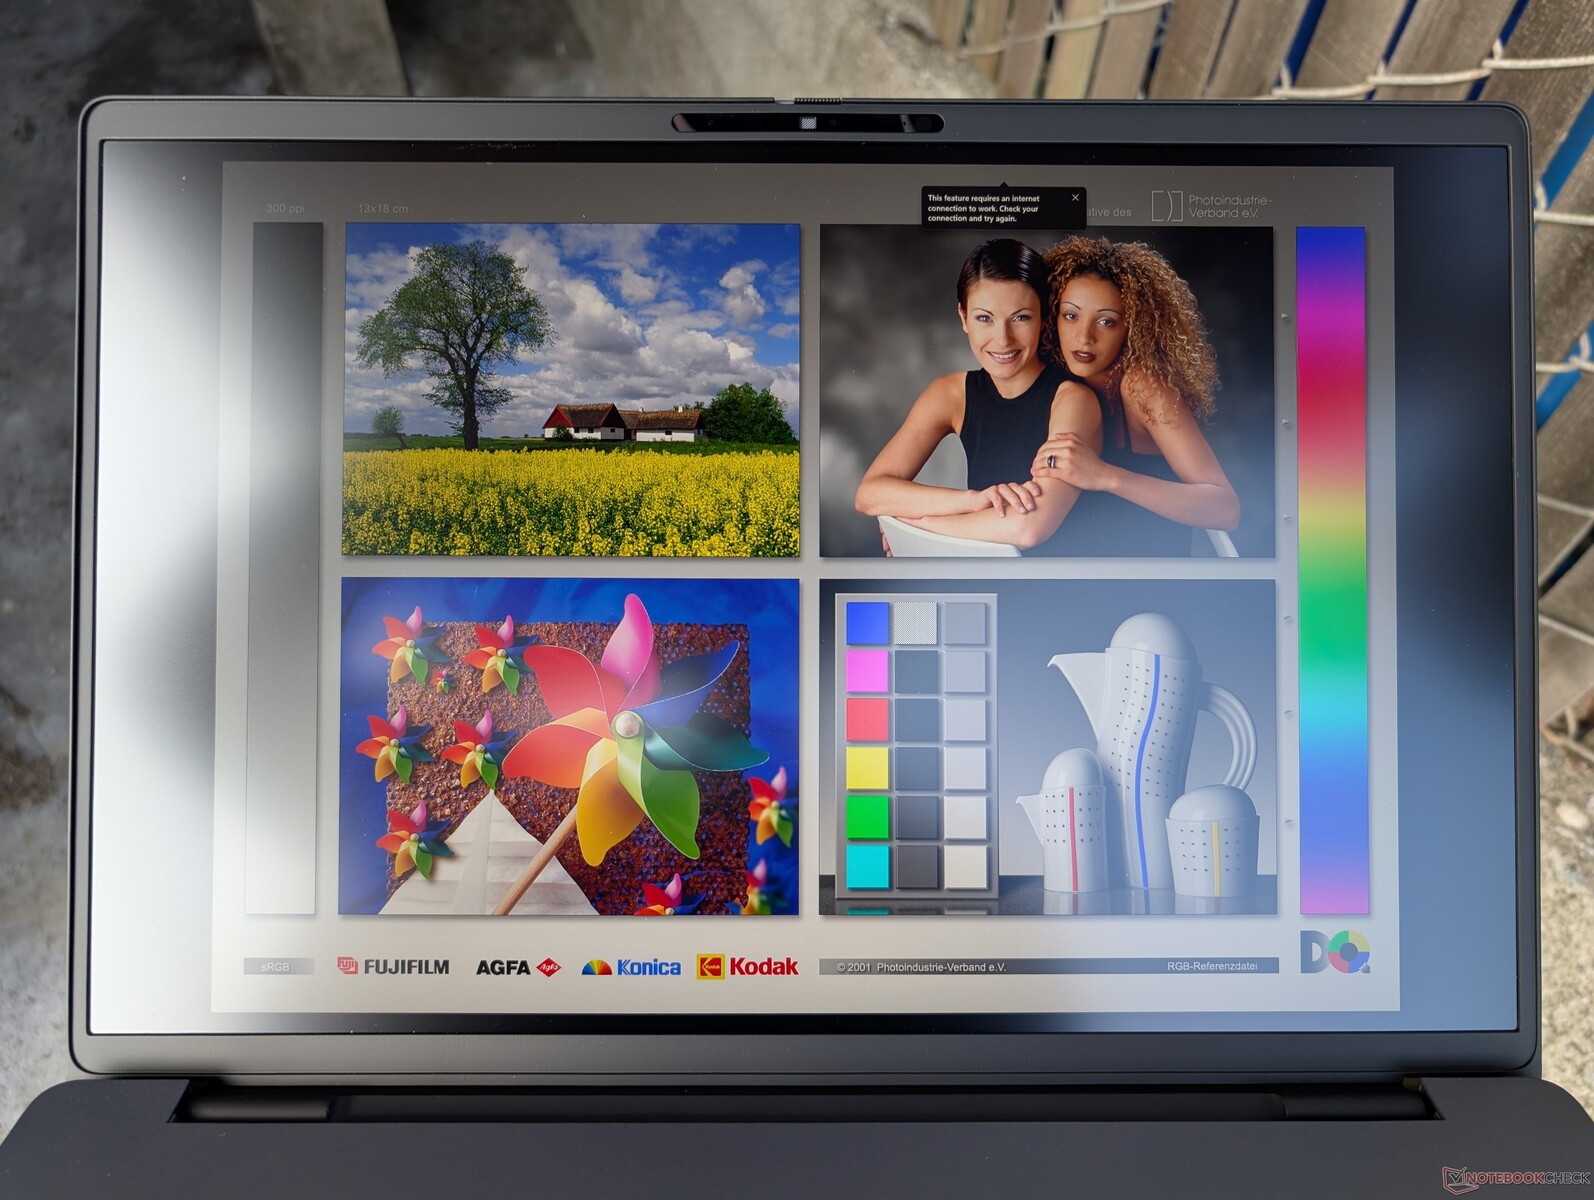
Al momento Dell offre solo un'opzione di pannello singolo in tutte le configurazioni, mentre altri portatili da 18 pollici, come lo Schenker Key 18 Pro possono offrire opzioni di risoluzione 4K più elevate. Per il resto, il display è eccellente e uno dei migliori display IPS che abbiamo visto su qualsiasi laptop da 18 pollici in termini di copertura del colore, rapporto di contrasto e luminosità. Tuttavia, caratteristiche come il supporto HDR e i tempi di risposta non sono all'altezza delle attuali offerte OLED.
| |||||||||||||||||||||||||
Distribuzione della luminosità: 91 %
Al centro con la batteria: 528.8 cd/m²
Contrasto: 2404:1 (Nero: 0.22 cd/m²)
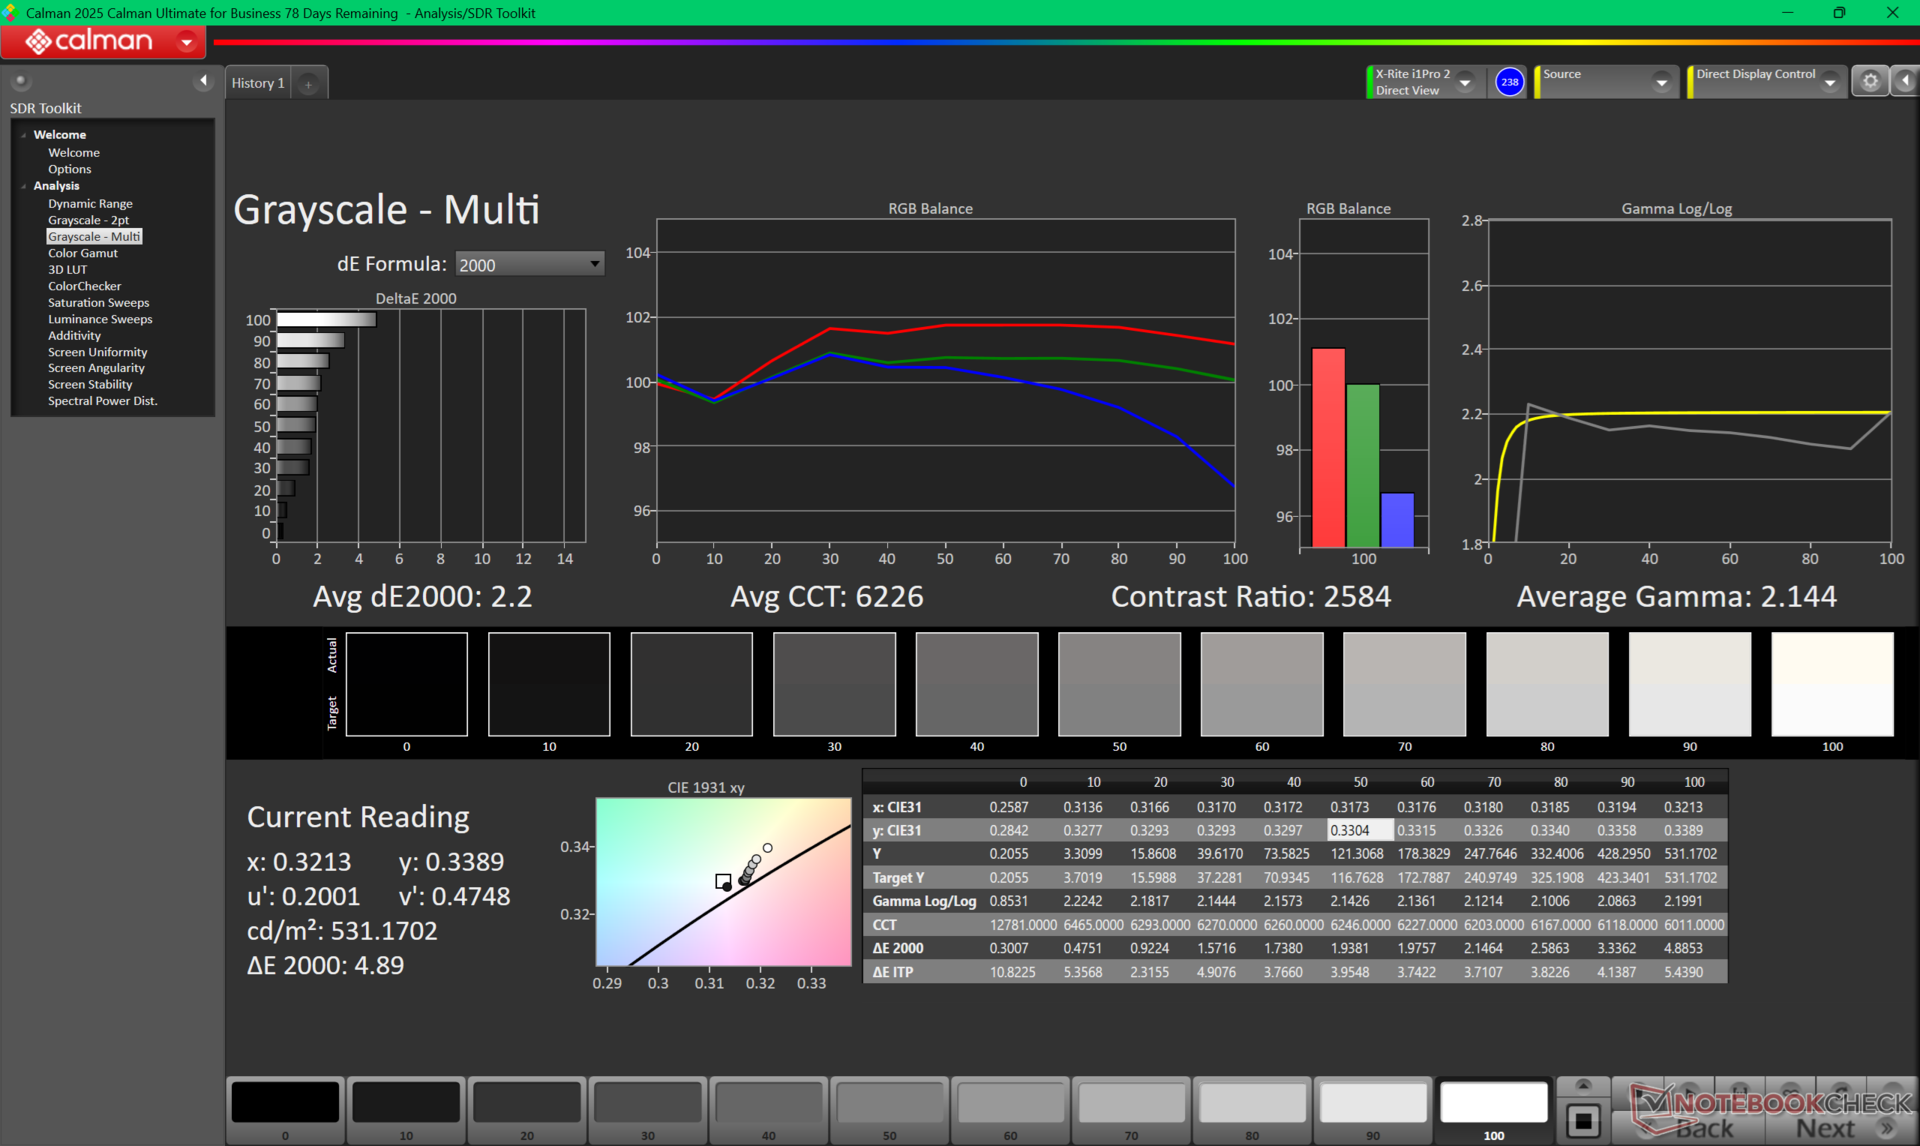
ΔE ColorChecker Calman: 2.76 | ∀{0.5-29.43 Ø4.79}
calibrated: 0.47
ΔE Greyscale Calman: 2.2 | ∀{0.09-98 Ø5}
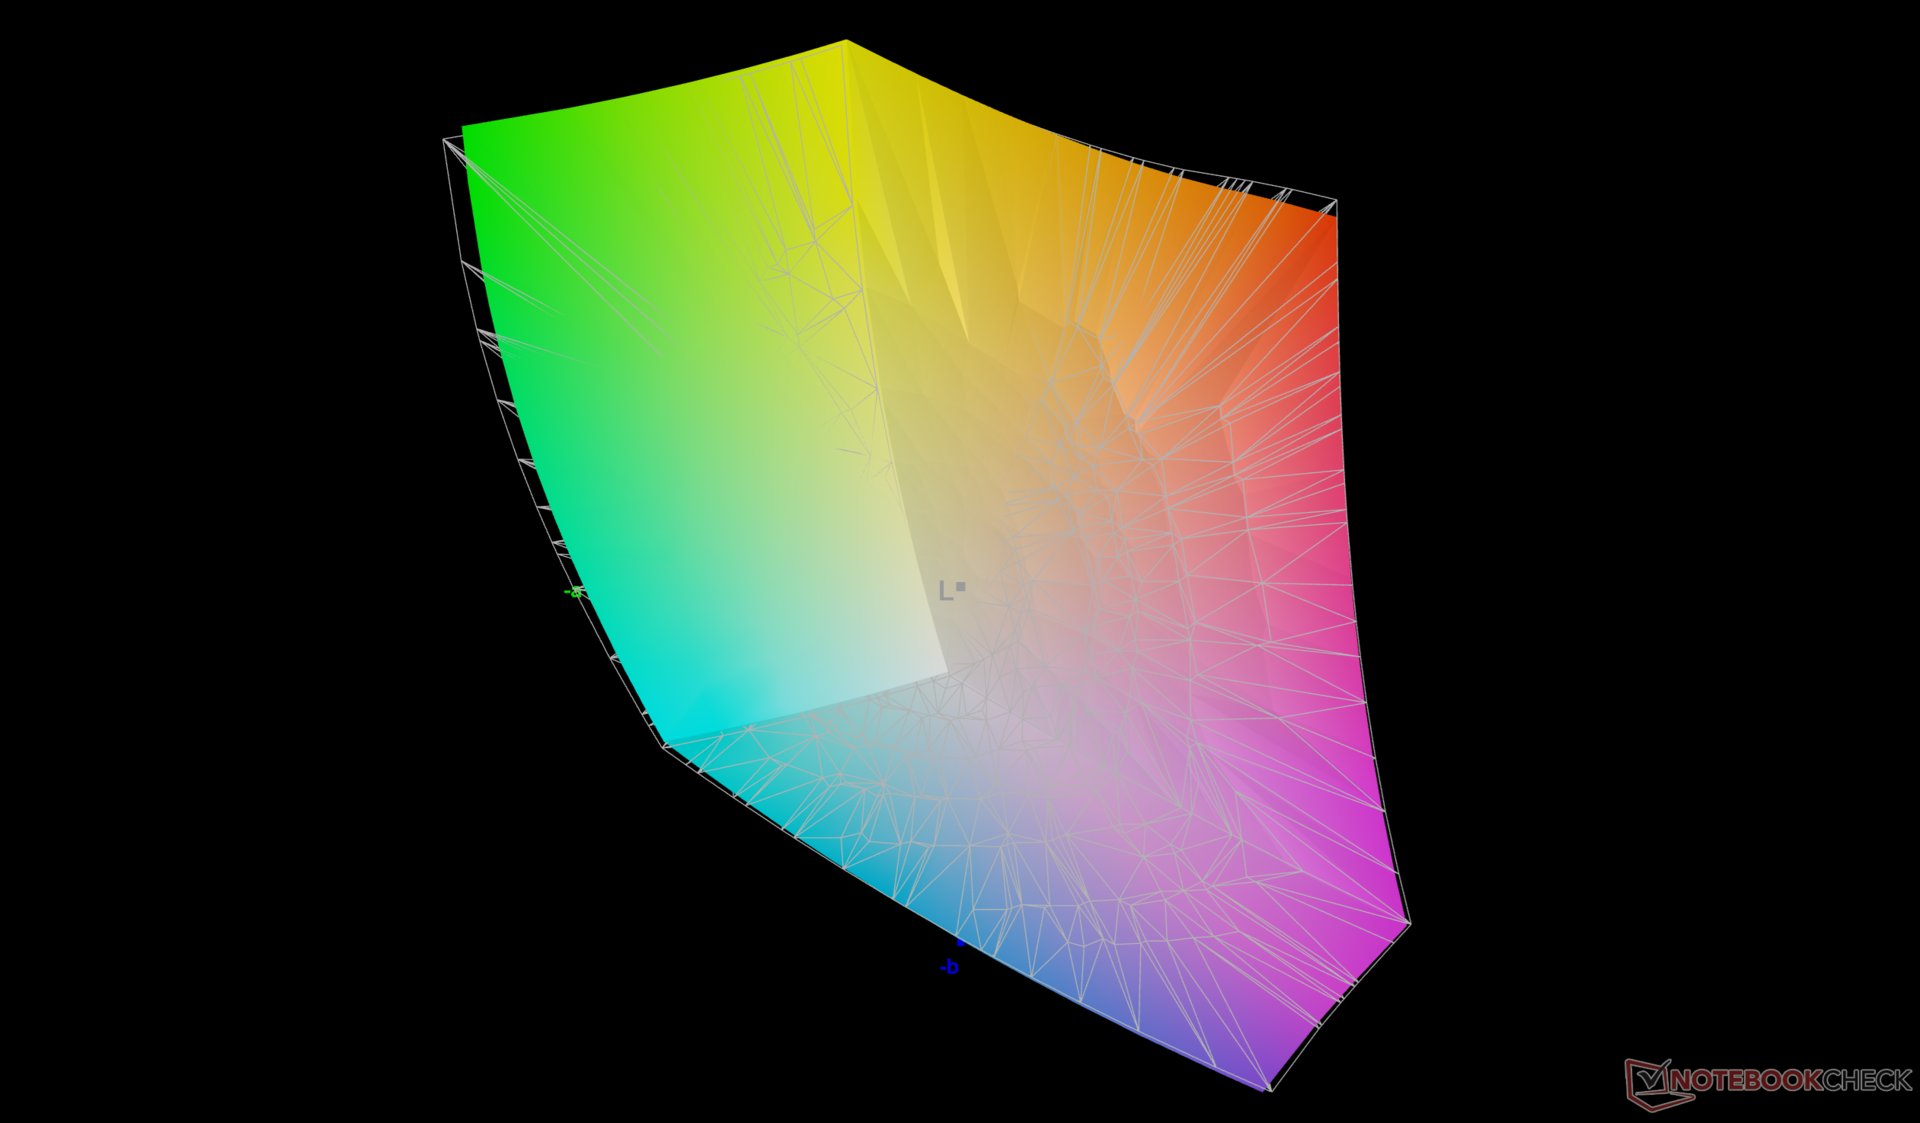
85.9% AdobeRGB 1998 (Argyll 3D)
99.9% sRGB (Argyll 3D)
97.7% Display P3 (Argyll 3D)
Gamma: 2.14
CCT: 2584 K
| Dell Pro Max 18 Plus MB18250 BOE NE18NZ7, IPS, 2560x1600, 18", 120 Hz | Schenker Key 18 Pro M25 RTX 5090 LQ180D1JW01, IPS, 3840x2400, 18", 200 Hz | HP ZBook X G1i 16 LG Philips LGD07B3, IPS, 2560x1600, 16", 120 Hz | HP ZBook Studio 16 G11 AUO87A8, IPS, 3840x2400, 16", 120 Hz | Lenovo ThinkPad P16s Gen 4 AMD N160JCA-GT1, , 1920x1200, 16", 60 Hz | Dell Pro Max 16 Plus Samsung 160HC01, OLED, 3840x2400, 16", 120 Hz | |
|---|---|---|---|---|---|---|
| Display | -2% | 5% | 0% | -19% | 1% | |
| Display P3 Coverage (%) | 97.7 | 90.5 -7% | 97.2 -1% | 97.7 0% | 65.8 -33% | 97.3 0% |
| sRGB Coverage (%) | 99.9 | 100 0% | 100 0% | 99.9 0% | 96.8 -3% | 100 0% |
| AdobeRGB 1998 Coverage (%) | 85.9 | 87.4 2% | 99.9 16% | 85.7 0% | 67.8 -21% | 88.8 3% |
| Response Times | 86% | -2% | 64% | 98% | ||
| Response Time Grey 50% / Grey 80% * (ms) | 39.9 ? | 5.2 ? 87% | 45.5 ? -14% | 14.2 ? 64% | 0.63 ? 98% | |
| Response Time Black / White * (ms) | 29.4 ? | 4.3 ? 85% | 26.1 ? 11% | 10.6 ? 64% | 0.89 ? 97% | |
| PWM Frequency (Hz) | 26536 ? | 479.9 ? | ||||
| PWM Amplitude * (%) | 47 | 28 | ||||
| Screen | -34% | -46% | -33% | -36% | 4% | |
| Brightness middle (cd/m²) | 528.8 | 529 0% | 461.8 -13% | 404.3 -24% | 540 2% | 530.9 0% |
| Brightness (cd/m²) | 515 | 513 0% | 427 -17% | 405 -21% | 516 0% | 540 5% |
| Brightness Distribution (%) | 91 | 95 4% | 88 -3% | 92 1% | 93 2% | 95 4% |
| Black Level * (cd/m²) | 0.22 | 0.31 -41% | 0.46 -109% | 0.28 -27% | 0.37 -68% | |
| Contrast (:1) | 2404 | 1706 -29% | 1004 -58% | 1444 -40% | 1459 -39% | |
| Colorchecker dE 2000 * | 2.76 | 2.7 2% | 4.08 -48% | 2.63 5% | 3.4 -23% | 2.42 12% |
| Colorchecker dE 2000 max. * | 5.38 | 7.8 -45% | 8.1 -51% | 4.48 17% | 5.6 -4% | 5.76 -7% |
| Colorchecker dE 2000 calibrated * | 0.47 | 0.8 -70% | 0.75 -60% | 1.46 -211% | 0.9 -91% | 0.7 -49% |
| Greyscale dE 2000 * | 2.2 | 4.9 -123% | 3.5 -59% | 2.1 5% | 4.5 -105% | 0.8 64% |
| Gamma | 2.14 103% | 2.23 99% | 2.15 102% | 2.3 96% | 2.51 88% | 2.23 99% |
| CCT | 2584 252% | 6997 93% | 6715 97% | 6810 95% | 6294 103% | 6488 100% |
| Media totale (Programma / Settaggio) | 17% /
-10% | -14% /
-29% | 10% /
-12% | -28% /
-32% | 34% /
19% |
* ... Meglio usare valori piccoli
Tempi di risposta del Display
| ↔ Tempi di risposta dal Nero al Bianco | ||
|---|---|---|
| 29.4 ms ... aumenta ↗ e diminuisce ↘ combinato | ↗ 13.9 ms Incremento |  |
| ↘ 15.5 ms Calo | ||
| Lo schermo mostra tempi di risposta relativamente lenti nei nostri tests e potrebbe essere troppo lento per i gamers. In confronto, tutti i dispositivi di test variano da 0.1 (minimo) a 240 (massimo) ms. » 78 % di tutti i dispositivi è migliore. Questo significa che i tempi di risposta rilevati sono peggiori rispetto alla media di tutti i dispositivi testati (20.3 ms). | ||
| ↔ Tempo di risposta dal 50% Grigio all'80% Grigio | ||
| 39.9 ms ... aumenta ↗ e diminuisce ↘ combinato | ↗ 17.7 ms Incremento | 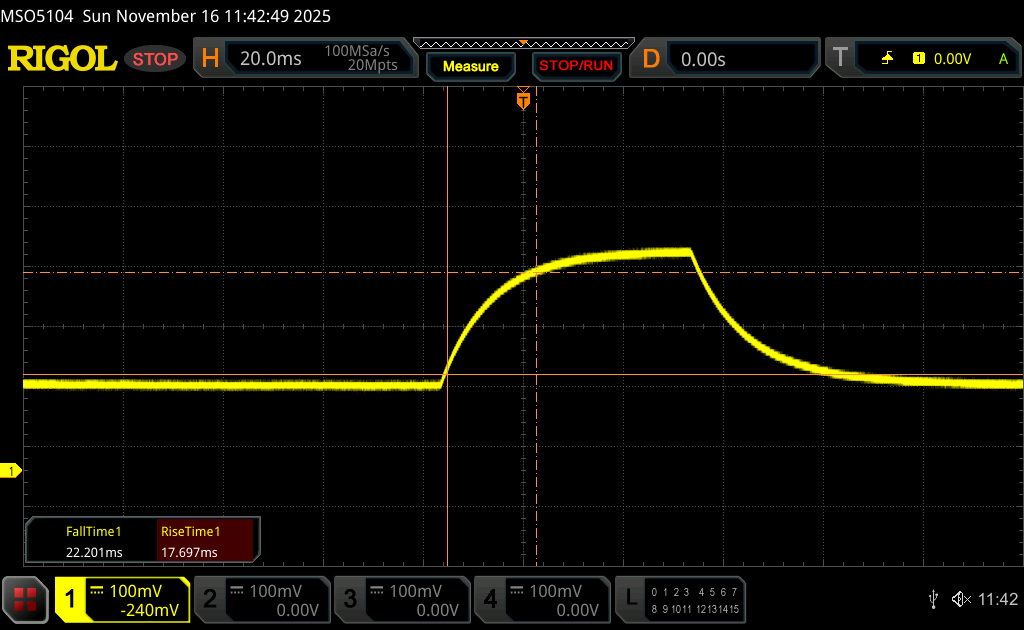 |
| ↘ 22.2 ms Calo | ||
| Lo schermo mostra tempi di risposta lenti nei nostri tests e sarà insoddisfacente per i gamers. In confronto, tutti i dispositivi di test variano da 0.165 (minimo) a 636 (massimo) ms. » 60 % di tutti i dispositivi è migliore. Questo significa che i tempi di risposta rilevati sono peggiori rispetto alla media di tutti i dispositivi testati (31.7 ms). | ||
Sfarfallio dello schermo / PWM (Pulse-Width Modulation)
| flickering dello schermo / PWM non rilevato |  | ||
In confronto: 53 % di tutti i dispositivi testati non utilizza PWM per ridurre la luminosita' del display. Se è rilevato PWM, una media di 8152 (minimo: 5 - massimo: 343500) Hz è stata rilevata. | |||

Prestazioni
Condizioni del test
Abbiamo impostato Dell Optimizer e Nvidia Control Panel sulla modalità Performance e sulla modalità grafica discreta, rispettivamente, prima di eseguire i benchmark qui sotto. Optimus avanzato è supportato per passare dalla modalità iGPU a quella dGPU senza riavviare.
Processore
Le prestazioni della CPU sono eccellenti ma imperfette. Quando si esegue CineBench R15 xT in loop, ad esempio, il nostro Core Ultra 9 285HX iniziale si riduceva di circa il 15% nel tempo, come mostra il grafico sottostante, a causa della sostenibilità limitata del Turbo Boost.
Cinebench R15 Multi Loop
Cinebench R23: Multi Core | Single Core
Cinebench R20: CPU (Multi Core) | CPU (Single Core)
Cinebench R15: CPU Multi 64Bit | CPU Single 64Bit
Blender: v2.79 BMW27 CPU
7-Zip 18.03: 7z b 4 | 7z b 4 -mmt1
Geekbench 6.5: Multi-Core | Single-Core
Geekbench 5.5: Multi-Core | Single-Core
HWBOT x265 Benchmark v2.2: 4k Preset
LibreOffice : 20 Documents To PDF
R Benchmark 2.5: Overall mean
| CPU Performance rating | |
| Dell Pro Max 18 Plus MB18250 | |
| Media Intel Core Ultra 9 285HX | |
| Dell Pro Max 16 Plus | |
| Schenker Key 18 Pro M25 RTX 5090 | |
| HP ZBook Fury 16 G10 | |
| Lenovo ThinkPad P16 Gen 2 | |
| HP ZBook X G1i 16 | |
| Lenovo ThinkPad P16s Gen 4 AMD | |
| HP ZBook Studio 16 G11 | |
| Dell Precision 7000 7670 Performance -2! | |
| Cinebench R23 / Multi Core | |
| Dell Pro Max 18 Plus MB18250 | |
| Media Intel Core Ultra 9 285HX (35165 - 40117, n=3) | |
| Schenker Key 18 Pro M25 RTX 5090 | |
| Dell Pro Max 16 Plus | |
| Lenovo ThinkPad P16 Gen 2 | |
| HP ZBook Fury 16 G10 | |
| HP ZBook X G1i 16 | |
| Lenovo ThinkPad P16s Gen 4 AMD | |
| HP ZBook Studio 16 G11 | |
| Dell Precision 7000 7670 Performance | |
| Cinebench R23 / Single Core | |
| Schenker Key 18 Pro M25 RTX 5090 | |
| Media Intel Core Ultra 9 285HX (2057 - 2185, n=3) | |
| Dell Pro Max 18 Plus MB18250 | |
| HP ZBook Fury 16 G10 | |
| Lenovo ThinkPad P16 Gen 2 | |
| Dell Pro Max 16 Plus | |
| HP ZBook X G1i 16 | |
| Lenovo ThinkPad P16s Gen 4 AMD | |
| HP ZBook Studio 16 G11 | |
| Dell Precision 7000 7670 Performance | |
| Cinebench R20 / CPU (Multi Core) | |
| Dell Pro Max 18 Plus MB18250 | |
| Media Intel Core Ultra 9 285HX (13758 - 15751, n=3) | |
| Schenker Key 18 Pro M25 RTX 5090 | |
| Dell Pro Max 16 Plus | |
| Lenovo ThinkPad P16 Gen 2 | |
| HP ZBook Fury 16 G10 | |
| HP ZBook X G1i 16 | |
| Lenovo ThinkPad P16s Gen 4 AMD | |
| HP ZBook Studio 16 G11 | |
| Dell Precision 7000 7670 Performance | |
| Cinebench R20 / CPU (Single Core) | |
| Schenker Key 18 Pro M25 RTX 5090 | |
| Dell Pro Max 18 Plus MB18250 | |
| Media Intel Core Ultra 9 285HX (799 - 841, n=3) | |
| HP ZBook Fury 16 G10 | |
| Dell Pro Max 16 Plus | |
| Lenovo ThinkPad P16s Gen 4 AMD | |
| Lenovo ThinkPad P16 Gen 2 | |
| HP ZBook X G1i 16 | |
| Dell Precision 7000 7670 Performance | |
| HP ZBook Studio 16 G11 | |
| Cinebench R15 / CPU Multi 64Bit | |
| Media Intel Core Ultra 9 285HX (5427 - 6232, n=3) | |
| Dell Pro Max 18 Plus MB18250 | |
| Schenker Key 18 Pro M25 RTX 5090 | |
| Dell Pro Max 16 Plus | |
| Lenovo ThinkPad P16 Gen 2 | |
| HP ZBook Fury 16 G10 | |
| HP ZBook X G1i 16 | |
| Lenovo ThinkPad P16s Gen 4 AMD | |
| HP ZBook Studio 16 G11 | |
| Dell Precision 7000 7670 Performance | |
| Cinebench R15 / CPU Single 64Bit | |
| Schenker Key 18 Pro M25 RTX 5090 | |
| Dell Pro Max 18 Plus MB18250 | |
| Media Intel Core Ultra 9 285HX (307 - 324, n=3) | |
| Lenovo ThinkPad P16s Gen 4 AMD | |
| Dell Pro Max 16 Plus | |
| HP ZBook X G1i 16 | |
| HP ZBook Fury 16 G10 | |
| Lenovo ThinkPad P16 Gen 2 | |
| Dell Precision 7000 7670 Performance | |
| HP ZBook Studio 16 G11 | |
| Blender / v2.79 BMW27 CPU | |
| Dell Precision 7000 7670 Performance | |
| HP ZBook Studio 16 G11 | |
| Lenovo ThinkPad P16s Gen 4 AMD | |
| HP ZBook X G1i 16 | |
| HP ZBook Fury 16 G10 | |
| Lenovo ThinkPad P16 Gen 2 | |
| Dell Pro Max 16 Plus | |
| Dell Pro Max 18 Plus MB18250 | |
| Schenker Key 18 Pro M25 RTX 5090 | |
| Media Intel Core Ultra 9 285HX (83 - 98, n=3) | |
| 7-Zip 18.03 / 7z b 4 | |
| Media Intel Core Ultra 9 285HX (106470 - 128778, n=3) | |
| Dell Pro Max 18 Plus MB18250 | |
| Dell Pro Max 16 Plus | |
| Schenker Key 18 Pro M25 RTX 5090 | |
| HP ZBook Fury 16 G10 | |
| Lenovo ThinkPad P16 Gen 2 | |
| HP ZBook Studio 16 G11 | |
| Lenovo ThinkPad P16s Gen 4 AMD | |
| HP ZBook X G1i 16 | |
| Dell Precision 7000 7670 Performance | |
| 7-Zip 18.03 / 7z b 4 -mmt1 | |
| Lenovo ThinkPad P16 Gen 2 | |
| Media Intel Core Ultra 9 285HX (6665 - 6822, n=3) | |
| Dell Pro Max 18 Plus MB18250 | |
| HP ZBook Fury 16 G10 | |
| Dell Pro Max 16 Plus | |
| Lenovo ThinkPad P16s Gen 4 AMD | |
| HP ZBook X G1i 16 | |
| Schenker Key 18 Pro M25 RTX 5090 | |
| Dell Precision 7000 7670 Performance | |
| HP ZBook Studio 16 G11 | |
| Geekbench 6.5 / Multi-Core | |
| Media Intel Core Ultra 9 285HX (20630 - 22104, n=3) | |
| Dell Pro Max 18 Plus MB18250 | |
| Dell Pro Max 16 Plus | |
| HP ZBook X G1i 16 | |
| Schenker Key 18 Pro M25 RTX 5090 | |
| Lenovo ThinkPad P16 Gen 2 | |
| HP ZBook Fury 16 G10 | |
| Lenovo ThinkPad P16s Gen 4 AMD | |
| HP ZBook Studio 16 G11 | |
| Geekbench 6.5 / Single-Core | |
| Dell Pro Max 18 Plus MB18250 | |
| Media Intel Core Ultra 9 285HX (2907 - 3088, n=3) | |
| HP ZBook Fury 16 G10 | |
| Lenovo ThinkPad P16s Gen 4 AMD | |
| HP ZBook X G1i 16 | |
| Dell Pro Max 16 Plus | |
| Lenovo ThinkPad P16 Gen 2 | |
| Schenker Key 18 Pro M25 RTX 5090 | |
| HP ZBook Studio 16 G11 | |
| Geekbench 5.5 / Multi-Core | |
| Media Intel Core Ultra 9 285HX (24910 - 27010, n=3) | |
| Dell Pro Max 18 Plus MB18250 | |
| Dell Pro Max 16 Plus | |
| Schenker Key 18 Pro M25 RTX 5090 | |
| Lenovo ThinkPad P16 Gen 2 | |
| HP ZBook Fury 16 G10 | |
| HP ZBook X G1i 16 | |
| Lenovo ThinkPad P16s Gen 4 AMD | |
| Dell Precision 7000 7670 Performance | |
| HP ZBook Studio 16 G11 | |
| Geekbench 5.5 / Single-Core | |
| Dell Pro Max 18 Plus MB18250 | |
| Media Intel Core Ultra 9 285HX (2121 - 2232, n=3) | |
| Lenovo ThinkPad P16s Gen 4 AMD | |
| Dell Pro Max 16 Plus | |
| HP ZBook Fury 16 G10 | |
| Schenker Key 18 Pro M25 RTX 5090 | |
| HP ZBook X G1i 16 | |
| Lenovo ThinkPad P16 Gen 2 | |
| Dell Precision 7000 7670 Performance | |
| HP ZBook Studio 16 G11 | |
| HWBOT x265 Benchmark v2.2 / 4k Preset | |
| Dell Pro Max 18 Plus MB18250 | |
| Media Intel Core Ultra 9 285HX (36.5 - 44.3, n=3) | |
| Schenker Key 18 Pro M25 RTX 5090 | |
| Dell Pro Max 16 Plus | |
| HP ZBook Fury 16 G10 | |
| HP ZBook X G1i 16 | |
| Lenovo ThinkPad P16 Gen 2 | |
| Lenovo ThinkPad P16s Gen 4 AMD | |
| HP ZBook Studio 16 G11 | |
| Dell Precision 7000 7670 Performance | |
| LibreOffice / 20 Documents To PDF | |
| Lenovo ThinkPad P16s Gen 4 AMD | |
| Lenovo ThinkPad P16 Gen 2 | |
| HP ZBook Studio 16 G11 | |
| Dell Precision 7000 7670 Performance | |
| HP ZBook Fury 16 G10 | |
| Dell Pro Max 16 Plus | |
| Media Intel Core Ultra 9 285HX (38.3 - 47.4, n=3) | |
| HP ZBook X G1i 16 | |
| Dell Pro Max 18 Plus MB18250 | |
| Schenker Key 18 Pro M25 RTX 5090 | |
| R Benchmark 2.5 / Overall mean | |
| Lenovo ThinkPad P16s Gen 4 AMD | |
| HP ZBook Studio 16 G11 | |
| Dell Precision 7000 7670 Performance | |
| Schenker Key 18 Pro M25 RTX 5090 | |
| Dell Pro Max 16 Plus | |
| HP ZBook X G1i 16 | |
| Media Intel Core Ultra 9 285HX (0.4012 - 0.4298, n=3) | |
| Dell Pro Max 18 Plus MB18250 | |
| Lenovo ThinkPad P16 Gen 2 | |
| HP ZBook Fury 16 G10 | |
* ... Meglio usare valori piccoli
AIDA64: FP32 Ray-Trace | FPU Julia | CPU SHA3 | CPU Queen | FPU SinJulia | FPU Mandel | CPU AES | CPU ZLib | FP64 Ray-Trace | CPU PhotoWorxx
| Performance rating | |
| Media Intel Core Ultra 9 285HX | |
| Dell Pro Max 18 Plus MB18250 | |
| Schenker Key 18 Pro M25 RTX 5090 | |
| Dell Pro Max 16 Plus | |
| Lenovo ThinkPad P16s Gen 4 AMD | |
| HP ZBook Studio 16 G11 | |
| AIDA64 / FP32 Ray-Trace | |
| Schenker Key 18 Pro M25 RTX 5090 | |
| Media Intel Core Ultra 9 285HX (31893 - 42341, n=3) | |
| Dell Pro Max 18 Plus MB18250 | |
| Dell Pro Max 16 Plus | |
| Lenovo ThinkPad P16s Gen 4 AMD | |
| HP ZBook Studio 16 G11 | |
| AIDA64 / FPU Julia | |
| Schenker Key 18 Pro M25 RTX 5090 | |
| Media Intel Core Ultra 9 285HX (161276 - 210885, n=3) | |
| Dell Pro Max 18 Plus MB18250 | |
| Dell Pro Max 16 Plus | |
| Lenovo ThinkPad P16s Gen 4 AMD | |
| HP ZBook Studio 16 G11 | |
| AIDA64 / CPU SHA3 | |
| Media Intel Core Ultra 9 285HX (7921 - 9815, n=3) | |
| Schenker Key 18 Pro M25 RTX 5090 | |
| Dell Pro Max 18 Plus MB18250 | |
| Dell Pro Max 16 Plus | |
| Lenovo ThinkPad P16s Gen 4 AMD | |
| HP ZBook Studio 16 G11 | |
| AIDA64 / CPU Queen | |
| Media Intel Core Ultra 9 285HX (135057 - 141681, n=3) | |
| Dell Pro Max 18 Plus MB18250 | |
| Dell Pro Max 16 Plus | |
| Schenker Key 18 Pro M25 RTX 5090 | |
| Lenovo ThinkPad P16s Gen 4 AMD | |
| HP ZBook Studio 16 G11 | |
| AIDA64 / FPU SinJulia | |
| Lenovo ThinkPad P16s Gen 4 AMD | |
| Media Intel Core Ultra 9 285HX (13080 - 14431, n=3) | |
| Schenker Key 18 Pro M25 RTX 5090 | |
| Dell Pro Max 18 Plus MB18250 | |
| Dell Pro Max 16 Plus | |
| HP ZBook Studio 16 G11 | |
| AIDA64 / FPU Mandel | |
| Schenker Key 18 Pro M25 RTX 5090 | |
| Media Intel Core Ultra 9 285HX (84053 - 108922, n=3) | |
| Dell Pro Max 18 Plus MB18250 | |
| Dell Pro Max 16 Plus | |
| Lenovo ThinkPad P16s Gen 4 AMD | |
| HP ZBook Studio 16 G11 | |
| AIDA64 / CPU AES | |
| Schenker Key 18 Pro M25 RTX 5090 | |
| Media Intel Core Ultra 9 285HX (119553 - 134195, n=3) | |
| Dell Pro Max 18 Plus MB18250 | |
| Dell Pro Max 16 Plus | |
| Lenovo ThinkPad P16s Gen 4 AMD | |
| HP ZBook Studio 16 G11 | |
| AIDA64 / CPU ZLib | |
| Dell Pro Max 18 Plus MB18250 | |
| Media Intel Core Ultra 9 285HX (1886 - 2267, n=3) | |
| Schenker Key 18 Pro M25 RTX 5090 | |
| Dell Pro Max 16 Plus | |
| Lenovo ThinkPad P16s Gen 4 AMD | |
| HP ZBook Studio 16 G11 | |
| AIDA64 / FP64 Ray-Trace | |
| Schenker Key 18 Pro M25 RTX 5090 | |
| Media Intel Core Ultra 9 285HX (17357 - 22312, n=3) | |
| Dell Pro Max 18 Plus MB18250 | |
| Dell Pro Max 16 Plus | |
| Lenovo ThinkPad P16s Gen 4 AMD | |
| HP ZBook Studio 16 G11 | |
| AIDA64 / CPU PhotoWorxx | |
| Dell Pro Max 16 Plus | |
| Media Intel Core Ultra 9 285HX (62274 - 62611, n=3) | |
| Dell Pro Max 18 Plus MB18250 | |
| HP ZBook Studio 16 G11 | |
| Lenovo ThinkPad P16s Gen 4 AMD | |
| Schenker Key 18 Pro M25 RTX 5090 | |
Test da sforzo
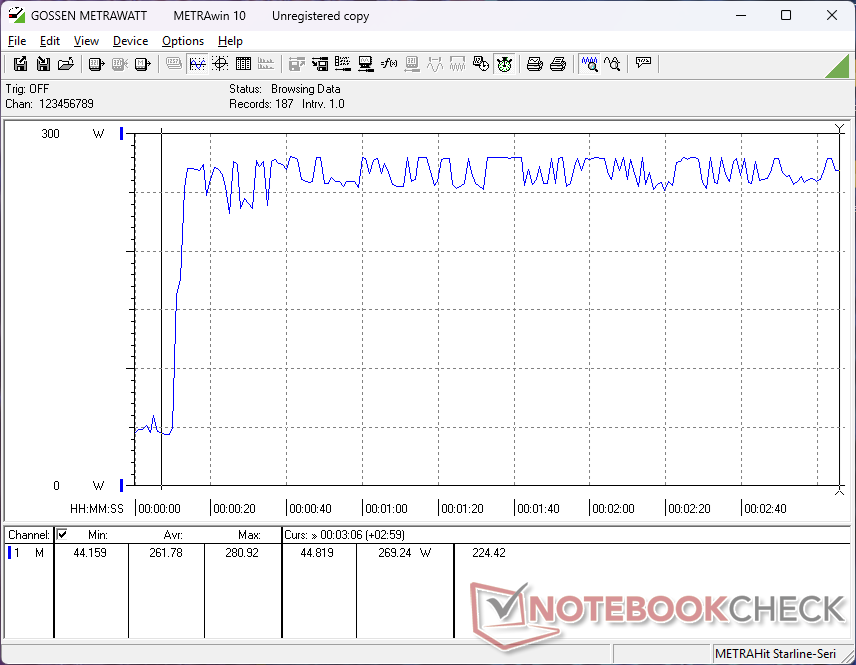
Durante l'esecuzione dello stress Prime95, la CPU saliva a 4 GHz, 160 W e poco più di 100 C (!) prima di scendere e stabilizzarsi a 3,2 GHz, 99 W e 98 C. Il Turbo Boost di breve durata integra le nostre osservazioni sul loop CineBench R15 xT menzionate sopra.
Le temperature della CPU rimanevano molto calde a ~100 C quando si eseguivano altri carichi impegnativi come i giochi, rispetto ai soli 77 C del modello precedente Prestazioni di Dell Precision 7670.
Si noti che l'assorbimento di potenza della scheda GPU e le velocità di clock si riducono leggermente quando si esegue in modalità Bilanciata invece che in modalità Performance, come mostrano gli screenshot qui sotto.
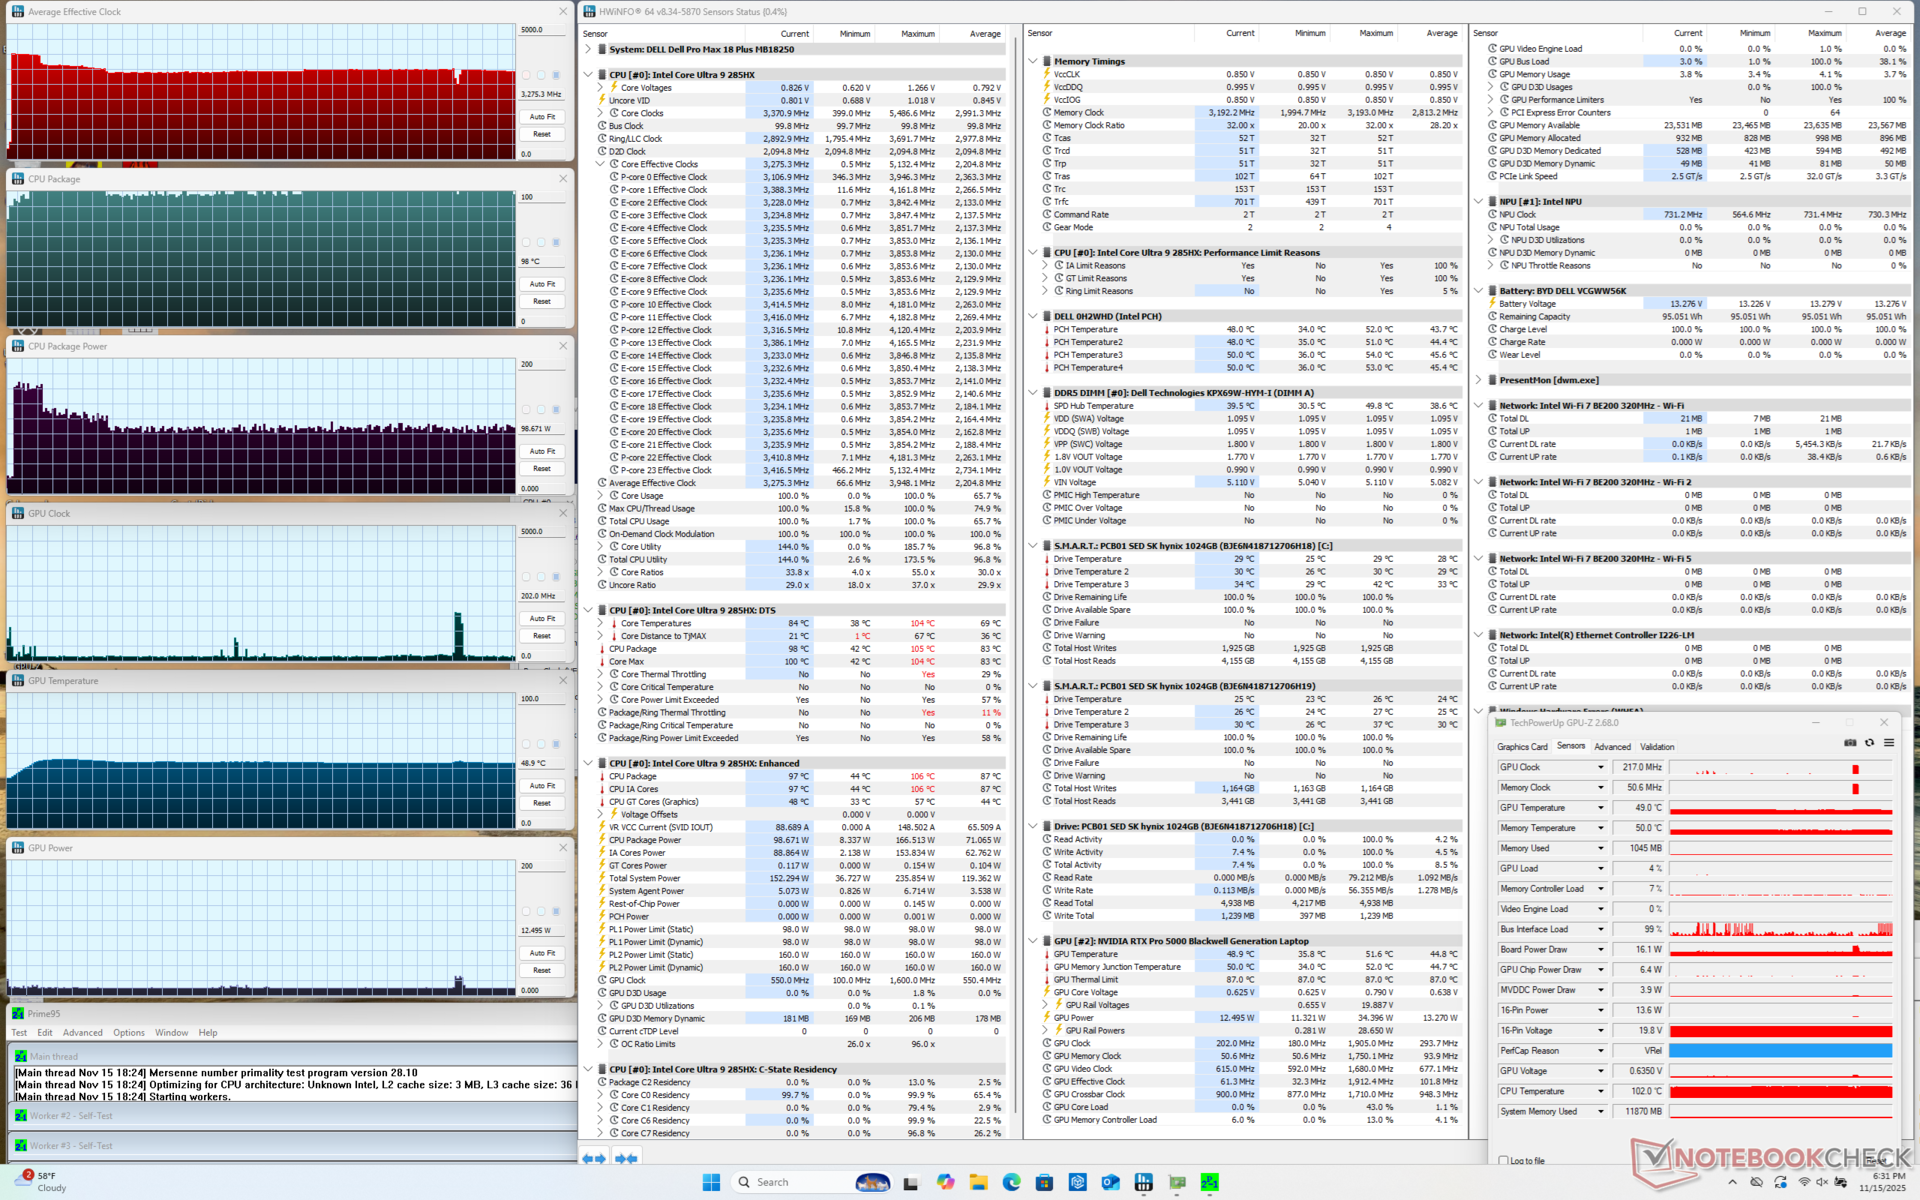
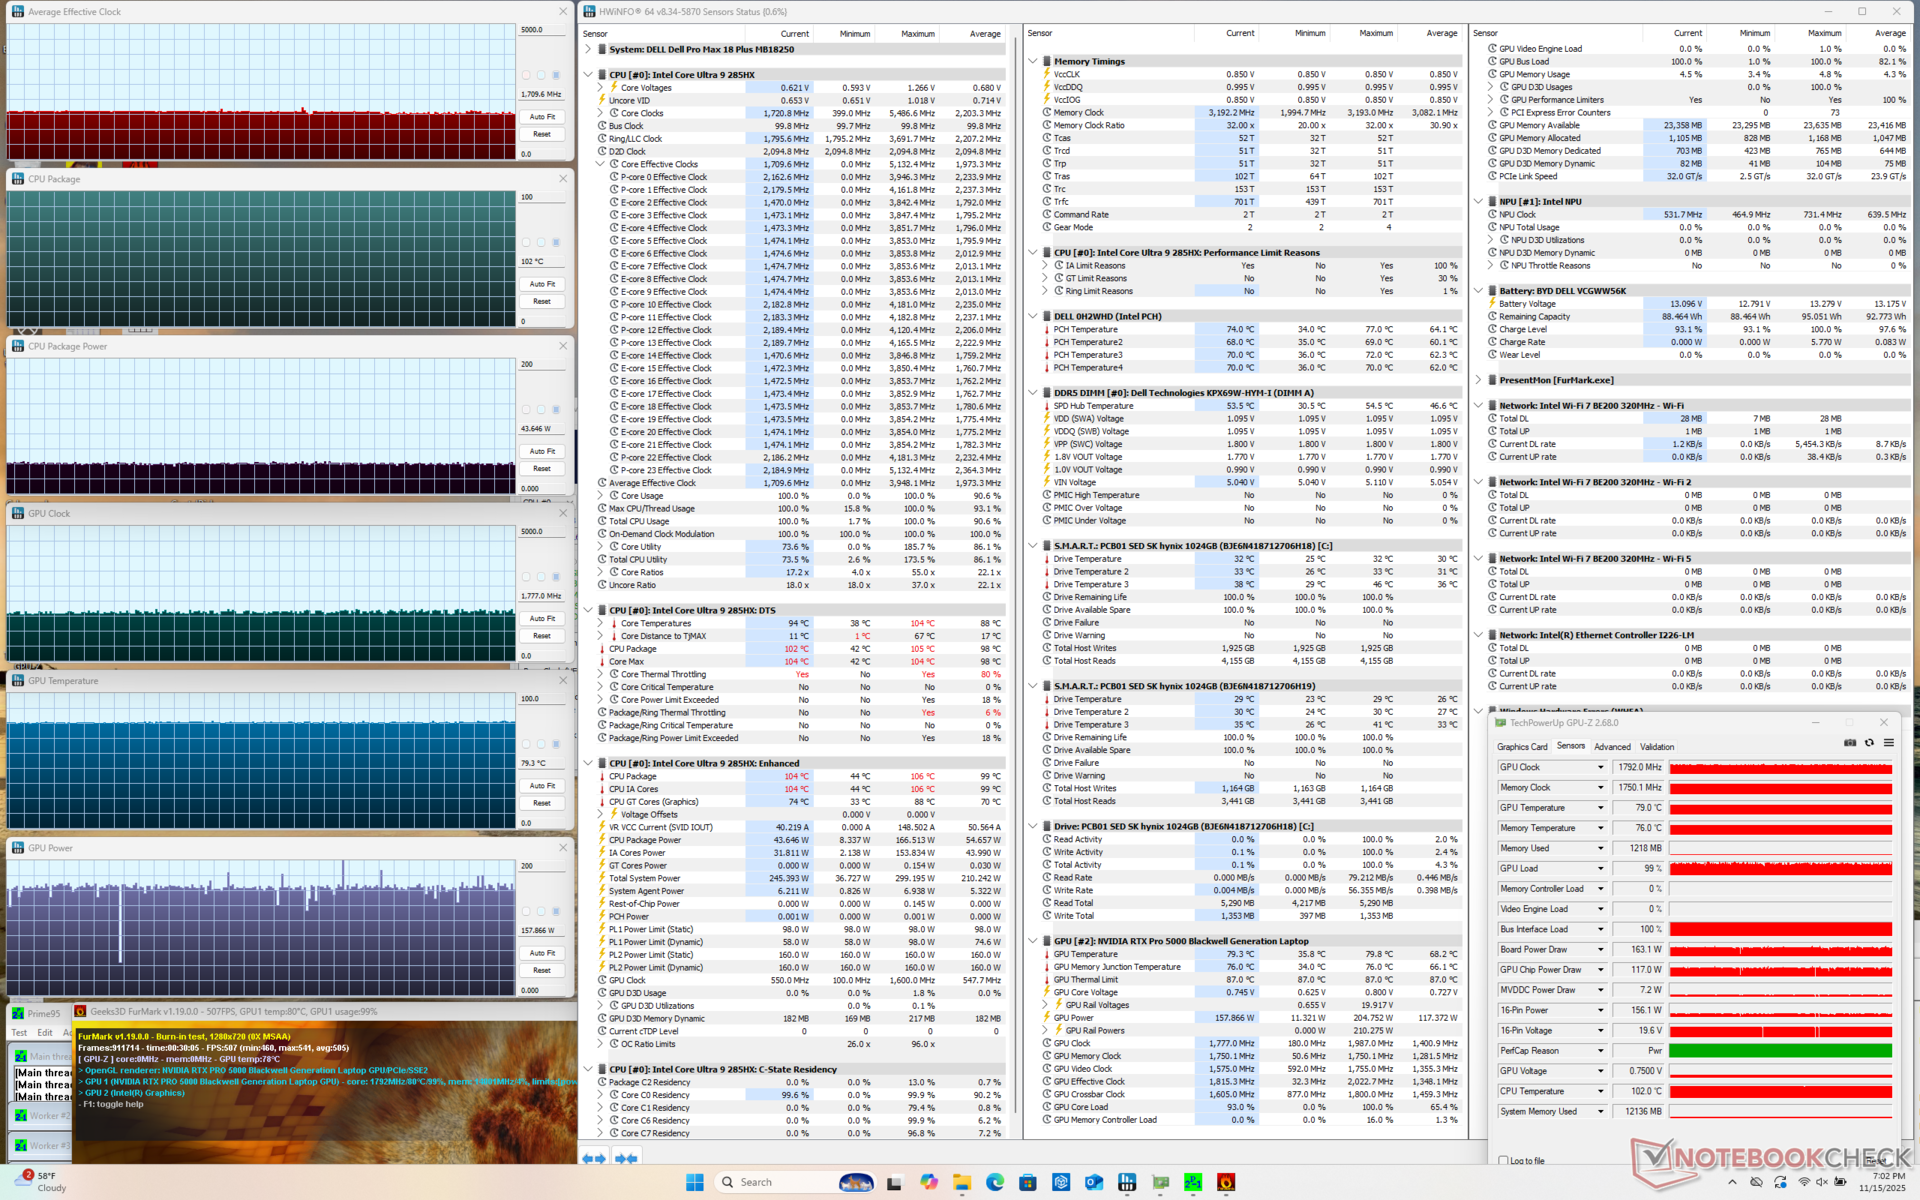
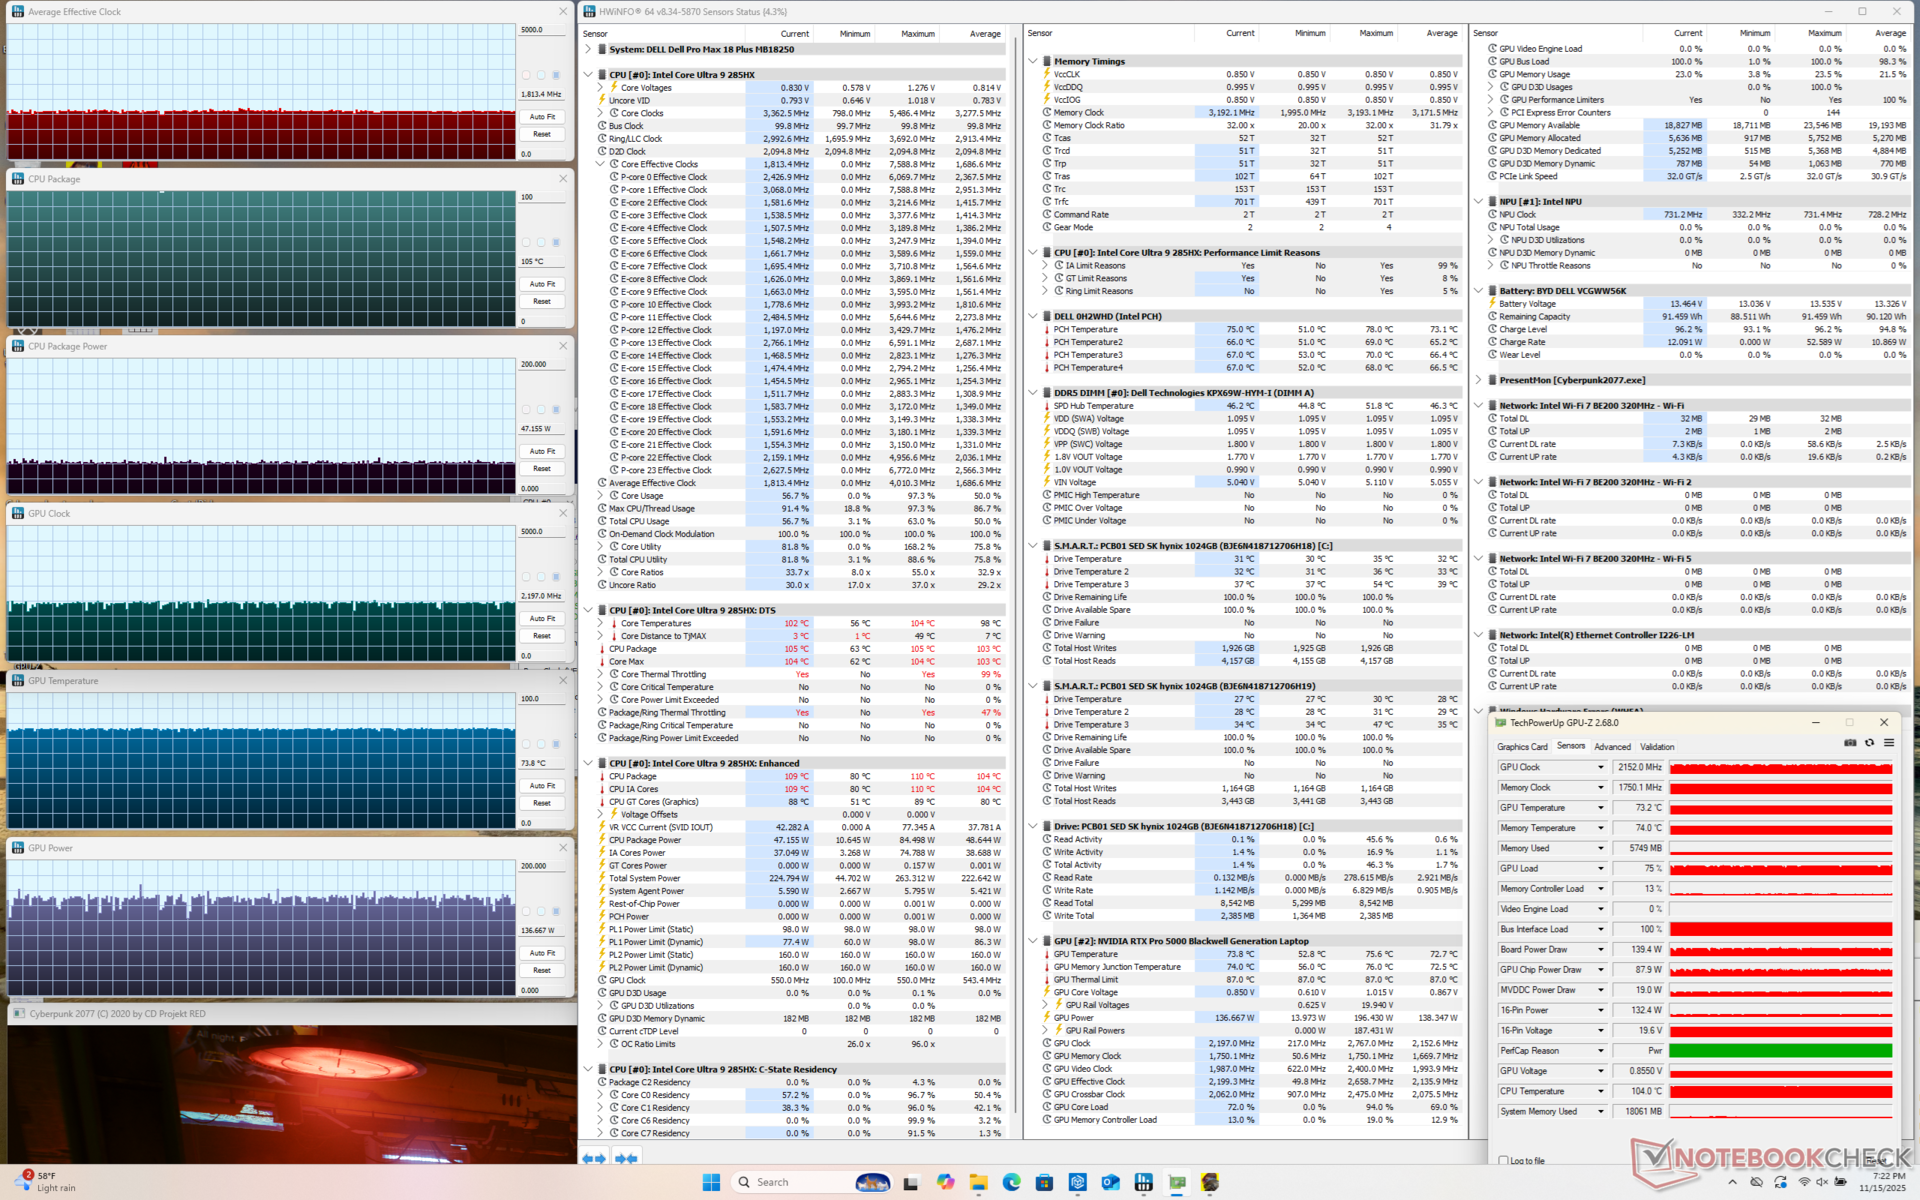
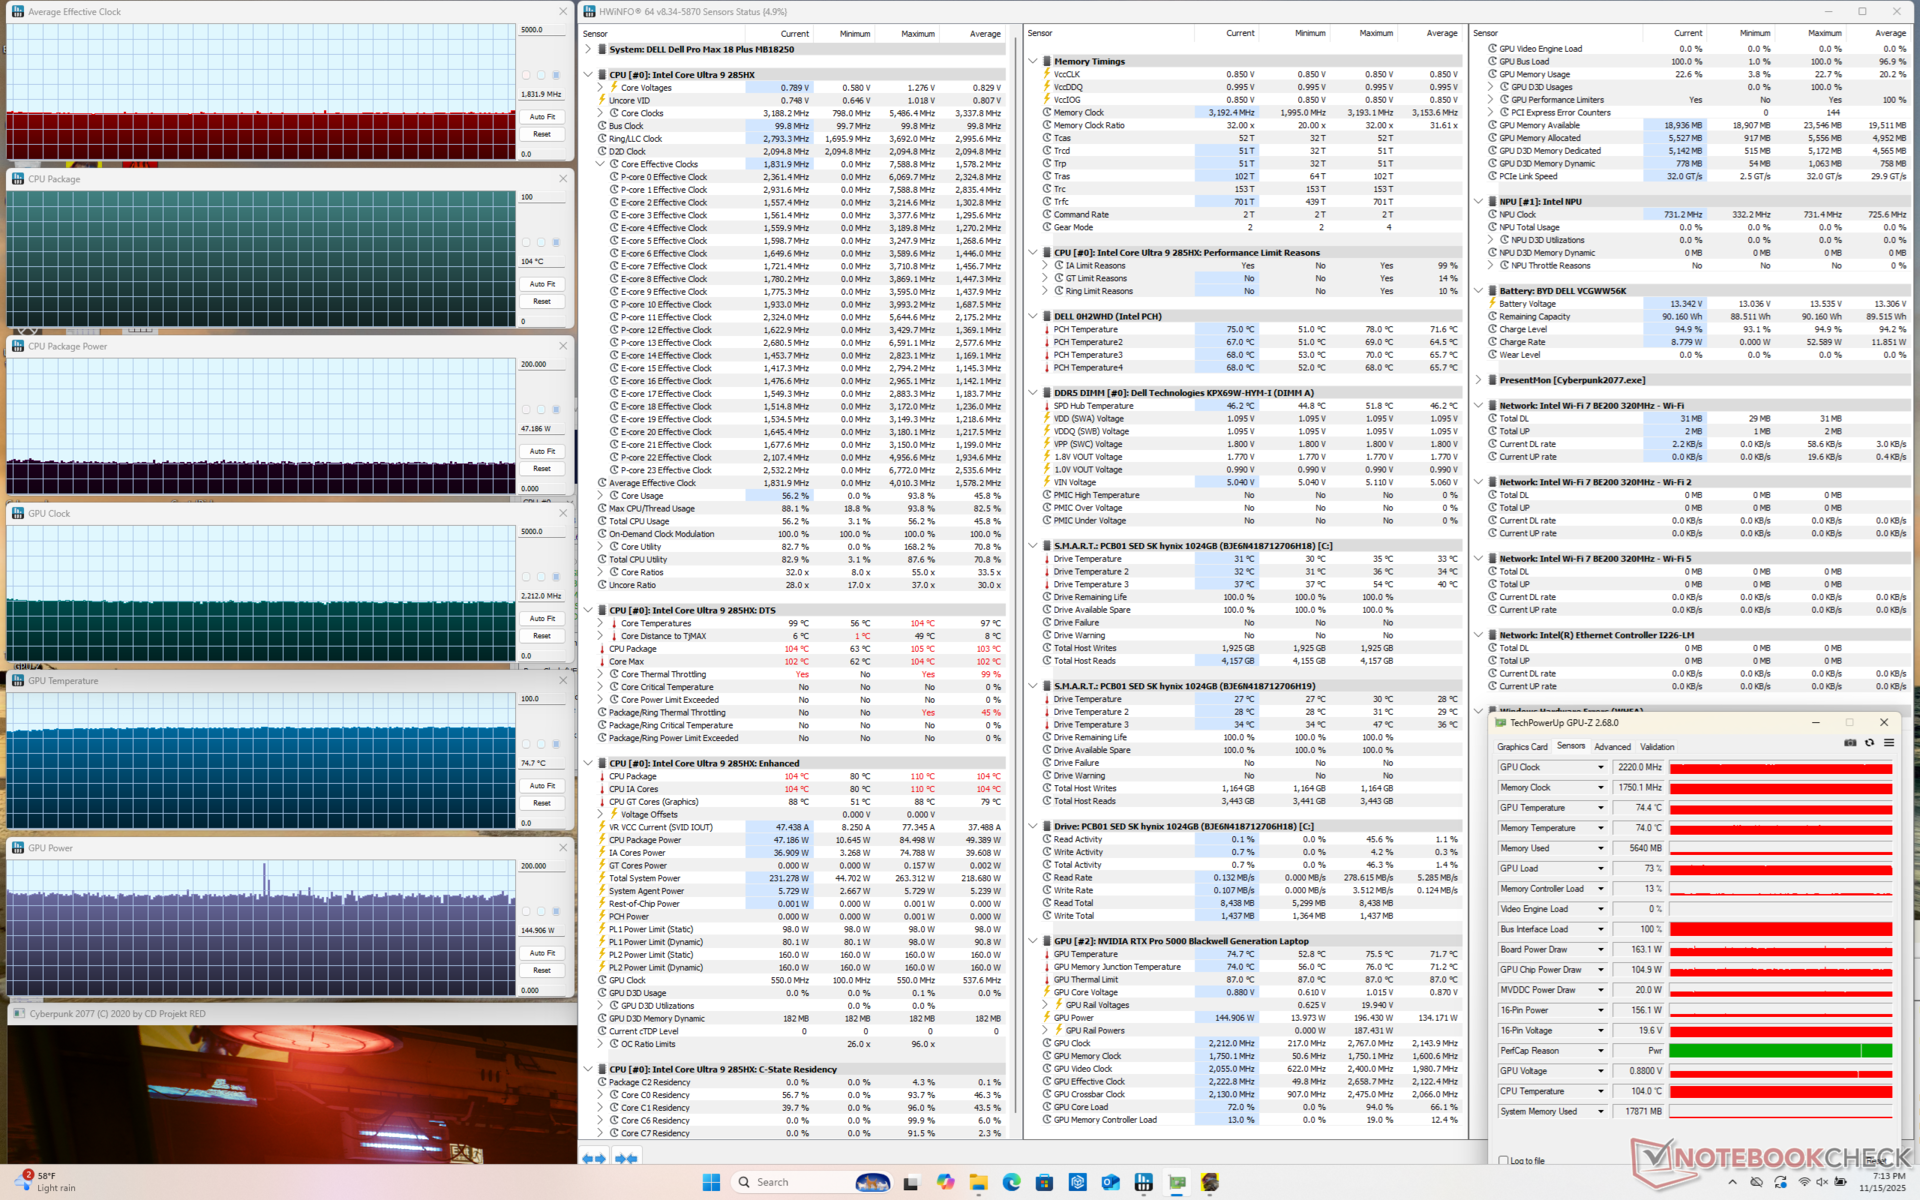
| Clock medio della CPU (GHz) | Clock della GPU (MHz) | Temperatura media della CPU (°C) | Temperatura media della GPU (°C) | |
| Sistema inattivo | -- | 225 | 43 | 36 |
| Stress Prime95 | 3,3 | -- | 99 | 49 |
| Prime95 + FurMark Stress | 1,7 | 1777 | 102 | 79 |
| Cyberpunk 2077 Stress (modalità Bilanciata) | 1,8 | 2197 | 105 | 74 |
| Cyberpunk 2077 Stress (modalità Performance) | 1,8 | 2212 | 104 | 75 |
Prestazioni del sistema
PCMark 10 non è riuscito a completarsi indipendentemente dalle impostazioni della GPU e quindi i suoi punteggi non sono elencati di seguito.
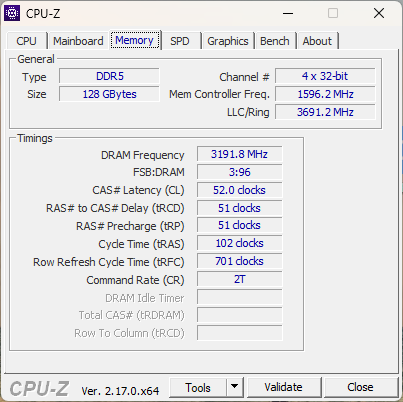
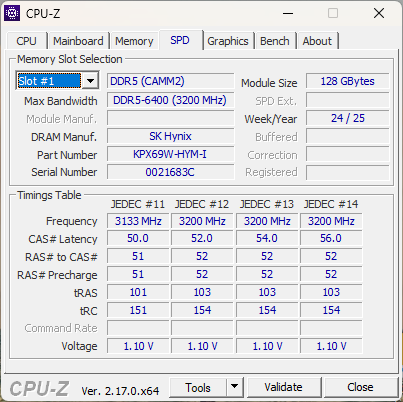
I punteggi della memoria AIDA64 sono molto alti, soprattutto per un portatile con 128 GB di RAM, grazie al fattore di forma CAMM2. Il nuovo standard è stato progettato per superare molte delle limitazioni del vecchio connettore SODIMM.
CrossMark: Overall | Productivity | Creativity | Responsiveness
WebXPRT 3: Overall
WebXPRT 4: Overall
Mozilla Kraken 1.1: Total
| Performance rating | |
| Dell Pro Max 18 Plus MB18250 | |
| Media Intel Core Ultra 9 285HX, Nvidia RTX PRO 5000 Blackwell Generation Laptop | |
| Dell Pro Max 16 Plus | |
| Schenker Key 18 Pro M25 RTX 5090 | |
| HP ZBook X G1i 16 | |
| HP ZBook Studio 16 G11 | |
| Lenovo ThinkPad P16s Gen 4 AMD | |
| CrossMark / Overall | |
| Dell Pro Max 18 Plus MB18250 | |
| Media Intel Core Ultra 9 285HX, Nvidia RTX PRO 5000 Blackwell Generation Laptop (2208 - 2267, n=2) | |
| Dell Pro Max 16 Plus | |
| Schenker Key 18 Pro M25 RTX 5090 | |
| HP ZBook X G1i 16 | |
| HP ZBook Studio 16 G11 | |
| Lenovo ThinkPad P16s Gen 4 AMD | |
| CrossMark / Productivity | |
| Dell Pro Max 16 Plus | |
| Media Intel Core Ultra 9 285HX, Nvidia RTX PRO 5000 Blackwell Generation Laptop (2016 - 2020, n=2) | |
| Dell Pro Max 18 Plus MB18250 | |
| Schenker Key 18 Pro M25 RTX 5090 | |
| HP ZBook X G1i 16 | |
| HP ZBook Studio 16 G11 | |
| Lenovo ThinkPad P16s Gen 4 AMD | |
| CrossMark / Creativity | |
| Dell Pro Max 18 Plus MB18250 | |
| Media Intel Core Ultra 9 285HX, Nvidia RTX PRO 5000 Blackwell Generation Laptop (2575 - 2725, n=2) | |
| Dell Pro Max 16 Plus | |
| HP ZBook X G1i 16 | |
| Schenker Key 18 Pro M25 RTX 5090 | |
| HP ZBook Studio 16 G11 | |
| Lenovo ThinkPad P16s Gen 4 AMD | |
| CrossMark / Responsiveness | |
| Schenker Key 18 Pro M25 RTX 5090 | |
| Dell Pro Max 18 Plus MB18250 | |
| Media Intel Core Ultra 9 285HX, Nvidia RTX PRO 5000 Blackwell Generation Laptop (1819 - 1858, n=2) | |
| Dell Pro Max 16 Plus | |
| HP ZBook X G1i 16 | |
| HP ZBook Studio 16 G11 | |
| Lenovo ThinkPad P16s Gen 4 AMD | |
| WebXPRT 3 / Overall | |
| Dell Pro Max 18 Plus MB18250 | |
| Schenker Key 18 Pro M25 RTX 5090 | |
| Media Intel Core Ultra 9 285HX, Nvidia RTX PRO 5000 Blackwell Generation Laptop (327 - 343, n=2) | |
| Dell Pro Max 16 Plus | |
| HP ZBook X G1i 16 | |
| Lenovo ThinkPad P16s Gen 4 AMD | |
| HP ZBook Studio 16 G11 | |
| WebXPRT 4 / Overall | |
| Schenker Key 18 Pro M25 RTX 5090 | |
| Dell Pro Max 16 Plus | |
| Media Intel Core Ultra 9 285HX, Nvidia RTX PRO 5000 Blackwell Generation Laptop (306 - 311, n=2) | |
| Dell Pro Max 18 Plus MB18250 | |
| HP ZBook X G1i 16 | |
| HP ZBook Studio 16 G11 | |
| Lenovo ThinkPad P16s Gen 4 AMD | |
| Mozilla Kraken 1.1 / Total | |
| HP ZBook Studio 16 G11 | |
| Lenovo ThinkPad P16s Gen 4 AMD | |
| HP ZBook X G1i 16 | |
| Dell Pro Max 18 Plus MB18250 | |
| Media Intel Core Ultra 9 285HX, Nvidia RTX PRO 5000 Blackwell Generation Laptop (435 - 439, n=2) | |
| Dell Pro Max 16 Plus | |
| Schenker Key 18 Pro M25 RTX 5090 | |
* ... Meglio usare valori piccoli
| AIDA64 / Memory Copy | |
| Dell Pro Max 16 Plus | |
| Media Intel Core Ultra 9 285HX (92790 - 93933, n=3) | |
| Dell Pro Max 18 Plus MB18250 | |
| HP ZBook Studio 16 G11 | |
| Lenovo ThinkPad P16s Gen 4 AMD | |
| Schenker Key 18 Pro M25 RTX 5090 | |
| AIDA64 / Memory Read | |
| Dell Pro Max 16 Plus | |
| Media Intel Core Ultra 9 285HX (96038 - 97565, n=3) | |
| Dell Pro Max 18 Plus MB18250 | |
| Lenovo ThinkPad P16s Gen 4 AMD | |
| HP ZBook Studio 16 G11 | |
| Schenker Key 18 Pro M25 RTX 5090 | |
| AIDA64 / Memory Write | |
| Dell Pro Max 18 Plus MB18250 | |
| Dell Pro Max 16 Plus | |
| Media Intel Core Ultra 9 285HX (89392 - 89691, n=3) | |
| Lenovo ThinkPad P16s Gen 4 AMD | |
| HP ZBook Studio 16 G11 | |
| Schenker Key 18 Pro M25 RTX 5090 | |
| AIDA64 / Memory Latency | |
| Schenker Key 18 Pro M25 RTX 5090 | |
| HP ZBook Studio 16 G11 | |
| Dell Pro Max 16 Plus | |
| Dell Pro Max 18 Plus MB18250 | |
| Media Intel Core Ultra 9 285HX (104.8 - 115.1, n=3) | |
| Lenovo ThinkPad P16s Gen 4 AMD | |
* ... Meglio usare valori piccoli
Latenza DPC
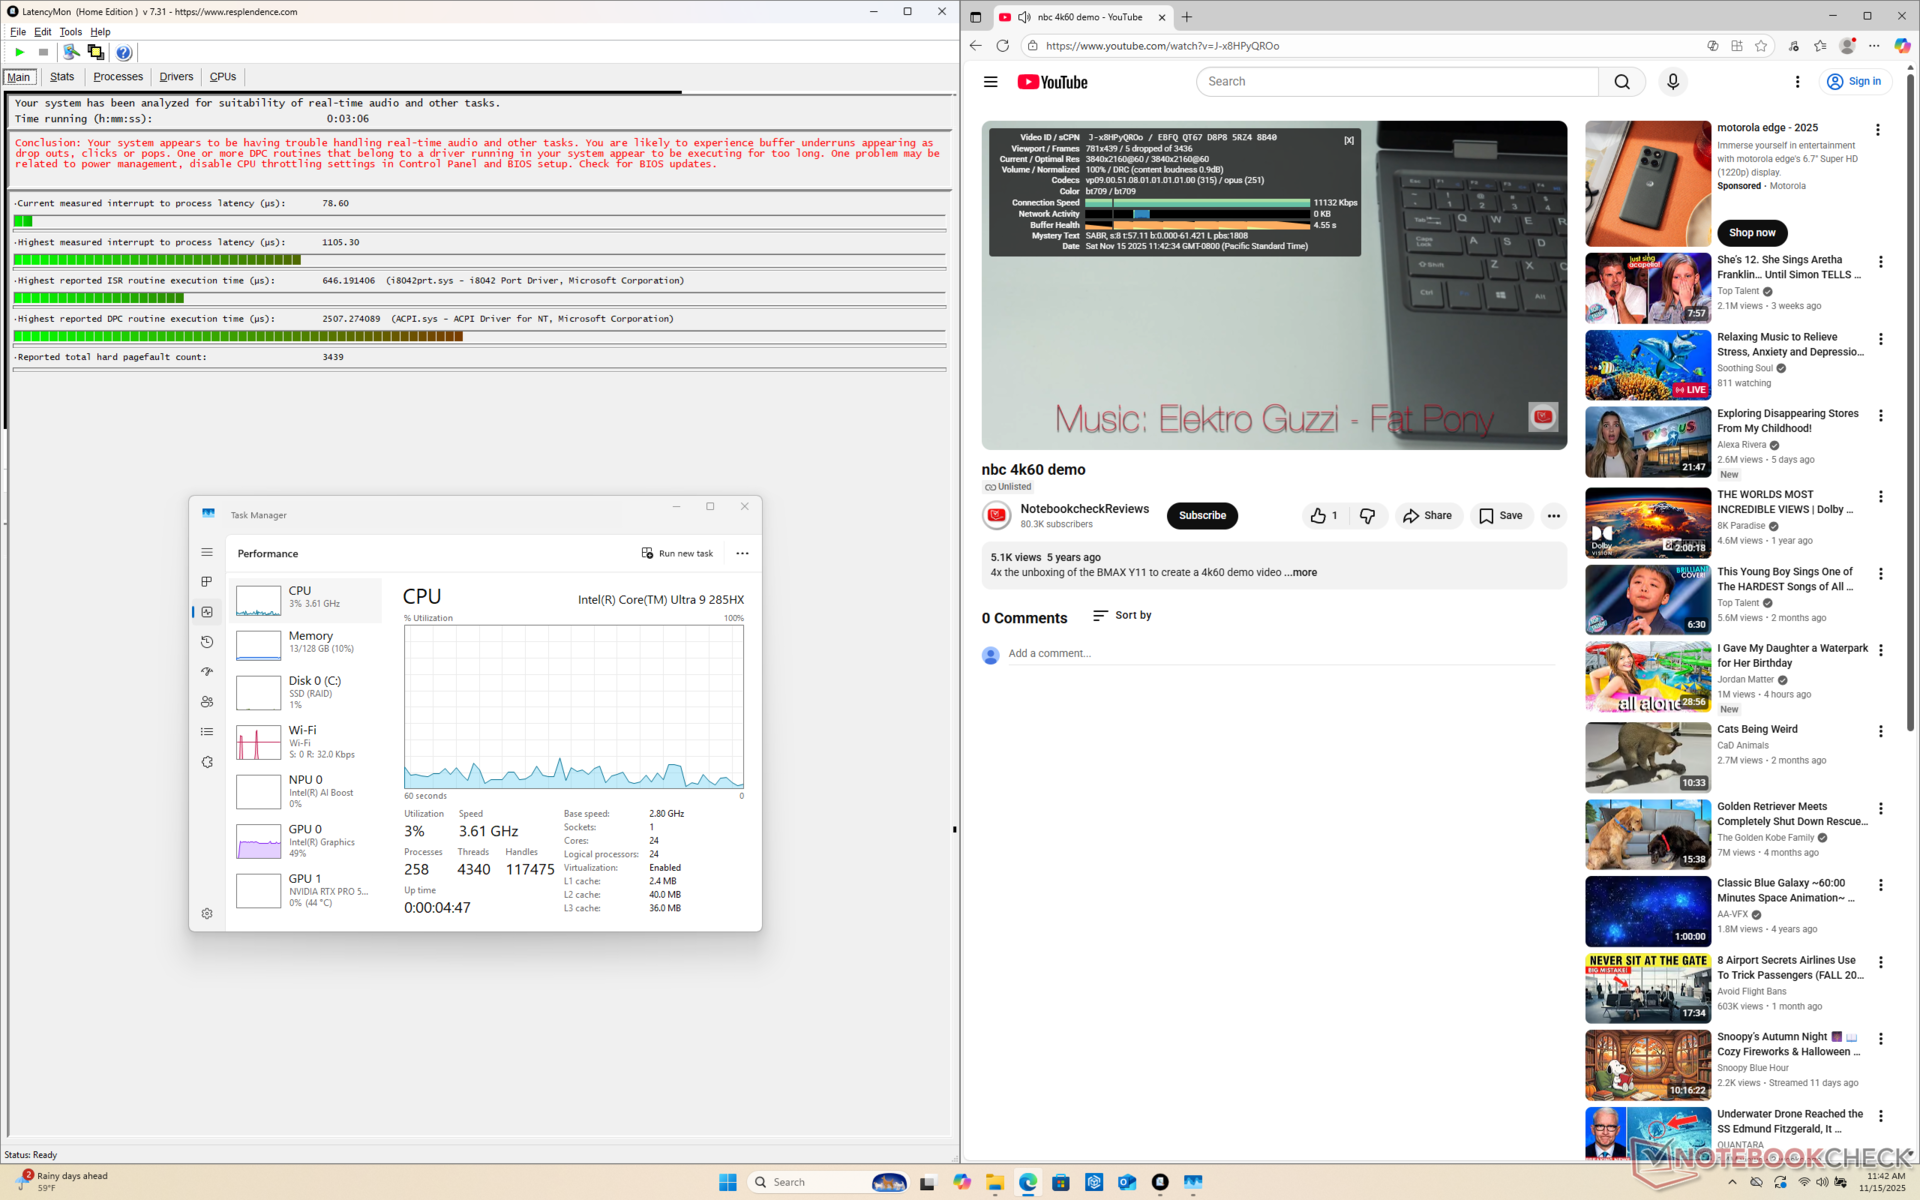

| DPC Latencies / LatencyMon - interrupt to process latency (max), Web, Youtube, Prime95 | |
| Schenker Key 18 Pro M25 RTX 5090 | |
| Dell Pro Max 16 Plus | |
| HP ZBook Studio 16 G11 | |
| Dell Pro Max 18 Plus MB18250 | |
| HP ZBook X G1i 16 | |
* ... Meglio usare valori piccoli
Dispositivi di archiviazione
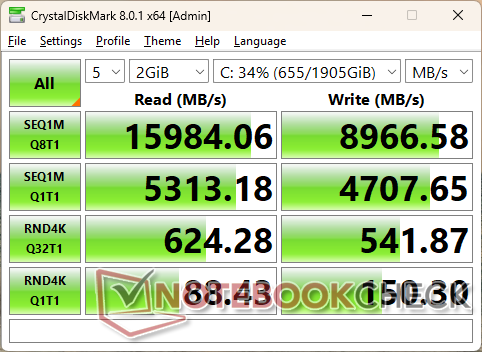
La nostra unità di prova funziona con due SK hynix PCB01 SSD PCIe5 in configurazione RAID 0. Una singola unità può raggiungere velocità di trasferimento di ~16000 MB/s, anche se solo per pochi minuti alla volta, secondo i risultati del nostro test DiskSpd loop qui sotto.
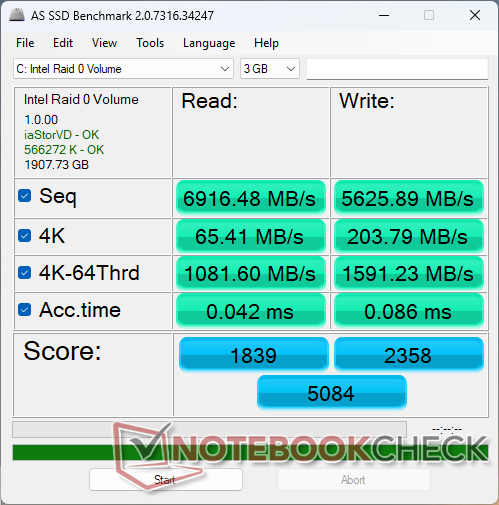

| Drive Performance rating - Percent | |
| Schenker Key 18 Pro M25 RTX 5090 | |
| HP ZBook X G1i 16 | |
| Dell Pro Max 16 Plus | |
| Dell Pro Max 18 Plus MB18250 | |
| HP ZBook Studio 16 G11 | |
| Lenovo ThinkPad P16s Gen 4 AMD -11! | |
* ... Meglio usare valori piccoli
Strozzatura del disco: DiskSpd Lettura in loop, Profondità coda 8
Prestazioni della GPU
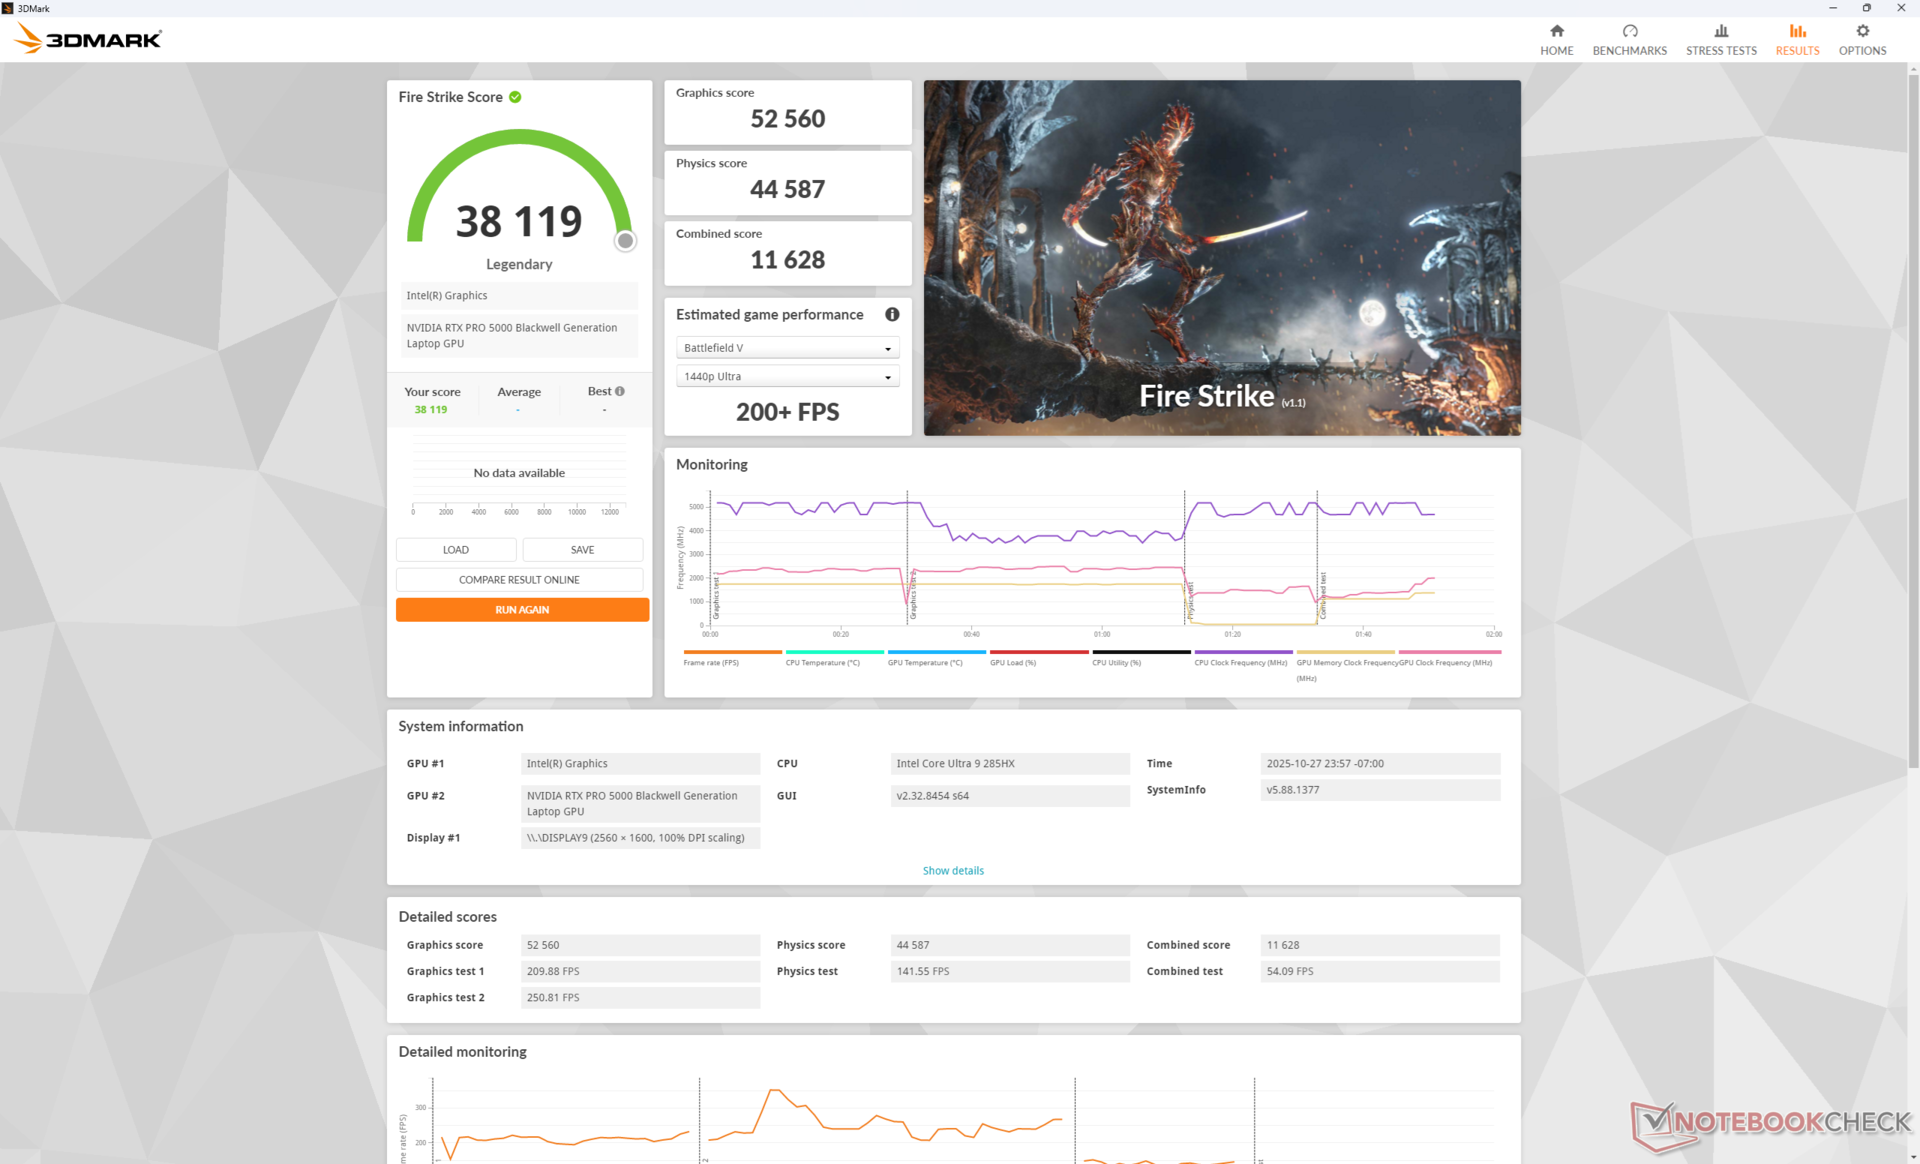
Le prestazioni grafiche sono leggermente più veloci, di pochi punti percentuali, rispetto a quelle di Dell Pro Max 16 Plus Dell Pro Max 16 Plus dotato della stessa GPU. L'assorbimento di potenza della scheda GPU è in media di circa 163 W in modalità Performance, che è vicina ai 175 W massimi.
| Profilo energetico | Punteggio grafico | Punteggio di fisica | Punteggio combinato |
| Modalità Prestazioni | 52560 | 44587 | 11628 |
| Modalità equilibrata | 47593 (-10%) | 47039 (+6%) | 11029 (-5%) |
| Alimentazione a batteria | 22941 (-56%) | 32131 (-28%) | 6944 (-40%) |
| 3DMark Performance rating - Percent | |
| Dell Pro Max 18 Plus MB18250 | |
| Media Nvidia RTX PRO 5000 Blackwell Generation Laptop | |
| Dell Pro Max 16 Plus | |
| Schenker Key 18 Pro M25 RTX 5090 -18! | |
| Lenovo ThinkPad P16 Gen 2 -1! | |
| HP ZBook Fury 16 G10 -3! | |
| Dell Precision 7000 7670 Performance -4! | |
| HP ZBook X G1i 16 | |
| HP ZBook Studio 16 G11 -1! | |
| Lenovo ThinkPad P16s Gen 4 AMD -20! | |
| 3DMark 11 - 1280x720 Performance GPU | |
| Dell Pro Max 18 Plus MB18250 | |
| Media Nvidia RTX PRO 5000 Blackwell Generation Laptop (68846 - 69594, n=2) | |
| Dell Pro Max 16 Plus | |
| Lenovo ThinkPad P16 Gen 2 | |
| HP ZBook Fury 16 G10 | |
| Schenker Key 18 Pro M25 RTX 5090 | |
| Dell Precision 7000 7670 Performance | |
| HP ZBook Studio 16 G11 | |
| HP ZBook X G1i 16 | |
| Lenovo ThinkPad P16s Gen 4 AMD | |
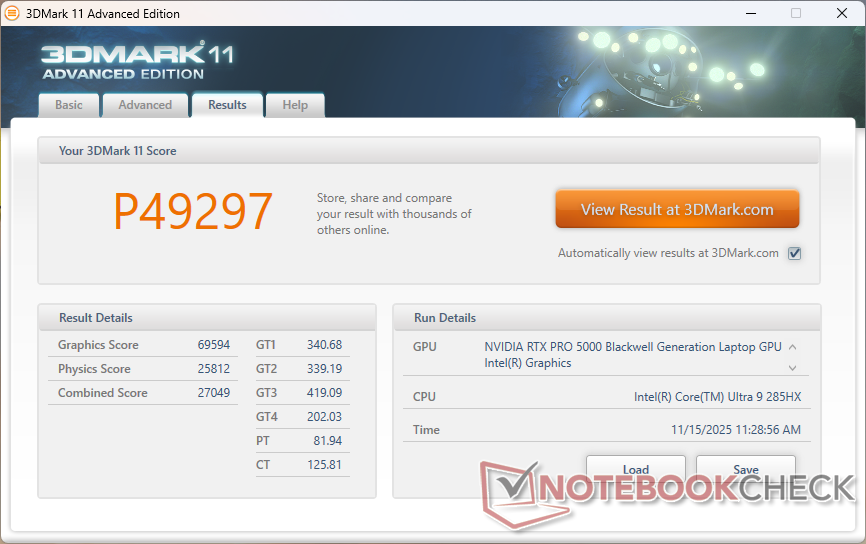
| 3DMark 11 Performance | 49297 punti | |
| 3DMark Cloud Gate Standard Score | 67936 punti | |
| 3DMark Fire Strike Score | 38119 punti | |
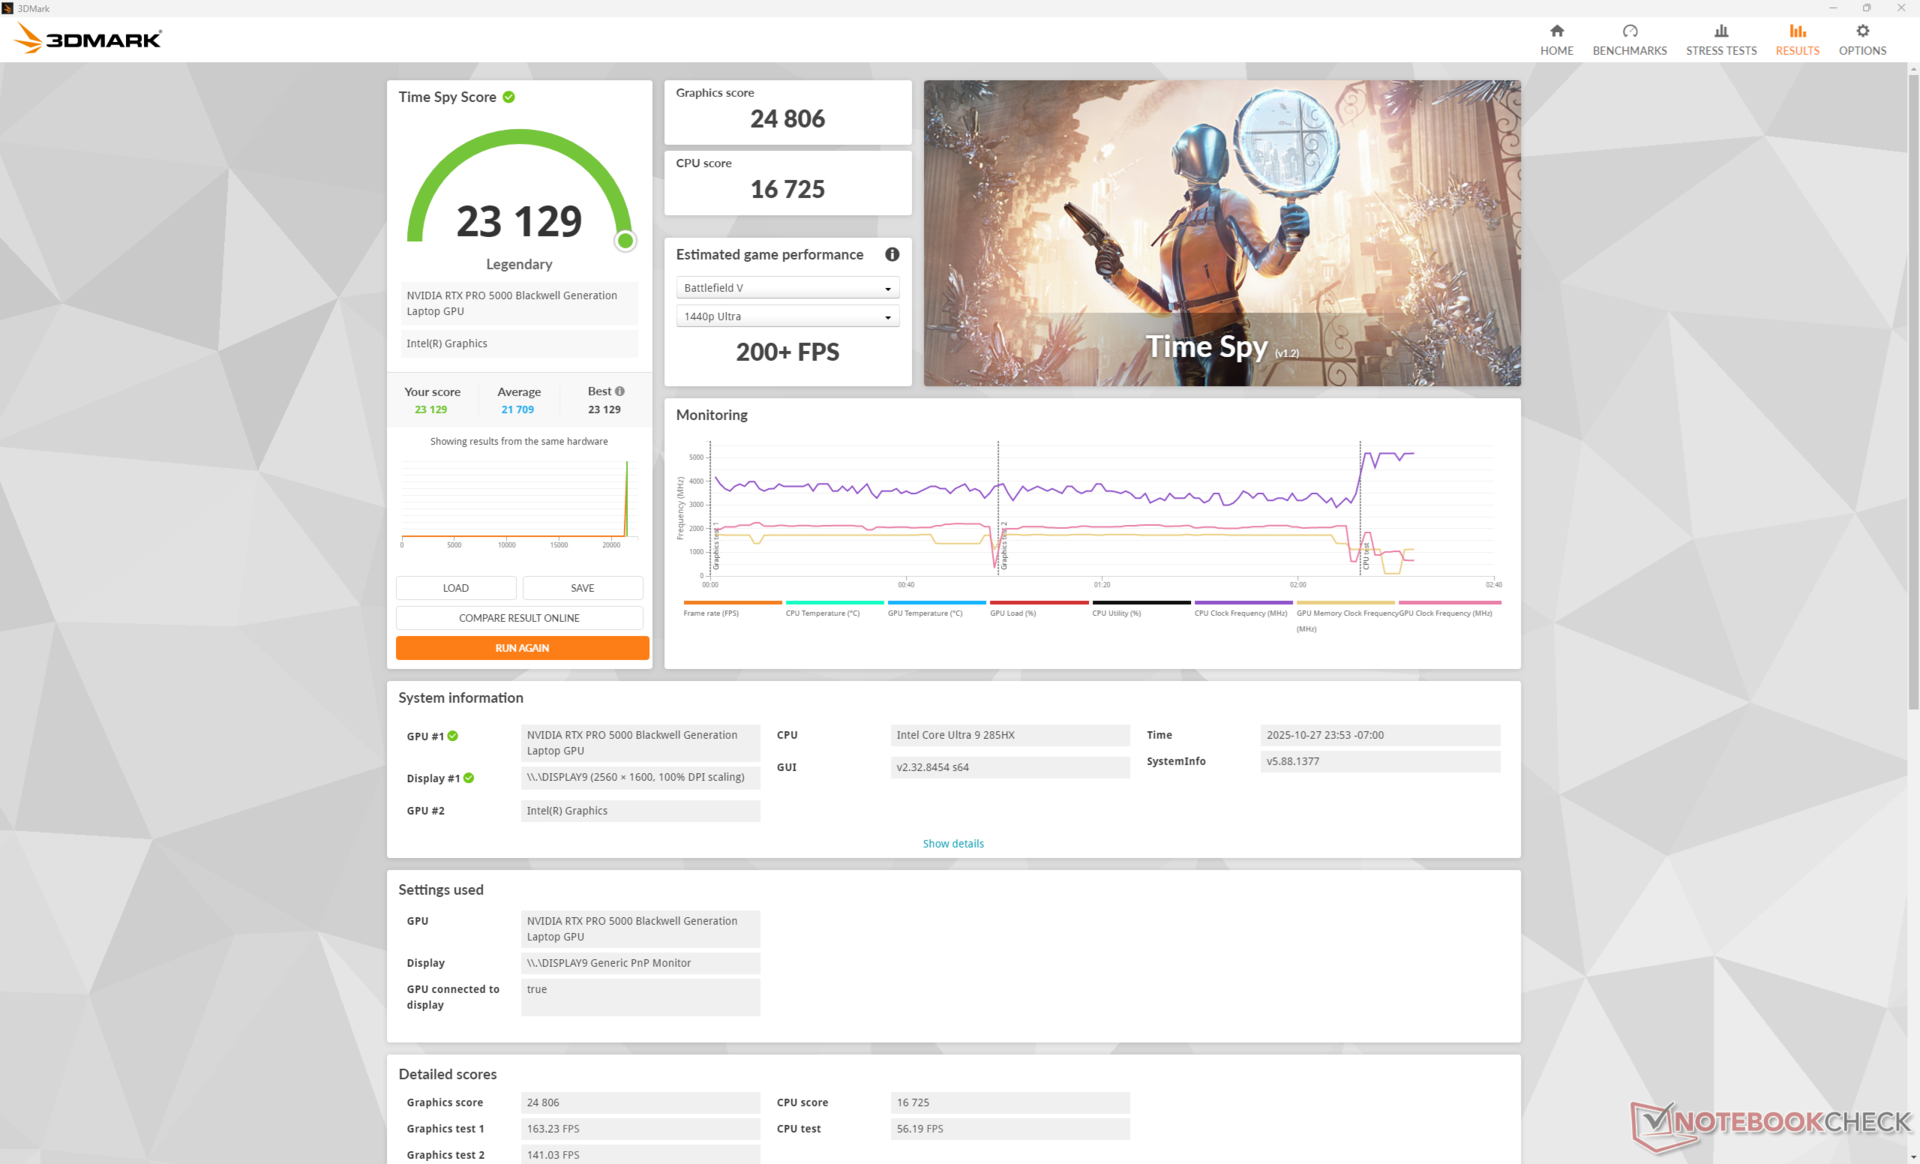
| 3DMark Time Spy Score | 23129 punti | |
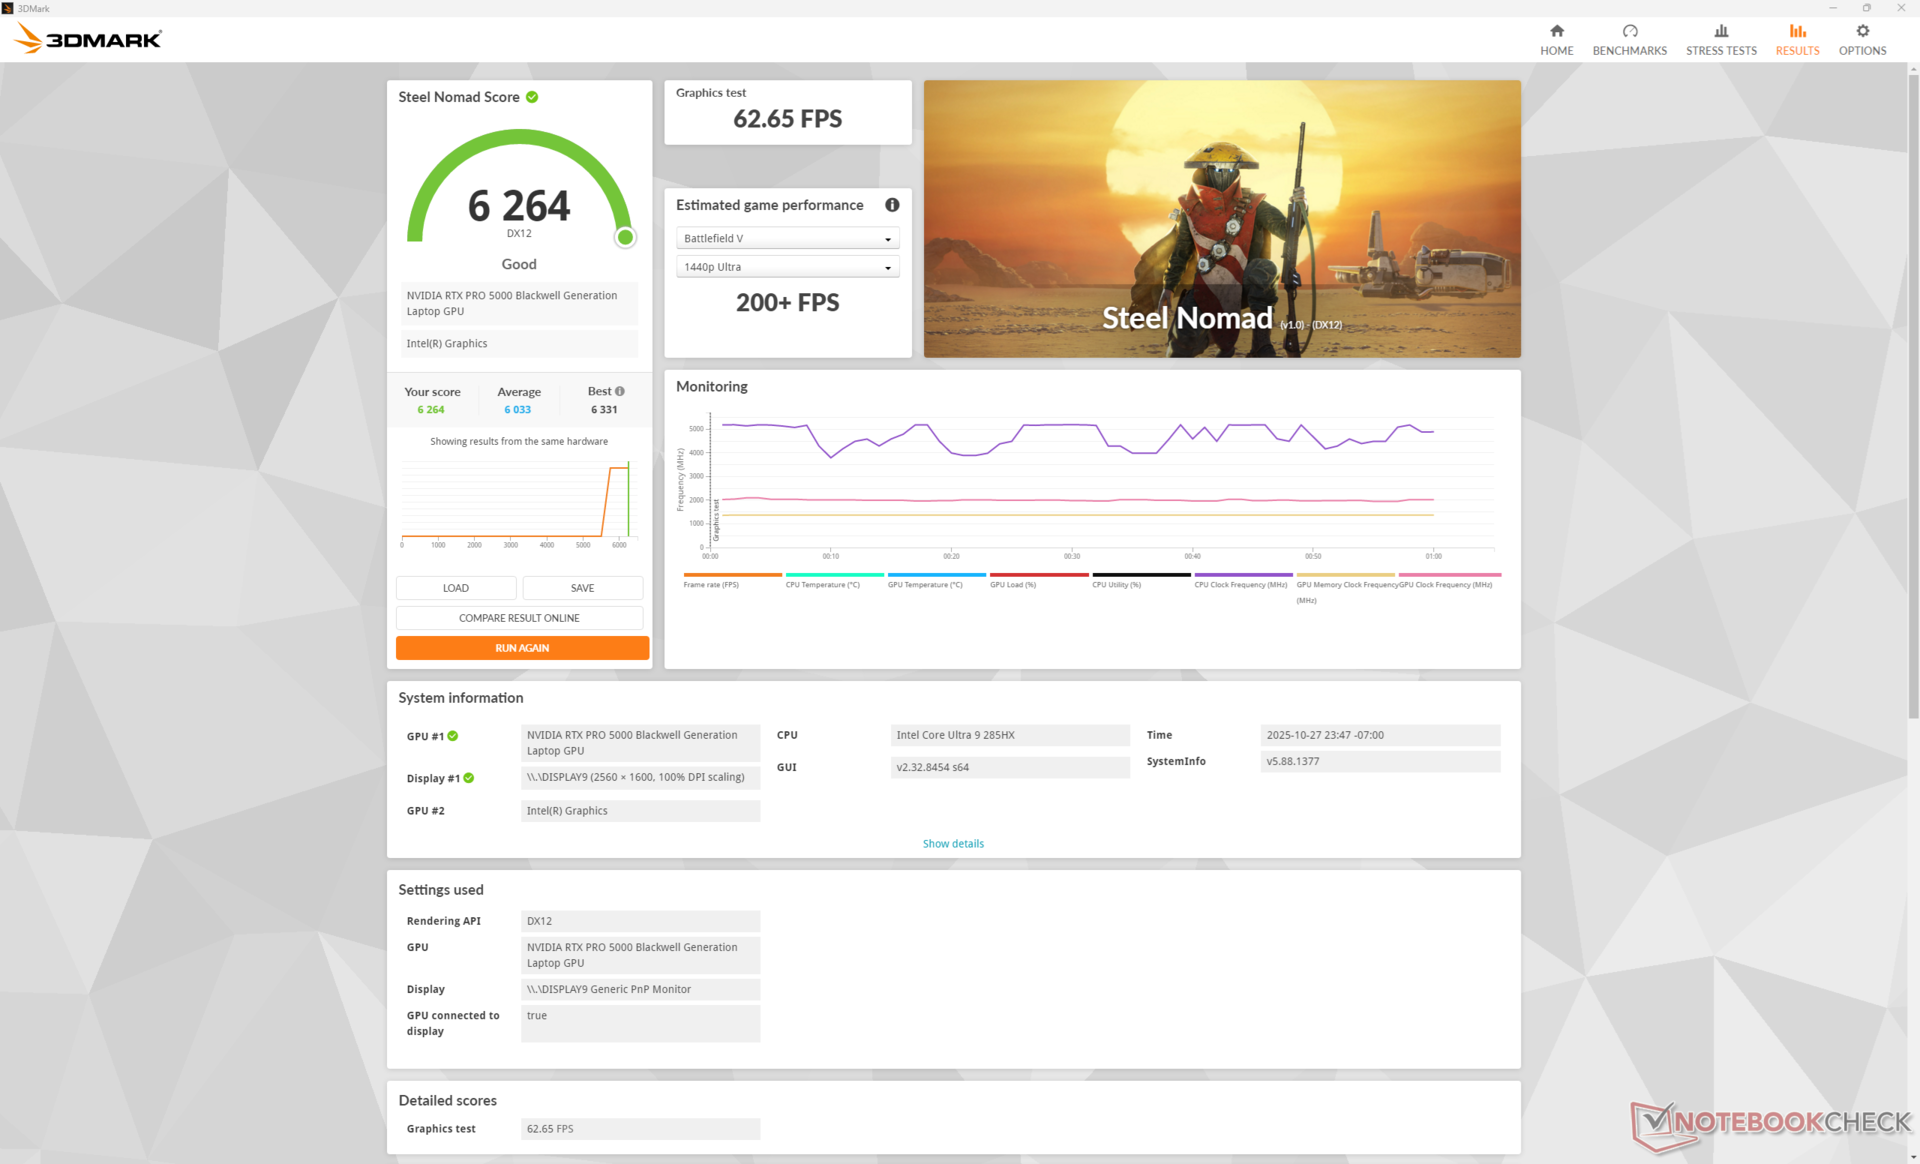
| 3DMark Steel Nomad Score | 6264 punti | |
Aiuto | ||
* ... Meglio usare valori piccoli
| Performance rating - Percent | |
| Dell Pro Max 18 Plus MB18250 | |
| Schenker Key 18 Pro M25 RTX 5090 | |
| Dell Pro Max 16 Plus | |
| HP ZBook X G1i 16 | |
| HP ZBook Studio 16 G11 | |
| Lenovo ThinkPad P16s Gen 4 AMD -1! | |
| Cyberpunk 2077 2.2 Phantom Liberty - 1920x1080 Ultra Preset (FSR off) | |
| Dell Pro Max 18 Plus MB18250 | |
| Schenker Key 18 Pro M25 RTX 5090 | |
| Dell Pro Max 16 Plus | |
| HP ZBook X G1i 16 | |
| HP ZBook Studio 16 G11 | |
| Lenovo ThinkPad P16s Gen 4 AMD | |
| Baldur's Gate 3 - 1920x1080 Ultra Preset AA:T | |
| Dell Pro Max 18 Plus MB18250 | |
| Dell Pro Max 16 Plus | |
| Schenker Key 18 Pro M25 RTX 5090 | |
| HP ZBook Studio 16 G11 | |
| HP ZBook X G1i 16 | |
| Lenovo ThinkPad P16s Gen 4 AMD | |
| GTA V - 1920x1080 Highest Settings possible AA:4xMSAA + FX AF:16x | |
| Dell Pro Max 18 Plus MB18250 | |
| Schenker Key 18 Pro M25 RTX 5090 | |
| Dell Pro Max 16 Plus | |
| HP ZBook X G1i 16 | |
| HP ZBook Studio 16 G11 | |
| Lenovo ThinkPad P16s Gen 4 AMD | |
| Final Fantasy XV Benchmark - 1920x1080 High Quality | |
| Dell Pro Max 18 Plus MB18250 | |
| Dell Pro Max 16 Plus | |
| Schenker Key 18 Pro M25 RTX 5090 | |
| HP ZBook X G1i 16 | |
| HP ZBook Studio 16 G11 | |
| Lenovo ThinkPad P16s Gen 4 AMD | |
| Strange Brigade - 1920x1080 ultra AA:ultra AF:16 | |
| Dell Pro Max 18 Plus MB18250 | |
| Schenker Key 18 Pro M25 RTX 5090 | |
| Dell Pro Max 16 Plus | |
| HP ZBook Studio 16 G11 | |
| HP ZBook X G1i 16 | |
| Dota 2 Reborn - 1920x1080 ultra (3/3) best looking | |
| Dell Pro Max 16 Plus | |
| Dell Pro Max 18 Plus MB18250 | |
| Schenker Key 18 Pro M25 RTX 5090 | |
| HP ZBook Studio 16 G11 | |
| HP ZBook X G1i 16 | |
| Lenovo ThinkPad P16s Gen 4 AMD | |
| X-Plane 11.11 - 1920x1080 high (fps_test=3) | |
| Dell Pro Max 18 Plus MB18250 | |
| Dell Pro Max 16 Plus | |
| Schenker Key 18 Pro M25 RTX 5090 | |
| HP ZBook Studio 16 G11 | |
| HP ZBook X G1i 16 | |
| Lenovo ThinkPad P16s Gen 4 AMD | |
| GTA V | |
| 1920x1080 Highest Settings possible AA:4xMSAA + FX AF:16x | |
| Dell Pro Max 18 Plus MB18250 | |
| Media Nvidia RTX PRO 5000 Blackwell Generation Laptop (142.5 - 156.1, n=2) | |
| Schenker Key 18 Pro M25 RTX 5090 | |
| Dell Pro Max 16 Plus | |
| Lenovo ThinkPad P16 Gen 2 | |
| HP ZBook X G1i 16 | |
| Dell Precision 7000 7670 Performance | |
| HP ZBook Studio 16 G11 | |
| Lenovo ThinkPad P16s Gen 4 AMD | |
| 2560x1440 Highest Settings possible AA:4xMSAA + FX AF:16x | |
| Dell Pro Max 18 Plus MB18250 | |
| Schenker Key 18 Pro M25 RTX 5090 | |
| Media Nvidia RTX PRO 5000 Blackwell Generation Laptop (138 - 152.6, n=2) | |
| Dell Pro Max 16 Plus | |
| Lenovo ThinkPad P16 Gen 2 | |
| Dell Precision 7000 7670 Performance | |
| HP ZBook X G1i 16 | |
| HP ZBook Studio 16 G11 | |
| Dota 2 Reborn - 3840x2160 ultra (3/3) best looking | |
| HP ZBook Fury 16 G10 | |
| Schenker Key 18 Pro M25 RTX 5090 | |
| Dell Pro Max 18 Plus MB18250 | |
| Media Nvidia RTX PRO 5000 Blackwell Generation Laptop (146.4 - 149.4, n=2) | |
| Dell Pro Max 16 Plus | |
| Dell Precision 7000 7670 Performance | |
Grafico Cyberpunk 2077 ultra FPS
| basso | medio | alto | ultra | QHD DLSS | QHD | 4K DLSS | 4K FSR | 4K | |
|---|---|---|---|---|---|---|---|---|---|
| GTA V (2015) | 186.7 | 185.8 | 178.3 | 156.1 | 152.6 | ||||
| Dota 2 Reborn (2015) | 219 | 179.8 | 182 | 163.9 | 149.4 | ||||
| Final Fantasy XV Benchmark (2018) | 233 | 232 | 197.6 | 156.9 | 101.5 | ||||
| X-Plane 11.11 (2018) | 154.4 | 133.2 | 104.2 | 94.4 | |||||
| Strange Brigade (2018) | 548 | 442 | 426 | 418 | 351 | 188.7 | |||
| Baldur's Gate 3 (2023) | 253 | 238 | 212 | 205 | 198.2 | 150.3 | 126.3 | 85.9 | |
| Cyberpunk 2077 2.2 Phantom Liberty (2023) | 176 | 174.3 | 161.4 | 152.4 | 130.3 | 116.7 | 81.3 | ||
| F1 24 (2024) | 338 | 322 | 322 | 147.7 | 148.6 | 101.8 | 85.7 | 83.6 | 50.2 |
Emissioni
Rumore del sistema
Le tre ventole interne sono quasi sempre attive e quindi il sistema non è mai veramente silenzioso nella maggior parte dei casi. Tuttavia, sono quasi impercettibili in un ufficio tipico durante la maggior parte dei carichi di lavoro medio-bassi e non si fanno sentire fino a quando non si introducono carichi molto più elevati. Siamo riusciti a raggiungere quasi 54 dB(A) durante l'esecuzione di giochi o carichi simili in modalità Bilanciata o Performance.
Forse per pura coincidenza, il comportamento e le misurazioni della ventola sono molto simili a quelli che abbiamo registrato su Dell Pro Max 16 Plus.
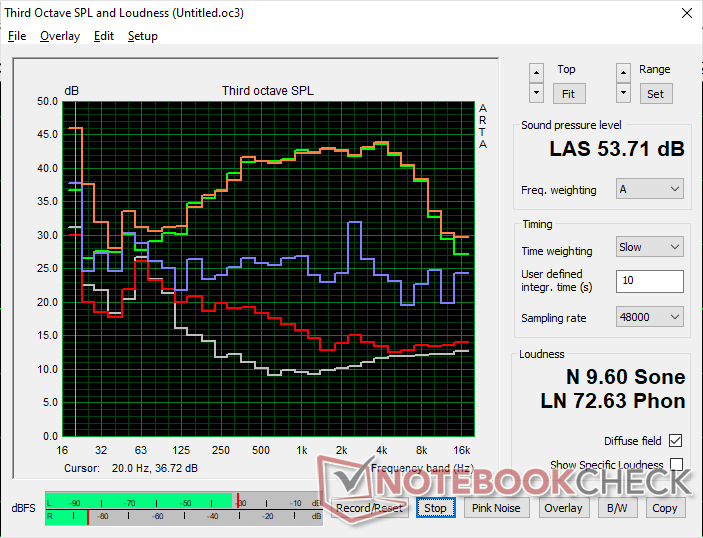
Rumorosità
| Idle |
| 27.1 / 27.1 / 27.1 dB(A) |
| Sotto carico |
| 38 / 53.8 dB(A) |
 | ||
30 dB silenzioso 40 dB(A) udibile 50 dB(A) rumoroso |
||
min: | ||
| Dell Pro Max 18 Plus MB18250 Ultra 9 285HX, RTX PRO 5000 Blackwell Generation Laptop | Schenker Key 18 Pro M25 RTX 5090 Ultra 9 275HX, GeForce RTX 5090 Laptop | HP ZBook X G1i 16 Ultra 7 265H, RTX PRO 2000 Blackwell Generation Laptop | HP ZBook Studio 16 G11 Ultra 9 185H, RTX 3000 Ada Generation Laptop | Lenovo ThinkPad P16s Gen 4 AMD Ryzen AI 9 HX 370, Radeon 890M | Dell Pro Max 16 Plus Ultra 9 285HX, RTX PRO 5000 Blackwell Generation Laptop | |
|---|---|---|---|---|---|---|
| Noise | -3% | 9% | 6% | -0% | -6% | |
| off /ambiente * (dB) | 23.1 | 23.9 -3% | 23.7 -3% | 23.8 -3% | 25.9 -12% | 23.2 -0% |
| Idle Minimum * (dB) | 27.1 | 25.2 7% | 23.7 13% | 23.8 12% | 25.9 4% | 26.7 1% |
| Idle Average * (dB) | 27.1 | 25.2 7% | 23.7 13% | 26.4 3% | 25.9 4% | 30.5 -13% |
| Idle Maximum * (dB) | 27.1 | 25.2 7% | 23.7 13% | 26.4 3% | 28.5 -5% | 34 -25% |
| Load Average * (dB) | 38 | 47.8 -26% | 32.7 14% | 33.7 11% | 42.9 -13% | 39.8 -5% |
| Cyberpunk 2077 ultra * (dB) | 53.8 | 54.4 -1% | 50.9 5% | 46.1 14% | 48.7 9% | 54.3 -1% |
| Load Maximum * (dB) | 53.8 | 58.6 -9% | 48 11% | 53.2 1% | 48.5 10% | 54.3 -1% |
* ... Meglio usare valori piccoli
Temperatura
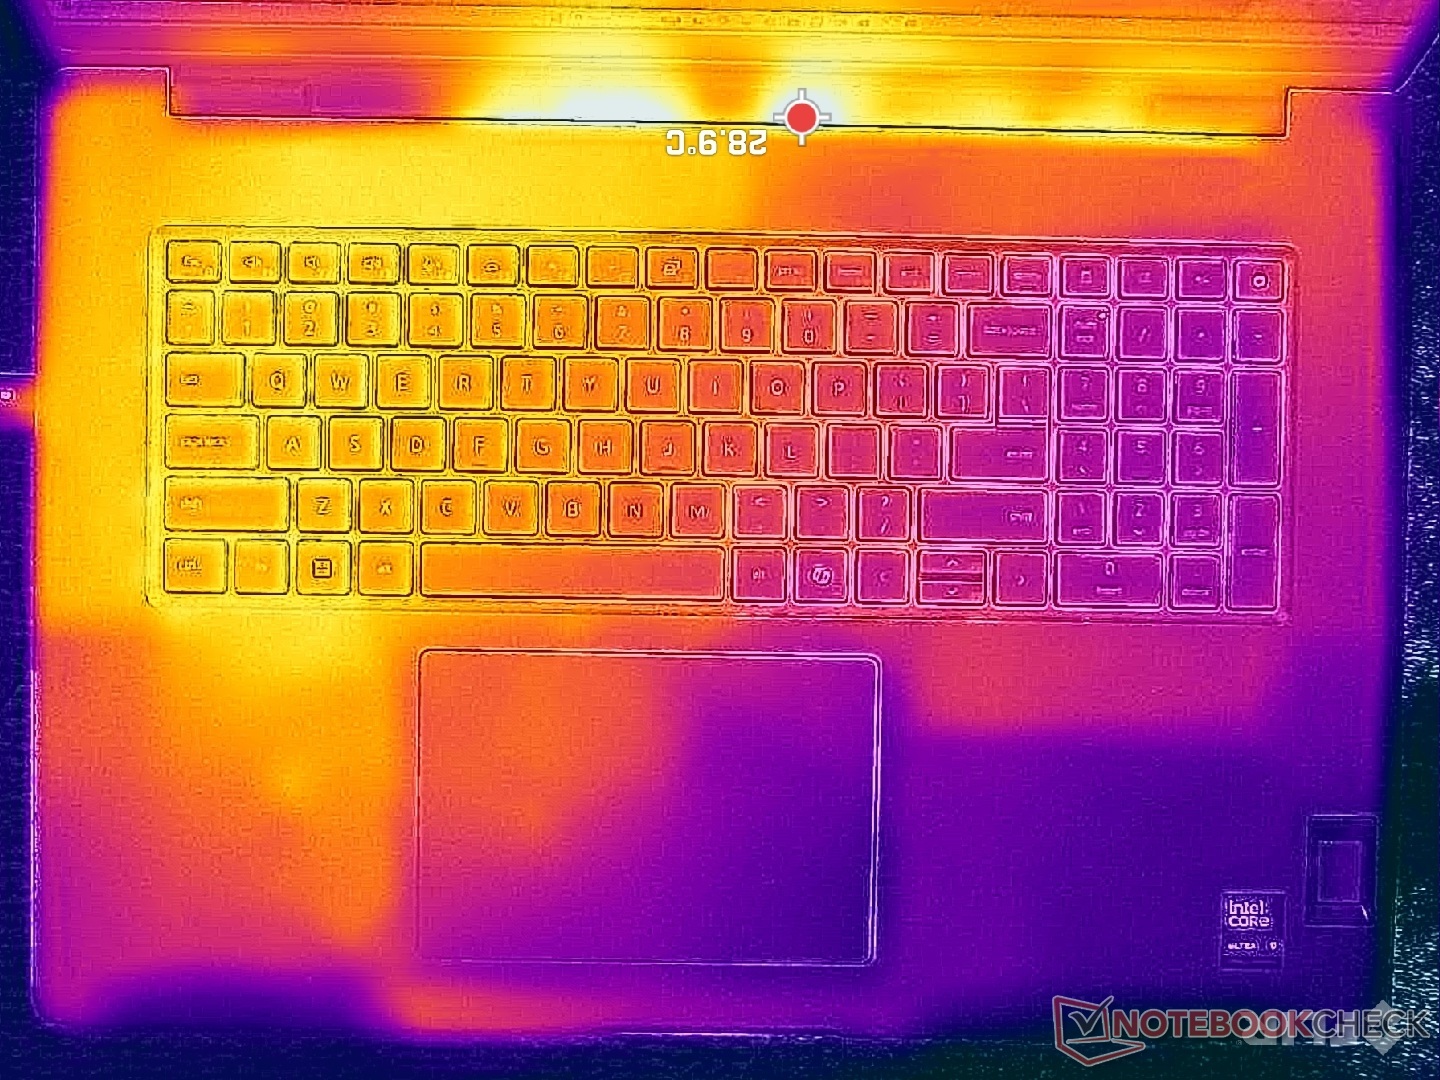
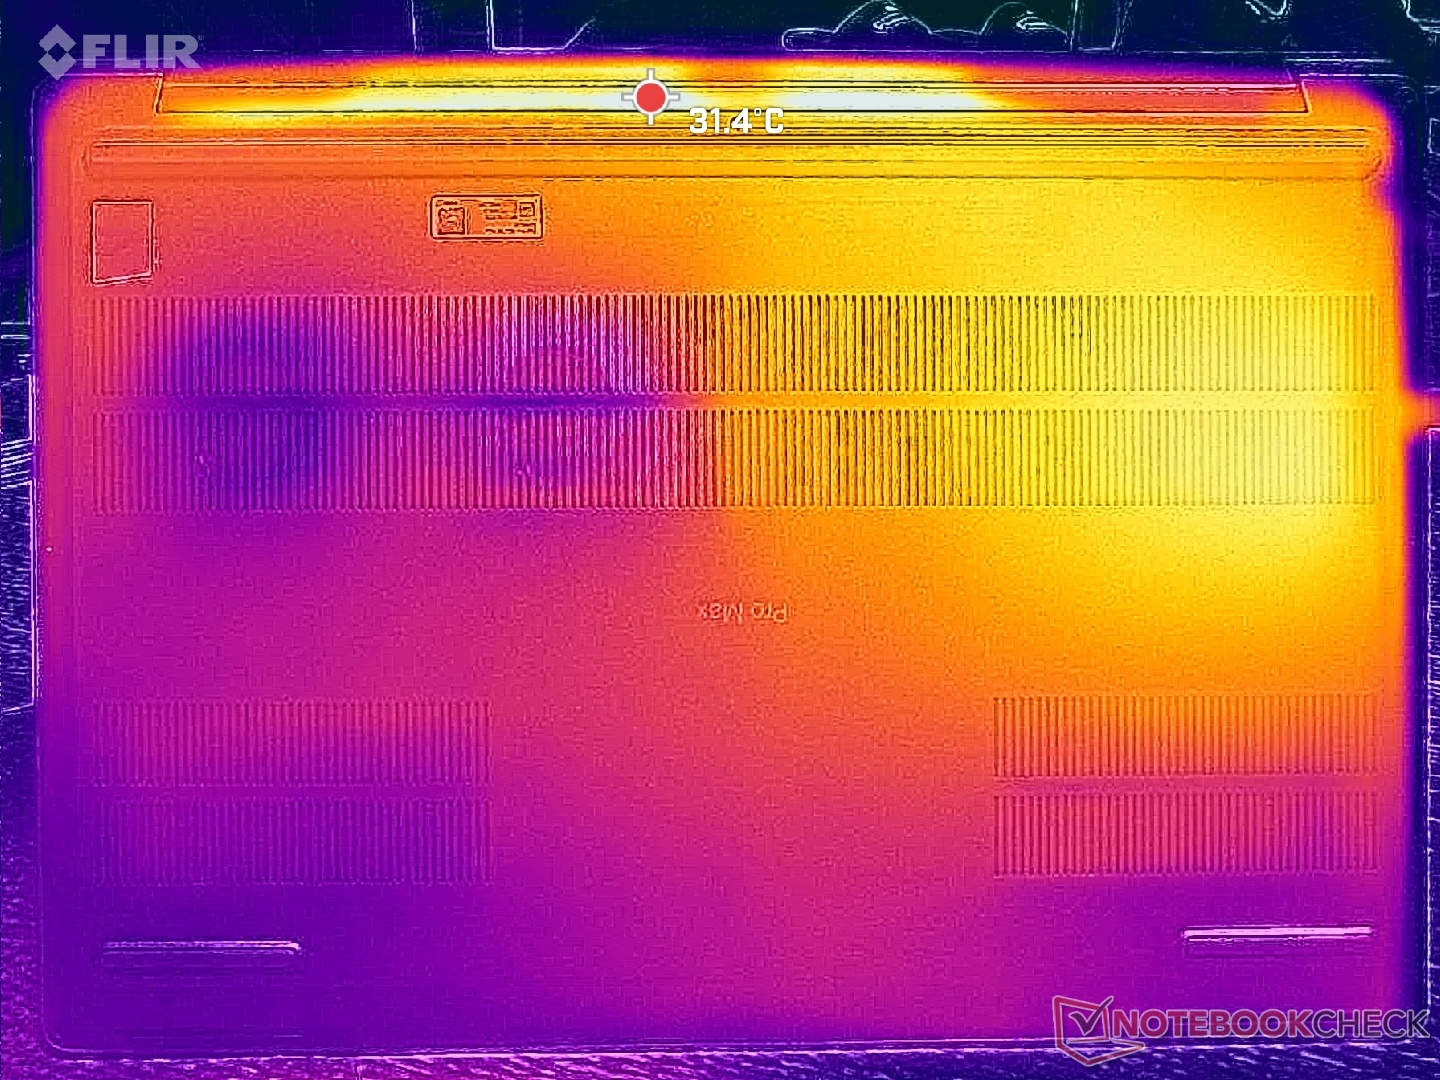
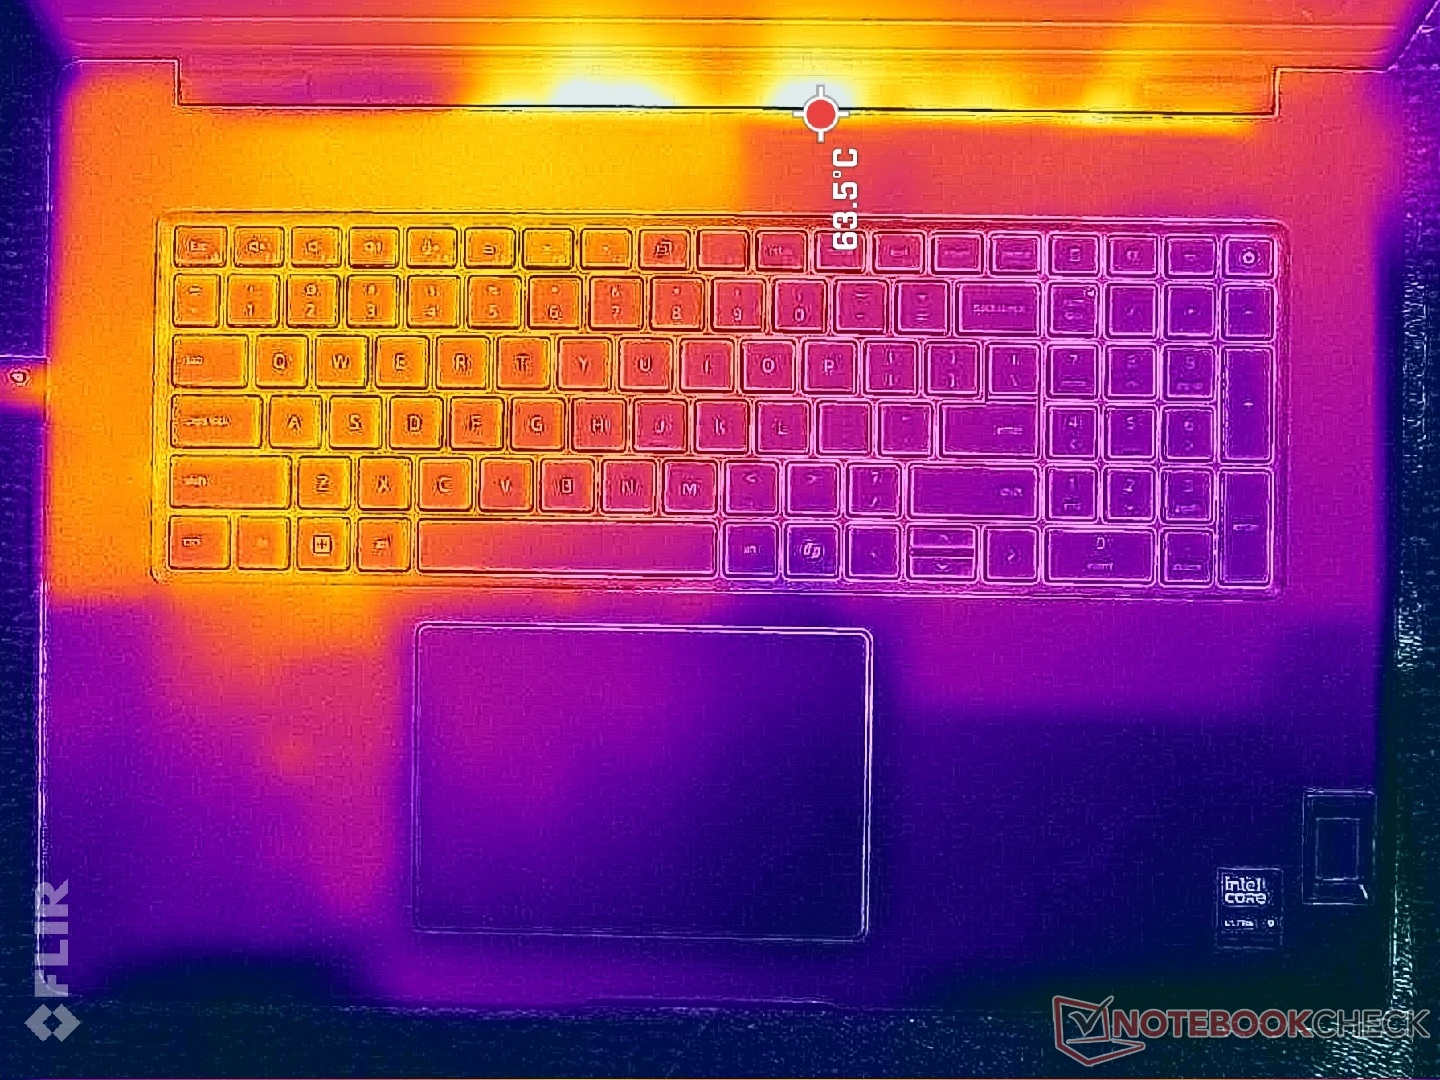
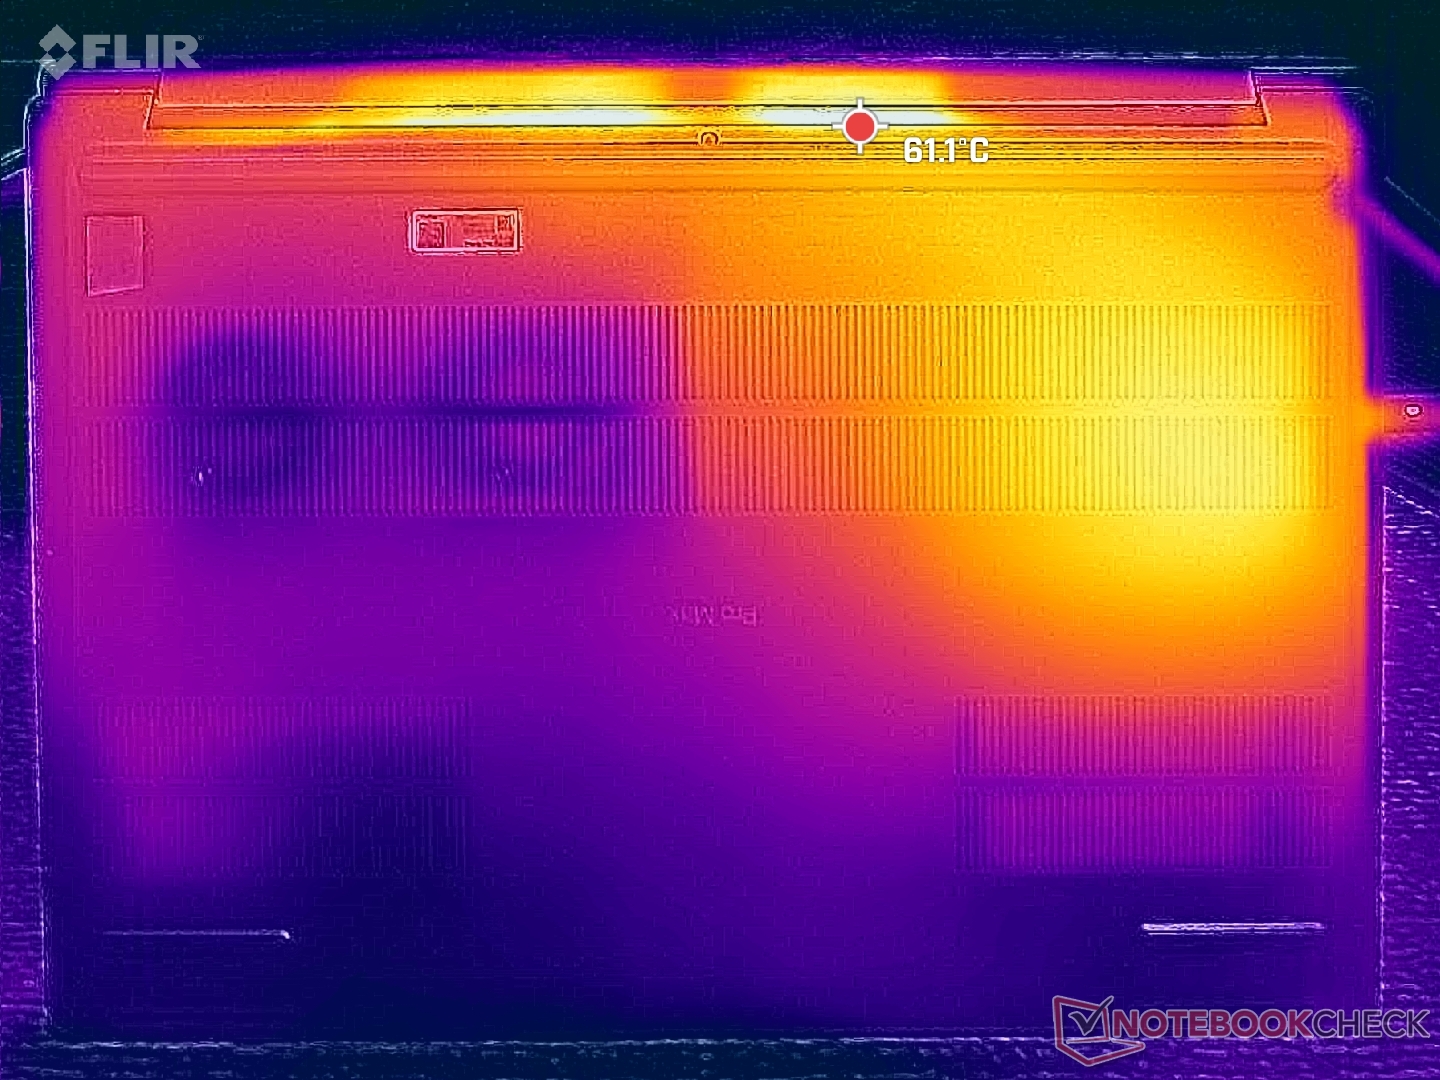
Le temperature di superficie sono più calde nella metà sinistra del sistema rispetto a quella destra, dove i punti caldi possono raggiungere i 43 C - 47 C quando sono sotto carico.
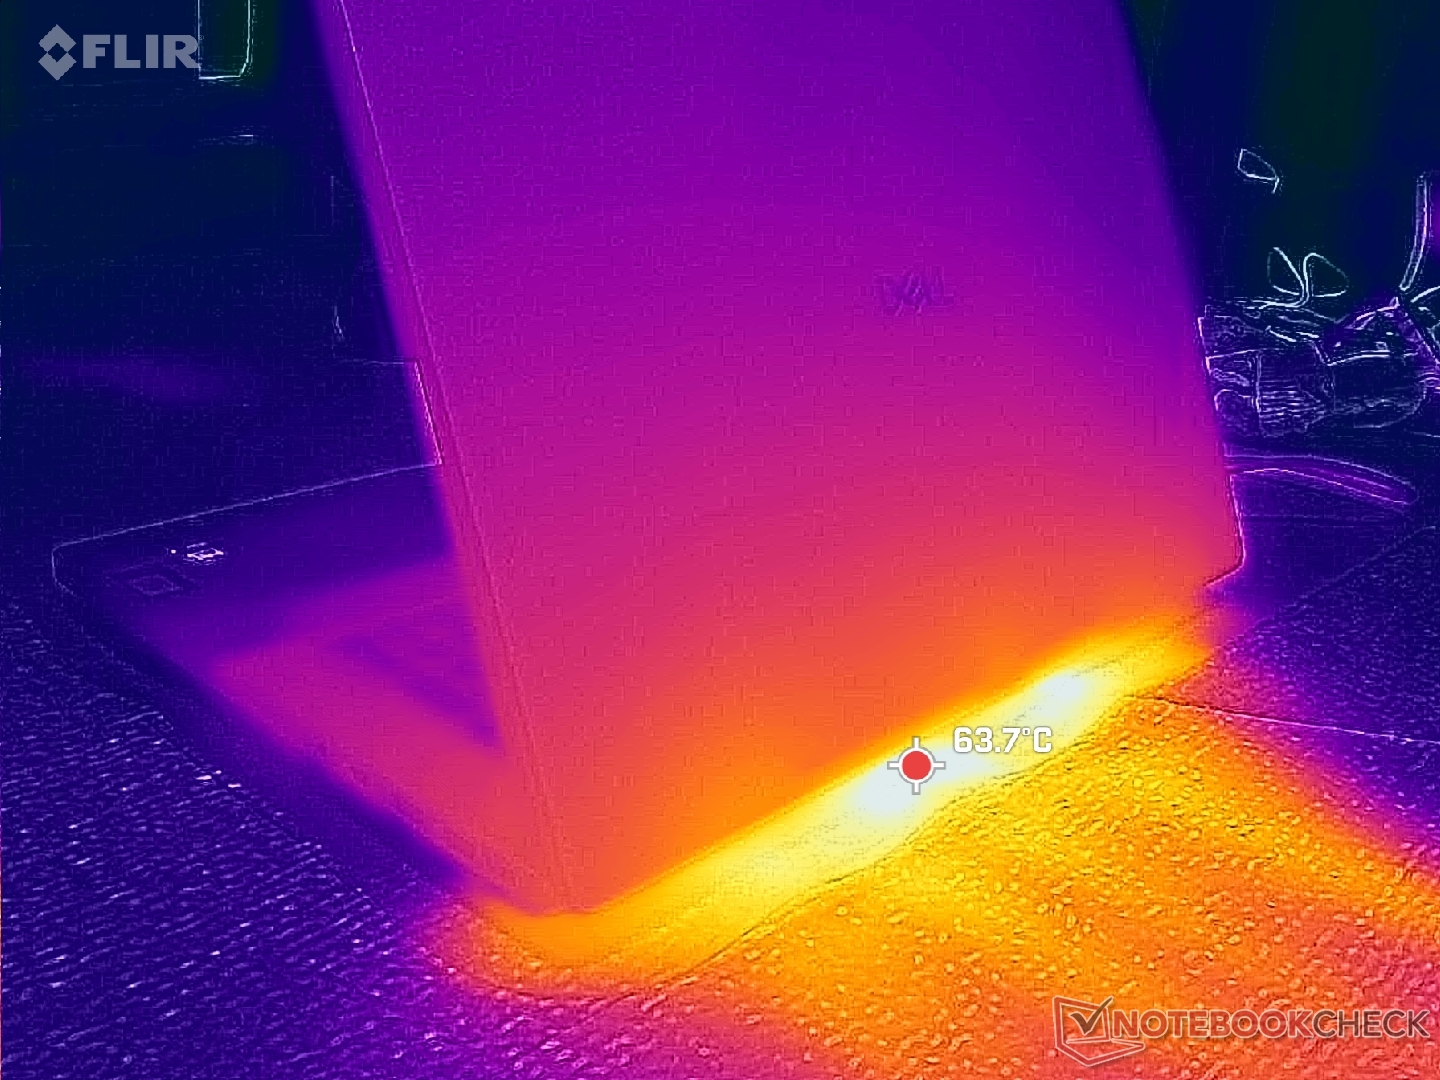
(±) La temperatura massima sul lato superiore è di 44.8 °C / 113 F, rispetto alla media di 38.2 °C / 101 F, che varia da 22.2 a 69.8 °C per questa classe Workstation.
(-) Il lato inferiore si riscalda fino ad un massimo di 47 °C / 117 F, rispetto alla media di 41.2 °C / 106 F
(+) In idle, la temperatura media del lato superiore è di 29.3 °C / 85 F, rispetto alla media deld ispositivo di 32 °C / 90 F.
(+) I poggiapolsi e il touchpad raggiungono la temperatura massima della pelle (32.8 °C / 91 F) e quindi non sono caldi.
(-) La temperatura media della zona del palmo della mano di dispositivi simili e'stata di 27.9 °C / 82.2 F (-4.9 °C / -8.8 F).
| Dell Pro Max 18 Plus MB18250 Ultra 9 285HX, RTX PRO 5000 Blackwell Generation Laptop | Schenker Key 18 Pro M25 RTX 5090 Ultra 9 275HX, GeForce RTX 5090 Laptop | HP ZBook X G1i 16 Ultra 7 265H, RTX PRO 2000 Blackwell Generation Laptop | HP ZBook Studio 16 G11 Ultra 9 185H, RTX 3000 Ada Generation Laptop | Lenovo ThinkPad P16s Gen 4 AMD Ryzen AI 9 HX 370, Radeon 890M | Dell Pro Max 16 Plus Ultra 9 285HX, RTX PRO 5000 Blackwell Generation Laptop | |
|---|---|---|---|---|---|---|
| Heat | -1% | 10% | 1% | -16% | 1% | |
| Maximum Upper Side * (°C) | 44.8 | 47.5 -6% | 36 20% | 36.6 18% | 50.6 -13% | 40.4 10% |
| Maximum Bottom * (°C) | 47 | 52.8 -12% | 39.4 16% | 47.8 -2% | 54.3 -16% | 45.6 3% |
| Idle Upper Side * (°C) | 31.8 | 28.5 10% | 30.4 4% | 31.4 1% | 35.3 -11% | 32.8 -3% |
| Idle Bottom * (°C) | 31.4 | 30.1 4% | 31.8 -1% | 35.6 -13% | 38.5 -23% | 33 -5% |
* ... Meglio usare valori piccoli
Altoparlanti
Dell Pro Max 18 Plus MB18250 analisi audio
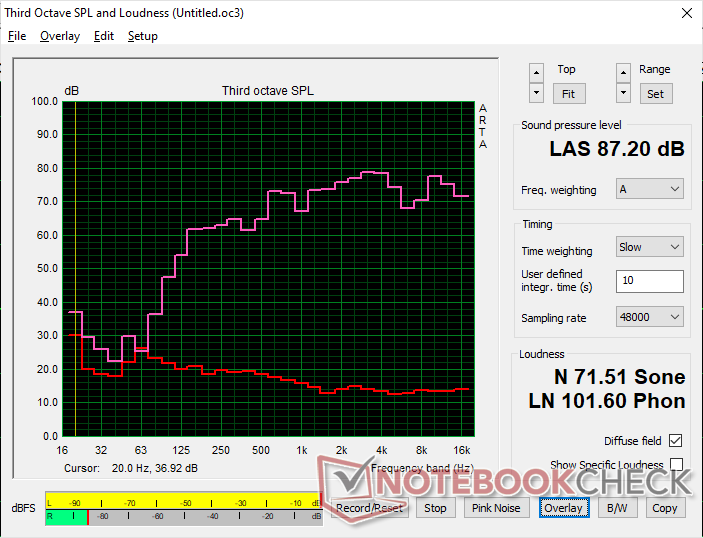
(+) | gli altoparlanti sono relativamente potenti (87.2 dB)
Bassi 100 - 315 Hz
(±) | bassi ridotti - in media 12.8% inferiori alla media
(±) | la linearità dei bassi è media (8.4% delta rispetto alla precedente frequenza)
Medi 400 - 2000 Hz
(+) | medi bilanciati - solo only 4% rispetto alla media
(+) | medi lineari (6.6% delta rispetto alla precedente frequenza)
Alti 2 - 16 kHz
(+) | Alti bilanciati - appena 4.7% dalla media
(+) | alti lineari (5.9% delta rispetto alla precedente frequenza)
Nel complesso 100 - 16.000 Hz
(+) | suono nel complesso lineare (11.4% differenza dalla media)
Rispetto alla stessa classe
» 11% di tutti i dispositivi testati in questa classe è stato migliore, 4% simile, 85% peggiore
» Il migliore ha avuto un delta di 7%, medio di 17%, peggiore di 35%
Rispetto a tutti i dispositivi testati
» 7% di tutti i dispositivi testati in questa classe è stato migliore, 2% similare, 91% peggiore
» Il migliore ha avuto un delta di 4%, medio di 24%, peggiore di 134%
Apple MacBook Pro 16 2021 M1 Pro analisi audio
(+) | gli altoparlanti sono relativamente potenti (84.7 dB)
Bassi 100 - 315 Hz
(+) | bassi buoni - solo 3.8% dalla media
(+) | bassi in lineaa (5.2% delta rispetto alla precedente frequenza)
Medi 400 - 2000 Hz
(+) | medi bilanciati - solo only 1.3% rispetto alla media
(+) | medi lineari (2.1% delta rispetto alla precedente frequenza)
Alti 2 - 16 kHz
(+) | Alti bilanciati - appena 1.9% dalla media
(+) | alti lineari (2.7% delta rispetto alla precedente frequenza)
Nel complesso 100 - 16.000 Hz
(+) | suono nel complesso lineare (4.6% differenza dalla media)
Rispetto alla stessa classe
» 0% di tutti i dispositivi testati in questa classe è stato migliore, 0% simile, 100% peggiore
» Il migliore ha avuto un delta di 5%, medio di 17%, peggiore di 45%
Rispetto a tutti i dispositivi testati
» 0% di tutti i dispositivi testati in questa classe è stato migliore, 0% similare, 100% peggiore
» Il migliore ha avuto un delta di 4%, medio di 24%, peggiore di 134%
Gestione dell'energia
Consumo di energia
Il funzionamento al minimo può assorbire da un minimo di 6 W a un massimo di 32 W se si utilizza l'impostazione di luminosità massima con la GPU discreta attiva. Questo valore minimo è inferiore a quello della maggior parte degli altri portatili da 18 pollici, il che spiega la durata relativamente lunga della batteria nella sezione successiva.
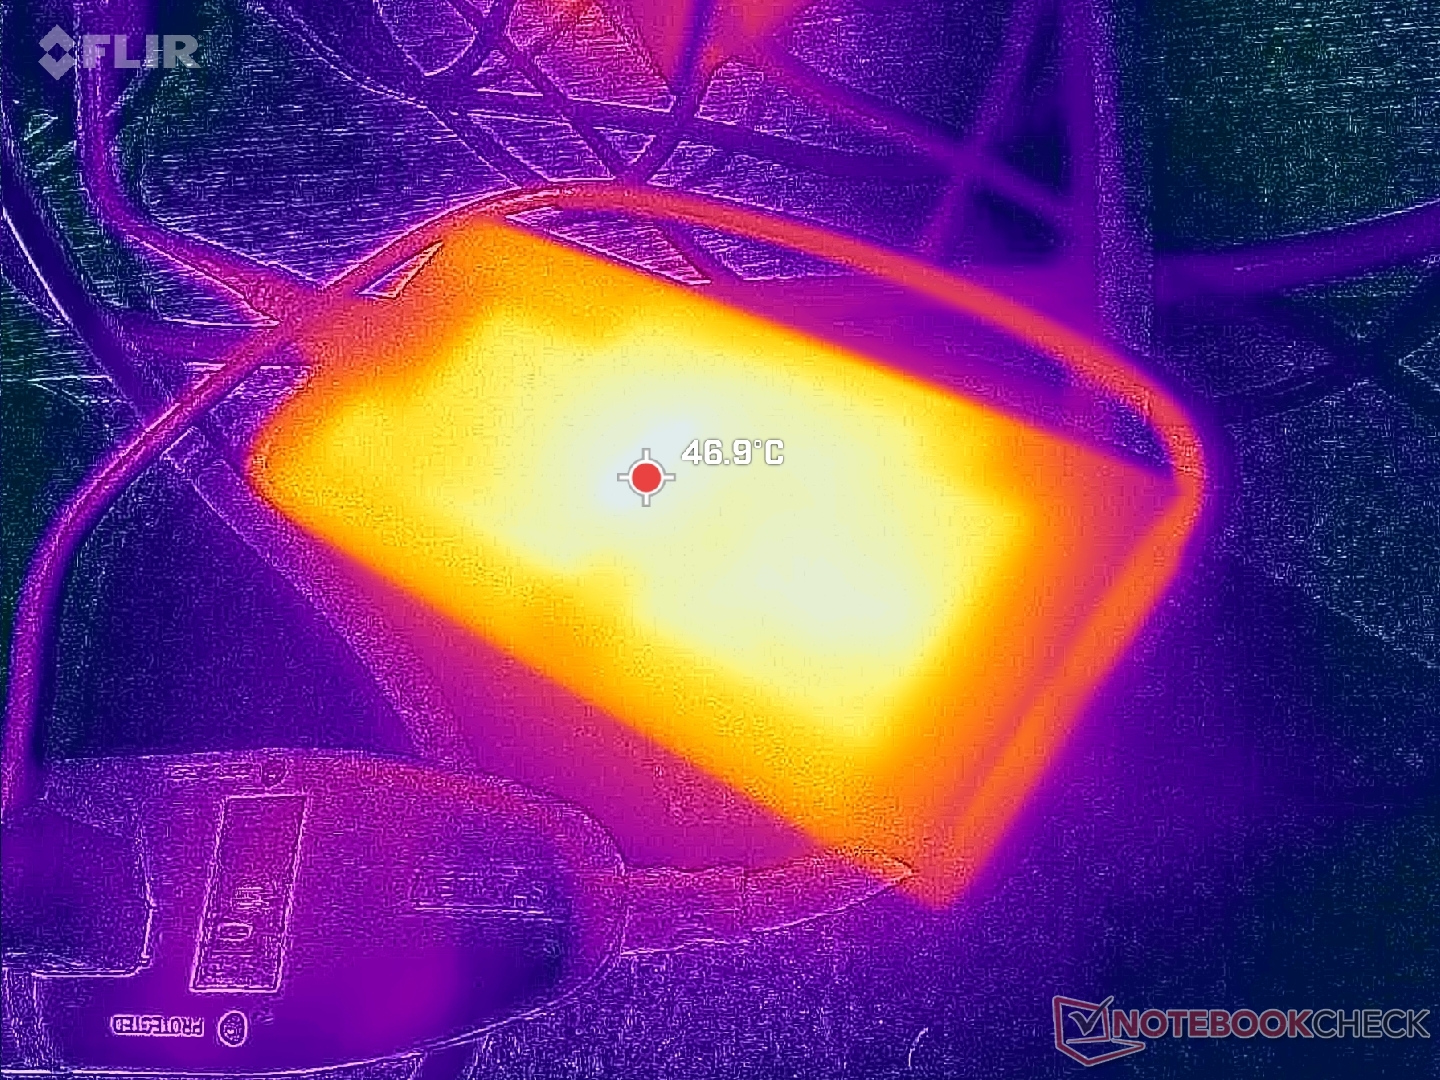
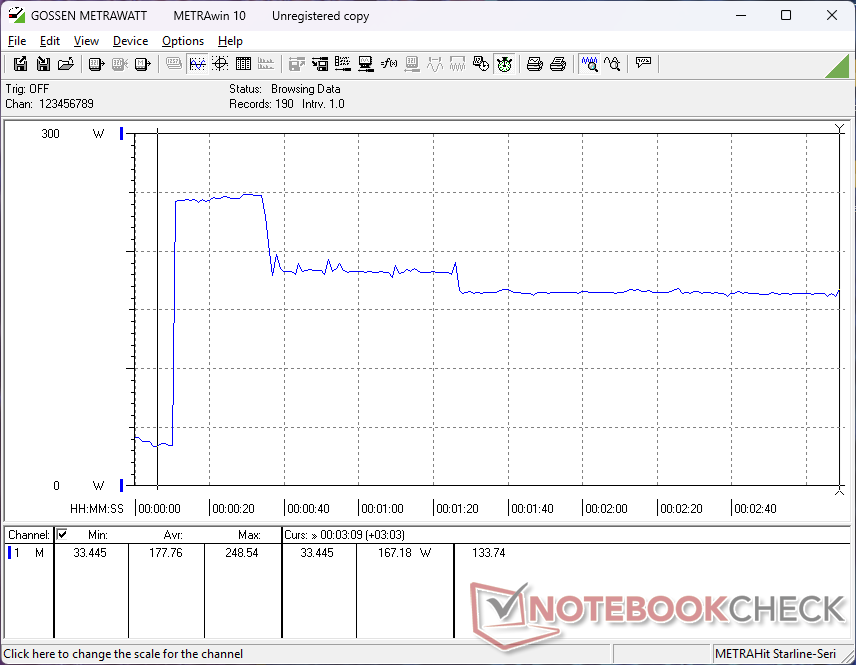
L'esecuzione di carichi impegnativi come Cyberpunk 2077 richiede quasi 260 W dall'adattatore CA USB-C da 280 W (~16,2 x 7,8 x 2,3 cm). Si aspetti che la velocità di ricarica sia molto lenta se si eseguono carichi impegnativi contemporaneamente. In confronto, l'HP ZBook Fury G1i 18 viene fornito con un adattatore CA da 330 W più ingombrante, per prestazioni massime potenzialmente più elevate e tassi di ricarica più rapidi.
| Off / Standby | |
| Idle | |
| Sotto carico |
|
Leggenda:
min: | |
| Dell Pro Max 18 Plus MB18250 Ultra 9 285HX, RTX PRO 5000 Blackwell Generation Laptop, , IPS, 2560x1600, 18" | Schenker Key 18 Pro M25 RTX 5090 Ultra 9 275HX, GeForce RTX 5090 Laptop, Samsung 9100 Pro 4 TB, IPS, 3840x2400, 18" | HP ZBook X G1i 16 Ultra 7 265H, RTX PRO 2000 Blackwell Generation Laptop, Samsung PM9A1 MZVL22T0HBLB, IPS, 2560x1600, 16" | HP ZBook Studio 16 G11 Ultra 9 185H, RTX 3000 Ada Generation Laptop, Kioxia XG8 KXG80ZNV1T02, IPS, 3840x2400, 16" | Lenovo ThinkPad P16 Gen 2 i7-14700HX, RTX 4000 Ada Generation Laptop, SK hynix PC801 HFS001TEJ9X162N, IPS, 2560x1600, 16" | Dell Pro Max 16 Plus Ultra 9 285HX, RTX PRO 5000 Blackwell Generation Laptop, SK hynix PCB01 HFS001TFM9X186N, OLED, 3840x2400, 16" | |
|---|---|---|---|---|---|---|
| Power Consumption | -38% | 49% | 4% | 7% | -97% | |
| Idle Minimum * (Watt) | 6.1 | 14 -130% | 4.1 33% | 14 -130% | 7.9 -30% | 35.1 -475% |
| Idle Average * (Watt) | 15.2 | 21.9 -44% | 9 41% | 22.4 -47% | 13.1 14% | 39.2 -158% |
| Idle Maximum * (Watt) | 32.4 | 22.3 31% | 9.4 71% | 25.7 21% | 24.2 25% | 56 -73% |
| Load Average * (Watt) | 130.1 | 149.5 -15% | 86.7 33% | 90.2 31% | 127.4 2% | 130.2 -0% |
| Cyberpunk 2077 ultra external monitor * (Watt) | 252 | 336 -33% | 102 60% | 120.3 52% | 219 13% | 213 15% |
| Cyberpunk 2077 ultra * (Watt) | 256 | 333 -30% | 106.1 59% | 125.4 51% | 225 12% | 229 11% |
| Load Maximum * (Watt) | 280.9 | 415.4 -48% | 152.9 46% | 142 49% | 248.5 12% | 285.2 -2% |
* ... Meglio usare valori piccoli
Consumo di energia Cyberpunk / Stress Test
Consumo di energia del monitor esterno
Durata della batteria
I tempi di esecuzione sono sorprendentemente lunghi quando si naviga sul web in modalità grafica integrata e con il profilo energetico bilanciato. Siamo riusciti a ottenere oltre 9 ore di utilizzo reale, che sono ore in più rispetto a quanto abbiamo registrato sul Lenovo ThinkPad P16 o HP ZBook Studio 16 G11.
| Dell Pro Max 18 Plus MB18250 Ultra 9 285HX, RTX PRO 5000 Blackwell Generation Laptop, 96 Wh | Schenker Key 18 Pro M25 RTX 5090 Ultra 9 275HX, GeForce RTX 5090 Laptop, 98 Wh | HP ZBook X G1i 16 Ultra 7 265H, RTX PRO 2000 Blackwell Generation Laptop, 83 Wh | HP ZBook Studio 16 G11 Ultra 9 185H, RTX 3000 Ada Generation Laptop, 86 Wh | Lenovo ThinkPad P16 Gen 2 i7-14700HX, RTX 4000 Ada Generation Laptop, 94 Wh | Dell Pro Max 16 Plus Ultra 9 285HX, RTX PRO 5000 Blackwell Generation Laptop, 96 Wh | |
|---|---|---|---|---|---|---|
| Autonomia della batteria | ||||||
| WiFi v1.3 (h) | 9.3 | 5.8 -38% | 12.5 34% | 4.8 -48% | 2.5 -73% | 3.6 -61% |
Valutazione Notebookcheck
La più grande workstation mobile di Dell è anche una delle migliori e più veloci, ma curiosamente ha meno opzioni di visualizzazione rispetto alla controparte più piccola da 16 pollici.
Dell Pro Max 18 Plus MB18250
- 11/19/2025 v8
Allen Ngo
 Total Sustainability Score:
 Potenziali concorrenti a confronto
Immagine | Modello | Prezzo | Peso | Altezza | Schermo |
|---|---|---|---|---|---|
1. 88.9%  | Dell Pro Max 18 Plus MB18250 Intel Core Ultra 9 285HX ⎘ Nvidia RTX PRO 5000 Blackwell Generation Laptop ⎘ 128 GB Memoria | Amazon: 1. $54.99 Smatree Hard EVA Protective ... 2. $69.99 130W USB-C Charger Compatibl... 3. $109.99 GKLSPL 165W/280W USB-C GaN A... Prezzo di listino: 6000 YSD | 3.6 kg | 30.2 mm | 18.00" 2560x1600 168 PPI IPS |
2. 84.6%  | Schenker Key 18 Pro M25 RTX 5090 Intel Core Ultra 9 275HX ⎘ NVIDIA GeForce RTX 5090 Laptop ⎘ 256 GB Memoria, 4096 GB SSD | Prezzo di listino: 6400€ | 4.1 kg | 29.5 mm | 18.00" 3840x2400 252 PPI IPS |
3. 87.4%  | HP ZBook X G1i 16 Intel Core Ultra 7 265H ⎘ NVIDIA RTX PRO 2000 Blackwell Generation Laptop ⎘ 64 GB Memoria, 2048 GB SSD | Amazon: $3,017.49 Prezzo di listino: 2700 USD | 2.2 kg | 23 mm | 16.00" 2560x1600 189 PPI IPS |
4. 84.2%  | HP ZBook Studio 16 G11 Intel Core Ultra 9 185H ⎘ NVIDIA RTX 3000 Ada Generation Laptop ⎘ 64 GB Memoria, 1024 GB SSD | Amazon: $4,261.65 Prezzo di listino: 4300 USD | 1.8 kg | 19 mm | 16.00" 3840x2400 283 PPI IPS |
5.  | Lenovo ThinkPad P16s Gen 4 AMD AMD Ryzen AI 9 HX 370 ⎘ AMD Radeon 890M ⎘ 64 GB Memoria | Amazon: $2,839.00 Prezzo di listino: 2440€ | 2 kg | 23 mm | 16.00" 1920x1200 142 PPI |
6. 88.4%  | Dell Pro Max 16 Plus Intel Core Ultra 9 285HX ⎘ Nvidia RTX PRO 5000 Blackwell Generation Laptop ⎘ 128 GB Memoria, SSD | Amazon: 1. $1,439.95 Dell Pro 16 Plus PB16250 (Re... 2. $6.84 Keyboard Cover for 16" Dell ... 3. $36.99 Nivjuky 130W 100W 65W USB C ... Prezzo di listino: 5000 USD | 2.8 kg | 30.9 mm | 16.00" 3840x2400 283 PPI OLED |
Transparency
La selezione dei dispositivi da recensire viene effettuata dalla nostra redazione. Il campione di prova è stato fornito all'autore come prestito dal produttore o dal rivenditore ai fini di questa recensione. L'istituto di credito non ha avuto alcuna influenza su questa recensione, né il produttore ne ha ricevuto una copia prima della pubblicazione. Non vi era alcun obbligo di pubblicare questa recensione. In quanto società mediatica indipendente, Notebookcheck non è soggetta all'autorità di produttori, rivenditori o editori.
Ecco come Notebookcheck esegue i test
Ogni anno, Notebookcheck esamina in modo indipendente centinaia di laptop e smartphone utilizzando procedure standardizzate per garantire che tutti i risultati siano comparabili. Da circa 20 anni sviluppiamo continuamente i nostri metodi di prova e nel frattempo stabiliamo gli standard di settore. Nei nostri laboratori di prova, tecnici ed editori esperti utilizzano apparecchiature di misurazione di alta qualità. Questi test comportano un processo di validazione in più fasi. Il nostro complesso sistema di valutazione si basa su centinaia di misurazioni e parametri di riferimento ben fondati, che mantengono l'obiettività.
