
Verdetto - Piccolo, semplice e professionale
La NucBox K16 è definita dal suo processore. Pur presentando lo stesso eccellente telaio dell'apprezzatissimo EVO-X1la vecchia CPU Zen 3+ di NucBox K16 significa che il sistema è progettato per gli utenti con un budget limitato, che possono apprezzare le caratteristiche fisiche o le porte dello chassis, ma che non hanno necessariamente bisogno delle elevate prestazioni di un processore Zen 5. Per le attività di base in ufficio, in remoto o legate ai server, NucBox K16 non esagera con le funzioni per un'esperienza utente più snella.
Lo stesso processore Zen 3+ è anche responsabile di molti svantaggi del sistema. La CPU obsoleta mostra i suoi limiti quando si analizza il consumo energetico, in quanto le prestazioni per watt non sono neanche lontanamente paragonabili a quelle di alcune delle più recenti alternative di Intel, tra cui il modello di GMK NucBox K13. Anche le prestazioni grafiche sono più lente della media, anche per una soluzione integrata.
Se la porta Oculink non ha alcun valore per i suoi carichi di lavoro, il NucBox K13, dal prezzo simile, può essere un'opzione molto più efficiente del K16, grazie al suo processore più recente e al suo aspetto più sottile. Il MSI Cubi NUC è disponibile anche con livelli di prestazioni simili, ma con una porta Thunderbolt 4 integrata invece di Oculink.
Pro
Contro
Prezzo e disponibilità
NucBox K16 è ora in vendita su Amazon con 32 GB di RAM e 512 GB di SSD al prezzo di 900 dollari o 680 dollari se acquistato direttamente dal produttore.
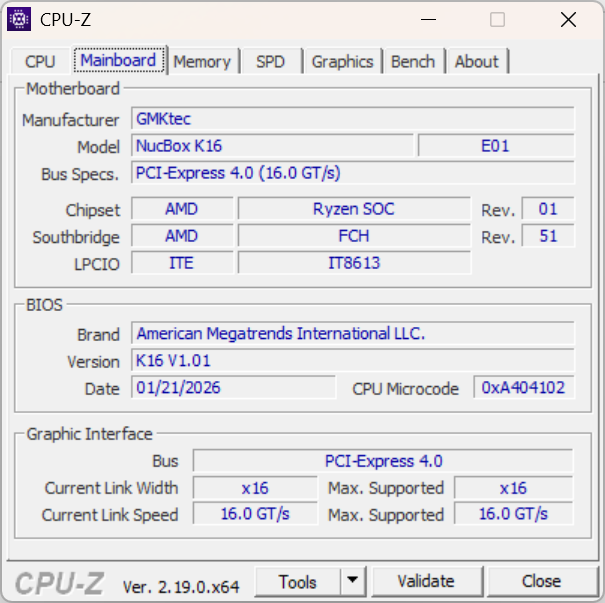
NucBox K16 è l'ultimo mini PC di GMktec che si rivolge più ai professionisti che agli utenti HTPC, grazie alla porta Oculink integrata. Si noti che, sebbene il K16 sia tecnicamente uno dei modelli più recenti di GMK, non è necessariamente migliore o più veloce del K15 o dei modelli precedenti, poiché il nome "K" non ha alcuna influenza sul tipo di processore all'interno.
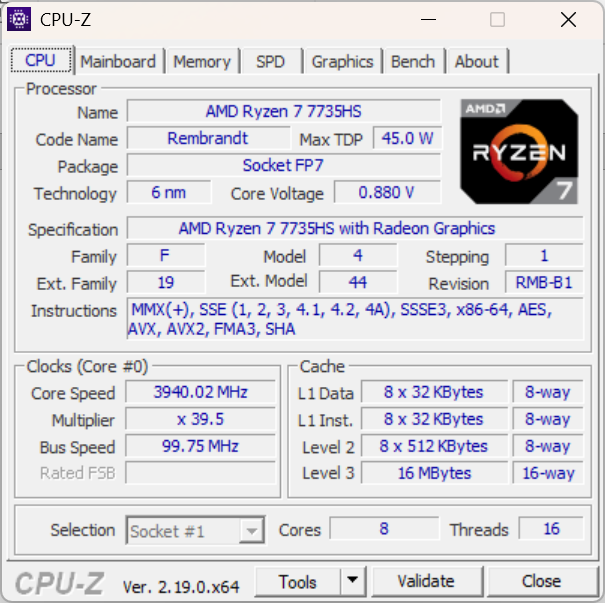
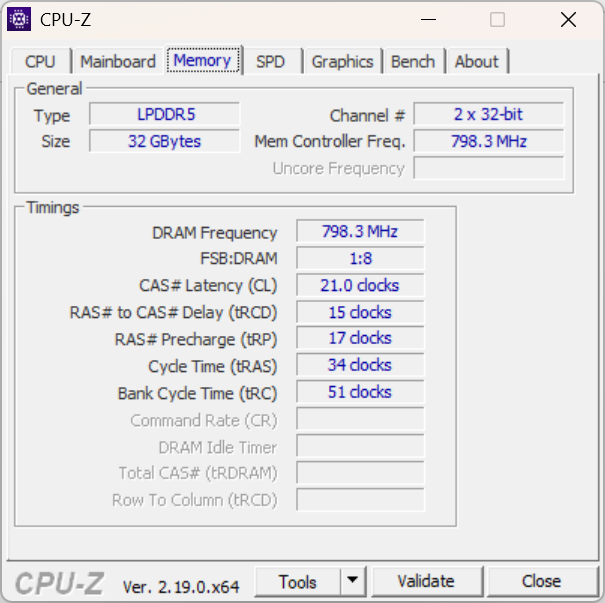
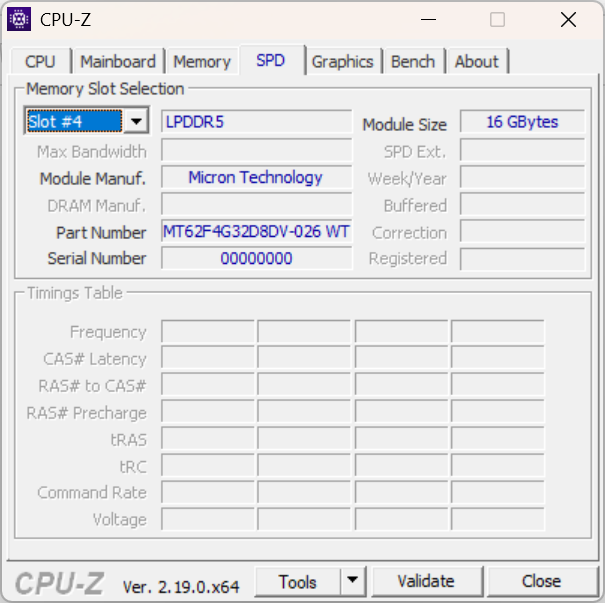
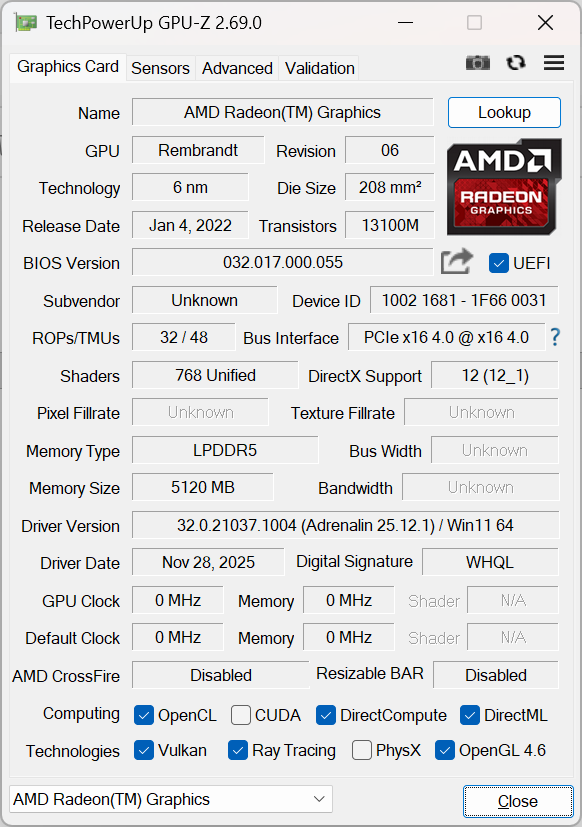
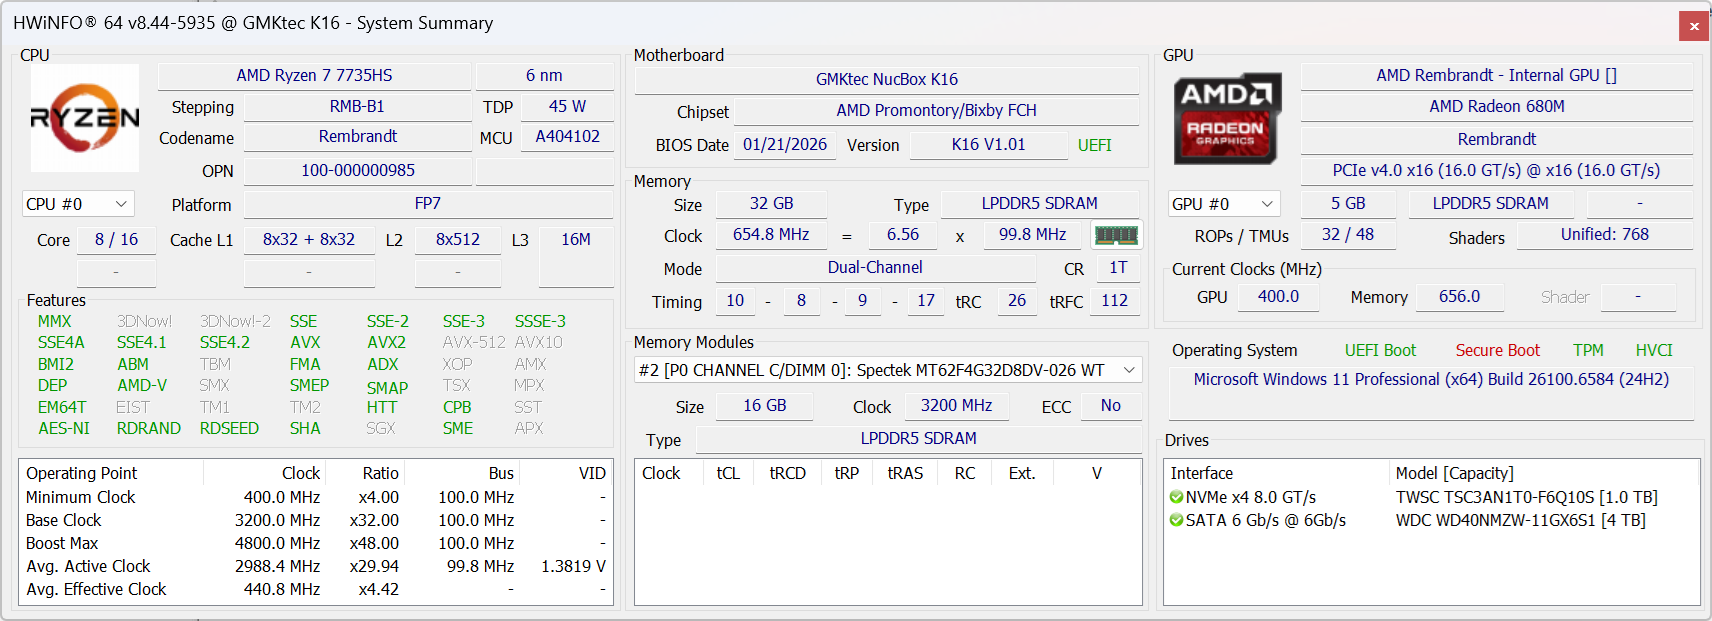
Al momento è disponibile solo una configurazione principale con CPU Ryzen 7 7735HS, 32 GB di RAM e 512 GB di SSD. Altre configurazioni possono raddoppiare lo spazio di archiviazione, ma la memoria saldata da 32 GB e la vecchia CPU Zen 3+ rimangono invariate.
Altre recensioni GMKtec:
Specifiche
Caso
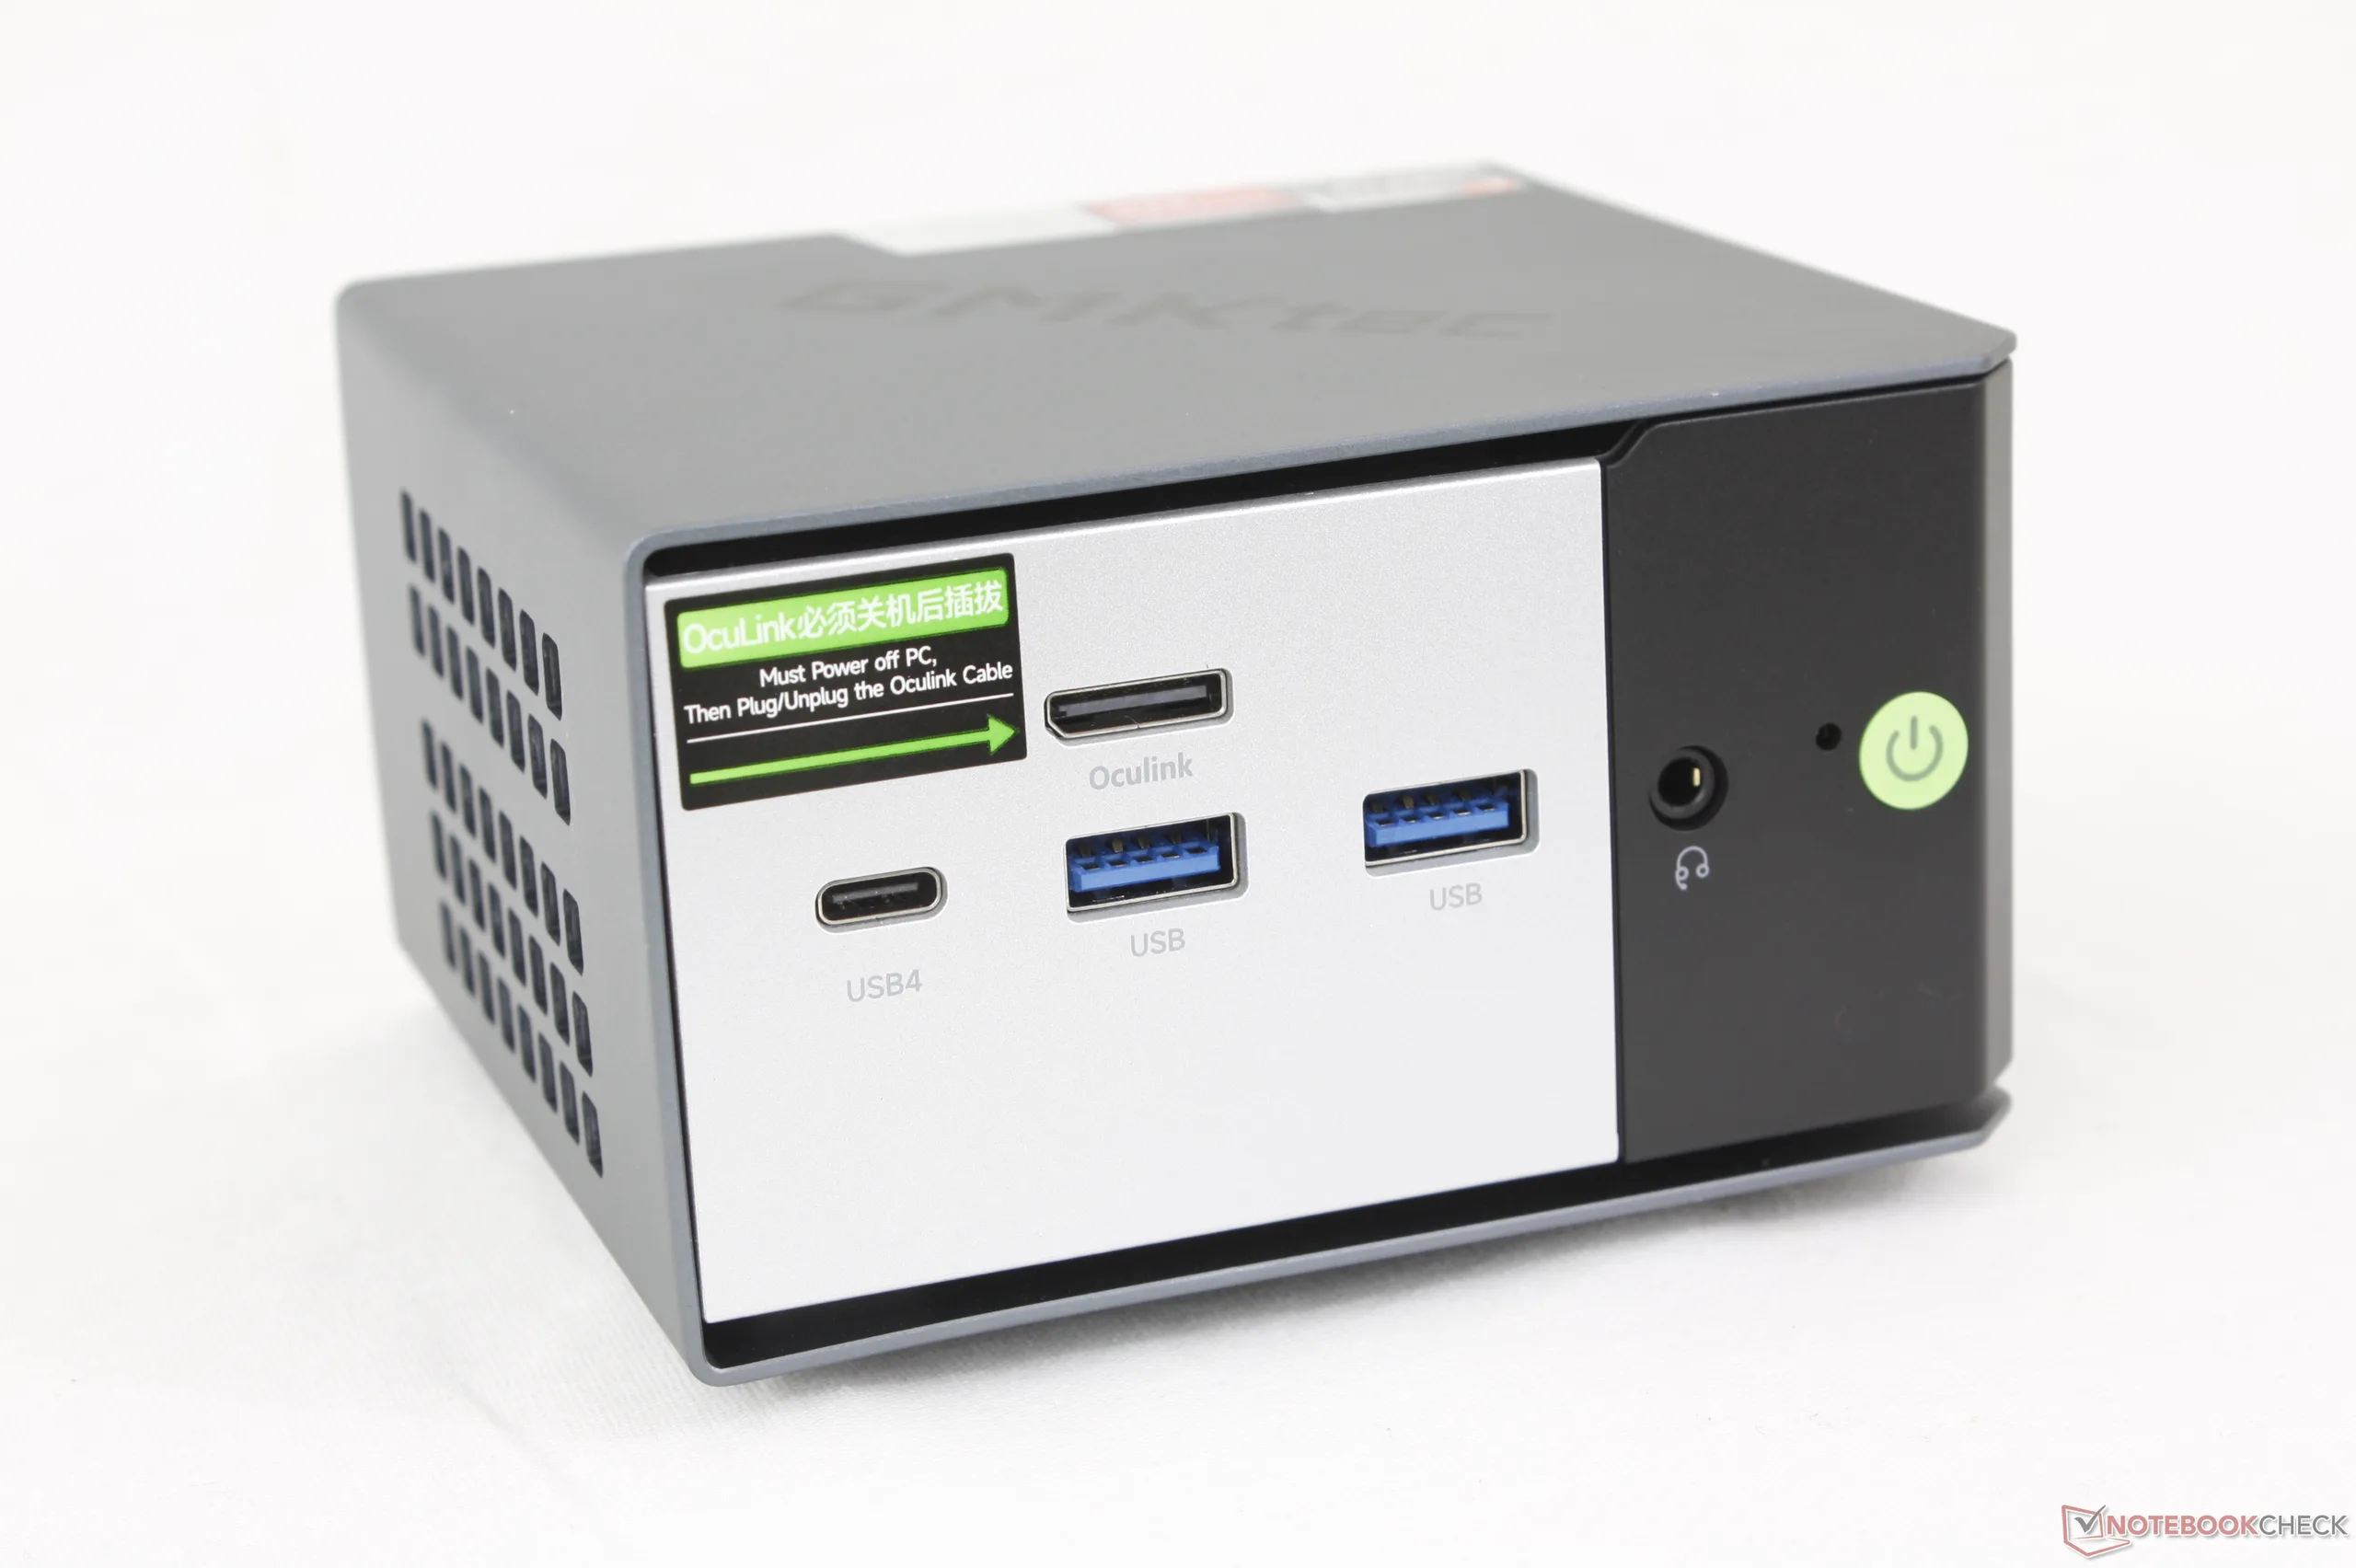
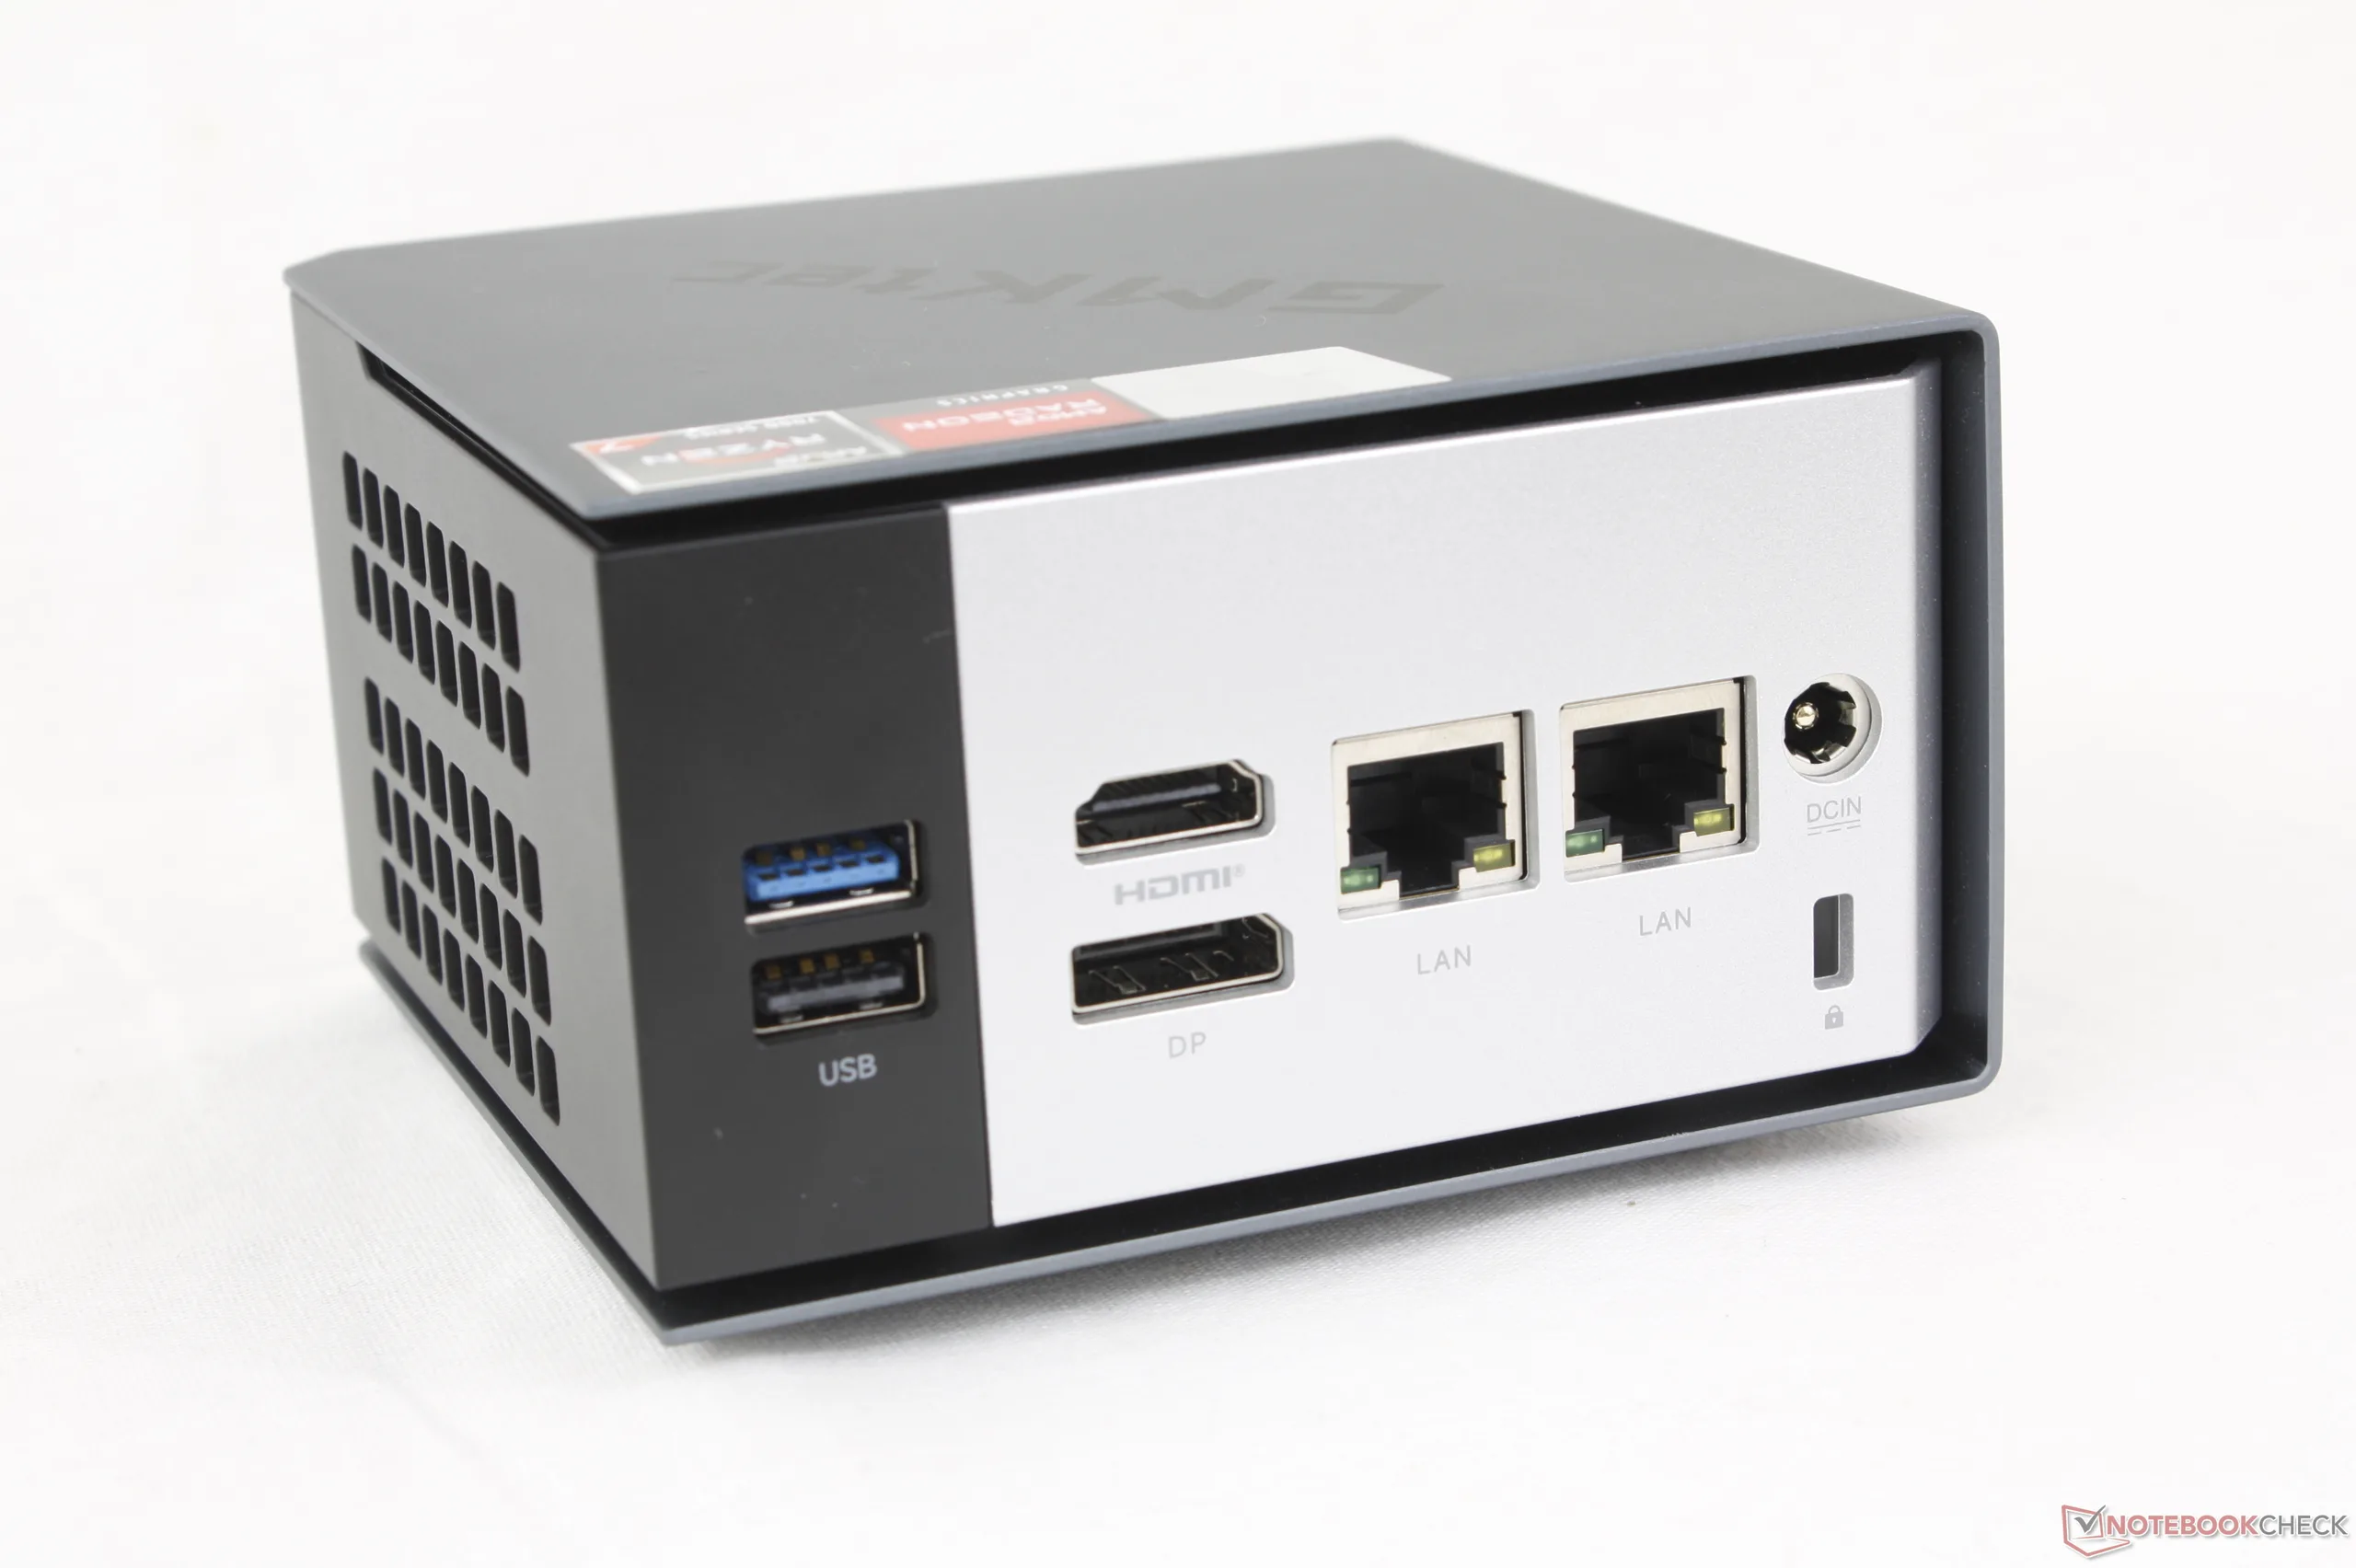
Lo chassis è identico a quello dell'EVO-X1 dello scorso anno, che continua ad essere uno dei mini PC più piccoli della gamma GMKtec. Le opzioni delle porte non sono cambiate, compresa l'importantissima porta Oculink che aiuta a distinguere il modello dalla maggior parte dei mini PC concorrenti.
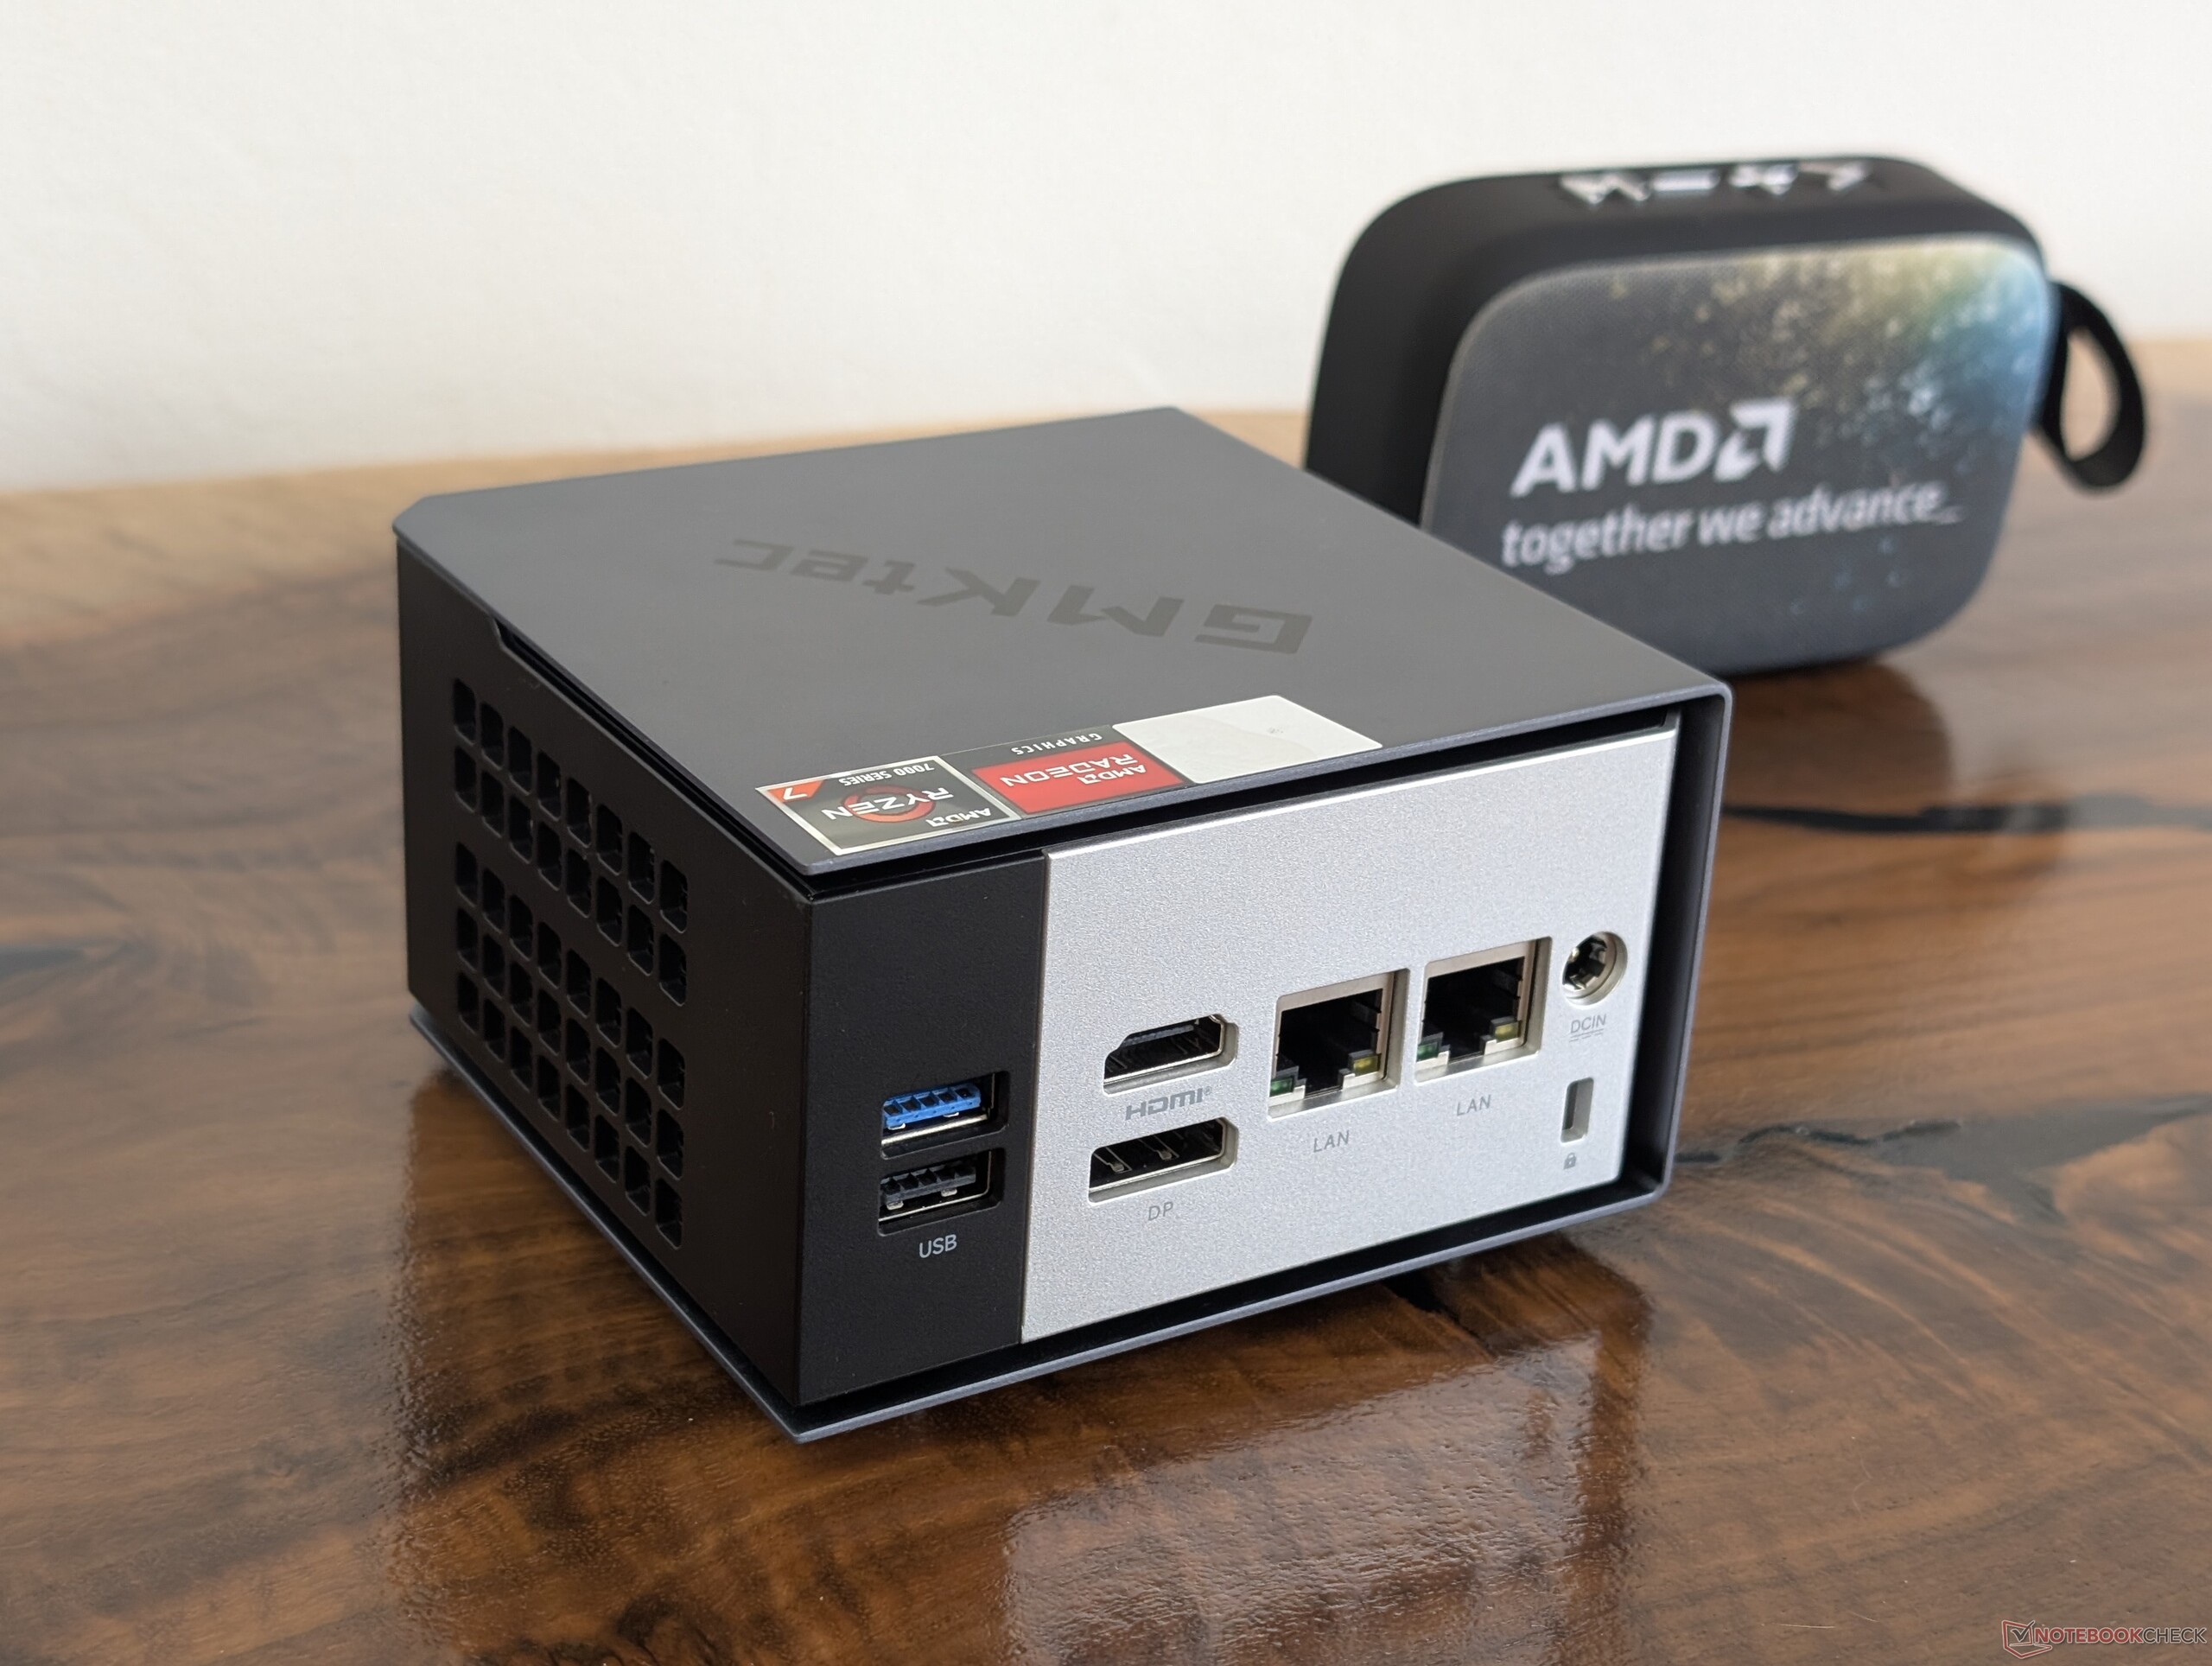
Connettività
Comunicazione
| Networking | |
| iperf3 transmit AXE11000 | |
| Asus NUC 15 Pro+ | |
| Geekom A7 Max, R9 7940HS | |
| MSI Cubi NUC AI+ 2MG | |
| GMK NucBox K16 | |
| GMK NucBox K13 | |
| Beelink SER9 Pro | |
| iperf3 receive AXE11000 | |
| Asus NUC 15 Pro+ | |
| MSI Cubi NUC AI+ 2MG | |
| Geekom A7 Max, R9 7940HS | |
| Beelink SER9 Pro | |
| GMK NucBox K13 | |
| GMK NucBox K16 | |
| iperf3 transmit AXE11000 6GHz | |
| GMK NucBox K16 | |
| Asus NUC 15 Pro+ | |
| MSI Cubi NUC AI+ 2MG | |
| GMK NucBox K13 | |
| Geekom A7 Max, R9 7940HS | |
| iperf3 receive AXE11000 6GHz | |
| GMK NucBox K16 | |
| GMK NucBox K13 | |
| MSI Cubi NUC AI+ 2MG | |
| Asus NUC 15 Pro+ | |
| Geekom A7 Max, R9 7940HS | |
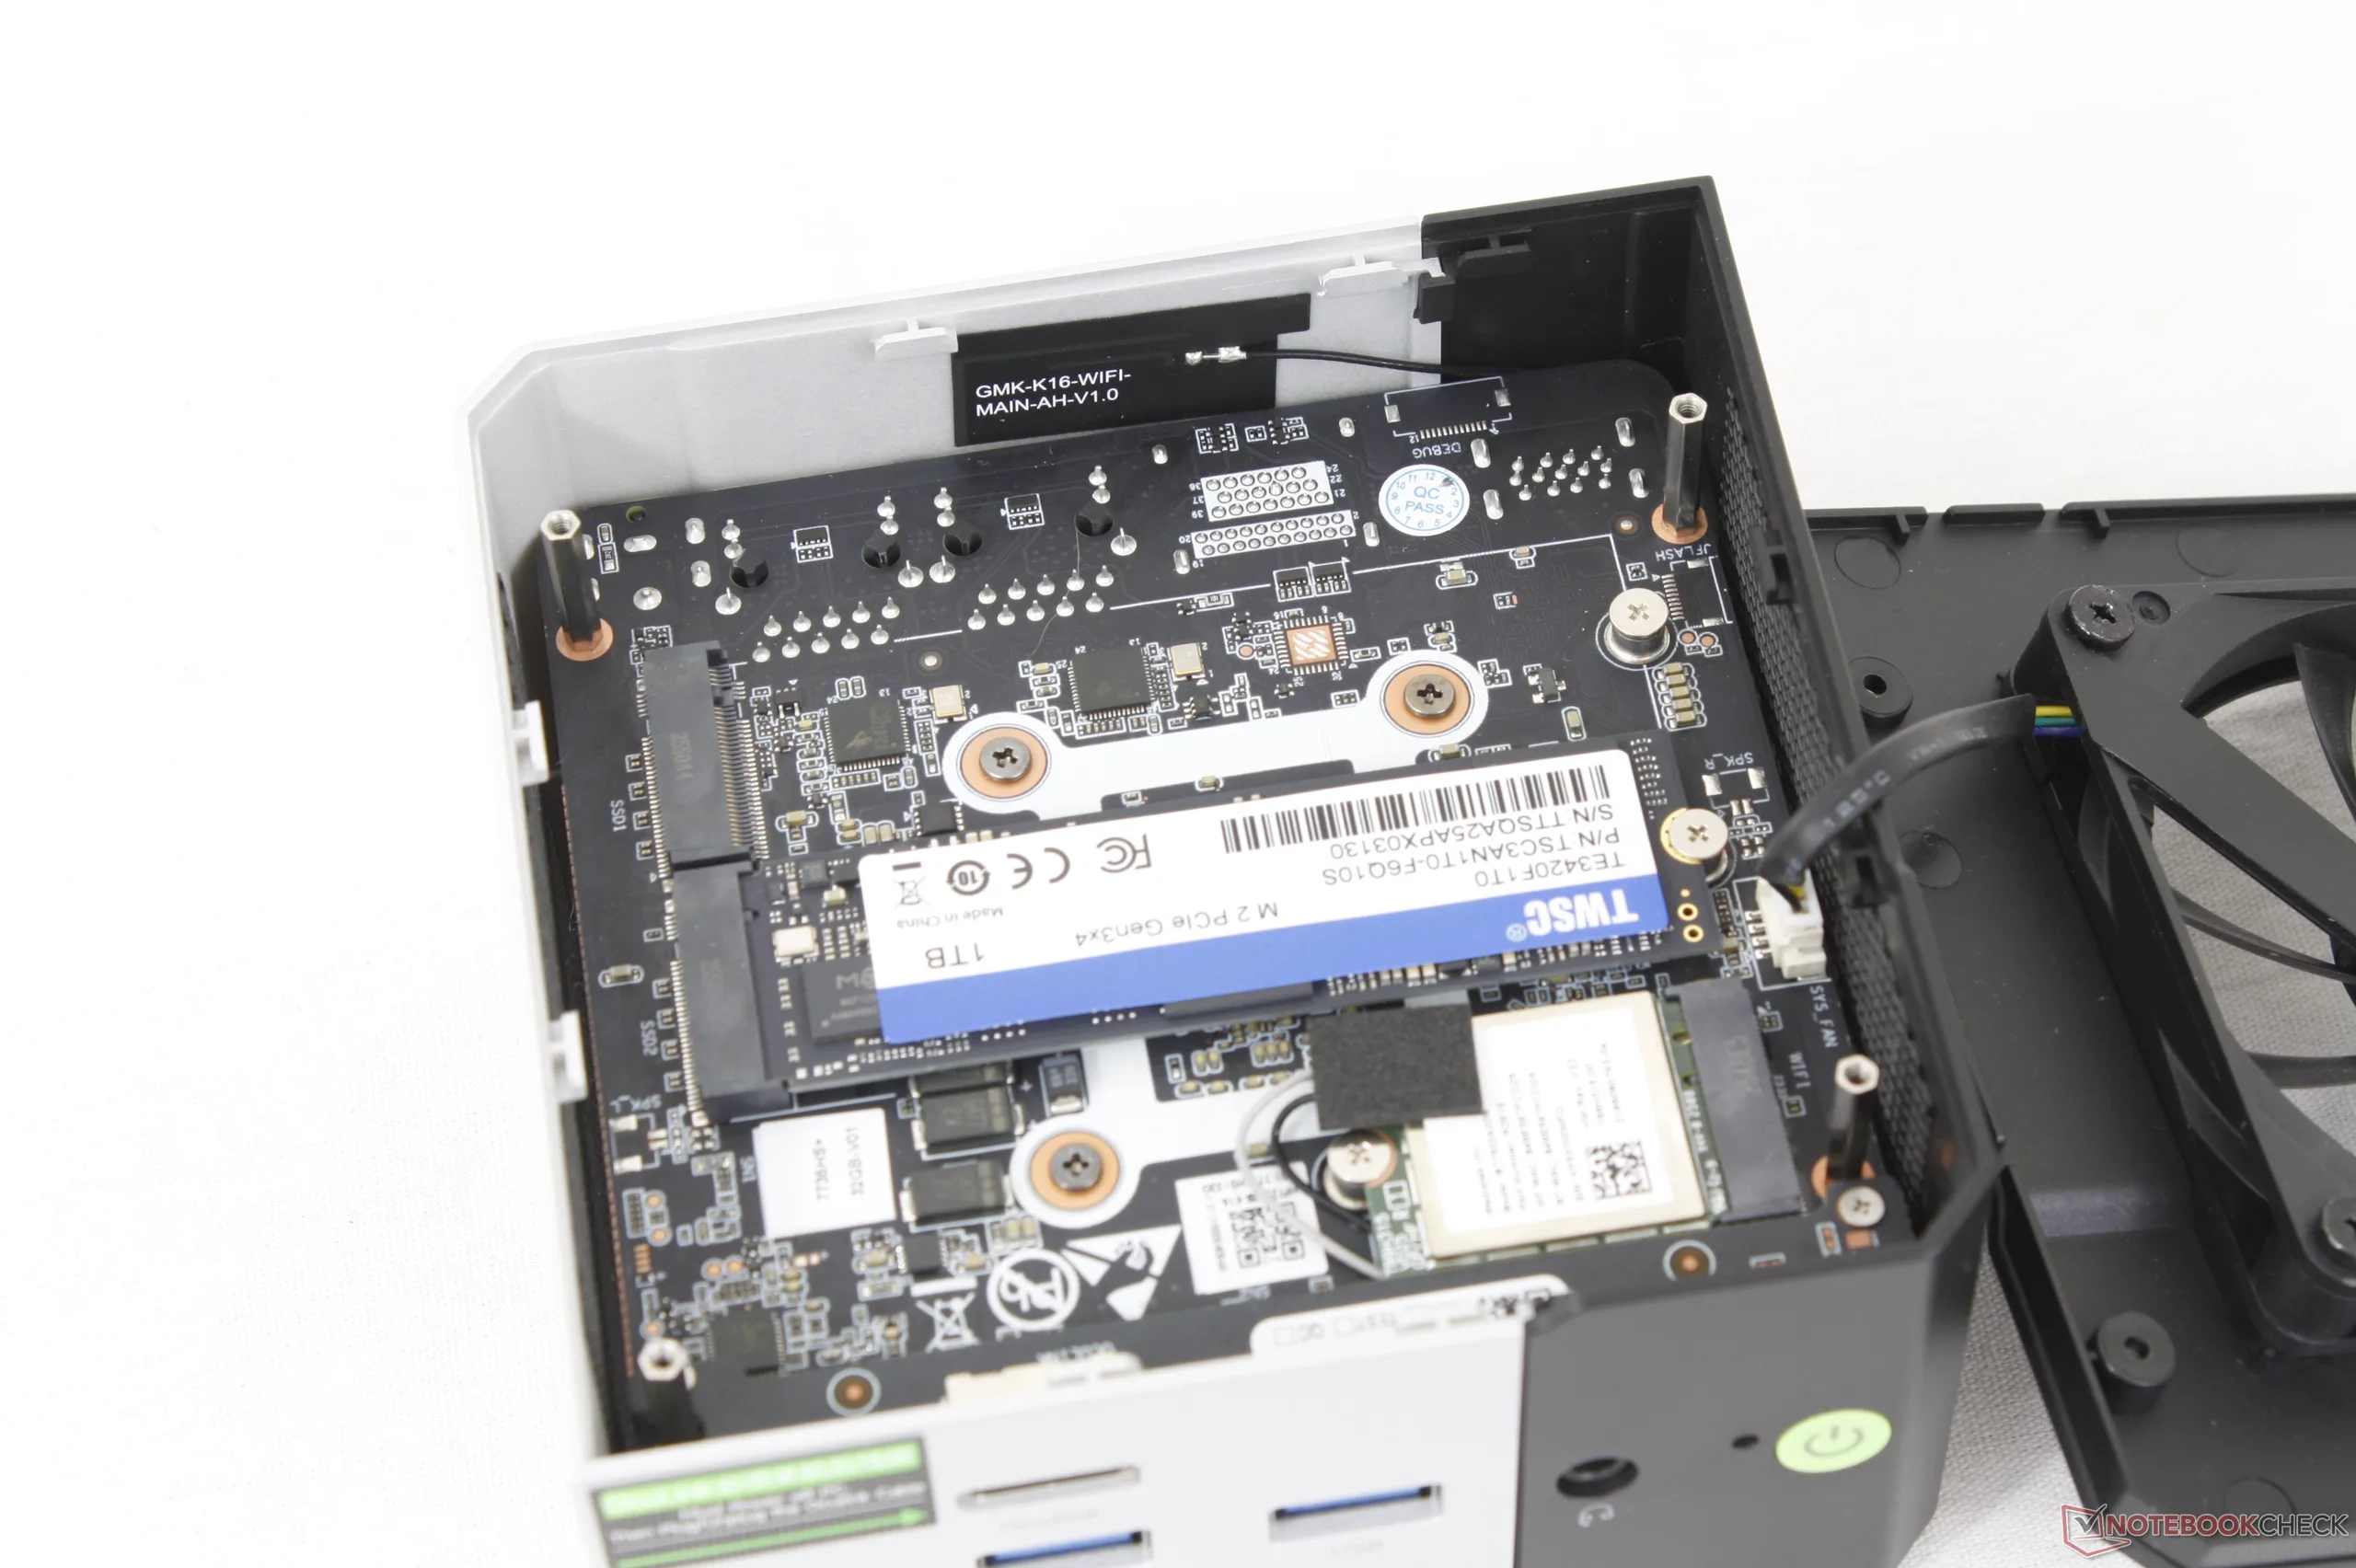
Manutenzione
Sostenibilità
Il produttore non elenca esplicitamente i materiali riciclati utilizzati durante la produzione. Per il resto, la confezione è tutta in carta e plastica, tranne l'involucro esterno in plastica.
Accessori e garanzia
La confezione di vendita include un cavo HDMI, oltre al consueto adattatore CA e alla documentazione cartacea.
La garanzia standard limitata di un anno del produttore si applica quando viene acquistato negli Stati Uniti.
Prestazioni
Condizioni del test
Abbiamo impostato il sistema in modalità Performance tramite il BIOS prima di eseguire i benchmark qui sotto. Si noti che il sistema viene fornito in modalità Bilanciata per impostazione predefinita.
Processore
Il Ryzen 7 7735HS può darsi che stia invecchiando, ma le prestazioni del processore grezzo sono ancora decenti, con risultati paragonabili a quelli del più recente Core Ultra 5 125H o circa il 20-25% più veloce del più efficiente Core Ultra 7 256V. Si noti che, a differenza di molte CPU più recenti, il processore Ryzen 7 7735HS non dispone di una NPU integrata necessaria per le funzioni AI locali come Co-Pilot+.
Cinebench R15 Multi Loop
Cinebench R23: Multi Core | Single Core
Cinebench R20: CPU (Multi Core) | CPU (Single Core)
Cinebench R15: CPU Multi 64Bit | CPU Single 64Bit
Blender: v2.79 BMW27 CPU
7-Zip 18.03: 7z b 4 | 7z b 4 -mmt1
Geekbench 6.7: Multi-Core | Single-Core
Geekbench 5.5: Multi-Core | Single-Core
HWBOT x265 Benchmark v2.2: 4k Preset
LibreOffice : 20 Documents To PDF
R Benchmark 2.5: Overall mean
| CPU Performance rating | |
| Asus NUC 15 Pro+ | |
| Khadas Mind Pro | |
| Beelink SER9 Pro | |
| Geekom A7 Max, R9 7940HS | |
| GMK NucBox K13 | |
| MSI Cubi NUC AI+ 2MG | |
| Media AMD Ryzen 7 7735HS | |
| GMK NucBox M7 Ultra | |
| GMK NucBox M3 Ultra | |
| GMK NucBox K16 | |
| MSI Cubi NUC 1M | |
| Minix Elite EU512-AI -2! | |
| BMAX B4 Turbo | |
| Cinebench R20 / CPU (Multi Core) | |
| Asus NUC 15 Pro+ | |
| Khadas Mind Pro | |
| Geekom A7 Max, R9 7940HS | |
| Beelink SER9 Pro | |
| Minix Elite EU512-AI | |
| GMK NucBox M7 Ultra | |
| GMK NucBox K16 | |
| Media AMD Ryzen 7 7735HS (3968 - 5502, n=15) | |
| GMK NucBox K13 | |
| MSI Cubi NUC AI+ 2MG | |
| GMK NucBox M3 Ultra | |
| MSI Cubi NUC 1M | |
| BMAX B4 Turbo | |
| Cinebench R20 / CPU (Single Core) | |
| Asus NUC 15 Pro+ | |
| Khadas Mind Pro | |
| MSI Cubi NUC AI+ 2MG | |
| GMK NucBox K13 | |
| MSI Cubi NUC 1M | |
| GMK NucBox M3 Ultra | |
| Geekom A7 Max, R9 7940HS | |
| Beelink SER9 Pro | |
| Minix Elite EU512-AI | |
| Media AMD Ryzen 7 7735HS (502 - 613, n=15) | |
| GMK NucBox K16 | |
| GMK NucBox M7 Ultra | |
| BMAX B4 Turbo | |
| Cinebench R15 / CPU Multi 64Bit | |
| Asus NUC 15 Pro+ | |
| Khadas Mind Pro | |
| Geekom A7 Max, R9 7940HS | |
| Beelink SER9 Pro | |
| Media AMD Ryzen 7 7735HS (1758 - 2355, n=17) | |
| GMK NucBox M7 Ultra | |
| Minix Elite EU512-AI | |
| GMK NucBox K16 | |
| GMK NucBox K13 | |
| GMK NucBox M3 Ultra | |
| MSI Cubi NUC AI+ 2MG | |
| MSI Cubi NUC 1M | |
| BMAX B4 Turbo | |
| Cinebench R15 / CPU Single 64Bit | |
| Asus NUC 15 Pro+ | |
| Khadas Mind Pro | |
| MSI Cubi NUC AI+ 2MG | |
| GMK NucBox K13 | |
| Geekom A7 Max, R9 7940HS | |
| Beelink SER9 Pro | |
| MSI Cubi NUC 1M | |
| GMK NucBox M3 Ultra | |
| Media AMD Ryzen 7 7735HS (206 - 255, n=16) | |
| GMK NucBox M7 Ultra | |
| GMK NucBox K16 | |
| Minix Elite EU512-AI | |
| BMAX B4 Turbo | |
| Geekbench 6.7 / Multi-Core | |
| Asus NUC 15 Pro+ | |
| Khadas Mind Pro | |
| Beelink SER9 Pro | |
| GMK NucBox K13 | |
| Geekom A7 Max, R9 7940HS | |
| GMK NucBox M7 Ultra | |
| Media AMD Ryzen 7 7735HS (7046 - 11035, n=9) | |
| MSI Cubi NUC AI+ 2MG | |
| MSI Cubi NUC 1M | |
| GMK NucBox M3 Ultra | |
| GMK NucBox K16 | |
| BMAX B4 Turbo | |
| Geekbench 6.7 / Single-Core | |
| Khadas Mind Pro | |
| GMK NucBox K13 | |
| MSI Cubi NUC AI+ 2MG | |
| Asus NUC 15 Pro+ | |
| MSI Cubi NUC 1M | |
| Geekom A7 Max, R9 7940HS | |
| Beelink SER9 Pro | |
| GMK NucBox M3 Ultra | |
| Media AMD Ryzen 7 7735HS (1949 - 2153, n=9) | |
| GMK NucBox M7 Ultra | |
| GMK NucBox K16 | |
| BMAX B4 Turbo | |
| HWBOT x265 Benchmark v2.2 / 4k Preset | |
| Asus NUC 15 Pro+ | |
| Khadas Mind Pro | |
| Beelink SER9 Pro | |
| Geekom A7 Max, R9 7940HS | |
| GMK NucBox M7 Ultra | |
| Media AMD Ryzen 7 7735HS (10.8 - 17.9, n=15) | |
| Minix Elite EU512-AI | |
| GMK NucBox K13 | |
| MSI Cubi NUC AI+ 2MG | |
| GMK NucBox K16 | |
| GMK NucBox M3 Ultra | |
| MSI Cubi NUC 1M | |
| BMAX B4 Turbo | |
| LibreOffice / 20 Documents To PDF | |
| BMAX B4 Turbo | |
| GMK NucBox M7 Ultra | |
| Minix Elite EU512-AI | |
| GMK NucBox M3 Ultra | |
| GMK NucBox K16 | |
| Asus NUC 15 Pro+ | |
| Media AMD Ryzen 7 7735HS (44.3 - 63.9, n=15) | |
| Geekom A7 Max, R9 7940HS | |
| Beelink SER9 Pro | |
| GMK NucBox K13 | |
| Khadas Mind Pro | |
| MSI Cubi NUC AI+ 2MG | |
| MSI Cubi NUC 1M | |
Cinebench R23: Multi Core | Single Core
Cinebench R20: CPU (Multi Core) | CPU (Single Core)
Cinebench R15: CPU Multi 64Bit | CPU Single 64Bit
Blender: v2.79 BMW27 CPU
7-Zip 18.03: 7z b 4 | 7z b 4 -mmt1
Geekbench 6.7: Multi-Core | Single-Core
Geekbench 5.5: Multi-Core | Single-Core
HWBOT x265 Benchmark v2.2: 4k Preset
LibreOffice : 20 Documents To PDF
R Benchmark 2.5: Overall mean
* ... Meglio usare valori piccoli
AIDA64: FP32 Ray-Trace | FPU Julia | CPU SHA3 | CPU Queen | FPU SinJulia | FPU Mandel | CPU AES | CPU ZLib | FP64 Ray-Trace | CPU PhotoWorxx | CPU CheckMate
| Performance rating | |
| Beelink SER9 Pro -1! | |
| Geekom A7 Max, R9 7940HS -1! | |
| Asus NUC 15 Pro+ -1! | |
| Media AMD Ryzen 7 7735HS | |
| GMK NucBox K16 -1! | |
| GMK NucBox K13 -1! | |
| MSI Cubi NUC AI+ 2MG -1! | |
| AIDA64 / FP32 Ray-Trace | |
| Beelink SER9 Pro (v6.92.6600) | |
| Geekom A7 Max, R9 7940HS (v6.92.6600) | |
| Asus NUC 15 Pro+ (v6.92.6600) | |
| GMK NucBox K16 (v8.20.8100) | |
| Media AMD Ryzen 7 7735HS (11831 - 17161, n=16) | |
| GMK NucBox K13 (v8.20.8100) | |
| MSI Cubi NUC AI+ 2MG (v6.92.6600) | |
| AIDA64 / FPU Julia | |
| Asus NUC 15 Pro+ (v6.92.6600) | |
| Geekom A7 Max, R9 7940HS (v6.92.6600) | |
| Beelink SER9 Pro (v6.92.6600) | |
| GMK NucBox K16 (v8.20.8100) | |
| Media AMD Ryzen 7 7735HS (75370 - 105483, n=16) | |
| GMK NucBox K13 (v8.20.8100) | |
| MSI Cubi NUC AI+ 2MG (v6.92.6600) | |
| AIDA64 / CPU SHA3 | |
| Asus NUC 15 Pro+ (v6.92.6600) | |
| Geekom A7 Max, R9 7940HS (v6.92.6600) | |
| Beelink SER9 Pro (v6.92.6600) | |
| GMK NucBox K16 (v8.20.8100) | |
| Media AMD Ryzen 7 7735HS (2499 - 3494, n=16) | |
| GMK NucBox K13 (v8.20.8100) | |
| MSI Cubi NUC AI+ 2MG (v6.92.6600) | |
| AIDA64 / CPU Queen | |
| Geekom A7 Max, R9 7940HS (v6.92.6600) | |
| Beelink SER9 Pro (v6.92.6600) | |
| Media AMD Ryzen 7 7735HS (87486 - 108729, n=15) | |
| Asus NUC 15 Pro+ (v6.92.6600) | |
| MSI Cubi NUC AI+ 2MG (v6.92.6600) | |
| AIDA64 / FPU SinJulia | |
| Beelink SER9 Pro (v6.92.6600) | |
| Geekom A7 Max, R9 7940HS (v6.92.6600) | |
| GMK NucBox K16 (v8.20.8100) | |
| Media AMD Ryzen 7 7735HS (11233 - 13097, n=16) | |
| Asus NUC 15 Pro+ (v6.92.6600) | |
| GMK NucBox K13 (v8.20.8100) | |
| MSI Cubi NUC AI+ 2MG (v6.92.6600) | |
| AIDA64 / FPU Mandel | |
| Asus NUC 15 Pro+ (v6.92.6600) | |
| Geekom A7 Max, R9 7940HS (v6.92.6600) | |
| Beelink SER9 Pro (v6.92.6600) | |
| GMK NucBox K16 (v8.20.8100) | |
| Media AMD Ryzen 7 7735HS (41400 - 58232, n=16) | |
| GMK NucBox K13 (v8.20.8100) | |
| MSI Cubi NUC AI+ 2MG (v6.92.6600) | |
| AIDA64 / CPU AES | |
| Geekom A7 Max, R9 7940HS (v6.92.6600) | |
| Beelink SER9 Pro (v6.92.6600) | |
| Asus NUC 15 Pro+ (v6.92.6600) | |
| Media AMD Ryzen 7 7735HS (44013 - 137629, n=16) | |
| GMK NucBox K13 (v8.20.8100) | |
| GMK NucBox K16 (v8.20.8100) | |
| MSI Cubi NUC AI+ 2MG (v6.92.6600) | |
| AIDA64 / CPU ZLib | |
| Asus NUC 15 Pro+ (v6.92.6600) | |
| Geekom A7 Max, R9 7940HS (v6.92.6600) | |
| Beelink SER9 Pro (v6.92.6600) | |
| GMK NucBox K16 (v8.20.8100) | |
| Media AMD Ryzen 7 7735HS (651 - 906, n=16) | |
| GMK NucBox K13 (v8.20.8100) | |
| MSI Cubi NUC AI+ 2MG (v6.92.6600) | |
| AIDA64 / FP64 Ray-Trace | |
| Beelink SER9 Pro (v6.92.6600) | |
| Geekom A7 Max, R9 7940HS (v6.92.6600) | |
| Asus NUC 15 Pro+ (v6.92.6600) | |
| GMK NucBox K16 (v8.20.8100) | |
| Media AMD Ryzen 7 7735HS (1459 - 9094, n=16) | |
| GMK NucBox K13 (v8.20.8100) | |
| MSI Cubi NUC AI+ 2MG (v6.92.6600) | |
| AIDA64 / CPU PhotoWorxx | |
| GMK NucBox K13 (v8.20.8100) | |
| Asus NUC 15 Pro+ (v6.92.6600) | |
| MSI Cubi NUC AI+ 2MG (v6.92.6600) | |
| Beelink SER9 Pro (v6.92.6600) | |
| Media AMD Ryzen 7 7735HS (17524 - 30542, n=16) | |
| Geekom A7 Max, R9 7940HS (v6.92.6600) | |
| GMK NucBox K16 (v8.20.8100) | |
| AIDA64 / CPU CheckMate | |
| GMK NucBox K16 (v8.20.8100) | |
| Media AMD Ryzen 7 7735HS (n=1) | |
| GMK NucBox K13 (v8.20.8100) | |
Prestazioni del sistema
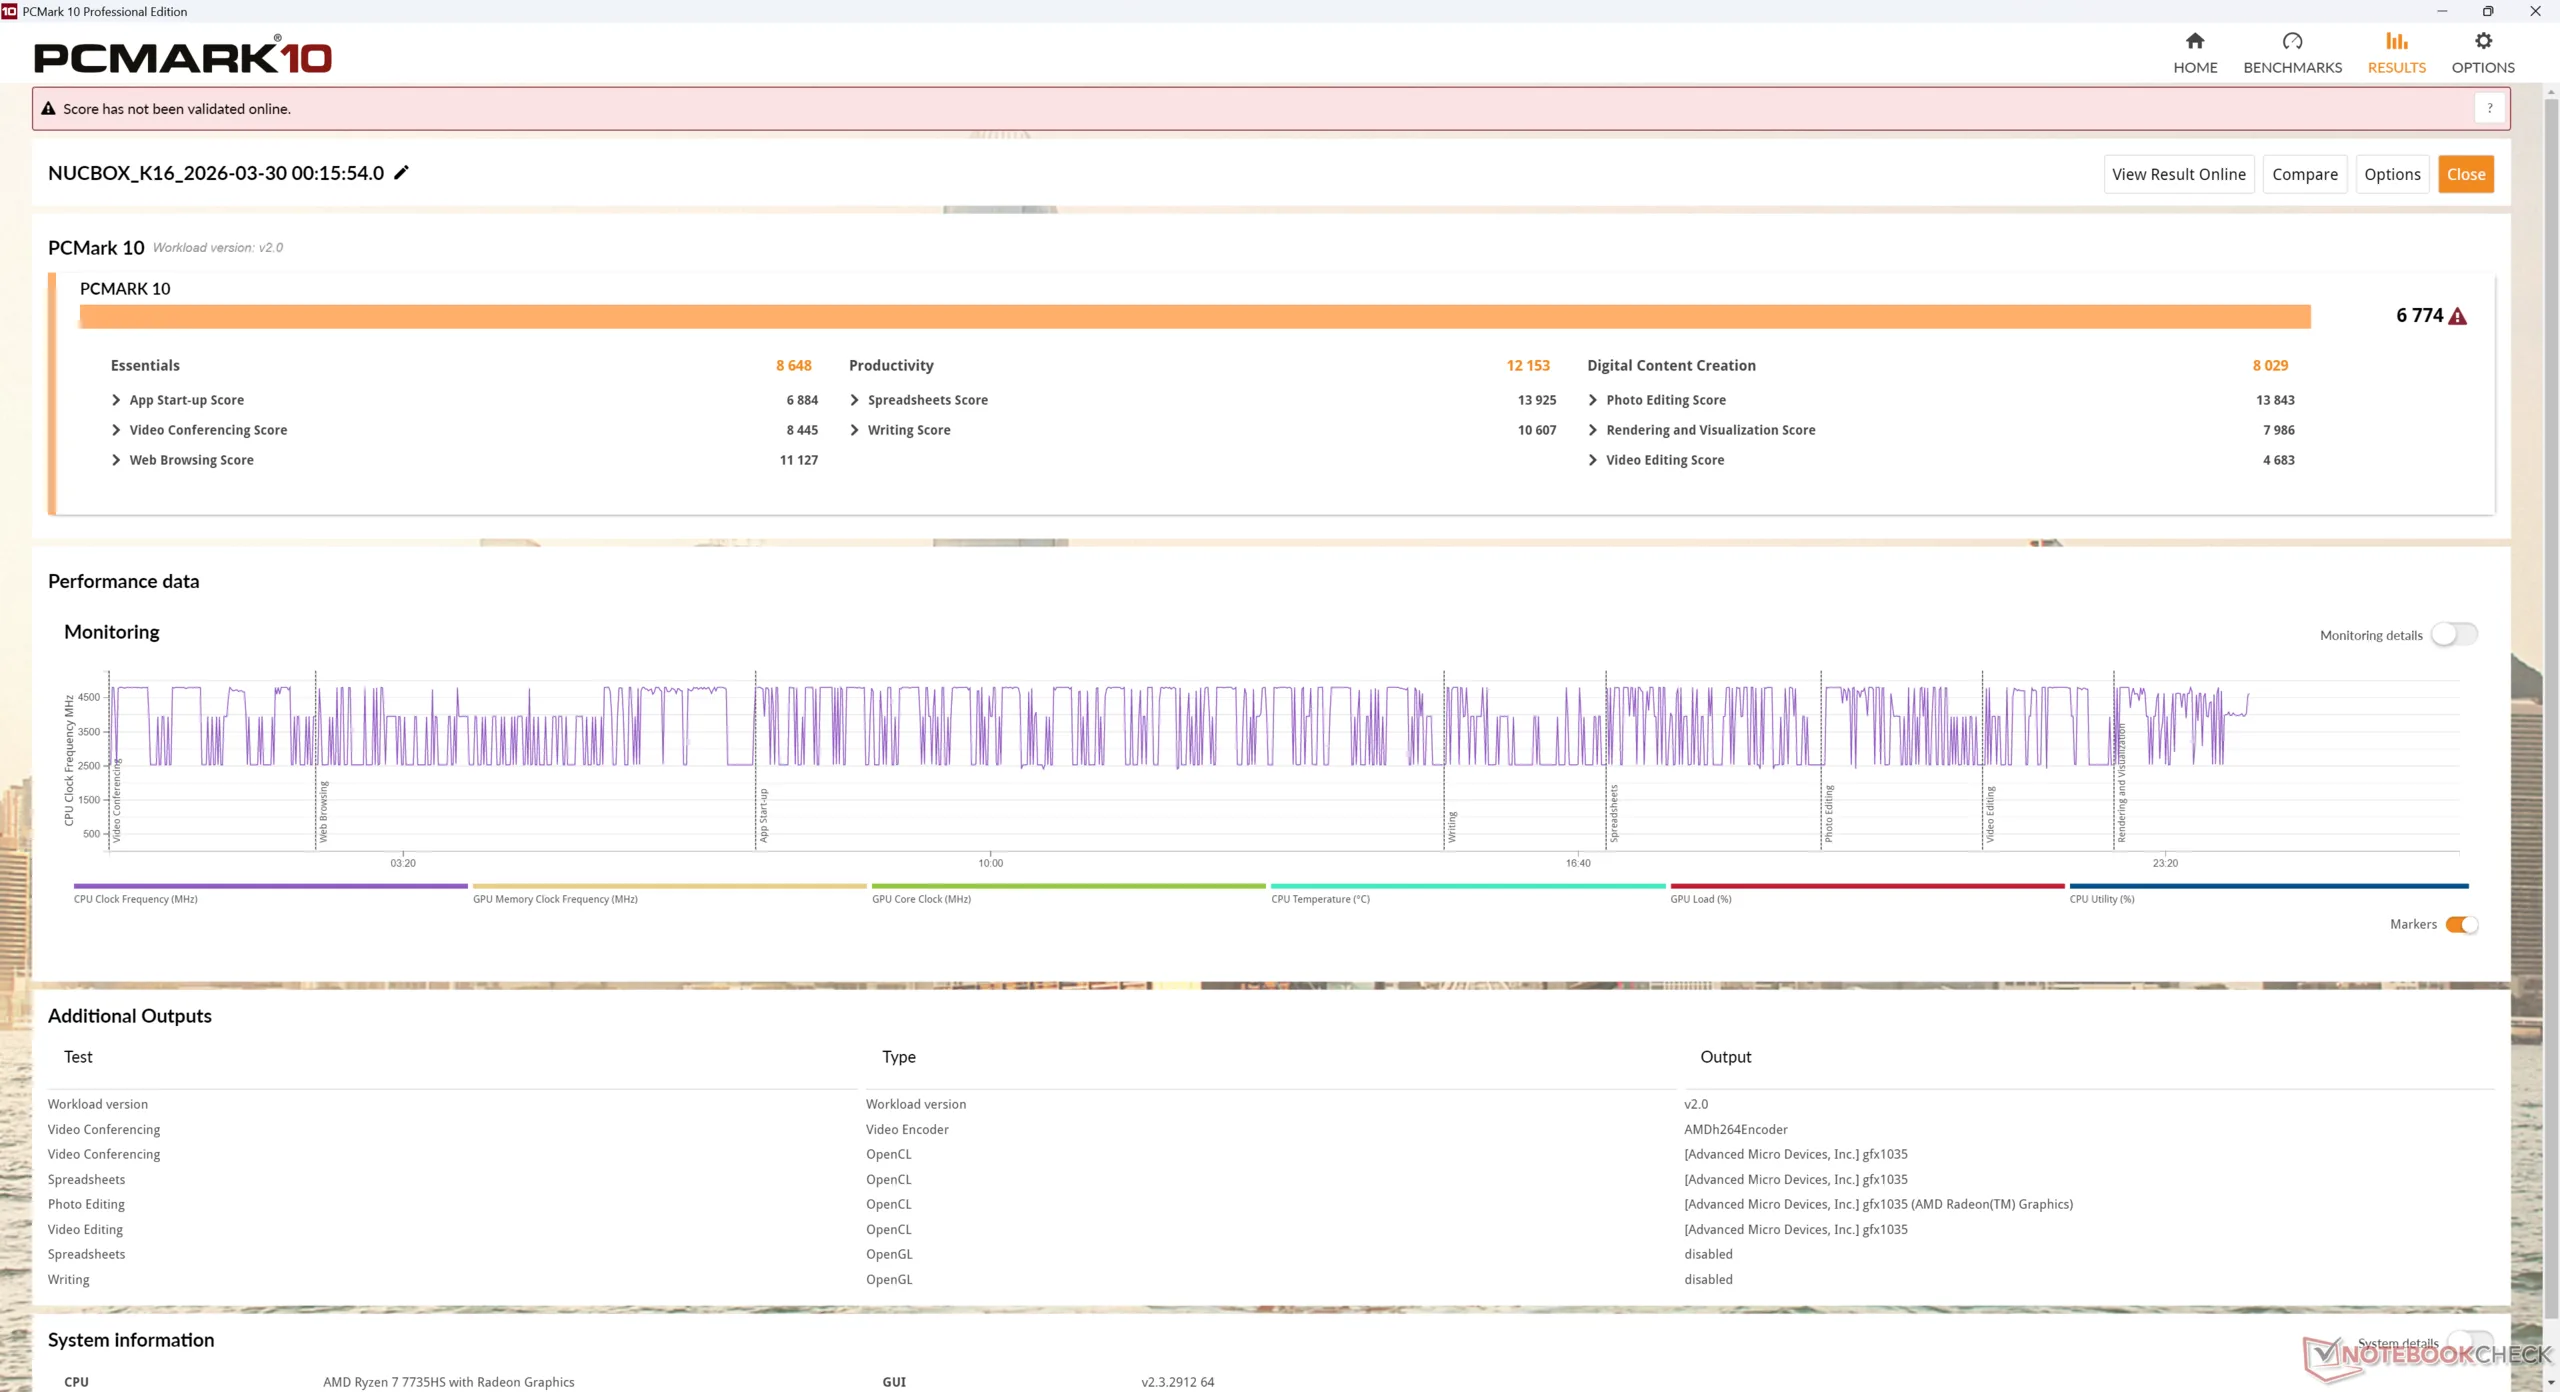
PCMark 10: Score | Essentials | Productivity | Digital Content Creation
CrossMark: Overall | Productivity | Creativity | Responsiveness
WebXPRT 3: Overall
WebXPRT 4: Overall
Mozilla Kraken 1.1: Total
| Performance rating | |
| GMK NucBox K13 | |
| Beelink SER9 Pro | |
| Asus NUC 15 Pro+ | |
| MSI Cubi NUC AI+ 2MG | |
| Geekom A7 Max, R9 7940HS | |
| Media AMD Ryzen 7 7735HS, AMD Radeon 680M | |
| GMK NucBox K16 | |
| PCMark 10 / Score | |
| GMK NucBox K13 | |
| Asus NUC 15 Pro+ | |
| Beelink SER9 Pro | |
| MSI Cubi NUC AI+ 2MG | |
| GMK NucBox K16 | |
| Geekom A7 Max, R9 7940HS | |
| Media AMD Ryzen 7 7735HS, AMD Radeon 680M (5722 - 7000, n=8) | |
| PCMark 10 / Essentials | |
| Beelink SER9 Pro | |
| Media AMD Ryzen 7 7735HS, AMD Radeon 680M (8648 - 11124, n=8) | |
| MSI Cubi NUC AI+ 2MG | |
| Geekom A7 Max, R9 7940HS | |
| GMK NucBox K13 | |
| Asus NUC 15 Pro+ | |
| GMK NucBox K16 | |
| PCMark 10 / Productivity | |
| GMK NucBox K13 | |
| GMK NucBox K16 | |
| Media AMD Ryzen 7 7735HS, AMD Radeon 680M (8428 - 12153, n=8) | |
| Geekom A7 Max, R9 7940HS | |
| Beelink SER9 Pro | |
| MSI Cubi NUC AI+ 2MG | |
| Asus NUC 15 Pro+ | |
| PCMark 10 / Digital Content Creation | |
| Asus NUC 15 Pro+ | |
| GMK NucBox K13 | |
| MSI Cubi NUC AI+ 2MG | |
| Beelink SER9 Pro | |
| Geekom A7 Max, R9 7940HS | |
| GMK NucBox K16 | |
| Media AMD Ryzen 7 7735HS, AMD Radeon 680M (5798 - 8726, n=8) | |
| CrossMark / Overall | |
| Beelink SER9 Pro | |
| Asus NUC 15 Pro+ | |
| GMK NucBox K13 | |
| Geekom A7 Max, R9 7940HS | |
| MSI Cubi NUC AI+ 2MG | |
| Media AMD Ryzen 7 7735HS, AMD Radeon 680M (1280 - 1736, n=8) | |
| GMK NucBox K16 | |
| CrossMark / Productivity | |
| Beelink SER9 Pro | |
| Geekom A7 Max, R9 7940HS | |
| GMK NucBox K13 | |
| Asus NUC 15 Pro+ | |
| Media AMD Ryzen 7 7735HS, AMD Radeon 680M (1336 - 1725, n=8) | |
| MSI Cubi NUC AI+ 2MG | |
| GMK NucBox K16 | |
| CrossMark / Creativity | |
| Asus NUC 15 Pro+ | |
| GMK NucBox K13 | |
| Beelink SER9 Pro | |
| MSI Cubi NUC AI+ 2MG | |
| Geekom A7 Max, R9 7940HS | |
| Media AMD Ryzen 7 7735HS, AMD Radeon 680M (1273 - 1785, n=8) | |
| GMK NucBox K16 | |
| CrossMark / Responsiveness | |
| Beelink SER9 Pro | |
| Geekom A7 Max, R9 7940HS | |
| Media AMD Ryzen 7 7735HS, AMD Radeon 680M (1144 - 1653, n=8) | |
| GMK NucBox K13 | |
| Asus NUC 15 Pro+ | |
| MSI Cubi NUC AI+ 2MG | |
| GMK NucBox K16 | |
| WebXPRT 3 / Overall | |
| MSI Cubi NUC AI+ 2MG | |
| Beelink SER9 Pro | |
| GMK NucBox K13 | |
| Geekom A7 Max, R9 7940HS | |
| Media AMD Ryzen 7 7735HS, AMD Radeon 680M (228 - 307, n=7) | |
| Asus NUC 15 Pro+ | |
| GMK NucBox K16 | |
| WebXPRT 4 / Overall | |
| GMK NucBox K13 | |
| MSI Cubi NUC AI+ 2MG | |
| Beelink SER9 Pro | |
| Geekom A7 Max, R9 7940HS | |
| Asus NUC 15 Pro+ | |
| Media AMD Ryzen 7 7735HS, AMD Radeon 680M (176 - 231, n=8) | |
| GMK NucBox K16 | |
| Mozilla Kraken 1.1 / Total | |
| GMK NucBox K16 | |
| Media AMD Ryzen 7 7735HS, AMD Radeon 680M (580 - 655, n=8) | |
| Beelink SER9 Pro | |
| Geekom A7 Max, R9 7940HS | |
| MSI Cubi NUC AI+ 2MG | |
| Asus NUC 15 Pro+ | |
| GMK NucBox K13 | |
* ... Meglio usare valori piccoli
| PCMark 10 Score | 6774 punti | |
Aiuto | ||
| AIDA64 / Memory Copy | |
| MSI Cubi NUC AI+ 2MG | |
| GMK NucBox K13 | |
| Asus NUC 15 Pro+ | |
| Beelink SER9 Pro | |
| Media AMD Ryzen 7 7735HS (30324 - 52012, n=16) | |
| GMK NucBox K16 | |
| Geekom A7 Max, R9 7940HS | |
| AIDA64 / Memory Read | |
| GMK NucBox K13 | |
| Asus NUC 15 Pro+ | |
| MSI Cubi NUC AI+ 2MG | |
| Beelink SER9 Pro | |
| Media AMD Ryzen 7 7735HS (33938 - 51856, n=16) | |
| GMK NucBox K16 | |
| Geekom A7 Max, R9 7940HS | |
| AIDA64 / Memory Write | |
| MSI Cubi NUC AI+ 2MG | |
| GMK NucBox K13 | |
| Beelink SER9 Pro | |
| Asus NUC 15 Pro+ | |
| Media AMD Ryzen 7 7735HS (33175 - 55284, n=16) | |
| GMK NucBox K16 | |
| Geekom A7 Max, R9 7940HS | |
| AIDA64 / Memory Latency | |
| GMK NucBox K16 | |
| Asus NUC 15 Pro+ | |
| Beelink SER9 Pro | |
| GMK NucBox K13 | |
| MSI Cubi NUC AI+ 2MG | |
| Geekom A7 Max, R9 7940HS | |
| Media AMD Ryzen 7 7735HS (78.2 - 109.8, n=16) | |
* ... Meglio usare valori piccoli
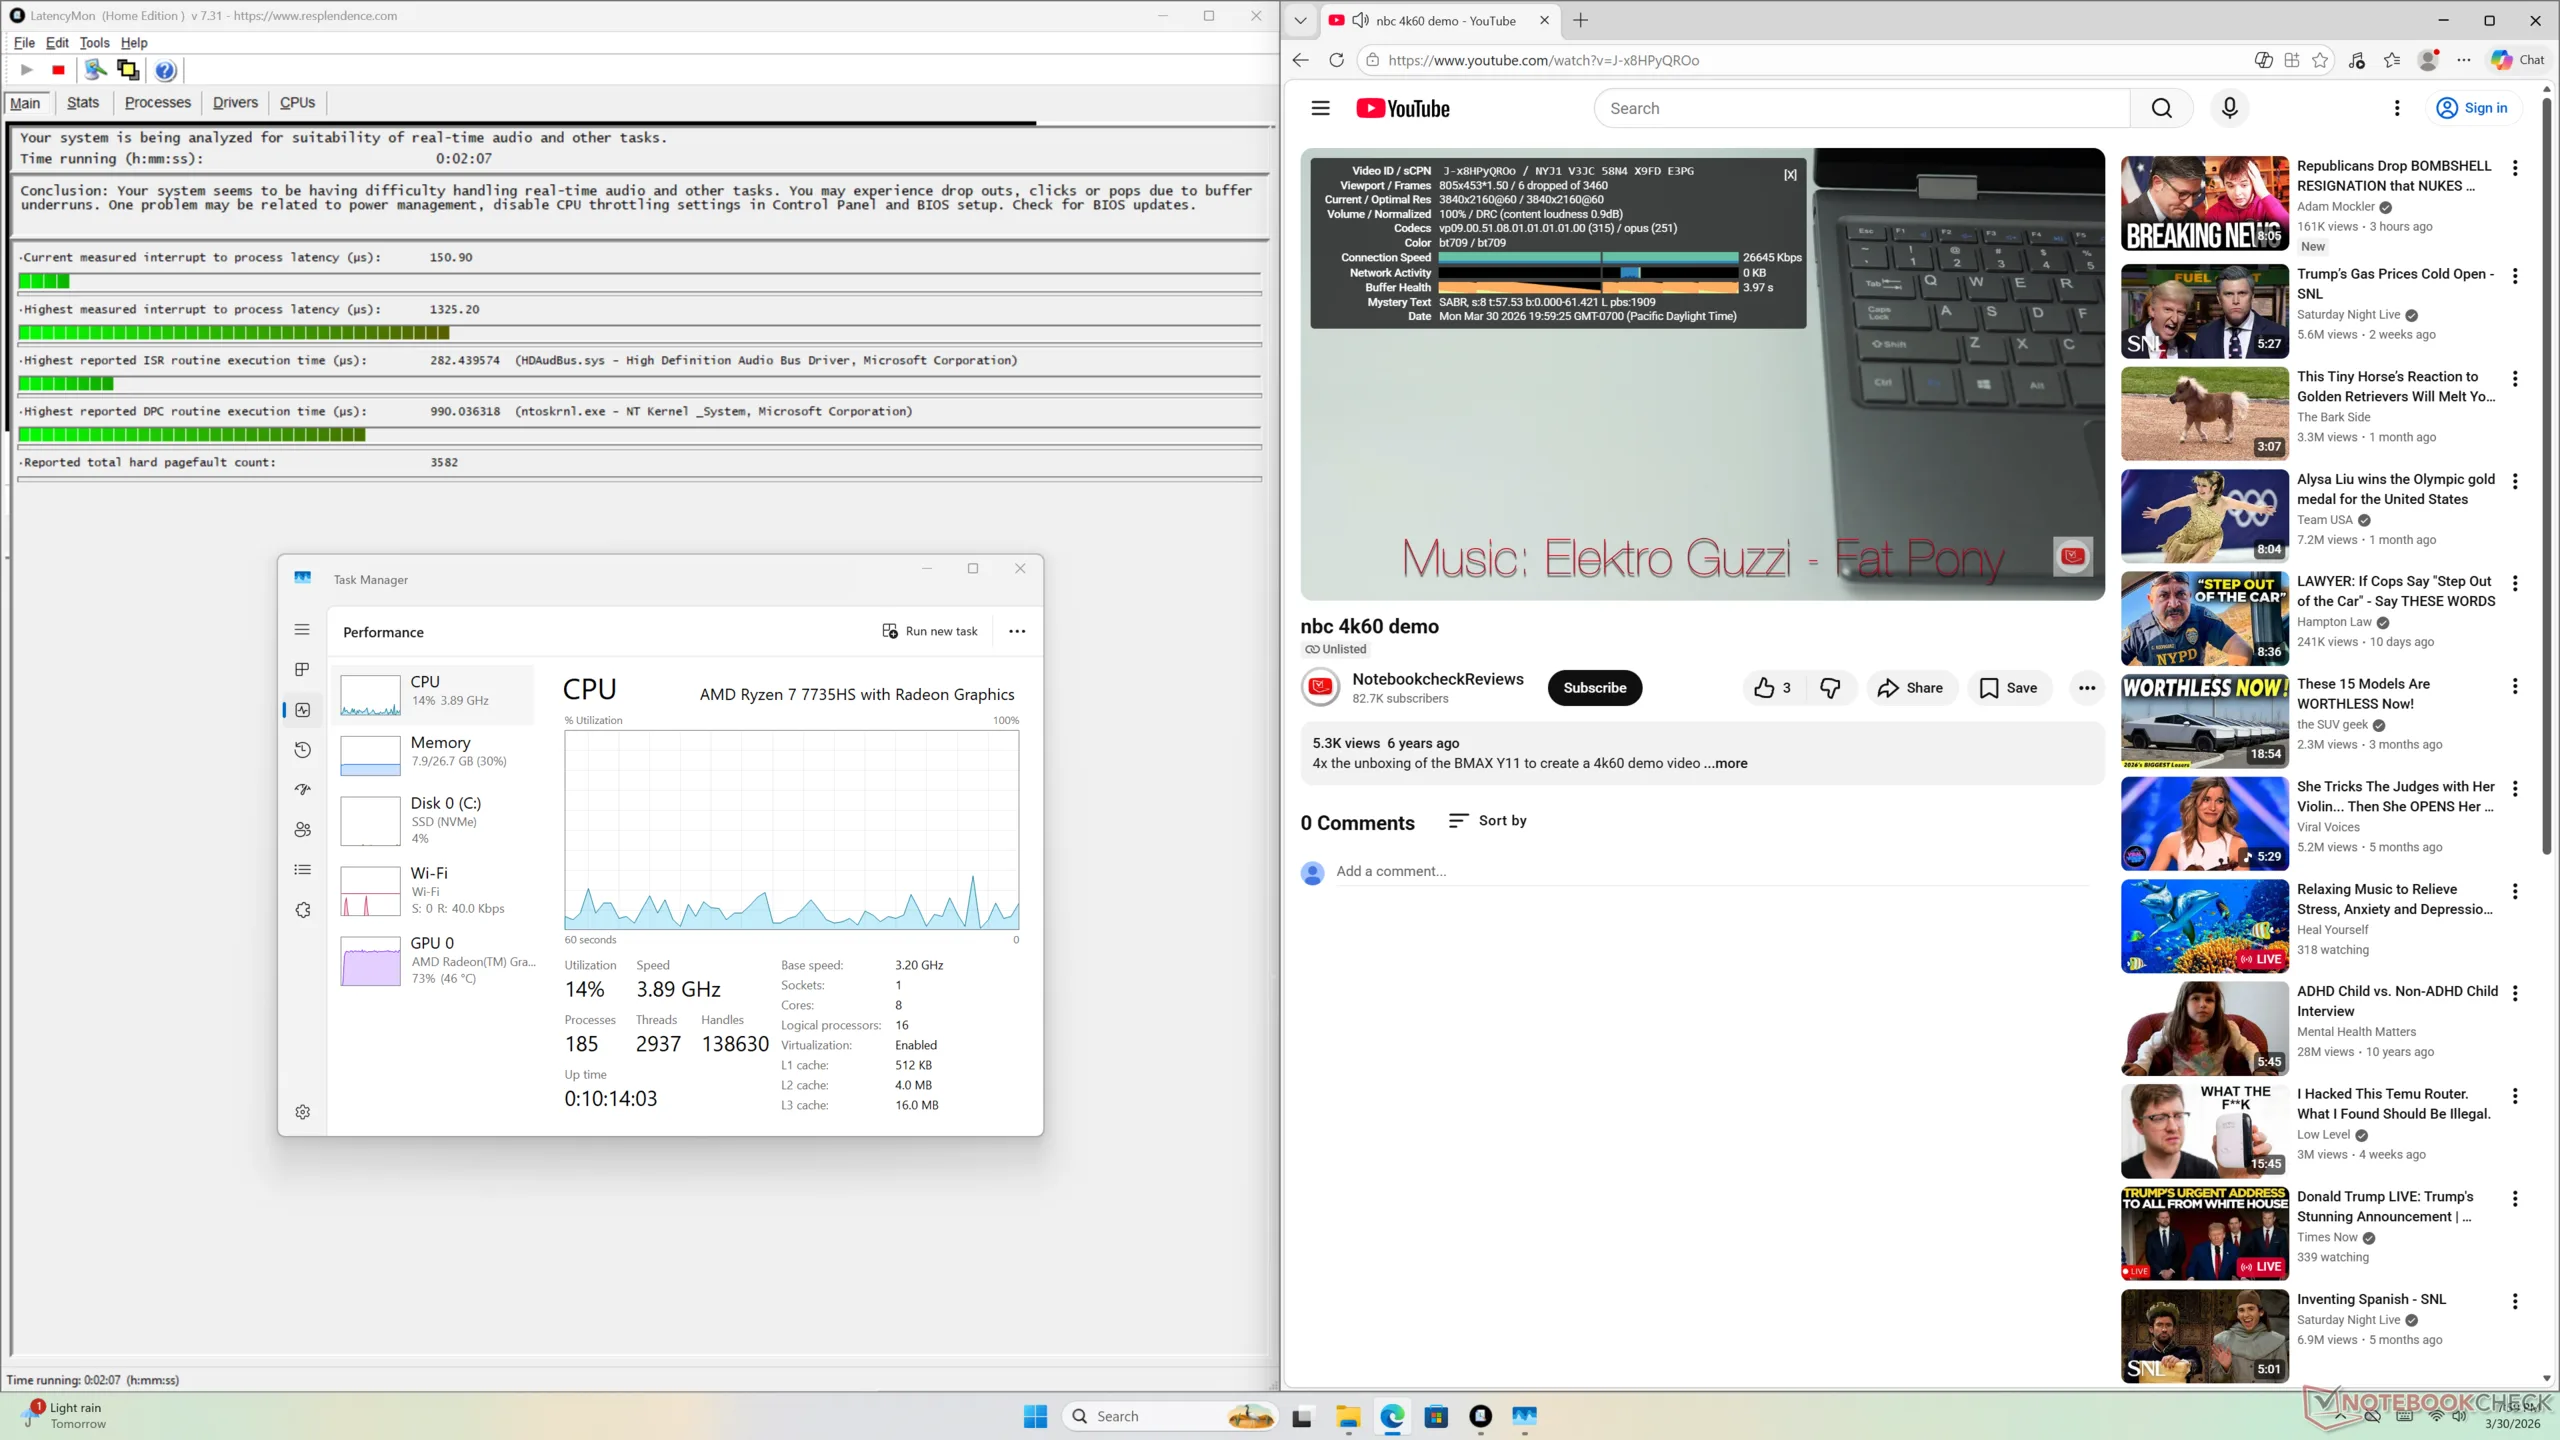
Latenza DPC
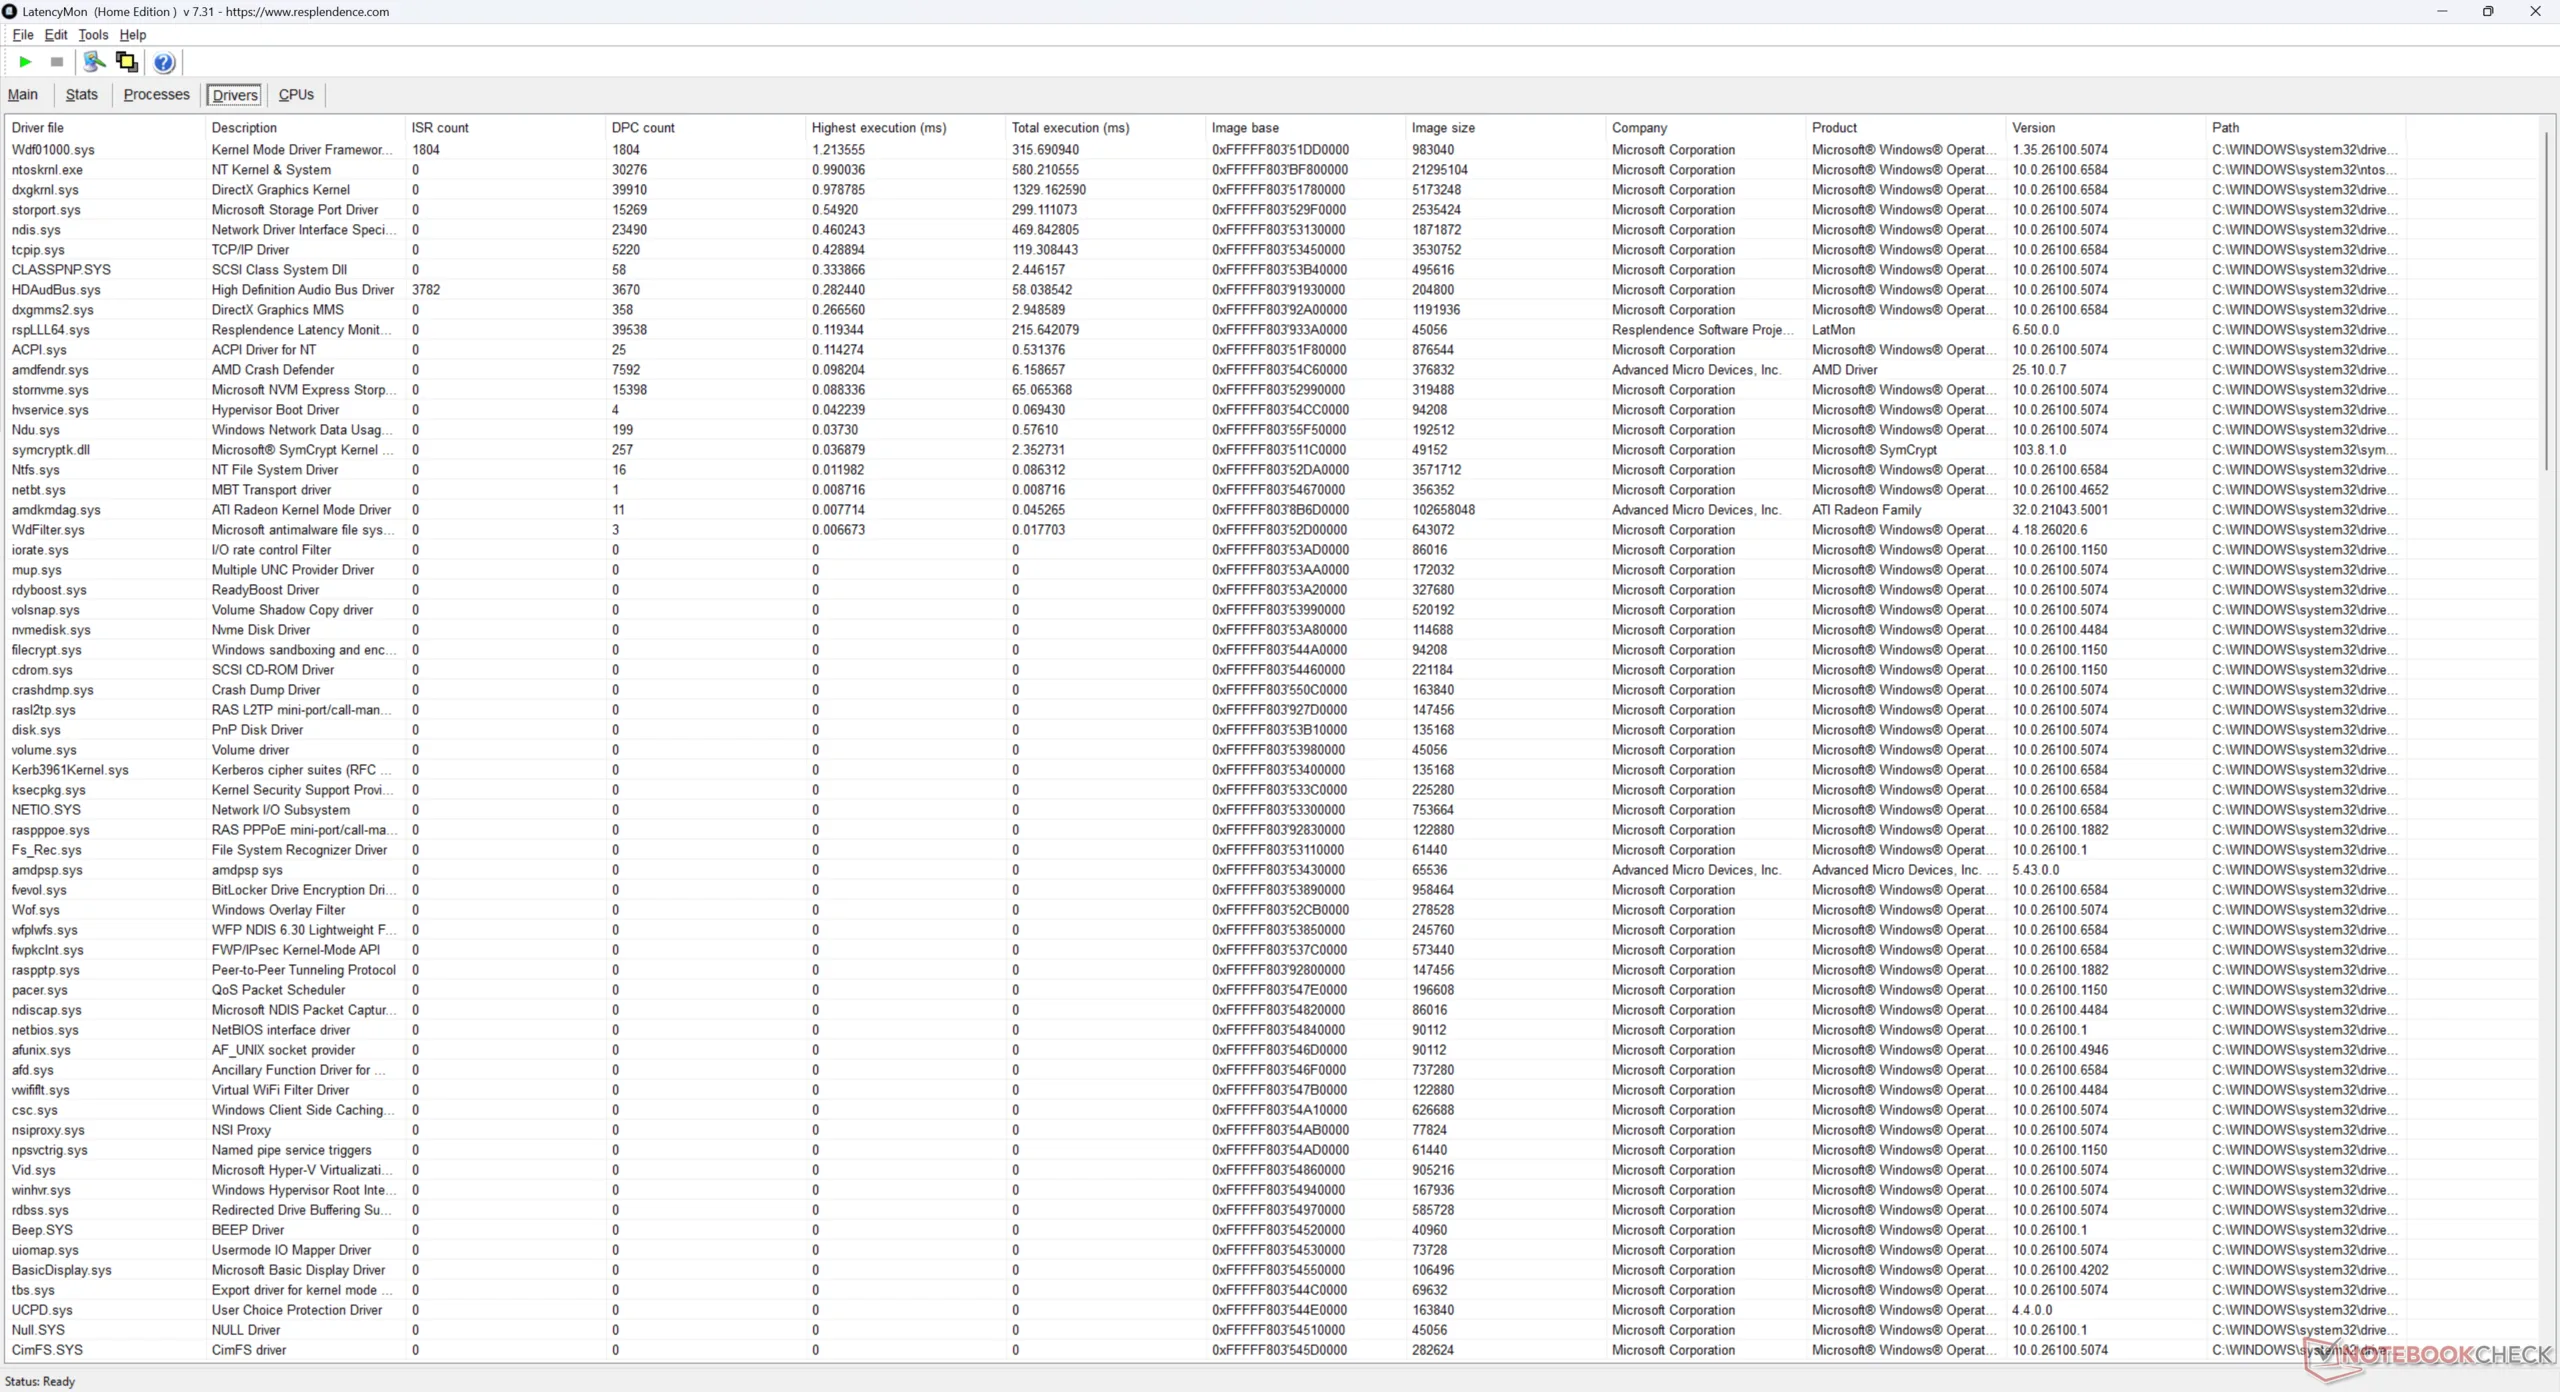
| DPC Latencies / LatencyMon - interrupt to process latency (max), Web, Youtube, Prime95 | |
| Geekom A7 Max, R9 7940HS | |
| GMK NucBox K13 | |
| GMK NucBox K16 | |
| Asus NUC 15 Pro+ | |
| MSI Cubi NUC AI+ 2MG | |
| Beelink SER9 Pro | |
* ... Meglio usare valori piccoli
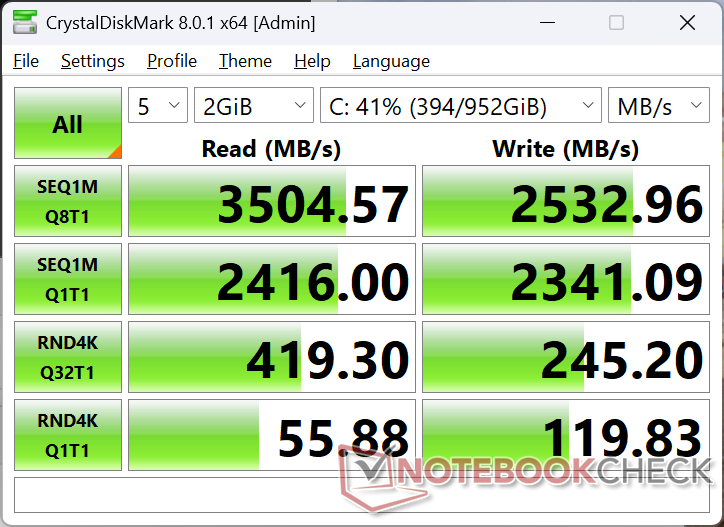
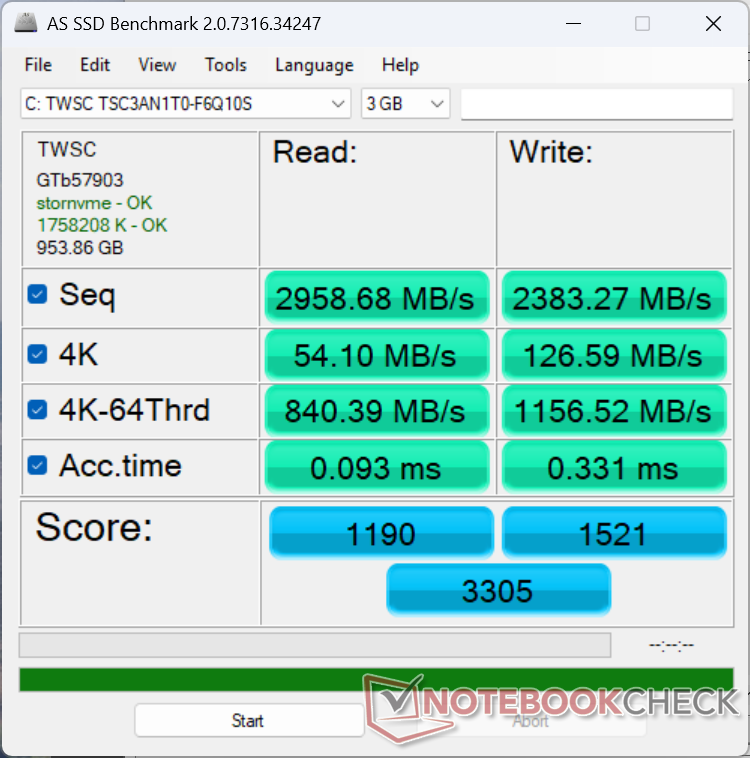
Dispositivi di archiviazione
La nostra unità di prova viene fornita con un TWSC TSC3AN1T0-F6Q10S al posto della Crucial P3 Plus, presente sul più costoso EVO-X1 dello scorso anno, probabilmente per risparmiare sui costi. Le prestazioni sono un po' più lente, con velocità di trasferimento che raggiungono i 3500 MB/s, come dimostrato dal nostro stress test qui sotto.

| Drive Performance rating - Percent | |
| Geekom A7 Max, R9 7940HS | |
| Asus NUC 15 Pro+ | |
| Beelink SER9 Pro | |
| MSI Cubi NUC AI+ 2MG | |
| GMK NucBox K13 | |
| GMK NucBox K16 | |
* ... Meglio usare valori piccoli
Strozzatura del disco: DiskSpd Lettura in loop, Profondità coda 8
Prestazioni della GPU
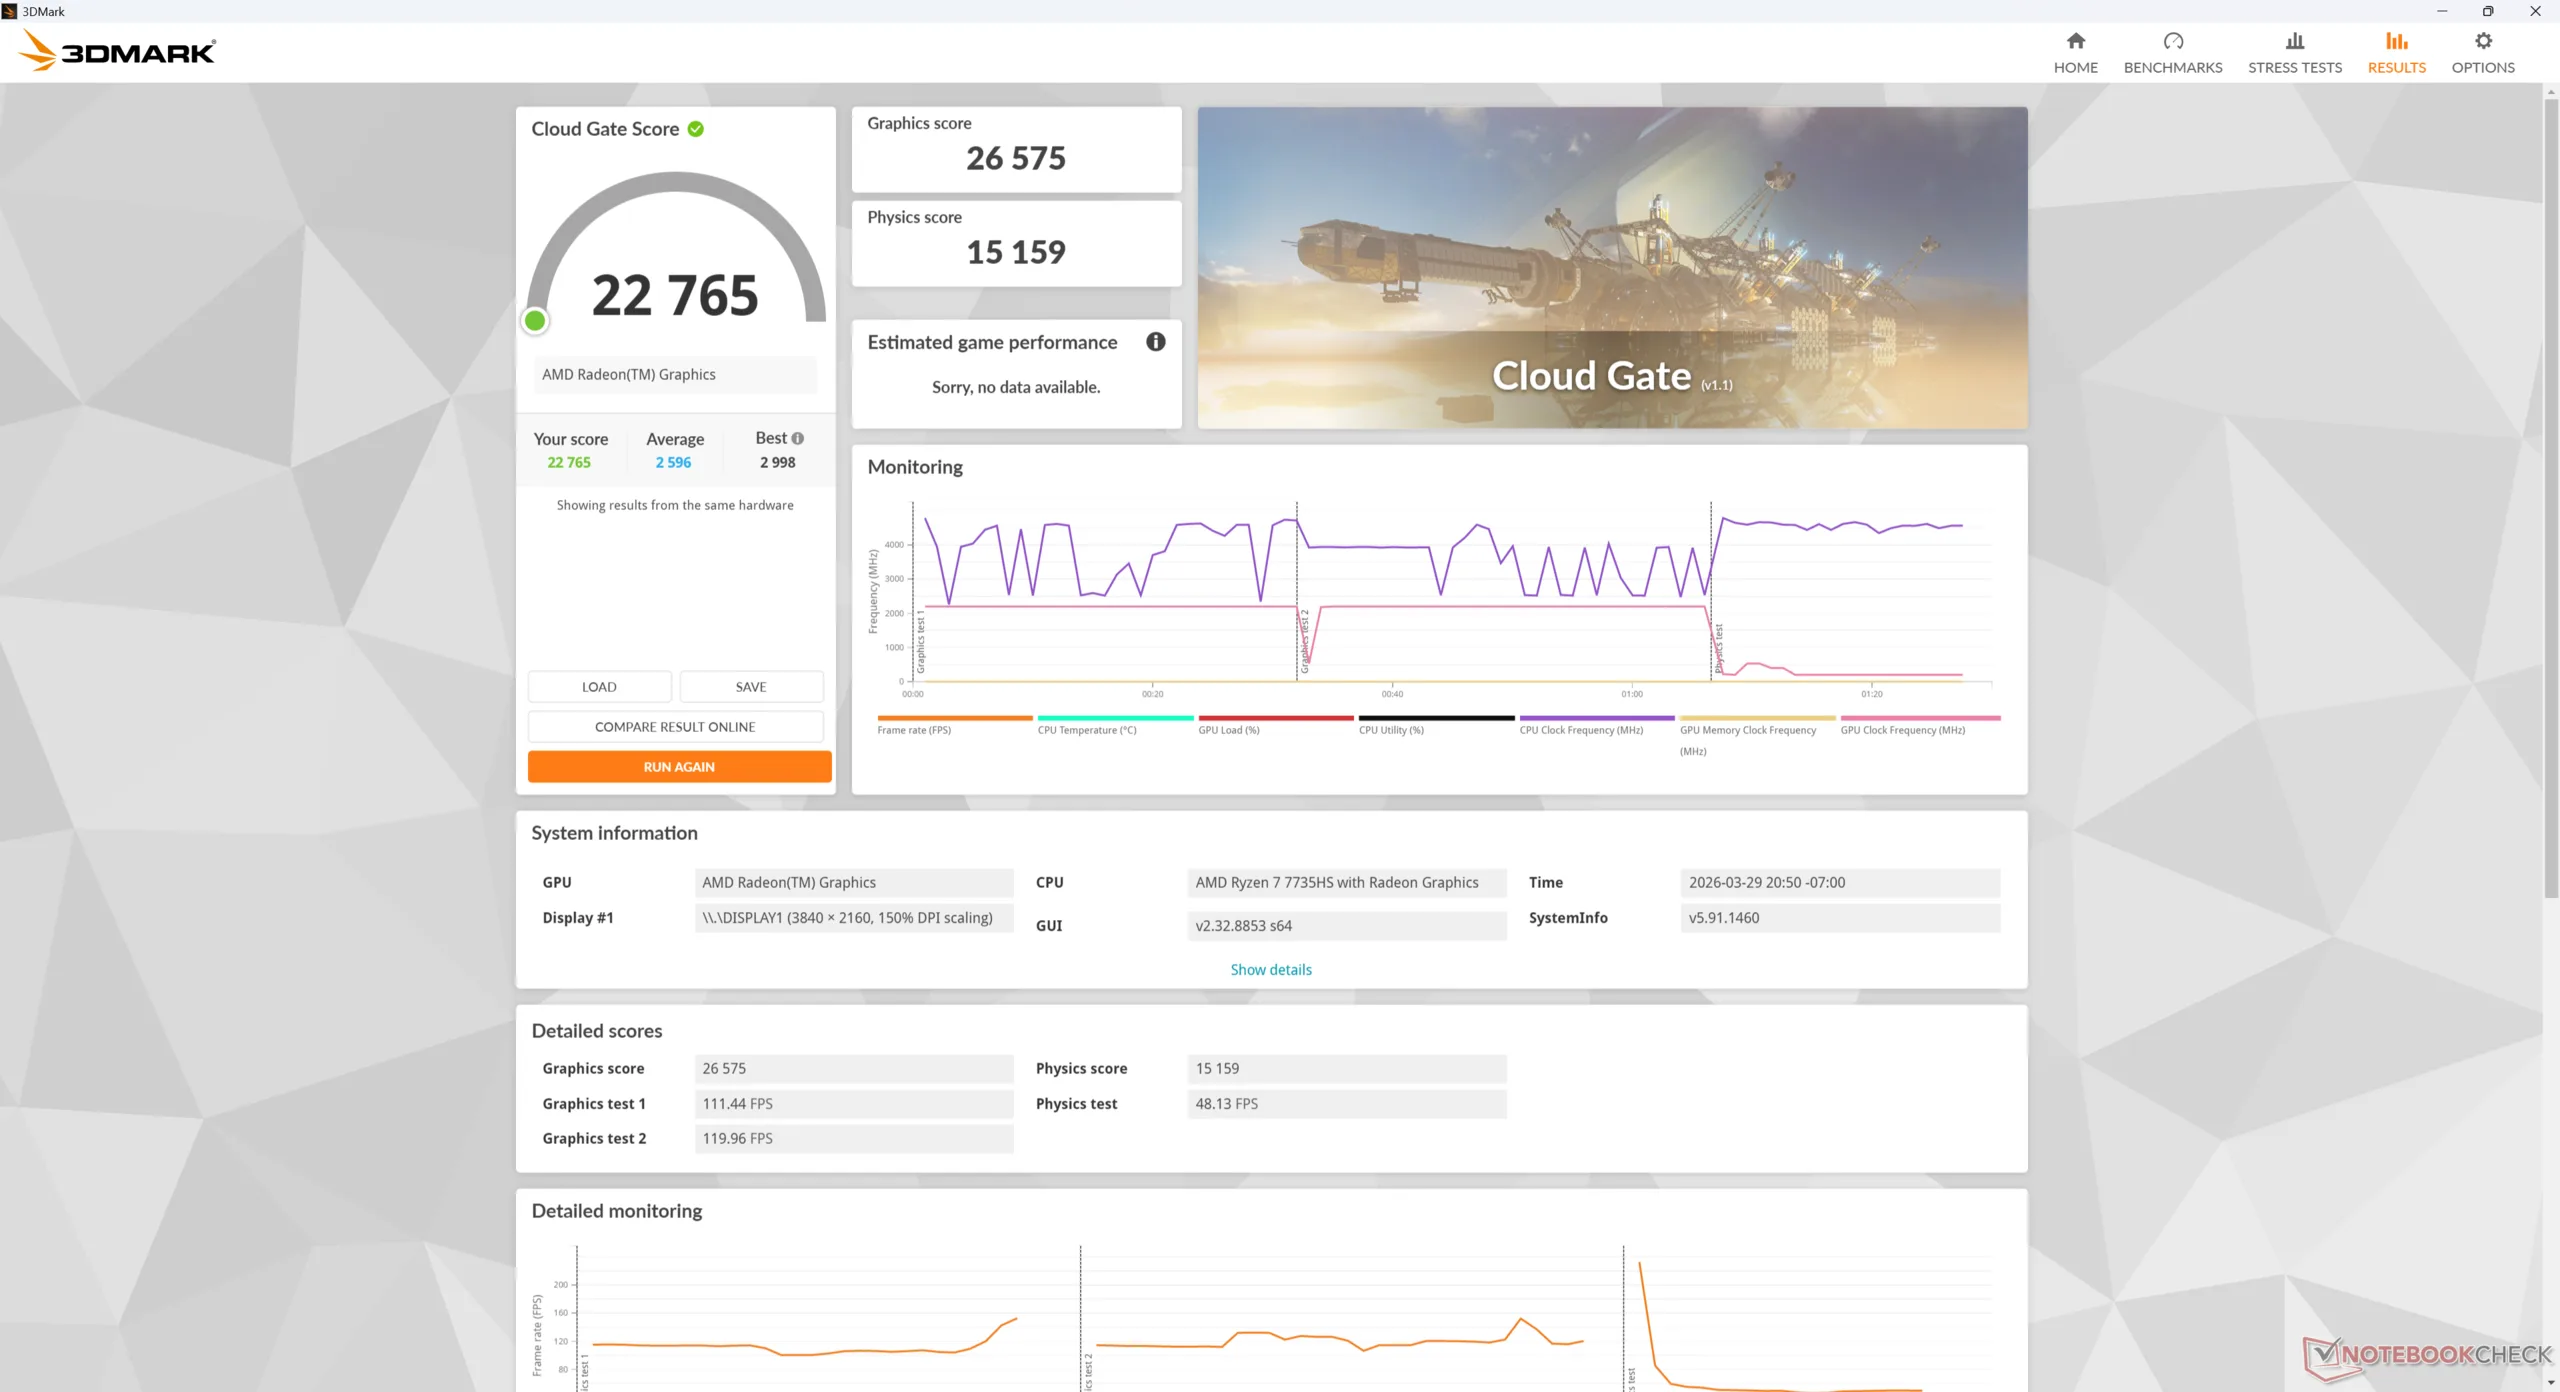
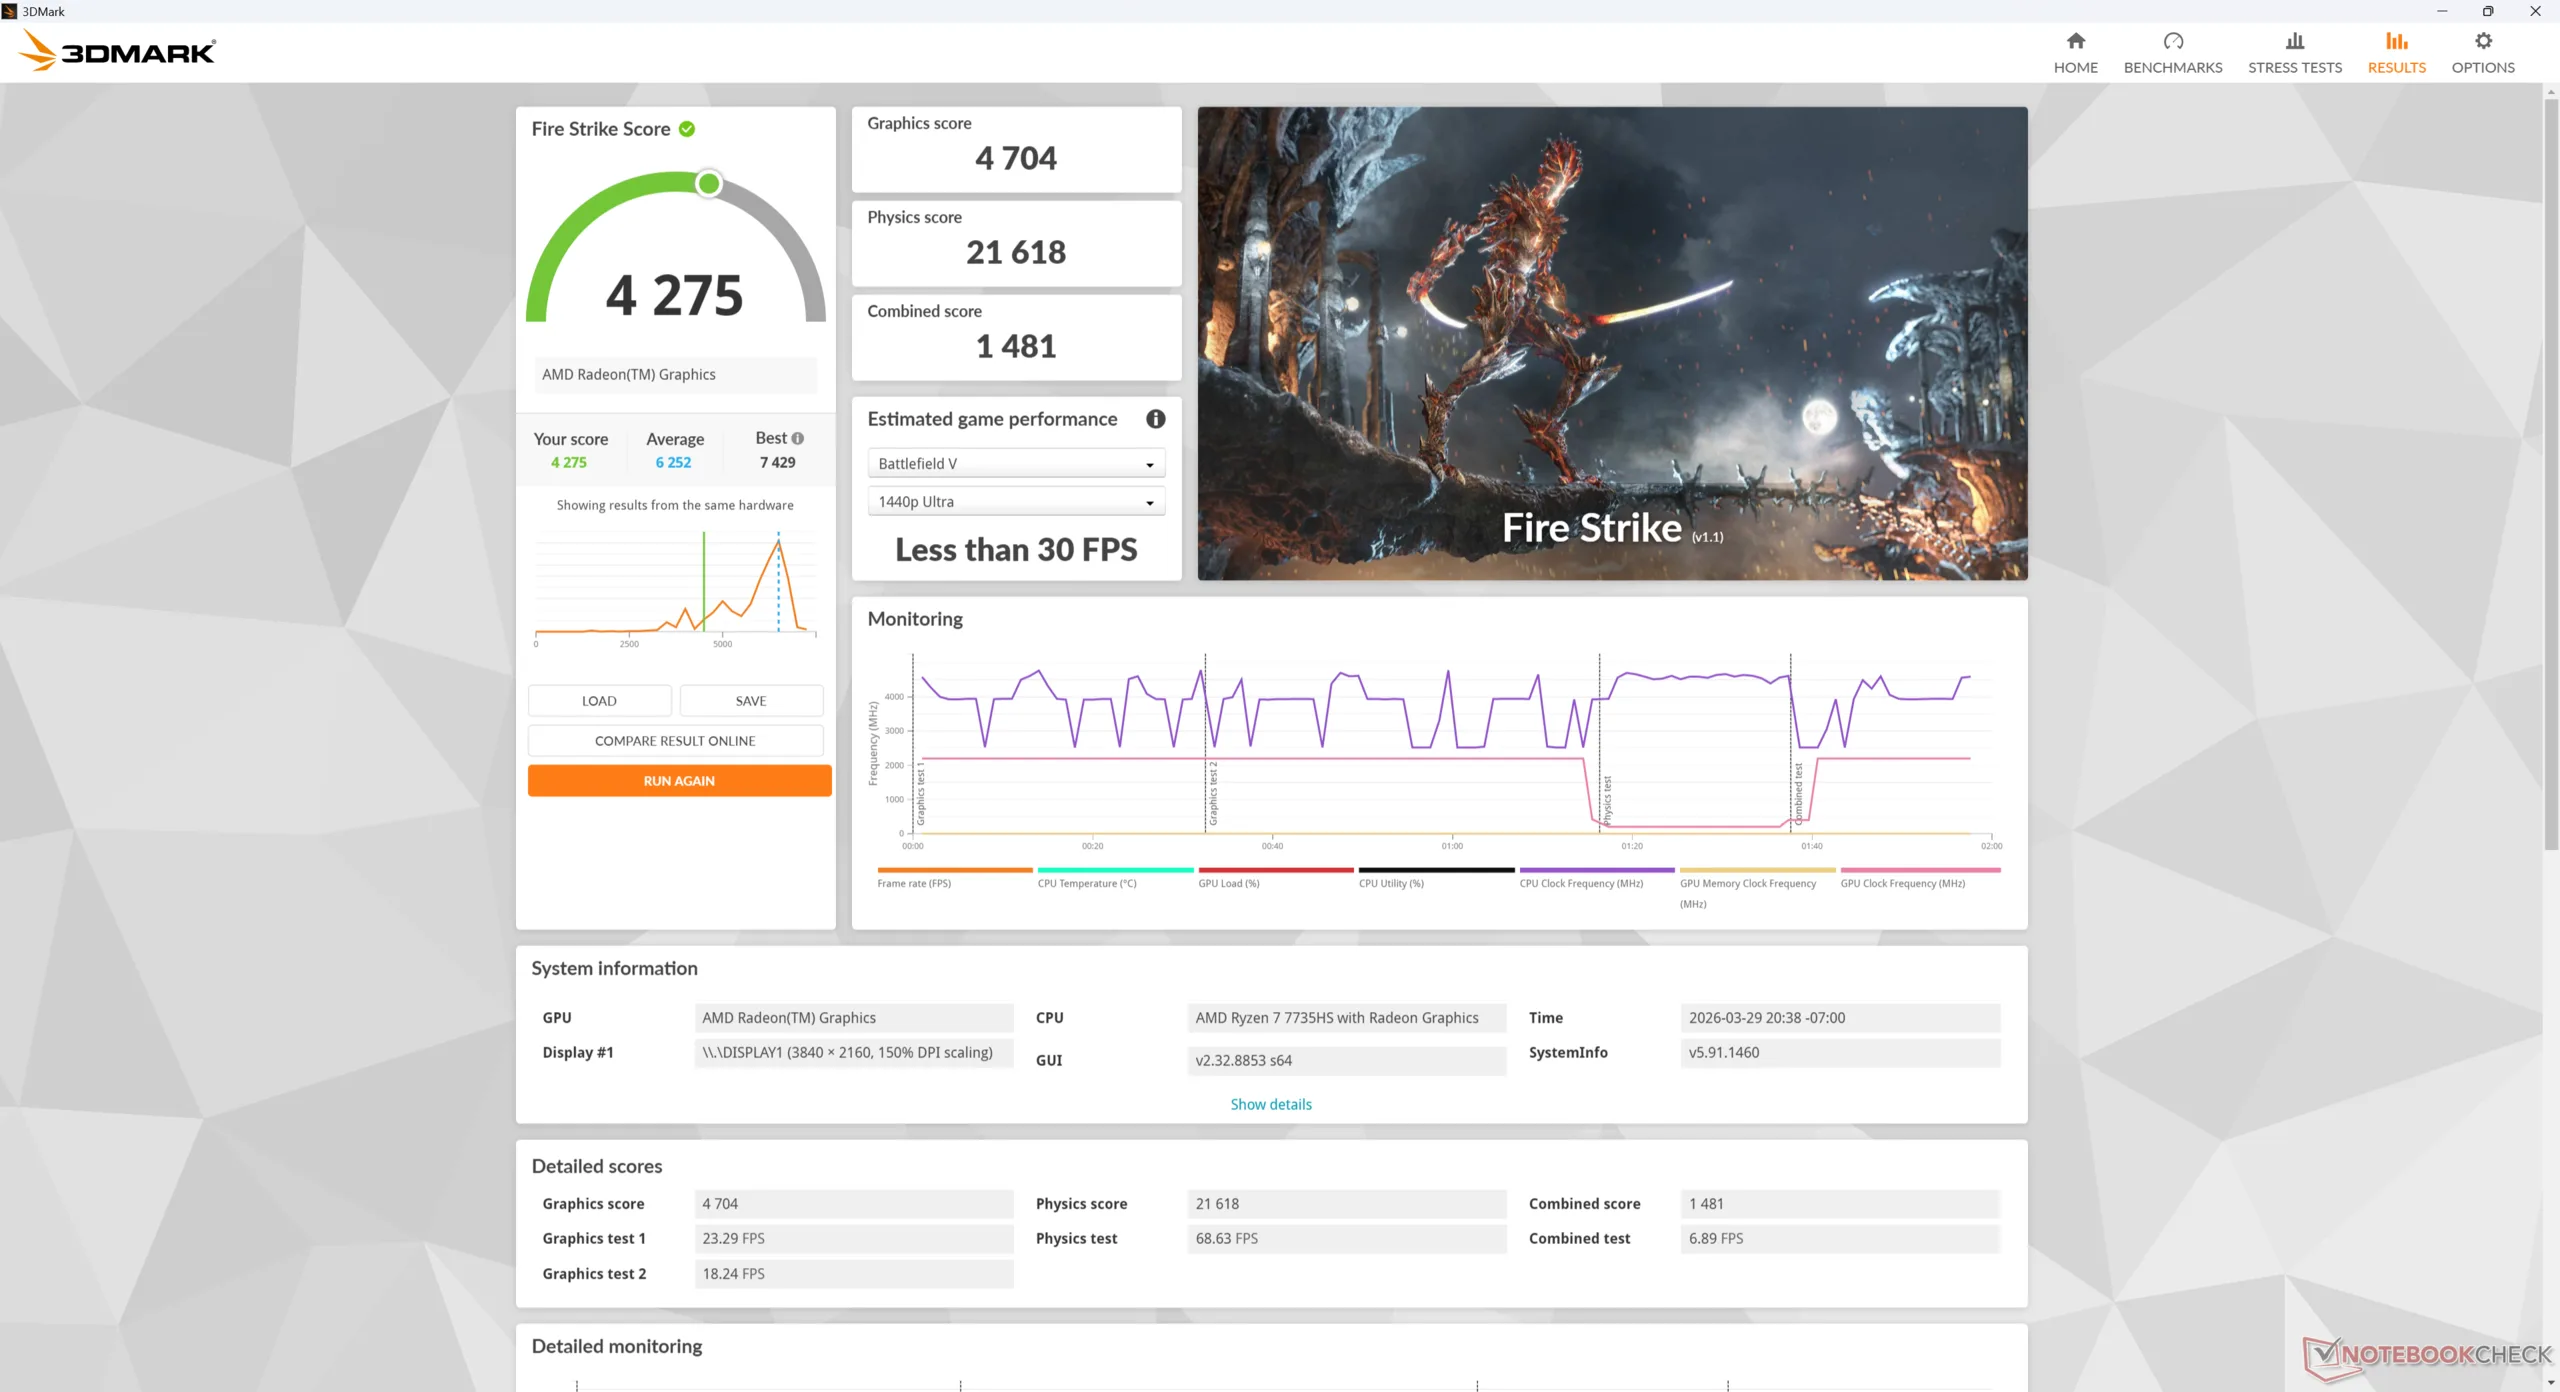
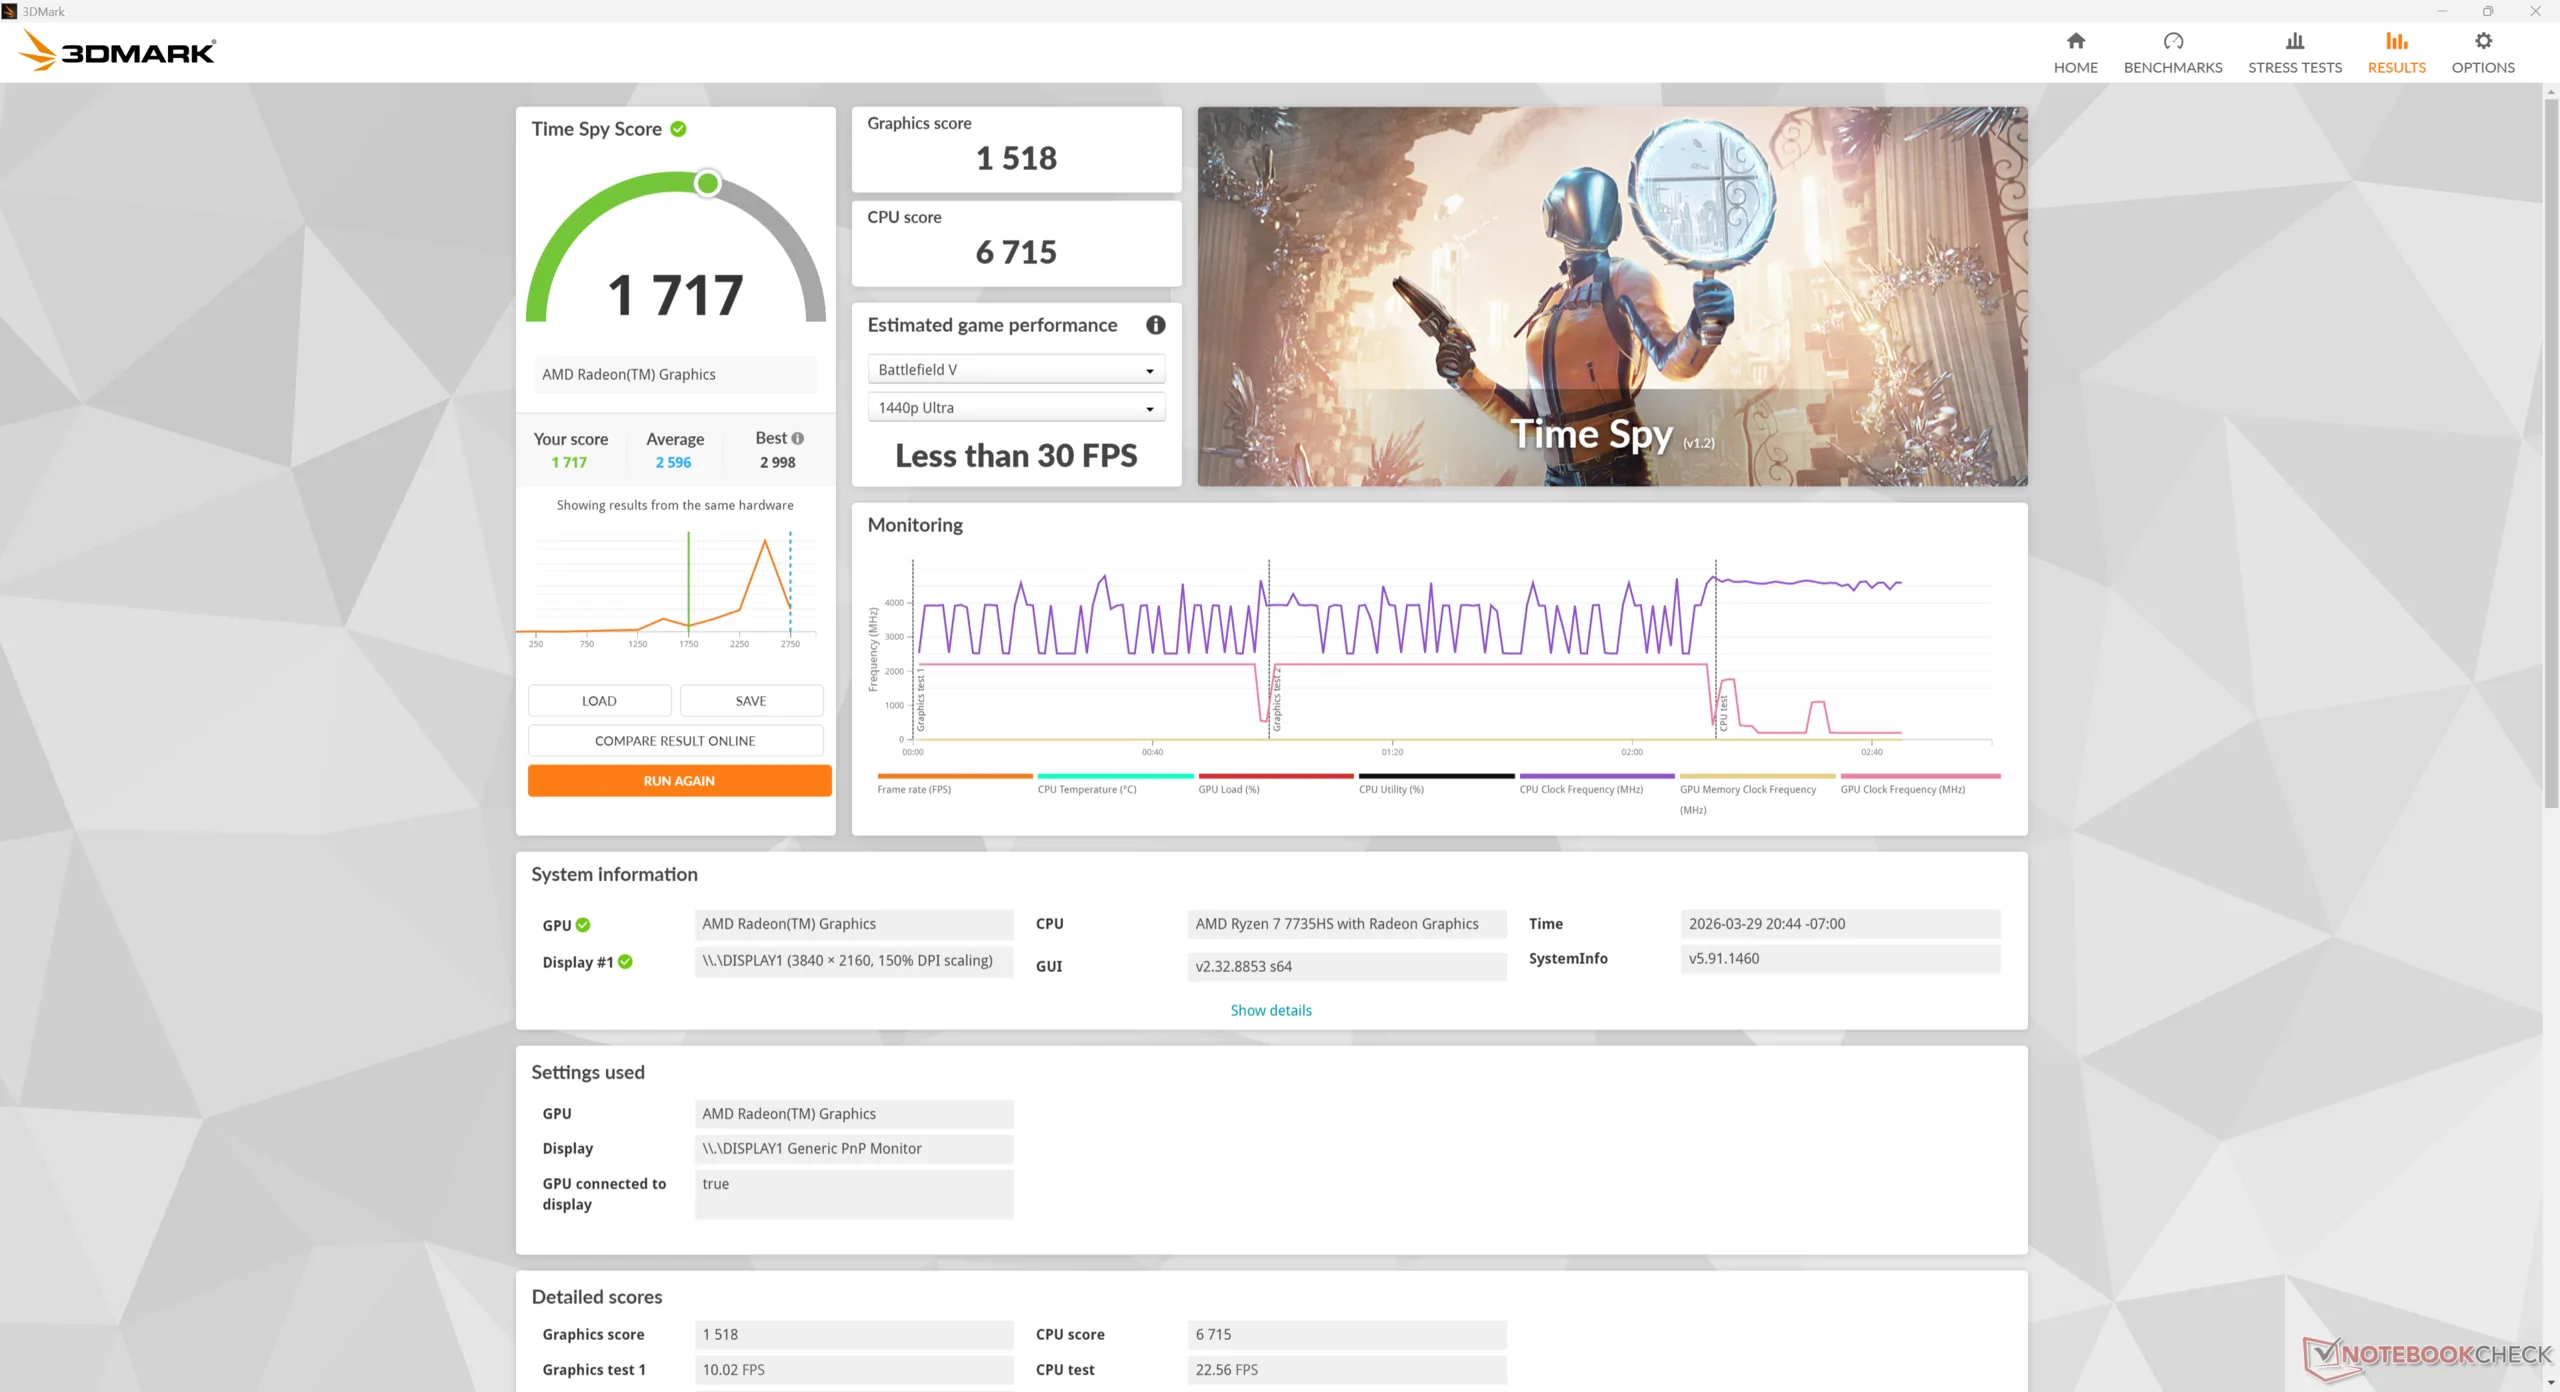
Le prestazioni grafiche sono più lente del previsto, anche dopo l'aggiornamento ai driver più recenti al momento della pubblicazione. i punteggi 3DMark sono più lenti di circa il 30 percento rispetto al PC medio del nostro database equipaggiato con la stessa scheda integrata Radeon 680M GPU INTEGRATA. Le prestazioni deludenti possono essere attribuite alla lentezza dei risultati di lettura, scrittura e copia della RAM, come mostrato dai risultati del benchmark AIDA64 di cui sopra.
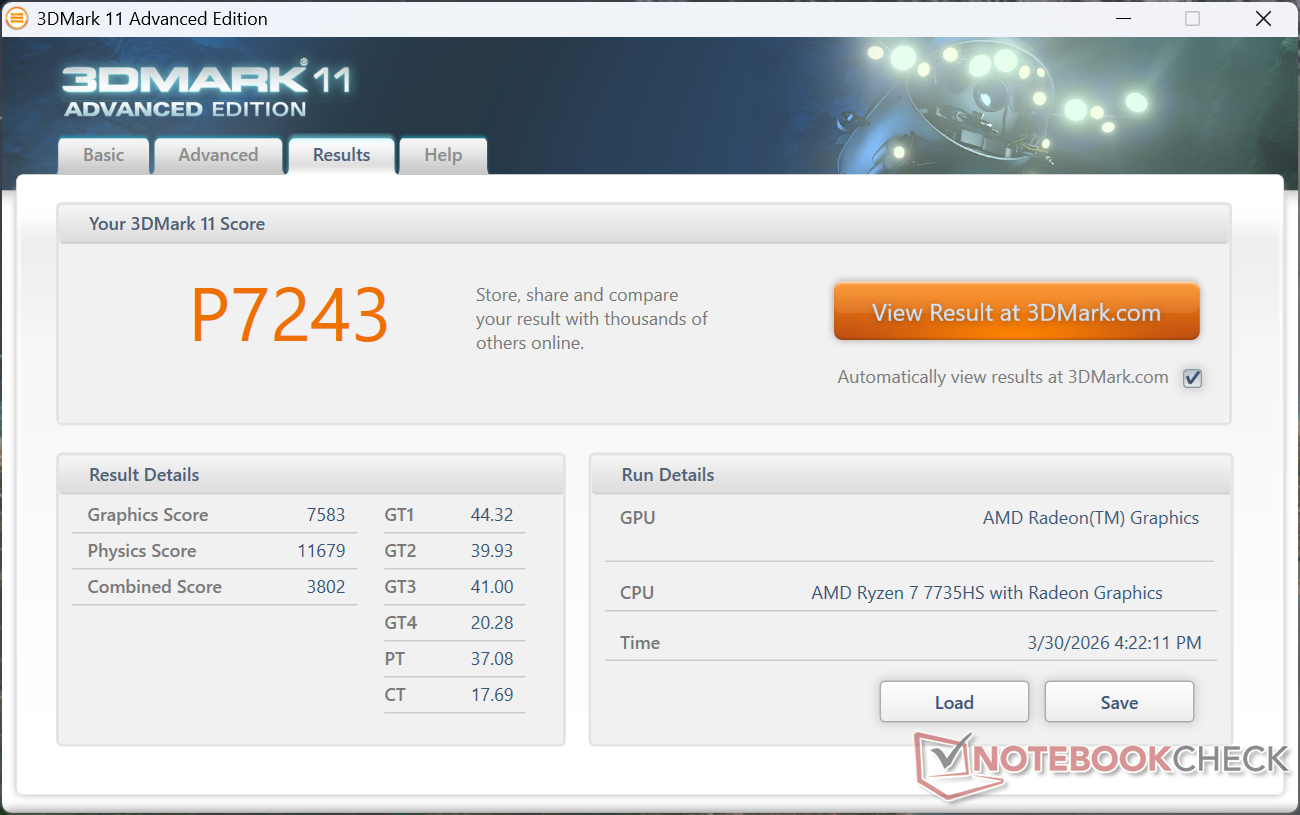
| 3DMark 11 Performance | 7243 punti | |
| 3DMark Cloud Gate Standard Score | 22765 punti | |
| 3DMark Fire Strike Score | 4275 punti | |
| 3DMark Time Spy Score | 1717 punti | |
Aiuto | ||
* ... Meglio usare valori piccoli
| Performance rating - Percent | |
| Asus NUC 15 Pro+ | |
| Beelink SER9 Pro | |
| MSI Cubi NUC AI+ 2MG | |
| GMK NucBox K13 | |
| Geekom A7 Max, R9 7940HS -1! | |
| GMK NucBox K16 | |
| Cyberpunk 2077 - 1920x1080 Ultra Preset (FSR off) | |
| Asus NUC 15 Pro+ | |
| Beelink SER9 Pro | |
| GMK NucBox K13 | |
| MSI Cubi NUC AI+ 2MG | |
| Geekom A7 Max, R9 7940HS | |
| GMK NucBox K16 | |
| Baldur's Gate 3 - 1920x1080 Ultra Preset AA:T | |
| Beelink SER9 Pro | |
| MSI Cubi NUC AI+ 2MG | |
| Asus NUC 15 Pro+ | |
| GMK NucBox K13 | |
| GMK NucBox K16 | |
| Geekom A7 Max, R9 7940HS | |
| GTA V - 1920x1080 Highest AA:4xMSAA + FX AF:16x | |
| Beelink SER9 Pro | |
| MSI Cubi NUC AI+ 2MG | |
| GMK NucBox K13 | |
| Asus NUC 15 Pro+ | |
| Geekom A7 Max, R9 7940HS | |
| GMK NucBox K16 | |
| Final Fantasy XV Benchmark - 1920x1080 High Quality | |
| Asus NUC 15 Pro+ | |
| Beelink SER9 Pro | |
| MSI Cubi NUC AI+ 2MG | |
| GMK NucBox K13 | |
| Geekom A7 Max, R9 7940HS | |
| GMK NucBox K16 | |
| Strange Brigade - 1920x1080 ultra AA:ultra AF:16 | |
| MSI Cubi NUC AI+ 2MG | |
| Asus NUC 15 Pro+ | |
| GMK NucBox K13 | |
| Beelink SER9 Pro | |
| GMK NucBox K16 | |
| Dota 2 Reborn - 1920x1080 ultra (3/3) best looking | |
| Asus NUC 15 Pro+ | |
| GMK NucBox K13 | |
| Beelink SER9 Pro | |
| MSI Cubi NUC AI+ 2MG | |
| Geekom A7 Max, R9 7940HS | |
| GMK NucBox K16 | |
| X-Plane 11.11 - 1920x1080 high (fps_test=3) | |
| Asus NUC 15 Pro+ | |
| Beelink SER9 Pro | |
| MSI Cubi NUC AI+ 2MG | |
| Geekom A7 Max, R9 7940HS | |
| GMK NucBox K16 | |
| GMK NucBox K13 | |
| F1 24 | |
| 1920x1080 Low Preset AA:T AF:16x | |
| Khadas Mind Pro | |
| Beelink SER9 Pro | |
| Asus NUC 15 Pro+ | |
| GMK NucBox K13 | |
| MSI Cubi NUC AI+ 2MG | |
| GMK NucBox M7 Ultra | |
| Media AMD Radeon 680M (42.8 - 72.2, n=5) | |
| Geekom A7 Max, R9 7940HS | |
| GMK NucBox K16 | |
| 1920x1080 Medium Preset AA:T AF:16x | |
| Khadas Mind Pro | |
| GMK NucBox K13 | |
| Beelink SER9 Pro | |
| Asus NUC 15 Pro+ | |
| GMK NucBox M7 Ultra | |
| Media AMD Radeon 680M (35.8 - 64.3, n=5) | |
| Geekom A7 Max, R9 7940HS | |
| GMK NucBox K16 | |
| 1920x1080 High Preset AA:T AF:16x | |
| Khadas Mind Pro | |
| GMK NucBox K13 | |
| Asus NUC 15 Pro+ | |
| Beelink SER9 Pro | |
| MSI Cubi NUC AI+ 2MG | |
| GMK NucBox M7 Ultra | |
| Media AMD Radeon 680M (23.7 - 46, n=5) | |
| Geekom A7 Max, R9 7940HS | |
| GMK NucBox K16 | |
| 1920x1080 Ultra High Preset AA:T AF:16x | |
| Khadas Mind Pro | |
| Asus NUC 15 Pro+ | |
| GMK NucBox K13 | |
| MSI Cubi NUC AI+ 2MG | |
| Beelink SER9 Pro | |
| Media AMD Radeon 680M (7.41 - 9.53, n=4) | |
| GMK NucBox K16 | |
| 1280x720 Ultra Low Preset AA:T | |
| MSI Cubi NUC AI+ 2MG | |
Grafico Cyberpunk 2077 ultra FPS
| basso | medio | alto | ultra | |
|---|---|---|---|---|
| GTA V (2015) | 88.3 | 82.2 | 29.4 | 13.1 |
| Dota 2 Reborn (2015) | 101.2 | 82.8 | 59.8 | 52.2 |
| Final Fantasy XV Benchmark (2018) | 41.2 | 22.1 | 15.8 | |
| X-Plane 11.11 (2018) | 42.3 | 34.2 | 30 | |
| Strange Brigade (2018) | 85.7 | 35.5 | 30.4 | 25.3 |
| Baldur's Gate 3 (2023) | 24.8 | 20.7 | 16.6 | 16.5 |
| Cyberpunk 2077 (2023) | 23.3 | 18.6 | 14.3 | 12.6 |
| F1 24 (2024) | 42.8 | 35.8 | 23.7 | 7.62 |
Emissioni
Rumore del sistema
Le ventole sono sempre attive, indipendentemente dal carico sullo schermo. Sebbene non siano molto rumorose, c'è un fruscio costante anche durante i carichi bassi come la navigazione web o lo streaming video. I carichi più elevati, come i giochi, possono far salire il rumore delle ventole fino a 50 dB(A), più forte della maggior parte dei computer portatili ultrasottili.
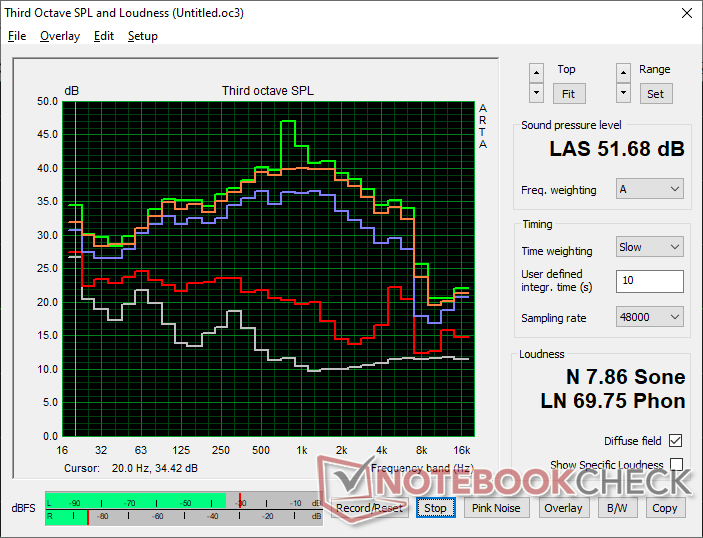
Rumorosità
| Idle |
| 30.9 / 31.6 / 31.6 dB(A) |
| Sotto carico |
| 45.3 / 51.7 dB(A) |
 | ||
30 dB silenzioso 40 dB(A) udibile 50 dB(A) rumoroso |
||
min: | ||
| GMK NucBox K16 R7 7735HS, Radeon 680M | GMK NucBox K13 Core Ultra 7 256V, Arc 140V | Beelink SER9 Pro Ryzen 7 H 255, Radeon 780M | Geekom A7 Max, R9 7940HS R9 7940HS, Radeon 780M | Asus NUC 15 Pro+ Ultra 9 285H, Arc 140T | MSI Cubi NUC AI+ 2MG Core Ultra 7 258V, Arc 140V | |
|---|---|---|---|---|---|---|
| Noise | 14% | 15% | 11% | 3% | 3% | |
| off /ambiente * (dB) | 23.6 | 23.3 1% | 23 3% | 24.7 -5% | 25.3 -7% | 24.8 -5% |
| Idle Minimum * (dB) | 30.9 | 24.5 21% | 29.1 6% | 25.5 17% | 25.4 18% | 28 9% |
| Idle Average * (dB) | 31.6 | 25 21% | 30.1 5% | 25.6 19% | 25.5 19% | 36.1 -14% |
| Idle Maximum * (dB) | 31.6 | 25.1 21% | 31.7 -0% | 25.7 19% | 37.3 -18% | 36.1 -14% |
| Load Average * (dB) | 45.3 | 40.1 11% | 33.7 26% | 43 5% | 44.4 2% | 38.9 14% |
| Cyberpunk 2077 ultra * (dB) | 49.2 | 44.2 10% | 33.8 31% | 44.9 9% | 46.2 6% | 37 25% |
| Load Maximum * (dB) | 51.7 | 45.1 13% | 35.2 32% | 45 13% | 52.7 -2% | 49.2 5% |
| Witcher 3 ultra * (dB) | 44.9 | 47.7 |
* ... Meglio usare valori piccoli
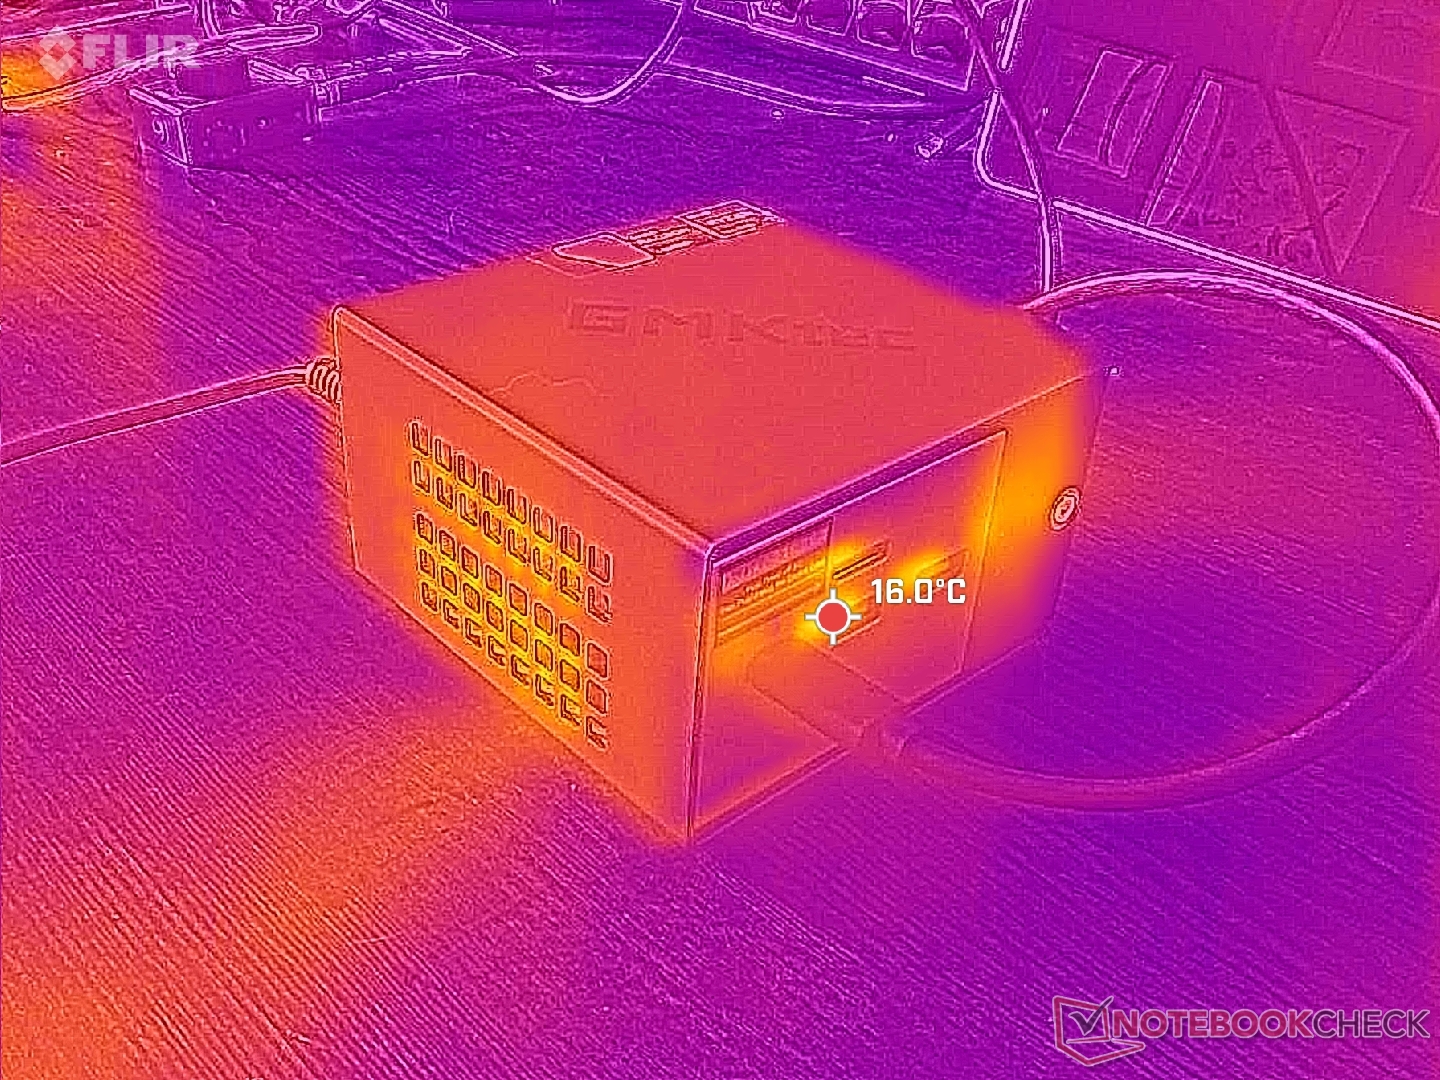
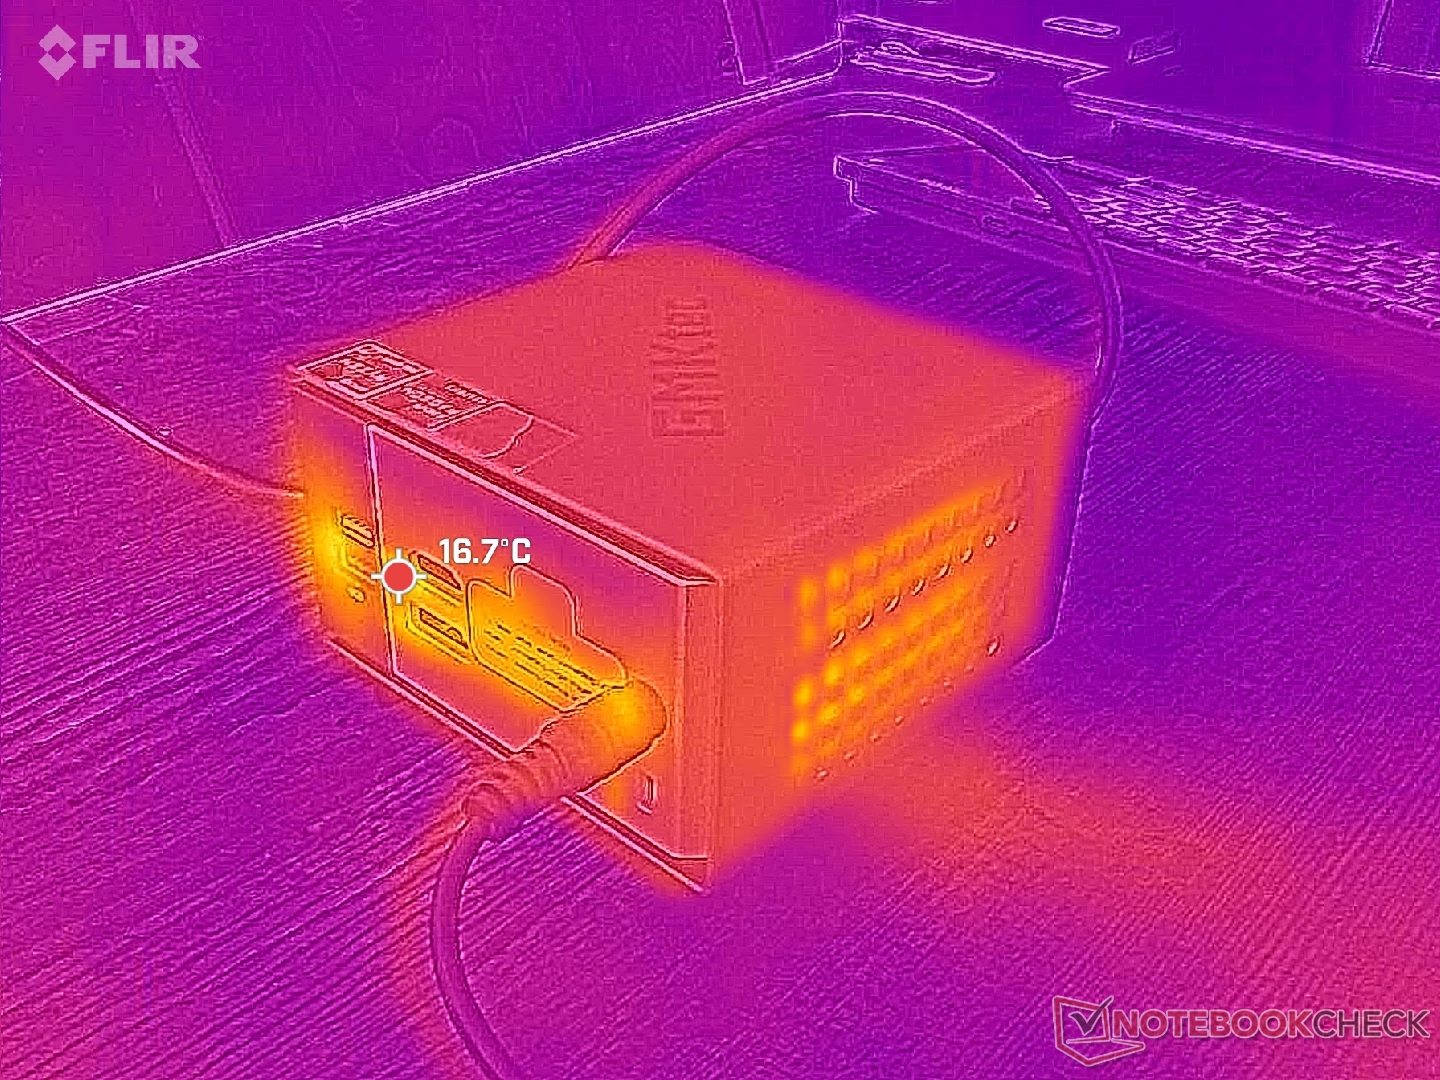
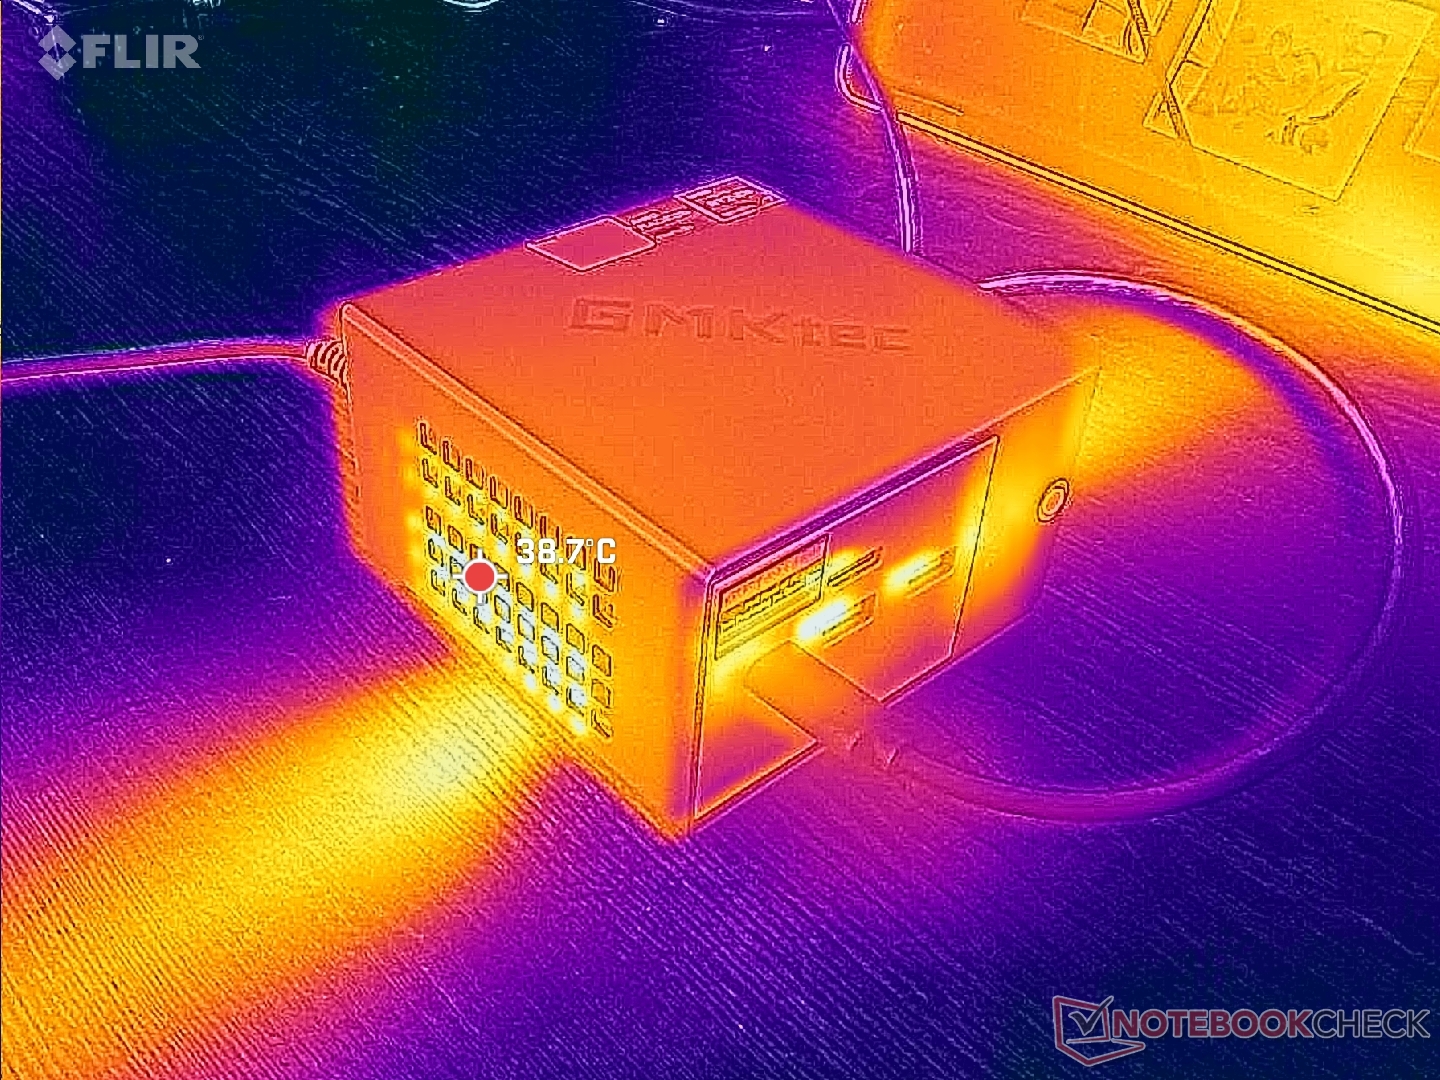
Temperatura
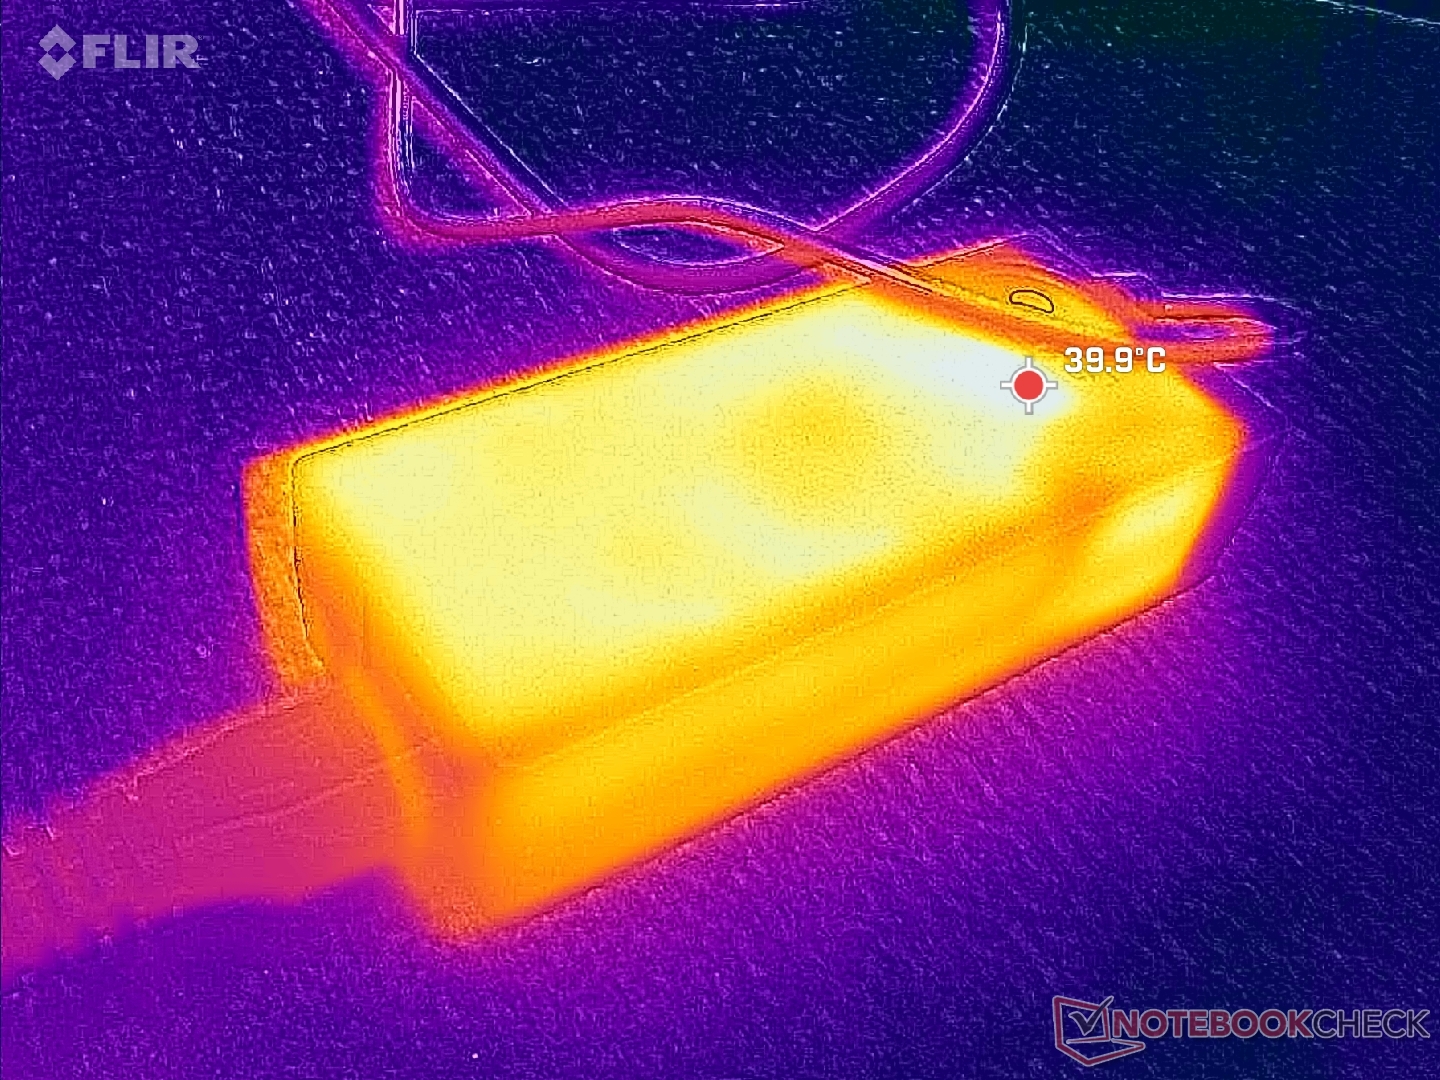
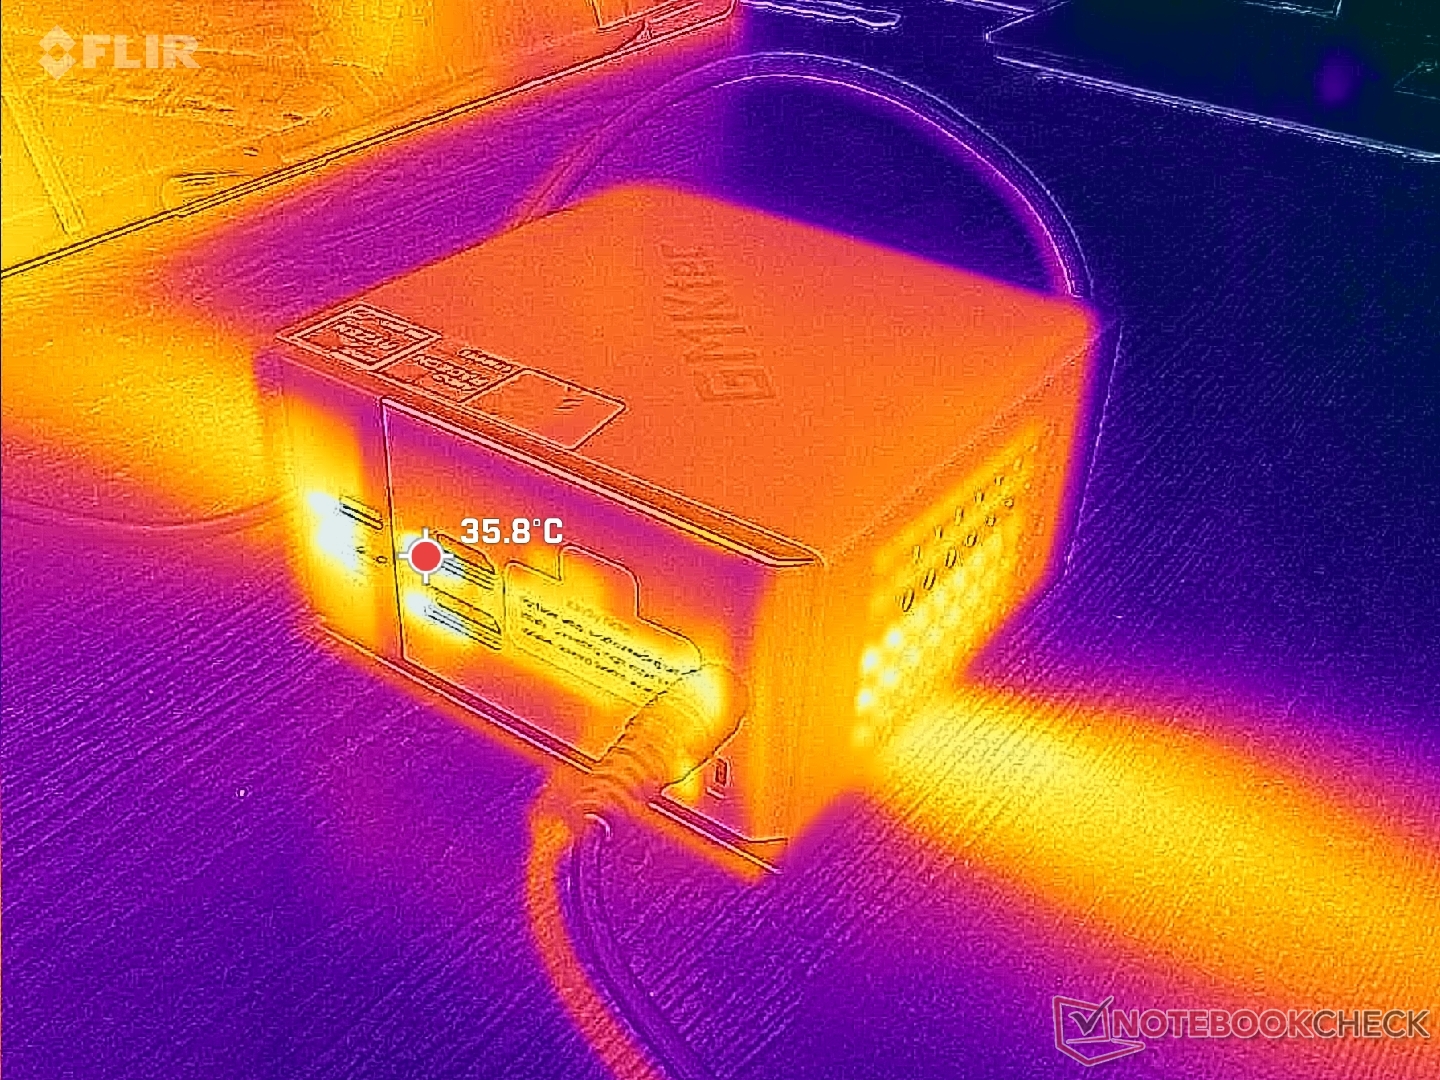
L'aria fresca entra dalle fessure lungo il bordo superiore dell'unità prima di uscire dai due lati dell'unità. Al contrario, il calore residuo esce dalla parte posteriore della maggior parte degli altri design di mini PC. Il posizionamento di NucBox K16 su un lato coprirebbe quindi le griglie di scarico e potrebbe avere un impatto sulla temperatura e sulle prestazioni.
(+) La temperatura massima sul lato superiore è di 28.4 °C / 83 F, rispetto alla media di 35.4 °C / 96 F, che varia da 20.6 a 69.5 °C per questa classe Mini PC.
(+) Il lato inferiore si riscalda fino ad un massimo di 29.4 °C / 85 F, rispetto alla media di 36.1 °C / 97 F
(+) In idle, la temperatura media del lato superiore è di 23.2 °C / 74 F, rispetto alla media deld ispositivo di 32.1 °C / 90 F.
Test da sforzo
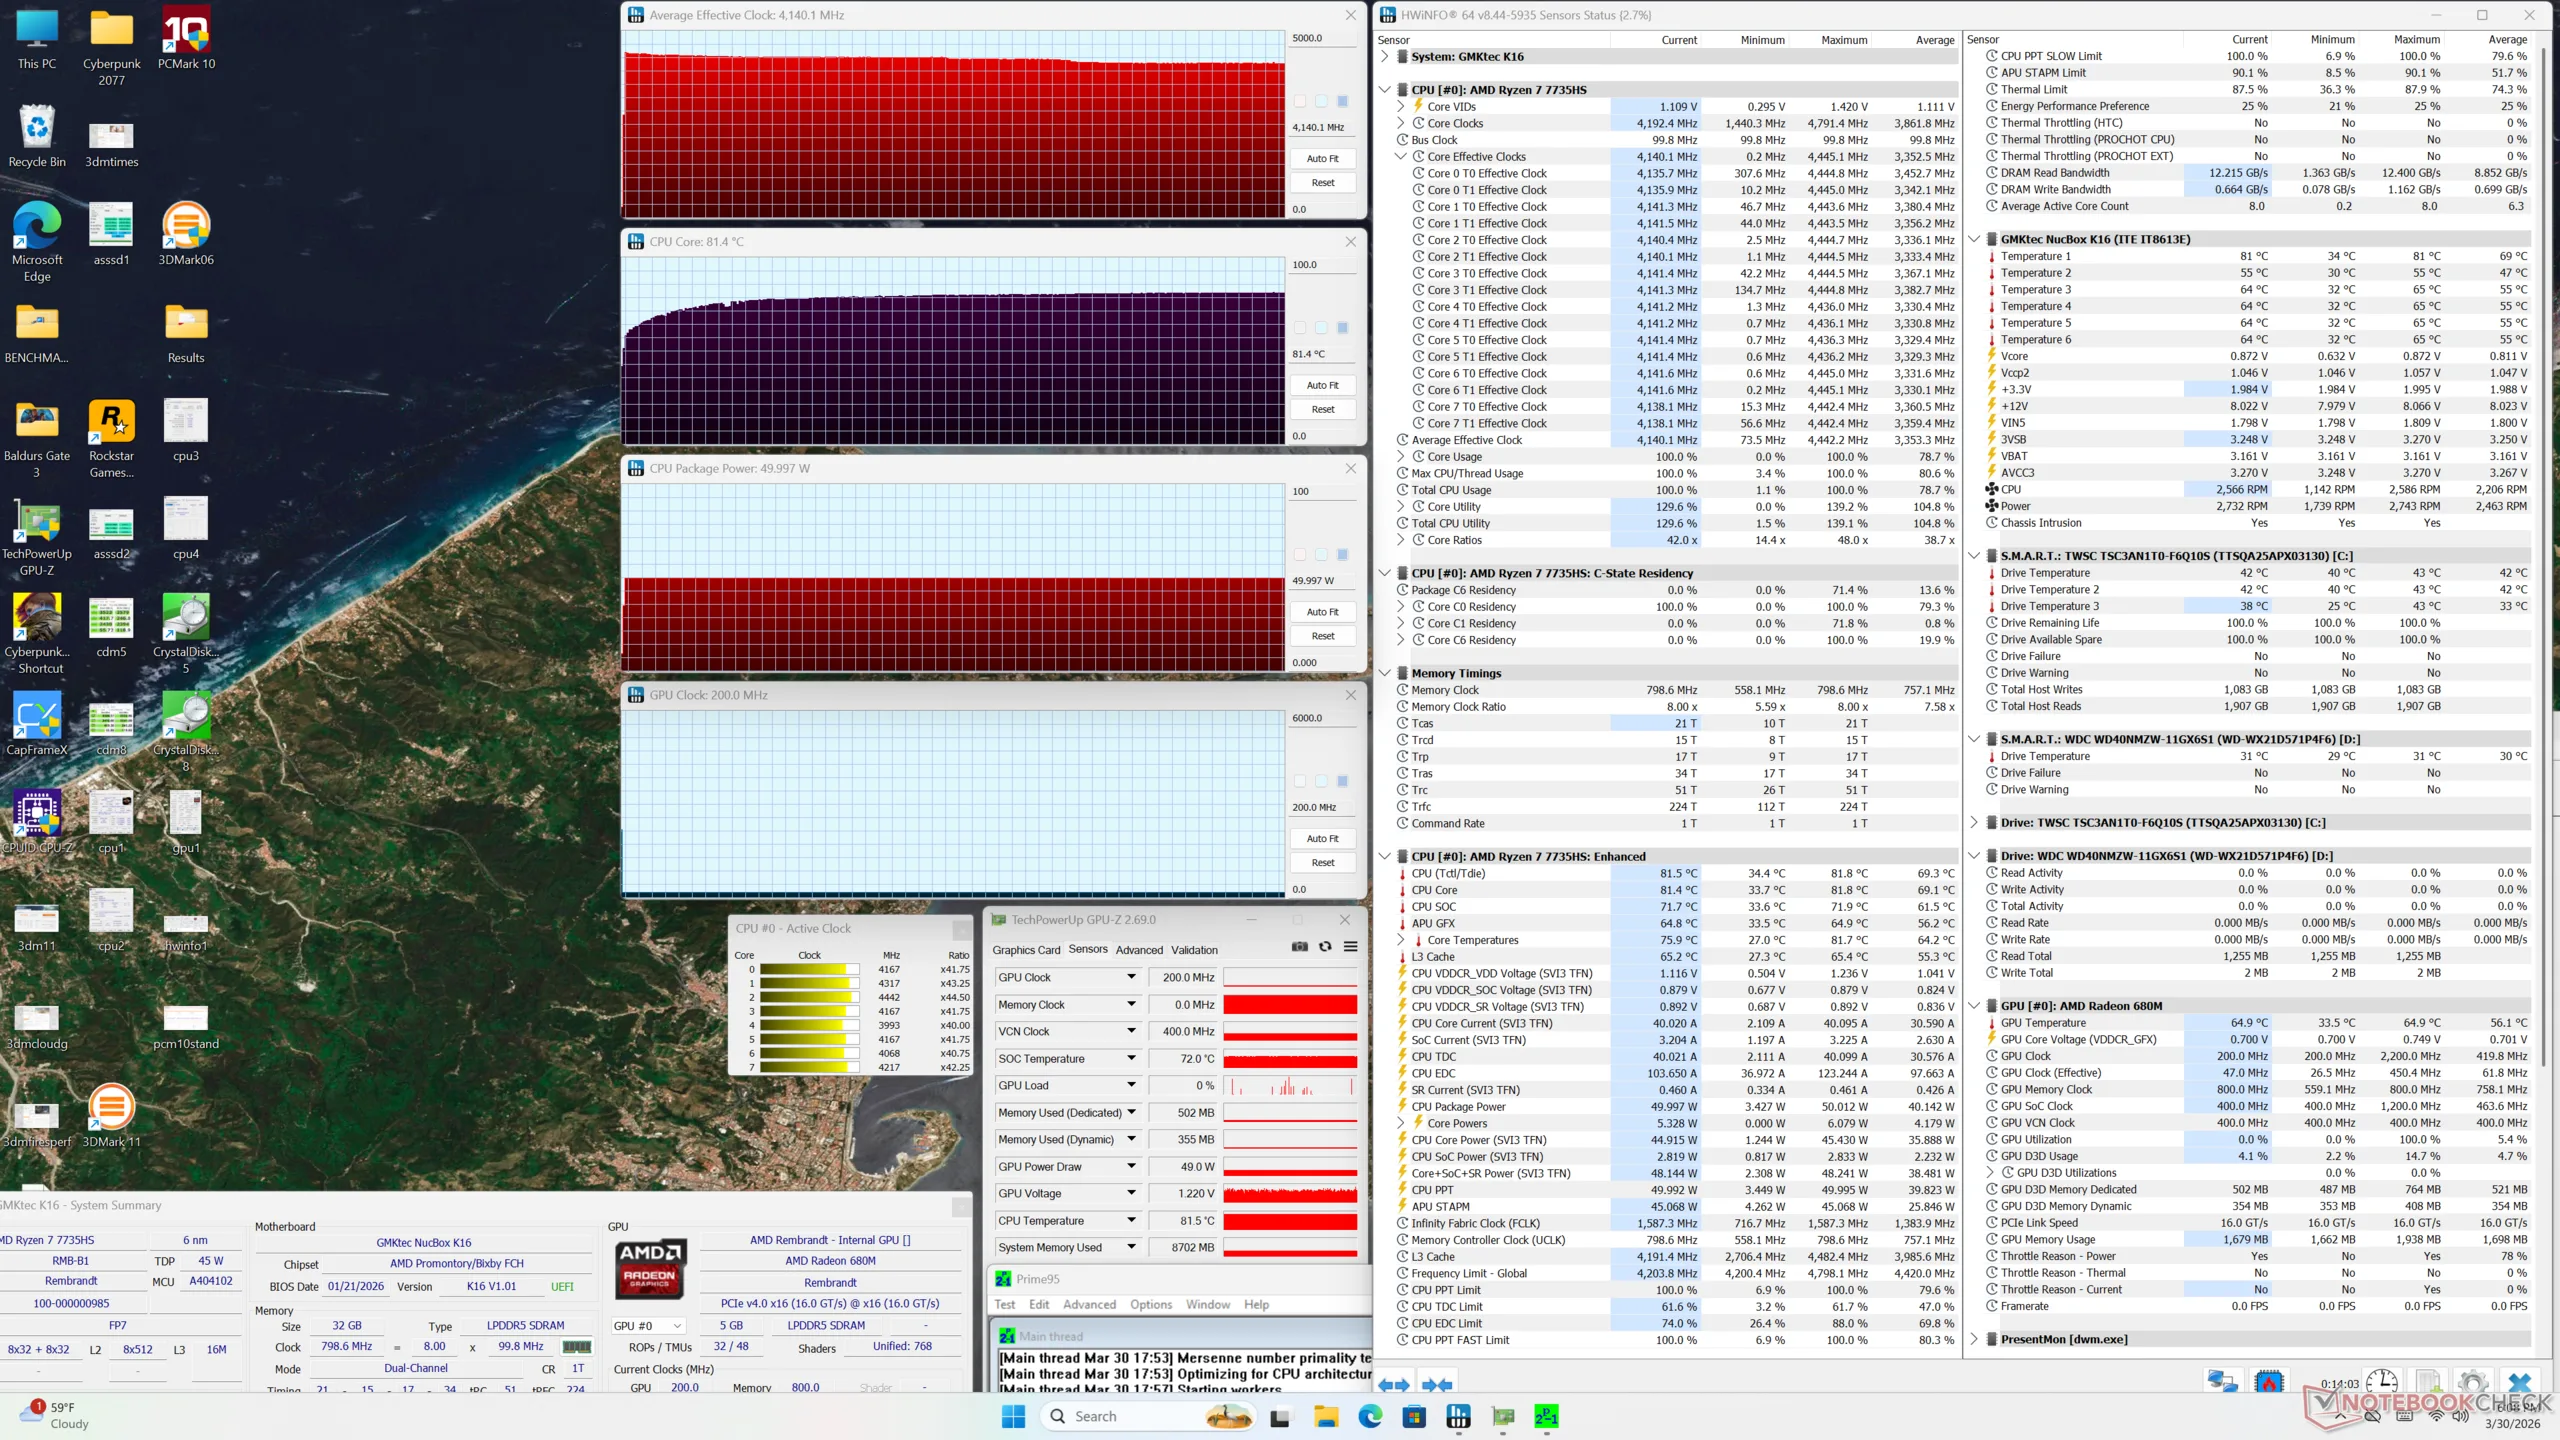
La CPU si stabilizzava a 4,1 GHz, 50 W e 81 C quando si eseguiva lo stress Prime95, che in realtà è più caldo di quello che abbiamo registrato su EVO-X1 con la CPU Zen 5, più recente e più veloce. La temperatura del core continuerebbe a essere più calda di qualche grado C anche durante l'esecuzione dei giochi. Il NucBox K13 con il più efficiente Core Ultra 7 256V offre sia prestazioni di gioco più veloci che una temperatura di funzionamento più fresca.
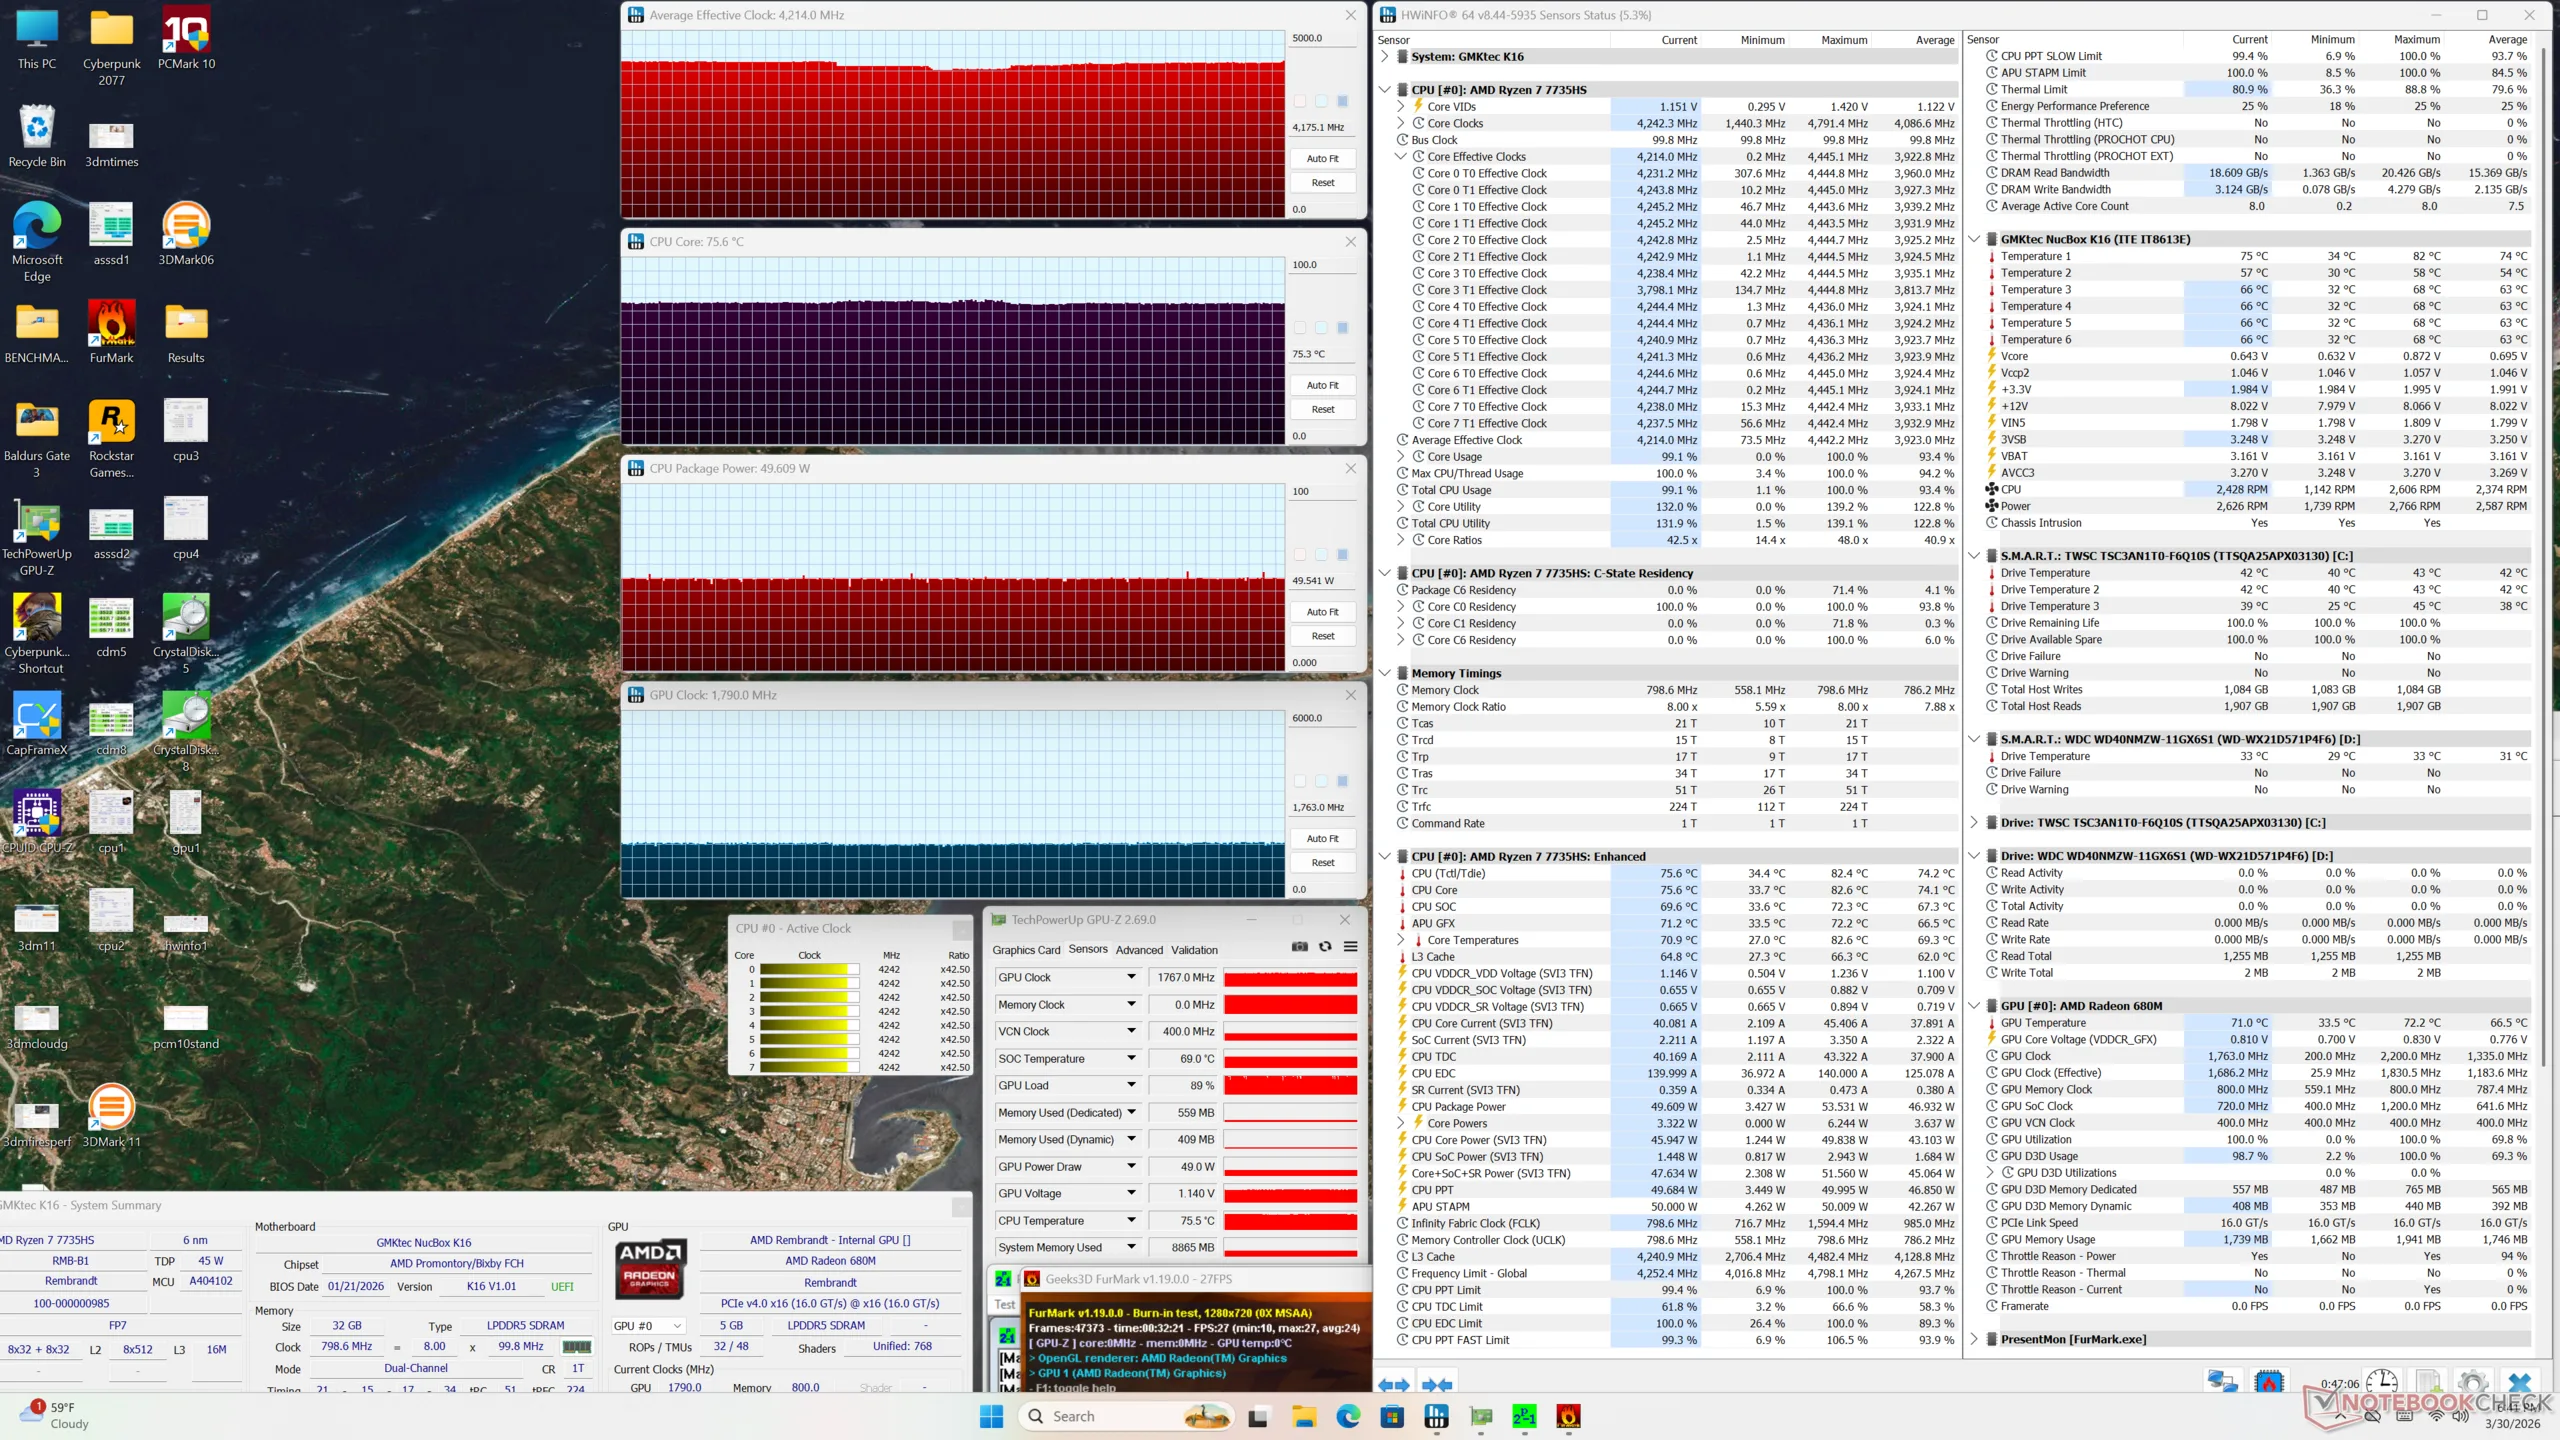
| Clock medio della CPU (GHz) | Clock della GPU (MHz) | Temperatura media della CPU (°C) | |
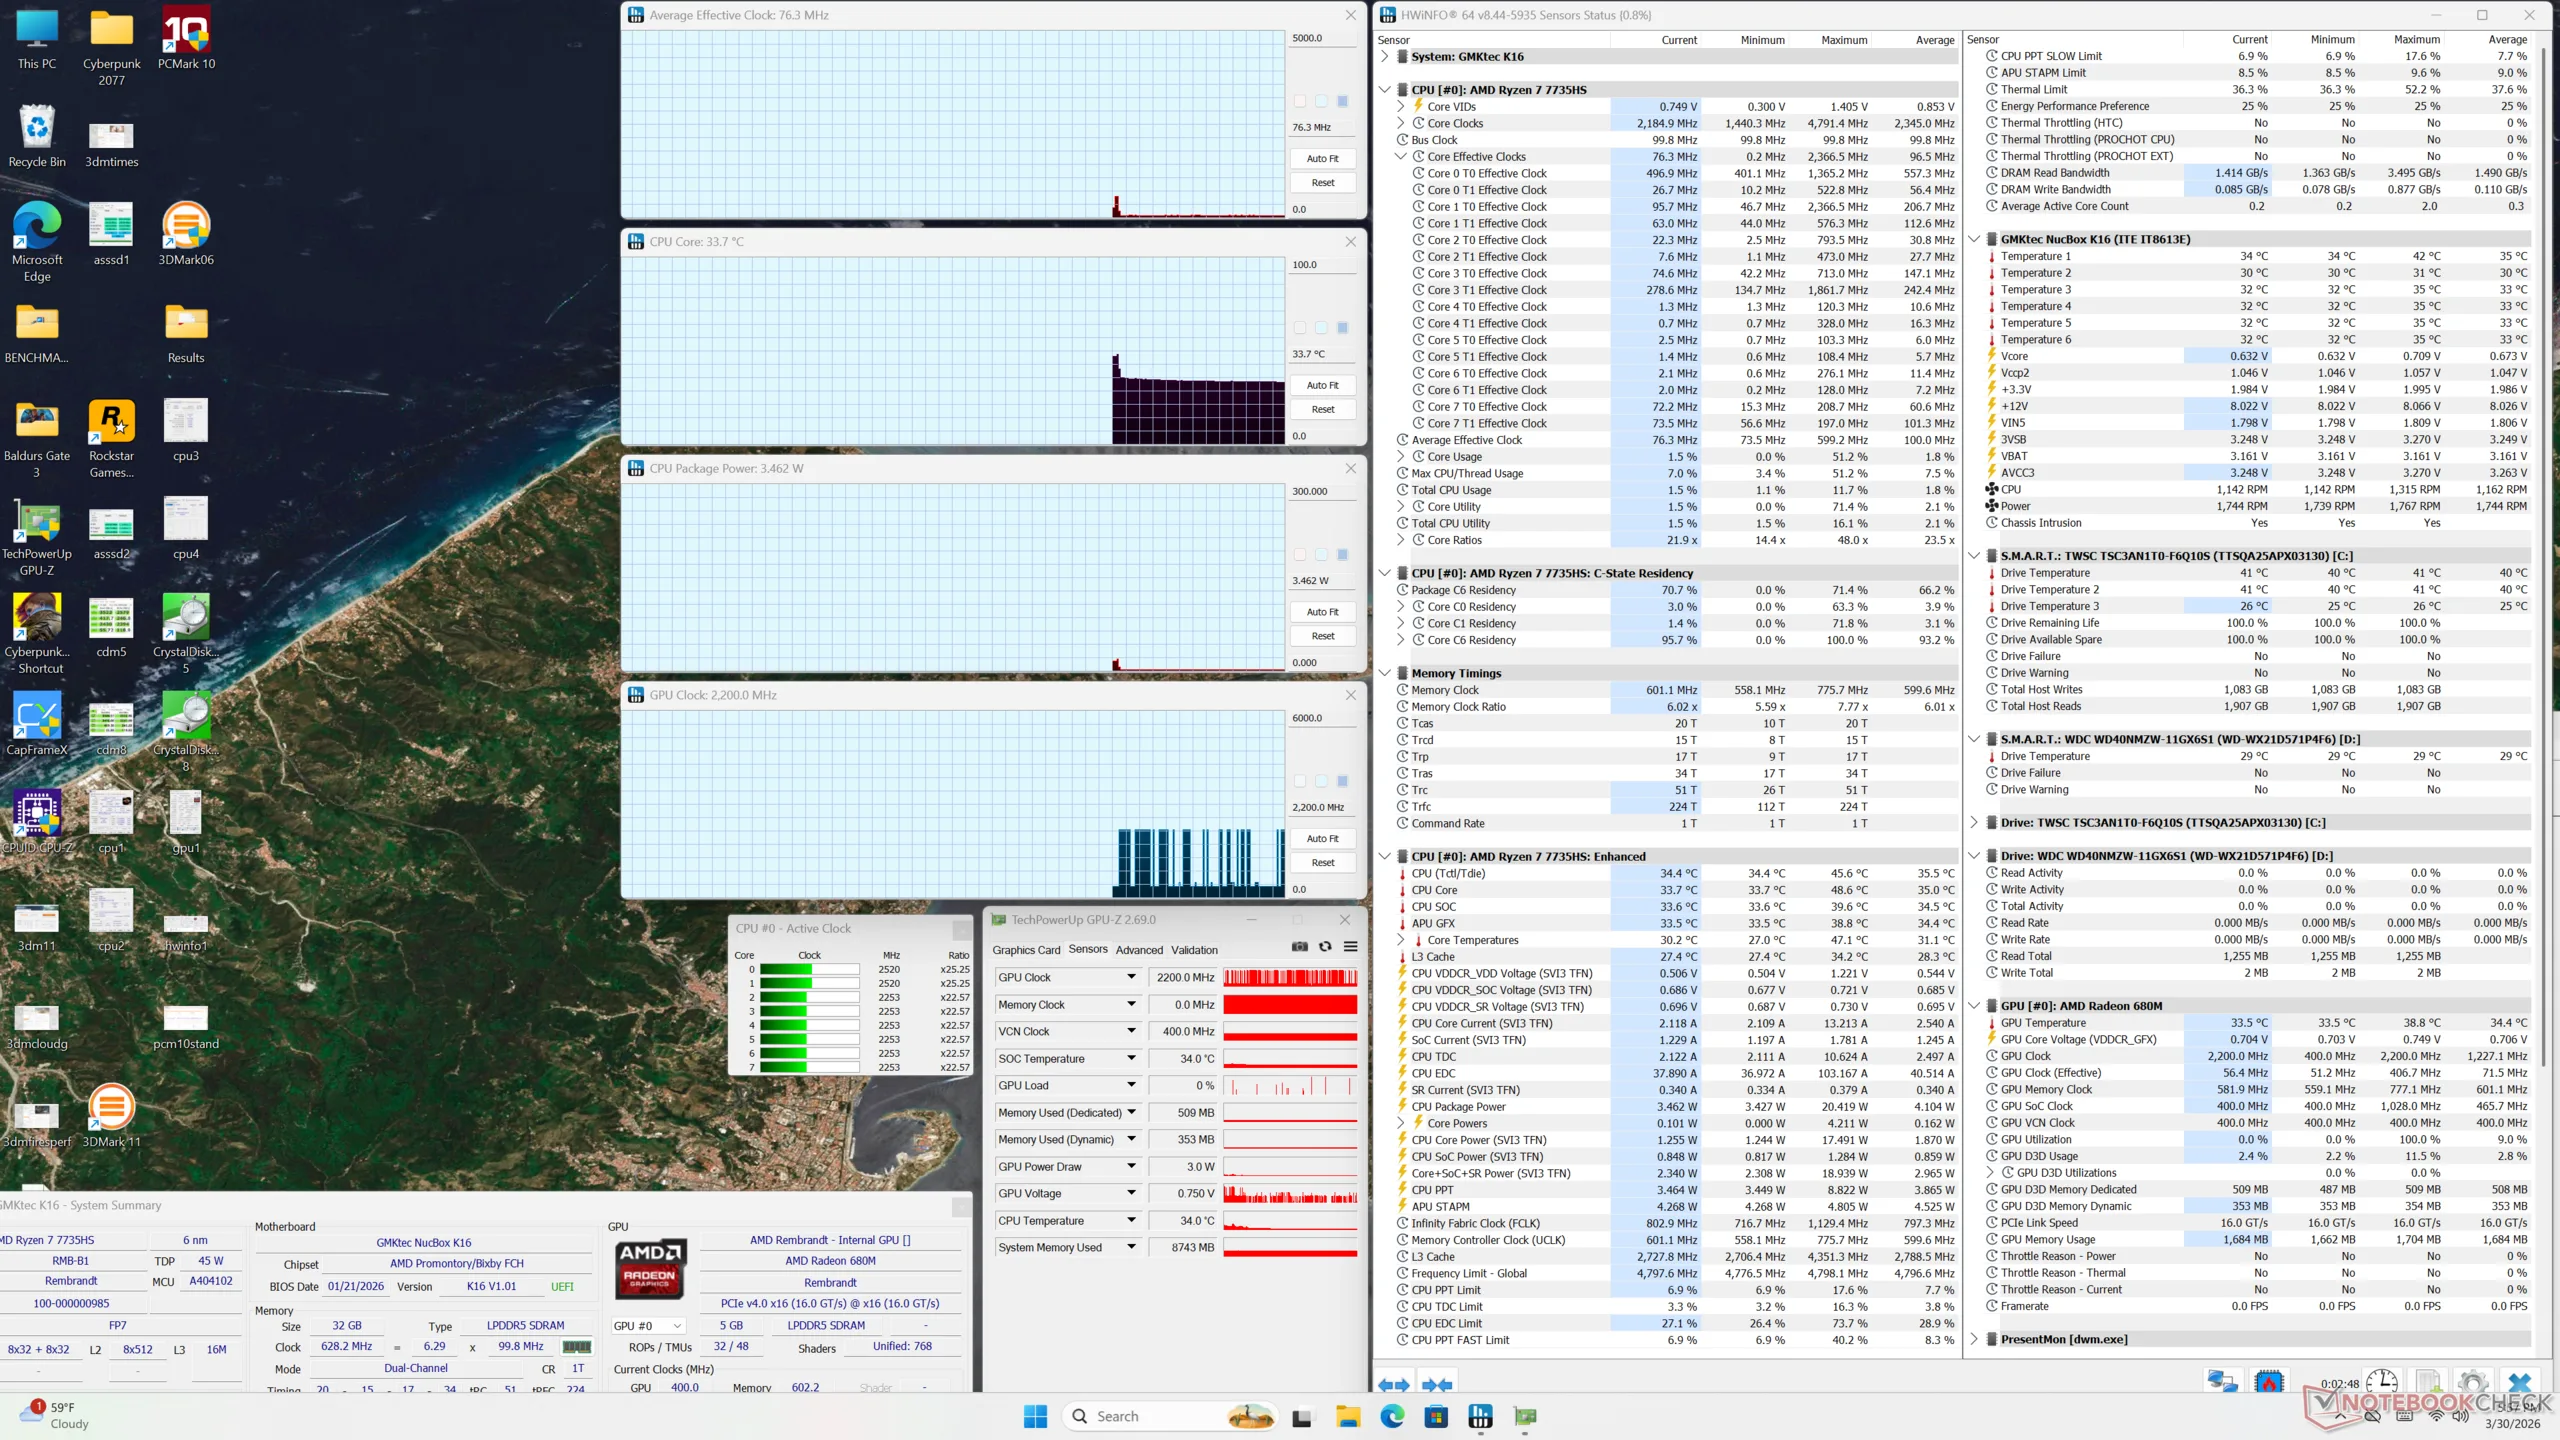
| Sistema inattivo | -- | 400 | 34 |
| Stress Prime95 | 4.1 | -- | 81 |
| Prime95 + FurMark Stress | 4.2 | 1763 | 75 |
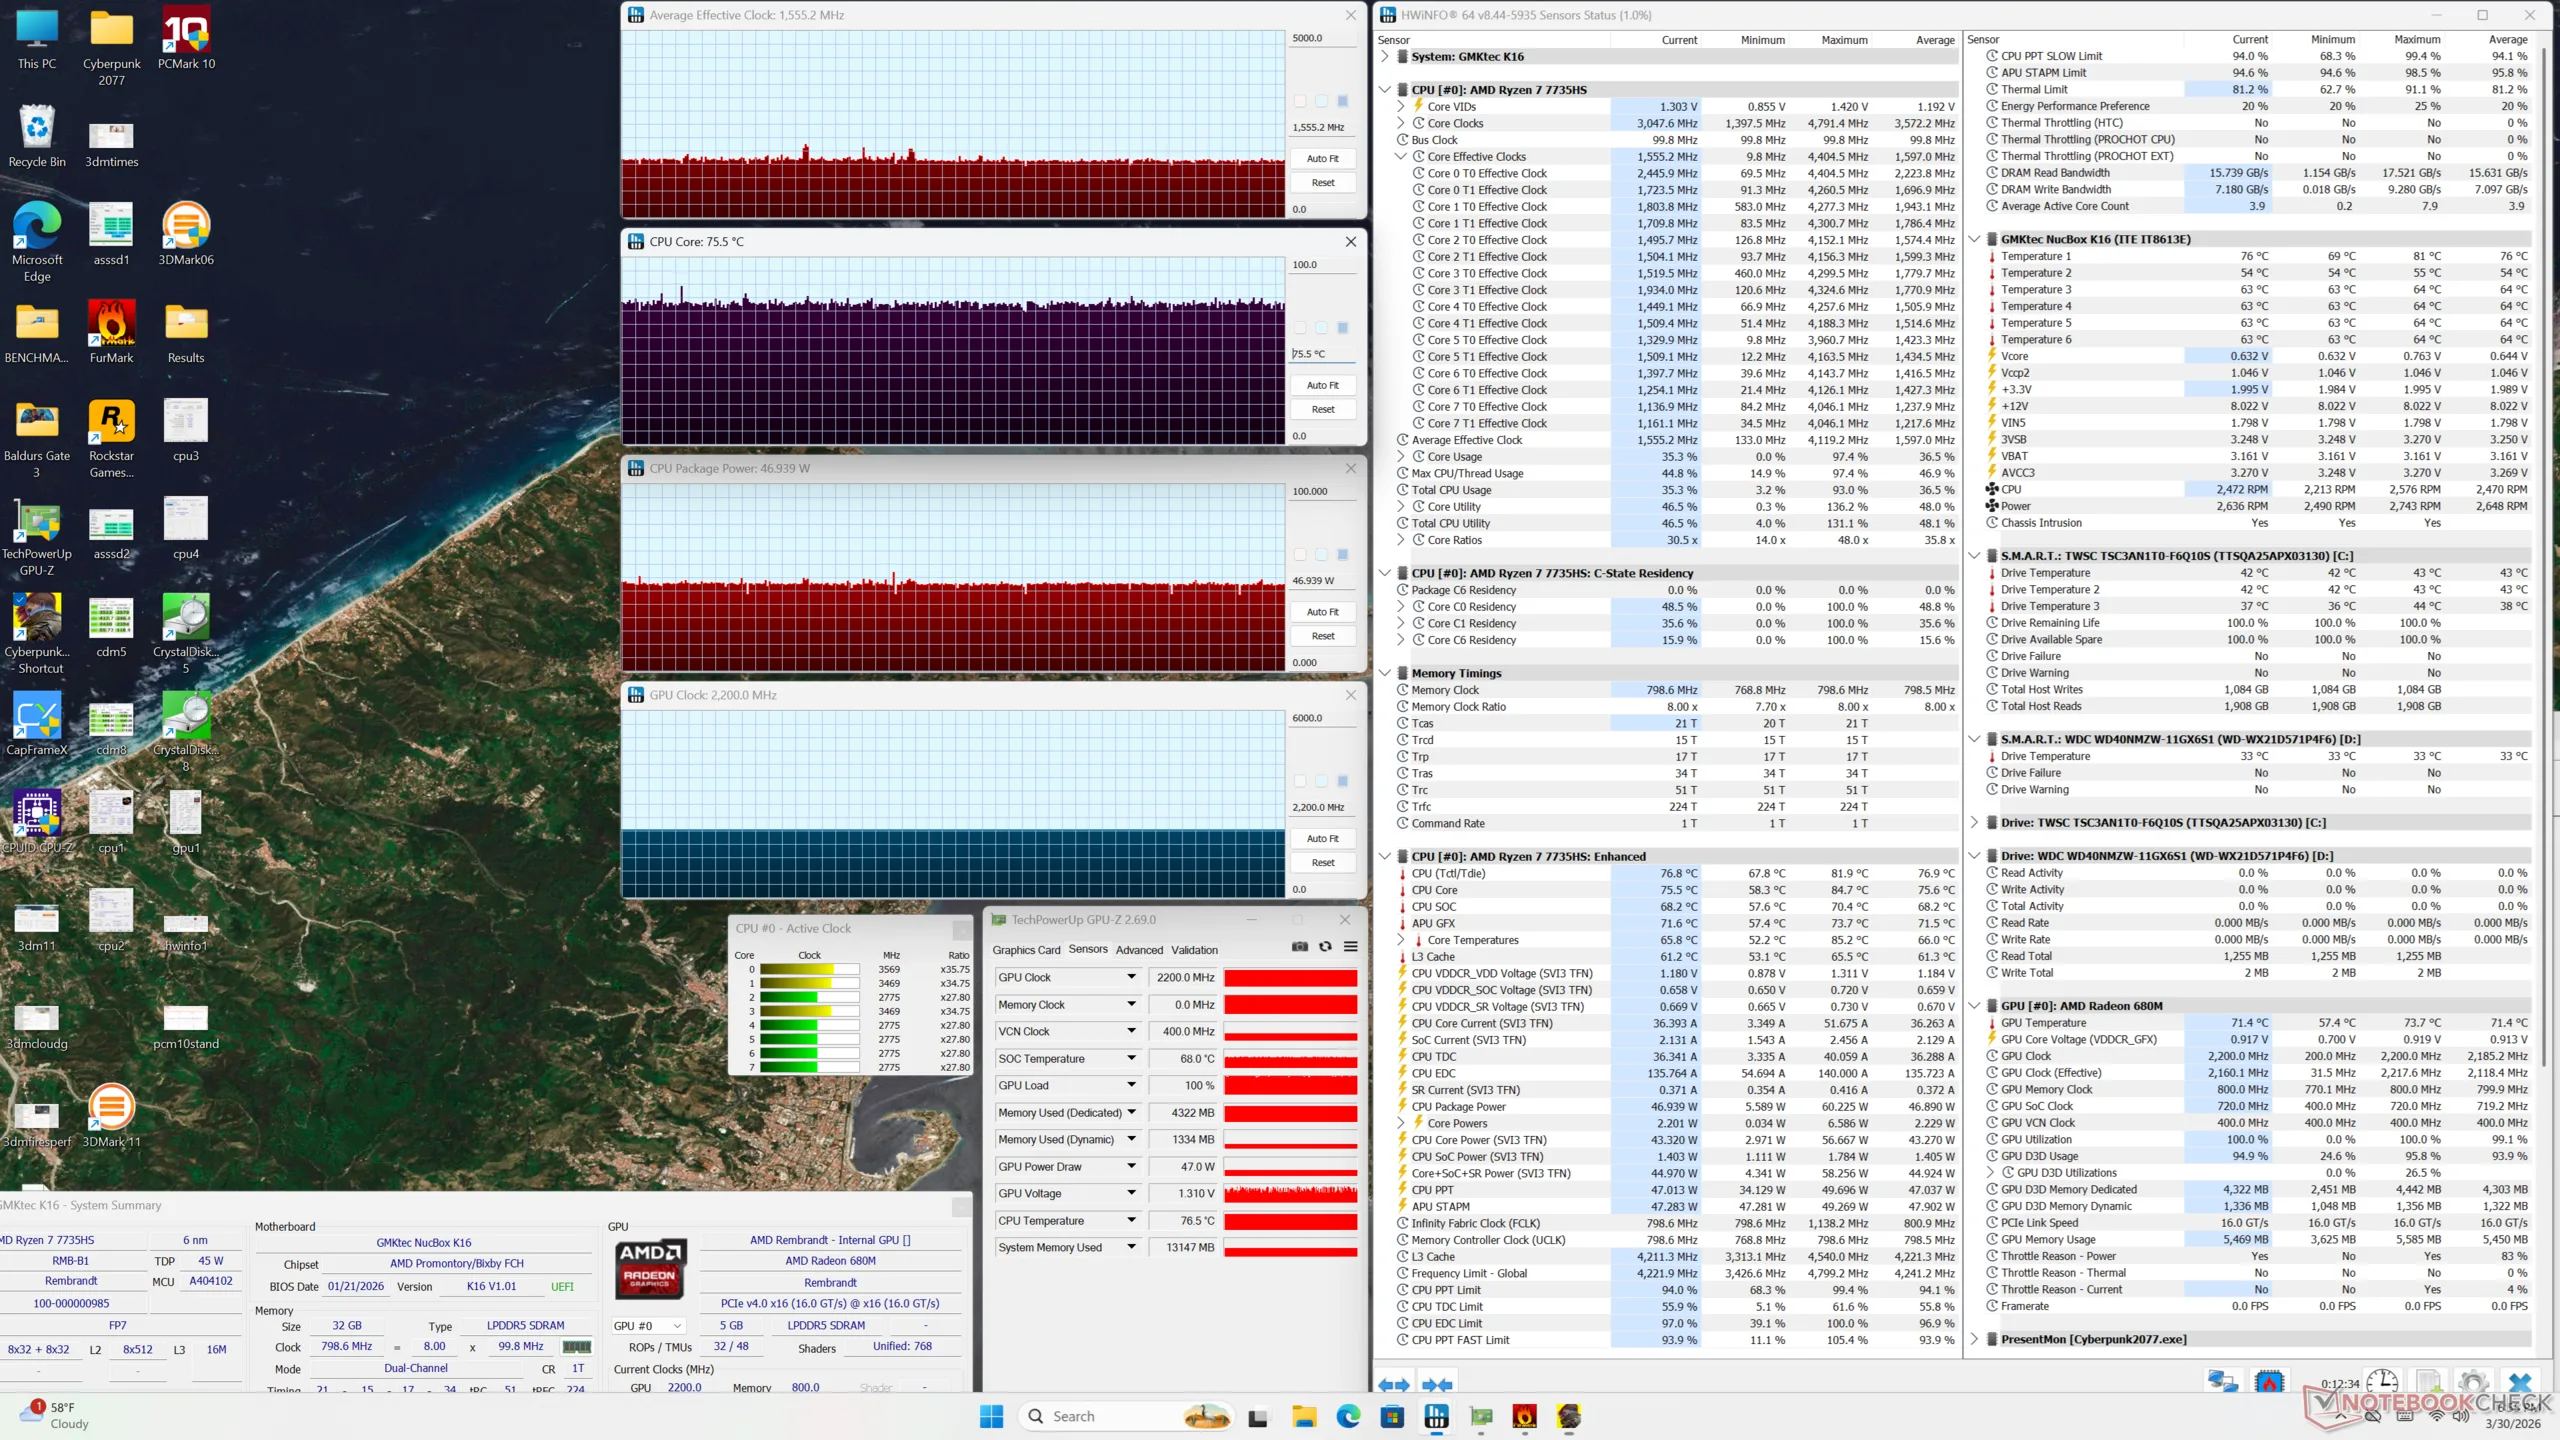
| Cyberpunk 2077 Stress | 1,6 | 2200 | 76 |
Gestione dell'energia
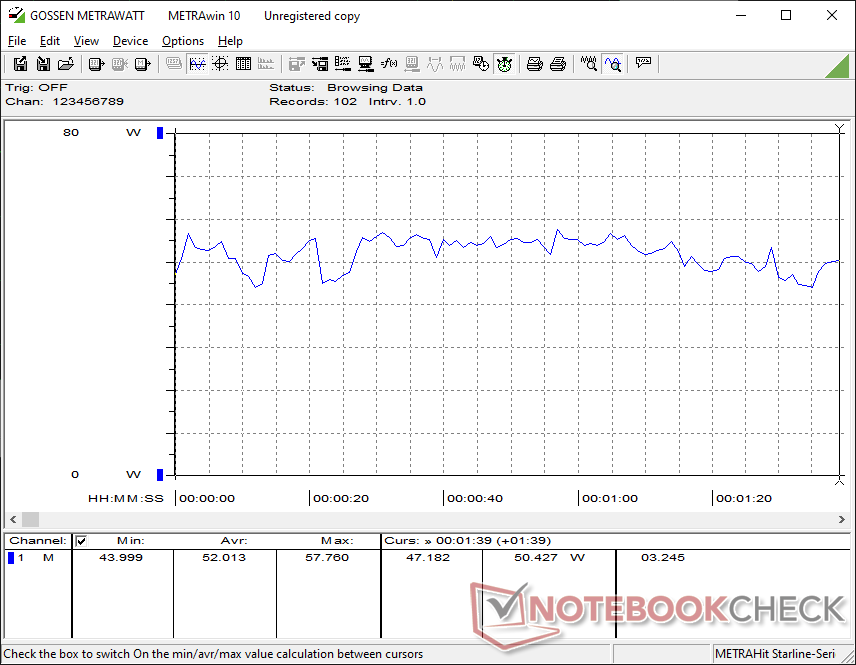
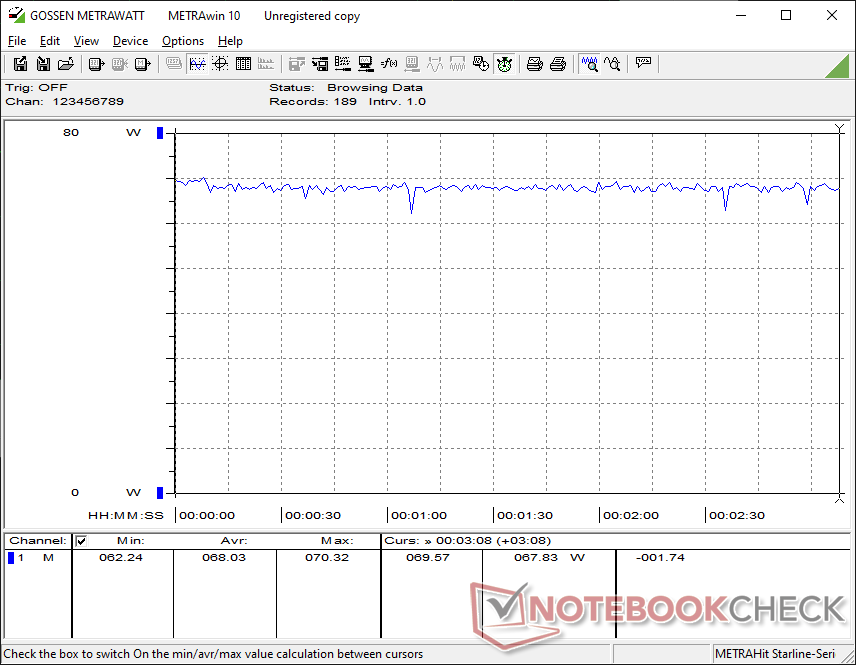
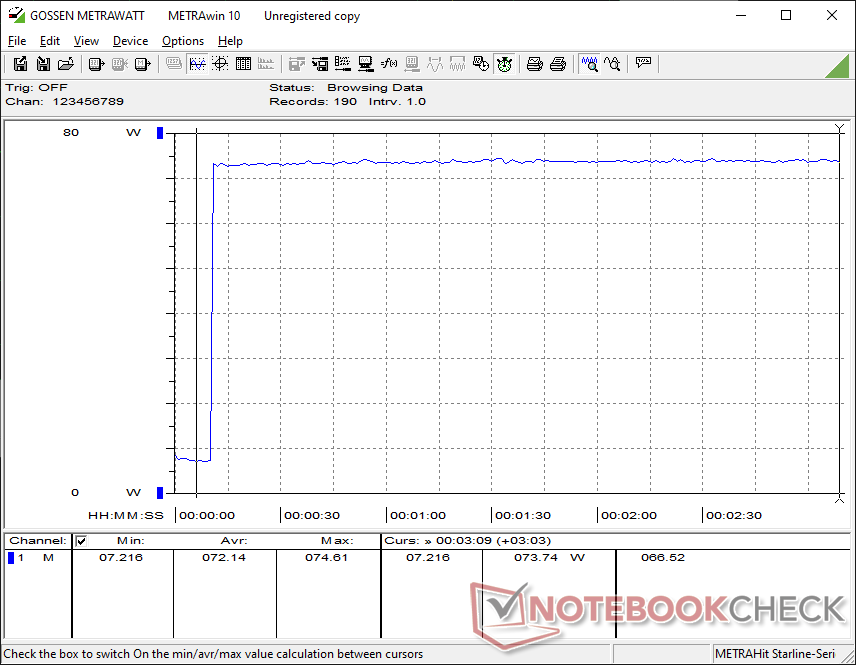
Consumo di energia
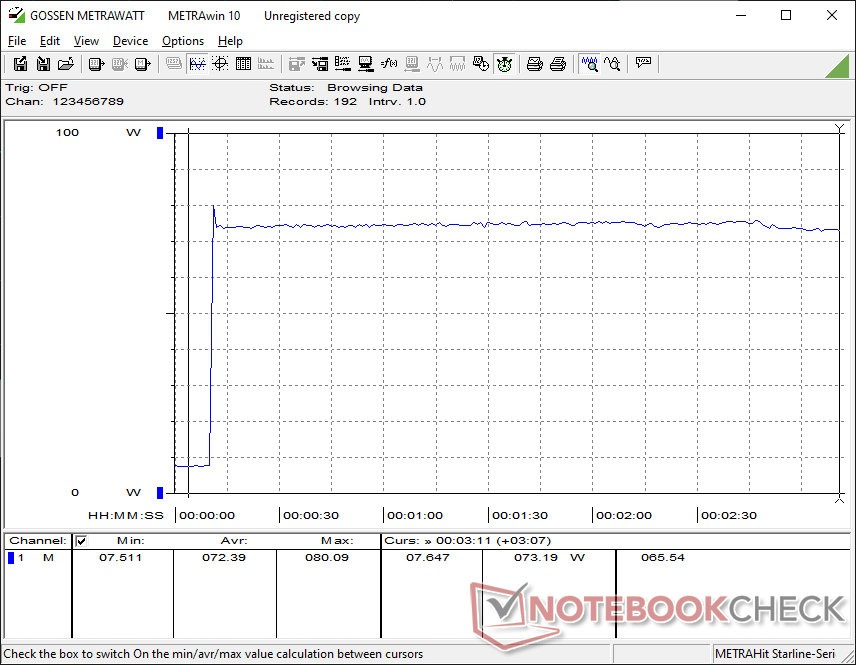
Il consumo energetico è il punto in cui il sistema Zen 3+ inizia a mostrare la sua età. Durante i giochi, il sistema consuma quasi 70 W o il doppio rispetto alla NucBox K13 alimentata da Lunar Lake, anche se quest'ultima offre prestazioni grafiche migliori del 60-90%. Allo stesso modo, durante l'esecuzione di Prime95, il NucBox K16 richiederebbe più del doppio dell'energia per un aumento mediocre del 20% delle prestazioni del processore.
Siamo riusciti a misurare un assorbimento massimo di 80 W dall'adattatore CA da 120 W di medie dimensioni (~13,3 x 5,8 x 3,2 cm).
| Off / Standby | |
| Idle | |
| Sotto carico |
|
Leggenda:
min: | |
| GMK NucBox K16 R7 7735HS, Radeon 680M, TWSC TSC3AN1T0-F6Q10S, , x, | GMK NucBox K13 Core Ultra 7 256V, Arc 140V, Huawei eKitStor Xtreme 200e 1 TB, , x, | Beelink SER9 Pro Ryzen 7 H 255, Radeon 780M, Crucial P3 Plus CT1000P3PSSD8, , x, | Geekom A7 Max, R9 7940HS R9 7940HS, Radeon 780M, Wodposit WPBSN4M8-1TGP, , x, | Asus NUC 15 Pro+ Ultra 9 285H, Arc 140T, Micron 3500 1TB MTFDKBA1T0TGD, , x, | MSI Cubi NUC AI+ 2MG Core Ultra 7 258V, Arc 140V, Phison 1 TB ESR01TBTCCZ-27J, , x, | |
|---|---|---|---|---|---|---|
| Power Consumption | 50% | -4% | -1% | -7% | 24% | |
| Idle Minimum * (Watt) | 7.4 | 2.3 69% | 7 5% | 5.6 24% | 3.9 47% | 2.9 61% |
| Idle Average * (Watt) | 7.7 | 3.6 53% | 7.1 8% | 7.1 8% | 6.1 21% | 5.7 26% |
| Idle Maximum * (Watt) | 7.7 | 5.8 25% | 7.5 3% | 8.4 -9% | 8.2 -6% | 10.2 -32% |
| Load Average * (Watt) | 52 | 27.3 47% | 62.3 -20% | 57.5 -11% | 56.1 -8% | 38.7 26% |
| Cyberpunk 2077 ultra external monitor * (Watt) | 68 | 31.6 54% | 80.1 -18% | 67.4 1% | 63.9 6% | 41.1 40% |
| Load Maximum * (Watt) | 80.1 | 39.6 51% | 82.9 -3% | 92.9 -16% | 160.6 -100% | 60 25% |
* ... Meglio usare valori piccoli
Consumo di energia Cyberpunk / Stress Test
Consumo di energia del monitor esterno
Valutazione Notebookcheck
NucBox K16 integra una CPU AMD Zen 3+ di vecchia generazione con un design dello chassis più recente, completo di Oculink e di doppie porte RJ-45 che i professionisti possono apprezzare.
GMK NucBox K16
- 04/01/2026 v8
Allen Ngo
 Total Sustainability Score:
 Potenziali concorrenti a confronto
Immagine | Modello | Prezzo | Peso | Altezza | Schermo |
|---|---|---|---|---|---|
1. 64.8%  | GMK NucBox K16 AMD Ryzen 7 7735HS ⎘ AMD Radeon 680M ⎘ 32 GB Memoria, 1024 GB SSD | Amazon: Prezzo di listino: 650 USD | 567 gr | 63 mm | x |
2. 77.4%  | GMK NucBox K13 Intel Core Ultra 7 256V ⎘ Intel Arc Graphics 140V ⎘ 16 GB Memoria, 1024 GB SSD | Amazon: Prezzo di listino: 670 USD | 506 gr | 36.6 mm | x |
3. 80.2%  | Beelink SER9 Pro AMD Ryzen 7 H 255 ⎘ AMD Radeon 780M ⎘ 32 GB Memoria, 1024 GB SSD | Amazon: Prezzo di listino: 520 USD | 812 gr | 44.7 mm | x |
4. 78.2% 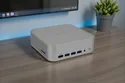 | Geekom A7 Max, R9 7940HS AMD Ryzen 9 7940HS ⎘ AMD Radeon 780M ⎘ 16 GB Memoria, 1024 GB SSD | Amazon: Prezzo di listino: 749€ | 681 gr | 46.9 mm | x |
5. 77.5% 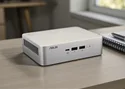 | Asus NUC 15 Pro+ Intel Core Ultra 9 285H ⎘ Intel Arc Graphics 140T ⎘ 32 GB Memoria, 1024 GB SSD | Amazon: $1,642.00 Prezzo di listino: 991€ | 690 gr | 42 mm | x |
6. 75.2% 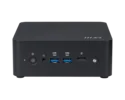 | MSI Cubi NUC AI+ 2MG Intel Core Ultra 7 258V ⎘ Intel Arc Graphics 140V ⎘ 32 GB Memoria, 1000 GB SSD | Amazon: Prezzo di listino: 900 USD | 669 gr | 50.1 mm | x |
Transparency
La selezione dei dispositivi da recensire viene effettuata dalla nostra redazione. Il campione di prova è stato fornito all'autore come prestito dal produttore o dal rivenditore ai fini di questa recensione. L'istituto di credito non ha avuto alcuna influenza su questa recensione, né il produttore ne ha ricevuto una copia prima della pubblicazione. Non vi era alcun obbligo di pubblicare questa recensione. In quanto società mediatica indipendente, Notebookcheck non è soggetta all'autorità di produttori, rivenditori o editori.
Ecco come Notebookcheck esegue i test
Ogni anno, Notebookcheck esamina in modo indipendente centinaia di laptop e smartphone utilizzando procedure standardizzate per garantire che tutti i risultati siano comparabili. Da circa 20 anni sviluppiamo continuamente i nostri metodi di prova e nel frattempo stabiliamo gli standard di settore. Nei nostri laboratori di prova, tecnici ed editori esperti utilizzano apparecchiature di misurazione di alta qualità. Questi test comportano un processo di validazione in più fasi. Il nostro complesso sistema di valutazione si basa su centinaia di misurazioni e parametri di riferimento ben fondati, che mantengono l'obiettività.
