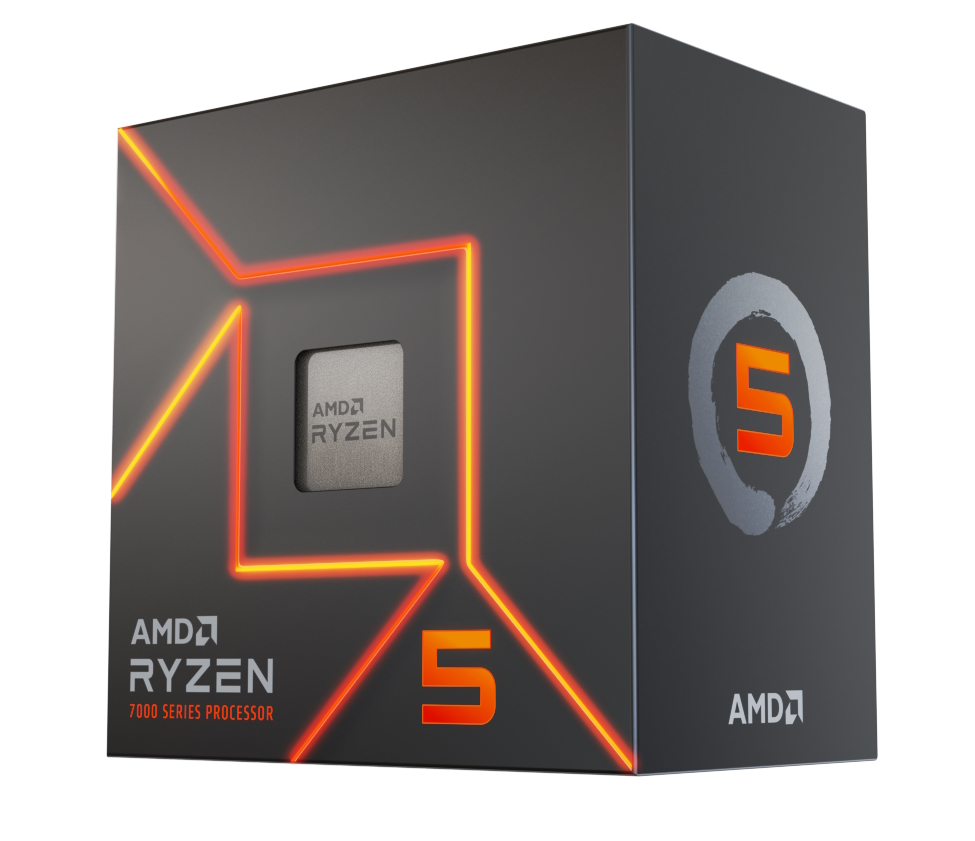
Recensione dell'AMD Ryzen 5 7600 65 W: Il punto di forza del gaming di fascia media da 220 dollari che supera il Core i9-12900K e tutte le CPU Zen 3 in single-core

Al CES 2023 AMD ha presentato la famiglia Ryzen 7000 da 65 W, destinata a un prezzo economico. Sono praticamente identiche alle CPU Ryzen 7000X, tranne che per i clock di boost leggermente inferiori, e sono dotate di supporto per l'overclocking.
In precedenza, abbiamo recensito il AMD Ryzen 7 7700 come uno dei primi componenti non-X da 65 W. Ora, invece, recensiamo il Ryzen 5 7600 entry-level. A breve seguirà la recensione del top-end Ryzen 9 7900.
Una panoramica dei processori desktop AMD 'Raphael' Zen 4 Ryzen 7000
| AMD Ryzen 7000 SKU | Cores / Threads | Clock di base | Turbo Clock | L2 Cache | L3 Cache | TDP | PPT | Prezzo di lancio |
|---|---|---|---|---|---|---|---|---|
| AMD Ryzen 9 7950X3D | 16 / 32 | 4,2 GHz | 5,7 GHz | 16x 1 MB | 128 MB | 120 W | 162 W | US$699 |
| AMD Ryzen 9 7950X | 16 / 32 | 4,5 GHz | 5,7 GHz | 16x 1 MB | 64 MB | 170 W | 230 W | US$699 |
| AMD Ryzen 9 7900X | 12 / 24 | 4,7 GHz | 5,6 GHz | 12x 1 MB | 64 MB | 170 W | 230 W | US$549 |
| AMD Ryzen 9 7900 | 12 / 24 | 3,7 GHz | 5,4 GHz | 12x 1 MB | 64 MB | 65 W | 88 W | US$429 |
| AMD Ryzen 7 7700X | 8 / 16 | 4,5 GHz | 5,4 GHz | 8x 1 MB | 32 MB | 105 W | 142 W | US$399 |
| AMD Ryzen 7 7700 | 8 / 16 | 3,8 GHz | 5,3 GHz | 8x 1 MB | 32 MB | 65 W | 88 W | US$329 |
| AMD Ryzen 5 7600X | 6 / 12 | 4,7 GHz | 5,3 GHz | 6x 1 MB | 32 MB | 105 W | 142 W | US$299 |
| AMD Ryzen 5 7600 | 6/ 12 | 3,8 GHz | 5,1 GHz | 6x1 MB | 32 MB | 65 W | 88 W | US$229 |
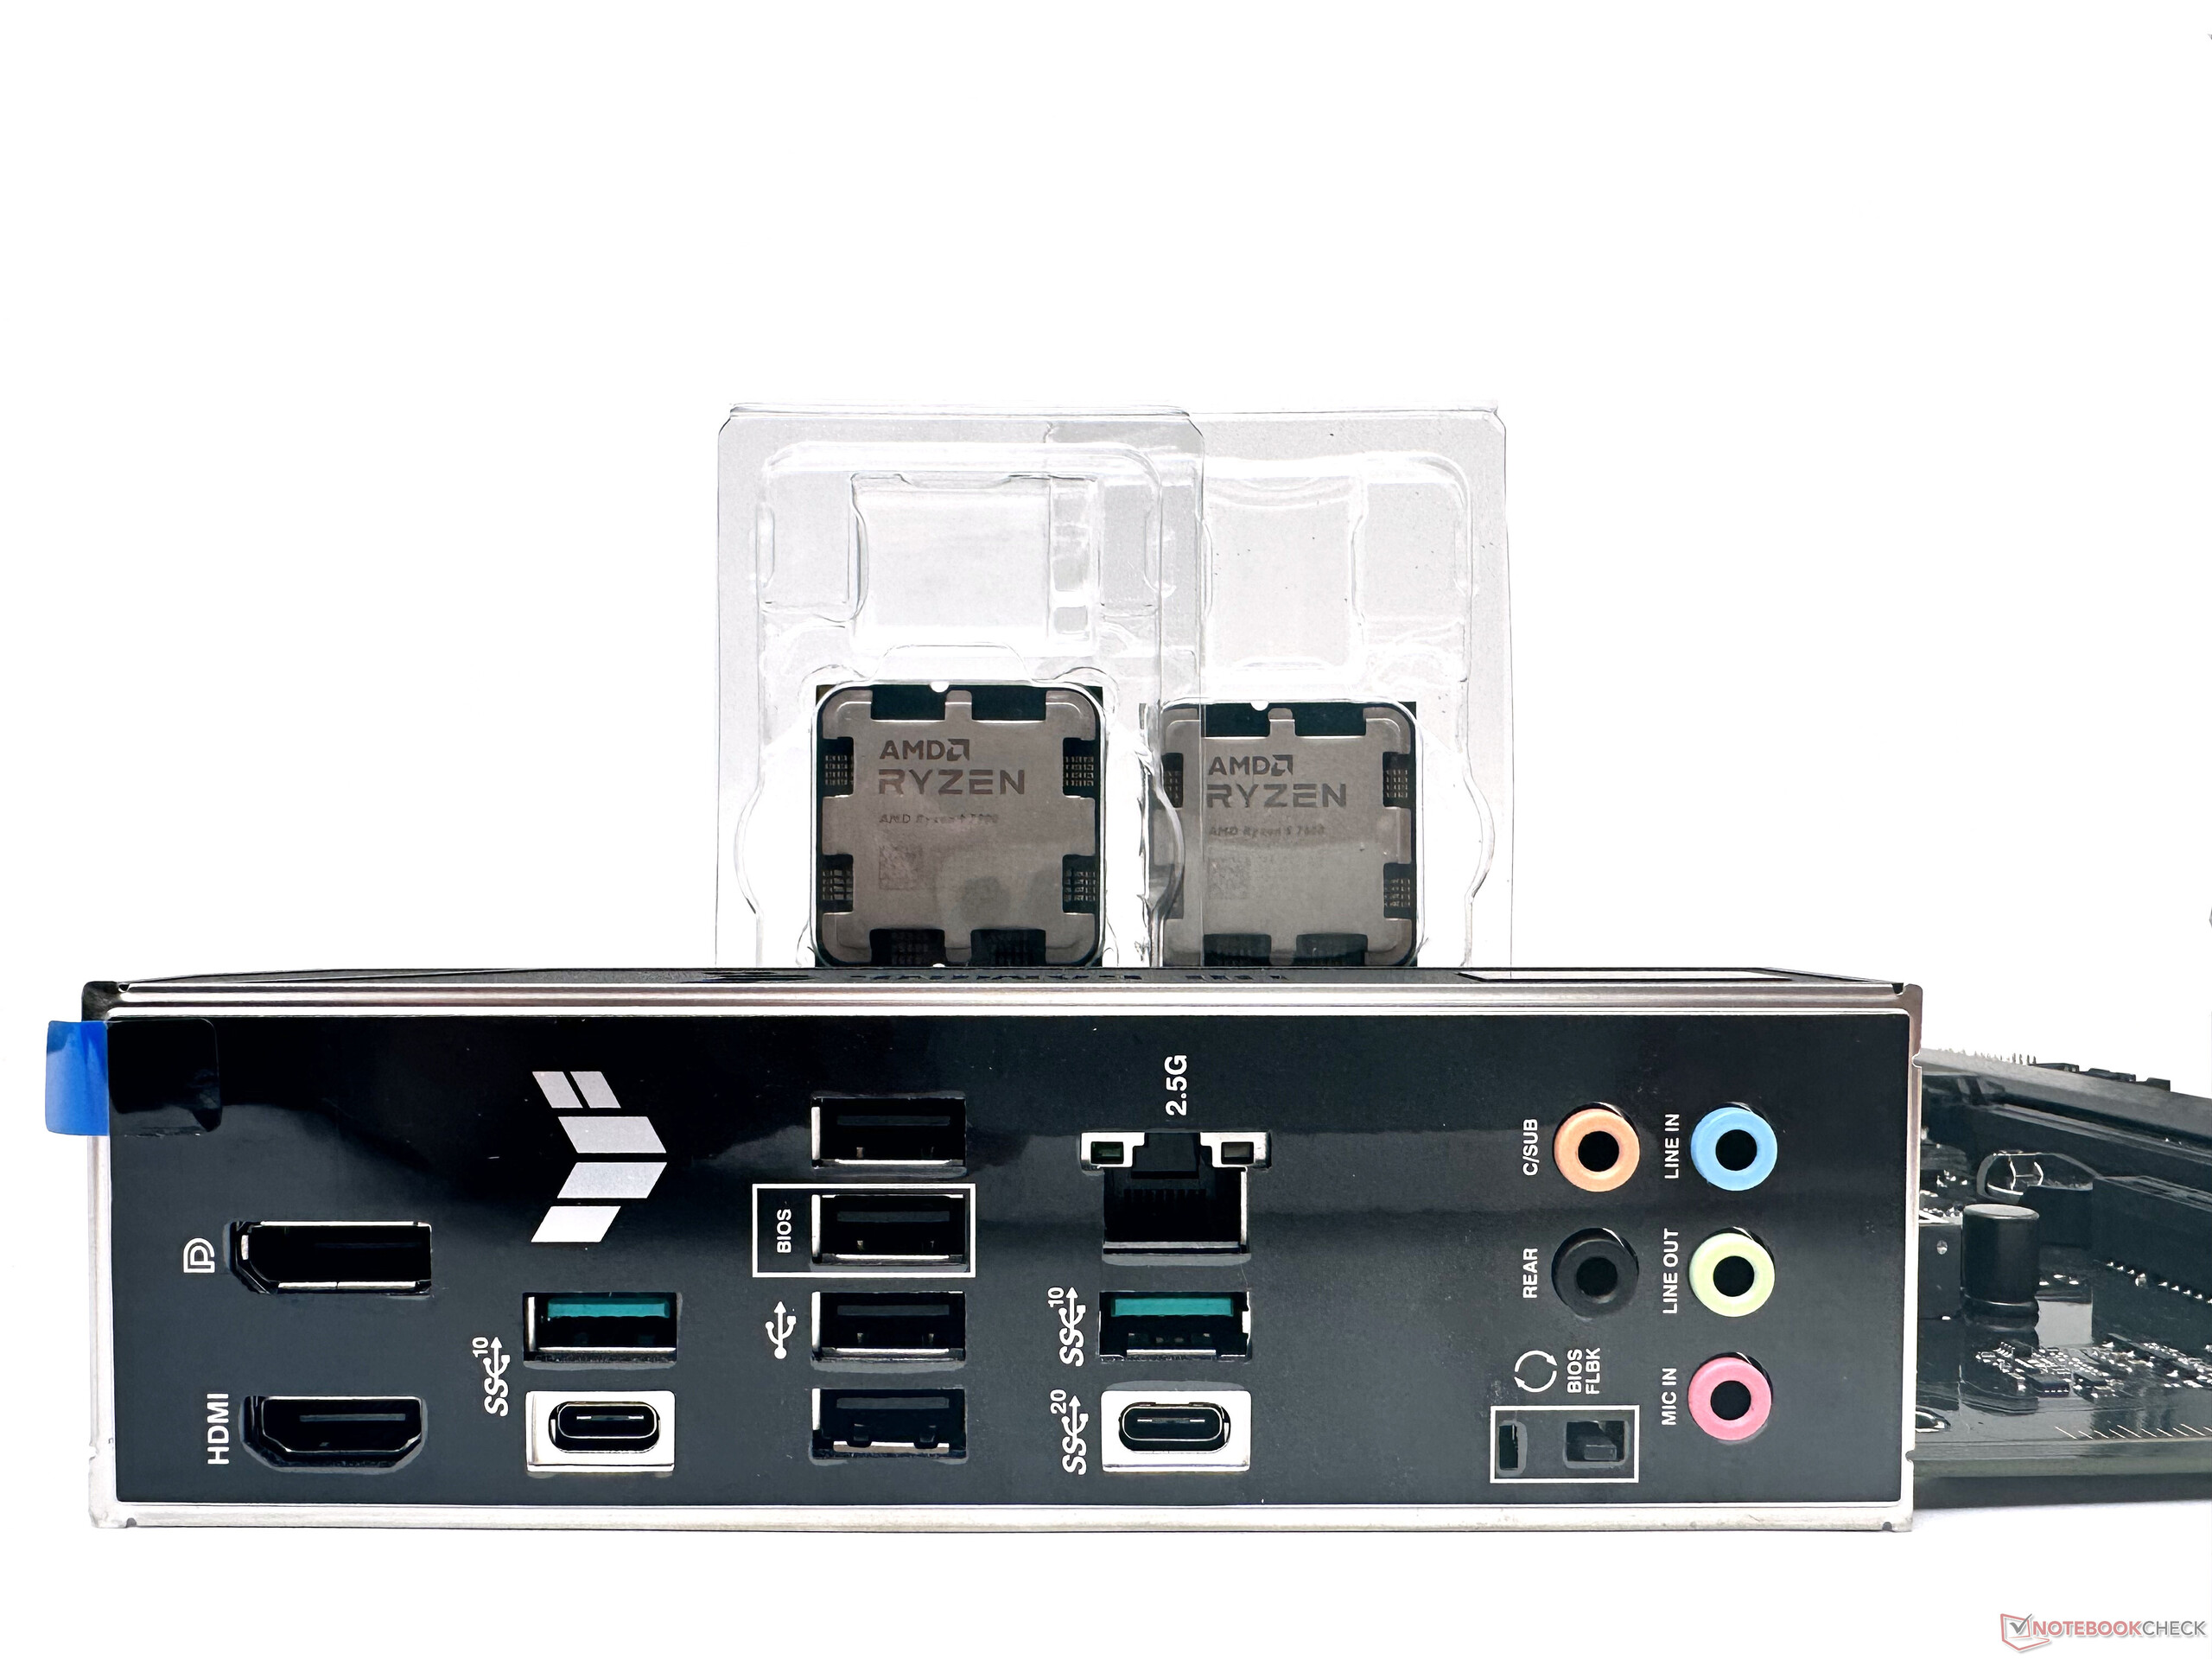
Il Ryzen 5 7600 offre sei core e 12 thread con un boost clock di 5,1 GHz (contro i 5,3 GHz del Ryzen 5 7600X).Ryzen 5 7600X). La CPU ha un TDP di 65 W ed è attualmente in vendita al prezzo di ₹22.997 (281,5 dollari) sul mercato indiano.
AMD offre in dotazione un radiatore Wraith Stealth e una garanzia di tre anni.
Il banco di prova: Una combinazione di Ryzen 5 7600 e RTX 4090
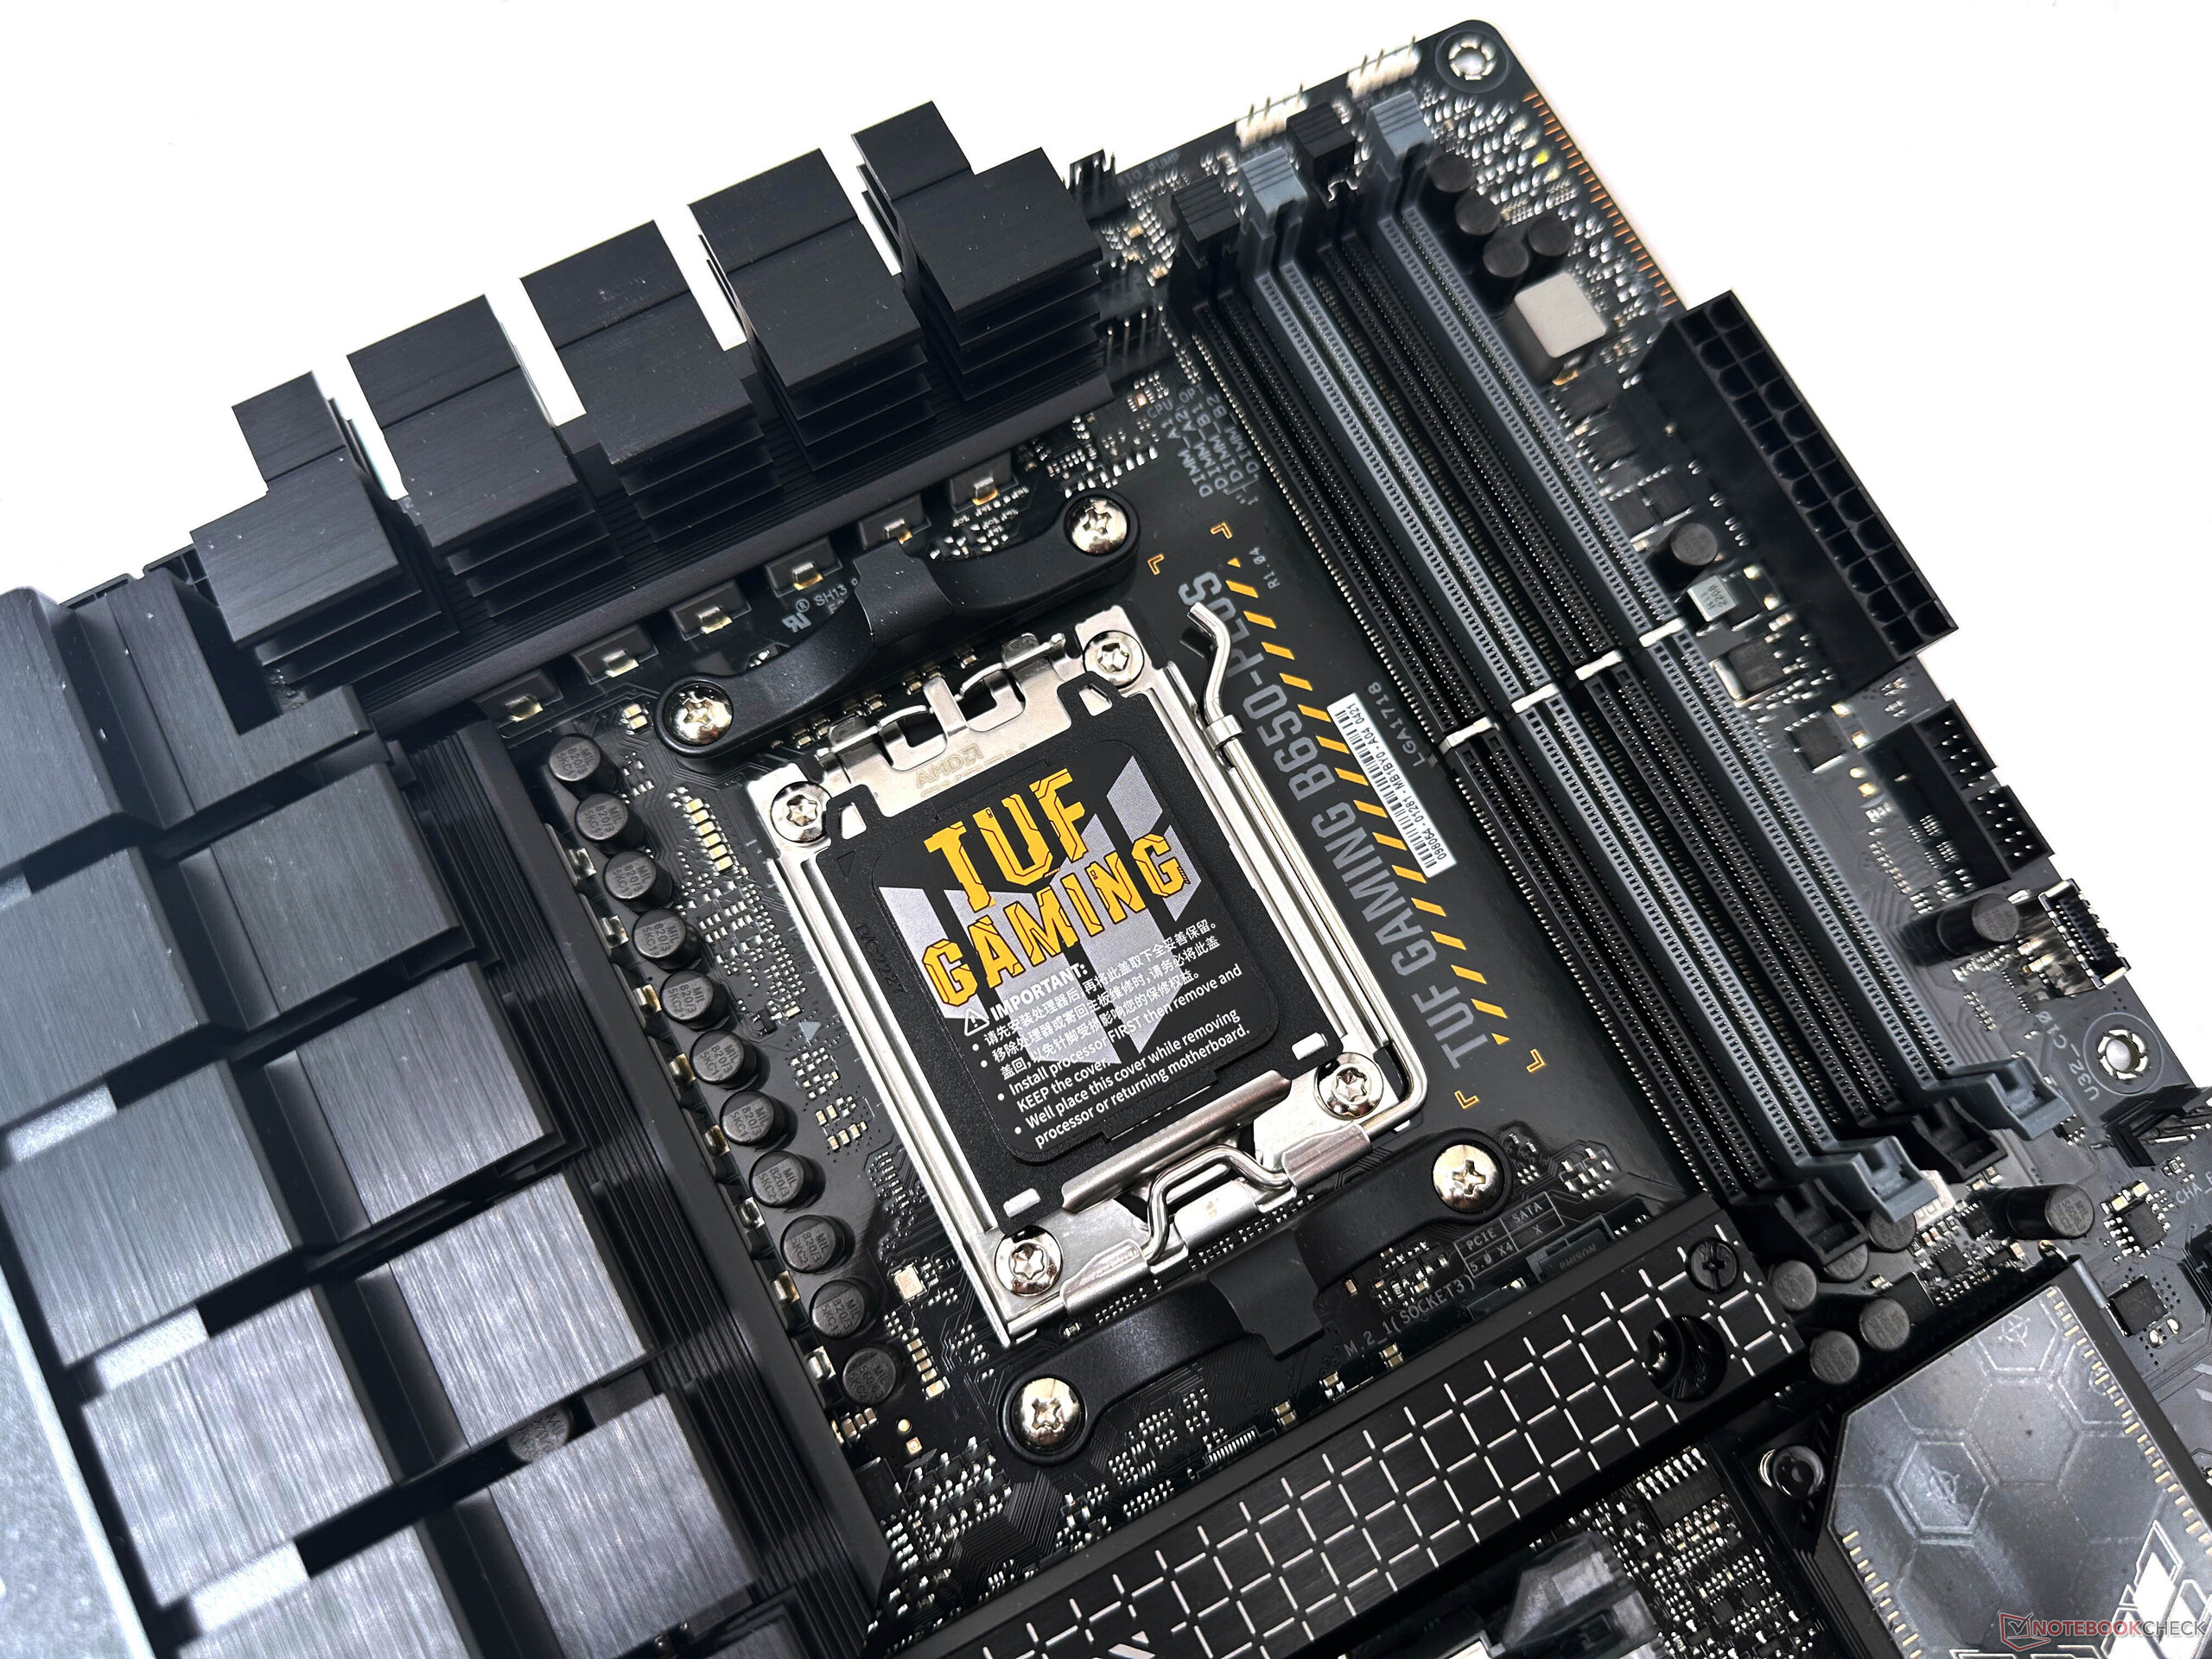
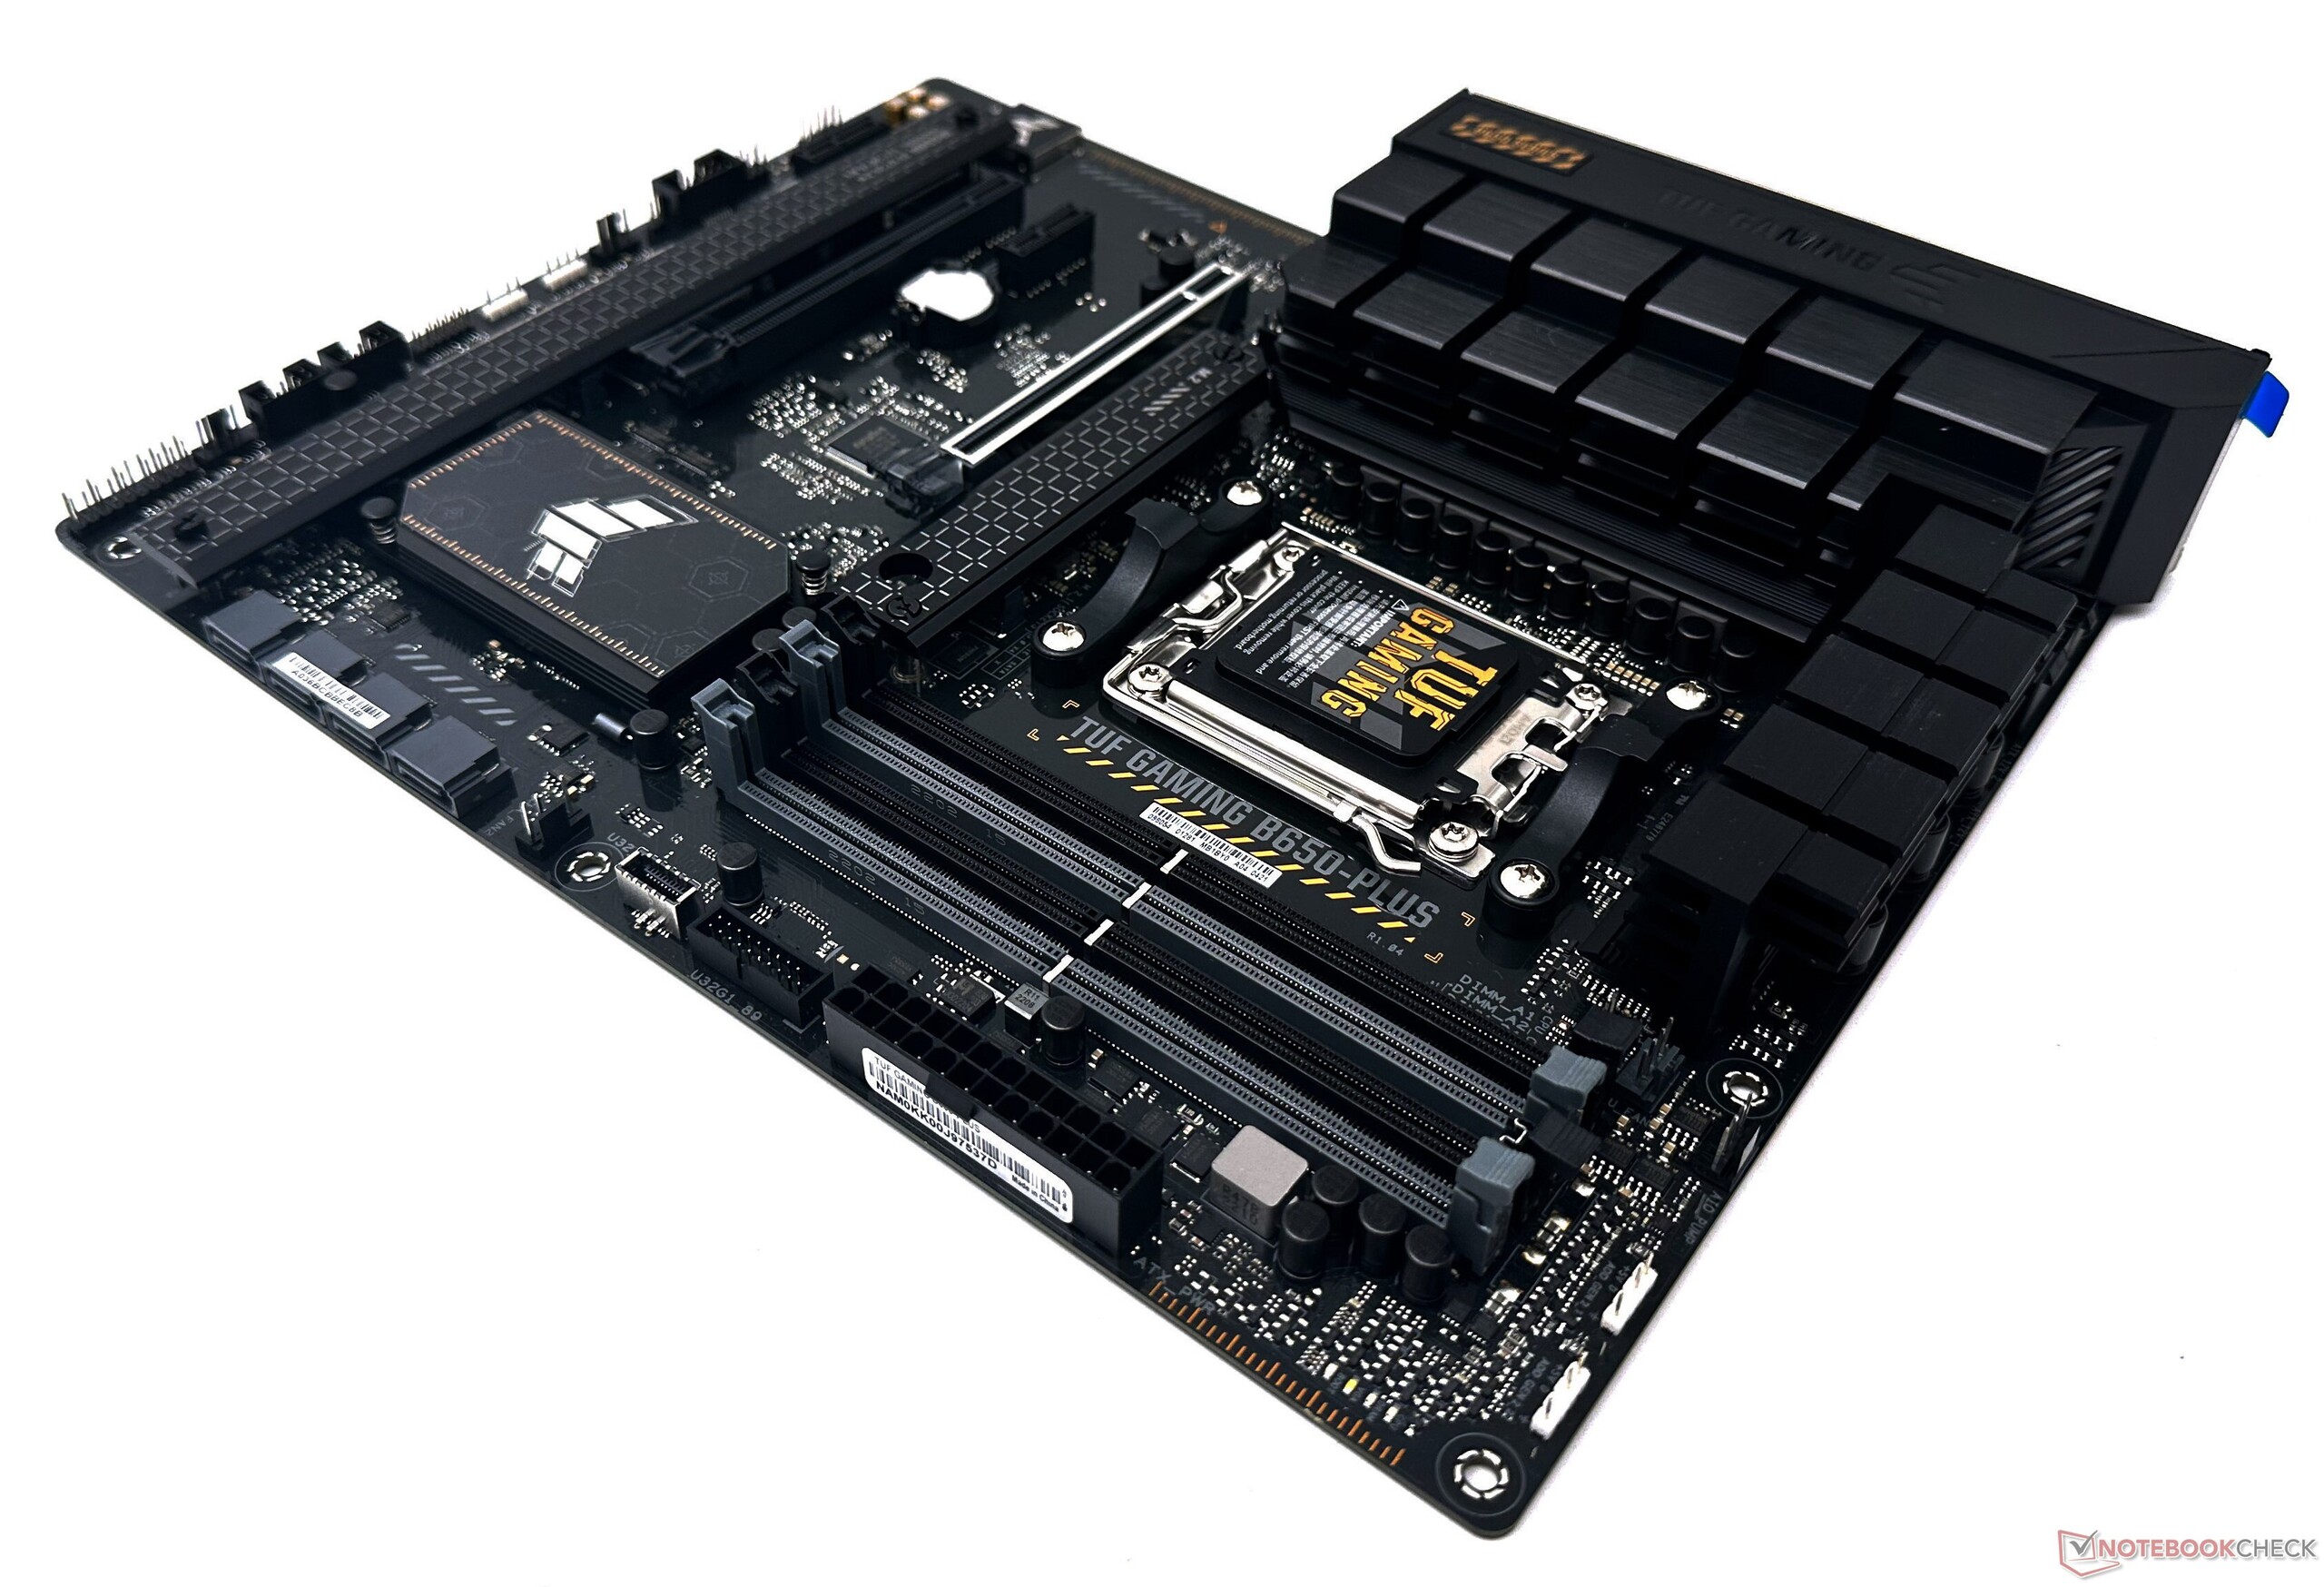
Il nostro banco di prova per l'AMD Ryzen 5 7600 è basato sul nuovo chipset B650. Questo include i seguenti componenti:
- Banco di prova Cooler Master MasterFrame 700
- Asus TUF Gaming B650-Plus con BIOS versione 1222
- Nvidia GeForce RTX 4090 Founders Edition
- Kingston Fury Renegade 1 TB NVMe SSD per i benchmark e i giochi
- 2x 16 GB di RAM Kingston Fury Beast RGB DDR5-6000 con timing 36-38-38-80 a 1,35 V
- Monitor Gigabyte M28U 4K 144 Hz
- Raffreddatore AIO Cooler Master MasterLiquid ML360L V2 ARGB
- Thermaltake ToughPower Grand RGB 850 W PSU
- Una nuova installazione di Windows 11 22H2 con le ultime patch e driver
Desideriamo ringraziare AMD per averci fornito la CPU Ryzen 5 7600 e il kit di memoria Kingston DDR5, e Asus per la scheda madre TUF Gaming B650-Plus e l'SSD Kingston. Vorremmo anche ringraziare Nvidia per la GPU RTX 4090, Gigabyte per il monitor M28U e infine Cooler Master per il banco di prova e il dissipatore AIO.
Nota: stiamo passando dalla RTX 3090 alla RTX 4090 per i test delle CPU desktop. Pertanto, i confronti sintetici 3D e di gioco con la RTX 4090 sono disponibili solo per un numero limitato di CPU al momento. Speriamo di poter testare altre CPU con la RTX 4090 nei prossimi giorni.
I benchmark relativi alle sole CPU non dovrebbero essere interessati da questa modifica.
Parametri di riferimento della CPU: batte tutte le CPU Zen 3 e il Core i9-12900K in single-core
Il 6C/12T AMD Ryzen 5 7600 a 65 W riesce ad essere un pelo più veloce del 8C/16T Ryzen 7 5800X a 105 W in termini di prestazioni cumulative della CPU, ma rimane indietro rispetto al Ryzen 5 7600X Ryzen 5 7600X di circa il 7% a causa dei clock di boost inferiori.
Mentre vediamo un vantaggio dell'11% rispetto all'Intel Core i5-12600K Intel Core i5-12600Kla CPU è anche in ritardo rispetto al Core i5-13600K del 15%.
Cinebench R20 e Cinebench R23 vedono il Ryzen 5 7600 superare facilmente tutte le CPU Zen 3, compreso il Ryzen 9 5950X AMD Vermeer (Ryzen 5000) R9 5950X Notebook Processor , in single core. AMD ha costantemente dimostrato eccellenti prestazioni single-core con Zen 4, e vediamo che il Ryzen 5 7600 è solo l'8% e il 10% dietro le parti di punta Ryzen 9 7950X e Ryzen 9 7950X3D, rispettivamente nei test sopra menzionati.
Sebbene i test Cinebench mostrino un notevole divario tra il Ryzen 5 7600 e il Core i9-13900K nelle prestazioni single-core, vediamo che questo divario si riduce significativamente in Geekbench. In questo caso, il Ryzen 5 7600 riesce a superare di un soffio il Core i9-12900K, che opera con una potenza di base del processore (PBP) molto più elevata, pari a 125 W.
I punteggi multi-core e la CPU di Blender subiscono una battuta d'arresto a causa del numero inferiore di core e thread. Ciononostante, notiamo ottimi guadagni rispetto al Ryzen 5 5600X e solo una carenza marginale rispetto al Ryzen 5 7600X, a seconda del benchmark.
| Performance rating - Percent | |
| AMD Ryzen 9 7950X | |
| Intel Core i9-13900K | |
| AMD Ryzen 9 7950X3D | |
| AMD Ryzen 9 7950X ECO 105 W -12! | |
| AMD Ryzen 9 7900X | |
| AMD Ryzen 9 7950X ECO 65 W -14! | |
| AMD Ryzen 9 5950X | |
| AMD Ryzen 7 7700X | |
| Intel Core i5-13600K | |
| Intel Core i9-12900K | |
| AMD Ryzen 7 7700 | |
| AMD Ryzen 7 7700X ECO 65 W -12! | |
| AMD Ryzen 9 5900X -2! | |
| AMD Ryzen 5 7600X | |
| AMD Ryzen 5 7600 | |
| AMD Ryzen 7 5800X | |
| Intel Core i5-12600K | |
| AMD Ryzen 7 5800X3D | |
| AMD Ryzen 5 5600X | |
| Cinebench R23 | |
| Single Core | |
| Intel Core i9-13900K | |
| AMD Ryzen 9 7950X3D | |
| AMD Ryzen 9 7900X | |
| AMD Ryzen 9 7950X | |
| Intel Core i5-13600K | |
| AMD Ryzen 9 7950X ECO 65 W | |
| AMD Ryzen 9 7950X ECO 105 W | |
| Intel Core i9-12900K | |
| AMD Ryzen 7 7700X ECO 65 W | |
| AMD Ryzen 7 7700X | |
| AMD Ryzen 5 7600X | |
| AMD Ryzen 7 7700 | |
| Intel Core i5-12600K | |
| AMD Ryzen 5 7600 | |
| AMD Ryzen 9 5950X | |
| AMD Ryzen 9 5900X | |
| AMD Ryzen 7 5800X | |
| AMD Ryzen 5 5600X | |
| AMD Ryzen 7 5800X3D | |
| Multi Core | |
| Intel Core i9-13900K | |
| AMD Ryzen 9 7950X | |
| AMD Ryzen 9 7950X3D | |
| AMD Ryzen 9 7950X ECO 105 W | |
| AMD Ryzen 9 7950X ECO 65 W | |
| AMD Ryzen 9 7900X | |
| AMD Ryzen 9 5950X | |
| Intel Core i9-12900K | |
| Intel Core i5-13600K | |
| AMD Ryzen 9 5900X | |
| AMD Ryzen 7 7700X | |
| AMD Ryzen 7 7700 | |
| AMD Ryzen 7 7700X ECO 65 W | |
| Intel Core i5-12600K | |
| AMD Ryzen 5 7600X | |
| AMD Ryzen 7 5800X | |
| AMD Ryzen 7 5800X3D | |
| AMD Ryzen 5 7600 | |
| AMD Ryzen 5 5600X | |
| Cinebench R20 | |
| CPU (Single Core) | |
| Intel Core i9-13900K | |
| AMD Ryzen 9 7950X3D | |
| AMD Ryzen 9 7900X | |
| AMD Ryzen 9 7950X | |
| AMD Ryzen 9 7950X ECO 65 W | |
| AMD Ryzen 9 7950X ECO 105 W | |
| Intel Core i5-13600K | |
| AMD Ryzen 7 7700X ECO 65 W | |
| AMD Ryzen 7 7700X | |
| Intel Core i9-12900K | |
| AMD Ryzen 5 7600X | |
| AMD Ryzen 7 7700 | |
| Intel Core i5-12600K | |
| AMD Ryzen 5 7600 | |
| AMD Ryzen 9 5950X | |
| AMD Ryzen 9 5900X | |
| AMD Ryzen 7 5800X | |
| AMD Ryzen 5 5600X | |
| AMD Ryzen 7 5800X3D | |
| CPU (Multi Core) | |
| Intel Core i9-13900K | |
| AMD Ryzen 9 7950X | |
| AMD Ryzen 9 7950X3D | |
| AMD Ryzen 9 7950X ECO 105 W | |
| AMD Ryzen 9 7950X ECO 65 W | |
| AMD Ryzen 9 7900X | |
| AMD Ryzen 9 5950X | |
| Intel Core i9-12900K | |
| Intel Core i5-13600K | |
| AMD Ryzen 9 5900X | |
| AMD Ryzen 7 7700X | |
| AMD Ryzen 7 7700X ECO 65 W | |
| AMD Ryzen 7 7700 | |
| Intel Core i5-12600K | |
| AMD Ryzen 7 5800X | |
| AMD Ryzen 5 7600X | |
| AMD Ryzen 5 7600 | |
| AMD Ryzen 7 5800X3D | |
| AMD Ryzen 5 5600X | |
| Cinebench R15 | |
| CPU Single 64Bit | |
| Intel Core i9-13900K | |
| AMD Ryzen 9 7950X3D | |
| AMD Ryzen 9 7900X | |
| AMD Ryzen 9 7950X | |
| AMD Ryzen 9 7950X ECO 105 W | |
| AMD Ryzen 7 7700X ECO 65 W | |
| AMD Ryzen 5 7600X | |
| AMD Ryzen 9 7950X ECO 65 W | |
| AMD Ryzen 7 7700X | |
| AMD Ryzen 7 7700 | |
| AMD Ryzen 5 7600 | |
| Intel Core i5-13600K | |
| Intel Core i9-12900K | |
| Intel Core i5-12600K | |
| AMD Ryzen 9 5950X | |
| AMD Ryzen 9 5900X | |
| AMD Ryzen 7 5800X | |
| AMD Ryzen 5 5600X | |
| AMD Ryzen 7 5800X3D | |
| CPU Multi 64Bit | |
| AMD Ryzen 9 7950X | |
| Intel Core i9-13900K | |
| AMD Ryzen 9 7950X3D | |
| AMD Ryzen 9 7950X ECO 105 W | |
| AMD Ryzen 9 7900X | |
| AMD Ryzen 9 7950X ECO 65 W | |
| AMD Ryzen 9 5950X | |
| Intel Core i9-12900K | |
| AMD Ryzen 9 5900X | |
| Intel Core i5-13600K | |
| AMD Ryzen 7 7700X | |
| AMD Ryzen 7 7700 | |
| AMD Ryzen 7 7700X ECO 65 W | |
| AMD Ryzen 7 5800X | |
| Intel Core i5-12600K | |
| AMD Ryzen 5 7600X | |
| AMD Ryzen 7 5800X3D | |
| AMD Ryzen 5 7600 | |
| AMD Ryzen 5 5600X | |
| Blender - v2.79 BMW27 CPU | |
| AMD Ryzen 5 5600X | |
| AMD Ryzen 5 7600 | |
| AMD Ryzen 7 5800X3D | |
| AMD Ryzen 5 7600X | |
| AMD Ryzen 7 5800X | |
| Intel Core i5-12600K | |
| AMD Ryzen 7 7700X ECO 65 W | |
| AMD Ryzen 7 7700 | |
| AMD Ryzen 7 7700X | |
| AMD Ryzen 9 5900X | |
| Intel Core i5-13600K | |
| Intel Core i9-12900K | |
| AMD Ryzen 9 5950X | |
| AMD Ryzen 9 7900X | |
| AMD Ryzen 9 7950X ECO 65 W | |
| AMD Ryzen 9 7950X ECO 105 W | |
| AMD Ryzen 9 7950X3D | |
| AMD Ryzen 9 7950X | |
| Intel Core i9-13900K | |
| Geekbench 5.5 | |
| Single-Core | |
| AMD Ryzen 9 7950X3D | |
| Intel Core i9-13900K | |
| AMD Ryzen 9 7900X | |
| AMD Ryzen 9 7950X ECO 65 W | |
| AMD Ryzen 9 7950X ECO 105 W | |
| AMD Ryzen 9 7950X | |
| AMD Ryzen 7 7700X | |
| AMD Ryzen 7 7700X ECO 65 W | |
| AMD Ryzen 5 7600X | |
| AMD Ryzen 7 7700 | |
| AMD Ryzen 5 7600 | |
| Intel Core i9-12900K | |
| Intel Core i5-13600K | |
| Intel Core i5-12600K | |
| AMD Ryzen 9 5950X | |
| AMD Ryzen 9 5900X | |
| AMD Ryzen 7 5800X | |
| AMD Ryzen 5 5600X | |
| AMD Ryzen 7 5800X3D | |
| Multi-Core | |
| AMD Ryzen 9 7950X3D | |
| Intel Core i9-13900K | |
| AMD Ryzen 9 7950X | |
| AMD Ryzen 9 7950X ECO 105 W | |
| AMD Ryzen 9 7950X ECO 65 W | |
| AMD Ryzen 9 7900X | |
| Intel Core i9-12900K | |
| AMD Ryzen 9 5950X | |
| Intel Core i5-13600K | |
| AMD Ryzen 7 7700X | |
| AMD Ryzen 7 7700 | |
| AMD Ryzen 7 7700X ECO 65 W | |
| AMD Ryzen 9 5900X | |
| Intel Core i5-12600K | |
| AMD Ryzen 5 7600X | |
| AMD Ryzen 7 5800X | |
| AMD Ryzen 5 7600 | |
| AMD Ryzen 7 5800X3D | |
| AMD Ryzen 5 5600X | |
| HWBOT x265 Benchmark v2.2 - 4k Preset | |
| AMD Ryzen 9 7950X | |
| Intel Core i9-13900K | |
| AMD Ryzen 9 7950X3D | |
| AMD Ryzen 9 7950X ECO 105 W | |
| AMD Ryzen 9 7900X | |
| AMD Ryzen 9 7950X ECO 65 W | |
| AMD Ryzen 9 5950X | |
| Intel Core i5-12600K | |
| Intel Core i9-12900K | |
| Intel Core i5-13600K | |
| AMD Ryzen 7 7700X | |
| AMD Ryzen 9 5900X | |
| AMD Ryzen 7 7700 | |
| AMD Ryzen 7 7700X ECO 65 W | |
| AMD Ryzen 5 7600X | |
| AMD Ryzen 7 5800X | |
| AMD Ryzen 5 7600 | |
| AMD Ryzen 7 5800X3D | |
| AMD Ryzen 5 5600X | |
| R Benchmark 2.5 - Overall mean | |
| AMD Ryzen 7 5800X3D | |
| AMD Ryzen 5 5600X | |
| AMD Ryzen 9 5950X | |
| AMD Ryzen 9 5900X | |
| AMD Ryzen 7 5800X | |
| Intel Core i5-12600K | |
| Intel Core i9-12900K | |
| Intel Core i5-13600K | |
| AMD Ryzen 5 7600 | |
| AMD Ryzen 7 7700 | |
| AMD Ryzen 7 7700X ECO 65 W | |
| AMD Ryzen 9 7950X | |
| AMD Ryzen 9 7950X ECO 65 W | |
| AMD Ryzen 9 7950X ECO 105 W | |
| AMD Ryzen 7 7700X | |
| AMD Ryzen 5 7600X | |
| AMD Ryzen 9 7900X | |
| AMD Ryzen 9 7950X3D | |
| Intel Core i9-13900K | |
| LibreOffice - 20 Documents To PDF | |
| Intel Core i5-12600K | |
| AMD Ryzen 7 5800X3D | |
| AMD Ryzen 9 5900X | |
| AMD Ryzen 9 5950X | |
| AMD Ryzen 5 5600X | |
| AMD Ryzen 7 5800X | |
| Intel Core i9-12900K | |
| AMD Ryzen 7 7700 | |
| AMD Ryzen 9 7950X3D | |
| AMD Ryzen 5 7600 | |
| AMD Ryzen 5 7600X | |
| Intel Core i9-13900K | |
| AMD Ryzen 9 7950X | |
| Intel Core i5-13600K | |
| AMD Ryzen 9 7900X | |
| AMD Ryzen 7 7700X ECO 65 W | |
| AMD Ryzen 7 7700X | |
| AMD Ryzen 9 7950X ECO 65 W | |
| AMD Ryzen 9 7950X ECO 105 W | |
* ... Meglio usare valori piccoli
Cinebench R15 Multi Loop
AMD fornisce i raffreddatori Wraith nella confezione dei processori Ryzen 7000 da 65 W. La nostra unità Ryzen 5 7600 è stata fornita con un radiatore a basso profilo Wraith Stealth. Il Wraith Stealth è in grado di svolgere il suo compito se si utilizza la CPU solo per attività di base e multimediali.
Raccomandiamo l'uso di un dissipatore AIO capace se si desidera utilizzare la CPU per flussi di lavoro impegnativi.
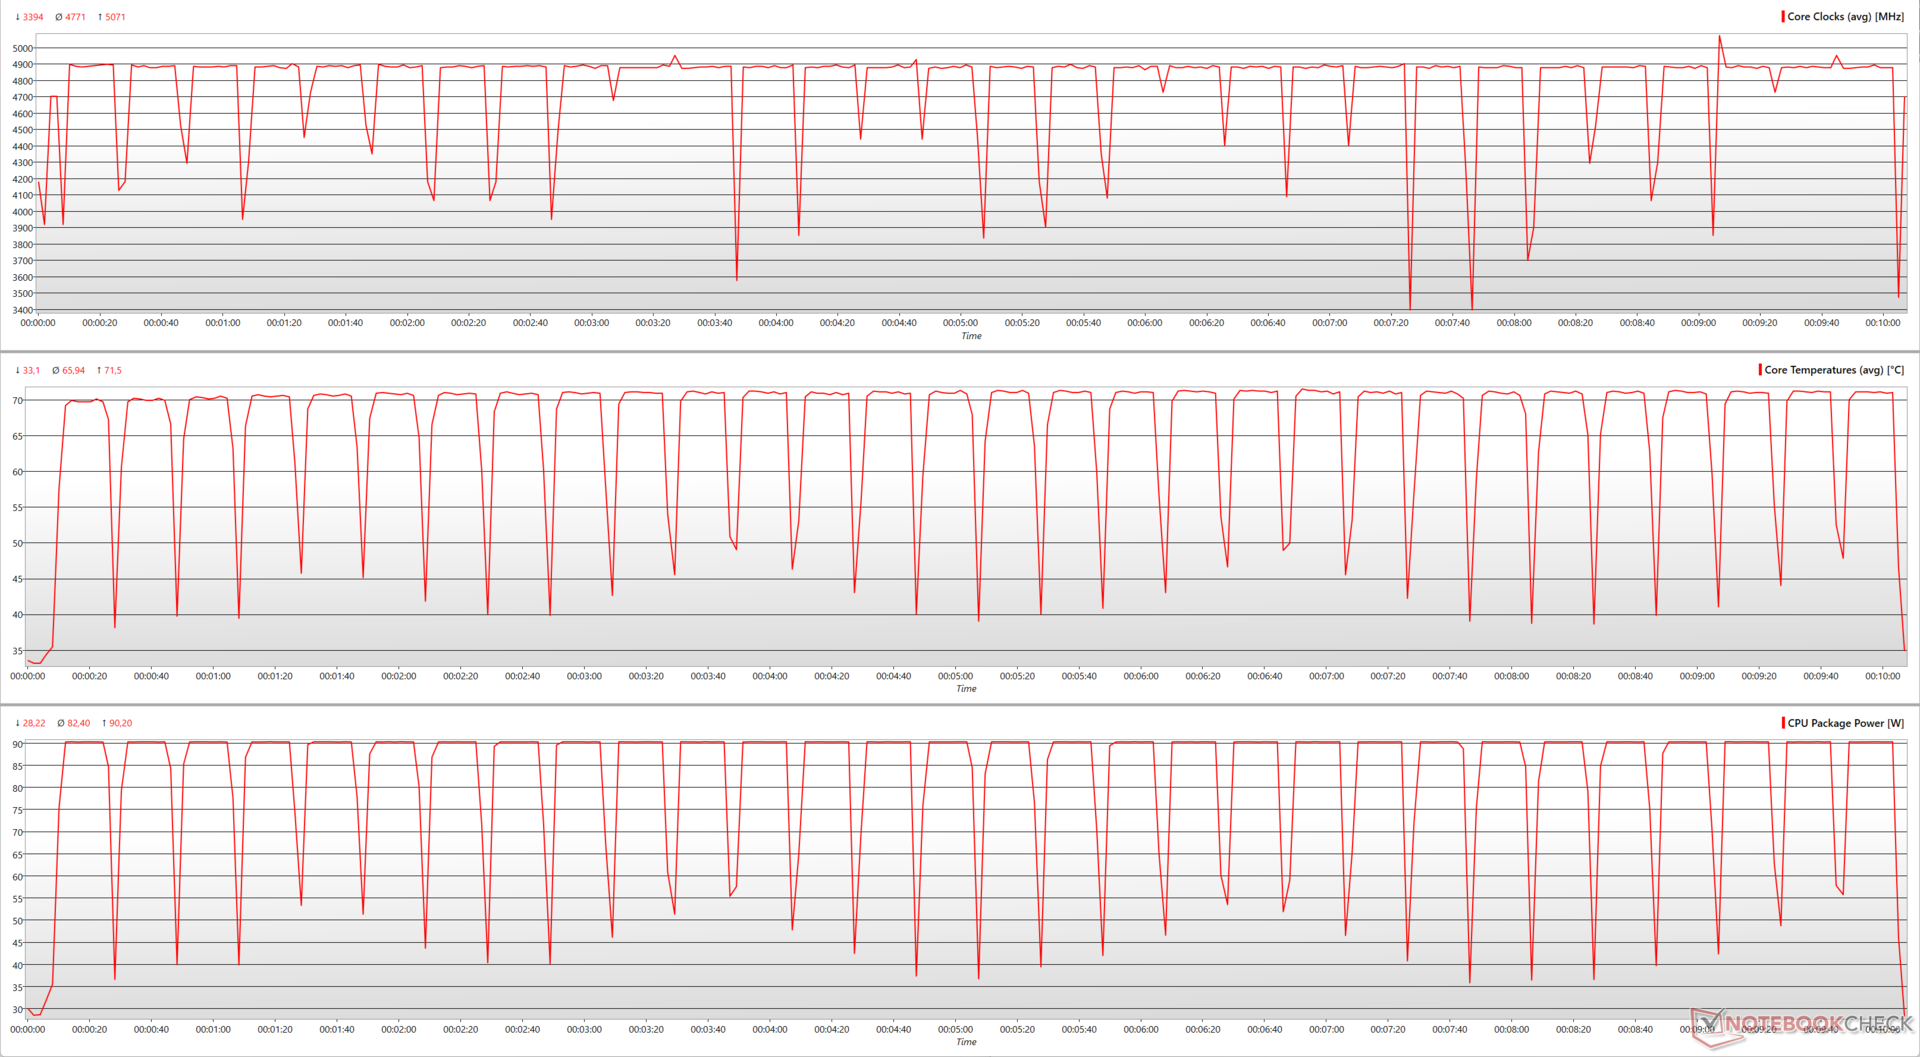
Il Ryzen 5 7600 ha mostrato eccellenti prestazioni sostenute senza alcun throttling nel nostro test Cinebench R15 multi-core loop quando è stato utilizzato insieme al raffreddatore AIO Cooler Master MasterLiquid ML360L V2 ARGB.
Il Ryzen 5 7600 può momentaneamente raggiungere un picco di 5,07 GHz durante questo test, che è vicino al suo boost clock nominale di 5,1 GHz. Tuttavia, la velocità media di clock del core durante l'esecuzione è di circa 4,8 GHz.
La potenza del package raggiunge costantemente i 90,2 W per tutta la durata di ogni ciclo, con temperature del core che toccano i 71,5 °C. La TjMax di 95 °C non viene raggiunta durante l'esecuzione, ma c'è abbastanza spazio termico perché Precision Boost 2 faccia la sua magia.
Prestazioni del sistema: Nessun problema di rilievo con il Ryzen 5 7600
Il Ryzen 5 7600 è in grado di superare il Ryzen 9 5900X in 3DMark 11 Physics, anche se 3DMark Time Spy Physics si rivela un compito un po' in salita per questo chip.
In AIDA64, il Ryzen 5 7600 è in grado di battere il suo cugino della serie X e altri chip Zen 3 e Alder Lake in diversi benchmark della CPU.
Per qualche motivo, CrossMark non ha funzionato bene sul nostro sistema di test. Tuttavia, le prestazioni generali del sistema e la reattività non sono un problema con il Ryzen 5 7600.
| Performance rating - Percent | |
| Intel Core i9-12900K -1! | |
| Intel Core i5-12600K -1! | |
| AMD Ryzen 9 7950X3D | |
| AMD Ryzen 9 7900X | |
| Intel Core i9-13900K | |
| AMD Ryzen 9 7950X | |
| AMD Ryzen 9 7950X | |
| AMD Ryzen 9 7950X | |
| Intel Core i5-13600K | |
| AMD Ryzen 5 7600X | |
| AMD Ryzen 9 5900X | |
| AMD Ryzen 7 7700 | |
| AMD Ryzen 7 7700X | |
| AMD Ryzen 7 7700X | |
| AMD Ryzen 5 7600 | |
| AMD Ryzen 9 5950X | |
| AMD Ryzen 7 5800X | |
| AMD Ryzen 5 5600X | |
| AMD Ryzen 7 5800X3D | |
* ... Meglio usare valori piccoli
prestazioni 3D e di gioco: CPU di gioco altamente capace
Tutti i processori Zen 4 si sono rivelati eccellenti per il gioco e il Ryzen 5 7600 non è da meno.
Prendendo in considerazione 3DMark 11 e 3DMark Time Spy, vediamo che il Ryzen 5 7600 è alla pari con il Core i9-13900K, più affamato di energia e più costoso, mentre è alle calcagna del Ryzen 9 7950X3D. In questo confronto, il Ryzen 5 7600X sembra offrire le prestazioni più elevate.
Nel gioco, tuttavia, il Core i9-13900K ottiene un vantaggio percepibile rispetto al Ryzen 5 da 65 W. Il Ryzen 9 7950X3D beneficia della V-cache 3D che gli consente di aumentare i fotogrammi a qualità e risoluzione molto basse.
Tuttavia, se siete alla ricerca di una CPU da gioco per una struttura di fascia media, non potete sbagliare con il Ryzen 5 7600.
| 3DMark Performance rating - Percent | |
| AMD Ryzen 5 7600X | |
| AMD Ryzen 9 7950X | |
| AMD Ryzen 9 7950X3D | |
| AMD Ryzen 5 7600 | |
| Intel Core i9-13900K | |
| 3DMark - 2560x1440 Time Spy Graphics | |
| AMD Ryzen 5 7600X | |
| AMD Ryzen 9 7950X | |
| AMD Ryzen 9 7950X3D | |
| AMD Ryzen 5 7600 | |
| Intel Core i9-13900K | |
| 3DMark 11 - 1280x720 Performance GPU | |
| AMD Ryzen 5 7600X | |
| AMD Ryzen 9 7950X | |
| AMD Ryzen 9 7950X3D | |
| AMD Ryzen 5 7600 | |
| Intel Core i9-13900K | |
| Gaming Performance rating - Percent | |
| AMD Ryzen 9 7950X3D | |
| AMD Ryzen 9 7950X | |
| Intel Core i9-13900K -2! | |
| AMD Ryzen 5 7600X -2! | |
| Media della classe Desktop -2! | |
| AMD Ryzen 5 7600 | |
| Cyberpunk 2077 1.6 | |
| 1920x1080 Ultra Preset | |
| AMD Ryzen 9 7950X3D | |
| Intel Core i9-13900K | |
| AMD Ryzen 9 7950X | |
| AMD Ryzen 5 7600 | |
| 1920x1080 Low Preset | |
| AMD Ryzen 9 7950X3D | |
| Intel Core i9-13900K | |
| AMD Ryzen 9 7950X | |
| AMD Ryzen 5 7600 | |
| F1 22 | |
| 1920x1080 Ultra High Preset AA:T AF:16x | |
| AMD Ryzen 5 7600X | |
| AMD Ryzen 9 7950X3D | |
| Intel Core i9-13900K | |
| AMD Ryzen 9 7950X | |
| Media della classe Desktop (100.2 - 219, n=14, ultimi 2 anni) | |
| AMD Ryzen 5 7600 | |
| 1920x1080 Low Preset AA:T AF:16x | |
| AMD Ryzen 9 7950X3D | |
| AMD Ryzen 9 7950X | |
| AMD Ryzen 5 7600X | |
| Media della classe Desktop (292 - 498, n=12, ultimi 2 anni) | |
| Intel Core i9-13900K | |
| AMD Ryzen 5 7600 | |
| F1 2021 - 1920x1080 Ultra High Preset + Raytracing AA:T AF:16x | |
| Intel Core i9-13900K | |
| AMD Ryzen 5 7600X | |
| AMD Ryzen 9 7950X | |
| AMD Ryzen 9 7950X3D | |
| AMD Ryzen 5 7600 | |
| Media della classe Desktop (176.2 - 287, n=10, ultimi 2 anni) | |
| Metro Exodus | |
| 1920x1080 Ultra Quality AF:16x | |
| AMD Ryzen 9 7950X | |
| AMD Ryzen 5 7600X | |
| AMD Ryzen 9 7950X3D | |
| Intel Core i9-13900K | |
| Media della classe Desktop (6.41 - 226, n=14, ultimi 2 anni) | |
| AMD Ryzen 5 7600 | |
| 1280x720 Low Quality AF:4x | |
| AMD Ryzen 5 7600X | |
| Media della classe Desktop (25.1 - 458, n=12, ultimi 2 anni) | |
| AMD Ryzen 9 7950X | |
| AMD Ryzen 9 7950X3D | |
| AMD Ryzen 5 7600 | |
| Intel Core i9-13900K | |
| The Witcher 3 | |
| 1920x1080 Ultra Graphics & Postprocessing (HBAO+) | |
| AMD Ryzen 9 7950X | |
| AMD Ryzen 5 7600X | |
| AMD Ryzen 9 7950X3D | |
| Intel Core i9-13900K | |
| AMD Ryzen 5 7600 | |
| Media della classe Desktop (7.8 - 369, n=48, ultimi 2 anni) | |
| 1024x768 Low Graphics & Postprocessing | |
| AMD Ryzen 9 7950X3D | |
| AMD Ryzen 9 7950X | |
| Intel Core i9-13900K | |
| AMD Ryzen 5 7600X | |
| AMD Ryzen 5 7600 | |
| Media della classe Desktop (39.3 - 841, n=30, ultimi 2 anni) | |
| Far Cry 5 | |
| 1920x1080 Ultra Preset AA:T | |
| AMD Ryzen 9 7950X3D | |
| Media della classe Desktop (11 - 314, n=24, ultimi 2 anni) | |
| Intel Core i9-13900K | |
| AMD Ryzen 9 7950X | |
| AMD Ryzen 5 7600X | |
| AMD Ryzen 5 7600 | |
| 1280x720 Low Preset AA:T | |
| AMD Ryzen 9 7950X3D | |
| Media della classe Desktop (25 - 402, n=23, ultimi 2 anni) | |
| AMD Ryzen 5 7600X | |
| Intel Core i9-13900K | |
| AMD Ryzen 9 7950X | |
| AMD Ryzen 5 7600 | |
| GTA V | |
| 1920x1080 Highest AA:4xMSAA + FX AF:16x | |
| Intel Core i9-13900K | |
| AMD Ryzen 9 7950X | |
| AMD Ryzen 9 7950X3D | |
| AMD Ryzen 5 7600X | |
| AMD Ryzen 5 7600 | |
| Media della classe Desktop (9.61 - 172.5, n=13, ultimi 2 anni) | |
| 1920x1080 Lowest Settings possible | |
| AMD Ryzen 9 7950X3D | |
| Intel Core i9-13900K | |
| AMD Ryzen 9 7950X | |
| AMD Ryzen 5 7600X | |
| AMD Ryzen 5 7600 | |
| Media della classe Desktop (61.3 - 188.2, n=13, ultimi 2 anni) | |
| X-Plane 11.11 | |
| 1920x1080 high (fps_test=3) | |
| AMD Ryzen 9 7950X3D | |
| Intel Core i9-13900K | |
| AMD Ryzen 9 7950X | |
| AMD Ryzen 5 7600X | |
| Media della classe Desktop (19.5 - 202, n=50, ultimi 2 anni) | |
| AMD Ryzen 5 7600 | |
| 1280x720 low (fps_test=1) | |
| Intel Core i9-13900K | |
| AMD Ryzen 9 7950X3D | |
| AMD Ryzen 9 7950X | |
| AMD Ryzen 5 7600X | |
| AMD Ryzen 5 7600 | |
| Media della classe Desktop (37.1 - 256, n=35, ultimi 2 anni) | |
| Dota 2 Reborn | |
| 1920x1080 ultra (3/3) best looking | |
| AMD Ryzen 9 7950X3D | |
| Intel Core i9-13900K | |
| AMD Ryzen 9 7950X | |
| Media della classe Desktop (31.3 - 309, n=33, ultimi 2 anni) | |
| AMD Ryzen 5 7600X | |
| AMD Ryzen 5 7600 | |
| 1280x720 min (0/3) fastest | |
| AMD Ryzen 9 7950X3D | |
| AMD Ryzen 9 7950X | |
| Media della classe Desktop (148.7 - 399, n=31, ultimi 2 anni) | |
| Intel Core i9-13900K | |
| AMD Ryzen 5 7600X | |
| AMD Ryzen 5 7600 | |
| Strange Brigade | |
| 1920x1080 ultra AA:ultra AF:16 | |
| AMD Ryzen 5 7600X | |
| AMD Ryzen 5 7600 | |
| AMD Ryzen 9 7950X | |
| AMD Ryzen 9 7950X3D | |
| Media della classe Desktop (12 - 616, n=17, ultimi 2 anni) | |
| 1280x720 lowest AF:1 | |
| AMD Ryzen 5 7600X | |
| AMD Ryzen 5 7600 | |
| AMD Ryzen 9 7950X | |
| AMD Ryzen 9 7950X3D | |
| Media della classe Desktop (20.9 - 786, n=17, ultimi 2 anni) | |
AMD Ryzen 5 7600 with Nvidia GeForce RTX 4090
| basso | medio | alto | ultra | QHD | 4K | |
|---|---|---|---|---|---|---|
| GTA V (2015) | 187.6 | 187.5 | 185 | 145 | 147.7 | |
| The Witcher 3 (2015) | 645 | 574 | 547 | 276 | 275 | |
| Dota 2 Reborn (2015) | 257 | 228 | 218 | 203 | 202 | |
| Final Fantasy XV Benchmark (2018) | 237 | 237 | 237 | 237 | 145.9 | |
| X-Plane 11.11 (2018) | 212 | 182.4 | 139.4 | 117.3 | ||
| Far Cry 5 (2018) | 207 | 187 | 182 | 175 | 170 | 158 |
| Strange Brigade (2018) | 736 | 600 | 580 | 569 | 509 | 279 |
| Metro Exodus (2019) | 284 | 243 | 221 | 184.3 | 173.6 | 133.6 |
| F1 2021 (2021) | 640 | 603 | 502 | 254 | 249 | 199.1 |
| Cyberpunk 2077 1.6 (2022) | 204 | 203 | 192.2 | 190.3 | 147.4 | 78.9 |
| F1 22 (2022) | 353 | 374 | 342 | 175.9 | 150 | 80.9 |
Gestione dell'energia: Maggiore efficienza energetica rispetto a Ryzen 7000 X-series
Analogamente a quanto visto in precedenza con il Ryzen 7 7700, il Ryzen 5 7600 continua a offrire prestazioni più elevate per Watt in Cinebench R15 multi-core rispetto alla serie Ryzen 7000 X, con un'efficienza superiore del 49% rispetto al Ryzen 5 7600X. Detto questo, un Ryzen 9 7950X con un consumo massimo di 65 W offre la massima efficienza energetica rispetto alla concorrenza.
Il PC Ryzen 5 7600 consuma la minor quantità di energia dalla parete in confronto all'esecuzione di FFT di grandi dimensioni Prime95 in-place, utilizzando solo 134,5 W.
Il Ryzen 5 7600 è più efficiente dell'11% rispetto al Ryzen 9 7950X3D in
Witcher 3 quando viene utilizzato in combinazione con una RTX 4090, ma è inferiore del 21% nell'efficienza energetica multi-core di Cinebench R15.
Come indicato in precedenza, stiamo passando alla RTX 4090 come GPU preferita. I test precedenti sono stati eseguiti principalmente con una RTX 3090 o una Titan RTX, ma vediamo ancora la combinazione Ryzen 5 7600 e RTX 4090 in testa alle classifiche di efficienza in
a 1080p Ultra.
Power Consumption: External monitor
| Power Consumption / Cinebench R15 Multi Efficiency (external Monitor) | |
| AMD Ryzen 9 7950X ECO 65 W, NVIDIA GeForce RTX 3090 | |
| Media della classe Desktop (13.7 - 41.2, n=14, ultimi 2 anni) | |
| AMD Ryzen 9 7950X ECO 105 W, NVIDIA GeForce RTX 3090 | |
| AMD Ryzen 9 7950X3D, NVIDIA GeForce RTX 4090 | |
| AMD Ryzen 7 7700, NVIDIA GeForce RTX 3090 | |
| AMD Ryzen 9 5950X, NVIDIA Titan RTX | |
| AMD Ryzen 5 7600, NVIDIA GeForce RTX 4090 | |
| AMD Ryzen 9 7950X, NVIDIA GeForce RTX 3090 | |
| Media NVIDIA GeForce RTX 4090 (10.4 - 21.9, n=22) | |
| AMD Ryzen 9 5900X, NVIDIA Titan RTX | |
| AMD Ryzen 9 7900X, NVIDIA GeForce RTX 3090 | |
| AMD Ryzen 7 7700X ECO 65 W, NVIDIA GeForce RTX 3090 | |
| AMD Ryzen 7 7700X, NVIDIA GeForce RTX 3090 | |
| Intel Core i9-13900K, NVIDIA GeForce RTX 3090 | |
| Intel Core i5-13600K, NVIDIA GeForce RTX 3090 | |
| Intel Core i9-12900K, NVIDIA Titan RTX | |
| Intel Core i5-12600K, NVIDIA Titan RTX | |
| AMD Ryzen 7 5800X, NVIDIA Titan RTX | |
| AMD Ryzen 5 7600X, NVIDIA GeForce RTX 3090 | |
| AMD Ryzen 5 5600X, NVIDIA Titan RTX | |
| AMD Ryzen 7 5800X3D, NVIDIA GeForce RTX 3090 Ti | |
| Power Consumption / Witcher 3 ultra Efficiency (external Monitor) | |
| AMD Ryzen 5 7600, NVIDIA GeForce RTX 4090 | |
| Media NVIDIA GeForce RTX 4090 (0.518 - 0.712, n=37) | |
| AMD Ryzen 9 7950X3D, NVIDIA GeForce RTX 4090 | |
| Media della classe Desktop (0.113 - 0.653, n=44, ultimi 2 anni) | |
| AMD Ryzen 7 7700, NVIDIA GeForce RTX 3090 | |
| Intel Core i5-13600K, NVIDIA GeForce RTX 3090 | |
| AMD Ryzen 5 7600X, NVIDIA GeForce RTX 3090 | |
| Intel Core i5-12600K, NVIDIA Titan RTX | |
| AMD Ryzen 7 5800X3D, NVIDIA GeForce RTX 3090 Ti | |
| AMD Ryzen 5 5600X, NVIDIA Titan RTX | |
| AMD Ryzen 9 7900X, NVIDIA GeForce RTX 3090 | |
| Intel Core i9-13900K, NVIDIA GeForce RTX 3090 | |
| AMD Ryzen 7 7700X, NVIDIA GeForce RTX 3090 | |
| AMD Ryzen 7 5800X, NVIDIA Titan RTX | |
| AMD Ryzen 9 7950X ECO 105 W, NVIDIA GeForce RTX 3090 | |
| AMD Ryzen 9 7950X ECO 65 W, NVIDIA GeForce RTX 3090 | |
| AMD Ryzen 9 7950X, NVIDIA GeForce RTX 3090 | |
| AMD Ryzen 7 7700X ECO 65 W, NVIDIA GeForce RTX 3090 | |
| AMD Ryzen 9 5900X, NVIDIA Titan RTX | |
| AMD Ryzen 9 5950X, NVIDIA Titan RTX | |
| Intel Core i9-12900K, NVIDIA Titan RTX | |
* ... Meglio usare valori piccoli
Pro
Contro
Verdetto: Una scelta intelligente per le build di gioco di fascia media

Sebbene i processori Ryzen 7000 non-X da 65 W possano sembrare superflui a prima vista, queste CPU offrono un'opzione valida per chi cerca di realizzare progetti economici senza percepire penalizzazioni nelle prestazioni rispetto alla serie Ryzen 7000X.
AMD è riuscita a offrire un significativo aumento delle prestazioni con il Ryzen 5 7600, battendo la maggior parte delle CPU Zen 3 e persino un colosso del calibro di un Intel Core i9-12900K in single-core, il tutto a un TDP molto economico di 65 W che può arrivare a 90 W sotto carico. Ciò si riflette anche negli eccellenti valori di efficienza energetica del processore.
Il processore Intel Raptor Lake Core i5-13600K è ancora in vantaggio per quanto riguarda le prestazioni complessive della CPU, ma il Ryzen 5 costa 100 dollari in meno rispetto ai prezzi attuali e si posiziona proprio alle calcagna del Core i5-13600K nei test single-core. Il chip Intel ha il vantaggio del numero di core/thread in multi-core, ma l'impatto effettivo di questo dipende dal vostro flusso di lavoro specifico.
L'AMD Ryzen 5 7600 ha tutte le carte in regola per essere una valida CPU per il gioco e la creazione di contenuti, a un prezzo che non fa saltare il banco, nonostante la spesa iniziale per la piattaforma Socket AM5"
Il gioco, in generale, è stato il punto forte di Zen 4 fin dall'inizio. Il Ryzen 5 7600 può essere appena il 9% più lento di un Ryzen 9 7950X o di un Core i9-13900K a impostazioni più basse, e questo divario può potenzialmente ridursi ulteriormente con impostazioni e risoluzioni di qualità superiore.
Il processore è dotato anche di una iGPU RDNA 2 nel die di I/O. Sebbene non sia in grado di fornire alcun impulso a qualcosa di più di un gioco di base e occasionale a 720p, funziona benissimo come acceleratore hardware per la codifica e la decodifica di contenuti multimediali. È utile anche nei momenti in cui le stelle non si allineano e la GPU discreta si arrende.
L'unica cosa che potrebbe frenare l'acquisto è il costo iniziale dell'adozione della piattaforma AM5 e della memoria DDR5. Se non vi dispiace ingoiare questa pillola e il vostro caso d'uso principale è il gioco, il Ryzen 5 7600 offre un ottimo rapporto qualità-prezzo e può mantenere la vostra scheda grafica moderna felicemente alimentata senza colli di bottiglia percepibili.
Prezzo e disponibilità
L'AMD Ryzen 5 7600 è attualmente disponibile a un prezzo scontato di 22.997 euro su Amazon India.
Negli Stati Uniti, questo processore da 65 W può essere acquistato a 220 dollari su Amazon US insieme a un bundle con il gioco Star Wars: Jedi Survivor. Il Ryzen 5 7600 è in vendita al prezzo MSRP di 229 dollari anche su Best Buy.
Transparency
La selezione dei dispositivi da recensire viene effettuata dalla nostra redazione. Il campione di prova è stato fornito all'autore come prestito dal produttore o dal rivenditore ai fini di questa recensione. L'istituto di credito non ha avuto alcuna influenza su questa recensione, né il produttore ne ha ricevuto una copia prima della pubblicazione. Non vi era alcun obbligo di pubblicare questa recensione. In quanto società mediatica indipendente, Notebookcheck non è soggetta all'autorità di produttori, rivenditori o editori.
Ecco come Notebookcheck esegue i test
Ogni anno, Notebookcheck esamina in modo indipendente centinaia di laptop e smartphone utilizzando procedure standardizzate per garantire che tutti i risultati siano comparabili. Da circa 20 anni sviluppiamo continuamente i nostri metodi di prova e nel frattempo stabiliamo gli standard di settore. Nei nostri laboratori di prova, tecnici ed editori esperti utilizzano apparecchiature di misurazione di alta qualità. Questi test comportano un processo di validazione in più fasi. Il nostro complesso sistema di valutazione si basa su centinaia di misurazioni e parametri di riferimento ben fondati, che mantengono l'obiettività.Price comparison

