Recensione breve del Portatile ASUS ZenBook 13 UX331UN (i7-8550, GeForce MX150, SSD, FHD)
| SD Card Reader | |
| average JPG Copy Test (av. of 3 runs) | |
| Dell XPS 13 9370 FHD i5 (Toshiba Exceria Pro M501 64 GB UHS-II) | |
| Apple MacBook Air 13.3" 1.8 GHz (2017) (Toshiba Exceria Pro SDXC 64 GB UHS-II) | |
| Media della classe Subnotebook (23.7 - 188, n=9, ultimi 2 anni) | |
| Asus ZenBook 13 UX331UN (Toshiba Exceria Pro M501) | |
| HP Envy 13-ad006ng (Toshiba Exceria Pro SDXC 64 GB UHS-II) | |
| Asus ZenBook 13 UX331UN (Toshiba Exceria Pro M501 microSDXC 64GB) | |
| maximum AS SSD Seq Read Test (1GB) | |
| Dell XPS 13 9370 FHD i5 (Toshiba Exceria Pro M501 64 GB UHS-II) | |
| Media della classe Subnotebook (24.9 - 195, n=8, ultimi 2 anni) | |
| Apple MacBook Air 13.3" 1.8 GHz (2017) (Toshiba Exceria Pro SDXC 64 GB UHS-II) | |
| Asus ZenBook 13 UX331UN (Toshiba Exceria Pro M501 microSDXC 64GB) | |
| Asus ZenBook 13 UX331UN (Toshiba Exceria Pro M501) | |
| HP Envy 13-ad006ng (Toshiba Exceria Pro SDXC 64 GB UHS-II) | |
| |||||||||||||||||||||||||
Distribuzione della luminosità: 86 %
Al centro con la batteria: 277 cd/m²
Contrasto: 1097:1 (Nero: 0.3 cd/m²)
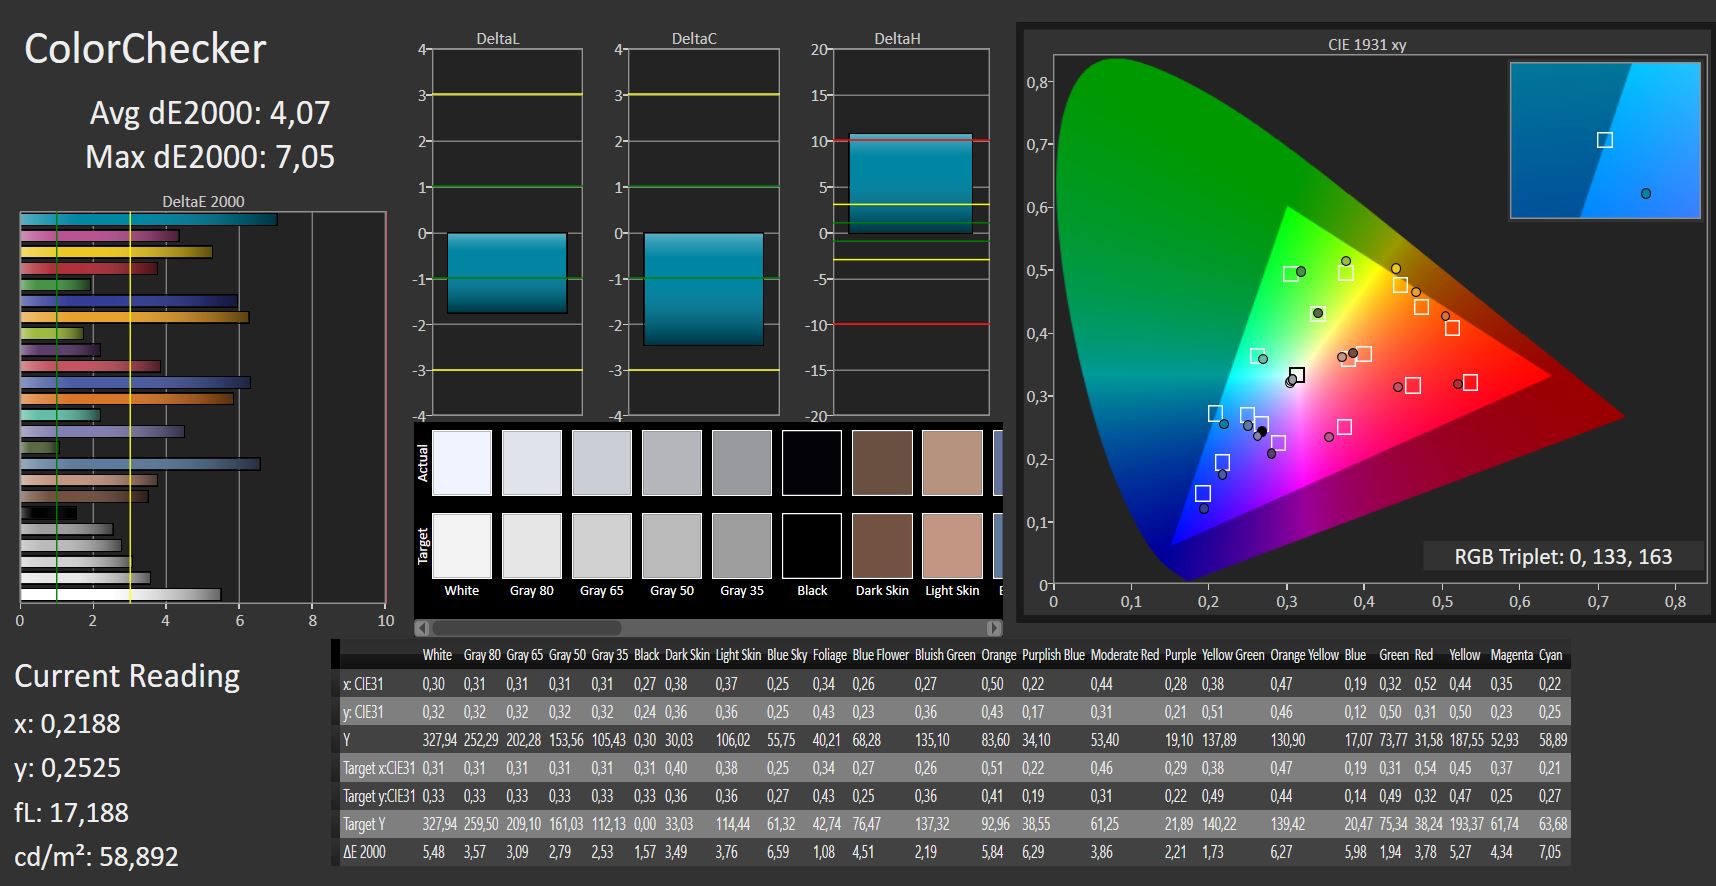
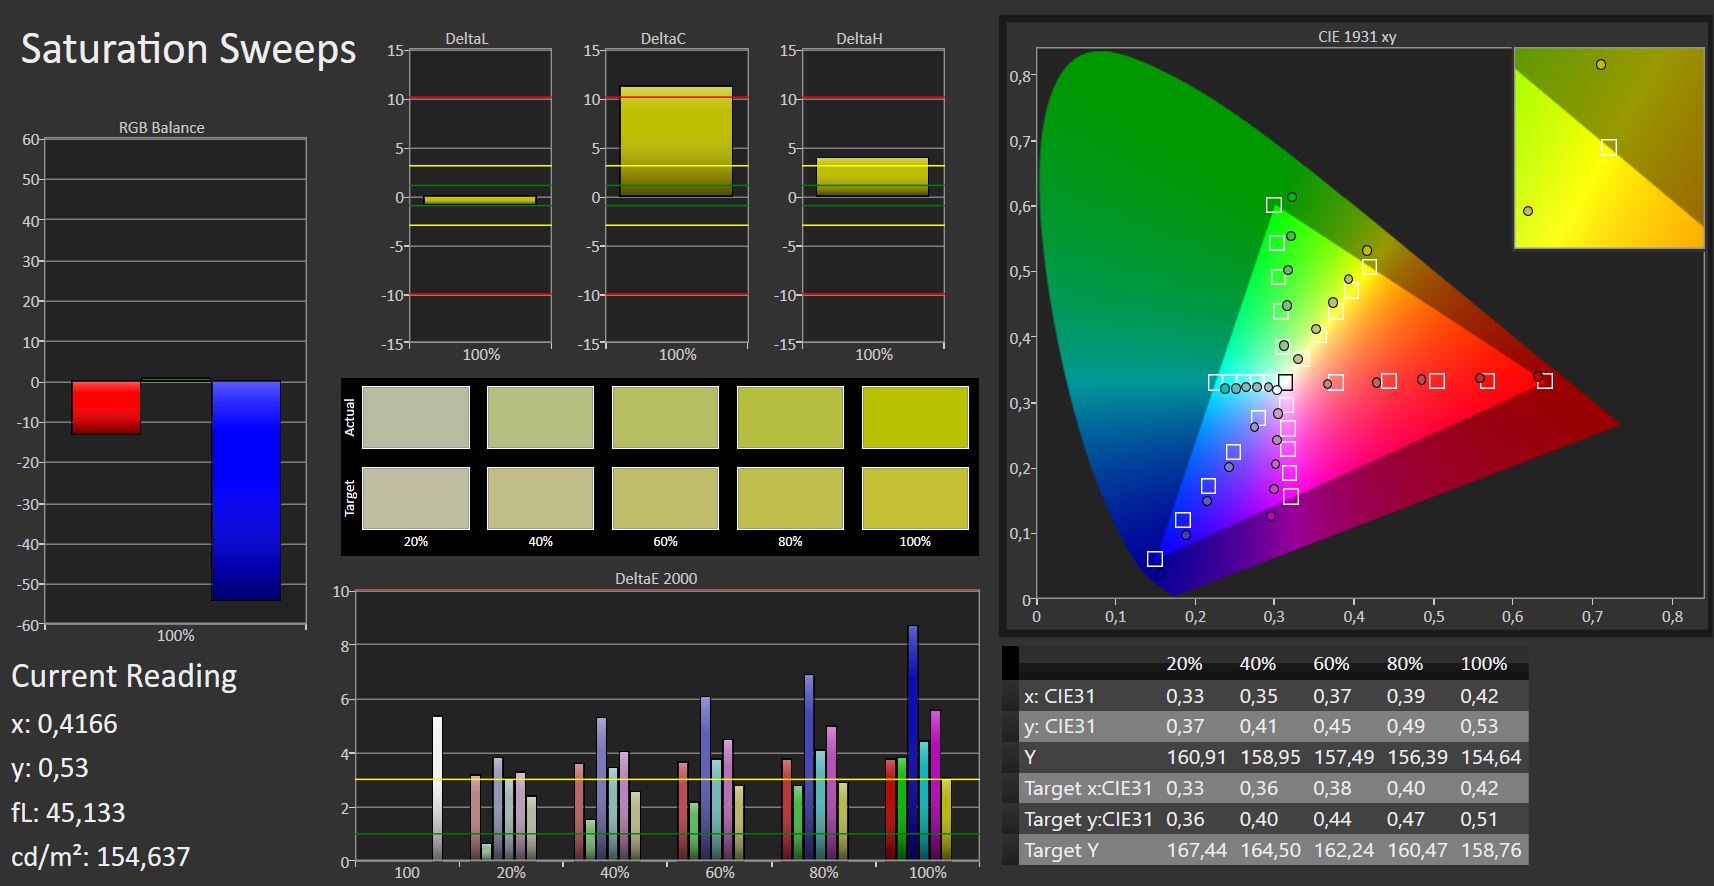
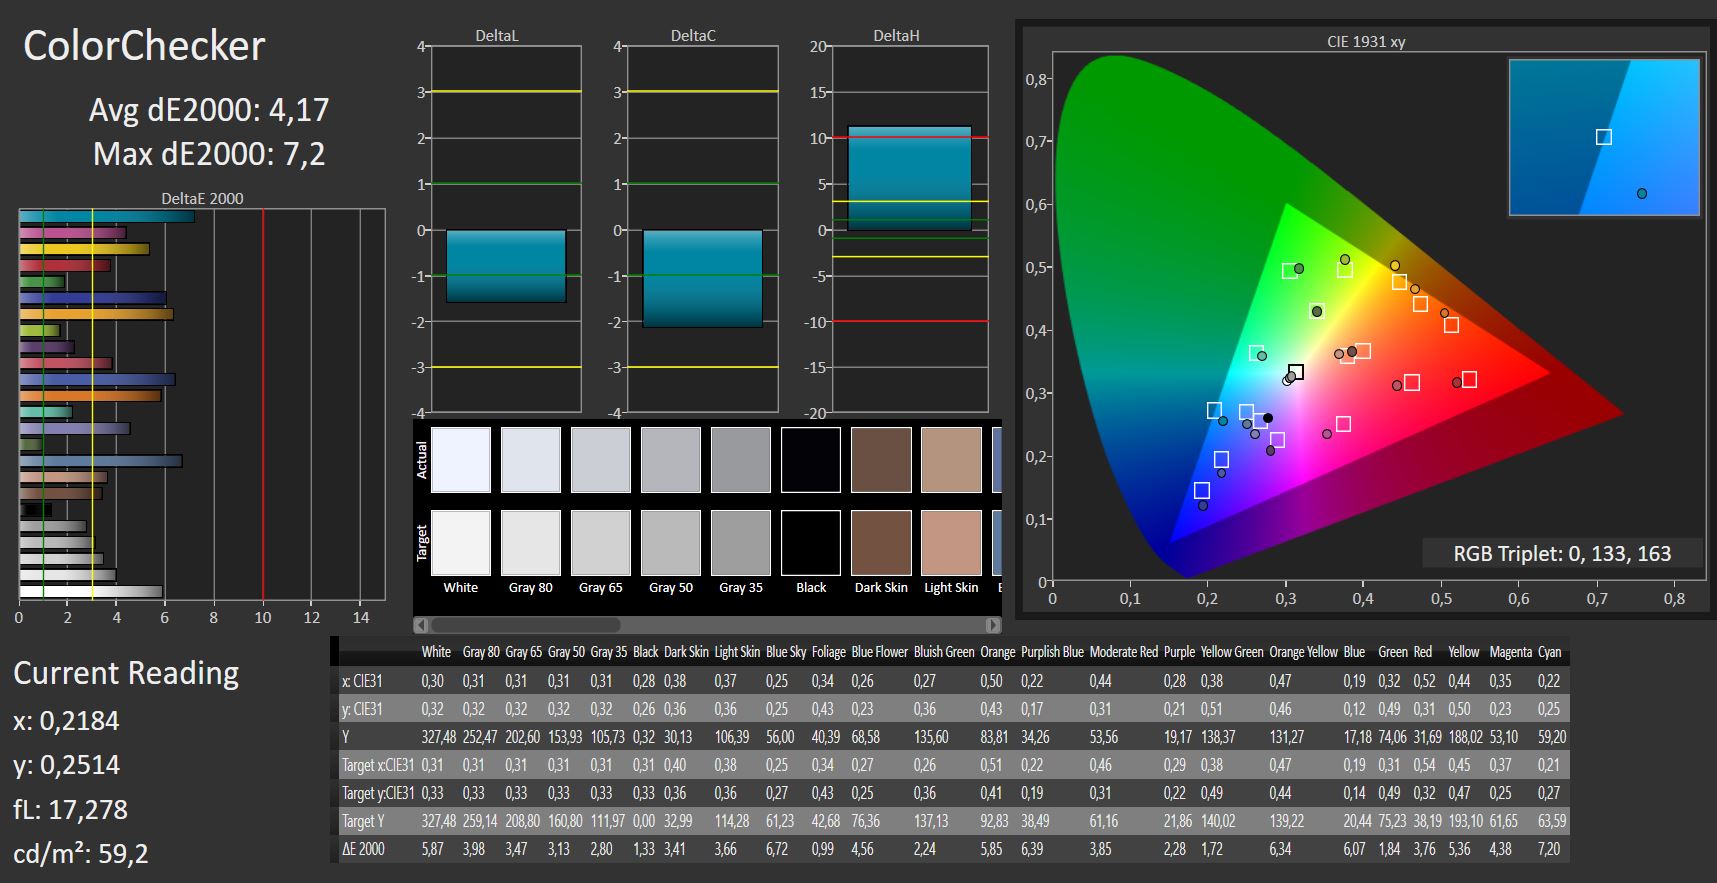
ΔE ColorChecker Calman: 4.07 | ∀{0.5-29.43 Ø4.71}
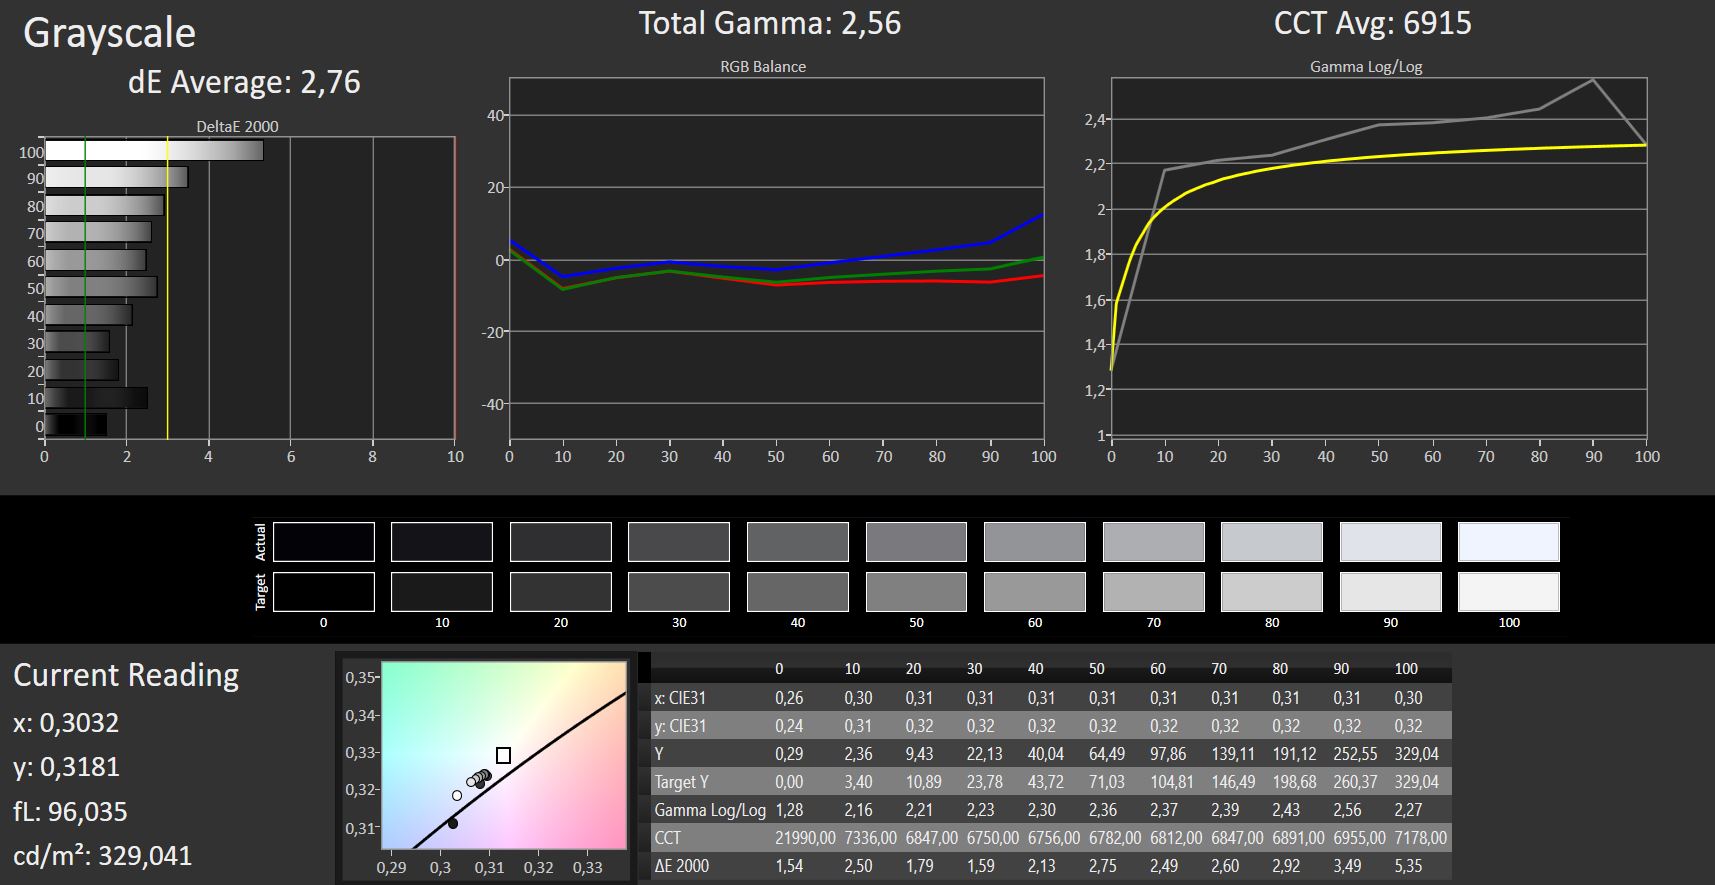
ΔE Greyscale Calman: 2.76 | ∀{0.09-98 Ø4.96}
86% sRGB (Argyll 1.6.3 3D)
56% AdobeRGB 1998 (Argyll 1.6.3 3D)
63.4% AdobeRGB 1998 (Argyll 3D)
86.7% sRGB (Argyll 3D)
63.3% Display P3 (Argyll 3D)
Gamma: 2.56
CCT: 6915 K
| Asus ZenBook 13 UX331UN IPS, 1920x1080, 13.3" | Asus ZenBook 13 UX331UN IPS LED, 1920x1080, 13.3" | Lenovo Ideapad 720S-13IKB IPS, 1920x1080, 13.3" | Dell XPS 13 9370 FHD i5 IPS, 1920x1080, 13.3" | HP Envy 13-ad006ng IPS LED, 1920x1080, 13.3" | Apple MacBook Air 13.3" 1.8 GHz (2017) TN LED, 1440x900, 13.3" | |
|---|---|---|---|---|---|---|
| Display | 5% | -3% | 10% | 2% | ||
| Display P3 Coverage (%) | 63.3 | 65.4 3% | 64.3 2% | 68.9 9% | 66.8 6% | |
| sRGB Coverage (%) | 86.7 | 93.1 7% | 82.3 -5% | 96.6 11% | 86.3 0% | |
| AdobeRGB 1998 Coverage (%) | 63.4 | 66.4 5% | 60.2 -5% | 69.6 10% | 63.1 0% | |
| Response Times | 10% | 8% | -66% | -21% | -19% | |
| Response Time Grey 50% / Grey 80% * (ms) | 44 ? | 22.4 ? 49% | 35 ? 20% | 62.4 ? -42% | 48 ? -9% | 52.4 ? -19% |
| Response Time Black / White * (ms) | 24 ? | 31.2 ? -30% | 25 ? -4% | 45.6 ? -90% | 32 ? -33% | 28.4 ? -18% |
| PWM Frequency (Hz) | 131000 ? | 1008 ? | 1000 ? | 58000 | ||
| Screen | -4% | -21% | 10% | -18% | ||
| Brightness middle (cd/m²) | 329 | 338 3% | 335 2% | 428 30% | 281 -15% | |
| Brightness (cd/m²) | 306 | 321 5% | 303 -1% | 405 32% | 264 -14% | |
| Brightness Distribution (%) | 86 | 90 5% | 85 -1% | 87 1% | 83 -3% | |
| Black Level * (cd/m²) | 0.3 | 0.35 -17% | 0.46 -53% | 0.26 13% | 0.23 23% | |
| Contrast (:1) | 1097 | 966 -12% | 728 -34% | 1646 50% | 1222 11% | |
| Colorchecker dE 2000 * | 4.07 | 4.2 -3% | 5.09 -25% | 3.8 7% | 4.83 -19% | |
| Colorchecker dE 2000 max. * | 7.05 | 6.5 8% | 11.92 -69% | 7.2 -2% | 8.89 -26% | |
| Greyscale dE 2000 * | 2.76 | 3.9 -41% | 3.23 -17% | 4.4 -59% | 6.63 -140% | |
| Gamma | 2.56 86% | 2.43 91% | 2.18 101% | 2.21 100% | 1.85 119% | |
| CCT | 6915 94% | 7144 91% | 6214 105% | 7067 92% | 6794 96% | |
| Color Space (Percent of AdobeRGB 1998) (%) | 56 | 60.4 8% | 54 -4% | 62.8 12% | 56 0% | |
| Color Space (Percent of sRGB) (%) | 86 | 93.1 8% | 82 -5% | 96.4 12% | 86 0% | |
| Media totale (Programma / Settaggio) | 4% /
-0% | -5% /
-13% | -15% /
-0% | -12% /
-15% | -19% /
-19% |
* ... Meglio usare valori piccoli
Sfarfallio dello schermo / PWM (Pulse-Width Modulation)
| flickering dello schermo / PWM non rilevato | ||
In confronto: 52 % di tutti i dispositivi testati non utilizza PWM per ridurre la luminosita' del display. Se è rilevato PWM, una media di 7754 (minimo: 5 - massimo: 343500) Hz è stata rilevata. | ||


Tempi di risposta del Display
| ↔ Tempi di risposta dal Nero al Bianco | ||
|---|---|---|
| 24 ms ... aumenta ↗ e diminuisce ↘ combinato | ↗ 13 ms Incremento | 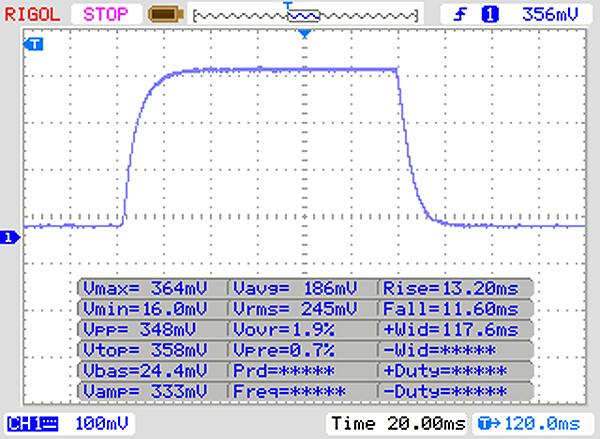 |
| ↘ 11 ms Calo | ||
| Lo schermo mostra buoni tempi di risposta durante i nostri tests, ma potrebbe essere troppo lento per i gamers competitivi. In confronto, tutti i dispositivi di test variano da 0.1 (minimo) a 240 (massimo) ms. » 54 % di tutti i dispositivi è migliore. Questo significa che i tempi di risposta rilevati sono peggiori rispetto alla media di tutti i dispositivi testati (19.8 ms). | ||
| ↔ Tempo di risposta dal 50% Grigio all'80% Grigio | ||
| 44 ms ... aumenta ↗ e diminuisce ↘ combinato | ↗ 22 ms Incremento | 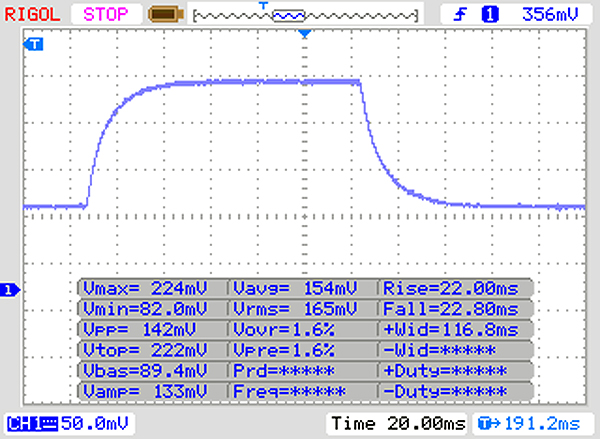 |
| ↘ 22 ms Calo | ||
| Lo schermo mostra tempi di risposta lenti nei nostri tests e sarà insoddisfacente per i gamers. In confronto, tutti i dispositivi di test variano da 0.165 (minimo) a 636 (massimo) ms. » 73 % di tutti i dispositivi è migliore. Questo significa che i tempi di risposta rilevati sono peggiori rispetto alla media di tutti i dispositivi testati (31 ms). | ||
| Geekbench 3 | |
| 32 Bit Single-Core Score | |
| Media della classe Subnotebook (n=1ultimi 2 anni) | |
| Lenovo Miix 520-12IKB 20M3000LGE | |
| Asus ZenBook 13 UX331UN | |
| Acer Swift 3 SF314-52G-89SL | |
| Media Intel Core i7-8550U (2471 - 4020, n=12) | |
| Acer Aspire 5 A517-51G-80L | |
| 64 Bit Multi-Core Score | |
| Acer Aspire 5 A517-51G-80L | |
| Media Intel Core i7-8550U (11637 - 14030, n=2) | |
| Octane V2 - Total Score | |
| Media della classe Subnotebook (35801 - 142020, n=28, ultimi 2 anni) | |
| Acer Aspire 5 A517-51G-80L (EDGE: 40.15063.674.0) | |
| Asus ZenBook 13 UX331UN (Edge 41) | |
| Asus ZenBook 13 UX331UN (Edge) | |
| Dell XPS 13 9370 FHD i5 (Edge 41.15399.15.0) | |
| Media Intel Core i7-8550U (17296 - 42043, n=39) | |
| HP Envy 13-ad006ng (Edge) | |
| Lenovo Ideapad 720S-13IKB | |
| Mozilla Kraken 1.1 - Total | |
| HP Envy 13-ad006ng (Edge) | |
| Media Intel Core i7-8550U (877 - 2114, n=45) | |
| Dell XPS 13 9370 FHD i5 (Edge 41.15399.15.0) | |
| Lenovo Ideapad 720S-13IKB | |
| Acer Aspire 5 A517-51G-80L (EDGE: 40.15063.674.0) | |
| Asus ZenBook 13 UX331UN (Edge) | |
| Asus ZenBook 13 UX331UN (Edge 41) | |
| Media della classe Subnotebook (234 - 1104, n=61, ultimi 2 anni) | |
| JetStream 1.1 - 1.1 Total | |
| Acer Swift 3 SF314-52G-89SL (Edge 40) | |
| Acer Aspire 5 A517-51G-80L (EDGE: 40.15063.674.0) | |
| Lenovo Miix 520-12IKB 20M3000LGE (Edge 41) | |
| Asus ZenBook 13 UX331UN (Edge) | |
| Asus ZenBook 13 UX331UN (Edge 41) | |
| Dell XPS 13 9370 FHD i5 (Edge 41.15399.15.0) | |
| Media Intel Core i7-8550U (141.9 - 288, n=61) | |
| Media della classe Subnotebook (n=1ultimi 2 anni) | |
| HP Envy 13-ad006ng (Edge) | |
| Lenovo Ideapad 720S-13IKB | |
* ... Meglio usare valori piccoli
| PCMark 7 Score | 5647 punti | |
| PCMark 8 Home Score Accelerated v2 | 3780 punti | |
| PCMark 8 Creative Score Accelerated v2 | 4765 punti | |
| PCMark 8 Work Score Accelerated v2 | 4811 punti | |
| PCMark 10 Score | 3160 punti | |
Aiuto | ||

| Asus ZenBook 13 UX331UN SK Hynix HFS256G39TND-N210A | Asus ZenBook 13 UX331UN SanDisk SD8SN8U512G1002 | Lenovo Ideapad 720S-13IKB Samsung PM961 MZVLW256HEHP | Dell XPS 13 9370 FHD i5 Toshiba XG5 KXG50ZNV256G | HP Envy 13-ad006ng Toshiba NVMe THNSN5256GPUK | Apple MacBook Air 13.3" 1.8 GHz (2017) Apple SSD SM0128G | Media SK Hynix HFS256G39TND-N210A | |
|---|---|---|---|---|---|---|---|
| CrystalDiskMark 3.0 | 5% | 146% | 93% | 39% | 88% | -1% | |
| Read Seq (MB/s) | 435.6 | 430.6 -1% | 1674 284% | 1875 330% | 1019 134% | 1390 219% | 482 ? 11% |
| Write Seq (MB/s) | 263 | 424.1 61% | 1191 353% | 352.7 34% | 195.4 -26% | 731 178% | 246 ? -6% |
| Read 512 (MB/s) | 258.1 | 275 7% | 658 155% | 840 225% | 735 185% | 899 248% | 328 ? 27% |
| Write 512 (MB/s) | 256.6 | 369.8 44% | 852 232% | 353.9 38% | 172.3 -33% | 715 179% | 243 ? -5% |
| Read 4k (MB/s) | 30.37 | 28.04 -8% | 51.8 71% | 34.18 13% | 34.5 14% | 16.29 -46% | 28 ? -8% |
| Write 4k (MB/s) | 78.6 | 53.5 -32% | 114.9 46% | 127.5 62% | 109.4 39% | 27.17 -65% | 74.8 ? -5% |
| Read 4k QD32 (MB/s) | 356.8 | 322.9 -10% | 349.2 -2% | 381.8 7% | 494.6 39% | 300.9 -16% | 323 ? -9% |
| Write 4k QD32 (MB/s) | 257.2 | 211.9 -18% | 332.2 29% | 339.9 32% | 161.3 -37% | 273.7 6% | 220 ? -14% |
| 3DMark 06 Standard Score | 12911 punti | |
| 3DMark 11 Performance | 3779 punti | |
| 3DMark Cloud Gate Standard Score | 13058 punti | |
| 3DMark Fire Strike Score | 2582 punti | |
| 3DMark Fire Strike Extreme Score | 1257 punti | |
| 3DMark Time Spy Score | 929 punti | |
Aiuto | ||
| Geekbench 4.0 - Compute OpenCL Score | |
| Acer Swift 3 SF314-52G-89SL | |
| Acer Swift 3 SF315-51G-57E5 | |
| Acer Aspire 5 A515-51G-51RL | |
| Media NVIDIA GeForce MX150 (41337 - 47999, n=8) | |
| Asus ZenBook 13 UX331UN | |
| ComputeMark v2.1 - 1024x600 Normal, Score | |
| Media della classe Subnotebook (944 - 10728, n=11, ultimi 2 anni) | |
| Acer Aspire 5 A515-51G-51RL | |
| Media NVIDIA GeForce MX150 (2256 - 2856, n=9) | |
| Asus ZenBook 13 UX331UN | |
| GFXBench (DX / GLBenchmark) 2.7 | |
| 1920x1080 T-Rex Offscreen | |
| Media della classe Subnotebook (81 - 915, n=7, ultimi 2 anni) | |
| Acer Aspire 5 A515-51G-51RL | |
| Media NVIDIA GeForce MX150 (203 - 284, n=4) | |
| Asus ZenBook 13 UX331UN | |
| T-Rex Onscreen | |
| Media della classe Subnotebook (54.3 - 794, n=7, ultimi 2 anni) | |
| Asus ZenBook 13 UX331UN | |
| Acer Aspire 5 A515-51G-51RL | |
| Media NVIDIA GeForce MX150 (59.8 - 210, n=4) | |
| GFXBench 3.0 | |
| 1920x1080 1080p Manhattan Offscreen | |
| Media della classe Subnotebook (206 - 591, n=6, ultimi 2 anni) | |
| Acer Aspire 5 A515-51G-51RL | |
| Media NVIDIA GeForce MX150 (121.5 - 148.7, n=4) | |
| Asus ZenBook 13 UX331UN | |
| on screen Manhattan Onscreen OGL | |
| Media della classe Subnotebook (60 - 338, n=6, ultimi 2 anni) | |
| Asus ZenBook 13 UX331UN | |
| Acer Aspire 5 A515-51G-51RL | |
| Media NVIDIA GeForce MX150 (57.9 - 112.7, n=4) | |
| GFXBench 3.1 | |
| 1920x1080 Manhattan ES 3.1 Offscreen | |
| Media della classe Subnotebook (157.5 - 336, n=6, ultimi 2 anni) | |
| Acer Aspire 5 A515-51G-51RL | |
| Media NVIDIA GeForce MX150 (85.1 - 111.5, n=4) | |
| Asus ZenBook 13 UX331UN | |
| on screen Manhattan ES 3.1 Onscreen | |
| Media della classe Subnotebook (60 - 222, n=6, ultimi 2 anni) | |
| Acer Aspire 5 A515-51G-51RL | |
| Asus ZenBook 13 UX331UN | |
| Media NVIDIA GeForce MX150 (49 - 92.1, n=4) | |
| GFXBench | |
| 1920x1080 Car Chase Offscreen | |
| Media della classe Subnotebook (107.4 - 260, n=8, ultimi 2 anni) | |
| Acer Aspire 5 A515-51G-51RL | |
| Media NVIDIA GeForce MX150 (52.9 - 75.4, n=4) | |
| Asus ZenBook 13 UX331UN | |
| on screen Car Chase Onscreen | |
| Media della classe Subnotebook (50.5 - 154.5, n=8, ultimi 2 anni) | |
| Acer Aspire 5 A515-51G-51RL | |
| Media NVIDIA GeForce MX150 (31.8 - 63.1, n=4) | |
| Asus ZenBook 13 UX331UN | |
| basso | medio | alto | ultra | |
|---|---|---|---|---|
| Tomb Raider (2013) | 188.2 | 105.2 | 70.9 | 34.2 |
| BioShock Infinite (2013) | 98.1 | 78.9 | 71.7 | 27.8 |
| The Witcher 3 (2015) | 46.4 | 28.1 | 15.6 | 9.6 |
| Metal Gear Solid V (2015) | 60 | 60 | 38.8 | 25.2 |
| Just Cause 3 (2015) | 35.8 | 34.2 | 22.9 | 20 |
| Dishonored 2 (2016) | 36.4 | 20.1 | 19.4 | 14.4 |
| The Evil Within 2 (2017) | 25.6 | 14.2 | 13 | 12 |
| ELEX (2017) | 37.2 | 22.2 | 17.2 | 12.2 |
| Destiny 2 (2017) | 48.4 | 28.2 | 22.8 | 11.9 |
| Call of Duty WWII (2017) | 62.2 | 52.9 | 28.6 | 17.9 |
| Need for Speed Payback (2017) | 39.9 | 25.8 | 20.6 | 19.7 |
| Star Wars Battlefront 2 (2017) | 52.1 | 20.7 | 17.9 | 15.9 |
| Final Fantasy XV Benchmark (2018) | 28.3 | 13.8 | 8.2 |
| Tomb Raider - 1366x768 High Preset AA:FX AF:8x | |
| Media NVIDIA GeForce MX150 (70.9 - 87.2, n=4) | |
| Asus ZenBook 13 UX331UN | |
| Acer TravelMate P259-MG-71UU | |
| Dell XPS 13 9370 FHD i5 | |
| Star Wars Battlefront 2 - 1280x720 Low Preset | |
| Media NVIDIA GeForce MX150 (52.1 - 102, n=3) | |
| Asus ZenBook 13 UX331UN | |
| HP Pavilion 15-cc107ng | |
Rumorosità
| Idle |
| 30.13 / 30.3 / 30.3 dB(A) |
| Sotto carico |
| 39.2 / 41 dB(A) |
 | ||
30 dB silenzioso 40 dB(A) udibile 50 dB(A) rumoroso |
||
min: | ||
| Asus ZenBook 13 UX331UN i5-8550U, GeForce MX150 | Asus ZenBook 13 UX331UN i5-8550U, GeForce MX150 | Lenovo Ideapad 720S-13IKB i5-8250U, UHD Graphics 620 | Dell XPS 13 9370 FHD i5 i5-8250U, UHD Graphics 620 | HP Envy 13-ad006ng i7-7500U, GeForce MX150 | |
|---|---|---|---|---|---|
| Noise | -1% | 5% | 7% | 3% | |
| off /ambiente * (dB) | 30.13 | 29.6 2% | 30.13 -0% | 29.1 3% | 30.5 -1% |
| Idle Minimum * (dB) | 30.13 | 29.6 2% | 30.13 -0% | 29.1 3% | 30.5 -1% |
| Idle Average * (dB) | 30.3 | 29.6 2% | 30.13 1% | 29.1 4% | 30.5 -1% |
| Idle Maximum * (dB) | 30.3 | 29.6 2% | 30.9 -2% | 29.1 4% | 30.5 -1% |
| Load Average * (dB) | 39.2 | 41.7 -6% | 34.7 11% | 32.2 18% | 37.3 5% |
| Load Maximum * (dB) | 41 | 43.5 -6% | 33.3 19% | 37.3 9% | 34.2 17% |
| Witcher 3 ultra * (dB) | 43.5 | 37.3 |
* ... Meglio usare valori piccoli
(+) La temperatura massima sul lato superiore è di 39.3 °C / 103 F, rispetto alla media di 35.9 °C / 97 F, che varia da 21.4 a 59 °C per questa classe Subnotebook.
(+) Il lato inferiore si riscalda fino ad un massimo di 36.5 °C / 98 F, rispetto alla media di 39.2 °C / 103 F
(+) In idle, la temperatura media del lato superiore è di 27.9 °C / 82 F, rispetto alla media deld ispositivo di 30.8 °C / 87 F.
(+) I poggiapolsi e il touchpad sono piu' freddi della temperatura della pelle con un massimo di 29.7 °C / 85.5 F e sono quindi freddi al tatto.
(±) La temperatura media della zona del palmo della mano di dispositivi simili e'stata di 28.2 °C / 82.8 F (-1.5 °C / -2.7 F).
| Asus ZenBook 13 UX331UN i5-8550U, GeForce MX150 | Asus ZenBook 13 UX331UN i5-8550U, GeForce MX150 | Lenovo Ideapad 720S-13IKB i5-8250U, UHD Graphics 620 | Dell XPS 13 9370 FHD i5 i5-8250U, UHD Graphics 620 | HP Envy 13-ad006ng i7-7500U, GeForce MX150 | Apple MacBook Air 13.3" 1.8 GHz (2017) 5350U, HD Graphics 6000 | |
|---|---|---|---|---|---|---|
| Heat | 8% | -5% | 0% | 10% | -3% | |
| Maximum Upper Side * (°C) | 39.3 | 40.9 -4% | 43.6 -11% | 44.2 -12% | 41.6 -6% | 42.8 -9% |
| Maximum Bottom * (°C) | 36.5 | 38.1 -4% | 42 -15% | 45.5 -25% | 33.4 8% | 41.5 -14% |
| Idle Upper Side * (°C) | 30 | 23.9 20% | 28.6 5% | 24.1 20% | 23.1 23% | 27.6 8% |
| Idle Bottom * (°C) | 28.3 | 23.1 18% | 28.2 -0% | 23.2 18% | 24.1 15% | 26.9 5% |
* ... Meglio usare valori piccoli
Asus ZenBook 13 UX331UN analisi audio
(-) | altoparlanti non molto potenti (67.9 dB)
Bassi 100 - 315 Hz
(±) | bassi ridotti - in media 13% inferiori alla media
(+) | bassi in lineaa (6.8% delta rispetto alla precedente frequenza)
Medi 400 - 2000 Hz
(+) | medi bilanciati - solo only 2.7% rispetto alla media
(+) | medi lineari (3.6% delta rispetto alla precedente frequenza)
Alti 2 - 16 kHz
(+) | Alti bilanciati - appena 0.9% dalla media
(+) | alti lineari (2.7% delta rispetto alla precedente frequenza)
Nel complesso 100 - 16.000 Hz
(±) | la linearità complessiva del suono è media (15.2% di differenza rispetto alla media
Rispetto alla stessa classe
» 34% di tutti i dispositivi testati in questa classe è stato migliore, 5% simile, 61% peggiore
» Il migliore ha avuto un delta di 5%, medio di 18%, peggiore di 53%
Rispetto a tutti i dispositivi testati
» 22% di tutti i dispositivi testati in questa classe è stato migliore, 4% similare, 74% peggiore
» Il migliore ha avuto un delta di 4%, medio di 23%, peggiore di 134%
Apple MacBook 12 (Early 2016) 1.1 GHz analisi audio
(+) | gli altoparlanti sono relativamente potenti (83.6 dB)
Bassi 100 - 315 Hz
(±) | bassi ridotti - in media 11.3% inferiori alla media
(±) | la linearità dei bassi è media (14.2% delta rispetto alla precedente frequenza)
Medi 400 - 2000 Hz
(+) | medi bilanciati - solo only 2.4% rispetto alla media
(+) | medi lineari (5.5% delta rispetto alla precedente frequenza)
Alti 2 - 16 kHz
(+) | Alti bilanciati - appena 2% dalla media
(+) | alti lineari (4.5% delta rispetto alla precedente frequenza)
Nel complesso 100 - 16.000 Hz
(+) | suono nel complesso lineare (10.2% differenza dalla media)
Rispetto alla stessa classe
» 7% di tutti i dispositivi testati in questa classe è stato migliore, 2% simile, 90% peggiore
» Il migliore ha avuto un delta di 5%, medio di 18%, peggiore di 53%
Rispetto a tutti i dispositivi testati
» 5% di tutti i dispositivi testati in questa classe è stato migliore, 1% similare, 94% peggiore
» Il migliore ha avuto un delta di 4%, medio di 23%, peggiore di 134%
| Off / Standby | |
| Idle | |
| Sotto carico |
|
Leggenda:
min: | |
| Asus ZenBook 13 UX331UN i5-8550U, GeForce MX150 | Asus ZenBook 13 UX331UN i5-8550U, GeForce MX150 | Lenovo Ideapad 720S-13IKB i5-8250U, UHD Graphics 620 | Dell XPS 13 9370 FHD i5 i5-8250U, UHD Graphics 620 | HP Envy 13-ad006ng i7-7500U, GeForce MX150 | Apple MacBook Air 13.3" 1.8 GHz (2017) 5350U, HD Graphics 6000 | |
|---|---|---|---|---|---|---|
| Power Consumption | -9% | -26% | -8% | -16% | -11% | |
| Idle Minimum * (Watt) | 2.2 | 2.7 -23% | 3.9 -77% | 3.14 -43% | 2.8 -27% | 3.4 -55% |
| Idle Average * (Watt) | 5 | 5.3 -6% | 7.7 -54% | 5.22 -4% | 5.8 -16% | 6.3 -26% |
| Idle Maximum * (Watt) | 8 | 6.2 22% | 10.4 -30% | 6 25% | 7.7 4% | 7 12% |
| Load Average * (Watt) | 33 | 37.6 -14% | 33.3 -1% | 38.5 -17% | 48 -45% | 34.5 -5% |
| Load Maximum * (Watt) | 49.4 | 60.1 -22% | 34 31% | 50.4 -2% | 48 3% | 40 19% |
| Witcher 3 ultra * (Watt) | 35 |
* ... Meglio usare valori piccoli
| Asus ZenBook 13 UX331UN i5-8550U, GeForce MX150, 50 Wh | Asus ZenBook 13 UX331UN i5-8550U, GeForce MX150, 50 Wh | Lenovo Ideapad 720S-13IKB i5-8250U, UHD Graphics 620, 46 Wh | Dell XPS 13 9370 FHD i5 i5-8250U, UHD Graphics 620, 52 Wh | HP Envy 13-ad006ng i7-7500U, GeForce MX150, 51 Wh | Apple MacBook Air 13.3" 1.8 GHz (2017) 5350U, HD Graphics 6000, 54 Wh | |
|---|---|---|---|---|---|---|
| Autonomia della batteria | 5% | -7% | 25% | -6% | 18% | |
| Reader / Idle (h) | 20.7 | 22 6% | 17.3 -16% | 23.6 14% | 20 -3% | |
| H.264 (h) | 8.9 | 9.6 8% | 13.9 56% | 7.9 -11% | ||
| WiFi v1.3 (h) | 9 | 8.4 -7% | 10.1 12% | 10.7 19% | 7.1 -21% | 10.6 18% |
| Load (h) | 1.8 | 2 11% | 1.5 -17% | 2 11% | 2 11% |
Pro
Contro
L'ASUS ZenBook 13 si comporta bene grazie a CPU e GPU potenti inseriti in uno chassis compatto. Tuttavia questo ha un costo, in quanto le dimensioni del case impediscono ad Asus di usare un sistema di raffreddamento adeguato. Tra le altre cose, ASUS ha fatto compromessi per le prestazioni della GPU per ridurre i problemi di raffreddamento.
Nonostante questo, lo ZenBook resta un buon tuttofare che sfrutta i fiochi in modo decente.
Considerando il design compatto, lo ZenBook resta relativamente fresco sotto carico, il che è una cosa positiva. La ventola in genere è silenziosa quando l dispositivo è in idle, ma si sente in modo evidente quando il portatile inizia ad essere testato. Coloro che cercano un dispositivo potente e silenzioso potrebbero non essere contenti di questo ZenBook.
Considerando il prezzo dello ZenBook ci saremmo aspettati da ASUS la presenza di un drive NVMe invece di un lento drive SATA III presente sullo ZenBook. Questo sarebbe stato possibile, in quanto Asus su suo sito dice che gli slots M.2-2280 supportano sia NVMe che SATA III. Il display IPS è adeguato con buoni angoli di visuale, contrasto buono, e luminosità adeguata. Inoltre, abbiamo apprezzato la retroilluminazione della tastiera e siamo rimasti impressionanti dall'ampia autonomia.
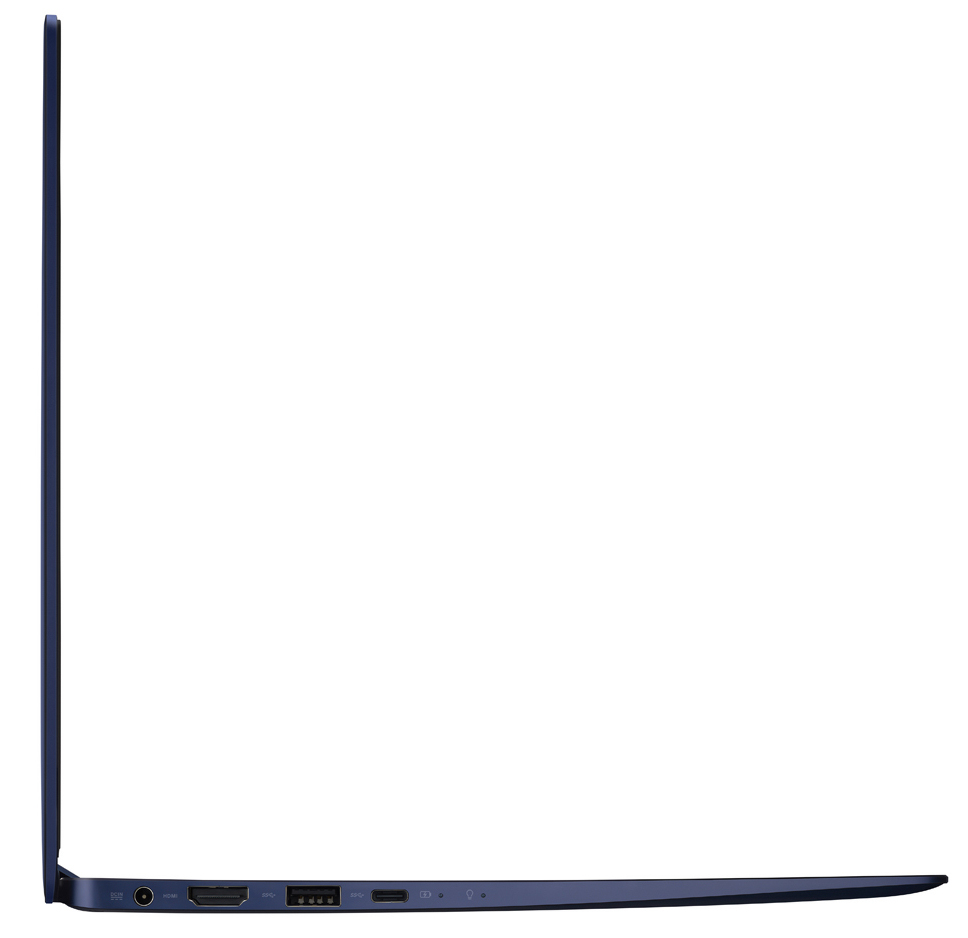
Le porte non brillano però. Sarebbe stato meglio se ASUS avesse incluso una porta Thunderbolt 3 invece di una porta USB 3.1 Gen 1 Type C. In questo modo sarebbe stato possibile ricaricare lo ZenBook tramite USB C, il che avrebbe aumentato l'appeal dello ZenBook e lo avrebbe reso più adatto al futuro.
Nota: si tratta di una recensione breve, con alcune sezioni non tradotte, per la versione integrale in inglese guardate qui.
Asus ZenBook 13 UX331UN
- 10/26/2019 v7 (old)
Sascha Mölck
Price comparison
