

Verdetto - Vale la pena prendere in considerazione l'XMG Fusion 16 con OLED
Con Fusion 16, XMG offre una versione leggermente più potente del noto Core 16. La caratteristica principale è il nuovo pannello OLED, che offre una qualità d'immagine eccezionale rispetto alla versione IPS. La caratteristica principale è il nuovo pannello OLED, che offre un'eccezionale qualità dell'immagine e immagini notevolmente più vivaci rispetto alla versione IPS. Solo la luminosità HDR potrebbe essere un po' più elevata. Detto questo, il pannello IPS con una frequenza di aggiornamento di 300 Hz rimane una solida alternativa e non soffre di problemi di PWM.
Il processore Intel HX, più veloce, offre prestazioni CPU grezze nettamente superiori, ma il suo impatto sui giochi è limitato. Nel complesso, le ventole rimangono un po' più silenziose rispetto a quelle della concorrenza e XMG offre un maggiore controllo sulle opzioni di configurazione, tra cui fino a 128 GB di RAM e 16 TB di storage SSD.
Nel complesso, il nuovo XMG Fusion 16 è un pacchetto all-around molto forte, e vale la pena scegliere il display OLED se si desidera la migliore qualità d'immagine possibile. La durata della batteria rimane sostanzialmente invariata. Tuttavia, se preferisce un pannello IPS, anche il Core 16, più conveniente, è una buona opzione, poiché le prestazioni di gioco con il processore AMD sono solo marginalmente inferiori.
Pro
Contro
Prezzo e disponibilità
La Fusion 16 può essere ordinata direttamente da XMG a partire da 1.899 euro. La nostra configurazione di prova, che include numerosi aggiornamenti, costa attualmente circa 2.700 euro.
Nota del traduttore: i computer portatili XMG non sono ufficialmente disponibili in Nord America.
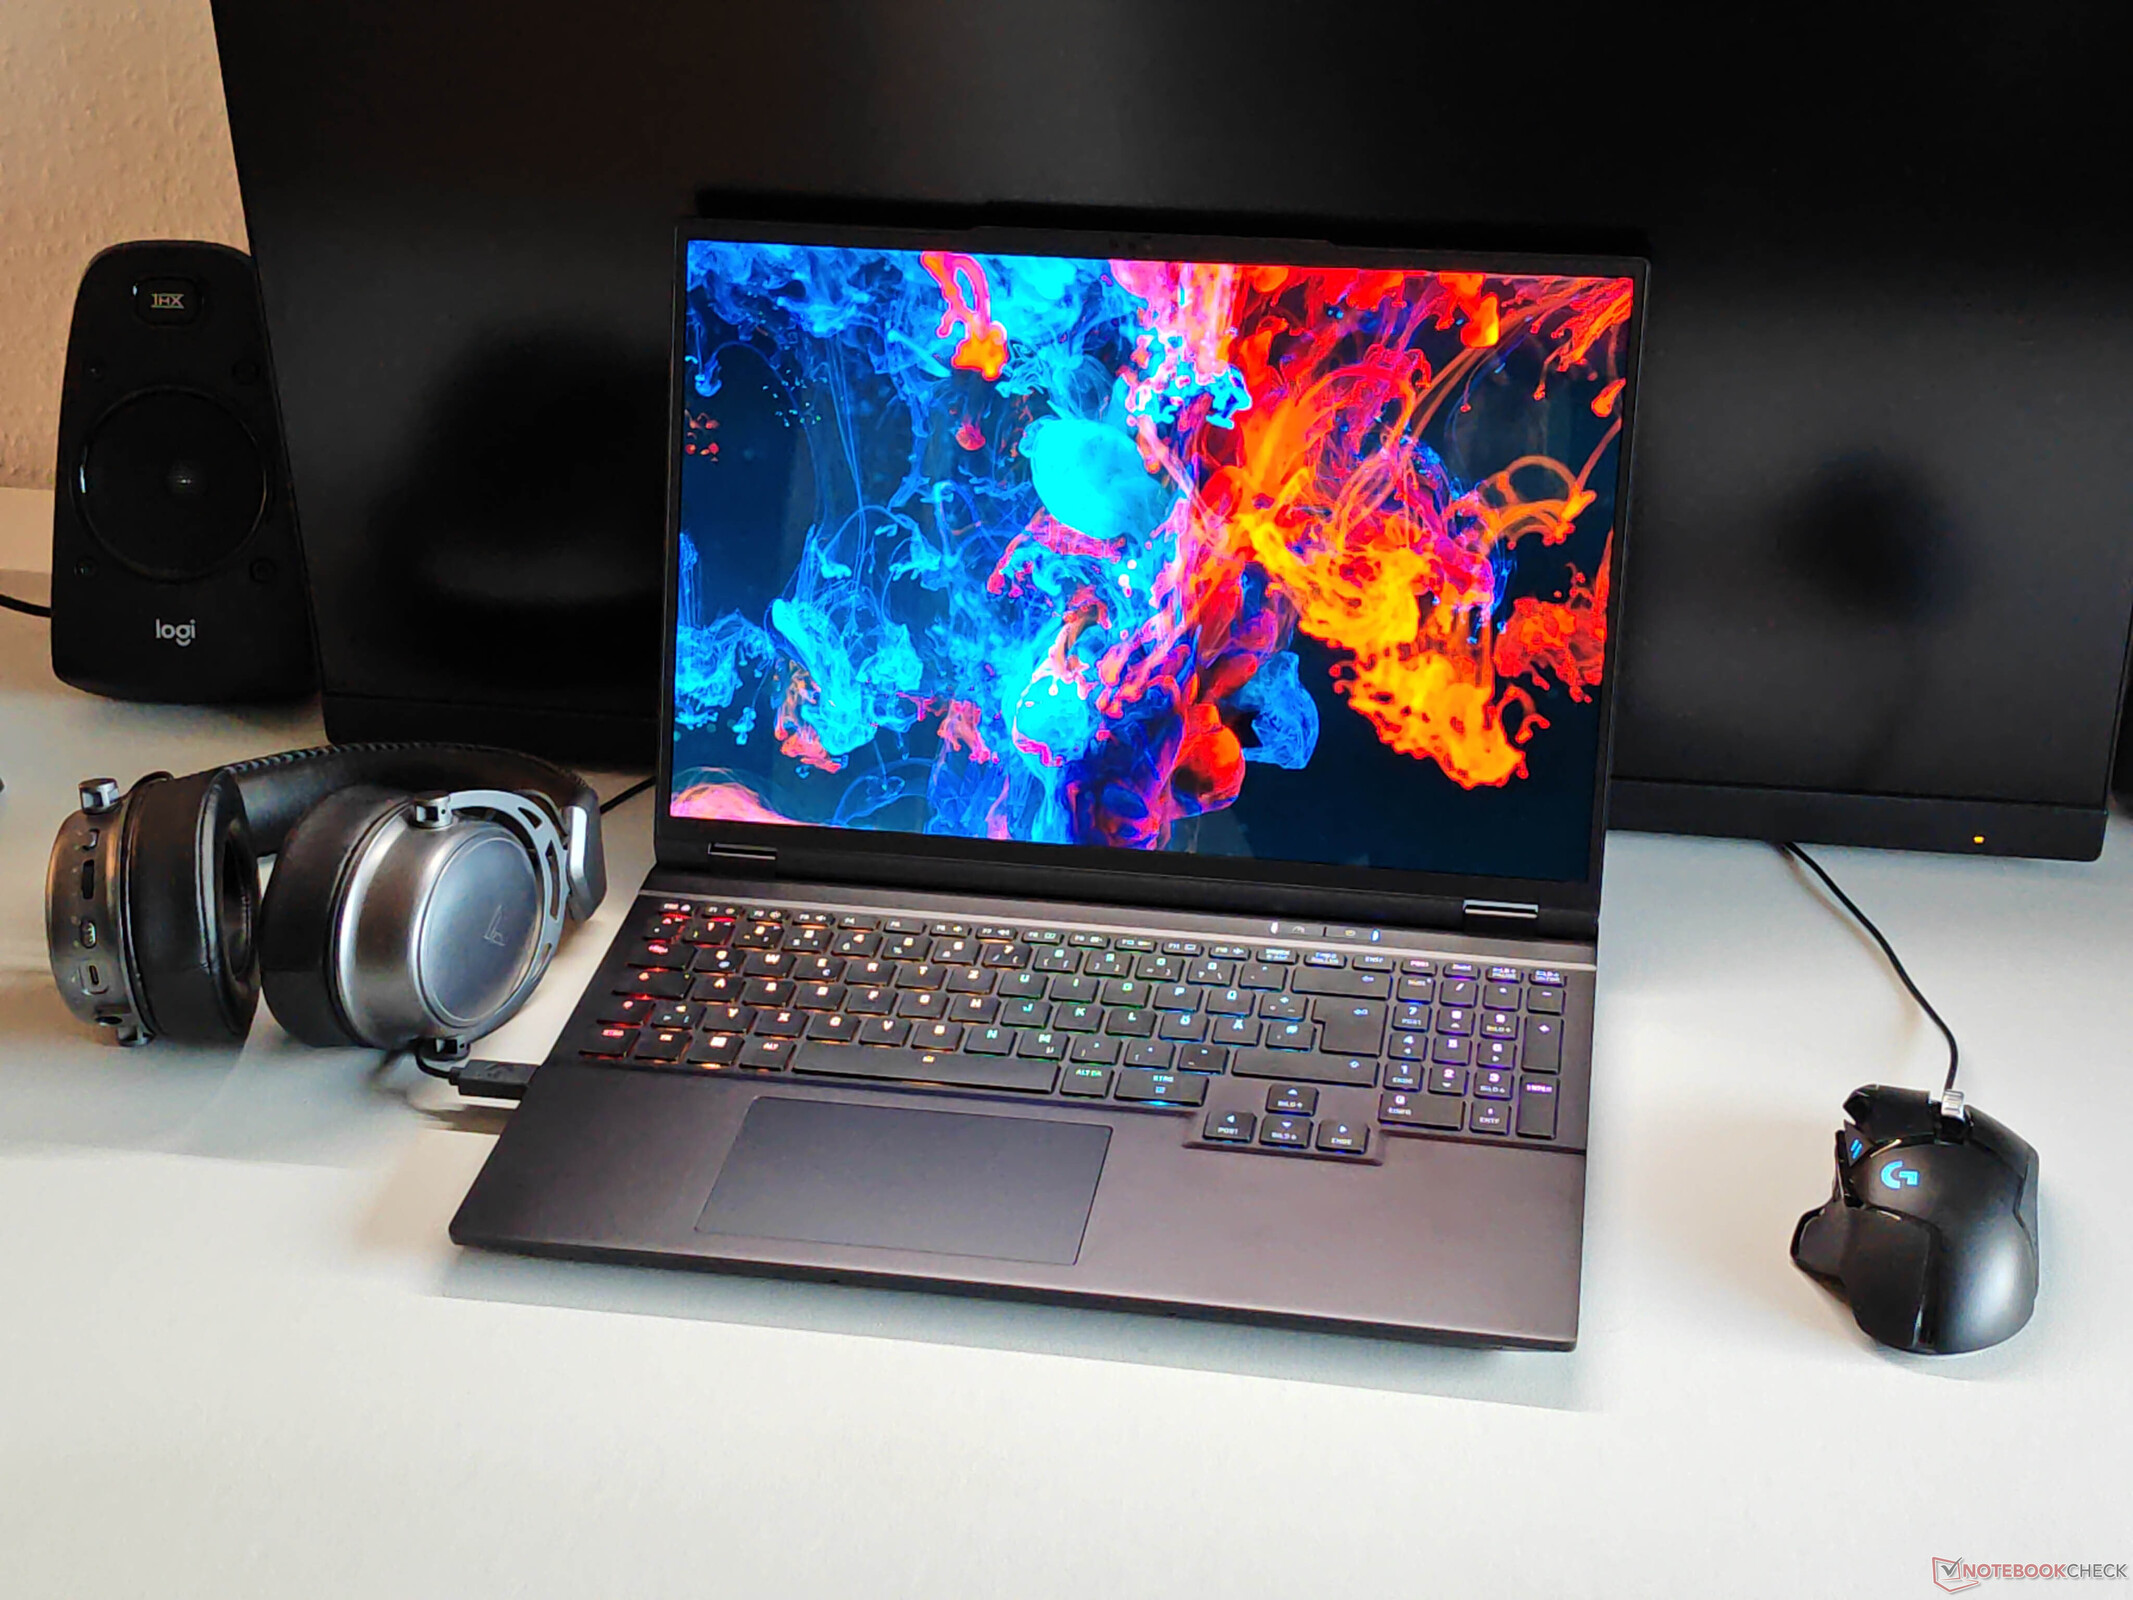
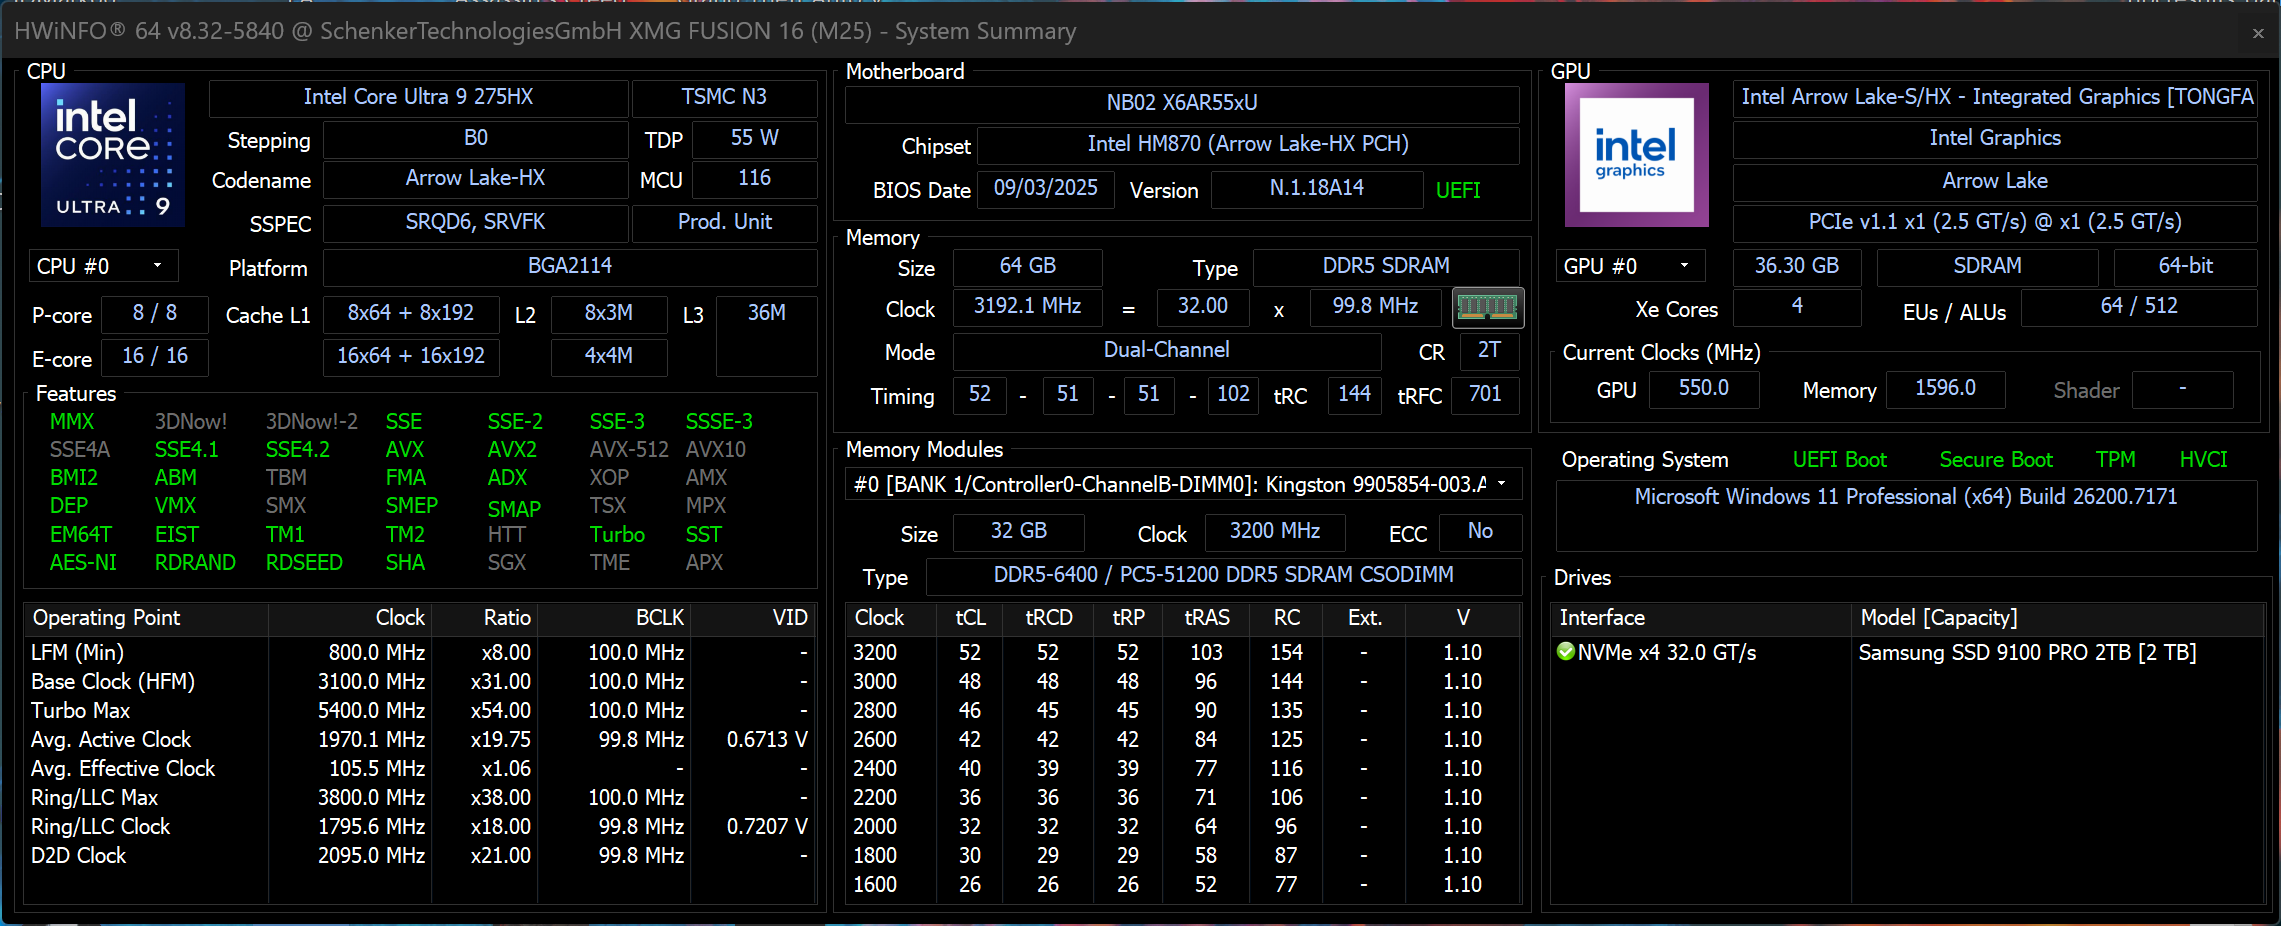
Il Fusion 16 è il primo portatile da gioco di XMG con un pannello OLED. Il telaio è già familiare grazie all'attuale XMG Core 16 (AMD Ryzen con IPS), ma il Fusion 16 è alimentato dall'Intel Core Ultra 9 275HX ad alte prestazioni, dalla nota GPU GeForce RTX 5070 Laptop e da un nuovo display OLED da 120 Hz.
Specifiche
Valigetta e attrezzatura
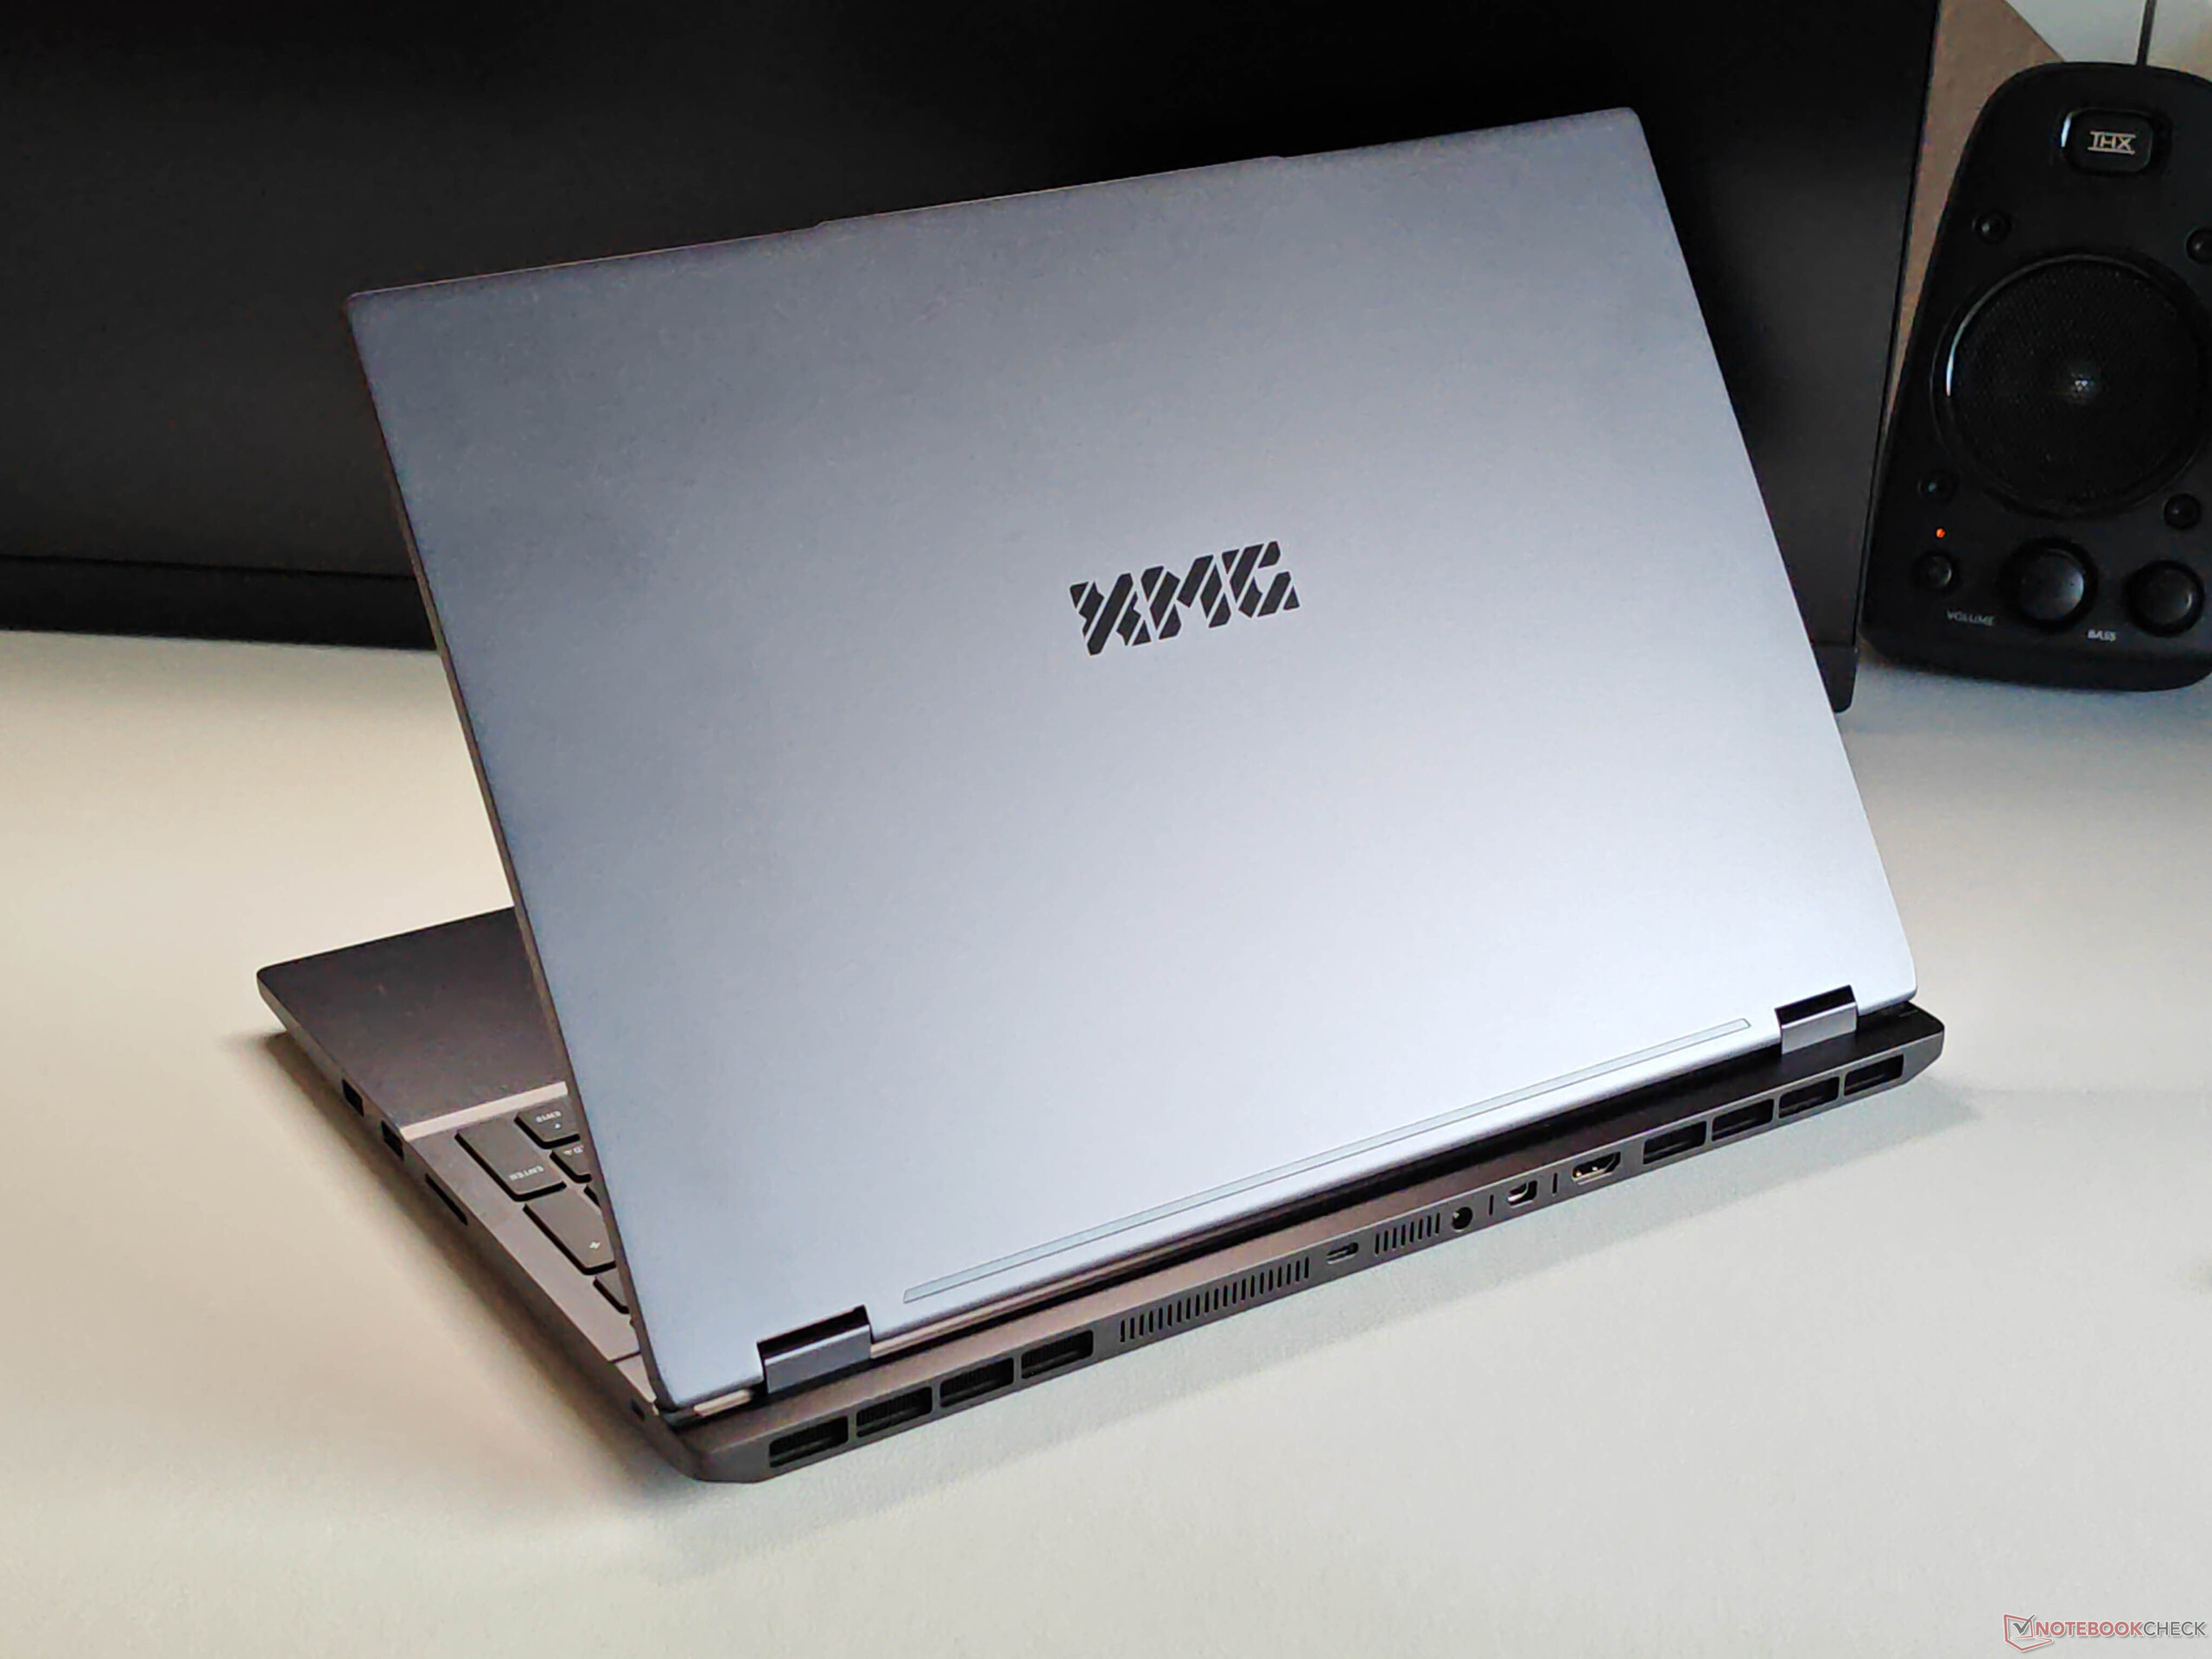
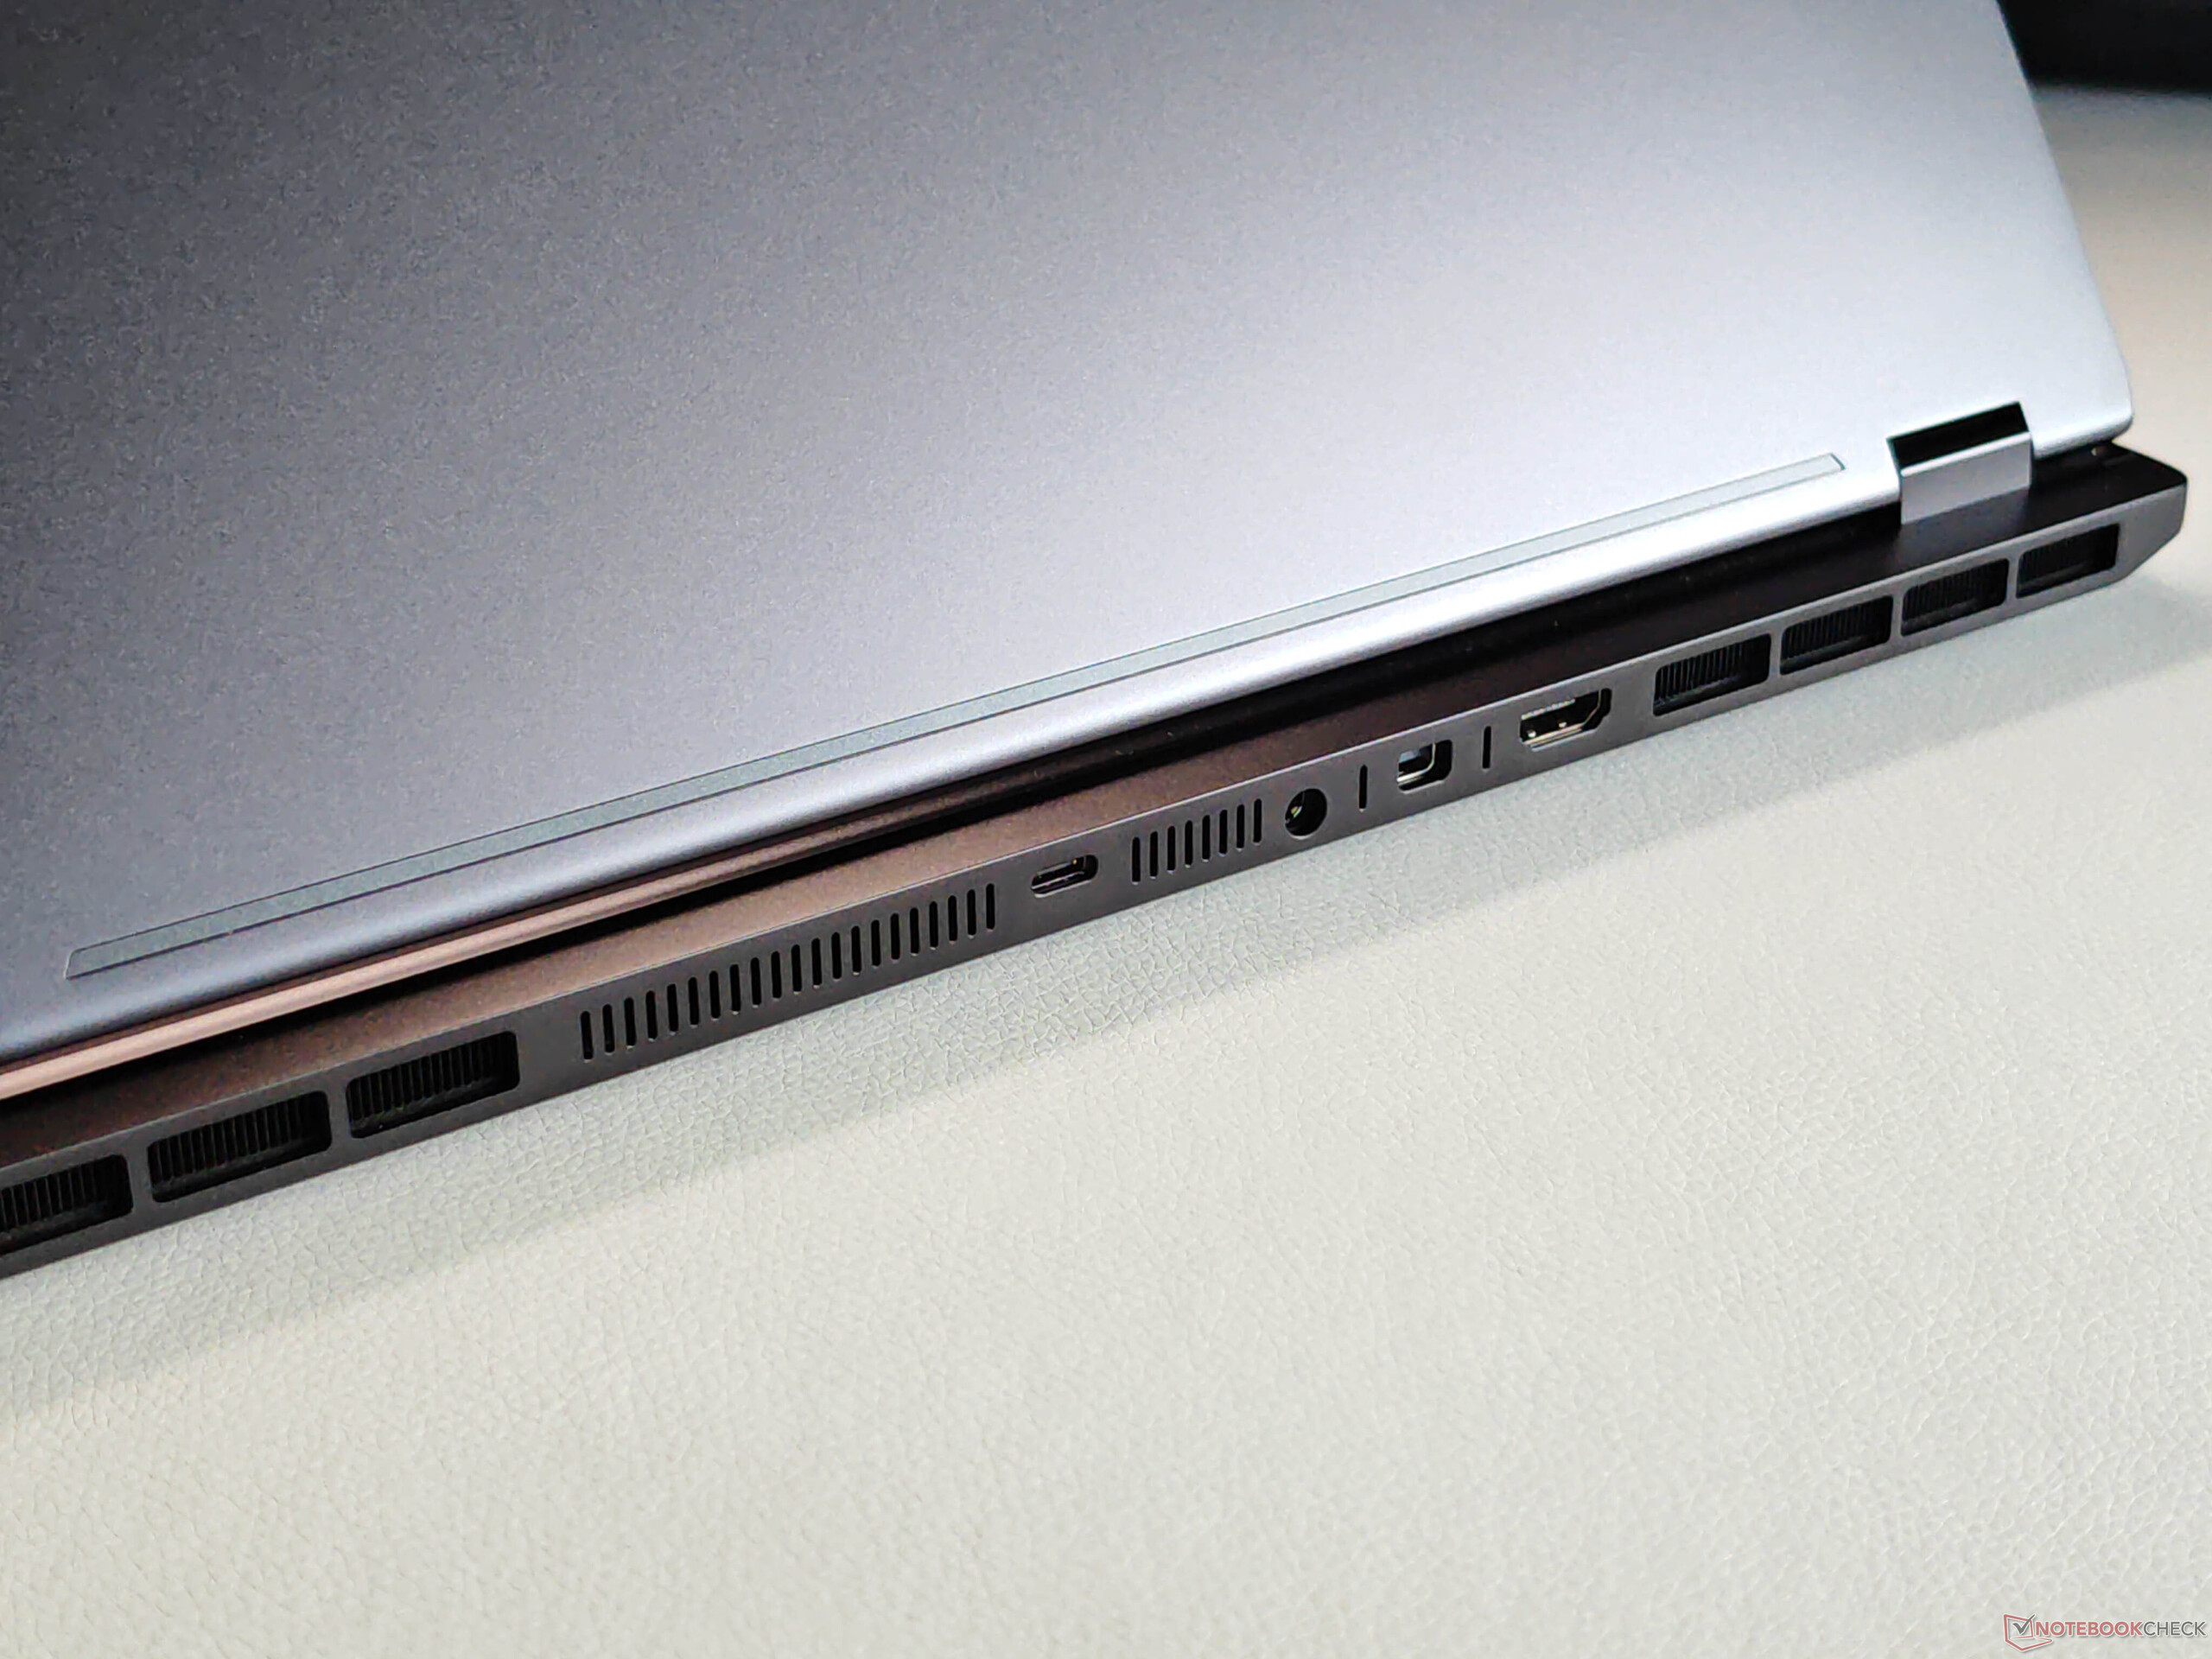
Non ci sono differenze nella custodia e nei dispositivi di input rispetto al modello già testato XMG Core 16la nuova versione OLED è più leggera di pochi grammi rispetto al modello IPS. Tuttavia, le caratteristiche del nuovo Fusion 16 sono leggermente migliori, in quanto è disponibile anche una porta Thunderbolt 4 oltre a un modulo Wi-Fi 7.


| SD Card Reader | |
| average JPG Copy Test (av. of 3 runs) | |
| Aorus Elite 16 AE6H (AV PRO microSD 128 GB V60) | |
| Schenker XMG Core 16 M25 (Angelbird AV Pro V60) | |
| Media della classe Gaming (20 - 210, n=70, ultimi 2 anni) | |
| Schenker XMG Fusion 16 M25 (Angelbird AV Pro V60) | |
| maximum AS SSD Seq Read Test (1GB) | |
| Schenker XMG Core 16 M25 (Angelbird AV Pro V60) | |
| Aorus Elite 16 AE6H (AV PRO microSD 128 GB V60) | |
| Media della classe Gaming (25.5 - 261, n=66, ultimi 2 anni) | |
| Schenker XMG Fusion 16 M25 (Angelbird AV Pro V60) | |
| Networking | |
| Schenker XMG Fusion 16 M25 | |
| iperf3 transmit AXE11000 | |
| iperf3 receive AXE11000 | |
| Lenovo Legion Pro 5 16IAX10, RTX 5070 | |
| iperf3 transmit AXE11000 | |
| iperf3 receive AXE11000 | |
| iperf3 transmit AXE11000 6GHz | |
| Schenker XMG Core 16 M25 | |
| iperf3 transmit AXE11000 | |
| iperf3 receive AXE11000 | |
| Asus TUF Gaming A16 FA608UP | |
| iperf3 transmit AXE11000 | |
| iperf3 receive AXE11000 | |
| MSI Crosshair 16 HX AI D2XWGKG | |
| iperf3 transmit AXE11000 | |
| iperf3 receive AXE11000 | |
| iperf3 transmit AXE11000 6GHz | |
| iperf3 receive AXE11000 6GHz | |
| Aorus Elite 16 AE6H | |
| iperf3 transmit AXE11000 | |
| iperf3 receive AXE11000 | |
| Gigabyte Gaming A16 GA6H | |
| iperf3 transmit AXE11000 | |
| iperf3 receive AXE11000 | |


Display - OLED a 120 Hz
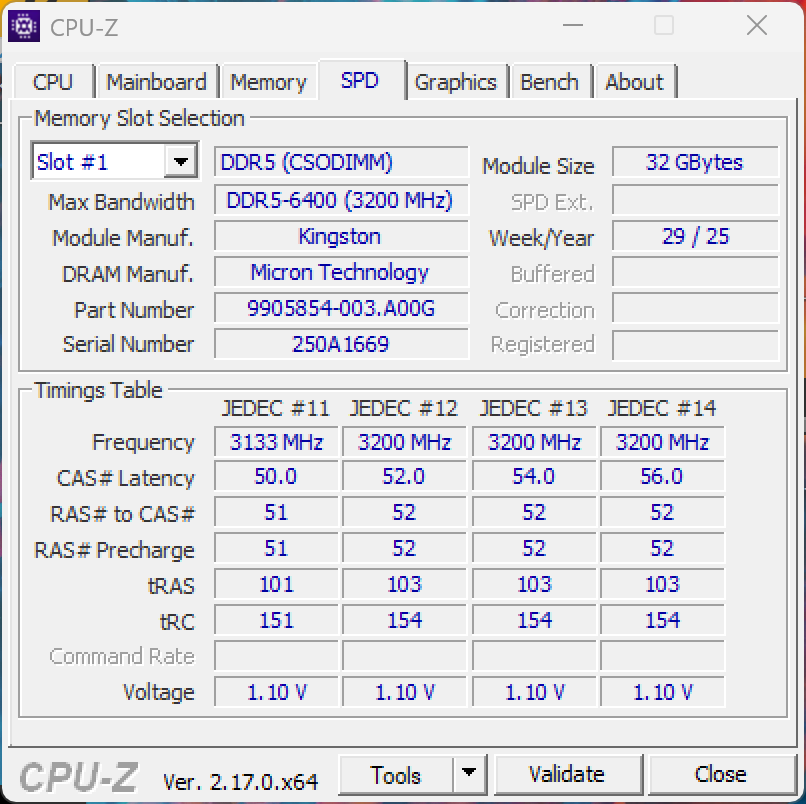
Fusion 16 è disponibile sia con il noto pannello IPS (300 Hz) del modello Core 16 oppure il nuovo pannello OLED di Samsung (2.880 × 1.800 pixel, 16:10, 120 Hz, supplemento di 130 euro). La qualità dell'immagine sullo schermo OLED lucido è eccellente, con colori vivaci, contrasto elevato e tempi di risposta estremamente rapidi. Tuttavia, lo sfarfallio PWM è presente a 480 Hz, anche se l'ampiezza è relativamente bassa.
La luminosità media in modalità SDR misura 433 cd/m² (con un livello di nero pari a 0), mentre la luminosità HDR raggiunge un picco di poco inferiore a 500 cd/m². Sarebbe stata auspicabile una luminosità maggiore, soprattutto in modalità HDR. XMG fornisce diversi profili calibrati in fabbrica, ma nessuno è del tutto convincente. Nella nostra analisi con il software professionale CalMAN, il profilo sRGB offre i risultati migliori. Con la nostra calibrazione (il profilo è disponibile per il download gratuito nel riquadro sottostante), il display può essere ulteriormente migliorato, rendendo il pannello adatto anche all'editing di immagini.
| |||||||||||||||||||||||||
Distribuzione della luminosità: 99 %
Al centro con la batteria: 434 cd/m²
Contrasto: ∞:1 (Nero: 0 cd/m²)
ΔE ColorChecker Calman: 3 | ∀{0.5-29.43 Ø4.78}
calibrated: 1.4
ΔE Greyscale Calman: 3.4 | ∀{0.09-98 Ø5}
93.3% AdobeRGB 1998 (Argyll 3D)
100% sRGB (Argyll 3D)
99.9% Display P3 (Argyll 3D)
Gamma: 2.47
CCT: 6452 K
| Schenker XMG Fusion 16 M25 ATNA60CL10_0, OLED, 2880x1800, 16", 120 Hz | Lenovo Legion Pro 5 16IAX10, RTX 5070 ATNA60HS01-0 (Samsung SDC420A), OLED, 2650x1600, 16", 165 Hz | Schenker XMG Core 16 M25 MNG007DA6-4, IPS, 2560x1600, 16", 300 Hz | Asus TUF Gaming A16 FA608UP MNG007DA5-3, IPS, 2560x1600, 16", 165 Hz | MSI Crosshair 16 HX AI D2XWGKG AUO B160QAN02.3, IPS, 2560x1600, 16", 240 Hz | Aorus Elite 16 AE6H NE160QDM-NYJ, IPS, 2560x1600, 16", 165 Hz | Gigabyte Gaming A16 GA6H NE160QDM-NYJ (BOE0C80), IPS, 2560x1600, 16", 165 Hz | |
|---|---|---|---|---|---|---|---|
| Display | 0% | -2% | -19% | -5% | -17% | -18% | |
| Display P3 Coverage (%) | 99.9 | 99.3 -1% | 98.8 -1% | 69.4 -31% | 95.5 -4% | 70.8 -29% | 69.4 -31% |
| sRGB Coverage (%) | 100 | 100 0% | 100 0% | 97.2 -3% | 99.7 0% | 99.8 0% | 99.5 0% |
| AdobeRGB 1998 Coverage (%) | 93.3 | 93.9 1% | 88.4 -5% | 71.9 -23% | 83.9 -10% | 72.6 -22% | 71.6 -23% |
| Response Times | -121% | -1278% | -877% | -832% | -2081% | -1781% | |
| Response Time Grey 50% / Grey 80% * (ms) | 0.56 ? | 2 ? -257% | 10.7 ? -1811% | 6.3 ? -1025% | 3.59 ? -541% | 16.8 ? -2900% | 14.3 ? -2454% |
| Response Time Black / White * (ms) | 0.58 ? | 1.4 ? -141% | 4.9 ? -745% | 4.8 ? -728% | 7.09 ? -1122% | 7.9 ? -1262% | 7 ? -1107% |
| PWM Frequency (Hz) | 480 ? | 1300 | |||||
| PWM Amplitude * (%) | 26 | 16.7 36% | |||||
| Screen | -2% | 16% | 26% | -49% | -20% | -29% | |
| Brightness middle (cd/m²) | 434 | 521 20% | 512 18% | 480 11% | 472 9% | 443 2% | 432 0% |
| Brightness (cd/m²) | 433 | 519 20% | 483 12% | 456 5% | 438 1% | 433 0% | 425 -2% |
| Brightness Distribution (%) | 99 | 98 -1% | 91 -8% | 91 -8% | 88 -11% | 90 -9% | 91 -8% |
| Black Level * (cd/m²) | 0.075 | 0.43 | 0.32 | 0.4 | 0.42 | 0.37 | |
| Colorchecker dE 2000 * | 3 | 2.5 17% | 2.4 20% | 1.4 53% | 6.07 -102% | 3.82 -27% | 4.76 -59% |
| Colorchecker dE 2000 max. * | 5.1 | 4.85 5% | 3.8 25% | 2.5 51% | 9.76 -91% | 7.61 -49% | 8.59 -68% |
| Colorchecker dE 2000 calibrated * | 1.4 | 2.5 -79% | 0.9 36% | 1.3 7% | 2.25 -61% | 1.33 5% | 1.18 16% |
| Greyscale dE 2000 * | 3.4 | 3.17 7% | 3.1 9% | 1.2 65% | 6.4 -88% | 5.5 -62% | 6.2 -82% |
| Gamma | 2.47 89% | 2.35 94% | 2.41 91% | 2.16 102% | 2.52 87% | 2.249 98% | 2.079 106% |
| CCT | 6452 101% | 6454 101% | 6534 99% | 6620 98% | 7987 81% | 6549 99% | 6690 97% |
| Contrast (:1) | 6947 | 1191 | 1500 | 1180 | 1055 | 1168 | |
| Media totale (Programma / Settaggio) | -41% /
-29% | -421% /
-204% | -290% /
-136% | -295% /
-168% | -706% /
-363% | -609% /
-318% |
* ... Meglio usare valori piccoli


Tempi di risposta del Display
| ↔ Tempi di risposta dal Nero al Bianco | ||
|---|---|---|
| 0.58 ms ... aumenta ↗ e diminuisce ↘ combinato | ↗ 0.33 ms Incremento |  |
| ↘ 0.25 ms Calo | ||
| Lo schermo ha mostrato valori di risposta molto veloci nei nostri tests ed è molto adatto per i gaming veloce. In confronto, tutti i dispositivi di test variano da 0.1 (minimo) a 240 (massimo) ms. » 1 % di tutti i dispositivi è migliore. Questo significa che i tempi di risposta rilevati sono migliori rispettto alla media di tutti i dispositivi testati (20.2 ms). | ||
| ↔ Tempo di risposta dal 50% Grigio all'80% Grigio | ||
| 0.56 ms ... aumenta ↗ e diminuisce ↘ combinato | ↗ 0.3 ms Incremento |  |
| ↘ 0.26 ms Calo | ||
| Lo schermo ha mostrato valori di risposta molto veloci nei nostri tests ed è molto adatto per i gaming veloce. In confronto, tutti i dispositivi di test variano da 0.165 (minimo) a 636 (massimo) ms. » 1 % di tutti i dispositivi è migliore. Questo significa che i tempi di risposta rilevati sono migliori rispettto alla media di tutti i dispositivi testati (31.6 ms). | ||
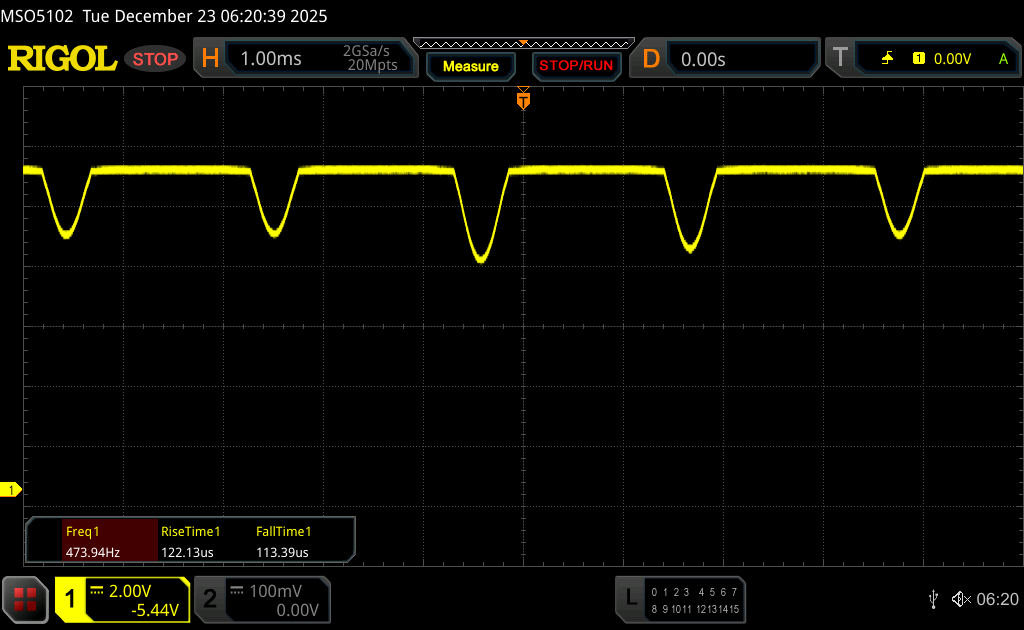
Sfarfallio dello schermo / PWM (Pulse-Width Modulation)
| flickering dello schermo / PWM rilevato | 480 Hz Amplitude: 26 % | ≤ 92 % settaggio luminosita' | 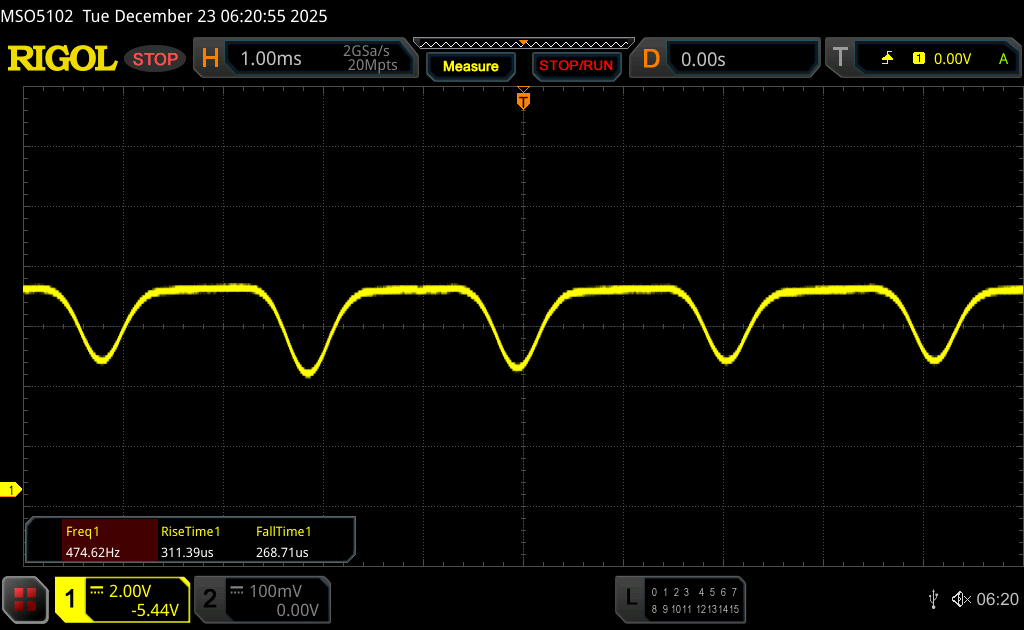 |
Il display sfarfalla a 480 Hz (Probabilmente a causa dell'uso di PWM) Flickering rilevato ad una luminosita' di 92 % o inferiore. Non dovrebbe verificarsi flickering o PWM sopra questo valore di luminosita'. La frequenza di 480 Hz è relativamente elevata, quindi la maggioranza degli utenti sensibili al PWM non dovrebbe notare alcun flickering. Tuttavia, è stato segnalato che alcuni utenti sono sensibili al PWM a 500 Hz ed oltre, quindi prestate attenzione. In confronto: 53 % di tutti i dispositivi testati non utilizza PWM per ridurre la luminosita' del display. Se è rilevato PWM, una media di 8091 (minimo: 5 - massimo: 343500) Hz è stata rilevata. | |||


Prestazioni - Arrow Lake HX e Blackwell
Condizioni del test
XMG offre diversi profili di potenza e noi abbiamo eseguito i benchmark in modalità Overboost - Normale. È disponibile anche una modalità Overboost - Estrema, che però non ha fornito ulteriori guadagni di prestazioni nei giochi.
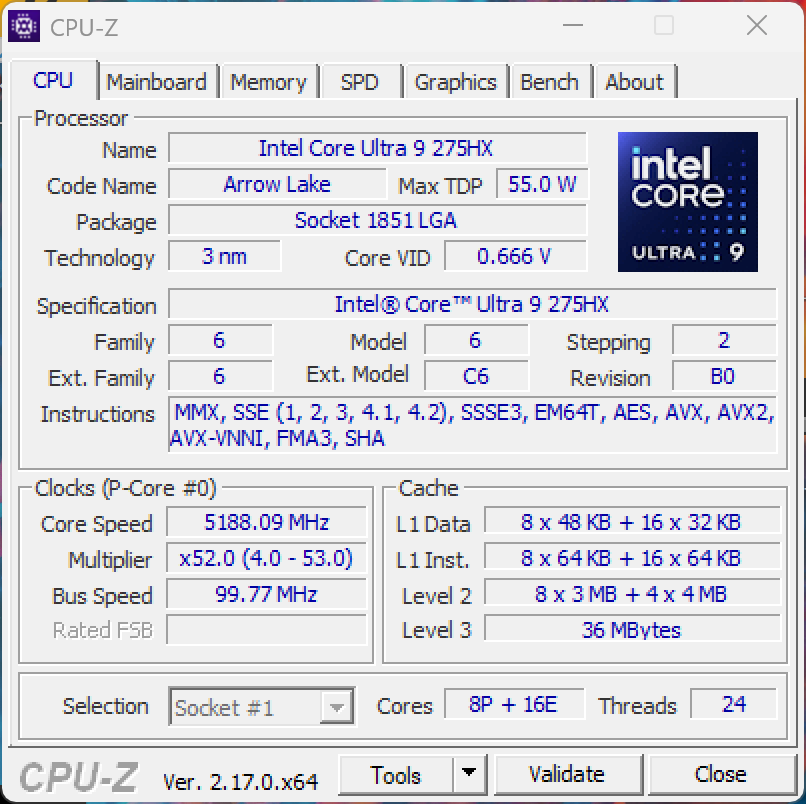
Processore
Il Intel Core Ultra 9 275HX può assorbire fino a 150/140 watt nella Fusion 16 e offre prestazioni complessive eccellenti. Rispetto all'AMD Ryzen AI 9 HX 370 nell'XMG Core 16, il 275HX è in media più veloce del 28% in tutti i nostri benchmark della CPU. Quando funziona a batteria, il processore è limitato a 40 watt, con un conseguente calo del 35% delle prestazioni multi-core.
Test di resistenza multipla Cinebench R15
Cinebench 2024: CPU Multi Core | CPU Single Core
Cinebench R23: Multi Core | Single Core
Cinebench R20: CPU (Multi Core) | CPU (Single Core)
Cinebench R15: CPU Multi 64Bit | CPU Single 64Bit
Blender: v2.79 BMW27 CPU
7-Zip 18.03: 7z b 4 | 7z b 4 -mmt1
Geekbench 6.5: Multi-Core | Single-Core
Geekbench 5.5: Multi-Core | Single-Core
HWBOT x265 Benchmark v2.2: 4k Preset
LibreOffice : 20 Documents To PDF
R Benchmark 2.5: Overall mean
| CPU Performance rating | |
| Media Intel Core Ultra 9 275HX | |
| Aorus Elite 16 AE6H -1! | |
| MSI Crosshair 16 HX AI D2XWGKG | |
| Schenker XMG Fusion 16 M25 | |
| Lenovo Legion Pro 5 16IAX10, RTX 5070 -2! | |
| Media della classe Gaming | |
| Schenker XMG Core 16 M25 | |
| Asus TUF Gaming A16 FA608UP | |
| Gigabyte Gaming A16 GA6H | |
| Cinebench 2024 / CPU Multi Core | |
| Media Intel Core Ultra 9 275HX (1547 - 2288, n=25) | |
| Schenker XMG Fusion 16 M25 | |
| Aorus Elite 16 AE6H | |
| MSI Crosshair 16 HX AI D2XWGKG | |
| Media della classe Gaming (331 - 2298, n=106, ultimi 2 anni) | |
| Schenker XMG Core 16 M25 | |
| Asus TUF Gaming A16 FA608UP | |
| Gigabyte Gaming A16 GA6H | |
| Cinebench 2024 / CPU Single Core | |
| Schenker XMG Fusion 16 M25 | |
| MSI Crosshair 16 HX AI D2XWGKG | |
| Media Intel Core Ultra 9 275HX (123.1 - 138.2, n=25) | |
| Aorus Elite 16 AE6H | |
| Media della classe Gaming (68.2 - 138.2, n=107, ultimi 2 anni) | |
| Schenker XMG Core 16 M25 | |
| Gigabyte Gaming A16 GA6H | |
| Asus TUF Gaming A16 FA608UP | |
| Cinebench R23 / Multi Core | |
| Media Intel Core Ultra 9 275HX (30712 - 40970, n=30) | |
| MSI Crosshair 16 HX AI D2XWGKG | |
| Schenker XMG Fusion 16 M25 | |
| Aorus Elite 16 AE6H | |
| Lenovo Legion Pro 5 16IAX10, RTX 5070 | |
| Media della classe Gaming (5668 - 40970, n=148, ultimi 2 anni) | |
| Schenker XMG Core 16 M25 | |
| Asus TUF Gaming A16 FA608UP | |
| Gigabyte Gaming A16 GA6H | |
| Cinebench R23 / Single Core | |
| Schenker XMG Fusion 16 M25 | |
| MSI Crosshair 16 HX AI D2XWGKG | |
| Media Intel Core Ultra 9 275HX (2009 - 2267, n=30) | |
| Lenovo Legion Pro 5 16IAX10, RTX 5070 | |
| Aorus Elite 16 AE6H | |
| Schenker XMG Core 16 M25 | |
| Media della classe Gaming (1136 - 2267, n=148, ultimi 2 anni) | |
| Gigabyte Gaming A16 GA6H | |
| Asus TUF Gaming A16 FA608UP | |
| Cinebench R20 / CPU (Multi Core) | |
| Media Intel Core Ultra 9 275HX (12026 - 16108, n=29) | |
| MSI Crosshair 16 HX AI D2XWGKG | |
| Schenker XMG Fusion 16 M25 | |
| Aorus Elite 16 AE6H | |
| Lenovo Legion Pro 5 16IAX10, RTX 5070 | |
| Media della classe Gaming (2179 - 16108, n=147, ultimi 2 anni) | |
| Schenker XMG Core 16 M25 | |
| Asus TUF Gaming A16 FA608UP | |
| Gigabyte Gaming A16 GA6H | |
| Cinebench R20 / CPU (Single Core) | |
| Schenker XMG Fusion 16 M25 | |
| MSI Crosshair 16 HX AI D2XWGKG | |
| Media Intel Core Ultra 9 275HX (774 - 870, n=29) | |
| Aorus Elite 16 AE6H | |
| Lenovo Legion Pro 5 16IAX10, RTX 5070 | |
| Schenker XMG Core 16 M25 | |
| Media della classe Gaming (439 - 870, n=147, ultimi 2 anni) | |
| Gigabyte Gaming A16 GA6H | |
| Asus TUF Gaming A16 FA608UP | |
| Cinebench R15 / CPU Multi 64Bit | |
| Media Intel Core Ultra 9 275HX (4737 - 6271, n=29) | |
| MSI Crosshair 16 HX AI D2XWGKG | |
| Aorus Elite 16 AE6H | |
| Schenker XMG Fusion 16 M25 | |
| Lenovo Legion Pro 5 16IAX10, RTX 5070 | |
| Media della classe Gaming (1537 - 6271, n=147, ultimi 2 anni) | |
| Schenker XMG Core 16 M25 | |
| Asus TUF Gaming A16 FA608UP | |
| Gigabyte Gaming A16 GA6H | |
| Cinebench R15 / CPU Single 64Bit | |
| Schenker XMG Fusion 16 M25 | |
| Media Intel Core Ultra 9 275HX (306 - 343, n=30) | |
| MSI Crosshair 16 HX AI D2XWGKG | |
| Lenovo Legion Pro 5 16IAX10, RTX 5070 | |
| Aorus Elite 16 AE6H | |
| Media della classe Gaming (188.8 - 343, n=146, ultimi 2 anni) | |
| Asus TUF Gaming A16 FA608UP | |
| Gigabyte Gaming A16 GA6H | |
| Schenker XMG Core 16 M25 | |
| Blender / v2.79 BMW27 CPU | |
| Gigabyte Gaming A16 GA6H | |
| Asus TUF Gaming A16 FA608UP | |
| Media della classe Gaming (80 - 517, n=143, ultimi 2 anni) | |
| Schenker XMG Core 16 M25 | |
| Lenovo Legion Pro 5 16IAX10, RTX 5070 | |
| Schenker XMG Fusion 16 M25 | |
| MSI Crosshair 16 HX AI D2XWGKG | |
| Media Intel Core Ultra 9 275HX (82 - 116, n=28) | |
| 7-Zip 18.03 / 7z b 4 | |
| Media Intel Core Ultra 9 275HX (98236 - 124155, n=29) | |
| Schenker XMG Fusion 16 M25 | |
| Aorus Elite 16 AE6H | |
| MSI Crosshair 16 HX AI D2XWGKG | |
| Lenovo Legion Pro 5 16IAX10, RTX 5070 | |
| Media della classe Gaming (23795 - 148086, n=145, ultimi 2 anni) | |
| Schenker XMG Core 16 M25 | |
| Asus TUF Gaming A16 FA608UP | |
| Gigabyte Gaming A16 GA6H | |
| 7-Zip 18.03 / 7z b 4 -mmt1 | |
| Schenker XMG Fusion 16 M25 | |
| MSI Crosshair 16 HX AI D2XWGKG | |
| Media Intel Core Ultra 9 275HX (6026 - 7149, n=29) | |
| Lenovo Legion Pro 5 16IAX10, RTX 5070 | |
| Schenker XMG Core 16 M25 | |
| Media della classe Gaming (4199 - 7508, n=145, ultimi 2 anni) | |
| Aorus Elite 16 AE6H | |
| Asus TUF Gaming A16 FA608UP | |
| Gigabyte Gaming A16 GA6H | |
| Geekbench 6.5 / Multi-Core | |
| Lenovo Legion Pro 5 16IAX10, RTX 5070 | |
| Media Intel Core Ultra 9 275HX (16033 - 21668, n=31) | |
| Schenker XMG Fusion 16 M25 | |
| Aorus Elite 16 AE6H | |
| MSI Crosshair 16 HX AI D2XWGKG | |
| Schenker XMG Core 16 M25 | |
| Media della classe Gaming (5340 - 22104, n=145, ultimi 2 anni) | |
| Asus TUF Gaming A16 FA608UP | |
| Gigabyte Gaming A16 GA6H | |
| Geekbench 6.5 / Single-Core | |
| Schenker XMG Fusion 16 M25 | |
| MSI Crosshair 16 HX AI D2XWGKG | |
| Media Intel Core Ultra 9 275HX (2843 - 3160, n=31) | |
| Lenovo Legion Pro 5 16IAX10, RTX 5070 | |
| Aorus Elite 16 AE6H | |
| Schenker XMG Core 16 M25 | |
| Media della classe Gaming (1490 - 3253, n=145, ultimi 2 anni) | |
| Asus TUF Gaming A16 FA608UP | |
| Gigabyte Gaming A16 GA6H | |
| Geekbench 5.5 / Multi-Core | |
| Schenker XMG Fusion 16 M25 | |
| Media Intel Core Ultra 9 275HX (19105 - 25855, n=30) | |
| Aorus Elite 16 AE6H | |
| MSI Crosshair 16 HX AI D2XWGKG | |
| Lenovo Legion Pro 5 16IAX10, RTX 5070 | |
| Media della classe Gaming (4557 - 27010, n=144, ultimi 2 anni) | |
| Schenker XMG Core 16 M25 | |
| Asus TUF Gaming A16 FA608UP | |
| Gigabyte Gaming A16 GA6H | |
| Geekbench 5.5 / Single-Core | |
| Schenker XMG Fusion 16 M25 | |
| MSI Crosshair 16 HX AI D2XWGKG | |
| Lenovo Legion Pro 5 16IAX10, RTX 5070 | |
| Media Intel Core Ultra 9 275HX (2033 - 2292, n=30) | |
| Aorus Elite 16 AE6H | |
| Schenker XMG Core 16 M25 | |
| Media della classe Gaming (986 - 2423, n=144, ultimi 2 anni) | |
| Asus TUF Gaming A16 FA608UP | |
| Gigabyte Gaming A16 GA6H | |
| HWBOT x265 Benchmark v2.2 / 4k Preset | |
| Media Intel Core Ultra 9 275HX (30.7 - 43.8, n=29) | |
| Lenovo Legion Pro 5 16IAX10, RTX 5070 | |
| MSI Crosshair 16 HX AI D2XWGKG | |
| Aorus Elite 16 AE6H | |
| Schenker XMG Fusion 16 M25 | |
| Schenker XMG Core 16 M25 | |
| Media della classe Gaming (7.7 - 44.3, n=145, ultimi 2 anni) | |
| Asus TUF Gaming A16 FA608UP | |
| Gigabyte Gaming A16 GA6H | |
| LibreOffice / 20 Documents To PDF | |
| Asus TUF Gaming A16 FA608UP | |
| Gigabyte Gaming A16 GA6H | |
| Schenker XMG Core 16 M25 | |
| Schenker XMG Fusion 16 M25 | |
| Media della classe Gaming (19 - 88.8, n=144, ultimi 2 anni) | |
| Lenovo Legion Pro 5 16IAX10, RTX 5070 | |
| Media Intel Core Ultra 9 275HX (33.2 - 62.1, n=29) | |
| MSI Crosshair 16 HX AI D2XWGKG | |
| Aorus Elite 16 AE6H | |
| R Benchmark 2.5 / Overall mean | |
| Gigabyte Gaming A16 GA6H | |
| Asus TUF Gaming A16 FA608UP | |
| Aorus Elite 16 AE6H | |
| Media della classe Gaming (0.3551 - 0.759, n=146, ultimi 2 anni) | |
| Lenovo Legion Pro 5 16IAX10, RTX 5070 | |
| Media Intel Core Ultra 9 275HX (0.3943 - 0.4568, n=29) | |
| Schenker XMG Fusion 16 M25 | |
| MSI Crosshair 16 HX AI D2XWGKG | |
| Schenker XMG Core 16 M25 | |
* ... Meglio usare valori piccoli
AIDA64: FP32 Ray-Trace | FPU Julia | CPU SHA3 | CPU Queen | FPU SinJulia | FPU Mandel | CPU AES | CPU ZLib | FP64 Ray-Trace | CPU PhotoWorxx
| Performance rating | |
| Media Intel Core Ultra 9 275HX | |
| MSI Crosshair 16 HX AI D2XWGKG | |
| Schenker XMG Fusion 16 M25 | |
| Lenovo Legion Pro 5 16IAX10, RTX 5070 | |
| Aorus Elite 16 AE6H | |
| Schenker XMG Core 16 M25 | |
| Media della classe Gaming | |
| Asus TUF Gaming A16 FA608UP | |
| Gigabyte Gaming A16 GA6H | |
| AIDA64 / FP32 Ray-Trace | |
| Schenker XMG Core 16 M25 | |
| MSI Crosshair 16 HX AI D2XWGKG | |
| Media Intel Core Ultra 9 275HX (28039 - 39895, n=29) | |
| Schenker XMG Fusion 16 M25 | |
| Lenovo Legion Pro 5 16IAX10, RTX 5070 | |
| Aorus Elite 16 AE6H | |
| Asus TUF Gaming A16 FA608UP | |
| Media della classe Gaming (7192 - 85542, n=144, ultimi 2 anni) | |
| Gigabyte Gaming A16 GA6H | |
| AIDA64 / FPU Julia | |
| MSI Crosshair 16 HX AI D2XWGKG | |
| Media Intel Core Ultra 9 275HX (140254 - 200744, n=29) | |
| Schenker XMG Fusion 16 M25 | |
| Lenovo Legion Pro 5 16IAX10, RTX 5070 | |
| Aorus Elite 16 AE6H | |
| Schenker XMG Core 16 M25 | |
| Media della classe Gaming (35040 - 238426, n=144, ultimi 2 anni) | |
| Asus TUF Gaming A16 FA608UP | |
| Gigabyte Gaming A16 GA6H | |
| AIDA64 / CPU SHA3 | |
| Media Intel Core Ultra 9 275HX (6710 - 9817, n=29) | |
| MSI Crosshair 16 HX AI D2XWGKG | |
| Schenker XMG Fusion 16 M25 | |
| Aorus Elite 16 AE6H | |
| Lenovo Legion Pro 5 16IAX10, RTX 5070 | |
| Schenker XMG Core 16 M25 | |
| Media della classe Gaming (1728 - 9817, n=144, ultimi 2 anni) | |
| Asus TUF Gaming A16 FA608UP | |
| Gigabyte Gaming A16 GA6H | |
| AIDA64 / CPU Queen | |
| Lenovo Legion Pro 5 16IAX10, RTX 5070 | |
| Media Intel Core Ultra 9 275HX (113887 - 140937, n=29) | |
| Aorus Elite 16 AE6H | |
| MSI Crosshair 16 HX AI D2XWGKG | |
| Schenker XMG Fusion 16 M25 | |
| Asus TUF Gaming A16 FA608UP | |
| Media della classe Gaming (49785 - 173351, n=144, ultimi 2 anni) | |
| Schenker XMG Core 16 M25 | |
| Gigabyte Gaming A16 GA6H | |
| AIDA64 / FPU SinJulia | |
| Schenker XMG Core 16 M25 | |
| Asus TUF Gaming A16 FA608UP | |
| Media della classe Gaming (4424 - 33636, n=144, ultimi 2 anni) | |
| Media Intel Core Ultra 9 275HX (11172 - 14425, n=29) | |
| MSI Crosshair 16 HX AI D2XWGKG | |
| Aorus Elite 16 AE6H | |
| Schenker XMG Fusion 16 M25 | |
| Lenovo Legion Pro 5 16IAX10, RTX 5070 | |
| Gigabyte Gaming A16 GA6H | |
| AIDA64 / FPU Mandel | |
| MSI Crosshair 16 HX AI D2XWGKG | |
| Media Intel Core Ultra 9 275HX (72596 - 104508, n=29) | |
| Schenker XMG Fusion 16 M25 | |
| Lenovo Legion Pro 5 16IAX10, RTX 5070 | |
| Aorus Elite 16 AE6H | |
| Schenker XMG Core 16 M25 | |
| Media della classe Gaming (17585 - 128721, n=144, ultimi 2 anni) | |
| Asus TUF Gaming A16 FA608UP | |
| Gigabyte Gaming A16 GA6H | |
| AIDA64 / CPU AES | |
| Media Intel Core Ultra 9 275HX (105608 - 247074, n=29) | |
| MSI Crosshair 16 HX AI D2XWGKG | |
| Schenker XMG Fusion 16 M25 | |
| Schenker XMG Core 16 M25 | |
| Lenovo Legion Pro 5 16IAX10, RTX 5070 | |
| Aorus Elite 16 AE6H | |
| Media della classe Gaming (19065 - 247074, n=144, ultimi 2 anni) | |
| Asus TUF Gaming A16 FA608UP | |
| Gigabyte Gaming A16 GA6H | |
| AIDA64 / CPU ZLib | |
| Media Intel Core Ultra 9 275HX (1582 - 2263, n=29) | |
| MSI Crosshair 16 HX AI D2XWGKG | |
| Schenker XMG Fusion 16 M25 | |
| Aorus Elite 16 AE6H | |
| Lenovo Legion Pro 5 16IAX10, RTX 5070 | |
| Media della classe Gaming (373 - 2531, n=144, ultimi 2 anni) | |
| Schenker XMG Core 16 M25 | |
| Asus TUF Gaming A16 FA608UP | |
| Gigabyte Gaming A16 GA6H | |
| AIDA64 / FP64 Ray-Trace | |
| Schenker XMG Core 16 M25 | |
| MSI Crosshair 16 HX AI D2XWGKG | |
| Media Intel Core Ultra 9 275HX (14847 - 21854, n=29) | |
| Schenker XMG Fusion 16 M25 | |
| Lenovo Legion Pro 5 16IAX10, RTX 5070 | |
| Aorus Elite 16 AE6H | |
| Asus TUF Gaming A16 FA608UP | |
| Media della classe Gaming (3856 - 45446, n=144, ultimi 2 anni) | |
| Gigabyte Gaming A16 GA6H | |
| AIDA64 / CPU PhotoWorxx | |
| Lenovo Legion Pro 5 16IAX10, RTX 5070 | |
| Schenker XMG Core 16 M25 | |
| Schenker XMG Fusion 16 M25 | |
| Media Intel Core Ultra 9 275HX (37482 - 62916, n=29) | |
| Aorus Elite 16 AE6H | |
| Media della classe Gaming (10805 - 62916, n=144, ultimi 2 anni) | |
| Asus TUF Gaming A16 FA608UP | |
| MSI Crosshair 16 HX AI D2XWGKG | |
| Gigabyte Gaming A16 GA6H | |
Prestazioni del sistema
L'impressione delle prestazioni soggettive è eccellente e anche i risultati nei benchmark sintetici sono molto buoni.
PCMark 10: Score | Essentials | Productivity | Digital Content Creation
CrossMark: Overall | Productivity | Creativity | Responsiveness
WebXPRT 3: Overall
WebXPRT 4: Overall
Mozilla Kraken 1.1: Total
| Performance rating | |
| Schenker XMG Fusion 16 M25 | |
| Lenovo Legion Pro 5 16IAX10, RTX 5070 | |
| Media Intel Core Ultra 9 275HX, NVIDIA GeForce RTX 5070 Laptop | |
| Schenker XMG Core 16 M25 -4! | |
| MSI Crosshair 16 HX AI D2XWGKG | |
| Aorus Elite 16 AE6H | |
| Media della classe Gaming | |
| Gigabyte Gaming A16 GA6H | |
| Asus TUF Gaming A16 FA608UP -4! | |
| PCMark 10 / Score | |
| Schenker XMG Fusion 16 M25 | |
| Lenovo Legion Pro 5 16IAX10, RTX 5070 | |
| Media Intel Core Ultra 9 275HX, NVIDIA GeForce RTX 5070 Laptop (8018 - 9667, n=4) | |
| MSI Crosshair 16 HX AI D2XWGKG | |
| Aorus Elite 16 AE6H | |
| Media della classe Gaming (5776 - 9667, n=122, ultimi 2 anni) | |
| Gigabyte Gaming A16 GA6H | |
| PCMark 10 / Essentials | |
| Lenovo Legion Pro 5 16IAX10, RTX 5070 | |
| Aorus Elite 16 AE6H | |
| MSI Crosshair 16 HX AI D2XWGKG | |
| Media della classe Gaming (8810 - 12600, n=127, ultimi 2 anni) | |
| Media Intel Core Ultra 9 275HX, NVIDIA GeForce RTX 5070 Laptop (10259 - 11025, n=4) | |
| Schenker XMG Fusion 16 M25 | |
| Gigabyte Gaming A16 GA6H | |
| PCMark 10 / Productivity | |
| Schenker XMG Fusion 16 M25 | |
| Media Intel Core Ultra 9 275HX, NVIDIA GeForce RTX 5070 Laptop (8307 - 16716, n=4) | |
| Lenovo Legion Pro 5 16IAX10, RTX 5070 | |
| Media della classe Gaming (6662 - 16716, n=122, ultimi 2 anni) | |
| Aorus Elite 16 AE6H | |
| MSI Crosshair 16 HX AI D2XWGKG | |
| Gigabyte Gaming A16 GA6H | |
| PCMark 10 / Digital Content Creation | |
| Lenovo Legion Pro 5 16IAX10, RTX 5070 | |
| MSI Crosshair 16 HX AI D2XWGKG | |
| Media Intel Core Ultra 9 275HX, NVIDIA GeForce RTX 5070 Laptop (13010 - 16417, n=4) | |
| Schenker XMG Fusion 16 M25 | |
| Aorus Elite 16 AE6H | |
| Media della classe Gaming (7440 - 19351, n=122, ultimi 2 anni) | |
| Gigabyte Gaming A16 GA6H | |
| CrossMark / Overall | |
| Media Intel Core Ultra 9 275HX, NVIDIA GeForce RTX 5070 Laptop (2084 - 2269, n=5) | |
| Aorus Elite 16 AE6H | |
| MSI Crosshair 16 HX AI D2XWGKG | |
| Schenker XMG Fusion 16 M25 | |
| Lenovo Legion Pro 5 16IAX10, RTX 5070 | |
| Schenker XMG Core 16 M25 | |
| Media della classe Gaming (1247 - 2344, n=118, ultimi 2 anni) | |
| Gigabyte Gaming A16 GA6H | |
| Asus TUF Gaming A16 FA608UP | |
| CrossMark / Productivity | |
| Aorus Elite 16 AE6H | |
| Media Intel Core Ultra 9 275HX, NVIDIA GeForce RTX 5070 Laptop (1931 - 2173, n=5) | |
| MSI Crosshair 16 HX AI D2XWGKG | |
| Schenker XMG Fusion 16 M25 | |
| Lenovo Legion Pro 5 16IAX10, RTX 5070 | |
| Media della classe Gaming (1299 - 2211, n=118, ultimi 2 anni) | |
| Schenker XMG Core 16 M25 | |
| Gigabyte Gaming A16 GA6H | |
| Asus TUF Gaming A16 FA608UP | |
| CrossMark / Creativity | |
| Schenker XMG Core 16 M25 | |
| Schenker XMG Fusion 16 M25 | |
| Media Intel Core Ultra 9 275HX, NVIDIA GeForce RTX 5070 Laptop (2322 - 2430, n=5) | |
| MSI Crosshair 16 HX AI D2XWGKG | |
| Aorus Elite 16 AE6H | |
| Lenovo Legion Pro 5 16IAX10, RTX 5070 | |
| Media della classe Gaming (1275 - 2729, n=118, ultimi 2 anni) | |
| Asus TUF Gaming A16 FA608UP | |
| Gigabyte Gaming A16 GA6H | |
| CrossMark / Responsiveness | |
| Aorus Elite 16 AE6H | |
| Media Intel Core Ultra 9 275HX, NVIDIA GeForce RTX 5070 Laptop (1754 - 2143, n=5) | |
| Gigabyte Gaming A16 GA6H | |
| MSI Crosshair 16 HX AI D2XWGKG | |
| Schenker XMG Fusion 16 M25 | |
| Lenovo Legion Pro 5 16IAX10, RTX 5070 | |
| Media della classe Gaming (1030 - 2330, n=118, ultimi 2 anni) | |
| Schenker XMG Core 16 M25 | |
| Asus TUF Gaming A16 FA608UP | |
| WebXPRT 3 / Overall | |
| Schenker XMG Core 16 M25 | |
| Schenker XMG Fusion 16 M25 | |
| Lenovo Legion Pro 5 16IAX10, RTX 5070 | |
| Media Intel Core Ultra 9 275HX, NVIDIA GeForce RTX 5070 Laptop (309 - 364, n=5) | |
| MSI Crosshair 16 HX AI D2XWGKG | |
| Media della classe Gaming (237 - 532, n=123, ultimi 2 anni) | |
| Aorus Elite 16 AE6H | |
| Asus TUF Gaming A16 FA608UP | |
| Gigabyte Gaming A16 GA6H | |
| WebXPRT 4 / Overall | |
| Schenker XMG Core 16 M25 | |
| Aorus Elite 16 AE6H | |
| Lenovo Legion Pro 5 16IAX10, RTX 5070 | |
| Media Intel Core Ultra 9 275HX, NVIDIA GeForce RTX 5070 Laptop (297 - 330, n=5) | |
| MSI Crosshair 16 HX AI D2XWGKG | |
| Schenker XMG Fusion 16 M25 | |
| Media della classe Gaming (176.4 - 345, n=118, ultimi 2 anni) | |
| Gigabyte Gaming A16 GA6H | |
| Asus TUF Gaming A16 FA608UP | |
| Mozilla Kraken 1.1 / Total | |
| Asus TUF Gaming A16 FA608UP | |
| Gigabyte Gaming A16 GA6H | |
| Media della classe Gaming (397 - 674, n=132, ultimi 2 anni) | |
| Lenovo Legion Pro 5 16IAX10, RTX 5070 | |
| Schenker XMG Fusion 16 M25 | |
| Aorus Elite 16 AE6H | |
| Media Intel Core Ultra 9 275HX, NVIDIA GeForce RTX 5070 Laptop (407 - 431, n=5) | |
| Schenker XMG Core 16 M25 | |
| MSI Crosshair 16 HX AI D2XWGKG | |
* ... Meglio usare valori piccoli
| PCMark 10 Score | 9667 punti | |
Aiuto | ||
| AIDA64 / Memory Copy | |
| Lenovo Legion Pro 5 16IAX10, RTX 5070 | |
| Schenker XMG Fusion 16 M25 | |
| Media Intel Core Ultra 9 275HX (56003 - 94460, n=29) | |
| Aorus Elite 16 AE6H | |
| Schenker XMG Core 16 M25 | |
| Media della classe Gaming (21750 - 108104, n=144, ultimi 2 anni) | |
| MSI Crosshair 16 HX AI D2XWGKG | |
| Asus TUF Gaming A16 FA608UP | |
| Gigabyte Gaming A16 GA6H | |
| AIDA64 / Memory Read | |
| Lenovo Legion Pro 5 16IAX10, RTX 5070 | |
| Schenker XMG Fusion 16 M25 | |
| Aorus Elite 16 AE6H | |
| Media Intel Core Ultra 9 275HX (55795 - 97151, n=29) | |
| Schenker XMG Core 16 M25 | |
| MSI Crosshair 16 HX AI D2XWGKG | |
| Media della classe Gaming (22956 - 104349, n=144, ultimi 2 anni) | |
| Asus TUF Gaming A16 FA608UP | |
| Gigabyte Gaming A16 GA6H | |
| AIDA64 / Memory Write | |
| Aorus Elite 16 AE6H | |
| Asus TUF Gaming A16 FA608UP | |
| Lenovo Legion Pro 5 16IAX10, RTX 5070 | |
| Schenker XMG Fusion 16 M25 | |
| Schenker XMG Core 16 M25 | |
| Media Intel Core Ultra 9 275HX (55663 - 116129, n=29) | |
| Media della classe Gaming (22297 - 133486, n=144, ultimi 2 anni) | |
| MSI Crosshair 16 HX AI D2XWGKG | |
| Gigabyte Gaming A16 GA6H | |
| AIDA64 / Memory Latency | |
| Media Intel Core Ultra 9 275HX (105.8 - 161.6, n=29) | |
| Aorus Elite 16 AE6H | |
| MSI Crosshair 16 HX AI D2XWGKG | |
| Schenker XMG Fusion 16 M25 | |
| Lenovo Legion Pro 5 16IAX10, RTX 5070 | |
| Gigabyte Gaming A16 GA6H | |
| Media della classe Gaming (59.5 - 259, n=144, ultimi 2 anni) | |
| Asus TUF Gaming A16 FA608UP | |
| Schenker XMG Core 16 M25 | |
* ... Meglio usare valori piccoli
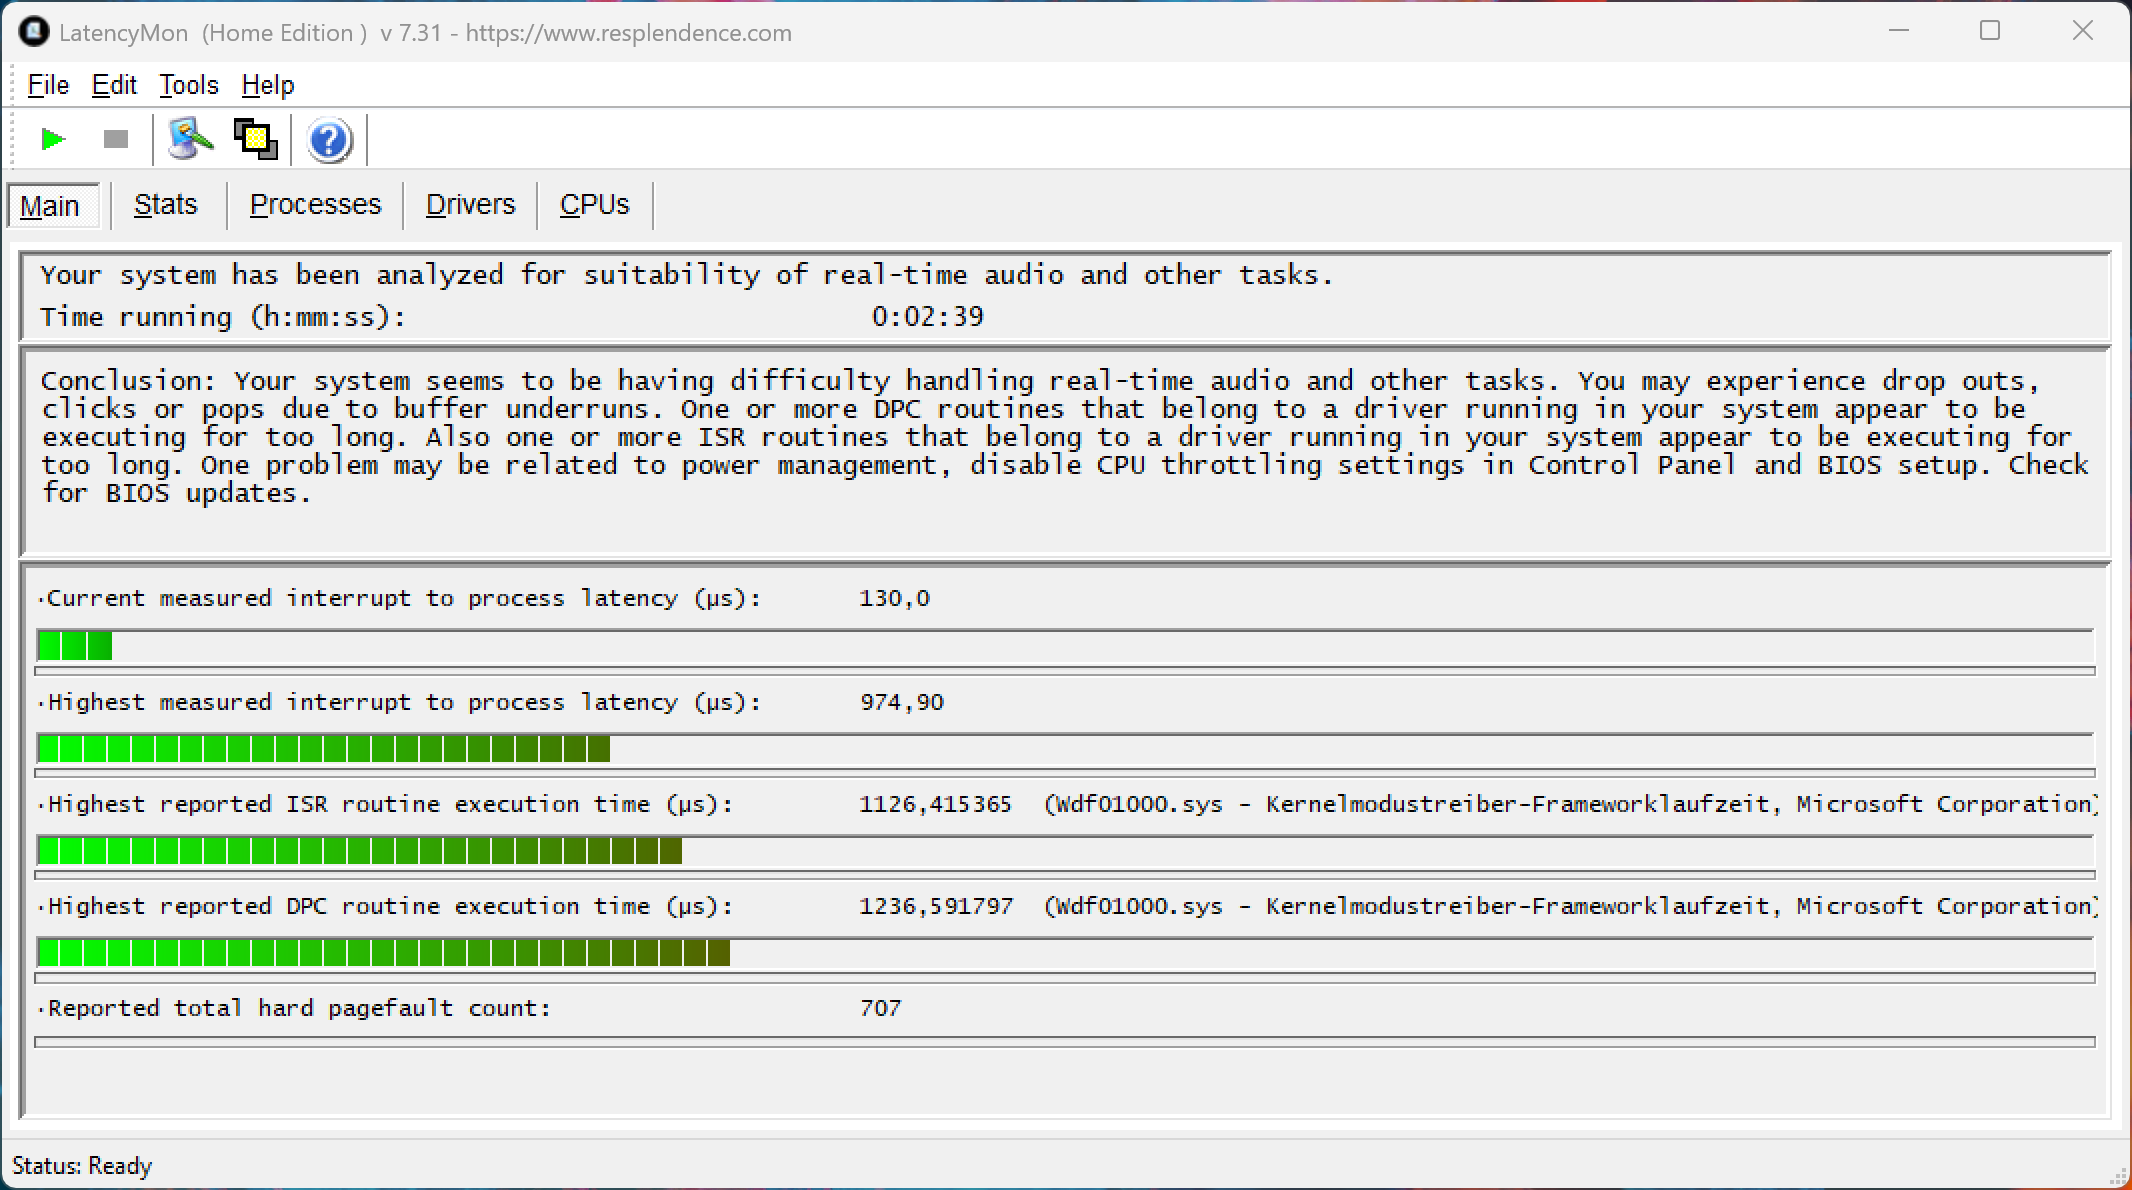
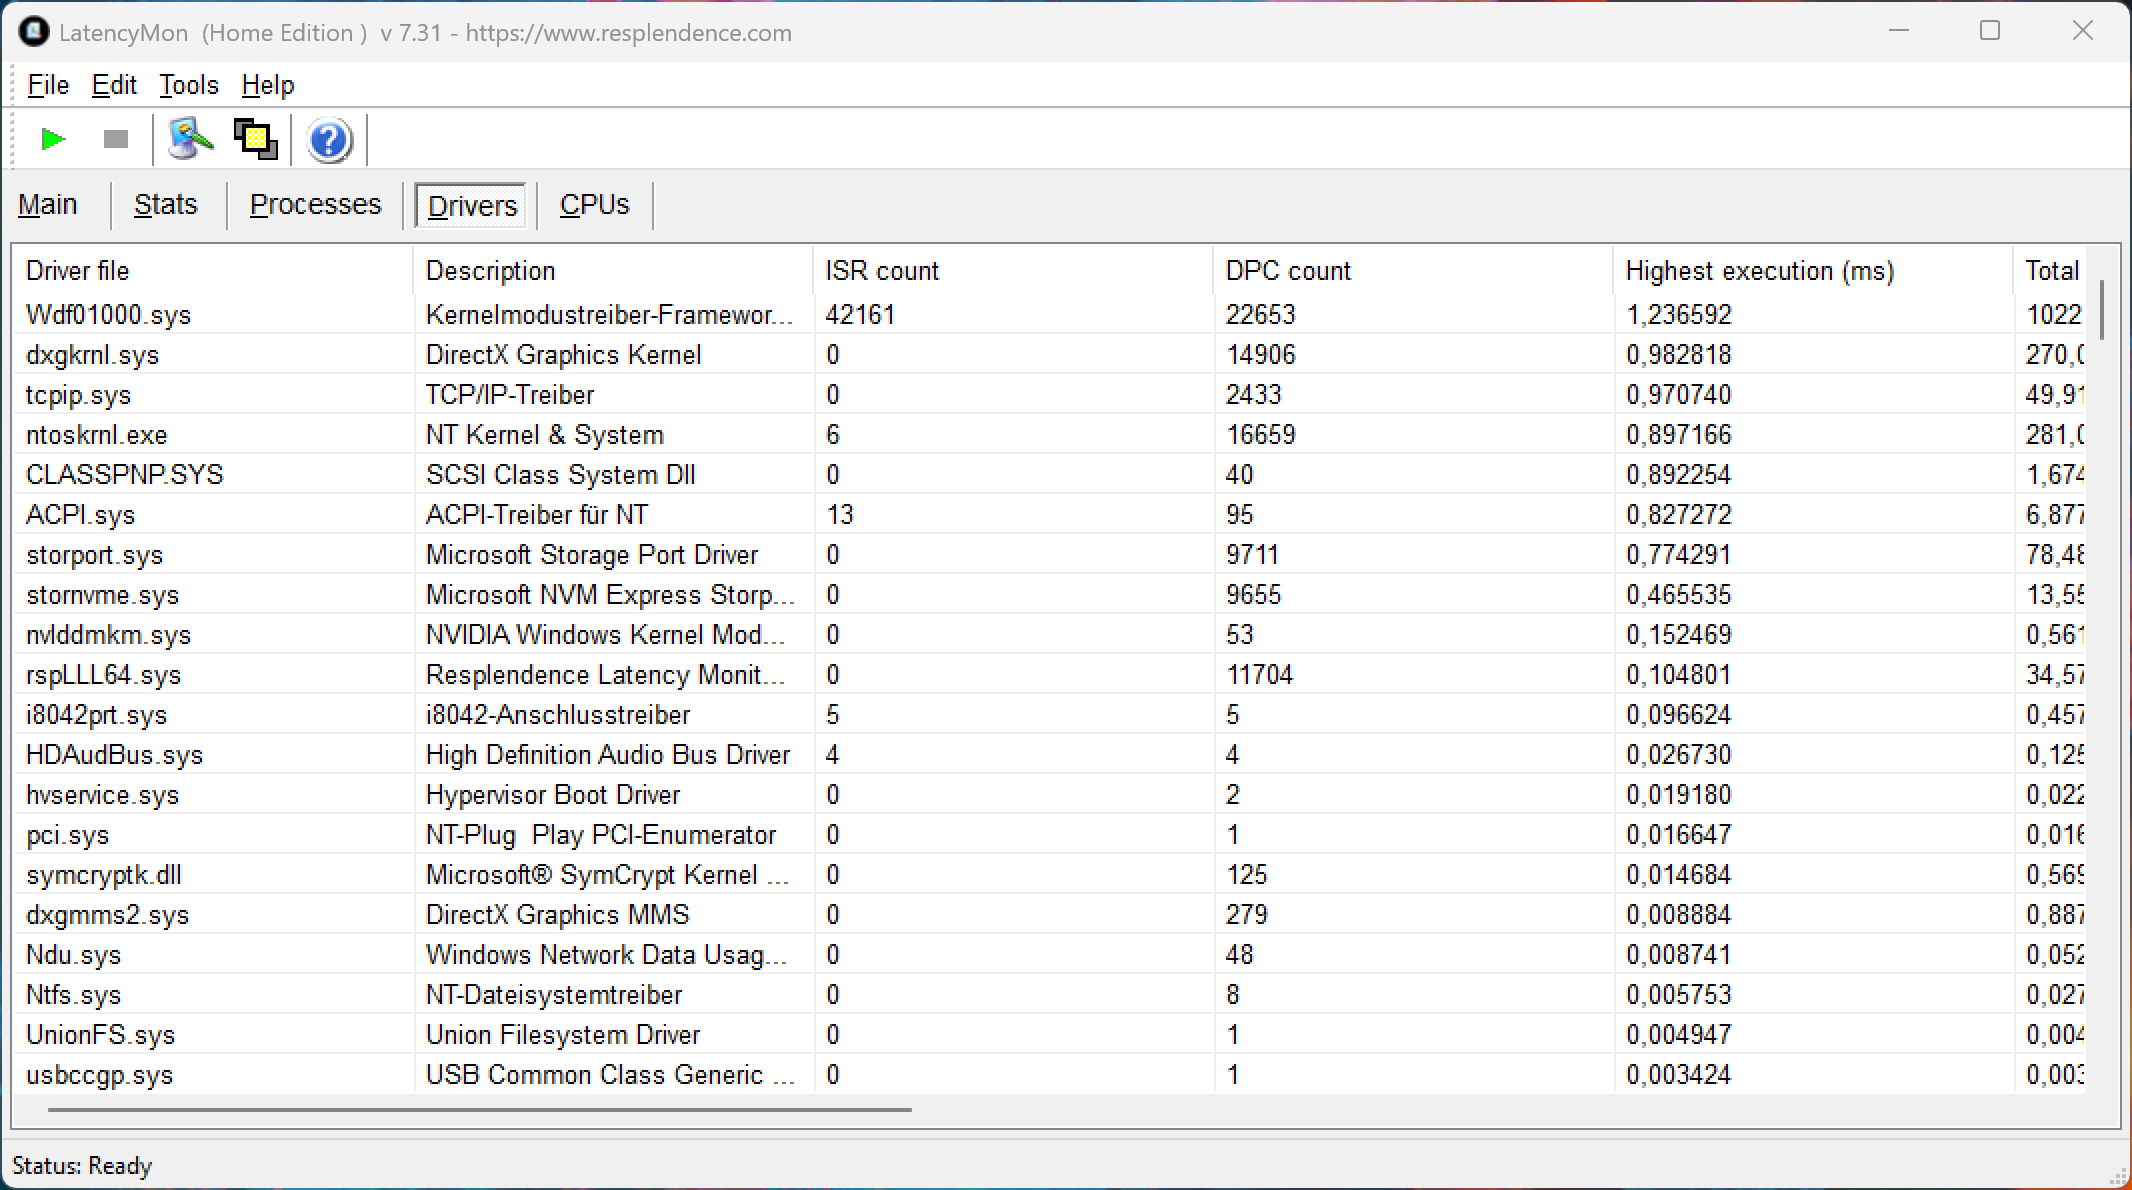
Latenze DPC
Nel nostro test di latenza standardizzato, l'unità di recensione con l'attuale versione del BIOS mostra limitazioni minori quando si utilizzano applicazioni audio in tempo reale.
| DPC Latencies / LatencyMon - interrupt to process latency (max), Web, Youtube, Prime95 | |
| Gigabyte Gaming A16 GA6H | |
| MSI Crosshair 16 HX AI D2XWGKG | |
| Schenker XMG Fusion 16 M25 | |
| Aorus Elite 16 AE6H | |
| Lenovo Legion Pro 5 16IAX10, RTX 5070 | |
| Schenker XMG Core 16 M25 | |
| Asus TUF Gaming A16 FA608UP | |
* ... Meglio usare valori piccoli
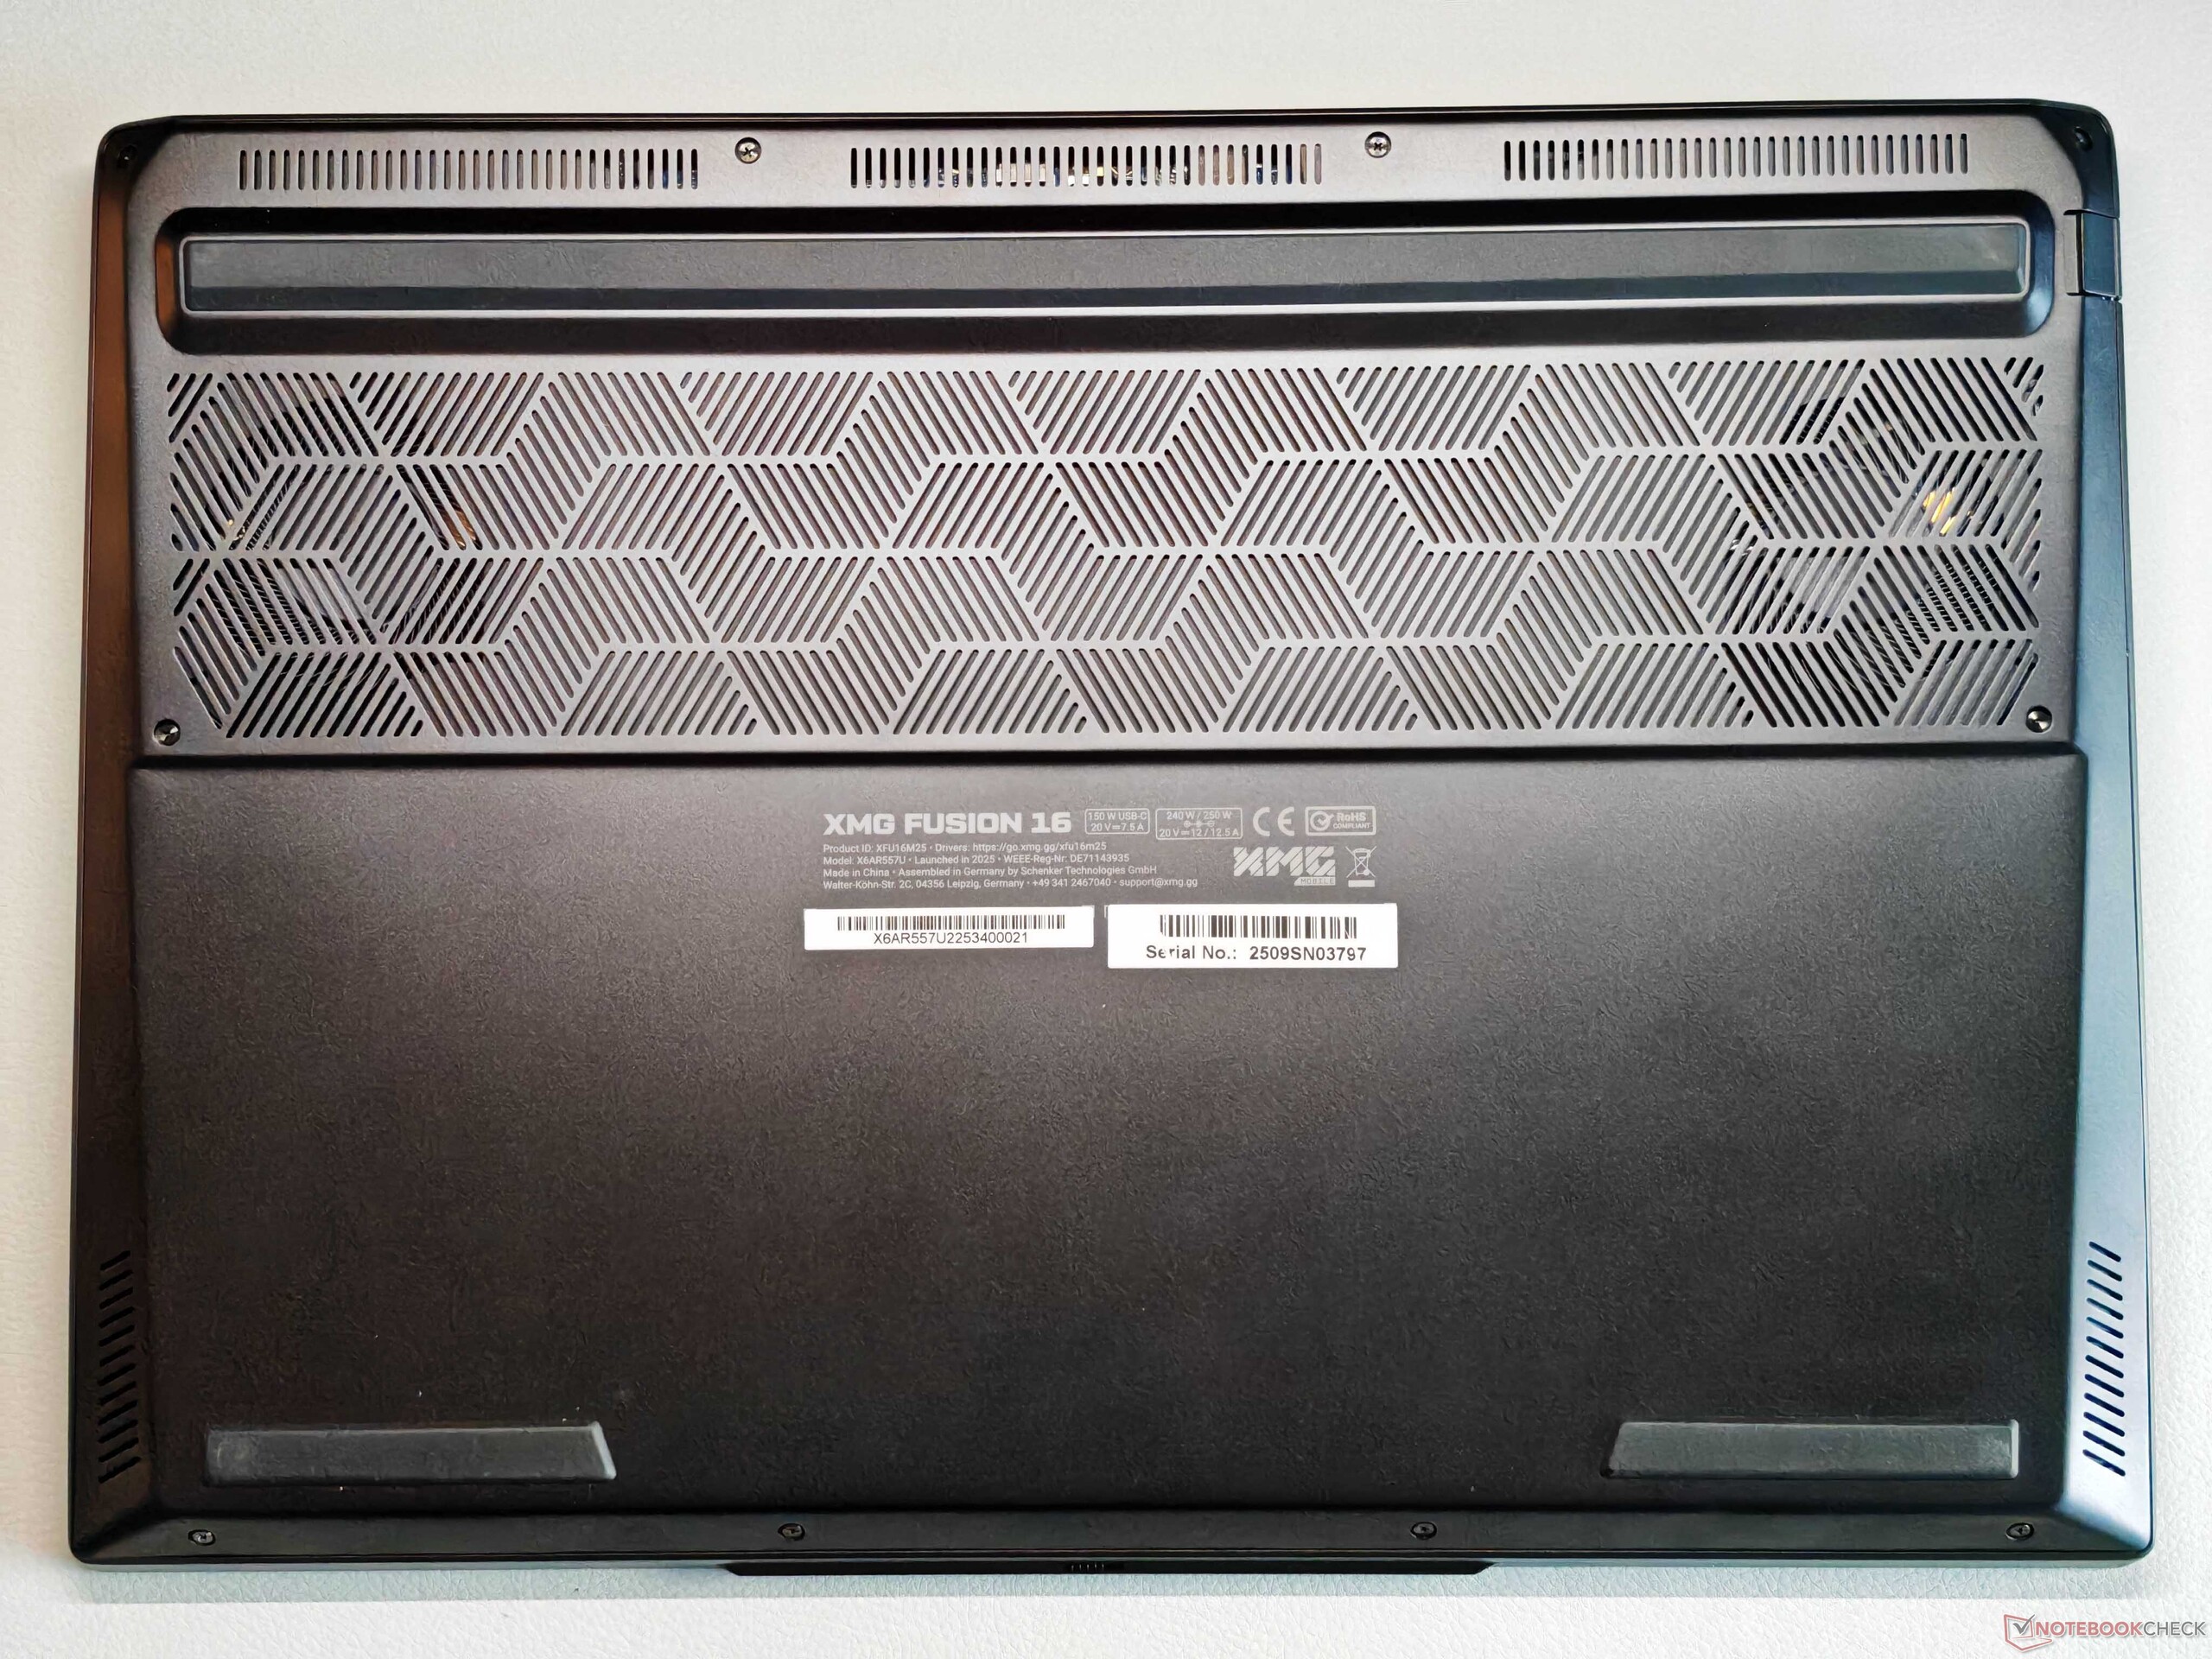
Dispositivi di archiviazione
Fusion 16 supporta PCIe 5.0 e la nostra unità di prova è dotata di un SSD Samsung 9100 Pro da 2 TB (1,73 TB liberi). Le prestazioni sono molto buone e rimangono stabili anche sotto carico sostenuto.

* ... Meglio usare valori piccoli
Strozzatura del disco: DiskSpd Lettura in loop, Profondità coda 8
Prestazioni della GPU
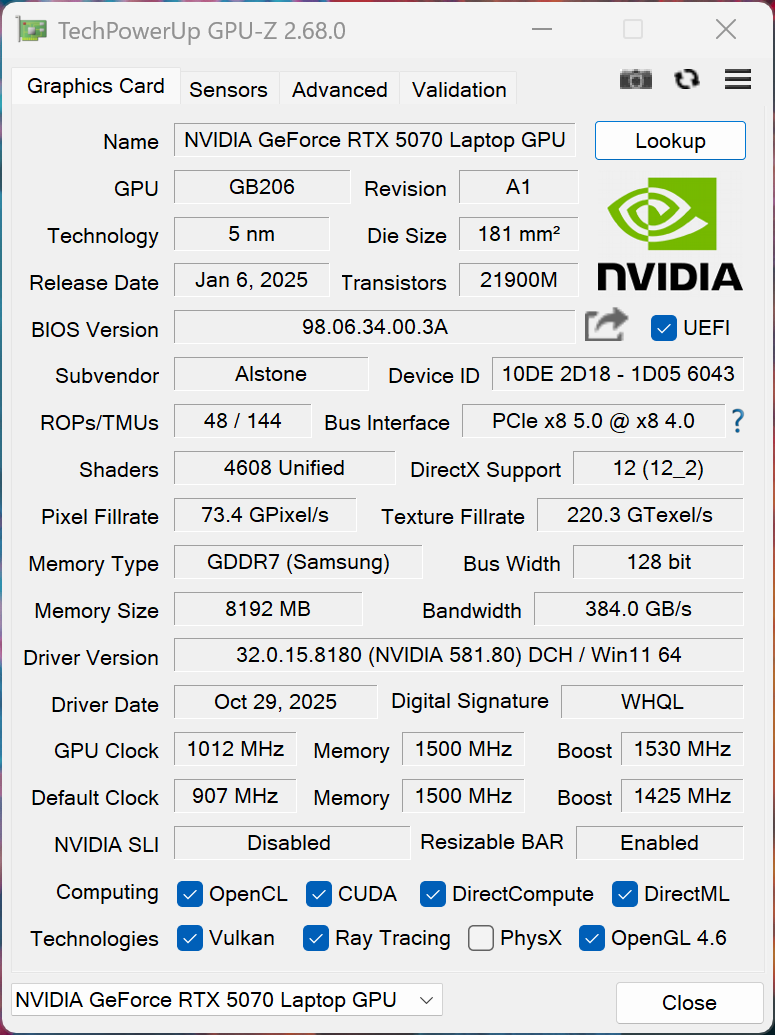
Come per il Core 16, la versione più veloce del laptop con RTX 5070 per computer portatili È installata (115 watt) e le prestazioni sono in linea con le aspettative. Tuttavia, il Core Ultra 9 275HX, più veloce, non offre un grande vantaggio rispetto al processore AMD del Core 16. Tutti i giochi moderni girano bene con impostazioni ragionevoli, anche se gli 8 GB di VRX non sono sufficienti. Tutti i giochi moderni funzionano senza problemi a impostazioni ragionevoli, anche se gli 8 GB di VRAM possono diventare un limite alle risoluzioni più elevate (ulteriori dettagli sono disponibili qui http://www.notebookcheck.net/Is-8-GB-VRAM-enough-for-modern-games-We-tested-it.1180853.0.html). Quando funziona a batteria, la GPU è limitata a un massimo di 50 watt, circa il 50% di potenza in meno.
| 3DMark 11 Performance | 37410 punti | |
| 3DMark Fire Strike Score | 28680 punti | |
| 3DMark Time Spy Score | 13439 punti | |
| 3DMark Steel Nomad Score | 3075 punti | |
| 3DMark Steel Nomad Light Score | 13426 punti | |
Aiuto | ||
| Blender / v3.3 Classroom OPTIX/RTX | |
| Schenker XMG Core 16 M25 | |
| Gigabyte Gaming A16 GA6H | |
| MSI Crosshair 16 HX AI D2XWGKG | |
| Asus TUF Gaming A16 FA608UP | |
| Schenker XMG Fusion 16 M25 | |
| Media NVIDIA GeForce RTX 5070 Laptop (17 - 24, n=23) | |
| Media della classe Gaming (9 - 95, n=141, ultimi 2 anni) | |
| Aorus Elite 16 AE6H | |
| Lenovo Legion Pro 5 16IAX10, RTX 5070 | |
| Blender / v3.3 Classroom CUDA | |
| Media NVIDIA GeForce RTX 5070 Laptop (29 - 228, n=24) | |
| Schenker XMG Core 16 M25 | |
| Schenker XMG Fusion 16 M25 | |
| Gigabyte Gaming A16 GA6H | |
| Asus TUF Gaming A16 FA608UP | |
| Media della classe Gaming (15 - 228, n=145, ultimi 2 anni) | |
| Aorus Elite 16 AE6H | |
| MSI Crosshair 16 HX AI D2XWGKG | |
| Lenovo Legion Pro 5 16IAX10, RTX 5070 | |
| Blender / v3.3 Classroom CPU | |
| Gigabyte Gaming A16 GA6H | |
| Asus TUF Gaming A16 FA608UP | |
| Media della classe Gaming (122 - 962, n=142, ultimi 2 anni) | |
| Media NVIDIA GeForce RTX 5070 Laptop (137 - 507, n=21) | |
| Schenker XMG Core 16 M25 | |
| Lenovo Legion Pro 5 16IAX10, RTX 5070 | |
| MSI Crosshair 16 HX AI D2XWGKG | |
| Schenker XMG Fusion 16 M25 | |
* ... Meglio usare valori piccoli

Cyberpunk 2077 grafico FPS ultra
| basso | medio | alto | ultra | QHD | |
|---|---|---|---|---|---|
| GTA V (2015) | 143.7 | 124.5 | |||
| Dota 2 Reborn (2015) | 211 | 185.7 | 177 | 164.3 | |
| Final Fantasy XV Benchmark (2018) | 231 | 179.7 | 136.2 | 97.4 | |
| X-Plane 11.11 (2018) | 142.4 | 117.4 | 99.3 | ||
| Strange Brigade (2018) | 519 | 335 | 278 | 242 | 165.7 |
| Baldur's Gate 3 (2023) | 179.1 | 142.7 | 123.4 | 121 | 84.1 |
| Cyberpunk 2077 (2023) | 164.9 | 137.6 | 115.3 | 103.8 | 65.2 |
| F1 24 (2024) | 296 | 291 | 241 | 86.4 | 55.2 |
| F1 25 (2025) | 243 | 218 | 172.3 | 27.7 | 15.5 |
| Call of Duty Black Ops 7 (2025) | 224 | 152 | 117 | 44 | 28 |
Emissioni
Rumore del sistema
Le ventole rimangono molto silenziose durante l'uso quotidiano e Fusion 16 è anche più silenzioso della maggior parte dei concorrenti, raggiungendo un massimo di 49,7 dB(A) durante il gioco. Non sono stati rilevati altri rumori elettronici.
Rumorosità
| Idle |
| 25.7 / 25.7 / 28 dB(A) |
| Sotto carico |
| 38.9 / 49.7 dB(A) |
 | ||
30 dB silenzioso 40 dB(A) udibile 50 dB(A) rumoroso |
||
min: | ||
| Schenker XMG Fusion 16 M25 Ultra 9 275HX, GeForce RTX 5070 Laptop | Lenovo Legion Pro 5 16IAX10, RTX 5070 Ultra 7 255HX, GeForce RTX 5070 Laptop | Schenker XMG Core 16 M25 Ryzen AI 9 HX 370, GeForce RTX 5070 Laptop | Asus TUF Gaming A16 FA608UP R7 260, GeForce RTX 5070 Laptop | MSI Crosshair 16 HX AI D2XWGKG Ultra 9 275HX, GeForce RTX 5070 Laptop | Aorus Elite 16 AE6H Ultra 9 275HX, GeForce RTX 5070 Laptop | Gigabyte Gaming A16 GA6H i7-13620H, GeForce RTX 5070 Laptop | |
|---|---|---|---|---|---|---|---|
| Noise | 4% | 2% | -12% | -12% | -16% | -7% | |
| off /ambiente * (dB) | 25.7 | 23 11% | 24.8 4% | 25.1 2% | 25.56 1% | 24 7% | 24 7% |
| Idle Minimum * (dB) | 25.7 | 23 11% | 24.8 4% | 32.2 -25% | 28.3 -10% | 25 3% | 25 3% |
| Idle Average * (dB) | 25.7 | 23 11% | 24.8 4% | 32.2 -25% | 28.3 -10% | 29 -13% | 26 -1% |
| Idle Maximum * (dB) | 28 | 23 18% | 27.1 3% | 32.2 -15% | 28.3 -1% | 32 -14% | 27 4% |
| Load Average * (dB) | 38.9 | 43.85 -13% | 40.2 -3% | 38.1 2% | 50.26 -29% | 60 -54% | 54 -39% |
| Cyberpunk 2077 ultra * (dB) | 49.7 | 50.27 -1% | 49.2 1% | 53.9 -8% | 57.8 -16% | 59 -19% | 54 -9% |
| Load Maximum * (dB) | 49.7 | 52.9 -6% | 49.2 1% | 57.1 -15% | 57.95 -17% | 61 -23% | 55 -11% |
* ... Meglio usare valori piccoli
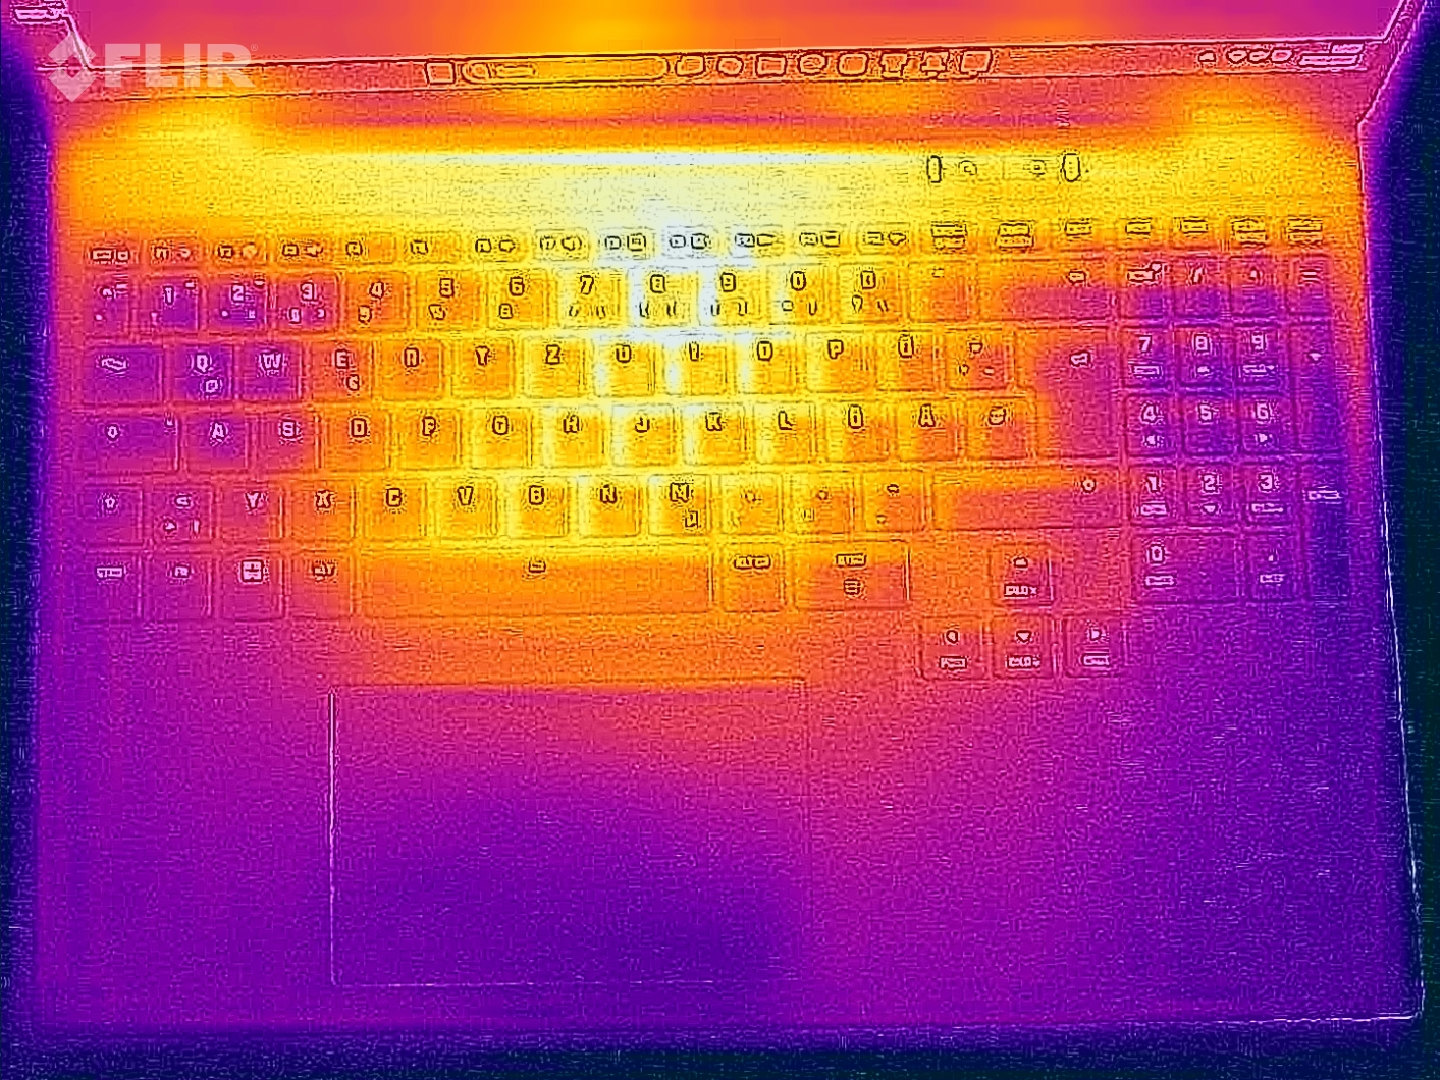
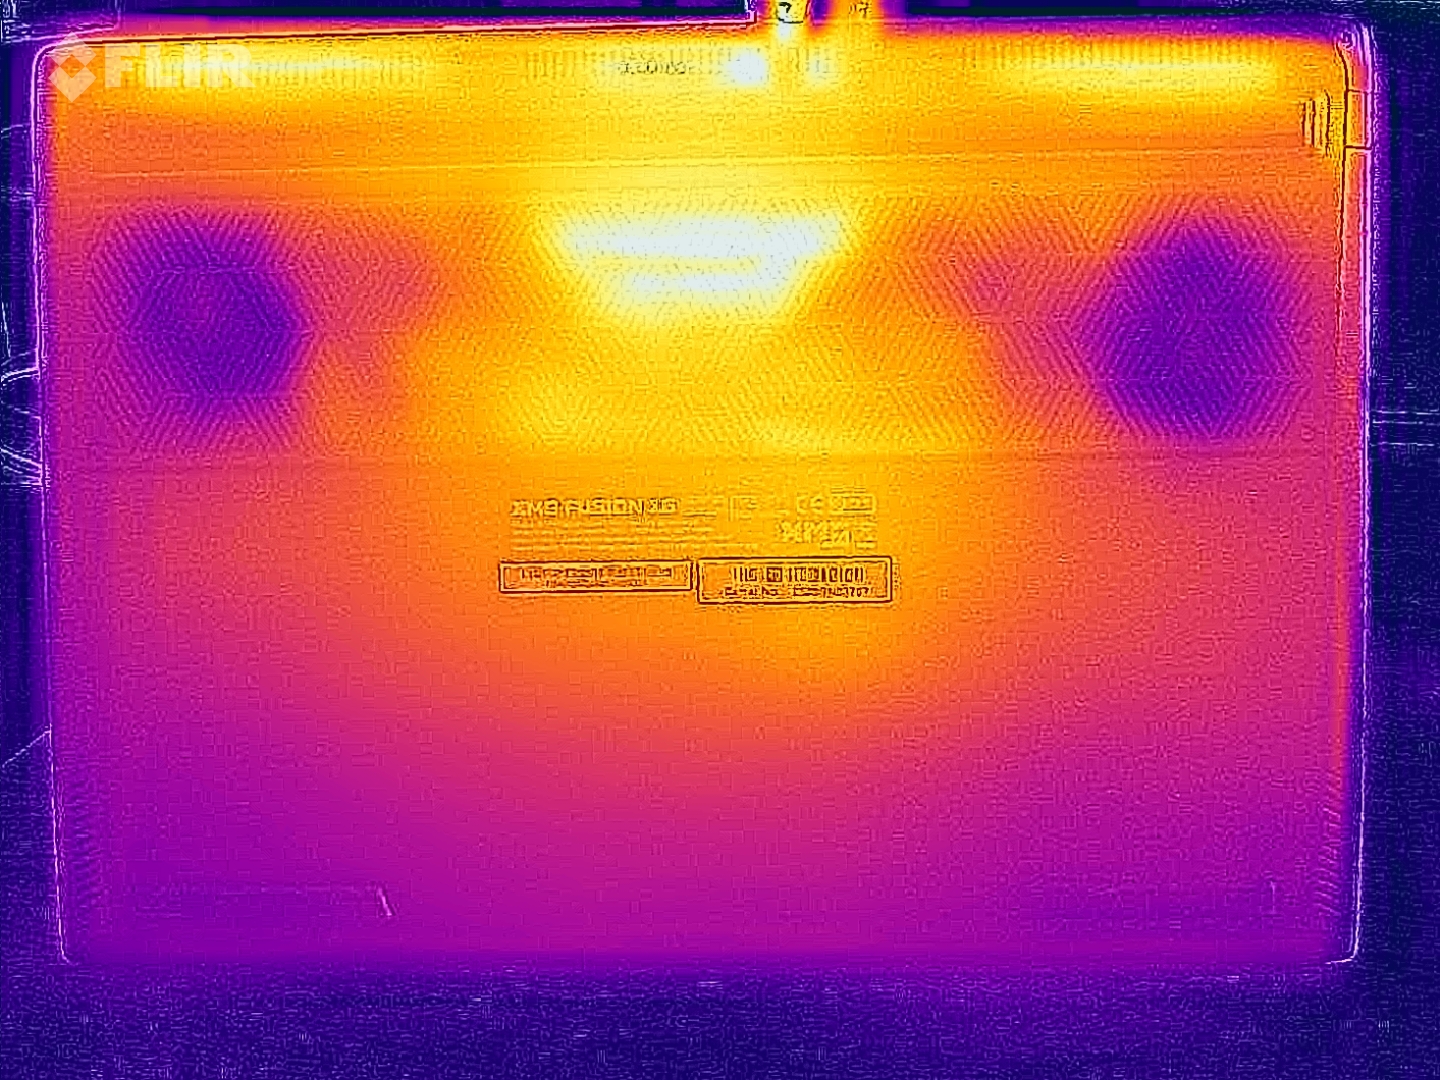
Temperatura
Fusion 16 rimane discreto in termini di temperature, e un massimo di 48 °C sul lato inferiore non è critico durante il gioco.

(±) La temperatura massima sul lato superiore è di 43.2 °C / 110 F, rispetto alla media di 40.4 °C / 105 F, che varia da 21.2 a 68.8 °C per questa classe Gaming.
(-) Il lato inferiore si riscalda fino ad un massimo di 48 °C / 118 F, rispetto alla media di 43.3 °C / 110 F
(+) In idle, la temperatura media del lato superiore è di 25.8 °C / 78 F, rispetto alla media deld ispositivo di 33.9 °C / 93 F.
(±) 3: The average temperature for the upper side is 36.6 °C / 98 F, compared to the average of 33.9 °C / 93 F for the class Gaming.
(+) I poggiapolsi e il touchpad sono piu' freddi della temperatura della pelle con un massimo di 31.4 °C / 88.5 F e sono quindi freddi al tatto.
(-) La temperatura media della zona del palmo della mano di dispositivi simili e'stata di 28.8 °C / 83.8 F (-2.6 °C / -4.7 F).
| Schenker XMG Fusion 16 M25 Ultra 9 275HX, GeForce RTX 5070 Laptop | Lenovo Legion Pro 5 16IAX10, RTX 5070 Ultra 7 255HX, GeForce RTX 5070 Laptop | Schenker XMG Core 16 M25 Ryzen AI 9 HX 370, GeForce RTX 5070 Laptop | Asus TUF Gaming A16 FA608UP R7 260, GeForce RTX 5070 Laptop | MSI Crosshair 16 HX AI D2XWGKG Ultra 9 275HX, GeForce RTX 5070 Laptop | Aorus Elite 16 AE6H Ultra 9 275HX, GeForce RTX 5070 Laptop | Gigabyte Gaming A16 GA6H i7-13620H, GeForce RTX 5070 Laptop | |
|---|---|---|---|---|---|---|---|
| Heat | -9% | -11% | 7% | -4% | -13% | -18% | |
| Maximum Upper Side * (°C) | 43.2 | 42 3% | 46.7 -8% | 39.5 9% | 44.8 -4% | 41 5% | 50 -16% |
| Maximum Bottom * (°C) | 48 | 44 8% | 58.5 -22% | 45.1 6% | 43.4 10% | 45 6% | 49 -2% |
| Idle Upper Side * (°C) | 26.6 | 33 -24% | 28.3 -6% | 25.7 3% | 31.2 -17% | 35 -32% | 35 -32% |
| Idle Bottom * (°C) | 27.6 | 34 -23% | 29.9 -8% | 25.5 8% | 28.8 -4% | 36 -30% | 34 -23% |
* ... Meglio usare valori piccoli
Altoparlanti
Schenker XMG Fusion 16 M25 analisi audio
(+) | gli altoparlanti sono relativamente potenti (85.1 dB)
Bassi 100 - 315 Hz
(-) | quasi nessun basso - in media 17.9% inferiori alla media
(±) | la linearità dei bassi è media (10.5% delta rispetto alla precedente frequenza)
Medi 400 - 2000 Hz
(±) | medi elevati - circa 5.7% superiore alla media
(+) | medi lineari (4.6% delta rispetto alla precedente frequenza)
Alti 2 - 16 kHz
(+) | Alti bilanciati - appena 3.1% dalla media
(+) | alti lineari (4.8% delta rispetto alla precedente frequenza)
Nel complesso 100 - 16.000 Hz
(+) | suono nel complesso lineare (14.8% differenza dalla media)
Rispetto alla stessa classe
» 29% di tutti i dispositivi testati in questa classe è stato migliore, 7% simile, 64% peggiore
» Il migliore ha avuto un delta di 6%, medio di 18%, peggiore di 132%
Rispetto a tutti i dispositivi testati
» 19% di tutti i dispositivi testati in questa classe è stato migliore, 4% similare, 77% peggiore
» Il migliore ha avuto un delta di 4%, medio di 24%, peggiore di 134%
Lenovo Legion Pro 5 16IAX10, RTX 5070 analisi audio
(±) | potenza degli altiparlanti media ma buona (75.73 dB)
Bassi 100 - 315 Hz
(-) | quasi nessun basso - in media 20% inferiori alla media
(±) | la linearità dei bassi è media (9.3% delta rispetto alla precedente frequenza)
Medi 400 - 2000 Hz
(±) | medi elevati - circa 6.1% superiore alla media
(±) | linearità dei medi adeguata (7.9% delta rispetto alla precedente frequenza)
Alti 2 - 16 kHz
(+) | Alti bilanciati - appena 2.2% dalla media
(+) | alti lineari (6.3% delta rispetto alla precedente frequenza)
Nel complesso 100 - 16.000 Hz
(±) | la linearità complessiva del suono è media (19.4% di differenza rispetto alla media
Rispetto alla stessa classe
» 66% di tutti i dispositivi testati in questa classe è stato migliore, 7% simile, 26% peggiore
» Il migliore ha avuto un delta di 6%, medio di 18%, peggiore di 132%
Rispetto a tutti i dispositivi testati
» 47% di tutti i dispositivi testati in questa classe è stato migliore, 7% similare, 46% peggiore
» Il migliore ha avuto un delta di 4%, medio di 24%, peggiore di 134%
Asus TUF Gaming A16 FA608UP analisi audio
(±) | potenza degli altiparlanti media ma buona (80.2 dB)
Bassi 100 - 315 Hz
(±) | bassi ridotti - in media 11.8% inferiori alla media
(±) | la linearità dei bassi è media (8.7% delta rispetto alla precedente frequenza)
Medi 400 - 2000 Hz
(+) | medi bilanciati - solo only 3% rispetto alla media
(+) | medi lineari (3% delta rispetto alla precedente frequenza)
Alti 2 - 16 kHz
(+) | Alti bilanciati - appena 4.4% dalla media
(±) | la linearità degli alti è media (7.4% delta rispetto alla precedente frequenza)
Nel complesso 100 - 16.000 Hz
(+) | suono nel complesso lineare (12.6% differenza dalla media)
Rispetto alla stessa classe
» 15% di tutti i dispositivi testati in questa classe è stato migliore, 3% simile, 81% peggiore
» Il migliore ha avuto un delta di 6%, medio di 18%, peggiore di 132%
Rispetto a tutti i dispositivi testati
» 11% di tutti i dispositivi testati in questa classe è stato migliore, 2% similare, 87% peggiore
» Il migliore ha avuto un delta di 4%, medio di 24%, peggiore di 134%
MSI Crosshair 16 HX AI D2XWGKG analisi audio
(±) | potenza degli altiparlanti media ma buona (81.5 dB)
Bassi 100 - 315 Hz
(-) | quasi nessun basso - in media 15.6% inferiori alla media
(±) | la linearità dei bassi è media (10.5% delta rispetto alla precedente frequenza)
Medi 400 - 2000 Hz
(±) | medi elevati - circa 6.6% superiore alla media
(±) | linearità dei medi adeguata (7.1% delta rispetto alla precedente frequenza)
Alti 2 - 16 kHz
(+) | Alti bilanciati - appena 1.6% dalla media
(+) | alti lineari (5.8% delta rispetto alla precedente frequenza)
Nel complesso 100 - 16.000 Hz
(+) | suono nel complesso lineare (14.7% differenza dalla media)
Rispetto alla stessa classe
» 28% di tutti i dispositivi testati in questa classe è stato migliore, 7% simile, 64% peggiore
» Il migliore ha avuto un delta di 6%, medio di 18%, peggiore di 132%
Rispetto a tutti i dispositivi testati
» 19% di tutti i dispositivi testati in questa classe è stato migliore, 4% similare, 77% peggiore
» Il migliore ha avuto un delta di 4%, medio di 24%, peggiore di 134%
Aorus Elite 16 AE6H analisi audio
(+) | gli altoparlanti sono relativamente potenti (87 dB)
Bassi 100 - 315 Hz
(±) | bassi ridotti - in media 10.8% inferiori alla media
(±) | la linearità dei bassi è media (7.5% delta rispetto alla precedente frequenza)
Medi 400 - 2000 Hz
(+) | medi bilanciati - solo only 2.1% rispetto alla media
(+) | medi lineari (4.8% delta rispetto alla precedente frequenza)
Alti 2 - 16 kHz
(+) | Alti bilanciati - appena 2.5% dalla media
(+) | alti lineari (4.3% delta rispetto alla precedente frequenza)
Nel complesso 100 - 16.000 Hz
(+) | suono nel complesso lineare (8.1% differenza dalla media)
Rispetto alla stessa classe
» 1% di tutti i dispositivi testati in questa classe è stato migliore, 1% simile, 98% peggiore
» Il migliore ha avuto un delta di 6%, medio di 18%, peggiore di 132%
Rispetto a tutti i dispositivi testati
» 1% di tutti i dispositivi testati in questa classe è stato migliore, 1% similare, 98% peggiore
» Il migliore ha avuto un delta di 4%, medio di 24%, peggiore di 134%
Gestione dell'energia
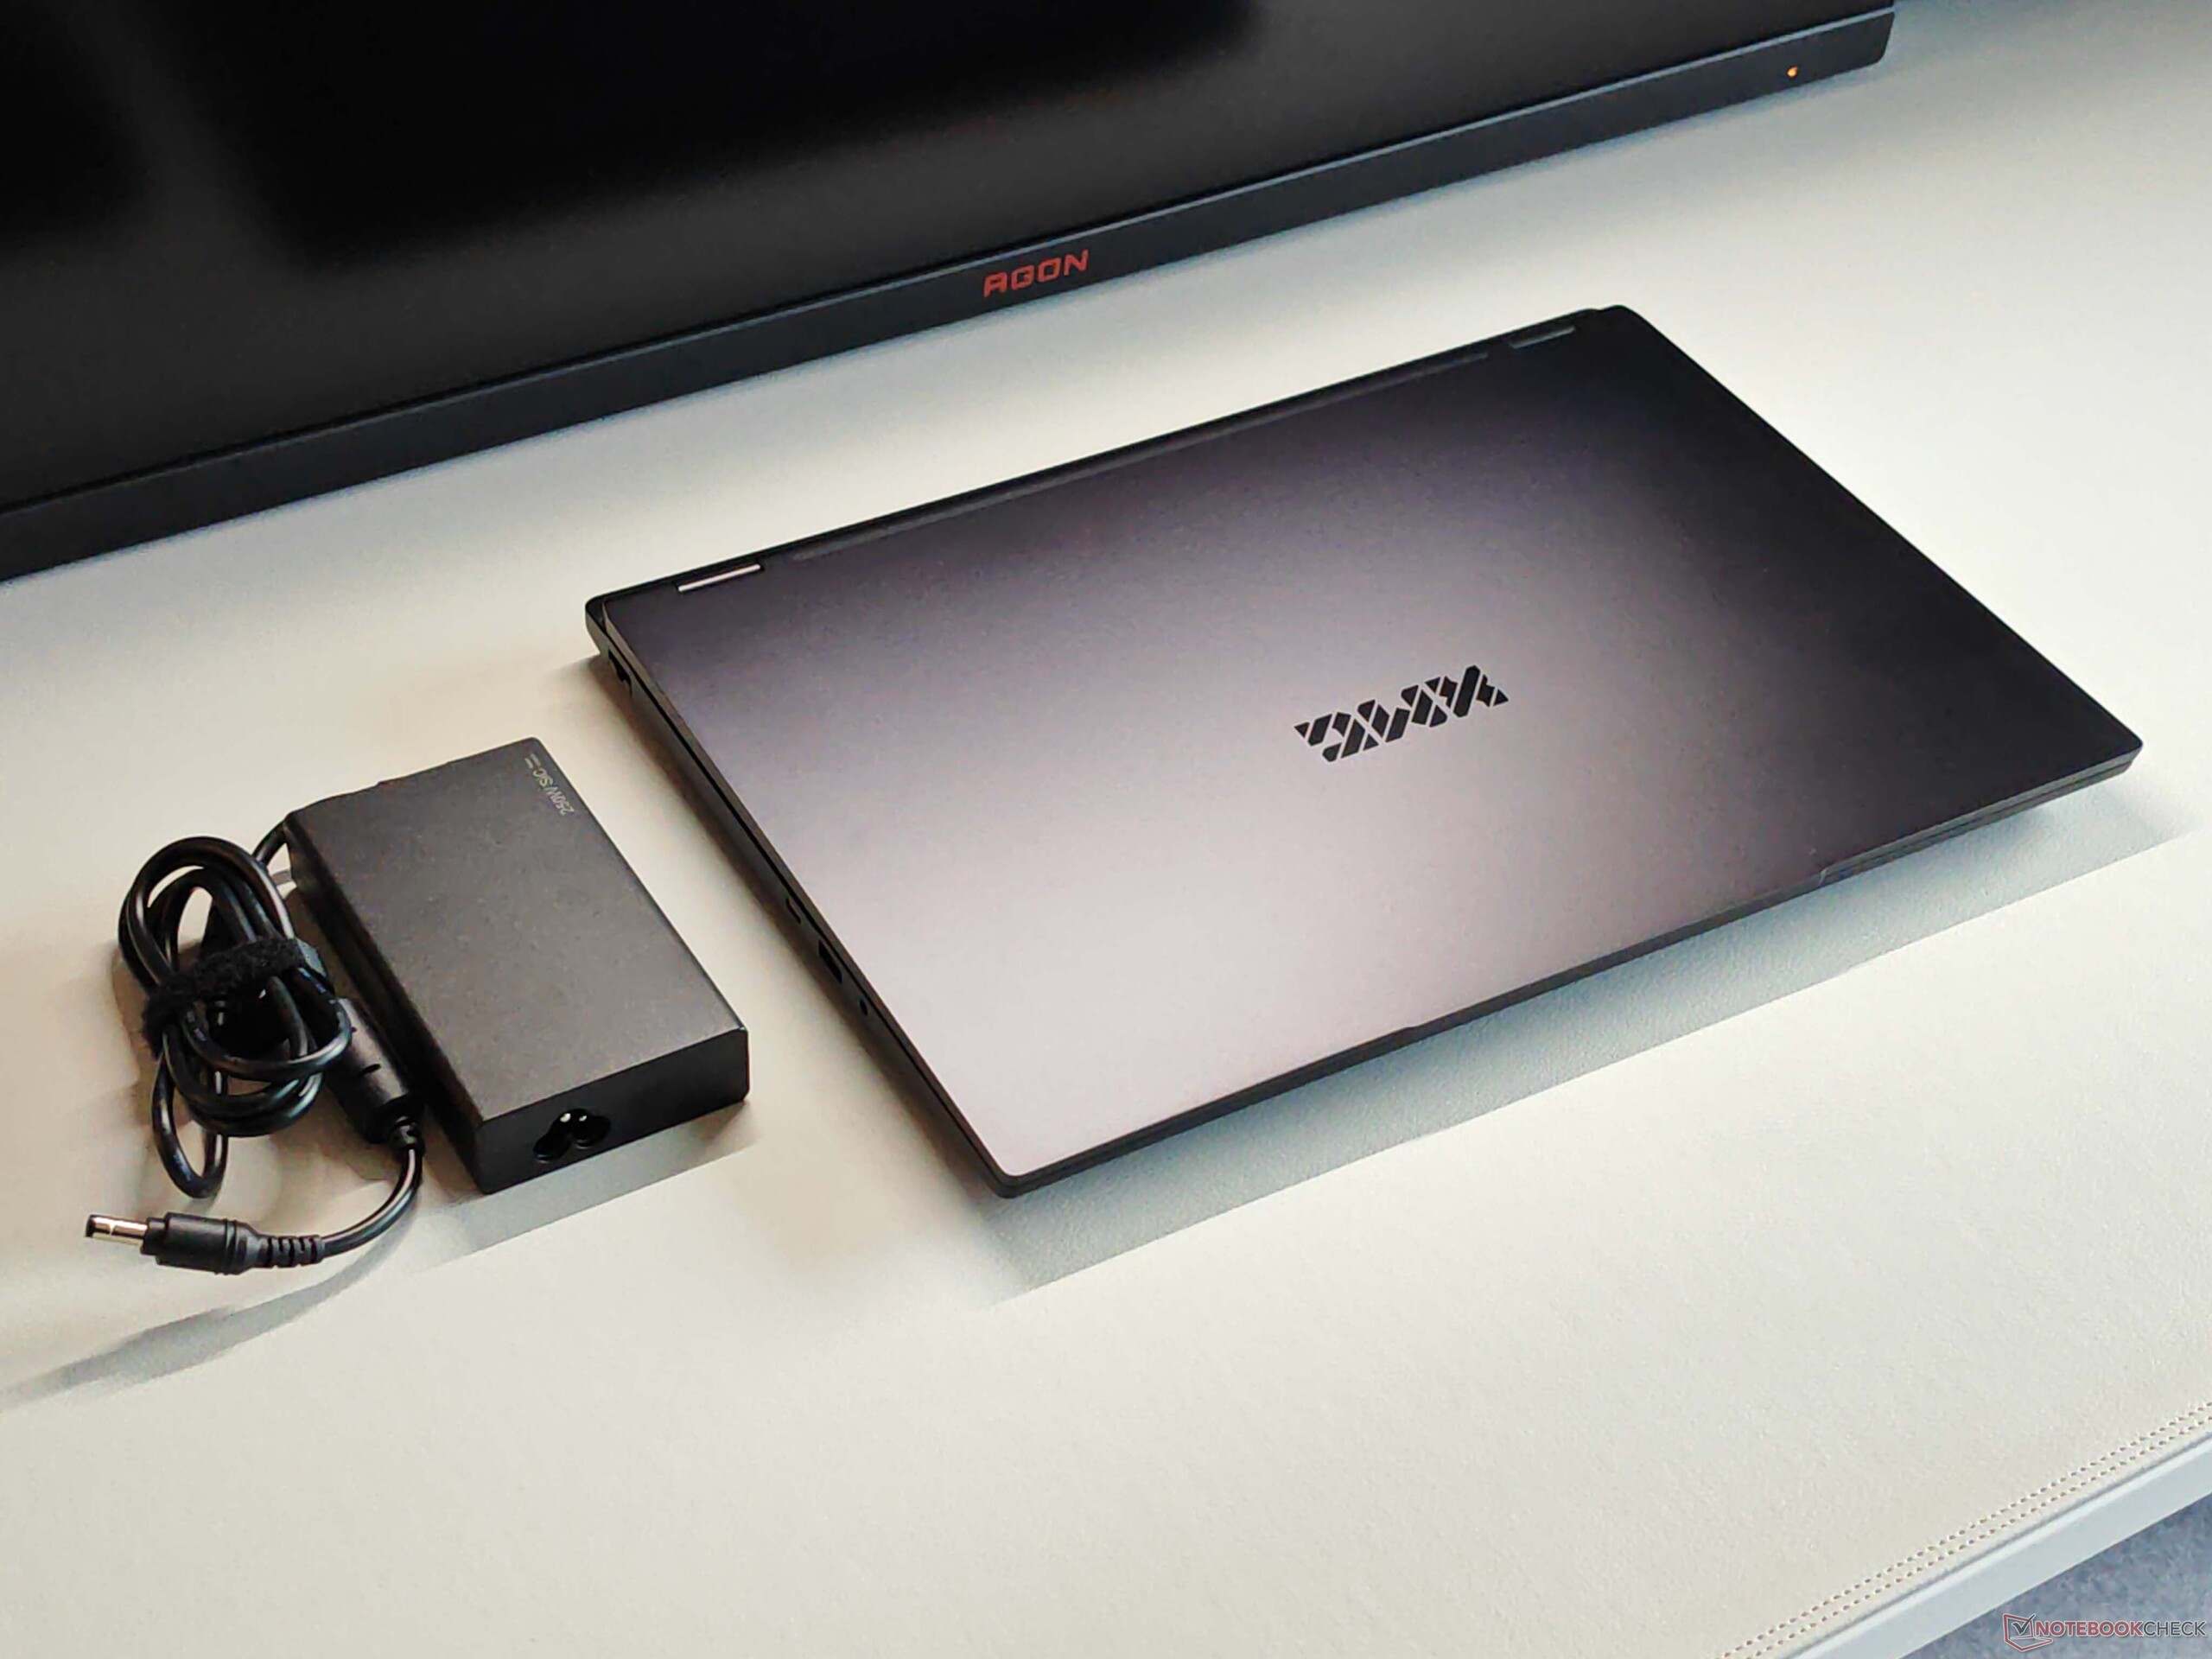
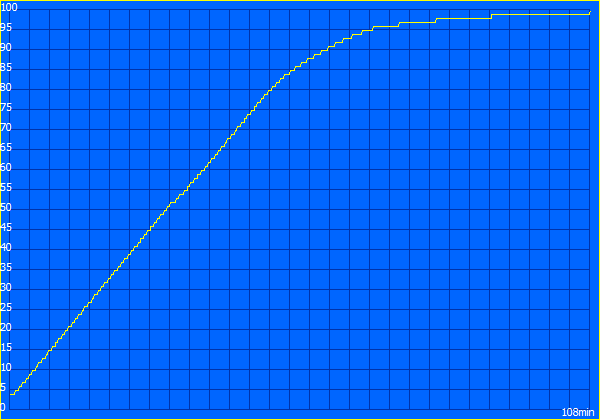
Non ci sono sorprese in termini di consumo energetico. Abbiamo misurato un picco di 243 watt durante lo stress test, ma questo si assesta rapidamente intorno ai 170 watt. L'alimentatore compatto da 250 watt è quindi sufficiente. Il consumo di energia in standby, pari a 1,8 watt, è relativamente alto.
| Off / Standby | |
| Idle | |
| Sotto carico |
|
Leggenda:
min: | |
| Schenker XMG Fusion 16 M25 Ultra 9 275HX, GeForce RTX 5070 Laptop, Samsung 9100 Pro 2 TB, OLED, 2880x1800, 16" | Lenovo Legion Pro 5 16IAX10, RTX 5070 Ultra 7 255HX, GeForce RTX 5070 Laptop, SK Hynix HFS001TEJ9X115N, OLED, 2650x1600, 16" | Schenker XMG Core 16 M25 Ryzen AI 9 HX 370, GeForce RTX 5070 Laptop, Samsung 990 Pro 2 TB MZVL72T0HDLB, IPS, 2560x1600, 16" | Asus TUF Gaming A16 FA608UP R7 260, GeForce RTX 5070 Laptop, Western Digital PC SN5000S SDEQNSJ-1T00, IPS, 2560x1600, 16" | MSI Crosshair 16 HX AI D2XWGKG Ultra 9 275HX, GeForce RTX 5070 Laptop, Micron 2500 1TB MTFDKBA1T0QGN, IPS, 2560x1600, 16" | Aorus Elite 16 AE6H Ultra 9 275HX, GeForce RTX 5070 Laptop, Gigabyte AG470S1TB-SI B10, IPS, 2560x1600, 16" | Gigabyte Gaming A16 GA6H i7-13620H, GeForce RTX 5070 Laptop, Kingston OM8PGP41024Q-A0, IPS, 2560x1600, 16" | Media NVIDIA GeForce RTX 5070 Laptop | Media della classe Gaming | |
|---|---|---|---|---|---|---|---|---|---|
| Power Consumption | -2% | 9% | 23% | -51% | -4% | 20% | 0% | -15% | |
| Idle Minimum * (Watt) | 15.3 | 10.6 31% | 7.4 52% | 4.6 70% | 26.2 -71% | 8.5 44% | 9 41% | 11.5 ? 25% | 13.5 ? 12% |
| Idle Average * (Watt) | 16.8 | 12.3 27% | 14.9 11% | 9.8 42% | 33.8 -101% | 13.6 19% | 11 35% | 16.3 ? 3% | 19.3 ? -15% |
| Idle Maximum * (Watt) | 17.3 | 18.6 -8% | 15.2 12% | 10.2 41% | 34 -97% | 22 -27% | 23 -33% | 21.6 ? -25% | 25.8 ? -49% |
| Load Average * (Watt) | 94.7 | 104 -10% | 100.8 -6% | 76.1 20% | 112 -18% | 113 -19% | 91 4% | 102 ? -8% | 110.9 ? -17% |
| Cyberpunk 2077 ultra external monitor * (Watt) | 180.9 | 227 -25% | 181.4 -0% | 198.1 -10% | 220 -22% | 219 -21% | 130 28% | ||
| Cyberpunk 2077 ultra * (Watt) | 185.3 | 231 -25% | 184.8 -0% | 198.9 -7% | 224 -21% | 223 -20% | 132.5 28% | ||
| Load Maximum * (Watt) | 242.7 | 248 -2% | 251.1 -3% | 235.2 3% | 315 -30% | 257 -6% | 155 36% | 227 ? 6% | 260 ? -7% |
* ... Meglio usare valori piccoli
Consumo energetico Cyberpunk / Stress test
Consumo di energia monitor esterno
Durata della batteria
Nonostante il pannello OLED, la durata della batteria è fondamentalmente molto simile a quella del Core 16 con display IPS. Nel test Wi-Fi con 150 cd/m², abbiamo misurato 10:15 ore e 7:39 ore a piena luminosità.

| Schenker XMG Fusion 16 M25 Ultra 9 275HX, GeForce RTX 5070 Laptop, 99.8 Wh | Lenovo Legion Pro 5 16IAX10, RTX 5070 Ultra 7 255HX, GeForce RTX 5070 Laptop, 80 Wh | Schenker XMG Core 16 M25 Ryzen AI 9 HX 370, GeForce RTX 5070 Laptop, 99.8 Wh | Asus TUF Gaming A16 FA608UP R7 260, GeForce RTX 5070 Laptop, 90 Wh | MSI Crosshair 16 HX AI D2XWGKG Ultra 9 275HX, GeForce RTX 5070 Laptop, 90 Wh | Aorus Elite 16 AE6H Ultra 9 275HX, GeForce RTX 5070 Laptop, 99 Wh | Gigabyte Gaming A16 GA6H i7-13620H, GeForce RTX 5070 Laptop, 76 Wh | Media della classe Gaming | |
|---|---|---|---|---|---|---|---|---|
| Battery Runtime | -40% | -2% | 21% | 8% | -17% | -25% | -33% | |
| WiFi Websurfing (h) | 10.3 | 6.2 -40% | 10.9 6% | 13 26% | 11.1 8% | 8.5 -17% | 7.7 -25% | 6.79 ? -34% |
| WiFi Websurfing max. Brightness (h) | 7.7 | 7 -9% | 8.9 16% | 5.3 ? -31% |
Valutazione complessiva di Notebookcheck
Schenker XMG Fusion 16 M25
- 12/29/2025 v8
Andreas Osthoff
 Total Sustainability Score:
 Possibili alternative a confronto
Immagine | Modello | Prezzo | Peso | Altezza | Schermo |
|---|---|---|---|---|---|
1. 87.5%  | Schenker XMG Fusion 16 M25 Intel Core Ultra 9 275HX ⎘ NVIDIA GeForce RTX 5070 Laptop ⎘ 64 GB Memoria, 2048 GB SSD | Prezzo di listino: 2700€ | 2.1 kg | 23 mm | 16.00" 2880x1800 212 PPI OLED |
2. 86.2%  | Lenovo Legion Pro 5 16IAX10, RTX 5070 Intel Core Ultra 7 255HX ⎘ NVIDIA GeForce RTX 5070 Laptop ⎘ 32 GB Memoria, 1024 GB SSD | Amazon: 1. $1,784.00 Lenovo Legion Pro 5 16IAX10 ... 2. $1,929.00 Lenovo 2025 Gaming Laptop | ... 3. $1,919.00 Lenovo Legion Pro 5 16IAX10 ... Prezzo di listino: 1800 Euro | 2.3 kg | 25.95 mm | 16.00" 2650x1600 189 PPI OLED |
3. 86.2%  | Schenker XMG Core 16 M25 AMD Ryzen AI 9 HX 370 ⎘ NVIDIA GeForce RTX 5070 Laptop ⎘ 64 GB Memoria, 2048 GB SSD | Prezzo di listino: 2100€ | 2.1 kg | 23 mm | 16.00" 2560x1600 189 PPI IPS |
4. 83.8%  | Asus TUF Gaming A16 FA608UP AMD Ryzen 7 260 ⎘ NVIDIA GeForce RTX 5070 Laptop ⎘ 32 GB Memoria, 1024 GB SSD | Amazon: $1,427.00 Prezzo di listino: 2199€ | 2.2 kg | 25.7 mm | 16.00" 2560x1600 189 PPI IPS |
5. 81.9%  | MSI Crosshair 16 HX AI D2XWGKG Intel Core Ultra 9 275HX ⎘ NVIDIA GeForce RTX 5070 Laptop ⎘ 16 GB Memoria, 1024 GB SSD | Amazon: 1. $1,710.99 msi Crosshair 18 HX AI 18" 2... 2. $54.99 Dongerdi 240W Charger Fit fo... 3. $1,699.00 msi Crosshair 16 HX AI 16" Q... Prezzo di listino: 2500 EUR | 2.5 kg | 27.9 mm | 16.00" 2560x1600 189 PPI IPS |
6. 84.4%  | Aorus Elite 16 AE6H Intel Core Ultra 9 275HX ⎘ NVIDIA GeForce RTX 5070 Laptop ⎘ 32 GB Memoria, 1024 GB SSD | Amazon: 1. $46.99 Smatree Hard Laptop Sleeve C... 2. $45.99 Smatree Hard EVA Protective ... 3. $55.99 Smatree MS89 Hard Protective... Prezzo di listino: 2300 EUR | 2.4 kg | 26 mm | 16.00" 2560x1600 189 PPI IPS |
7. 80.1%  | Gigabyte Gaming A16 GA6H Intel Core i7-13620H ⎘ NVIDIA GeForce RTX 5070 Laptop ⎘ 16 GB Memoria, 1024 GB SSD | Amazon: 1. $22.98 Puccy 3 Pack Screen Protecto... 2. $12.98 Puccy 2 Pack Touch Pad Film ... 3. $18.98 Puccy 2 Pack Film Protector,... Prezzo di listino: 1700 EUR | 2.3 kg | 23 mm | 16.00" 2560x1600 189 PPI IPS |
Transparency
La selezione dei dispositivi da recensire viene effettuata dalla nostra redazione. Il campione di prova è stato fornito all'autore come prestito dal produttore o dal rivenditore ai fini di questa recensione. L'istituto di credito non ha avuto alcuna influenza su questa recensione, né il produttore ne ha ricevuto una copia prima della pubblicazione. Non vi era alcun obbligo di pubblicare questa recensione. In quanto società mediatica indipendente, Notebookcheck non è soggetta all'autorità di produttori, rivenditori o editori.
Ecco come Notebookcheck esegue i test
Ogni anno, Notebookcheck esamina in modo indipendente centinaia di laptop e smartphone utilizzando procedure standardizzate per garantire che tutti i risultati siano comparabili. Da circa 20 anni sviluppiamo continuamente i nostri metodi di prova e nel frattempo stabiliamo gli standard di settore. Nei nostri laboratori di prova, tecnici ed editori esperti utilizzano apparecchiature di misurazione di alta qualità. Questi test comportano un processo di validazione in più fasi. Il nostro complesso sistema di valutazione si basa su centinaia di misurazioni e parametri di riferimento ben fondati, che mantengono l'obiettività.