Verdetto: Ryzen 7 9850X3D è il 9800X3D che sarebbe dovuto essere
Ryzen 7 9800X3D ha conquistato uno status di culto tra i giocatori di PC, e AMD chiaramente non ha finito di spremere il limone prima dell'arrivo di Zen 6 all'inizio del prossimo anno.
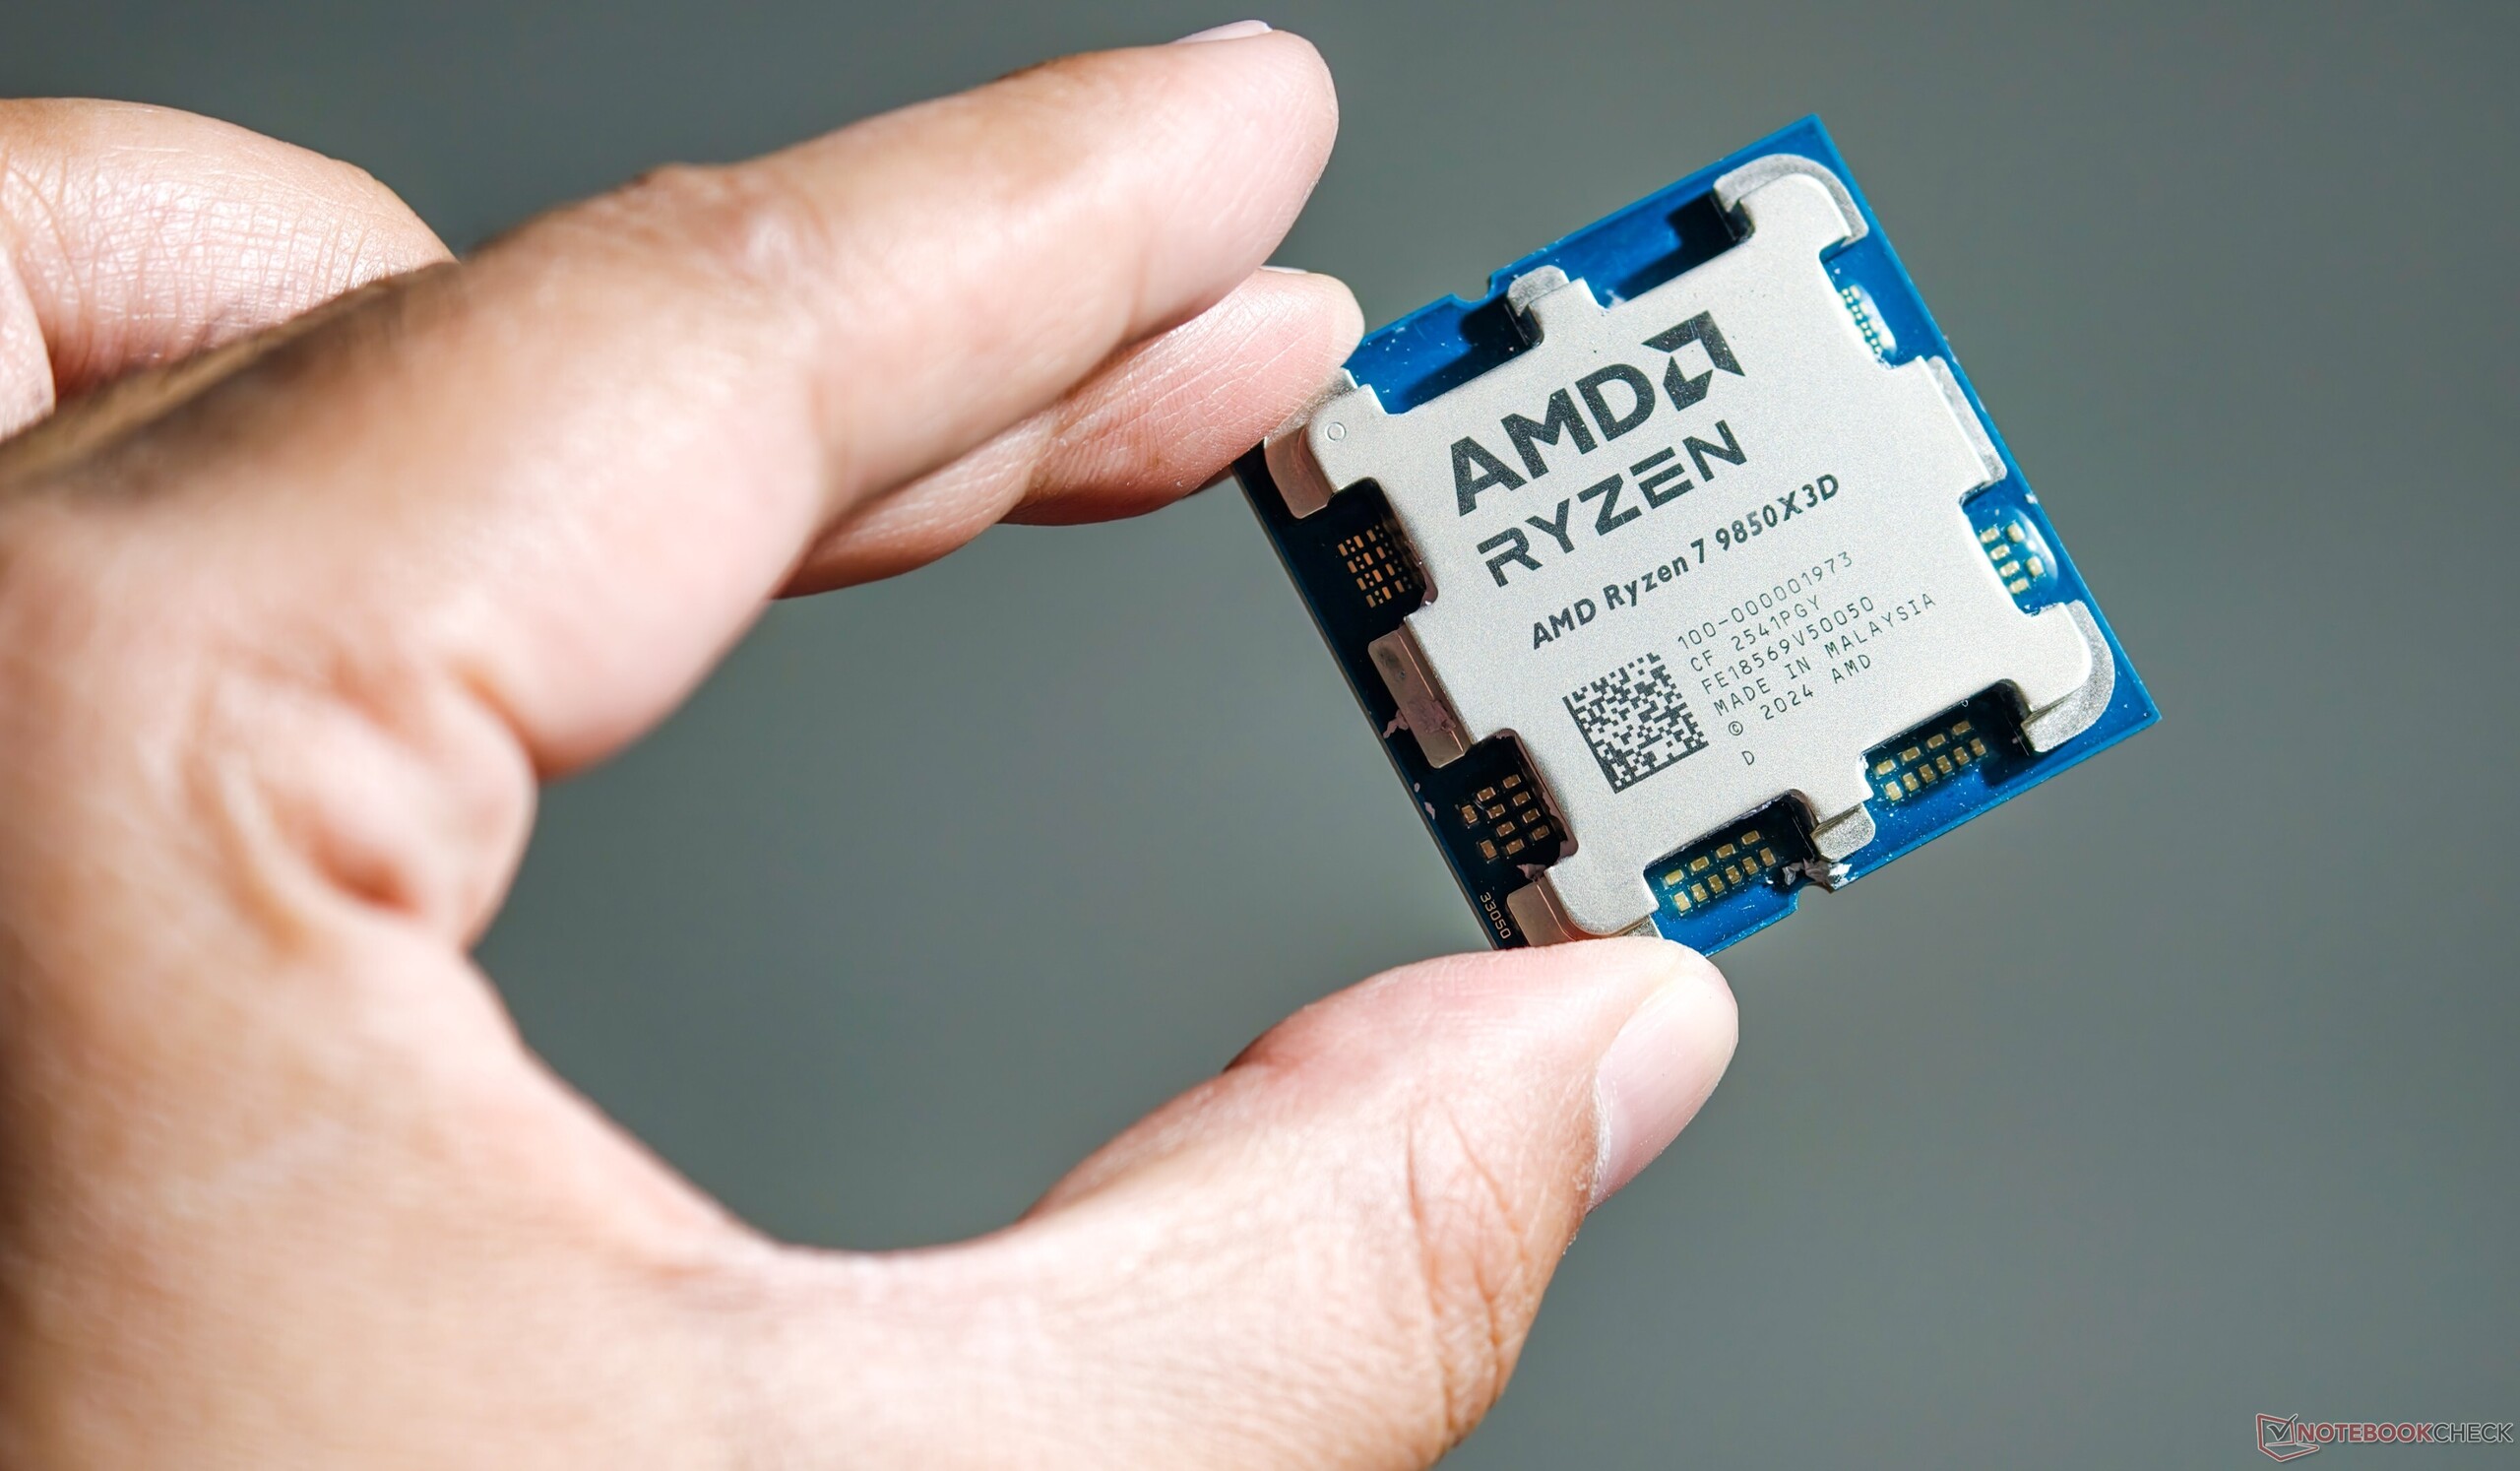
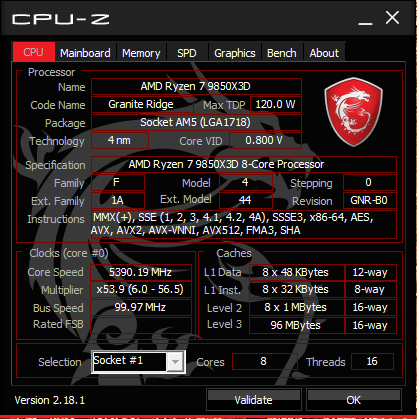
Così, abbiamo il nuovo AMD Ryzen 7 9850X3D, che essenzialmente è solo un 9800X3D con una migliore classificazione e un clock di boost leggermente più alto.
I guadagni complessivi in termini di prestazioni della CPU rispetto al Ryzen 7 9800X3D sono minimi, con un consumo energetico leggermente superiore. I numeri in single-core sono ampiamente competitivi con altri componenti Zen 5 e Arrow Lake-S, ma le nuove CPU Core Ultra 200S Plus di Intel mettono assolutamente in ginocchio il Ryzen 7 9850X3D nei carichi di lavoro multi-core.
Dove il Ryzen 7 9850X3D si fa valere è nel gioco che, dopo tutto, è la ragione d'essere dell'avere una V-Cache 3D. A differenza del Ryzen 9 9950X3D, qui c'è un solo CCD 3D V-Cache, quindi i giocatori non devono girarsi i pollici sperando che il sistema operativo programmi i core giusti per i giochi.
I vantaggi rispetto al Ryzen 7 9800X3D, tuttavia, rimangono minimi e non giustificano un upgrade, nemmeno per i giocatori competitivi più esigenti.
Il consumo energetico durante il gioco è marginalmente inferiore a quello del 9800X3D, ma quest'ultimo è leggermente più efficiente.
Le CPU Zen 5 di fascia alta non X3D rimangono scelte eccellenti per la produttività e il gioco a tutto tondo. Ai prezzi di 200 e 300 dollari, i nuovi Core Ultra 200S Plus sono una scelta obbligata se dà priorità alle prestazioni multi-core e se gioca principalmente in QHD o 4K con impostazioni Ultra.
Tuttavia, se desidera una bestia assoluta di CPU da gioco, la AMD Ryzen 7 9850X3D dovrebbe essere la sua prima scelta. Ma non si accinga a scambiare il suo Ryzen 7 9800X3D con uno di questi, poiché pagherebbe 20 dollari in più per un guadagno del 2-3% al massimo.
Un'opzione più prudente sarebbe quella di scegliere il vecchio Ryzen 7 7800X3D e ottenere quasi le stesse prestazioni di gioco del Ryzen 7 9850X3D, risparmiando nel contempo ben 115 dollari.
Pro
Contro
Prezzo e disponibilità
AMD Ryzen 7 9850X3D è disponibile su Amazon US a 499 dollari. In India, il Ryzen 7 9850X3D è disponibile su Amazon India e presso altri rivenditori a circa ₹53.000 dollari.
Sommario
- Verdetto: Ryzen 7 9850X3D è il 9800X3D che sarebbe dovuto essere
- Il banco di prova: Ryzen 7 9850X3D si accoppia alla grande con GeForce RTX 4090
- Prestazioni della CPU: Non è all'altezza del Core Ultra 200S Plus in multi-core
- Prestazioni del sistema: Proprio alle calcagna del Ryzen 9 9950X3D
- prestazioni 3D e di gioco: Vantaggi minimi rispetto a Ryzen 7 9800X3D
- Consumo energetico: Questa volta Intel si aggiudica la corona dell'efficienza
- Le impressioni di Notebookcheck su AMD Ryzen 7 9850X3D
AMD ha avuto un buon successo con la sua linea X3D fin dai tempi del primo Ryzen 7 5800X3D. Nella generazione Zen 5, l'azienda ha già introdotto il modello Ryzen 7 9800X3Dryzen 9 9900X3D e Ryzen 9 9950X3D Ryzen 9 9950X3D.
Ora abbiamo con noi il nuovo Ryzen 7 9850X3D.
Annunciato al CES 2026ryzen 7 9850X3D è più o meno la stessa CPU, ma con un contenitore migliorato con boost più elevati fino a 5,6 GHz, per 20 dollari in più.
Panoramica dei processori desktop AMD Zen 5 "Granite Ridge" Ryzen 9000
| SKU | Cores / Threads | Clock di base | Turbo Clock | Cache L2 | Cache L3 | TDP | Default Socket Power (PPT) | Prezzo di lancio (SEP) |
|---|---|---|---|---|---|---|---|---|
| Ryzen 9 9950X3D | 16 / 32 | 4,3 GHz | 5,7 GHz | 16x 1 MB | 128 MB | 170 W | 200 W | $699 |
| Ryzen 9 9950X | 16 / 32 | 4,3 GHz | 5,7 GHz | 16x 1 MB | 64 MB | 170 W | 200 W | $649 |
| Ryzen 9 9900X3D | 12 / 24 | 4,4 GHz | 5,5 GHz | 12x 1 MB | 128 MB | 120 W | 162 W | $599 |
| Ryzen 9 9900X | 12 / 24 | 4,4 GHz | 5,6 GHz | 12x 1 MB | 64 MB | 120 W | 162 W | $499 |
| Ryzen 7 9850X3D | 8/ 16 | 4,7 GHz | 5,6 GHz | 8x1 MB | 96 MB | 120 W | 162 W | $499 |
| Ryzen 7 9800X3D | 8 / 16 | 4,7 GHz | 5,2 GHz | 8x 1 MB | 96 MB | 120 W | 162 W | $479 |
| Ryzen 7 9700X | 8 / 16 | 3,8 GHz | 5,5 GHz | 8x 1 MB | 32 MB | 65 W | 88 W | $359 |
| Ryzen 5 9600X | 6 / 12 | 3,9 GHz | 5,4 GHz | 6x 1 MB | 32 MB | 65 W | 88 W | $279 |
Il banco di prova: Ryzen 7 9850X3D si accoppia alla grande con GeForce RTX 4090
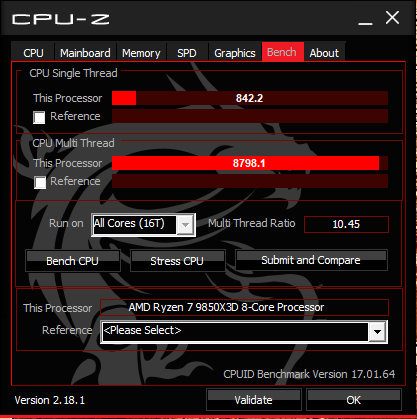
Il nostro banco di prova AMD Ryzen 7 9850X3D è composto dai seguenti componenti:
- Banco di prova aperto Cooler Master MasterFrame 700
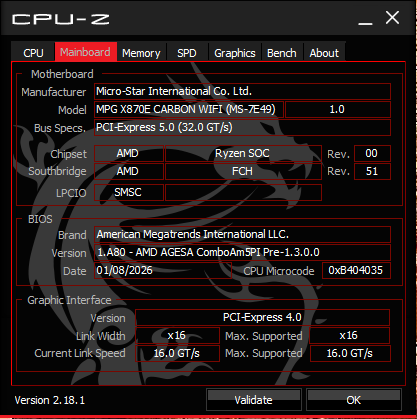
- Scheda madre MSI MAG X870E Carbon Wi-Fi con BIOS 1.A80 (AGESA ComboAM5PI Pre-1.3.0.0)
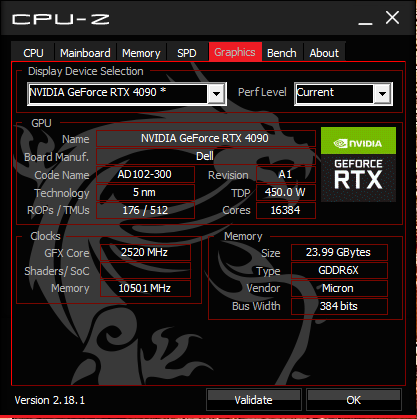
- Nvidia GeForce RTX 4090 Founders Edition GPU
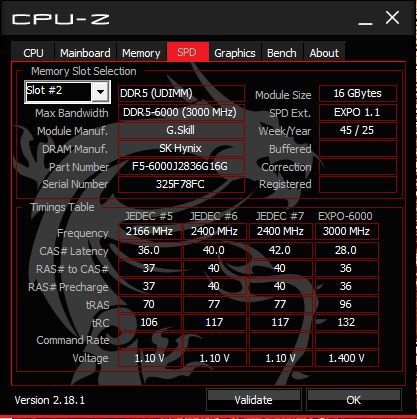
- 2x 16 GB di RAM G.Skill Trident Z5 Neo RGB DDR5-6000 in esecuzione nel profilo EXPO-6000 con temporizzazioni 28-36-36-96 a 1,40 V
- Samsung 990 Pro 1 TB PCIe Gen 4 NVMe SSD per OS, benchmark e giochi
- Monitor Alienware AW3225QF 4K 240 Hz QD-OLED
- Raffreddatore Cooler Master MasterLiquid ML360L V2 ARGB AiO
- Cooler Master MVE Gold V2 1250 ATX 3.0 alimentatore completamente modulare

Vorremmo ringraziare AMD per aver fornito il campione di prova Ryzen 7 9850X3D, la scheda madre, l'SSD e la memoria DDR5, Nvidia per la GPU RTX 4090 Founders Edition, Dell per il monitor AW3225QF e infine Cooler Master per il banco di prova, il radiatore AiO e l'alimentatore.
Tutti i test sono stati eseguiti su una nuova installazione di Windows 11 25H2 (Build 26200.7920) insieme ai driver del chipset AMD 8.02.18.557 e Nvidia Game Ready Driver 595.97.
Prestazioni della CPU: Non è all'altezza del Core Ultra 200S Plus in multi-core
Come previsto, Ryzen 7 9850X3D mostra solo un piccolo guadagno del 3% rispetto a Ryzen 7 9800X3D nelle prestazioni cumulative della CPU. Tuttavia, ottiene un buon 13% in più rispetto al Core Ultra 7 270K Plus quando si considerano tutti i test della CPU.
I test single-core di Cinebench collocano il Ryzen 7 9850X3D su un piedistallo simile a quello degli altri processori Zen 5 e Arrow Lake/Refresh nel confronto. Tuttavia, anche il Core Ultra 5 250K Plus da 199 dollari può registrare un vantaggio fino al 37% rispetto al Ryzen 7 9850X3D nei test multi-core di Cinebench, grazie al numero di core/thread più elevato.
Il divario tra il Ryzen 7 9850X3D e il Core Ultra 7 270K Plus si riduce ulteriormente nei risultati single-core di Geekbench. Tuttavia, l'ultima offerta X3D di fascia media di AMD non è ancora in grado di eguagliare i chip Arrow Lake/Refresh di Intel nella componente multi-core del benchmark.
| CPU Performance rating - Percent | |
| AMD Ryzen 9 9950X3D | |
| Intel Core Ultra 7 270K Plus | |
| AMD Ryzen 9 9950X | |
| Intel Core Ultra 9 285K | |
| AMD Ryzen 9 7950X -4! | |
| AMD Ryzen 9 7950X3D -2! | |
| Intel Core i9-13900K -2! | |
| Intel Core i9-14900K -1! | |
| AMD Ryzen 9 9900X -1! | |
| AMD Ryzen 9 7900X -4! | |
| Intel Core i7-14700K | |
| AMD Ryzen 7 9850X3D | |
| Intel Core Ultra 5 250K Plus | |
| AMD Ryzen 7 9800X3D | |
| AMD Ryzen 7 9700X | |
| Intel Core Ultra 5 245K | |
| Intel Core i9-12900K -3! | |
| AMD Ryzen 7 7800X3D -5! | |
| Intel Core i5-14600K | |
| Intel Core i5-13600K -2! | |
| AMD Ryzen 5 9600X -2! | |
| Intel Core i5-12600K -5! | |
* ... Meglio usare valori piccoli
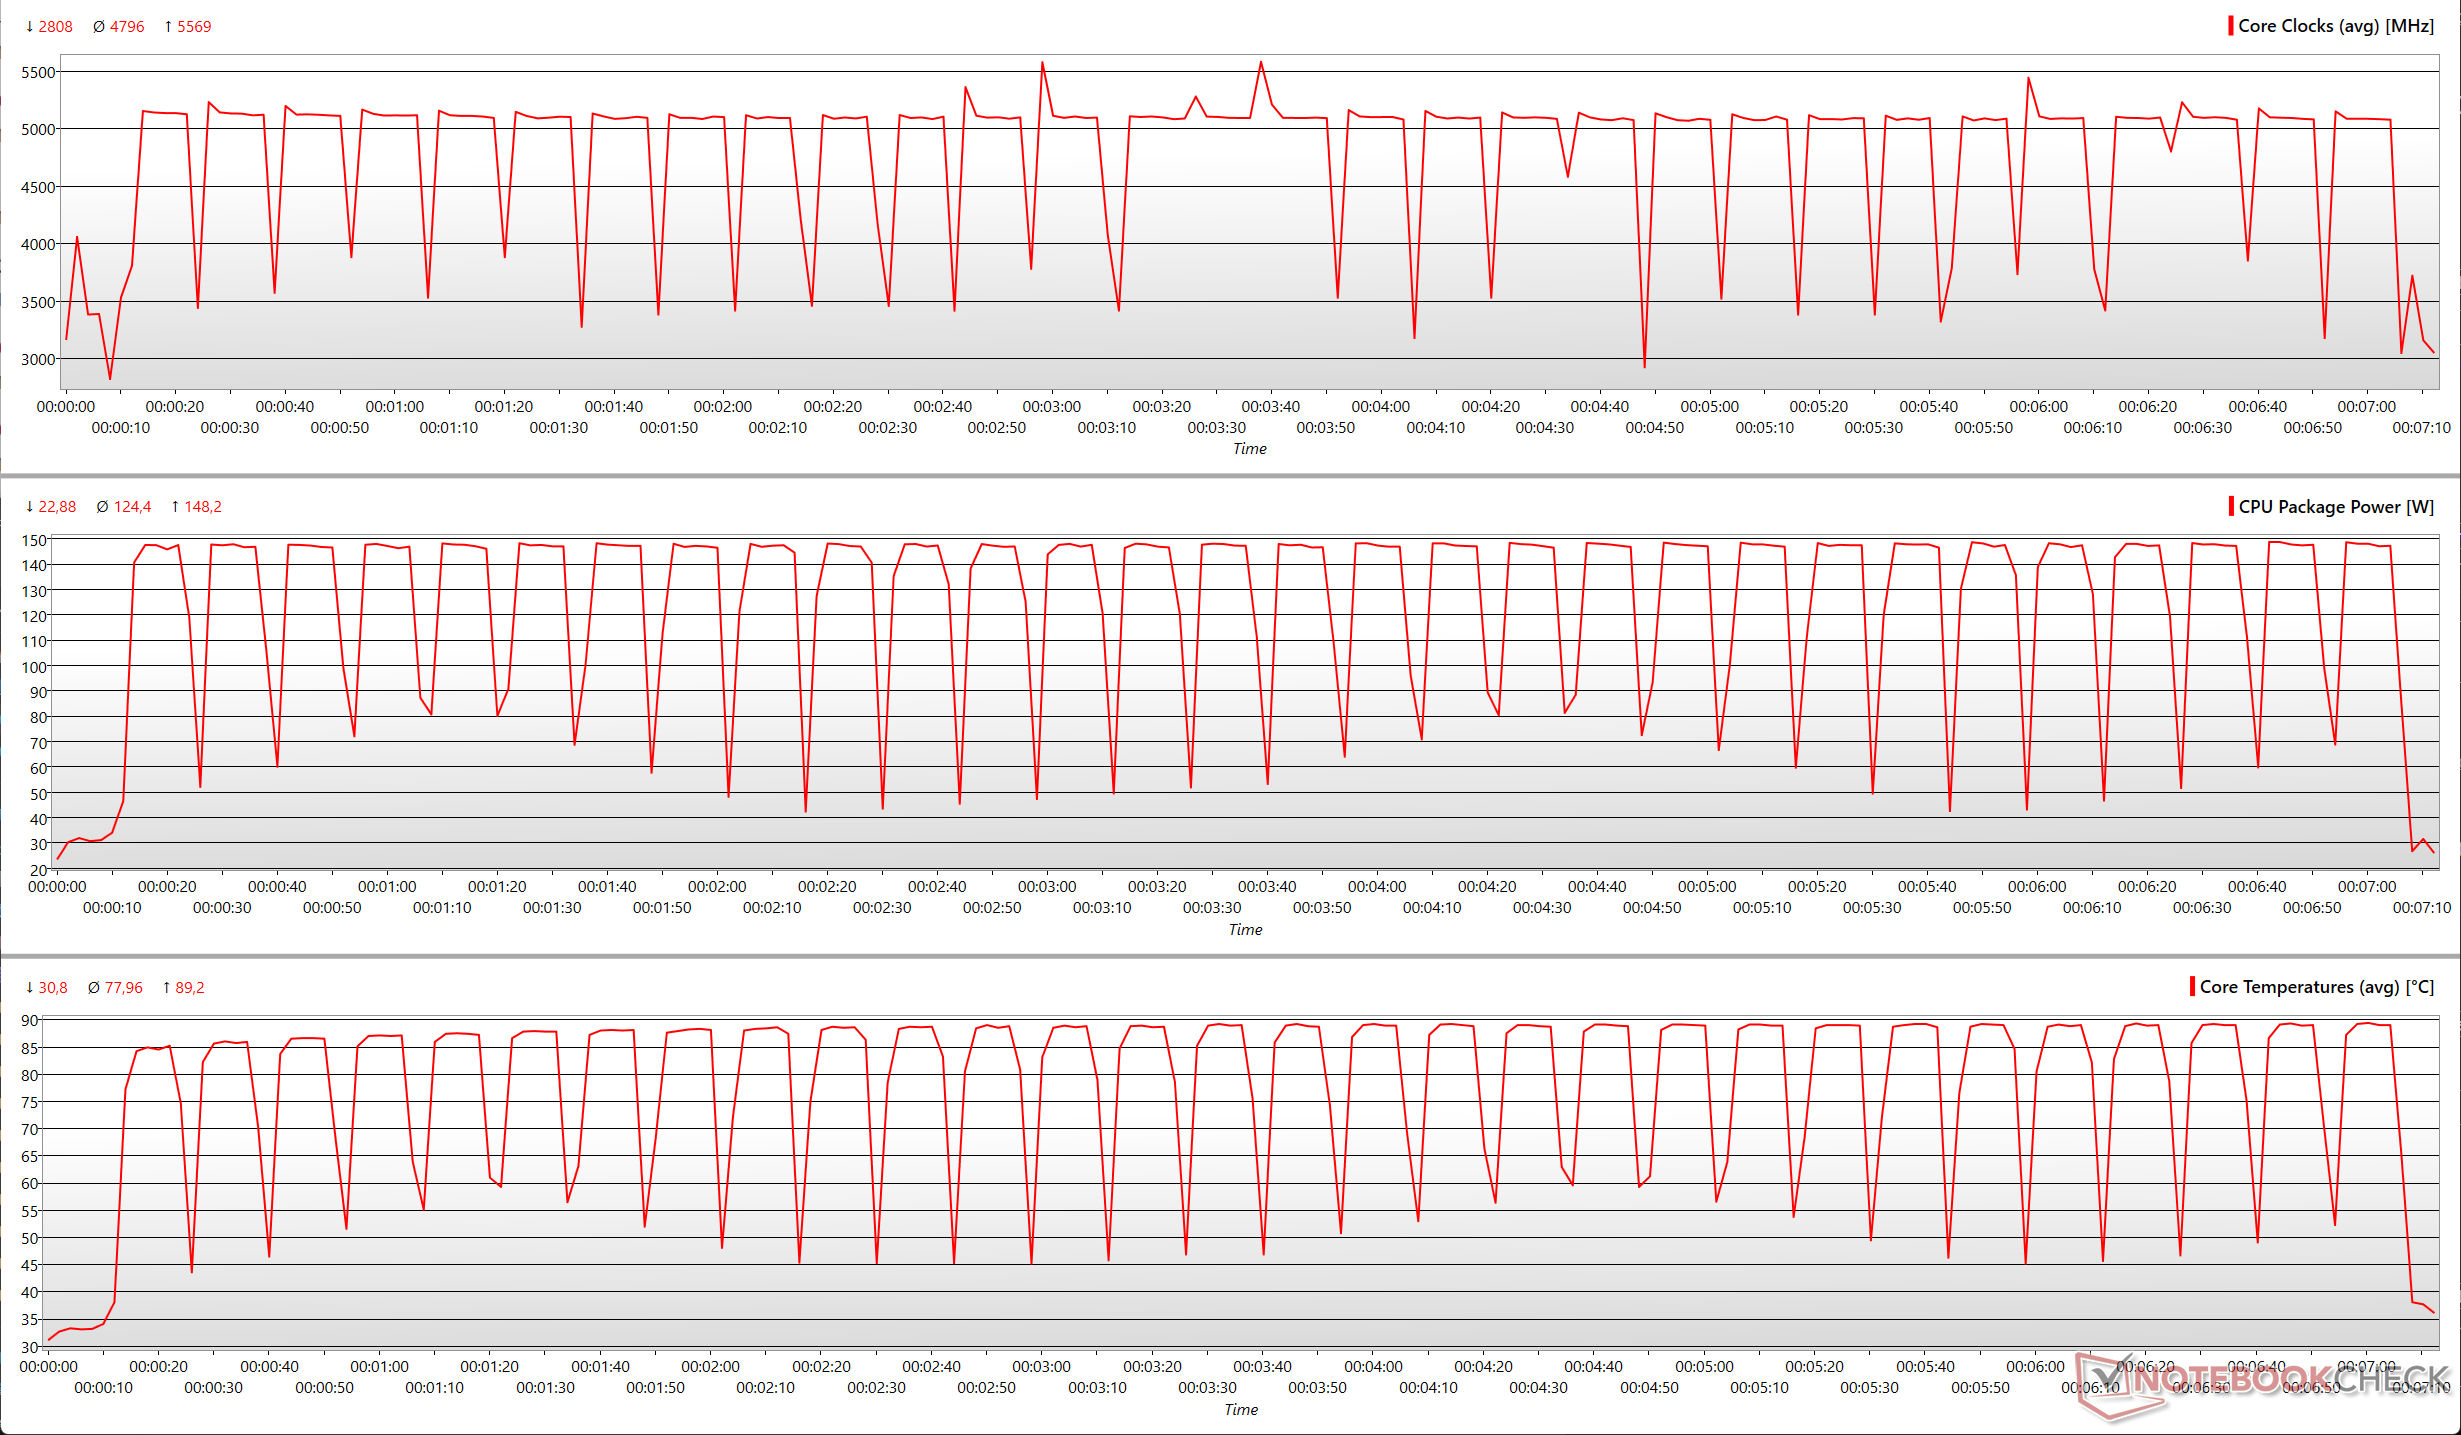
Cinebench R15 Multi Loop
AMD non fornisce un raffreddatore con Ryzen 7 9850X3D. Tuttavia, la CPU ha fornito buone prestazioni sostenute senza throttling durante un ciclo multi-core Cinebench R15 in combinazione con il nostro raffreddatore Cooler Master MasterLiquid ML360L V2 ARGB AiO.
Cinebench R15 Multi Loop
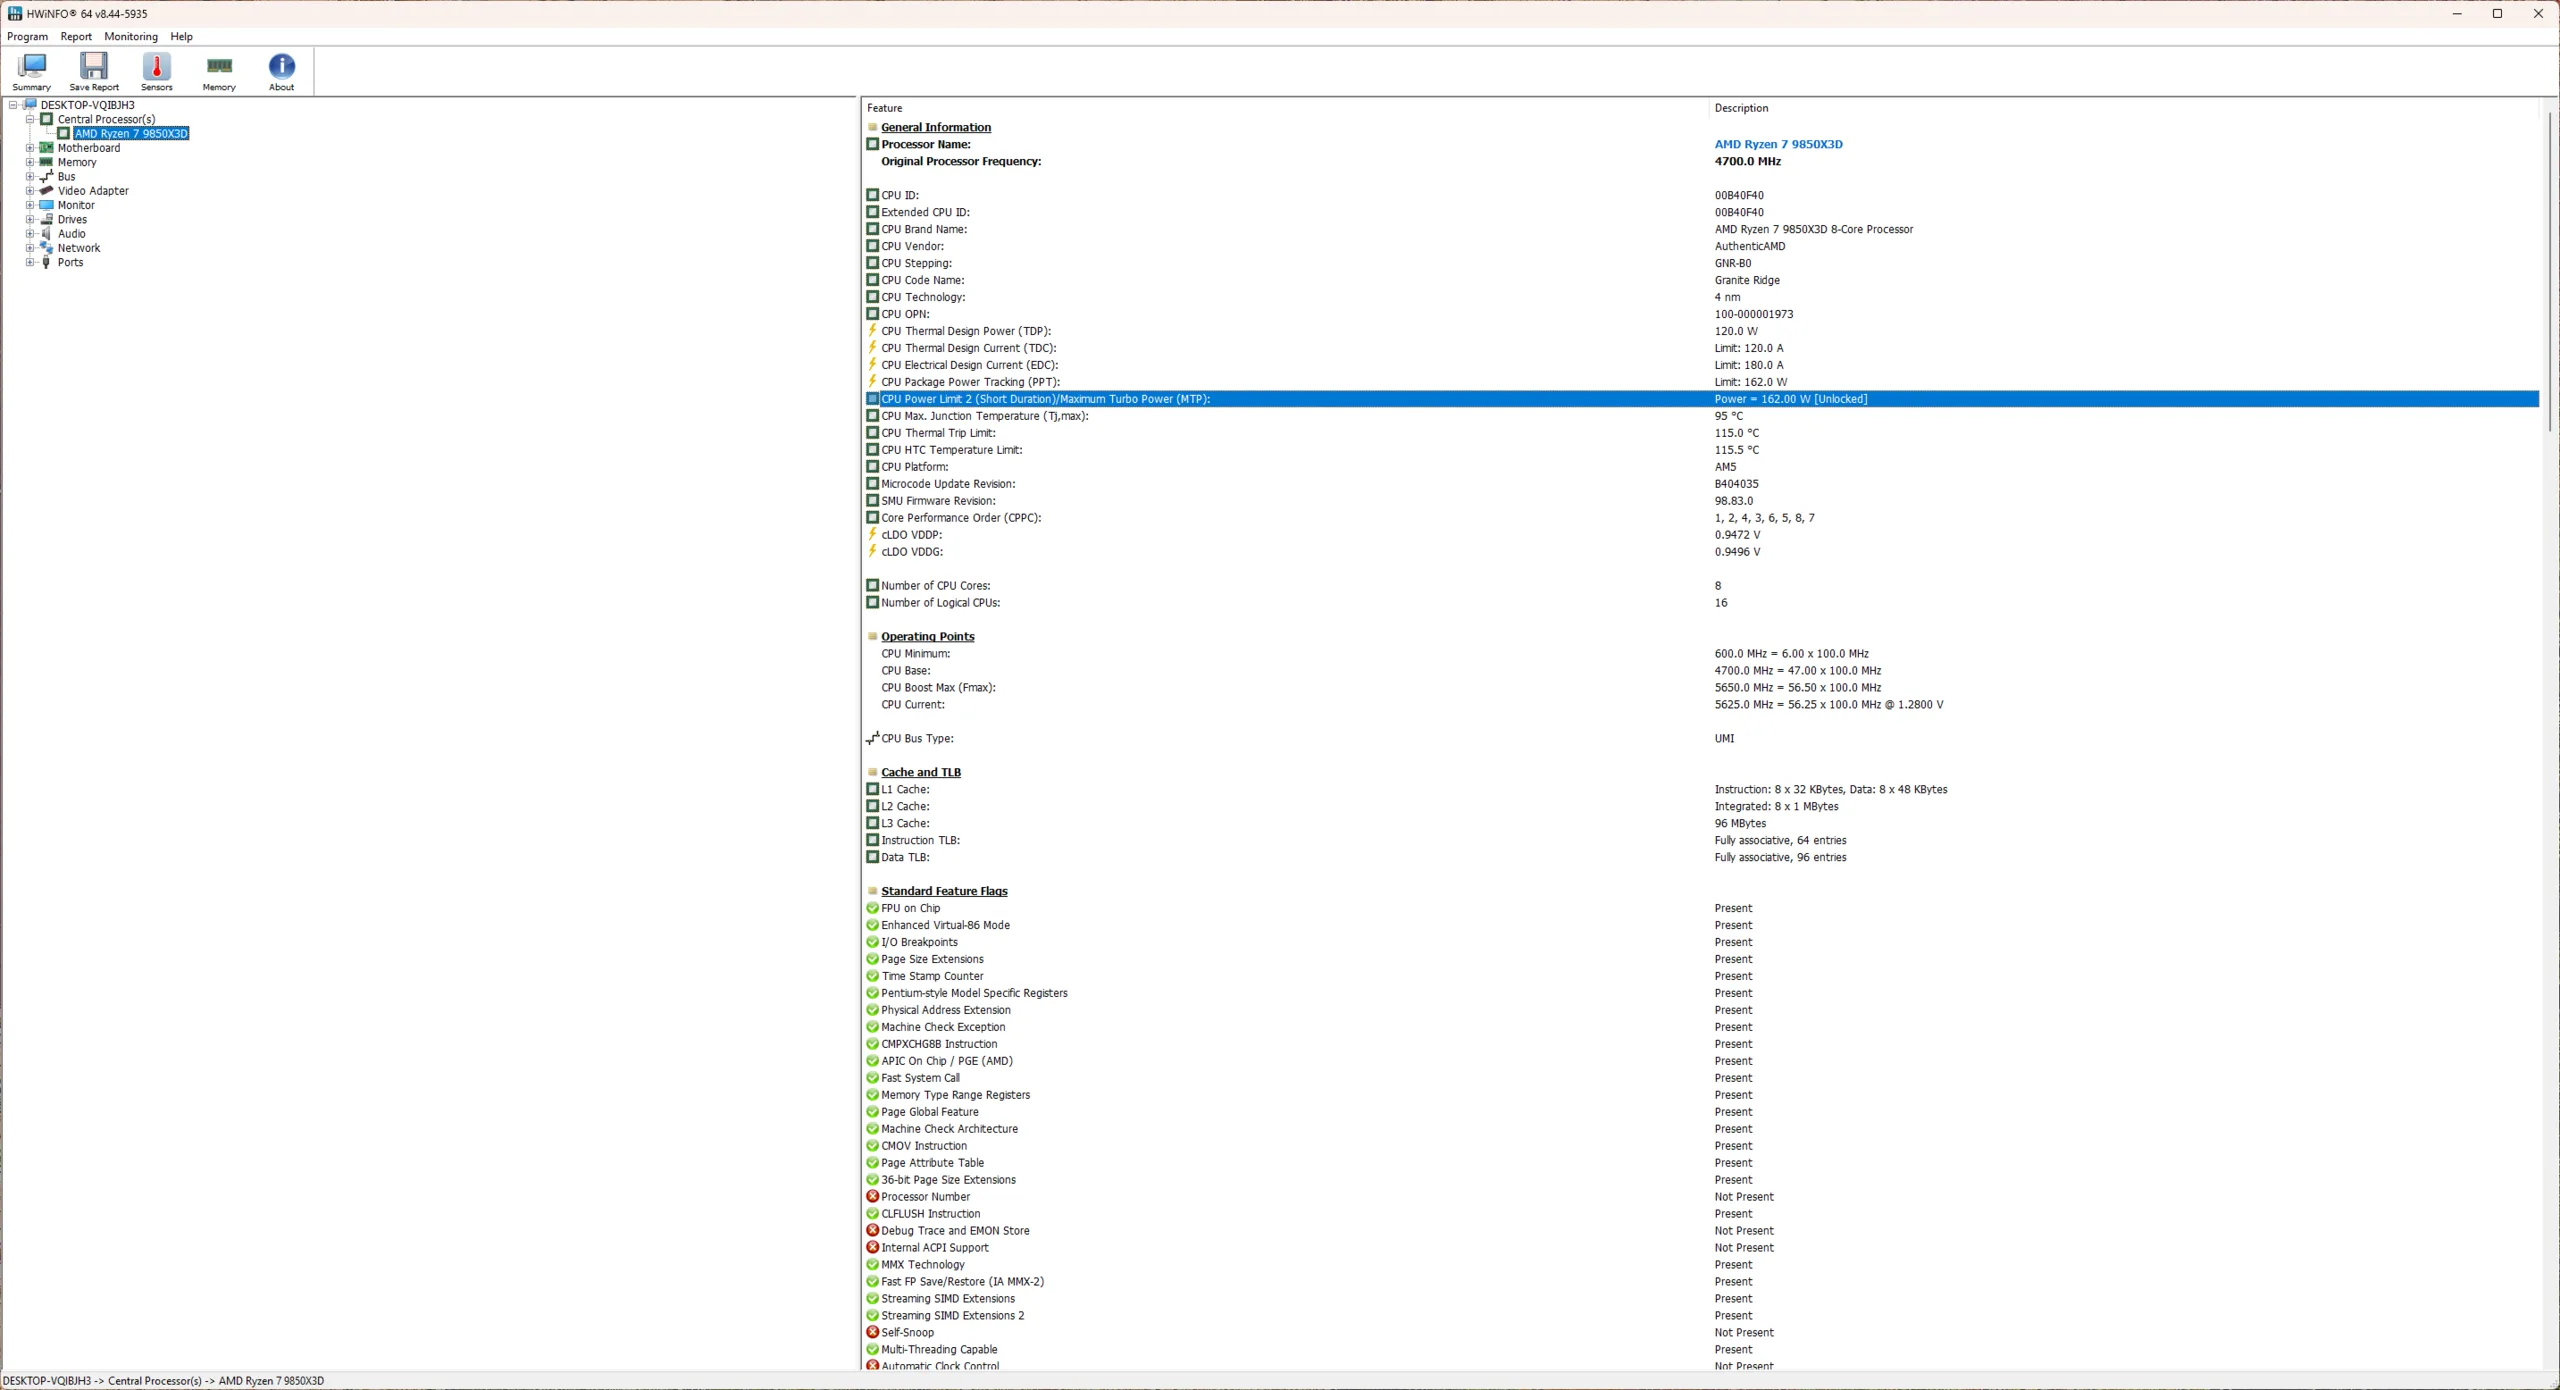
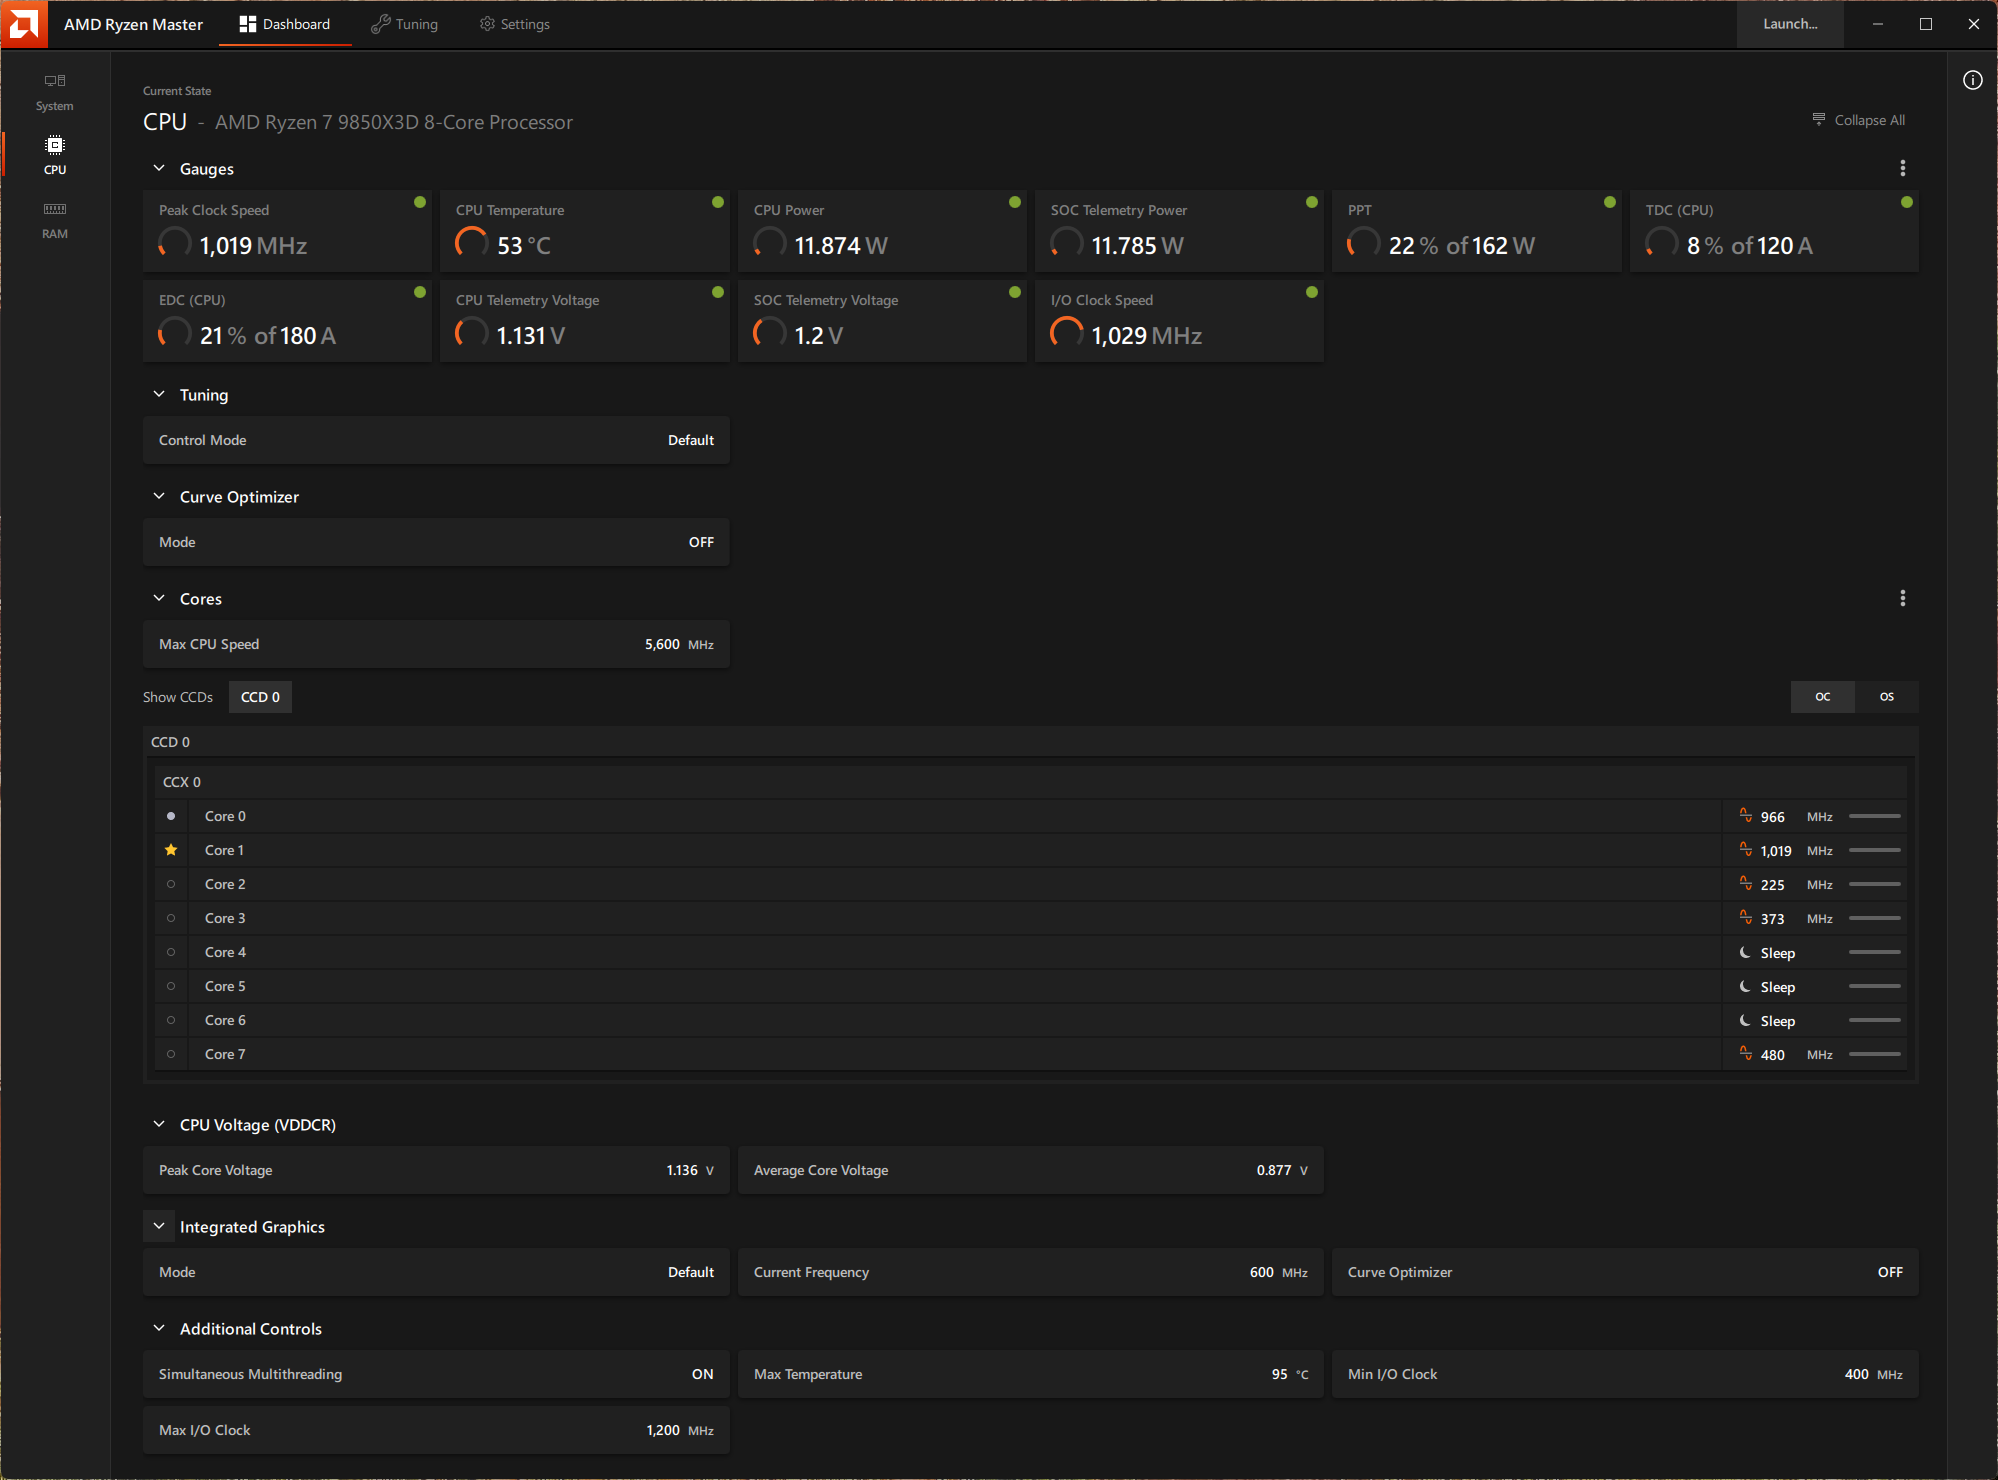
Durante un'esecuzione multi-core a 30 loop di Cinebench R15, Ryzen 7 9850X3D sale a 5,57 GHz, raggiungendo una potenza di picco di 148 W e una temperatura massima del core di 89 °C.
Con un TDP medio di 124 W, i clock medi dei core si aggirano intorno ai 4,8 GHz, mentre le temperature medie dei core rimangono vicine ai 78 °C.
Sebbene il TDP sia di 120 W, Ryzen 7 9850X3D può assorbire fino a 162 W dal socket AM5.
Prestazioni del sistema: Proprio alle calcagna del Ryzen 9 9950X3D
Ryzen 7 9850X3D gestisce la produttività quotidiana senza intoppi. Nei benchmark di sistema cumulativi, è inferiore al Ryzen 9 9950X3D di appena il 9%.
Vediamo guadagni tangibili in PCMark 10 rispetto al Ryzen 7 9800X3D, mentre offre prestazioni CrossMark complessive alla pari con le CPU Core Ultra 200S Plus.
Ancora una volta, le CPU AMD nel nostro confronto superano la maggior parte dei test AIDA64, ad eccezione del benchmark CPU PhotoWorxx.
3DMark 11: 1280x720 Performance Physics
3DMark: 1920x1080 Fire Strike Physics | 2560x1440 Time Spy CPU
CrossMark: Overall | Responsiveness | Creativity | Productivity
PCMark 10: Score | Essentials | Productivity | Digital Content Creation
AIDA64: FP32 Ray-Trace | FPU Julia | CPU SHA3 | CPU Queen | FPU SinJulia | FPU Mandel | CPU AES | CPU ZLib | FP64 Ray-Trace | CPU PhotoWorxx
| AIDA64 / FP32 Ray-Trace | |
| AMD Ryzen 9 9950X3D (v6.92.6600) | |
| AMD Ryzen 9 9950X (v6.92.6600) | |
| AMD Ryzen 9 9900X (v6.92.6600) | |
| AMD Ryzen 9 7950X (v6.75.6100) | |
| AMD Ryzen 9 7950X3D (v6.85.6300) | |
| AMD Ryzen 7 9800X3D (v6.92.6600) | |
| AMD Ryzen 7 9850X3D (v8.20.8100) | |
| AMD Ryzen 7 9850X3D (v6.92.6600) | |
| Intel Core Ultra 7 270K Plus (v8.20.8100) | |
| Intel Core Ultra 7 270K Plus (v6.92.6600) | |
| Intel Core Ultra 9 285K (v6.92.6600) | |
| AMD Ryzen 7 9700X (v6.92.6600) | |
| Intel Core i9-14900K (v6.85.6300) | |
| Intel Core i9-14900K (v8.20.8100) | |
| Intel Core i9-13900K (v6.75.6100) | |
| AMD Ryzen 5 9600X (v6.92.6600) | |
| AMD Ryzen 9 7900X (v6.70.6000) | |
| Intel Core i7-14700K (v6.92.6600) | |
| AMD Ryzen 7 7800X3D (v6.85.6300) | |
| Intel Core i5-14600K (v6.85.6300) | |
| Intel Core Ultra 5 250K Plus (v6.92.6600) | |
| Intel Core Ultra 5 250K Plus (v8.20.8100) | |
| Intel Core i5-13600K (v6.75.6100) | |
| Intel Core Ultra 5 245K (v6.92.6600) | |
| Intel Core i9-12900K (v6.50.5800) | |
| Intel Core i5-12600K (v6.50.5800) | |
| AIDA64 / FPU Julia | |
| AMD Ryzen 9 9950X3D (v6.92.6600) | |
| AMD Ryzen 9 7950X3D (v6.85.6300) | |
| AMD Ryzen 9 9950X (v6.92.6600) | |
| AMD Ryzen 9 7950X (v6.75.6100) | |
| Intel Core Ultra 7 270K Plus (v8.20.8100) | |
| Intel Core Ultra 7 270K Plus (v6.92.6600) | |
| Intel Core Ultra 9 285K (v6.92.6600) | |
| AMD Ryzen 7 9850X3D (v8.20.8100) | |
| AMD Ryzen 7 9850X3D (v6.92.6600) | |
| AMD Ryzen 9 7900X (v6.70.6000) | |
| AMD Ryzen 9 9900X (v6.92.6600) | |
| Intel Core i9-14900K (v6.85.6300) | |
| Intel Core i9-14900K (v8.20.8100) | |
| Intel Core i9-13900K (v6.75.6100) | |
| Intel Core i7-14700K (v6.92.6600) | |
| AMD Ryzen 7 9800X3D (v6.92.6600) | |
| AMD Ryzen 7 7800X3D (v6.85.6300) | |
| Intel Core Ultra 5 250K Plus (v6.92.6600) | |
| Intel Core Ultra 5 250K Plus (v8.20.8100) | |
| AMD Ryzen 7 9700X (v6.92.6600) | |
| Intel Core i5-14600K (v6.85.6300) | |
| Intel Core i5-13600K (v6.75.6100) | |
| AMD Ryzen 5 9600X (v6.92.6600) | |
| Intel Core Ultra 5 245K (v6.92.6600) | |
| Intel Core i9-12900K (v6.50.5800) | |
| Intel Core i5-12600K (v6.50.5800) | |
| AIDA64 / CPU SHA3 | |
| AMD Ryzen 9 7950X3D (v6.85.6300) | |
| Intel Core Ultra 9 285K (v6.92.6600) | |
| Intel Core Ultra 7 270K Plus (v8.20.8100) | |
| Intel Core Ultra 7 270K Plus (v6.92.6600) | |
| AMD Ryzen 9 9950X (v6.92.6600) | |
| AMD Ryzen 9 9950X3D (v6.92.6600) | |
| AMD Ryzen 9 7950X (v6.75.6100) | |
| Intel Core i9-13900K (v6.75.6100) | |
| Intel Core i9-14900K (v6.85.6300) | |
| Intel Core i9-14900K (v8.20.8100) | |
| AMD Ryzen 9 9900X (v6.92.6600) | |
| Intel Core i7-14700K (v6.92.6600) | |
| AMD Ryzen 9 7900X (v6.70.6000) | |
| AMD Ryzen 7 9850X3D (v8.20.8100) | |
| AMD Ryzen 7 9850X3D (v6.92.6600) | |
| Intel Core Ultra 5 250K Plus (v6.92.6600) | |
| Intel Core Ultra 5 250K Plus (v8.20.8100) | |
| AMD Ryzen 7 9800X3D (v6.92.6600) | |
| Intel Core i5-14600K (v6.85.6300) | |
| AMD Ryzen 7 9700X (v6.92.6600) | |
| AMD Ryzen 7 7800X3D (v6.85.6300) | |
| Intel Core i5-13600K (v6.75.6100) | |
| Intel Core i9-12900K (v6.50.5800) | |
| Intel Core Ultra 5 245K (v6.92.6600) | |
| AMD Ryzen 5 9600X (v6.92.6600) | |
| Intel Core i5-12600K (v6.50.5800) | |
| AIDA64 / CPU Queen | |
| AMD Ryzen 9 7950X (v6.75.6100) | |
| AMD Ryzen 9 7950X3D (v6.85.6300) | |
| AMD Ryzen 9 9950X (v6.92.6600) | |
| AMD Ryzen 9 9950X3D (v6.92.6600) | |
| AMD Ryzen 9 7900X (v6.70.6000) | |
| Intel Core i7-14700K (v6.92.6600) | |
| Intel Core i9-14900K (v6.85.6300) | |
| Intel Core i9-13900K (v6.75.6100) | |
| AMD Ryzen 9 9900X (v6.92.6600) | |
| Intel Core Ultra 7 270K Plus (v6.92.6600) | |
| Intel Core Ultra 9 285K (v6.92.6600) | |
| AMD Ryzen 7 9850X3D (v6.92.6600) | |
| Intel Core i5-14600K (v6.85.6300) | |
| AMD Ryzen 7 7800X3D (v6.85.6300) | |
| Intel Core i5-13600K (v6.75.6100) | |
| AMD Ryzen 7 9700X (v6.92.6600) | |
| AMD Ryzen 7 9800X3D (v6.92.6600) | |
| Intel Core i9-12900K (v6.50.5800) | |
| AMD Ryzen 5 9600X (v6.92.6600) | |
| Intel Core Ultra 5 250K Plus (v6.92.6600) | |
| Intel Core i5-12600K (v6.50.5800) | |
| Intel Core Ultra 5 245K (v6.92.6600) | |
| AIDA64 / FPU SinJulia | |
| AMD Ryzen 9 9950X (v6.92.6600) | |
| AMD Ryzen 9 9950X3D (v6.92.6600) | |
| AMD Ryzen 9 7950X (v6.75.6100) | |
| AMD Ryzen 9 7950X3D (v6.85.6300) | |
| AMD Ryzen 9 9900X (v6.92.6600) | |
| AMD Ryzen 9 7900X (v6.70.6000) | |
| Intel Core i9-14900K (v6.85.6300) | |
| Intel Core i9-14900K (v8.20.8100) | |
| Intel Core i9-13900K (v6.75.6100) | |
| Intel Core i7-14700K (v6.92.6600) | |
| AMD Ryzen 7 9850X3D (v8.20.8100) | |
| AMD Ryzen 7 9850X3D (v6.92.6600) | |
| AMD Ryzen 7 9700X (v6.92.6600) | |
| AMD Ryzen 7 9800X3D (v6.92.6600) | |
| AMD Ryzen 7 7800X3D (v6.85.6300) | |
| Intel Core Ultra 7 270K Plus (v8.20.8100) | |
| Intel Core Ultra 7 270K Plus (v6.92.6600) | |
| Intel Core Ultra 9 285K (v6.92.6600) | |
| Intel Core i9-12900K (v6.50.5800) | |
| AMD Ryzen 5 9600X (v6.92.6600) | |
| Intel Core i5-14600K (v6.85.6300) | |
| Intel Core i5-13600K (v6.75.6100) | |
| Intel Core i5-12600K (v6.50.5800) | |
| Intel Core Ultra 5 250K Plus (v6.92.6600) | |
| Intel Core Ultra 5 250K Plus (v8.20.8100) | |
| Intel Core Ultra 5 245K (v6.92.6600) | |
| AIDA64 / FPU Mandel | |
| AMD Ryzen 9 7950X3D (v6.85.6300) | |
| AMD Ryzen 9 9950X3D (v6.92.6600) | |
| AMD Ryzen 9 9950X (v6.92.6600) | |
| Intel Core Ultra 7 270K Plus (v8.20.8100) | |
| Intel Core Ultra 7 270K Plus (v6.92.6600) | |
| AMD Ryzen 9 7950X (v6.75.6100) | |
| AMD Ryzen 7 9850X3D (v8.20.8100) | |
| AMD Ryzen 7 9850X3D (v6.92.6600) | |
| Intel Core Ultra 9 285K (v6.92.6600) | |
| AMD Ryzen 9 7900X (v6.70.6000) | |
| AMD Ryzen 9 9900X (v6.92.6600) | |
| Intel Core i9-14900K (v6.85.6300) | |
| Intel Core i9-14900K (v8.20.8100) | |
| Intel Core i9-13900K (v6.75.6100) | |
| AMD Ryzen 7 9800X3D (v6.92.6600) | |
| Intel Core i7-14700K (v6.92.6600) | |
| AMD Ryzen 7 7800X3D (v6.85.6300) | |
| Intel Core Ultra 5 250K Plus (v6.92.6600) | |
| Intel Core Ultra 5 250K Plus (v8.20.8100) | |
| AMD Ryzen 7 9700X (v6.92.6600) | |
| Intel Core i5-14600K (v6.85.6300) | |
| Intel Core i5-13600K (v6.75.6100) | |
| AMD Ryzen 5 9600X (v6.92.6600) | |
| Intel Core Ultra 5 245K (v6.92.6600) | |
| Intel Core i9-12900K (v6.50.5800) | |
| Intel Core i5-12600K (v6.50.5800) | |
| AIDA64 / CPU AES | |
| AMD Ryzen 9 9900X (v6.92.6600) | |
| AMD Ryzen 9 7950X (v6.75.6100) | |
| AMD Ryzen 9 7950X3D (v6.85.6300) | |
| AMD Ryzen 7 9700X (v6.92.6600) | |
| Intel Core i9-14900K (v6.85.6300) | |
| Intel Core i9-14900K (v8.20.8100) | |
| Intel Core i9-13900K (v6.75.6100) | |
| AMD Ryzen 9 7900X (v6.70.6000) | |
| AMD Ryzen 5 9600X (v6.92.6600) | |
| Intel Core Ultra 9 285K (v6.92.6600) | |
| Intel Core i5-14600K (v6.85.6300) | |
| AMD Ryzen 7 7800X3D (v6.85.6300) | |
| Intel Core i5-13600K (v6.75.6100) | |
| AMD Ryzen 9 9950X (v6.92.6600) | |
| AMD Ryzen 9 9950X3D (v6.92.6600) | |
| Intel Core i7-14700K (v6.92.6600) | |
| Intel Core Ultra 7 270K Plus (v6.92.6600) | |
| Intel Core Ultra 7 270K Plus (v8.20.8100) | |
| Intel Core i9-12900K (v6.50.5800) | |
| AMD Ryzen 7 9850X3D (v8.20.8100) | |
| AMD Ryzen 7 9850X3D (v6.92.6600) | |
| AMD Ryzen 7 9800X3D (v6.92.6600) | |
| Intel Core Ultra 5 250K Plus (v6.92.6600) | |
| Intel Core Ultra 5 250K Plus (v8.20.8100) | |
| Intel Core Ultra 5 245K (v6.92.6600) | |
| Intel Core i5-12600K (v6.50.5800) | |
| AIDA64 / CPU ZLib | |
| AMD Ryzen 9 9950X3D (v6.92.6600) | |
| AMD Ryzen 9 9950X (v6.92.6600) | |
| Intel Core i9-14900K (v6.85.6300) | |
| Intel Core i9-14900K (v8.20.8100) | |
| Intel Core i9-13900K (v6.75.6100) | |
| Intel Core Ultra 7 270K Plus (v6.92.6600) | |
| Intel Core Ultra 7 270K Plus (v8.20.8100) | |
| AMD Ryzen 9 7950X (v6.75.6100) | |
| Intel Core Ultra 9 285K (v6.92.6600) | |
| AMD Ryzen 9 7950X3D (v6.85.6300) | |
| Intel Core i7-14700K (v6.92.6600) | |
| AMD Ryzen 9 9900X (v6.92.6600) | |
| AMD Ryzen 9 7900X (v6.70.6000) | |
| Intel Core i9-12900K (v6.50.5800) | |
| Intel Core i5-14600K (v6.85.6300) | |
| Intel Core i5-13600K (v6.75.6100) | |
| AMD Ryzen 7 9800X3D (v6.92.6600) | |
| AMD Ryzen 7 9850X3D (v6.92.6600) | |
| AMD Ryzen 7 9850X3D (v8.20.8100) | |
| Intel Core Ultra 5 250K Plus (v6.92.6600) | |
| Intel Core Ultra 5 250K Plus (v8.20.8100) | |
| AMD Ryzen 7 9700X (v6.92.6600) | |
| AMD Ryzen 7 7800X3D (v6.85.6300) | |
| AMD Ryzen 5 9600X (v6.92.6600) | |
| Intel Core i5-12600K (v6.50.5800) | |
| Intel Core Ultra 5 245K (v6.92.6600) | |
| AIDA64 / FP64 Ray-Trace | |
| AMD Ryzen 9 9950X (v6.92.6600) | |
| AMD Ryzen 9 9950X3D (v6.92.6600) | |
| AMD Ryzen 9 9900X (v6.92.6600) | |
| AMD Ryzen 9 7950X (v6.75.6100) | |
| AMD Ryzen 9 7950X3D (v6.85.6300) | |
| AMD Ryzen 7 9800X3D (v6.92.6600) | |
| AMD Ryzen 7 9850X3D (v8.20.8100) | |
| AMD Ryzen 7 9850X3D (v6.92.6600) | |
| Intel Core Ultra 7 270K Plus (v6.92.6600) | |
| Intel Core Ultra 7 270K Plus (v8.20.8100) | |
| Intel Core Ultra 9 285K (v6.92.6600) | |
| AMD Ryzen 7 9700X (v6.92.6600) | |
| Intel Core i9-14900K (v6.85.6300) | |
| Intel Core i9-14900K (v8.20.8100) | |
| Intel Core i9-13900K (v6.75.6100) | |
| AMD Ryzen 5 9600X (v6.92.6600) | |
| AMD Ryzen 9 7900X (v6.70.6000) | |
| Intel Core i7-14700K (v6.92.6600) | |
| AMD Ryzen 7 7800X3D (v6.85.6300) | |
| Intel Core i5-14600K (v6.85.6300) | |
| Intel Core Ultra 5 250K Plus (v6.92.6600) | |
| Intel Core Ultra 5 250K Plus (v8.20.8100) | |
| Intel Core i5-13600K (v6.75.6100) | |
| Intel Core Ultra 5 245K (v6.92.6600) | |
| Intel Core i9-12900K (v6.50.5800) | |
| Intel Core i5-12600K (v6.50.5800) | |
| AIDA64 / CPU PhotoWorxx | |
| Intel Core Ultra 7 270K Plus (v8.20.8100) | |
| Intel Core Ultra 7 270K Plus (v6.92.6600) | |
| Intel Core i9-14900K (v6.85.6300) | |
| Intel Core i9-14900K (v8.20.8100) | |
| Intel Core i5-14600K (v6.85.6300) | |
| Intel Core Ultra 9 285K (v6.92.6600) | |
| Intel Core i7-14700K (v6.92.6600) | |
| AMD Ryzen 9 7950X3D (v6.85.6300) | |
| AMD Ryzen 9 9950X3D (v6.92.6600) | |
| Intel Core i9-13900K (v6.75.6100) | |
| Intel Core i5-12600K (v6.50.5800) | |
| Intel Core i5-13600K (v6.75.6100) | |
| AMD Ryzen 9 9900X (v6.92.6600) | |
| Intel Core i9-12900K (v6.50.5800) | |
| Intel Core Ultra 5 250K Plus (v8.20.8100) | |
| Intel Core Ultra 5 250K Plus (v6.92.6600) | |
| AMD Ryzen 9 9950X (v6.92.6600) | |
| AMD Ryzen 7 9850X3D (v8.20.8100) | |
| AMD Ryzen 7 9850X3D (v6.92.6600) | |
| AMD Ryzen 7 7800X3D (v6.85.6300) | |
| AMD Ryzen 9 7950X (v6.75.6100) | |
| AMD Ryzen 7 9800X3D (v6.92.6600) | |
| AMD Ryzen 9 7900X (v6.70.6000) | |
| AMD Ryzen 7 9700X (v6.92.6600) | |
| AMD Ryzen 5 9600X (v6.92.6600) | |
| Intel Core Ultra 5 245K (v6.92.6600) | |
3DMark 11: 1280x720 Performance Physics
3DMark: 1920x1080 Fire Strike Physics | 2560x1440 Time Spy CPU
CrossMark: Overall | Responsiveness | Creativity | Productivity
PCMark 10: Score | Essentials | Productivity | Digital Content Creation
AIDA64: FP32 Ray-Trace | FPU Julia | CPU SHA3 | CPU Queen | FPU SinJulia | FPU Mandel | CPU AES | CPU ZLib | FP64 Ray-Trace | CPU PhotoWorxx
| PCMark 10 Score | 12382 punti | |
Aiuto | ||
Per valutare la latenza intra-CCD, abbiamo utilizzato MicroBenchX con SMT disattivato. La latenza all'interno del CCD è stata nominale, con il valore più basso di 19,5 ns tra il Core 2 e il Core 1. La latenza intra-CCD più elevata è stata di 23 ns tra il Core 0 e il Core 2.
| Core 0 | Core 1 | Core 2 | Core 3 | Core 4 | Core 5 | Core 6 | Core 7 | |
|---|---|---|---|---|---|---|---|---|
| Core 0 | 22.5 | 23 | 22.8 | 20 | 21.5 | 20 | 20.5 | |
| Core 1 | 22.5 | 21 | 22 | 22.5 | 21 | 20.5 | 21.8 | |
| Core 2 | 23 | 21 | 21 | 19.5 | 22.5 | 22.3 | 21.5 | |
| Core 3 | 22.8 | 22 | 21 | 22.5 | 20.8 | 21 | 19.8 | |
| Core 4 | 20 | 22.5 | 19.5 | 22.5 | 21.8 | 22.8 | 22 | |
| Core 5 | 21.5 | 21 | 22.5 | 20.8 | 21.8 | 22.8 | 22.8 | |
| Core 6 | 20 | 20.5 | 22.3 | 21 | 22.8 | 22.8 | 20.3 | |
| Core 7 | 20.5 | 21.8 | 21.5 | 19.8 | 22 | 22.8 | 20.3 |
* ... Meglio usare valori piccoli
prestazioni 3D e di gioco: Vantaggi minimi rispetto a Ryzen 7 9800X3D
Ryzen 7 9850X3D si comporta male nei test grafici 3DMark Time Spy e Fire Strike. Abbiamo notato questo comportamento anomalo anche in precedenza con il Ryzen 9 9950X3D.
In effetti, entrambe le CPU registrano numeri simili in questi benchmark.
| 3DMark 11 Performance | 71510 punti | |
| 3DMark Fire Strike Score | 53418 punti | |
| 3DMark Time Spy Score | 27672 punti | |
Aiuto | ||
Ryzen 7 9850X3D è complessivamente più veloce del 25% e del 36% rispetto al Core Ultra 7 270K Plus e al Core Ultra 5 250K Plus, rispettivamente, nella nostra selezione di giochi a 720p e 1080p.
Tuttavia, la CPU non è molto più veloce del Ryzen 7 9800X3D a queste risoluzioni.
Dove il Ryzen 7 9850X3D ha effettivamente un vantaggio è nei titoli estremamente legati alla CPU come X-Plane 11, Dota 2 Reborne Baldur's Gate 3. Il boost clock più elevato consente alla CPU di superare Ryzen 7 9800X in questi giochi.
| CPU Limit Gaming Performance rating - Percent | |
| AMD Ryzen 7 9850X3D | |
| AMD Ryzen 7 9800X3D | |
| AMD Ryzen 9 9950X3D | |
| AMD Ryzen 7 7800X3D -3! | |
| AMD Ryzen 9 7950X3D -3! | |
| Intel Core i9-14900K -3! | |
| AMD Ryzen 7 9700X | |
| AMD Ryzen 9 9900X | |
| AMD Ryzen 9 9950X -3! | |
| AMD Ryzen 5 9600X | |
| Intel Core Ultra 7 270K Plus | |
| Intel Core i5-14600K -3! | |
| Intel Core Ultra 9 285K | |
| Intel Core Ultra 5 250K Plus | |
| Intel Core i7-14700K -3! | |
| Intel Core Ultra 5 245K | |
Troviamo tendenze simili alle impostazioni QHD e 4K Ultra. A queste risoluzioni vincolate dalla GPU, le differenze tra Ryzen 7 9850X3D e 9800X3D sono praticamente nulle e rientrano nell'errore di arrotondamento.
Il Ryzen 9 9900X e il Core i9-14900K hanno combattuto bene, ma i chip AMD X3D sono chiaramente in testa, dimostrando l'utilità della V-Cache 3D, soprattutto in termini di minimi più stabili dell'1% e dello 0,1%.
| QHD and 4K Gaming Performance rating - Percent | |
| AMD Ryzen 7 9800X3D | |
| AMD Ryzen 7 7800X3D -2! | |
| AMD Ryzen 7 9850X3D | |
| AMD Ryzen 9 9950X3D | |
| AMD Ryzen 9 7950X3D -2! | |
| Intel Core i9-14900K -2! | |
| AMD Ryzen 7 9700X | |
| AMD Ryzen 9 9900X | |
| Intel Core Ultra 7 270K Plus | |
| Intel Core i5-14600K -2! | |
| AMD Ryzen 5 9600X | |
| Intel Core Ultra 5 250K Plus | |
| AMD Ryzen 9 9950X -2! | |
| Intel Core Ultra 9 285K | |
| Intel Core i7-14700K -2! | |
| Intel Core Ultra 5 245K | |
| The Witcher 3 - 3840x2160 Ultra Graphics & Postprocessing (HBAO+) | |
| Intel Core i9-14900K | |
| Intel Core Ultra 5 245K | |
| AMD Ryzen 7 9800X3D | |
| Intel Core Ultra 7 270K Plus | |
| AMD Ryzen 7 7800X3D | |
| Intel Core Ultra 5 250K Plus | |
| Intel Core i5-14600K | |
| AMD Ryzen 9 7950X3D | |
| AMD Ryzen 5 9600X | |
| Intel Core i7-14700K | |
| Intel Core Ultra 9 285K | |
| AMD Ryzen 7 9700X | |
| AMD Ryzen 9 9950X3D | |
| AMD Ryzen 9 9900X | |
| AMD Ryzen 7 9850X3D | |
| AMD Ryzen 9 9950X | |
AMD Ryzen 7 9850X3D con Nvidia GeForce RTX 4090
| basso | medio | alto | ultra | QHD DLSS | QHD | 4K DLSS | 4K | |
|---|---|---|---|---|---|---|---|---|
| The Witcher 3 (2015) | 835 | 784 | 603 | 282 | 242 | 267 | ||
| Dota 2 Reborn (2015) | 399 | 352 | 335 | 309 | 297 | |||
| Final Fantasy XV Benchmark (2018) | 235 | 234 | 225 | 202 | 137 | |||
| X-Plane 11.11 (2018) | 247 | 229 | 202 | 165.8 | ||||
| Far Cry 5 (2018) | 375 | 333 | 321 | 304 | 285 | 179 | ||
| Strange Brigade (2018) | 745 | 638 | 619 | 589 | 513 | 277 | ||
| Shadow of the Tomb Raider (2018) | 402 | 374 | 385 | 370 | 311 | 178.7 | ||
| Borderlands 3 (2019) | 315 | 297 | 263 | 246 | 213 | 123.3 | ||
| F1 22 (2022) | 494 | 508 | 444 | 213 | 155.6 | 81.7 | ||
| Baldur's Gate 3 (2023) | 461 | 372 | 323 | 321 | 308 | 244 | 208 | 139.8 |
| Cyberpunk 2077 (2023) | 264 | 261 | 236 | 211 | 157.7 | 147 | 80.1 | 71.7 |
| Assassin's Creed Mirage (2023) | 287 | 268 | 255 | 209 | 175 | 154 | 120 | |
| Avatar Frontiers of Pandora (2023) | 193.8 | 189.9 | 177.4 | 142.2 | 103 | 86.8 | 56.2 | |
| Black Myth: Wukong (2024) | 194 | 151 | 122 | 81 | 86 | 65 | 66 | 41 |
| Assassin's Creed Shadows (2025) | 135 | 129 | 117 | 95 | 95 | 82 | 80 | 63 |
| F1 25 (2025) | 409 | 389 | 367 | 88.8 | 96.2 | 56.4 | 50.7 | 27.9 |
| Death Stranding 2 (2026) | 180.3 | 158.8 | 146.1 | 123.9 | 124.4 | 106 | 99.1 | 71.8 |
Consumo energetico: Questa volta Intel si aggiudica la corona dell'efficienza
Ryzen 7 9850X3D assorbe il 19% di energia in più rispetto al Core Ultra 7 270K Plus durante l'esecuzione di Cinebench R23 single-core.
Tuttavia, quest'ultimo assorbe il 41% di energia in più nei test multi-core di Cinebench, grazie al numero maggiore di core.
C'è solo una differenza del 3% nel consumo di energia in single e multi-core tra il Ryzen 7 9850X3D e il 9800X3D.
Durante il gioco The Witcher 3 a 1080p Ultra, Ryzen 7 9850X3D consuma il 4% in meno rispetto a Ryzen 7 9800X3D e al Core Ultra 7 270K Plus.
Tutte e tre le CPU mostrano consumi più o meno simili in Cyberpunk 2077: Phantom Liberty a 1080p Ultra.
Consumo di energia: Monitor esterno
| Power Consumption / Cinebench R15 Multi (external Monitor) | |
| Intel Core i9-14900K, NVIDIA GeForce RTX 4090 | |
| Intel Core i7-14700K, NVIDIA GeForce RTX 4090 | |
| Intel Core Ultra 9 285K, NVIDIA GeForce RTX 4090 (Idle: 76.2 W) | |
| Intel Core Ultra 7 270K Plus, NVIDIA GeForce RTX 4090 | |
| Intel Core i5-14600K, NVIDIA GeForce RTX 4090 | |
| AMD Ryzen 9 9950X, NVIDIA GeForce RTX 4090 (Idle: 100 W) | |
| AMD Ryzen 9 9950X3D, NVIDIA GeForce RTX 4090 | |
| AMD Ryzen 9 9900X, NVIDIA GeForce RTX 4090 (Idle: 85.1 W) | |
| AMD Ryzen 9 7950X3D, NVIDIA GeForce RTX 4090 | |
| AMD Ryzen 7 9850X3D, NVIDIA GeForce RTX 4090 (Idle: 96 W) | |
| Intel Core Ultra 5 245K, NVIDIA GeForce RTX 4090 | |
| AMD Ryzen 7 9800X3D, NVIDIA GeForce RTX 4090 | |
| Intel Core Ultra 5 250K Plus, NVIDIA GeForce RTX 4090 | |
| AMD Ryzen 5 9600X, NVIDIA GeForce RTX 4090 | |
| AMD Ryzen 7 7800X3D, NVIDIA GeForce RTX 4090 | |
| AMD Ryzen 7 9700X, NVIDIA GeForce RTX 4090 (Idle: 83 W) | |
| Power Consumption / Cinebench R20 Single (external Monitor) | |
| Intel Core i7-14700K, NVIDIA GeForce RTX 4090 | |
| AMD Ryzen 9 9950X, NVIDIA GeForce RTX 4090 (100) | |
| AMD Ryzen 9 9950X3D, NVIDIA GeForce RTX 4090 | |
| AMD Ryzen 7 9850X3D, NVIDIA GeForce RTX 4090 (96) | |
| AMD Ryzen 9 9900X, NVIDIA GeForce RTX 4090 (85.1) | |
| AMD Ryzen 7 9700X, NVIDIA GeForce RTX 4090 (83) | |
| Intel Core Ultra 9 285K, NVIDIA GeForce RTX 4090 (76.2) | |
| Power Consumption / Cinebench R20 Multi (external Monitor) | |
| Intel Core i7-14700K, NVIDIA GeForce RTX 4090 | |
| Intel Core Ultra 9 285K, NVIDIA GeForce RTX 4090 (76.2) | |
| AMD Ryzen 9 9950X, NVIDIA GeForce RTX 4090 (100) | |
| AMD Ryzen 9 9950X3D, NVIDIA GeForce RTX 4090 | |
| AMD Ryzen 9 9900X, NVIDIA GeForce RTX 4090 (85.1) | |
| AMD Ryzen 7 9850X3D, NVIDIA GeForce RTX 4090 (96) | |
| AMD Ryzen 7 9700X, NVIDIA GeForce RTX 4090 (83) | |
| Power Consumption / Cinebench 2024 Single Power (external Monitor) | |
| AMD Ryzen 9 9950X3D, NVIDIA GeForce RTX 4090 | |
| AMD Ryzen 9 9950X, NVIDIA GeForce RTX 4090 | |
| AMD Ryzen 9 9900X, NVIDIA GeForce RTX 4090 | |
| AMD Ryzen 7 9850X3D, NVIDIA GeForce RTX 4090 | |
| AMD Ryzen 7 9700X, NVIDIA GeForce RTX 4090 | |
| Intel Core Ultra 9 285K, NVIDIA GeForce RTX 4090 | |
| Power Consumption / Cinebench 2024 Multi Power (external Monitor) | |
| Intel Core Ultra 9 285K, NVIDIA GeForce RTX 4090 (76.2) | |
| AMD Ryzen 9 9950X, NVIDIA GeForce RTX 4090 (100) | |
| AMD Ryzen 9 9950X3D, NVIDIA GeForce RTX 4090 | |
| AMD Ryzen 9 9900X, NVIDIA GeForce RTX 4090 (85.1) | |
| AMD Ryzen 7 9850X3D, NVIDIA GeForce RTX 4090 (96) | |
| AMD Ryzen 7 9700X, NVIDIA GeForce RTX 4090 (83) | |
| Power Consumption / Prime95 V2810 Stress (external Monitor) | |
| Intel Core i9-14900K, NVIDIA GeForce RTX 4090 | |
| Intel Core i7-14700K, NVIDIA GeForce RTX 4090 | |
| Intel Core Ultra 9 285K, NVIDIA GeForce RTX 4090 (Idle: 76.2 W) | |
| Intel Core i5-14600K, NVIDIA GeForce RTX 4090 | |
| Intel Core Ultra 7 270K Plus, NVIDIA GeForce RTX 4090 | |
| AMD Ryzen 9 9950X3D, NVIDIA GeForce RTX 4090 | |
| AMD Ryzen 9 9950X, NVIDIA GeForce RTX 4090 (Idle: 100 W) | |
| AMD Ryzen 9 9900X, NVIDIA GeForce RTX 4090 (Idle: 85.1 W) | |
| AMD Ryzen 9 7950X3D, NVIDIA GeForce RTX 4090 | |
| AMD Ryzen 7 9800X3D, NVIDIA GeForce RTX 4090 | |
| Intel Core Ultra 5 245K, NVIDIA GeForce RTX 4090 | |
| AMD Ryzen 7 9850X3D, NVIDIA GeForce RTX 4090 (Idle: 96 W) | |
| Intel Core Ultra 5 250K Plus, NVIDIA GeForce RTX 4090 | |
| AMD Ryzen 7 7800X3D, NVIDIA GeForce RTX 4090 | |
| AMD Ryzen 5 9600X, NVIDIA GeForce RTX 4090 | |
| AMD Ryzen 7 9700X, NVIDIA GeForce RTX 4090 (Idle: 83 W) | |
| Power Consumption / The Witcher 3 ultra (external Monitor) | |
| Intel Core i5-14600K, NVIDIA GeForce RTX 4090 | |
| Intel Core i9-14900K, NVIDIA GeForce RTX 4090 | |
| Intel Core i7-14700K, NVIDIA GeForce RTX 4090 | |
| AMD Ryzen 9 7950X3D, NVIDIA GeForce RTX 4090 | |
| AMD Ryzen 7 7800X3D, NVIDIA GeForce RTX 4090 | |
| AMD Ryzen 9 9950X3D, NVIDIA GeForce RTX 4090 | |
| AMD Ryzen 7 9800X3D, NVIDIA GeForce RTX 4090 | |
| Intel Core Ultra 5 245K, NVIDIA GeForce RTX 4090 | |
| AMD Ryzen 9 9950X, NVIDIA GeForce RTX 4090 (Idle: 100 W) | |
| Intel Core Ultra 7 270K Plus, NVIDIA GeForce RTX 4090 | |
| Intel Core Ultra 5 250K Plus, NVIDIA GeForce RTX 4090 | |
| AMD Ryzen 7 9850X3D, NVIDIA GeForce RTX 4090 (Idle: 96 W) | |
| AMD Ryzen 9 9900X, NVIDIA GeForce RTX 4090 (Idle: 85.1 W) | |
| Intel Core Ultra 9 285K, NVIDIA GeForce RTX 4090 (Idle: 76.2 W) | |
| AMD Ryzen 7 9700X, NVIDIA GeForce RTX 4090 (Idle: 83 W) | |
* ... Meglio usare valori piccoli
Il Core Ultra 7 270K Plus mostra un'efficienza energetica superiore del 30% e del 39% nelle prestazioni single-core e multi-core, rispettivamente, rispetto al Ryzen 7 9850X3D.
Nei giochi, la CPU Arrow Lake-S Refresh mostra ancora un'efficienza migliore, ma il divario si riduce significativamente al 5% questa volta.
| Power Consumption / Cinebench 2024 Single Power Efficiency - external Monitor | |
| Intel Core Ultra 9 285K, NVIDIA GeForce RTX 4090 | |
| AMD Ryzen 7 9700X, NVIDIA GeForce RTX 4090 | |
| AMD Ryzen 7 9850X3D, NVIDIA GeForce RTX 4090 | |
| AMD Ryzen 9 9900X, NVIDIA GeForce RTX 4090 | |
| AMD Ryzen 9 9950X3D, NVIDIA GeForce RTX 4090 | |
| AMD Ryzen 9 9950X, NVIDIA GeForce RTX 4090 | |
| Power Consumption / Cinebench 2024 Multi Power Efficiency - external Monitor | |
| AMD Ryzen 9 9950X3D, NVIDIA GeForce RTX 4090 | |
| Intel Core Ultra 9 285K, NVIDIA GeForce RTX 4090 | |
| AMD Ryzen 9 9950X, NVIDIA GeForce RTX 4090 | |
| AMD Ryzen 7 9700X, NVIDIA GeForce RTX 4090 | |
| AMD Ryzen 9 9900X, NVIDIA GeForce RTX 4090 | |
| AMD Ryzen 7 9850X3D, NVIDIA GeForce RTX 4090 | |
Le impressioni di Notebookcheck su AMD Ryzen 7 9850X3D
Ryzen 7 9850X3D pone ancora una volta AMD in prima linea nella corsa alla migliore CPU da gioco, nonostante gli sforzi concertati di Intel con Arrow Lake-S Refresh.
Tuttavia, Ryzen 7 9850X3D offre una scarsa differenziazione rispetto a Ryzen 7 9800X3D e non è un aggiornamento convincente nemmeno per i possessori di Ryzen 7 7800X3D.
Transparency
La selezione dei dispositivi da recensire viene effettuata dalla nostra redazione. Il campione di prova è stato fornito all'autore come prestito dal produttore o dal rivenditore ai fini di questa recensione. L'istituto di credito non ha avuto alcuna influenza su questa recensione, né il produttore ne ha ricevuto una copia prima della pubblicazione. Non vi era alcun obbligo di pubblicare questa recensione. In quanto società mediatica indipendente, Notebookcheck non è soggetta all'autorità di produttori, rivenditori o editori.
Ecco come Notebookcheck esegue i test
Ogni anno, Notebookcheck esamina in modo indipendente centinaia di laptop e smartphone utilizzando procedure standardizzate per garantire che tutti i risultati siano comparabili. Da circa 20 anni sviluppiamo continuamente i nostri metodi di prova e nel frattempo stabiliamo gli standard di settore. Nei nostri laboratori di prova, tecnici ed editori esperti utilizzano apparecchiature di misurazione di alta qualità. Questi test comportano un processo di validazione in più fasi. Il nostro complesso sistema di valutazione si basa su centinaia di misurazioni e parametri di riferimento ben fondati, che mantengono l'obiettività.
