Notebookcheck Logo
MSI Crosshair 16 HX AI in recensione

Recensione del portatile MSI Crosshair 16 HX AI: Prestazioni solide con limiti che non pregiudicano l'esperienza di gioco principale

Mirino sul bersaglio.

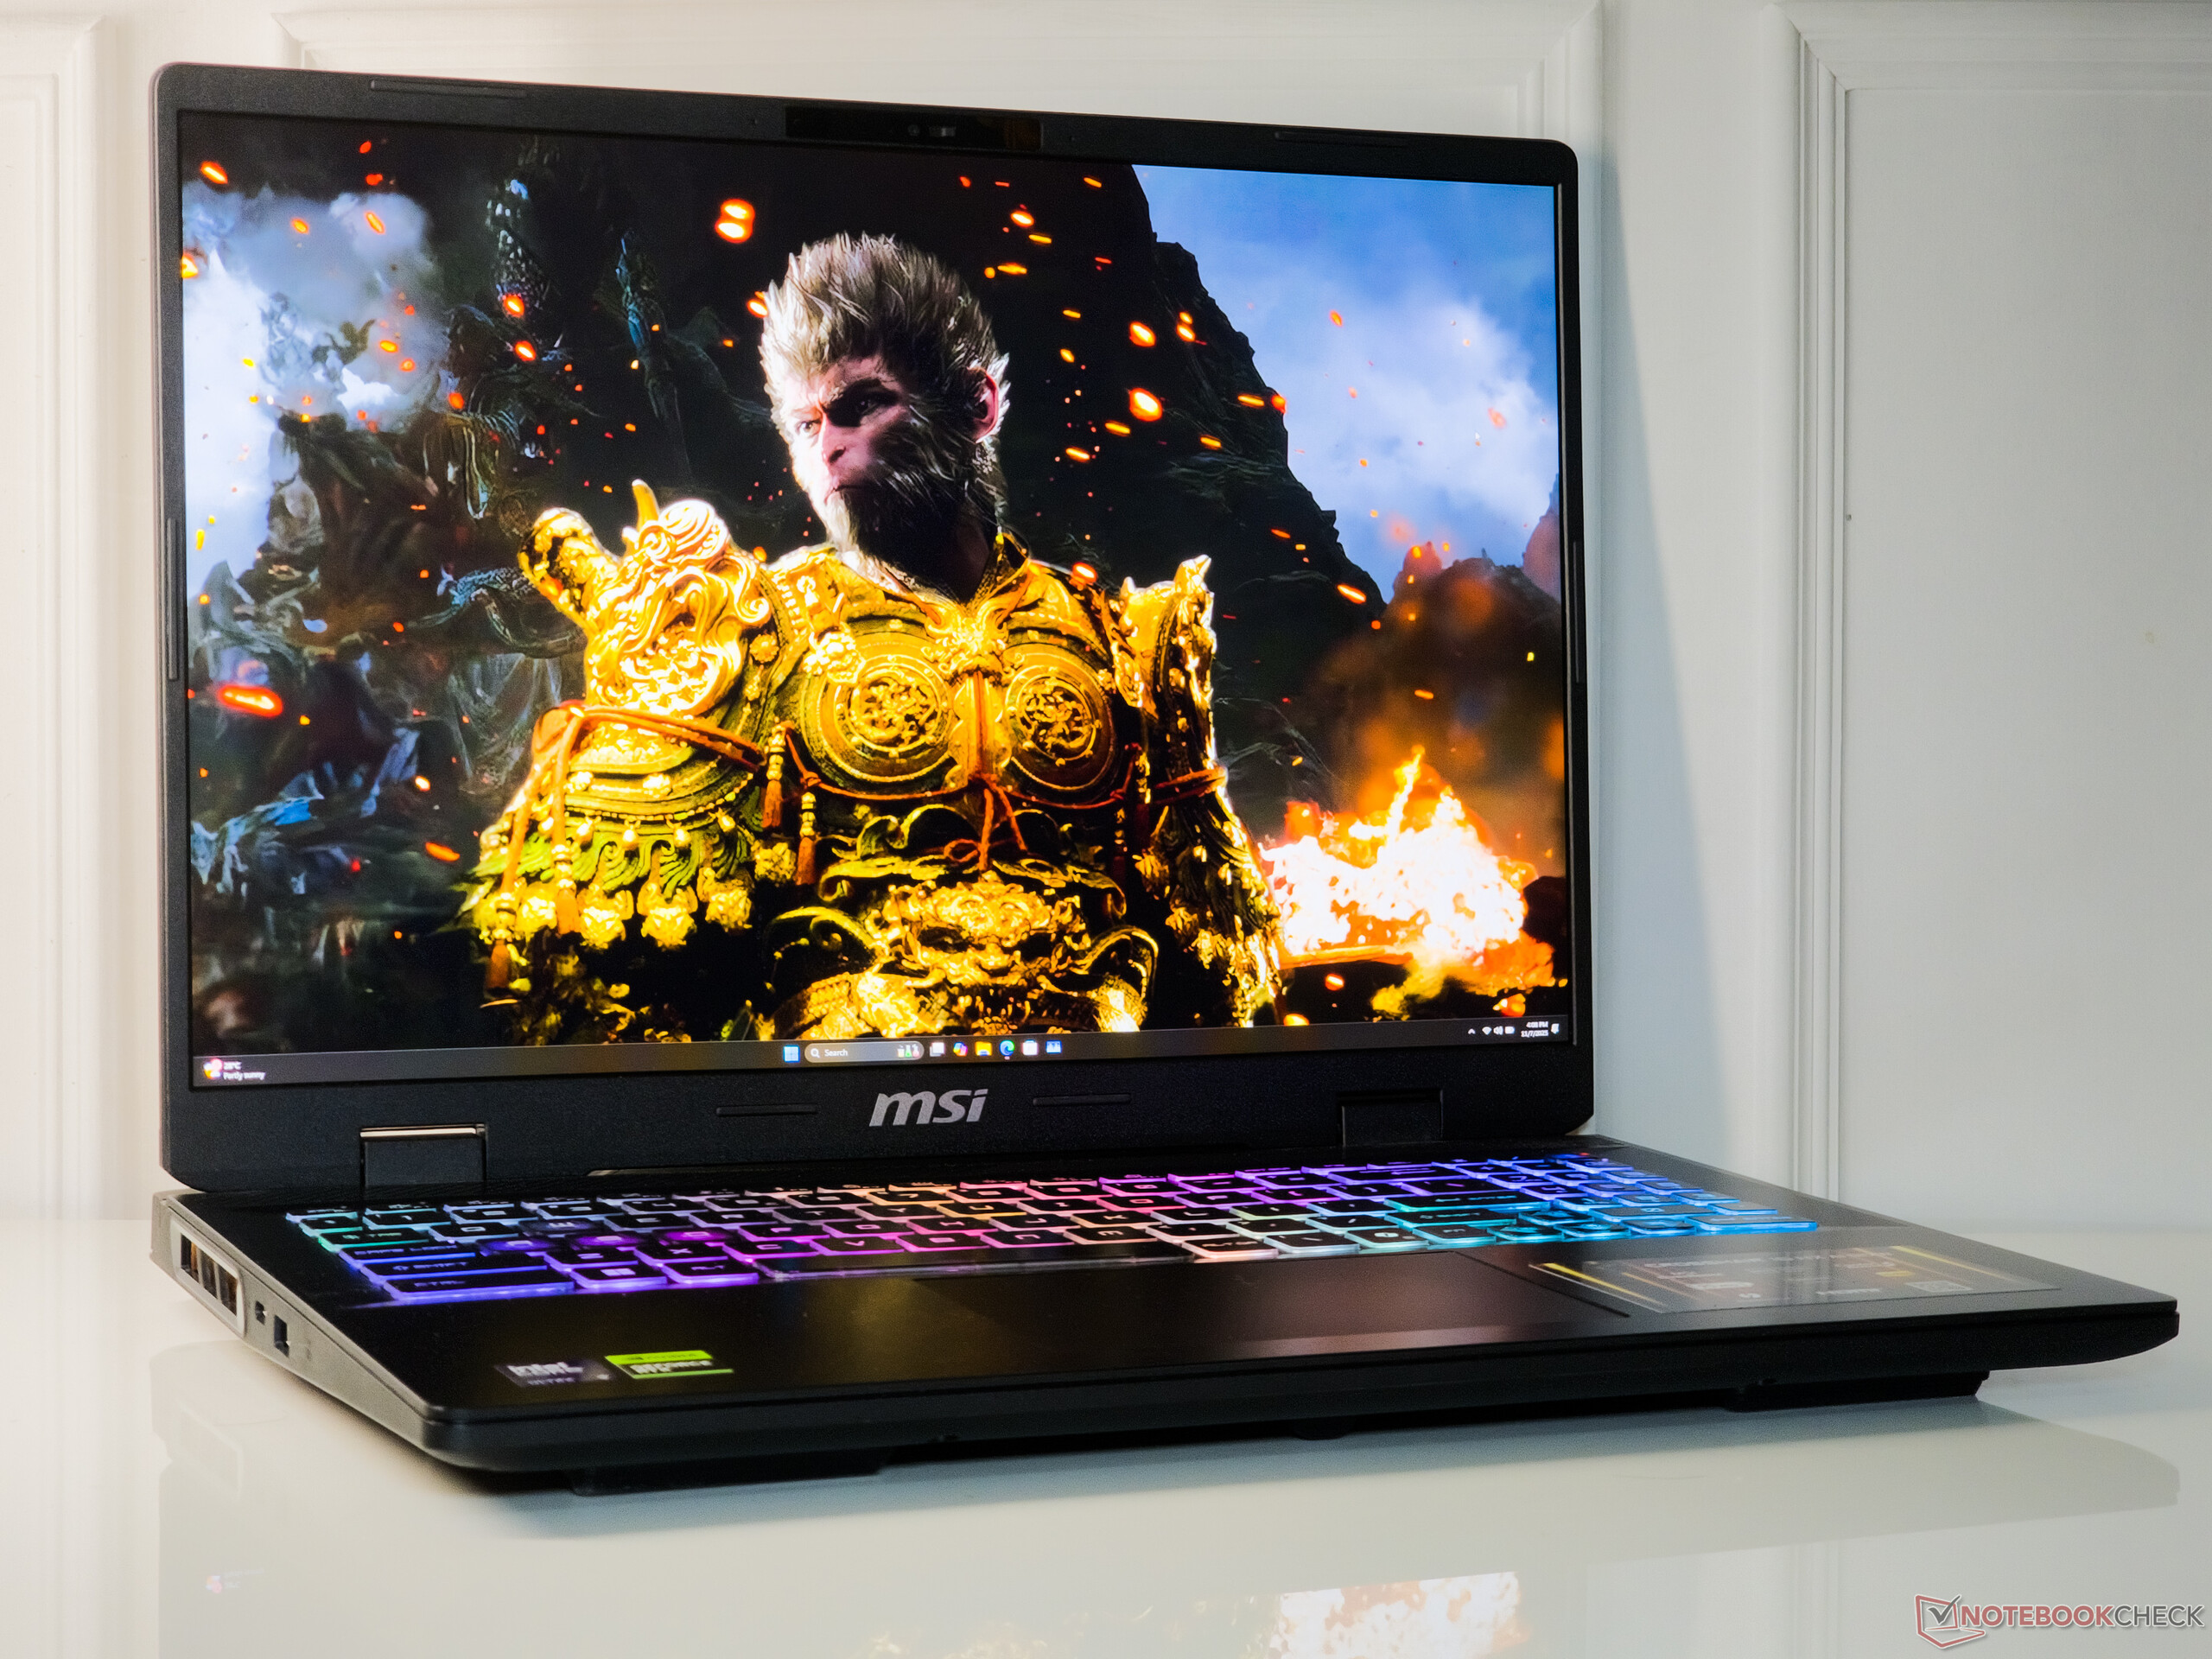
MSI Crosshair 16 HX AI mira a soddisfare i giocatori di fascia medio-alta con la sua combinazione di Core Ultra 9 275HX e RTX 5070 Laptop, ed è in grado di farlo per la maggior parte. Il Crosshair 16 HX AI è in grado di gestire abbastanza bene i giochi a 1440p e persino la creazione di contenuti, ma ci sono alcuni ovvi compromessi per tenere sotto controllo il prezzo.
Vaidyanathan Subramaniam, 👁 Vaidyanathan Subramaniam (traduzione a cura di DeepL / Ninh Duy) Pubblicato 🇺🇸 🇭🇺 ...
MSI Laptop / Notebook Gaming Nvidia Blackwell RTX 5000 Intel Arrow Lake

Verdetto: prestazioni forti con i compromessi previsti

Con un Intel Core Ultra 9 275HX e un Nvidia GeForce RTX 5070 Laptop, MSI Crosshair 16 HX AI è un capace laptop da gioco QHD per il 2025 che è anche abbastanza adatto alla creazione di contenuti.

Il Crosshair 16 HX AI è in grado di gestire i giochi a 1440p Ultra con frame rate accettabili, anche se i titoli ad alta intensità di VRAM possono rivelarsi una sfida, visti i miseri 8 GB di frame buffer del Laptop RTX 5070. DLSS4 e la generazione multi-frame possono aiutare, ma questo potrebbe non essere sempre di buon auspicio, soprattutto per gli sparatutto competitivi.

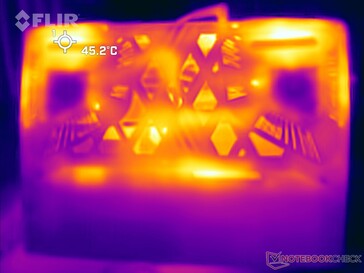
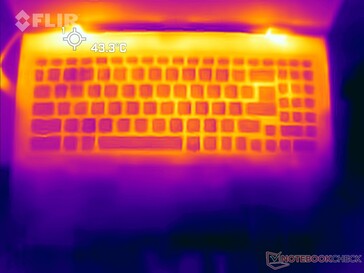
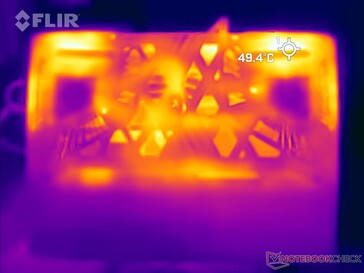
La modalità Prestazioni estreme scatena il pieno potenziale di Crosshair 16 HX AI, ma questo comporta un aumento delle emissioni di calore e di rumore, oltre a un maggiore consumo di energia.

Per il resto, MSI non ha tagliato nessun angolo in più rispetto a quanto avevamo già previsto. C'è poco da lamentarsi della costruzione in plastica e la connettività è ragionevole, anche se avremmo gradito una porta Thunderbolt 4/USB Type-C in più e migliori prestazioni di Wi-Fi 5.

Il display QHD+ a 240 Hz non è un mini-LED o un OLED, ma offre immagini impressionanti, tempi di risposta rapidi e assenza di PWM.

Nel complesso, MSI Crosshair 16 HX AI è adatto a chi è alla ricerca di un computer portatile decente per il gioco e la creazione di contenuti a 1440p intorno ai 2.000 dollari.

Pro

+ Buona qualità costruttiva complessiva
+ Vivido display QHD+ 240 Hz senza PWM
+ Prestazioni relativamente senza acceleratore
+ 8 GB di VRAM possono essere limitanti
+ Durata della batteria decente

Contro

- Solo una porta Thunderbolt 4/USB-C
- La velocità del Wi-Fi 5 potrebbe essere più veloce
- Nessun supporto HDR o sincronizzazione adattiva
- Lo scarico caldo può essere fastidioso durante l'uso del mouse
- Elevato consumo di energia in idle

Prezzo e disponibilità

Negli Stati Uniti, il Crosshair 16 HX AI è disponibile presso Micro Center a partire da 1.499,99 dollari per la variante Core Ultra 7 255HX.

In India, MSI Crosshair 16 HX AI parte da ₹1.59.990 per la variante Core Ultra 9 275HX + RTX 5060 su MSI.com e altri rivenditori, mentre la combinazione Core Ultra 9 275HX + RTX 5070 può essere acquistata a ₹1.99.990 tramite Amazon India.

Amazon Logo
$1,775.75
msi Crosshair 18 HX AI 18" 2560x1600 240Hz Display Gaming Laptop, Intel Core Ultra 9 275HX (24 Cores, 2.1-5.4 GHz), NVIDIA RTX 5070 8GB GDDR7, 32GB RAM, 1TB NVMe SSD, Windows 11 Home
  • $1,699.00
    msi Crosshair 16 HX AI 16" QHD+ 240Hz Display; Gaming Laptop - Gray, Intel Core Ultra 7 255HX 1.8GHz; NVIDIA GeForce RTX 5070 8GB GDDR7; 32GB DDR5-5600 RAM; 1TB NVMe SSD; WiFi 6E
  • $1,599.99
    MSI Crosshair A16 HX 16" QHD+ 240Hz Gaming Laptop: AMD Ryzen 9-8940HX, NVIDIA Geforce RTX 5060, 16GB DDR5, 1TB NVMe SSD, Type C, Wi-Fi 6E, Win 11 Home: Cosmo Gray D8WFKG-090US

Dopo aver recensito il MSI Crosshair A17 HX e il Crosshair 18 HX AIora rivolgiamo la nostra attenzione a MSI Crosshair 16 HX AI.

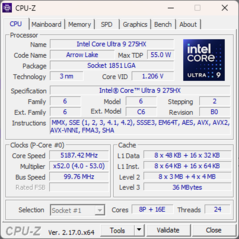
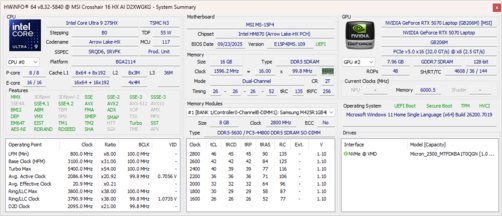
La nostra unità Crosshair 16 HX AI presenta il Core Ultra 9 275HX e una GPU RTX 5070 Laptop da 115 W, oltre a 16 GB di memoria DDR5-5600, un'unità SSD NVMe da 1 TB e un display QHD+ a 240 Hz di livello IPS in una struttura familiare Crosshair 16 HX D14 chassis.

Specifiche

MSI Crosshair 16 HX AI D2XWGKG (Crosshair 16 Serie)
Processore
Intel Core Ultra 9 275HX 24 x 2.1 - 5.4 GHz, 130 W PL2 / Short Burst, 100 W PL1 / Sustained, Arrow Lake-HX
Scheda grafica
NVIDIA GeForce RTX 5070 Laptop - 8 GB VRAM, Core: 2347 MHz, 115 W TDP, GDDR7, Game Ready Driver 581.57
Memoria
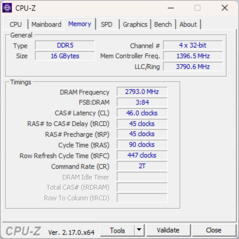
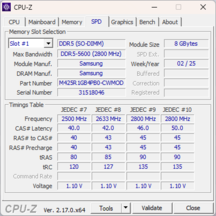
16 GB 
, DDR5-5600, Timings: 46-45-45-90
Schermo
16.00 pollici 16:10, 2560 x 1600 pixel 189 PPI, AUO B160QAN02.3, IPS, lucido: no, 240 Hz
Scheda madre
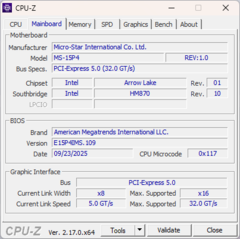
Intel HM870 (Arrow Lake-HX PCH)
Harddisk
Micron 2500 1TB MTFDKBA1T0QGN, 1024 GB 
, M.2 PCIe, 862 GB libera
Scheda audio
Intel Arrow Lake-S PCH - ACE (Audio Context Engine)
Porte di connessione
3 USB 3.0 / 3.1, 1 Thunderbolt 4, USB-C Power Delivery (PD), 1 HDMI, 1 DisplayPort, Connessioni Audio: 3.5 mm combo audio jack
Rete
Realtek RTL8168/8111 Gigabit-LAN (10/100/1000MBit/s), Intel Wi-Fi 6E AX211 (a/b/g/h/n = Wi-Fi 4/ac = Wi-Fi 5/ax = Wi-Fi 6/ Wi-Fi 6E 6 GHz), Bluetooth 5.3
Dimensioni
altezza x larghezza x profondità (in mm): 27.9 x 359 x 266.4
Batteria
90 Wh ioni di litio, 4-cell
Sistema Operativo
Microsoft Windows 11 Home
Camera
Webcam: 720p
Fotocamera Principale: 0.9 MPix
Altre caratteristiche
Casse: 2W Stereo Speakers, Tastiera: Chiclet, Illuminazione Tastiera: si, MSI Center, MSI App Player, Nahimic Audio, 12 Mesi Garanzia
Peso
2.5 kg
Prezzo
2500 EUR
Nota: il produttore potrebbe usare componenti di fornitori diversi pannelli dei diplay, drive o banchi di memoria con specifiche simili.


Telaio: Struttura in plastica con opzioni di connettività decenti

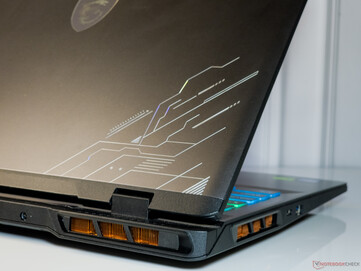
Crosshair 16 HX AI ha una struttura principalmente in plastica con finitura Cosmos Gray e un coperchio metallico che può essere completamente disteso con un angolo di 180°.

La qualità costruttiva è solida, con una flessione minima sul piano tastiera e sul coperchio.

La selezione delle porte è simile a quella di Crosshair 18 HX AI e comprende una porta Thunderbolt 4, 3 porte USB 3.2 Gen1 Type-A, un'uscita HDMI 2.1 e Gigabit Ethernet. Non abbiamo incontrato alcun ostacolo nel collegare le periferiche adiacenti.

MSI Crosshair 16 HX AI
MSI Crosshair 16 HX AI: Coperchio inferiore
MSI Crosshair 16 HX AI: Interno

Confronto delle dimensioni

364.38 mm 268.06 mm 25.95 mm 2.4 kg359 mm 266.4 mm 27.9 mm 2.5 kg357 mm 254 mm 26 mm 2.4 kg356.98 mm 265.43 mm 23.4 mm 2.5 kg354 mm 269 mm 25.7 mm 2.2 kg297 mm 210 mm 1 mm 5.7 g
A sinistra: Thunderbolt 4, USB 3.2 Gen1 Type-A
Posteriore: USB 3.2 Gen1 Type-A, HDMI 2.1-out, RJ-45 Gigabit Ethernet, DC-in
A destra: jack audio combo da 3,5 mm, USB 3.2 Gen1 Type-A, Kensington Lock

Connettività: Alta velocità di trasmissione 6 GHz 6E

La scheda WLAN Intel Wi-Fi 6E AX211 mostra velocità decenti nella banda 5 GHz, ma la banda 6 GHz 6E offre un elevato throughput di trasmissione e ricezione di 1,7 Gbps quando viene testata con il nostro router di riferimento Asus ROG Rapture GT-AXE11000.

Networking / iperf3 transmit AXE11000
Asus TUF Gaming A16 FA608UP
MediaTek Wi-Fi 6E MT7922 160MHz Wireless LAN Card
1767 (1659min - 1868max) MBit/s +95%
Media Intel Wi-Fi 6E AX211
  (64 - 1921, n=268)
1230 MBit/s +35%
Media della classe Gaming
  (469 - 1862, n=122, ultimi 2 anni)
1220 MBit/s +34%
Aorus Elite 16 AE6H
Intel Wi-Fi 7 BE200 320MHz
984 (790min - 1056max) MBit/s +8%
Lenovo Legion 5 Pro 16IAX10H
Intel Wi-Fi 6 AX203
972 (459min - 1006max) MBit/s +7%
MSI Crosshair 16 HX AI D2XWGKG
Intel Wi-Fi 6E AX211
908 (545min - 976max) MBit/s
Alienware 16X Aurora, RTX 5070
Mediatek Wi-Fi 7 MT7925 Wireless LAN Card
798 (633min - 900max) MBit/s -12%
Networking / iperf3 receive AXE11000
Asus TUF Gaming A16 FA608UP
MediaTek Wi-Fi 6E MT7922 160MHz Wireless LAN Card
1713 (1692min - 1729max) MBit/s +78%
Aorus Elite 16 AE6H
Intel Wi-Fi 7 BE200 320MHz
1670 (1607min - 1694max) MBit/s +73%
Media della classe Gaming
  (680 - 1745, n=122, ultimi 2 anni)
1415 MBit/s +47%
Media Intel Wi-Fi 6E AX211
  (582 - 1890, n=268)
1390 MBit/s +44%
MSI Crosshair 16 HX AI D2XWGKG
Intel Wi-Fi 6E AX211
965 (933min - 978max) MBit/s
Alienware 16X Aurora, RTX 5070
Mediatek Wi-Fi 7 MT7925 Wireless LAN Card
911 (868min - 935max) MBit/s -6%
Lenovo Legion 5 Pro 16IAX10H
Intel Wi-Fi 6 AX203
873 MBit/s -10%
Networking / iperf3 transmit AXE11000 6GHz
MSI Crosshair 16 HX AI D2XWGKG
Intel Wi-Fi 6E AX211
1708 (1673min - 1769max) MBit/s
Media della classe Gaming
  (648 - 2355, n=51, ultimi 2 anni)
1384 MBit/s -19%
Media Intel Wi-Fi 6E AX211
  (385 - 1851, n=223)
1364 MBit/s -20%
Alienware 16X Aurora, RTX 5070
Mediatek Wi-Fi 7 MT7925 Wireless LAN Card
1360 (699min - 1463max) MBit/s -20%
Networking / iperf3 receive AXE11000 6GHz
MSI Crosshair 16 HX AI D2XWGKG
Intel Wi-Fi 6E AX211
1731 (1699min - 1756max) MBit/s
Media Intel Wi-Fi 6E AX211
  (700 - 1857, n=223)
1497 MBit/s -14%
Media della classe Gaming
  (975 - 1788, n=50, ultimi 2 anni)
1491 MBit/s -14%
Alienware 16X Aurora, RTX 5070
Mediatek Wi-Fi 7 MT7925 Wireless LAN Card
1487 (1455min - 1502max) MBit/s -14%
0501001502002503003504004505005506006507007508008509009501000105011001150120012501300135014001450150015501600165017001750Tooltip
MSI Crosshair 16 HX AI D2XWGKG Intel Wi-Fi 6E AX211; iperf3 transmit AXE11000 6GHz; iperf 3.1.3: Ø1708 (1673-1769)
Alienware 16X Aurora, RTX 5070 Mediatek Wi-Fi 7 MT7925 Wireless LAN Card; iperf3 transmit AXE11000 6GHz; iperf 3.1.3: Ø1336 (699-1463)
MSI Crosshair 16 HX AI D2XWGKG Intel Wi-Fi 6E AX211; iperf3 receive AXE11000 6GHz; iperf 3.1.3: Ø1730 (1699-1756)
Alienware 16X Aurora, RTX 5070 Mediatek Wi-Fi 7 MT7925 Wireless LAN Card; iperf3 receive AXE11000 6GHz; iperf 3.1.3: Ø1486 (1455-1502)
MSI Crosshair 16 HX AI D2XWGKG Intel Wi-Fi 6E AX211; iperf3 transmit AXE11000; iperf 3.1.3: Ø908 (545-976)
Alienware 16X Aurora, RTX 5070 Mediatek Wi-Fi 7 MT7925 Wireless LAN Card; iperf3 transmit AXE11000; iperf 3.1.3: Ø797 (633-900)
MSI Crosshair 16 HX AI D2XWGKG Intel Wi-Fi 6E AX211; iperf3 receive AXE11000; iperf 3.1.3: Ø964 (933-978)
Alienware 16X Aurora, RTX 5070 Mediatek Wi-Fi 7 MT7925 Wireless LAN Card; iperf3 receive AXE11000; iperf 3.1.3: Ø910 (868-935)

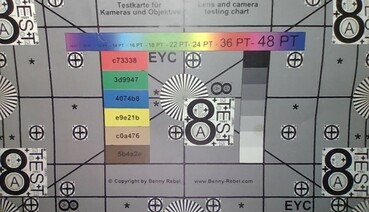
La qualità della webcam a 720p non è niente di eccezionale. Non è presente il login IR di Windows Hello, ma l'otturatore fisico per la privacy è di serie.
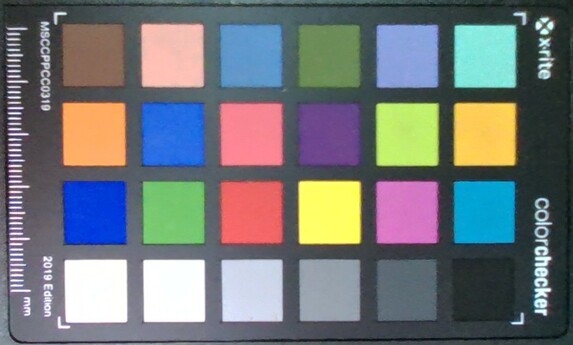
ColorChecker
8.4 ∆E
12.8 ∆E
11.5 ∆E
12.3 ∆E
13.5 ∆E
11.7 ∆E
12.7 ∆E
11 ∆E
16 ∆E
6.8 ∆E
12 ∆E
11.1 ∆E
9.2 ∆E
15.1 ∆E
20 ∆E
13.8 ∆E
11.6 ∆E
11.4 ∆E
2.7 ∆E
11.9 ∆E
17 ∆E
15.7 ∆E
10.4 ∆E
5.6 ∆E
ColorChecker MSI Crosshair 16 HX AI D2XWGKG: 11.84 ∆E min: 2.75 - max: 19.97 ∆E

Dispositivi di input: Esperienza di digitazione decente con sufficiente RGB

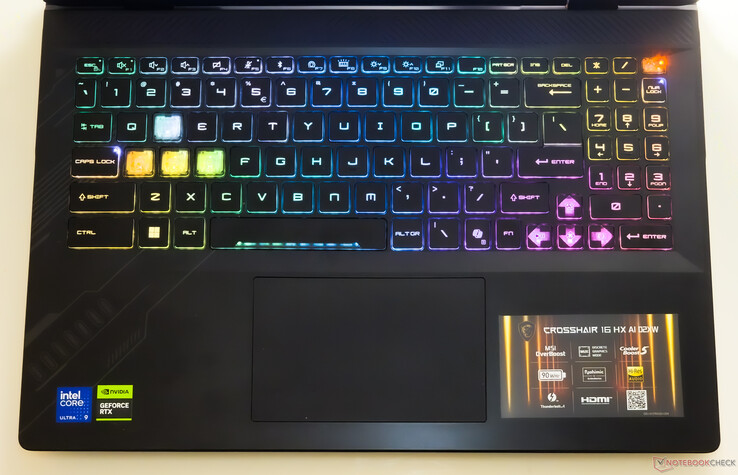
La tastiera Crosshair 16 HX AI RGB a 24 zone offre una discreta tattilità con una corsa dei tasti di 1,7 mm e tasti freccia di dimensioni standard. Il layout un po' atipico può portare a premere il tasto Fn più spesso della freccia sinistra.

Il tastierino numerico a tre colonne è utile, ma risulta angusto e non è adatto per la rapida elaborazione dei numeri.

La retroilluminazione a quattro livelli offre una buona illuminazione al buio e brilla bene, soprattutto attraverso i tasti WASD completamente trasparenti.

Il touchpad da 12 x 7,5 cm dimostra buone proprietà di scorrimento e supporta i gesti di Windows Precision, anche se a volte è difficile registrare i clic e i gesti lungo il bordo superiore.

MSI Crosshair 16 HX AI: tastiera e touchpad

Display: Pannello QHD+ 240 Hz con una buona copertura del gamut e nessuna PWM

Il display 16:10 QHD+ 240 Hz IPS di Crosshair 16 HX AI offre una luminosità massima di 472 nit con una buona uniformità dell'88%, un livello decente per l'uso in interni.

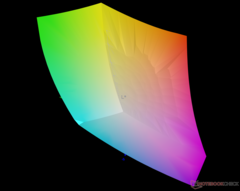
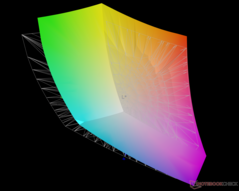
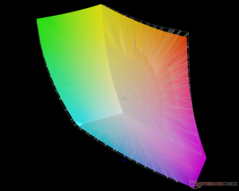
Il rapporto di contrasto misurato di 1.180:1 si presta a un'esperienza visiva soggettivamente buona, con una copertura quasi completa della gamma di colori sRGB e Display P3.

Detto questo, il display non supporta l'HDR né alcuna forma di sincronizzazione adattiva.

Matrice di subpixel
Matrice di subpixel
Il controluce si vede lungo il bordo inferiore con un'esposizione lunga
428
cd/m²
448
cd/m²
445
cd/m²
434
cd/m²
472
cd/m²
452
cd/m²
414
cd/m²
429
cd/m²
420
cd/m²
Distribuzione della luminosità
AUO B160QAN02.3 testato con X-Rite i1Basic Pro 3
Massima: 472 cd/m² (Nits) Media: 438 cd/m² Minimum: 25 cd/m²
Distribuzione della luminosità: 88 %
Al centro con la batteria: 471 cd/m²
Contrasto: 1180:1 (Nero: 0.4 cd/m²)
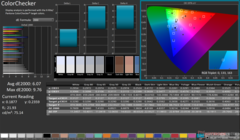
ΔE ColorChecker Calman: 6.07 | ∀{0.5-29.43 Ø4.79}
calibrated: 2.25
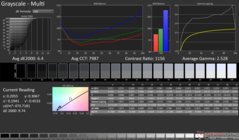
ΔE Greyscale Calman: 6.4 | ∀{0.09-98 Ø5}
83.9% AdobeRGB 1998 (Argyll 3D)
99.7% sRGB (Argyll 3D)
95.5% Display P3 (Argyll 3D)
Gamma: 2.52
CCT: 7987 K
MSI Crosshair 16 HX AI D2XWGKG
AUO B160QAN02.3, IPS, 2560x1600, 16", 240 Hz
Alienware 16X Aurora, RTX 5070
LG Philips 160WQG, IPS, 2560x1600, 16", 240 Hz
Aorus Elite 16 AE6H
NE160QDM-NYJ, IPS, 2560x1600, 16", 165 Hz
Lenovo Legion 5 Pro 16IAX10H
ATNA60HS01-0 (Samsung SDC420A), OLED, 2560x1600, 16", 165 Hz
Asus TUF Gaming A16 FA608UP
MNG007DA5-3, IPS, 2560x1600, 16", 165 Hz
Display
3%
-13%
6%
-15%
Display P3 Coverage (%)
95.5
96.9
1%
70.8
-26%
99.9
5%
69.4
-27%
sRGB Coverage (%)
99.7
99.8
0%
99.8
0%
100
0%
97.2
-3%
AdobeRGB 1998 Coverage (%)
83.9
89.7
7%
72.6
-13%
94.1
12%
71.9
-14%
Response Times
-22%
-190%
62%
-22%
Response Time Grey 50% / Grey 80% * (ms)
3.59 ?(1.51, 2.08)
4.3 ?(1.9, 2.4)
-20%
16.8 ?(8.1, 8.7)
-368%
2 ?(1, 1)
44%
6.3 ?(2.8, 3.5)
-75%
Response Time Black / White * (ms)
7.09 ?(3.52, 3.57)
8.7 ?(4.6, 4.1)
-23%
7.9 ?(2.7, 5.2)
-11%
1.4 ?(0.8, 0.6)
80%
4.8 ?(1.7, 3.1)
32%
PWM Frequency (Hz)
1300
PWM Amplitude * (%)
16.7
Screen
18%
10%
29%
37%
Brightness middle (cd/m²)
472
493.2
4%
443
-6%
518
10%
480
2%
Brightness (cd/m²)
438
477
9%
433
-1%
522
19%
456
4%
Brightness Distribution (%)
88
93
6%
90
2%
97
10%
91
3%
Black Level * (cd/m²)
0.4
0.5
-25%
0.42
-5%
0.32
20%
Contrast (:1)
1180
986
-16%
1055
-11%
1500
27%
Colorchecker dE 2000 *
6.07
3.57
41%
3.82
37%
2.49
59%
1.4
77%
Colorchecker dE 2000 max. *
9.76
7.03
28%
7.61
22%
5.25
46%
2.5
74%
Colorchecker dE 2000 calibrated *
2.25
0.68
70%
1.33
41%
2.15
4%
1.3
42%
Greyscale dE 2000 *
6.4
3.7
42%
5.5
14%
3.02
53%
1.2
81%
Gamma
2.52 87%
2.16 102%
2.249 98%
2.37 93%
2.16 102%
CCT
7987 81%
5876 111%
6549 99%
6426 101%
6620 98%
Media totale (Programma / Settaggio)
-0% / 9%
-64% / -23%
32% / 29%
0% / 17%

* ... Meglio usare valori piccoli

rispetto a sRGB: copertura del 99,7%
contro Adobe RGB: 83,9% di copertura
vs. Display P3: copertura del 95,5%

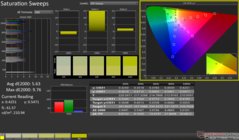
L'accuratezza del colore di Crosshair 16 HX AI è un po' scarsa.

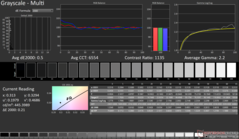
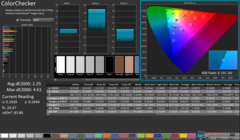
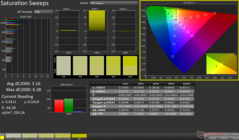
La nostra routine di calibrazione con lo spettrofotometro X-Rite i1Basic Pro 3 e il software Calman Ultimate di Portrait Displays migliora significativamente il DeltaE2000 della scala di grigi a soli 0,5 e il DeltaE2000 medio del ColorChecker a 2,25.

Scala di grigi prima della calibrazione
ColorChecker prima della calibrazione
Sweep di saturazione prima della calibrazione
Scala di grigi dopo la calibrazione
ColorChecker dopo la calibrazione
Sweep di saturazione dopo la calibrazione

Il nostro file ICC calibrato può essere scaricato dal link qui sopra.

Tempi di risposta del Display

I tempi di risposta del display mostrano quanto sia veloce lo schermo a cambaire da un colore all'altro. Tempi di risposta lenti possono creare sovrapposizioni negloi oggetti in movimento. Specialmente i giocatori patiti del 3D dovrebbero usare uno schermo con tempi di risposta bassi.
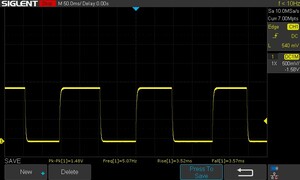
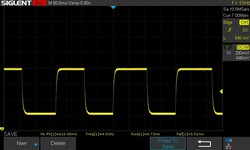
       Tempi di risposta dal Nero al Bianco
7.09 ms ... aumenta ↗ e diminuisce ↘ combinato↗ 3.52 ms Incremento
↘ 3.57 ms Calo
Lo schermo ha mostrato valori di risposta molto veloci nei nostri tests ed è molto adatto per i gaming veloce.
In confronto, tutti i dispositivi di test variano da 0.1 (minimo) a 240 (massimo) ms. » 20 % di tutti i dispositivi è migliore.
Questo significa che i tempi di risposta rilevati sono migliori rispettto alla media di tutti i dispositivi testati (20.3 ms).
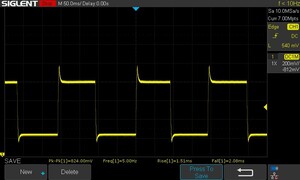
       Tempo di risposta dal 50% Grigio all'80% Grigio
3.59 ms ... aumenta ↗ e diminuisce ↘ combinato↗ 1.51 ms Incremento
↘ 2.08 ms Calo
Lo schermo ha mostrato valori di risposta molto veloci nei nostri tests ed è molto adatto per i gaming veloce.
In confronto, tutti i dispositivi di test variano da 0.165 (minimo) a 636 (massimo) ms. » 13 % di tutti i dispositivi è migliore.
Questo significa che i tempi di risposta rilevati sono migliori rispettto alla media di tutti i dispositivi testati (31.7 ms).
Tempo di risposta GtG senza overdrive del pannello: 10.24 ms

Il pannello utilizza l'overdrive per impostazione predefinita.

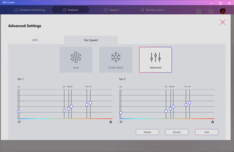
Disattivando l'overdrive del pannello tramite MSI Center, i tempi di risposta da 50% grigio a 80% grigio passano da 3,59 ms a 10,24 ms.

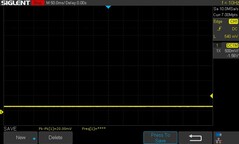
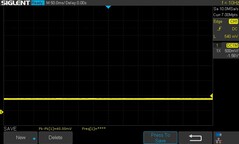
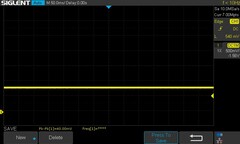
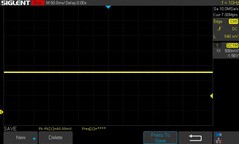
Non abbiamo osservato alcuno sfarfallio PWM a tutti i livelli di luminosità testati.

Sfarfallio dello schermo / PWM (Pulse-Width Modulation)

Per ridurre la luminosità dello schermo, alcuni portatili accendono e spengono la retroilluminazione in rapida successione - un metodo chiamato Pulse Width Modulation (PWM). Questa frequenza di ciclo a livello ideale non dovrebbe essere percepibile dall'occhi umano. Se tale frequenza è troppo bassa, gli utenti con occhi sensibili potrebbero stancarsi gli occhi o avere mal di testa o anche notare uno sfarfallio.
flickering dello schermo / PWM non rilevato ≤ 100 % settaggio luminosita'

In confronto: 53 % di tutti i dispositivi testati non utilizza PWM per ridurre la luminosita' del display. Se è rilevato PWM, una media di 8152 (minimo: 5 - massimo: 343500) Hz è stata rilevata.

0% di luminosità: Nessun PWM
10% di luminosità: Nessun PWM
25% di luminosità: Nessun PWM
50% di luminosità: Nessun PWM
75% di luminosità: Nessun PWM
luminosità al 100%: Nessun PWM
Visione all'aperto in condizioni di cielo coperto
Visione all'aperto all'ombra
Minima perdita di informazioni sulla luminosità e sul colore agli angoli estremi

Prestazioni: Il Core Ultra 9 275HX e la RTX 5070 non riservano sorprese

MSI offre Crosshair 16 HX AI in due SKU: Core Ultra 7 255HX + RTX 5060 Laptop e Core Ultra 9 275HX + RTX 5070 Laptop.

Entrambe le SKU possono essere equipaggiate con un massimo di 96 GB di memoria DDR5-6400, ma la nostra unità era dotata di soli 16 GB di RAM DDR5-5600 installati.


Condizioni di test

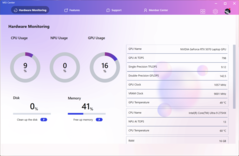
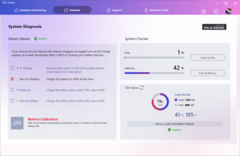
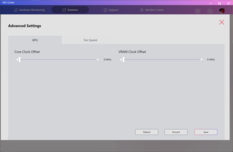
Abbiamo utilizzato la modalità Extreme Performance in MSI Center con dGPU MUX per tutti i benchmark e i giochi.

I test della batteria sono stati eseguiti in modalità ECO-Silent con la GPU impostata su MSHybrid.

Centro MSI
Centro MSI
Centro MSI
Centro MSI
Centro MSI
Centro MSI
Modalità di prestazioni PL1 (PBP) / Tau PL2 (MTP) / Tau GPU TGP (FurMark) Cinebench R15 Multi score Cinebench R15 Multi score (30 loop)
ECO-Silenzioso 20 W / 56 s 20 W / 2,44 ms 13 W 1728 (-67,8%) 1752 (-65,05%)
Bilanciato 40 W / 56 s 60 W / 2,44 ms 75 W 4171 (-22,28%) 3517 (-29,84%)
Prestazioni estreme 100 W / 56 s 130 W / 2,44 ms 92 W 5367 (100%) 5013 (100%)

Processore

Il Crosshair 16 HX AI's Intel Core Ultra 9 275HX offre prestazioni paragonabili a quelle di altri computer portatili dotati della stessa CPU, anche se il modello Lenovo Legion Pro 5di Lenovo Pro 5 è complessivamente un po' più veloce, grazie a un PL1/PL2 più elevato.

Le prestazioni multi-core sostenute sono generalmente stabili, a parte un calo momentaneo nel 20° run durante un ciclo multi-core di Cinebench R15.

Cinebench R15 Ciclo multi-core

02955908851180147517702065236026552950324535403835413044254720501553105605Tooltip
MSI Crosshair 16 HX AI D2XWGKG Intel Core Ultra 9 275HX: Ø5246 (4918.23-5393.74)
Alienware 16X Aurora, RTX 5070 Intel Core Ultra 9 275HX: Ø5073 (4910.99-5571.03)
Aorus Elite 16 AE6H Intel Core Ultra 9 275HX: Ø5115 (5060.09-5301.52)
Lenovo Legion 5 Pro 16IAX10H Intel Core Ultra 9 275HX: Ø5438 (5337.6-5885.82)
Asus TUF Gaming A16 FA608UP AMD Ryzen 7 260: Ø2740 (2520.16-2768.93)
MSI Crosshair 18 HX AI A2XW Intel Core Ultra 9 275HX: Ø5222 (5148.67-5245.9)
MSI Crosshair A17 HX D8WGKG AMD Ryzen 9 8940HX: Ø5221 (5186.05-5406.14)
Schenker XMG Core 16 M25 AMD Ryzen AI 9 HX 370: Ø3503 (3290.01-3542.96)
CPU Performance rating: Percent
Cinebench R23: Multi Core | Single Core
Cinebench R20: CPU (Multi Core) | CPU (Single Core)
Cinebench R15: CPU Multi 64Bit | CPU Single 64Bit
Blender: v2.79 BMW27 CPU
7-Zip 18.03: 7z b 4 | 7z b 4 -mmt1
Geekbench 6.5: Multi-Core | Single-Core
Geekbench 5.5: Multi-Core | Single-Core
HWBOT x265 Benchmark v2.2: 4k Preset
LibreOffice : 20 Documents To PDF
R Benchmark 2.5: Overall mean
CPU Performance rating
Lenovo Legion 5 Pro 16IAX10H
Intel Core Ultra 9 275HX
85.7 pt
Media Intel Core Ultra 9 275HX
 
83.2 pt
Aorus Elite 16 AE6H -1!
Intel Core Ultra 9 275HX
83 pt
Alienware 16X Aurora, RTX 5070
Intel Core Ultra 9 275HX
82.4 pt
MSI Crosshair 16 HX AI D2XWGKG
Intel Core Ultra 9 275HX
82.1 pt
MSI Crosshair 18 HX AI A2XW
Intel Core Ultra 9 275HX
80.2 pt
MSI Crosshair A17 HX D8WGKG
AMD Ryzen 9 8940HX
77.5 pt
Media della classe Gaming
 
66.1 pt
Schenker XMG Core 16 M25
AMD Ryzen AI 9 HX 370
64.1 pt
Asus TUF Gaming A16 FA608UP
AMD Ryzen 7 260
54.1 pt
Cinebench R23 / Multi Core
Lenovo Legion 5 Pro 16IAX10H
Intel Core Ultra 9 275HX
37507 Points +6%
Media Intel Core Ultra 9 275HX
  (30712 - 40970, n=28)
35882 Points +1%
Alienware 16X Aurora, RTX 5070
Intel Core Ultra 9 275HX
35478 (31087min - 35478max) Points 0%
MSI Crosshair 16 HX AI D2XWGKG
Intel Core Ultra 9 275HX
35421 Points
Aorus Elite 16 AE6H
Intel Core Ultra 9 275HX
34511 Points -3%
MSI Crosshair 18 HX AI A2XW
Intel Core Ultra 9 275HX
34500 (33034.3min - 34500.3max) Points -3%
MSI Crosshair A17 HX D8WGKG
AMD Ryzen 9 8940HX
32521 Points -8%
Media della classe Gaming
  (5668 - 40970, n=147, ultimi 2 anni)
25185 Points -29%
Schenker XMG Core 16 M25
AMD Ryzen AI 9 HX 370
22187 Points -37%
Asus TUF Gaming A16 FA608UP
AMD Ryzen 7 260
17277 Points -51%
Cinebench R23 / Single Core
Lenovo Legion 5 Pro 16IAX10H
Intel Core Ultra 9 275HX
2248 Points +1%
MSI Crosshair 16 HX AI D2XWGKG
Intel Core Ultra 9 275HX
2216 Points
Alienware 16X Aurora, RTX 5070
Intel Core Ultra 9 275HX
2193 Points -1%
Media Intel Core Ultra 9 275HX
  (2009 - 2267, n=28)
2190 Points -1%
Aorus Elite 16 AE6H
Intel Core Ultra 9 275HX
2159 Points -3%
MSI Crosshair 18 HX AI A2XW
Intel Core Ultra 9 275HX
2141 Points -3%
Schenker XMG Core 16 M25
AMD Ryzen AI 9 HX 370
2019 Points -9%
Media della classe Gaming
  (1136 - 2267, n=147, ultimi 2 anni)
1980 Points -11%
MSI Crosshair A17 HX D8WGKG
AMD Ryzen 9 8940HX
1930 Points -13%
Asus TUF Gaming A16 FA608UP
AMD Ryzen 7 260
1760 Points -21%
Cinebench R20 / CPU (Multi Core)
Lenovo Legion 5 Pro 16IAX10H
Intel Core Ultra 9 275HX
14763 Points +7%
Media Intel Core Ultra 9 275HX
  (12026 - 16108, n=27)
14054 Points +2%
Alienware 16X Aurora, RTX 5070
Intel Core Ultra 9 275HX
13953 Points +1%
MSI Crosshair 16 HX AI D2XWGKG
Intel Core Ultra 9 275HX
13810 Points
MSI Crosshair 18 HX AI A2XW
Intel Core Ultra 9 275HX
13434 Points -3%
Aorus Elite 16 AE6H
Intel Core Ultra 9 275HX
13401 Points -3%
MSI Crosshair A17 HX D8WGKG
AMD Ryzen 9 8940HX
12720 Points -8%
Media della classe Gaming
  (2179 - 16108, n=146, ultimi 2 anni)
9703 Points -30%
Schenker XMG Core 16 M25
AMD Ryzen AI 9 HX 370
8504 Points -38%
Asus TUF Gaming A16 FA608UP
AMD Ryzen 7 260
6770 Points -51%
Cinebench R20 / CPU (Single Core)
Lenovo Legion 5 Pro 16IAX10H
Intel Core Ultra 9 275HX
863 Points +1%
MSI Crosshair 16 HX AI D2XWGKG
Intel Core Ultra 9 275HX
853 Points
Alienware 16X Aurora, RTX 5070
Intel Core Ultra 9 275HX
846 Points -1%
Media Intel Core Ultra 9 275HX
  (774 - 870, n=27)
845 Points -1%
Aorus Elite 16 AE6H
Intel Core Ultra 9 275HX
831 Points -3%
MSI Crosshair 18 HX AI A2XW
Intel Core Ultra 9 275HX
816 Points -4%
Schenker XMG Core 16 M25
AMD Ryzen AI 9 HX 370
795 Points -7%
Media della classe Gaming
  (439 - 870, n=146, ultimi 2 anni)
764 Points -10%
MSI Crosshair A17 HX D8WGKG
AMD Ryzen 9 8940HX
747 Points -12%
Asus TUF Gaming A16 FA608UP
AMD Ryzen 7 260
679 Points -20%
Cinebench R15 / CPU Multi 64Bit
Lenovo Legion 5 Pro 16IAX10H
Intel Core Ultra 9 275HX
5886 (5337.6min - 5885.82max) Points +9%
Media Intel Core Ultra 9 275HX
  (4756 - 6271, n=27)
5589 Points +4%
Alienware 16X Aurora, RTX 5070
Intel Core Ultra 9 275HX
5571 (4910.99min - 5571.03max) Points +3%
MSI Crosshair A17 HX D8WGKG
AMD Ryzen 9 8940HX
5406 (5186.05min - 5406.14max) Points 0%
MSI Crosshair 16 HX AI D2XWGKG
Intel Core Ultra 9 275HX
5394 (4918.23min - 5393.74max) Points
Aorus Elite 16 AE6H
Intel Core Ultra 9 275HX
5302 (5060.09min - 5301.52max) Points -2%
MSI Crosshair 18 HX AI A2XW
Intel Core Ultra 9 275HX
5246 (5148.67min - 5245.9max) Points -3%
Media della classe Gaming
  (1537 - 6271, n=146, ultimi 2 anni)
3899 Points -28%
Schenker XMG Core 16 M25
AMD Ryzen AI 9 HX 370
3543 (3290.01min - 3542.96max) Points -34%
Asus TUF Gaming A16 FA608UP
AMD Ryzen 7 260
2769 (2520.16min - 2768.93max) Points -49%
Cinebench R15 / CPU Single 64Bit
Lenovo Legion 5 Pro 16IAX10H
Intel Core Ultra 9 275HX
334 Points +2%
Media Intel Core Ultra 9 275HX
  (306 - 343, n=28)
331 Points +1%
MSI Crosshair 16 HX AI D2XWGKG
Intel Core Ultra 9 275HX
329 Points
Alienware 16X Aurora, RTX 5070
Intel Core Ultra 9 275HX
328 Points 0%
Aorus Elite 16 AE6H
Intel Core Ultra 9 275HX
322 Points -2%
MSI Crosshair 18 HX AI A2XW
Intel Core Ultra 9 275HX
320 Points -3%
Media della classe Gaming
  (188.8 - 343, n=145, ultimi 2 anni)
293 Points -11%
MSI Crosshair A17 HX D8WGKG
AMD Ryzen 9 8940HX
290 Points -12%
Asus TUF Gaming A16 FA608UP
AMD Ryzen 7 260
275 Points -16%
Schenker XMG Core 16 M25
AMD Ryzen AI 9 HX 370
188.8 Points -43%
Blender / v2.79 BMW27 CPU
Asus TUF Gaming A16 FA608UP
AMD Ryzen 7 260
182 Seconds * -90%
Media della classe Gaming
  (80 - 517, n=142, ultimi 2 anni)
154.1 Seconds * -61%
Schenker XMG Core 16 M25
AMD Ryzen AI 9 HX 370
139 Seconds * -45%
MSI Crosshair A17 HX D8WGKG
AMD Ryzen 9 8940HX
101 Seconds * -5%
Alienware 16X Aurora, RTX 5070
Intel Core Ultra 9 275HX
99 Seconds * -3%
MSI Crosshair 18 HX AI A2XW
Intel Core Ultra 9 275HX
99 Seconds * -3%
Lenovo Legion 5 Pro 16IAX10H
Intel Core Ultra 9 275HX
97 Seconds * -1%
MSI Crosshair 16 HX AI D2XWGKG
Intel Core Ultra 9 275HX
96 Seconds *
Media Intel Core Ultra 9 275HX
  (82 - 116, n=26)
95.1 Seconds * +1%
7-Zip 18.03 / 7z b 4
MSI Crosshair A17 HX D8WGKG
AMD Ryzen 9 8940HX
133175 MIPS +23%
Media Intel Core Ultra 9 275HX
  (98236 - 124155, n=27)
113381 MIPS +4%
Lenovo Legion 5 Pro 16IAX10H
Intel Core Ultra 9 275HX
112452 MIPS +4%
Aorus Elite 16 AE6H
Intel Core Ultra 9 275HX
109036 MIPS 0%
MSI Crosshair 18 HX AI A2XW
Intel Core Ultra 9 275HX
108965 MIPS 0%
MSI Crosshair 16 HX AI D2XWGKG
Intel Core Ultra 9 275HX
108549 MIPS
Alienware 16X Aurora, RTX 5070
Intel Core Ultra 9 275HX
107286 MIPS -1%
Media della classe Gaming
  (23795 - 148086, n=144, ultimi 2 anni)
91379 MIPS -16%
Schenker XMG Core 16 M25
AMD Ryzen AI 9 HX 370
84735 MIPS -22%
Asus TUF Gaming A16 FA608UP
AMD Ryzen 7 260
72400 MIPS -33%
7-Zip 18.03 / 7z b 4 -mmt1
MSI Crosshair A17 HX D8WGKG
AMD Ryzen 9 8940HX
7360 MIPS +8%
MSI Crosshair 16 HX AI D2XWGKG
Intel Core Ultra 9 275HX
6794 MIPS
Media Intel Core Ultra 9 275HX
  (6026 - 7149, n=27)
6695 MIPS -1%
Lenovo Legion 5 Pro 16IAX10H
Intel Core Ultra 9 275HX
6687 MIPS -2%
Alienware 16X Aurora, RTX 5070
Intel Core Ultra 9 275HX
6587 MIPS -3%
Schenker XMG Core 16 M25
AMD Ryzen AI 9 HX 370
6487 MIPS -5%
Media della classe Gaming
  (4199 - 7508, n=144, ultimi 2 anni)
6404 MIPS -6%
Aorus Elite 16 AE6H
Intel Core Ultra 9 275HX
6394 MIPS -6%
MSI Crosshair 18 HX AI A2XW
Intel Core Ultra 9 275HX
6290 MIPS -7%
Asus TUF Gaming A16 FA608UP
AMD Ryzen 7 260
6101 MIPS -10%
Geekbench 6.5 / Multi-Core
Lenovo Legion 5 Pro 16IAX10H
Intel Core Ultra 9 275HX
19885 Points +9%
Media Intel Core Ultra 9 275HX
  (16033 - 21668, n=29)
19376 Points +6%
Alienware 16X Aurora, RTX 5070
Intel Core Ultra 9 275HX
19270 Points +6%
MSI Crosshair 18 HX AI A2XW
Intel Core Ultra 9 275HX
18984 Points +4%
Aorus Elite 16 AE6H
Intel Core Ultra 9 275HX
18894 Points +4%
MSI Crosshair 16 HX AI D2XWGKG
Intel Core Ultra 9 275HX
18253 Points
MSI Crosshair A17 HX D8WGKG
AMD Ryzen 9 8940HX
16362 Points -10%
Schenker XMG Core 16 M25
AMD Ryzen AI 9 HX 370
16311 Points -11%
Media della classe Gaming
  (5340 - 22104, n=144, ultimi 2 anni)
15610 Points -14%
Asus TUF Gaming A16 FA608UP
AMD Ryzen 7 260
13299 Points -27%
Geekbench 6.5 / Single-Core
Lenovo Legion 5 Pro 16IAX10H
Intel Core Ultra 9 275HX
3089 Points +1%
Alienware 16X Aurora, RTX 5070
Intel Core Ultra 9 275HX
3081 Points +1%
MSI Crosshair 16 HX AI D2XWGKG
Intel Core Ultra 9 275HX
3058 Points
Media Intel Core Ultra 9 275HX
  (2843 - 3160, n=29)
3033 Points -1%
Aorus Elite 16 AE6H
Intel Core Ultra 9 275HX
2950 Points -4%
Schenker XMG Core 16 M25
AMD Ryzen AI 9 HX 370
2930 Points -4%
MSI Crosshair 18 HX AI A2XW
Intel Core Ultra 9 275HX
2856 Points -7%
MSI Crosshair A17 HX D8WGKG
AMD Ryzen 9 8940HX
2835 Points -7%
Media della classe Gaming
  (1490 - 3253, n=144, ultimi 2 anni)
2782 Points -9%
Asus TUF Gaming A16 FA608UP
AMD Ryzen 7 260
2673 Points -13%
Geekbench 5.5 / Multi-Core
Media Intel Core Ultra 9 275HX
  (19105 - 25855, n=28)
22869 Points +5%
Aorus Elite 16 AE6H
Intel Core Ultra 9 275HX
22612 Points +4%
MSI Crosshair 18 HX AI A2XW
Intel Core Ultra 9 275HX
22589 Points +4%
Lenovo Legion 5 Pro 16IAX10H
Intel Core Ultra 9 275HX
22302 Points +2%
MSI Crosshair 16 HX AI D2XWGKG
Intel Core Ultra 9 275HX
21819 Points
Alienware 16X Aurora, RTX 5070
Intel Core Ultra 9 275HX
21530 Points -1%
MSI Crosshair A17 HX D8WGKG
AMD Ryzen 9 8940HX
19421 Points -11%
Media della classe Gaming
  (4557 - 27010, n=143, ultimi 2 anni)
16758 Points -23%
Schenker XMG Core 16 M25
AMD Ryzen AI 9 HX 370
16322 Points -25%
Asus TUF Gaming A16 FA608UP
AMD Ryzen 7 260
12239 Points -44%
Geekbench 5.5 / Single-Core
Lenovo Legion 5 Pro 16IAX10H
Intel Core Ultra 9 275HX
2246 Points +1%
Alienware 16X Aurora, RTX 5070
Intel Core Ultra 9 275HX
2243 Points +1%
MSI Crosshair 16 HX AI D2XWGKG
Intel Core Ultra 9 275HX
2231 Points
Media Intel Core Ultra 9 275HX
  (2033 - 2292, n=28)
2200 Points -1%
Aorus Elite 16 AE6H
Intel Core Ultra 9 275HX
2177 Points -2%
MSI Crosshair 18 HX AI A2XW
Intel Core Ultra 9 275HX
2154 Points -3%
Schenker XMG Core 16 M25
AMD Ryzen AI 9 HX 370
2076 Points -7%
Media della classe Gaming
  (986 - 2423, n=143, ultimi 2 anni)
2005 Points -10%
Asus TUF Gaming A16 FA608UP
AMD Ryzen 7 260
1954 Points -12%
MSI Crosshair A17 HX D8WGKG
AMD Ryzen 9 8940HX
1925 Points -14%
HWBOT x265 Benchmark v2.2 / 4k Preset
Lenovo Legion 5 Pro 16IAX10H
Intel Core Ultra 9 275HX
39.1 fps +9%
Media Intel Core Ultra 9 275HX
  (30.7 - 43.8, n=27)
38 fps +6%
Alienware 16X Aurora, RTX 5070
Intel Core Ultra 9 275HX
37.3 fps +4%
MSI Crosshair A17 HX D8WGKG
AMD Ryzen 9 8940HX
36.2 fps +1%
MSI Crosshair 16 HX AI D2XWGKG
Intel Core Ultra 9 275HX
36 fps
MSI Crosshair 18 HX AI A2XW
Intel Core Ultra 9 275HX
36 fps 0%
Aorus Elite 16 AE6H
Intel Core Ultra 9 275HX
35.9 fps 0%
Schenker XMG Core 16 M25
AMD Ryzen AI 9 HX 370
28.4 fps -21%
Media della classe Gaming
  (7.7 - 44.3, n=144, ultimi 2 anni)
27.2 fps -24%
Asus TUF Gaming A16 FA608UP
AMD Ryzen 7 260
21.4 fps -41%
LibreOffice / 20 Documents To PDF
Asus TUF Gaming A16 FA608UP
AMD Ryzen 7 260
57.1 s * -38%
Schenker XMG Core 16 M25
AMD Ryzen AI 9 HX 370
52.1 s * -26%
Media della classe Gaming
  (19 - 88.8, n=143, ultimi 2 anni)
47.6 s * -15%
MSI Crosshair 16 HX AI D2XWGKG
Intel Core Ultra 9 275HX
41.4 s *
Media Intel Core Ultra 9 275HX
  (33.2 - 62.1, n=27)
41.4 s * -0%
MSI Crosshair A17 HX D8WGKG
AMD Ryzen 9 8940HX
40.5 s * +2%
Aorus Elite 16 AE6H
Intel Core Ultra 9 275HX
39.5 s * +5%
Alienware 16X Aurora, RTX 5070
Intel Core Ultra 9 275HX
38.6 s * +7%
MSI Crosshair 18 HX AI A2XW
Intel Core Ultra 9 275HX
35.6 s * +14%
Lenovo Legion 5 Pro 16IAX10H
Intel Core Ultra 9 275HX
33.2 s * +20%
R Benchmark 2.5 / Overall mean
MSI Crosshair 18 HX AI A2XW
Intel Core Ultra 9 275HX
0.4542 sec * -14%
Asus TUF Gaming A16 FA608UP
AMD Ryzen 7 260
0.4479 sec * -12%
MSI Crosshair A17 HX D8WGKG
AMD Ryzen 9 8940HX
0.4334 sec * -9%
Media della classe Gaming
  (0.3551 - 0.759, n=145, ultimi 2 anni)
0.4281 sec * -7%
Aorus Elite 16 AE6H
Intel Core Ultra 9 275HX
0.428 sec * -7%
Alienware 16X Aurora, RTX 5070
Intel Core Ultra 9 275HX
0.4208 sec * -5%
Media Intel Core Ultra 9 275HX
  (0.3943 - 0.4568, n=27)
0.4154 sec * -4%
Lenovo Legion 5 Pro 16IAX10H
Intel Core Ultra 9 275HX
0.4093 sec * -2%
MSI Crosshair 16 HX AI D2XWGKG
Intel Core Ultra 9 275HX
0.3994 sec *
Schenker XMG Core 16 M25
AMD Ryzen AI 9 HX 370
0.3974 sec * +1%

* ... Meglio usare valori piccoli

Cinebench R15 CPU Single 64Bit
329 Points
Cinebench R15 Ref. Match 64Bit
99.6 %
Cinebench R15 OpenGL 64Bit
311 fps
Cinebench R15 CPU Multi 64Bit
5394 Points
Cinebench R20 CPU (Single Core)
853 Points
Cinebench R20 CPU (Multi Core)
13810 Points
Cinebench R23 Multi Core
35421 Points
Cinebench R23 Single Core
2216 Points
Cinebench 2024 CPU Multi Core
1937 Points
Cinebench 2024 CPU Single Core
136.6 Points
Aiuto
Performance rating
MSI Crosshair A17 HX D8WGKG
AMD Ryzen 9 8940HX, GeForce RTX 5070 Laptop
96.6 pt
Media Intel Core Ultra 9 275HX
 
79.2 pt
Lenovo Legion 5 Pro 16IAX10H
Intel Core Ultra 9 275HX, GeForce RTX 5070 Ti Laptop
79.1 pt
MSI Crosshair 18 HX AI A2XW
Intel Core Ultra 9 275HX, GeForce RTX 5070 Laptop
76.8 pt
MSI Crosshair 16 HX AI D2XWGKG
Intel Core Ultra 9 275HX, GeForce RTX 5070 Laptop
75.7 pt
Alienware 16X Aurora, RTX 5070
Intel Core Ultra 9 275HX, GeForce RTX 5070 Laptop
74.5 pt
Aorus Elite 16 AE6H
Intel Core Ultra 9 275HX, GeForce RTX 5070 Laptop
73.6 pt
Schenker XMG Core 16 M25
AMD Ryzen AI 9 HX 370, GeForce RTX 5070 Laptop
70.5 pt
Media della classe Gaming
 
62.8 pt
Asus TUF Gaming A16 FA608UP
AMD Ryzen 7 260, GeForce RTX 5070 Laptop
57.4 pt
AIDA64 / FP32 Ray-Trace
MSI Crosshair A17 HX D8WGKG
AMD Ryzen 9 8940HX, GeForce RTX 5070 Laptop
52718 KRay/s +49%
Schenker XMG Core 16 M25
AMD Ryzen AI 9 HX 370, GeForce RTX 5070 Laptop
37403 KRay/s +6%
Media Intel Core Ultra 9 275HX
  (28067 - 39895, n=27)
35729 KRay/s +1%
MSI Crosshair 18 HX AI A2XW
Intel Core Ultra 9 275HX, GeForce RTX 5070 Laptop
35676 KRay/s +1%
MSI Crosshair 16 HX AI D2XWGKG
Intel Core Ultra 9 275HX, GeForce RTX 5070 Laptop
35418 KRay/s
Lenovo Legion 5 Pro 16IAX10H
Intel Core Ultra 9 275HX, GeForce RTX 5070 Ti Laptop
34811 KRay/s -2%
Alienware 16X Aurora, RTX 5070
Intel Core Ultra 9 275HX, GeForce RTX 5070 Laptop
32561 KRay/s -8%
Aorus Elite 16 AE6H
Intel Core Ultra 9 275HX, GeForce RTX 5070 Laptop
32444 KRay/s -8%
Asus TUF Gaming A16 FA608UP
AMD Ryzen 7 260, GeForce RTX 5070 Laptop
28399 KRay/s -20%
Media della classe Gaming
  (7192 - 85542, n=143, ultimi 2 anni)
28297 KRay/s -20%
AIDA64 / FPU Julia
MSI Crosshair A17 HX D8WGKG
AMD Ryzen 9 8940HX, GeForce RTX 5070 Laptop
212581 Points +19%
MSI Crosshair 18 HX AI A2XW
Intel Core Ultra 9 275HX, GeForce RTX 5070 Laptop
181117 Points +1%
Media Intel Core Ultra 9 275HX
  (140254 - 200744, n=27)
180235 Points +1%
Lenovo Legion 5 Pro 16IAX10H
Intel Core Ultra 9 275HX, GeForce RTX 5070 Ti Laptop
179594 Points 0%
MSI Crosshair 16 HX AI D2XWGKG
Intel Core Ultra 9 275HX, GeForce RTX 5070 Laptop
178891 Points
Aorus Elite 16 AE6H
Intel Core Ultra 9 275HX, GeForce RTX 5070 Laptop
165607 Points -7%
Alienware 16X Aurora, RTX 5070
Intel Core Ultra 9 275HX, GeForce RTX 5070 Laptop
165095 Points -8%
Schenker XMG Core 16 M25
AMD Ryzen AI 9 HX 370, GeForce RTX 5070 Laptop
143992 Points -20%
Media della classe Gaming
  (35040 - 252486, n=143, ultimi 2 anni)
127772 Points -29%
Asus TUF Gaming A16 FA608UP
AMD Ryzen 7 260, GeForce RTX 5070 Laptop
117226 Points -34%
AIDA64 / CPU SHA3
MSI Crosshair A17 HX D8WGKG
AMD Ryzen 9 8940HX, GeForce RTX 5070 Laptop
9259 MB/s +9%
Media Intel Core Ultra 9 275HX
  (6766 - 9817, n=27)
8648 MB/s +2%
Lenovo Legion 5 Pro 16IAX10H
Intel Core Ultra 9 275HX, GeForce RTX 5070 Ti Laptop
8499 MB/s 0%
MSI Crosshair 16 HX AI D2XWGKG
Intel Core Ultra 9 275HX, GeForce RTX 5070 Laptop
8466 MB/s
MSI Crosshair 18 HX AI A2XW
Intel Core Ultra 9 275HX, GeForce RTX 5070 Laptop
8260 MB/s -2%
Alienware 16X Aurora, RTX 5070
Intel Core Ultra 9 275HX, GeForce RTX 5070 Laptop
7975 MB/s -6%
Aorus Elite 16 AE6H
Intel Core Ultra 9 275HX, GeForce RTX 5070 Laptop
7905 MB/s -7%
Schenker XMG Core 16 M25
AMD Ryzen AI 9 HX 370, GeForce RTX 5070 Laptop
5932 MB/s -30%
Media della classe Gaming
  (1728 - 10389, n=143, ultimi 2 anni)
5875 MB/s -31%
Asus TUF Gaming A16 FA608UP
AMD Ryzen 7 260, GeForce RTX 5070 Laptop
5002 MB/s -41%
AIDA64 / CPU Queen
MSI Crosshair A17 HX D8WGKG
AMD Ryzen 9 8940HX, GeForce RTX 5070 Laptop
172010 Points +31%
Lenovo Legion 5 Pro 16IAX10H
Intel Core Ultra 9 275HX, GeForce RTX 5070 Ti Laptop
139285 Points +6%
Alienware 16X Aurora, RTX 5070
Intel Core Ultra 9 275HX, GeForce RTX 5070 Laptop
134492 Points +3%
Media Intel Core Ultra 9 275HX
  (113887 - 140937, n=27)
133512 Points +2%
Aorus Elite 16 AE6H
Intel Core Ultra 9 275HX, GeForce RTX 5070 Laptop
132015 Points +1%
MSI Crosshair 16 HX AI D2XWGKG
Intel Core Ultra 9 275HX, GeForce RTX 5070 Laptop
131131 Points
MSI Crosshair 18 HX AI A2XW
Intel Core Ultra 9 275HX, GeForce RTX 5070 Laptop
126618 Points -3%
Media della classe Gaming
  (50699 - 200651, n=143, ultimi 2 anni)
119712 Points -9%
Asus TUF Gaming A16 FA608UP
AMD Ryzen 7 260, GeForce RTX 5070 Laptop
119010 Points -9%
Schenker XMG Core 16 M25
AMD Ryzen AI 9 HX 370, GeForce RTX 5070 Laptop
94793 Points -28%
AIDA64 / FPU SinJulia
MSI Crosshair A17 HX D8WGKG
AMD Ryzen 9 8940HX, GeForce RTX 5070 Laptop
29514 Points +127%
Schenker XMG Core 16 M25
AMD Ryzen AI 9 HX 370, GeForce RTX 5070 Laptop
19120 Points +47%
Asus TUF Gaming A16 FA608UP
AMD Ryzen 7 260, GeForce RTX 5070 Laptop
15283 Points +18%
Media della classe Gaming
  (5020 - 33636, n=143, ultimi 2 anni)
14378 Points +11%
Lenovo Legion 5 Pro 16IAX10H
Intel Core Ultra 9 275HX, GeForce RTX 5070 Ti Laptop
13891 Points +7%
Media Intel Core Ultra 9 275HX
  (11172 - 14425, n=27)
13501 Points +4%
Alienware 16X Aurora, RTX 5070
Intel Core Ultra 9 275HX, GeForce RTX 5070 Laptop
13428 Points +3%
MSI Crosshair 16 HX AI D2XWGKG
Intel Core Ultra 9 275HX, GeForce RTX 5070 Laptop
12998 Points
Aorus Elite 16 AE6H
Intel Core Ultra 9 275HX, GeForce RTX 5070 Laptop
12789 Points -2%
MSI Crosshair 18 HX AI A2XW
Intel Core Ultra 9 275HX, GeForce RTX 5070 Laptop
12602 Points -3%
AIDA64 / FPU Mandel
MSI Crosshair A17 HX D8WGKG
AMD Ryzen 9 8940HX, GeForce RTX 5070 Laptop
113321 Points +21%
MSI Crosshair 18 HX AI A2XW
Intel Core Ultra 9 275HX, GeForce RTX 5070 Laptop
94765 Points +1%
Media Intel Core Ultra 9 275HX
  (72596 - 104508, n=27)
94110 Points 0%
MSI Crosshair 16 HX AI D2XWGKG
Intel Core Ultra 9 275HX, GeForce RTX 5070 Laptop
93713 Points
Lenovo Legion 5 Pro 16IAX10H
Intel Core Ultra 9 275HX, GeForce RTX 5070 Ti Laptop
90021 Points -4%
Aorus Elite 16 AE6H
Intel Core Ultra 9 275HX, GeForce RTX 5070 Laptop
86354 Points -8%
Alienware 16X Aurora, RTX 5070
Intel Core Ultra 9 275HX, GeForce RTX 5070 Laptop
84624 Points -10%
Schenker XMG Core 16 M25
AMD Ryzen AI 9 HX 370, GeForce RTX 5070 Laptop
77421 Points -17%
Media della classe Gaming
  (17585 - 134044, n=143, ultimi 2 anni)
65939 Points -30%
Asus TUF Gaming A16 FA608UP
AMD Ryzen 7 260, GeForce RTX 5070 Laptop
63212 Points -33%
AIDA64 / CPU AES
MSI Crosshair A17 HX D8WGKG
AMD Ryzen 9 8940HX, GeForce RTX 5070 Laptop
168749 MB/s +35%
Lenovo Legion 5 Pro 16IAX10H
Intel Core Ultra 9 275HX, GeForce RTX 5070 Ti Laptop
132784 MB/s +7%
Media Intel Core Ultra 9 275HX
  (107195 - 247074, n=27)
131711 MB/s +6%
MSI Crosshair 16 HX AI D2XWGKG
Intel Core Ultra 9 275HX, GeForce RTX 5070 Laptop
124637 MB/s
Alienware 16X Aurora, RTX 5070
Intel Core Ultra 9 275HX, GeForce RTX 5070 Laptop
123278 MB/s -1%
MSI Crosshair 18 HX AI A2XW
Intel Core Ultra 9 275HX, GeForce RTX 5070 Laptop
121631 MB/s -2%
Schenker XMG Core 16 M25
AMD Ryzen AI 9 HX 370, GeForce RTX 5070 Laptop
118993 MB/s -5%
Aorus Elite 16 AE6H
Intel Core Ultra 9 275HX, GeForce RTX 5070 Laptop
115587 MB/s -7%
Media della classe Gaming
  (19065 - 247074, n=143, ultimi 2 anni)
109406 MB/s -12%
Asus TUF Gaming A16 FA608UP
AMD Ryzen 7 260, GeForce RTX 5070 Laptop
90394 MB/s -27%
AIDA64 / CPU ZLib
Lenovo Legion 5 Pro 16IAX10H
Intel Core Ultra 9 275HX, GeForce RTX 5070 Ti Laptop
2116 MB/s +6%
MSI Crosshair A17 HX D8WGKG
AMD Ryzen 9 8940HX, GeForce RTX 5070 Laptop
2092 MB/s +5%
Media Intel Core Ultra 9 275HX
  (1599 - 2263, n=27)
2038 MB/s +3%
MSI Crosshair 16 HX AI D2XWGKG
Intel Core Ultra 9 275HX, GeForce RTX 5070 Laptop
1987 MB/s
Alienware 16X Aurora, RTX 5070
Intel Core Ultra 9 275HX, GeForce RTX 5070 Laptop
1928 MB/s -3%
MSI Crosshair 18 HX AI A2XW
Intel Core Ultra 9 275HX, GeForce RTX 5070 Laptop
1923 MB/s -3%
Aorus Elite 16 AE6H
Intel Core Ultra 9 275HX, GeForce RTX 5070 Laptop
1878 MB/s -5%
Media della classe Gaming
  (373 - 2531, n=143, ultimi 2 anni)
1531 MB/s -23%
Schenker XMG Core 16 M25
AMD Ryzen AI 9 HX 370, GeForce RTX 5070 Laptop
1518 MB/s -24%
Asus TUF Gaming A16 FA608UP
AMD Ryzen 7 260, GeForce RTX 5070 Laptop
1039 MB/s -48%
AIDA64 / FP64 Ray-Trace
MSI Crosshair A17 HX D8WGKG
AMD Ryzen 9 8940HX, GeForce RTX 5070 Laptop
28180 KRay/s +47%
Schenker XMG Core 16 M25
AMD Ryzen AI 9 HX 370, GeForce RTX 5070 Laptop
20295 KRay/s +6%
Media Intel Core Ultra 9 275HX
  (14847 - 21854, n=27)
19265 KRay/s 0%
MSI Crosshair 18 HX AI A2XW
Intel Core Ultra 9 275HX, GeForce RTX 5070 Laptop
19236 KRay/s 0%
MSI Crosshair 16 HX AI D2XWGKG
Intel Core Ultra 9 275HX, GeForce RTX 5070 Laptop
19183 KRay/s
Lenovo Legion 5 Pro 16IAX10H
Intel Core Ultra 9 275HX, GeForce RTX 5070 Ti Laptop
18919 KRay/s -1%
Aorus Elite 16 AE6H
Intel Core Ultra 9 275HX, GeForce RTX 5070 Laptop
17636 KRay/s -8%
Alienware 16X Aurora, RTX 5070
Intel Core Ultra 9 275HX, GeForce RTX 5070 Laptop
17429 KRay/s -9%
Asus TUF Gaming A16 FA608UP
AMD Ryzen 7 260, GeForce RTX 5070 Laptop
15351 KRay/s -20%
Media della classe Gaming
  (3856 - 45446, n=143, ultimi 2 anni)
15152 KRay/s -21%
AIDA64 / CPU PhotoWorxx
Schenker XMG Core 16 M25
AMD Ryzen AI 9 HX 370, GeForce RTX 5070 Laptop
51695 MPixel/s +32%
Media Intel Core Ultra 9 275HX
  (37482 - 62916, n=27)
50085 MPixel/s +28%
Lenovo Legion 5 Pro 16IAX10H
Intel Core Ultra 9 275HX, GeForce RTX 5070 Ti Laptop
49232 MPixel/s +26%
Alienware 16X Aurora, RTX 5070
Intel Core Ultra 9 275HX, GeForce RTX 5070 Laptop
49214 MPixel/s +26%
Aorus Elite 16 AE6H
Intel Core Ultra 9 275HX, GeForce RTX 5070 Laptop
49213 MPixel/s +26%
MSI Crosshair 18 HX AI A2XW
Intel Core Ultra 9 275HX, GeForce RTX 5070 Laptop
49114 MPixel/s +26%
Media della classe Gaming
  (10805 - 62916, n=143, ultimi 2 anni)
43002 MPixel/s +10%
Asus TUF Gaming A16 FA608UP
AMD Ryzen 7 260, GeForce RTX 5070 Laptop
39936 MPixel/s +2%
MSI Crosshair 16 HX AI D2XWGKG
Intel Core Ultra 9 275HX, GeForce RTX 5070 Laptop
39052 MPixel/s
MSI Crosshair A17 HX D8WGKG
AMD Ryzen 9 8940HX, GeForce RTX 5070 Laptop
34819 MPixel/s -11%

Prestazioni del sistema

Abbiamo dovuto aggiornare temporaneamente il driver Nvidia alla versione 577.00 per far funzionare PCMark 10 in modo affidabile.

Le prestazioni complessive del sistema sono più che adeguate per la produttività quotidiana e la navigazione web.

Performance rating
Lenovo Legion 5 Pro 16IAX10H
GeForce RTX 5070 Ti Laptop, Ultra 9 275HX, Western Digital PC SN8000S SDEPNRK-1T00
83.8 pt
Aorus Elite 16 AE6H
GeForce RTX 5070 Laptop, Ultra 9 275HX, Gigabyte AG470S1TB-SI B10
82.1 pt
Media Intel Core Ultra 9 275HX, NVIDIA GeForce RTX 5070 Laptop
 
80.5 pt
MSI Crosshair 18 HX AI A2XW
GeForce RTX 5070 Laptop, Ultra 9 275HX, Micron 2500 1TB MTFDKBA1T0QGN
79.1 pt
Alienware 16X Aurora, RTX 5070 -4!
GeForce RTX 5070 Laptop, Ultra 9 275HX
78.4 pt
MSI Crosshair 16 HX AI D2XWGKG
GeForce RTX 5070 Laptop, Ultra 9 275HX, Micron 2500 1TB MTFDKBA1T0QGN
78.3 pt
Schenker XMG Core 16 M25 -4!
GeForce RTX 5070 Laptop, Ryzen AI 9 HX 370, Samsung 990 Pro 2 TB MZVL72T0HDLB
75.8 pt
Media della classe Gaming
 
75.5 pt
MSI Crosshair A17 HX D8WGKG
GeForce RTX 5070 Laptop, R9 8940HX, Samsung PM9C1 MZVL81T0HELB-00BTW
71.3 pt
Asus TUF Gaming A16 FA608UP -4!
GeForce RTX 5070 Laptop, R7 260, Western Digital PC SN5000S SDEQNSJ-1T00
61.7 pt
PCMark 10 / Score
Lenovo Legion 5 Pro 16IAX10H
GeForce RTX 5070 Ti Laptop, Ultra 9 275HX, Western Digital PC SN8000S SDEPNRK-1T00
8297 Points +2%
MSI Crosshair 16 HX AI D2XWGKG
GeForce RTX 5070 Laptop, Ultra 9 275HX, Micron 2500 1TB MTFDKBA1T0QGN
8149 Points
MSI Crosshair A17 HX D8WGKG
GeForce RTX 5070 Laptop, R9 8940HX, Samsung PM9C1 MZVL81T0HELB-00BTW
8106 Points -1%
Aorus Elite 16 AE6H
GeForce RTX 5070 Laptop, Ultra 9 275HX, Gigabyte AG470S1TB-SI B10
8104 Points -1%
Media Intel Core Ultra 9 275HX, NVIDIA GeForce RTX 5070 Laptop
  (8018 - 8149, n=3)
8090 Points -1%
Media della classe Gaming
  (5776 - 9852, n=121, ultimi 2 anni)
8063 Points -1%
MSI Crosshair 18 HX AI A2XW
GeForce RTX 5070 Laptop, Ultra 9 275HX, Micron 2500 1TB MTFDKBA1T0QGN
8018 Points -2%
PCMark 10 / Essentials
MSI Crosshair A17 HX D8WGKG
GeForce RTX 5070 Laptop, R9 8940HX, Samsung PM9C1 MZVL81T0HELB-00BTW
11371 Points +6%
MSI Crosshair 18 HX AI A2XW
GeForce RTX 5070 Laptop, Ultra 9 275HX, Micron 2500 1TB MTFDKBA1T0QGN
11025 Points +2%
Media Intel Core Ultra 9 275HX, NVIDIA GeForce RTX 5070 Laptop
  (10767 - 11025, n=3)
10857 Points +1%
Aorus Elite 16 AE6H
GeForce RTX 5070 Laptop, Ultra 9 275HX, Gigabyte AG470S1TB-SI B10
10780 Points 0%
MSI Crosshair 16 HX AI D2XWGKG
GeForce RTX 5070 Laptop, Ultra 9 275HX, Micron 2500 1TB MTFDKBA1T0QGN
10767 Points
Media della classe Gaming
  (8840 - 12600, n=125, ultimi 2 anni)
10752 Points 0%
Lenovo Legion 5 Pro 16IAX10H
GeForce RTX 5070 Ti Laptop, Ultra 9 275HX, Western Digital PC SN8000S SDEPNRK-1T00
10738 Points 0%
PCMark 10 / Productivity
Media della classe Gaming
  (6662 - 14612, n=121, ultimi 2 anni)
9817 Points +18%
MSI Crosshair 18 HX AI A2XW
GeForce RTX 5070 Laptop, Ultra 9 275HX, Micron 2500 1TB MTFDKBA1T0QGN
9751 Points +17%
Lenovo Legion 5 Pro 16IAX10H
GeForce RTX 5070 Ti Laptop, Ultra 9 275HX, Western Digital PC SN8000S SDEPNRK-1T00
9698 Points +17%
MSI Crosshair A17 HX D8WGKG
GeForce RTX 5070 Laptop, R9 8940HX, Samsung PM9C1 MZVL81T0HELB-00BTW
9492 Points +14%
Aorus Elite 16 AE6H
GeForce RTX 5070 Laptop, Ultra 9 275HX, Gigabyte AG470S1TB-SI B10
9488 Points +14%
Media Intel Core Ultra 9 275HX, NVIDIA GeForce RTX 5070 Laptop
  (8307 - 9751, n=3)
9182 Points +11%
MSI Crosshair 16 HX AI D2XWGKG
GeForce RTX 5070 Laptop, Ultra 9 275HX, Micron 2500 1TB MTFDKBA1T0QGN
8307 Points
PCMark 10 / Digital Content Creation
MSI Crosshair 16 HX AI D2XWGKG
GeForce RTX 5070 Laptop, Ultra 9 275HX, Micron 2500 1TB MTFDKBA1T0QGN
16417 Points
Lenovo Legion 5 Pro 16IAX10H
GeForce RTX 5070 Ti Laptop, Ultra 9 275HX, Western Digital PC SN8000S SDEPNRK-1T00
14888 Points -9%
Media Intel Core Ultra 9 275HX, NVIDIA GeForce RTX 5070 Laptop
  (13010 - 16417, n=3)
14516 Points -12%
Aorus Elite 16 AE6H
GeForce RTX 5070 Laptop, Ultra 9 275HX, Gigabyte AG470S1TB-SI B10
14120 Points -14%
Media della classe Gaming
  (7440 - 19351, n=121, ultimi 2 anni)
13654 Points -17%
MSI Crosshair A17 HX D8WGKG
GeForce RTX 5070 Laptop, R9 8940HX, Samsung PM9C1 MZVL81T0HELB-00BTW
13392 Points -18%
MSI Crosshair 18 HX AI A2XW
GeForce RTX 5070 Laptop, Ultra 9 275HX, Micron 2500 1TB MTFDKBA1T0QGN
13010 Points -21%
CrossMark / Overall
Alienware 16X Aurora, RTX 5070
GeForce RTX 5070 Laptop, Ultra 9 275HX
2269 Points +8%
Lenovo Legion 5 Pro 16IAX10H
GeForce RTX 5070 Ti Laptop, Ultra 9 275HX, Western Digital PC SN8000S SDEPNRK-1T00
2176 Points +3%
Media Intel Core Ultra 9 275HX, NVIDIA GeForce RTX 5070 Laptop
  (2084 - 2269, n=4)
2150 Points +2%
Aorus Elite 16 AE6H
GeForce RTX 5070 Laptop, Ultra 9 275HX, Gigabyte AG470S1TB-SI B10
2138 Points +1%
MSI Crosshair 16 HX AI D2XWGKG
GeForce RTX 5070 Laptop, Ultra 9 275HX, Micron 2500 1TB MTFDKBA1T0QGN
2107 Points
MSI Crosshair 18 HX AI A2XW
GeForce RTX 5070 Laptop, Ultra 9 275HX, Micron 2500 1TB MTFDKBA1T0QGN
2084 Points -1%
Schenker XMG Core 16 M25
GeForce RTX 5070 Laptop, Ryzen AI 9 HX 370, Samsung 990 Pro 2 TB MZVL72T0HDLB
2028 Points -4%
Media della classe Gaming
  (1247 - 2344, n=116, ultimi 2 anni)
1983 Points -6%
MSI Crosshair A17 HX D8WGKG
GeForce RTX 5070 Laptop, R9 8940HX, Samsung PM9C1 MZVL81T0HELB-00BTW
1977 Points -6%
Asus TUF Gaming A16 FA608UP
GeForce RTX 5070 Laptop, R7 260, Western Digital PC SN5000S SDEQNSJ-1T00
1712 Points -19%
CrossMark / Productivity
Alienware 16X Aurora, RTX 5070
GeForce RTX 5070 Laptop, Ultra 9 275HX
2173 Points +10%
Lenovo Legion 5 Pro 16IAX10H
GeForce RTX 5070 Ti Laptop, Ultra 9 275HX, Western Digital PC SN8000S SDEPNRK-1T00
2038 Points +3%
Media Intel Core Ultra 9 275HX, NVIDIA GeForce RTX 5070 Laptop
  (1932 - 2173, n=4)
2024 Points +3%
Aorus Elite 16 AE6H
GeForce RTX 5070 Laptop, Ultra 9 275HX, Gigabyte AG470S1TB-SI B10
2022 Points +3%
MSI Crosshair 16 HX AI D2XWGKG
GeForce RTX 5070 Laptop, Ultra 9 275HX, Micron 2500 1TB MTFDKBA1T0QGN
1970 Points
MSI Crosshair 18 HX AI A2XW
GeForce RTX 5070 Laptop, Ultra 9 275HX, Micron 2500 1TB MTFDKBA1T0QGN
1932 Points -2%
Media della classe Gaming
  (1299 - 2211, n=116, ultimi 2 anni)
1862 Points -5%
MSI Crosshair A17 HX D8WGKG
GeForce RTX 5070 Laptop, R9 8940HX, Samsung PM9C1 MZVL81T0HELB-00BTW
1844 Points -6%
Schenker XMG Core 16 M25
GeForce RTX 5070 Laptop, Ryzen AI 9 HX 370, Samsung 990 Pro 2 TB MZVL72T0HDLB
1820 Points -8%
Asus TUF Gaming A16 FA608UP
GeForce RTX 5070 Laptop, R7 260, Western Digital PC SN5000S SDEQNSJ-1T00
1648 Points -16%
CrossMark / Creativity
Lenovo Legion 5 Pro 16IAX10H
GeForce RTX 5070 Ti Laptop, Ultra 9 275HX, Western Digital PC SN8000S SDEPNRK-1T00
2456 Points +3%
Schenker XMG Core 16 M25
GeForce RTX 5070 Laptop, Ryzen AI 9 HX 370, Samsung 990 Pro 2 TB MZVL72T0HDLB
2455 Points +3%
Alienware 16X Aurora, RTX 5070
GeForce RTX 5070 Laptop, Ultra 9 275HX
2415 Points +1%
MSI Crosshair 16 HX AI D2XWGKG
GeForce RTX 5070 Laptop, Ultra 9 275HX, Micron 2500 1TB MTFDKBA1T0QGN
2380 Points
Media Intel Core Ultra 9 275HX, NVIDIA GeForce RTX 5070 Laptop
  (2322 - 2415, n=4)
2372 Points 0%
MSI Crosshair 18 HX AI A2XW
GeForce RTX 5070 Laptop, Ultra 9 275HX, Micron 2500 1TB MTFDKBA1T0QGN
2371 Points 0%
Aorus Elite 16 AE6H
GeForce RTX 5070 Laptop, Ultra 9 275HX, Gigabyte AG470S1TB-SI B10
2322 Points -2%
MSI Crosshair A17 HX D8WGKG
GeForce RTX 5070 Laptop, R9 8940HX, Samsung PM9C1 MZVL81T0HELB-00BTW
2225 Points -7%
Media della classe Gaming
  (1275 - 2729, n=116, ultimi 2 anni)
2215 Points -7%
Asus TUF Gaming A16 FA608UP
GeForce RTX 5070 Laptop, R7 260, Western Digital PC SN5000S SDEQNSJ-1T00
1879 Points -21%
CrossMark / Responsiveness
Alienware 16X Aurora, RTX 5070
GeForce RTX 5070 Laptop, Ultra 9 275HX
2143 Points +20%
Aorus Elite 16 AE6H
GeForce RTX 5070 Laptop, Ultra 9 275HX, Gigabyte AG470S1TB-SI B10
1977 Points +10%
Media Intel Core Ultra 9 275HX, NVIDIA GeForce RTX 5070 Laptop
  (1779 - 2143, n=4)
1922 Points +7%
Lenovo Legion 5 Pro 16IAX10H
GeForce RTX 5070 Ti Laptop, Ultra 9 275HX, Western Digital PC SN8000S SDEPNRK-1T00
1844 Points +3%
MSI Crosshair 16 HX AI D2XWGKG
GeForce RTX 5070 Laptop, Ultra 9 275HX, Micron 2500 1TB MTFDKBA1T0QGN
1790 Points
MSI Crosshair 18 HX AI A2XW
GeForce RTX 5070 Laptop, Ultra 9 275HX, Micron 2500 1TB MTFDKBA1T0QGN
1779 Points -1%
Media della classe Gaming
  (1030 - 2330, n=116, ultimi 2 anni)
1734 Points -3%
MSI Crosshair A17 HX D8WGKG
GeForce RTX 5070 Laptop, R9 8940HX, Samsung PM9C1 MZVL81T0HELB-00BTW
1709 Points -5%
Schenker XMG Core 16 M25
GeForce RTX 5070 Laptop, Ryzen AI 9 HX 370, Samsung 990 Pro 2 TB MZVL72T0HDLB
1581 Points -12%
Asus TUF Gaming A16 FA608UP
GeForce RTX 5070 Laptop, R7 260, Western Digital PC SN5000S SDEQNSJ-1T00
1454 Points -19%
AIDA64 / Memory Copy
Aorus Elite 16 AE6H
GeForce RTX 5070 Laptop, Ultra 9 275HX, Gigabyte AG470S1TB-SI B10
78064 MB/s +14%
Lenovo Legion 5 Pro 16IAX10H
GeForce RTX 5070 Ti Laptop, Ultra 9 275HX, Western Digital PC SN8000S SDEPNRK-1T00
77921 MB/s +14%
Alienware 16X Aurora, RTX 5070
GeForce RTX 5070 Laptop, Ultra 9 275HX
77444 MB/s +13%
MSI Crosshair 18 HX AI A2XW
GeForce RTX 5070 Laptop, Ultra 9 275HX, Micron 2500 1TB MTFDKBA1T0QGN
77263 MB/s +13%
Media Intel Core Ultra 9 275HX, NVIDIA GeForce RTX 5070 Laptop
  (68559 - 78064, n=4)
75333 MB/s +10%
Schenker XMG Core 16 M25
GeForce RTX 5070 Laptop, Ryzen AI 9 HX 370, Samsung 990 Pro 2 TB MZVL72T0HDLB
73841 MB/s +8%
Media della classe Gaming
  (21750 - 104987, n=143, ultimi 2 anni)
70923 MB/s +3%
MSI Crosshair 16 HX AI D2XWGKG
GeForce RTX 5070 Laptop, Ultra 9 275HX, Micron 2500 1TB MTFDKBA1T0QGN
68559 MB/s
Asus TUF Gaming A16 FA608UP
GeForce RTX 5070 Laptop, R7 260, Western Digital PC SN5000S SDEQNSJ-1T00
67750 MB/s -1%
MSI Crosshair A17 HX D8WGKG
GeForce RTX 5070 Laptop, R9 8940HX, Samsung PM9C1 MZVL81T0HELB-00BTW
51173 MB/s -25%
AIDA64 / Memory Read
Lenovo Legion 5 Pro 16IAX10H
GeForce RTX 5070 Ti Laptop, Ultra 9 275HX, Western Digital PC SN8000S SDEPNRK-1T00
86404 MB/s +3%
Aorus Elite 16 AE6H
GeForce RTX 5070 Laptop, Ultra 9 275HX, Gigabyte AG470S1TB-SI B10
86191 MB/s +3%
Alienware 16X Aurora, RTX 5070
GeForce RTX 5070 Laptop, Ultra 9 275HX
85905 MB/s +2%
Media Intel Core Ultra 9 275HX, NVIDIA GeForce RTX 5070 Laptop
  (83924 - 86191, n=4)
85066 MB/s +1%
Schenker XMG Core 16 M25
GeForce RTX 5070 Laptop, Ryzen AI 9 HX 370, Samsung 990 Pro 2 TB MZVL72T0HDLB
84797 MB/s +1%
MSI Crosshair 18 HX AI A2XW
GeForce RTX 5070 Laptop, Ultra 9 275HX, Micron 2500 1TB MTFDKBA1T0QGN
84242 MB/s 0%
MSI Crosshair 16 HX AI D2XWGKG
GeForce RTX 5070 Laptop, Ultra 9 275HX, Micron 2500 1TB MTFDKBA1T0QGN
83924 MB/s
Media della classe Gaming
  (22956 - 104349, n=143, ultimi 2 anni)
73852 MB/s -12%
MSI Crosshair A17 HX D8WGKG
GeForce RTX 5070 Laptop, R9 8940HX, Samsung PM9C1 MZVL81T0HELB-00BTW
62219 MB/s -26%
Asus TUF Gaming A16 FA608UP
GeForce RTX 5070 Laptop, R7 260, Western Digital PC SN5000S SDEQNSJ-1T00
61170 MB/s -27%
AIDA64 / Memory Write
Aorus Elite 16 AE6H
GeForce RTX 5070 Laptop, Ultra 9 275HX, Gigabyte AG470S1TB-SI B10
106063 MB/s +59%
Asus TUF Gaming A16 FA608UP
GeForce RTX 5070 Laptop, R7 260, Western Digital PC SN5000S SDEQNSJ-1T00
86401 MB/s +29%
Media Intel Core Ultra 9 275HX, NVIDIA GeForce RTX 5070 Laptop
  (66719 - 106063, n=4)
82195 MB/s +23%
Schenker XMG Core 16 M25
GeForce RTX 5070 Laptop, Ryzen AI 9 HX 370, Samsung 990 Pro 2 TB MZVL72T0HDLB
81836 MB/s +23%
Alienware 16X Aurora, RTX 5070
GeForce RTX 5070 Laptop, Ultra 9 275HX
78747 MB/s +18%
Lenovo Legion 5 Pro 16IAX10H
GeForce RTX 5070 Ti Laptop, Ultra 9 275HX, Western Digital PC SN8000S SDEPNRK-1T00
77655 MB/s +16%
MSI Crosshair 18 HX AI A2XW
GeForce RTX 5070 Laptop, Ultra 9 275HX, Micron 2500 1TB MTFDKBA1T0QGN
77252 MB/s +16%
Media della classe Gaming
  (22297 - 133486, n=143, ultimi 2 anni)
72595 MB/s +9%
MSI Crosshair 16 HX AI D2XWGKG
GeForce RTX 5070 Laptop, Ultra 9 275HX, Micron 2500 1TB MTFDKBA1T0QGN
66719 MB/s
MSI Crosshair A17 HX D8WGKG
GeForce RTX 5070 Laptop, R9 8940HX, Samsung PM9C1 MZVL81T0HELB-00BTW
61929 MB/s -7%
AIDA64 / Memory Latency
Alienware 16X Aurora, RTX 5070
GeForce RTX 5070 Laptop, Ultra 9 275HX
116 ns * -4%
Lenovo Legion 5 Pro 16IAX10H
GeForce RTX 5070 Ti Laptop, Ultra 9 275HX, Western Digital PC SN8000S SDEPNRK-1T00
112 ns * -0%
Aorus Elite 16 AE6H
GeForce RTX 5070 Laptop, Ultra 9 275HX, Gigabyte AG470S1TB-SI B10
111.6 ns * -0%
MSI Crosshair 16 HX AI D2XWGKG
GeForce RTX 5070 Laptop, Ultra 9 275HX, Micron 2500 1TB MTFDKBA1T0QGN
111.5 ns *
Media Intel Core Ultra 9 275HX, NVIDIA GeForce RTX 5070 Laptop
  (106.8 - 116, n=4)
111.5 ns * -0%
MSI Crosshair 18 HX AI A2XW
GeForce RTX 5070 Laptop, Ultra 9 275HX, Micron 2500 1TB MTFDKBA1T0QGN
106.8 ns * +4%
Media della classe Gaming
  (59.5 - 259, n=143, ultimi 2 anni)
101.8 ns * +9%
Asus TUF Gaming A16 FA608UP
GeForce RTX 5070 Laptop, R7 260, Western Digital PC SN5000S SDEQNSJ-1T00
93.8 ns * +16%
Schenker XMG Core 16 M25
GeForce RTX 5070 Laptop, Ryzen AI 9 HX 370, Samsung 990 Pro 2 TB MZVL72T0HDLB
86.7 ns * +22%
MSI Crosshair A17 HX D8WGKG
GeForce RTX 5070 Laptop, R9 8940HX, Samsung PM9C1 MZVL81T0HELB-00BTW
83.9 ns * +25%
WebXPRT 3 / Overall
Lenovo Legion 5 Pro 16IAX10H
GeForce RTX 5070 Ti Laptop, Ultra 9 275HX, Western Digital PC SN8000S SDEPNRK-1T00
532 Points +61%
Alienware 16X Aurora, RTX 5070
GeForce RTX 5070 Laptop, Ultra 9 275HX
364 Points +10%
Schenker XMG Core 16 M25
GeForce RTX 5070 Laptop, Ryzen AI 9 HX 370, Samsung 990 Pro 2 TB MZVL72T0HDLB
352 Points +6%
Media Intel Core Ultra 9 275HX, NVIDIA GeForce RTX 5070 Laptop
  (309 - 364, n=4)
333 Points +1%
MSI Crosshair 16 HX AI D2XWGKG
GeForce RTX 5070 Laptop, Ultra 9 275HX, Micron 2500 1TB MTFDKBA1T0QGN
331 Points
MSI Crosshair 18 HX AI A2XW
GeForce RTX 5070 Laptop, Ultra 9 275HX, Micron 2500 1TB MTFDKBA1T0QGN
329 Points -1%
Media della classe Gaming
  (237 - 532, n=121, ultimi 2 anni)
315 Points -5%
Aorus Elite 16 AE6H
GeForce RTX 5070 Laptop, Ultra 9 275HX, Gigabyte AG470S1TB-SI B10
309 Points -7%
Asus TUF Gaming A16 FA608UP
GeForce RTX 5070 Laptop, R7 260, Western Digital PC SN5000S SDEQNSJ-1T00
297 Points -10%
MSI Crosshair A17 HX D8WGKG
GeForce RTX 5070 Laptop, R9 8940HX, Samsung PM9C1 MZVL81T0HELB-00BTW
274 Points -17%
WebXPRT 4 / Overall
Schenker XMG Core 16 M25
GeForce RTX 5070 Laptop, Ryzen AI 9 HX 370, Samsung 990 Pro 2 TB MZVL72T0HDLB
345 Points +10%
Alienware 16X Aurora, RTX 5070
GeForce RTX 5070 Laptop, Ultra 9 275HX
330 Points +5%
Aorus Elite 16 AE6H
GeForce RTX 5070 Laptop, Ultra 9 275HX, Gigabyte AG470S1TB-SI B10
328 Points +4%
Lenovo Legion 5 Pro 16IAX10H
GeForce RTX 5070 Ti Laptop, Ultra 9 275HX, Western Digital PC SN8000S SDEPNRK-1T00
324 Points +3%
Media Intel Core Ultra 9 275HX, NVIDIA GeForce RTX 5070 Laptop
  (315 - 330, n=4)
323 Points +3%
MSI Crosshair 18 HX AI A2XW
GeForce RTX 5070 Laptop, Ultra 9 275HX, Micron 2500 1TB MTFDKBA1T0QGN
317 Points +1%
MSI Crosshair 16 HX AI D2XWGKG
GeForce RTX 5070 Laptop, Ultra 9 275HX, Micron 2500 1TB MTFDKBA1T0QGN
315 Points
Media della classe Gaming
  (176.4 - 345, n=116, ultimi 2 anni)
283 Points -10%
Asus TUF Gaming A16 FA608UP
GeForce RTX 5070 Laptop, R7 260, Western Digital PC SN5000S SDEQNSJ-1T00
239 Points -24%
MSI Crosshair A17 HX D8WGKG
GeForce RTX 5070 Laptop, R9 8940HX, Samsung PM9C1 MZVL81T0HELB-00BTW
230 Points -27%
Mozilla Kraken 1.1 / Total
Asus TUF Gaming A16 FA608UP
GeForce RTX 5070 Laptop, R7 260, Western Digital PC SN5000S SDEQNSJ-1T00
562 ms * -38%
MSI Crosshair A17 HX D8WGKG
GeForce RTX 5070 Laptop, R9 8940HX, Samsung PM9C1 MZVL81T0HELB-00BTW
507 ms * -25%
Media della classe Gaming
  (397 - 674, n=130, ultimi 2 anni)
473 ms * -16%
MSI Crosshair 18 HX AI A2XW
GeForce RTX 5070 Laptop, Ultra 9 275HX, Micron 2500 1TB MTFDKBA1T0QGN
431 ms * -6%
Aorus Elite 16 AE6H
GeForce RTX 5070 Laptop, Ultra 9 275HX, Gigabyte AG470S1TB-SI B10
422 ms * -4%
Media Intel Core Ultra 9 275HX, NVIDIA GeForce RTX 5070 Laptop
  (407 - 431, n=4)
418 ms * -3%
Schenker XMG Core 16 M25
GeForce RTX 5070 Laptop, Ryzen AI 9 HX 370, Samsung 990 Pro 2 TB MZVL72T0HDLB
416.4 ms * -2%
Lenovo Legion 5 Pro 16IAX10H
GeForce RTX 5070 Ti Laptop, Ultra 9 275HX, Western Digital PC SN8000S SDEPNRK-1T00
414 ms * -2%
Alienware 16X Aurora, RTX 5070
GeForce RTX 5070 Laptop, Ultra 9 275HX
410 ms * -1%
MSI Crosshair 16 HX AI D2XWGKG
GeForce RTX 5070 Laptop, Ultra 9 275HX, Micron 2500 1TB MTFDKBA1T0QGN
407 ms *

* ... Meglio usare valori piccoli

PCMark 10 Score
8149 punti
Aiuto

Latenza DPC

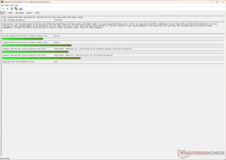
La latenza DPC misurata è più alta, il che può potenzialmente creare problemi durante i flussi di lavoro audio in tempo reale.

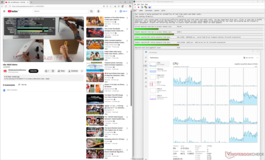
LatencyMon durante la riproduzione di YouTube in 4K60
LatencyMon dopo 10 secondi di Prime95
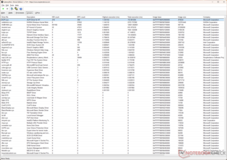
Il driver ACPI.sys mostra il tempo di esecuzione più alto
DPC Latencies / LatencyMon - interrupt to process latency (max), Web, Youtube, Prime95
Alienware 16X Aurora, RTX 5070
GeForce RTX 5070 Laptop, Ultra 9 275HX
2079.4 μs * -90%
Lenovo Legion 5 Pro 16IAX10H
GeForce RTX 5070 Ti Laptop, Ultra 9 275HX, Western Digital PC SN8000S SDEPNRK-1T00
1123.5 μs * -3%
MSI Crosshair 16 HX AI D2XWGKG
GeForce RTX 5070 Laptop, Ultra 9 275HX, Micron 2500 1TB MTFDKBA1T0QGN
1094 μs *
MSI Crosshair 18 HX AI A2XW
GeForce RTX 5070 Laptop, Ultra 9 275HX, Micron 2500 1TB MTFDKBA1T0QGN
1057.2 μs * +3%
Aorus Elite 16 AE6H
GeForce RTX 5070 Laptop, Ultra 9 275HX, Gigabyte AG470S1TB-SI B10
965.2 μs * +12%
MSI Crosshair A17 HX D8WGKG
GeForce RTX 5070 Laptop, R9 8940HX, Samsung PM9C1 MZVL81T0HELB-00BTW
759.9 μs * +31%
Schenker XMG Core 16 M25
GeForce RTX 5070 Laptop, Ryzen AI 9 HX 370, Samsung 990 Pro 2 TB MZVL72T0HDLB
606 μs * +45%
Asus TUF Gaming A16 FA608UP
GeForce RTX 5070 Laptop, R7 260, Western Digital PC SN5000S SDEQNSJ-1T00
563.8 μs * +48%

* ... Meglio usare valori piccoli

Dispositivi di archiviazione

L'SSD Micron 2500 1 TB PCIe Gen 4 NVMe offre prestazioni decenti in lettura/scrittura, ma non è all'altezza di un modello come il Samsung PM9C1 nel Crosshair A17 HX.

È disponibile uno slot M.2 aggiuntivo per l'espansione dell'archiviazione.

Micron 2500 1TB MTFDKBA1T0QGN
CDM 5/6 Read Seq Q32T1: 6739.1 MB/s
CDM 5/6 Write Seq Q32T1: 5799.9 MB/s
CDM 5/6 Read 4K Q32T1: 550.6 MB/s
CDM 5/6 Write 4K Q32T1: 610.5 MB/s
CDM 5 Read Seq: 3298 MB/s
CDM 5 Write Seq: 3296 MB/s
CDM 5/6 Read 4K: 70.4 MB/s
CDM 5/6 Write 4K: 174.7 MB/s
CDM 6 Write 4K Q8T8: 594.4 MB/s
CDM 6 Read 4K Q8T8: 1107.9 MB/s
Drive Performance rating - Percent
Aorus Elite 16 AE6H
Gigabyte AG470S1TB-SI B10
86.1 pt
MSI Crosshair A17 HX D8WGKG
Samsung PM9C1 MZVL81T0HELB-00BTW
78 pt
Alienware 16X Aurora, RTX 5070
 
77.2 pt
Lenovo Legion 5 Pro 16IAX10H
Western Digital PC SN8000S SDEPNRK-1T00
71.7 pt
Media della classe Gaming
 
68.5 pt
Media Micron 2500 1TB MTFDKBA1T0QGN
 
64.7 pt
Schenker XMG Core 16 M25
Samsung 990 Pro 2 TB MZVL72T0HDLB
64.4 pt
MSI Crosshair 16 HX AI D2XWGKG
Micron 2500 1TB MTFDKBA1T0QGN
59.2 pt
MSI Crosshair 18 HX AI A2XW
Micron 2500 1TB MTFDKBA1T0QGN
58.7 pt
Asus TUF Gaming A16 FA608UP
Western Digital PC SN5000S SDEQNSJ-1T00
52.3 pt
DiskSpd
seq read
Alienware 16X Aurora, RTX 5070
 
4792 (4766.73min - 4792.47max) MB/s +344%
Lenovo Legion 5 Pro 16IAX10H
Western Digital PC SN8000S SDEPNRK-1T00
4144 (3878.27min - 4144.39max) MB/s +284%
MSI Crosshair A17 HX D8WGKG
Samsung PM9C1 MZVL81T0HELB-00BTW
3670 (3639.46min - 3669.81max) MB/s +240%
Media della classe Gaming
  (281 - 8300, n=127, ultimi 2 anni)
3493 MB/s +224%
Schenker XMG Core 16 M25
Samsung 990 Pro 2 TB MZVL72T0HDLB
3275 (3228.94min - 3275.33max) MB/s +204%
Media Micron 2500 1TB MTFDKBA1T0QGN
  (348 - 3632, n=11)
2772 MB/s +157%
Aorus Elite 16 AE6H
Gigabyte AG470S1TB-SI B10
2725 (2717.3min - 2725.46max) MB/s +153%
MSI Crosshair 18 HX AI A2XW
Micron 2500 1TB MTFDKBA1T0QGN
2388 (557.15min - 2387.86max) MB/s +121%
Asus TUF Gaming A16 FA608UP
Western Digital PC SN5000S SDEQNSJ-1T00
1717 (1605.72min - 1717.49max) MB/s +59%
MSI Crosshair 16 HX AI D2XWGKG
Micron 2500 1TB MTFDKBA1T0QGN
1079 (297.62min - 1078.51max) MB/s
seq write
Alienware 16X Aurora, RTX 5070
 
5593 (3454.43min - 5593.31max) MB/s +100%
MSI Crosshair A17 HX D8WGKG
Samsung PM9C1 MZVL81T0HELB-00BTW
4484 (4438.34min - 4483.66max) MB/s +61%
Aorus Elite 16 AE6H
Gigabyte AG470S1TB-SI B10
4341 (3914.54min - 4341.44max) MB/s +55%
Media della classe Gaming
  (1454 - 9699, n=127, ultimi 2 anni)
3973 MB/s +42%
Media Micron 2500 1TB MTFDKBA1T0QGN
  (2759 - 5256, n=11)
3852 MB/s +38%
Asus TUF Gaming A16 FA608UP
Western Digital PC SN5000S SDEQNSJ-1T00
3830 (3464.7min - 3830.45max) MB/s +37%
Schenker XMG Core 16 M25
Samsung 990 Pro 2 TB MZVL72T0HDLB
3727 (3443.1min - 3727.06max) MB/s +33%
MSI Crosshair 18 HX AI A2XW
Micron 2500 1TB MTFDKBA1T0QGN
3071 (2466.77min - 3070.8max) MB/s +10%
MSI Crosshair 16 HX AI D2XWGKG
Micron 2500 1TB MTFDKBA1T0QGN
2793 (2710.36min - 2793.06max) MB/s
Lenovo Legion 5 Pro 16IAX10H
Western Digital PC SN8000S SDEPNRK-1T00
2082 (2048.29min - 2081.87max) MB/s -25%
seq q8 t1 read
MSI Crosshair A17 HX D8WGKG
Samsung PM9C1 MZVL81T0HELB-00BTW
7187 (6550.03min - 7186.83max) MB/s +7%
Alienware 16X Aurora, RTX 5070
 
7030 (6368.69min - 7030.49max) MB/s +4%
Aorus Elite 16 AE6H
Gigabyte AG470S1TB-SI B10
6996 (6462.16min - 6995.95max) MB/s +4%
Lenovo Legion 5 Pro 16IAX10H
Western Digital PC SN8000S SDEPNRK-1T00
6949 (5894.47min - 6948.86max) MB/s +3%
Media Micron 2500 1TB MTFDKBA1T0QGN
  (6745 - 7237, n=11)
6941 MB/s +3%
Media della classe Gaming
  (3193 - 15056, n=127, ultimi 2 anni)
6941 MB/s +3%
MSI Crosshair 18 HX AI A2XW
Micron 2500 1TB MTFDKBA1T0QGN
6833 (5759.01min - 6833.32max) MB/s +1%
MSI Crosshair 16 HX AI D2XWGKG
Micron 2500 1TB MTFDKBA1T0QGN
6745 (5542.14min - 6744.65max) MB/s
Schenker XMG Core 16 M25
Samsung 990 Pro 2 TB MZVL72T0HDLB
6600 (5848.07min - 6599.74max) MB/s -2%
Asus TUF Gaming A16 FA608UP
Western Digital PC SN5000S SDEQNSJ-1T00
6365 (5802.54min - 6364.58max) MB/s -6%
seq q8 t1 write
Schenker XMG Core 16 M25
Samsung 990 Pro 2 TB MZVL72T0HDLB
6933 (6921.65min - 6932.56max) MB/s +24%
Alienware 16X Aurora, RTX 5070
 
6529 (6230.01min - 6528.8max) MB/s +17%
Lenovo Legion 5 Pro 16IAX10H
Western Digital PC SN8000S SDEPNRK-1T00
6236 (6118.79min - 6236.41max) MB/s +12%
Media Micron 2500 1TB MTFDKBA1T0QGN
  (5343 - 6103, n=11)
5833 MB/s +5%
MSI Crosshair 18 HX AI A2XW
Micron 2500 1TB MTFDKBA1T0QGN
5822 (5624.01min - 5822max) MB/s +4%
Media della classe Gaming
  (1699 - 13519, n=127, ultimi 2 anni)
5599 MB/s 0%
MSI Crosshair 16 HX AI D2XWGKG
Micron 2500 1TB MTFDKBA1T0QGN
5580 (5352.56min - 5579.64max) MB/s
Asus TUF Gaming A16 FA608UP
Western Digital PC SN5000S SDEQNSJ-1T00
5576 (5054.3min - 5575.91max) MB/s 0%
Aorus Elite 16 AE6H
Gigabyte AG470S1TB-SI B10
5257 (5165.65min - 5256.51max) MB/s -6%
MSI Crosshair A17 HX D8WGKG
Samsung PM9C1 MZVL81T0HELB-00BTW
4989 (4790.38min - 4988.58max) MB/s -11%
4k q1 t1 read
Alienware 16X Aurora, RTX 5070
 
95.8 (94.49min - 95.77max) MB/s +35%
Lenovo Legion 5 Pro 16IAX10H
Western Digital PC SN8000S SDEPNRK-1T00
75.6 (75.3min - 75.62max) MB/s +7%
Aorus Elite 16 AE6H
Gigabyte AG470S1TB-SI B10
72.9 (53.58min - 72.9max) MB/s +3%
Asus TUF Gaming A16 FA608UP
Western Digital PC SN5000S SDEQNSJ-1T00
71.9 (71.68min - 71.87max) MB/s +2%
MSI Crosshair 16 HX AI D2XWGKG
Micron 2500 1TB MTFDKBA1T0QGN
70.8 (70min - 70.76max) MB/s
Media Micron 2500 1TB MTFDKBA1T0QGN
  (61 - 78.8, n=11)
70 MB/s -1%
Media della classe Gaming
  (32.2 - 110.2, n=127, ultimi 2 anni)
69.5 MB/s -2%
MSI Crosshair 18 HX AI A2XW
Micron 2500 1TB MTFDKBA1T0QGN
62.8 (61.81min - 62.77max) MB/s -11%
MSI Crosshair A17 HX D8WGKG
Samsung PM9C1 MZVL81T0HELB-00BTW
62 (60.9min - 61.95max) MB/s -12%
Schenker XMG Core 16 M25
Samsung 990 Pro 2 TB MZVL72T0HDLB
59.7 (58.18min - 59.68max) MB/s -16%
4k q1 t1 write
Alienware 16X Aurora, RTX 5070
 
345 (334.89min - 345.07max) MB/s +92%
Aorus Elite 16 AE6H
Gigabyte AG470S1TB-SI B10
301 (241.45min - 300.96max) MB/s +68%
Media della classe Gaming
  (78 - 397, n=127, ultimi 2 anni)
209 MB/s +17%
Media Micron 2500 1TB MTFDKBA1T0QGN
  (153.6 - 329, n=11)
204 MB/s +14%
MSI Crosshair 16 HX AI D2XWGKG
Micron 2500 1TB MTFDKBA1T0QGN
179.3 (176.29min - 179.31max) MB/s
MSI Crosshair A17 HX D8WGKG
Samsung PM9C1 MZVL81T0HELB-00BTW
174.4 (172.1min - 174.38max) MB/s -3%
Lenovo Legion 5 Pro 16IAX10H
Western Digital PC SN8000S SDEPNRK-1T00
161.9 (135.91min - 161.88max) MB/s -10%
MSI Crosshair 18 HX AI A2XW
Micron 2500 1TB MTFDKBA1T0QGN
157.4 (152.37min - 157.35max) MB/s -12%
Asus TUF Gaming A16 FA608UP
Western Digital PC SN5000S SDEQNSJ-1T00
143.8 (140.01min - 143.77max) MB/s -20%
Schenker XMG Core 16 M25
Samsung 990 Pro 2 TB MZVL72T0HDLB
111.3 (110.29min - 111.32max) MB/s -38%
4k q32 t16 read
Lenovo Legion 5 Pro 16IAX10H
Western Digital PC SN8000S SDEPNRK-1T00
4494 (4467.04min - 4494.06max) MB/s +533%
MSI Crosshair A17 HX D8WGKG
Samsung PM9C1 MZVL81T0HELB-00BTW
4074 (4063.44min - 4074.07max) MB/s +474%
Alienware 16X Aurora, RTX 5070
 
4034 (4021.16min - 4033.83max) MB/s +468%
Aorus Elite 16 AE6H
Gigabyte AG470S1TB-SI B10
3992 (3943.59min - 3991.68max) MB/s +462%
Media della classe Gaming
  (417 - 8067, n=127, ultimi 2 anni)
2534 MB/s +257%
Media Micron 2500 1TB MTFDKBA1T0QGN
  (692 - 4137, n=11)
1724 MB/s +143%
Asus TUF Gaming A16 FA608UP
Western Digital PC SN5000S SDEQNSJ-1T00
1036 (949.61min - 1035.55max) MB/s +46%
Schenker XMG Core 16 M25
Samsung 990 Pro 2 TB MZVL72T0HDLB
1009 (886.13min - 1008.75max) MB/s +42%
MSI Crosshair 16 HX AI D2XWGKG
Micron 2500 1TB MTFDKBA1T0QGN
710 (698.38min - 710.41max) MB/s
MSI Crosshair 18 HX AI A2XW
Micron 2500 1TB MTFDKBA1T0QGN
692 (675.6min - 691.51max) MB/s -3%
4k q32 t16 write
Lenovo Legion 5 Pro 16IAX10H
Western Digital PC SN8000S SDEPNRK-1T00
4289 (3869.88min - 4288.69max) MB/s +643%
Alienware 16X Aurora, RTX 5070
 
3899 (3811.51min - 3899.28max) MB/s +576%
Aorus Elite 16 AE6H
Gigabyte AG470S1TB-SI B10
3604 (2631.14min - 3603.98max) MB/s +525%
MSI Crosshair A17 HX D8WGKG
Samsung PM9C1 MZVL81T0HELB-00BTW
2671 (2552.06min - 2671.09max) MB/s +363%
Media della classe Gaming
  (162.3 - 5653, n=127, ultimi 2 anni)
2104 MB/s +265%
Media Micron 2500 1TB MTFDKBA1T0QGN
  (415 - 3628, n=11)
1264 MB/s +119%
MSI Crosshair 16 HX AI D2XWGKG
Micron 2500 1TB MTFDKBA1T0QGN
577 (574.03min - 577.25max) MB/s
MSI Crosshair 18 HX AI A2XW
Micron 2500 1TB MTFDKBA1T0QGN
559 (548.85min - 558.58max) MB/s -3%
Schenker XMG Core 16 M25
Samsung 990 Pro 2 TB MZVL72T0HDLB
464 (459.68min - 464.25max) MB/s -20%
Asus TUF Gaming A16 FA608UP
Western Digital PC SN5000S SDEQNSJ-1T00
455 (405.09min - 455.15max) MB/s -21%
AS SSD
Score Total
Aorus Elite 16 AE6H
Gigabyte AG470S1TB-SI B10
10170 Points +45%
MSI Crosshair A17 HX D8WGKG
Samsung PM9C1 MZVL81T0HELB-00BTW
8735 Points +24%
MSI Crosshair 16 HX AI D2XWGKG
Micron 2500 1TB MTFDKBA1T0QGN
7019 Points
MSI Crosshair 18 HX AI A2XW
Micron 2500 1TB MTFDKBA1T0QGN
6959 Points -1%
Media della classe Gaming
  (2912 - 13854, n=124, ultimi 2 anni)
6899 Points -2%
Lenovo Legion 5 Pro 16IAX10H
Western Digital PC SN8000S SDEPNRK-1T00
6678 Points -5%
Media Micron 2500 1TB MTFDKBA1T0QGN
  (3292 - 9065, n=11)
6471 Points -8%
Alienware 16X Aurora, RTX 5070
 
6345 Points -10%
Schenker XMG Core 16 M25
Samsung 990 Pro 2 TB MZVL72T0HDLB
6169 Points -12%
Asus TUF Gaming A16 FA608UP
Western Digital PC SN5000S SDEQNSJ-1T00
4498 Points -36%
Score Read
Aorus Elite 16 AE6H
Gigabyte AG470S1TB-SI B10
3247 Points +100%
MSI Crosshair A17 HX D8WGKG
Samsung PM9C1 MZVL81T0HELB-00BTW
3048 Points +88%
Lenovo Legion 5 Pro 16IAX10H
Western Digital PC SN8000S SDEPNRK-1T00
2426 Points +49%
Media della classe Gaming
  (953 - 4418, n=124, ultimi 2 anni)
2361 Points +45%
Media Micron 2500 1TB MTFDKBA1T0QGN
  (1049 - 3311, n=11)
1943 Points +20%
Alienware 16X Aurora, RTX 5070
 
1894 Points +17%
MSI Crosshair 18 HX AI A2XW
Micron 2500 1TB MTFDKBA1T0QGN
1635 Points +1%
MSI Crosshair 16 HX AI D2XWGKG
Micron 2500 1TB MTFDKBA1T0QGN
1623 Points
Schenker XMG Core 16 M25
Samsung 990 Pro 2 TB MZVL72T0HDLB
1345 Points -17%
Asus TUF Gaming A16 FA608UP
Western Digital PC SN5000S SDEQNSJ-1T00
1333 Points -18%
Score Write
Aorus Elite 16 AE6H
Gigabyte AG470S1TB-SI B10
5320 Points +14%
MSI Crosshair 16 HX AI D2XWGKG
Micron 2500 1TB MTFDKBA1T0QGN
4682 Points
MSI Crosshair 18 HX AI A2XW
Micron 2500 1TB MTFDKBA1T0QGN
4567 Points -2%
Schenker XMG Core 16 M25
Samsung 990 Pro 2 TB MZVL72T0HDLB
4177 Points -11%
MSI Crosshair A17 HX D8WGKG
Samsung PM9C1 MZVL81T0HELB-00BTW
4136 Points -12%
Media Micron 2500 1TB MTFDKBA1T0QGN
  (1773 - 5036, n=11)
3607 Points -23%
Alienware 16X Aurora, RTX 5070
 
3554 Points -24%
Media della classe Gaming
  (1375 - 7208, n=124, ultimi 2 anni)
3391 Points -28%
Lenovo Legion 5 Pro 16IAX10H
Western Digital PC SN8000S SDEPNRK-1T00
3149 Points -33%
Asus TUF Gaming A16 FA608UP
Western Digital PC SN5000S SDEQNSJ-1T00
2553 Points -45%
Seq Read
MSI Crosshair A17 HX D8WGKG
Samsung PM9C1 MZVL81T0HELB-00BTW
5933.7 MB/s +10%
Lenovo Legion 5 Pro 16IAX10H
Western Digital PC SN8000S SDEPNRK-1T00
5696 MB/s +6%
Aorus Elite 16 AE6H
Gigabyte AG470S1TB-SI B10
5675.68 MB/s +5%
Schenker XMG Core 16 M25
Samsung 990 Pro 2 TB MZVL72T0HDLB
5548 MB/s +3%
MSI Crosshair 16 HX AI D2XWGKG
Micron 2500 1TB MTFDKBA1T0QGN
5392.36 MB/s
MSI Crosshair 18 HX AI A2XW
Micron 2500 1TB MTFDKBA1T0QGN
5390.71 MB/s 0%
Media Micron 2500 1TB MTFDKBA1T0QGN
  (4726 - 5599, n=11)
5283 MB/s -2%
Media della classe Gaming
  (2272 - 9890, n=124, ultimi 2 anni)
5279 MB/s -2%
Alienware 16X Aurora, RTX 5070
 
5151.36 MB/s -4%
Asus TUF Gaming A16 FA608UP
Western Digital PC SN5000S SDEQNSJ-1T00
4346 MB/s -19%
Seq Write
MSI Crosshair A17 HX D8WGKG
Samsung PM9C1 MZVL81T0HELB-00BTW
5791.27 MB/s +109%
Aorus Elite 16 AE6H
Gigabyte AG470S1TB-SI B10
4300.61 MB/s +55%
Schenker XMG Core 16 M25
Samsung 990 Pro 2 TB MZVL72T0HDLB
4263 MB/s +54%
Media della classe Gaming
  (114.5 - 9926, n=124, ultimi 2 anni)
3917 MB/s +41%
MSI Crosshair 18 HX AI A2XW
Micron 2500 1TB MTFDKBA1T0QGN
3554.23 MB/s +28%
Media Micron 2500 1TB MTFDKBA1T0QGN
  (2255 - 5036, n=11)
3538 MB/s +28%
Alienware 16X Aurora, RTX 5070
 
3282.92 MB/s +19%
MSI Crosshair 16 HX AI D2XWGKG
Micron 2500 1TB MTFDKBA1T0QGN
2769.06 MB/s
Lenovo Legion 5 Pro 16IAX10H
Western Digital PC SN8000S SDEPNRK-1T00
2721 MB/s -2%
Asus TUF Gaming A16 FA608UP
Western Digital PC SN5000S SDEQNSJ-1T00
2619 MB/s -5%
4K Read
Aorus Elite 16 AE6H
Gigabyte AG470S1TB-SI B10
95.59 MB/s +42%
Alienware 16X Aurora, RTX 5070
 
86.83 MB/s +29%
Lenovo Legion 5 Pro 16IAX10H
Western Digital PC SN8000S SDEPNRK-1T00
78.5 MB/s +16%
Schenker XMG Core 16 M25
Samsung 990 Pro 2 TB MZVL72T0HDLB
78.5 MB/s +16%
Media Micron 2500 1TB MTFDKBA1T0QGN
  (53.6 - 108.4, n=11)
71.5 MB/s +6%
MSI Crosshair A17 HX D8WGKG
Samsung PM9C1 MZVL81T0HELB-00BTW
69.81 MB/s +4%
Media della classe Gaming
  (27.8 - 108.4, n=124, ultimi 2 anni)
68.8 MB/s +2%
MSI Crosshair 16 HX AI D2XWGKG
Micron 2500 1TB MTFDKBA1T0QGN
67.41 MB/s
Asus TUF Gaming A16 FA608UP
Western Digital PC SN5000S SDEQNSJ-1T00
66.2 MB/s -2%
MSI Crosshair 18 HX AI A2XW
Micron 2500 1TB MTFDKBA1T0QGN
62.2 MB/s -8%
4K Write
Alienware 16X Aurora, RTX 5070
 
294.61 MB/s +6%
MSI Crosshair 16 HX AI D2XWGKG
Micron 2500 1TB MTFDKBA1T0QGN
278.63 MB/s
MSI Crosshair 18 HX AI A2XW
Micron 2500 1TB MTFDKBA1T0QGN
278 MB/s 0%
Aorus Elite 16 AE6H
Gigabyte AG470S1TB-SI B10
272.05 MB/s -2%
Lenovo Legion 5 Pro 16IAX10H
Western Digital PC SN8000S SDEPNRK-1T00
241 MB/s -14%
Media Micron 2500 1TB MTFDKBA1T0QGN
  (75.6 - 307, n=11)
234 MB/s -16%
Media della classe Gaming
  (75.6 - 512, n=124, ultimi 2 anni)
218 MB/s -22%
Schenker XMG Core 16 M25
Samsung 990 Pro 2 TB MZVL72T0HDLB
211 MB/s -24%
MSI Crosshair A17 HX D8WGKG
Samsung PM9C1 MZVL81T0HELB-00BTW
210.85 MB/s -24%
Asus TUF Gaming A16 FA608UP
Western Digital PC SN5000S SDEQNSJ-1T00
156.3 MB/s -44%
4K-64 Read
Aorus Elite 16 AE6H
Gigabyte AG470S1TB-SI B10
2584.33 MB/s +154%
MSI Crosshair A17 HX D8WGKG
Samsung PM9C1 MZVL81T0HELB-00BTW
2384.85 MB/s +135%
Lenovo Legion 5 Pro 16IAX10H
Western Digital PC SN8000S SDEPNRK-1T00
1778 MB/s +75%
Media della classe Gaming
  (517 - 3630, n=124, ultimi 2 anni)
1765 MB/s +74%
Media Micron 2500 1TB MTFDKBA1T0QGN
  (511 - 2662, n=11)
1343 MB/s +32%
Alienware 16X Aurora, RTX 5070
 
1291.89 MB/s +27%
MSI Crosshair 18 HX AI A2XW
Micron 2500 1TB MTFDKBA1T0QGN
1033.87 MB/s +2%
MSI Crosshair 16 HX AI D2XWGKG
Micron 2500 1TB MTFDKBA1T0QGN
1015.98 MB/s
Asus TUF Gaming A16 FA608UP
Western Digital PC SN5000S SDEQNSJ-1T00
832 MB/s -18%
Schenker XMG Core 16 M25
Samsung 990 Pro 2 TB MZVL72T0HDLB
711 MB/s -30%
4K-64 Write
Aorus Elite 16 AE6H
Gigabyte AG470S1TB-SI B10
4617.66 MB/s +12%
MSI Crosshair 16 HX AI D2XWGKG
Micron 2500 1TB MTFDKBA1T0QGN
4126.89 MB/s
MSI Crosshair 18 HX AI A2XW
Micron 2500 1TB MTFDKBA1T0QGN
3933.95 MB/s -5%
Schenker XMG Core 16 M25
Samsung 990 Pro 2 TB MZVL72T0HDLB
3540 MB/s -14%
MSI Crosshair A17 HX D8WGKG
Samsung PM9C1 MZVL81T0HELB-00BTW
3345.54 MB/s -19%
Media Micron 2500 1TB MTFDKBA1T0QGN
  (1267 - 4408, n=11)
3019 MB/s -27%
Alienware 16X Aurora, RTX 5070
 
2930.89 MB/s -29%
Media della classe Gaming
  (991 - 5909, n=124, ultimi 2 anni)
2785 MB/s -33%
Lenovo Legion 5 Pro 16IAX10H
Western Digital PC SN8000S SDEPNRK-1T00
2636 MB/s -36%
Asus TUF Gaming A16 FA608UP
Western Digital PC SN5000S SDEQNSJ-1T00
2134 MB/s -48%
Access Time Read
MSI Crosshair 16 HX AI D2XWGKG
Micron 2500 1TB MTFDKBA1T0QGN
0.111 ms *
MSI Crosshair 18 HX AI A2XW
Micron 2500 1TB MTFDKBA1T0QGN
0.1 ms * +10%
Lenovo Legion 5 Pro 16IAX10H
Western Digital PC SN8000S SDEPNRK-1T00
0.097 ms * +13%
Media Micron 2500 1TB MTFDKBA1T0QGN
  (0.02 - 0.111, n=11)
0.07327 ms * +34%
MSI Crosshair A17 HX D8WGKG
Samsung PM9C1 MZVL81T0HELB-00BTW
0.063 ms * +43%
Aorus Elite 16 AE6H
Gigabyte AG470S1TB-SI B10
0.059 ms * +47%
Media della classe Gaming
  (0.016 - 0.17, n=124, ultimi 2 anni)
0.05562 ms * +50%
Asus TUF Gaming A16 FA608UP
Western Digital PC SN5000S SDEQNSJ-1T00
0.054 ms * +51%
Alienware 16X Aurora, RTX 5070
 
0.045 ms * +59%
Schenker XMG Core 16 M25
Samsung 990 Pro 2 TB MZVL72T0HDLB
0.017 ms * +85%
Access Time Write
Alienware 16X Aurora, RTX 5070
 
0.087 ms * -521%
MSI Crosshair 18 HX AI A2XW
Micron 2500 1TB MTFDKBA1T0QGN
0.052 ms * -271%
Media della classe Gaming
  (0.012 - 0.277, n=124, ultimi 2 anni)
0.03881 ms * -177%
Asus TUF Gaming A16 FA608UP
Western Digital PC SN5000S SDEQNSJ-1T00
0.03 ms * -114%
Media Micron 2500 1TB MTFDKBA1T0QGN
  (0.012 - 0.052, n=11)
0.02264 ms * -62%
MSI Crosshair A17 HX D8WGKG
Samsung PM9C1 MZVL81T0HELB-00BTW
0.021 ms * -50%
Schenker XMG Core 16 M25
Samsung 990 Pro 2 TB MZVL72T0HDLB
0.018 ms * -29%
Lenovo Legion 5 Pro 16IAX10H
Western Digital PC SN8000S SDEPNRK-1T00
0.016 ms * -14%
Aorus Elite 16 AE6H
Gigabyte AG470S1TB-SI B10
0.015 ms * -7%
MSI Crosshair 16 HX AI D2XWGKG
Micron 2500 1TB MTFDKBA1T0QGN
0.014 ms *

* ... Meglio usare valori piccoli

Strozzatura del disco: DiskSpd Lettura in loop, Profondità coda 8

034569010351380172520702415276031053450379541404485483051755520586562106555Tooltip
MSI Crosshair 16 HX AI D2XWGKG; diskspd 2.0.17 f: Ø6532 (3454.23-6827.28)

Prestazioni della GPU

La GPU Crosshair 16 HX AI da 115 W GPU Nvidia GeForce RTX 5070 Laptop si comporta come previsto.

Il laptop si posiziona dietro a Legion Pro 5 con una GPU per laptop RTX 5070 Ti da 140 W RTX 5070 Ti Laptop GPU del 22% nei test 3DMark complessivi.

3DMark Performance rating - Percent
Lenovo Legion 5 Pro 16IAX10H
NVIDIA GeForce RTX 5070 Ti Laptop, Intel Core Ultra 9 275HX
100 pt
Media della classe Gaming
 
83.8 pt
MSI Crosshair A17 HX D8WGKG
NVIDIA GeForce RTX 5070 Laptop, AMD Ryzen 9 8940HX
80.2 pt
Media NVIDIA GeForce RTX 5070 Laptop
 
79.8 pt
Asus TUF Gaming A16 FA608UP -1!
NVIDIA GeForce RTX 5070 Laptop, AMD Ryzen 7 260
79.5 pt
Alienware 16X Aurora, RTX 5070
NVIDIA GeForce RTX 5070 Laptop, Intel Core Ultra 9 275HX
78.5 pt
MSI Crosshair 18 HX AI A2XW
NVIDIA GeForce RTX 5070 Laptop, Intel Core Ultra 9 275HX
78.3 pt
MSI Crosshair 16 HX AI D2XWGKG
NVIDIA GeForce RTX 5070 Laptop, Intel Core Ultra 9 275HX
78 pt
Aorus Elite 16 AE6H
NVIDIA GeForce RTX 5070 Laptop, Intel Core Ultra 9 275HX
77.8 pt
Schenker XMG Core 16 M25 -1!
NVIDIA GeForce RTX 5070 Laptop, AMD Ryzen AI 9 HX 370
75.7 pt
3DMark 11 - 1280x720 Performance GPU
Lenovo Legion 5 Pro 16IAX10H
NVIDIA GeForce RTX 5070 Ti Laptop, Intel Core Ultra 9 275HX
61651 Points +41%
Media della classe Gaming
  (13523 - 80022, n=137, ultimi 2 anni)
48696 Points +11%
Asus TUF Gaming A16 FA608UP
NVIDIA GeForce RTX 5070 Laptop, AMD Ryzen 7 260
46464 Points +6%
Aorus Elite 16 AE6H
NVIDIA GeForce RTX 5070 Laptop, Intel Core Ultra 9 275HX
46297 Points +6%
Schenker XMG Core 16 M25
NVIDIA GeForce RTX 5070 Laptop, AMD Ryzen AI 9 HX 370
45994 Points +5%
Media NVIDIA GeForce RTX 5070 Laptop
  (36721 - 49568, n=20)
44335 Points +1%
MSI Crosshair 18 HX AI A2XW
NVIDIA GeForce RTX 5070 Laptop, Intel Core Ultra 9 275HX
43834 Points 0%
MSI Crosshair 16 HX AI D2XWGKG
NVIDIA GeForce RTX 5070 Laptop, Intel Core Ultra 9 275HX
43690 Points
MSI Crosshair A17 HX D8WGKG
NVIDIA GeForce RTX 5070 Laptop, AMD Ryzen 9 8940HX
42665 Points -2%
Alienware 16X Aurora, RTX 5070
NVIDIA GeForce RTX 5070 Laptop, Intel Core Ultra 9 275HX
41019 Points -6%
3DMark
1280x720 Cloud Gate Standard Graphics
Lenovo Legion 5 Pro 16IAX10H
NVIDIA GeForce RTX 5070 Ti Laptop, Intel Core Ultra 9 275HX
155373 Points +16%
MSI Crosshair A17 HX D8WGKG
NVIDIA GeForce RTX 5070 Laptop, AMD Ryzen 9 8940HX
149907 Points +12%
Media NVIDIA GeForce RTX 5070 Laptop
  (119532 - 186504, n=11)
148803 Points +11%
Media della classe Gaming
  (84648 - 223650, n=64, ultimi 2 anni)
145184 Points +8%
Alienware 16X Aurora, RTX 5070
NVIDIA GeForce RTX 5070 Laptop, Intel Core Ultra 9 275HX
143284 Points +7%
MSI Crosshair 18 HX AI A2XW
NVIDIA GeForce RTX 5070 Laptop, Intel Core Ultra 9 275HX
134722 Points +1%
MSI Crosshair 16 HX AI D2XWGKG
NVIDIA GeForce RTX 5070 Laptop, Intel Core Ultra 9 275HX
134003 Points
Aorus Elite 16 AE6H
NVIDIA GeForce RTX 5070 Laptop, Intel Core Ultra 9 275HX
119532 Points -11%
1920x1080 Fire Strike Graphics
Lenovo Legion 5 Pro 16IAX10H
NVIDIA GeForce RTX 5070 Ti Laptop, Intel Core Ultra 9 275HX
46018 Points +27%
Aorus Elite 16 AE6H
NVIDIA GeForce RTX 5070 Laptop, Intel Core Ultra 9 275HX
37331 Points +3%
Asus TUF Gaming A16 FA608UP
NVIDIA GeForce RTX 5070 Laptop, AMD Ryzen 7 260
37193 Points +3%
MSI Crosshair 18 HX AI A2XW
NVIDIA GeForce RTX 5070 Laptop, Intel Core Ultra 9 275HX
36728 Points +1%
MSI Crosshair A17 HX D8WGKG
NVIDIA GeForce RTX 5070 Laptop, AMD Ryzen 9 8940HX
36639 Points +1%
Schenker XMG Core 16 M25
NVIDIA GeForce RTX 5070 Laptop, AMD Ryzen AI 9 HX 370
36337 Points 0%
Media della classe Gaming
  (6487 - 62849, n=151, ultimi 2 anni)
36276 Points 0%
MSI Crosshair 16 HX AI D2XWGKG
NVIDIA GeForce RTX 5070 Laptop, Intel Core Ultra 9 275HX
36224 Points
Alienware 16X Aurora, RTX 5070
NVIDIA GeForce RTX 5070 Laptop, Intel Core Ultra 9 275HX
35646 Points -2%
Media NVIDIA GeForce RTX 5070 Laptop
  (28759 - 38680, n=22)
35423 Points -2%
2560x1440 Time Spy Graphics
Lenovo Legion 5 Pro 16IAX10H
NVIDIA GeForce RTX 5070 Ti Laptop, Intel Core Ultra 9 275HX
17966 Points +31%
Media della classe Gaming
  (2295 - 25984, n=148, ultimi 2 anni)
15058 Points +10%
Asus TUF Gaming A16 FA608UP
NVIDIA GeForce RTX 5070 Laptop, AMD Ryzen 7 260
14771 Points +8%
Aorus Elite 16 AE6H
NVIDIA GeForce RTX 5070 Laptop, Intel Core Ultra 9 275HX
14058 Points +3%
Alienware 16X Aurora, RTX 5070
NVIDIA GeForce RTX 5070 Laptop, Intel Core Ultra 9 275HX
13976 Points +2%
MSI Crosshair 16 HX AI D2XWGKG
NVIDIA GeForce RTX 5070 Laptop, Intel Core Ultra 9 275HX
13714 Points
MSI Crosshair 18 HX AI A2XW
NVIDIA GeForce RTX 5070 Laptop, Intel Core Ultra 9 275HX
13586 Points -1%
MSI Crosshair A17 HX D8WGKG
NVIDIA GeForce RTX 5070 Laptop, AMD Ryzen 9 8940HX
13580 Points -1%
Media NVIDIA GeForce RTX 5070 Laptop
  (10851 - 14771, n=22)
13359 Points -3%
Schenker XMG Core 16 M25
NVIDIA GeForce RTX 5070 Laptop, AMD Ryzen AI 9 HX 370
13198 Points -4%
3DMark 11 Performance
36966 punti
3DMark Ice Storm Standard Score
313398 punti
3DMark Cloud Gate Standard Score
67854 punti
3DMark Fire Strike Score
28686 punti
3DMark Fire Strike Extreme Score
16912 punti
3DMark Time Spy Score
13956 punti
3DMark Steel Nomad Score
3108 punti
3DMark Steel Nomad Light Score
14107 punti
Aiuto
Blender / v3.3 Classroom OPTIX/RTX
Schenker XMG Core 16 M25
NVIDIA GeForce RTX 5070 Laptop, AMD Ryzen AI 9 HX 370
22 Seconds * -10%
MSI Crosshair 16 HX AI D2XWGKG
NVIDIA GeForce RTX 5070 Laptop, Intel Core Ultra 9 275HX
20 Seconds *
Asus TUF Gaming A16 FA608UP
NVIDIA GeForce RTX 5070 Laptop, AMD Ryzen 7 260
20 Seconds * -0%
Media NVIDIA GeForce RTX 5070 Laptop
  (17 - 24, n=21)
19.6 Seconds * +2%
Media della classe Gaming
  (9 - 95, n=141, ultimi 2 anni)
19.1 Seconds * +4%
Aorus Elite 16 AE6H
NVIDIA GeForce RTX 5070 Laptop, Intel Core Ultra 9 275HX
19 Seconds * +5%
MSI Crosshair 18 HX AI A2XW
NVIDIA GeForce RTX 5070 Laptop, Intel Core Ultra 9 275HX
19 Seconds * +5%
Alienware 16X Aurora, RTX 5070
NVIDIA GeForce RTX 5070 Laptop, Intel Core Ultra 9 275HX
18 Seconds * +10%
MSI Crosshair A17 HX D8WGKG
NVIDIA GeForce RTX 5070 Laptop, AMD Ryzen 9 8940HX
17 Seconds * +15%
Lenovo Legion 5 Pro 16IAX10H
NVIDIA GeForce RTX 5070 Ti Laptop, Intel Core Ultra 9 275HX
15 Seconds * +25%
Blender / v3.3 Classroom CUDA
Media NVIDIA GeForce RTX 5070 Laptop
  (29 - 228, n=22)
41 Seconds * -28%
Schenker XMG Core 16 M25
NVIDIA GeForce RTX 5070 Laptop, AMD Ryzen AI 9 HX 370
36 Seconds * -13%
Asus TUF Gaming A16 FA608UP
NVIDIA GeForce RTX 5070 Laptop, AMD Ryzen 7 260
33.1 Seconds * -3%
Media della classe Gaming
  (15 - 228, n=143, ultimi 2 anni)
33.1 Seconds * -3%
Aorus Elite 16 AE6H
NVIDIA GeForce RTX 5070 Laptop, Intel Core Ultra 9 275HX
32 Seconds * -0%
MSI Crosshair 16 HX AI D2XWGKG
NVIDIA GeForce RTX 5070 Laptop, Intel Core Ultra 9 275HX
32 Seconds *
MSI Crosshair A17 HX D8WGKG
NVIDIA GeForce RTX 5070 Laptop, AMD Ryzen 9 8940HX
31 Seconds * +3%
MSI Crosshair 18 HX AI A2XW
NVIDIA GeForce RTX 5070 Laptop, Intel Core Ultra 9 275HX
31 Seconds * +3%
Alienware 16X Aurora, RTX 5070
NVIDIA GeForce RTX 5070 Laptop, Intel Core Ultra 9 275HX
30 Seconds * +6%
Lenovo Legion 5 Pro 16IAX10H
NVIDIA GeForce RTX 5070 Ti Laptop, Intel Core Ultra 9 275HX
24 Seconds * +25%
Blender / v3.3 Classroom CPU
Asus TUF Gaming A16 FA608UP
NVIDIA GeForce RTX 5070 Laptop, AMD Ryzen 7 260
292 Seconds * -88%
Media della classe Gaming
  (122 - 962, n=141, ultimi 2 anni)
260 Seconds * -68%
Media NVIDIA GeForce RTX 5070 Laptop
  (137 - 372, n=19)
249 Seconds * -61%
Schenker XMG Core 16 M25
NVIDIA GeForce RTX 5070 Laptop, AMD Ryzen AI 9 HX 370
211 Seconds * -36%
Alienware 16X Aurora, RTX 5070
NVIDIA GeForce RTX 5070 Laptop, Intel Core Ultra 9 275HX
158 Seconds * -2%
MSI Crosshair 18 HX AI A2XW
NVIDIA GeForce RTX 5070 Laptop, Intel Core Ultra 9 275HX
157 Seconds * -1%
Lenovo Legion 5 Pro 16IAX10H
NVIDIA GeForce RTX 5070 Ti Laptop, Intel Core Ultra 9 275HX
155 Seconds * -0%
MSI Crosshair 16 HX AI D2XWGKG
NVIDIA GeForce RTX 5070 Laptop, Intel Core Ultra 9 275HX
155 Seconds *

* ... Meglio usare valori piccoli

Crosshair 16 HX AI è in grado di eseguire in modo convincente molti titoli con impostazioni QHD Ultra, ma la limitazione di 8 GB di VRAM diventa immediatamente evidente nei giochi ad alta intensità di VRAM come Mito Nero: Wukong e F1 25.

Performance rating - Percent
Lenovo Legion 5 Pro 16IAX10H
Intel Core Ultra 9 275HX, NVIDIA GeForce RTX 5070 Ti Laptop
97.9 pt
Alienware 16X Aurora, RTX 5070
Intel Core Ultra 9 275HX, NVIDIA GeForce RTX 5070 Laptop
90.2 pt
MSI Crosshair A17 HX D8WGKG -1!
AMD Ryzen 9 8940HX, NVIDIA GeForce RTX 5070 Laptop
90 pt
Aorus Elite 16 AE6H -1!
Intel Core Ultra 9 275HX, NVIDIA GeForce RTX 5070 Laptop
89.3 pt
MSI Crosshair 16 HX AI D2XWGKG
Intel Core Ultra 9 275HX, NVIDIA GeForce RTX 5070 Laptop
86 pt
MSI Crosshair 18 HX AI A2XW
Intel Core Ultra 9 275HX, NVIDIA GeForce RTX 5070 Laptop
83.2 pt
Media della classe Gaming
 
81.9 pt
Schenker XMG Core 16 M25
AMD Ryzen AI 9 HX 370, NVIDIA GeForce RTX 5070 Laptop
77.3 pt
Asus TUF Gaming A16 FA608UP
AMD Ryzen 7 260, NVIDIA GeForce RTX 5070 Laptop
75.4 pt
Cyberpunk 2077 2.2 Phantom Liberty - 1920x1080 Ultra Preset (FSR off)
Lenovo Legion 5 Pro 16IAX10H
Intel Core Ultra 9 275HX, NVIDIA GeForce RTX 5070 Ti Laptop
132.4 (106.3min) fps +24%
Asus TUF Gaming A16 FA608UP
AMD Ryzen 7 260, NVIDIA GeForce RTX 5070 Laptop
109.4 (88.6min) fps +2%
Aorus Elite 16 AE6H
Intel Core Ultra 9 275HX, NVIDIA GeForce RTX 5070 Laptop
108.7 (89min) fps +1%
MSI Crosshair 16 HX AI D2XWGKG
Intel Core Ultra 9 275HX, NVIDIA GeForce RTX 5070 Laptop
107.1 (87.1min) fps
MSI Crosshair A17 HX D8WGKG
AMD Ryzen 9 8940HX, NVIDIA GeForce RTX 5070 Laptop
106.7 (86min) fps 0%
Alienware 16X Aurora, RTX 5070
Intel Core Ultra 9 275HX, NVIDIA GeForce RTX 5070 Laptop
102.9 (84.7min, 80.8P1) fps -4%
MSI Crosshair 18 HX AI A2XW
Intel Core Ultra 9 275HX, NVIDIA GeForce RTX 5070 Laptop
101.9 (84.1min, 80.1P1) fps -5%
Media della classe Gaming
  (17.7 - 169.9, n=143, ultimi 2 anni)
101.8 fps -5%
Schenker XMG Core 16 M25
AMD Ryzen AI 9 HX 370, NVIDIA GeForce RTX 5070 Laptop
94.8 (76.7min) fps -11%
Baldur's Gate 3 - 1920x1080 Ultra Preset AA:T
Alienware 16X Aurora, RTX 5070
Intel Core Ultra 9 275HX, NVIDIA GeForce RTX 5070 Laptop
140.8 fps +7%
Lenovo Legion 5 Pro 16IAX10H
Intel Core Ultra 9 275HX, NVIDIA GeForce RTX 5070 Ti Laptop
138.9 (70.9min, 84P0.1, 87.7P1) fps +6%
Media della classe Gaming
  (37.2 - 246, n=110, ultimi 2 anni)
135.7 fps +4%
MSI Crosshair 16 HX AI D2XWGKG
Intel Core Ultra 9 275HX, NVIDIA GeForce RTX 5070 Laptop
131 (109.2min, 110.4P0.1, 112.9P1) fps
MSI Crosshair 18 HX AI A2XW
Intel Core Ultra 9 275HX, NVIDIA GeForce RTX 5070 Laptop
128.8 fps -2%
Asus TUF Gaming A16 FA608UP
AMD Ryzen 7 260, NVIDIA GeForce RTX 5070 Laptop
127.5 fps -3%
MSI Crosshair A17 HX D8WGKG
AMD Ryzen 9 8940HX, NVIDIA GeForce RTX 5070 Laptop
124.9 (109.1min, 111P0.1, 114.8P1) fps -5%
Schenker XMG Core 16 M25
AMD Ryzen AI 9 HX 370, NVIDIA GeForce RTX 5070 Laptop
121.9 fps -7%
Aorus Elite 16 AE6H
Intel Core Ultra 9 275HX, NVIDIA GeForce RTX 5070 Laptop
121.3 (103.6min, 106.8P0.1, 111P1) fps -7%
GTA V - 1920x1080 Highest Settings possible AA:4xMSAA + FX AF:16x
MSI Crosshair A17 HX D8WGKG
AMD Ryzen 9 8940HX, NVIDIA GeForce RTX 5070 Laptop
160.2 (1.922min, 111.1P1) fps +13%
Alienware 16X Aurora, RTX 5070
Intel Core Ultra 9 275HX, NVIDIA GeForce RTX 5070 Laptop
156.4 (3.01min, 100P1) fps +10%
Aorus Elite 16 AE6H
Intel Core Ultra 9 275HX, NVIDIA GeForce RTX 5070 Laptop
148.6 (9.12min, 100P1) fps +4%
Lenovo Legion 5 Pro 16IAX10H
Intel Core Ultra 9 275HX, NVIDIA GeForce RTX 5070 Ti Laptop
147.6 (2.55min, 90.9P1) fps +4%
MSI Crosshair 16 HX AI D2XWGKG
Intel Core Ultra 9 275HX, NVIDIA GeForce RTX 5070 Laptop
142.3 (4.22min, 100P1) fps
MSI Crosshair 18 HX AI A2XW
Intel Core Ultra 9 275HX, NVIDIA GeForce RTX 5070 Laptop
142.1 (3.56min, 100P1) fps 0%
Schenker XMG Core 16 M25
AMD Ryzen AI 9 HX 370, NVIDIA GeForce RTX 5070 Laptop
134.1 (4.88min, 90.9P1) fps -6%
Asus TUF Gaming A16 FA608UP
AMD Ryzen 7 260, NVIDIA GeForce RTX 5070 Laptop
124.8 (4.67min, 90.9P1) fps -12%
Media della classe Gaming
  (12.1 - 186.9, n=130, ultimi 2 anni)
124.6 fps -12%
Final Fantasy XV Benchmark - 1920x1080 High Quality
Lenovo Legion 5 Pro 16IAX10H
Intel Core Ultra 9 275HX, NVIDIA GeForce RTX 5070 Ti Laptop
181.4 fps +28%
Alienware 16X Aurora, RTX 5070
Intel Core Ultra 9 275HX, NVIDIA GeForce RTX 5070 Laptop
150.7 fps +6%
Aorus Elite 16 AE6H
Intel Core Ultra 9 275HX, NVIDIA GeForce RTX 5070 Laptop
150.6 fps +6%
MSI Crosshair 18 HX AI A2XW
Intel Core Ultra 9 275HX, NVIDIA GeForce RTX 5070 Laptop
145.3 fps +2%
Asus TUF Gaming A16 FA608UP
AMD Ryzen 7 260, NVIDIA GeForce RTX 5070 Laptop
142.3 fps 0%
MSI Crosshair 16 HX AI D2XWGKG
Intel Core Ultra 9 275HX, NVIDIA GeForce RTX 5070 Laptop
141.9 fps
MSI Crosshair A17 HX D8WGKG
AMD Ryzen 9 8940HX, NVIDIA GeForce RTX 5070 Laptop
141.5 fps 0%
Schenker XMG Core 16 M25
AMD Ryzen AI 9 HX 370, NVIDIA GeForce RTX 5070 Laptop
139.9 fps -1%
Media della classe Gaming
  (19.2 - 215, n=143, ultimi 2 anni)
136.7 fps -4%
Strange Brigade - 1920x1080 ultra AA:ultra AF:16
Lenovo Legion 5 Pro 16IAX10H
Intel Core Ultra 9 275HX, NVIDIA GeForce RTX 5070 Ti Laptop
353 (129min, 257P1) fps +36%
Media della classe Gaming
  (38.9 - 456, n=130, ultimi 2 anni)
262 fps +1%
MSI Crosshair 16 HX AI D2XWGKG
Intel Core Ultra 9 275HX, NVIDIA GeForce RTX 5070 Laptop
259 (168.9min, 192.7P1) fps
Alienware 16X Aurora, RTX 5070
Intel Core Ultra 9 275HX, NVIDIA GeForce RTX 5070 Laptop
259 (107.2min, 194.8P1) fps 0%
Schenker XMG Core 16 M25
AMD Ryzen AI 9 HX 370, NVIDIA GeForce RTX 5070 Laptop
258 (130.8min, 195.1P1) fps 0%
MSI Crosshair 18 HX AI A2XW
Intel Core Ultra 9 275HX, NVIDIA GeForce RTX 5070 Laptop
244 (149.7min, 179.2P1) fps -6%
Asus TUF Gaming A16 FA608UP
AMD Ryzen 7 260, NVIDIA GeForce RTX 5070 Laptop
219 (128min, 164.3P1) fps -15%
Dota 2 Reborn - 1920x1080 ultra (3/3) best looking
MSI Crosshair A17 HX D8WGKG
AMD Ryzen 9 8940HX, NVIDIA GeForce RTX 5070 Laptop
184.2 (153.5min) fps +8%
Alienware 16X Aurora, RTX 5070
Intel Core Ultra 9 275HX, NVIDIA GeForce RTX 5070 Laptop
184 (156.1min) fps +8%
Lenovo Legion 5 Pro 16IAX10H
Intel Core Ultra 9 275HX, NVIDIA GeForce RTX 5070 Ti Laptop
174 (144.7min) fps +2%
MSI Crosshair 16 HX AI D2XWGKG
Intel Core Ultra 9 275HX, NVIDIA GeForce RTX 5070 Laptop
170 (145.1min) fps
Aorus Elite 16 AE6H
Intel Core Ultra 9 275HX, NVIDIA GeForce RTX 5070 Laptop
169.6 (141min) fps 0%
MSI Crosshair 18 HX AI A2XW
Intel Core Ultra 9 275HX, NVIDIA GeForce RTX 5070 Laptop
165.8 (139.8min) fps -2%
Media della classe Gaming
  (65.1 - 248, n=145, ultimi 2 anni)
154.3 fps -9%
Schenker XMG Core 16 M25
AMD Ryzen AI 9 HX 370, NVIDIA GeForce RTX 5070 Laptop
135.1 (115.7min) fps -21%
Asus TUF Gaming A16 FA608UP
AMD Ryzen 7 260, NVIDIA GeForce RTX 5070 Laptop
123.2 (104.7min) fps -28%
X-Plane 11.11 - 1920x1080 high (fps_test=3)
Alienware 16X Aurora, RTX 5070
Intel Core Ultra 9 275HX, NVIDIA GeForce RTX 5070 Laptop
116.1 fps +5%
Lenovo Legion 5 Pro 16IAX10H
Intel Core Ultra 9 275HX, NVIDIA GeForce RTX 5070 Ti Laptop
116 fps +5%
Aorus Elite 16 AE6H
Intel Core Ultra 9 275HX, NVIDIA GeForce RTX 5070 Laptop
115.9 fps +4%
MSI Crosshair 16 HX AI D2XWGKG
Intel Core Ultra 9 275HX, NVIDIA GeForce RTX 5070 Laptop
111 fps
MSI Crosshair A17 HX D8WGKG
AMD Ryzen 9 8940HX, NVIDIA GeForce RTX 5070 Laptop
107.4 fps -3%
Media della classe Gaming
  (33.4 - 150.2, n=148, ultimi 2 anni)
103.6 fps -7%
MSI Crosshair 18 HX AI A2XW
Intel Core Ultra 9 275HX, NVIDIA GeForce RTX 5070 Laptop
99.8 fps -10%
Schenker XMG Core 16 M25
AMD Ryzen AI 9 HX 370, NVIDIA GeForce RTX 5070 Laptop
87.5 fps -21%
Asus TUF Gaming A16 FA608UP
AMD Ryzen 7 260, NVIDIA GeForce RTX 5070 Laptop
80.7 fps -27%

Cyberpunk 2077 1080p Grafico fps Ultra

Non abbiamo notato alcun problema di throttling durante un'esecuzione prolungata di Cyberpunk 2077: Phantom Liberty a 1080p Ultra.

0102030405060708090100Tooltip
MSI Crosshair 16 HX AI D2XWGKG Ultra 9 275HX, GeForce RTX 5070 Laptop: Ø100.1 (94.9-101.9)
bassomedioaltoultraQHD DLSSQHD
GTA V (2015) 179.8 174.1 172.4 142.3 125.9
Dota 2 Reborn (2015) 217 190.5 183.8 170
Final Fantasy XV Benchmark (2018) 234 192.6 141.9 104
X-Plane 11.11 (2018) 148.1 133.9 111
Strange Brigade (2018) 536 362 302 259 171.8
Baldur's Gate 3 (2023) 204 150.7 135.5 131 133.9 90.7
Cyberpunk 2077 2.2 Phantom Liberty (2023) 174.2 145 120.1 107.1 77 66.3
F1 24 (2024) 305 316 251 87.6 86.7 53.8
Black Myth: Wukong (2024) 197 112 86 44 40 26
F1 25 (2025) 267 242 191 26.5 29.1 7.69
Battlefield 6 (2025) 154 138.6 106.6 79.9 56.1 43.4

Emissioni: Raffreddamento robusto, ma con livelli di decibel e termiche elevati

Rumore del sistema

Il rumore della ventola nella modalità Extreme Performance raggiunge quasi 58 db(A) a pieno carico.

Il profilo Extreme Performance include una modalità di ventola Cooler Boost, che raggiunge un picco di 65 db(A), per cui si raccomanda vivamente l'uso di cuffie durante il gioco in questa modalità.

Crosshair 16 HX AI ha un sistema di raffreddamento a doppia ventola con cinque heatpipes

Rumorosità

Idle
28.3 / 28.3 / 28.3 dB(A)
Sotto carico
50.26 / 57.95 dB(A)
  red to green bar
 
 
30 dB
silenzioso
40 dB(A)
udibile
50 dB(A)
rumoroso
 
min: dark, med: mid, max: light   Earthworks M23R, Arta (15 cm di distanza)   Rumorosità ambientale: 25.56 dB(A)
dB(A) 0102030405060708090Deep BassMiddle BassHigh BassLower RangeMidsHigher MidsLower HighsMid HighsUpper HighsSuper Highs2024.931.32525.424.93128.734.34023.130.45025.826.86328.533.18028.334.110024.327.912525.631.716025.534.620027.230.625022.232.631519.833.640016.432.750017.234.96301439.48001340.7100012.239.8125012.143.3160011.844.8200011.945.9250011.149.1315010.650.4400010.446.750001047.3630010.447.3800010.542.51000010.239.61250010.137.7160009.732.8SPL25.658N0.711.3median 12.1median 39.6Delta4.76.3hearing rangehide median Fan NoiseMSI Crosshair 16 HX AI D2XWGKG
MSI Crosshair 16 HX AI D2XWGKG
Ultra 9 275HX, GeForce RTX 5070 Laptop
Alienware 16X Aurora, RTX 5070
Ultra 9 275HX, GeForce RTX 5070 Laptop
Aorus Elite 16 AE6H
Ultra 9 275HX, GeForce RTX 5070 Laptop
Lenovo Legion 5 Pro 16IAX10H
Ultra 9 275HX, GeForce RTX 5070 Ti Laptop
Asus TUF Gaming A16 FA608UP
R7 260, GeForce RTX 5070 Laptop
Noise
15%
-3%
3%
-1%
off /ambiente * (dB)
25.56
23.7
7%
24
6%
24
6%
25.1
2%
Idle Minimum * (dB)
28.3
23.9
16%
25
12%
24
15%
32.2
-14%
Idle Average * (dB)
28.3
23.9
16%
29
-2%
24
15%
32.2
-14%
Idle Maximum * (dB)
28.3
26.1
8%
32
-13%
30.9
-9%
32.2
-14%
Load Average * (dB)
50.26
26.8
47%
60
-19%
55.9
-11%
38.1
24%
Cyberpunk 2077 ultra * (dB)
57.8
51.8
10%
59
-2%
56.72
2%
53.9
7%
Load Maximum * (dB)
57.95
58
-0%
61
-5%
56.72
2%
57.1
1%

* ... Meglio usare valori piccoli

Temperatura

Le temperature della superficie possono raggiungere i 45 °C sul lato superiore e quasi 49 °C sul lato inferiore sotto carico nella modalità Extreme Performance.

Le aree WASD, touchpad e palm rest sono rimaste relativamente fresche durante gli stress test.

Dato che le ventole spingono fuori molta aria dalle prese d'aria multiple, chi utilizza un mouse potrebbe voler posizionarsi in modo appropriato per evitare il disagio dello scarico caldo.

Carico massimo
 44.8 °C43.2 °C42.8 °C 
 38.2 °C40 °C38.8 °C 
 29.6 °C31 °C30.2 °C 
Massima: 44.8 °C
Media: 37.6 °C
43.4 °C40 °C41.8 °C
37.6 °C40.4 °C36.8 °C
32.6 °C30.6 °C29.6 °C
Massima: 43.4 °C
Media: 37 °C
Alimentazione (max)  48.4 °C | Temperatura della stanza 23 °C | Amprobe TMD-50 // Fluke 62 Mini IR Thermometer
(±) La temperatura media del lato superiore sotto carico massimo e' di 37.6 °C / 100 F, rispetto alla media di 33.9 °C / 93 F per i dispositivi di questa classe Gaming.
(±) La temperatura massima sul lato superiore è di 44.8 °C / 113 F, rispetto alla media di 40.5 °C / 105 F, che varia da 21.2 a 68.8 °C per questa classe Gaming.
(±) Il lato inferiore si riscalda fino ad un massimo di 43.4 °C / 110 F, rispetto alla media di 43.3 °C / 110 F
(+) In idle, la temperatura media del lato superiore è di 28.9 °C / 84 F, rispetto alla media deld ispositivo di 33.9 °C / 93 F.
(±) 3: The average temperature for the upper side is 36.9 °C / 98 F, compared to the average of 33.9 °C / 93 F for the class Gaming.
(+) I poggiapolsi e il touchpad sono piu' freddi della temperatura della pelle con un massimo di 31 °C / 87.8 F e sono quindi freddi al tatto.
(-) La temperatura media della zona del palmo della mano di dispositivi simili e'stata di 28.9 °C / 84 F (-2.1 °C / -3.8 F).
Sistema inattivo: Top
Sistema inattivo: in basso
Prime95 + FurMark stress: Top
Prime95 + stress FurMark: In basso
Cyberpunk 2077 1080p Ultra stress: Top
Cyberpunk 2077 1080p Ultra stress: In basso
MSI Crosshair 16 HX AI D2XWGKG
Ultra 9 275HX, GeForce RTX 5070 Laptop
Alienware 16X Aurora, RTX 5070
Ultra 9 275HX, GeForce RTX 5070 Laptop
Aorus Elite 16 AE6H
Ultra 9 275HX, GeForce RTX 5070 Laptop
Lenovo Legion 5 Pro 16IAX10H
Ultra 9 275HX, GeForce RTX 5070 Ti Laptop
Asus TUF Gaming A16 FA608UP
R7 260, GeForce RTX 5070 Laptop
Heat
-3%
-8%
-23%
9%
Maximum Upper Side * (°C)
44.8
51
-14%
41
8%
48
-7%
39.5
12%
Maximum Bottom * (°C)
43.4
45.6
-5%
45
-4%
50
-15%
45.1
-4%
Idle Upper Side * (°C)
31.2
29.8
4%
35
-12%
38
-22%
25.7
18%
Idle Bottom * (°C)
28.8
27.4
5%
36
-25%
42
-46%
25.5
11%

* ... Meglio usare valori piccoli

Altoparlanti

Gli altoparlanti stereo di Crosshair 16 HX AI hanno livelli di volume decenti, ma mancano di una buona risposta dei bassi.

dB(A) 0102030405060708090Deep BassMiddle BassHigh BassLower RangeMidsHigher MidsLower HighsMid HighsUpper HighsSuper Highs2024.933.32525.4303128.732.44023.131.25025.828.96328.5378028.333.310024.33112525.639.216025.543.320027.25525022.261.131519.861.640016.459.750017.2666301474.88001376.8100012.274.3125012.170.1160011.867200011.967.9250011.163.3315010.659.8400010.46550001064.1630010.467.6800010.565.71000010.2641250010.167.3160009.764SPL25.681.5N0.750.5median 12.1median 64.1Delta4.75.326.325.821.422.12624.925.127.622.532.523.448.72655.818.860.922.167.2267019.372.317.674.217.774.319.575.31571.711.871.311.27410.574.21072.710.17210.67210.97511.374.811.671.71269.71269.612.371.112.669.61270.111.269.824.784.70.666.6median 12median 71.73.42.2hearing rangehide median Pink NoiseMSI Crosshair 16 HX AI D2XWGKGApple MacBook Pro 16 2021 M1 Pro
Diagramma frequenza (le caselle possono essere selezionate/deselezionate per confrontare i dispositivi)
MSI Crosshair 16 HX AI D2XWGKG analisi audio

(±) | potenza degli altiparlanti media ma buona (81.5 dB)
Bassi 100 - 315 Hz
(-) | quasi nessun basso - in media 15.6% inferiori alla media
(±) | la linearità dei bassi è media (10.5% delta rispetto alla precedente frequenza)
Medi 400 - 2000 Hz
(±) | medi elevati - circa 6.6% superiore alla media
(±) | linearità dei medi adeguata (7.1% delta rispetto alla precedente frequenza)
Alti 2 - 16 kHz
(+) | Alti bilanciati - appena 1.6% dalla media
(+) | alti lineari (5.8% delta rispetto alla precedente frequenza)
Nel complesso 100 - 16.000 Hz
(+) | suono nel complesso lineare (14.7% differenza dalla media)
Rispetto alla stessa classe
» 28% di tutti i dispositivi testati in questa classe è stato migliore, 7% simile, 64% peggiore
» Il migliore ha avuto un delta di 6%, medio di 18%, peggiore di 132%
Rispetto a tutti i dispositivi testati
» 18% di tutti i dispositivi testati in questa classe è stato migliore, 4% similare, 77% peggiore
» Il migliore ha avuto un delta di 4%, medio di 24%, peggiore di 134%

Apple MacBook Pro 16 2021 M1 Pro analisi audio

(+) | gli altoparlanti sono relativamente potenti (84.7 dB)
Bassi 100 - 315 Hz
(+) | bassi buoni - solo 3.8% dalla media
(+) | bassi in lineaa (5.2% delta rispetto alla precedente frequenza)
Medi 400 - 2000 Hz
(+) | medi bilanciati - solo only 1.3% rispetto alla media
(+) | medi lineari (2.1% delta rispetto alla precedente frequenza)
Alti 2 - 16 kHz
(+) | Alti bilanciati - appena 1.9% dalla media
(+) | alti lineari (2.7% delta rispetto alla precedente frequenza)
Nel complesso 100 - 16.000 Hz
(+) | suono nel complesso lineare (4.6% differenza dalla media)
Rispetto alla stessa classe
» 0% di tutti i dispositivi testati in questa classe è stato migliore, 0% simile, 100% peggiore
» Il migliore ha avuto un delta di 5%, medio di 17%, peggiore di 45%
Rispetto a tutti i dispositivi testati
» 0% di tutti i dispositivi testati in questa classe è stato migliore, 0% similare, 100% peggiore
» Il migliore ha avuto un delta di 4%, medio di 24%, peggiore di 134%

Consumo di energia: Non il più frugale nel confronto

Crosshair 16 HX AI non è molto parsimonioso per quanto riguarda il consumo energetico nella modalità Extreme Performance. I consumi sono un po' più elevati anche negli stati di spegnimento e di standby.

Consumo di corrente
Off / Standbydarklight 0.47 / 1.56 Watt
Idledarkmidlight 26.2 / 33.8 / 34 Watt
Sotto carico midlight 112 / 315 Watt
 color bar
Leggenda: min: dark, med: mid, max: light        Metrahit Energy
MSI Crosshair 16 HX AI D2XWGKG
Ultra 9 275HX, GeForce RTX 5070 Laptop, IPS, 2560x1600, 16"
Alienware 16X Aurora, RTX 5070
Ultra 9 275HX, GeForce RTX 5070 Laptop, IPS, 2560x1600, 16"
Aorus Elite 16 AE6H
Ultra 9 275HX, GeForce RTX 5070 Laptop, IPS, 2560x1600, 16"
Lenovo Legion 5 Pro 16IAX10H
Ultra 9 275HX, GeForce RTX 5070 Ti Laptop, OLED, 2560x1600, 16"
Asus TUF Gaming A16 FA608UP
R7 260, GeForce RTX 5070 Laptop, IPS, 2560x1600, 16"
Media NVIDIA GeForce RTX 5070 Laptop
 
Media della classe Gaming
 
Power Consumption
11%
26%
9%
43%
34%
25%
Idle Minimum * (Watt)
26.2
20.1
23%
8.5
68%
14
47%
4.6
82%
11.7 ?(4.6 - 32, n=19)
55%
Idle Average * (Watt)
33.8
27.6
18%
13.6
60%
14.3
58%
9.8
71%
16.7 ?(8.1 - 36, n=19)
51%
Idle Maximum * (Watt)
34
31.8
6%
22
35%
20.1
41%
10.2
70%
22.6 ?(10.2 - 47, n=19)
34%
Load Average * (Watt)
112
102.7
8%
113
-1%
177
-58%
76.1
32%
Cyberpunk 2077 ultra external monitor * (Watt)
220
192.3
13%
219
-0%
255
-16%
198.1
10%
Cyberpunk 2077 ultra * (Watt)
224
217
3%
223
-0%
255
-14%
198.9
11%
Load Maximum * (Watt)
315
292
7%
257
18%
294
7%
235.2
25%

* ... Meglio usare valori piccoli

Consumo energetico: Cyberpunk 2077 / Stress test

020406080100120140160180200220240260280300Tooltip
MSI Crosshair 16 HX AI D2XWGKG; 3DMark06 Return To Proxycon: Ø112.3 (99.1-125.5)
MSI Crosshair 16 HX AI D2XWGKG; 1280x720 Prime95 28.10 and Furmark 1.25: Ø215 (207-315)
MSI Crosshair 16 HX AI D2XWGKG; Cyberpunk 2077 FHD ultra no FSR 150cd: Ø224 (198-250)
MSI Crosshair 16 HX AI D2XWGKG; Idle 150cd/m2: Ø34.2 (33.1-42.1)

Consumo di energia: Monitor esterno

0153045607590105120135150165180195210225Tooltip
MSI Crosshair 16 HX AI D2XWGKG; Prime95 V2810 Stress (external Monitor): Ø175.3 (133.9-207)
MSI Crosshair 16 HX AI D2XWGKG; Cinebench R15 Multi (external Monitor): Ø193.3 (192.4-194.5)
MSI Crosshair 16 HX AI D2XWGKG; Cinebench R20 Single (external Monitor): Ø50.4 (46.9-119.7)
MSI Crosshair 16 HX AI D2XWGKG; Cinebench R20 Multi (external Monitor): Ø194.9 (192.3-199.4)
MSI Crosshair 16 HX AI D2XWGKG; Cinebench R23 Single (external Monitor): Ø50.9 (46.7-121)
MSI Crosshair 16 HX AI D2XWGKG; Cinebench R23 Multi (external Monitor): Ø193.6 (191.3-201)
MSI Crosshair 16 HX AI D2XWGKG; Cinebench 2024 Single Power (external Monitor): Ø52.2 (47-77.6)
MSI Crosshair 16 HX AI D2XWGKG; Cinebench 2024 Multi Power (external Monitor): Ø177.9 (159.2-200)
MSI Crosshair 16 HX AI D2XWGKG; 1280x720 FurMark 1.19 GPU Stress Test (external Monitor): Ø146.4 (136.8-154.8)
MSI Crosshair 16 HX AI D2XWGKG; Idle 1min (external Monitor): Ø17.6 (10.8-24.3)
MSI Crosshair 16 HX AI D2XWGKG; Cyberpunk 2077 FHD ultra no FSR (external Monitor): Ø220 (189.6-238)

Durata della batteria

L'autonomia della batteria, che si avvicina a 12 ore o più, è possibile in modalità ECO-Silent con MSHybrid e la frequenza di aggiornamento impostata a 60 Hz.

Autonomia della batteria
WiFi Websurfing
11ore 06minuti
Big Buck Bunny H.264 1080p
14ore 10minuti
MSI Crosshair 16 HX AI D2XWGKG
Ultra 9 275HX, GeForce RTX 5070 Laptop, 90 Wh
Alienware 16X Aurora, RTX 5070
Ultra 9 275HX, GeForce RTX 5070 Laptop, 96 Wh
Aorus Elite 16 AE6H
Ultra 9 275HX, GeForce RTX 5070 Laptop, 99 Wh
Lenovo Legion 5 Pro 16IAX10H
Ultra 9 275HX, GeForce RTX 5070 Ti Laptop, 80 Wh
Asus TUF Gaming A16 FA608UP
R7 260, GeForce RTX 5070 Laptop, 90 Wh
Media della classe Gaming
 
Autonomia della batteria
WiFi v1.3 (h)
11.1
4.3
-61%
8.5
-23%
4.9
-56%
13
17%

Le impressioni generali di Notebookcheck su MSI Crosshair 16 HX AI

MSI Crosshair 16 HX AI si presenta come un portatile da gioco di fascia medio-alta capace. Sono visibili misure di riduzione dei costi, ma nessuna che influisca negativamente sull'effettiva esperienza di gioco.

MSI Crosshair 16 HX AI D2XWGKG - 11/11/2025 v8
Vaidyanathan Subramaniam

Chassis
82 / 98 → 84%
Tastiera
85%
Dispositivo di puntamento
81%
Connettività
60 / 80 → 75%
Peso
60 / 10-68 → 86%
Batteria
86 / 95 → 90%
Display
80%
Prestazioni di gioco
90%
Prestazioni Applicazioni
91%
AI Performance
93%
Temperatura
88 / 95 → 92%
Rumorosità
57 / 90 → 63%
Audio
77%
Fotocamera
30 / 75 → 40%
Media
61%
82%
Gaming - Media ponderata
CO2 Emissions
No Data
Materials
0%
Packaging
50%
Power Use
67.1%
Repairability
50%
Software Updates
22.3%
Recycle Logo Total Sustainability Score: 31.6%

Potenziali concorrenti a confronto

Immagine
Modello
Prezzo
Peso
Altezza
Schermo
1.
81.9%
MSI Crosshair 16 HX AI D2XWGKG
Intel Core Ultra 9 275HX ⎘
NVIDIA GeForce RTX 5070 Laptop ⎘
16 GB Memoria, 1024 GB SSD
Amazon:
1. $1,775.75
msi Crosshair 18 HX AI 18" 2...
2. $1,699.00
msi Crosshair 16 HX AI 16" Q...
3. $1,599.99
MSI Crosshair A16 HX 16" QHD...
Prezzo di listino: 2500 EUR
2.5 kg27.9 mm16.00"
2560x1600
189 PPI
IPS
2.
84.9%
Alienware 16X Aurora, RTX 5070
Intel Core Ultra 9 275HX ⎘
NVIDIA GeForce RTX 5070 Laptop ⎘
32 GB Memoria
Prezzo di listino: 1800 USD2.5 kg23.4 mm16.00"
2560x1600
189 PPI
IPS
3.
84.4%
Aorus Elite 16 AE6H
Aorus Elite 16 AE6H
Intel Core Ultra 9 275HX ⎘
NVIDIA GeForce RTX 5070 Laptop ⎘
32 GB Memoria, 1024 GB SSD
Amazon:
1. $45.99
Smatree Hard EVA Protective ...
2. $46.99
Smatree Hard Laptop Sleeve C...
3. $59.99
Smatree 16 inch Laptop Sleev...
Prezzo di listino: 2300 EUR
2.4 kg26 mm16.00"
2560x1600
189 PPI
IPS
4.
84.5%
Lenovo Legion 5 Pro 16IAX10H
Intel Core Ultra 9 275HX ⎘
NVIDIA GeForce RTX 5070 Ti Laptop ⎘
32 GB Memoria, 1024 GB SSD
Amazon:
1. $5.99
Keyboard Skin Compatible for...
2. $55.99
300W 245W Legion 5 Charger C...
3. $3.99
Keyboard Skin Compatible for...
Prezzo di listino: 2500 Euro
2.4 kg25.95 mm16.00"
2560x1600
189 PPI
OLED
5.
83.8%
Asus TUF Gaming A16 FA608UP
AMD Ryzen 7 260 ⎘
NVIDIA GeForce RTX 5070 Laptop ⎘
32 GB Memoria, 1024 GB SSD
Amazon: $1,699.00
Prezzo di listino: 2199€
2.2 kg25.7 mm16.00"
2560x1600
189 PPI
IPS

Transparency

La selezione dei dispositivi da recensire viene effettuata dalla nostra redazione. Il campione di prova è stato fornito all'autore come prestito dal produttore o dal rivenditore ai fini di questa recensione. L'istituto di credito non ha avuto alcuna influenza su questa recensione, né il produttore ne ha ricevuto una copia prima della pubblicazione. Non vi era alcun obbligo di pubblicare questa recensione. In quanto società mediatica indipendente, Notebookcheck non è soggetta all'autorità di produttori, rivenditori o editori.

Ecco come Notebookcheck esegue i test

Ogni anno, Notebookcheck esamina in modo indipendente centinaia di laptop e smartphone utilizzando procedure standardizzate per garantire che tutti i risultati siano comparabili. Da circa 20 anni sviluppiamo continuamente i nostri metodi di prova e nel frattempo stabiliamo gli standard di settore. Nei nostri laboratori di prova, tecnici ed editori esperti utilizzano apparecchiature di misurazione di alta qualità. Questi test comportano un processo di validazione in più fasi. Il nostro complesso sistema di valutazione si basa su centinaia di misurazioni e parametri di riferimento ben fondati, che mantengono l'obiettività.
Please share our article, every link counts!
Mail Logo
> Recensioni e prove di notebook, tablets e smartphones > Recensioni e prove > Recensioni e prove > Recensione del portatile MSI Crosshair 16 HX AI: Prestazioni solide con limiti che non pregiudicano l'esperienza di gioco principale
Vaidyanathan Subramaniam, 2025-11-12 (Update: 2025-11-12)