Verdetto: Un passo avanti, due passi indietro
Il vecchio ThinkPad P16 era più grande e più pesante della concorrenza. Il modello più recente, il Lenovo ThinkPad P16 Gen 3, tuttavia, sembra una correzione eccessiva: È molto più mobile, ma fa dei sacrifici in termini di prestazioni, con i 105 W TGP della GPU e il caricabatterie da 180 W. Non è una cosa che ci aspettiamo da questa linea di prodotti che ha come obiettivo principale le prestazioni.
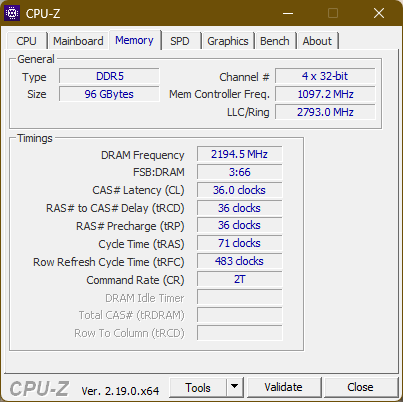
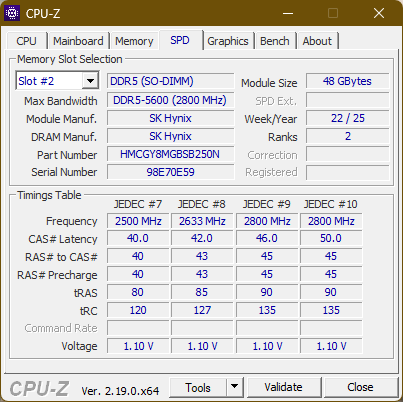
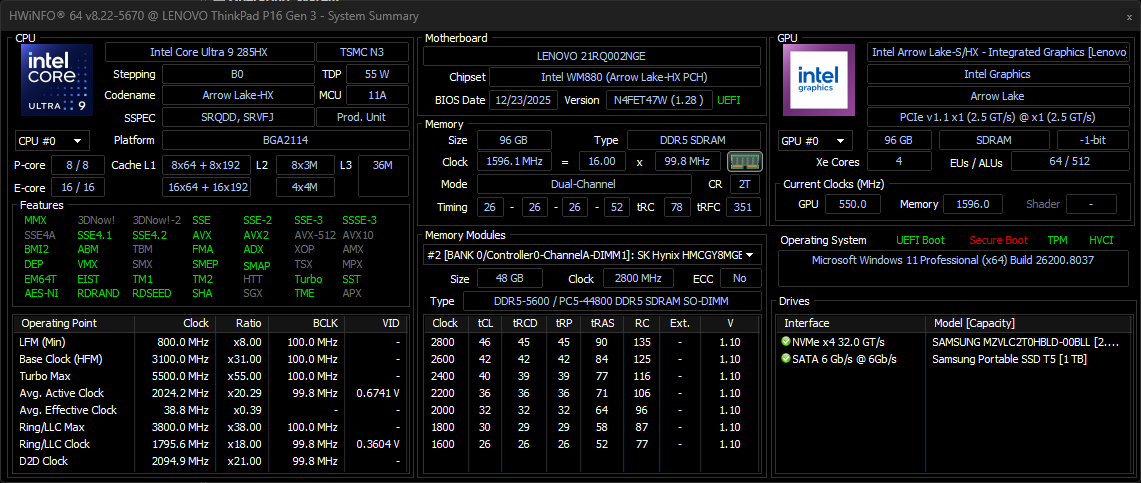
Le prestazioni complessive sono comunque elevate e il ThinkPad P16 G3 ha molte qualità che lo rendono un buon cavallo di battaglia. Particolarmente degna di nota è l'espandibilità, in quanto è possibile inserire in questo portatile fino a 192 GB di RAM e tre SSD 2280. Per l'utilizzo di CAD o AI locale, questo è un ottimo laptop.
Prezzo e disponibilità
Sul sito Lenovo.com, il prezzo del Lenovo ThinkPad P16 Gen 3 è di circa 3.500 dollari.
Sommario
- Verdetto: Un passo avanti, due passi indietro
- Specifiche tecniche: Core Ultra 9 e RTX Pro 3000 Blackwell
- Il caso: Un inizio completamente nuovo per il ThinkPad P16
- Connettività
- Dispositivi di ingresso
- Display
- Prestazioni
- Emissioni
- Gestione dell'energia
- Valutazione Notebookcheck
- Potenziali concorrenti a confronto
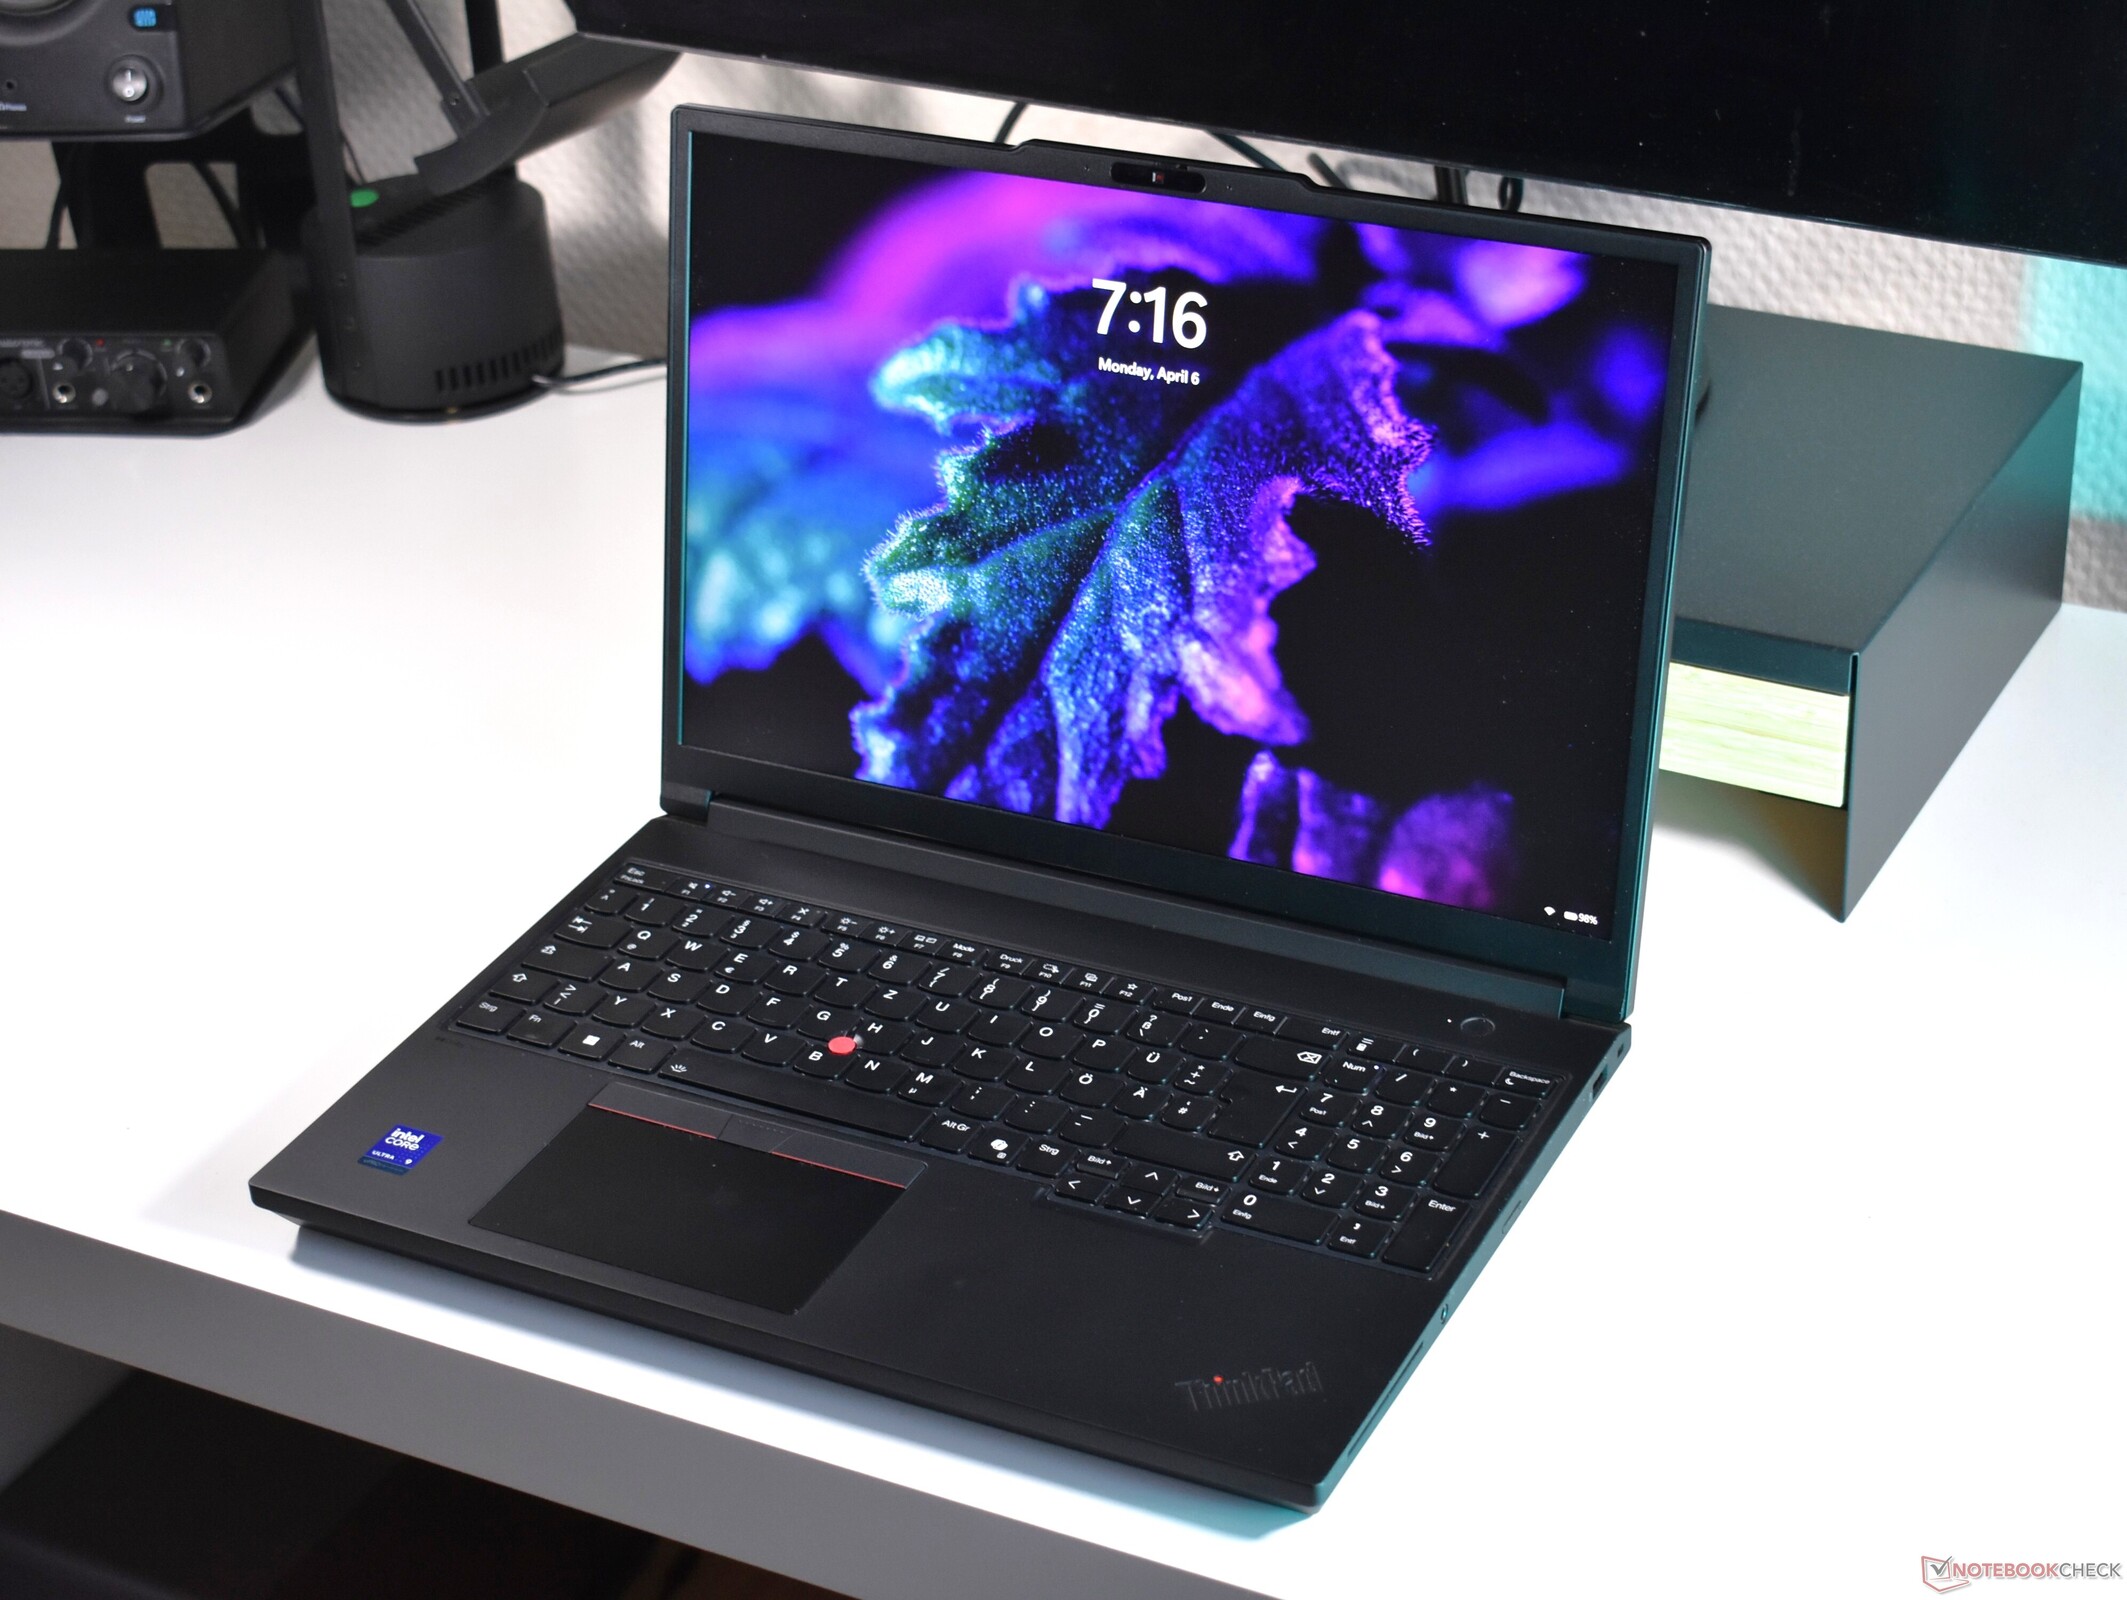
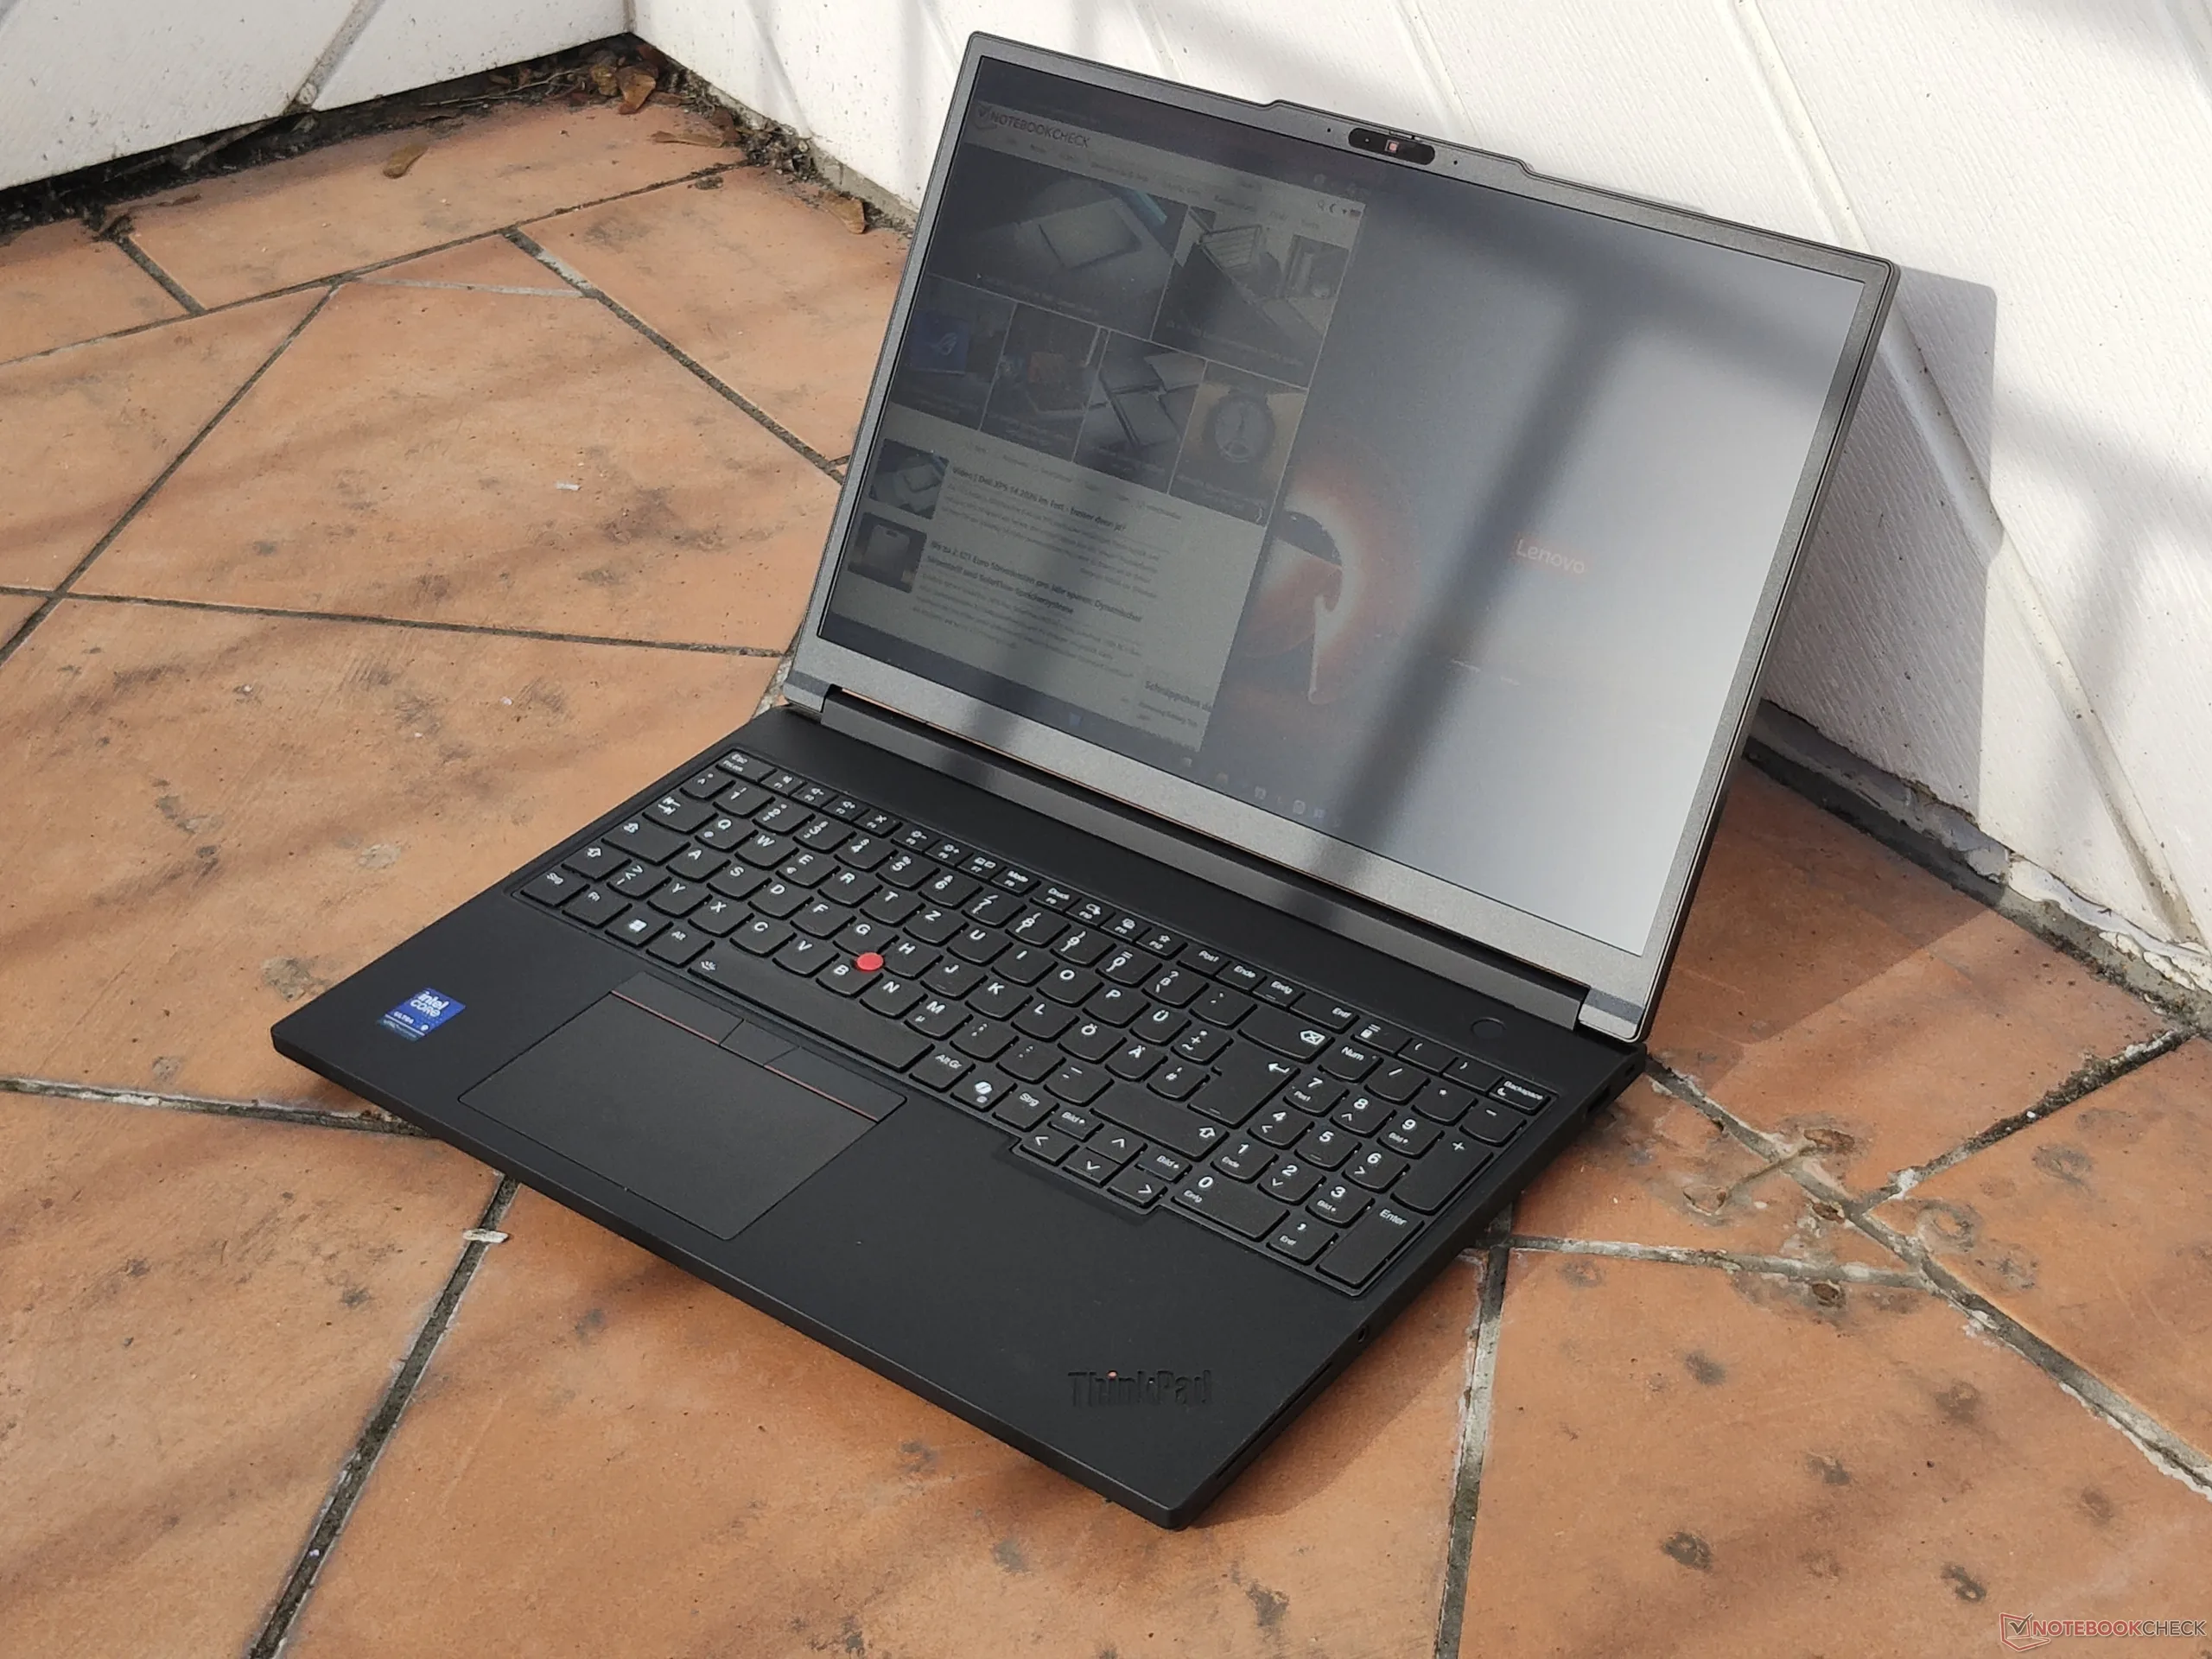
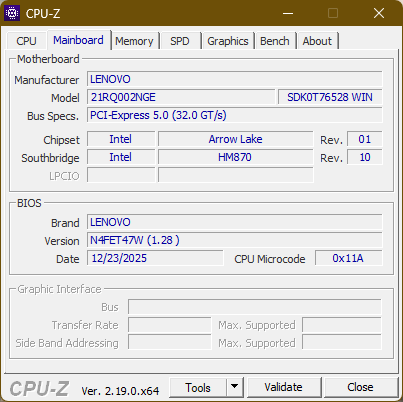
Lenovo chiama le sue workstation mobili serie ThinkPad P - con la P che sta per potenza o prestazioni. Il nostro dispositivo in prova, il Lenovo ThinkPad P16 Gen 3, rappresenta questo aspetto più di qualsiasi altro modello della serie. Dà priorità alle prestazioni rispetto ad altri aspetti, come la mobilità. Si tratta del portatile ThinkPad più pesante, più spesso, ma anche più potente della gamma, con il maggior numero di opzioni di configurazione e di possibilità di aggiornamento. Se acquista un P16 Gen 3, ha bisogno di questa potenza - e ha molti soldi. Che si tratti di CAD o di AI locale, o anche di fungere da server portatile, il ThinkPad P16 è il modello che deve gestire tutto questo.
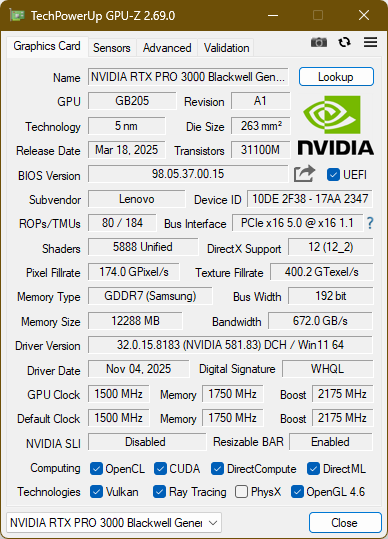
Specifiche tecniche: Core Ultra 9 e RTX Pro 3000 Blackwell
Il caso: Un inizio completamente nuovo per il ThinkPad P16
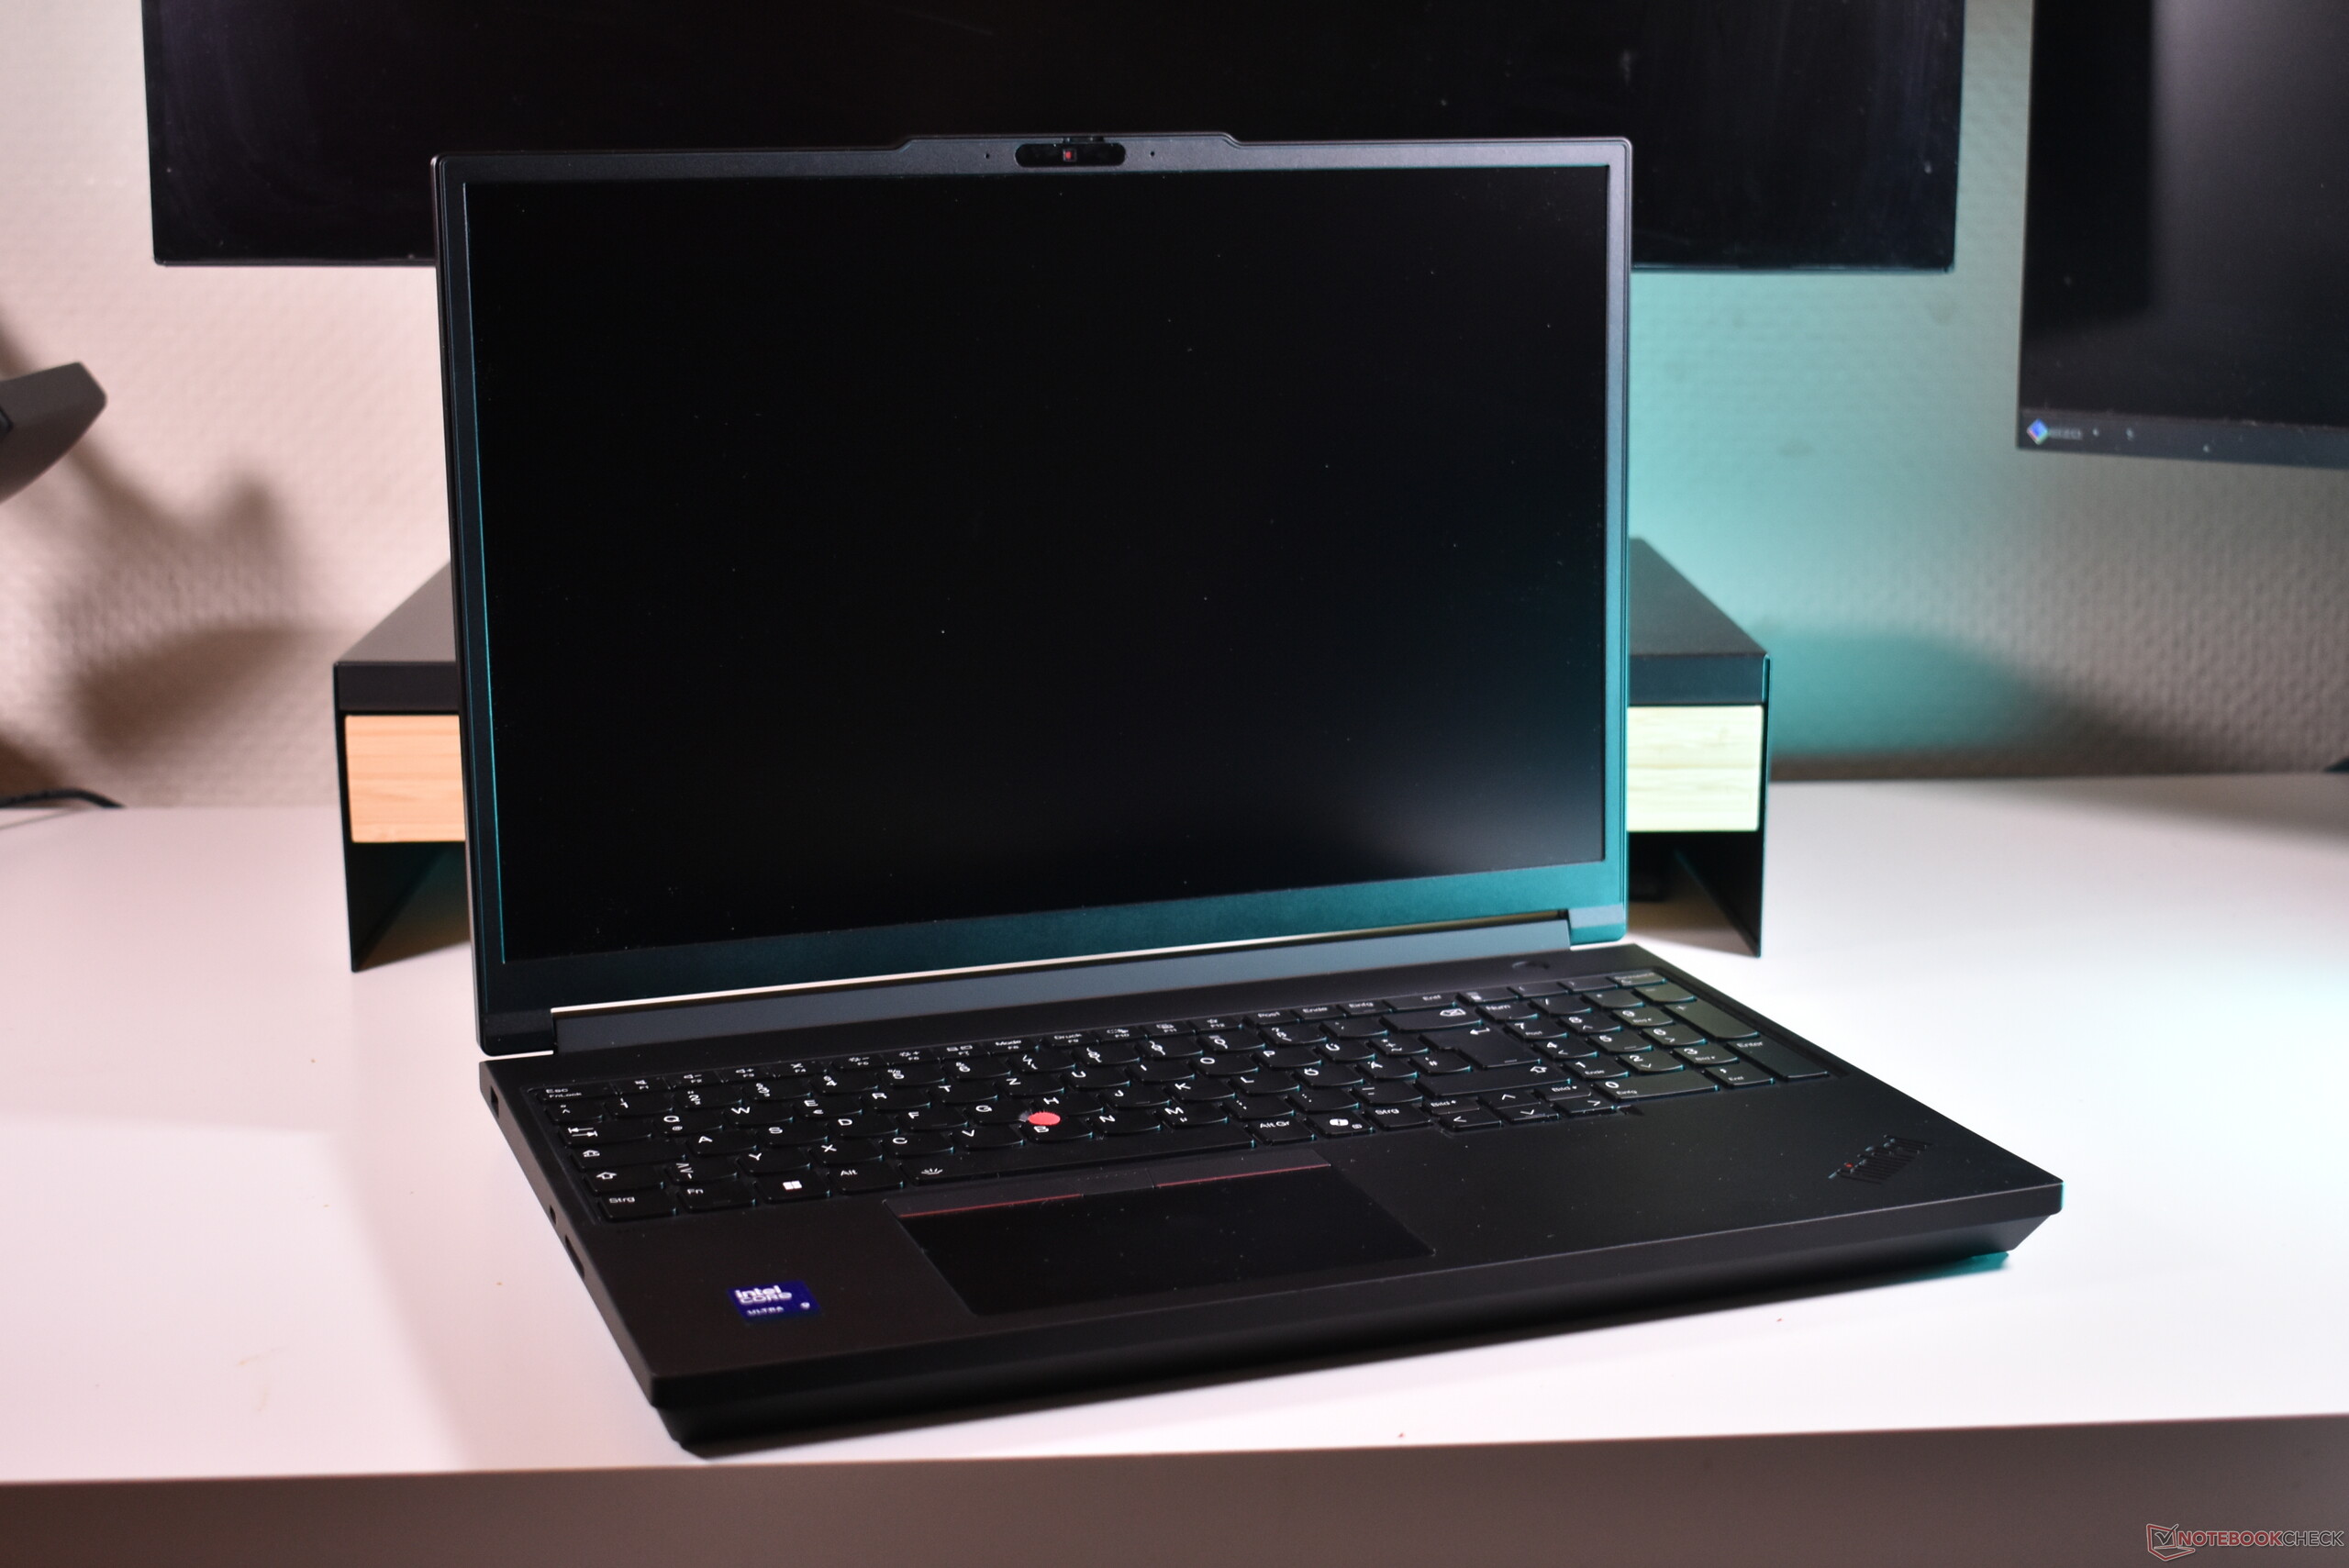
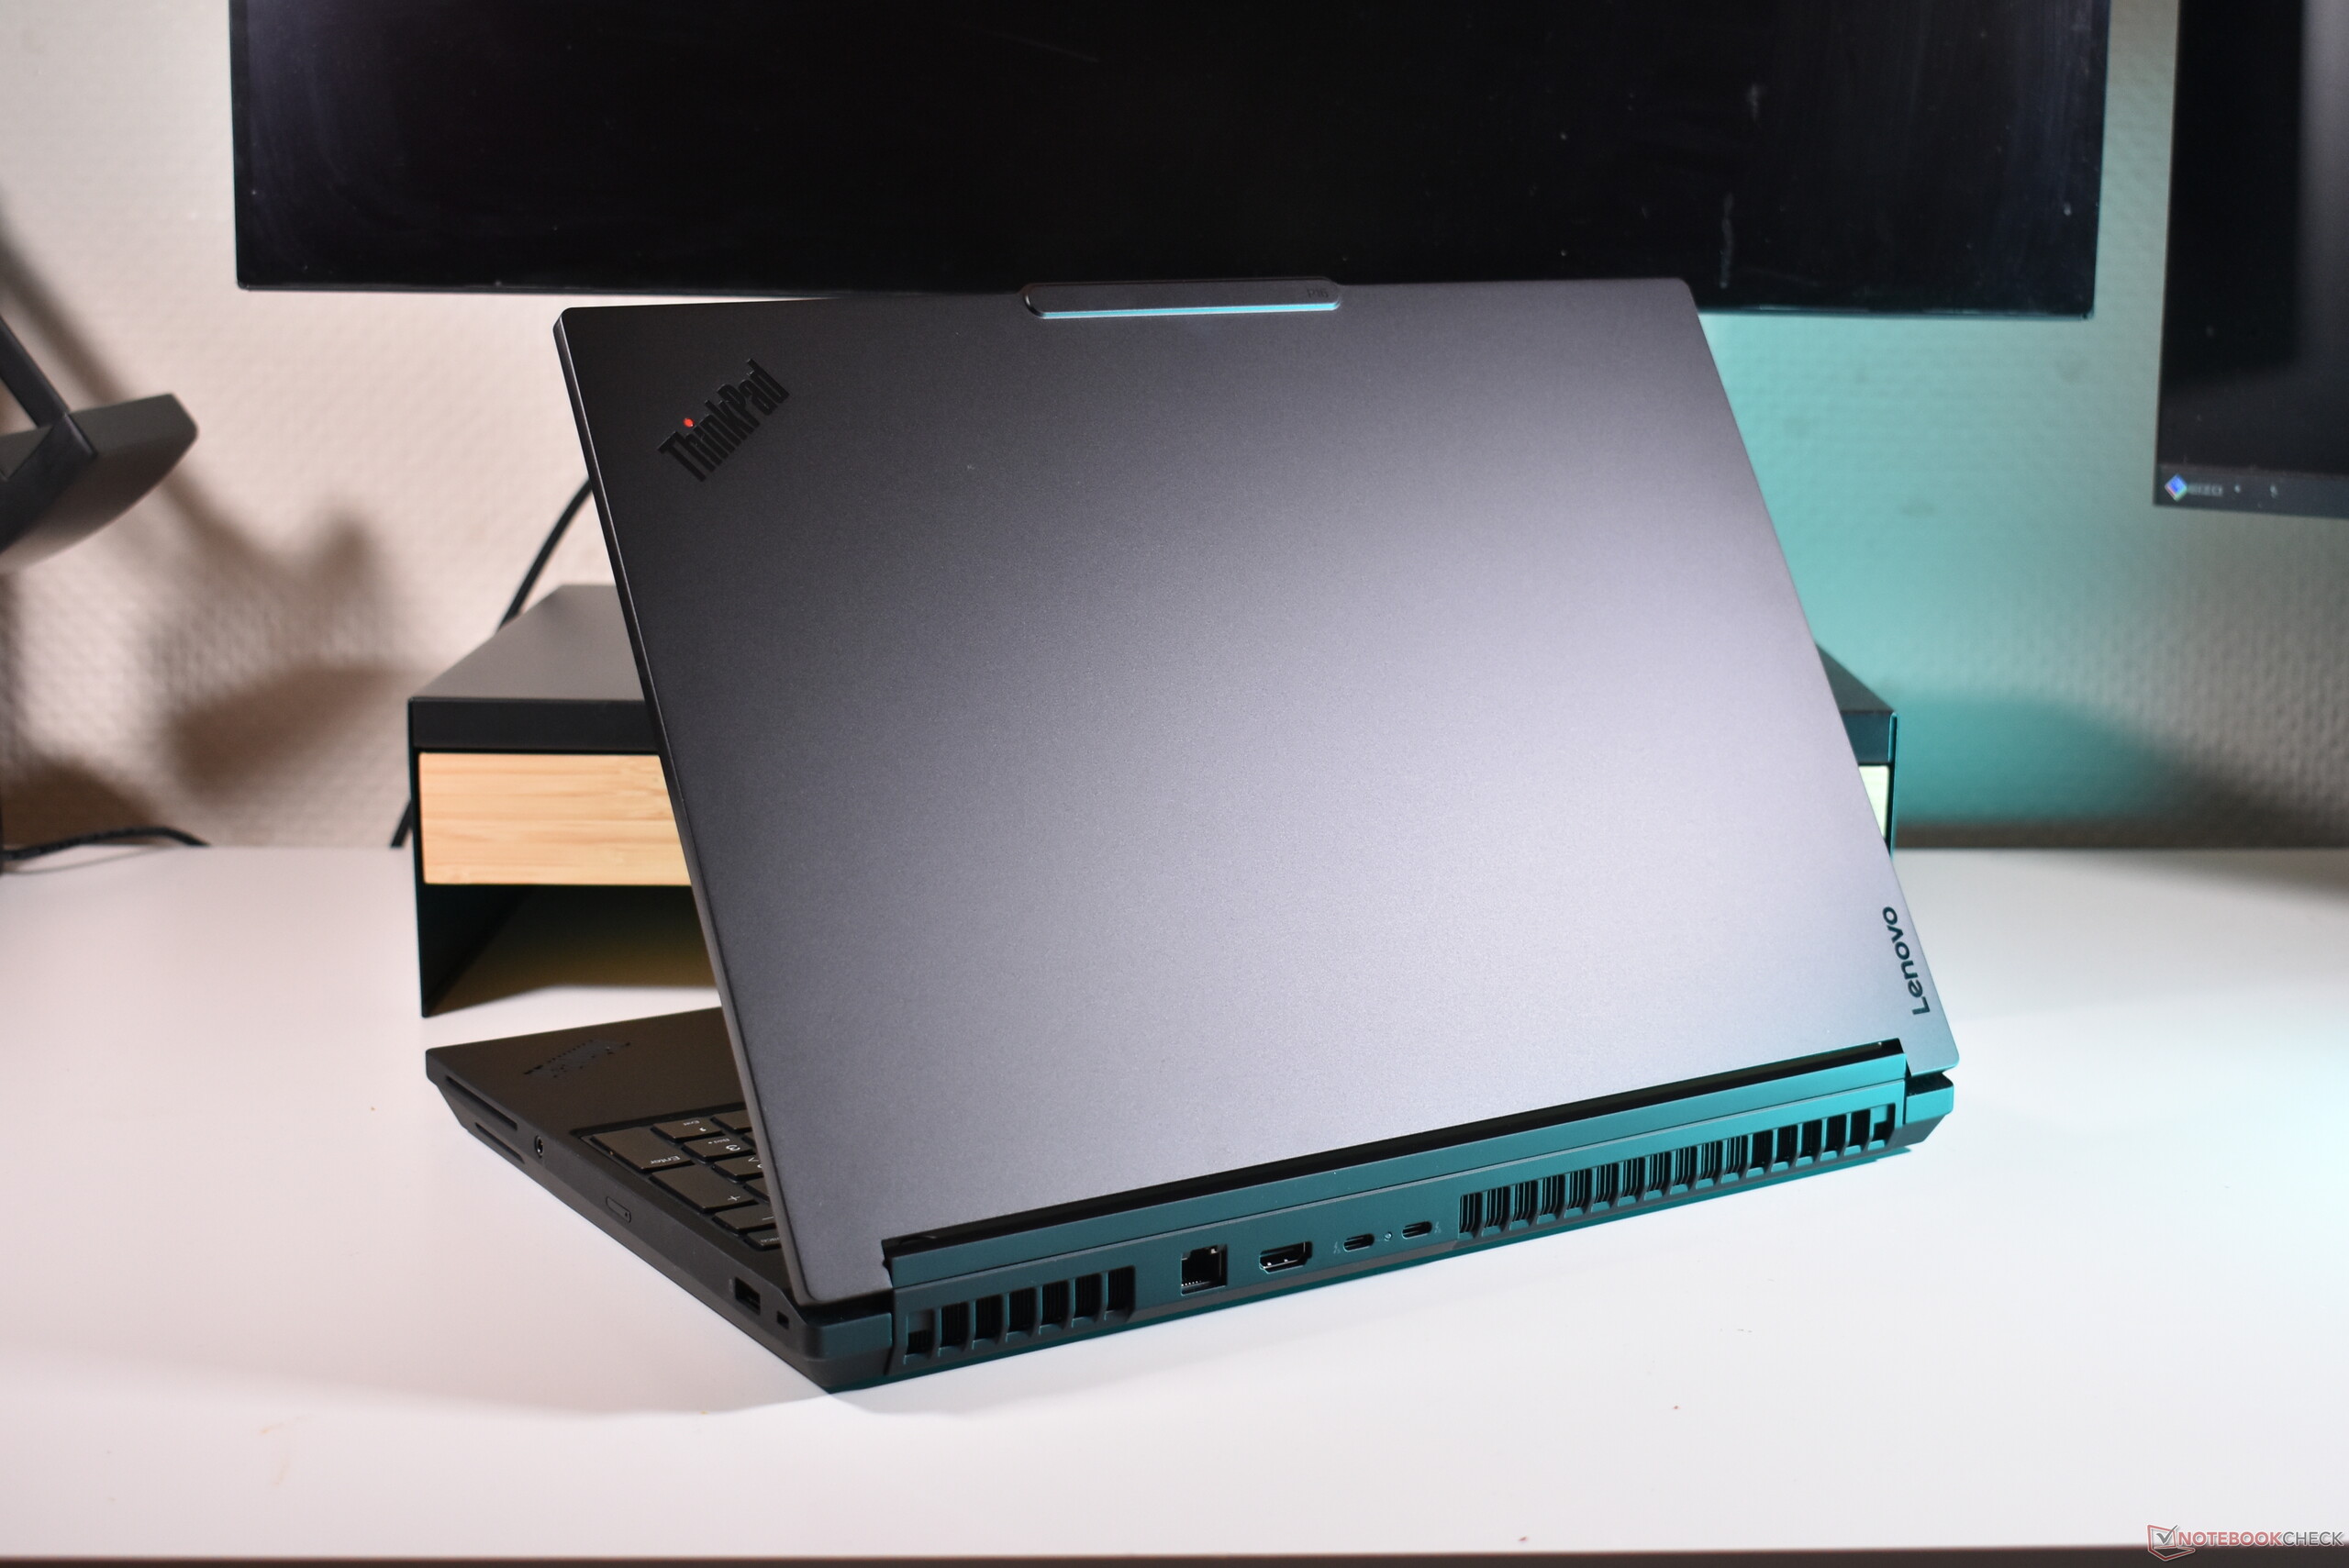
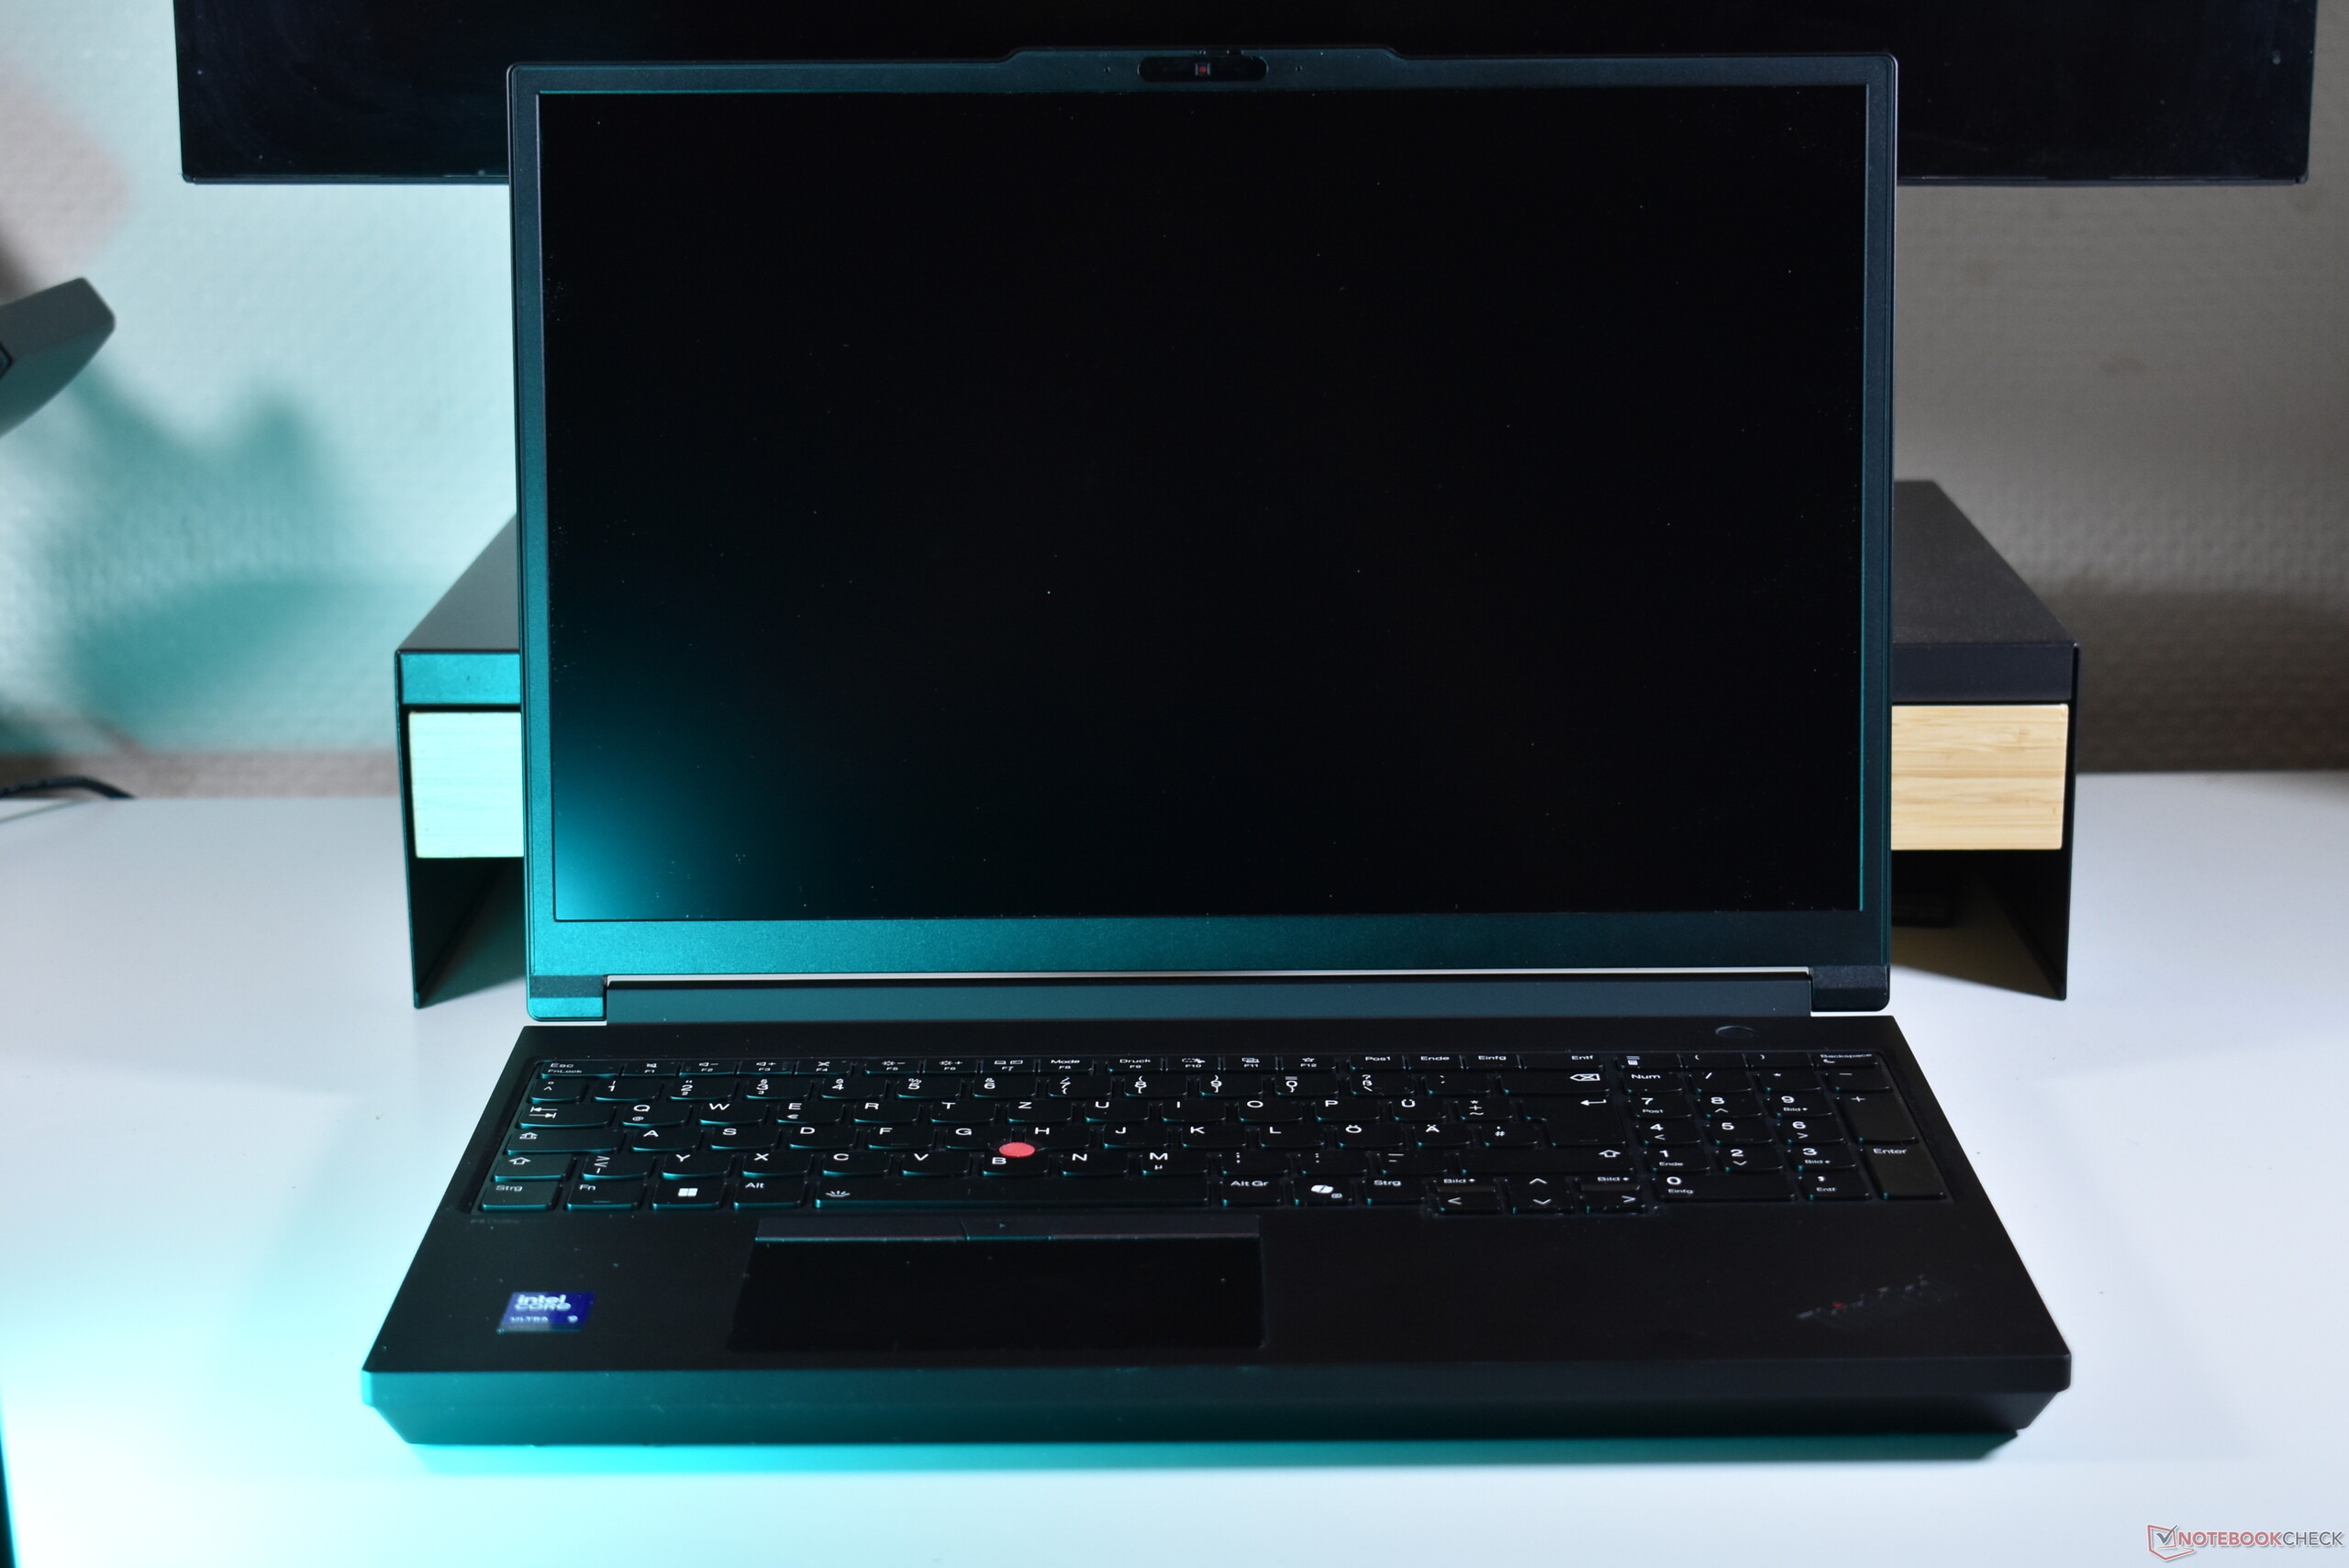
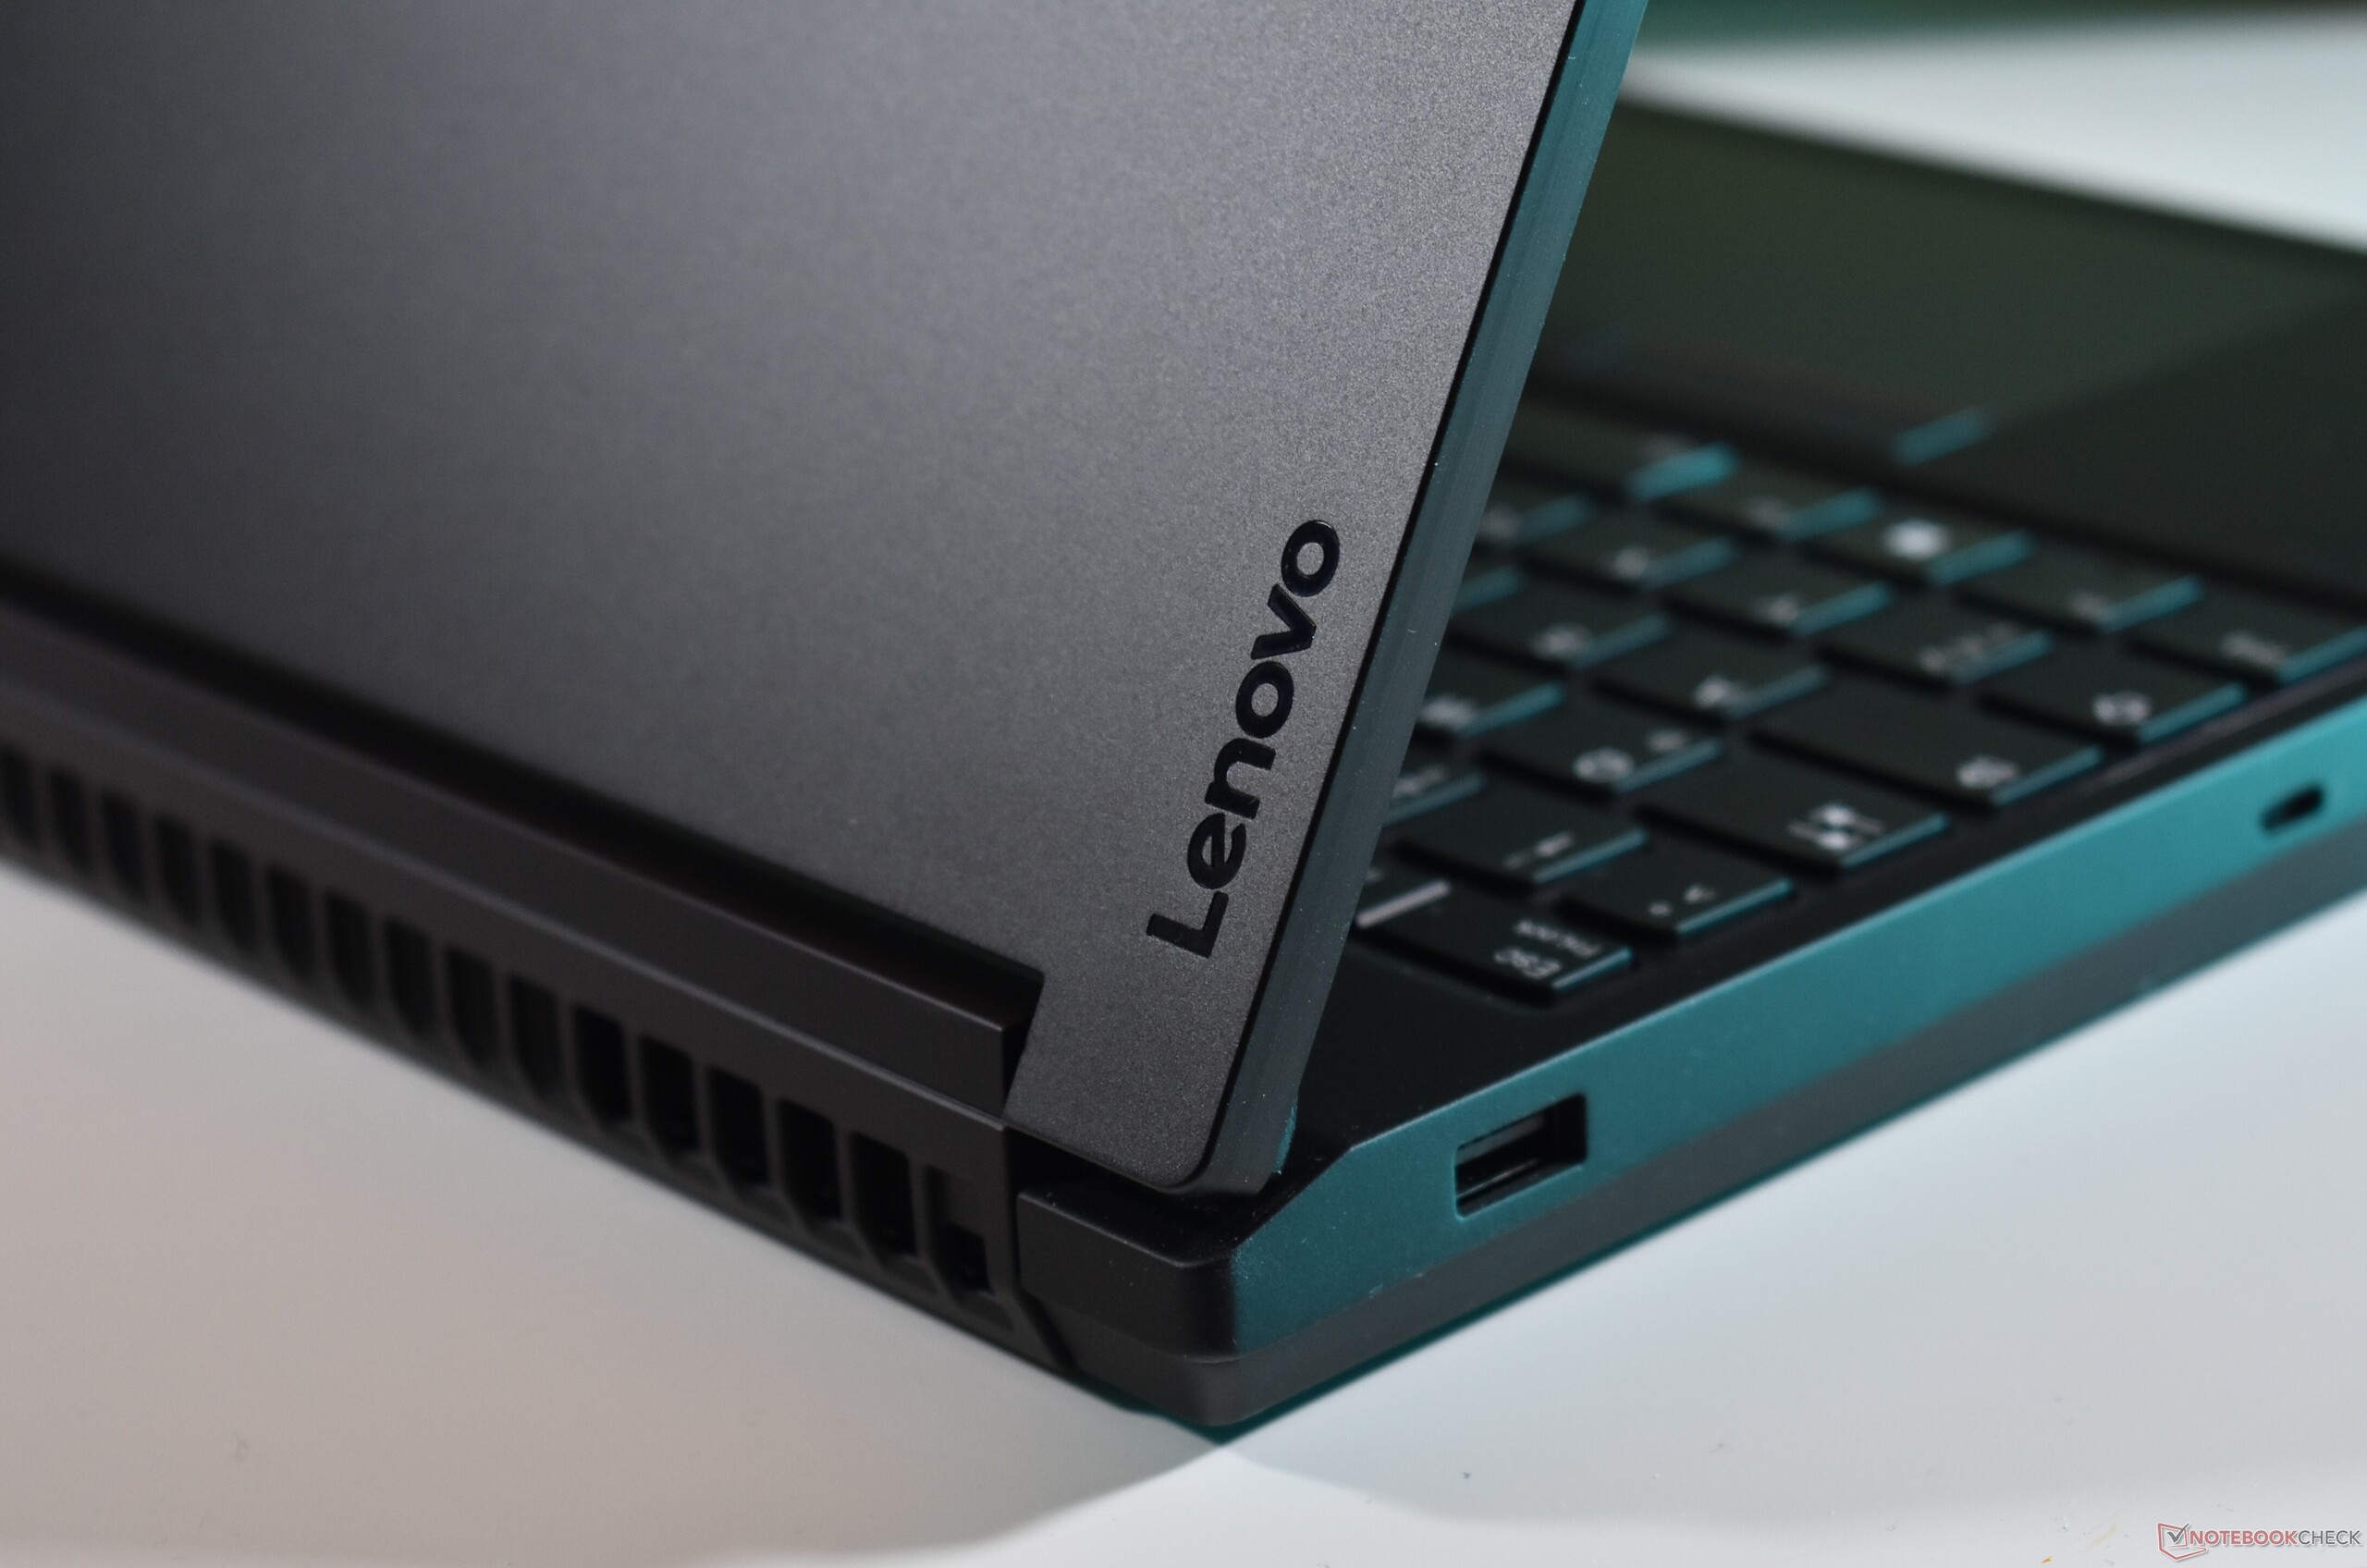
Con l'originale ThinkPad P16 Gen 1 e il ThinkPad P16 Gen 2lenovo ha intrapreso una nuova e audace direzione per le sue workstation: Grigio anziché nero, arrotondato anziché squadrato. Tutto questo è passato nel nuovo Lenovo ThinkPad P16 Gen 3. È squadrato e nero come un ThinkPad classico. Ma non è un rifiuto totale del vecchio design del P16: Lenovo mantiene il coperchio superiore in alluminio, anche se ora in nero anodizzato. La metà inferiore in metallo dello chassis utilizza il tipico rivestimento nero ThinkPad, che è liscio e leggermente gommato. La novità di quest'anno è la cerniera più ampia in un unico pezzo, dove Lenovo colloca le antenne Wi-Fi. Lo schermo oscilla appena e si apre a 180 gradi. È possibile aprirlo con una sola mano.

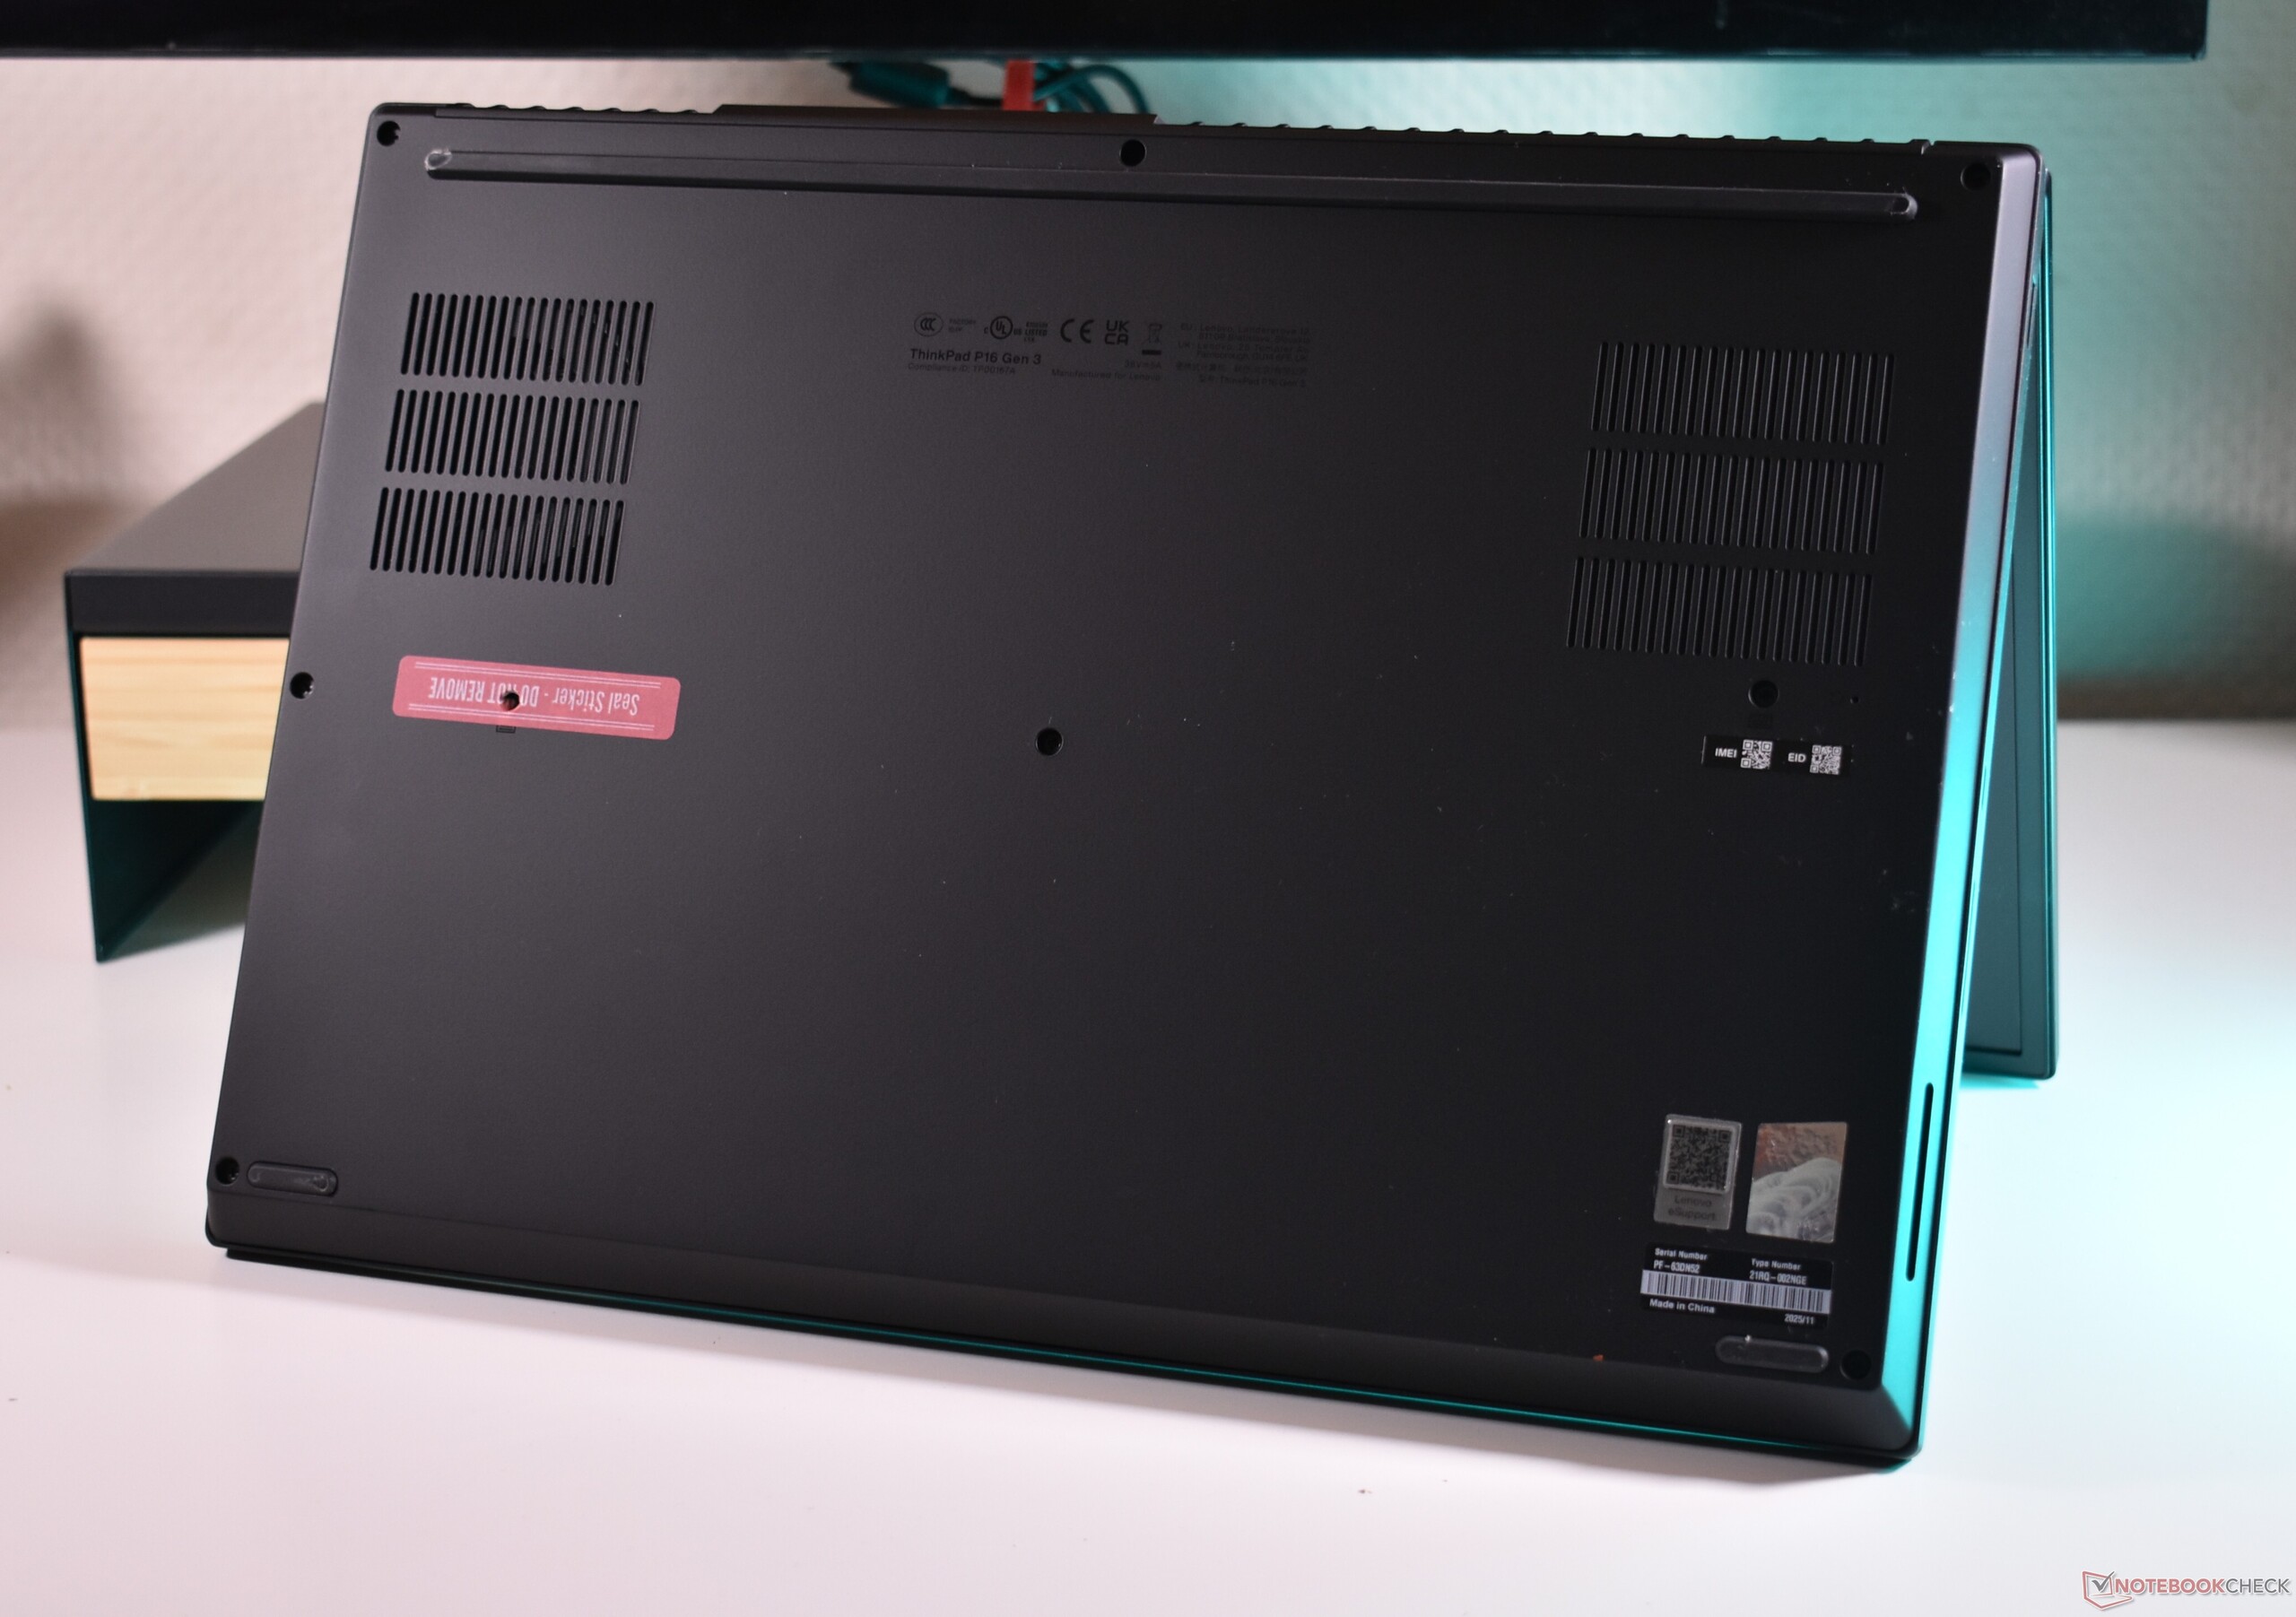
Il nuovo P16 è notevolmente più leggero e compatto rispetto alla versione precedente. È ancora pesante e grande, ma non è più il più grande e pesante tra i portatili workstation da 16 pollici full-fat. Chiaramente, l'ottimizzazione della mobilità è stata una delle priorità di Lenovo.
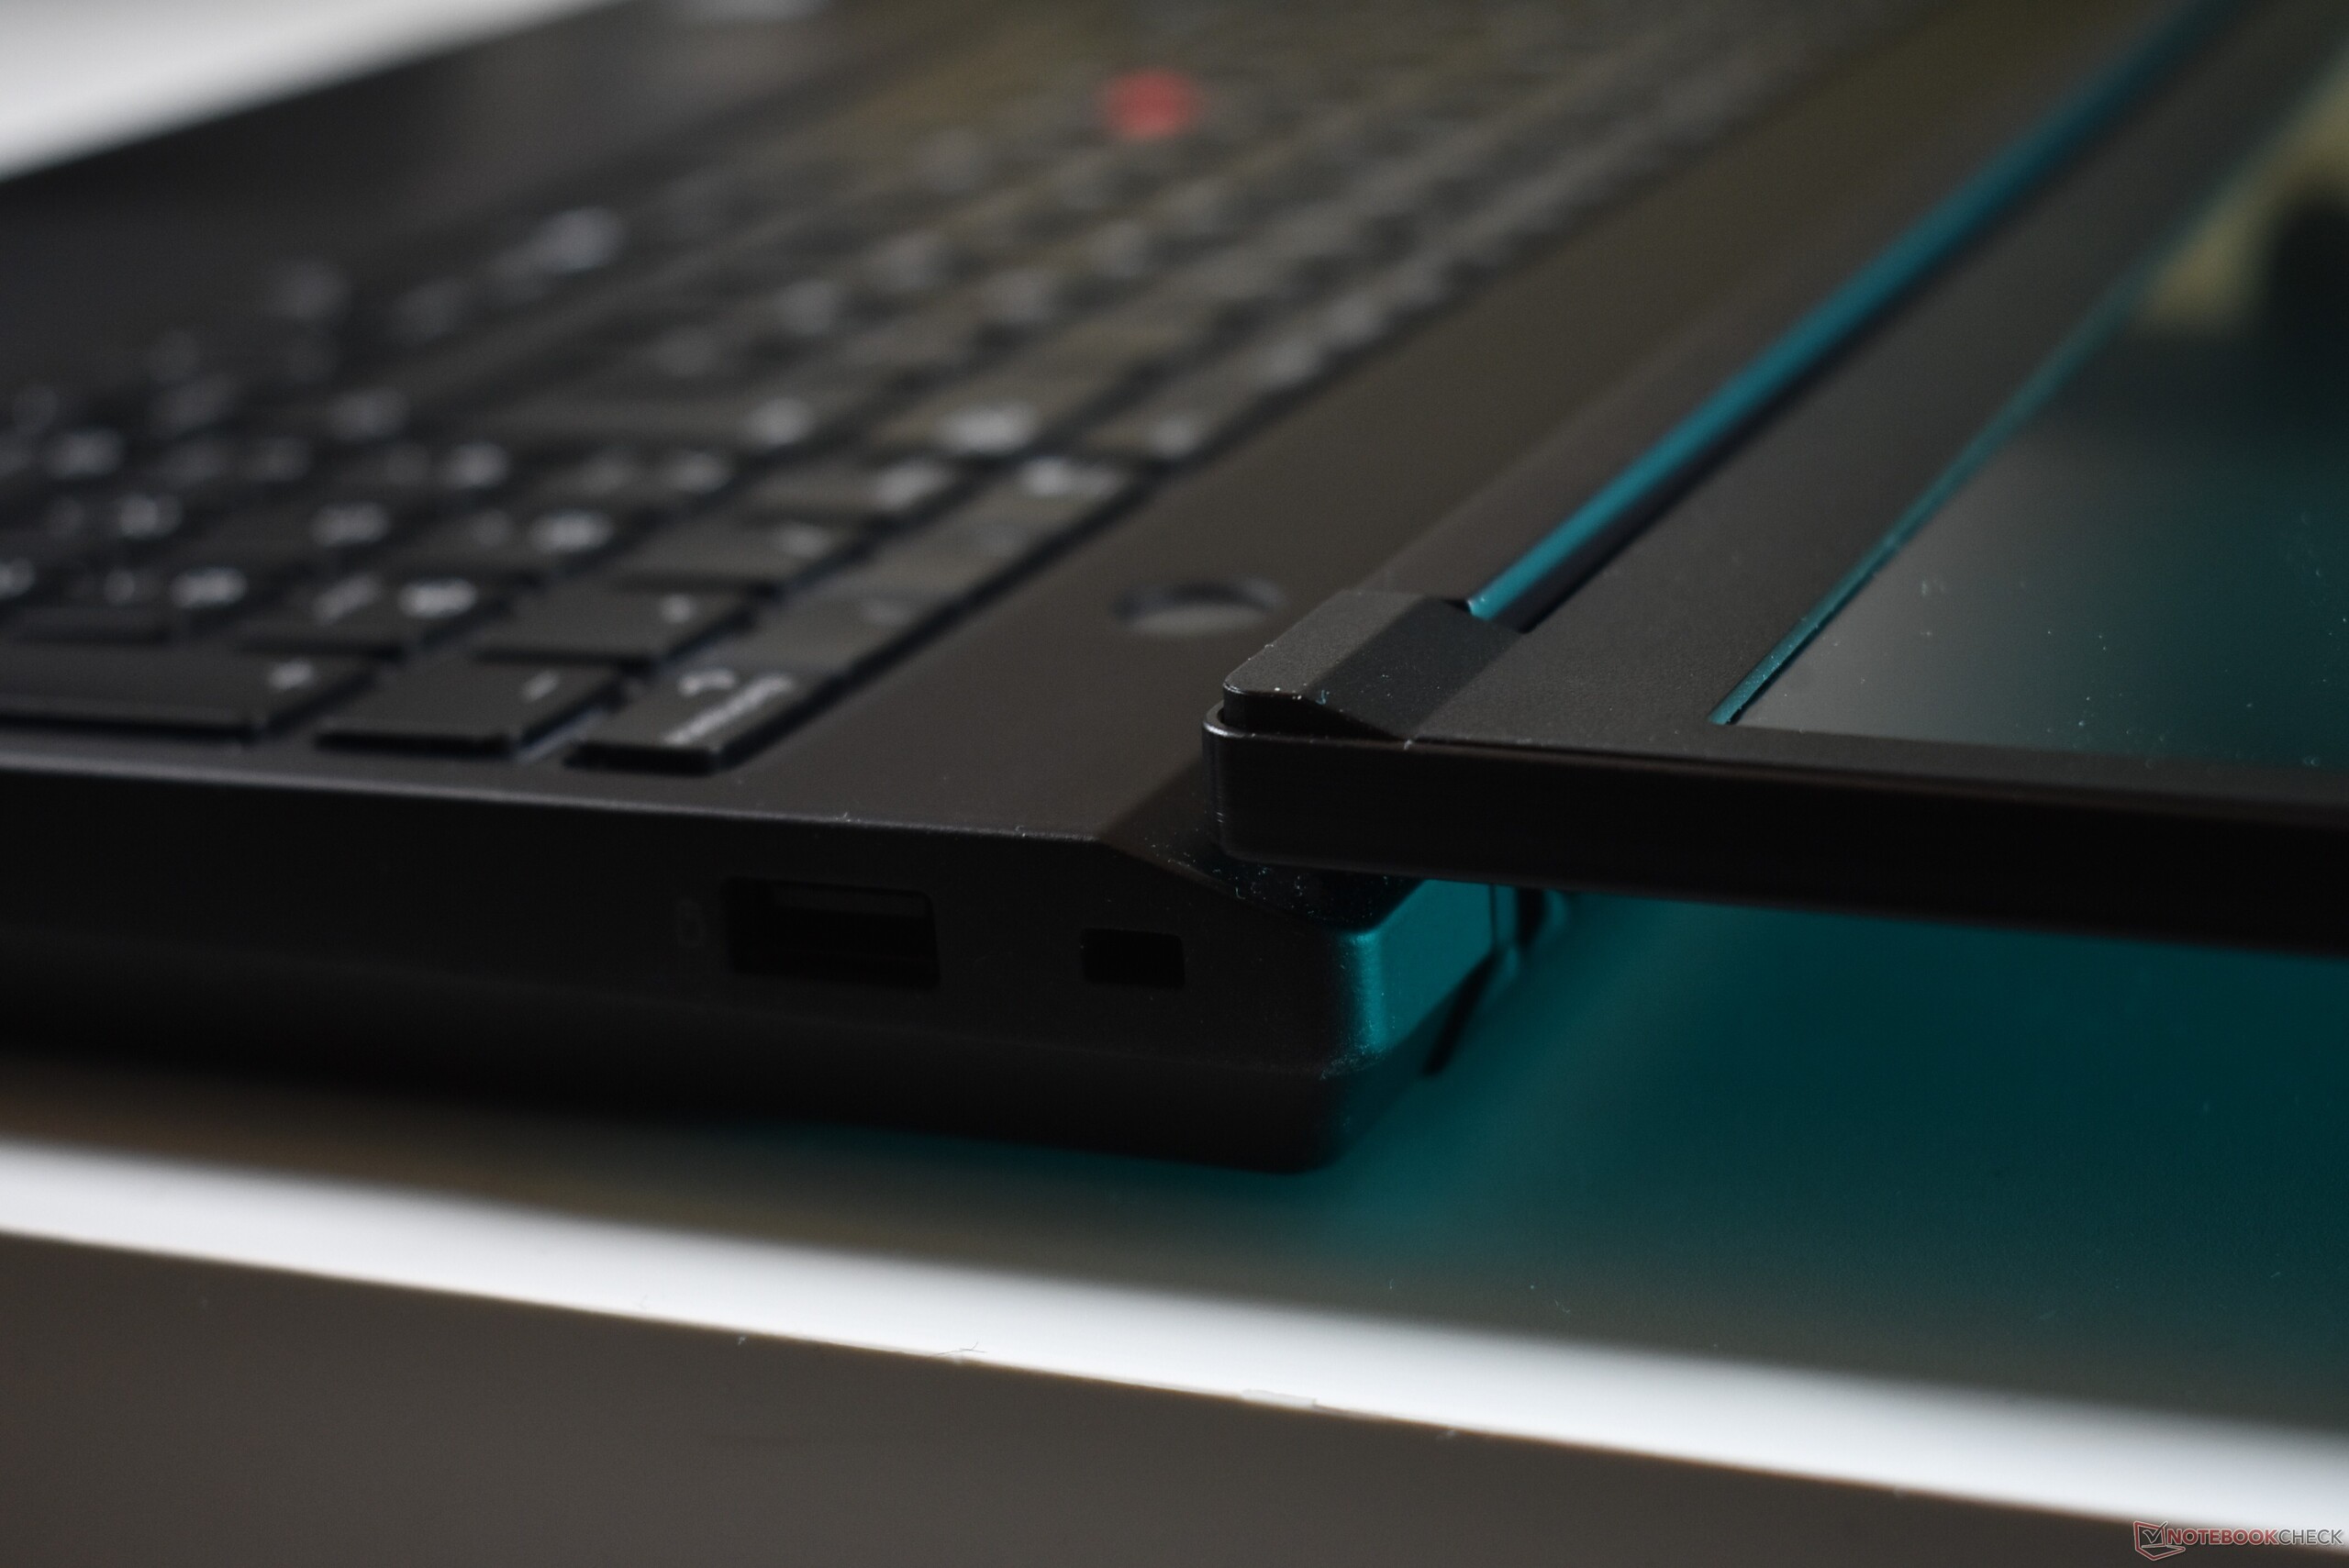
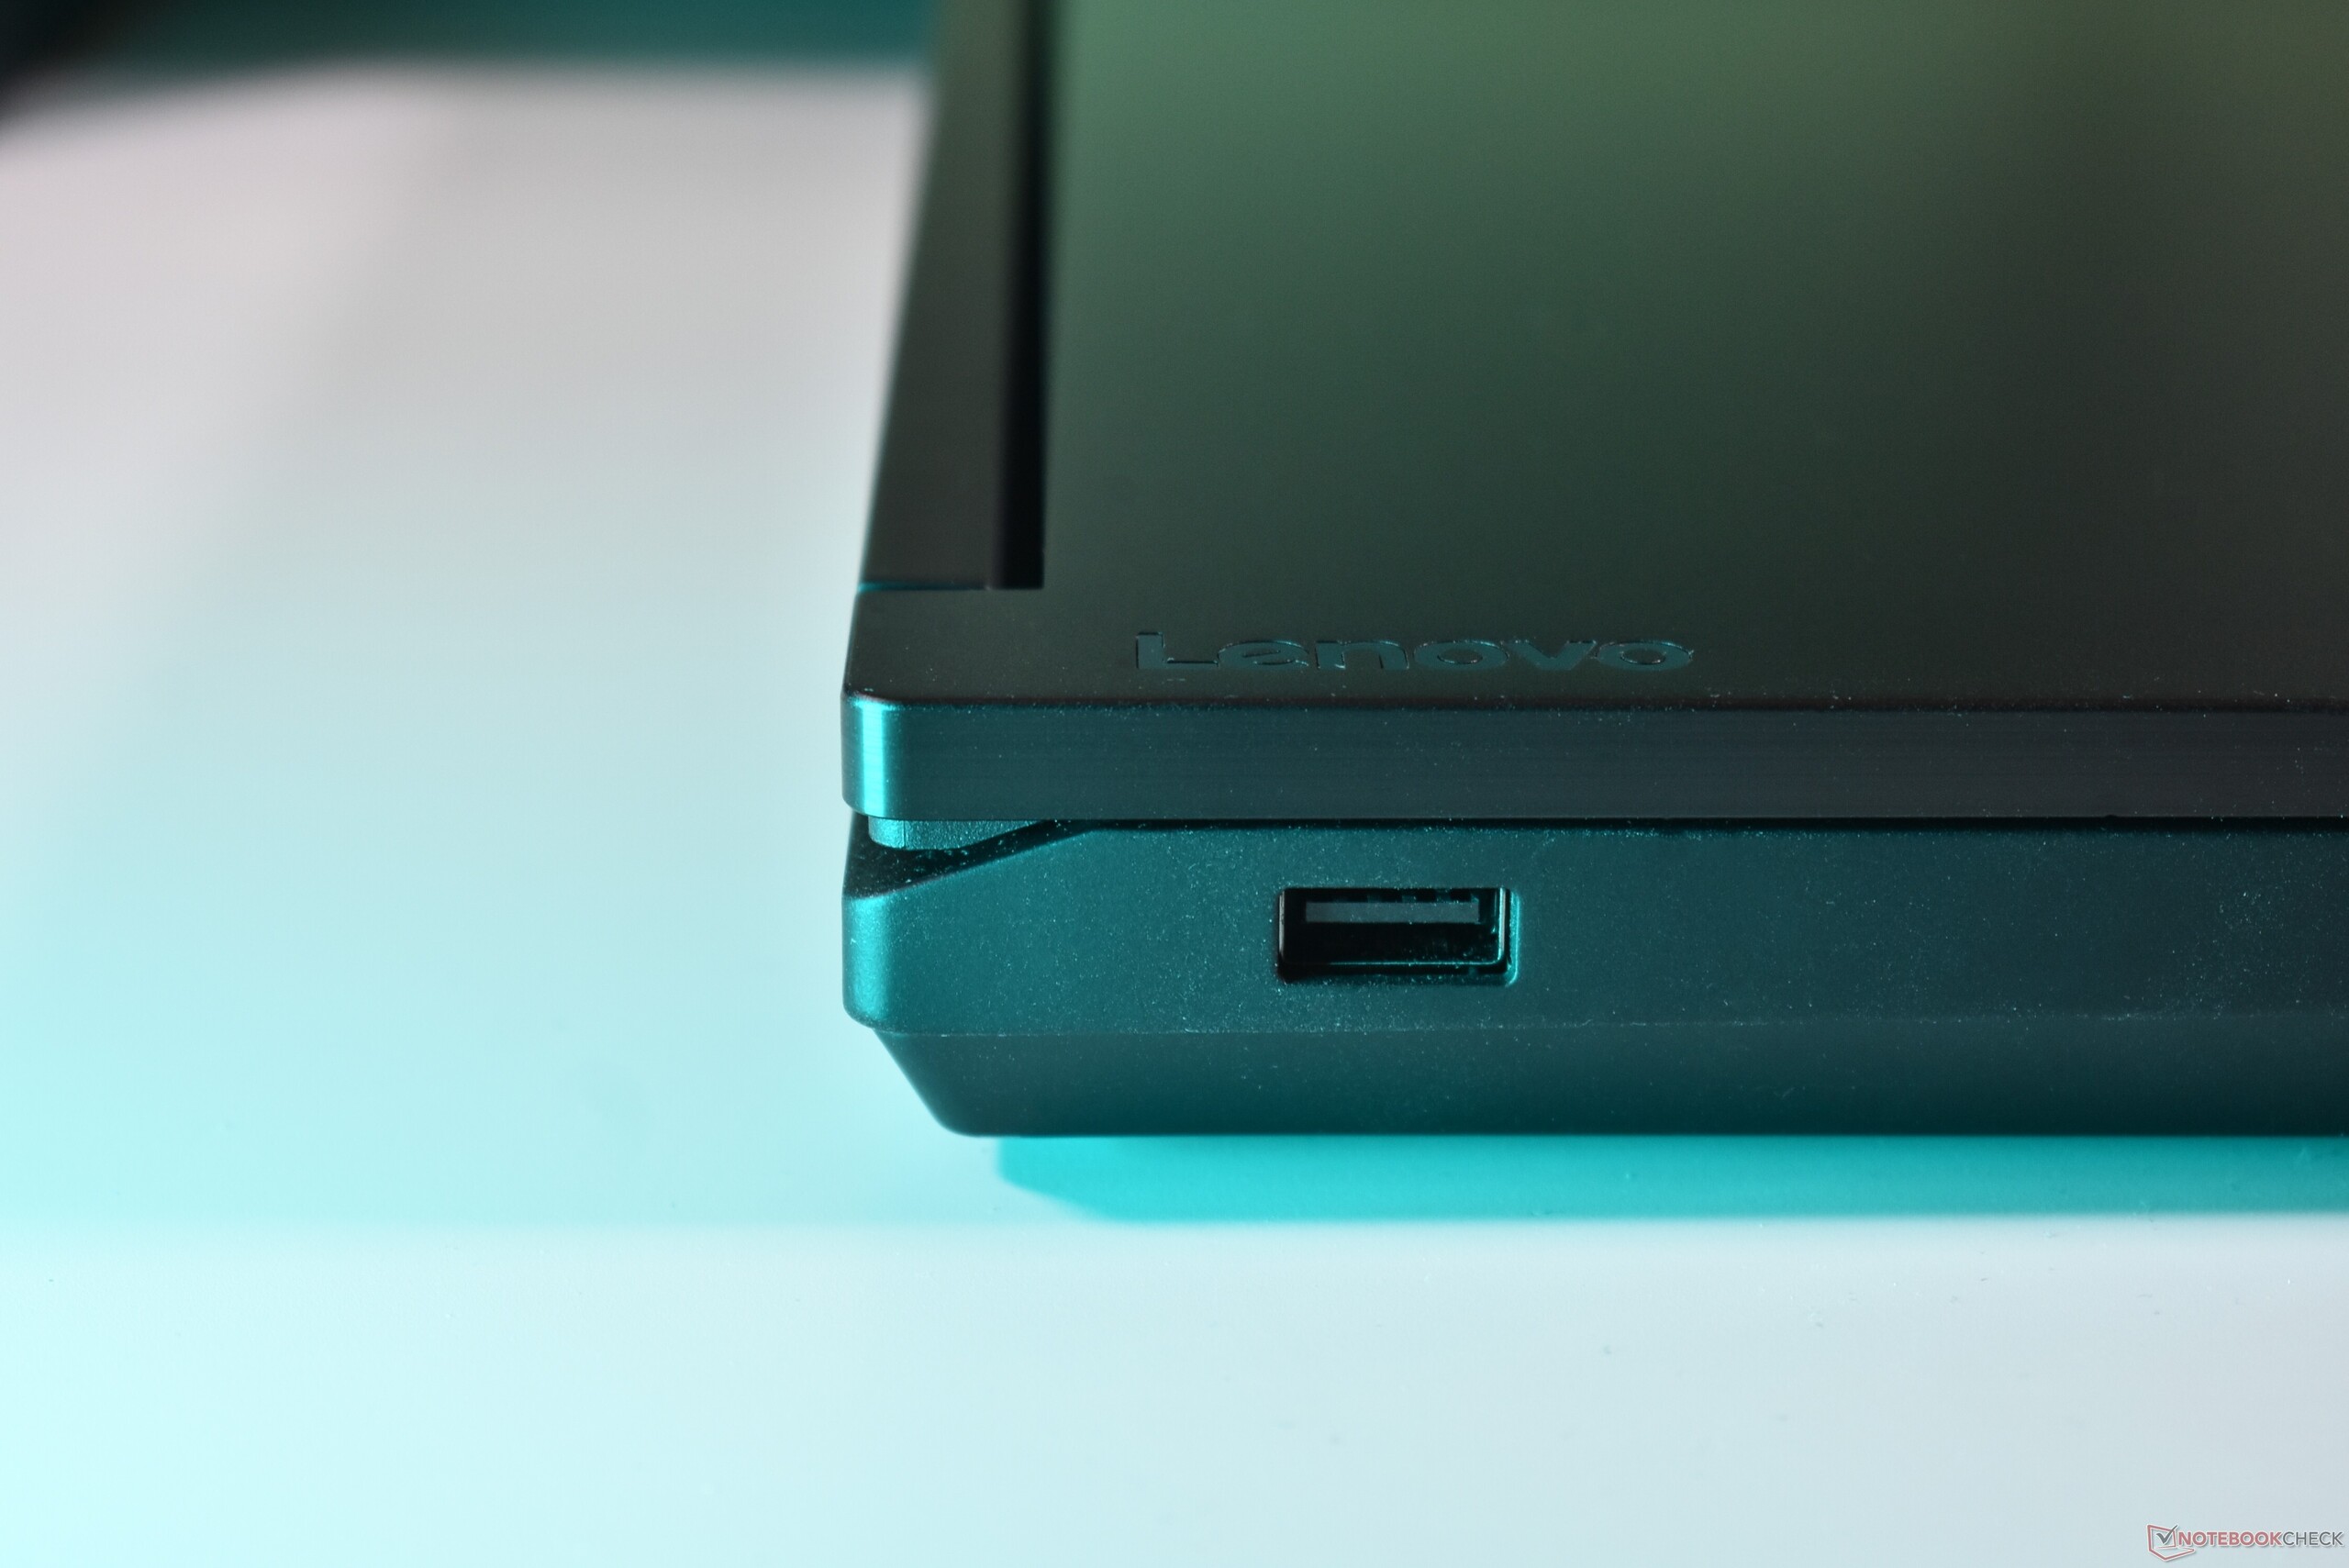
Connettività
La novità principale sono le porte Thunderbolt 5 sul retro. Inoltre, la terza USB-C supporta ora Thunderbolt 4. Inoltre, Lenovo ha scelto di riportare l'Ethernet RJ45, che supporta velocità di 2,5 GBit. Il ThinkPad P16 ora si ricarica tramite USB-C.


Lettore di schede SD
| SD Card Reader | |
| average JPG Copy Test (av. of 3 runs) | |
| Lenovo ThinkPad T16g Gen 3 RTX 5080 (ADATA SD8.0 Express 512 GB) | |
| Lenovo ThinkPad T16g Gen 3 RTX 5080 (Angelbird AV Pro V60) | |
| Media della classe Workstation (49.6 - 681, n=14, ultimi 2 anni) | |
| HP ZBook Fury 16 G11 (Toshiba Exceria Pro SDXC 64 GB UHS-II) | |
| Lenovo ThinkPad P1 Gen 8 (Toshiba Exceria Pro SDXC 64 GB UHS-II) | |
| Lenovo ThinkPad P16 Gen 3 (AV Pro V60) | |
| Dell Pro Max 16 Plus (Toshiba Exceria Pro SDXC 64 GB UHS-II) | |
| Lenovo ThinkPad P16 G2 21FA000FGE | |
| maximum AS SSD Seq Read Test (1GB) | |
| Lenovo ThinkPad T16g Gen 3 RTX 5080 (ADATA SD8.0 Express 512 GB) | |
| Lenovo ThinkPad T16g Gen 3 RTX 5080 (Angelbird AV Pro V60) | |
| Media della classe Workstation (87.6 - 1455, n=14, ultimi 2 anni) | |
| Lenovo ThinkPad P16 Gen 3 (AV Pro V60) | |
| HP ZBook Fury 16 G11 (Toshiba Exceria Pro SDXC 64 GB UHS-II) | |
| Dell Pro Max 16 Plus (Toshiba Exceria Pro SDXC 64 GB UHS-II) | |
| Lenovo ThinkPad P1 Gen 8 (Toshiba Exceria Pro SDXC 64 GB UHS-II) | |
| Lenovo ThinkPad P16 G2 21FA000FGE | |
Comunicazione


Manutenzione


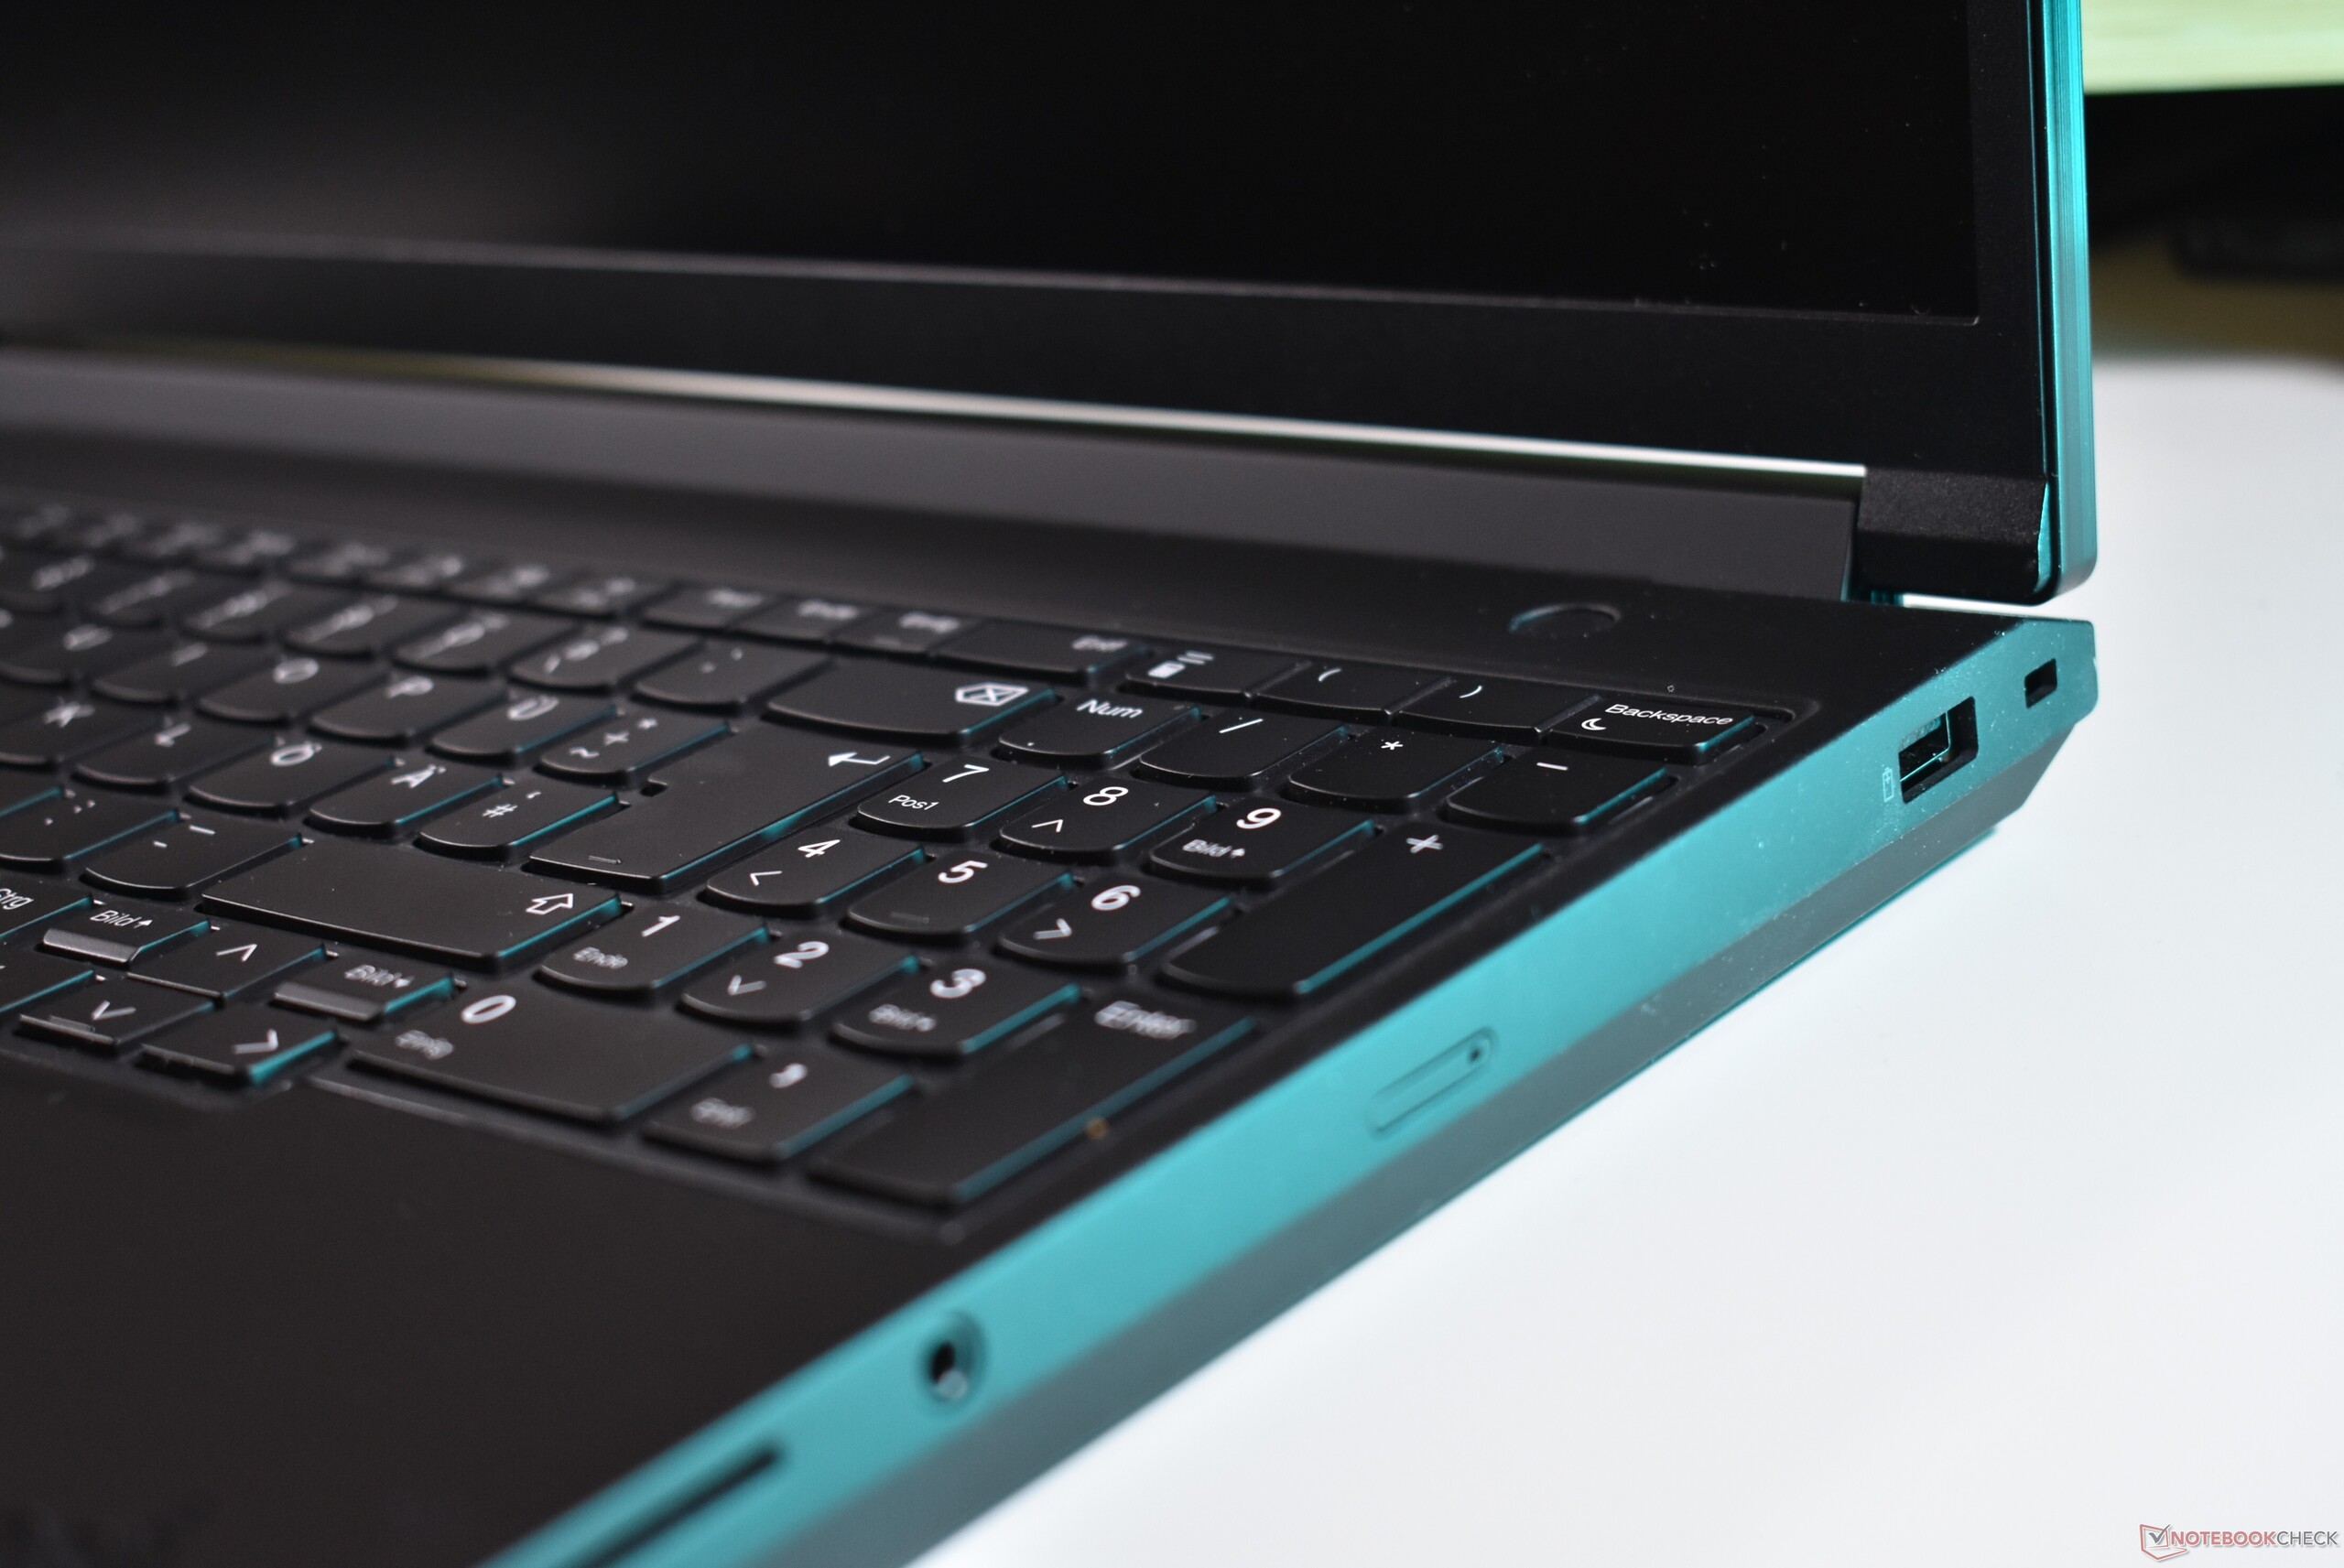
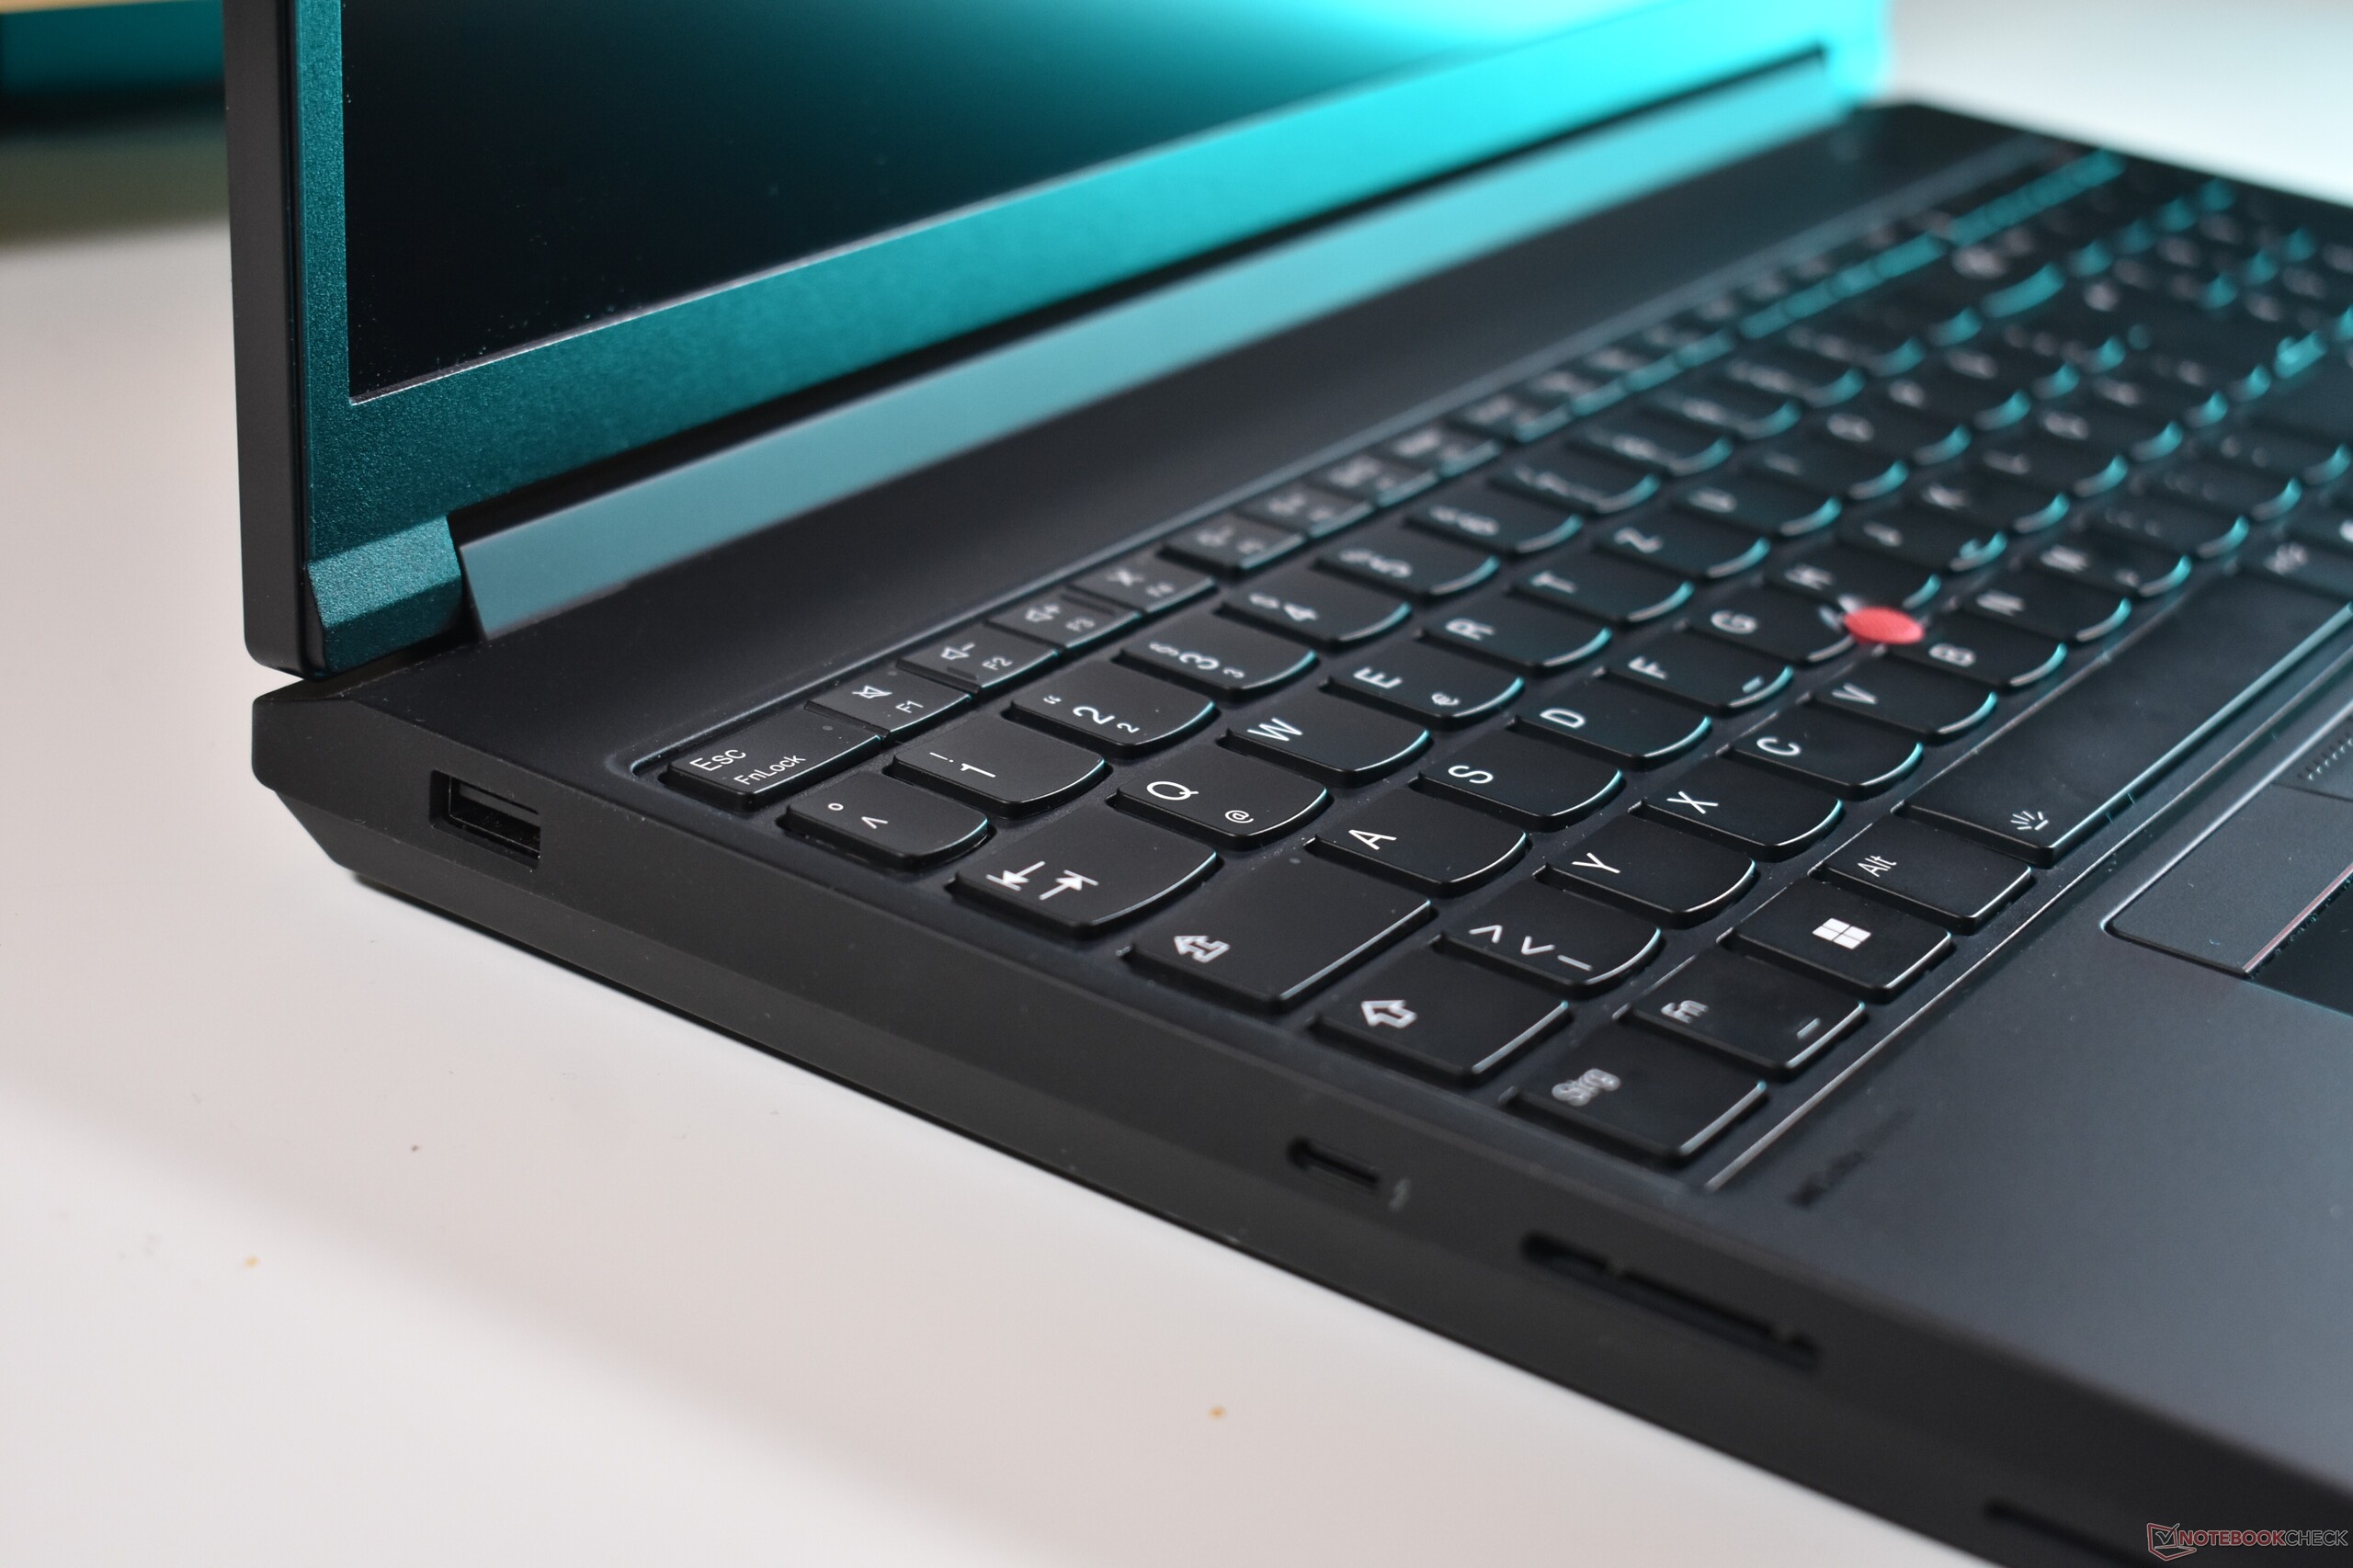
Dispositivi di ingresso
Tastiera
Mentre il resto del portatile cambia, la tastiera retroilluminata wite-LED a due livelli rimane la stessa di prima. I tasti arrotondati e leggermente concavi offrono un appoggio morbido ma definito, con una buona distanza di corsa di 1,5 mm. Il layout è spazioso e, con il tastierino numerico dedicato, è ideale per la scrittura dei numeri. Nel complesso, l'utilizzo della tastiera è un piacere e si colloca tra le migliori dell'attuale linea ThinkPad.

Touchpad
A parte il cambio di colore da argento a nero, il touchpad rimane identico a quello del precedente ThinkPad P16 G2. La superficie in mylar del clickpad meccanico a immersione misura 11,5 x 6,5 cm, ha un bel click smorzato e, sebbene non sia piacevole come il vetro, la superficie è liscia, il che la rende molto utilizzabile. Altrettanto valido, se non addirittura migliore, è il ThinkPad TrackPoint con i suoi tre pulsanti dedicati.


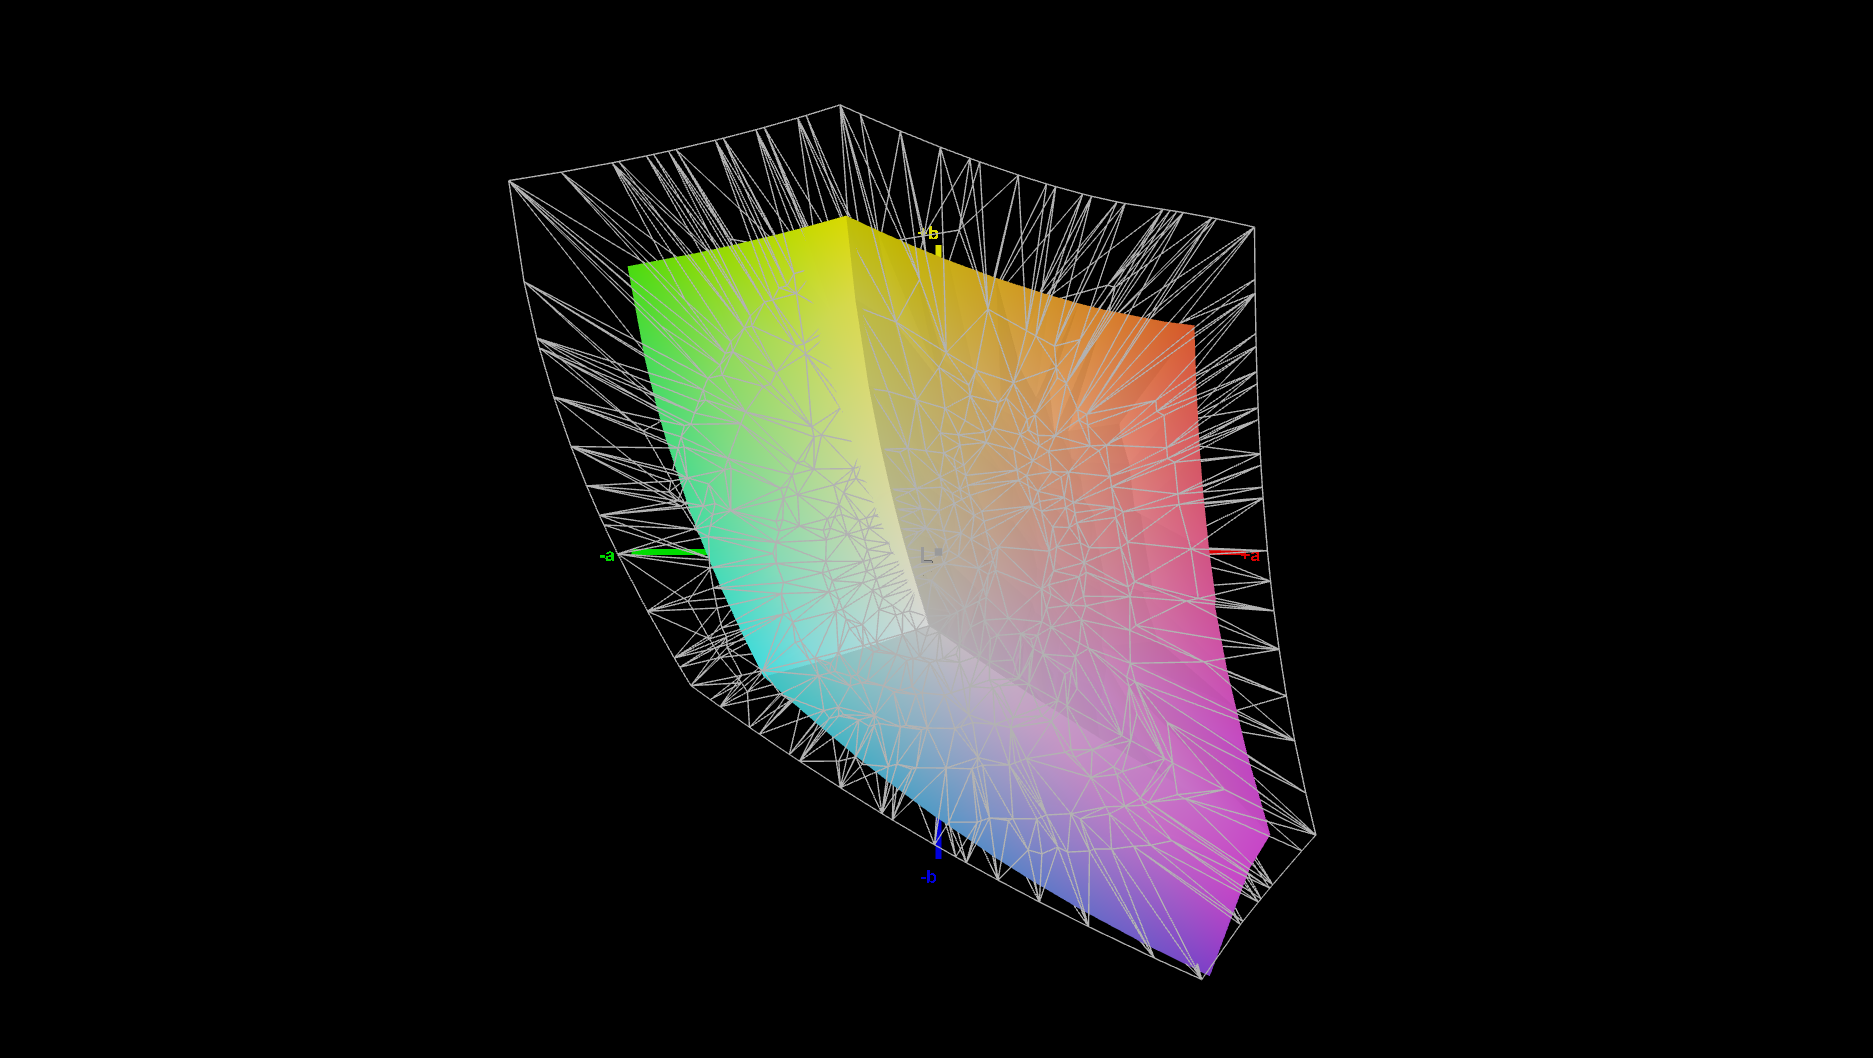
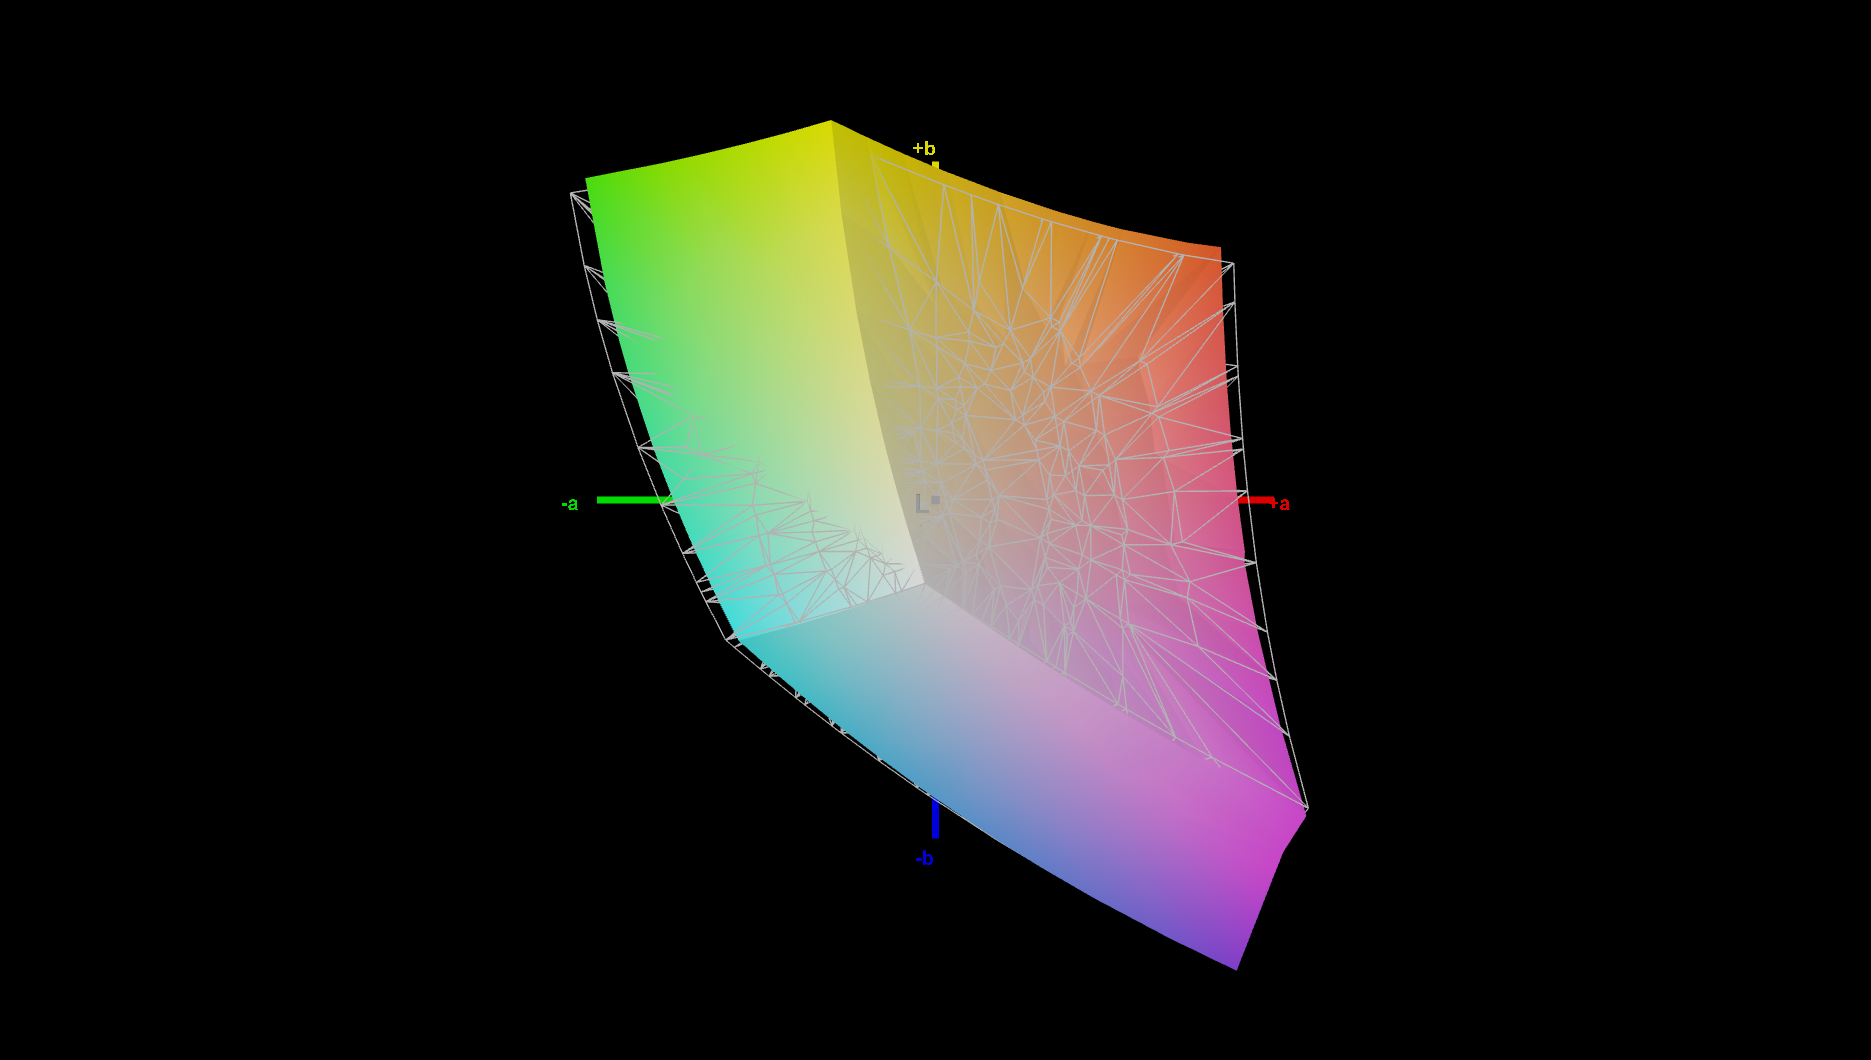
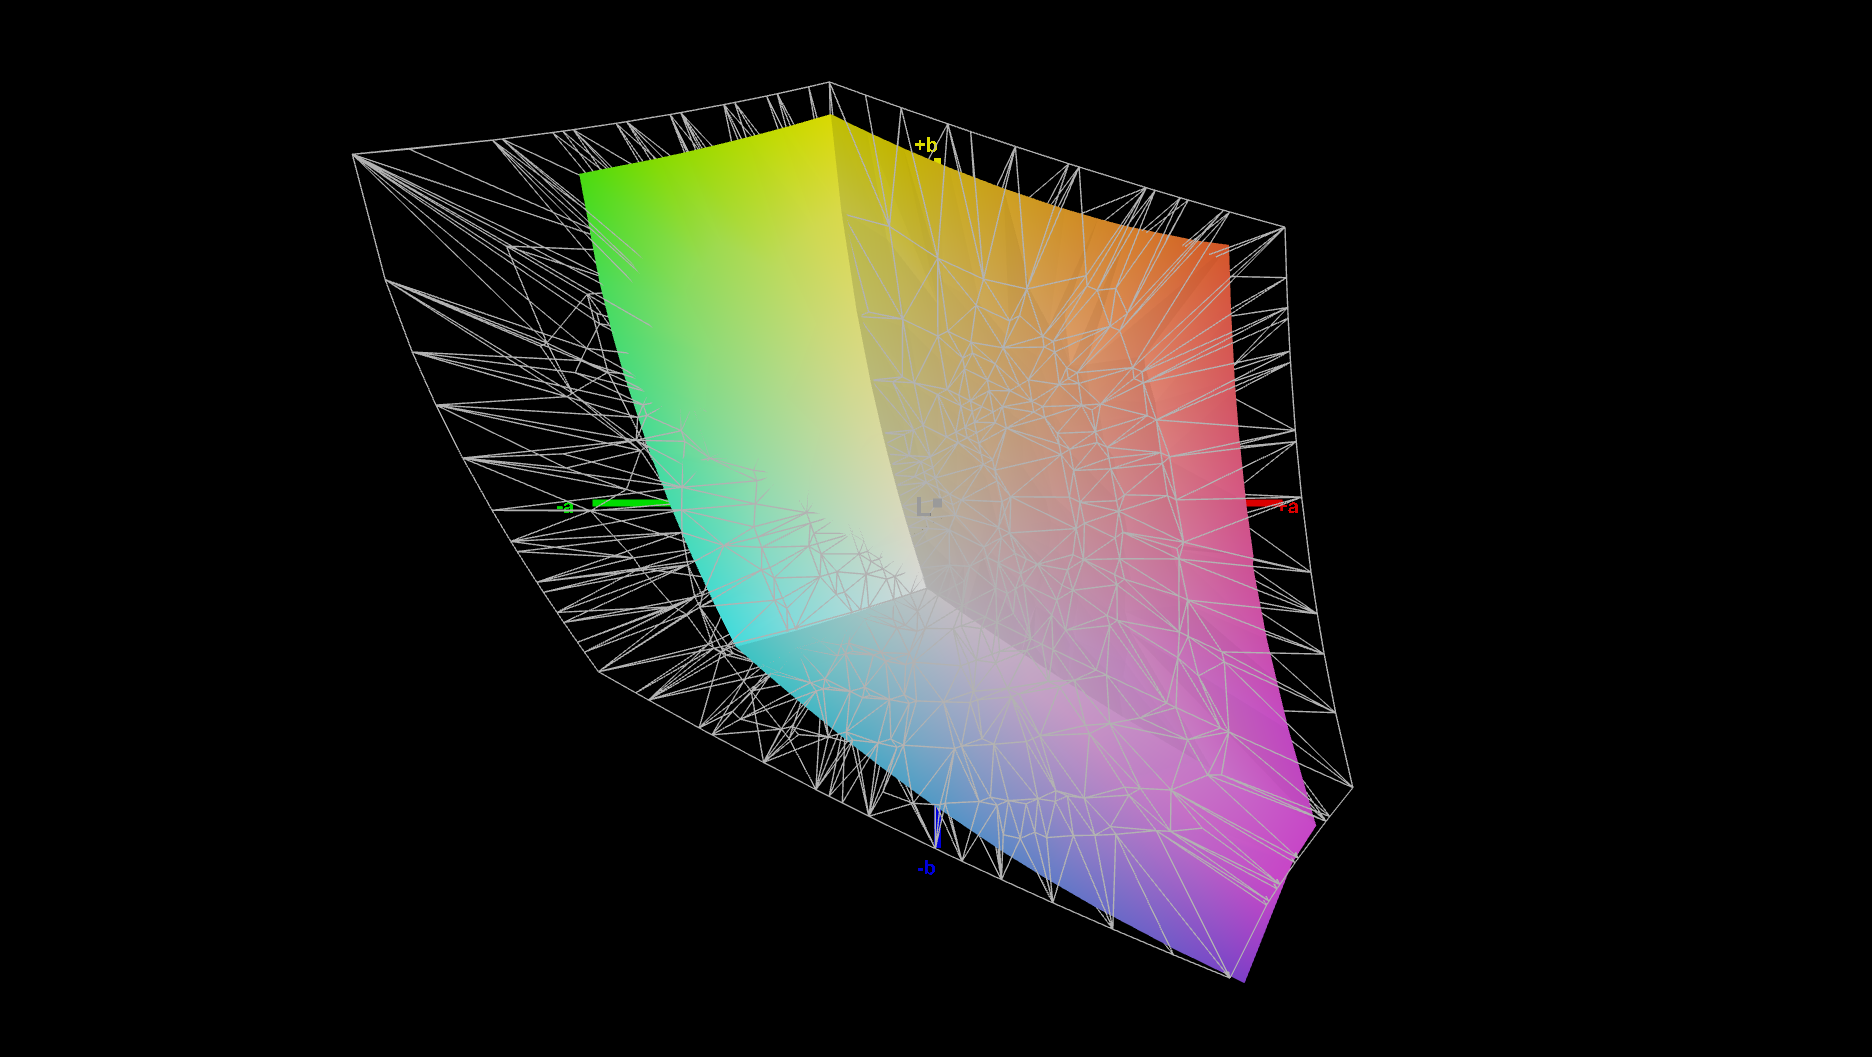
Display
Gli acquirenti del Lenovo ThinkPad P16 Gen 3 possono scegliere tra tre diverse opzioni di schermo:
- WUXGA (1.920 x 1.200), IPS, 500 cd/m², 100 % sRGB, opaco, 60 Hz
- 3.2K (3.200 x 2.000), Tandem OLED, 600 cd/m² (SDR) / 1500 cd/m² di picco (HDR), 100 % DCI P3, semi lucido, 40 - 120 Hz VRR, Dolby Vision
- 4K-WQUXGA (3.840 x 2.400), IPS, 800 cd/m², 100 % DCI P3, opaco, Dolby Vision, 60 Hz
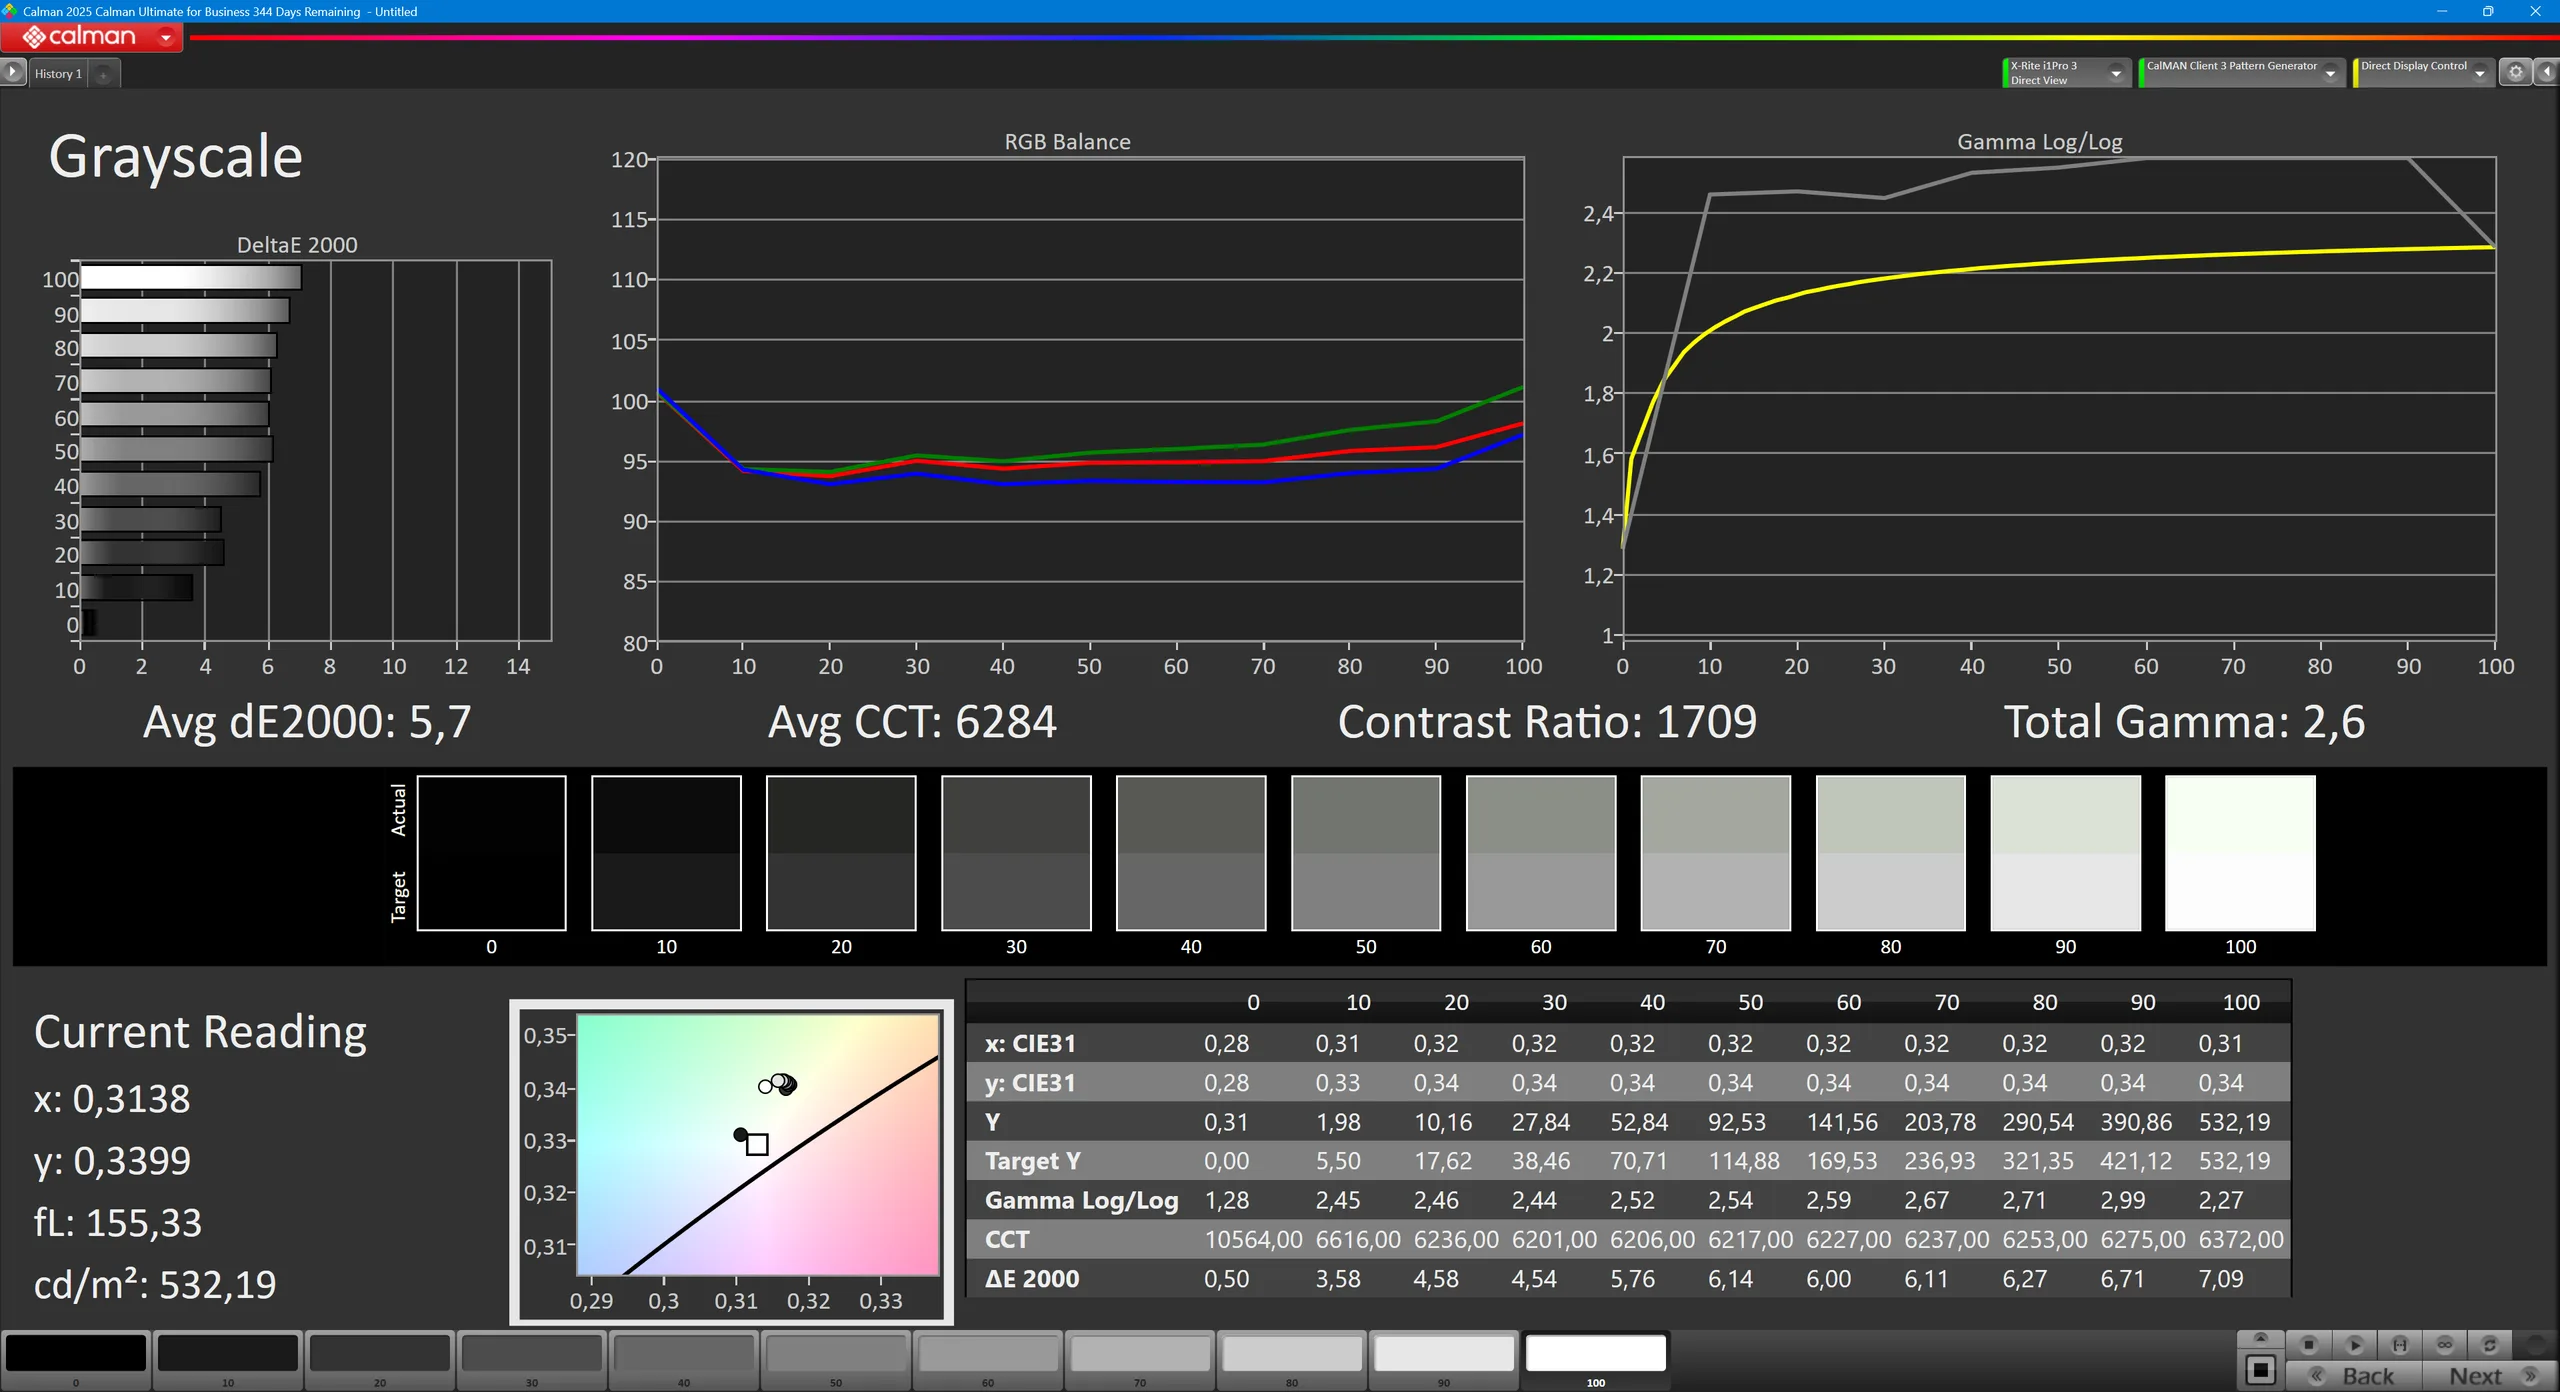
L'opzione dello schermo di base del nostro campione recensito è adatta al lavoro d'ufficio e ad altre attività in cui non è necessaria un'ampia gamma di colori. Per l'uso multimediale, non è il massimo, anche a causa della lenta frequenza di aggiornamento di 60 Hz. Almeno non c'è PWM. Vorremmo che la risoluzione fosse più alta, dato che WUXGA non è poi così alta per una workstation da 16 pollici così costosa.
| |||||||||||||||||||||||||
Distribuzione della luminosità: 88 %
Al centro con la batteria: 532 cd/m²
Contrasto: 1716:1 (Nero: 0.31 cd/m²)
ΔE ColorChecker Calman: 4.4 | ∀{0.5-29.43 Ø4.74}
calibrated: 1.1
ΔE Greyscale Calman: 5.7 | ∀{0.09-98 Ø4.99}
66.6% AdobeRGB 1998 (Argyll 3D)
95.2% sRGB (Argyll 3D)
64.9% Display P3 (Argyll 3D)
Gamma: 2.6
CCT: 6284 K
| Lenovo ThinkPad P16 Gen 3 N160JCA-GT1, IPS LED, 1920x1200, 16", 60 Hz | Lenovo ThinkPad P16 G2 21FA000FGE MNG007DA1-9, IPS LED, 2560x1600, 16", 165 Hz | Dell Pro Max 16 Plus Samsung 160HC01, OLED, 3840x2400, 16", 120 Hz | HP ZBook Fury 16 G11 AUO87A8, IPS, 3840x2400, 16", 120 Hz | Lenovo ThinkPad T16g Gen 3 RTX 5080 ATNA60KA02-0, OLED, 3200x2000, 16", 120 Hz | Lenovo ThinkPad P1 Gen 8 Samsung ATNA60KA02-0, Tandem OLED, 3200x2000, 16", 120 Hz | |
|---|---|---|---|---|---|---|
| Display | 8% | 29% | 29% | 30% | 34% | |
| Display P3 Coverage (%) | 64.9 | 71 9% | 97.3 50% | 98.4 52% | 98.8 52% | 98.8 52% |
| sRGB Coverage (%) | 95.2 | 99.2 4% | 100 5% | 99.9 5% | 100 5% | 100 5% |
| AdobeRGB 1998 Coverage (%) | 66.6 | 73.2 10% | 88.8 33% | 86 29% | 88.9 33% | 97.5 46% |
| Response Times | 52% | 97% | 59% | 97% | 97% | |
| Response Time Grey 50% / Grey 80% * (ms) | 29.8 ? | 12.8 ? 57% | 0.63 ? 98% | 11.4 ? 62% | 1.51 ? 95% | 0.57 ? 98% |
| Response Time Black / White * (ms) | 18.7 ? | 10.1 ? 46% | 0.89 ? 95% | 8.4 ? 55% | 0.44 ? 98% | 0.73 ? 96% |
| PWM Frequency (Hz) | 479.9 ? | 1200 ? | 1199 | |||
| PWM Amplitude * (%) | 28 | 22 | 18 | |||
| Screen | -5% | 29% | -1% | 43% | 37% | |
| Brightness middle (cd/m²) | 532 | 510 -4% | 530.9 0% | 457.6 -14% | 585 10% | 561.8 6% |
| Brightness (cd/m²) | 497 | 517 4% | 540 9% | 466 -6% | 590 19% | 566 14% |
| Brightness Distribution (%) | 88 | 89 1% | 95 8% | 83 -6% | 98 11% | 99 13% |
| Black Level * (cd/m²) | 0.31 | 0.37 -19% | 0.43 -39% | |||
| Contrast (:1) | 1716 | 1378 -20% | 1064 -38% | |||
| Colorchecker dE 2000 * | 4.4 | 2.6 41% | 2.42 45% | 2.78 37% | 0.9 80% | 1.29 71% |
| Colorchecker dE 2000 max. * | 6.9 | 5.2 25% | 5.76 17% | 5.53 20% | 2.7 61% | 2.96 57% |
| Colorchecker dE 2000 calibrated * | 1.1 | 2.3 -109% | 0.7 36% | 1.37 -25% | 0.81 26% | |
| Greyscale dE 2000 * | 5.7 | 3.6 37% | 0.8 86% | 2 65% | 1.4 75% | 1.4 75% |
| Gamma | 2.6 85% | 2.26 97% | 2.23 99% | 2.28 96% | 2.18 101% | 2.23 99% |
| CCT | 6284 103% | 5969 109% | 6488 100% | 6806 96% | 6442 101% | 6319 103% |
| Media totale (Programma / Settaggio) | 18% /
6% | 52% /
40% | 29% /
14% | 57% /
49% | 56% /
47% |
* ... Meglio usare valori piccoli


Tempi di risposta del Display
| ↔ Tempi di risposta dal Nero al Bianco | ||
|---|---|---|
| 18.7 ms ... aumenta ↗ e diminuisce ↘ combinato | ↗ 10.4 ms Incremento |  |
| ↘ 8.3 ms Calo | ||
| Lo schermo mostra buoni tempi di risposta durante i nostri tests, ma potrebbe essere troppo lento per i gamers competitivi. In confronto, tutti i dispositivi di test variano da 0.1 (minimo) a 240 (massimo) ms. » 41 % di tutti i dispositivi è migliore. Questo significa che i tempi di risposta rilevati sono simili alla media di tutti i dispositivi testati (20 ms). | ||
| ↔ Tempo di risposta dal 50% Grigio all'80% Grigio | ||
| 29.8 ms ... aumenta ↗ e diminuisce ↘ combinato | ↗ 13.7 ms Incremento |  |
| ↘ 16.1 ms Calo | ||
| Lo schermo mostra tempi di risposta relativamente lenti nei nostri tests e potrebbe essere troppo lento per i gamers. In confronto, tutti i dispositivi di test variano da 0.165 (minimo) a 636 (massimo) ms. » 40 % di tutti i dispositivi è migliore. Questo significa che i tempi di risposta rilevati sono simili alla media di tutti i dispositivi testati (31.2 ms). | ||
Sfarfallio dello schermo / PWM (Pulse-Width Modulation)
| flickering dello schermo / PWM non rilevato |  | ||
In confronto: 52 % di tutti i dispositivi testati non utilizza PWM per ridurre la luminosita' del display. Se è rilevato PWM, una media di 7901 (minimo: 5 - massimo: 343500) Hz è stata rilevata. | |||


Prestazioni
Condizioni del test
- Migliore durata della batteria: PL1 45 W / PL2 160 W
- Bilanciato: PL1 100 W / PL2 160 W
- Migliori prestazioni: PL1 110 W /PL2 160 W
Tutti i nostri benchmark sono stati eseguiti in modalità "Prestazioni migliori".
Processore
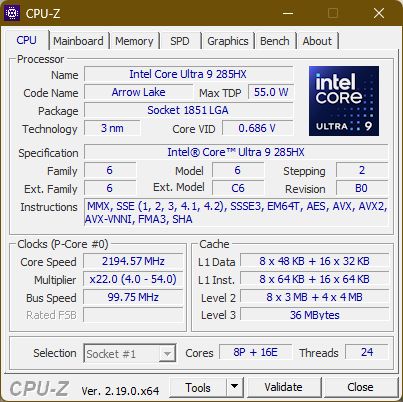
Il Intel Core Ultra 285HX è un potente processore "Arrow Lake", basato sulla più recente serie di CPU desktop di Intel. Con un totale di 24 core, otto dei quali possono raggiungere i 5,5 GHz, questa è una delle CPU Intel più veloci per i computer portatili. Ulteriori confronti con altri processori sono possibili con il nostro elenco di CPU.
In media, il ThinkPad P16 Gen 3 è più veloce del 43% rispetto al ThinkPad P16 Gen 2 per quanto riguarda le prestazioni del processore. Nonostante questo grande passo avanti nelle prestazioni, la CPU ha prestazioni leggermente inferiori alla media per questo chip.
Quando il portatile funziona a batteria, le prestazioni si riducono del 26 percento, a 27728 punti nel test Cinebench R23 Multicore.
Cinebench R15 Multi Loop
Cinebench R23: Multi Core | Single Core
Cinebench R20: CPU (Multi Core) | CPU (Single Core)
Cinebench R15: CPU Multi 64Bit | CPU Single 64Bit
Blender: v2.79 BMW27 CPU
7-Zip 18.03: 7z b 4 | 7z b 4 -mmt1
Geekbench 6.6: Multi-Core | Single-Core
Geekbench 5.5: Multi-Core | Single-Core
HWBOT x265 Benchmark v2.2: 4k Preset
LibreOffice : 20 Documents To PDF
R Benchmark 2.5: Overall mean
| CPU Performance rating | |
| Media Intel Core Ultra 9 285HX | |
| Lenovo ThinkPad T16g Gen 3 RTX 5080 | |
| Dell Pro Max 16 Plus | |
| Lenovo ThinkPad P16 Gen 3 | |
| HP ZBook Fury 16 G11 | |
| Media della classe Workstation | |
| Lenovo ThinkPad P1 Gen 8 | |
| Lenovo ThinkPad P16 G2 21FA000FGE -2! | |
| Cinebench R23 / Multi Core | |
| Lenovo ThinkPad T16g Gen 3 RTX 5080 | |
| Media Intel Core Ultra 9 285HX (34955 - 40117, n=6) | |
| Dell Pro Max 16 Plus | |
| Lenovo ThinkPad P16 Gen 3 | |
| HP ZBook Fury 16 G11 | |
| Media della classe Workstation (14055 - 38520, n=26, ultimi 2 anni) | |
| Lenovo ThinkPad P1 Gen 8 | |
| Lenovo ThinkPad P16 G2 21FA000FGE | |
| Cinebench R23 / Single Core | |
| Lenovo ThinkPad P16 Gen 3 | |
| Lenovo ThinkPad T16g Gen 3 RTX 5080 | |
| Media Intel Core Ultra 9 285HX (2057 - 2303, n=6) | |
| HP ZBook Fury 16 G11 | |
| Dell Pro Max 16 Plus | |
| Lenovo ThinkPad P1 Gen 8 | |
| Media della classe Workstation (1712 - 2228, n=26, ultimi 2 anni) | |
| Lenovo ThinkPad P16 G2 21FA000FGE | |
| Cinebench R20 / CPU (Multi Core) | |
| Lenovo ThinkPad T16g Gen 3 RTX 5080 | |
| Media Intel Core Ultra 9 285HX (13152 - 15751, n=6) | |
| Dell Pro Max 16 Plus | |
| Lenovo ThinkPad P16 Gen 3 | |
| HP ZBook Fury 16 G11 | |
| Media della classe Workstation (5471 - 15043, n=26, ultimi 2 anni) | |
| Lenovo ThinkPad P1 Gen 8 | |
| Lenovo ThinkPad P16 G2 21FA000FGE | |
| Cinebench R20 / CPU (Single Core) | |
| Lenovo ThinkPad P16 Gen 3 | |
| Lenovo ThinkPad T16g Gen 3 RTX 5080 | |
| Media Intel Core Ultra 9 285HX (799 - 884, n=6) | |
| HP ZBook Fury 16 G11 | |
| Dell Pro Max 16 Plus | |
| Media della classe Workstation (671 - 857, n=26, ultimi 2 anni) | |
| Lenovo ThinkPad P1 Gen 8 | |
| Lenovo ThinkPad P16 G2 21FA000FGE | |
| Cinebench R15 / CPU Multi 64Bit | |
| Lenovo ThinkPad T16g Gen 3 RTX 5080 | |
| Media Intel Core Ultra 9 285HX (5427 - 6232, n=6) | |
| Lenovo ThinkPad P16 Gen 3 | |
| Dell Pro Max 16 Plus | |
| HP ZBook Fury 16 G11 | |
| Media della classe Workstation (2489 - 5810, n=26, ultimi 2 anni) | |
| Lenovo ThinkPad P1 Gen 8 | |
| Lenovo ThinkPad P16 G2 21FA000FGE | |
| Cinebench R15 / CPU Single 64Bit | |
| Lenovo ThinkPad T16g Gen 3 RTX 5080 | |
| Media Intel Core Ultra 9 285HX (307 - 340, n=6) | |
| Lenovo ThinkPad P16 Gen 3 | |
| Dell Pro Max 16 Plus | |
| Lenovo ThinkPad P1 Gen 8 | |
| HP ZBook Fury 16 G11 | |
| Media della classe Workstation (191.4 - 328, n=26, ultimi 2 anni) | |
| Lenovo ThinkPad P16 G2 21FA000FGE | |
| Blender / v2.79 BMW27 CPU | |
| Lenovo ThinkPad P1 Gen 8 | |
| Lenovo ThinkPad P16 G2 21FA000FGE | |
| Media della classe Workstation (91 - 261, n=26, ultimi 2 anni) | |
| HP ZBook Fury 16 G11 | |
| Lenovo ThinkPad P16 Gen 3 | |
| Dell Pro Max 16 Plus | |
| Lenovo ThinkPad T16g Gen 3 RTX 5080 | |
| Media Intel Core Ultra 9 285HX (83 - 103, n=6) | |
| 7-Zip 18.03 / 7z b 4 | |
| Media Intel Core Ultra 9 285HX (99260 - 128778, n=6) | |
| Dell Pro Max 16 Plus | |
| Lenovo ThinkPad T16g Gen 3 RTX 5080 | |
| HP ZBook Fury 16 G11 | |
| Lenovo ThinkPad P16 Gen 3 | |
| Media della classe Workstation (54741 - 116969, n=26, ultimi 2 anni) | |
| Lenovo ThinkPad P16 G2 21FA000FGE | |
| Lenovo ThinkPad P1 Gen 8 | |
| 7-Zip 18.03 / 7z b 4 -mmt1 | |
| HP ZBook Fury 16 G11 | |
| Lenovo ThinkPad T16g Gen 3 RTX 5080 | |
| Media Intel Core Ultra 9 285HX (6422 - 6822, n=6) | |
| Dell Pro Max 16 Plus | |
| Lenovo ThinkPad P16 Gen 3 | |
| Lenovo ThinkPad P16 G2 21FA000FGE | |
| Media della classe Workstation (4981 - 6960, n=26, ultimi 2 anni) | |
| Lenovo ThinkPad P1 Gen 8 | |
| Geekbench 6.6 / Multi-Core | |
| Dell Pro Max 16 Plus | |
| Media Intel Core Ultra 9 285HX (18212 - 22104, n=6) | |
| Lenovo ThinkPad T16g Gen 3 RTX 5080 | |
| Lenovo ThinkPad P16 Gen 3 | |
| Lenovo ThinkPad P1 Gen 8 | |
| Media della classe Workstation (12196 - 20887, n=26, ultimi 2 anni) | |
| HP ZBook Fury 16 G11 | |
| Geekbench 6.6 / Single-Core | |
| Lenovo ThinkPad T16g Gen 3 RTX 5080 | |
| Media Intel Core Ultra 9 285HX (2907 - 3088, n=6) | |
| Lenovo ThinkPad P16 Gen 3 | |
| HP ZBook Fury 16 G11 | |
| Dell Pro Max 16 Plus | |
| Lenovo ThinkPad P1 Gen 8 | |
| Media della classe Workstation (2389 - 3065, n=26, ultimi 2 anni) | |
| Geekbench 5.5 / Multi-Core | |
| Dell Pro Max 16 Plus | |
| Media Intel Core Ultra 9 285HX (18992 - 27010, n=6) | |
| Lenovo ThinkPad T16g Gen 3 RTX 5080 | |
| Lenovo ThinkPad P16 Gen 3 | |
| HP ZBook Fury 16 G11 | |
| Media della classe Workstation (11542 - 25554, n=26, ultimi 2 anni) | |
| Lenovo ThinkPad P1 Gen 8 | |
| Lenovo ThinkPad P16 G2 21FA000FGE | |
| Geekbench 5.5 / Single-Core | |
| Lenovo ThinkPad T16g Gen 3 RTX 5080 | |
| Media Intel Core Ultra 9 285HX (2121 - 2232, n=6) | |
| Lenovo ThinkPad P16 Gen 3 | |
| Dell Pro Max 16 Plus | |
| HP ZBook Fury 16 G11 | |
| Media della classe Workstation (1781 - 2183, n=26, ultimi 2 anni) | |
| Lenovo ThinkPad P1 Gen 8 | |
| Lenovo ThinkPad P16 G2 21FA000FGE | |
| HWBOT x265 Benchmark v2.2 / 4k Preset | |
| Media Intel Core Ultra 9 285HX (35.3 - 44.3, n=6) | |
| Lenovo ThinkPad T16g Gen 3 RTX 5080 | |
| Dell Pro Max 16 Plus | |
| Lenovo ThinkPad P16 Gen 3 | |
| HP ZBook Fury 16 G11 | |
| Lenovo ThinkPad P1 Gen 8 | |
| Media della classe Workstation (14.4 - 40.5, n=26, ultimi 2 anni) | |
| Lenovo ThinkPad P16 G2 21FA000FGE | |
| LibreOffice / 20 Documents To PDF | |
| Lenovo ThinkPad P16 G2 21FA000FGE | |
| HP ZBook Fury 16 G11 | |
| Media della classe Workstation (37.1 - 74.7, n=26, ultimi 2 anni) | |
| Lenovo ThinkPad T16g Gen 3 RTX 5080 | |
| Media Intel Core Ultra 9 285HX (38 - 49.1, n=6) | |
| Dell Pro Max 16 Plus | |
| Lenovo ThinkPad P16 Gen 3 | |
| Lenovo ThinkPad P1 Gen 8 | |
| R Benchmark 2.5 / Overall mean | |
| Lenovo ThinkPad P16 G2 21FA000FGE | |
| Media della classe Workstation (0.3825 - 0.603, n=26, ultimi 2 anni) | |
| Lenovo ThinkPad P1 Gen 8 | |
| Dell Pro Max 16 Plus | |
| Media Intel Core Ultra 9 285HX (0.4012 - 0.4444, n=6) | |
| Lenovo ThinkPad P16 Gen 3 | |
| Lenovo ThinkPad T16g Gen 3 RTX 5080 | |
| HP ZBook Fury 16 G11 | |
* ... Meglio usare valori piccoli
AIDA64: FP32 Ray-Trace | FPU Julia | CPU SHA3 | CPU Queen | FPU SinJulia | FPU Mandel | CPU AES | CPU ZLib | FP64 Ray-Trace | CPU PhotoWorxx
| Performance rating | |
| Media Intel Core Ultra 9 285HX | |
| Lenovo ThinkPad T16g Gen 3 RTX 5080 | |
| Dell Pro Max 16 Plus | |
| Lenovo ThinkPad P16 Gen 3 | |
| Media della classe Workstation | |
| HP ZBook Fury 16 G11 | |
| Lenovo ThinkPad P1 Gen 8 | |
| Lenovo ThinkPad P16 G2 21FA000FGE | |
| AIDA64 / FP32 Ray-Trace | |
| Lenovo ThinkPad T16g Gen 3 RTX 5080 (v6.92.6600) | |
| Media Intel Core Ultra 9 285HX (29076 - 42341, n=6) | |
| Dell Pro Max 16 Plus (v6.92.6600) | |
| Lenovo ThinkPad P16 Gen 3 (v6.92.6600) | |
| Media della classe Workstation (10658 - 61611, n=26, ultimi 2 anni) | |
| Lenovo ThinkPad P1 Gen 8 (v6.92.6600) | |
| HP ZBook Fury 16 G11 (v6.92.6600) | |
| Lenovo ThinkPad P16 G2 21FA000FGE (v6.75.6100) | |
| AIDA64 / FPU Julia | |
| Media Intel Core Ultra 9 285HX (161276 - 210885, n=6) | |
| Lenovo ThinkPad T16g Gen 3 RTX 5080 (v6.92.6600) | |
| Lenovo ThinkPad P16 Gen 3 (v6.92.6600) | |
| Dell Pro Max 16 Plus (v6.92.6600) | |
| Media della classe Workstation (56664 - 186971, n=26, ultimi 2 anni) | |
| Lenovo ThinkPad P1 Gen 8 (v6.92.6600) | |
| HP ZBook Fury 16 G11 (v6.92.6600) | |
| Lenovo ThinkPad P16 G2 21FA000FGE (v6.75.6100) | |
| AIDA64 / CPU SHA3 | |
| Lenovo ThinkPad T16g Gen 3 RTX 5080 (v6.92.6600) | |
| Media Intel Core Ultra 9 285HX (7757 - 9815, n=6) | |
| Lenovo ThinkPad P16 Gen 3 (v6.92.6600) | |
| Dell Pro Max 16 Plus (v6.92.6600) | |
| Media della classe Workstation (2608 - 8975, n=26, ultimi 2 anni) | |
| Lenovo ThinkPad P1 Gen 8 (v6.92.6600) | |
| HP ZBook Fury 16 G11 (v6.92.6600) | |
| Lenovo ThinkPad P16 G2 21FA000FGE (v6.75.6100) | |
| AIDA64 / CPU Queen | |
| Lenovo ThinkPad T16g Gen 3 RTX 5080 (v6.92.6600) | |
| HP ZBook Fury 16 G11 (v6.92.6600) | |
| Lenovo ThinkPad P16 Gen 3 (v6.92.6600) | |
| Media Intel Core Ultra 9 285HX (134345 - 141681, n=6) | |
| Dell Pro Max 16 Plus (v6.92.6600) | |
| Lenovo ThinkPad P16 G2 21FA000FGE (v6.75.6100) | |
| Media della classe Workstation (60778 - 144411, n=26, ultimi 2 anni) | |
| Lenovo ThinkPad P1 Gen 8 (v6.92.6600) | |
| AIDA64 / FPU SinJulia | |
| Lenovo ThinkPad T16g Gen 3 RTX 5080 (v6.92.6600) | |
| HP ZBook Fury 16 G11 (v6.92.6600) | |
| Media Intel Core Ultra 9 285HX (12559 - 14431, n=6) | |
| Media della classe Workstation (8165 - 29343, n=26, ultimi 2 anni) | |
| Dell Pro Max 16 Plus (v6.92.6600) | |
| Lenovo ThinkPad P16 Gen 3 (v6.92.6600) | |
| Lenovo ThinkPad P16 G2 21FA000FGE (v6.75.6100) | |
| Lenovo ThinkPad P1 Gen 8 (v6.92.6600) | |
| AIDA64 / FPU Mandel | |
| Lenovo ThinkPad T16g Gen 3 RTX 5080 (v6.92.6600) | |
| Media Intel Core Ultra 9 285HX (84053 - 108922, n=6) | |
| Lenovo ThinkPad P16 Gen 3 (v6.92.6600) | |
| Dell Pro Max 16 Plus (v6.92.6600) | |
| Media della classe Workstation (27301 - 98153, n=26, ultimi 2 anni) | |
| Lenovo ThinkPad P1 Gen 8 (v6.92.6600) | |
| HP ZBook Fury 16 G11 (v6.92.6600) | |
| Lenovo ThinkPad P16 G2 21FA000FGE (v6.75.6100) | |
| AIDA64 / CPU AES | |
| Lenovo ThinkPad T16g Gen 3 RTX 5080 (v6.92.6600) | |
| Media Intel Core Ultra 9 285HX (119553 - 134195, n=6) | |
| Lenovo ThinkPad P16 Gen 3 (v6.92.6600) | |
| Dell Pro Max 16 Plus (v6.92.6600) | |
| Media della classe Workstation (56077 - 187841, n=26, ultimi 2 anni) | |
| HP ZBook Fury 16 G11 (v6.92.6600) | |
| Lenovo ThinkPad P16 G2 21FA000FGE (v6.75.6100) | |
| Lenovo ThinkPad P1 Gen 8 (v6.92.6600) | |
| AIDA64 / CPU ZLib | |
| Lenovo ThinkPad T16g Gen 3 RTX 5080 (v6.92.6600) | |
| Media Intel Core Ultra 9 285HX (1886 - 2267, n=6) | |
| Lenovo ThinkPad P16 Gen 3 (v6.92.6600) | |
| Dell Pro Max 16 Plus (v6.92.6600) | |
| Media della classe Workstation (742 - 2148, n=26, ultimi 2 anni) | |
| HP ZBook Fury 16 G11 (v6.92.6600) | |
| Lenovo ThinkPad P1 Gen 8 (v6.92.6600) | |
| Lenovo ThinkPad P16 G2 21FA000FGE (v6.75.6100) | |
| AIDA64 / FP64 Ray-Trace | |
| Lenovo ThinkPad T16g Gen 3 RTX 5080 (v6.92.6600) | |
| Media Intel Core Ultra 9 285HX (15059 - 22312, n=6) | |
| Dell Pro Max 16 Plus (v6.92.6600) | |
| Lenovo ThinkPad P16 Gen 3 (v6.92.6600) | |
| Media della classe Workstation (5580 - 32891, n=26, ultimi 2 anni) | |
| Lenovo ThinkPad P1 Gen 8 (v6.92.6600) | |
| HP ZBook Fury 16 G11 (v6.92.6600) | |
| Lenovo ThinkPad P16 G2 21FA000FGE (v6.75.6100) | |
| AIDA64 / CPU PhotoWorxx | |
| Dell Pro Max 16 Plus (v6.92.6600) | |
| Lenovo ThinkPad P1 Gen 8 (v6.92.6600) | |
| Media della classe Workstation (37151 - 93684, n=26, ultimi 2 anni) | |
| Media Intel Core Ultra 9 285HX (39232 - 62611, n=6) | |
| Lenovo ThinkPad T16g Gen 3 RTX 5080 (v6.92.6600) | |
| Lenovo ThinkPad P16 Gen 3 (v6.92.6600) | |
| HP ZBook Fury 16 G11 (v6.92.6600) | |
| Lenovo ThinkPad P16 G2 21FA000FGE (v6.75.6100) | |
Prestazioni del sistema
PCMark 10: Score | Essentials | Productivity | Digital Content Creation
CrossMark: Overall | Productivity | Creativity | Responsiveness
WebXPRT 3: Overall
WebXPRT 4: Overall
Mozilla Kraken 1.1: Total
| Performance rating | |
| Lenovo ThinkPad T16g Gen 3 RTX 5080 | |
| Lenovo ThinkPad P16 Gen 3 | |
| Media Intel Core Ultra 9 285HX, NVIDIA RTX PRO 3000 Blackwell Generation Laptop | |
| Dell Pro Max 16 Plus -4! | |
| Lenovo ThinkPad P1 Gen 8 | |
| HP ZBook Fury 16 G11 | |
| Media della classe Workstation | |
| Lenovo ThinkPad P16 G2 21FA000FGE -1! | |
| PCMark 10 / Score | |
| Lenovo ThinkPad T16g Gen 3 RTX 5080 | |
| Lenovo ThinkPad P16 Gen 3 | |
| Media Intel Core Ultra 9 285HX, NVIDIA RTX PRO 3000 Blackwell Generation Laptop (n=1) | |
| Lenovo ThinkPad P1 Gen 8 | |
| Media della classe Workstation (6436 - 10409, n=22, ultimi 2 anni) | |
| HP ZBook Fury 16 G11 | |
| Lenovo ThinkPad P16 G2 21FA000FGE | |
| PCMark 10 / Essentials | |
| Lenovo ThinkPad P16 G2 21FA000FGE | |
| Lenovo ThinkPad P1 Gen 8 | |
| Media della classe Workstation (9622 - 11157, n=22, ultimi 2 anni) | |
| Lenovo ThinkPad P16 Gen 3 | |
| Media Intel Core Ultra 9 285HX, NVIDIA RTX PRO 3000 Blackwell Generation Laptop (n=1) | |
| Lenovo ThinkPad T16g Gen 3 RTX 5080 | |
| HP ZBook Fury 16 G11 | |
| PCMark 10 / Productivity | |
| Lenovo ThinkPad T16g Gen 3 RTX 5080 | |
| Lenovo ThinkPad P16 Gen 3 | |
| Media Intel Core Ultra 9 285HX, NVIDIA RTX PRO 3000 Blackwell Generation Laptop (n=1) | |
| Lenovo ThinkPad P1 Gen 8 | |
| Media della classe Workstation (8789 - 20616, n=22, ultimi 2 anni) | |
| HP ZBook Fury 16 G11 | |
| Lenovo ThinkPad P16 G2 21FA000FGE | |
| PCMark 10 / Digital Content Creation | |
| Lenovo ThinkPad T16g Gen 3 RTX 5080 | |
| Lenovo ThinkPad P16 Gen 3 | |
| Media Intel Core Ultra 9 285HX, NVIDIA RTX PRO 3000 Blackwell Generation Laptop (n=1) | |
| HP ZBook Fury 16 G11 | |
| Lenovo ThinkPad P1 Gen 8 | |
| Media della classe Workstation (7744 - 15631, n=22, ultimi 2 anni) | |
| Lenovo ThinkPad P16 G2 21FA000FGE | |
| CrossMark / Overall | |
| Lenovo ThinkPad T16g Gen 3 RTX 5080 | |
| Dell Pro Max 16 Plus | |
| Lenovo ThinkPad P16 Gen 3 | |
| Media Intel Core Ultra 9 285HX, NVIDIA RTX PRO 3000 Blackwell Generation Laptop (n=1) | |
| HP ZBook Fury 16 G11 | |
| Lenovo ThinkPad P1 Gen 8 | |
| Media della classe Workstation (1307 - 2267, n=25, ultimi 2 anni) | |
| Lenovo ThinkPad P16 G2 21FA000FGE | |
| CrossMark / Productivity | |
| Lenovo ThinkPad T16g Gen 3 RTX 5080 | |
| Lenovo ThinkPad P16 Gen 3 | |
| Media Intel Core Ultra 9 285HX, NVIDIA RTX PRO 3000 Blackwell Generation Laptop (n=1) | |
| Dell Pro Max 16 Plus | |
| HP ZBook Fury 16 G11 | |
| Lenovo ThinkPad P1 Gen 8 | |
| Media della classe Workstation (1130 - 2122, n=25, ultimi 2 anni) | |
| Lenovo ThinkPad P16 G2 21FA000FGE | |
| CrossMark / Creativity | |
| Dell Pro Max 16 Plus | |
| Lenovo ThinkPad T16g Gen 3 RTX 5080 | |
| Lenovo ThinkPad P16 Gen 3 | |
| Media Intel Core Ultra 9 285HX, NVIDIA RTX PRO 3000 Blackwell Generation Laptop (n=1) | |
| HP ZBook Fury 16 G11 | |
| Lenovo ThinkPad P1 Gen 8 | |
| Media della classe Workstation (1657 - 2725, n=25, ultimi 2 anni) | |
| Lenovo ThinkPad P16 G2 21FA000FGE | |
| CrossMark / Responsiveness | |
| Lenovo ThinkPad T16g Gen 3 RTX 5080 | |
| Lenovo ThinkPad P16 Gen 3 | |
| Media Intel Core Ultra 9 285HX, NVIDIA RTX PRO 3000 Blackwell Generation Laptop (n=1) | |
| Dell Pro Max 16 Plus | |
| HP ZBook Fury 16 G11 | |
| Lenovo ThinkPad P1 Gen 8 | |
| Media della classe Workstation (993 - 2096, n=25, ultimi 2 anni) | |
| Lenovo ThinkPad P16 G2 21FA000FGE | |
| WebXPRT 3 / Overall | |
| Lenovo ThinkPad T16g Gen 3 RTX 5080 | |
| Lenovo ThinkPad P16 Gen 3 | |
| Media Intel Core Ultra 9 285HX, NVIDIA RTX PRO 3000 Blackwell Generation Laptop (n=1) | |
| Lenovo ThinkPad P1 Gen 8 | |
| Dell Pro Max 16 Plus | |
| Lenovo ThinkPad P16 G2 21FA000FGE | |
| HP ZBook Fury 16 G11 | |
| Media della classe Workstation (260 - 360, n=26, ultimi 2 anni) | |
| WebXPRT 4 / Overall | |
| Lenovo ThinkPad P16 Gen 3 | |
| Media Intel Core Ultra 9 285HX, NVIDIA RTX PRO 3000 Blackwell Generation Laptop (n=1) | |
| Lenovo ThinkPad T16g Gen 3 RTX 5080 | |
| Dell Pro Max 16 Plus | |
| HP ZBook Fury 16 G11 | |
| Lenovo ThinkPad P1 Gen 8 | |
| Media della classe Workstation (189.2 - 326, n=26, ultimi 2 anni) | |
| Mozilla Kraken 1.1 / Total | |
| Lenovo ThinkPad P16 G2 21FA000FGE | |
| Media della classe Workstation (411 - 538, n=26, ultimi 2 anni) | |
| Lenovo ThinkPad P1 Gen 8 | |
| HP ZBook Fury 16 G11 | |
| Dell Pro Max 16 Plus | |
| Lenovo ThinkPad T16g Gen 3 RTX 5080 | |
| Lenovo ThinkPad P16 Gen 3 | |
| Media Intel Core Ultra 9 285HX, NVIDIA RTX PRO 3000 Blackwell Generation Laptop (n=1) | |
* ... Meglio usare valori piccoli
| PCMark 10 Score | 10149 punti | |
Aiuto | ||
| AIDA64 / Memory Copy | |
| Lenovo ThinkPad P1 Gen 8 | |
| Dell Pro Max 16 Plus | |
| Media della classe Workstation (56003 - 164795, n=26, ultimi 2 anni) | |
| Media Intel Core Ultra 9 285HX (63431 - 93933, n=6) | |
| Lenovo ThinkPad T16g Gen 3 RTX 5080 | |
| Lenovo ThinkPad P16 Gen 3 | |
| HP ZBook Fury 16 G11 | |
| Lenovo ThinkPad P16 G2 21FA000FGE | |
| AIDA64 / Memory Read | |
| Dell Pro Max 16 Plus | |
| Media Intel Core Ultra 9 285HX (67084 - 97565, n=6) | |
| Media della classe Workstation (55795 - 121563, n=26, ultimi 2 anni) | |
| Lenovo ThinkPad P1 Gen 8 | |
| Lenovo ThinkPad P16 Gen 3 | |
| Lenovo ThinkPad T16g Gen 3 RTX 5080 | |
| HP ZBook Fury 16 G11 | |
| Lenovo ThinkPad P16 G2 21FA000FGE | |
| AIDA64 / Memory Write | |
| Dell Pro Max 16 Plus | |
| Media della classe Workstation (55663 - 214520, n=26, ultimi 2 anni) | |
| Media Intel Core Ultra 9 285HX (64112 - 89691, n=6) | |
| Lenovo ThinkPad P16 Gen 3 | |
| Lenovo ThinkPad T16g Gen 3 RTX 5080 | |
| Lenovo ThinkPad P1 Gen 8 | |
| Lenovo ThinkPad P16 G2 21FA000FGE | |
| HP ZBook Fury 16 G11 | |
| AIDA64 / Memory Latency | |
| Lenovo ThinkPad P16 Gen 3 | |
| Lenovo ThinkPad T16g Gen 3 RTX 5080 | |
| Lenovo ThinkPad P1 Gen 8 | |
| Media Intel Core Ultra 9 285HX (104.8 - 151.7, n=6) | |
| Media della classe Workstation (84.5 - 165.2, n=26, ultimi 2 anni) | |
| Dell Pro Max 16 Plus | |
| Lenovo ThinkPad P16 G2 21FA000FGE | |
| HP ZBook Fury 16 G11 | |
* ... Meglio usare valori piccoli
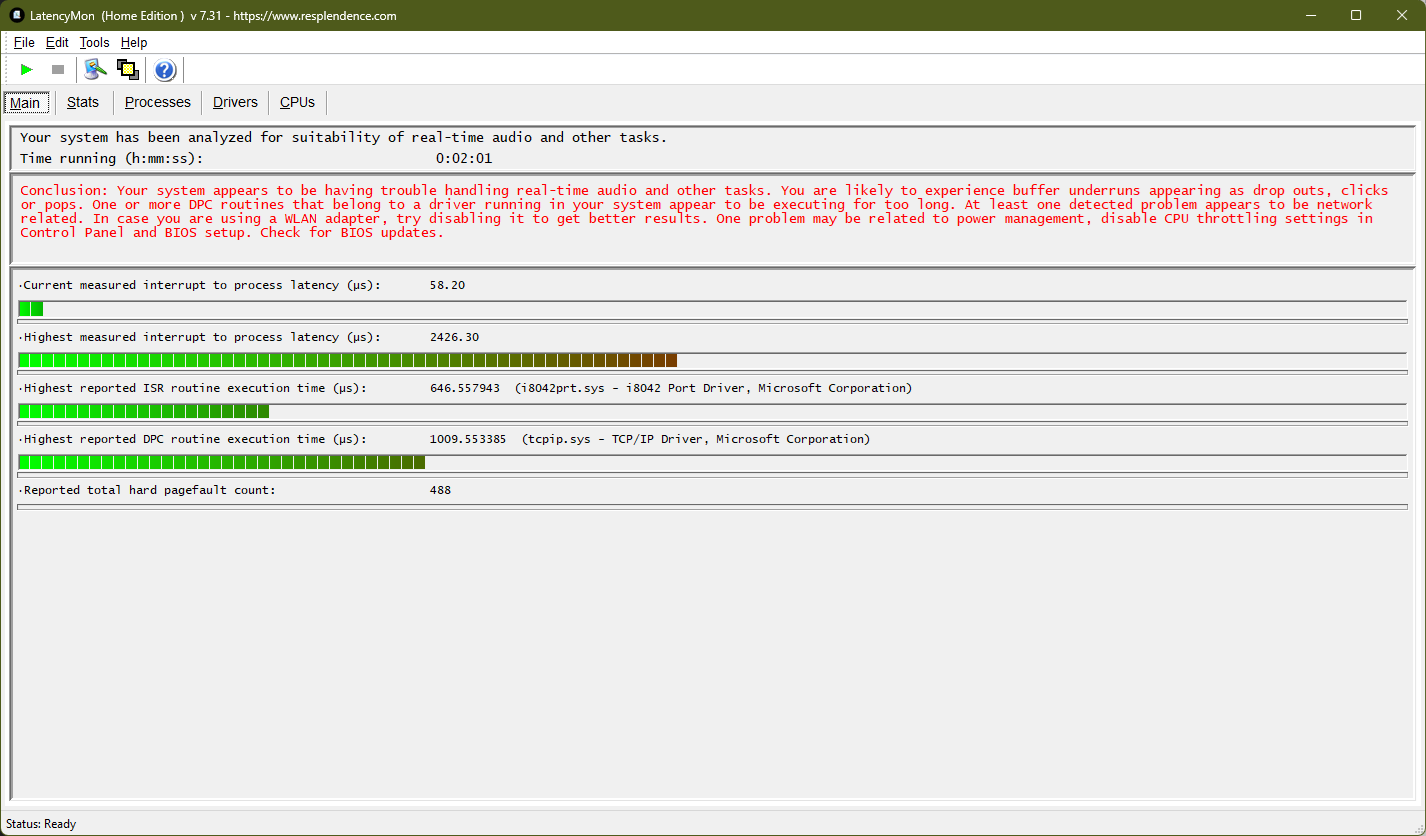
Latenza DPC
| DPC Latencies / LatencyMon - interrupt to process latency (max), Web, Youtube, Prime95 | |
| HP ZBook Fury 16 G11 | |
| Lenovo ThinkPad P1 Gen 8 | |
| Dell Pro Max 16 Plus | |
| Lenovo ThinkPad P16 Gen 3 | |
| Lenovo ThinkPad T16g Gen 3 RTX 5080 | |
| Lenovo ThinkPad P16 G2 21FA000FGE | |
* ... Meglio usare valori piccoli
Dispositivi di archiviazione
Lenovo utilizza un veloce SSD PCIe 5.0 prodotto da Samsung, il PM9E1, che ha una capacità di 2 TB. L'SSD M.2 2280 si comporta bene nei nostri benchmark, superando la maggior parte delle altre workstation. Tuttavia, le prestazioni vengono un po' strozzate sotto carico.
Il ThinkPad dispone di due alloggiamenti NVMe 4.0 M.2 2280 aggiuntivi sotto la tastiera, che consentono di espandere molto l'archiviazione.

* ... Meglio usare valori piccoli
Strozzatura del disco: DiskSpd Lettura in loop, Profondità coda 8
Prestazioni della GPU
Lenovo utilizza la Nvidia RTX Pro 3000 Blackwelluna GPU professionale, certificata ISV, di Nvidia. Questa scheda grafica è paragonabile alla Nvidia GeForce RTX 5070 Ti. Nel ThinkPad P16 Gen 3, Lenovo la limita a 105 W, molto lontana dai 175 W della TGP RTX 5000 Pro di Dell Pro Max 16 Plus. Di conseguenza, le prestazioni ne risentono, con un ritardo di circa il 24% rispetto al concorrente sia nei test professionali (SPECviewperf) che in quelli consumer (3DMark).
In generale, le prestazioni della GPU si riducono quando il P16 Gen 3 funziona a batteria, con appena 37978 punti nel test GPU 3DMark 11, una riduzione del 23 percento.
| 3DMark 06 Standard Score | 63693 punti | |
| 3DMark Vantage P Result | 116321 punti | |
| 3DMark 11 Performance | 39176 punti | |
| 3DMark Cloud Gate Standard Score | 65135 punti | |
| 3DMark Fire Strike Score | 31208 punti | |
| 3DMark Time Spy Score | 14579 punti | |
Aiuto | ||
* ... Meglio usare valori piccoli
Prestazioni di gioco
| Cyberpunk 2077 - 1920x1080 Ultra Preset (FSR off) | |
| Dell Pro Max 16 Plus | |
| Lenovo ThinkPad T16g Gen 3 RTX 5080 | |
| Lenovo ThinkPad P16 Gen 3 | |
| HP ZBook Fury 16 G11 | |
| Lenovo ThinkPad P1 Gen 8 | |
| Media della classe Workstation (19.6 - 152.4, n=26, ultimi 2 anni) | |
| Baldur's Gate 3 - 1920x1080 Ultra Preset AA:T | |
| Dell Pro Max 16 Plus | |
| Lenovo ThinkPad T16g Gen 3 RTX 5080 | |
| Lenovo ThinkPad P16 Gen 3 | |
| HP ZBook Fury 16 G11 | |
| Lenovo ThinkPad P1 Gen 8 | |
| Media della classe Workstation (23.7 - 205, n=27, ultimi 2 anni) | |
| Final Fantasy XV Benchmark - 1920x1080 High Quality | |
| Dell Pro Max 16 Plus | |
| Lenovo ThinkPad T16g Gen 3 RTX 5080 | |
| Lenovo ThinkPad P16 Gen 3 | |
| HP ZBook Fury 16 G11 | |
| Lenovo ThinkPad P1 Gen 8 | |
| Media della classe Workstation (26.4 - 197.6, n=26, ultimi 2 anni) | |
| Lenovo ThinkPad P16 G2 21FA000FGE | |
Grafico Cyberpunk 2077 ultra FPS
| basso | medio | alto | ultra | QHD | 4K DLSS | 4K FSR | 4K | |
|---|---|---|---|---|---|---|---|---|
| GTA V (2015) | 183.5 | 182.6 | 176.4 | 131.7 | 116.7 | |||
| Dota 2 Reborn (2015) | 204 | 181.7 | 167.3 | 157 | 128.7 | |||
| Final Fantasy XV Benchmark (2018) | 204 | 164 | 132 | 111 | 63.8 | |||
| X-Plane 11.11 (2018) | 136.1 | 118.7 | 92.1 | 73.5 | ||||
| Strange Brigade (2018) | 524 | 380 | 321 | 290 | 204 | 108.7 | ||
| Baldur's Gate 3 (2023) | 172.4 | 147.8 | 128.9 | 126.8 | 91.9 | 75.8 | 75.4 | 49.4 |
| Cyberpunk 2077 (2023) | 138.7 | 137 | 112.7 | 102.5 | 70.7 | 37.7 | 30.8 | |
| Kingdom Come Deliverance 2 (2025) | 166.7 | 131.2 | 106.4 | 80.2 | 56.3 | 44.8 | 30 | |
| Civilization 7 (2025) | 287 | 183.6 | 163.2 | 116.9 | 88.7 | 62.4 | ||
| Assassin's Creed Shadows (2025) | 79 | 74 | 62 | 47 | 39 | 37 | 26 | |
| The Elder Scrolls IV Oblivion Remastered (2025) | 87.8 | 81.6 | 76.4 | 35.3 | 23.6 | 21.6 | 24.3 | 13.3 |
| Doom: The Dark Ages (2025) | 98.2 | 80.3 | 73.4 | 69.7 | 46.9 | 35.1 | 24.9 | |
| F1 25 (2025) | 189.1 | 176.5 | 165.8 | 33.8 | 20.1 | 17.7 | 9.25 | |
| Borderlands 4 (2025) | 71.5 | 59 | 46.6 | 32.5 | 22 | 64.6 | 11.5 | |
| The Outer Worlds 2 (2025) | 101.1 | 97.1 | 83.4 | 50.3 | 32.6 | 27.2 | 17 | |
| ARC Raiders (2025) | 167.6 | 137 | 121.7 | 84.4 | 57.5 | 55.7 | 31.3 | |
| Anno 117: Pax Romana (2025) | 129 | 103.8 | 78 | 41.5 | 29 | 26 | 15.9 |
Emissioni
Rumore del sistema
Le doppie ventole del portatile ThinkPad sono per lo più silenziose durante l'uso in ufficio, ma possono diventare piuttosto rumorose sotto carico - oltre 50 dB(a) sono molto udibili, anche da stanze diverse.
Non siamo riusciti a rilevare il fruscio della bobina per il ThinkPad P16 Gen 3.
Rumorosità
| Idle |
| 23.6 / 27.2 / 27.2 dB(A) |
| Sotto carico |
| 42.7 / 53.9 dB(A) |
 | ||
30 dB silenzioso 40 dB(A) udibile 50 dB(A) rumoroso |
||
min: | ||
| Lenovo ThinkPad P16 Gen 3 Ultra 9 285HX, RTX PRO 3000 Blackwell Generation Laptop | Lenovo ThinkPad P16 G2 21FA000FGE i7-13700HX, RTX 2000 Ada Generation Laptop | Dell Pro Max 16 Plus Ultra 9 285HX, RTX PRO 5000 Blackwell Generation Laptop | HP ZBook Fury 16 G11 i9-14900HX, RTX 3500 Ada Generation Laptop | Lenovo ThinkPad T16g Gen 3 RTX 5080 Ultra 9 275HX, GeForce RTX 5080 Laptop | Lenovo ThinkPad P1 Gen 8 Ultra 7 255H, RTX PRO 2000 Blackwell Generation Laptop | |
|---|---|---|---|---|---|---|
| Noise | 1% | -6% | 5% | -1% | 14% | |
| off /ambiente * (dB) | 23.6 | 23.5 -0% | 23.2 2% | 23.2 2% | 24.7 -5% | 23.1 2% |
| Idle Minimum * (dB) | 23.6 | 23.5 -0% | 26.7 -13% | 23.2 2% | 24.7 -5% | 23.1 2% |
| Idle Average * (dB) | 27.2 | 29.2 -7% | 30.5 -12% | 23.2 15% | 28.9 -6% | 23.1 15% |
| Idle Maximum * (dB) | 27.2 | 29.5 -8% | 34 -25% | 29.5 -8% | 28.9 -6% | 23.1 15% |
| Load Average * (dB) | 42.7 | 32.7 23% | 39.8 7% | 43 -1% | 30.4 29% | 27.3 36% |
| Cyberpunk 2077 ultra * (dB) | 53.9 | 54.3 -1% | 48.2 11% | 57.7 -7% | ||
| Load Maximum * (dB) | 53.9 | 56.6 -5% | 54.3 -1% | 48.2 11% | 57.7 -7% | 47.9 11% |
| Witcher 3 ultra * (dB) | 50.6 |
* ... Meglio usare valori piccoli
Temperatura
Poiché il ThinkPad P16 Gen 3 è più compatto del suo predecessore, non ci sorprende che sia anche un po' più caldo. Il valore massimo complessivo è di 50,8 gradi Celsius o 123 F, e anche il poggiapolsi diventa un po' caldo al tatto.
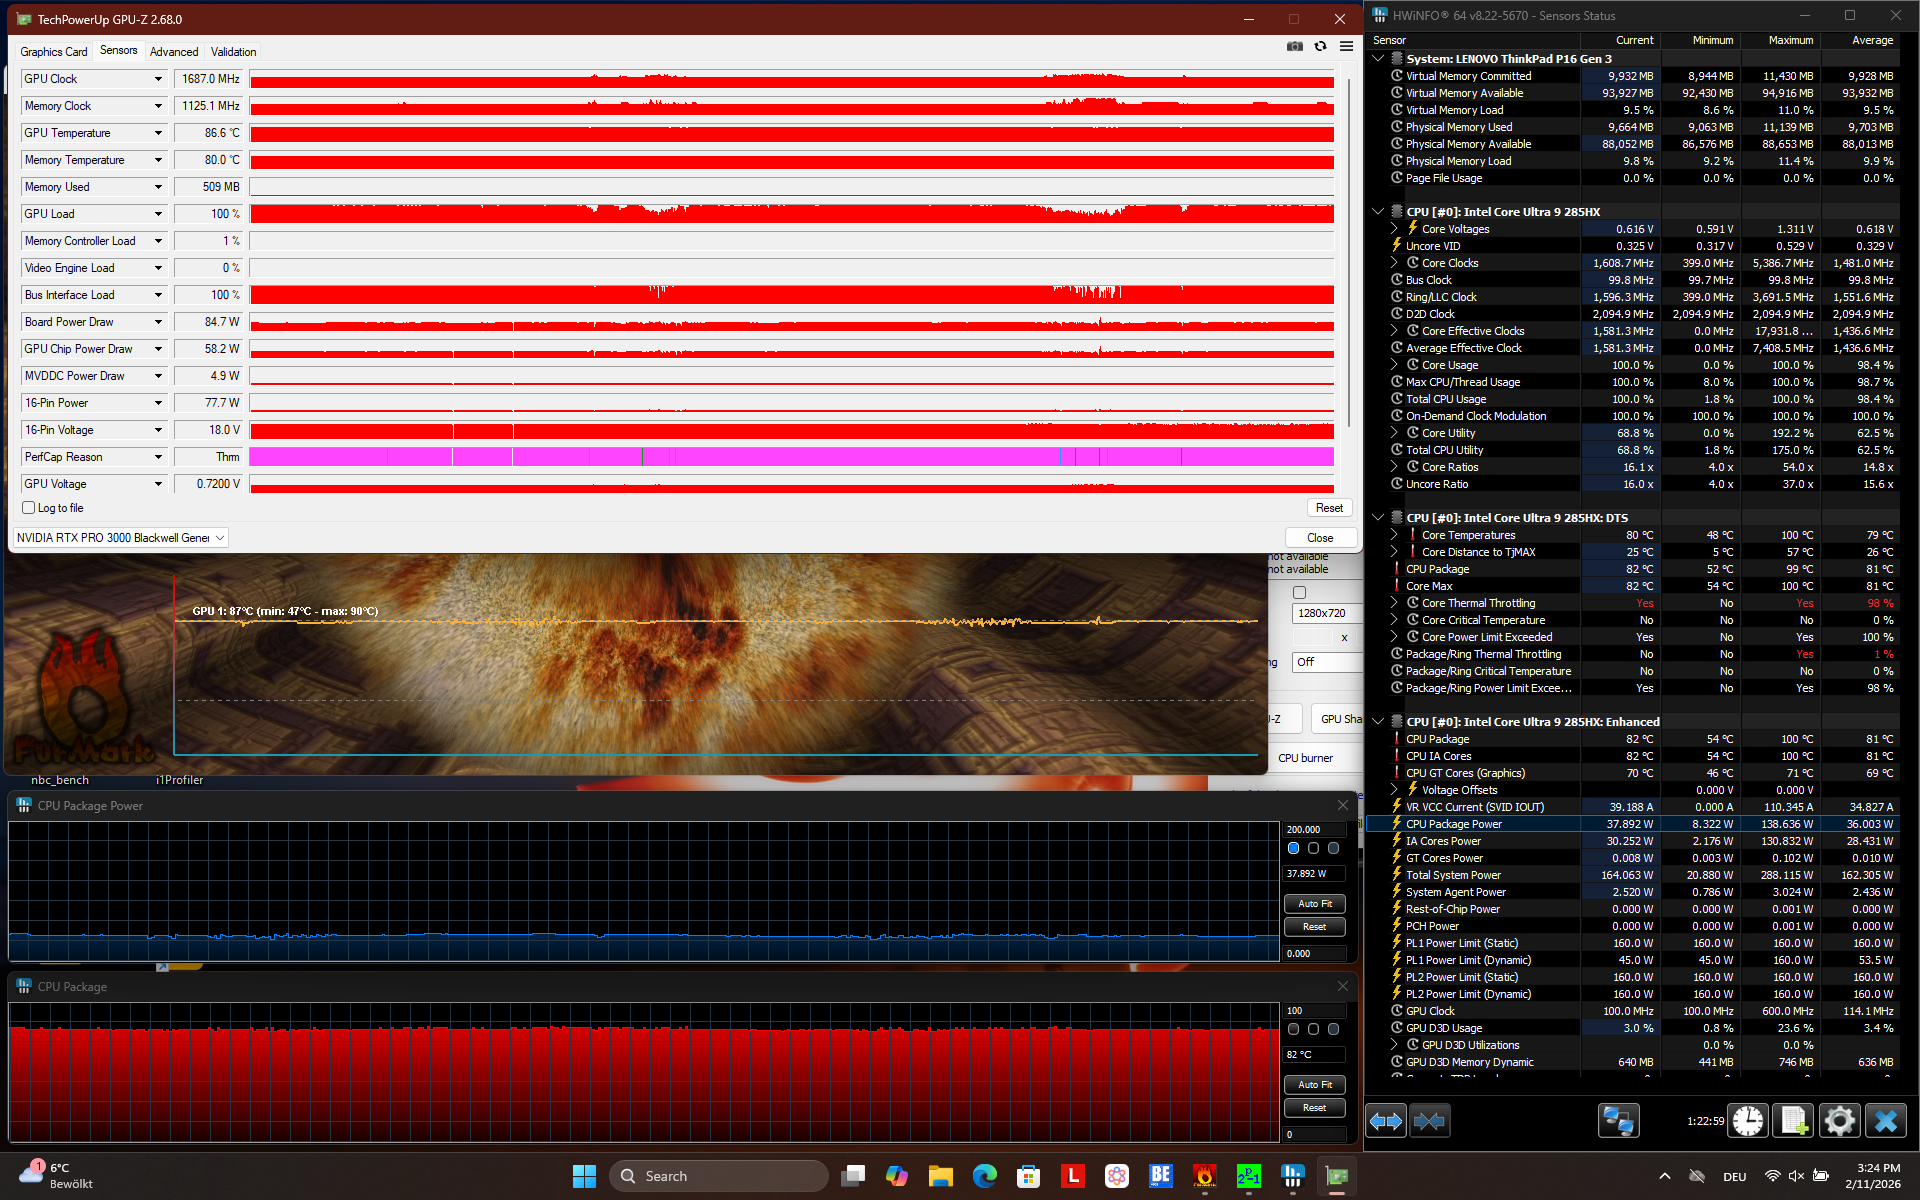
Né la GPU né la CPU riescono a mantenere l'assorbimento massimo di energia sotto carico combinato. La CPU viene limitata a 37 W e la GPU a 85 W.
(-) La temperatura massima sul lato superiore è di 50.8 °C / 123 F, rispetto alla media di 38.2 °C / 101 F, che varia da 22.2 a 69.8 °C per questa classe Workstation.
(-) Il lato inferiore si riscalda fino ad un massimo di 48 °C / 118 F, rispetto alla media di 41.1 °C / 106 F
(+) In idle, la temperatura media del lato superiore è di 26.9 °C / 80 F, rispetto alla media deld ispositivo di 32 °C / 90 F.
(±) 3: The average temperature for the upper side is 35 °C / 95 F, compared to the average of 32 °C / 90 F for the class Workstation.
(+) I poggiapolsi e il touchpad raggiungono la temperatura massima della pelle (32.4 °C / 90.3 F) e quindi non sono caldi.
(-) La temperatura media della zona del palmo della mano di dispositivi simili e'stata di 27.8 °C / 82 F (-4.6 °C / -8.3 F).
| Lenovo ThinkPad P16 Gen 3 Ultra 9 285HX, RTX PRO 3000 Blackwell Generation Laptop | Lenovo ThinkPad P16 G2 21FA000FGE i7-13700HX, RTX 2000 Ada Generation Laptop | Dell Pro Max 16 Plus Ultra 9 285HX, RTX PRO 5000 Blackwell Generation Laptop | HP ZBook Fury 16 G11 i9-14900HX, RTX 3500 Ada Generation Laptop | Lenovo ThinkPad T16g Gen 3 RTX 5080 Ultra 9 275HX, GeForce RTX 5080 Laptop | Lenovo ThinkPad P1 Gen 8 Ultra 7 255H, RTX PRO 2000 Blackwell Generation Laptop | |
|---|---|---|---|---|---|---|
| Heat | 10% | -1% | -10% | 6% | 6% | |
| Maximum Upper Side * (°C) | 50.8 | 47.2 7% | 40.4 20% | 42.2 17% | 43.9 14% | 45 11% |
| Maximum Bottom * (°C) | 48 | 39.5 18% | 45.6 5% | 48 -0% | 45.4 5% | 33 31% |
| Idle Upper Side * (°C) | 30.1 | 28.1 7% | 32.8 -9% | 37 -23% | 27.7 8% | 30.6 -2% |
| Idle Bottom * (°C) | 27.5 | 25.3 8% | 33 -20% | 36.8 -34% | 28.6 -4% | 31.6 -15% |
* ... Meglio usare valori piccoli
Altoparlanti
Nonostante le dimensioni minuscole, gli altoparlanti del P16 G3, situati sul lato del dispositivo, funzionano bene: sono forti e offrono anche bassi, rendendoli adatti all'ascolto della musica.
Lenovo ThinkPad P16 Gen 3 analisi audio
(+) | gli altoparlanti sono relativamente potenti (83.5 dB)
Bassi 100 - 315 Hz
(±) | bassi ridotti - in media 9.9% inferiori alla media
(±) | la linearità dei bassi è media (13% delta rispetto alla precedente frequenza)
Medi 400 - 2000 Hz
(+) | medi bilanciati - solo only 4% rispetto alla media
(+) | medi lineari (4% delta rispetto alla precedente frequenza)
Alti 2 - 16 kHz
(+) | Alti bilanciati - appena 2.2% dalla media
(+) | alti lineari (4.8% delta rispetto alla precedente frequenza)
Nel complesso 100 - 16.000 Hz
(+) | suono nel complesso lineare (10% differenza dalla media)
Rispetto alla stessa classe
» 6% di tutti i dispositivi testati in questa classe è stato migliore, 3% simile, 91% peggiore
» Il migliore ha avuto un delta di 7%, medio di 17%, peggiore di 35%
Rispetto a tutti i dispositivi testati
» 4% di tutti i dispositivi testati in questa classe è stato migliore, 1% similare, 94% peggiore
» Il migliore ha avuto un delta di 4%, medio di 24%, peggiore di 134%
Lenovo ThinkPad P1 Gen 8 analisi audio
(+) | gli altoparlanti sono relativamente potenti (87.5 dB)
Bassi 100 - 315 Hz
(±) | bassi ridotti - in media 9.8% inferiori alla media
(±) | la linearità dei bassi è media (11.2% delta rispetto alla precedente frequenza)
Medi 400 - 2000 Hz
(+) | medi bilanciati - solo only 2.9% rispetto alla media
(+) | medi lineari (2.8% delta rispetto alla precedente frequenza)
Alti 2 - 16 kHz
(+) | Alti bilanciati - appena 3% dalla media
(+) | alti lineari (4.7% delta rispetto alla precedente frequenza)
Nel complesso 100 - 16.000 Hz
(+) | suono nel complesso lineare (8.3% differenza dalla media)
Rispetto alla stessa classe
» 1% di tutti i dispositivi testati in questa classe è stato migliore, 1% simile, 97% peggiore
» Il migliore ha avuto un delta di 7%, medio di 17%, peggiore di 35%
Rispetto a tutti i dispositivi testati
» 2% di tutti i dispositivi testati in questa classe è stato migliore, 1% similare, 97% peggiore
» Il migliore ha avuto un delta di 4%, medio di 24%, peggiore di 134%
Gestione dell'energia
Consumo di energia
Il consumo energetico è inferiore rispetto al precedente ThinkPad P16. Il consumo di energia sotto carico ha superato i 180 W, indicando che il dispositivo può scaricare la batteria, anche quando è collegato a un caricatore.
| Off / Standby | |
| Idle | |
| Sotto carico |
|
Leggenda:
min: | |
| Lenovo ThinkPad P16 Gen 3 Ultra 9 285HX, RTX PRO 3000 Blackwell Generation Laptop, Samsung PM9E1 MZVLC2T0HBLD, IPS LED, 1920x1200, 16" | Lenovo ThinkPad P16 G2 21FA000FGE i7-13700HX, RTX 2000 Ada Generation Laptop, SK hynix PC801 HFS001TEJ9X162N, IPS LED, 2560x1600, 16" | Dell Pro Max 16 Plus Ultra 9 285HX, RTX PRO 5000 Blackwell Generation Laptop, SK hynix PCB01 HFS001TFM9X186N, OLED, 3840x2400, 16" | HP ZBook Fury 16 G11 i9-14900HX, RTX 3500 Ada Generation Laptop, SK hynix PC801 HFS001TEJ9X101N, IPS, 3840x2400, 16" | Lenovo ThinkPad T16g Gen 3 RTX 5080 Ultra 9 275HX, GeForce RTX 5080 Laptop, Samsung PM9E1 MZVLC2T0HBLD, OLED, 3200x2000, 16" | Lenovo ThinkPad P1 Gen 8 Ultra 7 255H, RTX PRO 2000 Blackwell Generation Laptop, Samsung PM9E1 1 TB MZVLC1T0HFLU, Tandem OLED, 3200x2000, 16" | Media NVIDIA RTX PRO 3000 Blackwell Generation Laptop | Media della classe Workstation | |
|---|---|---|---|---|---|---|---|---|
| Power Consumption | -7% | -135% | -15% | -12% | -10% | 0% | -2% | |
| Idle Minimum * (Watt) | 7.8 | 9.3 -19% | 35.1 -350% | 8.6 -10% | 9.9 -27% | 15.4 -97% | 7.8 ? -0% | 8.9 ? -14% |
| Idle Average * (Watt) | 12.6 | 14.1 -12% | 39.2 -211% | 14.8 -17% | 17.1 -36% | 16.5 -31% | 12.6 ? -0% | 13.7 ? -9% |
| Idle Maximum * (Watt) | 16.5 | 15.5 6% | 56 -239% | 15.7 5% | 17.7 -7% | 23.1 -40% | 16.5 ? -0% | 18 ? -9% |
| Load Average * (Watt) | 118.7 | 133.6 -13% | 130.2 -10% | 129.4 -9% | 125.6 -6% | 86.6 27% | 118.7 ? -0% | 95.2 ? 20% |
| Cyberpunk 2077 ultra external monitor * (Watt) | 161.3 | 213 -32% | 192.6 -19% | 166.8 -3% | 121.8 24% | |||
| Cyberpunk 2077 ultra * (Watt) | 159.6 | 229 -43% | 199.4 -25% | 160.5 -1% | 123.1 23% | |||
| Load Maximum * (Watt) | 181.4 | 179.6 1% | 285.2 -57% | 236.1 -30% | 182.8 -1% | 143.6 21% | 181.4 ? -0% | 175.2 ? 3% |
| Witcher 3 ultra * (Watt) | 144.9 |
* ... Meglio usare valori piccoli
Consumo di energia Cyberpunk / Stress Test
Consumo di energia del monitor esterno
Durata della batteria
Con una grande batteria da 99 Wh e uno schermo WUXGA ad alta efficienza energetica, il ThinkPad P16 Gen 3 si comporta bene nel nostro test sulla batteria: 11.6 ore nel test di navigazione web Wi-Fi (150 cd/m²) sono migliori di tutte le altre workstation del confronto.
| Lenovo ThinkPad P16 Gen 3 Ultra 9 285HX, RTX PRO 3000 Blackwell Generation Laptop, 99 Wh | Lenovo ThinkPad P16 G2 21FA000FGE i7-13700HX, RTX 2000 Ada Generation Laptop, 94 Wh | Dell Pro Max 16 Plus Ultra 9 285HX, RTX PRO 5000 Blackwell Generation Laptop, 96 Wh | HP ZBook Fury 16 G11 i9-14900HX, RTX 3500 Ada Generation Laptop, 95 Wh | Lenovo ThinkPad T16g Gen 3 RTX 5080 Ultra 9 275HX, GeForce RTX 5080 Laptop, 99.9 Wh | Lenovo ThinkPad P1 Gen 8 Ultra 7 255H, RTX PRO 2000 Blackwell Generation Laptop, 90 Wh | Media della classe Workstation | |
|---|---|---|---|---|---|---|---|
| Autonomia della batteria | -26% | -69% | -42% | -19% | -53% | -24% | |
| WiFi v1.3 (h) | 11.6 | 8.6 -26% | 3.6 -69% | 6.7 -42% | 9.4 -19% | 5.5 -53% | 8.55 ? -26% |
| Load (h) | 1.8 | 1.429 ? -21% |
Valutazione Notebookcheck
Il ThinkPad P16 Gen 3 è una workstation mobile potente e altamente espandibile, con un'ottima qualità costruttiva, dispositivi di input, opzioni di porte e uno schermo luminoso e opaco, oltre a una buona durata della batteria. Stranamente, le prestazioni sono lo svantaggio maggiore, in quanto potrebbero essere ancora migliori.
Lenovo ThinkPad P16 Gen 3
- 04/22/2026 v8
Benjamin Herzig
 Total Sustainability Score:
 Potenziali concorrenti a confronto
Immagine | Modello | Prezzo | Peso | Altezza | Schermo |
|---|---|---|---|---|---|
1. 89%  | Lenovo ThinkPad P16 Gen 3 Intel Core Ultra 9 285HX ⎘ NVIDIA RTX PRO 3000 Blackwell Generation Laptop ⎘ 96 GB Memoria, 2048 GB SSD | Amazon: Prezzo di listino: 4000 Euro | 2.7 kg | 30 mm | 16.00" 1920x1200 142 PPI IPS LED |
2. 90.2% v7 (old)  | Lenovo ThinkPad P16 G2 21FA000FGE Intel Core i7-13700HX ⎘ NVIDIA RTX 2000 Ada Generation Laptop ⎘ 32 GB Memoria, 1024 GB SSD | Prezzo di listino: 2750 Euro | 3 kg | 30.23 mm | 16.00" 2560x1600 189 PPI IPS LED |
3. 88.4%  | Dell Pro Max 16 Plus Intel Core Ultra 9 285HX ⎘ NVIDIA RTX PRO 5000 Blackwell Generation Laptop ⎘ 128 GB Memoria, SSD | Prezzo di listino: 5000 USD | 2.8 kg | 30.9 mm | 16.00" 3840x2400 283 PPI OLED |
4. 85.9%  | HP ZBook Fury 16 G11 Intel Core i9-14900HX ⎘ NVIDIA RTX 3500 Ada Generation Laptop ⎘ 64 GB Memoria, 1024 GB SSD | Prezzo di listino: 3300 USD | 2.6 kg | 28.5 mm | 16.00" 3840x2400 283 PPI IPS |
5. 87.3%  | Lenovo ThinkPad T16g Gen 3 RTX 5080 Intel Core Ultra 9 275HX ⎘ NVIDIA GeForce RTX 5080 Laptop ⎘ 64 GB Memoria, 2048 GB SSD | Prezzo di listino: 4800€ | 2.6 kg | 29.8 mm | 16.00" 3200x2000 236 PPI OLED |
6. 91.6%  | Lenovo ThinkPad P1 Gen 8 Intel Core Ultra 7 255H ⎘ NVIDIA RTX PRO 2000 Blackwell Generation Laptop ⎘ 32 GB Memoria, 1024 GB SSD | Amazon: Prezzo di listino: 2000 USD | 1.9 kg | 20.6 mm | 16.00" 3200x2000 236 PPI Tandem OLED |
Transparency
La selezione dei dispositivi da recensire viene effettuata dalla nostra redazione. Il campione di prova è stato fornito all'autore come prestito dal produttore o dal rivenditore ai fini di questa recensione. L'istituto di credito non ha avuto alcuna influenza su questa recensione, né il produttore ne ha ricevuto una copia prima della pubblicazione. Non vi era alcun obbligo di pubblicare questa recensione. In quanto società mediatica indipendente, Notebookcheck non è soggetta all'autorità di produttori, rivenditori o editori.
Ecco come Notebookcheck esegue i test
Ogni anno, Notebookcheck esamina in modo indipendente centinaia di laptop e smartphone utilizzando procedure standardizzate per garantire che tutti i risultati siano comparabili. Da circa 20 anni sviluppiamo continuamente i nostri metodi di prova e nel frattempo stabiliamo gli standard di settore. Nei nostri laboratori di prova, tecnici ed editori esperti utilizzano apparecchiature di misurazione di alta qualità. Questi test comportano un processo di validazione in più fasi. Il nostro complesso sistema di valutazione si basa su centinaia di misurazioni e parametri di riferimento ben fondati, che mantengono l'obiettività.
