Verdetto - il ThinkPad T1g Gen 8 è un eccellente computer portatile multimediale con un piccolo difetto
Con il ThinkPad T1g Gen 8, Lenovo mira a rivolgersi a un'ampia base di utenti, tra cui utenti professionali, creatori di contenuti, giocatori e consumatori. Il risultato è un ottimo computer portatile multimediale, anche se costoso. Il suo principale punto debole rispetto alla concorrenza è il display OLED in tandem. Certo, i livelli di luminosità sono estremamente elevati, soprattutto in modalità HDR, e la superficie opaca aiuta a ridurre i riflessi, ma l'immagine appare semplicemente un po' più granulosa rispetto a quella dei suoi rivali. Inoltre, è improbabile che la maggior parte degli utenti sappia cosa significhi la denominazione "T1g". Perché Lenovo non abbia semplicemente riproposto il noto nome ThinkPad X1 Extreme rimane un mistero.
Le prestazioni complessive dei componenti sono buone, anche se la scheda grafica avrebbe potuto essere un po' più veloce. Tra i suoi concorrenti, il ThinkPad T1g Gen 8 si distingue per l'offerta di una RAM sostituibile dall'utente, due slot PCIe 5.0 M.2 veloci e il supporto Thunderbolt 5. In compenso, mancano alcune caratteristiche orientate al business, come un lettore di SmartCard o un modem 5G.
Il vero punto critico, tuttavia, è il prezzo. Se riesce a convincere il suo datore di lavoro a spendere circa 4.500 euro per un portatile aziendale, il ThinkPad T1g Gen 8 offre un pacchetto complessivo molto convincente. Per gli utenti privati, invece, ha solo un senso limitato. Il modello di Lenovo Yoga Pro 9i 16 offre prestazioni leggermente superiori e una qualità dell'immagine marginalmente migliore per quasi 2.000 euro in meno. E se è davvero disposto a spendere così tanto, le alternative come il MacBook Pro 16 con il più veloce M4 Max (o presto l'M5 Max) o l'Asus ProArt P16 Asus ProArt P16 con una RTX 5090 mobile GeForce e un pannello OLED in tandem sono semplicemente opzioni più interessanti.
Pro
Contro
Prezzo e disponibilità
Il ThinkPad T1g Gen 8 può essere configurato a partire da 2.900 euro direttamente da Lenovo. Il prezzo finale varia in modo significativo a seconda della configurazione e della regione.
Sommario
- Verdetto - il ThinkPad T1g Gen 8 è un eccellente computer portatile multimediale con un piccolo difetto
- Specifiche
- Custodia e caratteristiche
- Dispositivi di input - tastiera eccellente
- Display - Touchscreen OLED tandem opaco
- Prestazioni - Arrow Lake e Blackwell
- Emissioni e potenza
- Valutazione complessiva di Notebookcheck
- Le possibili alternative in sintesi
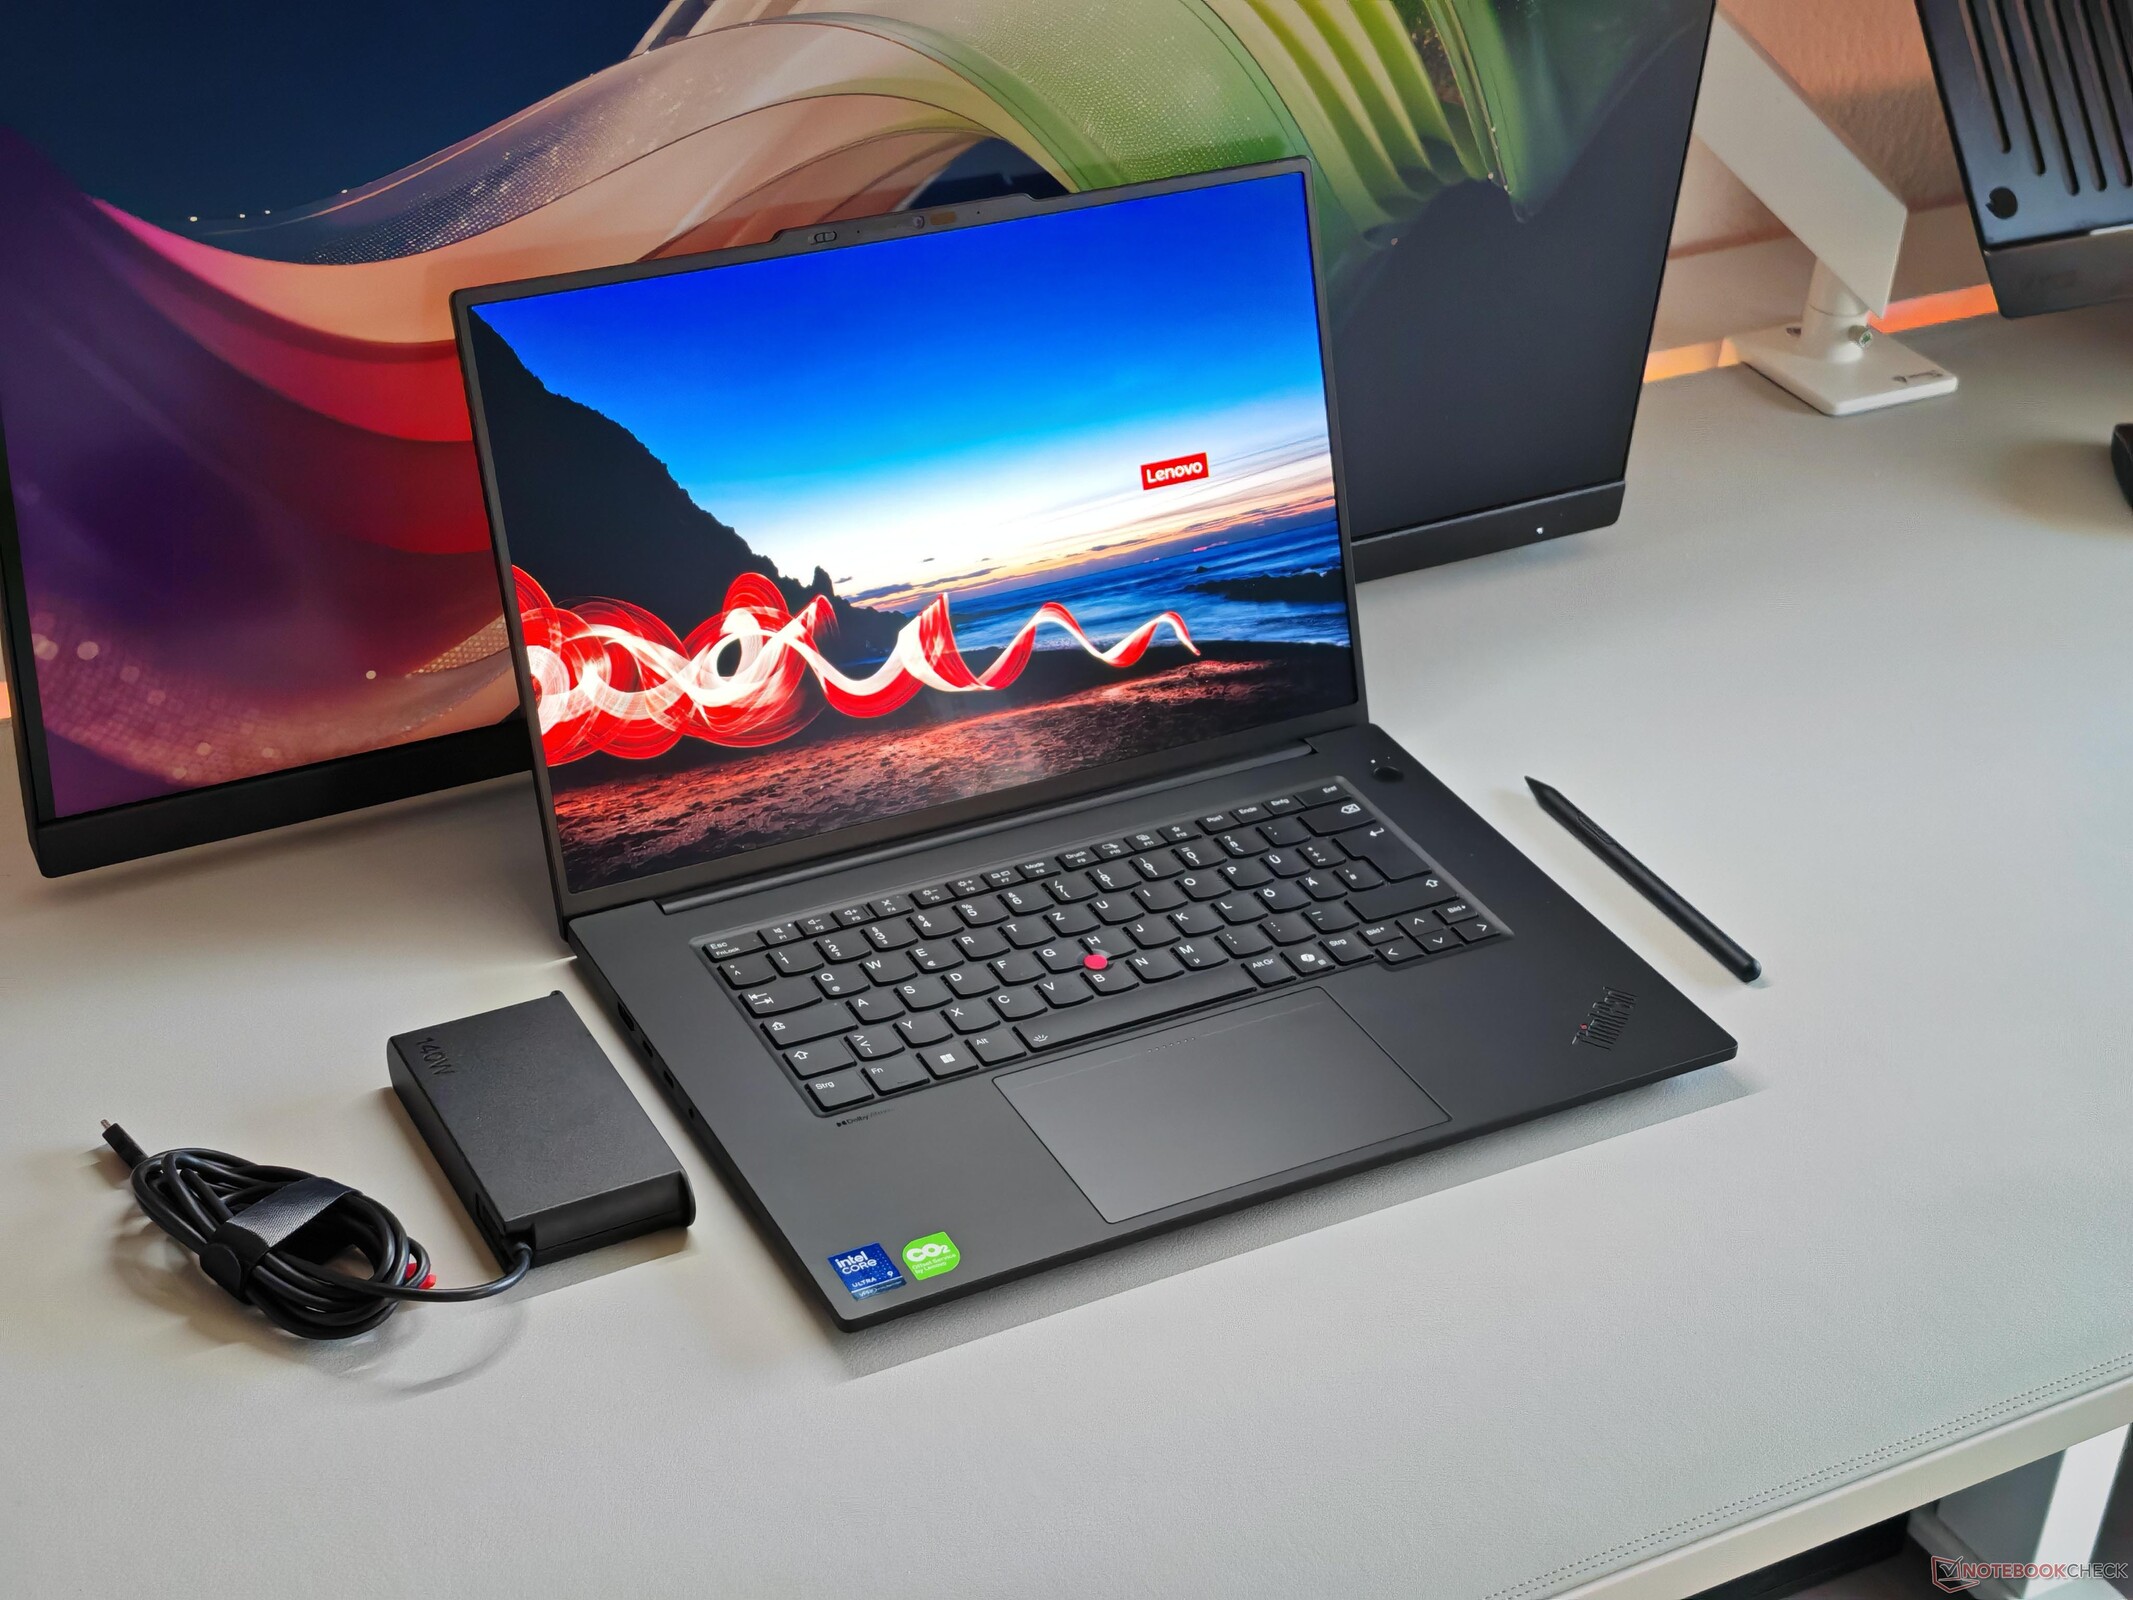
Lenovo aveva effettivamente interrotto il ThinkPad X1 Extreme, il suo computer portatile multimediale dotato di GPU GeForce, dopo la sesta generazione e offriva solo la controparte tecnicamente identica per la workstation, il ThinkPad P1. Con l'introduzione del ThinkPad T1g Gen 8, tuttavia, il produttore sta effettivamente invertendo la rotta. In termini pratici, il T1g Gen 8 è essenzialmente un ThinkPad P1 Gen 8 con grafica GeForce, riposizionato ancora una volta come modello incentrato sulla multimedialità.
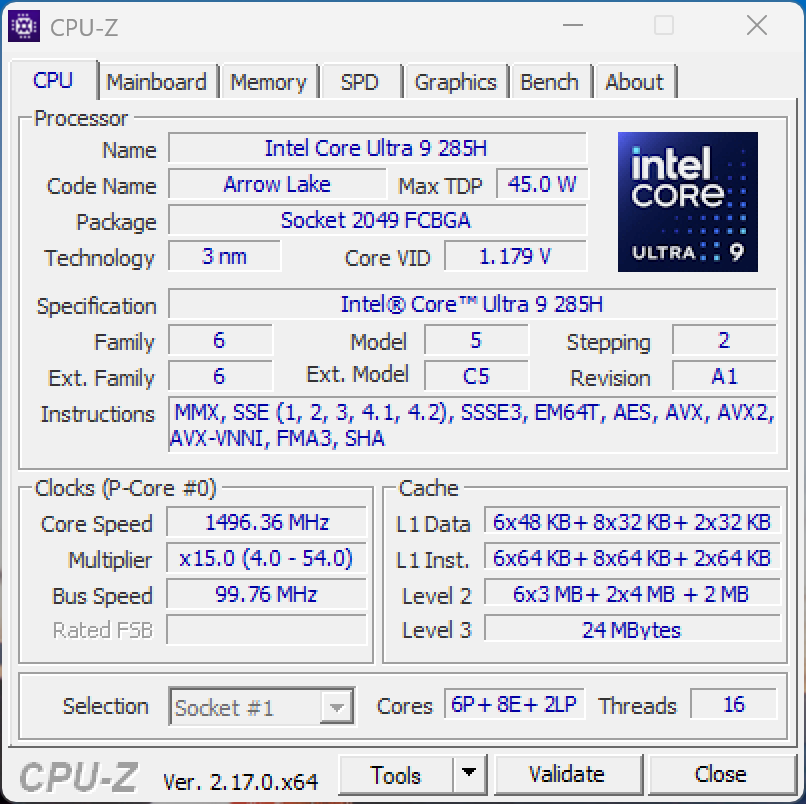
Il prezzo del ThinkPad T1g Gen 8 parte da circa 2.900 euro. La nostra unità di recensione è la configurazione di fascia alta con l'Intel Core Ultra 9 285H Intel Core Ultra 9 285H, GeForce RTX 5070, 64 GB di RAM, un SSD da 2 TB e il touchscreen OLED opaco a 120 Hz in tandem, che ha un prezzo di circa 4.500 euro.
Specifiche
Custodia e caratteristiche
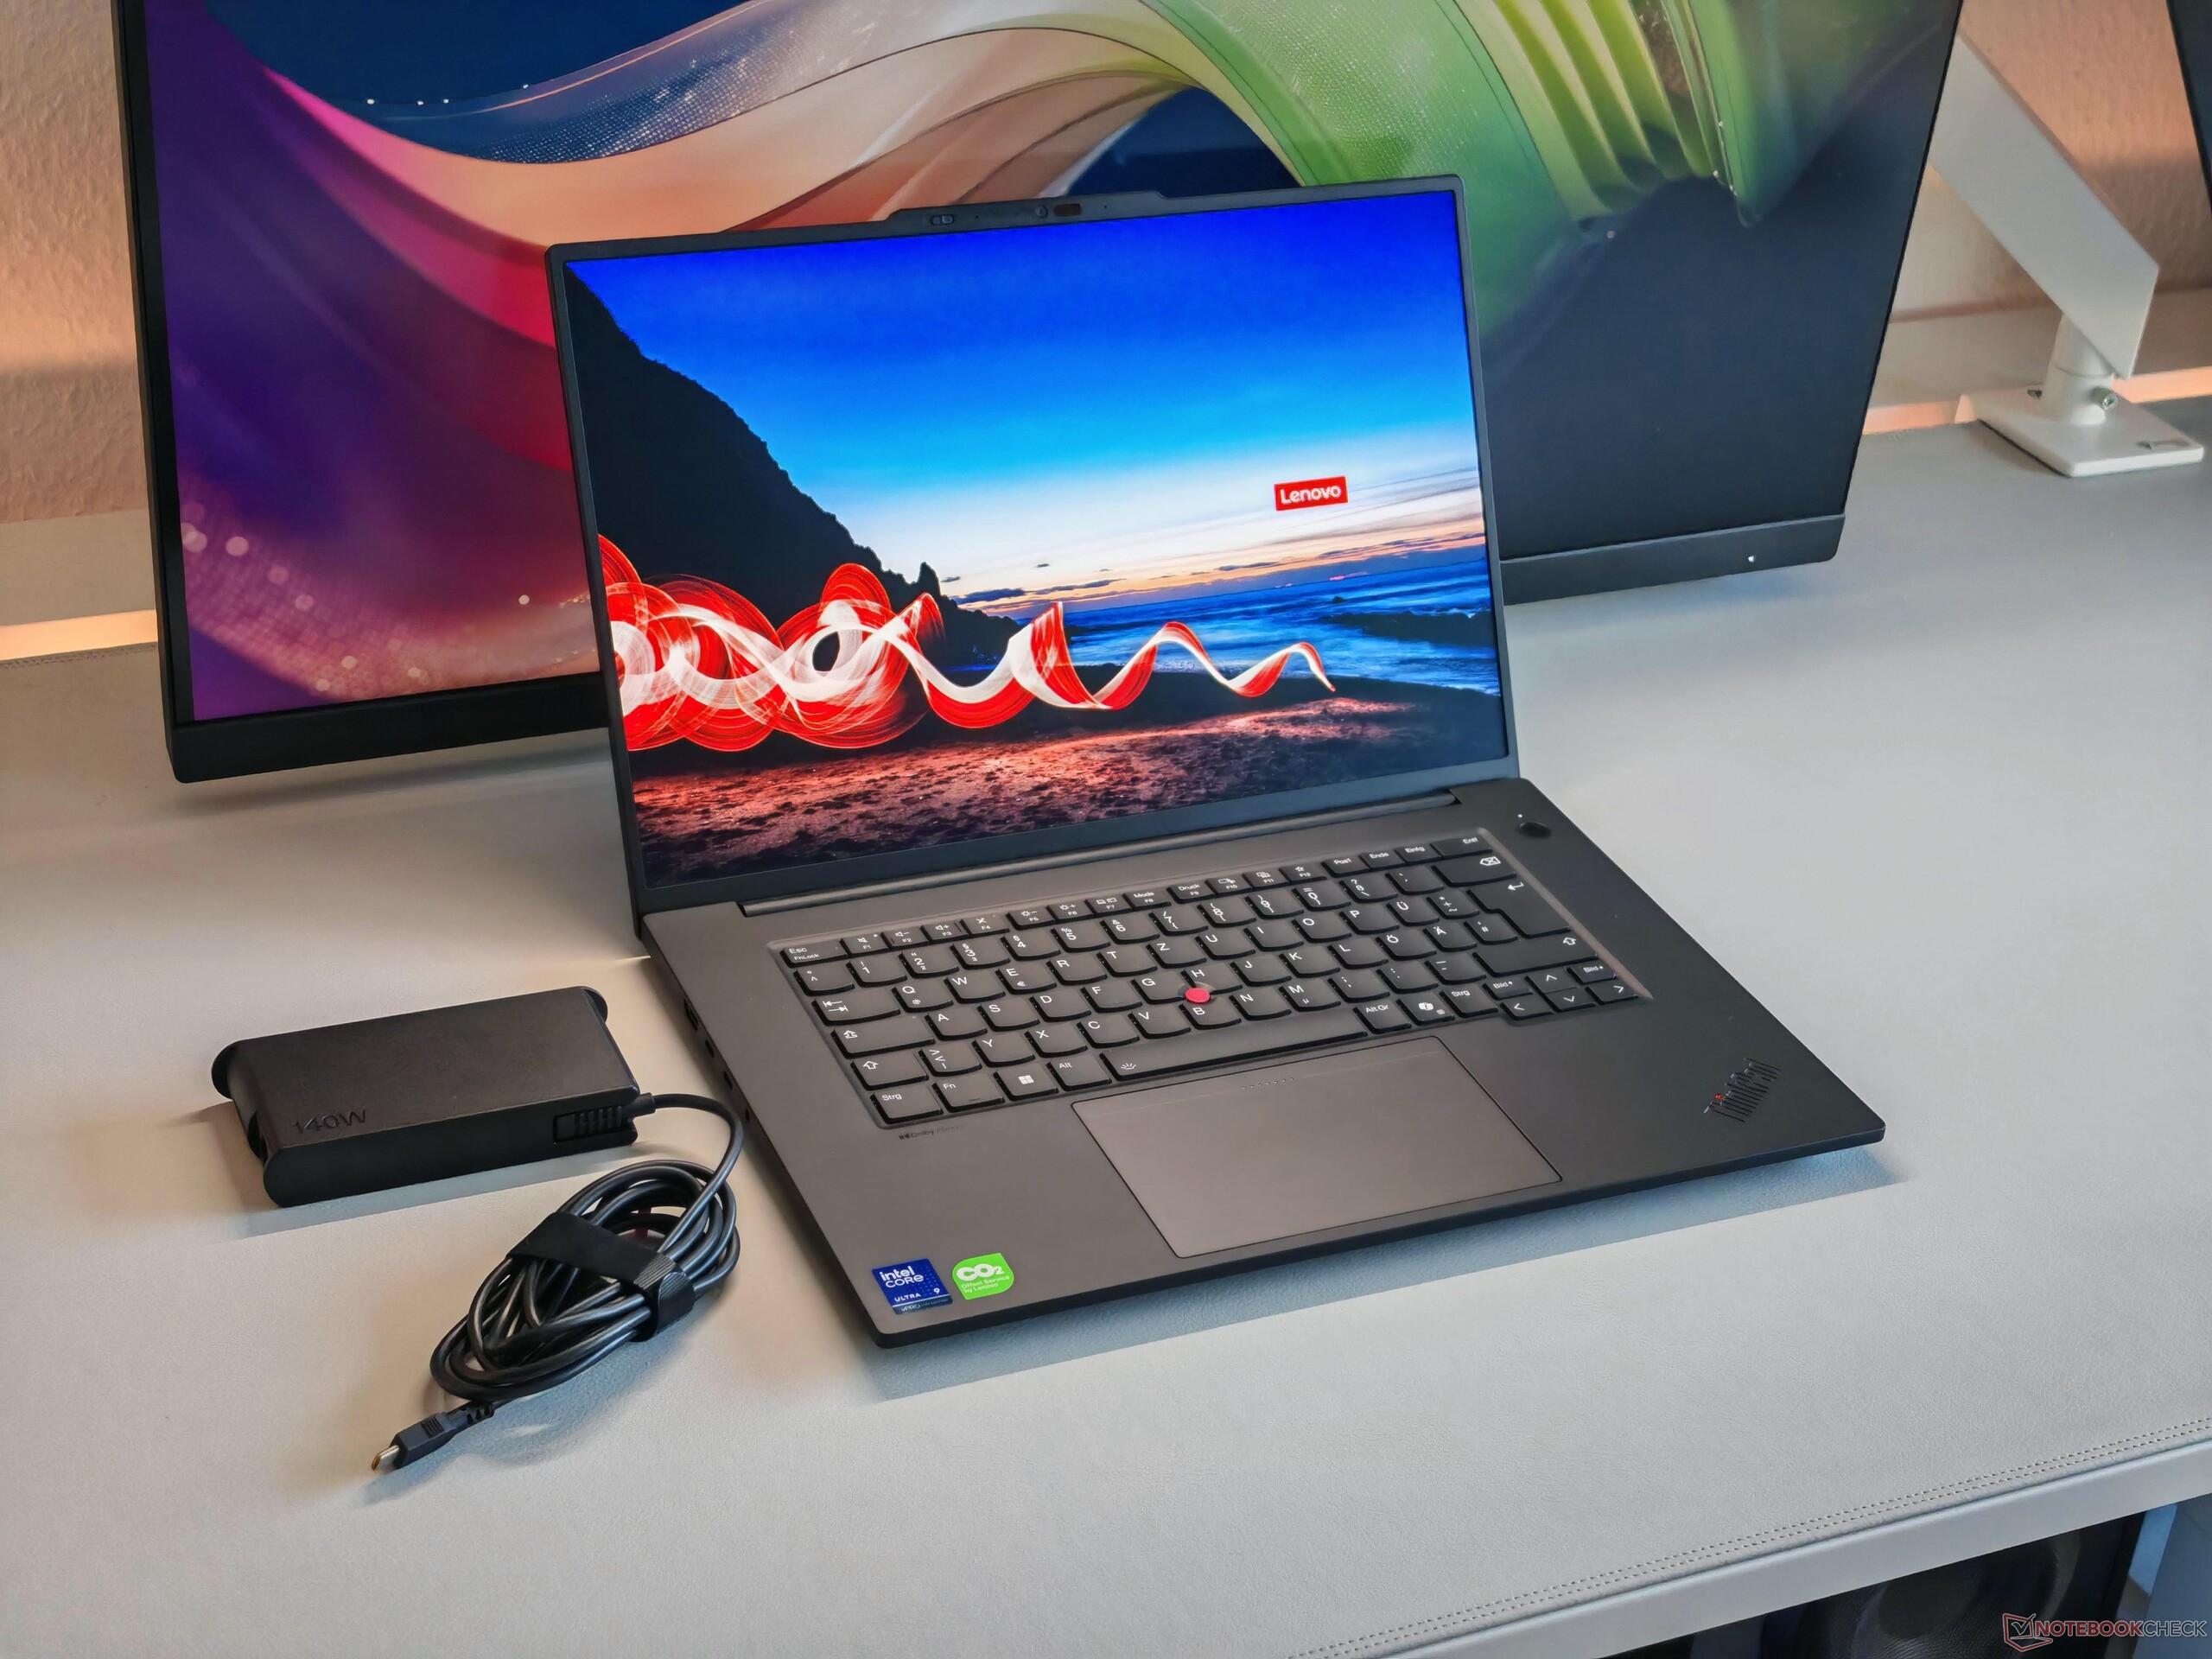
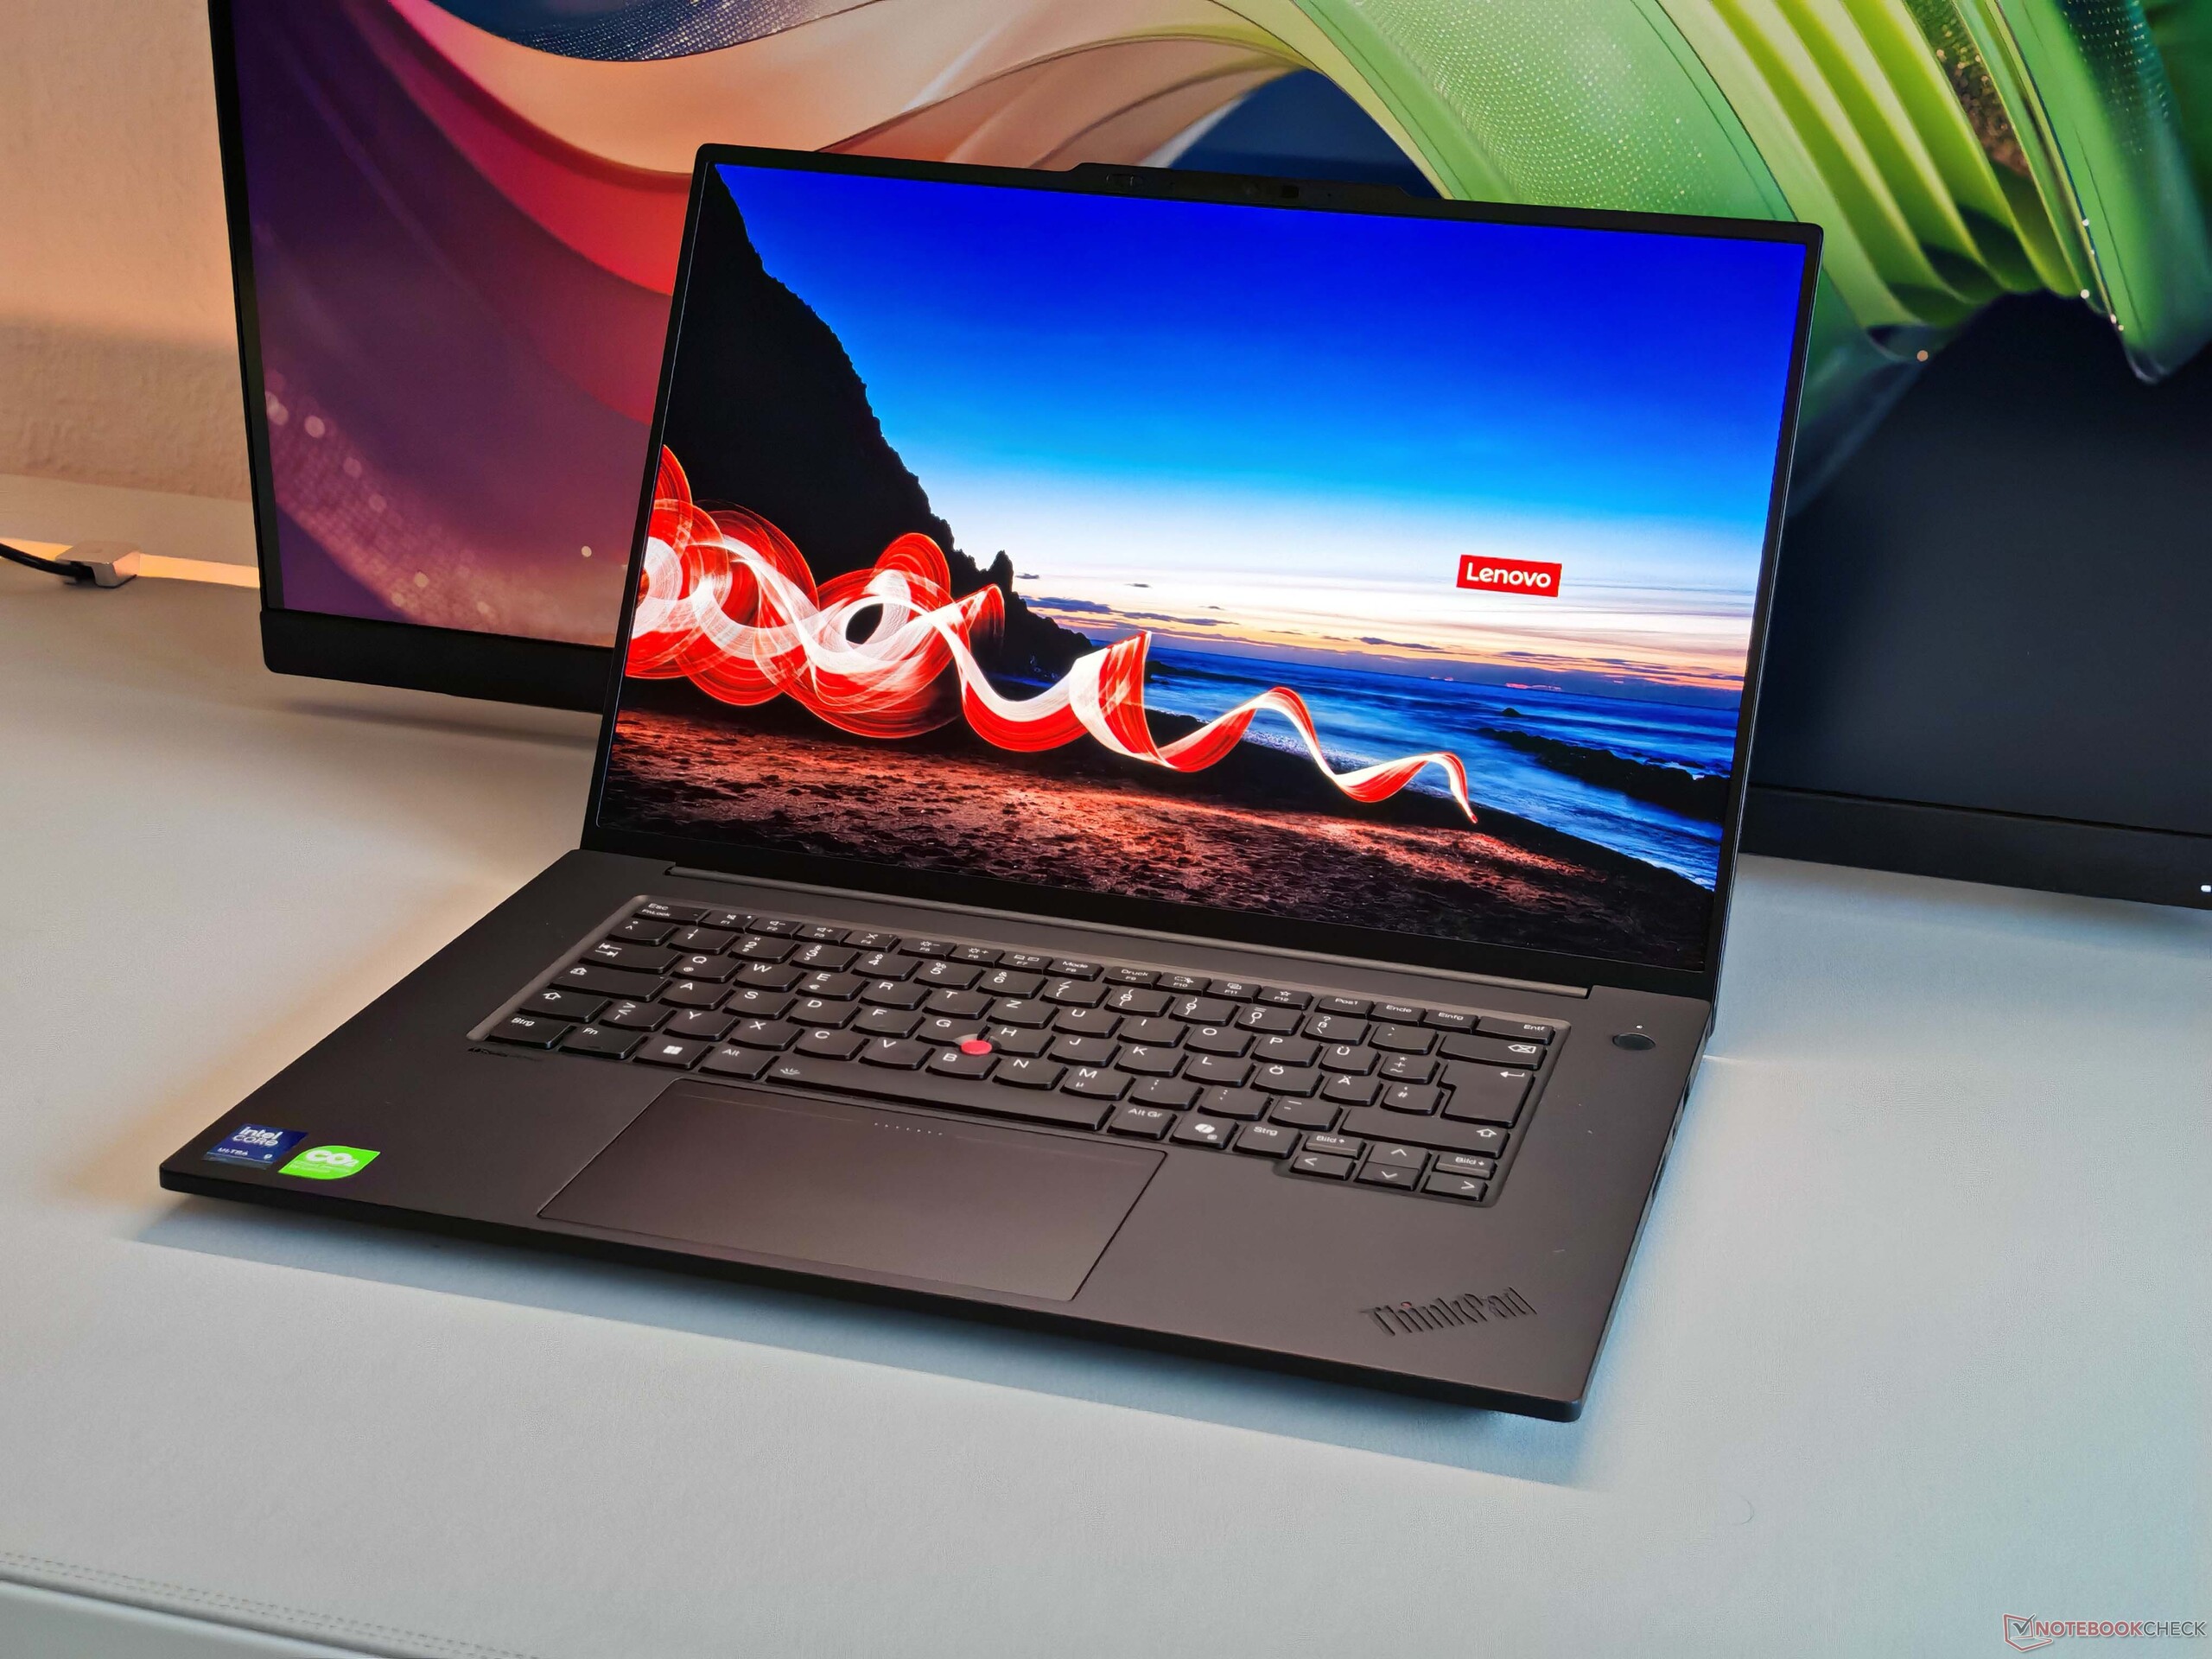
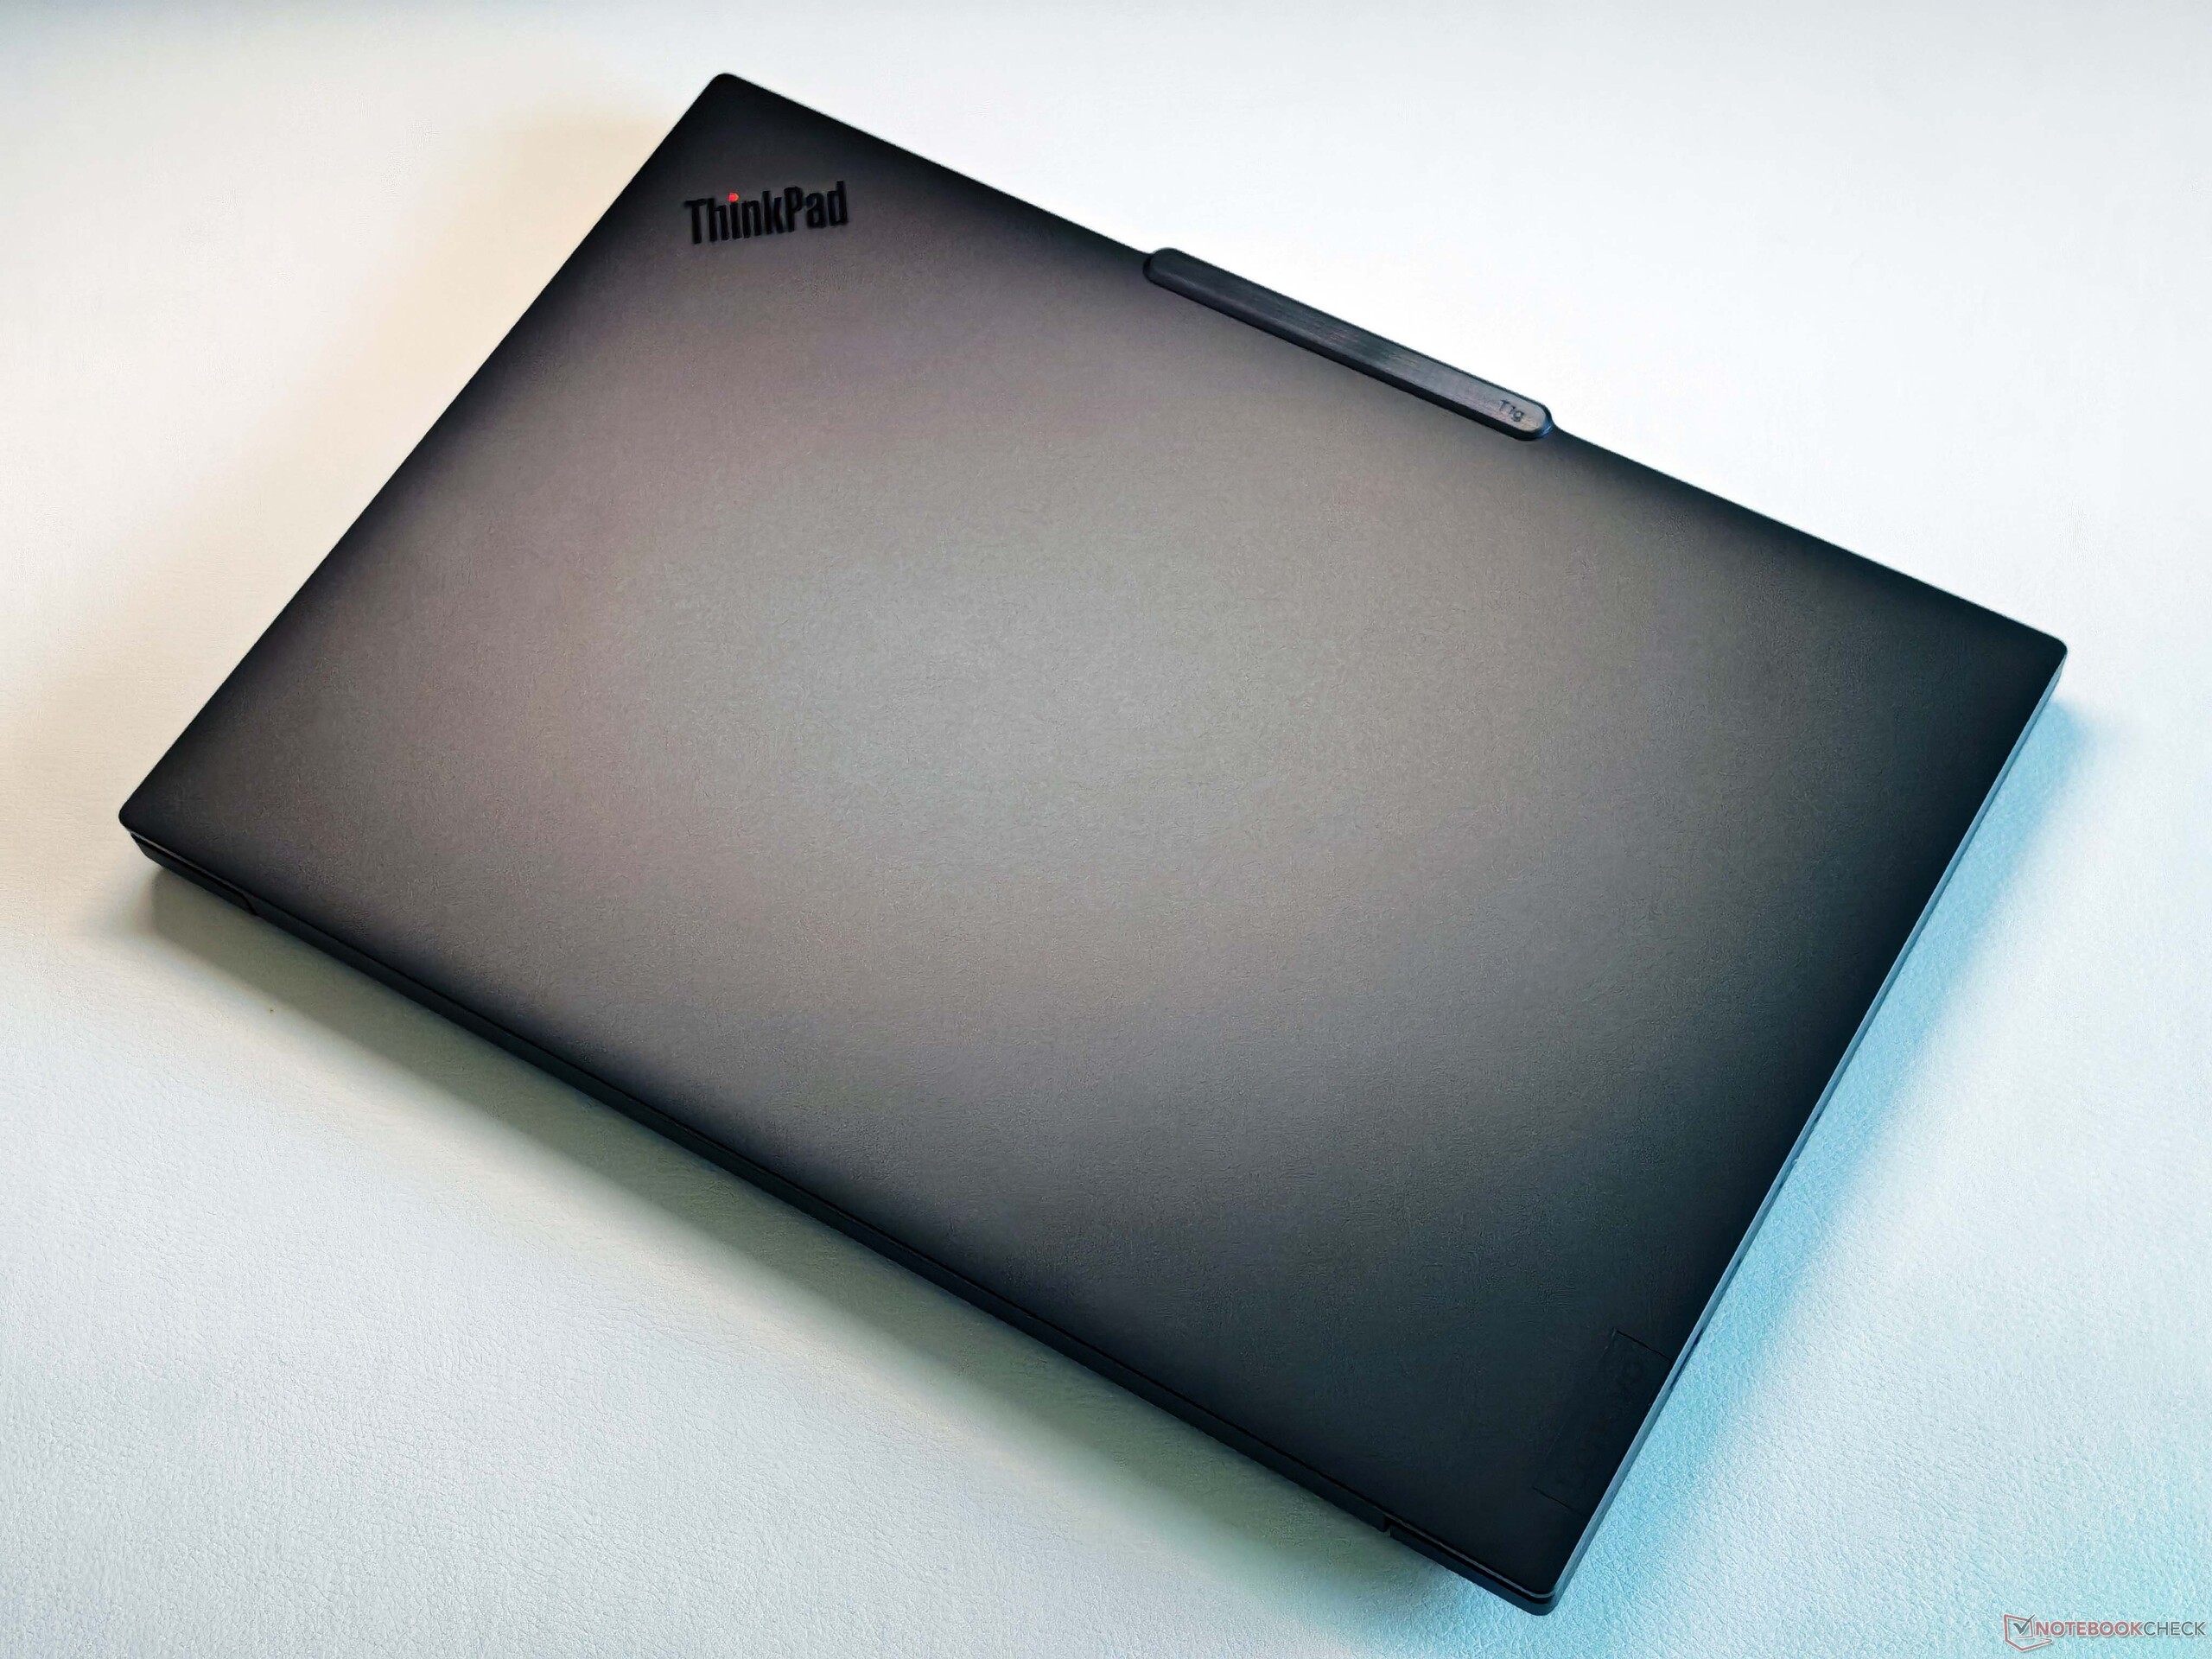
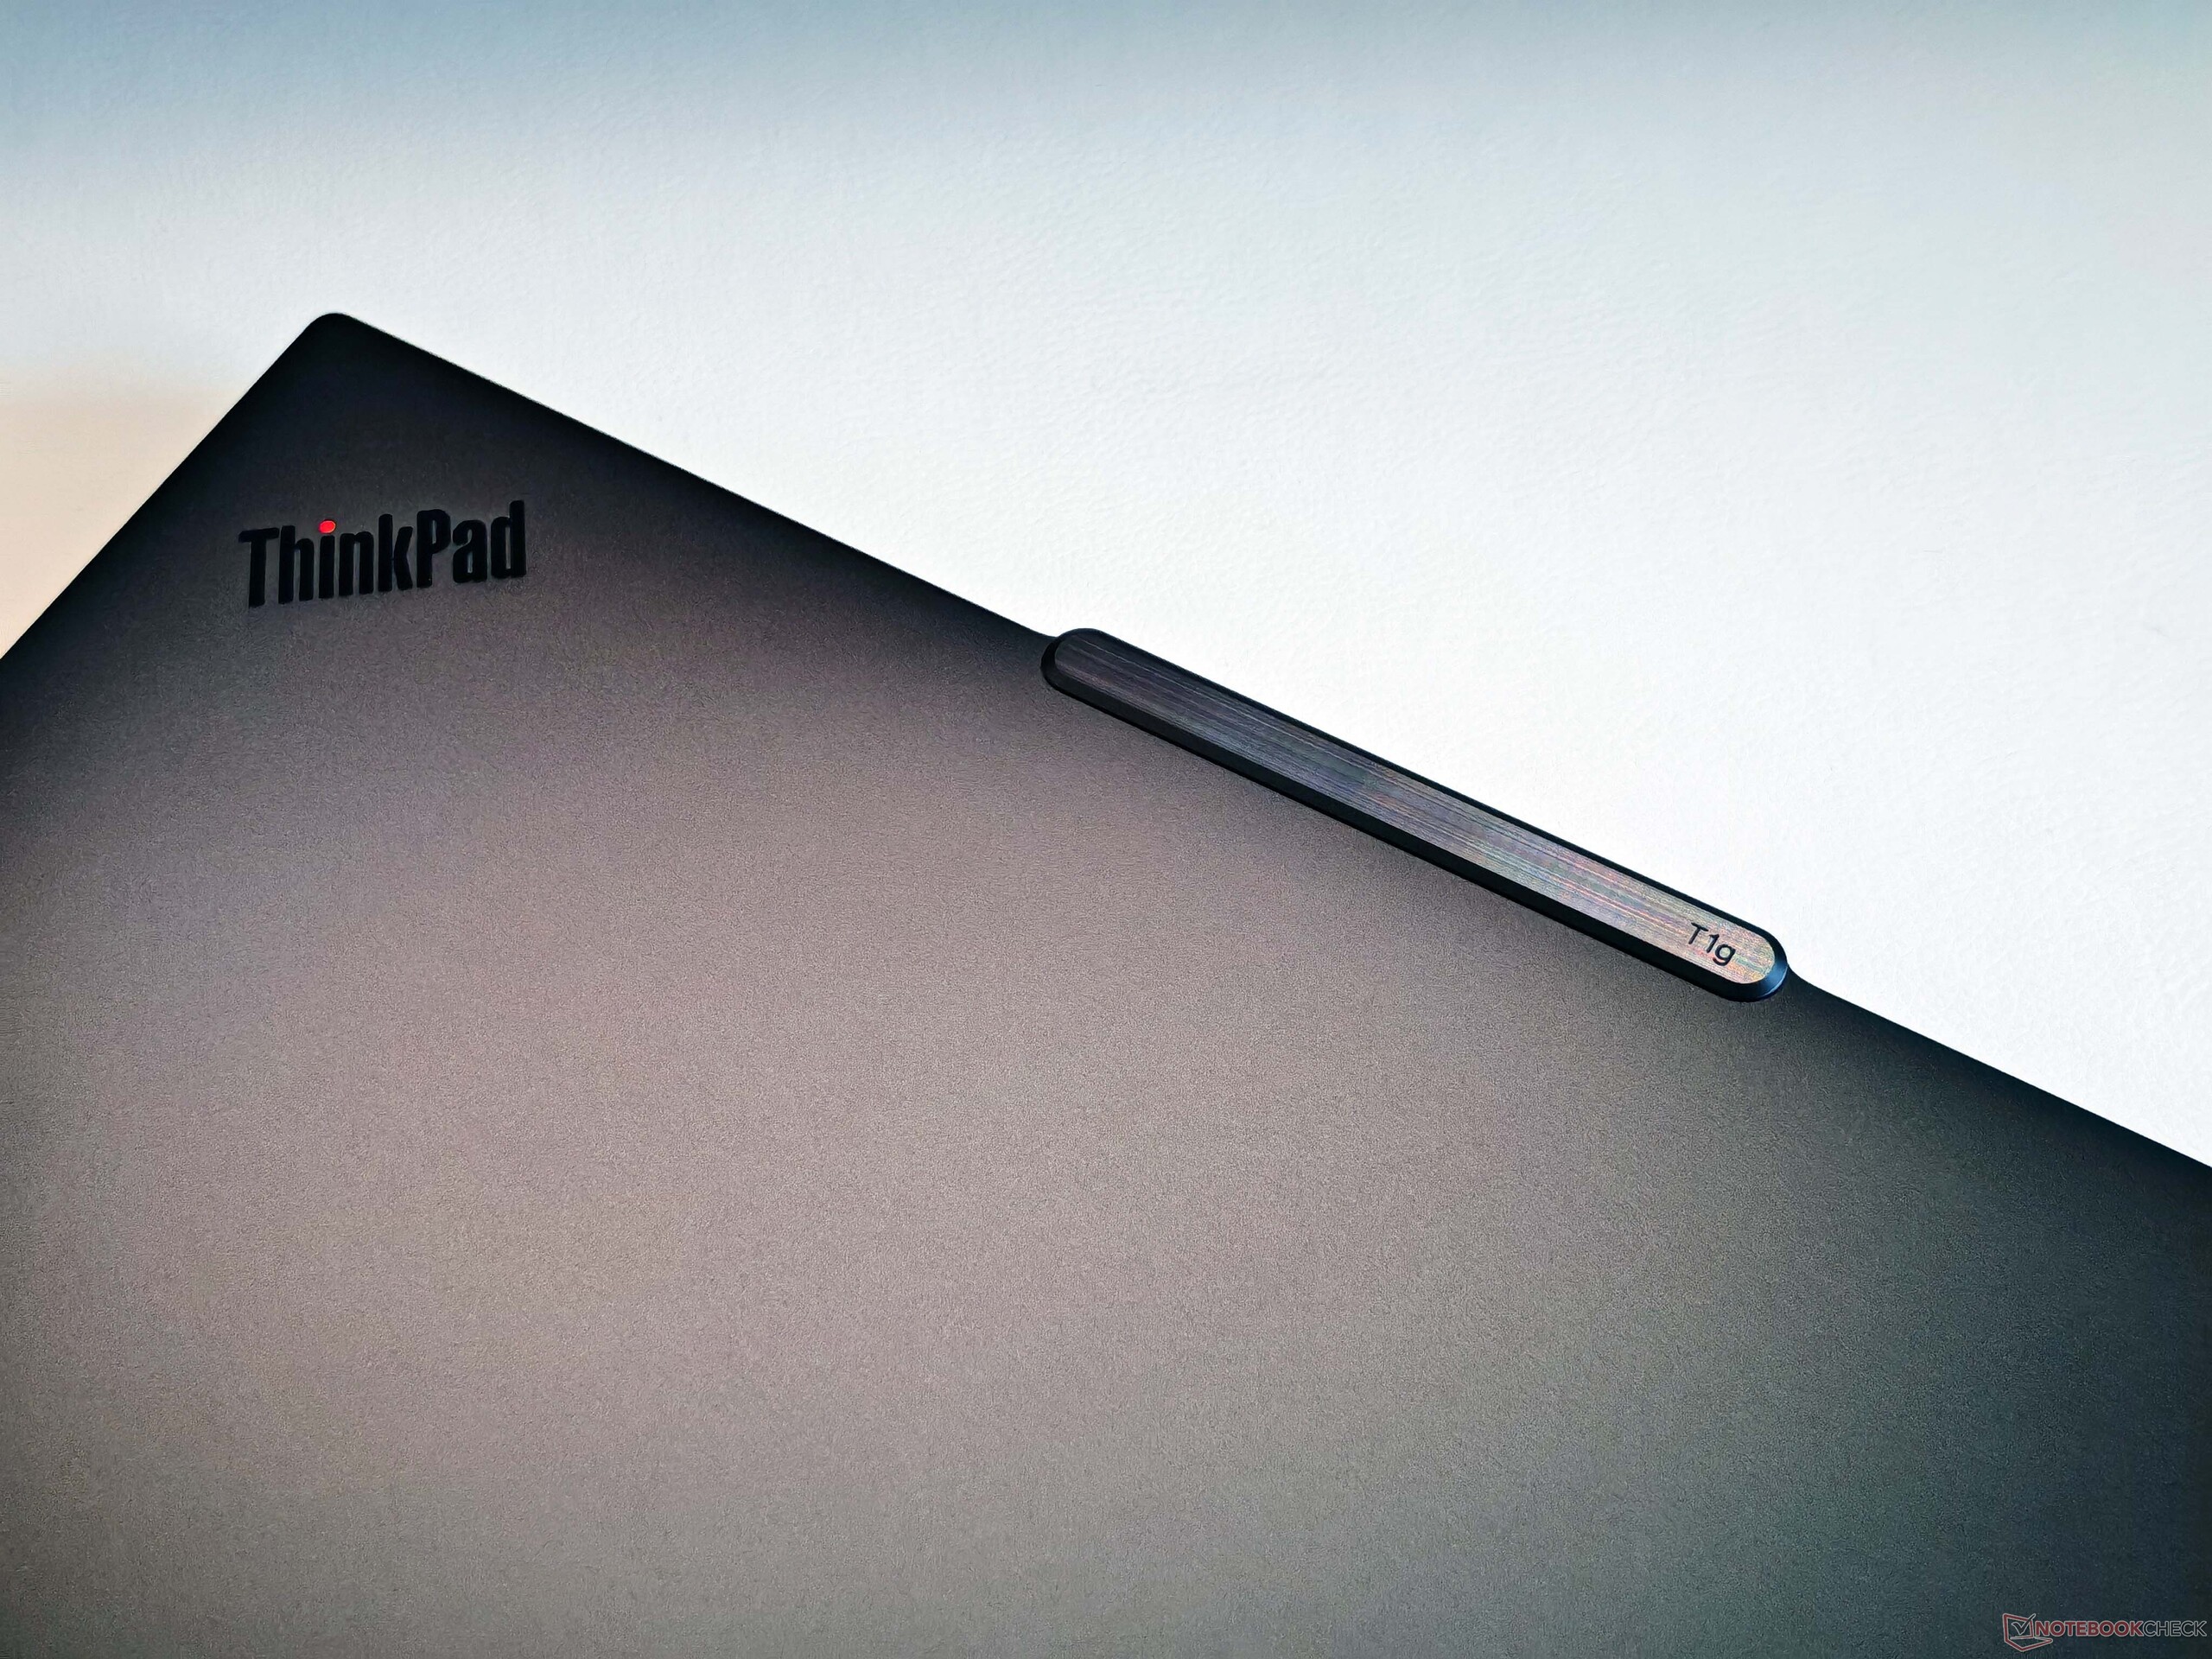
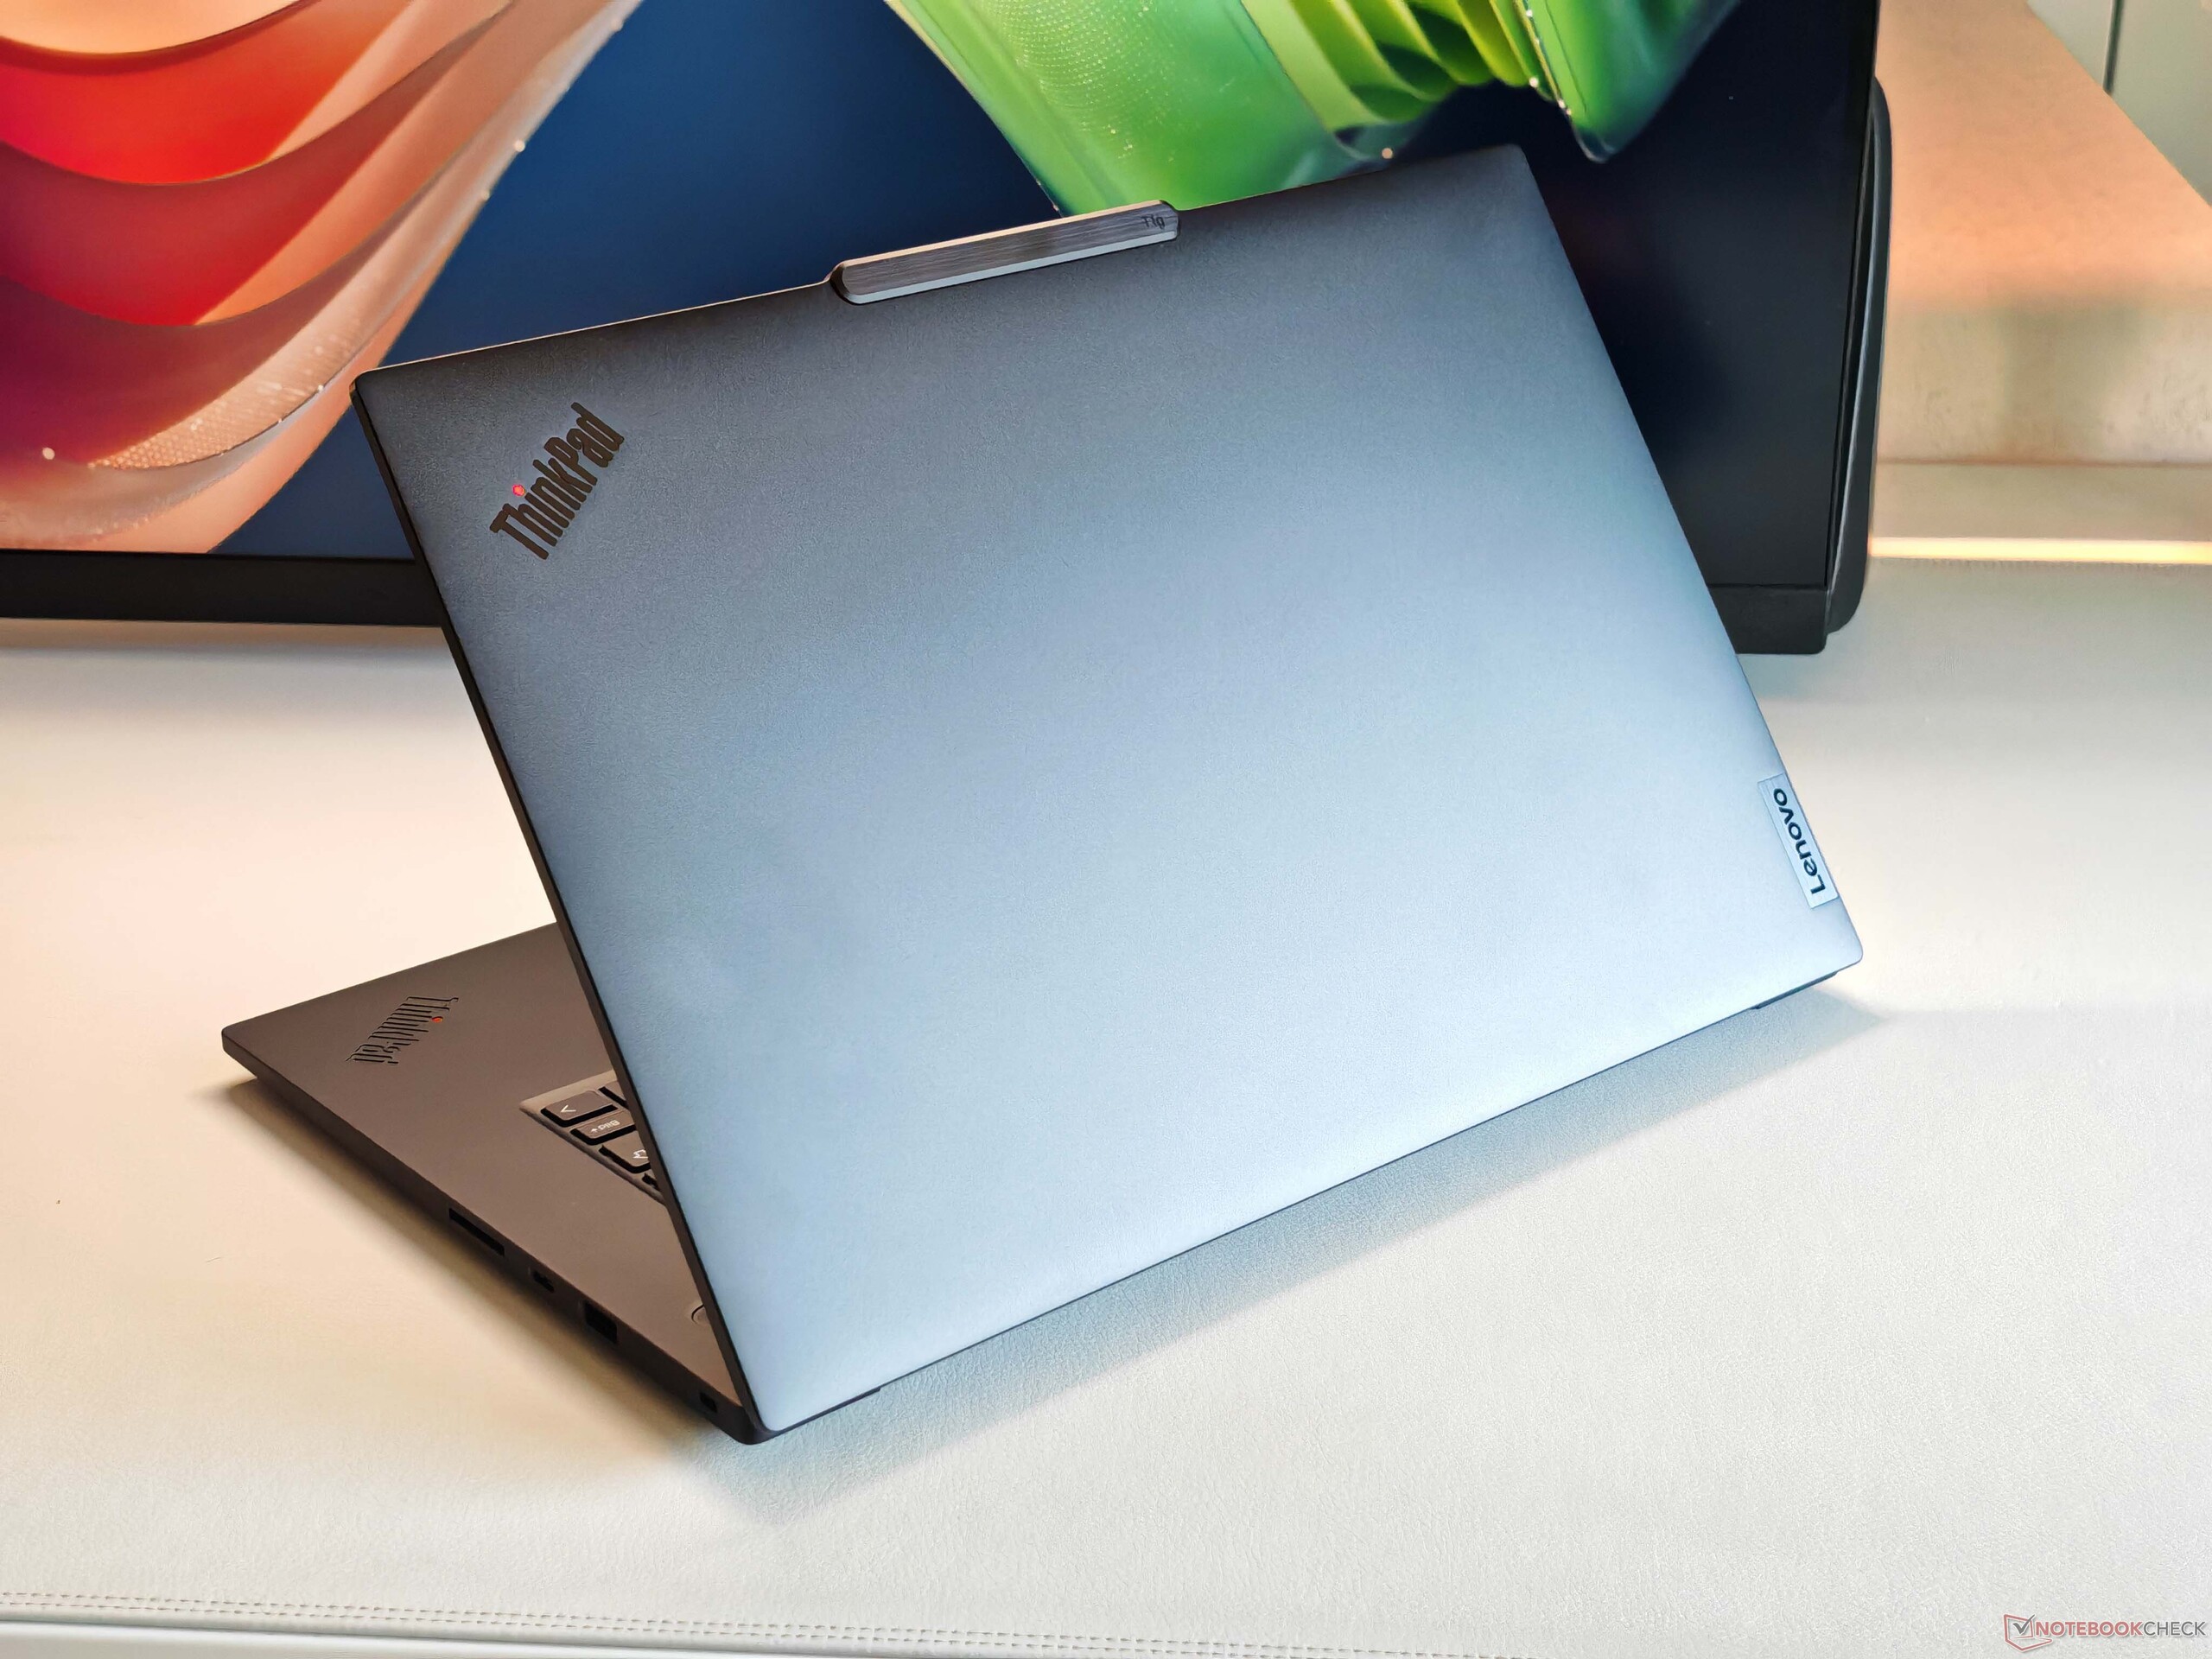
Il telaio in alluminio del ThinkPad T1g Gen 8 è già noto dal modello ThinkPad P1g Gen 8 ThinkPad P1e, a parte la protuberanza della fotocamera, c'è ben poco da criticare. In termini di qualità costruttiva, sensazione e rigidità, il ThinkPad T1g è all'altezza delle sue aspirazioni premium. Il coperchio liscio del display è un po' soggetto alle impronte digitali, ma è facile da pulire.
La connettività è solida, con un numero sufficiente di porte USB (3x USB-C, 1x USB-A), mentre Thunderbolt 5 è già disponibile sul lato sinistro. Il lettore di schede SD accoglie pienamente le schede, anche se le velocità di trasferimento sono solo medie. Il modulo Wi-Fi supporta Wi-Fi 7 e Bluetooth 5.4 e offre buone velocità di trasmissione nei nostri test. Tuttavia, gli utenti devono fare a meno di una porta Ethernet e di un modem 5G. La webcam da 5 MP (che include un otturatore privacy e un modulo IR) cattura immagini rispettabili.


| SD Card Reader | |
| average JPG Copy Test (av. of 3 runs) | |
| Lenovo ThinkPad T1g Gen 8 21TD003GE (ADATA SD8.0 Express 512 GBAV Pro V60) | |
| Lenovo ThinkPad T1g Gen 8 21TD003GE (Angelbird AV Pro V60) | |
| Asus ProArt P16 H7606WP (Angelbird AV Pro V60) | |
| Apple MacBook Pro 16 2024 M4 Pro (Angelbird AV Pro V60) | |
| Media della classe Multimedia (22.2 - 531, n=42, ultimi 2 anni) | |
| Lenovo Yoga Pro 9i 16 RTX 5070 (Angelbird AV Pro V60) | |
| maximum AS SSD Seq Read Test (1GB) | |
| Lenovo ThinkPad T1g Gen 8 21TD003GE (ADATA SD8.0 Express 512 GB) | |
| Lenovo ThinkPad T1g Gen 8 21TD003GE (Angelbird AV Pro V60) | |
| Asus ProArt P16 H7606WP (Angelbird AV Pro V60) | |
| Apple MacBook Pro 16 2024 M4 Pro (Angelbird AV Pro V60) | |
| Media della classe Multimedia (27.9 - 1455, n=42, ultimi 2 anni) | |
| Lenovo Yoga Pro 9i 16 RTX 5070 (Angelbird AV Pro V60) | |
| Networking | |
| Lenovo ThinkPad T1g Gen 8 21TD003GE | |
| iperf3 transmit AXE11000 | |
| iperf3 receive AXE11000 | |
| Lenovo Yoga Pro 9i 16 RTX 5070 | |
| iperf3 transmit AXE11000 | |
| iperf3 receive AXE11000 | |
| Asus ProArt P16 H7606WP | |
| iperf3 transmit AXE11000 | |
| iperf3 receive AXE11000 | |
| Dell 16 Premium DA16250 | |
| iperf3 transmit AXE11000 | |
| iperf3 receive AXE11000 | |
| iperf3 transmit AXE11000 6GHz | |
| iperf3 receive AXE11000 6GHz | |
| Apple MacBook Pro 16 2024 M4 Pro | |
| iperf3 transmit AXE11000 | |
| iperf3 receive AXE11000 | |


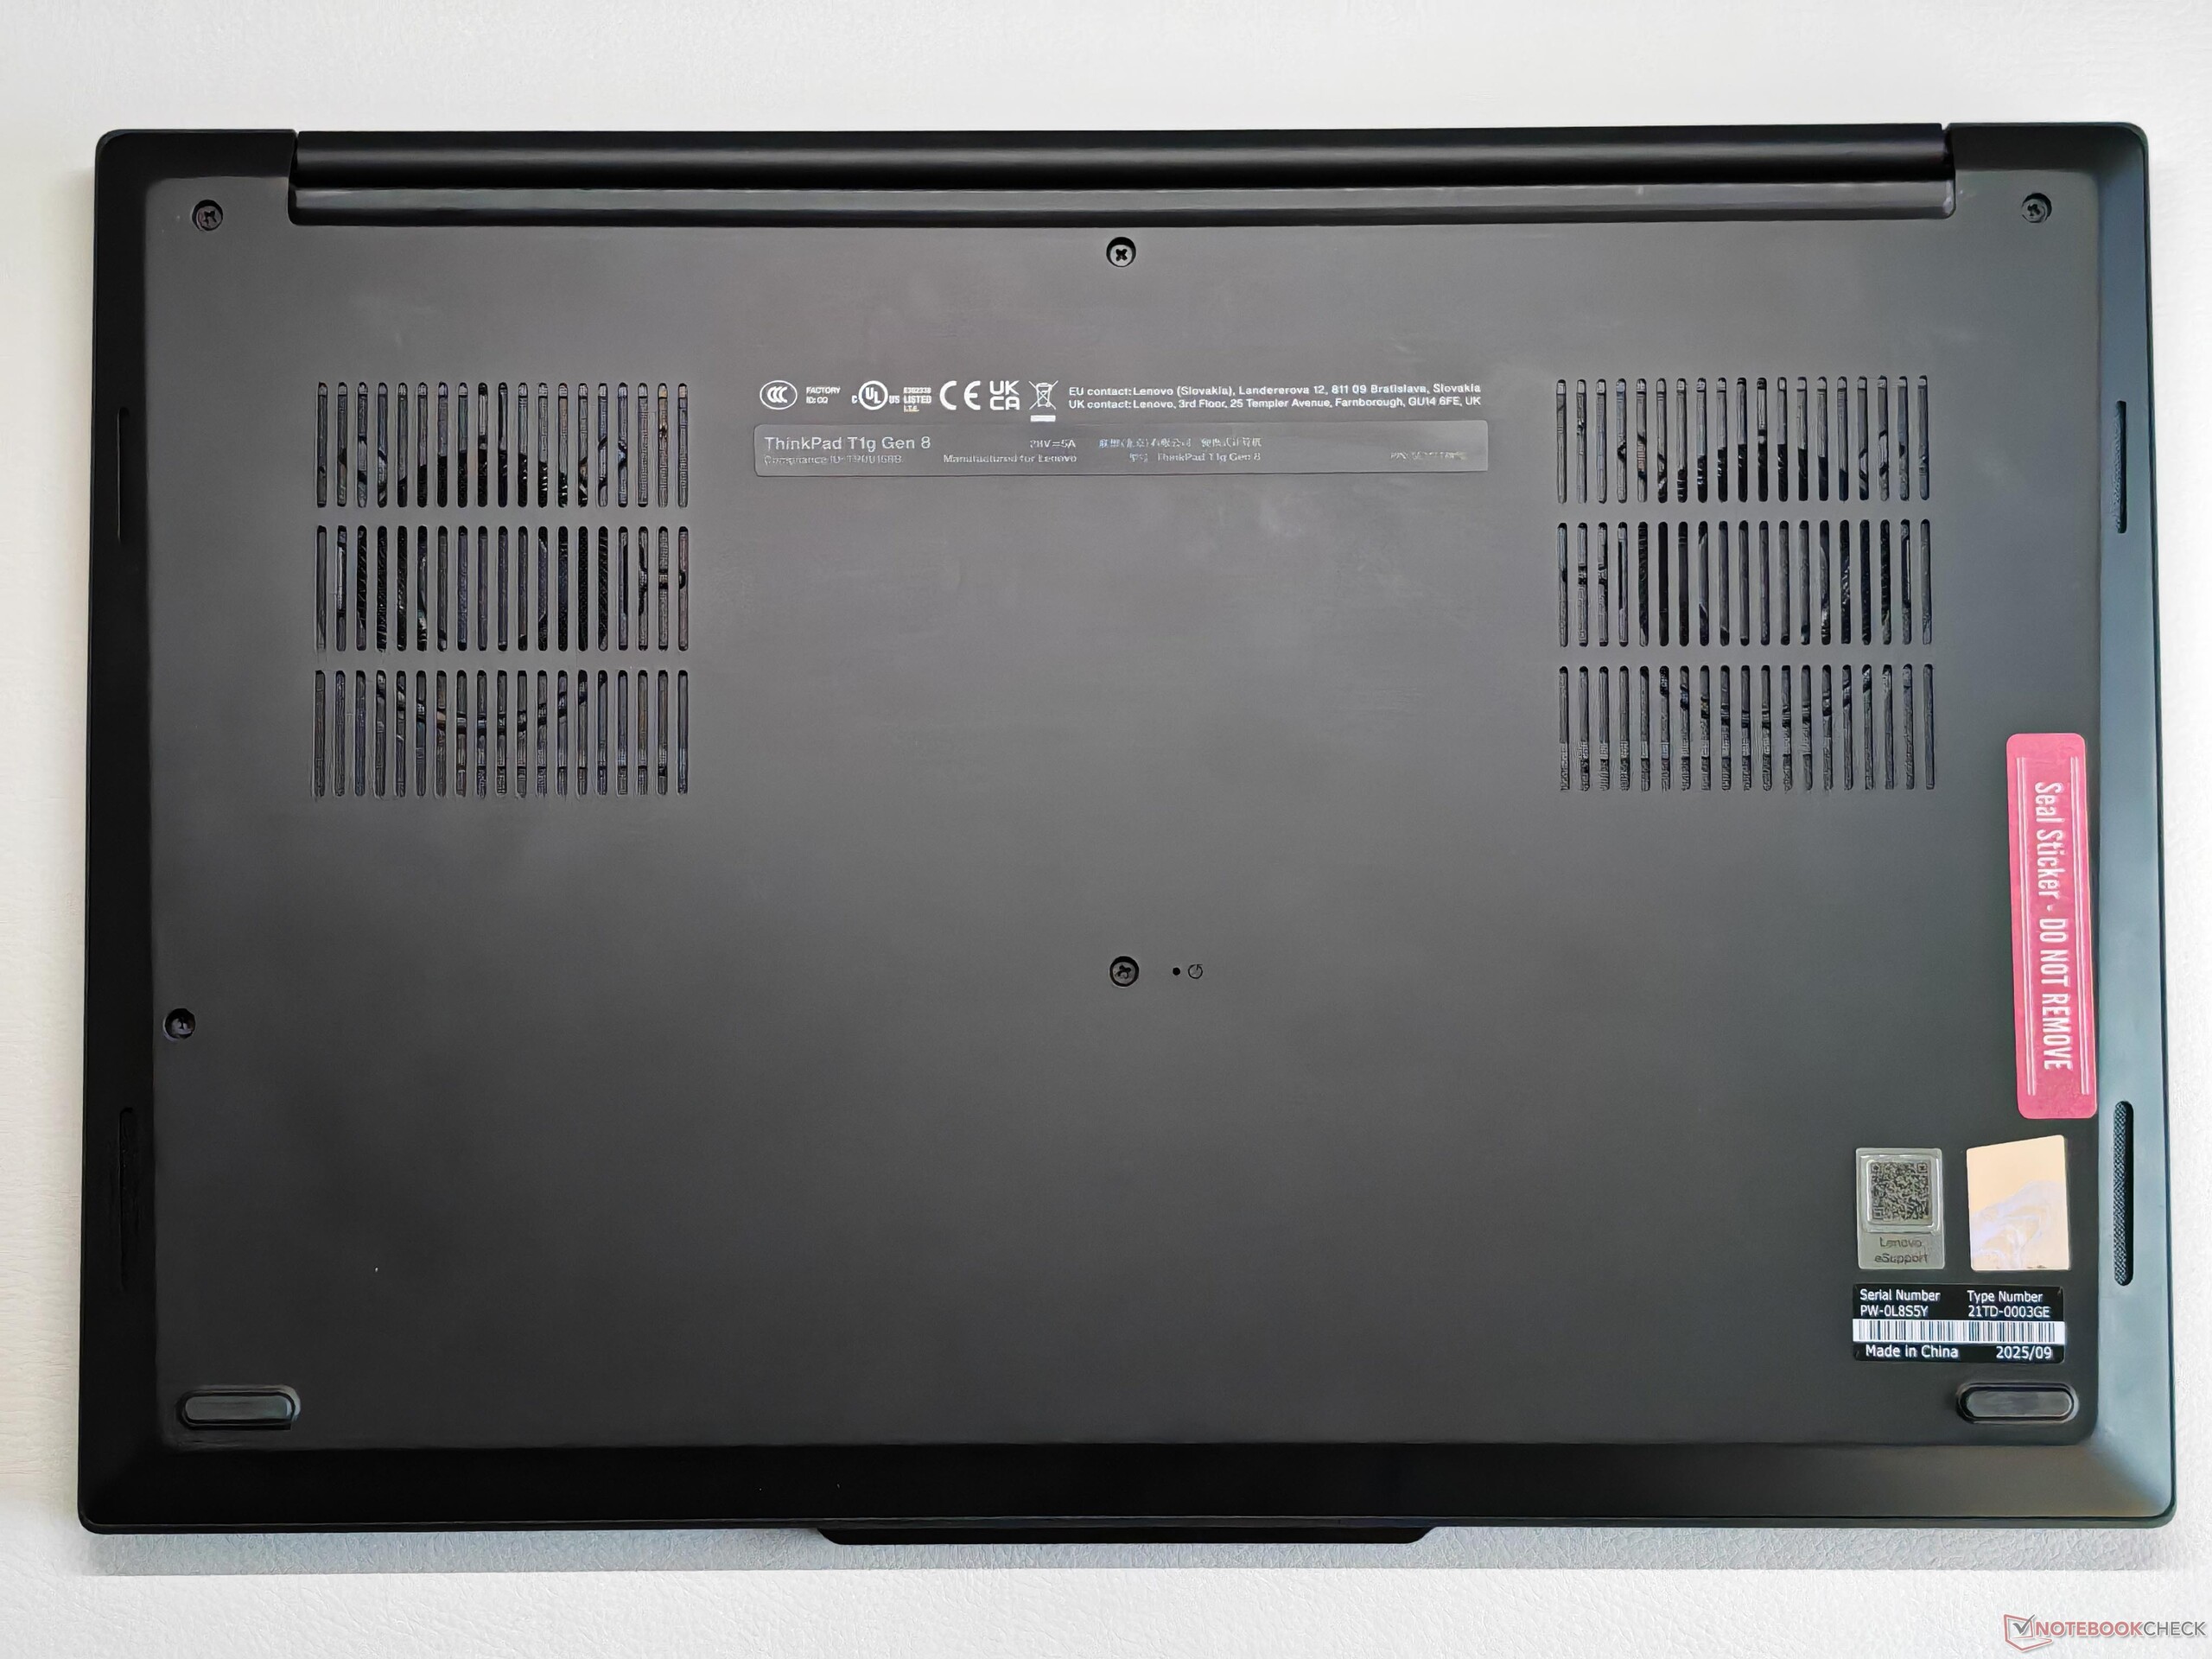
Manutenzione
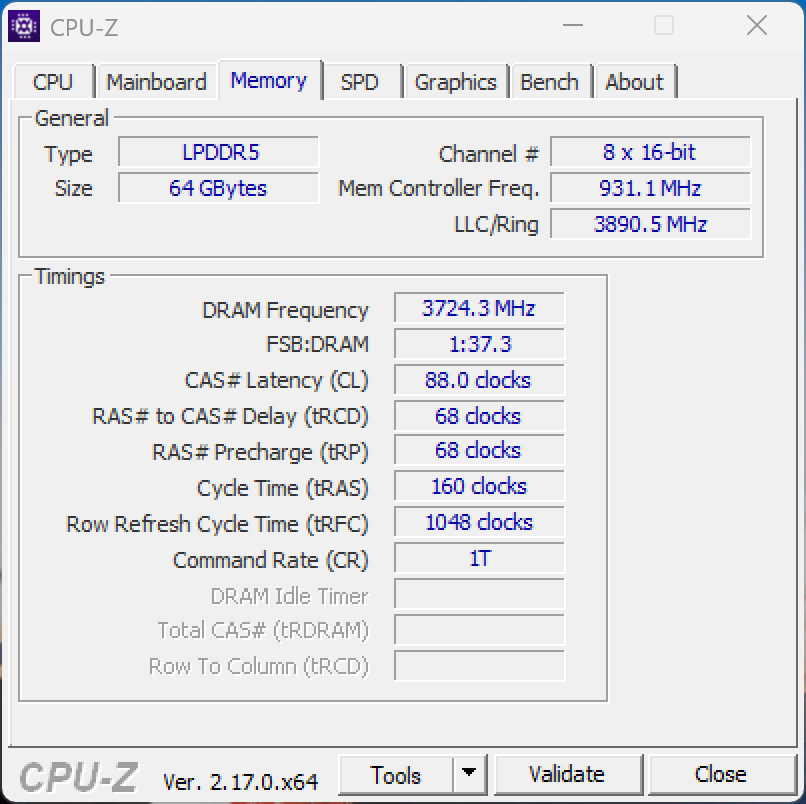
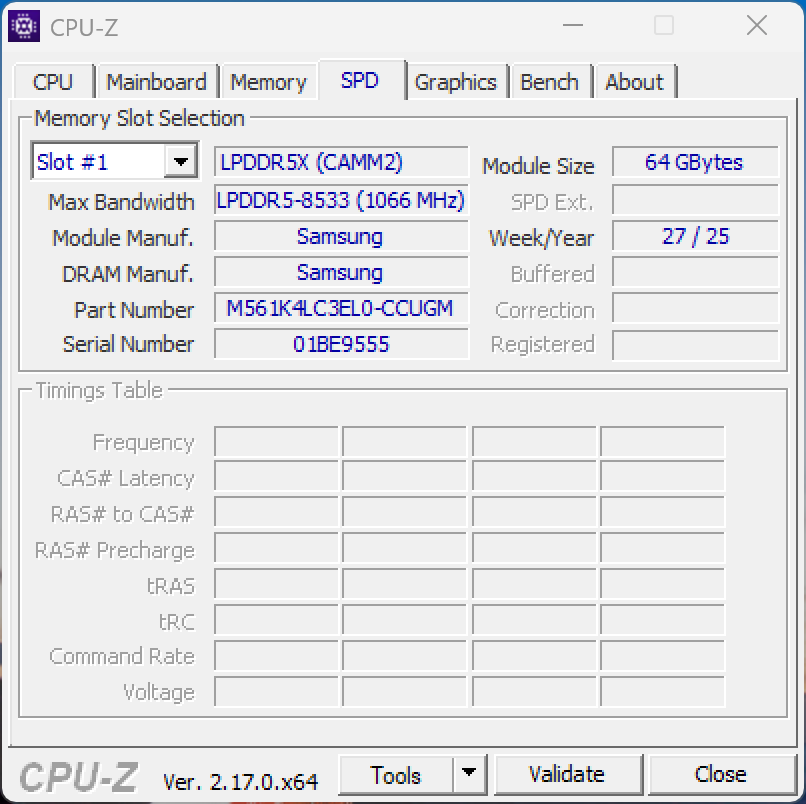
Nel complesso, le opzioni di manutenzione sono buone e la RAM può essere sostituita grazie a un modulo CAMM2, anche se la capacità massima supportata è limitata a 64 GB. Ci sono anche due slot per SSD M.2-2280 (PCIe 5.0) e anche la batteria può essere sostituita. Il modulo Wi-Fi, invece, è saldato in posizione.


Sostenibilità
Lenovo offre un'ampia trasparenza sull'impronta di CO₂ del dispositivo e sull'uso di materiali riciclati.

Dispositivi di input - tastiera eccellente
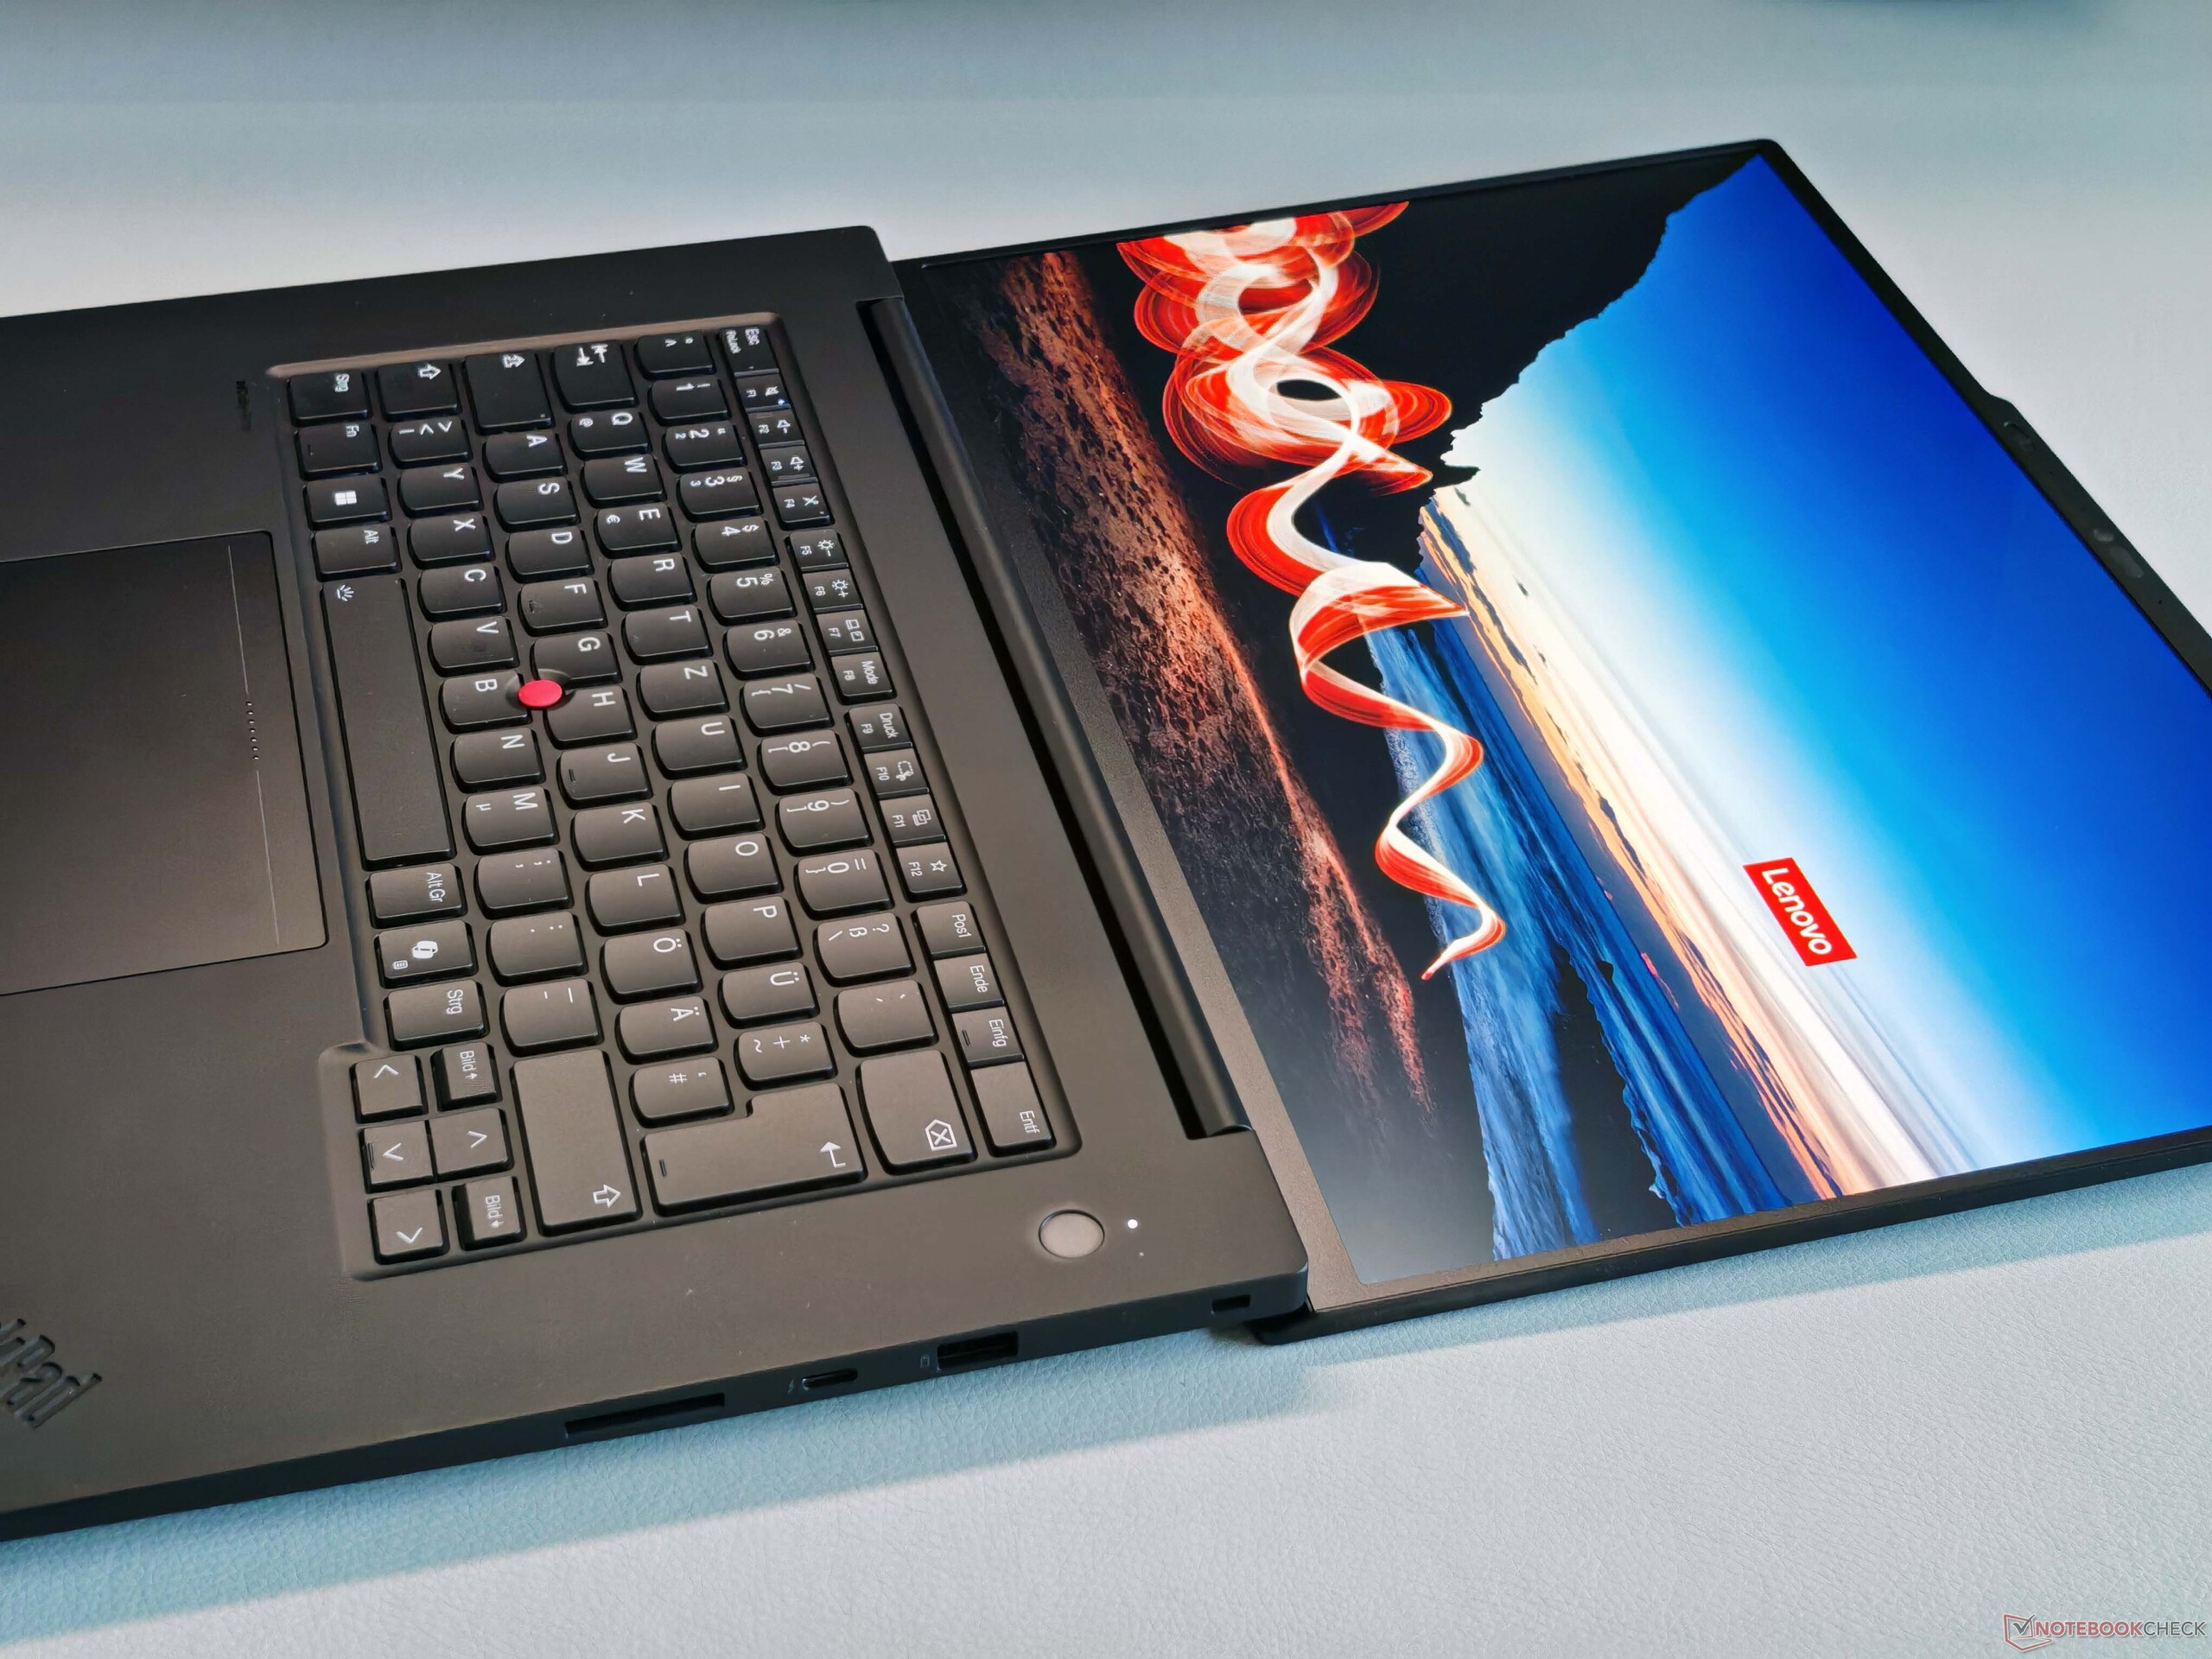
Anche se il layout della tastiera retroilluminata non è ideale in alcuni punti (ad esempio, i tasti più stretti per le umlaut), l'esperienza di digitazione è eccezionale ed è senza dubbio una delle migliori tastiere mobili che Lenovo offre attualmente. Soggettivamente, la corsa dei tasti sembra più lunga di 1,5 mm, evocando ricordi dei vecchi modelli ThinkPad.
Anche il touchpad aptico si comporta in modo eccellente, soprattutto in combinazione con il TrackPoint. Per informazioni più dettagliate, rimandiamo i lettori alla nostra recensione del ThinkPad P1 Gen 7. Il pannello OLED supporta anche l'input tattile, che funziona in modo affidabile, e nella confezione è incluso uno stilo.


Display - Touchscreen OLED tandem opaco

Oltre ai due pannelli IPS (Full HD o 4K, entrambi a 60 Hz), Lenovo offre anche un pannello OLED Tandem opaco a 120 Hz (VRR), montato nella nostra unità di prova. Lo svantaggio principale di questa opzione è che la superficie opaca, combinata con lo strato touchscreen, produce un'impressione di immagine leggermente sgranata, in particolare con i contenuti luminosi. Di conseguenza, la qualità dell'immagine soggettiva appare un po' più debole rispetto a quella di concorrenti come lo Yoga Pro 9i 16 con il suo display OLED Tandem lucido. Il lato positivo è che i riflessi vengono eliminati in modo efficace.
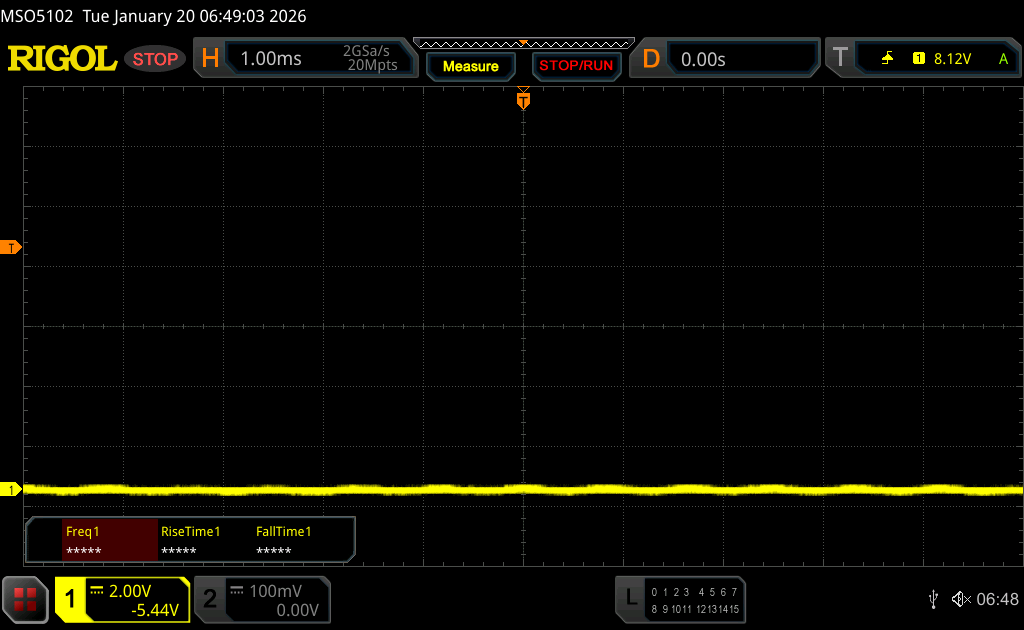
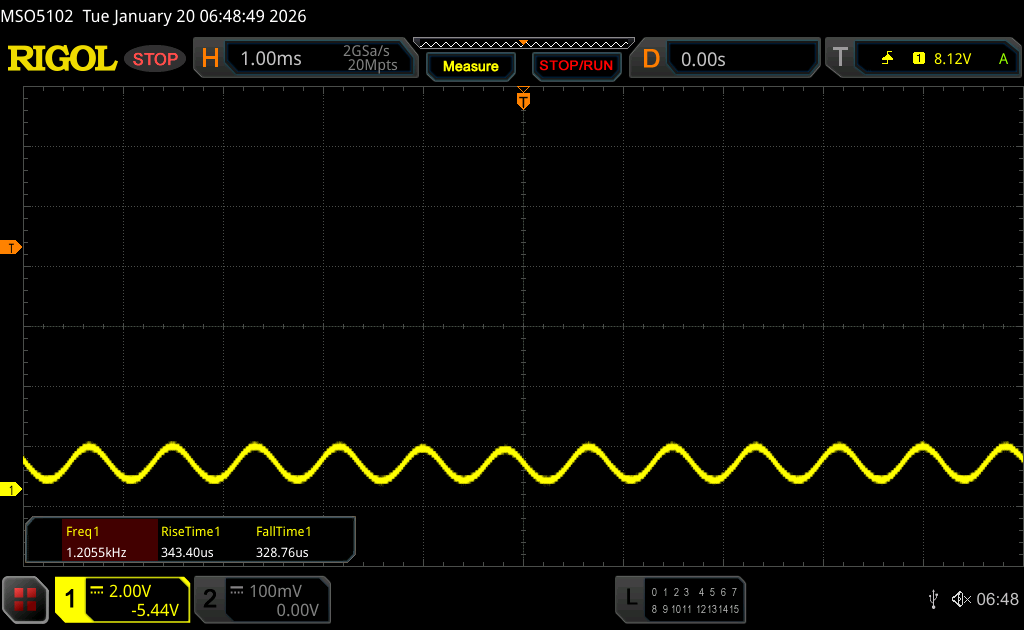
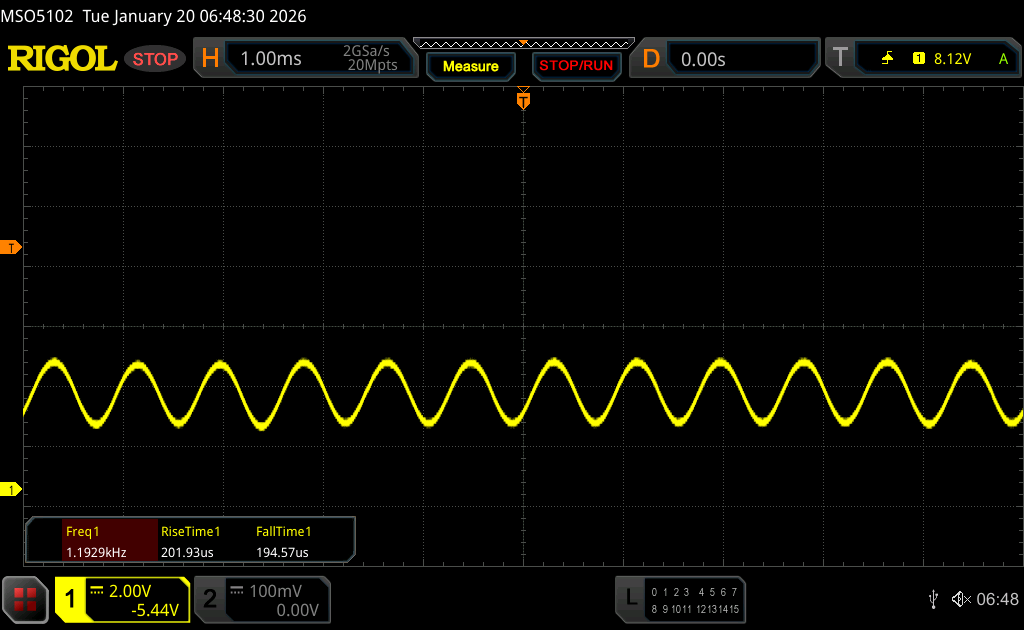
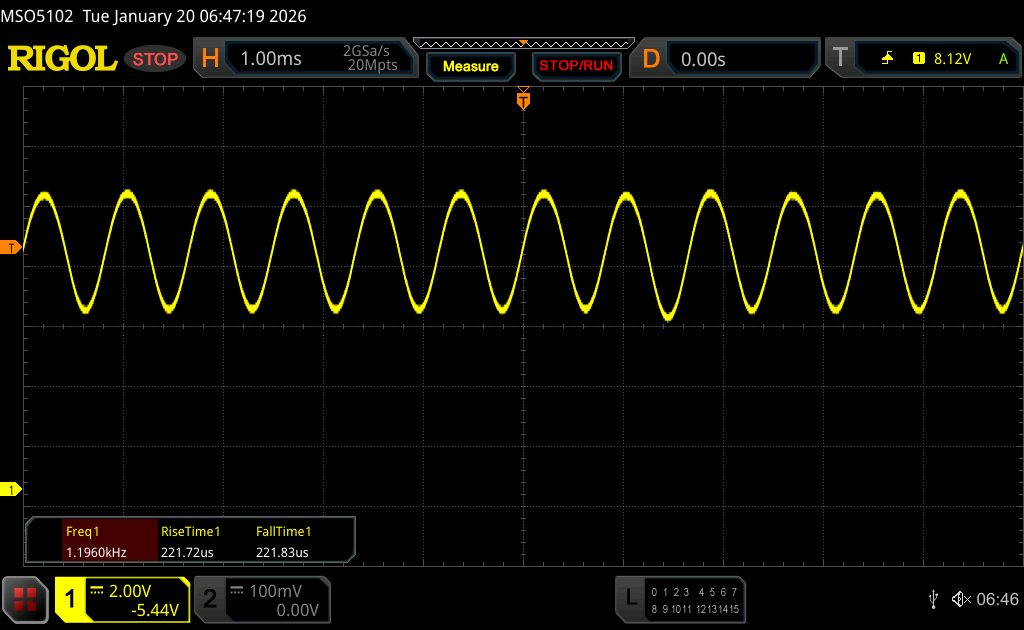
A livelli di luminosità del 70% e inferiori, è presente uno sfarfallio PWM misurabile. Tuttavia, con una frequenza elevata di circa 1,2 kHz e un'ampiezza ridotta, questo non dovrebbe rappresentare un problema significativo nella pratica.
La luminosità SDR raggiunge un solido ~600 cd/m², mentre i contenuti HDR raggiungono picchi fino a 1.530 cd/m² (o 753 cd/m² con un'immagine quasi completamente bianca). Sono disponibili diversi profili di colore, e l'accuratezza del colore sia per sRGB che per P3 (ciascuno coperto completamente) è buona. La riproduzione della scala di grigi potrebbe essere leggermente migliore, tuttavia, e la nostra calibrazione non ha portato a ulteriori miglioramenti.
| |||||||||||||||||||||||||
Distribuzione della luminosità: 98 %
Al centro con la batteria: 578 cd/m²
Contrasto: ∞:1 (Nero: 0 cd/m²)
ΔE ColorChecker Calman: 1.6 | ∀{0.5-29.43 Ø4.74}
ΔE Greyscale Calman: 2.6 | ∀{0.09-98 Ø4.99}
88.9% AdobeRGB 1998 (Argyll 3D)
100% sRGB (Argyll 3D)
98.8% Display P3 (Argyll 3D)
Gamma: 2.19
CCT: 6527 K
| Lenovo ThinkPad T1g Gen 8 21TD003GE ATNA60KA02-0, Tandem-OLED, 3200x2000, 16", 120 Hz | Lenovo Yoga Pro 9i 16 RTX 5070 ATNA60KA01-0, OLED, 3200x2000, 16", 120 Hz | Asus ProArt P16 RTX 5090 ATNA60HC03-0, OLED, 3840x2400, 16", 120 Hz | Dell 16 Premium DA16250 Samsung 163DU02, OLED, 3840x2400, 16.3", 120 Hz | Apple MacBook Pro 16 2024 M4 Pro Mini-LED, 3456x2234, 16.2", 120 Hz | |
|---|---|---|---|---|---|
| Display | 3% | 0% | 0% | 0% | |
| Display P3 Coverage (%) | 98.8 | 97.4 -1% | 98.9 0% | 99.7 1% | 99.7 1% |
| sRGB Coverage (%) | 100 | 100 0% | 100 0% | 100 0% | 100 0% |
| AdobeRGB 1998 Coverage (%) | 88.9 | 96.8 9% | 88.6 0% | 88.1 -1% | 88.8 0% |
| Response Times | 3% | -32% | -101% | -8819% | |
| Response Time Grey 50% / Grey 80% * (ms) | 0.26 ? | 0.27 ? -4% | 0.3 ? -15% | 0.61 ? -135% | 43 ? -16438% |
| Response Time Black / White * (ms) | 0.42 ? | 0.37 ? 12% | 0.45 ? -7% | 0.88 ? -110% | 41.2 ? -9710% |
| PWM Frequency (Hz) | 1200 ? | 1200 | 480 ? | 490.8 ? | 14880 |
| PWM Amplitude * (%) | 22 | 22 -0% | 38 -73% | 35 -59% | 90 -309% |
| Screen | 49% | 41% | 6% | 36% | |
| Brightness middle (cd/m²) | 578 | 974 69% | 661 14% | 385.7 -33% | 632 9% |
| Brightness (cd/m²) | 583 | 979 68% | 663 14% | 387 -34% | 616 6% |
| Brightness Distribution (%) | 98 | 98 0% | 99 1% | 98 0% | 95 -3% |
| Black Level * (cd/m²) | |||||
| Colorchecker dE 2000 * | 1.6 | 0.9 44% | 0.5 69% | 1.36 15% | 0.6 63% |
| Colorchecker dE 2000 max. * | 4.5 | 1.7 62% | 1.4 69% | 2.85 37% | 1.2 73% |
| Greyscale dE 2000 * | 2.6 | 1.3 50% | 0.6 77% | 1.3 50% | 0.8 69% |
| Gamma | 2.19 100% | 2.21 100% | 2.19 100% | 2.2 100% | 2.21 100% |
| CCT | 6527 100% | 6751 96% | 6565 99% | 6282 103% | 6450 101% |
| Colorchecker dE 2000 calibrated * | 0.65 | ||||
| Media totale (Programma / Settaggio) | 18% /
26% | 3% /
12% | -32% /
-22% | -2928% /
-2187% |
* ... Meglio usare valori piccoli


Tempi di risposta del Display
| ↔ Tempi di risposta dal Nero al Bianco | ||
|---|---|---|
| 0.42 ms ... aumenta ↗ e diminuisce ↘ combinato | ↗ 0.23 ms Incremento |  |
| ↘ 0.19 ms Calo | ||
| Lo schermo ha mostrato valori di risposta molto veloci nei nostri tests ed è molto adatto per i gaming veloce. In confronto, tutti i dispositivi di test variano da 0.1 (minimo) a 240 (massimo) ms. » 0 % di tutti i dispositivi è migliore. Questo significa che i tempi di risposta rilevati sono migliori rispettto alla media di tutti i dispositivi testati (20 ms). | ||
| ↔ Tempo di risposta dal 50% Grigio all'80% Grigio | ||
| 0.26 ms ... aumenta ↗ e diminuisce ↘ combinato | ↗ 0.12 ms Incremento |  |
| ↘ 0.14 ms Calo | ||
| Lo schermo ha mostrato valori di risposta molto veloci nei nostri tests ed è molto adatto per i gaming veloce. In confronto, tutti i dispositivi di test variano da 0.165 (minimo) a 636 (massimo) ms. » 0 % di tutti i dispositivi è migliore. Questo significa che i tempi di risposta rilevati sono migliori rispettto alla media di tutti i dispositivi testati (31.3 ms). | ||
Sfarfallio dello schermo / PWM (Pulse-Width Modulation)
| flickering dello schermo / PWM rilevato | 1200 Hz Amplitude: 22 % | ≤ 70 % settaggio luminosita' |  |
Il display sfarfalla a 1200 Hz (Probabilmente a causa dell'uso di PWM) Flickering rilevato ad una luminosita' di 70 % o inferiore. Non dovrebbe verificarsi flickering o PWM sopra questo valore di luminosita'. La frequenza di 1200 Hz è abbastanza alta, quindi la maggioranza degli utenti sensibili al PWM non dovrebbero notare alcun flickering. In confronto: 53 % di tutti i dispositivi testati non utilizza PWM per ridurre la luminosita' del display. Se è rilevato PWM, una media di 7923 (minimo: 5 - massimo: 343500) Hz è stata rilevata. | |||


Prestazioni - Arrow Lake e Blackwell
Condizioni del test
Come è tipico dei ThinkPad, i profili energetici di Lenovo sono direttamente collegati alle impostazioni energetiche di Windows. Tutti i benchmark sono stati eseguiti utilizzando la modalità " Best performance".
Processore
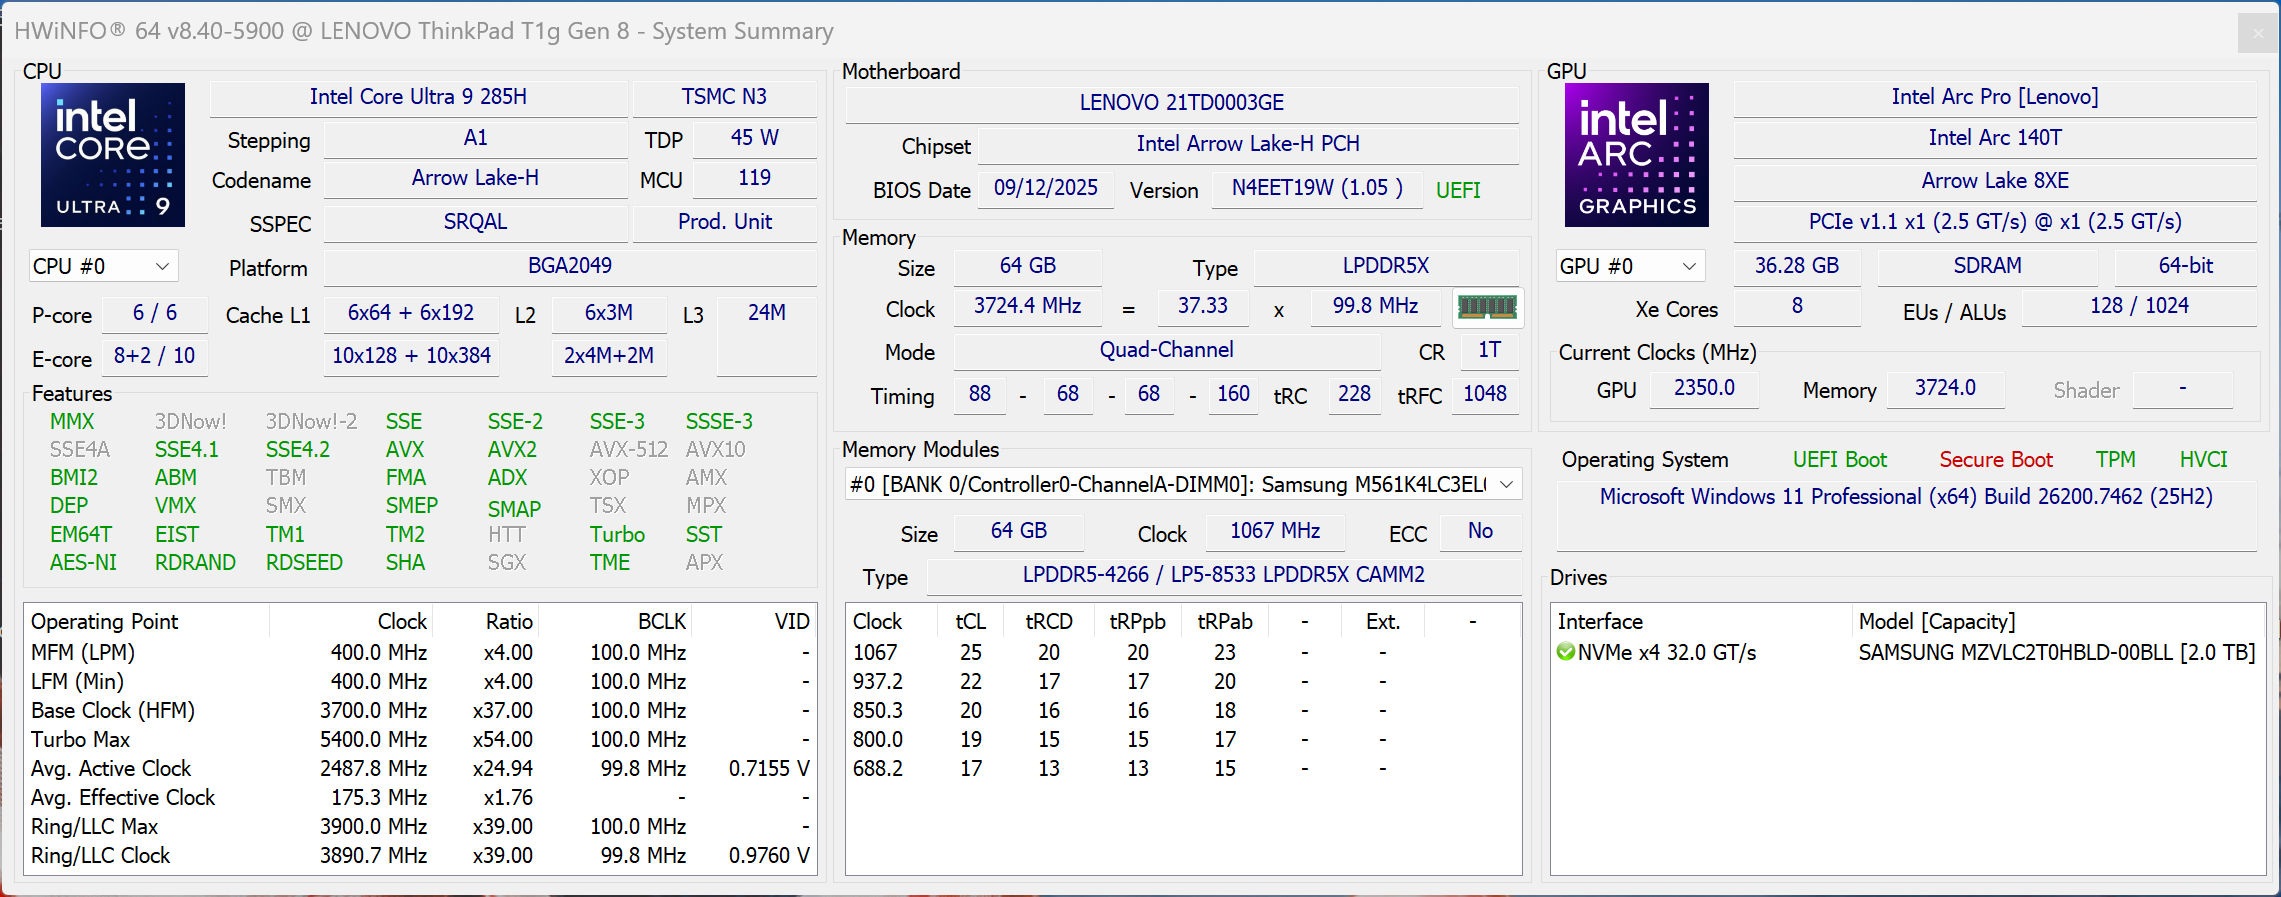
Lenovo equipaggia il ThinkPad T1g Gen 8 con l'Intel Core Ultra 9 285H Intel Core Ultra 9 285H (Arrow Lake), che è in grado di assorbire fino a 105 watt per brevi periodi, prima di stabilizzarsi intorno ai 74 watt. Le prestazioni della CPU sono complessivamente forti e i concorrenti basati su Windows sono in gran parte su un livello simile, con solo l'M4 Max di AppleM4 Max che opera in una classe di prestazioni chiaramente diversa.
Quando funziona a batteria, il processore è limitato a un massimo di 45 watt, che si traduce in una modesta riduzione delle prestazioni multi-core di circa l'11%.
Test Cinebench R15 Multi sostenuto
Cinebench 2024: CPU Multi Core | CPU Single Core
Cinebench R23: Multi Core | Single Core
Cinebench R20: CPU (Multi Core) | CPU (Single Core)
Cinebench R15: CPU Multi 64Bit | CPU Single 64Bit
Blender: v2.79 BMW27 CPU
7-Zip 18.03: 7z b 4 | 7z b 4 -mmt1
Geekbench 6.6: Multi-Core | Single-Core
Geekbench 5.5: Multi-Core | Single-Core
HWBOT x265 Benchmark v2.2: 4k Preset
LibreOffice : 20 Documents To PDF
R Benchmark 2.5: Overall mean
| CPU Performance rating | |
| Apple MacBook Pro 16 M4 Max -8! | |
| Lenovo Yoga Pro 9i 16 RTX 5070 | |
| Lenovo ThinkPad T1g Gen 8 21TD003GE | |
| Asus ProArt P16 RTX 5090 | |
| Lenovo ThinkPad P1 Gen 8 | |
| Dell 16 Premium DA16250 | |
| Media Intel Core Ultra 9 285H | |
| Media della classe Multimedia | |
| Cinebench 2024 / CPU Multi Core | |
| Apple MacBook Pro 16 M4 Max | |
| Apple MacBook Pro 16 M4 Max | |
| Asus ProArt P16 RTX 5090 | |
| Lenovo Yoga Pro 9i 16 RTX 5070 | |
| Lenovo ThinkPad P1 Gen 8 | |
| Lenovo ThinkPad T1g Gen 8 21TD003GE | |
| Dell 16 Premium DA16250 | |
| Media Intel Core Ultra 9 285H (740 - 1194, n=11) | |
| Media della classe Multimedia (327 - 2437, n=77, ultimi 2 anni) | |
| Cinebench 2024 / CPU Single Core | |
| Apple MacBook Pro 16 M4 Max | |
| Lenovo Yoga Pro 9i 16 RTX 5070 | |
| Media Intel Core Ultra 9 285H (124.8 - 130, n=11) | |
| Media della classe Multimedia (72.5 - 201, n=56, ultimi 2 anni) | |
| Lenovo ThinkPad T1g Gen 8 21TD003GE | |
| Lenovo ThinkPad P1 Gen 8 | |
| Dell 16 Premium DA16250 | |
| Asus ProArt P16 RTX 5090 | |
| Cinebench R23 / Multi Core | |
| Apple MacBook Pro 16 M4 Max | |
| Asus ProArt P16 RTX 5090 | |
| Lenovo Yoga Pro 9i 16 RTX 5070 | |
| Lenovo ThinkPad T1g Gen 8 21TD003GE | |
| Lenovo ThinkPad P1 Gen 8 | |
| Dell 16 Premium DA16250 | |
| Media Intel Core Ultra 9 285H (15070 - 23576, n=12) | |
| Media della classe Multimedia (4861 - 33362, n=76, ultimi 2 anni) | |
| Cinebench R23 / Single Core | |
| Apple MacBook Pro 16 M4 Max | |
| Lenovo Yoga Pro 9i 16 RTX 5070 | |
| Lenovo ThinkPad T1g Gen 8 21TD003GE | |
| Media Intel Core Ultra 9 285H (1979 - 2166, n=12) | |
| Asus ProArt P16 RTX 5090 | |
| Lenovo ThinkPad P1 Gen 8 | |
| Media della classe Multimedia (1128 - 2459, n=69, ultimi 2 anni) | |
| Dell 16 Premium DA16250 | |
| Cinebench R20 / CPU (Multi Core) | |
| Asus ProArt P16 RTX 5090 | |
| Lenovo Yoga Pro 9i 16 RTX 5070 | |
| Lenovo ThinkPad T1g Gen 8 21TD003GE | |
| Lenovo ThinkPad P1 Gen 8 | |
| Dell 16 Premium DA16250 | |
| Media Intel Core Ultra 9 285H (5861 - 9208, n=12) | |
| Apple MacBook Pro 16 M4 Max | |
| Media della classe Multimedia (1887 - 12912, n=61, ultimi 2 anni) | |
| Cinebench R20 / CPU (Single Core) | |
| Lenovo Yoga Pro 9i 16 RTX 5070 | |
| Lenovo ThinkPad T1g Gen 8 21TD003GE | |
| Media Intel Core Ultra 9 285H (761 - 837, n=12) | |
| Asus ProArt P16 RTX 5090 | |
| Lenovo ThinkPad P1 Gen 8 | |
| Dell 16 Premium DA16250 | |
| Media della classe Multimedia (420 - 853, n=61, ultimi 2 anni) | |
| Apple MacBook Pro 16 M4 Max | |
| Cinebench R15 / CPU Multi 64Bit | |
| Apple MacBook Pro 16 M4 Max | |
| Asus ProArt P16 RTX 5090 | |
| Lenovo Yoga Pro 9i 16 RTX 5070 | |
| Lenovo ThinkPad T1g Gen 8 21TD003GE | |
| Dell 16 Premium DA16250 | |
| Lenovo ThinkPad P1 Gen 8 | |
| Media Intel Core Ultra 9 285H (2280 - 3496, n=12) | |
| Media della classe Multimedia (856 - 5224, n=66, ultimi 2 anni) | |
| Cinebench R15 / CPU Single 64Bit | |
| Lenovo Yoga Pro 9i 16 RTX 5070 | |
| Lenovo ThinkPad T1g Gen 8 21TD003GE | |
| Media Intel Core Ultra 9 285H (288 - 322, n=12) | |
| Apple MacBook Pro 16 M4 Max | |
| Lenovo ThinkPad P1 Gen 8 | |
| Dell 16 Premium DA16250 | |
| Media della classe Multimedia (99.6 - 326, n=64, ultimi 2 anni) | |
| Asus ProArt P16 RTX 5090 | |
| Blender / v2.79 BMW27 CPU | |
| Media della classe Multimedia (100 - 557, n=62, ultimi 2 anni) | |
| Media Intel Core Ultra 9 285H (151 - 235, n=12) | |
| Lenovo ThinkPad P1 Gen 8 | |
| Dell 16 Premium DA16250 | |
| Lenovo ThinkPad T1g Gen 8 21TD003GE | |
| Lenovo Yoga Pro 9i 16 RTX 5070 | |
| Asus ProArt P16 RTX 5090 | |
| 7-Zip 18.03 / 7z b 4 | |
| Asus ProArt P16 RTX 5090 | |
| Lenovo Yoga Pro 9i 16 RTX 5070 | |
| Lenovo ThinkPad T1g Gen 8 21TD003GE | |
| Dell 16 Premium DA16250 | |
| Lenovo ThinkPad P1 Gen 8 | |
| Media Intel Core Ultra 9 285H (50116 - 71959, n=12) | |
| Media della classe Multimedia (29095 - 130368, n=60, ultimi 2 anni) | |
| 7-Zip 18.03 / 7z b 4 -mmt1 | |
| Lenovo Yoga Pro 9i 16 RTX 5070 | |
| Asus ProArt P16 RTX 5090 | |
| Media Intel Core Ultra 9 285H (5403 - 6419, n=12) | |
| Lenovo ThinkPad T1g Gen 8 21TD003GE | |
| Media della classe Multimedia (3666 - 7545, n=60, ultimi 2 anni) | |
| Dell 16 Premium DA16250 | |
| Lenovo ThinkPad P1 Gen 8 | |
| Geekbench 6.6 / Multi-Core | |
| Apple MacBook Pro 16 M4 Max | |
| Lenovo Yoga Pro 9i 16 RTX 5070 | |
| Lenovo ThinkPad T1g Gen 8 21TD003GE | |
| Dell 16 Premium DA16250 | |
| Lenovo ThinkPad P1 Gen 8 | |
| Media Intel Core Ultra 9 285H (15284 - 17992, n=15) | |
| Asus ProArt P16 RTX 5090 | |
| Media della classe Multimedia (4983 - 29415, n=75, ultimi 2 anni) | |
| Geekbench 6.6 / Single-Core | |
| Apple MacBook Pro 16 M4 Max | |
| Lenovo Yoga Pro 9i 16 RTX 5070 | |
| Lenovo ThinkPad T1g Gen 8 21TD003GE | |
| Asus ProArt P16 RTX 5090 | |
| Media Intel Core Ultra 9 285H (2665 - 3110, n=15) | |
| Media della classe Multimedia (1534 - 4326, n=71, ultimi 2 anni) | |
| Lenovo ThinkPad P1 Gen 8 | |
| Dell 16 Premium DA16250 | |
| Geekbench 5.5 / Multi-Core | |
| Lenovo Yoga Pro 9i 16 RTX 5070 | |
| Lenovo ThinkPad T1g Gen 8 21TD003GE | |
| Dell 16 Premium DA16250 | |
| Lenovo ThinkPad P1 Gen 8 | |
| Media Intel Core Ultra 9 285H (13140 - 17487, n=13) | |
| Asus ProArt P16 RTX 5090 | |
| Media della classe Multimedia (4652 - 20422, n=60, ultimi 2 anni) | |
| Geekbench 5.5 / Single-Core | |
| Asus ProArt P16 RTX 5090 | |
| Lenovo Yoga Pro 9i 16 RTX 5070 | |
| Lenovo ThinkPad T1g Gen 8 21TD003GE | |
| Media Intel Core Ultra 9 285H (1689 - 2256, n=13) | |
| Lenovo ThinkPad P1 Gen 8 | |
| Dell 16 Premium DA16250 | |
| Media della classe Multimedia (805 - 2974, n=60, ultimi 2 anni) | |
| HWBOT x265 Benchmark v2.2 / 4k Preset | |
| Asus ProArt P16 RTX 5090 | |
| Lenovo Yoga Pro 9i 16 RTX 5070 | |
| Lenovo ThinkPad P1 Gen 8 | |
| Lenovo ThinkPad T1g Gen 8 21TD003GE | |
| Dell 16 Premium DA16250 | |
| Media Intel Core Ultra 9 285H (17.9 - 27.2, n=12) | |
| Media della classe Multimedia (5.26 - 36.1, n=60, ultimi 2 anni) | |
| LibreOffice / 20 Documents To PDF | |
| Media della classe Multimedia (23.9 - 146.7, n=61, ultimi 2 anni) | |
| Asus ProArt P16 RTX 5090 | |
| Media Intel Core Ultra 9 285H (39.4 - 56.1, n=12) | |
| Lenovo Yoga Pro 9i 16 RTX 5070 | |
| Dell 16 Premium DA16250 | |
| Lenovo ThinkPad T1g Gen 8 21TD003GE | |
| Lenovo ThinkPad P1 Gen 8 | |
| R Benchmark 2.5 / Overall mean | |
| Media della classe Multimedia (0.3604 - 0.947, n=60, ultimi 2 anni) | |
| Dell 16 Premium DA16250 | |
| Lenovo ThinkPad P1 Gen 8 | |
| Media Intel Core Ultra 9 285H (0.4079 - 0.4794, n=12) | |
| Lenovo ThinkPad T1g Gen 8 21TD003GE | |
| Asus ProArt P16 RTX 5090 | |
| Lenovo Yoga Pro 9i 16 RTX 5070 | |
* ... Meglio usare valori piccoli
AIDA64: FP32 Ray-Trace | FPU Julia | CPU SHA3 | CPU Queen | FPU SinJulia | FPU Mandel | CPU AES | CPU ZLib | FP64 Ray-Trace | CPU PhotoWorxx
| Performance rating | |
| Asus ProArt P16 RTX 5090 | |
| Lenovo Yoga Pro 9i 16 RTX 5070 | |
| Lenovo ThinkPad P1 Gen 8 | |
| Lenovo ThinkPad T1g Gen 8 21TD003GE | |
| Media Intel Core Ultra 9 285H | |
| Media della classe Multimedia | |
| AIDA64 / FP32 Ray-Trace | |
| Asus ProArt P16 RTX 5090 | |
| Lenovo Yoga Pro 9i 16 RTX 5070 | |
| Lenovo ThinkPad T1g Gen 8 21TD003GE | |
| Lenovo ThinkPad P1 Gen 8 | |
| Media Intel Core Ultra 9 285H (13687 - 24612, n=14) | |
| Media della classe Multimedia (2214 - 50388, n=57, ultimi 2 anni) | |
| AIDA64 / FPU Julia | |
| Asus ProArt P16 RTX 5090 | |
| Lenovo Yoga Pro 9i 16 RTX 5070 | |
| Lenovo ThinkPad P1 Gen 8 | |
| Lenovo ThinkPad T1g Gen 8 21TD003GE | |
| Media Intel Core Ultra 9 285H (54365 - 129641, n=14) | |
| Media della classe Multimedia (12867 - 201874, n=58, ultimi 2 anni) | |
| AIDA64 / CPU SHA3 | |
| Lenovo Yoga Pro 9i 16 RTX 5070 | |
| Lenovo ThinkPad P1 Gen 8 | |
| Lenovo ThinkPad T1g Gen 8 21TD003GE | |
| Asus ProArt P16 RTX 5090 | |
| Media Intel Core Ultra 9 285H (3473 - 5879, n=14) | |
| Media della classe Multimedia (653 - 8623, n=58, ultimi 2 anni) | |
| AIDA64 / CPU Queen | |
| Asus ProArt P16 RTX 5090 | |
| Media della classe Multimedia (13483 - 181505, n=54, ultimi 2 anni) | |
| Lenovo ThinkPad P1 Gen 8 | |
| Lenovo ThinkPad T1g Gen 8 21TD003GE | |
| Lenovo Yoga Pro 9i 16 RTX 5070 | |
| Media Intel Core Ultra 9 285H (53557 - 67363, n=12) | |
| AIDA64 / FPU SinJulia | |
| Asus ProArt P16 RTX 5090 | |
| Lenovo Yoga Pro 9i 16 RTX 5070 | |
| Media della classe Multimedia (1240 - 28794, n=58, ultimi 2 anni) | |
| Lenovo ThinkPad T1g Gen 8 21TD003GE | |
| Lenovo ThinkPad P1 Gen 8 | |
| Media Intel Core Ultra 9 285H (6921 - 9378, n=14) | |
| AIDA64 / FPU Mandel | |
| Asus ProArt P16 RTX 5090 | |
| Lenovo Yoga Pro 9i 16 RTX 5070 | |
| Lenovo ThinkPad P1 Gen 8 | |
| Lenovo ThinkPad T1g Gen 8 21TD003GE | |
| Media Intel Core Ultra 9 285H (38174 - 64632, n=14) | |
| Media della classe Multimedia (6395 - 105740, n=57, ultimi 2 anni) | |
| AIDA64 / CPU AES | |
| Asus ProArt P16 RTX 5090 | |
| Lenovo Yoga Pro 9i 16 RTX 5070 | |
| Lenovo ThinkPad P1 Gen 8 | |
| Lenovo ThinkPad T1g Gen 8 21TD003GE | |
| Media Intel Core Ultra 9 285H (58110 - 117613, n=14) | |
| Media della classe Multimedia (13243 - 126790, n=58, ultimi 2 anni) | |
| AIDA64 / CPU ZLib | |
| Asus ProArt P16 RTX 5090 | |
| Lenovo Yoga Pro 9i 16 RTX 5070 | |
| Lenovo ThinkPad P1 Gen 8 | |
| Lenovo ThinkPad T1g Gen 8 21TD003GE | |
| Media Intel Core Ultra 9 285H (574 - 1366, n=14) | |
| Media della classe Multimedia (167.2 - 2022, n=58, ultimi 2 anni) | |
| AIDA64 / FP64 Ray-Trace | |
| Asus ProArt P16 RTX 5090 | |
| Lenovo Yoga Pro 9i 16 RTX 5070 | |
| Lenovo ThinkPad P1 Gen 8 | |
| Lenovo ThinkPad T1g Gen 8 21TD003GE | |
| Media Intel Core Ultra 9 285H (5509 - 13527, n=14) | |
| Media della classe Multimedia (1014 - 26875, n=58, ultimi 2 anni) | |
| AIDA64 / CPU PhotoWorxx | |
| Lenovo Yoga Pro 9i 16 RTX 5070 | |
| Lenovo ThinkPad P1 Gen 8 | |
| Lenovo ThinkPad T1g Gen 8 21TD003GE | |
| Media Intel Core Ultra 9 285H (49874 - 65392, n=14) | |
| Asus ProArt P16 RTX 5090 | |
| Media della classe Multimedia (12860 - 88086, n=58, ultimi 2 anni) | |
Prestazioni del sistema
Come previsto, le prestazioni complessive del sistema sono molto buone e durante i test non sono stati riscontrati problemi di stabilità.
PCMark 10: Score | Essentials | Productivity | Digital Content Creation
CrossMark: Overall | Productivity | Creativity | Responsiveness
WebXPRT 3: Overall
WebXPRT 4: Overall
Mozilla Kraken 1.1: Total
| Performance rating | |
| Apple MacBook Pro 16 M4 Max -4! | |
| Lenovo ThinkPad T1g Gen 8 21TD003GE | |
| Media Intel Core Ultra 9 285H, NVIDIA GeForce RTX 5070 Laptop | |
| Lenovo ThinkPad P1 Gen 8 | |
| Lenovo Yoga Pro 9i 16 RTX 5070 | |
| Dell 16 Premium DA16250 -4! | |
| Media della classe Multimedia | |
| Asus ProArt P16 RTX 5090 -4! | |
| PCMark 10 / Score | |
| Lenovo ThinkPad T1g Gen 8 21TD003GE | |
| Lenovo ThinkPad P1 Gen 8 | |
| Media Intel Core Ultra 9 285H, NVIDIA GeForce RTX 5070 Laptop (8267 - 9691, n=2) | |
| Lenovo Yoga Pro 9i 16 RTX 5070 | |
| Media della classe Multimedia (4325 - 10386, n=54, ultimi 2 anni) | |
| PCMark 10 / Essentials | |
| Lenovo ThinkPad P1 Gen 8 | |
| Lenovo Yoga Pro 9i 16 RTX 5070 | |
| Media Intel Core Ultra 9 285H, NVIDIA GeForce RTX 5070 Laptop (10345 - 10564, n=2) | |
| Media della classe Multimedia (8025 - 11664, n=54, ultimi 2 anni) | |
| Lenovo ThinkPad T1g Gen 8 21TD003GE | |
| PCMark 10 / Productivity | |
| Lenovo ThinkPad P1 Gen 8 | |
| Lenovo ThinkPad T1g Gen 8 21TD003GE | |
| Media Intel Core Ultra 9 285H, NVIDIA GeForce RTX 5070 Laptop (9402 - 18233, n=2) | |
| Media della classe Multimedia (7323 - 18233, n=54, ultimi 2 anni) | |
| Lenovo Yoga Pro 9i 16 RTX 5070 | |
| PCMark 10 / Digital Content Creation | |
| Lenovo Yoga Pro 9i 16 RTX 5070 | |
| Media Intel Core Ultra 9 285H, NVIDIA GeForce RTX 5070 Laptop (13096 - 15438, n=2) | |
| Lenovo ThinkPad T1g Gen 8 21TD003GE | |
| Lenovo ThinkPad P1 Gen 8 | |
| Media della classe Multimedia (3651 - 16240, n=54, ultimi 2 anni) | |
| CrossMark / Overall | |
| Apple MacBook Pro 16 M4 Max | |
| Lenovo ThinkPad T1g Gen 8 21TD003GE | |
| Media Intel Core Ultra 9 285H, NVIDIA GeForce RTX 5070 Laptop (2077 - 2236, n=2) | |
| Lenovo Yoga Pro 9i 16 RTX 5070 | |
| Dell 16 Premium DA16250 | |
| Asus ProArt P16 RTX 5090 | |
| Lenovo ThinkPad P1 Gen 8 | |
| Media della classe Multimedia (866 - 2728, n=64, ultimi 2 anni) | |
| CrossMark / Productivity | |
| Lenovo ThinkPad T1g Gen 8 21TD003GE | |
| Apple MacBook Pro 16 M4 Max | |
| Media Intel Core Ultra 9 285H, NVIDIA GeForce RTX 5070 Laptop (1920 - 2092, n=2) | |
| Lenovo Yoga Pro 9i 16 RTX 5070 | |
| Dell 16 Premium DA16250 | |
| Lenovo ThinkPad P1 Gen 8 | |
| Asus ProArt P16 RTX 5090 | |
| Media della classe Multimedia (913 - 2489, n=64, ultimi 2 anni) | |
| CrossMark / Creativity | |
| Apple MacBook Pro 16 M4 Max | |
| Lenovo ThinkPad T1g Gen 8 21TD003GE | |
| Media Intel Core Ultra 9 285H, NVIDIA GeForce RTX 5070 Laptop (2438 - 2470, n=2) | |
| Lenovo Yoga Pro 9i 16 RTX 5070 | |
| Asus ProArt P16 RTX 5090 | |
| Dell 16 Premium DA16250 | |
| Lenovo ThinkPad P1 Gen 8 | |
| Media della classe Multimedia (907 - 3465, n=64, ultimi 2 anni) | |
| CrossMark / Responsiveness | |
| Lenovo ThinkPad T1g Gen 8 21TD003GE | |
| Media Intel Core Ultra 9 285H, NVIDIA GeForce RTX 5070 Laptop (1629 - 2024, n=2) | |
| Dell 16 Premium DA16250 | |
| Lenovo Yoga Pro 9i 16 RTX 5070 | |
| Lenovo ThinkPad P1 Gen 8 | |
| Apple MacBook Pro 16 M4 Max | |
| Asus ProArt P16 RTX 5090 | |
| Media della classe Multimedia (605 - 2024, n=64, ultimi 2 anni) | |
| WebXPRT 3 / Overall | |
| Apple MacBook Pro 16 M4 Max | |
| Lenovo Yoga Pro 9i 16 RTX 5070 | |
| Media Intel Core Ultra 9 285H, NVIDIA GeForce RTX 5070 Laptop (326 - 345, n=2) | |
| Media della classe Multimedia (136.4 - 596, n=67, ultimi 2 anni) | |
| Dell 16 Premium DA16250 | |
| Lenovo ThinkPad P1 Gen 8 | |
| Lenovo ThinkPad T1g Gen 8 21TD003GE | |
| Asus ProArt P16 RTX 5090 | |
| WebXPRT 4 / Overall | |
| Apple MacBook Pro 16 M4 Max | |
| Lenovo Yoga Pro 9i 16 RTX 5070 | |
| Media Intel Core Ultra 9 285H, NVIDIA GeForce RTX 5070 Laptop (303 - 311, n=2) | |
| Lenovo ThinkPad T1g Gen 8 21TD003GE | |
| Dell 16 Premium DA16250 | |
| Lenovo ThinkPad P1 Gen 8 | |
| Media della classe Multimedia (167.3 - 402, n=68, ultimi 2 anni) | |
| Asus ProArt P16 RTX 5090 | |
| Mozilla Kraken 1.1 / Total | |
| Dell 16 Premium DA16250 | |
| Media della classe Multimedia (228 - 835, n=71, ultimi 2 anni) | |
| Lenovo ThinkPad P1 Gen 8 | |
| Lenovo ThinkPad T1g Gen 8 21TD003GE | |
| Media Intel Core Ultra 9 285H, NVIDIA GeForce RTX 5070 Laptop (433 - 444, n=2) | |
| Lenovo Yoga Pro 9i 16 RTX 5070 | |
| Asus ProArt P16 RTX 5090 | |
| Apple MacBook Pro 16 M4 Max | |
* ... Meglio usare valori piccoli
| PCMark 10 Score | 9691 punti | |
Aiuto | ||
| AIDA64 / Memory Copy | |
| Lenovo Yoga Pro 9i 16 RTX 5070 | |
| Lenovo ThinkPad P1 Gen 8 | |
| Lenovo ThinkPad T1g Gen 8 21TD003GE | |
| Media Intel Core Ultra 9 285H (76179 - 109252, n=14) | |
| Asus ProArt P16 RTX 5090 | |
| Media della classe Multimedia (21158 - 131796, n=58, ultimi 2 anni) | |
| AIDA64 / Memory Read | |
| Asus ProArt P16 RTX 5090 | |
| Lenovo Yoga Pro 9i 16 RTX 5070 | |
| Media Intel Core Ultra 9 285H (74572 - 89837, n=14) | |
| Media della classe Multimedia (19699 - 125604, n=58, ultimi 2 anni) | |
| Lenovo ThinkPad T1g Gen 8 21TD003GE | |
| Lenovo ThinkPad P1 Gen 8 | |
| AIDA64 / Memory Write | |
| Asus ProArt P16 RTX 5090 | |
| Media della classe Multimedia (17733 - 134916, n=58, ultimi 2 anni) | |
| Media Intel Core Ultra 9 285H (62446 - 107584, n=14) | |
| Lenovo ThinkPad T1g Gen 8 21TD003GE | |
| Lenovo Yoga Pro 9i 16 RTX 5070 | |
| Lenovo ThinkPad P1 Gen 8 | |
| AIDA64 / Memory Latency | |
| Lenovo ThinkPad P1 Gen 8 | |
| Lenovo ThinkPad T1g Gen 8 21TD003GE | |
| Media Intel Core Ultra 9 285H (106.2 - 136.7, n=14) | |
| Lenovo Yoga Pro 9i 16 RTX 5070 | |
| Media della classe Multimedia (7 - 535, n=58, ultimi 2 anni) | |
| Asus ProArt P16 RTX 5090 | |
* ... Meglio usare valori piccoli
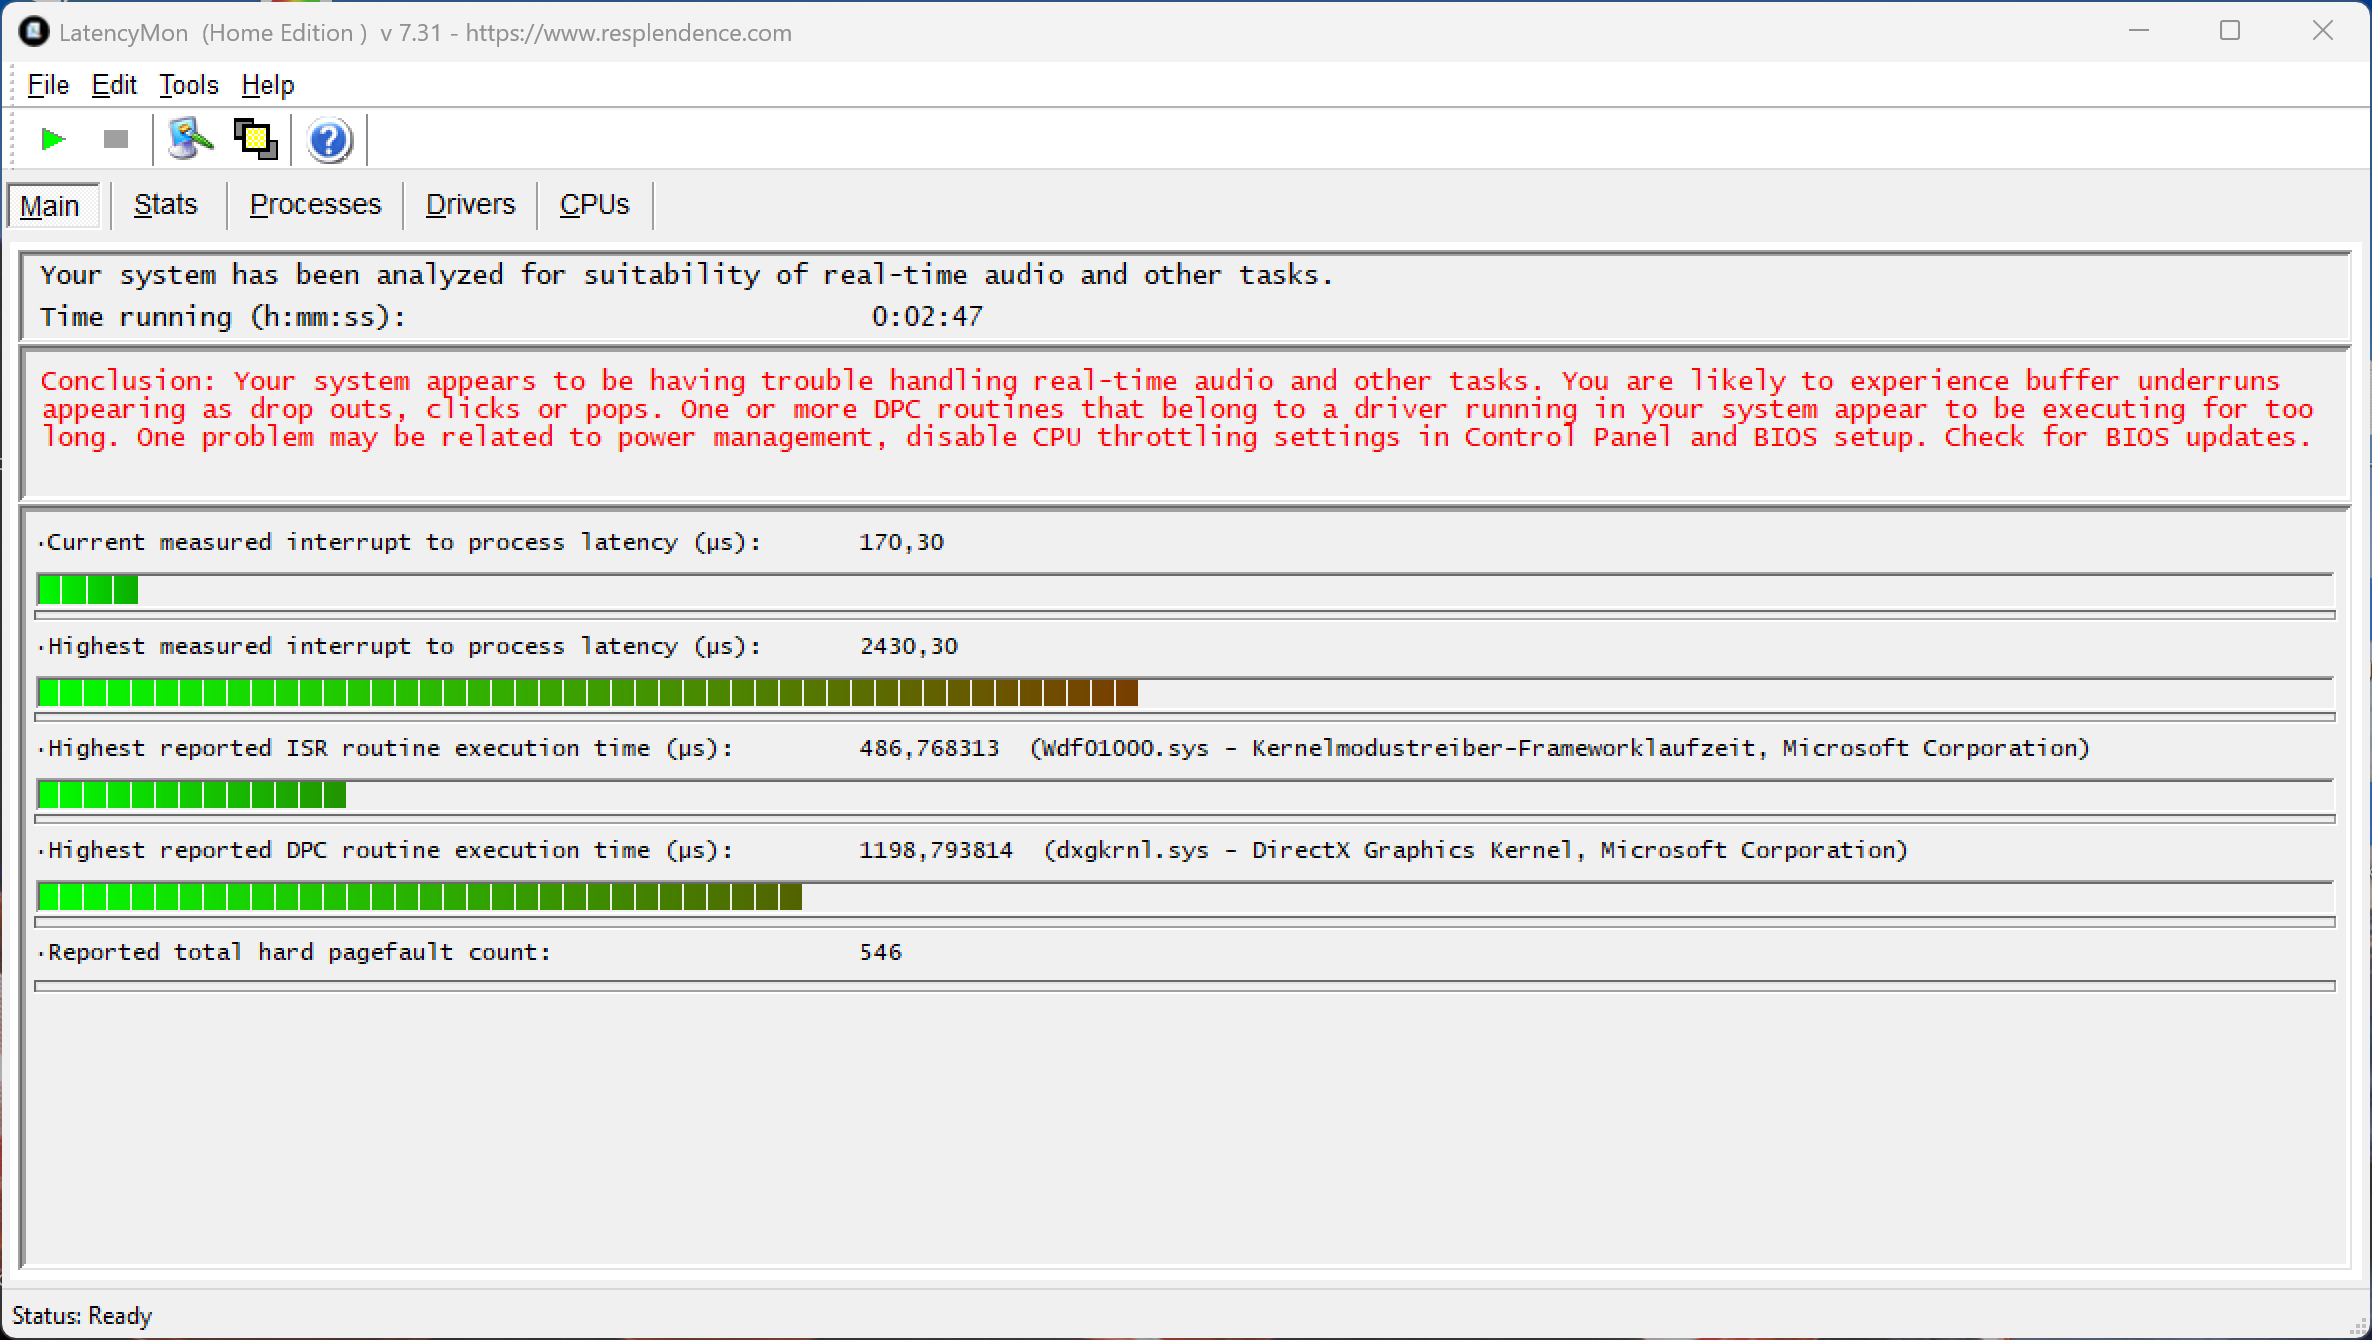
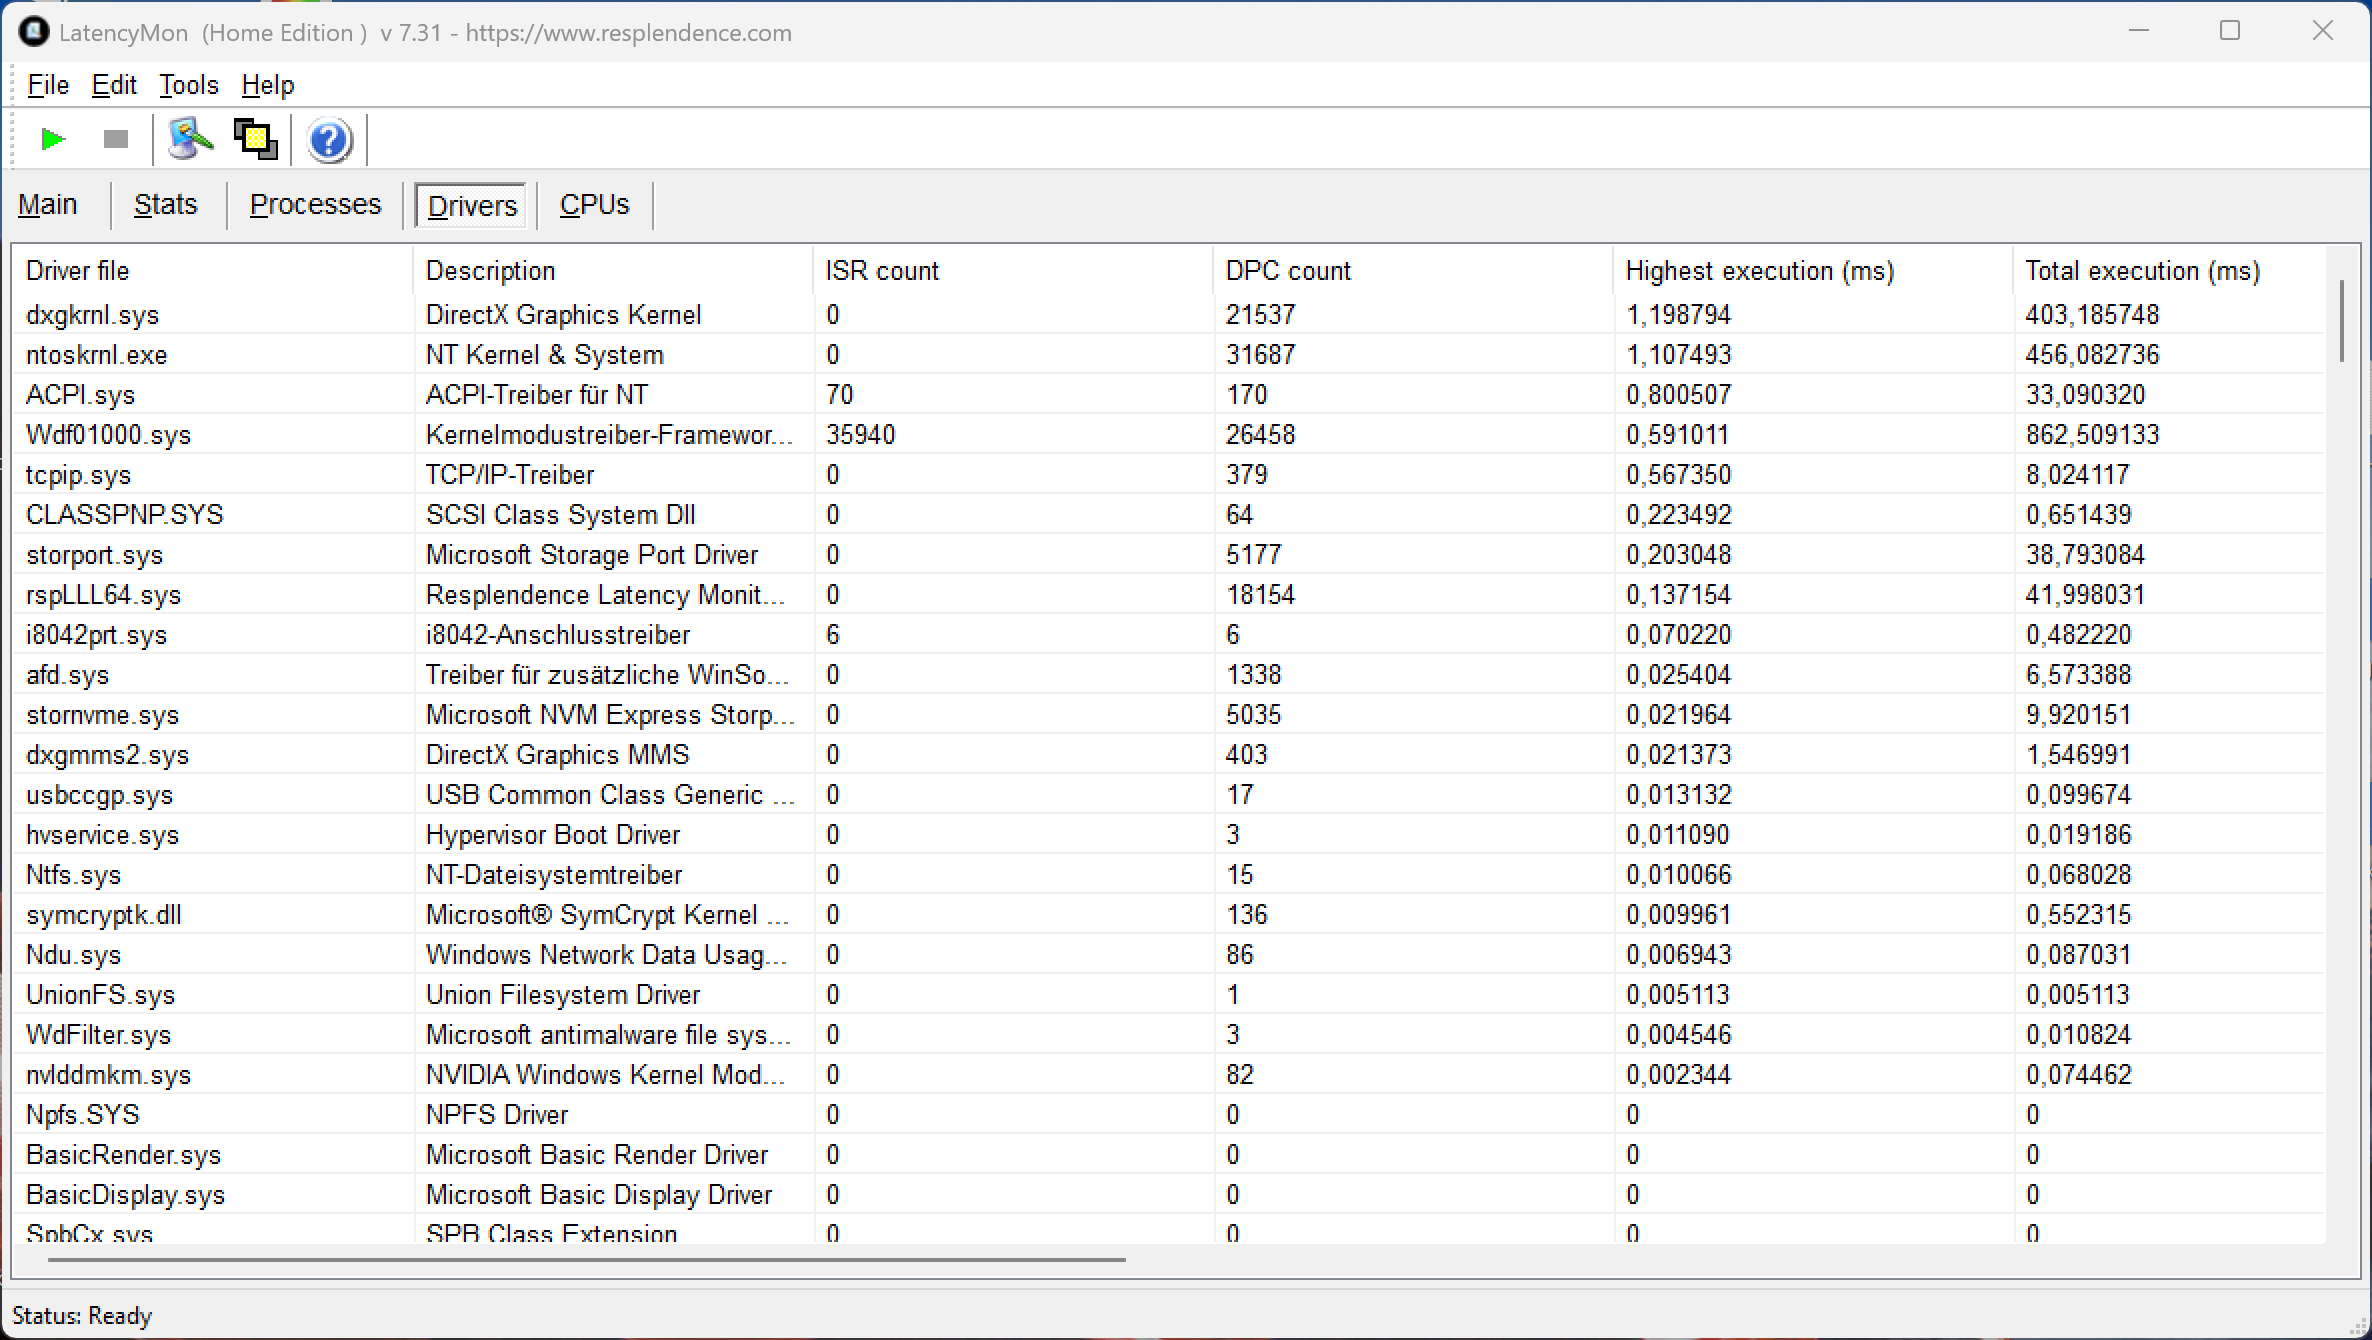
Latenze DPC
Nel nostro test di latenza standardizzato (navigazione web, riproduzione di YouTube 4K e carico della CPU), il sistema mostra dei limiti quando si tratta di utilizzare applicazioni audio in tempo reale.
| DPC Latencies / LatencyMon - interrupt to process latency (max), Web, Youtube, Prime95 | |
| Asus ProArt P16 RTX 5090 | |
| Lenovo ThinkPad P1 Gen 8 | |
| Lenovo ThinkPad T1g Gen 8 21TD003GE | |
| Lenovo Yoga Pro 9i 16 RTX 5070 | |
| Dell 16 Premium DA16250 | |
* ... Meglio usare valori piccoli
Dispositivi di archiviazione
Il ThinkPad T1g offre due slot M.2-2280, entrambi collegati tramite PCIe 5.0. Il Samsung PM9E1 installato (2 TB, 1,76 TB liberi) offre velocità di trasferimento buone e molto stabili, ma non sfrutta appieno la larghezza di banda PCIe 5.0 disponibile.

* ... Meglio usare valori piccoli
Prestazioni in lettura continua: Loop di lettura DiskSpd, profondità della coda 8
Prestazioni della GPU
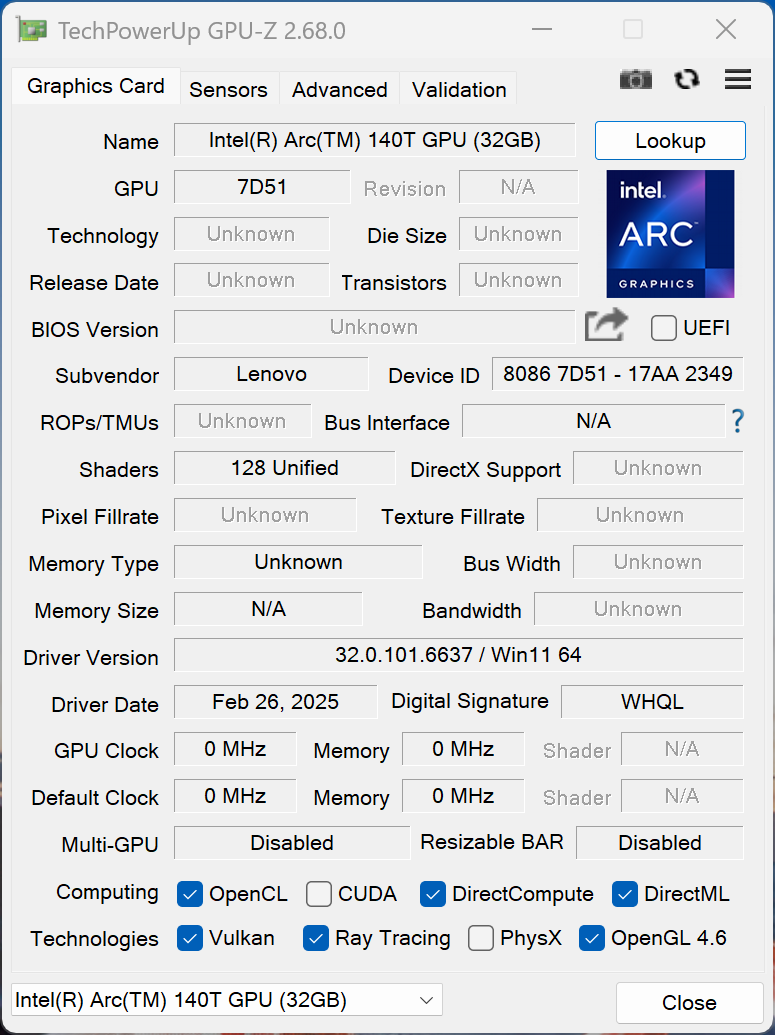
Lenovo utilizza la versione da 75 watt della mobile GeForce RTX 5070 (60 W + 15 W Dynamic Boost) con 8 GB di VRAM. Ciò la colloca ben al di sotto dei 115 watt massimi possibili. Di conseguenza, le prestazioni grafiche sono più deboli rispetto a quelle delle implementazioni RTX 5070 della concorrenza, e non possono avvicinarsi a quelle della RTX 5090 che si trova nella Asus ProArt P16. Solo il modello Dell 16 Premium con la sua RTX 5070 da 60 watt viene superato. Sotto carico sostenuto, le prestazioni della GPU rimangono completamente stabili, mentre con l'alimentazione a batteria il consumo massimo scende a 60 watt (-11%).
Anche il gioco è ovviamente possibile e molti titoli continuano a funzionare senza problemi alla risoluzione QHD. Abbiamo analizzato i limiti imposti dagli 8 GB di VRAM in un articolo dedicato.
| 3DMark 11 Performance | 33372 punti | |
| 3DMark Fire Strike Score | 27509 punti | |
| 3DMark Time Spy Score | 11672 punti | |
| 3DMark Steel Nomad Score | 2636 punti | |
| 3DMark Steel Nomad Light Score | 11903 punti | |
Aiuto | ||
| Blender / v3.3 Classroom OPTIX/RTX | |
| Media della classe Multimedia (12 - 105, n=26, ultimi 2 anni) | |
| Lenovo Yoga Pro 9i 16 RTX 5070 | |
| Lenovo ThinkPad T1g Gen 8 21TD003GE | |
| Dell 16 Premium DA16250 | |
| Lenovo ThinkPad P1 Gen 8 | |
| Media NVIDIA GeForce RTX 5070 Laptop (17 - 24, n=27) | |
| Asus ProArt P16 H7606WP | |
| Asus ProArt P16 RTX 5090 | |
| Blender / v3.3 Classroom CUDA | |
| Media della classe Multimedia (20 - 186, n=26, ultimi 2 anni) | |
| Lenovo ThinkPad P1 Gen 8 | |
| Media NVIDIA GeForce RTX 5070 Laptop (29 - 228, n=28) | |
| Lenovo ThinkPad T1g Gen 8 21TD003GE | |
| Dell 16 Premium DA16250 | |
| Lenovo Yoga Pro 9i 16 RTX 5070 | |
| Asus ProArt P16 H7606WP | |
| Asus ProArt P16 RTX 5090 | |
| Blender / v3.3 Classroom METAL | |
| Media della classe Multimedia (17.8 - 68, n=5, ultimi 2 anni) | |
| Apple MacBook Pro 16 M4 Max | |
| Blender / v3.3 Classroom CPU | |
| Media della classe Multimedia (134.5 - 1042, n=65, ultimi 2 anni) | |
| Dell 16 Premium DA16250 | |
| Lenovo ThinkPad P1 Gen 8 | |
| Media NVIDIA GeForce RTX 5070 Laptop (137 - 507, n=25) | |
| Lenovo ThinkPad T1g Gen 8 21TD003GE | |
| Lenovo Yoga Pro 9i 16 RTX 5070 | |
| Asus ProArt P16 H7606WP | |
| Asus ProArt P16 RTX 5090 | |
| Apple MacBook Pro 16 M4 Max | |
* ... Meglio usare valori piccoli
Cyberpunk 2077 grafico FPS ultra
| basso | medio | alto | ultra | QHD DLSS | QHD | |
|---|---|---|---|---|---|---|
| GTA V (2015) | 128 | 104.1 | ||||
| Dota 2 Reborn (2015) | 165.1 | 152.4 | 144.8 | 134.7 | ||
| Final Fantasy XV Benchmark (2018) | 216 | 156.2 | 119.9 | 88.6 | ||
| X-Plane 11.11 (2018) | 104.2 | 97.9 | 79.9 | |||
| Strange Brigade (2018) | 502 | 300 | 248 | 217 | 146.7 | |
| Baldur's Gate 3 (2023) | 150.4 | 122.1 | 106.8 | 106 | 72.8 | |
| Cyberpunk 2077 (2023) | 137.5 | 112.8 | 98 | 87.3 | 64.4 | 56.1 |
| F1 24 (2024) | 247 | 245 | 197.5 | 66.4 | 67 | 42.1 |
Emissioni e potenza
Emissioni di rumore

Il sistema di raffreddamento a doppia ventola fa un buon lavoro complessivo. Durante i carichi di lavoro leggeri, il sistema è spesso appena udibile, producendo solo un leggero rumore di fondo di circa 27 dB(A). A pieno carico, abbiamo misurato fino a 47,8 dB(A), il che rende comunque il ThinkPad T1g più silenzioso dei suoi concorrenti basati su Windows. Solo il MacBook Pro 16 con l'M4 Max rimane sensibilmente più silenzioso.
L'utilizzo dei profili di prestazioni alternativi consente di ridurre ulteriormente il rumore massimo della ventola(Migliore efficienza energetica: 38,9 dB(A); Bilanciato: 43,3 dB(A)). Questi livelli di rumore rimangono invariati durante il funzionamento a batteria. Non sono stati rilevati altri rumori elettronici sull'unità di prova.
Rumorosità
| Idle |
| 25 / 25 / 27.3 dB(A) |
| Sotto carico |
| 37.3 / 47.8 dB(A) |
 | ||
30 dB silenzioso 40 dB(A) udibile 50 dB(A) rumoroso |
||
min: | ||
| Lenovo ThinkPad T1g Gen 8 21TD003GE Ultra 9 285H, GeForce RTX 5070 Laptop | Lenovo Yoga Pro 9i 16 RTX 5070 Ultra 9 285H, GeForce RTX 5070 Laptop | Asus ProArt P16 RTX 5090 Ryzen AI 9 HX 370, GeForce RTX 5090 Laptop | Dell 16 Premium DA16250 Ultra 7 255H, GeForce RTX 5070 Laptop | Apple MacBook Pro 16 M4 Max M4 Max 16-Core, M4 Max 40-Core GPU | |
|---|---|---|---|---|---|
| Noise | -3% | -8% | 2% | 5% | |
| off /ambiente * (dB) | 25 | 24.1 4% | 24.2 3% | 23.2 7% | 24.1 4% |
| Idle Minimum * (dB) | 25 | 24.1 4% | 24.2 3% | 23.2 7% | 24.1 4% |
| Idle Average * (dB) | 25 | 24.1 4% | 27.6 -10% | 23.2 7% | 24.1 4% |
| Idle Maximum * (dB) | 27.3 | 25.1 8% | 32.6 -19% | 26.6 3% | 24.1 12% |
| Load Average * (dB) | 37.3 | 44.2 -18% | 42.6 -14% | 39.4 -6% | 42.2 -13% |
| Cyberpunk 2077 ultra * (dB) | 47.8 | 52.7 -10% | 51.2 -7% | 47.3 1% | 42.2 12% |
| Load Maximum * (dB) | 47.8 | 52.7 -10% | 53.2 -11% | 48.9 -2% | 42.2 12% |
* ... Meglio usare valori piccoli
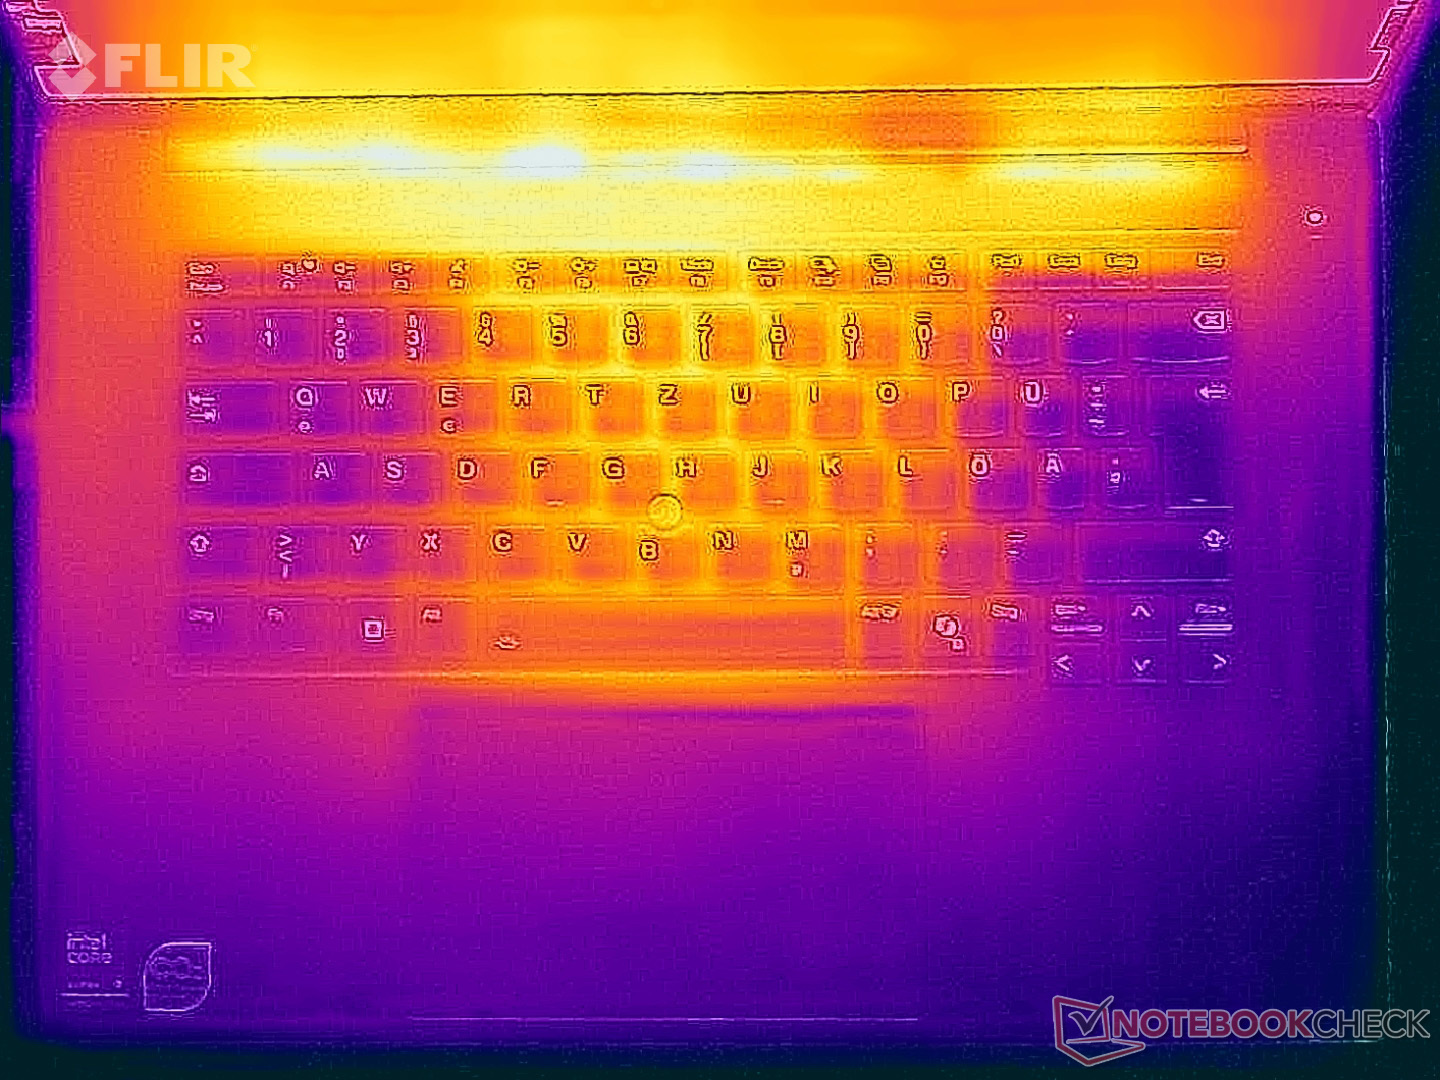
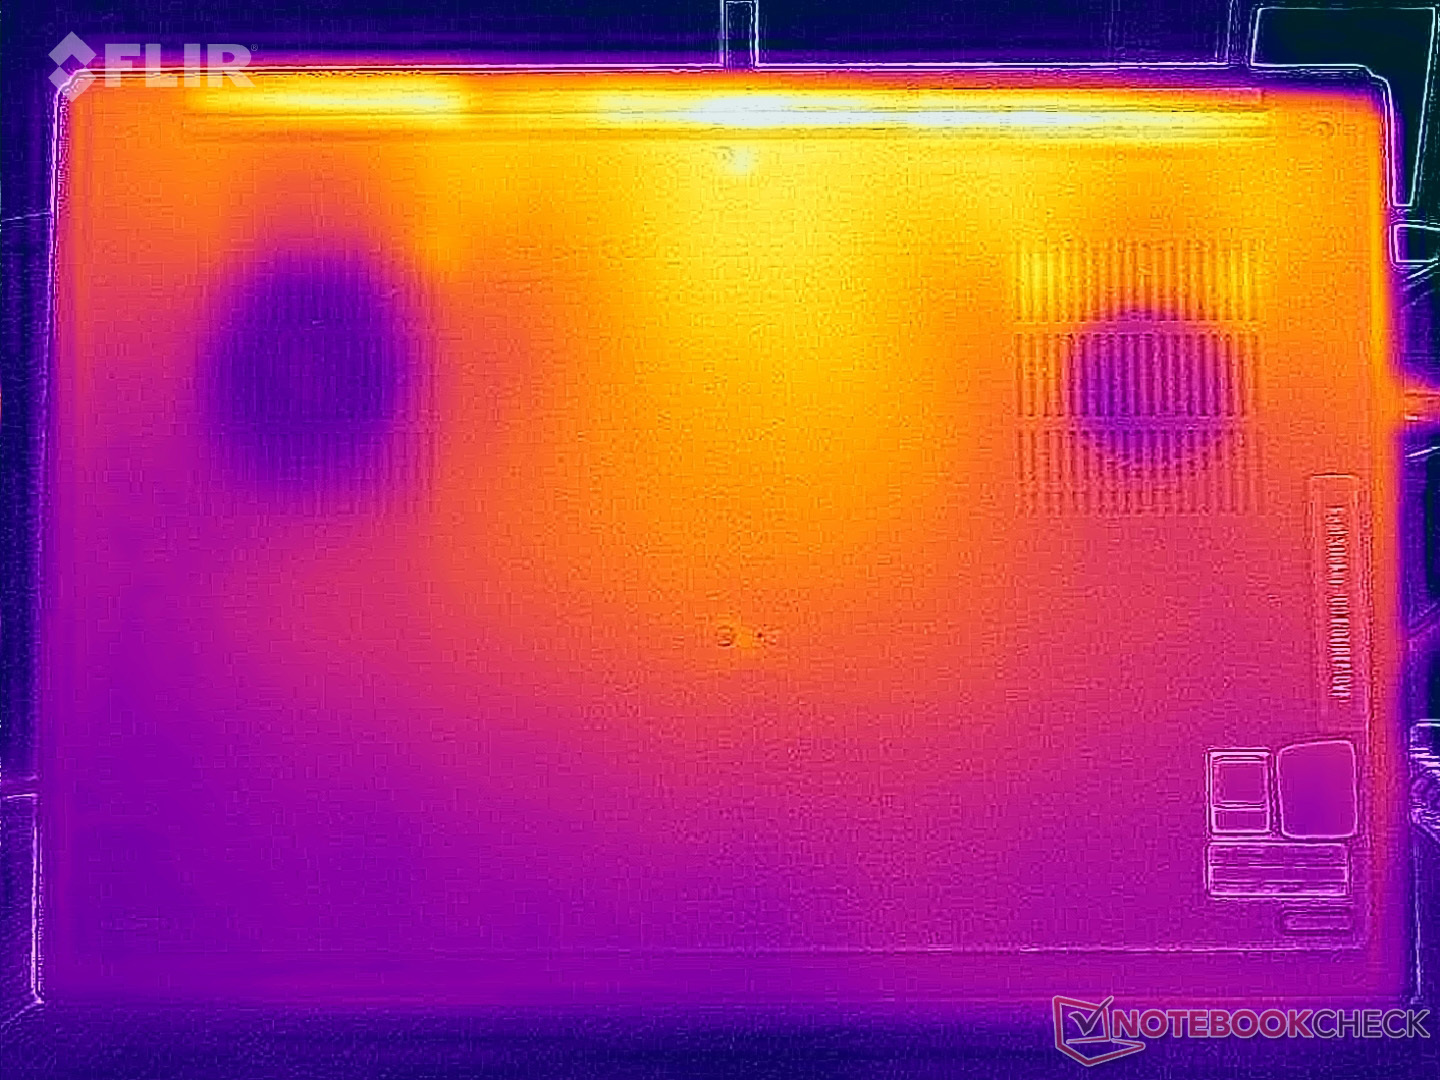
Le temperature
Il ThinkPad T1g Gen 8 non presenta problemi di temperatura. Con carichi di lavoro leggeri, lo chassis in alluminio rimane molto fresco, e anche durante lo stress test abbiamo misurato temperature superiori a 40 °C solo in alcune aree, con un massimo di 44,7 °C. Di conseguenza, non ci sono limitazioni di utilizzo.
Durante lo stress test, la CPU opera a 35 watt a circa 78 °C, mentre la GPU opera a 60 watt a circa 76 °C.

(±) La temperatura massima sul lato superiore è di 44.7 °C / 112 F, rispetto alla media di 36.9 °C / 98 F, che varia da 21 a 71 °C per questa classe Multimedia.
(±) Il lato inferiore si riscalda fino ad un massimo di 42.8 °C / 109 F, rispetto alla media di 39.1 °C / 102 F
(+) In idle, la temperatura media del lato superiore è di 25.8 °C / 78 F, rispetto alla media deld ispositivo di 31.3 °C / 88 F.
(±) 3: The average temperature for the upper side is 37.2 °C / 99 F, compared to the average of 31.3 °C / 88 F for the class Multimedia.
(+) I poggiapolsi e il touchpad raggiungono la temperatura massima della pelle (32 °C / 89.6 F) e quindi non sono caldi.
(-) La temperatura media della zona del palmo della mano di dispositivi simili e'stata di 28.7 °C / 83.7 F (-3.3 °C / -5.9 F).
| Lenovo ThinkPad T1g Gen 8 21TD003GE Ultra 9 285H, GeForce RTX 5070 Laptop | Lenovo Yoga Pro 9i 16 RTX 5070 Ultra 9 285H, GeForce RTX 5070 Laptop | Asus ProArt P16 RTX 5090 Ryzen AI 9 HX 370, GeForce RTX 5090 Laptop | Dell 16 Premium DA16250 Ultra 7 255H, GeForce RTX 5070 Laptop | Apple MacBook Pro 16 M4 Max M4 Max 16-Core, M4 Max 40-Core GPU | |
|---|---|---|---|---|---|
| Heat | -1% | -3% | 2% | 8% | |
| Maximum Upper Side * (°C) | 44.7 | 41.8 6% | 47 -5% | 36.8 18% | 42.8 4% |
| Maximum Bottom * (°C) | 42.8 | 47.9 -12% | 51.6 -21% | 34.8 19% | 42.3 1% |
| Idle Upper Side * (°C) | 26.9 | 26.3 2% | 24.9 7% | 31.2 -16% | 23.6 12% |
| Idle Bottom * (°C) | 27.3 | 27.6 -1% | 25.5 7% | 30.8 -13% | 23.5 14% |
* ... Meglio usare valori piccoli
Altoparlanti
Gli altoparlanti stereo offrono un'ottima qualità del suono, ma tutti i dispositivi di confronto si comportano a un livello altrettanto elevato.
Lenovo ThinkPad T1g Gen 8 21TD003GE analisi audio
(+) | gli altoparlanti sono relativamente potenti (85.6 dB)
Bassi 100 - 315 Hz
(±) | bassi ridotti - in media 9.3% inferiori alla media
(±) | la linearità dei bassi è media (11.9% delta rispetto alla precedente frequenza)
Medi 400 - 2000 Hz
(+) | medi bilanciati - solo only 2.5% rispetto alla media
(+) | medi lineari (4% delta rispetto alla precedente frequenza)
Alti 2 - 16 kHz
(+) | Alti bilanciati - appena 3.4% dalla media
(±) | la linearità degli alti è media (7.5% delta rispetto alla precedente frequenza)
Nel complesso 100 - 16.000 Hz
(+) | suono nel complesso lineare (8.7% differenza dalla media)
Rispetto alla stessa classe
» 10% di tutti i dispositivi testati in questa classe è stato migliore, 2% simile, 88% peggiore
» Il migliore ha avuto un delta di 5%, medio di 17%, peggiore di 45%
Rispetto a tutti i dispositivi testati
» 2% di tutti i dispositivi testati in questa classe è stato migliore, 1% similare, 97% peggiore
» Il migliore ha avuto un delta di 4%, medio di 24%, peggiore di 134%
Lenovo Yoga Pro 9i 16 RTX 5070 analisi audio
(±) | potenza degli altiparlanti media ma buona (81.4 dB)
Bassi 100 - 315 Hz
(±) | bassi ridotti - in media 5.5% inferiori alla media
(±) | la linearità dei bassi è media (7.5% delta rispetto alla precedente frequenza)
Medi 400 - 2000 Hz
(+) | medi bilanciati - solo only 1.7% rispetto alla media
(+) | medi lineari (3.1% delta rispetto alla precedente frequenza)
Alti 2 - 16 kHz
(±) | alti ridotti - circa 6.2% inferiori alla media
(+) | alti lineari (3.9% delta rispetto alla precedente frequenza)
Nel complesso 100 - 16.000 Hz
(+) | suono nel complesso lineare (9.7% differenza dalla media)
Rispetto alla stessa classe
» 13% di tutti i dispositivi testati in questa classe è stato migliore, 1% simile, 86% peggiore
» Il migliore ha avuto un delta di 5%, medio di 17%, peggiore di 45%
Rispetto a tutti i dispositivi testati
» 4% di tutti i dispositivi testati in questa classe è stato migliore, 1% similare, 95% peggiore
» Il migliore ha avuto un delta di 4%, medio di 24%, peggiore di 134%
Asus ProArt P16 RTX 5090 analisi audio
(±) | potenza degli altiparlanti media ma buona (80.8 dB)
Bassi 100 - 315 Hz
(+) | bassi buoni - solo 3.3% dalla media
(±) | la linearità dei bassi è media (7.7% delta rispetto alla precedente frequenza)
Medi 400 - 2000 Hz
(+) | medi bilanciati - solo only 2.9% rispetto alla media
(+) | medi lineari (1.9% delta rispetto alla precedente frequenza)
Alti 2 - 16 kHz
(+) | Alti bilanciati - appena 4.1% dalla media
(+) | alti lineari (5.5% delta rispetto alla precedente frequenza)
Nel complesso 100 - 16.000 Hz
(+) | suono nel complesso lineare (8.3% differenza dalla media)
Rispetto alla stessa classe
» 9% di tutti i dispositivi testati in questa classe è stato migliore, 2% simile, 90% peggiore
» Il migliore ha avuto un delta di 5%, medio di 17%, peggiore di 45%
Rispetto a tutti i dispositivi testati
» 2% di tutti i dispositivi testati in questa classe è stato migliore, 1% similare, 97% peggiore
» Il migliore ha avuto un delta di 4%, medio di 24%, peggiore di 134%
Dell 16 Premium DA16250 analisi audio
(+) | gli altoparlanti sono relativamente potenti (84.2 dB)
Bassi 100 - 315 Hz
(±) | bassi ridotti - in media 6.1% inferiori alla media
(+) | bassi in lineaa (4.2% delta rispetto alla precedente frequenza)
Medi 400 - 2000 Hz
(+) | medi bilanciati - solo only 1.4% rispetto alla media
(+) | medi lineari (3.6% delta rispetto alla precedente frequenza)
Alti 2 - 16 kHz
(+) | Alti bilanciati - appena 1.5% dalla media
(+) | alti lineari (2.2% delta rispetto alla precedente frequenza)
Nel complesso 100 - 16.000 Hz
(+) | suono nel complesso lineare (5.1% differenza dalla media)
Rispetto alla stessa classe
» 1% di tutti i dispositivi testati in questa classe è stato migliore, 0% simile, 99% peggiore
» Il migliore ha avuto un delta di 5%, medio di 17%, peggiore di 45%
Rispetto a tutti i dispositivi testati
» 0% di tutti i dispositivi testati in questa classe è stato migliore, 0% similare, 100% peggiore
» Il migliore ha avuto un delta di 4%, medio di 24%, peggiore di 134%
Apple MacBook Pro 16 2024 M4 Pro analisi audio
(+) | gli altoparlanti sono relativamente potenti (84.6 dB)
Bassi 100 - 315 Hz
(±) | bassi ridotti - in media 5.1% inferiori alla media
(+) | bassi in lineaa (5.6% delta rispetto alla precedente frequenza)
Medi 400 - 2000 Hz
(+) | medi bilanciati - solo only 1.4% rispetto alla media
(+) | medi lineari (2.4% delta rispetto alla precedente frequenza)
Alti 2 - 16 kHz
(+) | Alti bilanciati - appena 1.6% dalla media
(+) | alti lineari (3% delta rispetto alla precedente frequenza)
Nel complesso 100 - 16.000 Hz
(+) | suono nel complesso lineare (4.8% differenza dalla media)
Rispetto alla stessa classe
» 0% di tutti i dispositivi testati in questa classe è stato migliore, 0% simile, 99% peggiore
» Il migliore ha avuto un delta di 5%, medio di 17%, peggiore di 45%
Rispetto a tutti i dispositivi testati
» 0% di tutti i dispositivi testati in questa classe è stato migliore, 0% similare, 100% peggiore
» Il migliore ha avuto un delta di 4%, medio di 24%, peggiore di 134%
Consumo di energia

Non ci sono grandi sorprese per quanto riguarda le misurazioni di potenza. Il pannello OLED luminoso si fa notare al minimo, ma c'è da aspettarselo. Durante lo stress test, abbiamo misurato brevemente circa 143 watt, prima che il consumo si stabilizzi rapidamente a circa 134 watt. L'alimentatore da 140 watt è in grado di gestire questo carico, ma c'è poco spazio a disposizione, ad esempio per caricare la batteria allo stesso tempo.
| Off / Standby | |
| Idle | |
| Sotto carico |
|
Leggenda:
min: | |
| Lenovo ThinkPad T1g Gen 8 21TD003GE Ultra 9 285H, GeForce RTX 5070 Laptop, Samsung PM9E1 MZVLC2T0HBLD, Tandem-OLED, 3200x2000, 16" | Lenovo Yoga Pro 9i 16 RTX 5070 Ultra 9 285H, GeForce RTX 5070 Laptop, WD PC SN7100S SDFPMSL-1T00-1101, OLED, 3200x2000, 16" | Asus ProArt P16 RTX 5090 Ryzen AI 9 HX 370, GeForce RTX 5090 Laptop, Micron 2500 2TB MTFDKBA2T0QGN-1BN1AABGA, OLED, 3840x2400, 16" | Dell 16 Premium DA16250 Ultra 7 255H, GeForce RTX 5070 Laptop, Kioxia BG6 KBG6AZNV1T02, OLED, 3840x2400, 16.3" | Apple MacBook Pro 16 M4 Max M4 Max 16-Core, M4 Max 40-Core GPU, Apple SSD AP1024Z, Mini-LED, 3456x2234, 16.2" | Media NVIDIA GeForce RTX 5070 Laptop | Media della classe Multimedia | |
|---|---|---|---|---|---|---|---|
| Power Consumption | -19% | -31% | -8% | -2% | -30% | 22% | |
| Idle Minimum * (Watt) | 8.5 | 8.8 -4% | 10.9 -28% | 6.5 24% | 4.7 45% | 10.7 ? -26% | 5.79 ? 32% |
| Idle Average * (Watt) | 13.6 | 16.1 -18% | 12.1 11% | 8.1 40% | 15.5 -14% | 15.3 ? -13% | 10.3 ? 24% |
| Idle Maximum * (Watt) | 14.1 | 16.5 -17% | 12.5 11% | 33 -134% | 15.6 -11% | 20.2 ? -43% | 12.3 ? 13% |
| Load Average * (Watt) | 84.5 | 89.3 -6% | 129.3 -53% | 88.9 -5% | 125 -48% | 97.5 ? -15% | 66.5 ? 21% |
| Cyberpunk 2077 ultra external monitor * (Watt) | 118.1 | 157.9 -34% | 172.8 -46% | 108.9 8% | 107.2 9% | ||
| Cyberpunk 2077 ultra * (Watt) | 120.3 | 160.6 -33% | 176.6 -47% | 108.7 10% | 116.2 3% | ||
| Load Maximum * (Watt) | 143 | 177.4 -24% | 233.9 -64% | 138.3 3% | 143.7 -0% | 216 ? -51% | 113 ? 21% |
* ... Meglio usare valori piccoli
Consumo energetico - Cyberpunk/test di stress
Consumo di energia con monitor esterno
Durata della batteria
Utilizzando la batteria da 90 Wh, il nostro test Wi-Fi a 150 cd/m² produce poco meno di 11 ore di autonomia, un risultato molto competitivo tra i rivali basati su Windows. Solo il MacBook Pro dura molto di più, raggiungendo circa 18 ore. Alla massima luminosità, abbiamo misurato poco meno di sei ore, mettendo il ThinkPad davanti agli altri modelli Windows, mentre il MacBook Pro dura solo un'ora in più.

Valutazione complessiva di Notebookcheck
Lenovo ThinkPad T1g Gen 8 21TD003GE
- 01/21/2026 v8
Andreas Osthoff
 Total Sustainability Score:
 Le possibili alternative in sintesi
Immagine | Modello | Prezzo | Peso | Altezza | Schermo |
|---|---|---|---|---|---|
1. 92.4%  | Lenovo ThinkPad T1g Gen 8 21TD003GE Intel Core Ultra 9 285H ⎘ NVIDIA GeForce RTX 5070 Laptop ⎘ 64 GB Memoria, 2048 GB SSD | Amazon: Prezzo di listino: 4500€ | 1.9 kg | 15.8 mm | 16.00" 3200x2000 236 PPI Tandem-OLED |
2. 90.4%  | Lenovo Yoga Pro 9i 16 RTX 5070 Intel Core Ultra 9 285H ⎘ NVIDIA GeForce RTX 5070 Laptop ⎘ 64 GB Memoria, 1024 GB SSD | Amazon: Prezzo di listino: 2800€ | 1.9 kg | 17.9 mm | 16.00" 3200x2000 236 PPI OLED |
3. 89.7%  | Asus ProArt P16 RTX 5090 AMD Ryzen AI 9 HX 370 ⎘ NVIDIA GeForce RTX 5090 Laptop ⎘ 64 GB Memoria, 2048 GB SSD | Amazon: Prezzo di listino: 4799€ | 2 kg | 18.3 mm | 16.00" 3840x2400 283 PPI OLED |
4. 87.9%  | Dell 16 Premium DA16250 Intel Core Ultra 7 255H ⎘ NVIDIA GeForce RTX 5070 Laptop ⎘ 32 GB Memoria, 1024 GB SSD | Amazon: Prezzo di listino: 3300 USD | 2.3 kg | 18.7 mm | 16.30" 3840x2400 278 PPI OLED |
5. 91.7%  | Apple MacBook Pro 16 M4 Max Apple M4 Max 16-Core ⎘ Apple M4 Max 40-Core GPU ⎘ 48 GB Memoria, 1024 GB SSD | Amazon: Prezzo di listino: 4699€ | 2.1 kg | 16.8 mm | 16.20" 3456x2234 254 PPI Mini-LED |
Transparency
La selezione dei dispositivi da recensire viene effettuata dalla nostra redazione. Il campione di prova è stato fornito all'autore come prestito dal produttore o dal rivenditore ai fini di questa recensione. L'istituto di credito non ha avuto alcuna influenza su questa recensione, né il produttore ne ha ricevuto una copia prima della pubblicazione. Non vi era alcun obbligo di pubblicare questa recensione. In quanto società mediatica indipendente, Notebookcheck non è soggetta all'autorità di produttori, rivenditori o editori.
Ecco come Notebookcheck esegue i test
Ogni anno, Notebookcheck esamina in modo indipendente centinaia di laptop e smartphone utilizzando procedure standardizzate per garantire che tutti i risultati siano comparabili. Da circa 20 anni sviluppiamo continuamente i nostri metodi di prova e nel frattempo stabiliamo gli standard di settore. Nei nostri laboratori di prova, tecnici ed editori esperti utilizzano apparecchiature di misurazione di alta qualità. Questi test comportano un processo di validazione in più fasi. Il nostro complesso sistema di valutazione si basa su centinaia di misurazioni e parametri di riferimento ben fondati, che mantengono l'obiettività.