 Deutsch
 English
 Español
 Français
 Italiano
 Nederlands
 Polski
 Português
 Русский
 Türkçe
 Svenska
 Chinese
 Magyar
Recensione dello Schenker Work 14 Base - portatile da ufficio economico, con molte porte e un luminoso display IPS
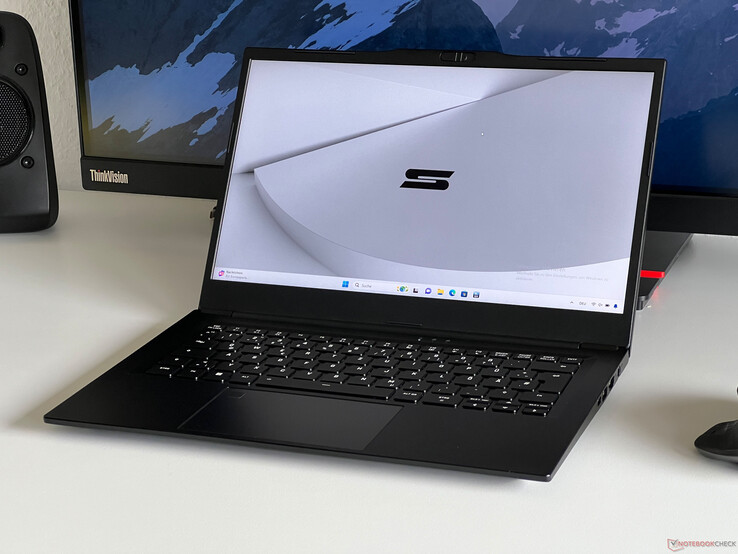
Il Work 14 Base di Schenker è un computer portatile compatto per l'ufficio che, oltre a un display IPS luminoso e opaco, offre ottime opzioni di aggiornamento e un'ampia varietà di porte, tra cui l'Ethernet, che non è più scontata al giorno d'oggi nemmeno nei computer portatili per l'ufficio o per le aziende. I prezzi del Work 14 partono da 750 dollari e il nostro dispositivo di prova con 16 GB di RAM si trova attualmente a circa 770 dollari.
Potenziali concorrenti a confrontos
Punteggio | Data | Modello | Peso | Altezza | Dimensione | Risoluzione | Miglior Prezzo |
|---|---|---|---|---|---|---|---|
| 82 % | 05/2024 | SCHENKER Work 14 Base i5-1235U, Iris Xe G7 80EUs | 1.3 kg | 20.2 mm | 14.00" | 1920x1080 | |
| 85.6 % | 11/2023 | Acer Swift Go 14 SFG14-71 i5-1335U, Iris Xe G7 80EUs | 1.3 kg | 14.9 mm | 14.00" | 2880x1800 | |
| 84.6 % | 10/2023 | HP ProBook 445 G10 R5 7530U, Vega 7 | 1.3 kg | 20 mm | 14.00" | 1920x1080 | |
| 85.3 % | 06/2023 | Dell Latitude 3440 i5-1345U, Iris Xe G7 80EUs | 1.5 kg | 19.4 mm | 14.00" | 1920x1080 | |
| 88.6 % | 08/2023 | Lenovo ThinkPad L14 G4 21H6S00900 R5 7530U, Vega 7 | 1.5 kg | 19.83 mm | 14.00" | 1920x1080 |
Custodia e connettività
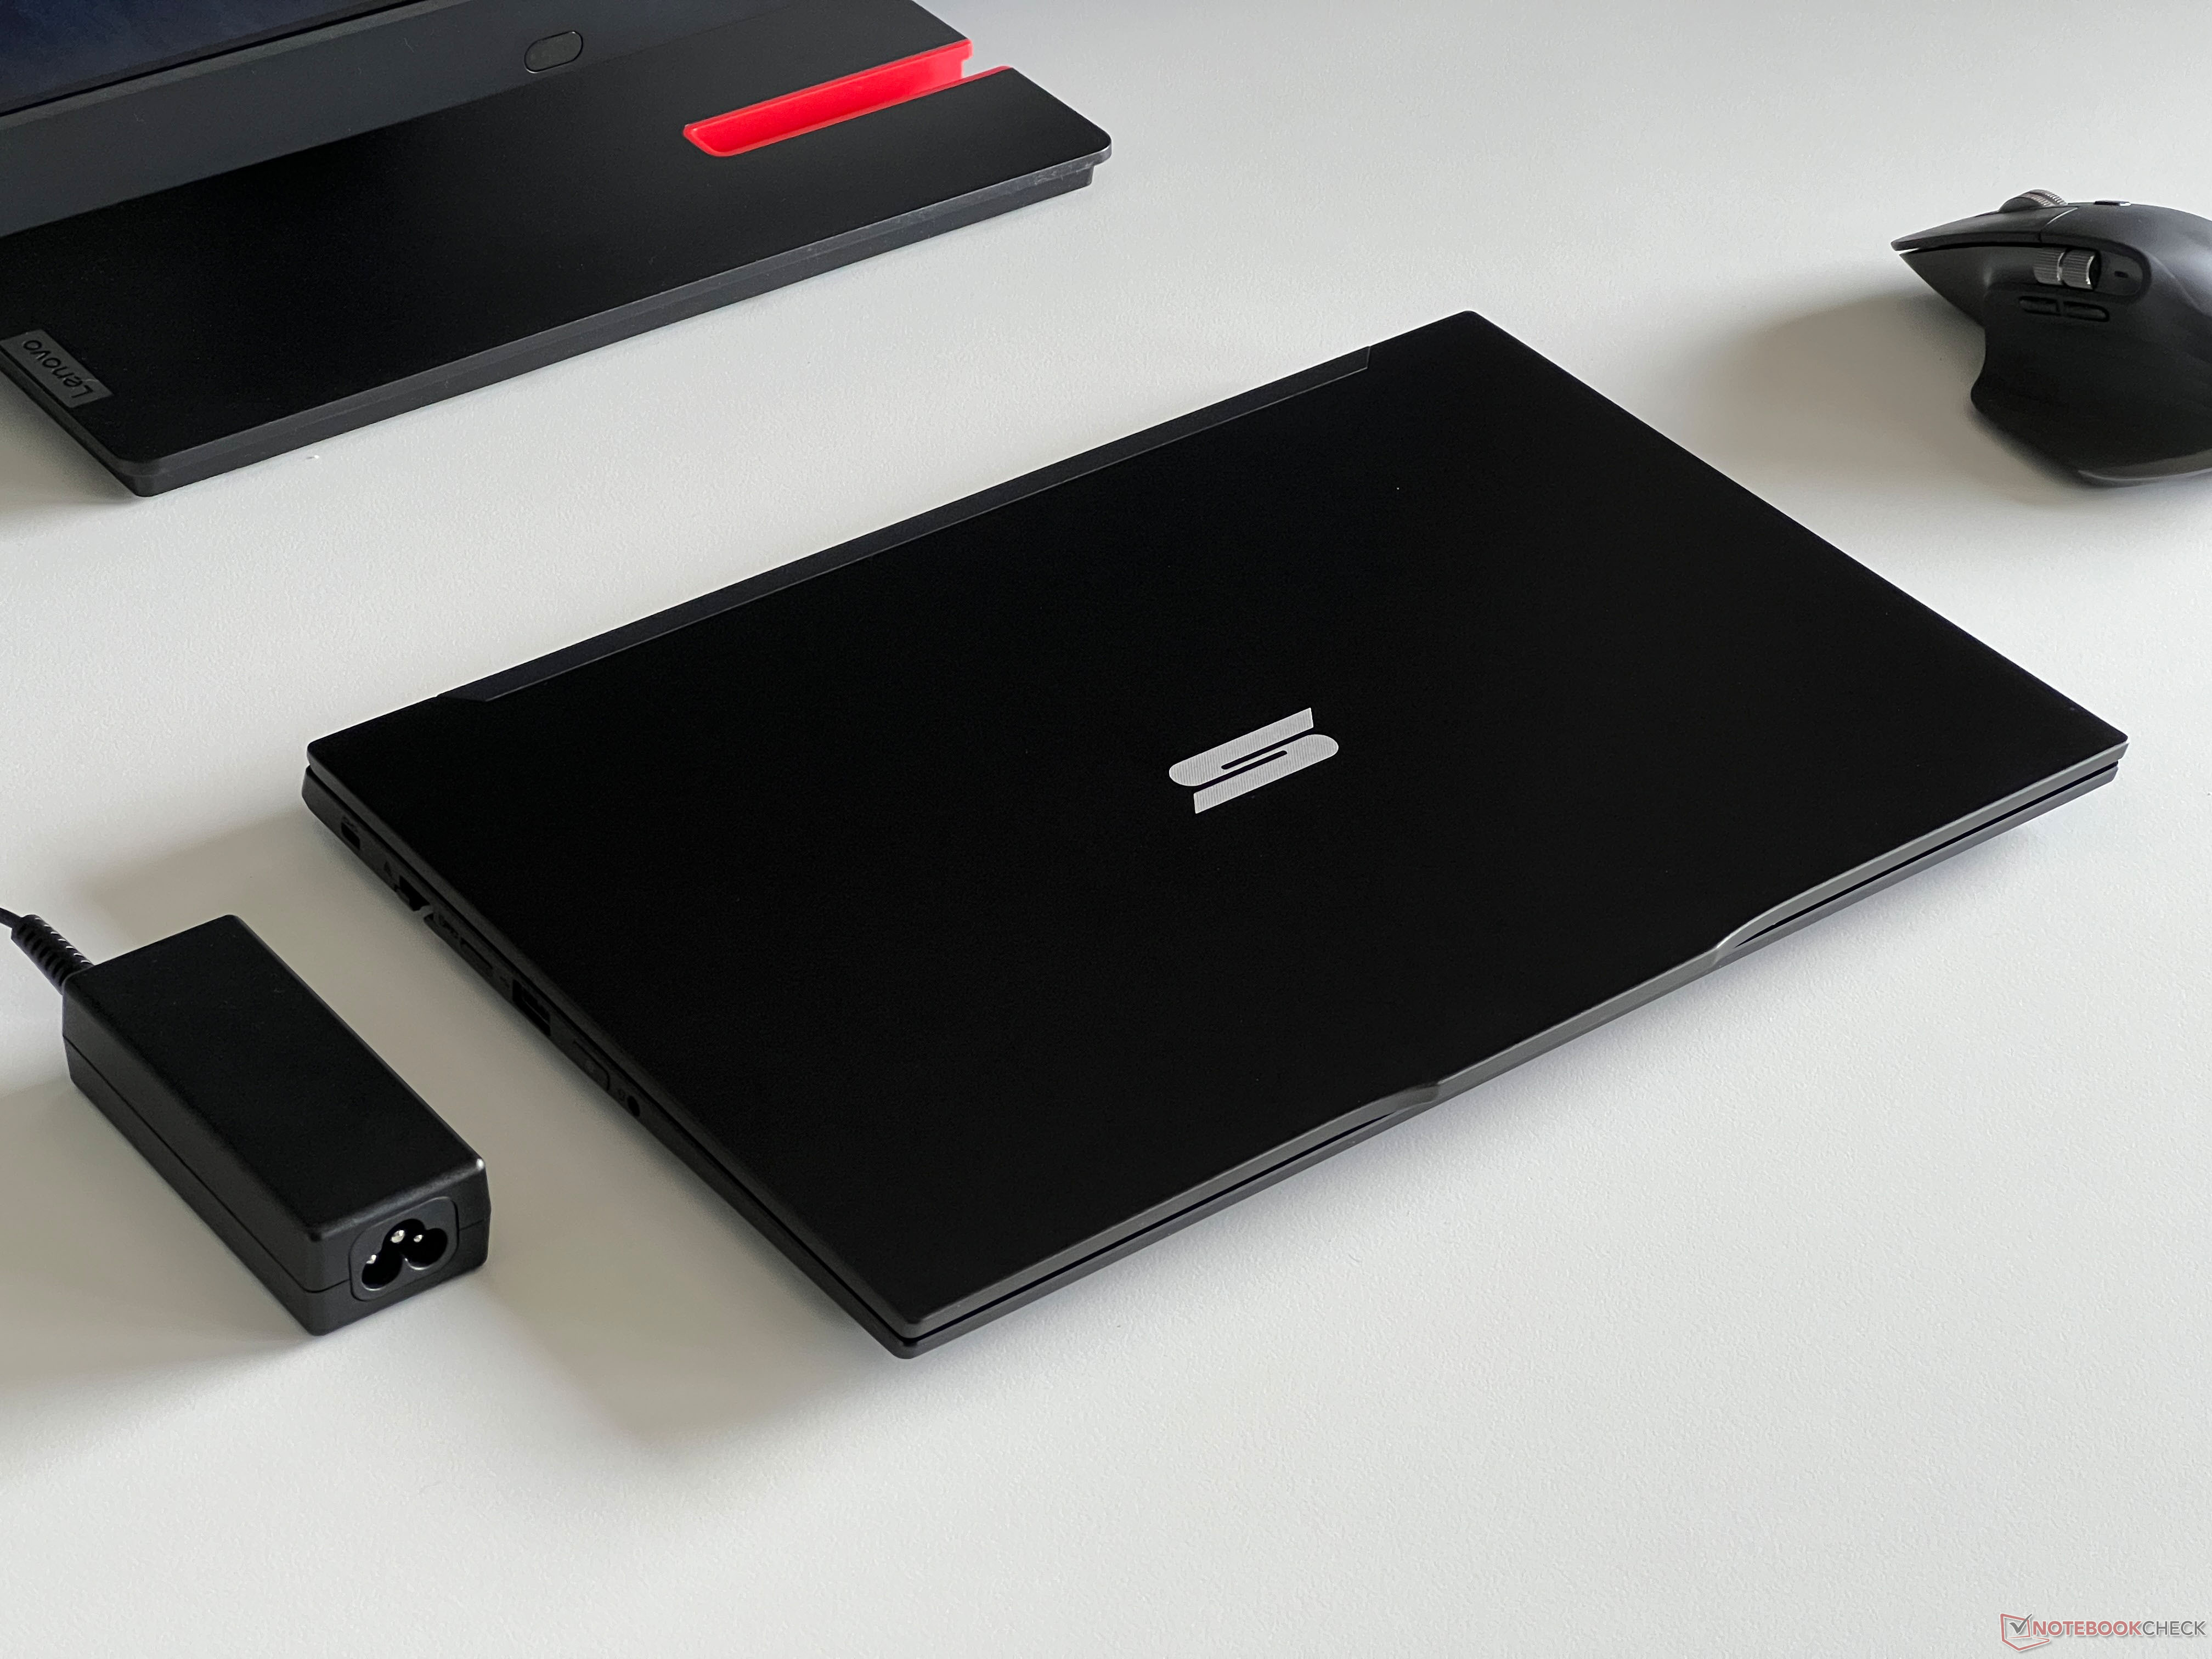
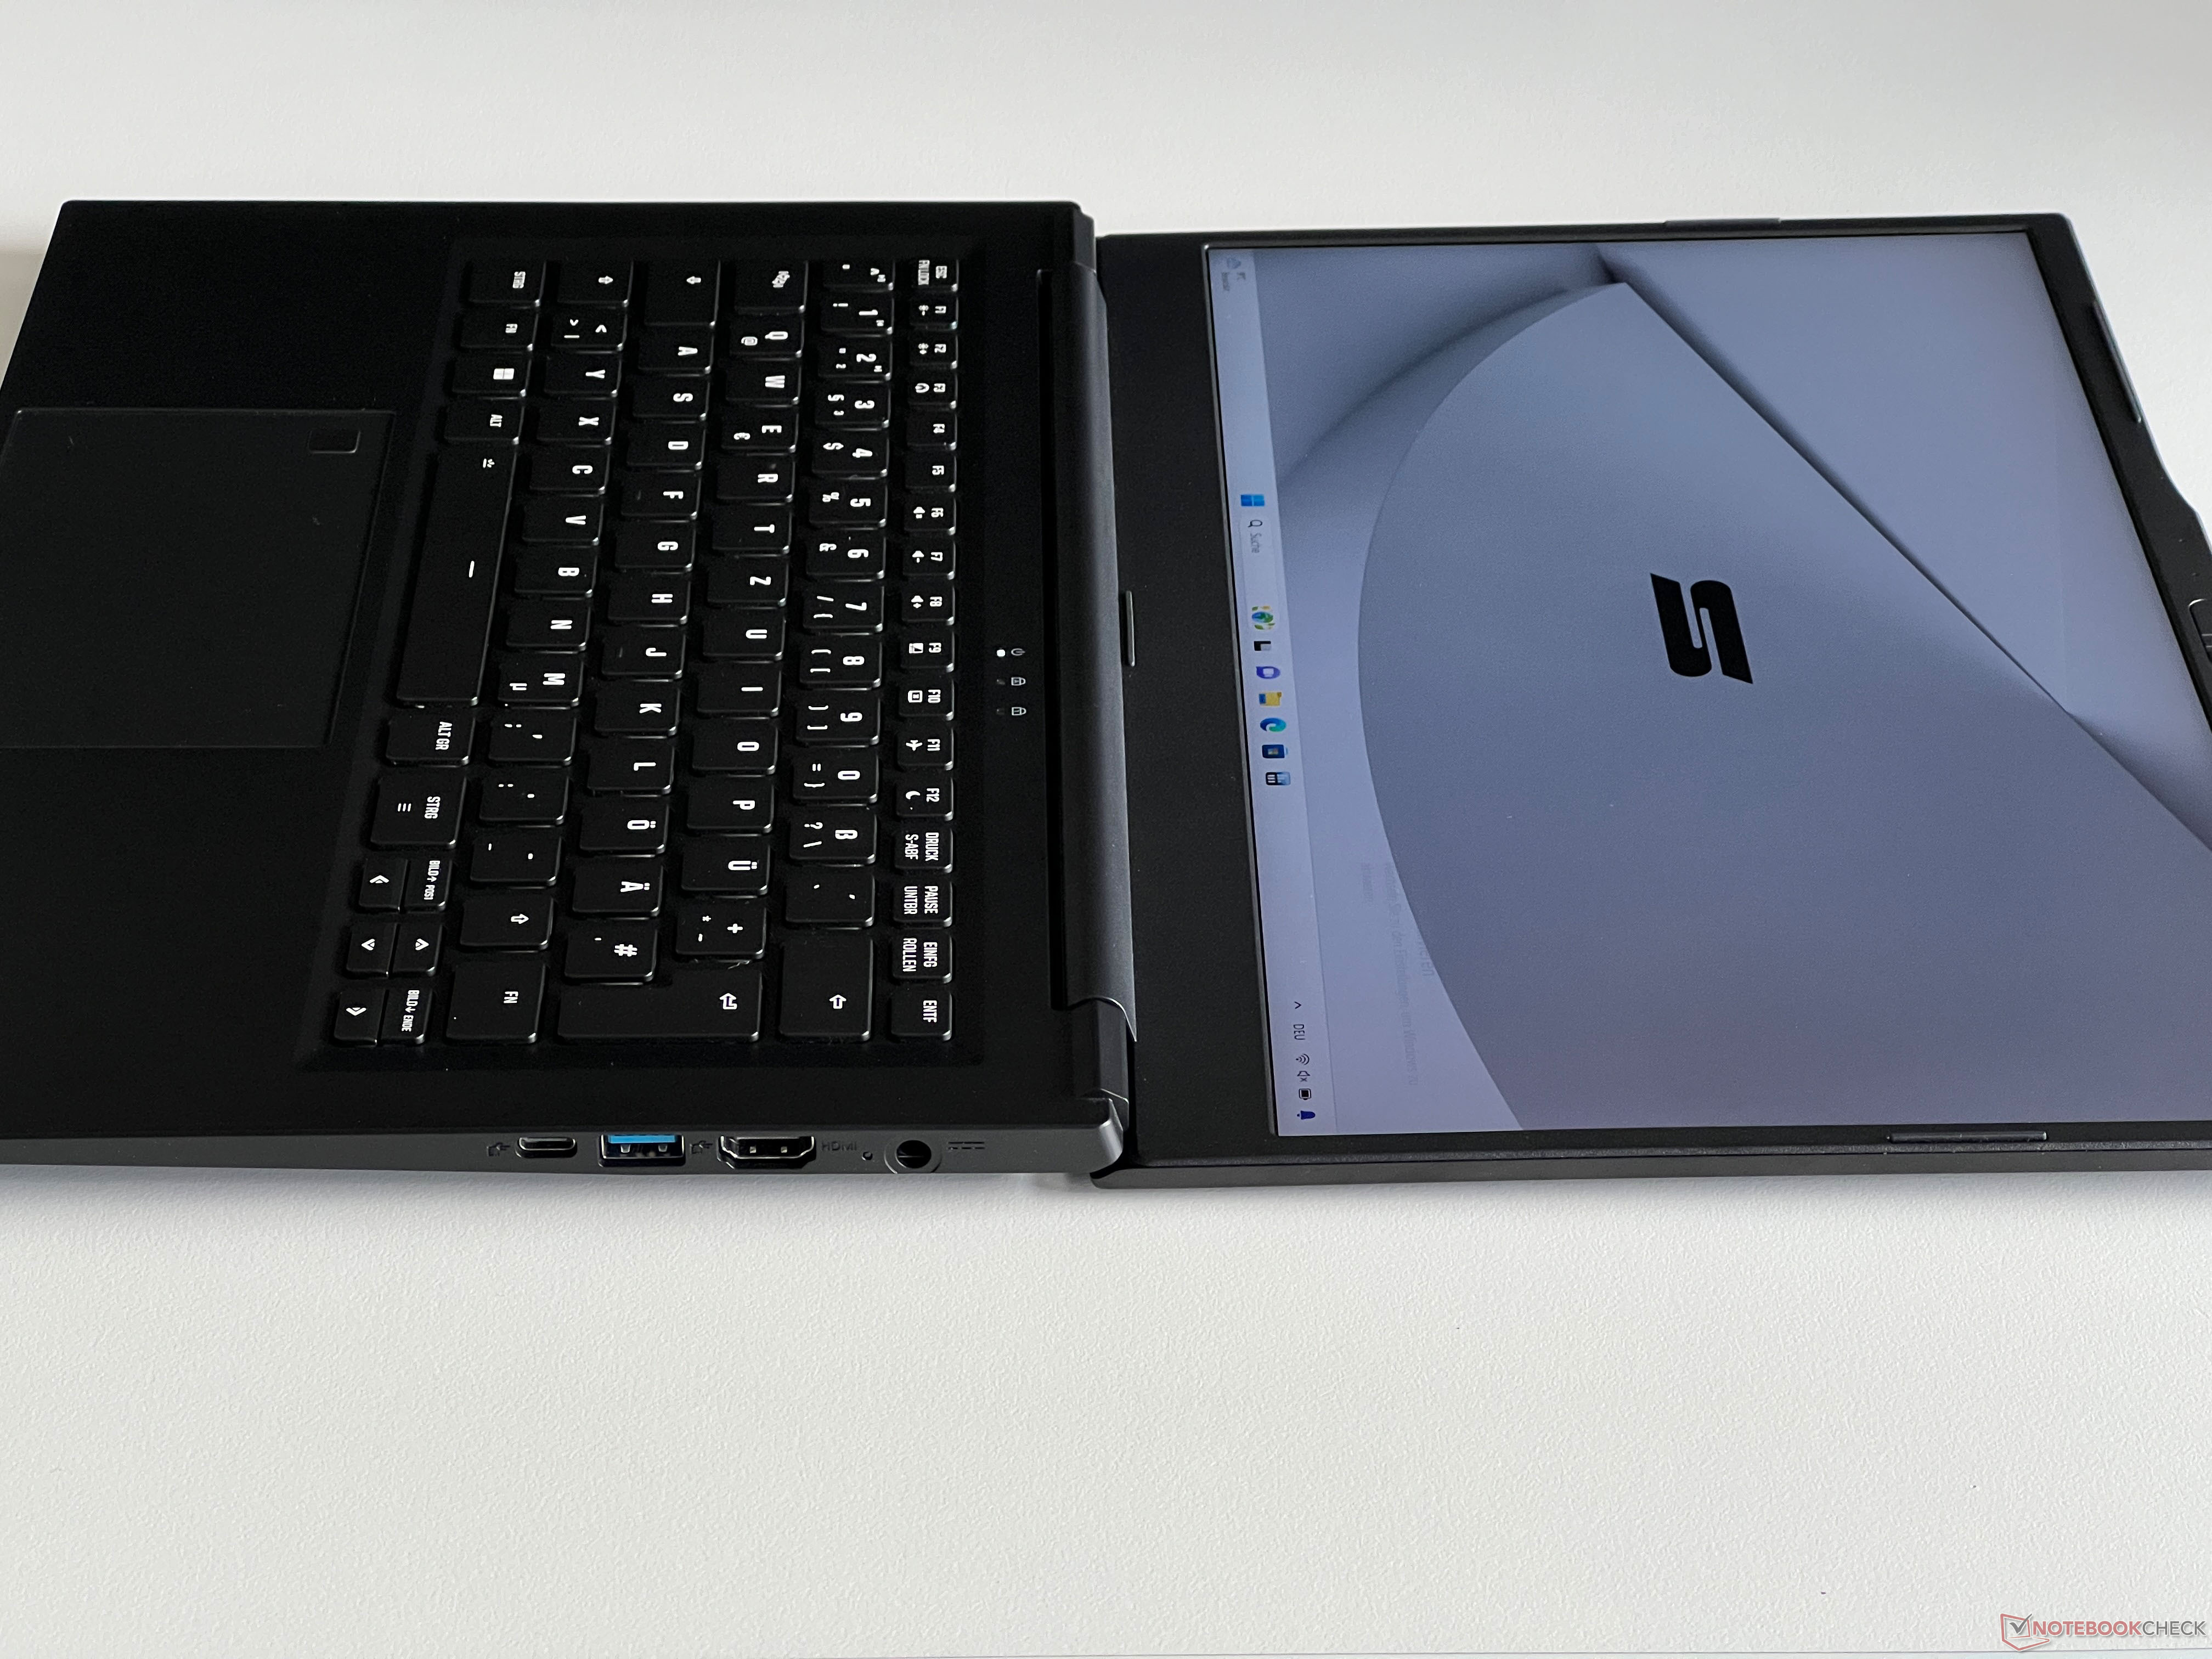
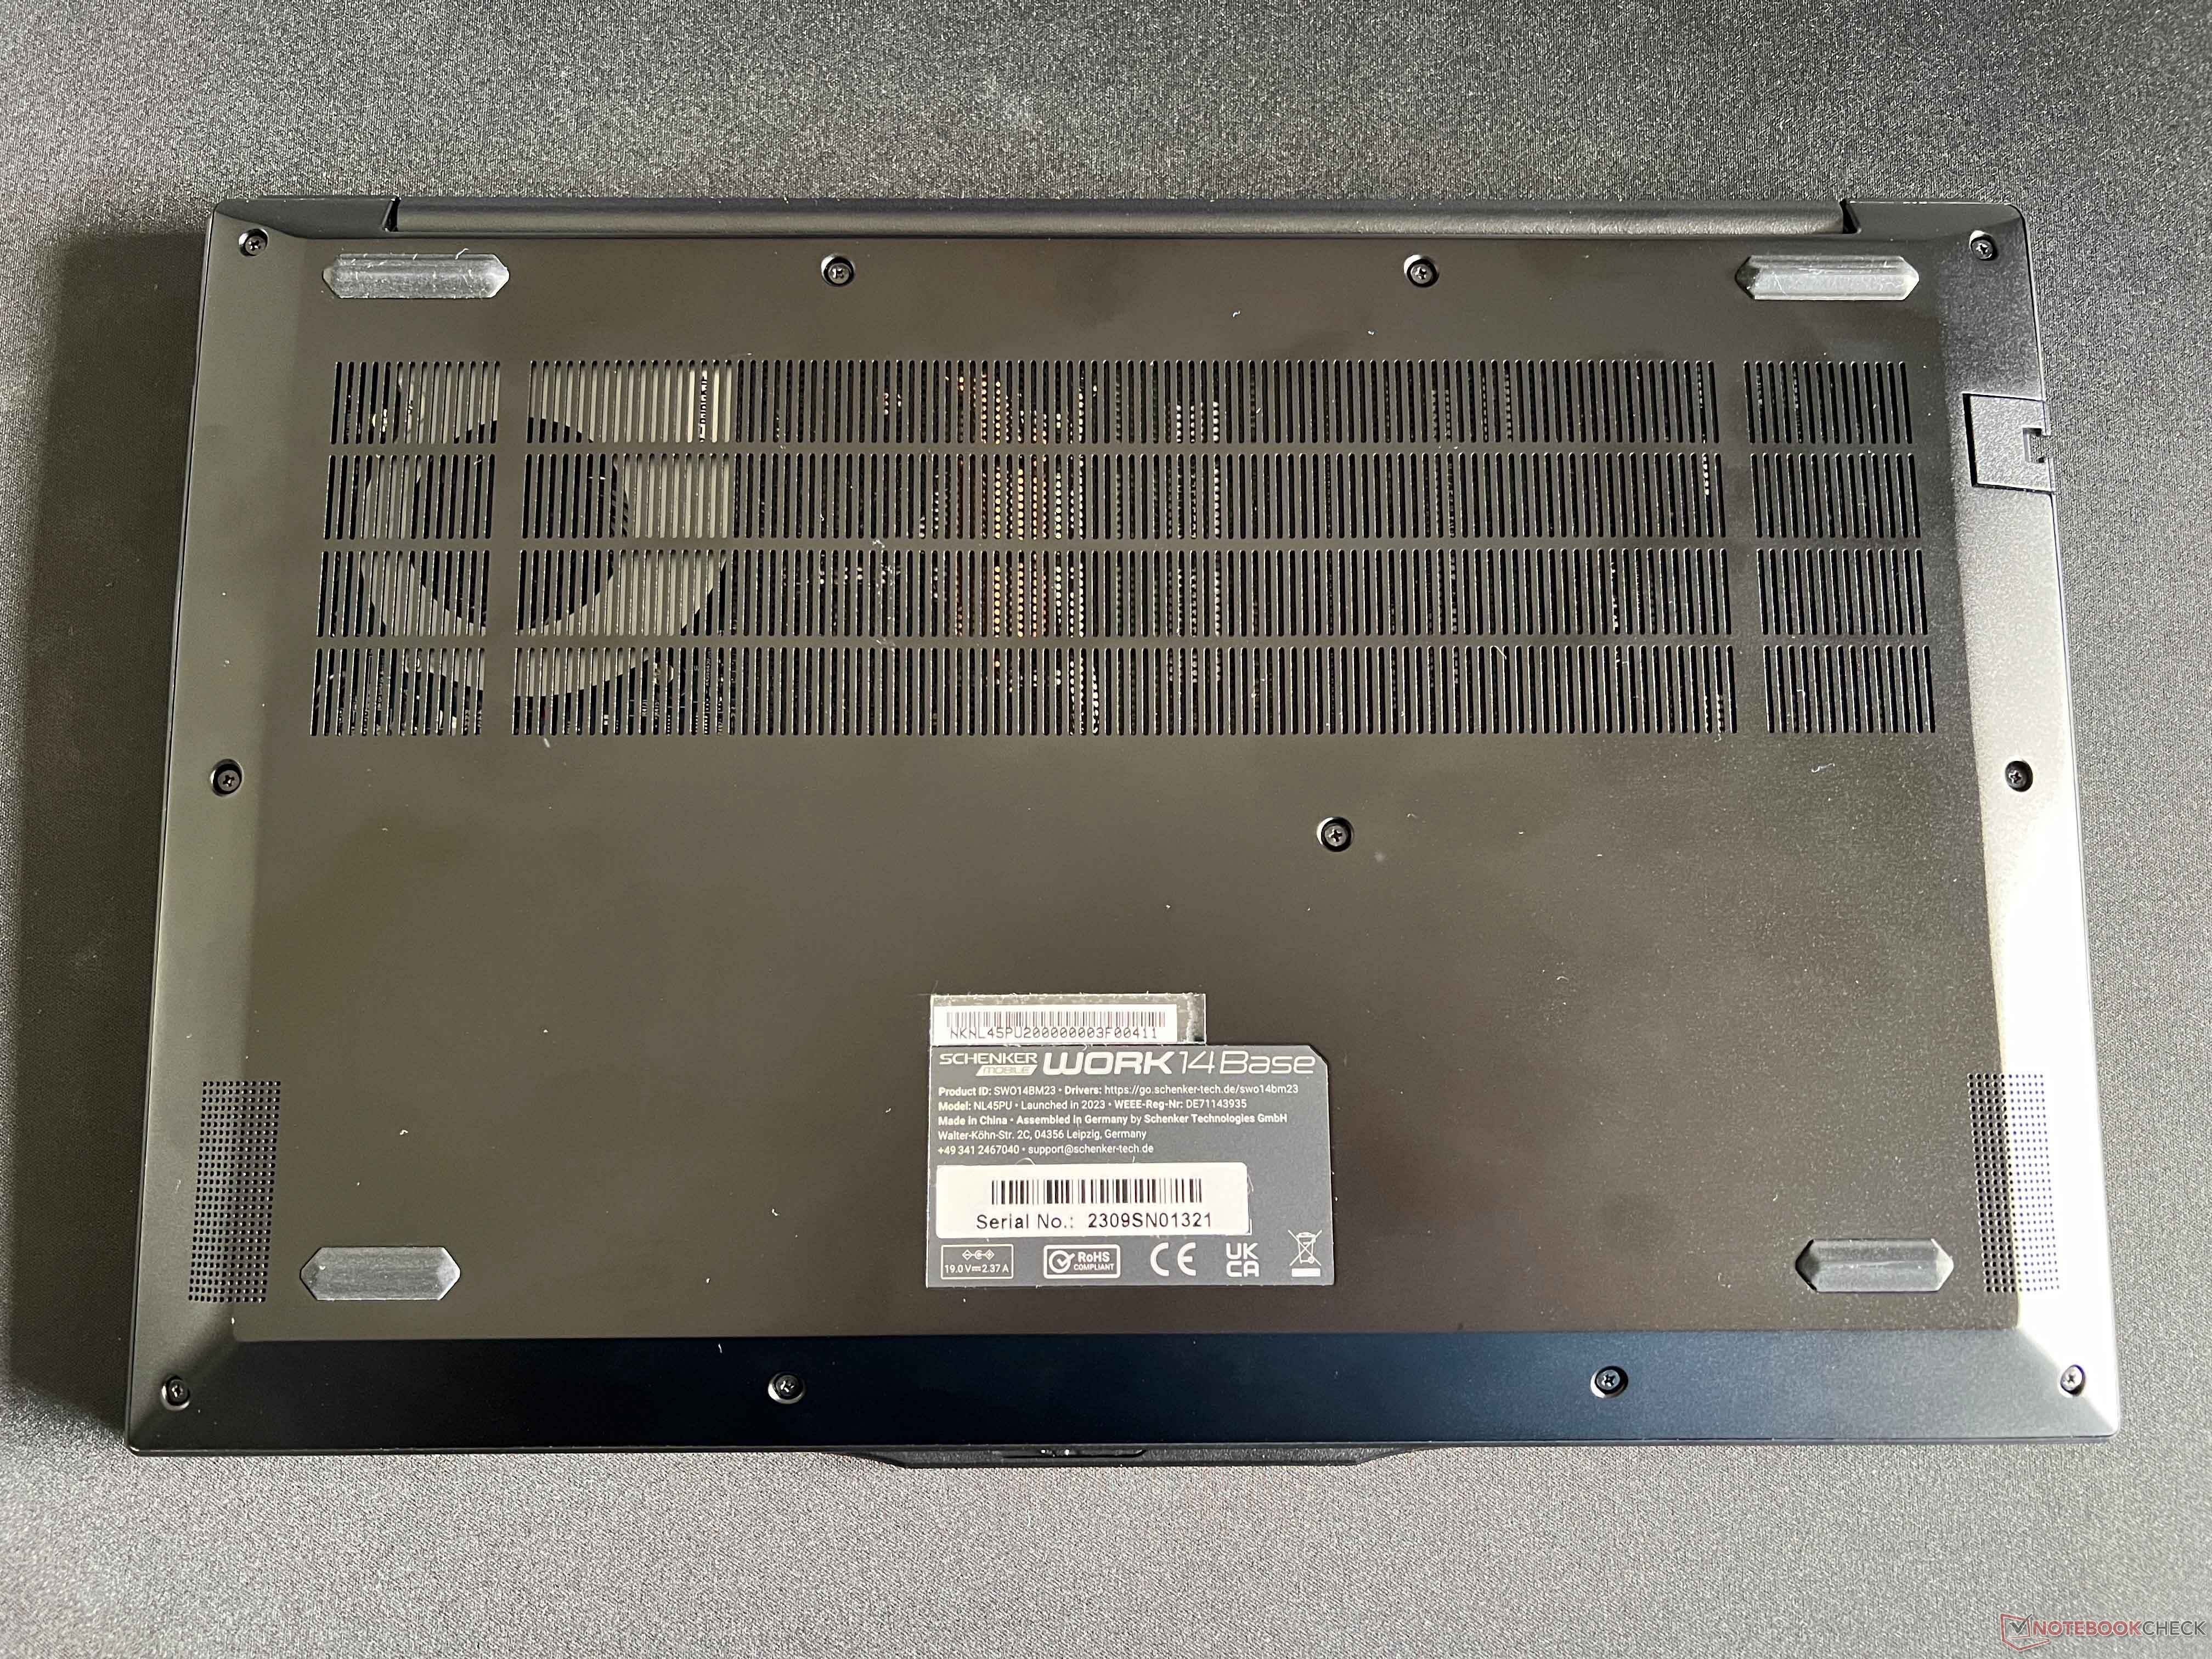
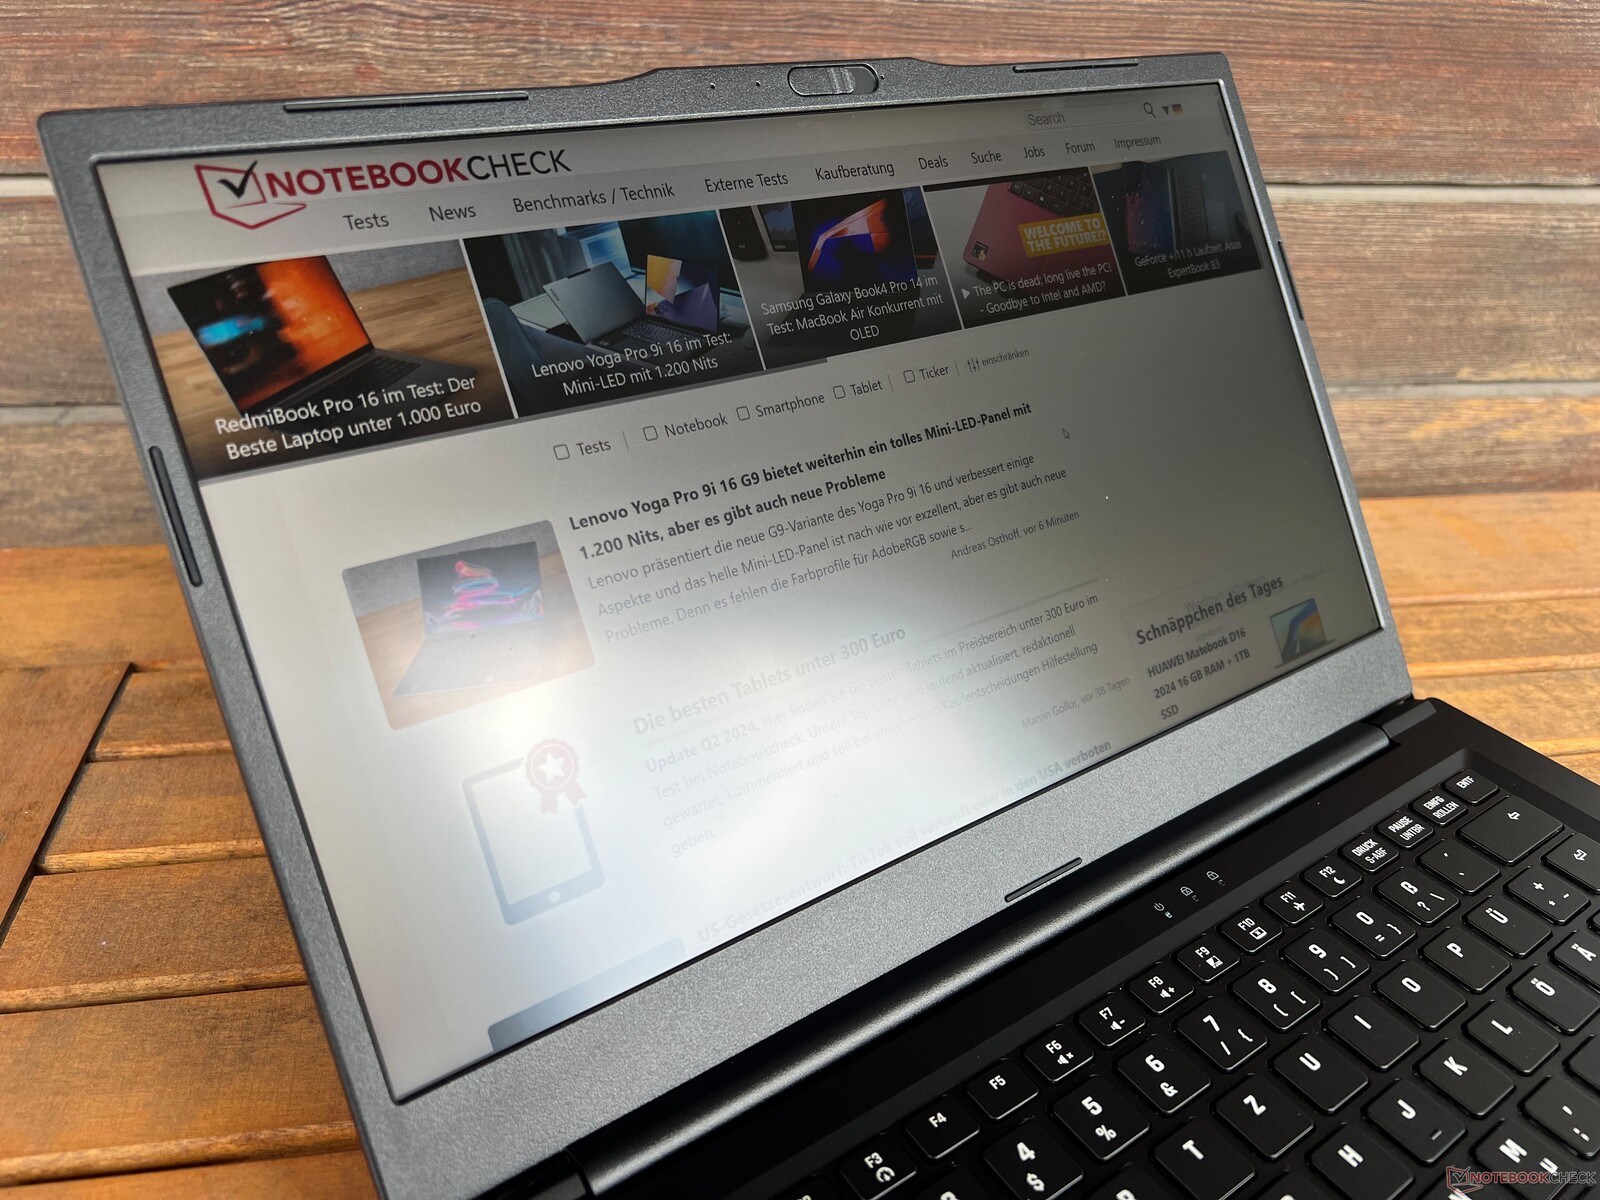
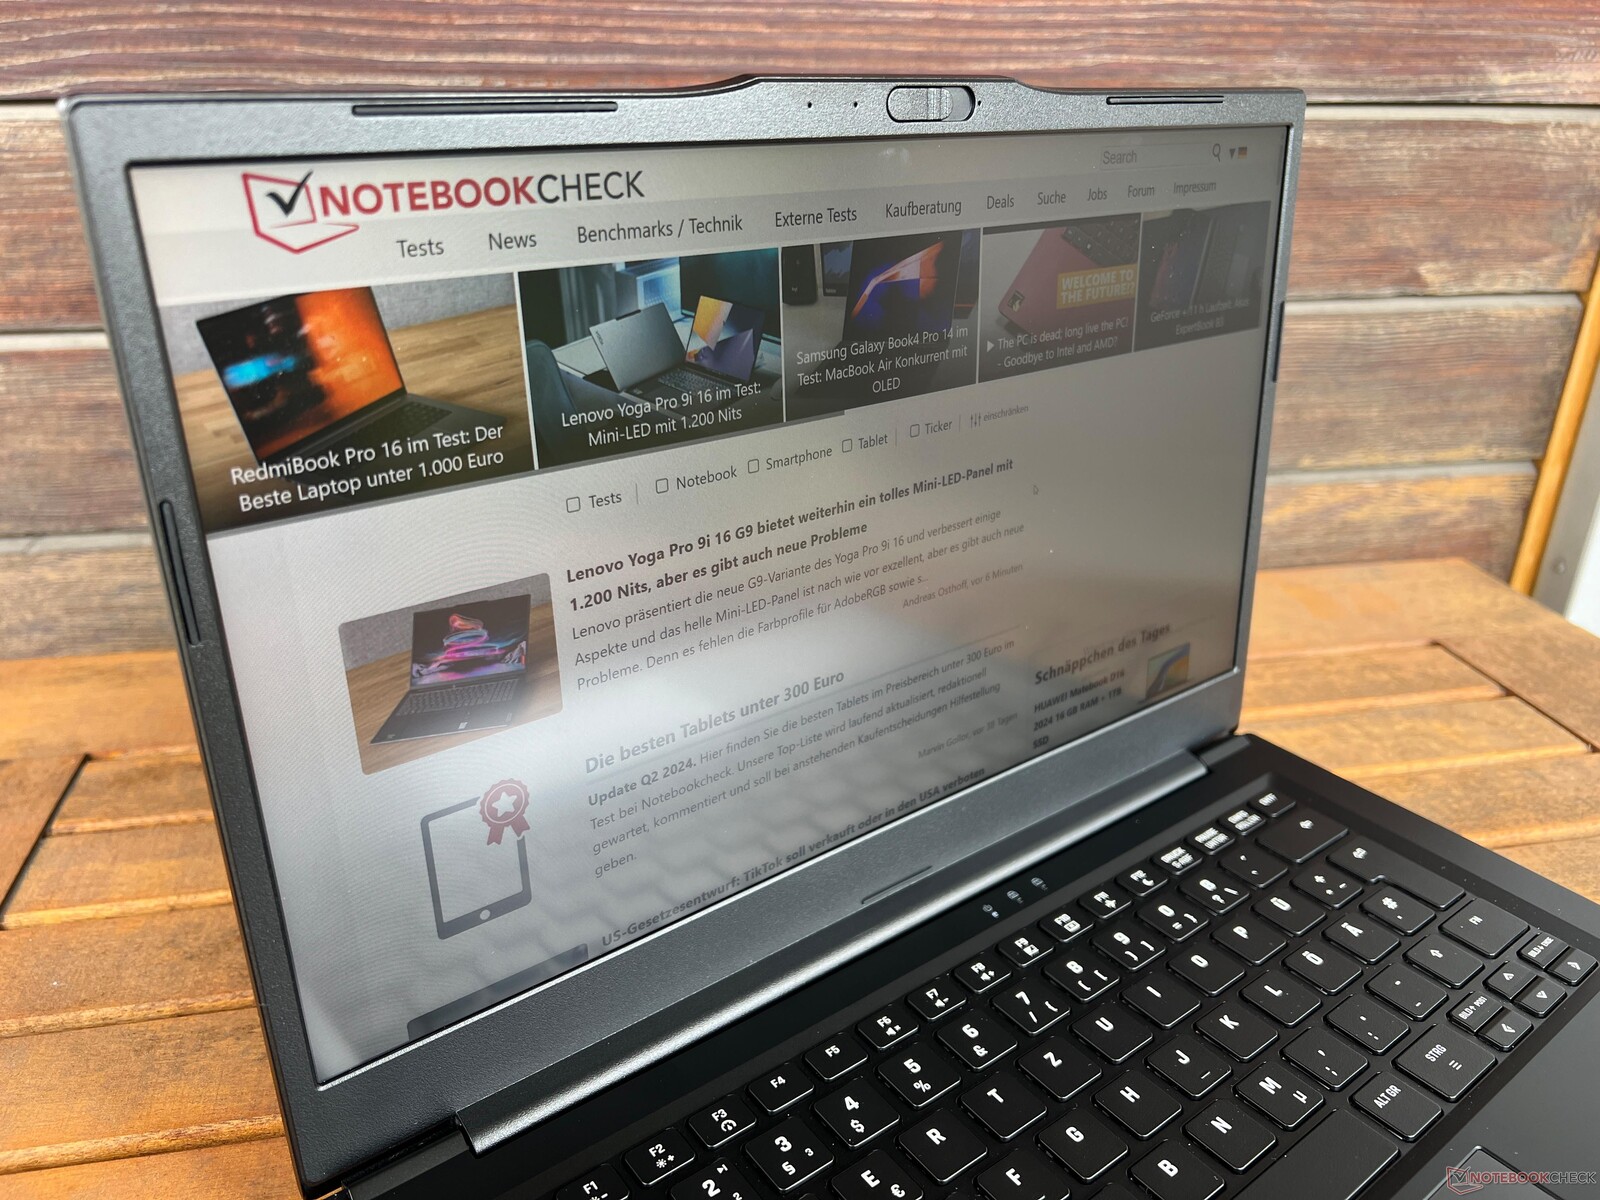
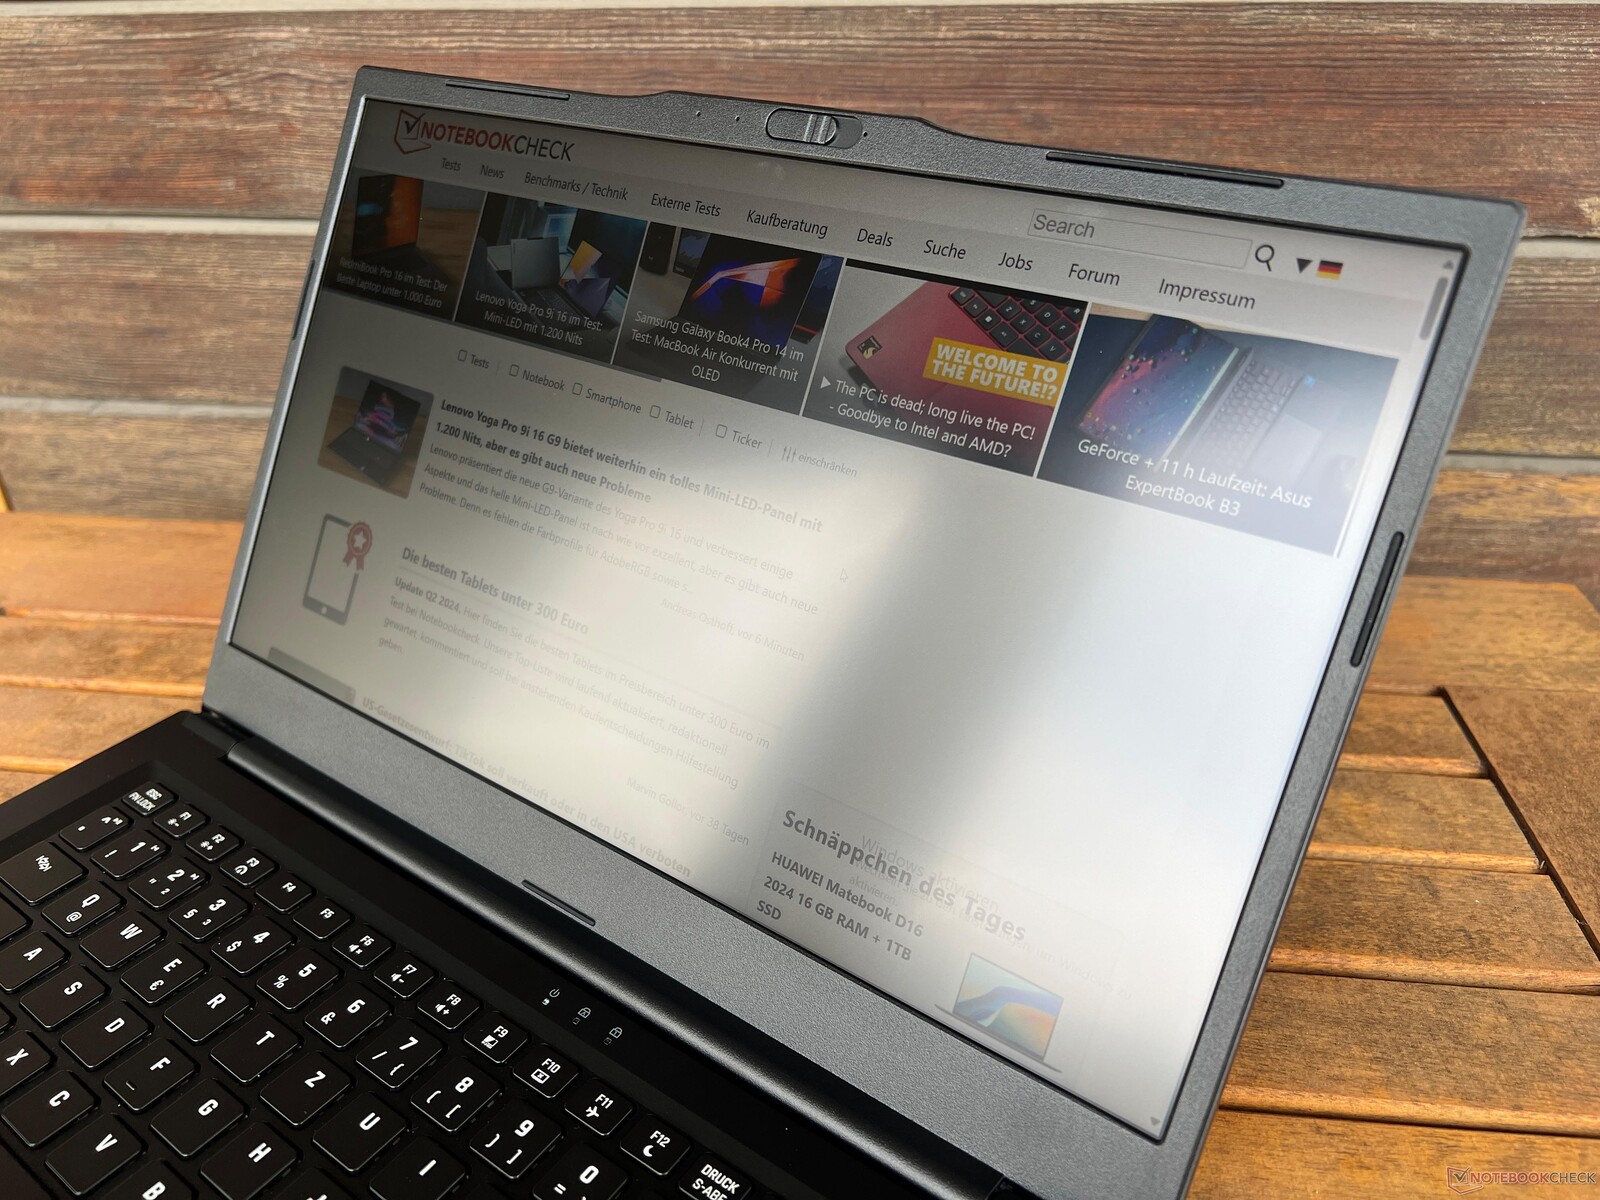
Work 14 Base utilizza un case in alluminio nero che, a prima vista, dà un'impressione di alta qualità. Tuttavia, le sue superfici lisce sono un'estrema calamita per le impronte digitali e richiedono una pulizia frequente. Con un sovrapprezzo, è possibile ottenere il portatile senza il logo Schenker sul coperchio. Non appena apre il coperchio, che funziona molto facilmente grazie alla gobba della fotocamera non particolarmente attraente, viene accolto da un pannello 16:9 con un'ampia cornice lungo la parte inferiore, realizzata in plastica ruvida. Non sembra più particolarmente moderno. La stabilità è buona, tuttavia abbiamo notato alcuni leggeri scricchiolii quando si ruota il portatile e, soprattutto, quando si apre il display (angolo di apertura massimo 180 gradi).
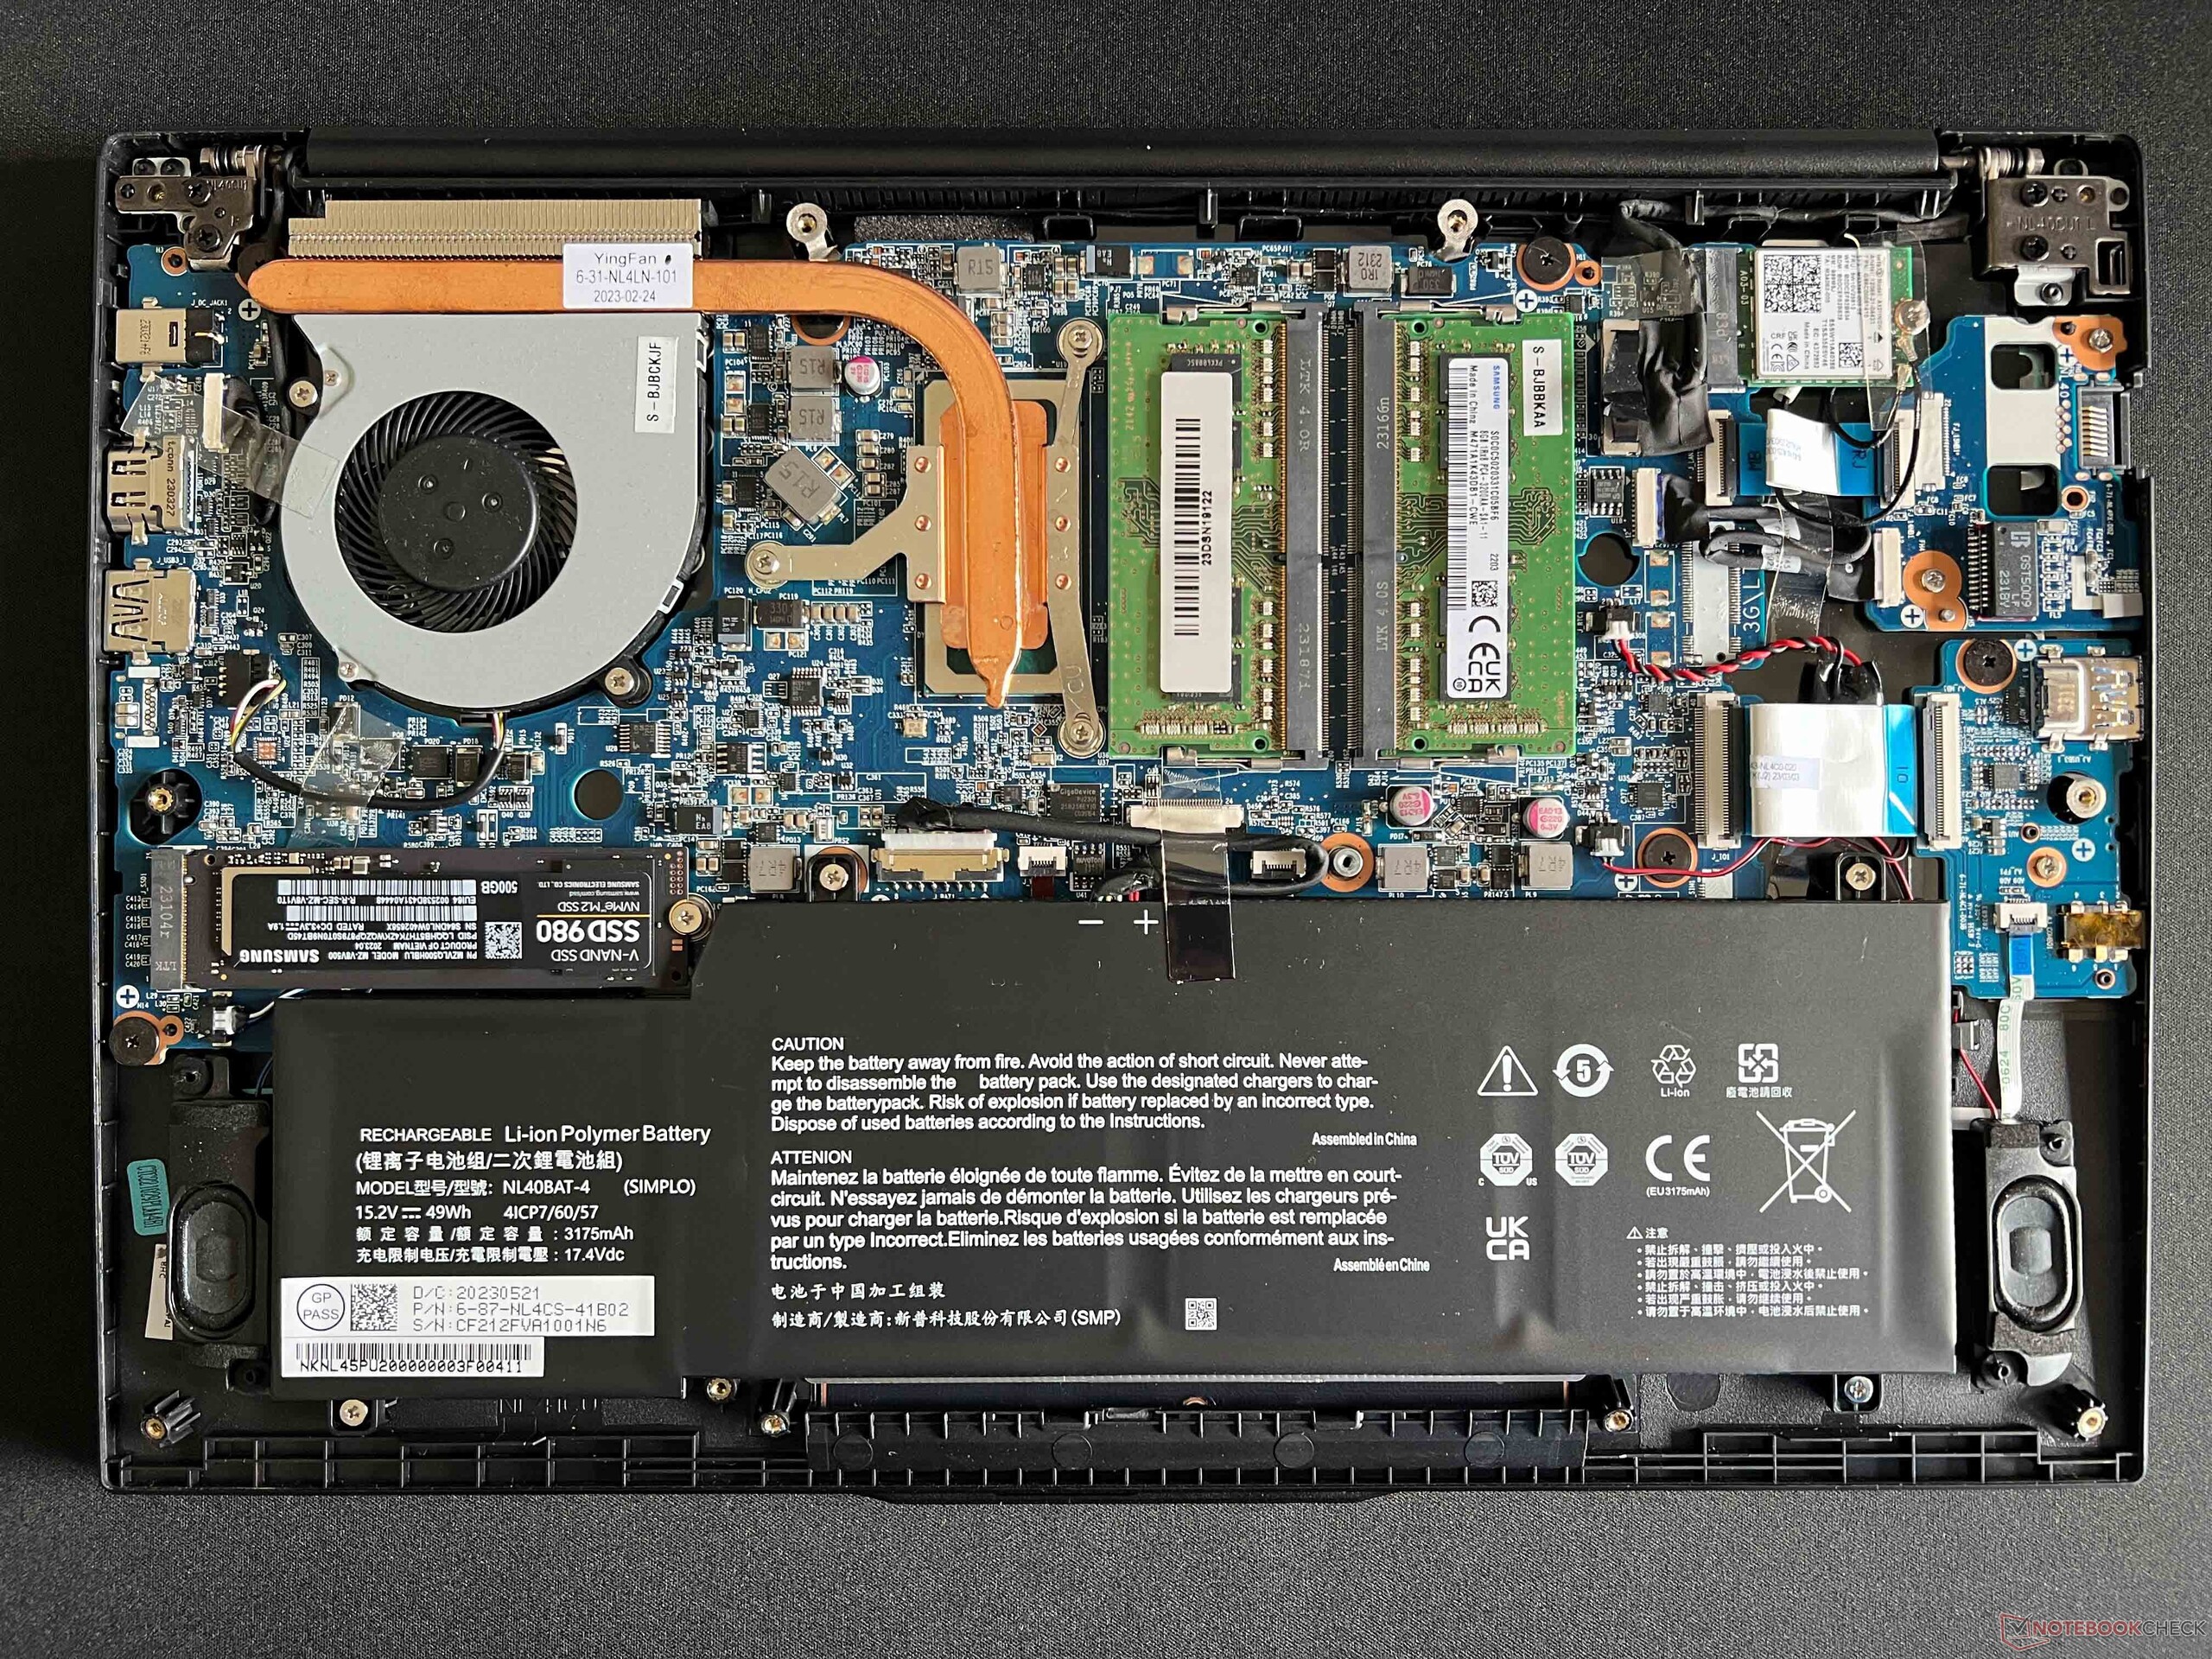
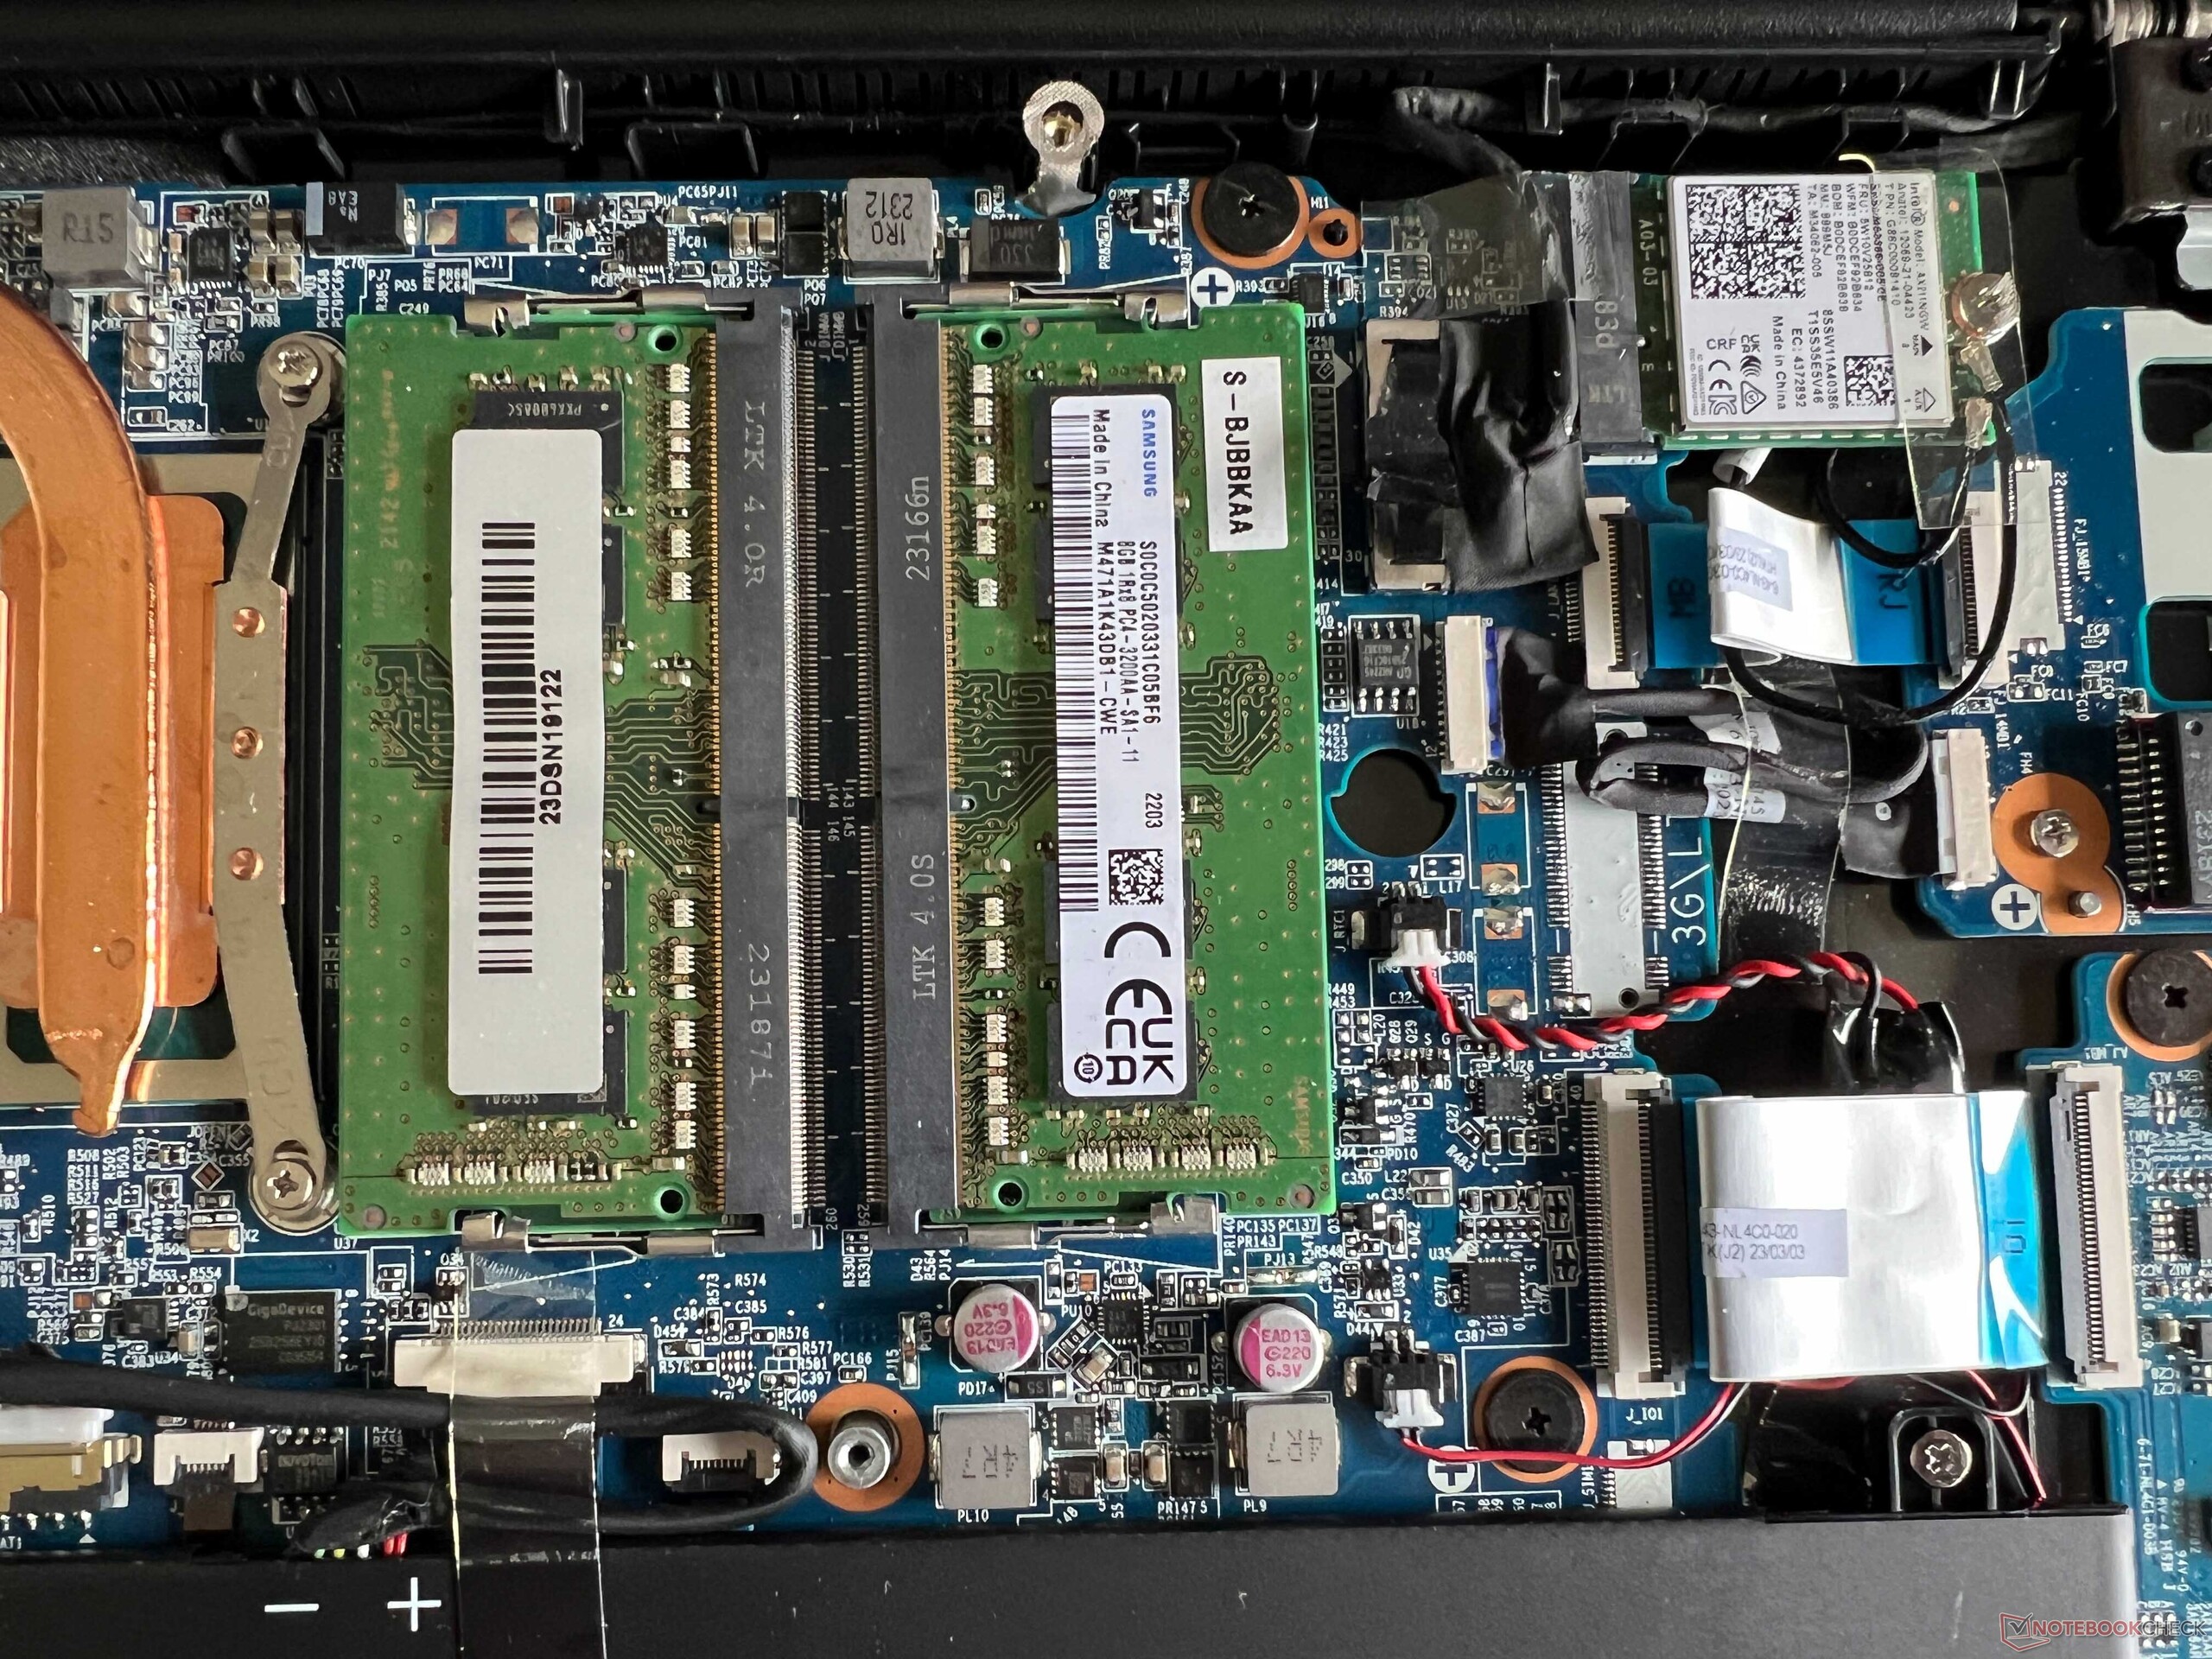
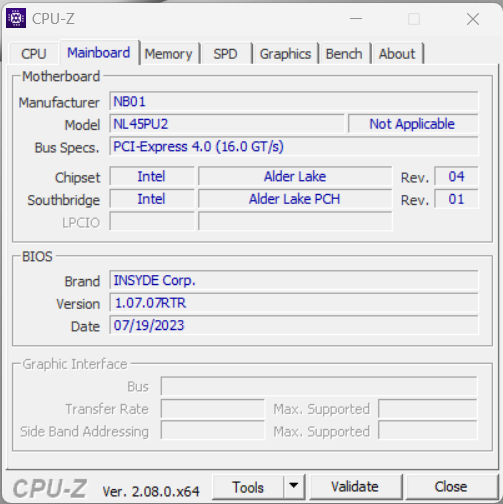
Il coperchio inferiore è fissato da normali viti Philips e può essere rimosso facilmente. Le opzioni di aggiornamento del portatile sono eccellenti, in quanto sono disponibili due slot per la RAM e, naturalmente, anche i modelli SSD e WLAN possono essere aggiornati. Questo dispositivo è in realtà già dotato di un modulo WLAN abbastanza moderno di Intel (AX211) e anche le sue velocità di trasferimento sono ottime.
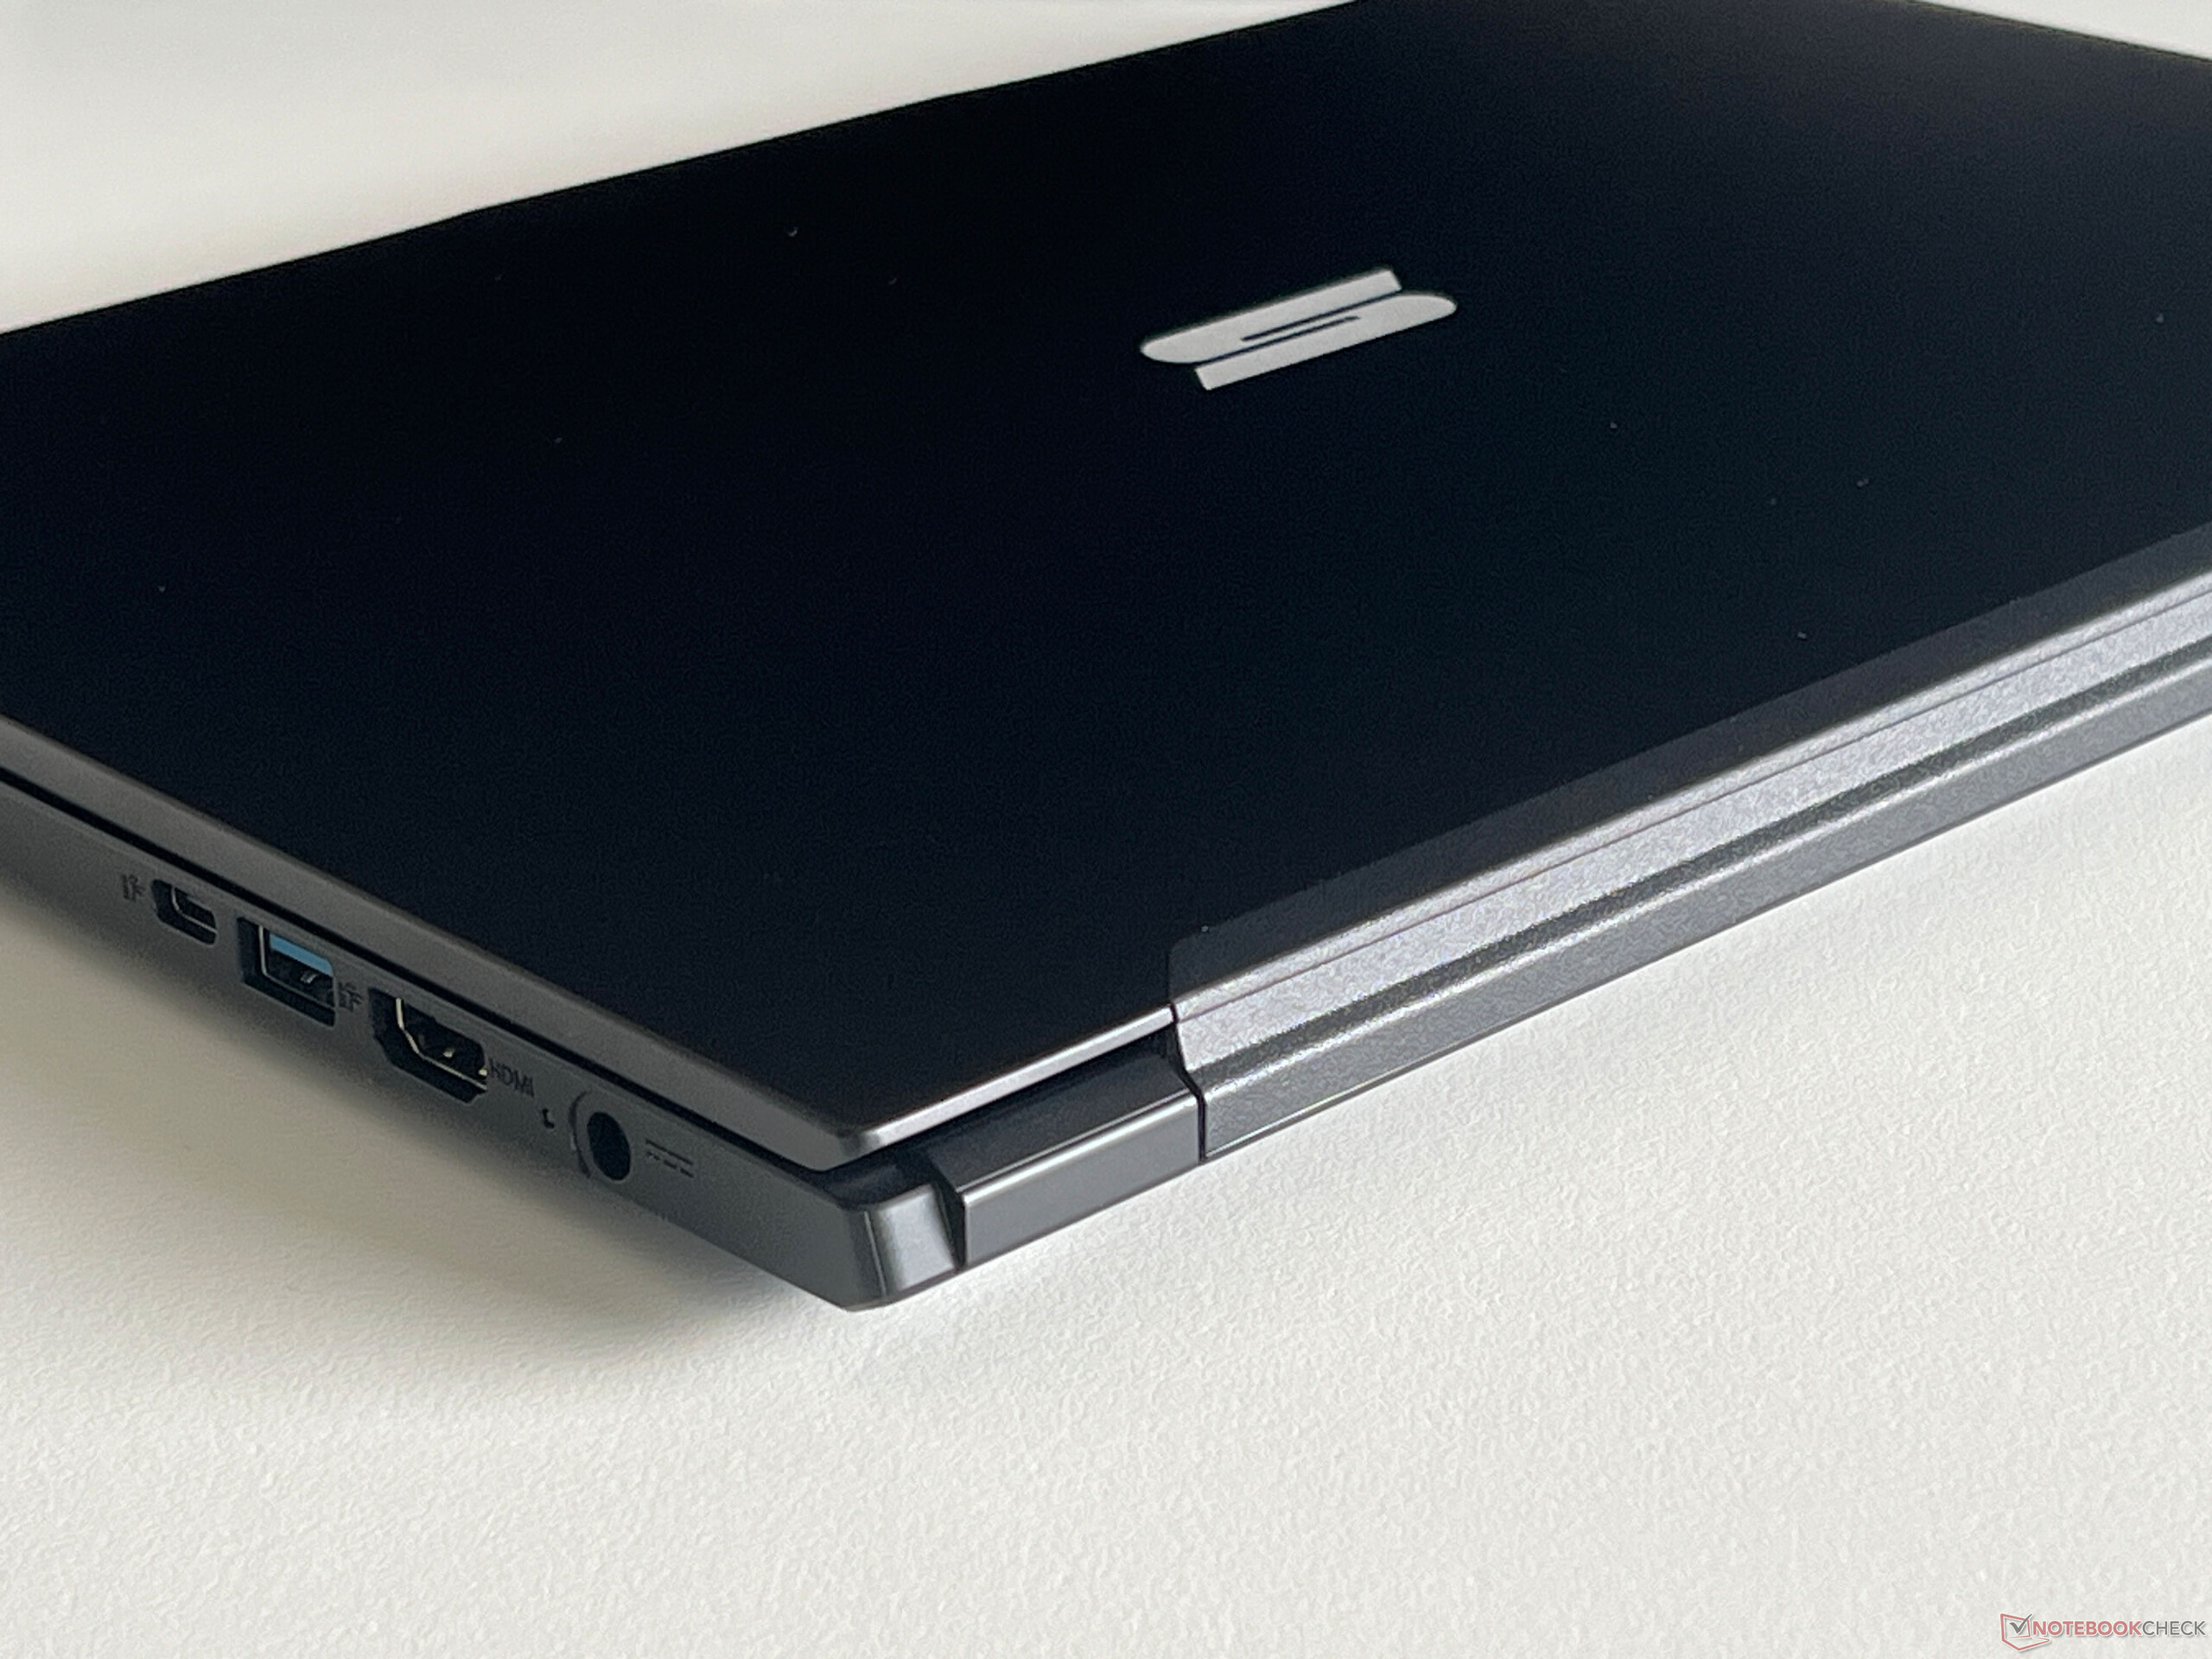
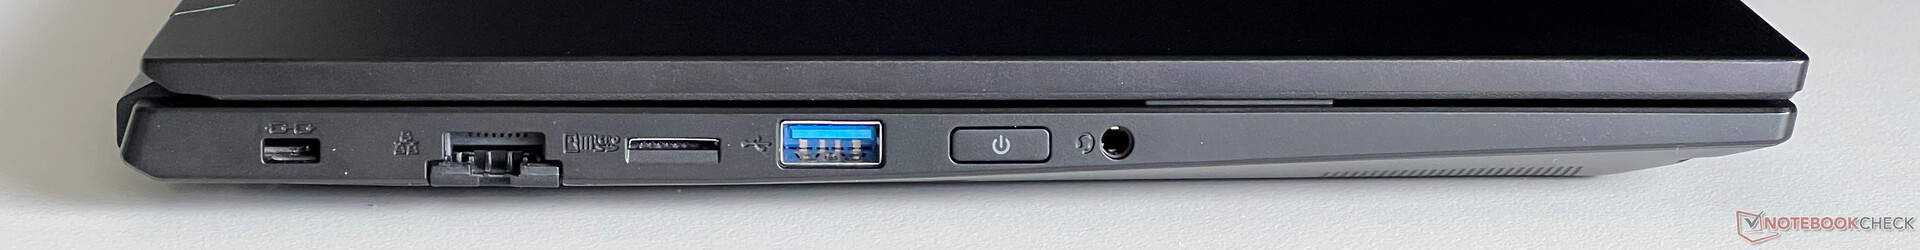
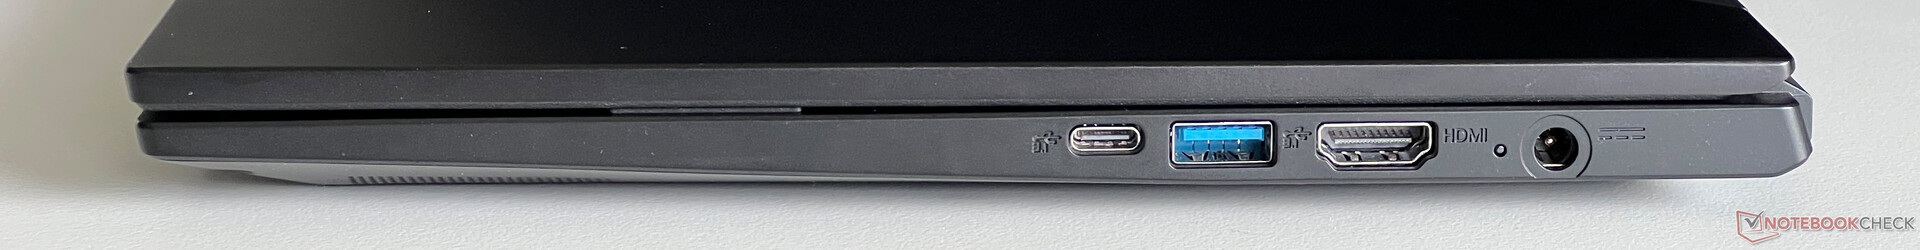
Le opzioni di connettività sono un altro dei punti di forza di Work 14. Anche se dovrà rinunciare a USB 4.0 e Thunderbolt, dispone di un numero sufficiente di connessioni USB e può anche utilizzare le docking station USB-C senza alcun problema. Inoltre, dispone di una porta Gigabit Ethernet. La sua webcam da 1080p con copertura meccanica scatta foto di qualità media.
| SD Card Reader | |
| average JPG Copy Test (av. of 3 runs) | |
| SCHENKER Work 14 Base (Angelbird AV Pro V60) | |
| Lenovo ThinkPad L14 G4 21H6S00900 | |
| Media della classe Office (8 - 82.7, n=47, ultimi 2 anni) | |
| Acer Swift Go 14 SFG14-71 | |
| maximum AS SSD Seq Read Test (1GB) | |
| Lenovo ThinkPad L14 G4 21H6S00900 (AV Pro V60) | |
| SCHENKER Work 14 Base (Angelbird AV Pro V60) | |
| Media della classe Office (25 - 90.5, n=41, ultimi 2 anni) | |
| Acer Swift Go 14 SFG14-71 (AV Pro SD microSD 128 GB V60) | |
| Networking | |
| SCHENKER Work 14 Base | |
| iperf3 transmit AXE11000 |
|
| iperf3 receive AXE11000 |
|
| Acer Swift Go 14 SFG14-71 | |
| iperf3 transmit AXE11000 |
|
| iperf3 receive AXE11000 |
|
| iperf3 transmit AXE11000 6GHz |
|
| iperf3 receive AXE11000 6GHz |
|
| HP ProBook 445 G10 | |
| iperf3 transmit AXE11000 |
|
| iperf3 receive AXE11000 |
|
| Dell Latitude 3440 | |
| iperf3 transmit AXE11000 |
|
| iperf3 receive AXE11000 |
|
| iperf3 transmit AXE11000 6GHz |
|
| iperf3 receive AXE11000 6GHz |
|
| Lenovo ThinkPad L14 G4 21H6S00900 | |
| iperf3 transmit AXE11000 |
|
| iperf3 receive AXE11000 |
|
| iperf3 transmit AXE11000 6GHz |
|
| iperf3 receive AXE11000 6GHz |
|
")
")
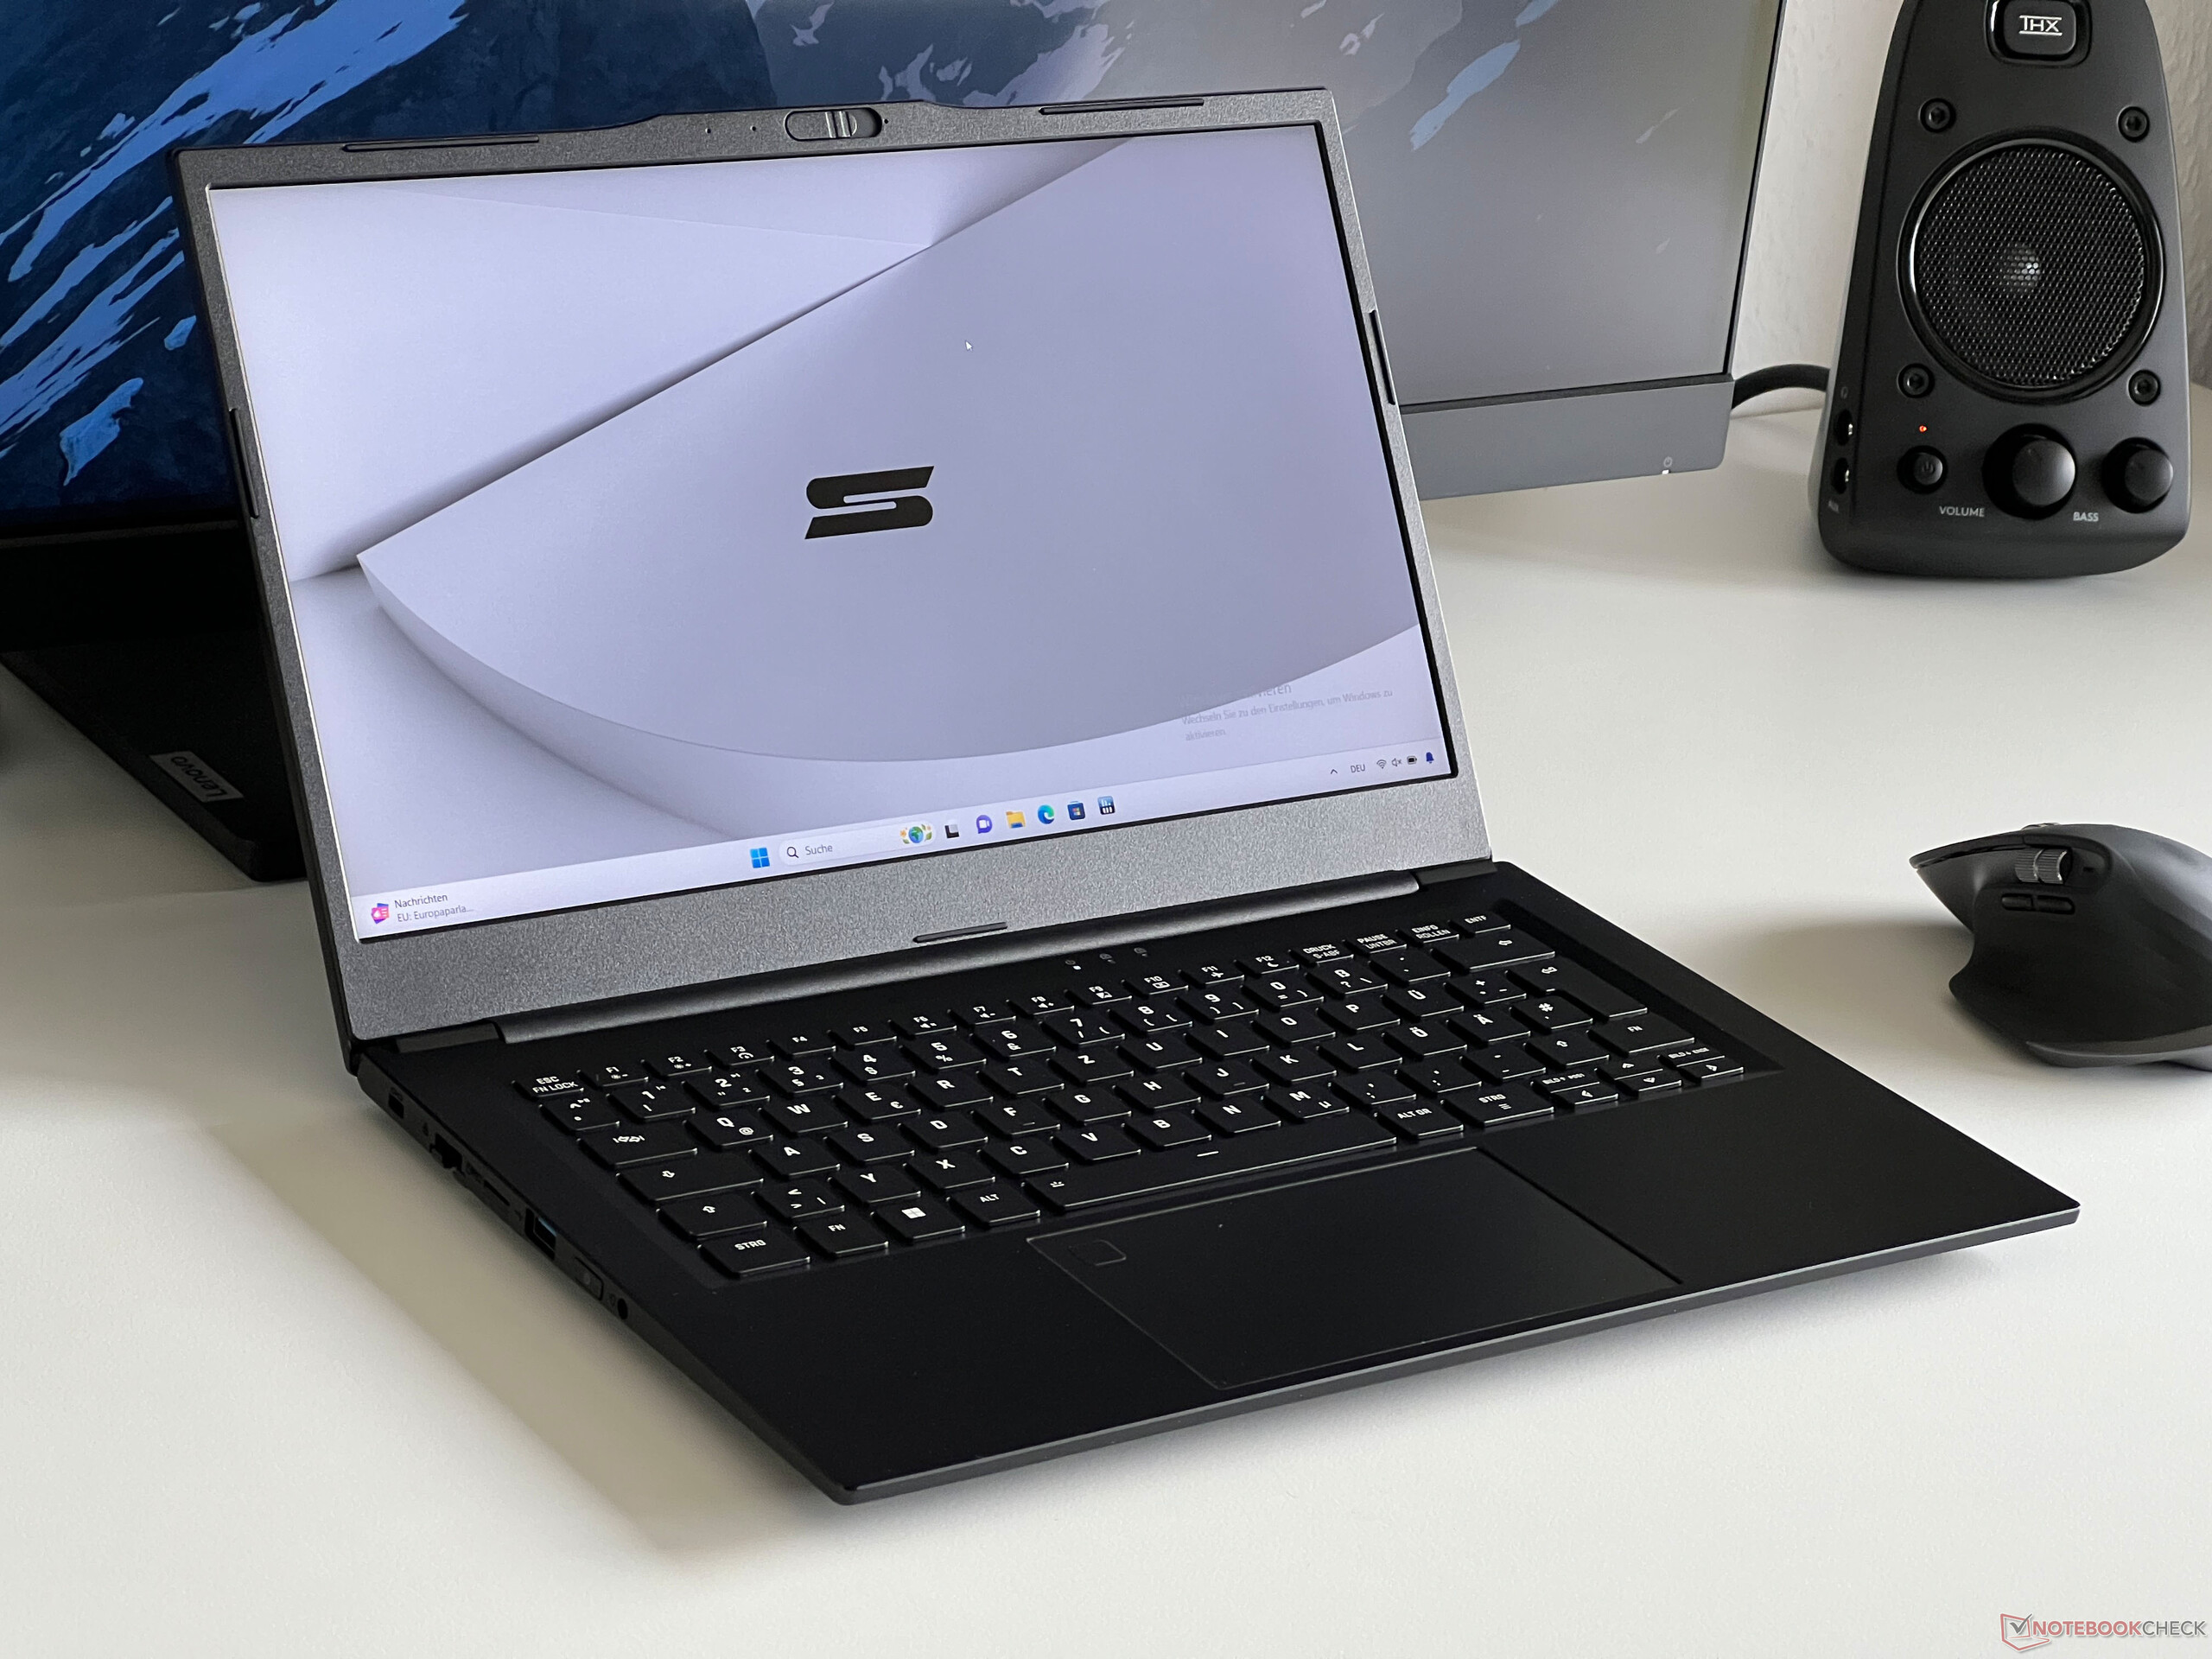
Dispositivi di ingresso
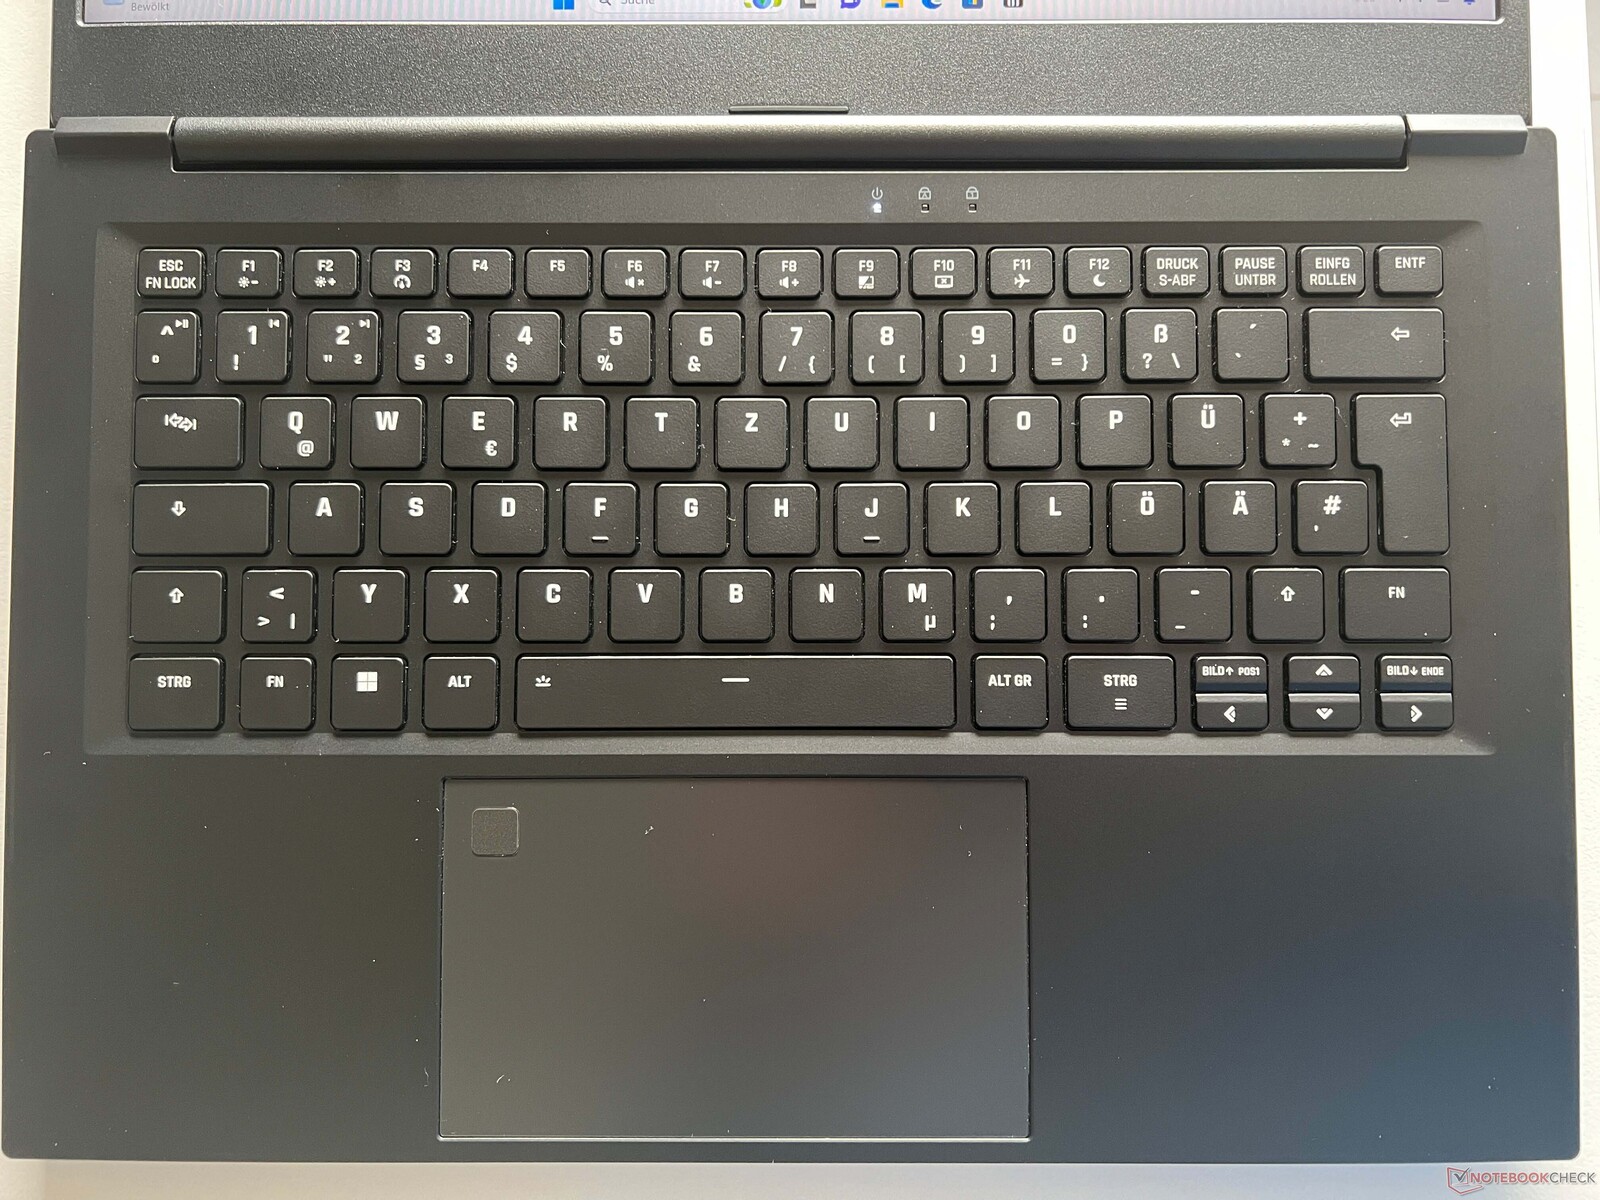
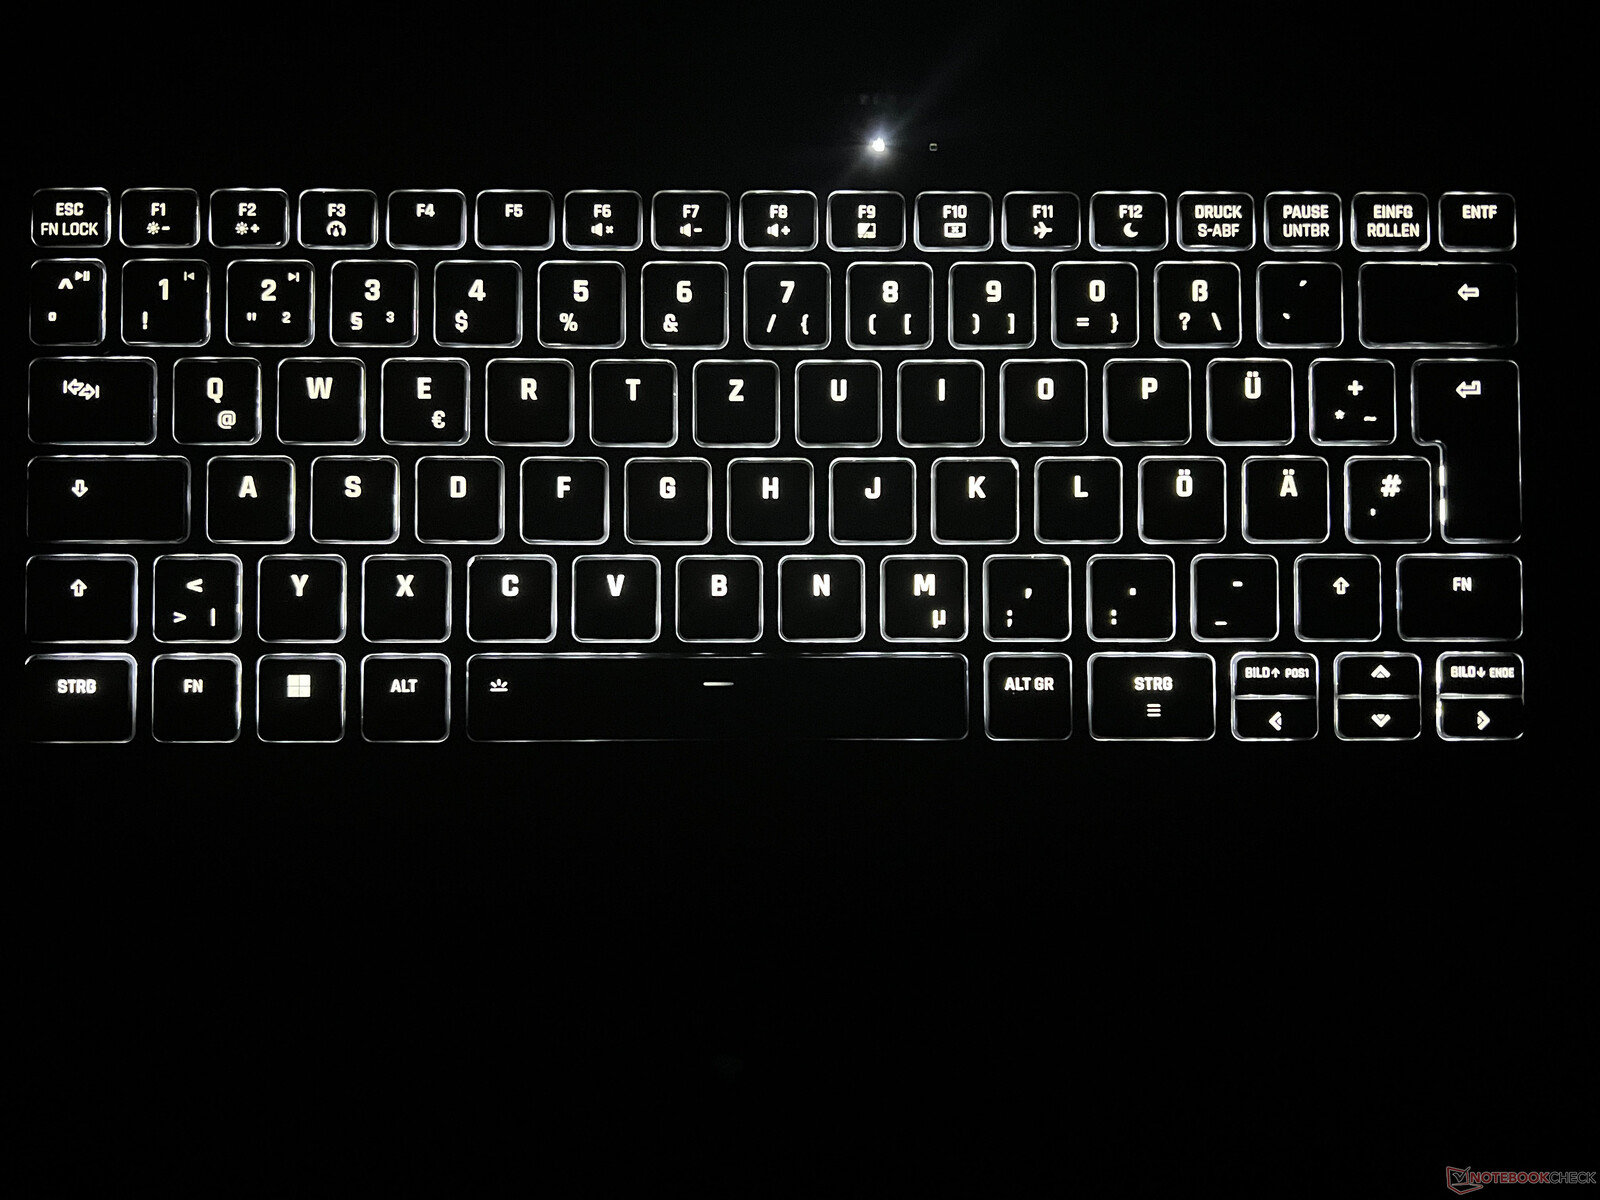
La tastiera chiclet nera del portatile è retroilluminata ed è comoda da digitare, tuttavia i tasti sono un po' più sottili del solito e in generale sono piuttosto piccoli. I tasti freccia sono in realtà ancora più piccoli, ma ci sono almeno dei tasti immagine su/immagine giù dedicati. Il touchpad Microsoft Precision è abbastanza grande da poter essere utilizzato comodamente (12,1 x 7,3 cm) ed è dotato di uno scanner di impronte digitali nell'angolo superiore sinistro. D'altra parte, non è totalmente liscio e si nota una certa resistenza durante l'uso. Inoltre, i suoi rumori di scatto sono molto forti e poco costosi, il che significa che raccomandiamo di toccare il pad solo per gli input, invece di premere.
Display - Pannello IPS opaco
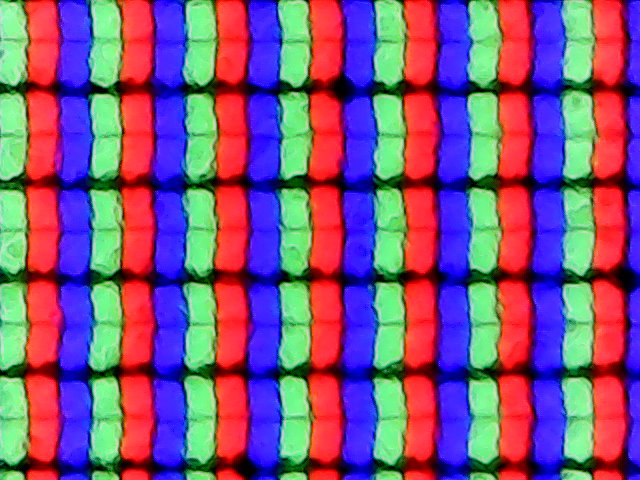
Il Work 14 è dotato di un pannello IPS opaco (60 Hz) di AU Optronics, con una risoluzione di 1.920 x 1.080 pixel. Ciò significa che si tratta ancora di un pannello 16:9, ma la maggior parte degli schermi dei suoi concorrenti ha lo stesso rapporto d'aspetto. Soggettivamente, la qualità dell'immagine soffre leggermente a causa dell'aspetto granuloso, tuttavia i contenuti sono sufficientemente nitidi e lo schermo non fa uso di PWM. Il backlight bleeding non è un problema, ma i tempi di risposta sono molto lenti e abbiamo notato una notevole quantità di ghosting. In un confronto diretto, l'Acer Swift Go offre una qualità d'immagine soggettiva molto migliore con il suo pannello OLED, ma a sua volta gli utenti devono fare i conti con un costante sfarfallio PWM.
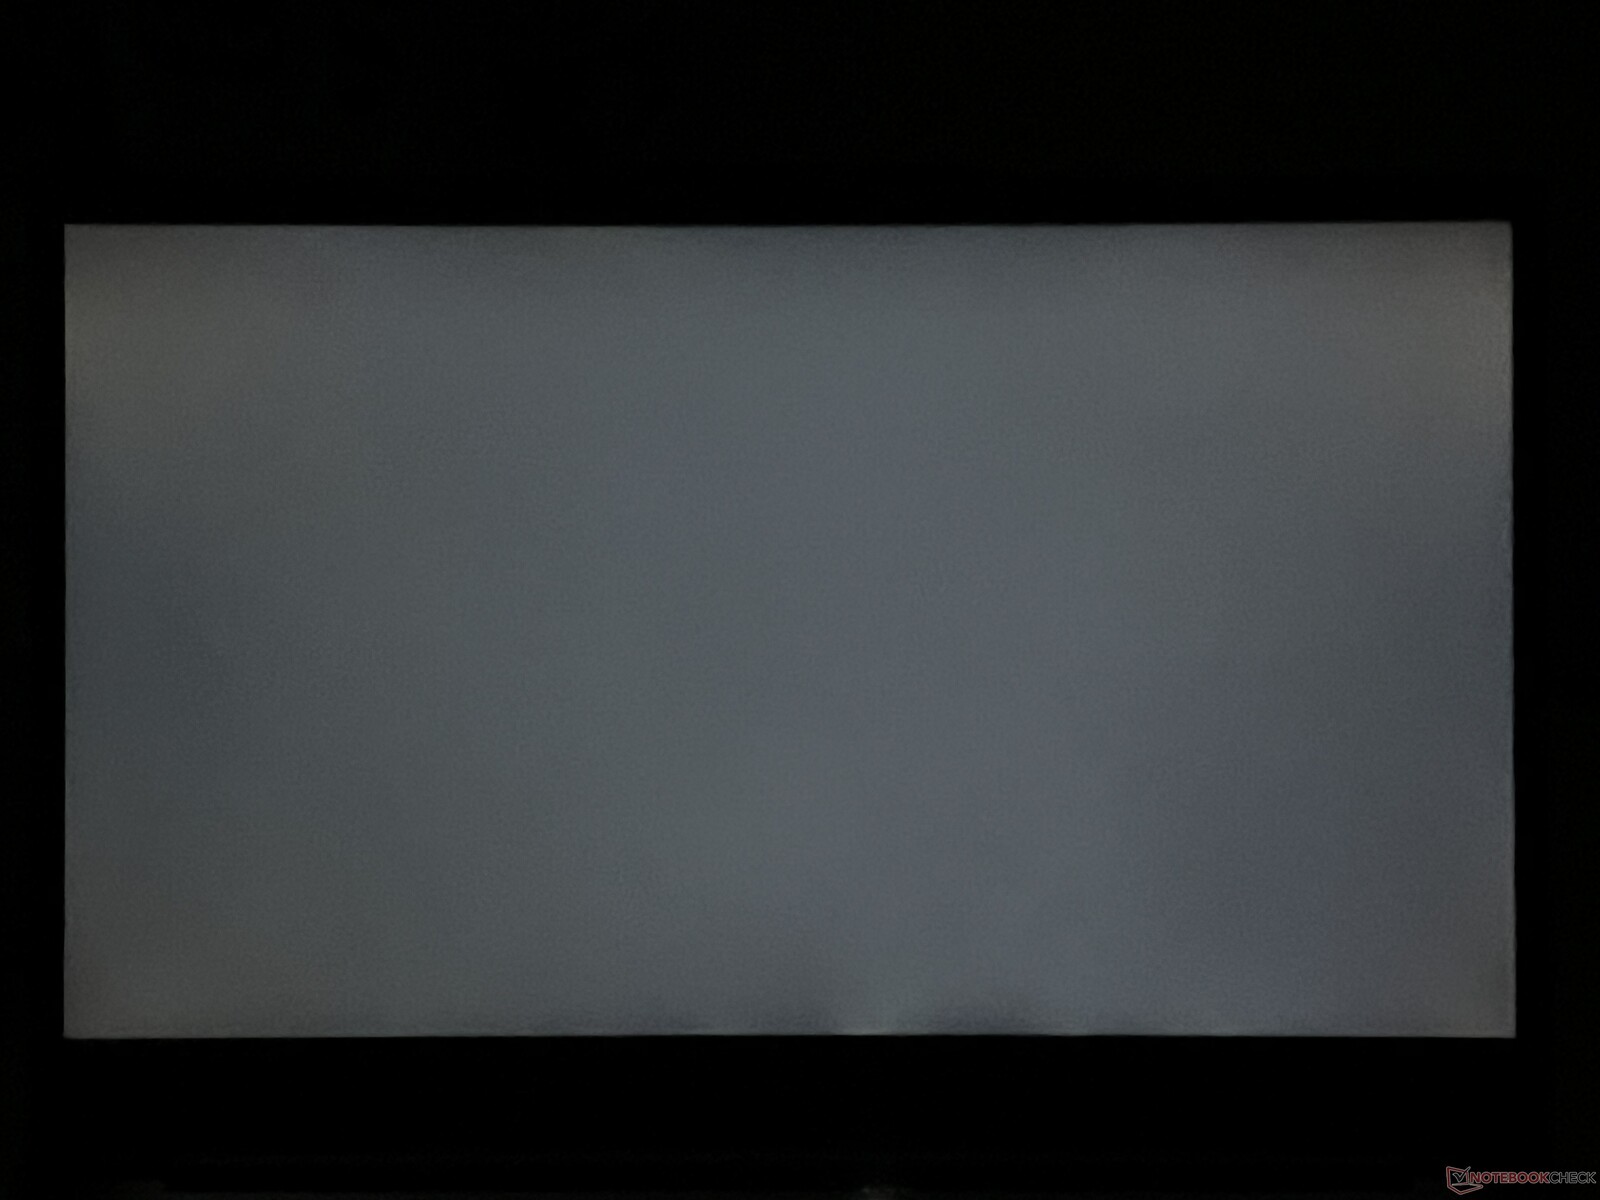
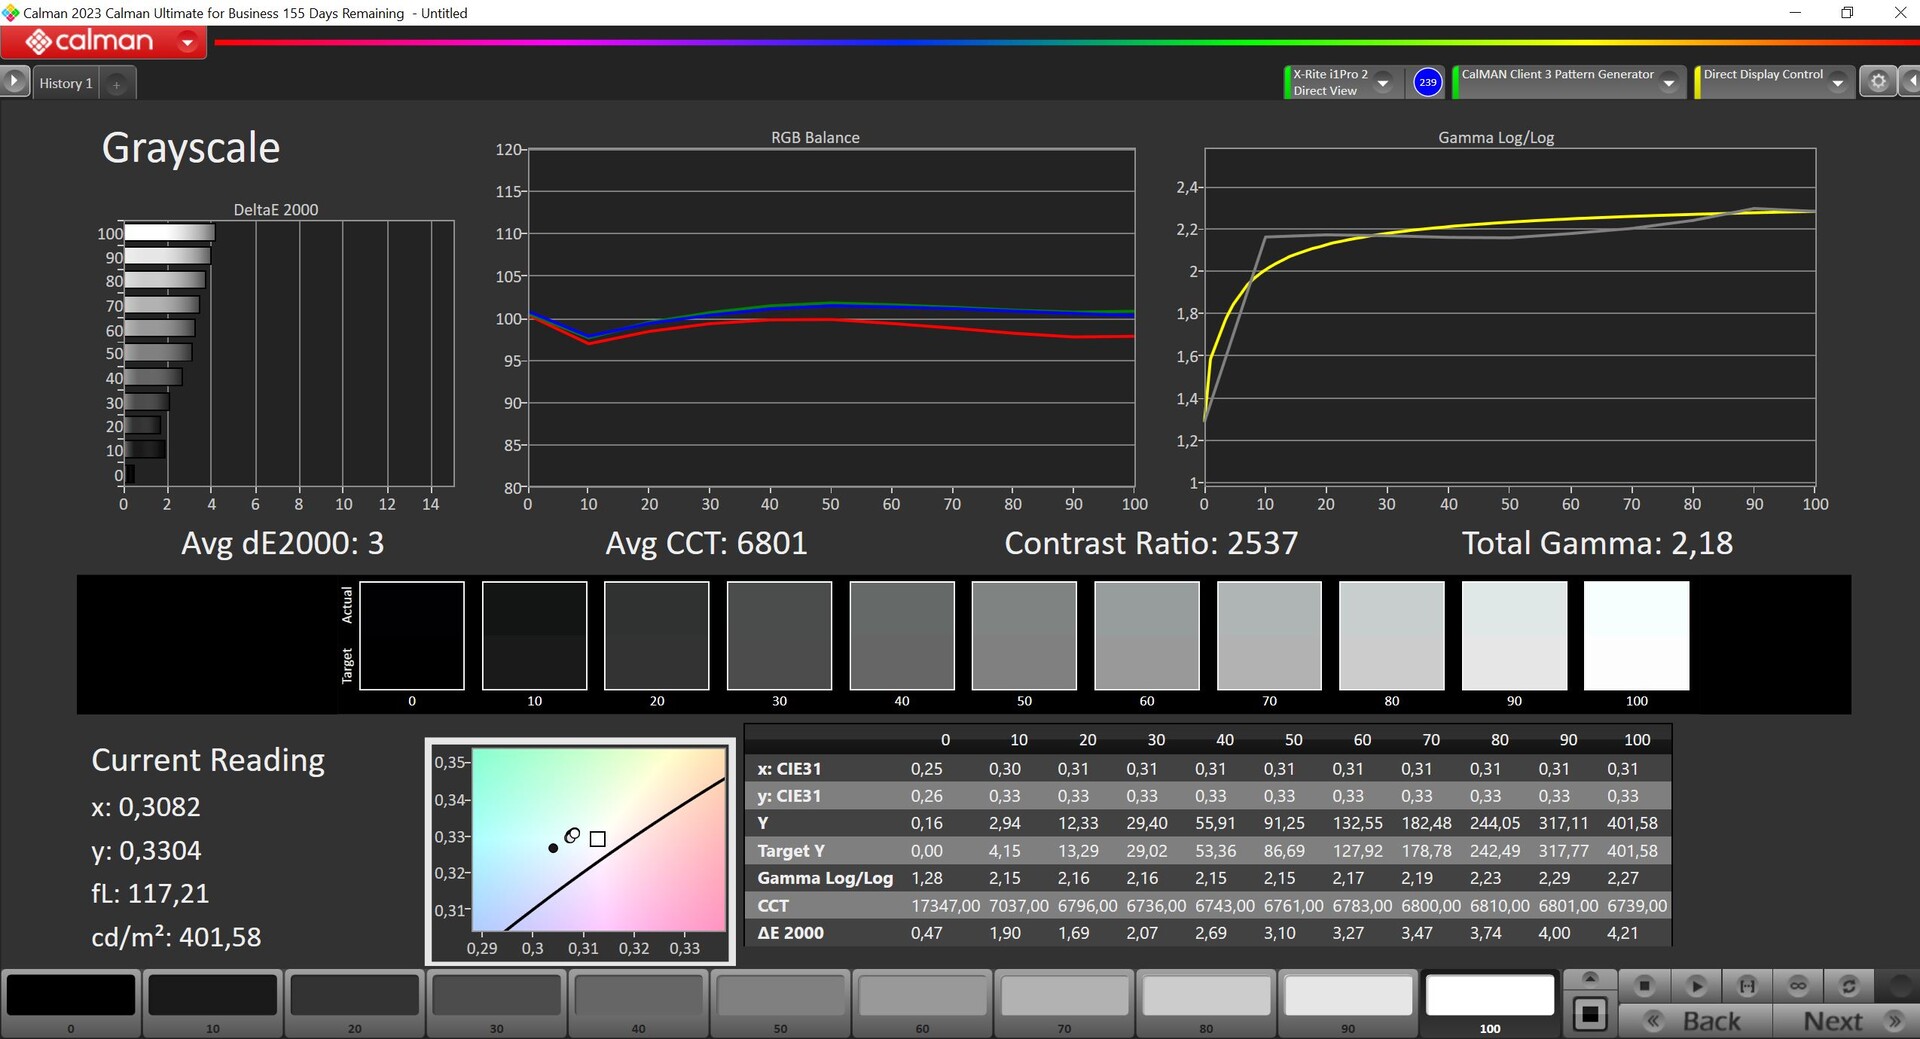
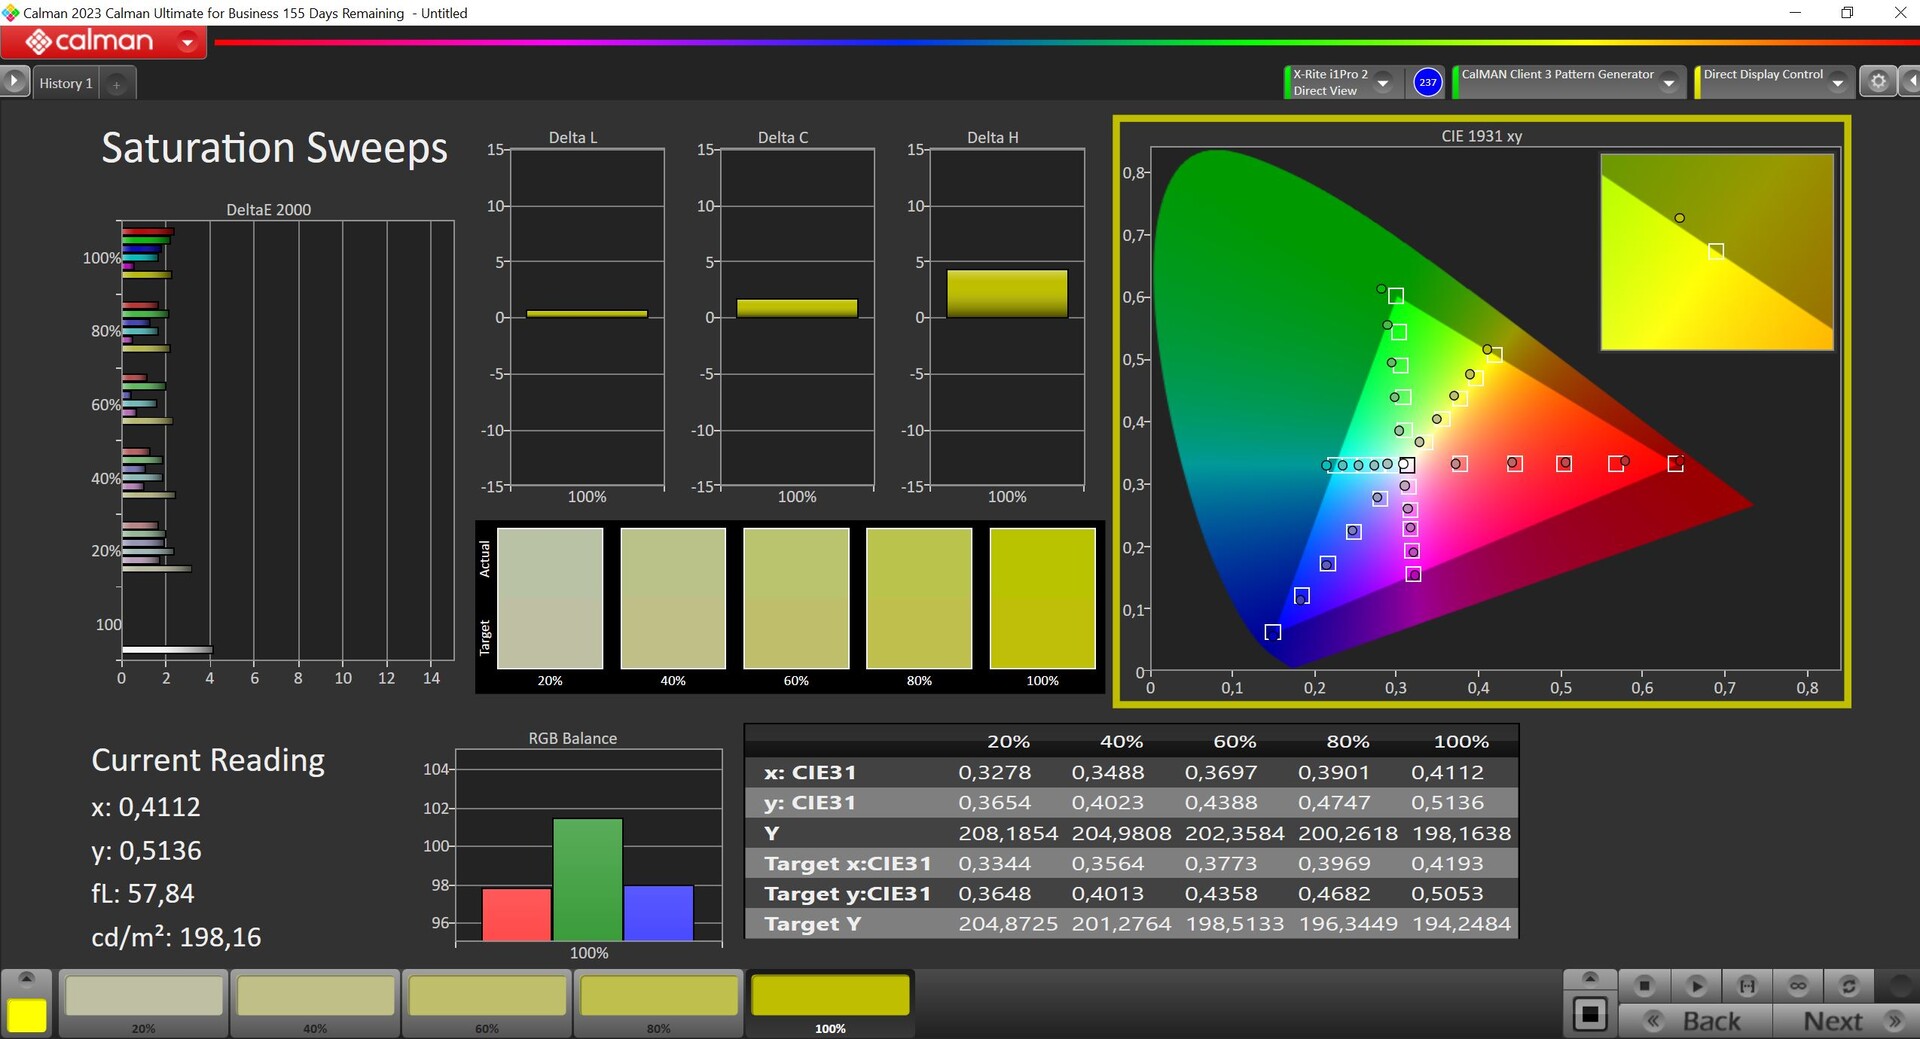
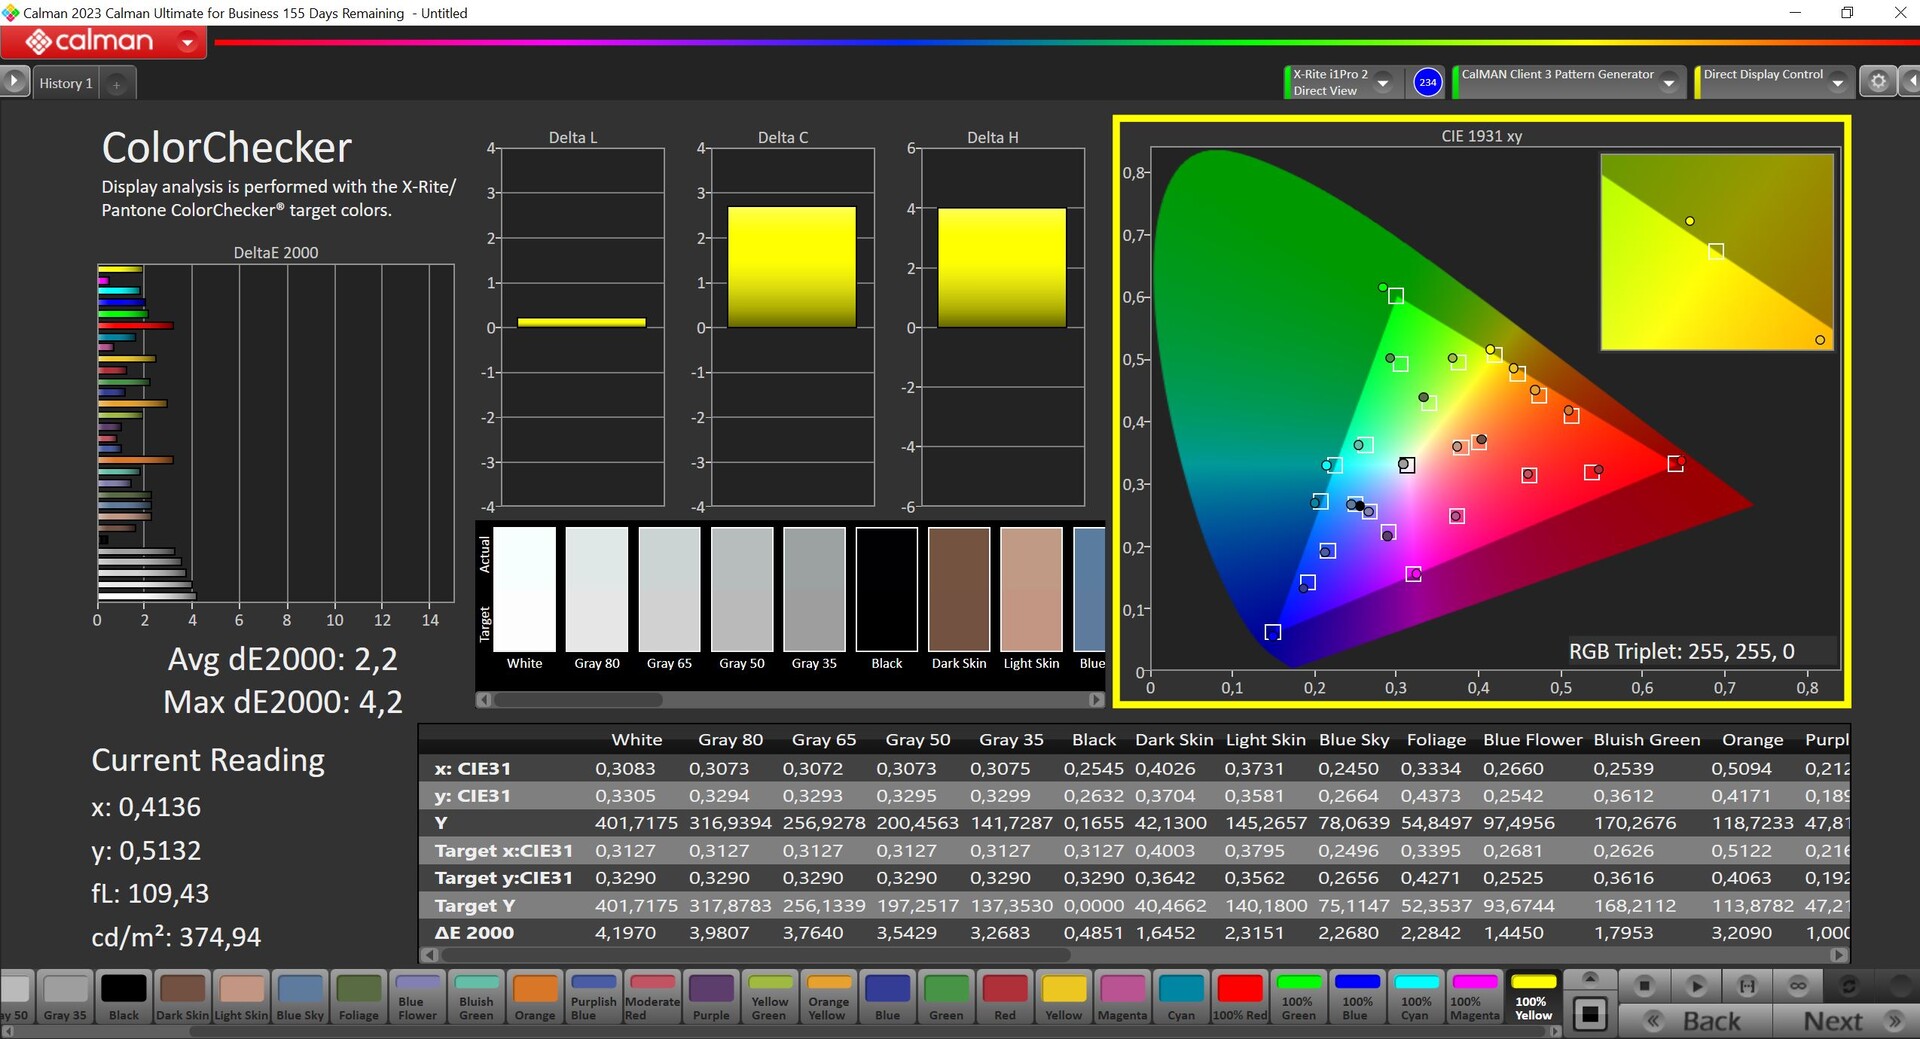
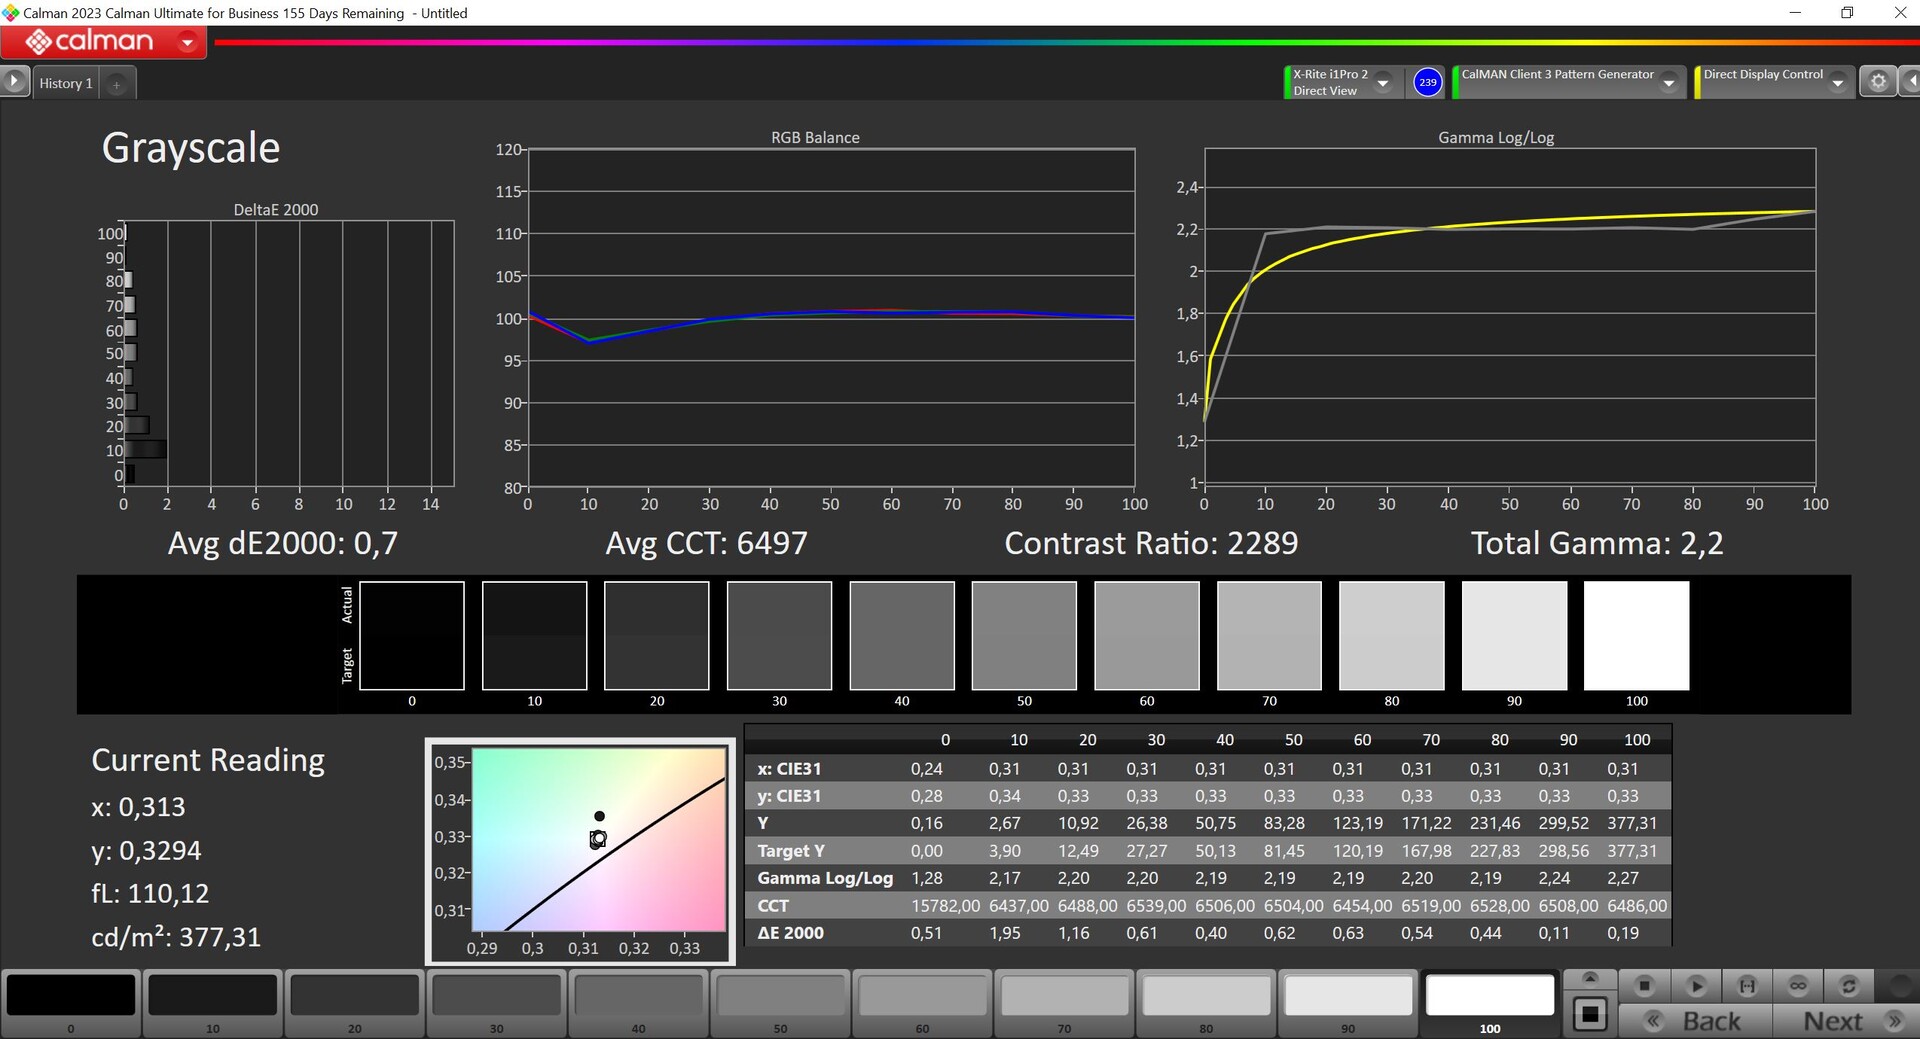
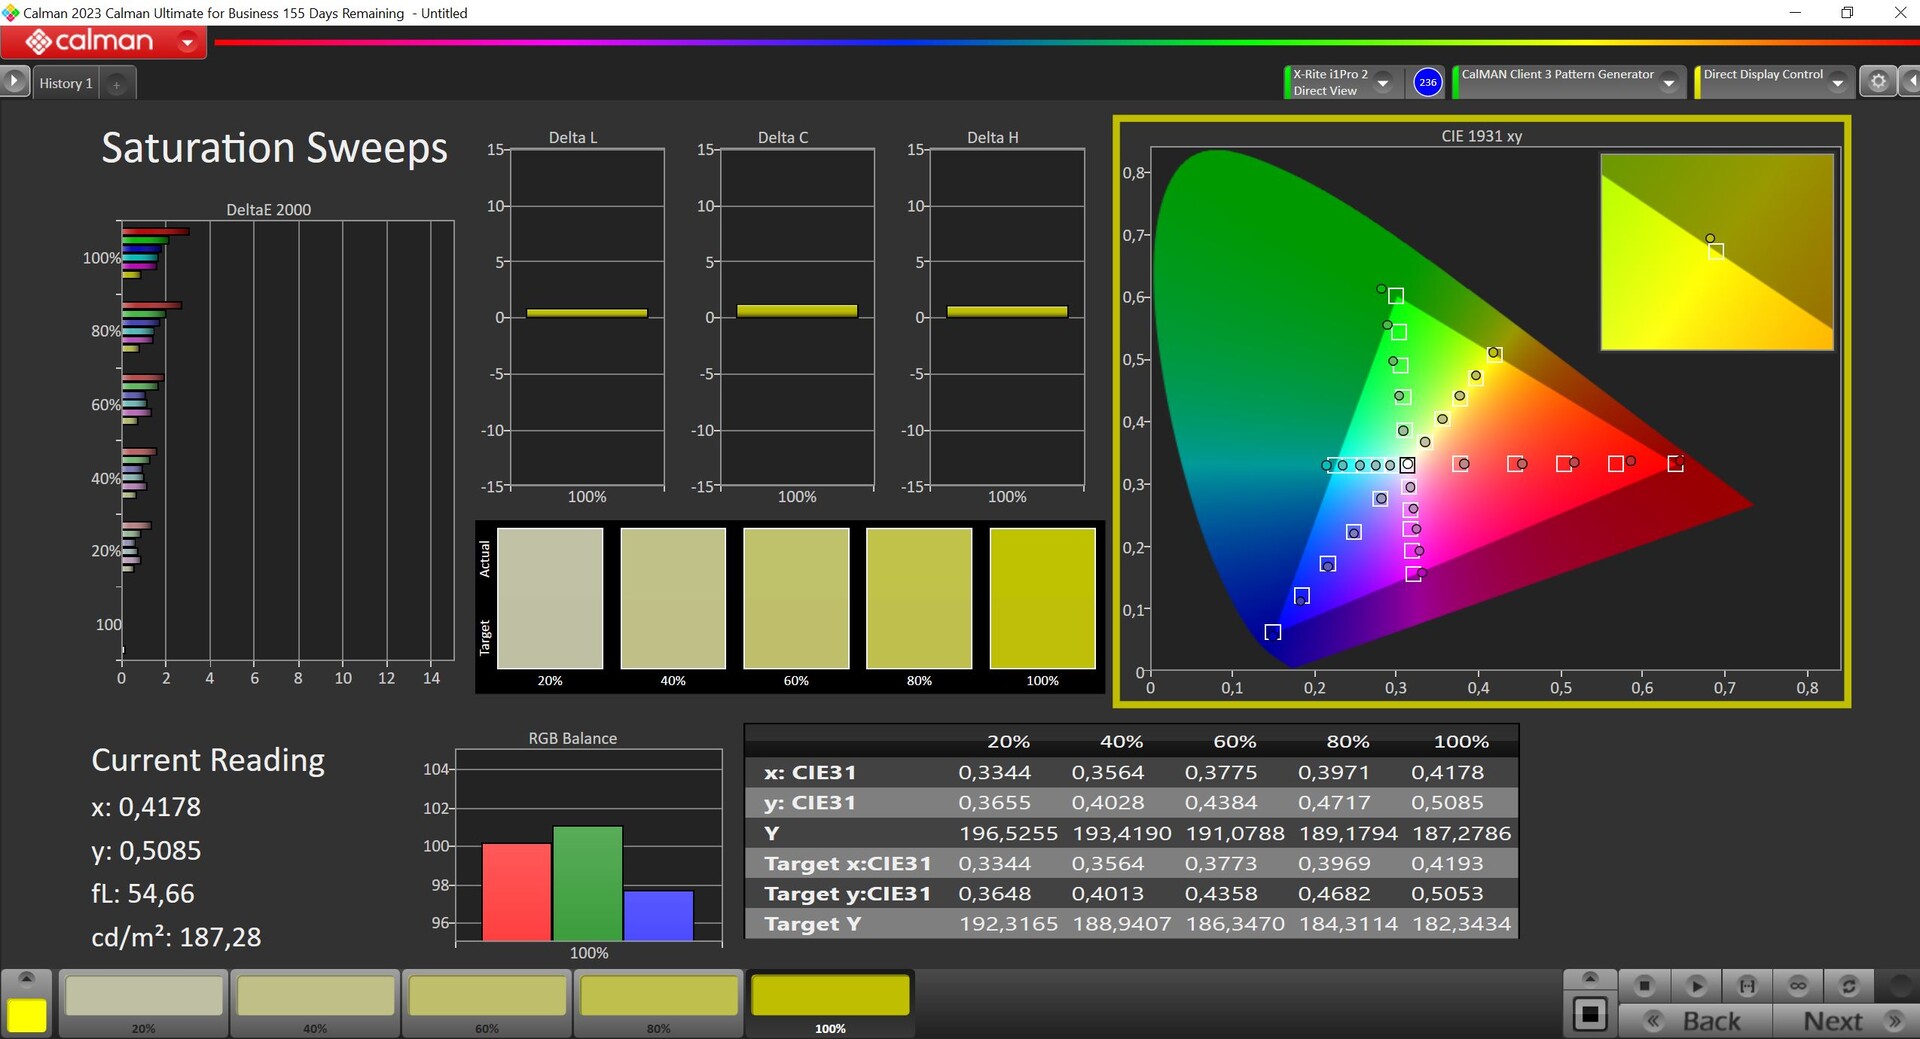
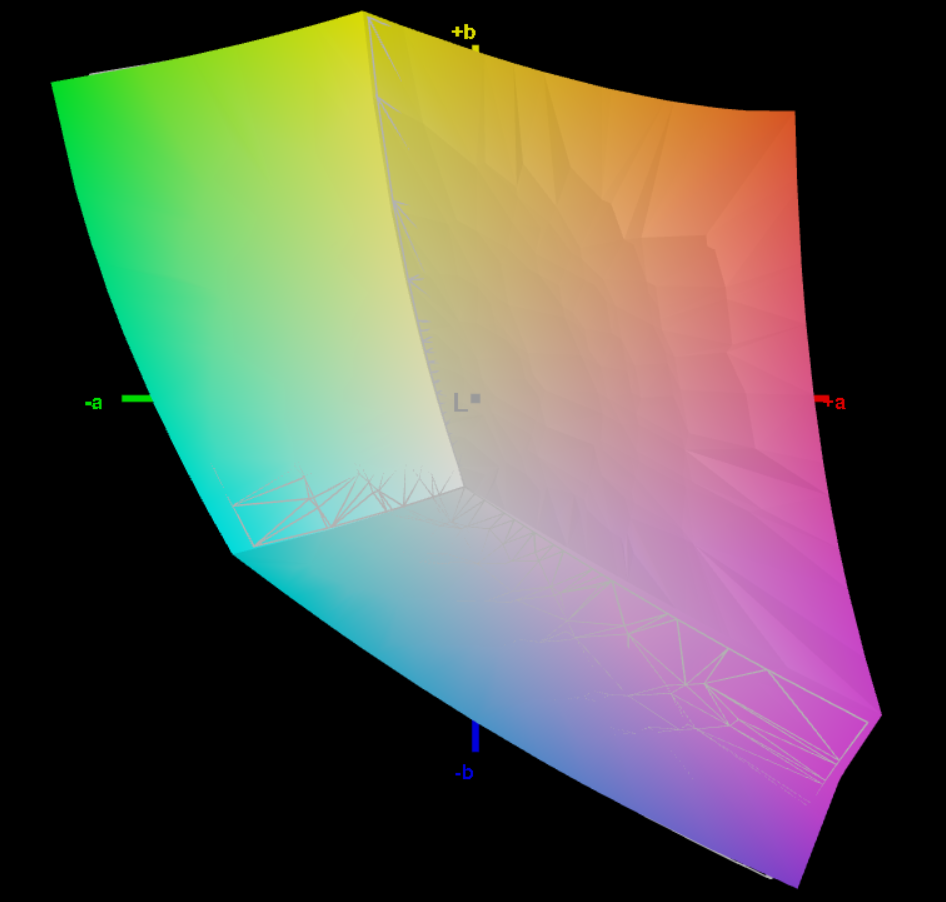
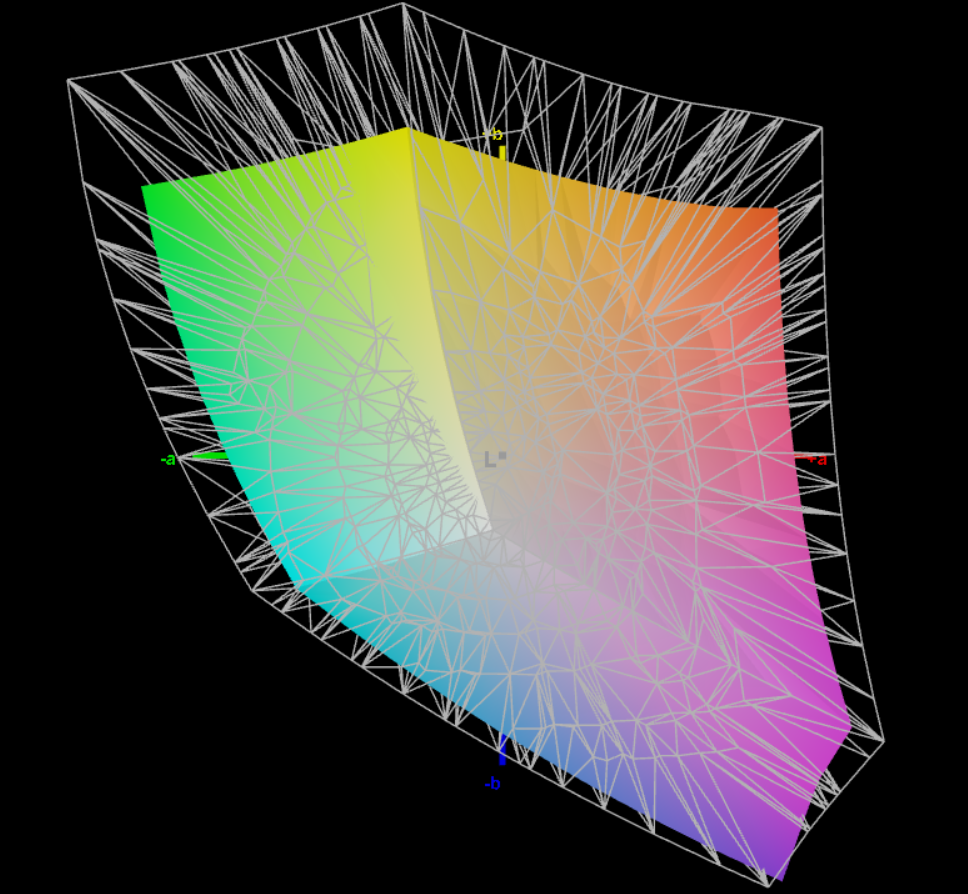
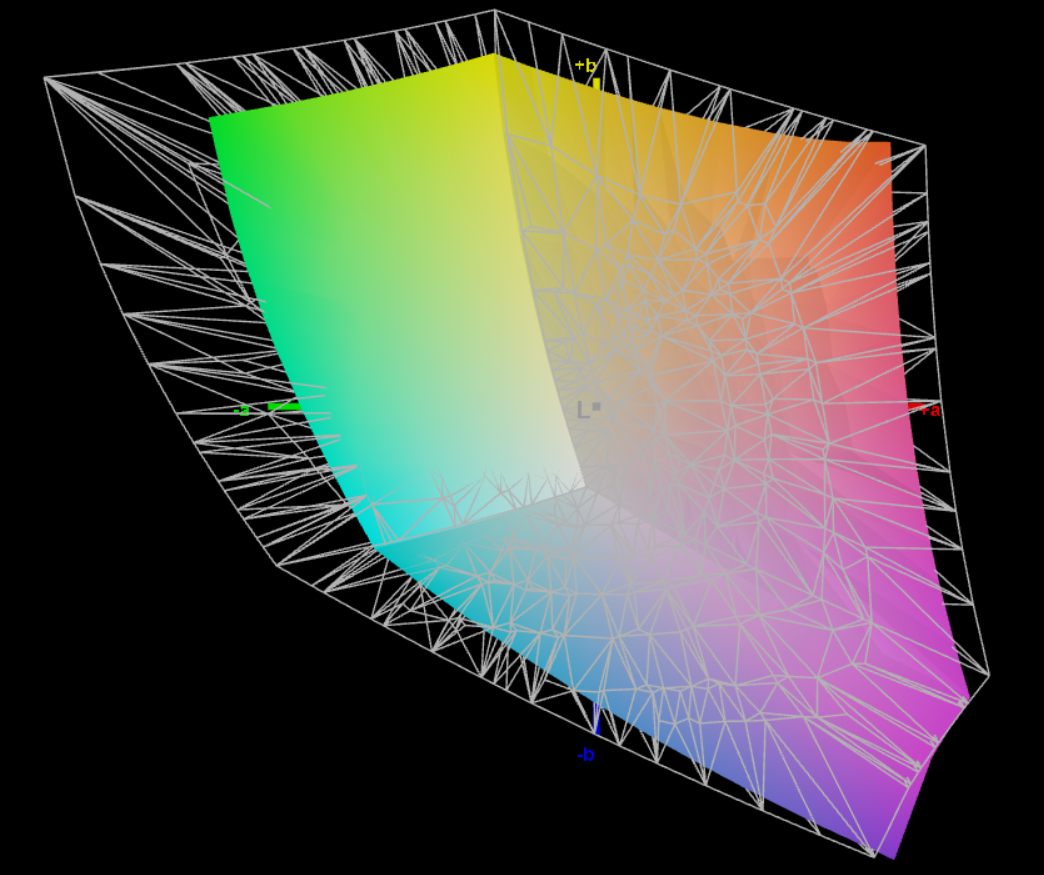
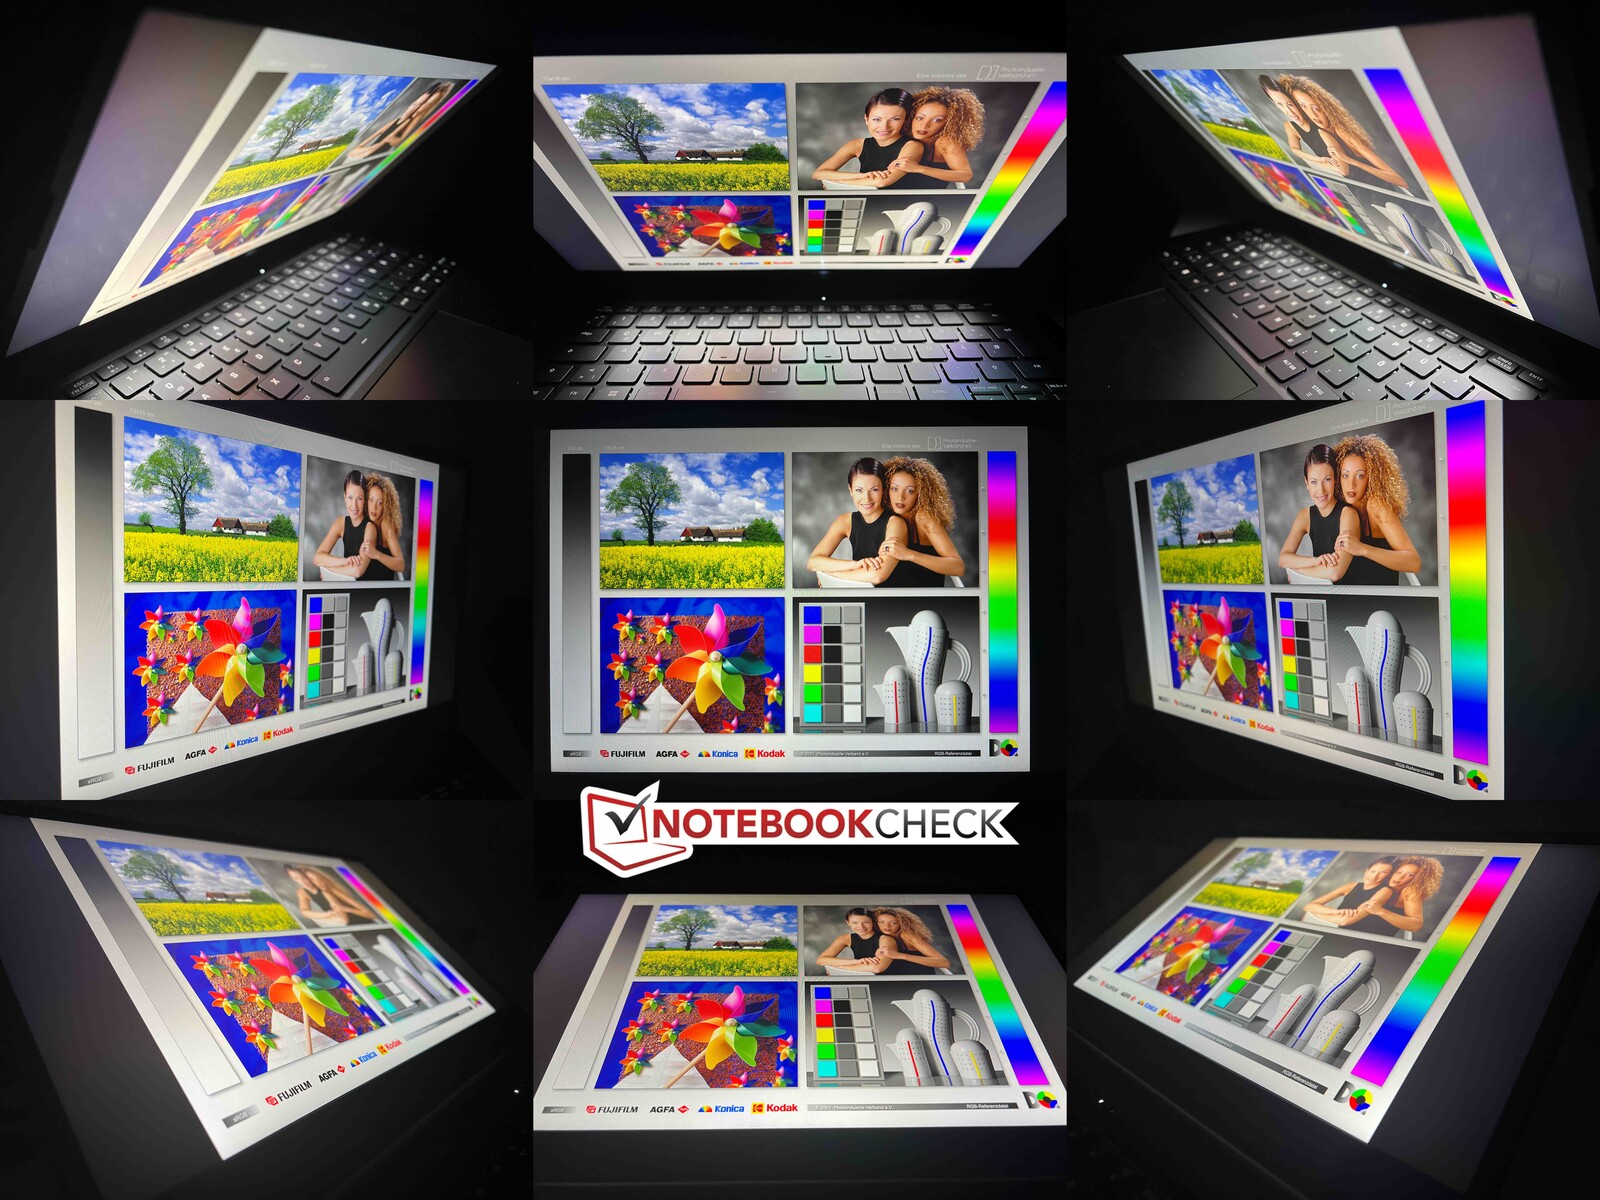
Il produttore dichiara una luminosità tipica di 300 cd/m² e il nostro dispositivo di prova ha mostrato risultati molto migliori in media, ossia oltre 400 cd/m². Inoltre, il suo valore del nero è molto basso, pari a 0,16 cd/m², il che porta a un elevato rapporto di contrasto massimo. La sua calibrazione è decente fin dall'inizio e questo non dovrebbe comportare problemi nell'uso quotidiano. Se si calibra lo schermo da soli, si può migliorare leggermente la sua rappresentazione, ma questo avviene al costo di una certa luminosità. Copre quasi completamente lo spazio cromatico sRGB più piccolo. All'esterno, il pannello fa una buona impressione e la stabilità dell'angolo di visione è buona.
| |||||||||||||||||||||||||
Distribuzione della luminosità: 89 %
Al centro con la batteria: 402 cd/m²
Contrasto: 2513:1 (Nero: 0.16 cd/m²)
ΔE Color 2.2 | 0.5-29.43 Ø5, calibrated: 1.3
ΔE Greyscale 3 | 0.57-98 Ø5.3
73.8% AdobeRGB 1998 (Argyll 2.2.0 3D)
99.8% sRGB (Argyll 2.2.0 3D)
72.4% Display P3 (Argyll 2.2.0 3D)
Gamma: 2.18
| SCHENKER Work 14 Base B140HAN06.8, IPS, 1920x1080, 14.00 | Acer Swift Go 14 SFG14-71 Samsung ATNA40YK11-0, OLED, 2880x1800, 14.00 | HP ProBook 445 G10 AUO2FA6, IPS, 1920x1080, 14.00 | Dell Latitude 3440 BOE NE140FH, IPS, 1920x1080, 14.00 | Lenovo ThinkPad L14 G4 21H6S00900 B140HAN06.9, IPS LED, 1920x1080, 14.00 | |
|---|---|---|---|---|---|
| Display | 22% | -5% | -42% | 0% | |
| Display P3 Coverage | 72.4 | 99.9 38% | 68.4 -6% | 40.4 -44% | 73.2 1% |
| sRGB Coverage | 99.8 | 100 0% | 95.2 -5% | 60.7 -39% | 98.9 -1% |
| AdobeRGB 1998 Coverage | 73.8 | 95.4 29% | 70.6 -4% | 41.8 -43% | 73.9 0% |
| Response Times | 96% | 24% | 28% | 5% | |
| Response Time Grey 50% / Grey 80% * | 60 ? | 1.85 ? 97% | 53.4 ? 11% | 35.3 ? 41% | 58.1 ? 3% |
| Response Time Black / White * | 34.7 ? | 2 ? 94% | 21.8 ? 37% | 29.8 ? 14% | 32.7 ? 6% |
| PWM Frequency | 357 ? | ||||
| Screen | -8% | -15% | -67% | -18% | |
| Brightness middle | 402 | 278 -31% | 501 25% | 292.6 -27% | 430 7% |
| Brightness | 404 | 279 -31% | 464 15% | 270 -33% | 409 1% |
| Brightness Distribution | 89 | 96 8% | 87 -2% | 88 -1% | 88 -1% |
| Black Level * | 0.16 | 0.04 75% | 0.26 -63% | 0.19 -19% | 0.31 -94% |
| Contrast | 2513 | 6950 177% | 1927 -23% | 1540 -39% | 1387 -45% |
| Colorchecker dE 2000 * | 2.2 | 3.01 -37% | 2.64 -20% | 4.63 -110% | 2.4 -9% |
| Colorchecker dE 2000 max. * | 4.2 | 4.43 -5% | 5.06 -20% | 17.1 -307% | 4.7 -12% |
| Colorchecker dE 2000 calibrated * | 1.3 | 4.14 -218% | 1.57 -21% | 2.13 -64% | 1.4 -8% |
| Greyscale dE 2000 * | 3 | 3.2 -7% | 3.8 -27% | 3.2 -7% | 3 -0% |
| Gamma | 2.18 101% | 2.194 100% | 2.103 105% | 2.34 94% | 2.3 96% |
| CCT | 6801 96% | 6126 106% | 6562 99% | 7184 90% | 6489 100% |
| Media totale (Programma / Settaggio) | 37% /
14% | 1% /
-7% | -27% /
-48% | -4% /
-11% |
* ... Meglio usare valori piccoli

Tempi di risposta del Display
| ↔ Tempi di risposta dal Nero al Bianco | ||
|---|---|---|
| 34.7 ms ... aumenta ↗ e diminuisce ↘ combinato | ↗ 17 ms Incremento | 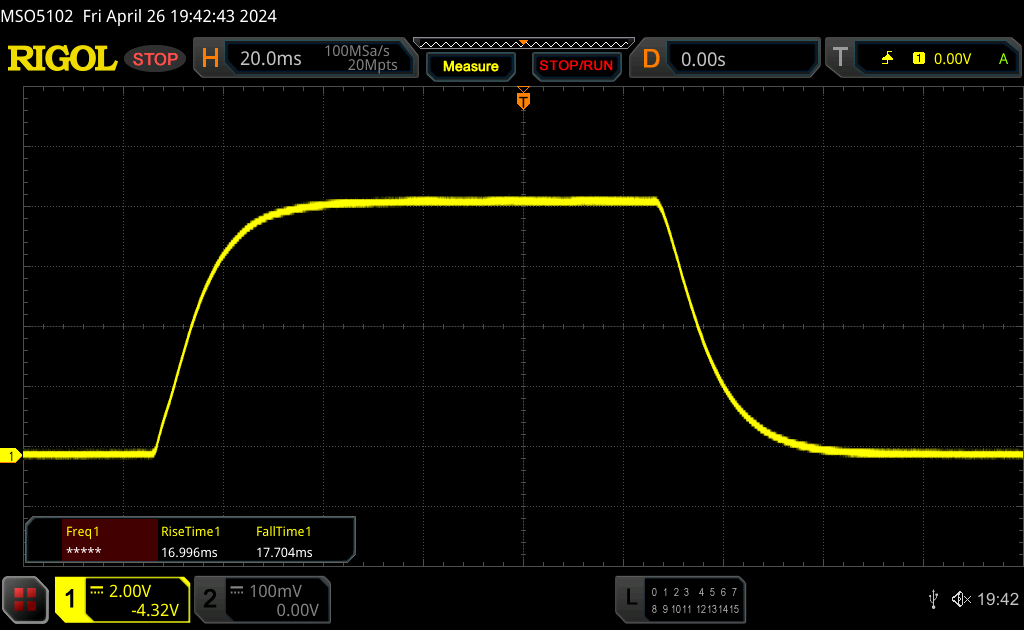 |
| ↘ 17.7 ms Calo | ||
| Lo schermo mostra tempi di risposta lenti nei nostri tests e sarà insoddisfacente per i gamers. In confronto, tutti i dispositivi di test variano da 0.1 (minimo) a 240 (massimo) ms. » 91 % di tutti i dispositivi è migliore. Questo significa che i tempi di risposta rilevati sono peggiori rispetto alla media di tutti i dispositivi testati (21.4 ms). | ||
| ↔ Tempo di risposta dal 50% Grigio all'80% Grigio | ||
| 60 ms ... aumenta ↗ e diminuisce ↘ combinato | ↗ 27.5 ms Incremento | 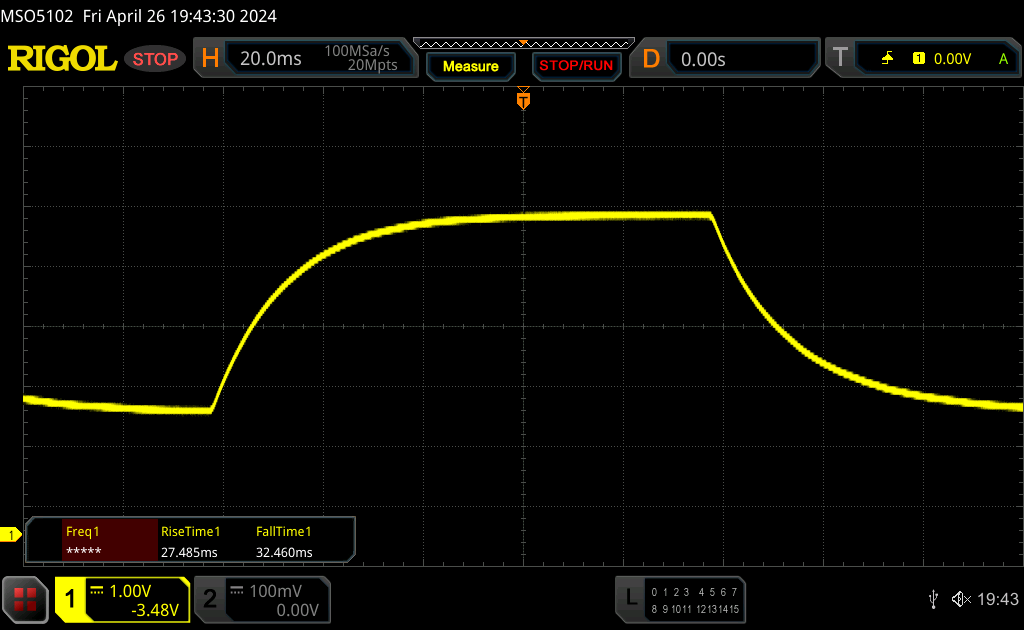 |
| ↘ 32.5 ms Calo | ||
| Lo schermo mostra tempi di risposta lenti nei nostri tests e sarà insoddisfacente per i gamers. In confronto, tutti i dispositivi di test variano da 0.2 (minimo) a 636 (massimo) ms. » 95 % di tutti i dispositivi è migliore. Questo significa che i tempi di risposta rilevati sono peggiori rispetto alla media di tutti i dispositivi testati (33.7 ms). | ||
Sfarfallio dello schermo / PWM (Pulse-Width Modulation)
| flickering dello schermo / PWM non rilevato | 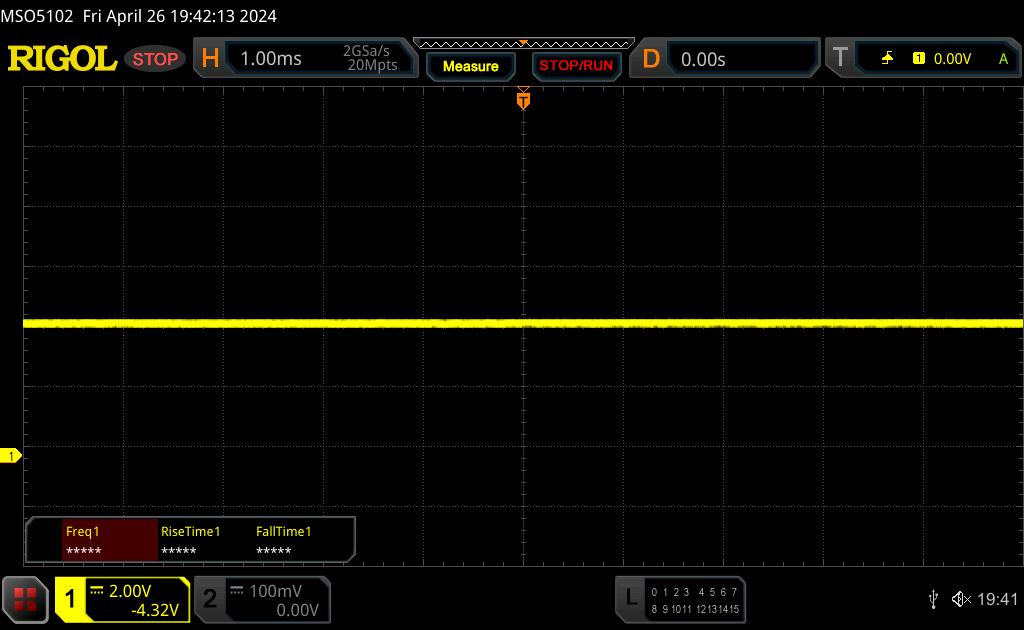 | ||
In confronto: 53 % di tutti i dispositivi testati non utilizza PWM per ridurre la luminosita' del display. Se è rilevato PWM, una media di 17812 (minimo: 5 - massimo: 3846000) Hz è stata rilevata. | |||
Performance - Il lavoro 14 con Alder Lake
Condizioni di test
Schenker offre diversi profili di prestazioni. Abbiamo effettuato i seguenti benchmark e misurazioni utilizzando la modalità intrattenimento, che è attiva per impostazione predefinita.
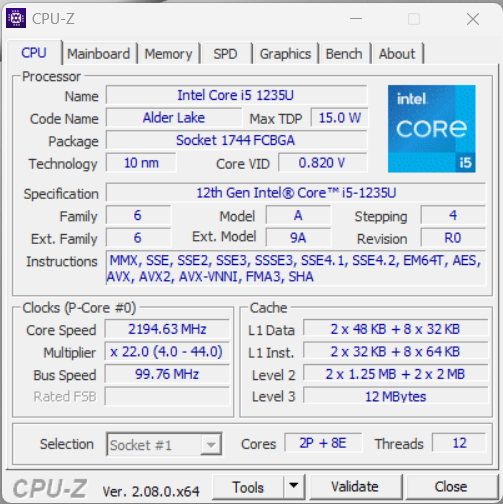
Processore - Core i5-1235U
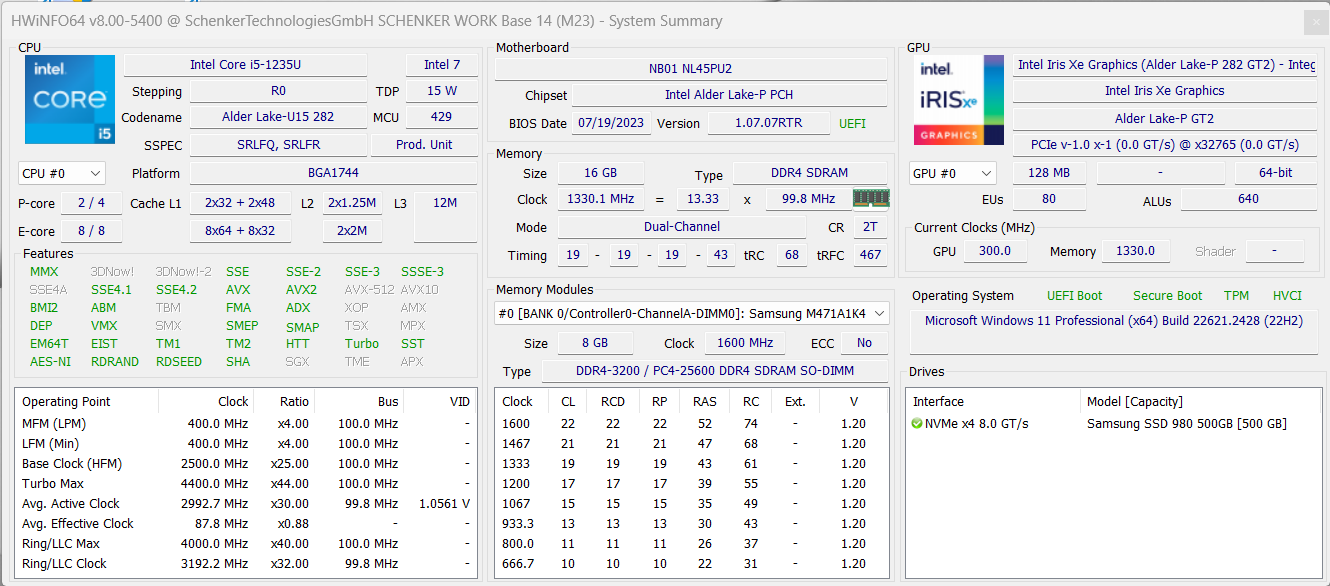
Il Core i5-1235U appartiene alla generazione Alder Lake di Intel, è dotato di 10 core (prestazioni 2x, efficienza 8x) e funziona a 25/20 watt all'interno di Work 14. Naturalmente, non deve aspettarsi miracoli in termini di prestazioni, tuttavia le sue prestazioni complessive sono paragonabili a quelle del Core i5-1345U all'interno del Dell Latitude 14. Le prestazioni della CPU sono sicuramente sufficienti per le semplici attività quotidiane quando lavora da casa o in ufficio e, inoltre, il portatile non risulta troppo lento. A sua volta, dovrà fare a meno di una NPU per le applicazioni AI. Nell'uso della batteria, il processore può consumare un massimo di 15 watt, motivo per cui le sue prestazioni sono inferiori del 20%. Ulteriori benchmark della CPU sono disponibili qui.
Cinebench R15 Multi continuous test
Cinebench R23: Multi Core | Single Core
Cinebench R20: CPU (Multi Core) | CPU (Single Core)
Cinebench R15: CPU Multi 64Bit | CPU Single 64Bit
Blender: v2.79 BMW27 CPU
7-Zip 18.03: 7z b 4 | 7z b 4 -mmt1
Geekbench 6.2: Multi-Core | Single-Core
Geekbench 5.5: Multi-Core | Single-Core
HWBOT x265 Benchmark v2.2: 4k Preset
LibreOffice : 20 Documents To PDF
R Benchmark 2.5: Overall mean
| CPU Performance Rating | |
| Acer Swift Go 14 SFG14-71 | |
| Lenovo ThinkPad L14 G4 21H6S00900 -2! | |
| Dell Latitude 3440 -2! | |
| HP ProBook 445 G10 | |
| Media della classe Office | |
| SCHENKER Work 14 Base | |
| Media Intel Core i5-1235U | |
| Cinebench R23 / Multi Core | |
| Lenovo ThinkPad L14 G4 21H6S00900 | |
| Media della classe Office (1056 - 15743, n=120, ultimi 2 anni) | |
| HP ProBook 445 G10 | |
| Acer Swift Go 14 SFG14-71 | |
| Dell Latitude 3440 | |
| SCHENKER Work 14 Base | |
| Media Intel Core i5-1235U (2485 - 9208, n=8) | |
| Cinebench R23 / Single Core | |
| Dell Latitude 3440 | |
| Media Intel Core i5-1235U (1444 - 1698, n=8) | |
| SCHENKER Work 14 Base | |
| Acer Swift Go 14 SFG14-71 | |
| Media della classe Office (529 - 1995, n=120, ultimi 2 anni) | |
| HP ProBook 445 G10 | |
| Lenovo ThinkPad L14 G4 21H6S00900 | |
| Cinebench R20 / CPU (Multi Core) | |
| Lenovo ThinkPad L14 G4 21H6S00900 | |
| Media della classe Office (356 - 5904, n=118, ultimi 2 anni) | |
| HP ProBook 445 G10 | |
| Acer Swift Go 14 SFG14-71 | |
| Dell Latitude 3440 | |
| SCHENKER Work 14 Base | |
| Media Intel Core i5-1235U (1783 - 3537, n=8) | |
| Cinebench R20 / CPU (Single Core) | |
| Dell Latitude 3440 | |
| SCHENKER Work 14 Base | |
| Media Intel Core i5-1235U (566 - 651, n=8) | |
| Acer Swift Go 14 SFG14-71 | |
| HP ProBook 445 G10 | |
| Lenovo ThinkPad L14 G4 21H6S00900 | |
| Media della classe Office (181.3 - 764, n=118, ultimi 2 anni) | |
| Cinebench R15 / CPU Multi 64Bit | |
| Lenovo ThinkPad L14 G4 21H6S00900 | |
| Media della classe Office (160.8 - 2642, n=118, ultimi 2 anni) | |
| Acer Swift Go 14 SFG14-71 | |
| HP ProBook 445 G10 | |
| Dell Latitude 3440 | |
| Media Intel Core i5-1235U (785 - 1587, n=8) | |
| SCHENKER Work 14 Base | |
| Cinebench R15 / CPU Single 64Bit | |
| Dell Latitude 3440 | |
| Acer Swift Go 14 SFG14-71 | |
| HP ProBook 445 G10 | |
| Lenovo ThinkPad L14 G4 21H6S00900 | |
| SCHENKER Work 14 Base | |
| Media della classe Office (82.6 - 284, n=116, ultimi 2 anni) | |
| Media Intel Core i5-1235U (151.5 - 242, n=8) | |
| Blender / v2.79 BMW27 CPU | |
| Media della classe Office (214 - 2844, n=119, ultimi 2 anni) | |
| SCHENKER Work 14 Base | |
| Media Intel Core i5-1235U (366 - 662, n=8) | |
| Dell Latitude 3440 | |
| Acer Swift Go 14 SFG14-71 | |
| Lenovo ThinkPad L14 G4 21H6S00900 | |
| HP ProBook 445 G10 | |
| 7-Zip 18.03 / 7z b 4 | |
| HP ProBook 445 G10 | |
| Lenovo ThinkPad L14 G4 21H6S00900 | |
| Dell Latitude 3440 | |
| Media della classe Office (4226 - 62349, n=119, ultimi 2 anni) | |
| Acer Swift Go 14 SFG14-71 | |
| Media Intel Core i5-1235U (20166 - 38643, n=8) | |
| SCHENKER Work 14 Base | |
| 7-Zip 18.03 / 7z b 4 -mmt1 | |
| Dell Latitude 3440 | |
| HP ProBook 445 G10 | |
| Lenovo ThinkPad L14 G4 21H6S00900 | |
| SCHENKER Work 14 Base | |
| Acer Swift Go 14 SFG14-71 | |
| Media della classe Office (2233 - 6687, n=119, ultimi 2 anni) | |
| Media Intel Core i5-1235U (4371 - 5233, n=8) | |
| Geekbench 6.2 / Multi-Core | |
| Acer Swift Go 14 SFG14-71 | |
| Media della classe Office (662 - 12171, n=42, ultimi 2 anni) | |
| Media Intel Core i5-1235U (6703 - 7046, n=2) | |
| SCHENKER Work 14 Base | |
| HP ProBook 445 G10 | |
| Geekbench 6.2 / Single-Core | |
| Acer Swift Go 14 SFG14-71 | |
| Media della classe Office (457 - 2646, n=41, ultimi 2 anni) | |
| Media Intel Core i5-1235U (1981 - 2208, n=2) | |
| SCHENKER Work 14 Base | |
| HP ProBook 445 G10 | |
| Geekbench 5.5 / Multi-Core | |
| Acer Swift Go 14 SFG14-71 | |
| Media Intel Core i5-1235U (5528 - 8571, n=10) | |
| Media della classe Office (1018 - 11980, n=120, ultimi 2 anni) | |
| Dell Latitude 3440 | |
| SCHENKER Work 14 Base | |
| HP ProBook 445 G10 | |
| Lenovo ThinkPad L14 G4 21H6S00900 | |
| Geekbench 5.5 / Single-Core | |
| Dell Latitude 3440 | |
| Acer Swift Go 14 SFG14-71 | |
| SCHENKER Work 14 Base | |
| Media Intel Core i5-1235U (1426 - 1643, n=10) | |
| Media della classe Office (510 - 1974, n=120, ultimi 2 anni) | |
| HP ProBook 445 G10 | |
| Lenovo ThinkPad L14 G4 21H6S00900 | |
| HWBOT x265 Benchmark v2.2 / 4k Preset | |
| Lenovo ThinkPad L14 G4 21H6S00900 | |
| HP ProBook 445 G10 | |
| Media della classe Office (1.55 - 17.4, n=118, ultimi 2 anni) | |
| Acer Swift Go 14 SFG14-71 | |
| Dell Latitude 3440 | |
| SCHENKER Work 14 Base | |
| Media Intel Core i5-1235U (4.99 - 9.43, n=8) | |
| LibreOffice / 20 Documents To PDF | |
| Acer Swift Go 14 SFG14-71 | |
| Media della classe Office (31.3 - 117.5, n=118, ultimi 2 anni) | |
| HP ProBook 445 G10 | |
| Media Intel Core i5-1235U (42.4 - 65.5, n=8) | |
| Dell Latitude 3440 | |
| SCHENKER Work 14 Base | |
| Lenovo ThinkPad L14 G4 21H6S00900 | |
| R Benchmark 2.5 / Overall mean | |
| Media della classe Office (0.4244 - 1.397, n=117, ultimi 2 anni) | |
| Lenovo ThinkPad L14 G4 21H6S00900 | |
| HP ProBook 445 G10 | |
| Media Intel Core i5-1235U (0.4986 - 0.603, n=8) | |
| Acer Swift Go 14 SFG14-71 | |
| SCHENKER Work 14 Base | |
| Dell Latitude 3440 | |
* ... Meglio usare valori piccoli
AIDA64: FP32 Ray-Trace | FPU Julia | CPU SHA3 | CPU Queen | FPU SinJulia | FPU Mandel | CPU AES | CPU ZLib | FP64 Ray-Trace | CPU PhotoWorxx
| Performance Rating | |
| Lenovo ThinkPad L14 G4 21H6S00900 | |
| HP ProBook 445 G10 | |
| Media della classe Office | |
| Dell Latitude 3440 | |
| Acer Swift Go 14 SFG14-71 | |
| Media Intel Core i5-1235U | |
| SCHENKER Work 14 Base | |
| AIDA64 / FP32 Ray-Trace | |
| HP ProBook 445 G10 | |
| Lenovo ThinkPad L14 G4 21H6S00900 | |
| Media della classe Office (763 - 24250, n=118, ultimi 2 anni) | |
| Dell Latitude 3440 | |
| Acer Swift Go 14 SFG14-71 | |
| SCHENKER Work 14 Base | |
| Media Intel Core i5-1235U (3078 - 7457, n=8) | |
| AIDA64 / FPU Julia | |
| Lenovo ThinkPad L14 G4 21H6S00900 | |
| HP ProBook 445 G10 | |
| Media della classe Office (4027 - 102228, n=118, ultimi 2 anni) | |
| Dell Latitude 3440 | |
| Acer Swift Go 14 SFG14-71 | |
| SCHENKER Work 14 Base | |
| Media Intel Core i5-1235U (15838 - 37760, n=8) | |
| AIDA64 / CPU SHA3 | |
| Lenovo ThinkPad L14 G4 21H6S00900 | |
| Media della classe Office (279 - 4442, n=117, ultimi 2 anni) | |
| HP ProBook 445 G10 | |
| Dell Latitude 3440 | |
| SCHENKER Work 14 Base | |
| Acer Swift Go 14 SFG14-71 | |
| Media Intel Core i5-1235U (978 - 2072, n=8) | |
| AIDA64 / CPU Queen | |
| Lenovo ThinkPad L14 G4 21H6S00900 | |
| HP ProBook 445 G10 | |
| Media della classe Office (8031 - 113016, n=118, ultimi 2 anni) | |
| Dell Latitude 3440 | |
| Media Intel Core i5-1235U (45680 - 62404, n=8) | |
| Acer Swift Go 14 SFG14-71 | |
| SCHENKER Work 14 Base | |
| AIDA64 / FPU SinJulia | |
| HP ProBook 445 G10 | |
| Lenovo ThinkPad L14 G4 21H6S00900 | |
| Media della classe Office (404 - 14288, n=118, ultimi 2 anni) | |
| Dell Latitude 3440 | |
| Media Intel Core i5-1235U (3099 - 4644, n=8) | |
| Acer Swift Go 14 SFG14-71 | |
| SCHENKER Work 14 Base | |
| AIDA64 / FPU Mandel | |
| Lenovo ThinkPad L14 G4 21H6S00900 | |
| HP ProBook 445 G10 | |
| Media della classe Office (2054 - 54365, n=118, ultimi 2 anni) | |
| Dell Latitude 3440 | |
| Acer Swift Go 14 SFG14-71 | |
| SCHENKER Work 14 Base | |
| Media Intel Core i5-1235U (8046 - 18819, n=8) | |
| AIDA64 / CPU AES | |
| Lenovo ThinkPad L14 G4 21H6S00900 | |
| Media della classe Office (5226 - 147611, n=118, ultimi 2 anni) | |
| Dell Latitude 3440 | |
| Media Intel Core i5-1235U (23386 - 67140, n=8) | |
| Acer Swift Go 14 SFG14-71 | |
| HP ProBook 445 G10 | |
| SCHENKER Work 14 Base | |
| AIDA64 / CPU ZLib | |
| Dell Latitude 3440 | |
| Media della classe Office (67.6 - 1018, n=118, ultimi 2 anni) | |
| HP ProBook 445 G10 | |
| Lenovo ThinkPad L14 G4 21H6S00900 | |
| SCHENKER Work 14 Base | |
| Media Intel Core i5-1235U (329 - 633, n=8) | |
| Acer Swift Go 14 SFG14-71 | |
| AIDA64 / FP64 Ray-Trace | |
| HP ProBook 445 G10 | |
| Lenovo ThinkPad L14 G4 21H6S00900 | |
| Media della classe Office (432 - 12755, n=118, ultimi 2 anni) | |
| Dell Latitude 3440 | |
| SCHENKER Work 14 Base | |
| Acer Swift Go 14 SFG14-71 | |
| Media Intel Core i5-1235U (1670 - 3928, n=8) | |
| AIDA64 / CPU PhotoWorxx | |
| Acer Swift Go 14 SFG14-71 | |
| Media Intel Core i5-1235U (15933 - 41909, n=8) | |
| SCHENKER Work 14 Base | |
| Media della classe Office (4814 - 48177, n=118, ultimi 2 anni) | |
| Dell Latitude 3440 | |
| HP ProBook 445 G10 | |
| Lenovo ThinkPad L14 G4 21H6S00900 | |
Prestazioni del sistema
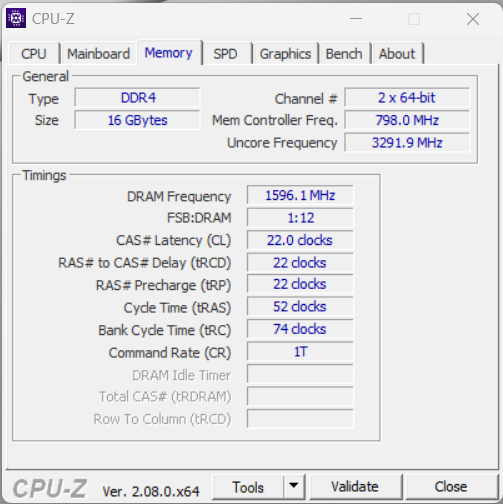
Nell'uso quotidiano, le prestazioni del portatile sono discrete, anche se l'SSD PCIe svolge un ruolo importante. Durante il nostro test, non abbiamo notato alcun problema di stabilità del sistema e, se necessario, la RAM del dispositivo può essere espansa fino a 64 GB.
CrossMark: Overall | Productivity | Creativity | Responsiveness
WebXPRT 3: Overall
WebXPRT 4: Overall
Mozilla Kraken 1.1: Total
| PCMark 10 / Score | |
| Lenovo ThinkPad L14 G4 21H6S00900 | |
| HP ProBook 445 G10 | |
| Media della classe Office (2325 - 7157, n=103, ultimi 2 anni) | |
| Acer Swift Go 14 SFG14-71 | |
| Dell Latitude 3440 | |
| Media Intel Core i5-1235U, Intel Iris Xe Graphics G7 80EUs (4528 - 5543, n=8) | |
| SCHENKER Work 14 Base | |
| PCMark 10 / Essentials | |
| Lenovo ThinkPad L14 G4 21H6S00900 | |
| Dell Latitude 3440 | |
| HP ProBook 445 G10 | |
| Acer Swift Go 14 SFG14-71 | |
| Media Intel Core i5-1235U, Intel Iris Xe Graphics G7 80EUs (9143 - 11273, n=8) | |
| Media della classe Office (5095 - 20841, n=103, ultimi 2 anni) | |
| SCHENKER Work 14 Base | |
| PCMark 10 / Productivity | |
| HP ProBook 445 G10 | |
| Lenovo ThinkPad L14 G4 21H6S00900 | |
| Media della classe Office (3041 - 10198, n=103, ultimi 2 anni) | |
| Acer Swift Go 14 SFG14-71 | |
| Dell Latitude 3440 | |
| Media Intel Core i5-1235U, Intel Iris Xe Graphics G7 80EUs (6440 - 7354, n=8) | |
| SCHENKER Work 14 Base | |
| PCMark 10 / Digital Content Creation | |
| Acer Swift Go 14 SFG14-71 | |
| Media della classe Office (1912 - 9056, n=103, ultimi 2 anni) | |
| Dell Latitude 3440 | |
| SCHENKER Work 14 Base | |
| Lenovo ThinkPad L14 G4 21H6S00900 | |
| Media Intel Core i5-1235U, Intel Iris Xe Graphics G7 80EUs (4220 - 5839, n=8) | |
| HP ProBook 445 G10 | |
| CrossMark / Overall | |
| Acer Swift Go 14 SFG14-71 | |
| Dell Latitude 3440 | |
| Media Intel Core i5-1235U, Intel Iris Xe Graphics G7 80EUs (983 - 1644, n=8) | |
| Media della classe Office (348 - 1891, n=104, ultimi 2 anni) | |
| SCHENKER Work 14 Base | |
| Lenovo ThinkPad L14 G4 21H6S00900 | |
| CrossMark / Productivity | |
| Acer Swift Go 14 SFG14-71 | |
| Dell Latitude 3440 | |
| Media Intel Core i5-1235U, Intel Iris Xe Graphics G7 80EUs (1026 - 1676, n=8) | |
| Media della classe Office (393 - 1870, n=104, ultimi 2 anni) | |
| SCHENKER Work 14 Base | |
| Lenovo ThinkPad L14 G4 21H6S00900 | |
| CrossMark / Creativity | |
| Dell Latitude 3440 | |
| Acer Swift Go 14 SFG14-71 | |
| Media Intel Core i5-1235U, Intel Iris Xe Graphics G7 80EUs (1032 - 1618, n=8) | |
| Media della classe Office (340 - 1982, n=104, ultimi 2 anni) | |
| SCHENKER Work 14 Base | |
| Lenovo ThinkPad L14 G4 21H6S00900 | |
| CrossMark / Responsiveness | |
| Acer Swift Go 14 SFG14-71 | |
| Media Intel Core i5-1235U, Intel Iris Xe Graphics G7 80EUs (746 - 1867, n=8) | |
| Dell Latitude 3440 | |
| Media della classe Office (258 - 2017, n=104, ultimi 2 anni) | |
| SCHENKER Work 14 Base | |
| Lenovo ThinkPad L14 G4 21H6S00900 | |
| WebXPRT 3 / Overall | |
| Dell Latitude 3440 | |
| Media Intel Core i5-1235U, Intel Iris Xe Graphics G7 80EUs (233 - 305, n=11) | |
| Media della classe Office (99.2 - 368, n=105, ultimi 2 anni) | |
| Lenovo ThinkPad L14 G4 21H6S00900 | |
| Acer Swift Go 14 SFG14-71 | |
| SCHENKER Work 14 Base | |
| WebXPRT 4 / Overall | |
| Dell Latitude 3440 | |
| Media Intel Core i5-1235U, Intel Iris Xe Graphics G7 80EUs (206 - 236, n=10) | |
| SCHENKER Work 14 Base | |
| Media della classe Office (80 - 328, n=93, ultimi 2 anni) | |
| Lenovo ThinkPad L14 G4 21H6S00900 | |
| Mozilla Kraken 1.1 / Total | |
| Lenovo ThinkPad L14 G4 21H6S00900 | |
| Media della classe Office (479 - 1966, n=110, ultimi 2 anni) | |
| SCHENKER Work 14 Base | |
| Media Intel Core i5-1235U, Intel Iris Xe Graphics G7 80EUs (486 - 634, n=11) | |
| Acer Swift Go 14 SFG14-71 | |
| Acer Swift Go 14 SFG14-71 | |
| Dell Latitude 3440 | |
* ... Meglio usare valori piccoli
| PCMark 10 Score | 4873 punti | |
Aiuto | ||
| AIDA64 / Memory Copy | |
| Acer Swift Go 14 SFG14-71 | |
| Media Intel Core i5-1235U (24653 - 61921, n=8) | |
| SCHENKER Work 14 Base | |
| Media della classe Office (7158 - 88119, n=119, ultimi 2 anni) | |
| Dell Latitude 3440 | |
| HP ProBook 445 G10 | |
| Lenovo ThinkPad L14 G4 21H6S00900 | |
| AIDA64 / Memory Read | |
| Media Intel Core i5-1235U (24441 - 66108, n=8) | |
| SCHENKER Work 14 Base | |
| Media della classe Office (7325 - 87297, n=119, ultimi 2 anni) | |
| Acer Swift Go 14 SFG14-71 | |
| Dell Latitude 3440 | |
| HP ProBook 445 G10 | |
| Lenovo ThinkPad L14 G4 21H6S00900 | |
| AIDA64 / Memory Write | |
| Acer Swift Go 14 SFG14-71 | |
| Media Intel Core i5-1235U (25156 - 75808, n=8) | |
| Media della classe Office (7579 - 94965, n=119, ultimi 2 anni) | |
| SCHENKER Work 14 Base | |
| Dell Latitude 3440 | |
| HP ProBook 445 G10 | |
| Lenovo ThinkPad L14 G4 21H6S00900 | |
| AIDA64 / Memory Latency | |
| Acer Swift Go 14 SFG14-71 | |
| Lenovo ThinkPad L14 G4 21H6S00900 | |
| Media della classe Office (44.3 - 188.3, n=120, ultimi 2 anni) | |
| HP ProBook 445 G10 | |
| Media Intel Core i5-1235U (76.3 - 119, n=8) | |
| SCHENKER Work 14 Base | |
| Dell Latitude 3440 | |
* ... Meglio usare valori piccoli
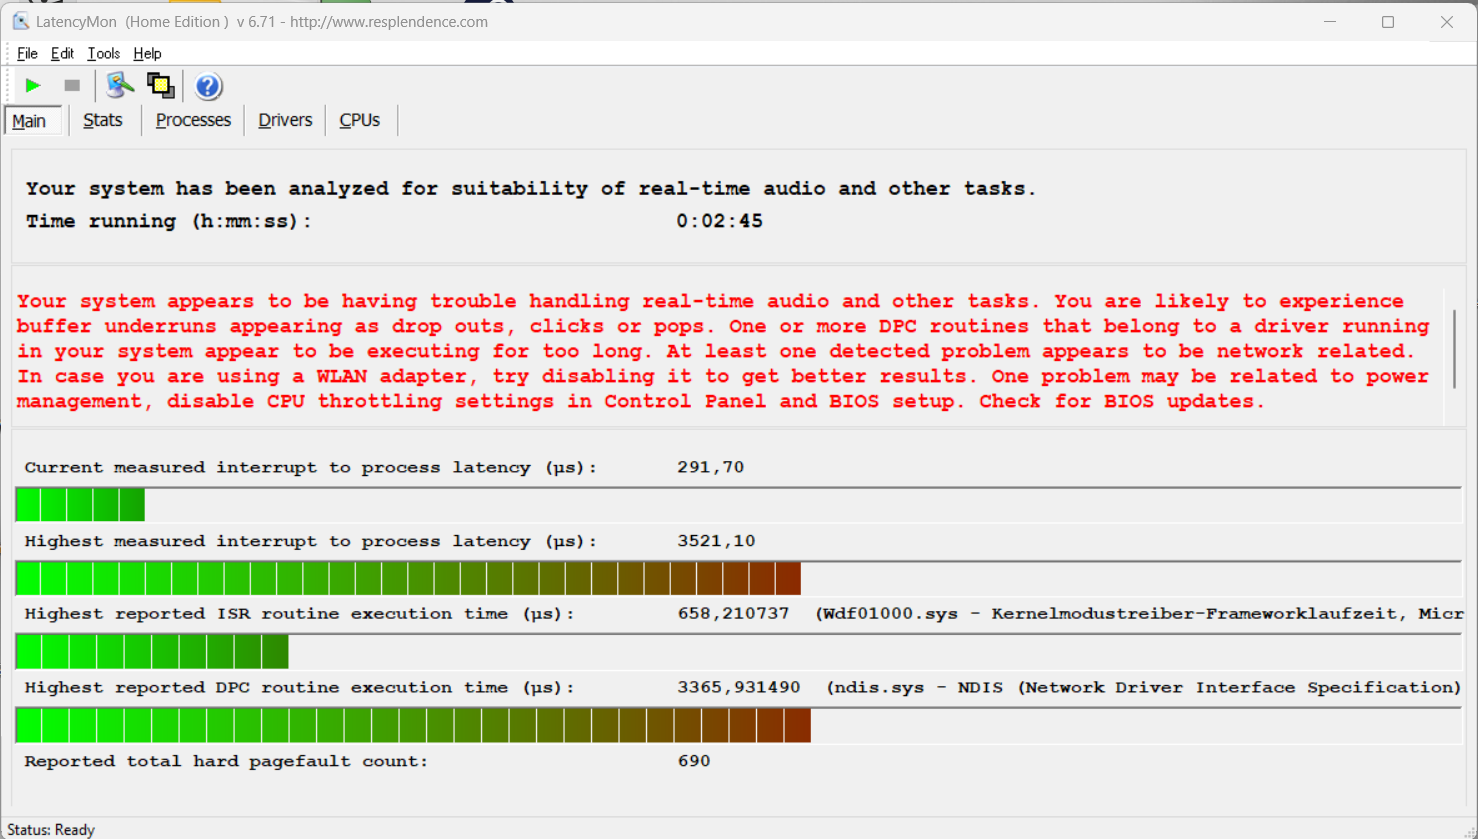
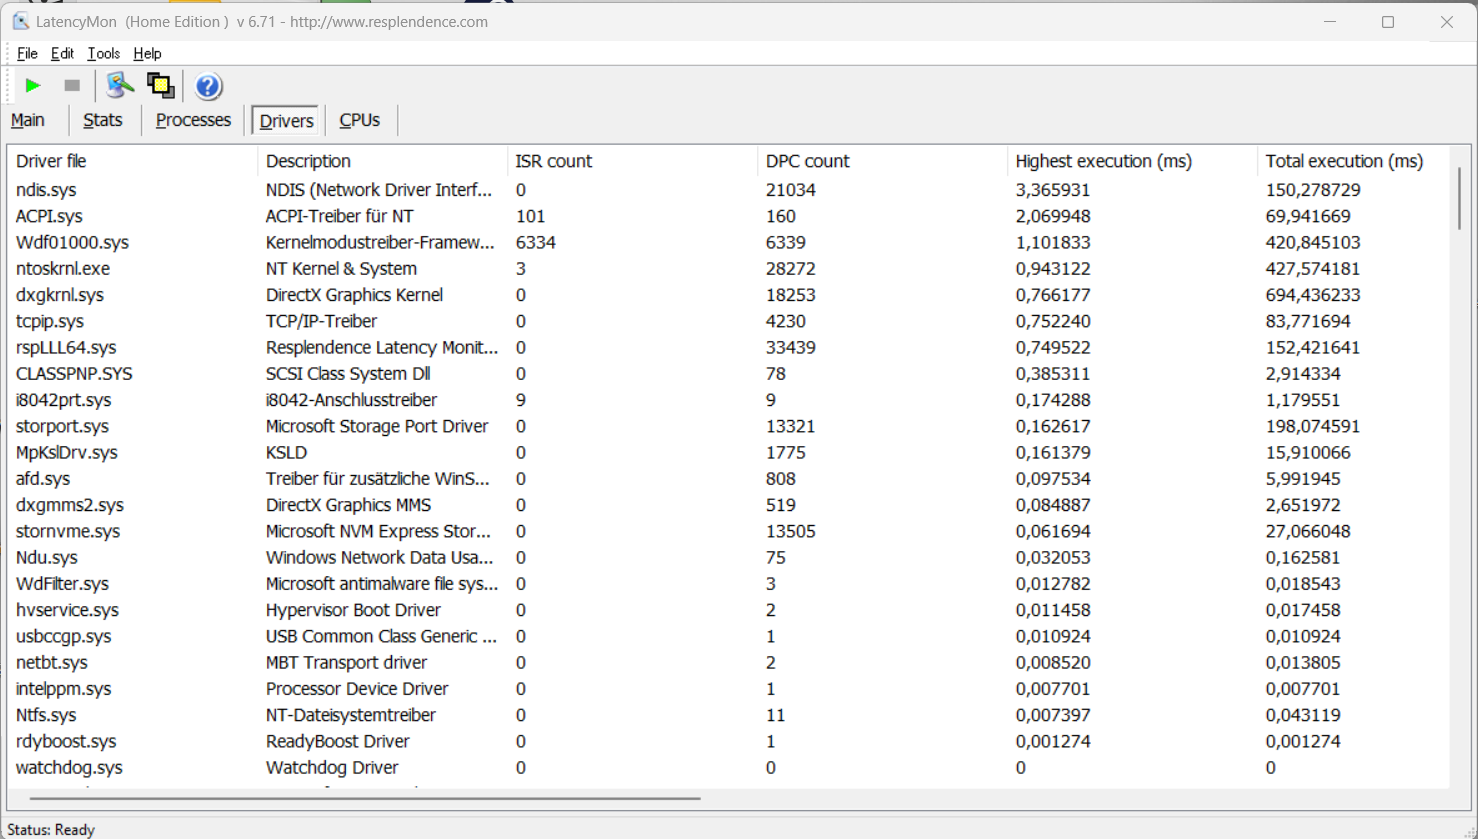
Latenze DPC
Durante il nostro test di latenza standardizzato, il dispositivo di prova con l'attuale versione del BIOS ha mostrato delle limitazioni quando si utilizzano applicazioni audio in tempo reale.
| DPC Latencies / LatencyMon - interrupt to process latency (max), Web, Youtube, Prime95 | |
| SCHENKER Work 14 Base | |
| Dell Latitude 3440 | |
| Lenovo ThinkPad L14 G4 21H6S00900 | |
| HP ProBook 445 G10 | |
| Acer Swift Go 14 SFG14-71 | |
* ... Meglio usare valori piccoli
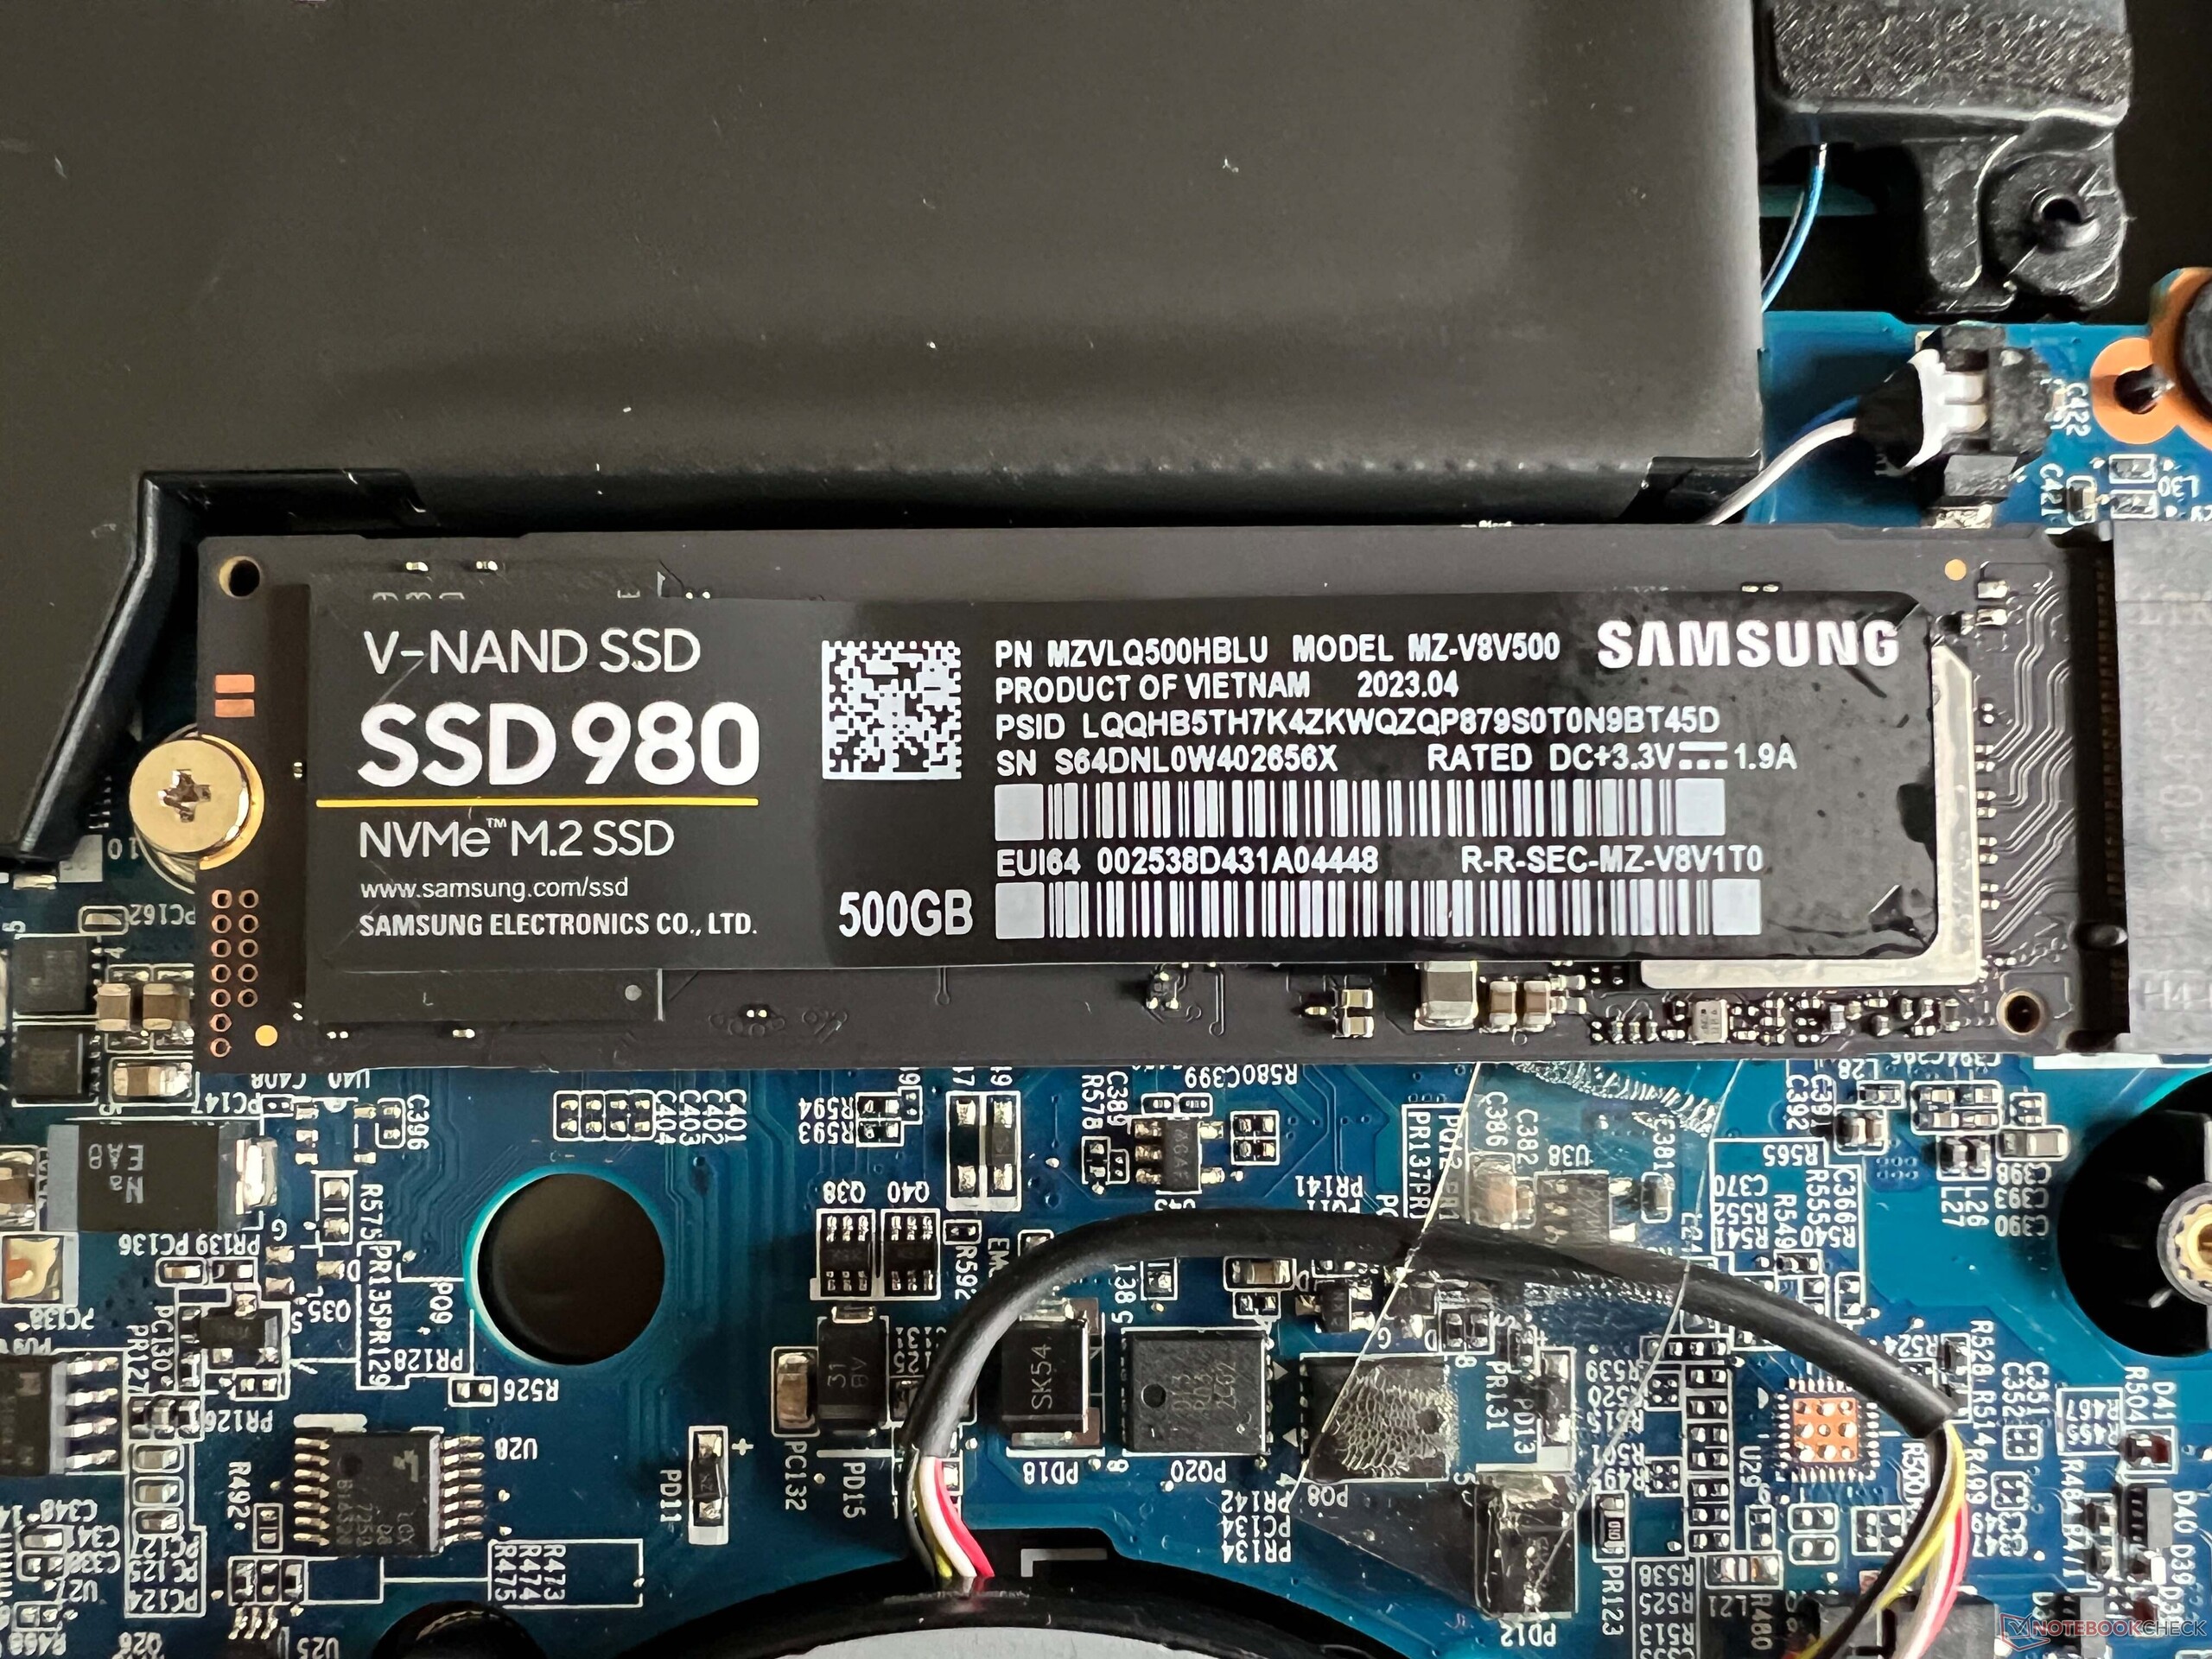
Dispositivo di archiviazione
Work 14 dispone di uno slot PCIe 4.0 veloce per SSD M.2-2280. Il nostro dispositivo di prova è dotato della versione da 500 GB di Samsung 980, che offre velocità di trasferimento decenti e stabili. Dopo il primo avvio del portatile, gli utenti hanno a disposizione 422 GB da utilizzare. Ulteriori benchmark SSD sono disponibili qui.

* ... Meglio usare valori piccoli
Reading continuous performance: DiskSpd Read Loop, Queue Depth 8
Scheda grafica
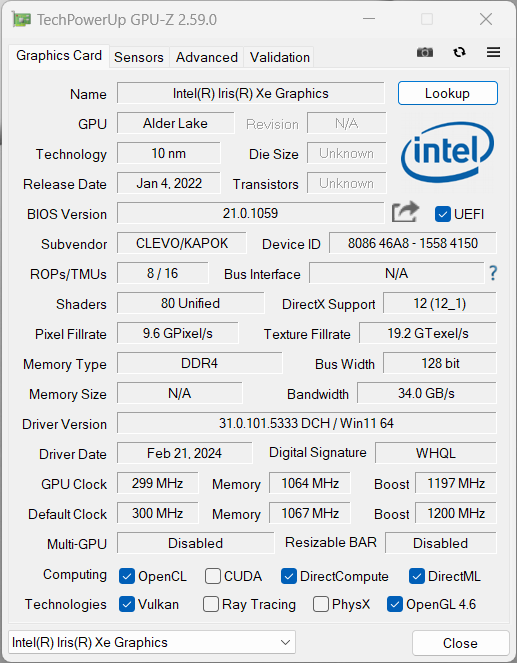
I calcoli grafici sono affidati alla scheda grafica integrata Iris Xe Graphics G7 (80 EU). L'iGPU gestisce bene le attività quotidiane, compresa la riproduzione di video ad alta risoluzione, ma non ci si deve aspettare molto di più da essa. Tuttavia, lo stesso si può dire per i suoi concorrenti, anch'essi dotati di GPU Iris o, nel caso dell'HP ProBook 445, di una GPU Iris HP ProBook 445l'obsoleta AMD RX Vega 7.
I nostri benchmark di gioco hanno mostrato molto chiaramente che il Work 14 Base è a malapena adatto a giocare. Anche quando si eseguono giochi più vecchi o meno esigenti, si è generalmente limitati a livelli di dettaglio bassi.
Sotto carico permanente, le prestazioni grafiche non rimangono completamente stabili e calano di circa il 10%. Durante l'uso della batteria, non abbiamo notato un ulteriore calo delle prestazioni. Ulteriori benchmark della GPU sono disponibili qui .
| 3DMark 11 Performance | 5431 punti | |
| 3DMark Fire Strike Score | 3537 punti | |
| 3DMark Time Spy Score | 1331 punti | |
Aiuto | ||
| Blender / v3.3 Classroom HIP/AMD | |
| Lenovo ThinkPad L14 G4 21H6S00900 | |
| HP ProBook 445 G10 | |
| Media della classe Office (322 - 1215, n=18, ultimi 2 anni) | |
| Blender / v3.3 Classroom CPU | |
| SCHENKER Work 14 Base | |
| Media Intel Iris Xe Graphics G7 80EUs (463 - 3047, n=48) | |
| Media della classe Office (343 - 3786, n=107, ultimi 2 anni) | |
| Dell Latitude 3440 | |
| Lenovo ThinkPad L14 G4 21H6S00900 | |
| Acer Swift Go 14 SFG14-71 | |
| HP ProBook 445 G10 | |
* ... Meglio usare valori piccoli
| Performance Rating - Percent | |
| Media della classe Office | |
| Acer Swift Go 14 SFG14-71 | |
| Dell Latitude 3440 | |
| SCHENKER Work 14 Base | |
| HP ProBook 445 G10 | |
| Lenovo ThinkPad L14 G4 21H6S00900 | |
| The Witcher 3 - 1920x1080 Ultra Graphics & Postprocessing (HBAO+) | |
| Media della classe Office (2.66 - 34, n=108, ultimi 2 anni) | |
| Acer Swift Go 14 SFG14-71 | |
| HP ProBook 445 G10 | |
| Dell Latitude 3440 | |
| SCHENKER Work 14 Base | |
| Lenovo ThinkPad L14 G4 21H6S00900 | |
| GTA V - 1920x1080 Highest Settings possible AA:4xMSAA + FX AF:16x | |
| Media della classe Office (3.35 - 47.8, n=89, ultimi 2 anni) | |
| Acer Swift Go 14 SFG14-71 | |
| Lenovo ThinkPad L14 G4 21H6S00900 | |
| SCHENKER Work 14 Base | |
| HP ProBook 445 G10 | |
| Dell Latitude 3440 | |
| Final Fantasy XV Benchmark - 1920x1080 High Quality | |
| Acer Swift Go 14 SFG14-71 | |
| Media della classe Office (2.03 - 35.7, n=101, ultimi 2 anni) | |
| Dell Latitude 3440 | |
| SCHENKER Work 14 Base | |
| HP ProBook 445 G10 | |
| Lenovo ThinkPad L14 G4 21H6S00900 | |
| Strange Brigade - 1920x1080 ultra AA:ultra AF:16 | |
| Media della classe Office (6.6 - 56.5, n=94, ultimi 2 anni) | |
| Acer Swift Go 14 SFG14-71 | |
| Dell Latitude 3440 | |
| SCHENKER Work 14 Base | |
| HP ProBook 445 G10 | |
| Lenovo ThinkPad L14 G4 21H6S00900 | |
| Dota 2 Reborn - 1920x1080 ultra (3/3) best looking | |
| Acer Swift Go 14 SFG14-71 | |
| Media della classe Office (7.8 - 121.2, n=121, ultimi 2 anni) | |
| Dell Latitude 3440 | |
| SCHENKER Work 14 Base | |
| HP ProBook 445 G10 | |
| Lenovo ThinkPad L14 G4 21H6S00900 | |
| X-Plane 11.11 - 1920x1080 high (fps_test=3) | |
| Media della classe Office (5.55 - 92.6, n=121, ultimi 2 anni) | |
| Dell Latitude 3440 | |
| HP ProBook 445 G10 | |
| Lenovo ThinkPad L14 G4 21H6S00900 | |
| SCHENKER Work 14 Base | |
| Acer Swift Go 14 SFG14-71 | |
Witcher 3 FPS diagram
| basso | medio | alto | ultra | |
| GTA V (2015) | 76.2 | 66.4 | 15.8 | 6.87 |
| The Witcher 3 (2015) | 66 | 43 | 23 | 9.6 |
| Dota 2 Reborn (2015) | 82.5 | 60 | 46.6 | 41.9 |
| Final Fantasy XV Benchmark (2018) | 30.2 | 17.4 | 12.1 | |
| X-Plane 11.11 (2018) | 30.2 | 23.7 | 21.8 | |
| Far Cry 5 (2018) | 36 | 20 | 19 | 17 |
| Strange Brigade (2018) | 64.6 | 28.3 | 22.4 | 17.6 |
| F1 23 (2023) | 29.3 | 26.7 | 18.3 |
Emissioni e potenza
Emissioni di rumore
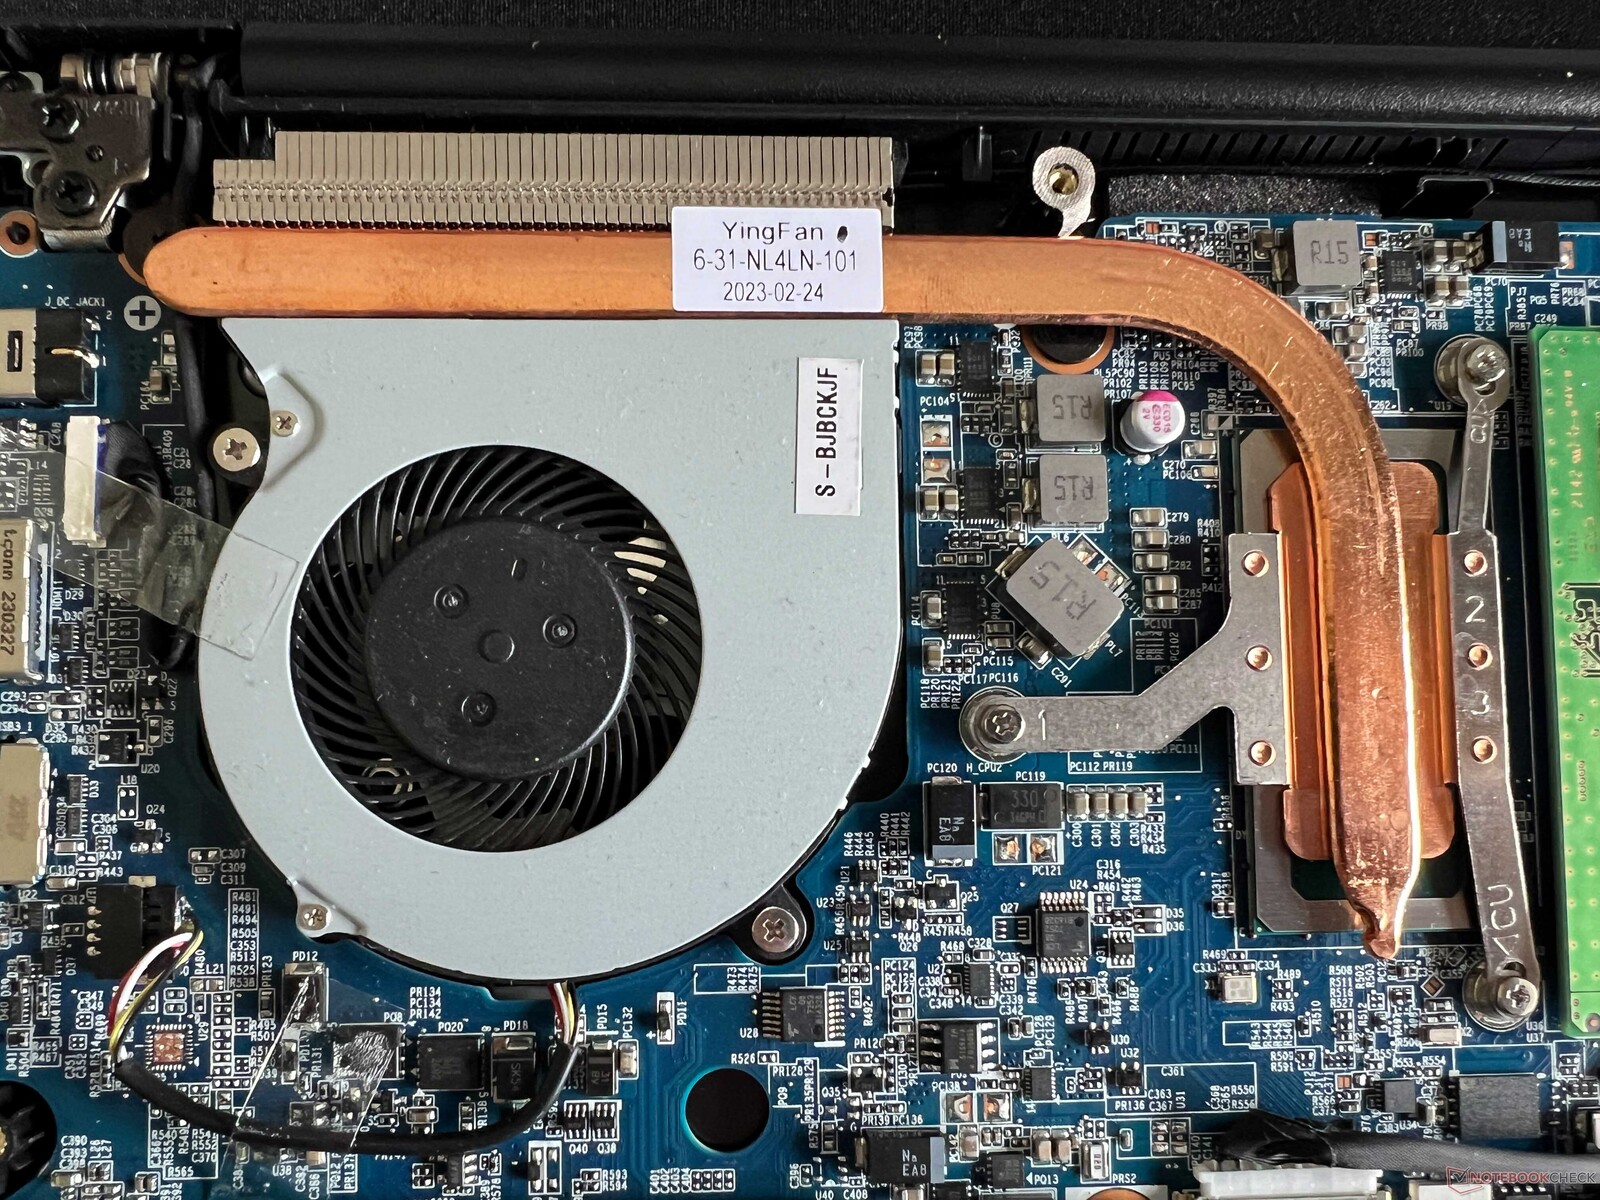
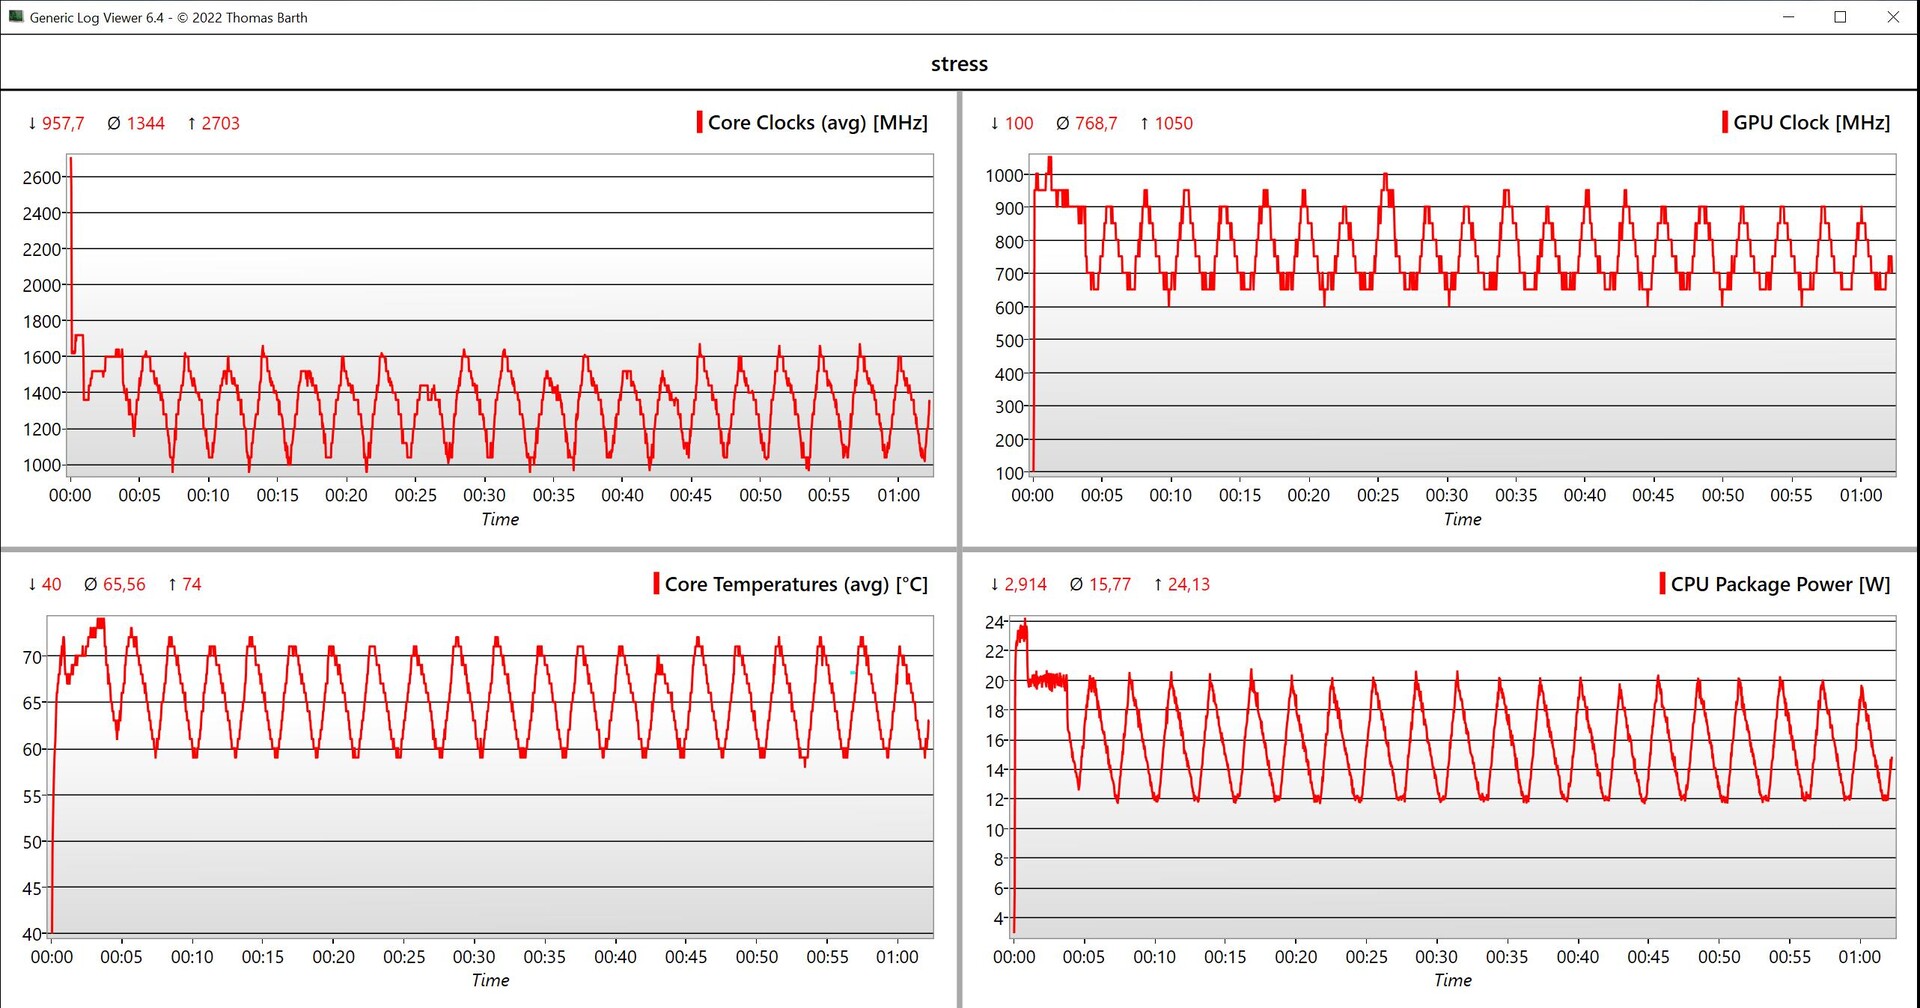
Per raffreddare il portatile viene utilizzata una sola ventola. Quando è al minimo e a basso carico, rimane abbastanza silenziosa, ma se il sistema viene sollecitato maggiormente, la ventola diventa piuttosto rumorosa (35 dB(A)) e inoltre emette un rumore ad alta frequenza. Durante lo stress test, i suoi 43 dB(A) sono decisamente troppo alti, soprattutto se si considerano le basse prestazioni del portatile. Non abbiamo notato altri rumori elettronici provenienti dal nostro dispositivo di prova.
Rumorosità
| Idle |
| 23.6 / 23.6 / 24.8 dB(A) |
| Sotto carico |
| 34.2 / 42.9 dB(A) |
 | ||
30 dB silenzioso 40 dB(A) udibile 50 dB(A) rumoroso |
||
min: | ||
| SCHENKER Work 14 Base Iris Xe G7 80EUs, i5-1235U, Samsung SSD 980 500GB (MZ-V8V500BW) | Acer Swift Go 14 SFG14-71 Iris Xe G7 80EUs, i5-1335U, WD PC SN740 SDDQNQD-512G-1014 | HP ProBook 445 G10 Vega 7, R5 7530U, Kioxia BG5 KBG50ZNS512G | Dell Latitude 3440 Iris Xe G7 80EUs, i5-1345U, Samsung PM9A1 MZVL2512HCJQ | Lenovo ThinkPad L14 G4 21H6S00900 Vega 7, R5 7530U, Kioxia BG5 KBG5AZNT512G | |
|---|---|---|---|---|---|
| Noise | -5% | -1% | -3% | -3% | |
| off /ambiente * | 23.6 | 24.9 -6% | 24 -2% | 23.9 -1% | 25.2 -7% |
| Idle Minimum * | 23.6 | 24.9 -6% | 24 -2% | 24.4 -3% | 25.2 -7% |
| Idle Average * | 23.6 | 24.9 -6% | 25 -6% | 24.4 -3% | 25.2 -7% |
| Idle Maximum * | 24.8 | 24.9 -0% | 28 -13% | 24.4 2% | 27.3 -10% |
| Load Average * | 34.2 | 31.9 7% | 33 4% | 37.1 -8% | 32.1 6% |
| Witcher 3 ultra * | 34.2 | 43.2 -26% | 36 -5% | 38.2 -12% | 35.7 -4% |
| Load Maximum * | 42.9 | 43.2 -1% | 36 16% | 40.2 6% | 38.3 11% |
* ... Meglio usare valori piccoli
Temperatura
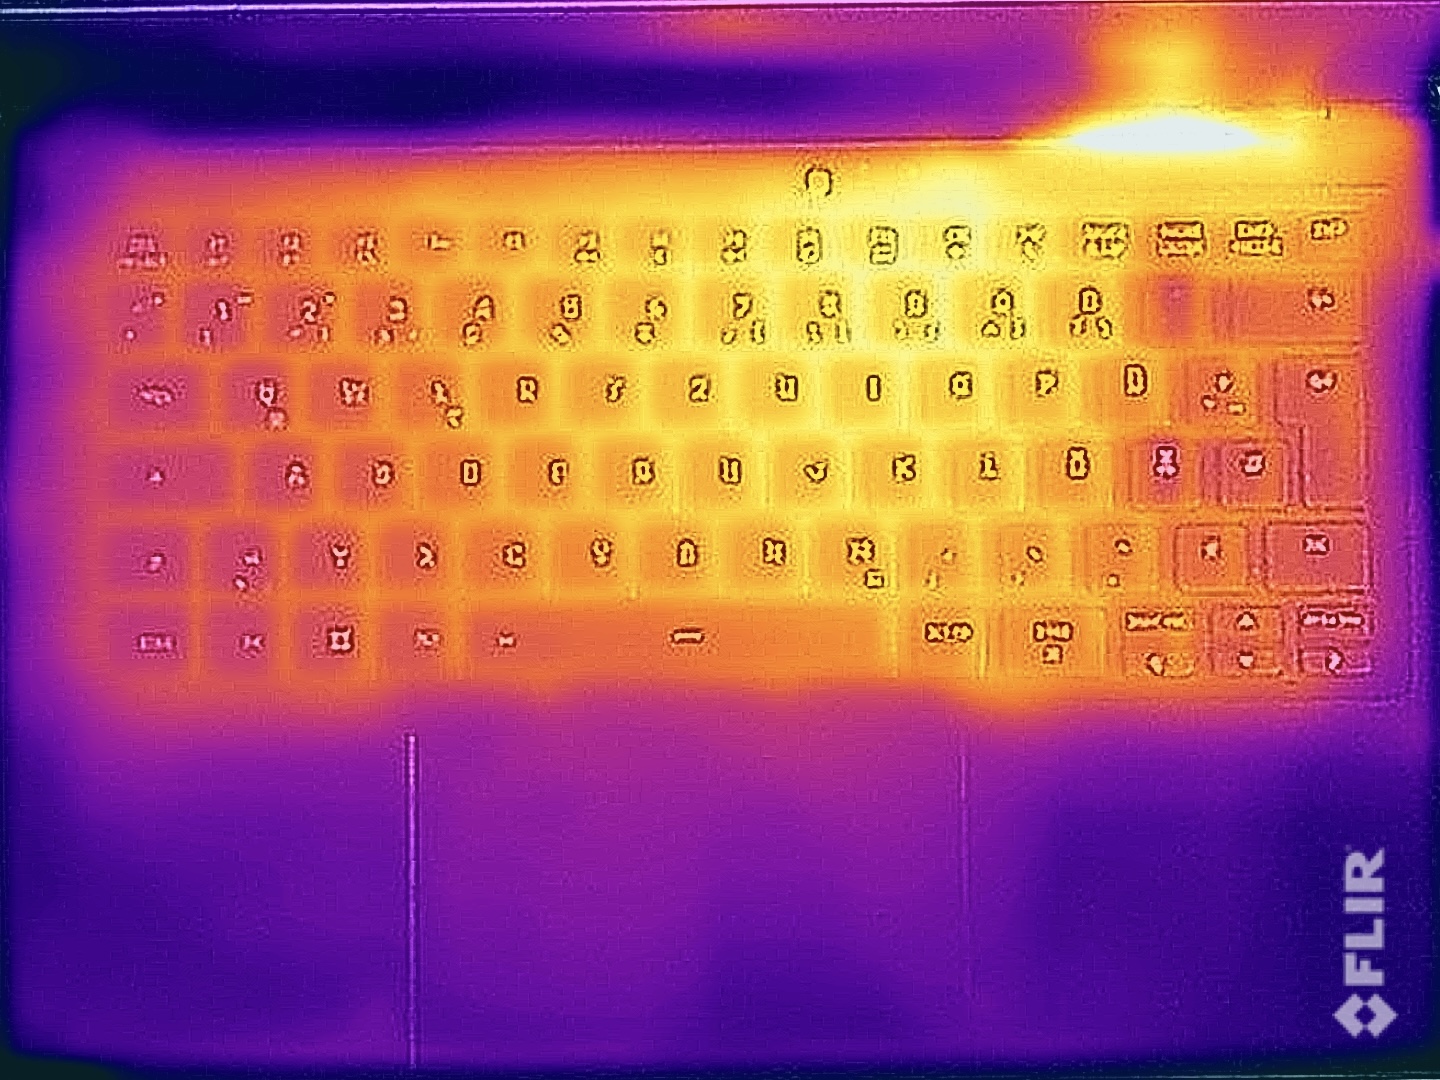
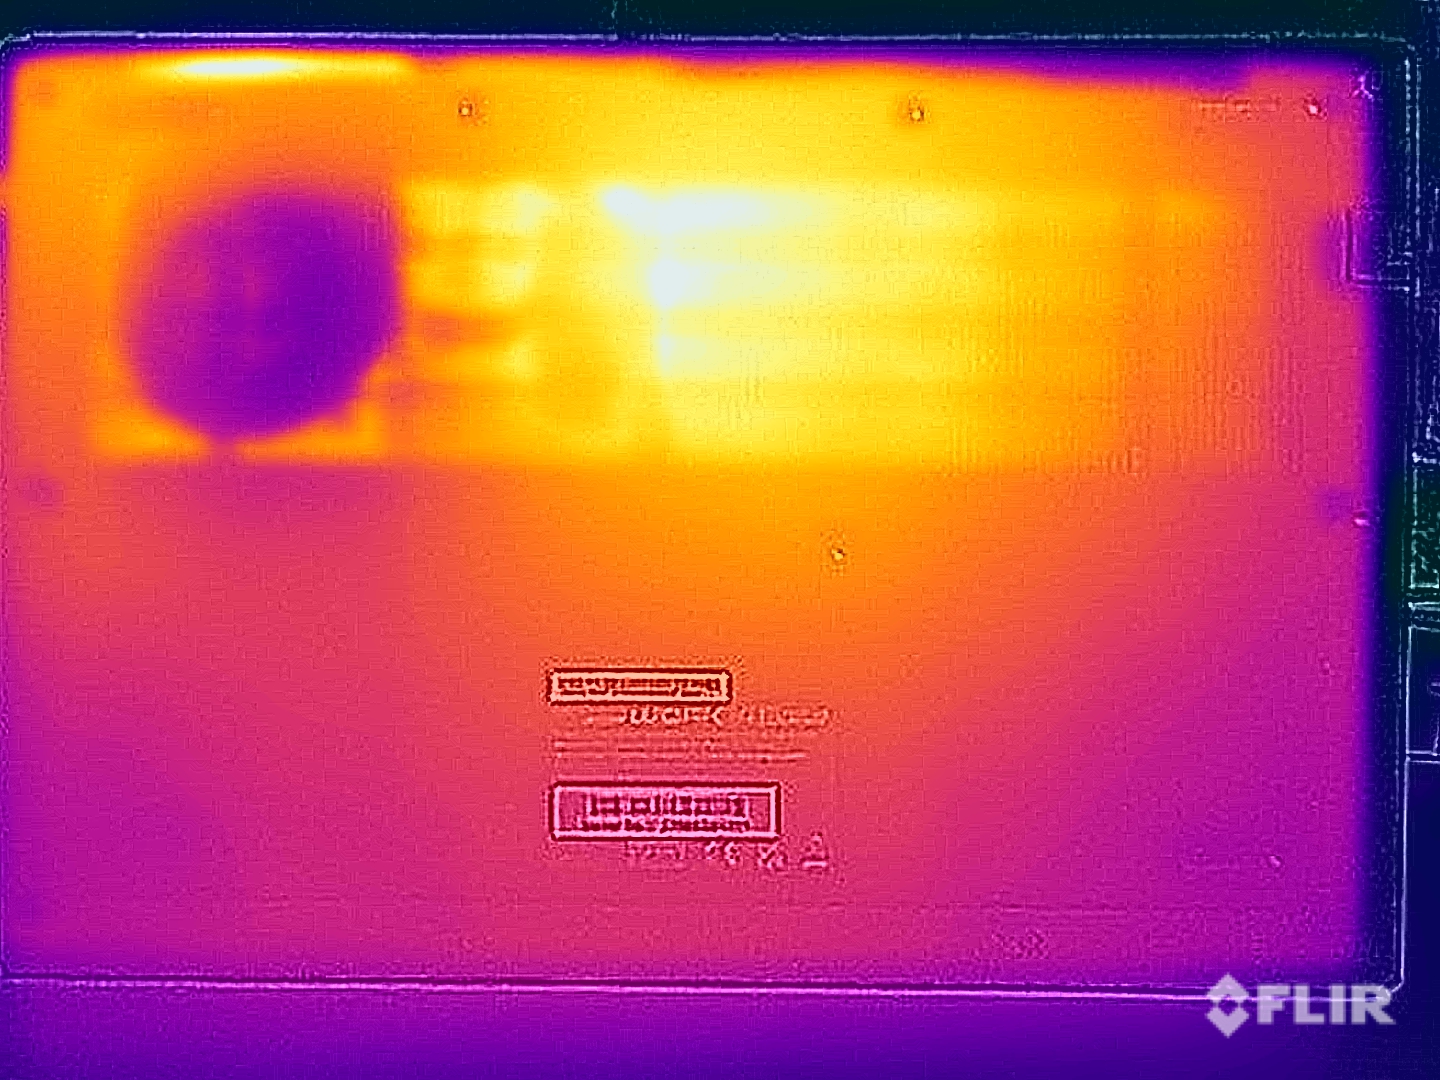
Le sue temperature superficiali rimangono acritiche e anche a pieno carico, è possibile appoggiare il Work 14 sulle cosce senza problemi, inoltre le dita non si surriscaldano durante la digitazione. Durante lo stress test, il processore ha consumato 20 watt per un bel po' di minuti, mentre durante l'ulteriore corso si è bilanciato tra i 12 e i 20 watt.
(+) La temperatura massima sul lato superiore è di 39.2 °C / 103 F, rispetto alla media di 34.2 °C / 94 F, che varia da 21.2 a 62.5 °C per questa classe Office.
(±) Il lato inferiore si riscalda fino ad un massimo di 40.4 °C / 105 F, rispetto alla media di 36.7 °C / 98 F
(+) In idle, la temperatura media del lato superiore è di 24.4 °C / 76 F, rispetto alla media deld ispositivo di 29.5 °C / 85 F.
(±) Riproducendo The Witcher 3, la temperatura media per il lato superiore e' di 33.3 °C / 92 F, rispetto alla media del dispositivo di 29.5 °C / 85 F.
(+) I poggiapolsi e il touchpad sono piu' freddi della temperatura della pelle con un massimo di 27 °C / 80.6 F e sono quindi freddi al tatto.
(±) La temperatura media della zona del palmo della mano di dispositivi simili e'stata di 27.7 °C / 81.9 F (+0.7 °C / 1.3 F).
| SCHENKER Work 14 Base Intel Core i5-1235U, Intel Iris Xe Graphics G7 80EUs | Acer Swift Go 14 SFG14-71 Intel Core i5-1335U, Intel Iris Xe Graphics G7 80EUs | HP ProBook 445 G10 AMD Ryzen 5 7530U, AMD Radeon RX Vega 7 | Dell Latitude 3440 Intel Core i5-1345U, Intel Iris Xe Graphics G7 80EUs | Lenovo ThinkPad L14 G4 21H6S00900 AMD Ryzen 5 7530U, AMD Radeon RX Vega 7 | |
|---|---|---|---|---|---|
| Heat | -12% | -15% | -8% | -16% | |
| Maximum Upper Side * | 39.2 | 44.8 -14% | 43 -10% | 35.2 10% | 39 1% |
| Maximum Bottom * | 40.4 | 34.8 14% | 51 -26% | 41 -1% | 46.3 -15% |
| Idle Upper Side * | 25.3 | 30.7 -21% | 27 -7% | 29.8 -18% | 26.3 -4% |
| Idle Bottom * | 25.8 | 32.5 -26% | 30 -16% | 32 -24% | 37.5 -45% |
* ... Meglio usare valori piccoli
Altoparlanti
I due altoparlanti stereo del portatile possono raggiungere un volume massimo elevato, tuttavia la loro qualità complessiva è estremamente debole e rappresenta uno dei principali punti deboli del Work 14. Sebbene i computer portatili economici per ufficio non siano mai stati famosi per il loro audio impressionante, il modello Dell Latitude 14 dimostra che si può fare di più. Il resto della concorrenza è avvantaggiato anche in questo aspetto.
SCHENKER Work 14 Base analisi audio
(+) | gli altoparlanti sono relativamente potenti (84.4 dB)
Bassi 100 - 315 Hz
(-) | quasi nessun basso - in media 22.8% inferiori alla media
(±) | la linearità dei bassi è media (8.6% delta rispetto alla precedente frequenza)
Medi 400 - 2000 Hz
(±) | medi elevati - circa 9.7% superiore alla media
(±) | linearità dei medi adeguata (11.7% delta rispetto alla precedente frequenza)
Alti 2 - 16 kHz
(+) | Alti bilanciati - appena 4.6% dalla media
(±) | la linearità degli alti è media (8.5% delta rispetto alla precedente frequenza)
Nel complesso 100 - 16.000 Hz
(±) | la linearità complessiva del suono è media (25.9% di differenza rispetto alla media
Rispetto alla stessa classe
» 77% di tutti i dispositivi testati in questa classe è stato migliore, 8% simile, 16% peggiore
» Il migliore ha avuto un delta di 7%, medio di 22%, peggiore di 53%
Rispetto a tutti i dispositivi testati
» 76% di tutti i dispositivi testati in questa classe è stato migliore, 5% similare, 19% peggiore
» Il migliore ha avuto un delta di 4%, medio di 25%, peggiore di 134%
Dell Latitude 3440 analisi audio
(+) | gli altoparlanti sono relativamente potenti (85.8 dB)
Bassi 100 - 315 Hz
(±) | bassi ridotti - in media 14.6% inferiori alla media
(±) | la linearità dei bassi è media (9.8% delta rispetto alla precedente frequenza)
Medi 400 - 2000 Hz
(+) | medi bilanciati - solo only 3% rispetto alla media
(+) | medi lineari (3.5% delta rispetto alla precedente frequenza)
Alti 2 - 16 kHz
(+) | Alti bilanciati - appena 4.2% dalla media
(+) | alti lineari (5.9% delta rispetto alla precedente frequenza)
Nel complesso 100 - 16.000 Hz
(+) | suono nel complesso lineare (11.6% differenza dalla media)
Rispetto alla stessa classe
» 2% di tutti i dispositivi testati in questa classe è stato migliore, 1% simile, 97% peggiore
» Il migliore ha avuto un delta di 7%, medio di 22%, peggiore di 53%
Rispetto a tutti i dispositivi testati
» 6% di tutti i dispositivi testati in questa classe è stato migliore, 2% similare, 92% peggiore
» Il migliore ha avuto un delta di 4%, medio di 25%, peggiore di 134%
Consumo di energia
Non abbiamo notato sorprese per quanto riguarda i valori di consumo energetico del dispositivo e l'alimentatore da 45 watt è più che potente.
| Off / Standby | |
| Idle | |
| Sotto carico |
|
Leggenda:
min: Attualmente utilizziamo il Metrahit Energy, un multimetro digitale professionale per la misurazione della qualità della potenza e dell'energia monofase, per le nostre misurazioni. | |
Power consumption Witcher 3 / stress test
Power consumption with external monitor
Tempi di esecuzione
Il Work 14 è dotato di una batteria da 49 Wh, che ha portato a tempi di autonomia pratici di 7:38 ore a 150 cd/m² (il 38% della luminosità massima del nostro dispositivo di prova) e di 5:33 ore alla massima luminosità durante il nostro test WLAN. Di conseguenza, questo dispositivo è rimasto indietro rispetto alla maggior parte della concorrenza e il Work 14 non riuscirà a gestire un'intera giornata lavorativa senza bisogno del caricabatterie. La ricarica completa del dispositivo richiede circa 2,5 ore con il dispositivo acceso.
Pro
Contro
Verdetto - Un portatile da ufficio con buone opzioni di manutenzione
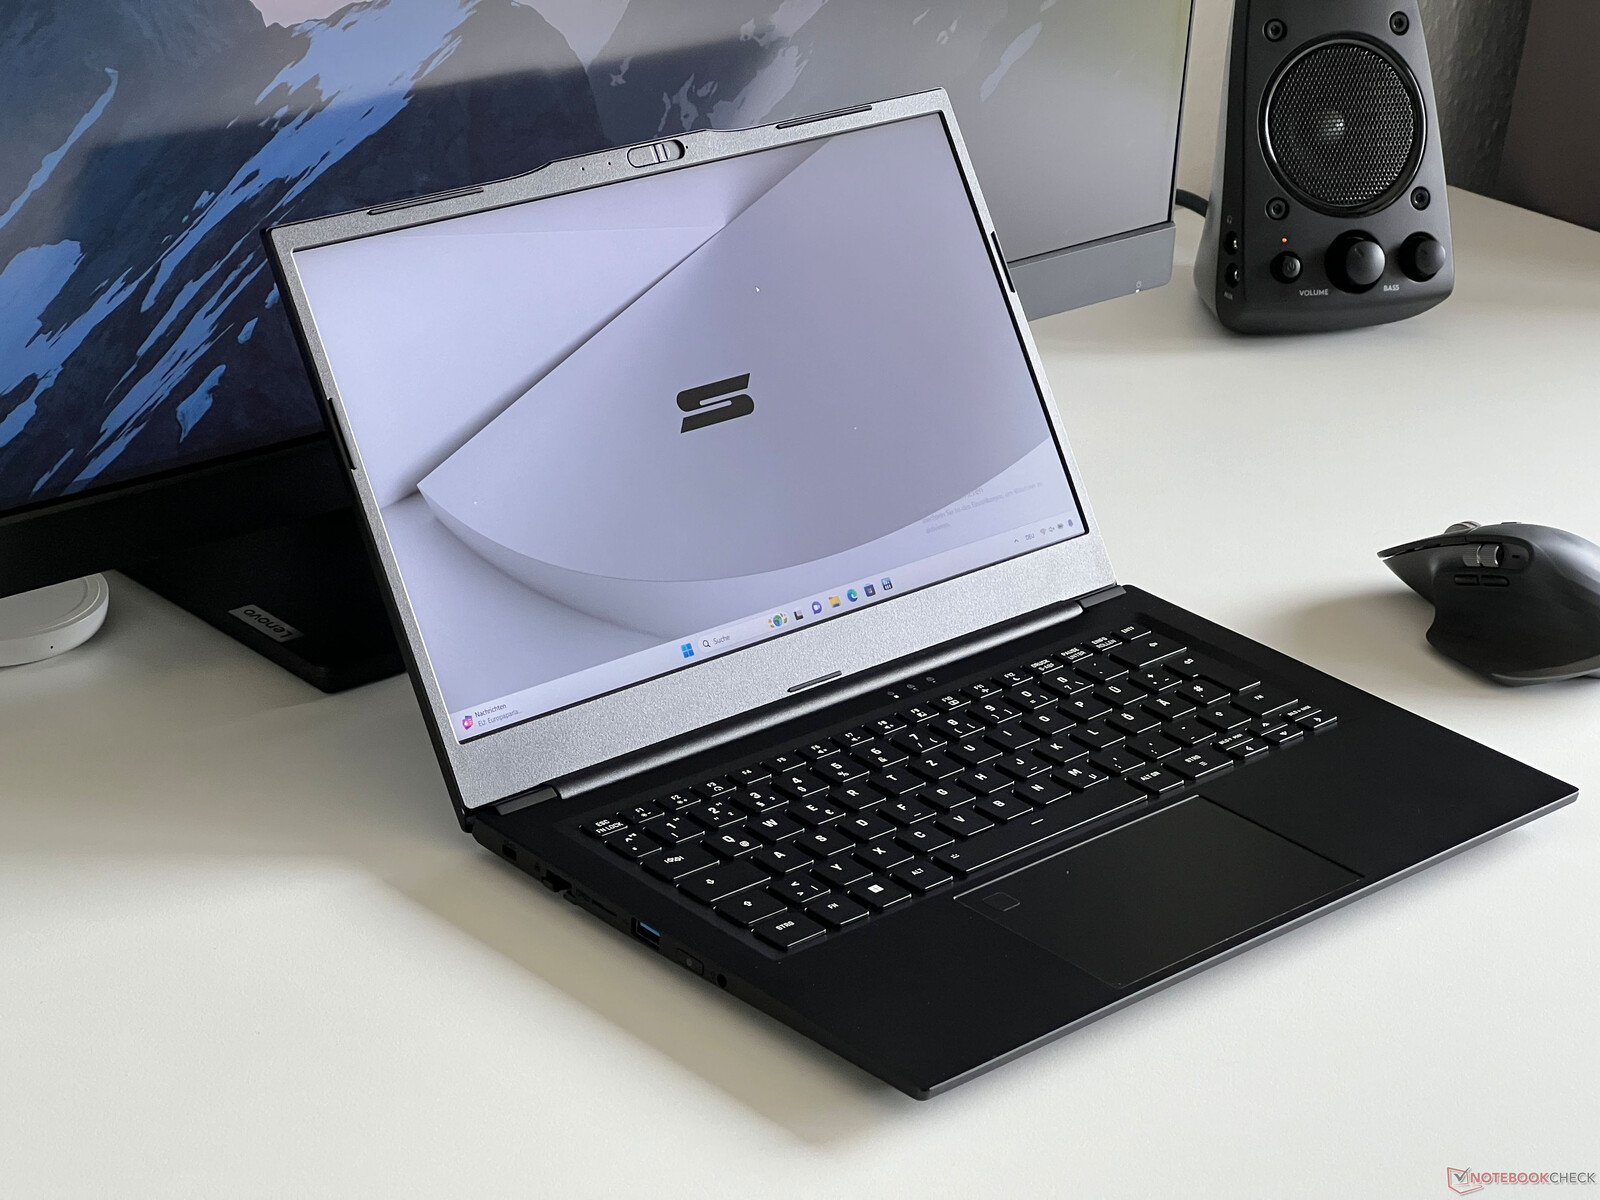
Schenker Work 14 Base è un computer portatile da ufficio entry-level che, a parte il case in alluminio, offre ottime opzioni di manutenzione e un'ampia selezione di porte. Purtroppo, dovrà rinunciare a standard moderni come USB4 e Thunderbolt, ma in compenso dispone di un numero sufficiente di porte USB e di una connessione Gigabit Ethernet, cosa che non è sempre scontata nei computer portatili da ufficio. Il suo telaio in alluminio ha un aspetto più pregiato rispetto a quelli in plastica dei suoi concorrenti, tuttavia le sue superfici attirano molte impronte digitali e abbiamo notato alcuni leggeri scricchiolii durante il nostro test.
Il portatile è dotato di un Core i5-1235U obsoleto che utilizza limiti di potenza ridotti, per cui le sue prestazioni sono del tutto sufficienti per le semplici attività quotidiane. In parte, anche il suo SSD PCIe è responsabile di questa buona impressione soggettiva. D'altra parte, la sua piccola ventola diventa piuttosto fastidiosa sotto carico, in quanto emette un rumore acuto e nel complesso diventa troppo rumorosa. Il display IPS opaco del portatile con risoluzione Full HD è molto luminoso con 400 cd/m².
Schenker Work 14 Base è un semplice computer portatile da ufficio con un case in alluminio, buone opzioni di manutenzione e un display IPS opaco. Tuttavia, dovrà convivere con un'immagine sgranata e con uno standard di prestazioni generalmente basso.
Anche per Work 14 Base non è facile competere con i suoi concorrenti, che in genere offrono prestazioni leggermente migliori, maggiore autonomia e altoparlanti migliori. i display 16:9, tuttavia, sono ancora la norma in questa classe di prezzo e, in generale, dovrà scendere a compromessi in questo segmento quando si tratta di prestazioni.
Prezzo e disponibilità
Attualmente, il prezzo di vendita di Schenker Work 14 Base è di circa 750 dollari, ma non è disponibile per l'acquisto negli Stati Uniti.
SCHENKER Work 14 Base
-
05/01/2024 v7
Andreas Osthoff
Transparency
The present review sample was made available to the author as a loan by the manufacturer or a shop for the purposes of review. The lender had no influence on this review, nor did the manufacturer receive a copy of this review before publication. There was no obligation to publish this review.
Pricecompare

