Recensione del notebook Lenovo IdeaPad L340-17IRH: gaming notebook tuttofare che non sfrutta a pieno le potenzialità

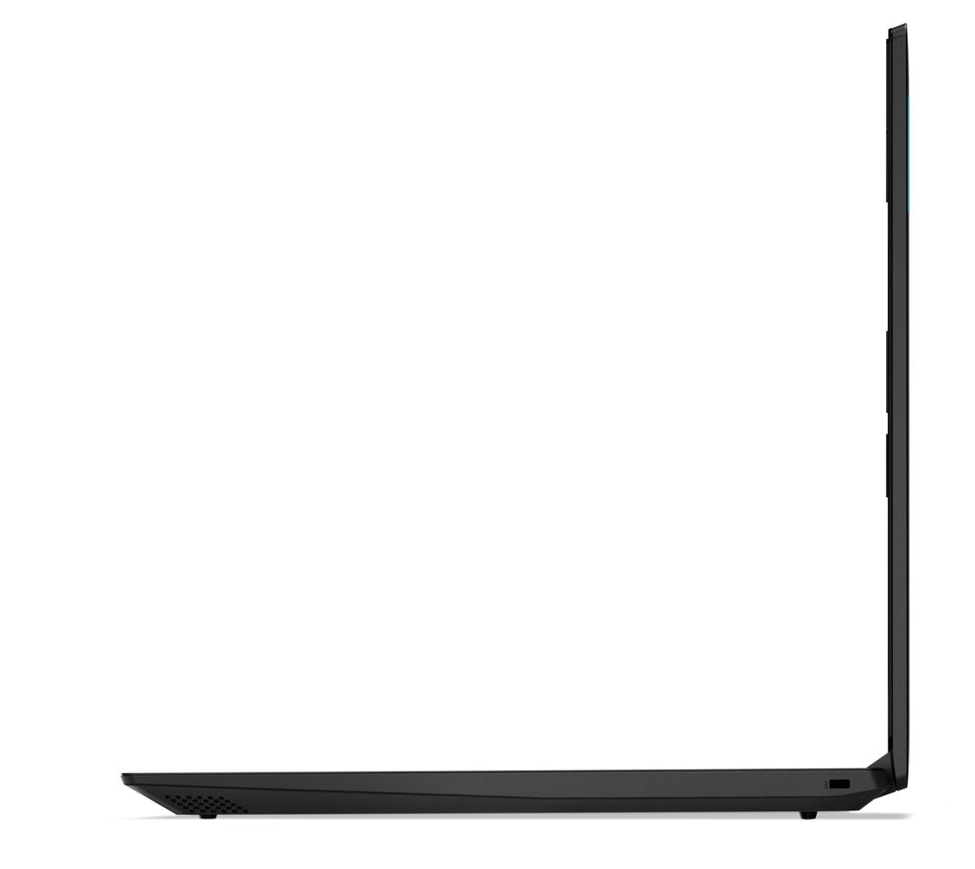
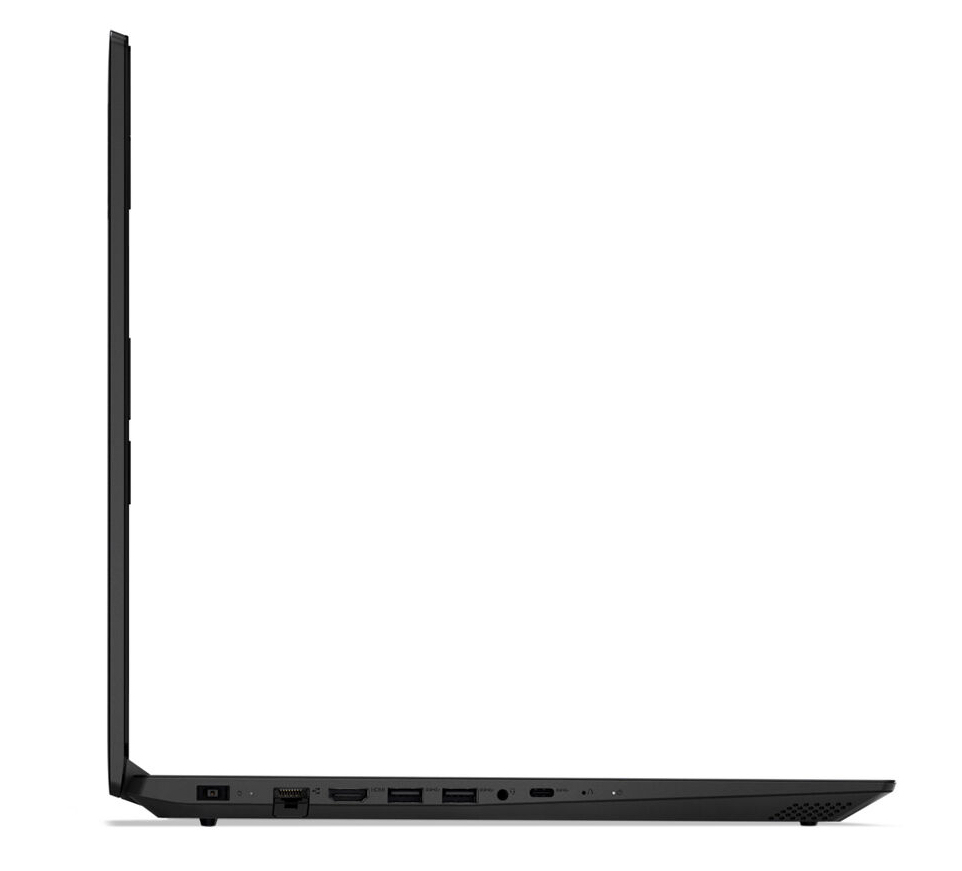
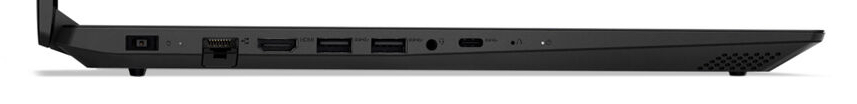
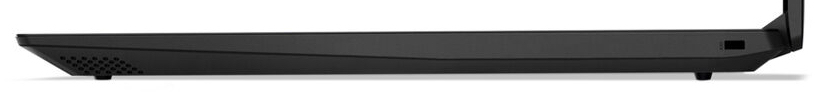
Connessioni
| |||||||||||||||||||||||||
Distribuzione della luminosità: 85 %
Al centro con la batteria: 328 cd/m²
Contrasto: 1514:1 (Nero: 0.21 cd/m²)
ΔE ColorChecker Calman: 4.04 | ∀{0.5-29.43 Ø4.72}
calibrated: 2.06
ΔE Greyscale Calman: 4.21 | ∀{0.09-98 Ø4.97}
93% sRGB (Argyll 1.6.3 3D)
60% AdobeRGB 1998 (Argyll 1.6.3 3D)
66.6% AdobeRGB 1998 (Argyll 3D)
92.7% sRGB (Argyll 3D)
66.3% Display P3 (Argyll 3D)
Gamma: 2.5
CCT: 7189 K
| Lenovo Ideapad L340-17IRH 81LL001YGE IPS, 1920x1080, 17.3" | Lenovo Ideapad L340-17API-81LY0004GE TN LED, 1600x900, 17.3" | Asus TUF FX705DT-AU068T IPS, 1920x1080, 17.3" | MSI GF75 Thin 9SC IPS, 1920x1080, 17.3" | HP Pavilion Gaming 17-cd0085cl IPS, 1920x1080, 17.3" | Dell G3 17 3779 IPS, 1920x1080, 17.3" | |
|---|---|---|---|---|---|---|
| Display | -21% | -5% | -4% | -4% | -3% | |
| Display P3 Coverage (%) | 66.3 | 51.1 -23% | 62.3 -6% | 62.5 -6% | 63.3 -5% | 63.9 -4% |
| sRGB Coverage (%) | 92.7 | 73.9 -20% | 89.1 -4% | 90 -3% | 90.2 -3% | 89.8 -3% |
| AdobeRGB 1998 Coverage (%) | 66.6 | 52.7 -21% | 63.7 -4% | 64 -4% | 64.3 -3% | 64.9 -3% |
| Response Times | 11% | -29% | -19% | 8% | -16% | |
| Response Time Grey 50% / Grey 80% * (ms) | 32 ? | 42 ? -31% | 41 ? -28% | 34 ? -6% | 31.6 ? 1% | 38 ? -19% |
| Response Time Black / White * (ms) | 23 ? | 11 ? 52% | 30 ? -30% | 30.4 ? -32% | 19.6 ? 15% | 26 ? -13% |
| PWM Frequency (Hz) | 250 ? | |||||
| Screen | -85% | -5% | -5% | -15% | -16% | |
| Brightness middle (cd/m²) | 318 | 230 -28% | 316 -1% | 344.7 8% | 299.6 -6% | 323 2% |
| Brightness (cd/m²) | 292 | 201 -31% | 294 1% | 332 14% | 285 -2% | 306 5% |
| Brightness Distribution (%) | 85 | 78 -8% | 84 -1% | 91 7% | 86 1% | 89 5% |
| Black Level * (cd/m²) | 0.21 | 0.46 -119% | 0.32 -52% | 0.3 -43% | 0.33 -57% | 0.31 -48% |
| Contrast (:1) | 1514 | 500 -67% | 988 -35% | 1149 -24% | 908 -40% | 1042 -31% |
| Colorchecker dE 2000 * | 4.04 | 10.36 -156% | 3.39 16% | 3.08 24% | 3.68 9% | 4.96 -23% |
| Colorchecker dE 2000 max. * | 6.59 | 18.63 -183% | 5.56 16% | 6.32 4% | 8.05 -22% | 8.25 -25% |
| Colorchecker dE 2000 calibrated * | 2.06 | 2.14 -4% | 2.94 -43% | 3.15 -53% | ||
| Greyscale dE 2000 * | 4.21 | 13.32 -216% | 3.17 25% | 3.8 10% | 3.8 10% | 5.65 -34% |
| Gamma | 2.5 88% | 2.54 87% | 2.39 92% | 2.17 101% | 2.12 104% | 2.24 98% |
| CCT | 7189 90% | 14124 46% | 7098 92% | 7284 89% | 7240 90% | 7441 87% |
| Color Space (Percent of AdobeRGB 1998) (%) | 60 | 48 -20% | 51 -15% | 58 -3% | 58.1 -3% | 58 -3% |
| Color Space (Percent of sRGB) (%) | 93 | 74 -20% | 89 -4% | 89.6 -4% | 89.8 -3% | 90 -3% |
| Media totale (Programma / Settaggio) | -32% /
-59% | -13% /
-8% | -9% /
-6% | -4% /
-10% | -12% /
-13% |
* ... Meglio usare valori piccoli
Tempi di risposta del Display
| ↔ Tempi di risposta dal Nero al Bianco | ||
|---|---|---|
| 23 ms ... aumenta ↗ e diminuisce ↘ combinato | ↗ 14 ms Incremento | 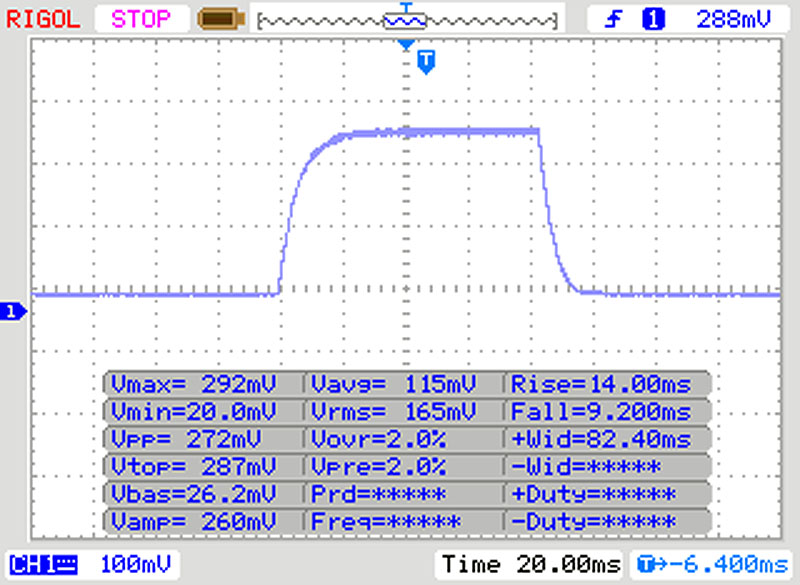 |
| ↘ 9 ms Calo | ||
| Lo schermo mostra buoni tempi di risposta durante i nostri tests, ma potrebbe essere troppo lento per i gamers competitivi. In confronto, tutti i dispositivi di test variano da 0.1 (minimo) a 240 (massimo) ms. » 52 % di tutti i dispositivi è migliore. Questo significa che i tempi di risposta rilevati sono peggiori rispetto alla media di tutti i dispositivi testati (19.8 ms). | ||
| ↔ Tempo di risposta dal 50% Grigio all'80% Grigio | ||
| 32 ms ... aumenta ↗ e diminuisce ↘ combinato | ↗ 16 ms Incremento | 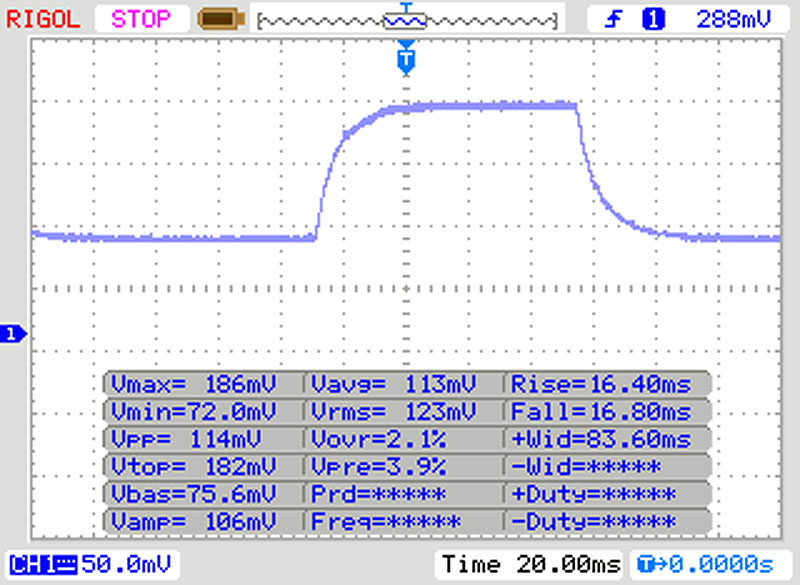 |
| ↘ 16 ms Calo | ||
| Lo schermo mostra tempi di risposta lenti nei nostri tests e sarà insoddisfacente per i gamers. In confronto, tutti i dispositivi di test variano da 0.165 (minimo) a 636 (massimo) ms. » 43 % di tutti i dispositivi è migliore. Questo significa che i tempi di risposta rilevati sono simili alla media di tutti i dispositivi testati (31 ms). | ||
Sfarfallio dello schermo / PWM (Pulse-Width Modulation)
| flickering dello schermo / PWM rilevato | 250 Hz | ≤ 20 % settaggio luminosita' | 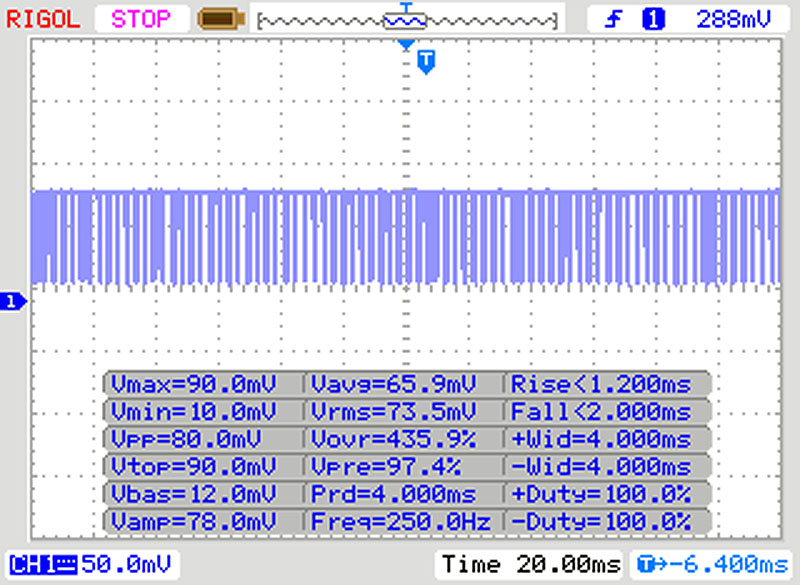 |
Il display sfarfalla a 250 Hz (Probabilmente a causa dell'uso di PWM) Flickering rilevato ad una luminosita' di 20 % o inferiore. Non dovrebbe verificarsi flickering o PWM sopra questo valore di luminosita'. La frequenza di 250 Hz è relativamente bassa, quindi gli utenti sensibili potrebbero notare il flickering ed accusare stanchezza agli occhi a questo livello di luminosità e a livelli inferiori. In confronto: 52 % di tutti i dispositivi testati non utilizza PWM per ridurre la luminosita' del display. Se è rilevato PWM, una media di 7775 (minimo: 5 - massimo: 343500) Hz è stata rilevata. | |||
| Mozilla Kraken 1.1 - Total | |
| Lenovo Ideapad L340-17API-81LY0004GE (Edge 44) | |
| Asus TUF FX705DT-AU068T (Edge 44) | |
| Dell G3 17 3779 (Edge 42.17134.1.0) | |
| Media Intel Core i5-9300H (1079 - 1349, n=8) | |
| Lenovo Ideapad L340-17IRH 81LL001YGE (Edge 44) | |
| MSI GF75 Thin 9SC (Edge 44.17763.1.0) | |
| HP Pavilion Gaming 17-cd0085cl (Edge 44.17763.1.0) | |
| Media della classe Gaming (391 - 590, n=106, ultimi 2 anni) | |
| Octane V2 - Total Score | |
| Media della classe Gaming (89353 - 139447, n=28, ultimi 2 anni) | |
| MSI GF75 Thin 9SC (Edge 44.17763.1.0) | |
| HP Pavilion Gaming 17-cd0085cl (Edge 44.17763.1.0) | |
| Lenovo Ideapad L340-17IRH 81LL001YGE (Edge 44) | |
| Dell G3 17 3779 (Edge 42.17134.1.0) | |
| Media Intel Core i5-9300H (22225 - 34957, n=7) | |
| Lenovo Ideapad L340-17API-81LY0004GE (Edge 44) | |
| Asus TUF FX705DT-AU068T (Edge 44) | |
| JetStream 1.1 - 1.1 Total | |
| Media della classe Gaming (549 - 647, n=3, ultimi 2 anni) | |
| MSI GF75 Thin 9SC (Edge 44.17763.1.0) | |
| HP Pavilion Gaming 17-cd0085cl (Edge 44.17763.1.0) | |
| Lenovo Ideapad L340-17IRH 81LL001YGE (Edge 44) | |
| Dell G3 17 3779 (Edge 42.17134.1.0) | |
| Media Intel Core i5-9300H (150.3 - 254, n=7) | |
| Lenovo Ideapad L340-17API-81LY0004GE (Edge 44) | |
| Asus TUF FX705DT-AU068T (Edge 44) | |
* ... Meglio usare valori piccoli
| PCMark 8 Home Score Accelerated v2 | 3582 punti | |
| PCMark 8 Creative Score Accelerated v2 | 3438 punti | |
| PCMark 8 Work Score Accelerated v2 | 4922 punti | |
| PCMark 10 Score | 4821 punti | |
Aiuto | ||

| Lenovo Ideapad L340-17IRH 81LL001YGE WDC PC SN520 SDAPMUW-512 | Lenovo Ideapad L340-17API-81LY0004GE Samsung SSD PM871b MZ7LN256HAJQ | Asus TUF FX705DT-AU068T WDC PC SN520 SDAPNUW-256G | MSI GF75 Thin 9SC Crucial P1 SSD CT1000P1SSD8 | HP Pavilion Gaming 17-cd0085cl Samsung SSD PM981 MZVLB256HAHQ | Dell G3 17 3779 SK hynix SC311 SATA | Media WDC PC SN520 SDAPMUW-512 | Media della classe Gaming | |
|---|---|---|---|---|---|---|---|---|
| CrystalDiskMark 5.2 / 6 | -44% | 4% | 27% | 43% | -59% | 3% | 168% | |
| Write 4K (MB/s) | 100.7 | 94.4 -6% | 145 44% | 133 32% | 135.3 34% | 62.8 -38% | 115.1 ? 14% | 202 ? 101% |
| Read 4K (MB/s) | 40.26 | 32.45 -19% | 45.28 12% | 55.6 38% | 63.7 58% | 24.63 -39% | 41.4 ? 3% | 78.2 ? 94% |
| Write Seq (MB/s) | 1196 | 482.8 -60% | 1301 9% | 1623 36% | 1337 12% | 203.9 -83% | 1208 ? 1% | 3726 ? 212% |
| Read Seq (MB/s) | 1091 | 524 -52% | 1362 25% | 1386 27% | 1617 48% | 550 -50% | 1121 ? 3% | 3617 ? 232% |
| Write 4K Q32T1 (MB/s) | 376 | 232 -38% | 249.1 -34% | 501 33% | 568 51% | 160.1 -57% | 421 ? 12% | 611 ? 63% |
| Read 4K Q32T1 (MB/s) | 418.6 | 253.6 -39% | 342.1 -18% | 584 40% | 645 54% | 184.3 -56% | 393 ? -6% | 712 ? 70% |
| Write Seq Q32T1 (MB/s) | 1459 | 496.5 -66% | 1301 -11% | 1696 16% | 1428 -2% | 235 -84% | 1388 ? -5% | 5242 ? 259% |
| Read Seq Q32T1 (MB/s) | 1684 | 540 -68% | 1732 3% | 1572 -7% | 3184 89% | 554 -67% | 1697 ? 1% | 7011 ? 316% |
| 3DMark 11 Performance | 10990 punti | |
| 3DMark Ice Storm Standard Score | 72776 punti | |
| 3DMark Cloud Gate Standard Score | 22820 punti | |
| 3DMark Fire Strike Score | 7863 punti | |
Aiuto | ||
| BioShock Infinite - 1920x1080 Ultra Preset, DX11 (DDOF) | |
| HP Pavilion Gaming 17-cd0085cl | |
| HP Omen 15-dc1020ng (Dual-Channel-Modus) | |
| MSI GF75 Thin 9SC | |
| HP Omen 15-dc1020ng | |
| Media NVIDIA GeForce GTX 1650 Mobile (68.5 - 99.4, n=18) | |
| Lenovo Ideapad L340-17IRH 81LL001YGE | |
| Asus TUF FX705DT-AU068T | |
| Dell G3 17 3779 | |
| Asus TUF FX705DY-AU072 | |
| Lenovo Ideapad L340-17API-81LY0004GE | |
| The Witcher 3 - 1920x1080 High Graphics & Postprocessing (Nvidia HairWorks Off) | |
| Media della classe Gaming (181 - 341, n=3, ultimi 2 anni) | |
| HP Pavilion Gaming 17-cd0085cl | |
| MSI GF75 Thin 9SC | |
| HP Omen 15-dc1020ng | |
| Media NVIDIA GeForce GTX 1650 Mobile (45 - 70.4, n=29) | |
| Acer Aspire Nitro 5 AN515-54-53Z2 | |
| Asus TUF FX705DT-AU068T | |
| Lenovo Ideapad L340-17IRH 81LL001YGE | |
| Dell G3 17 3779 | |
| Asus TUF FX705DY-AU072 | |
| Battlefield V - 1920x1080 Ultra Preset | |
| Media NVIDIA GeForce GTX 1650 Mobile (44.3 - 64.8, n=5) | |
| Lenovo Ideapad L340-17IRH 81LL001YGE | |
| Asus TUF FX705DY-AU072 | |
| Apex Legends - 1920x1080 Maximum Settings AA:TS AF:16x | |
| Lenovo Ideapad L340-17IRH 81LL001YGE | |
| Media NVIDIA GeForce GTX 1650 Mobile (65.4 - 71.7, n=3) | |
| Asus TUF FX705DY-AU072 | |
| Final Fantasy XV Benchmark - 1280x720 Lite Quality | |
| Media della classe Gaming (117.4 - 235, n=69, ultimi 2 anni) | |
| Media NVIDIA GeForce GTX 1650 Mobile (54.8 - 87.4, n=4) | |
| Asus TUF FX705DT-AU068T | |
| Lenovo Ideapad L340-17IRH 81LL001YGE | |
| F1 2019 - 1920x1080 Ultra High Preset AA:T AF:16x | |
| HP Omen 15-dc1020ng (Dual-Channel-Modus) | |
| Media NVIDIA GeForce GTX 1650 Mobile (59 - 65, n=5) | |
| HP Omen 15-dc1020ng | |
| Lenovo Ideapad L340-17IRH 81LL001YGE | |
| Lenovo Ideapad L340-17API-81LY0004GE | |
| basso | medio | alto | ultra | |
|---|---|---|---|---|
| BioShock Infinite (2013) | 195.6 | 159.4 | 152.2 | 80.5 |
| The Witcher 3 (2015) | 135.8 | 100.1 | 57.5 | 34.2 |
| Final Fantasy XV Benchmark (2018) | 54.8 | 49.1 | 35.4 | |
| Battlefield V (2018) | 83.7 | 60.4 | 57.7 | 54.3 |
| Apex Legends (2019) | 144 | 95.1 | 71.9 | 71.7 |
| Anthem (2019) | 43.9 | 33.4 | 34.2 | 29.1 |
| Total War: Three Kingdoms (2019) | 114.8 | 57.7 | 38.9 | 26.1 |
| F1 2019 (2019) | 111 | 84 | 70 | 59 |
| Control (2019) | 126.7 | 45.2 | 33.4 |
Rumorosità
| Idle |
| 30 / 30 / 30.4 dB(A) |
| Sotto carico |
| 40.9 / 40.9 dB(A) |
 | ||
30 dB silenzioso 40 dB(A) udibile 50 dB(A) rumoroso |
||
min: | ||
(±) La temperatura massima sul lato superiore è di 45 °C / 113 F, rispetto alla media di 40.4 °C / 105 F, che varia da 21.2 a 68.8 °C per questa classe Gaming.
(-) Il lato inferiore si riscalda fino ad un massimo di 54 °C / 129 F, rispetto alla media di 43.2 °C / 110 F
(+) In idle, la temperatura media del lato superiore è di 26 °C / 79 F, rispetto alla media deld ispositivo di 33.9 °C / 93 F.
(±) Riproducendo The Witcher 3, la temperatura media per il lato superiore e' di 32.7 °C / 91 F, rispetto alla media del dispositivo di 33.9 °C / 93 F.
(+) I poggiapolsi e il touchpad raggiungono la temperatura massima della pelle (35.5 °C / 95.9 F) e quindi non sono caldi.
(-) La temperatura media della zona del palmo della mano di dispositivi simili e'stata di 28.8 °C / 83.8 F (-6.7 °C / -12.1 F).
Lenovo Ideapad L340-17IRH 81LL001YGE analisi audio
(-) | altoparlanti non molto potenti (61.5 dB)
Bassi 100 - 315 Hz
(-) | quasi nessun basso - in media 17% inferiori alla media
(±) | la linearità dei bassi è media (13.9% delta rispetto alla precedente frequenza)
Medi 400 - 2000 Hz
(±) | medi elevati - circa 6.8% superiore alla media
(±) | linearità dei medi adeguata (10.5% delta rispetto alla precedente frequenza)
Alti 2 - 16 kHz
(+) | Alti bilanciati - appena 1.7% dalla media
(+) | alti lineari (5.9% delta rispetto alla precedente frequenza)
Nel complesso 100 - 16.000 Hz
(±) | la linearità complessiva del suono è media (25.2% di differenza rispetto alla media
Rispetto alla stessa classe
» 90% di tutti i dispositivi testati in questa classe è stato migliore, 3% simile, 7% peggiore
» Il migliore ha avuto un delta di 6%, medio di 18%, peggiore di 132%
Rispetto a tutti i dispositivi testati
» 77% di tutti i dispositivi testati in questa classe è stato migliore, 5% similare, 18% peggiore
» Il migliore ha avuto un delta di 4%, medio di 24%, peggiore di 134%
Asus TUF FX705DT-AU068T analisi audio
(-) | altoparlanti non molto potenti (65.9 dB)
Bassi 100 - 315 Hz
(-) | quasi nessun basso - in media 18.9% inferiori alla media
(±) | la linearità dei bassi è media (12.2% delta rispetto alla precedente frequenza)
Medi 400 - 2000 Hz
(+) | medi bilanciati - solo only 4.2% rispetto alla media
(±) | linearità dei medi adeguata (10.7% delta rispetto alla precedente frequenza)
Alti 2 - 16 kHz
(±) | alti elevati - circa 7.3% superiori alla media
(±) | la linearità degli alti è media (7.1% delta rispetto alla precedente frequenza)
Nel complesso 100 - 16.000 Hz
(±) | la linearità complessiva del suono è media (28.9% di differenza rispetto alla media
Rispetto alla stessa classe
» 94% di tutti i dispositivi testati in questa classe è stato migliore, 2% simile, 4% peggiore
» Il migliore ha avuto un delta di 6%, medio di 18%, peggiore di 132%
Rispetto a tutti i dispositivi testati
» 87% di tutti i dispositivi testati in questa classe è stato migliore, 2% similare, 11% peggiore
» Il migliore ha avuto un delta di 4%, medio di 24%, peggiore di 134%
| Off / Standby | |
| Idle | |
| Sotto carico |
|
Leggenda:
min: | |
Pro
Contro
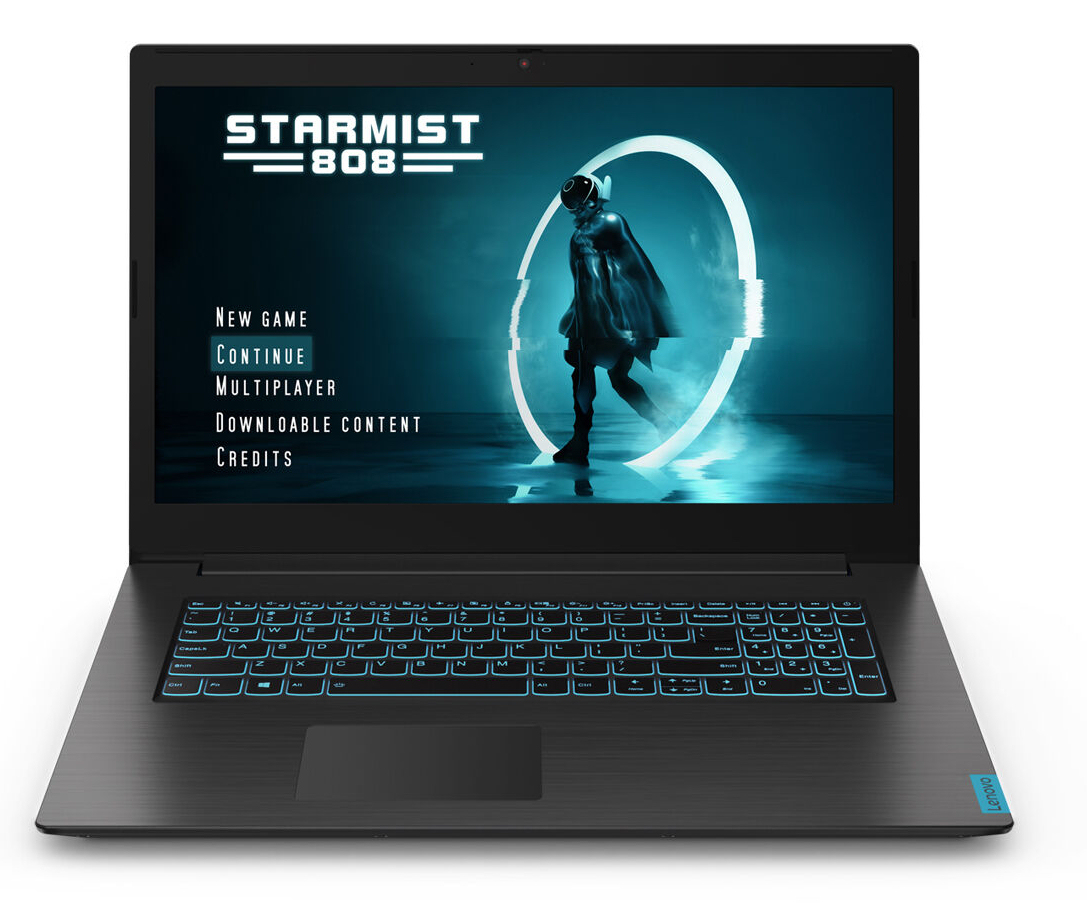
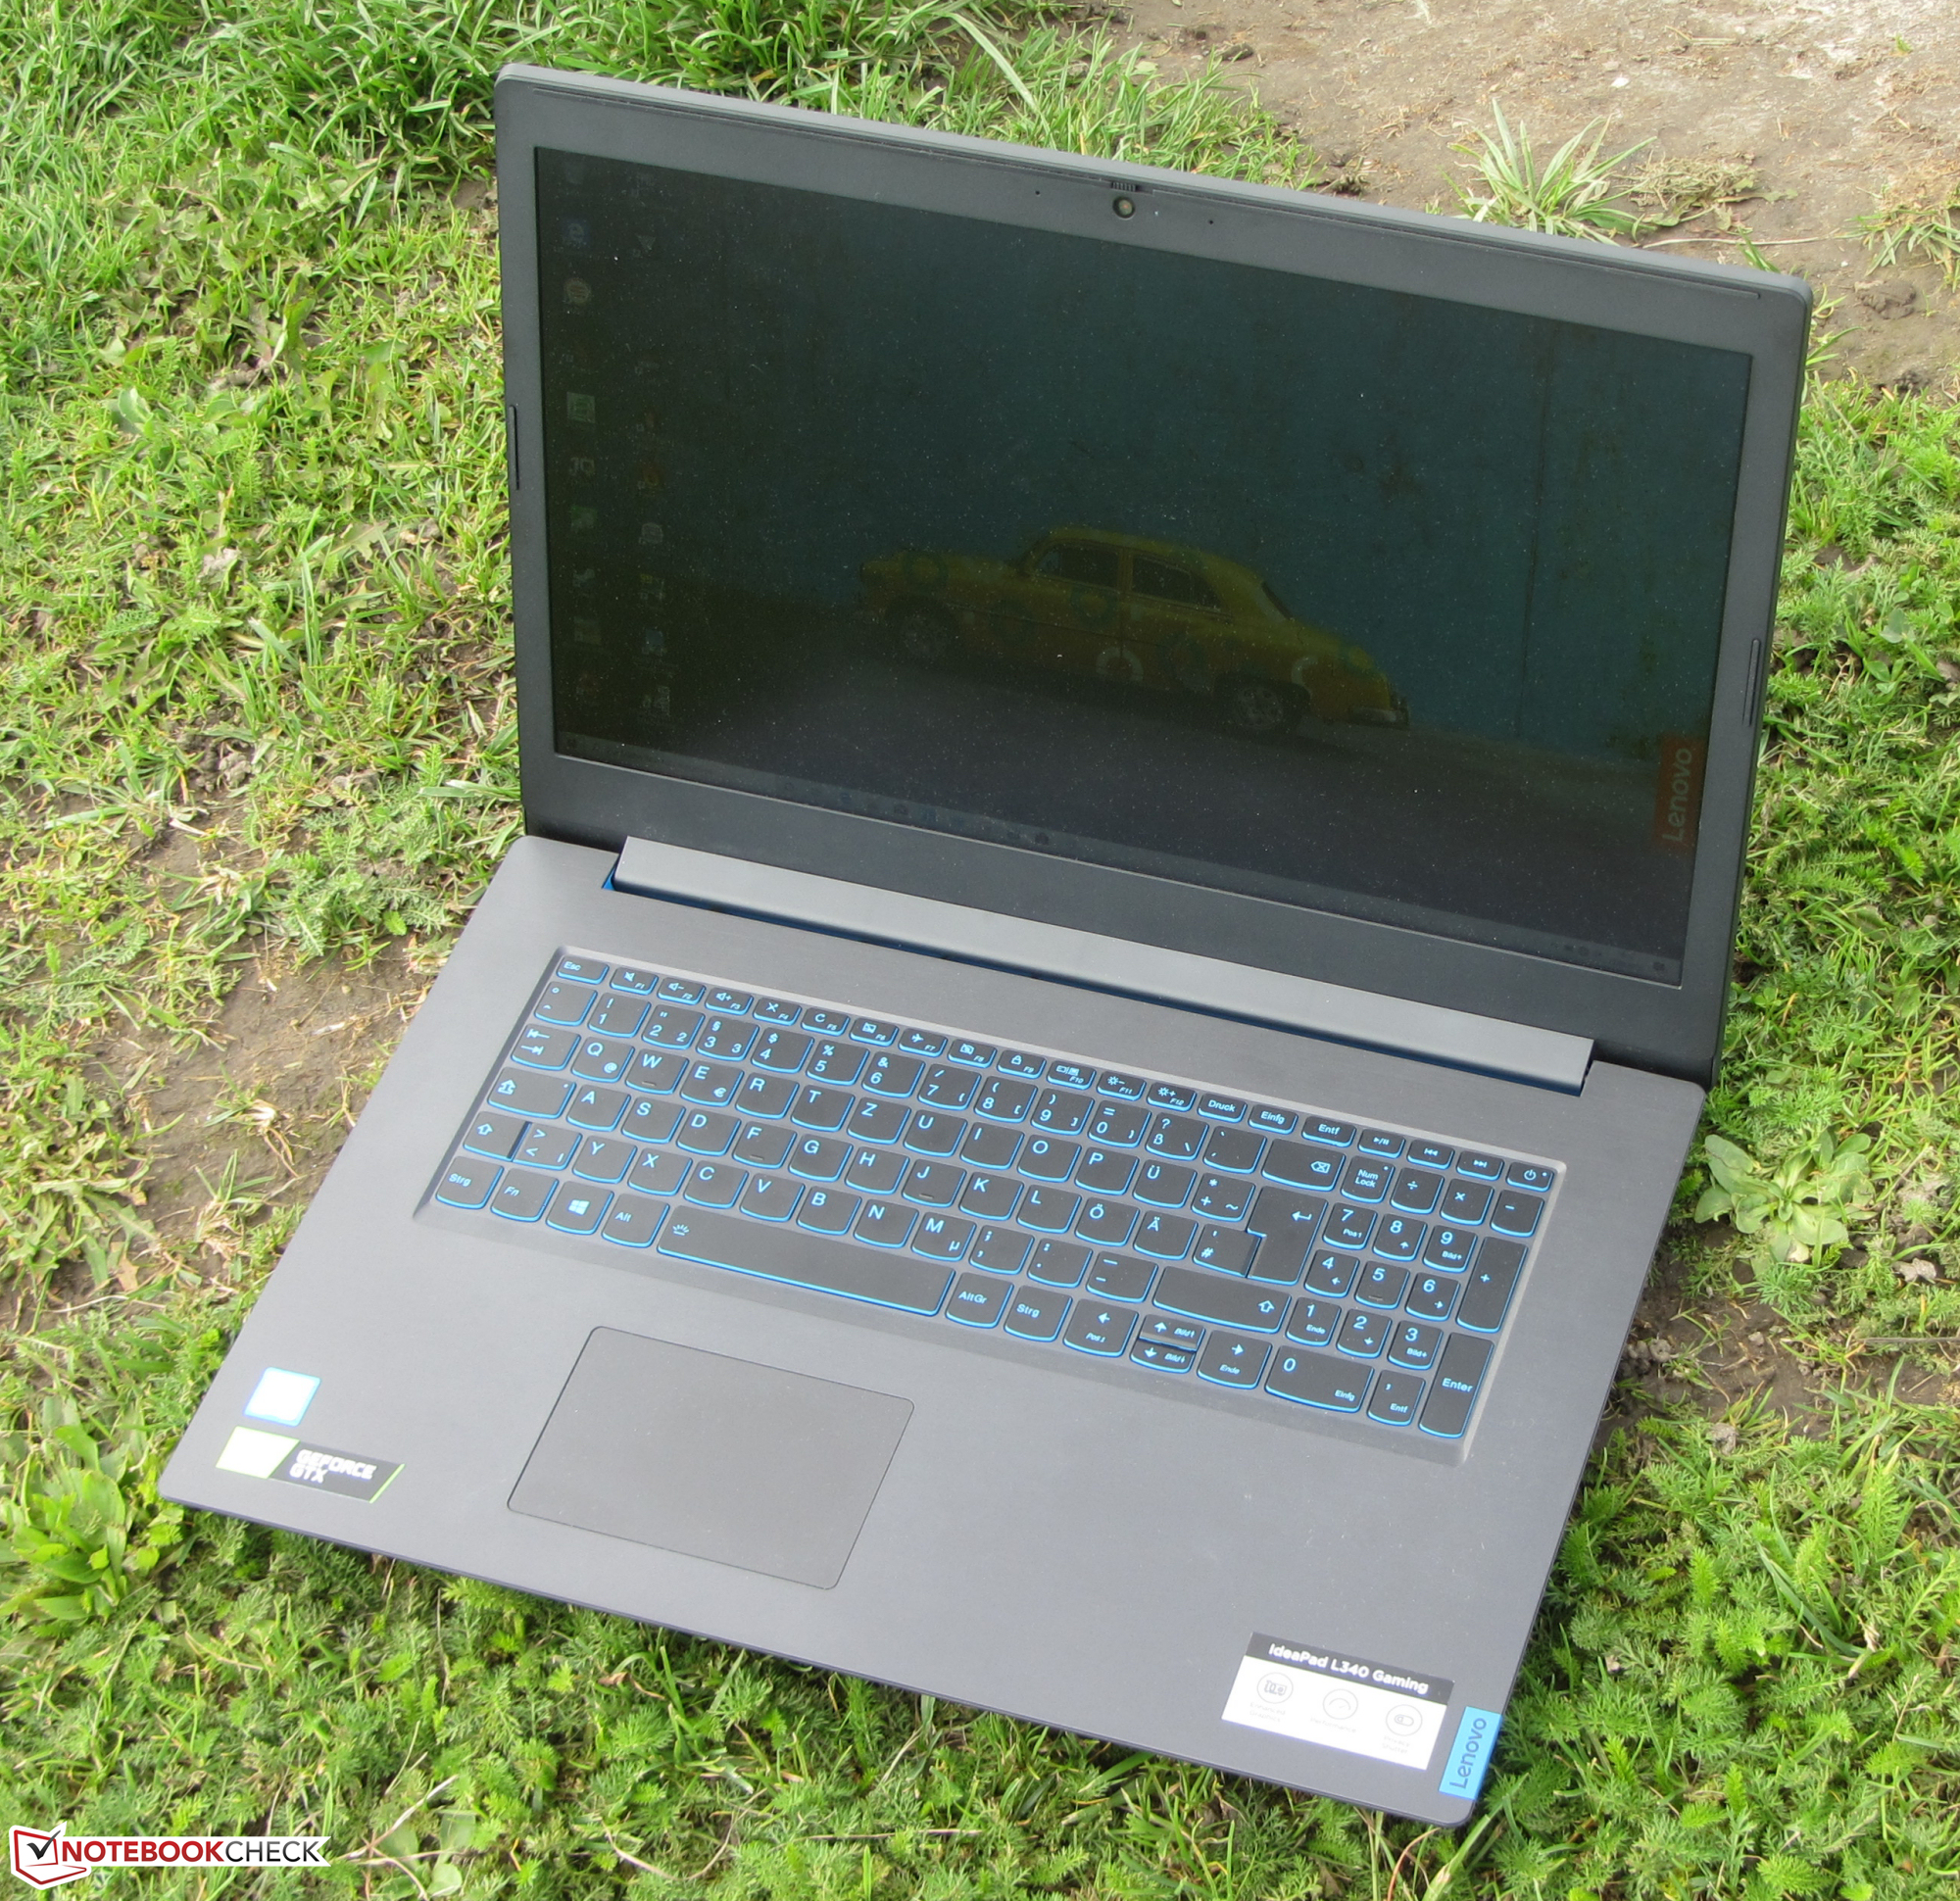
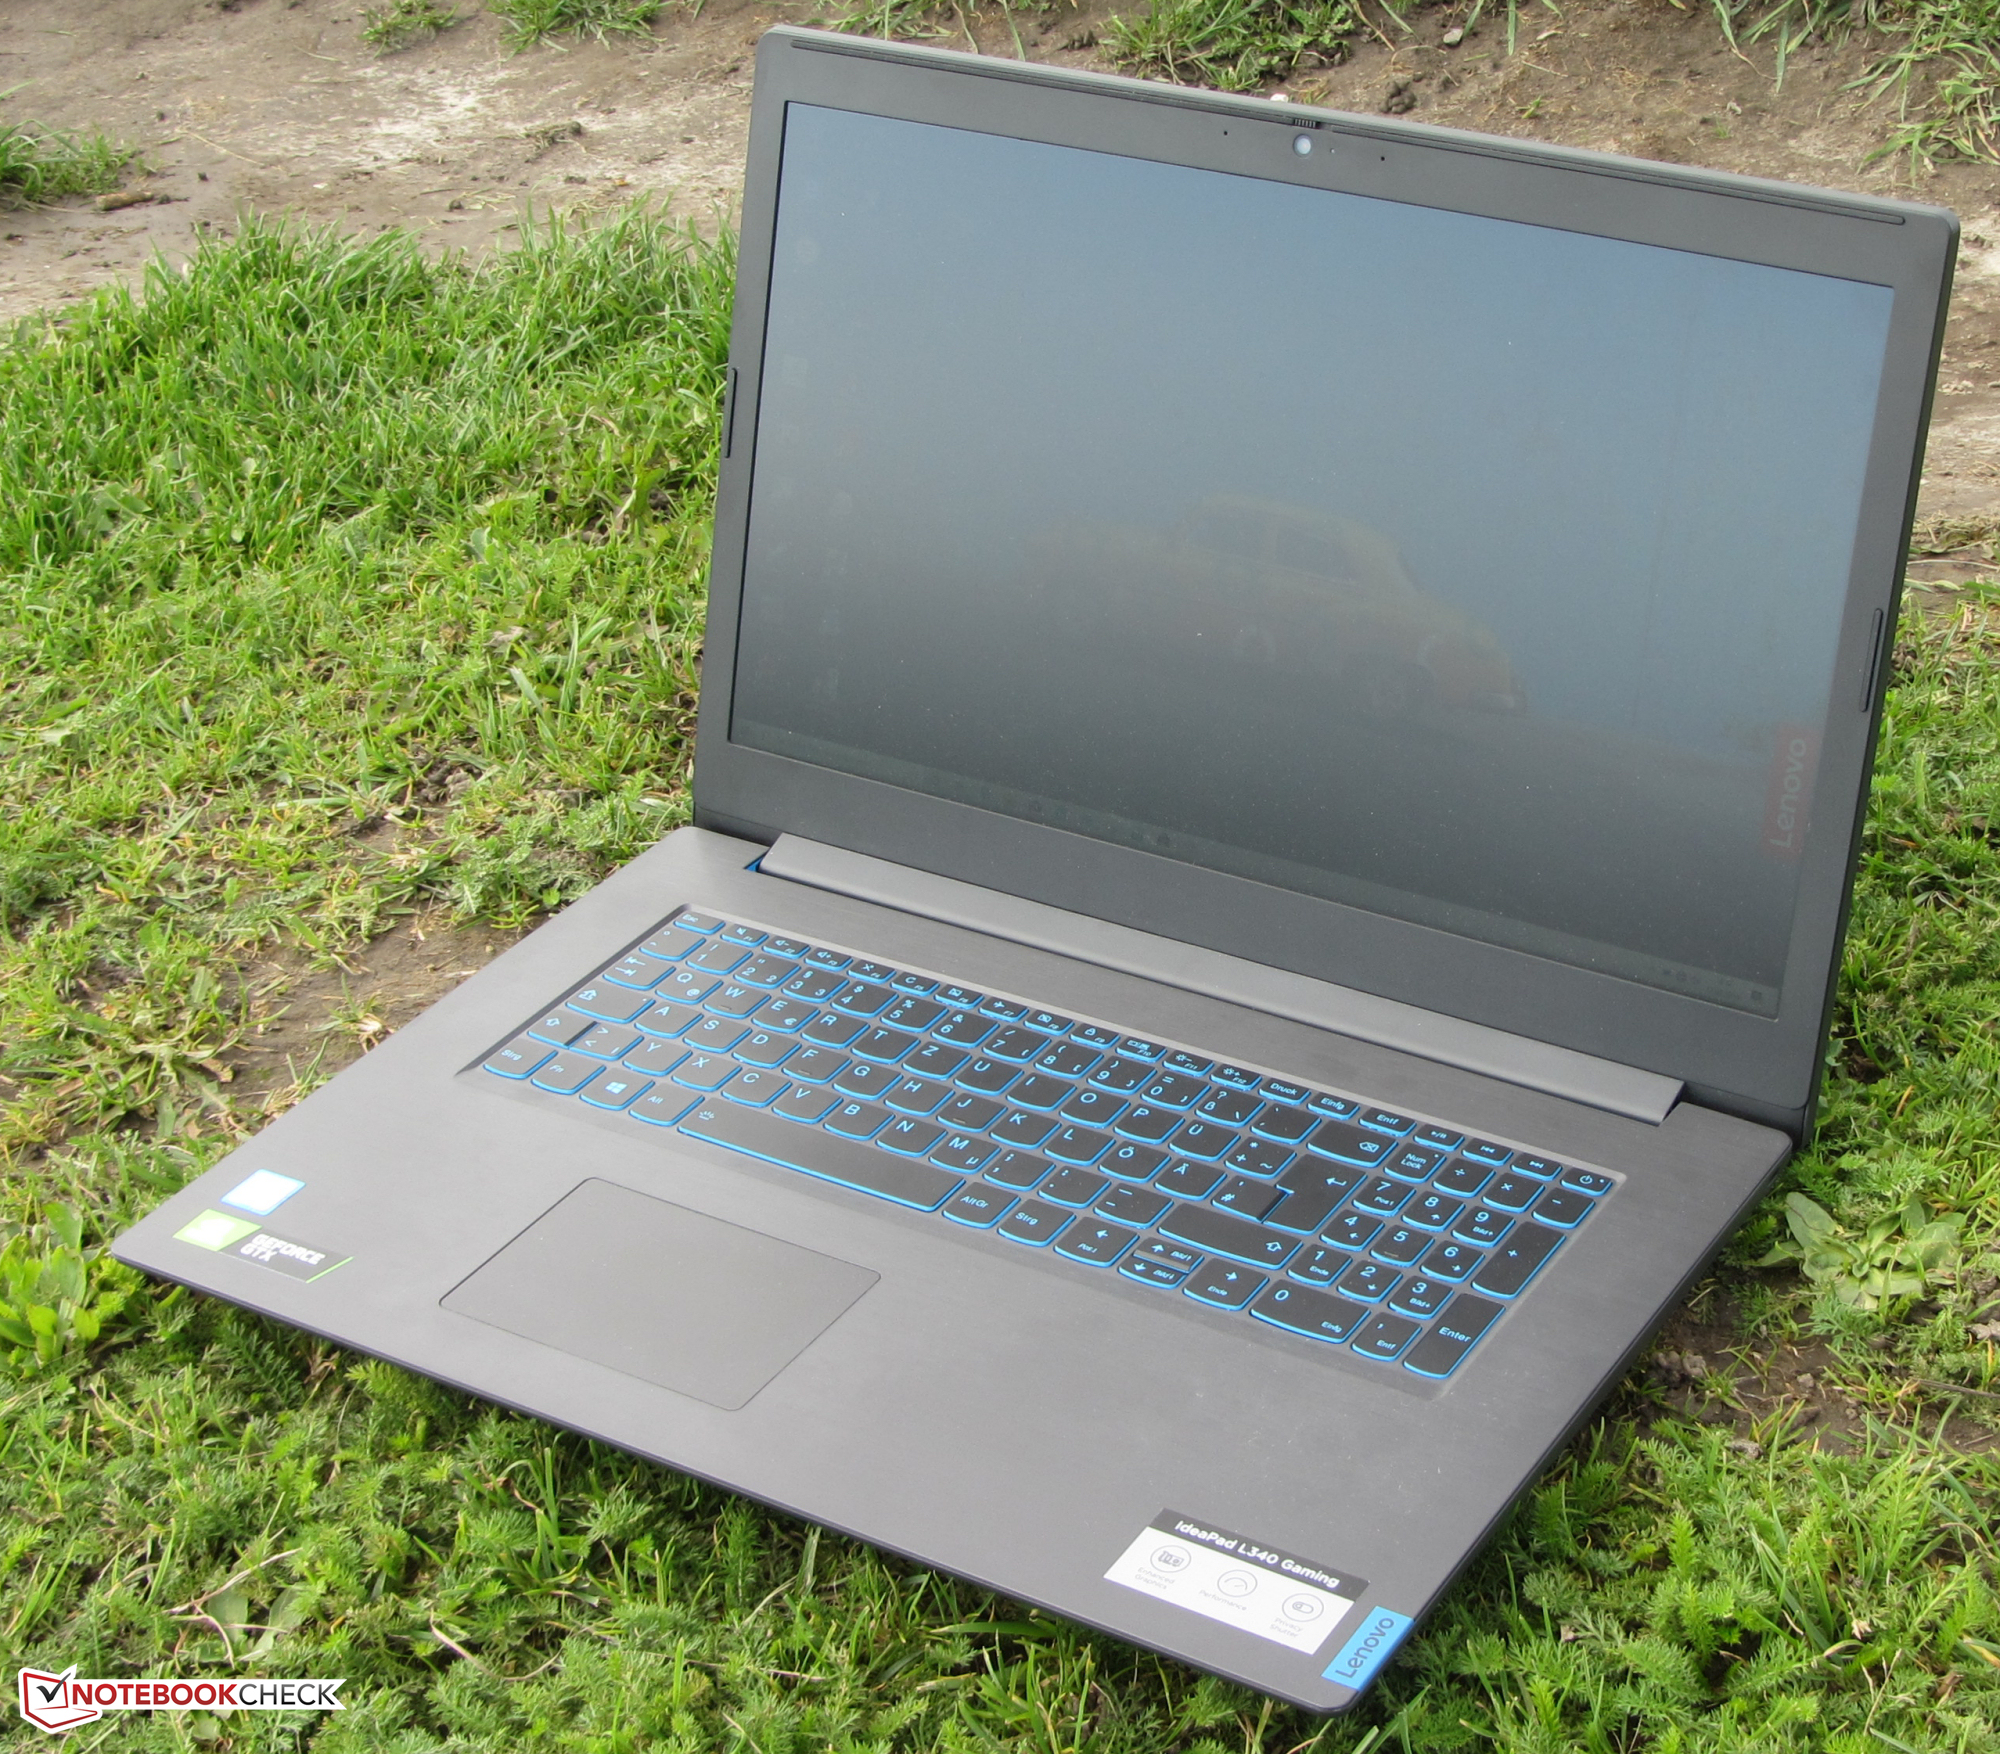
Con l'IdeaPad L340-17IRH, Lenovo offre un notebook da 17,3 pollici di fascia media. La combinazione integrata del processore Core i5-9300H e della GPU GeForce GTX-1650 gestisce tutti gli attuali giochi per computer sullo schermo senza intoppi. In generale, è possibile utilizzare la risoluzione Full-HD e impostazioni di qualità medio-alta.
Grazie alla sua scheda grafica dedicata, l'IdeaPad L340-17IRH potrebbe essere interessante anche al di là del gioco per molti utenti.
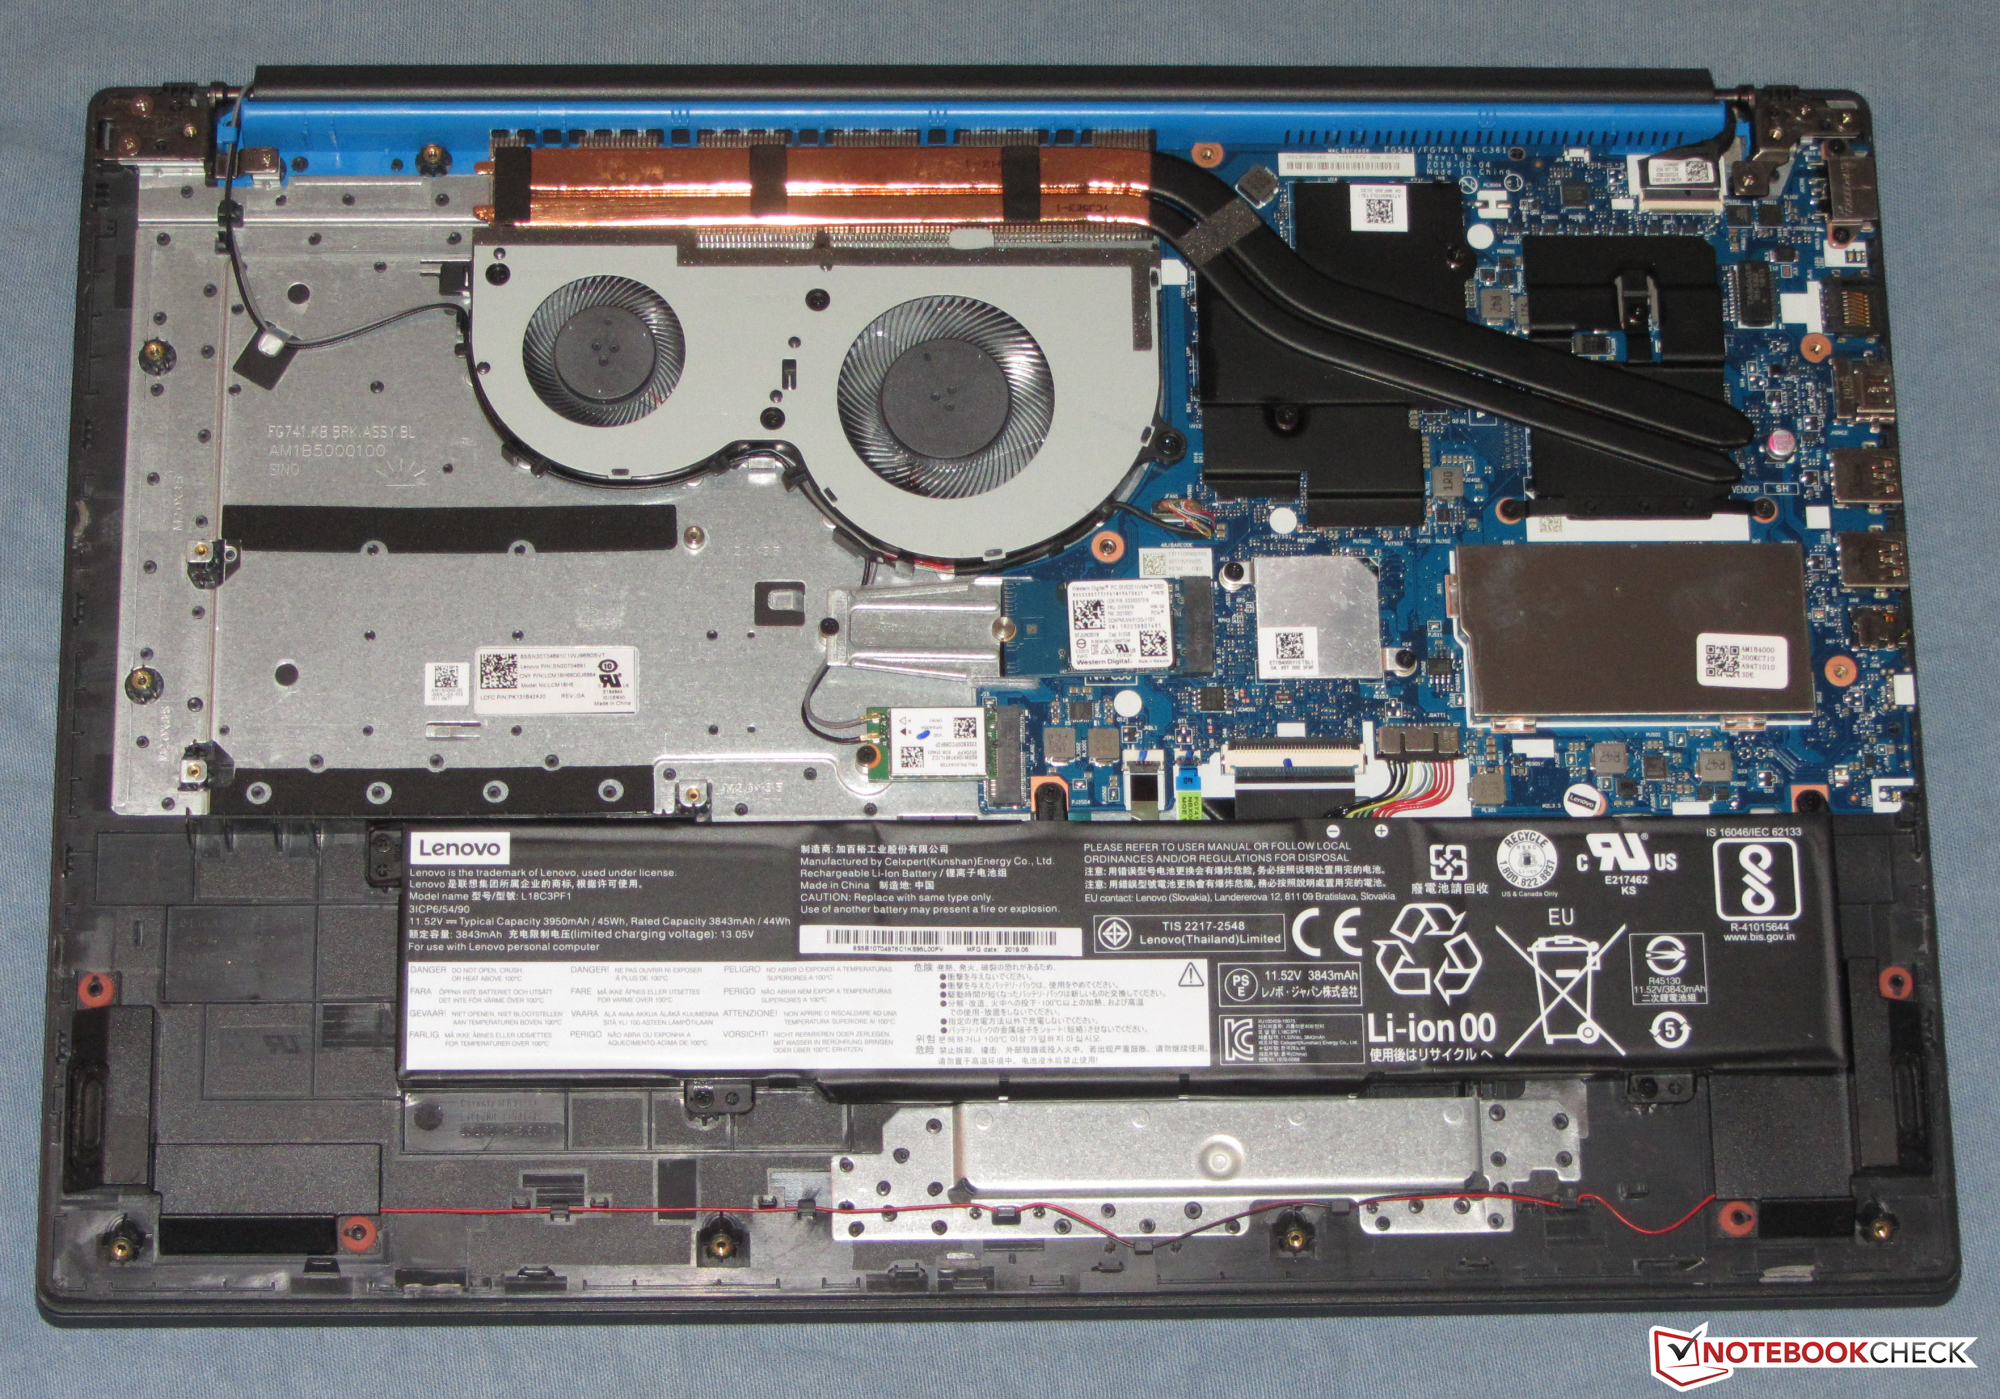
Tuttavia, il frame rate rimane al di sotto del potenziale del notebook, dal momento che la memoria di lavoro funziona solo in modalità single-channel. Non è possibile attivare la modalità a dual-channel, poiché il notebook ha un solo slot per la memoria di lavoro.
L'unità SSD NVMe integrata garantisce un funzionamento rapido e fluido del sistema. Si dovrebbe essere in grado di sostituirlo con un modello più veloce o di capacità superiore, ma per farlo, è necessario aprire il case. Il display IPS opaco mostra punteggi con angoli di visualizzazione stabili, un buon contrasto e un'ottima riproduzione dei colori. La luminosità dei display va bene, ma dovrebbe essere migliore in un notebook di questa fascia di prezzo.
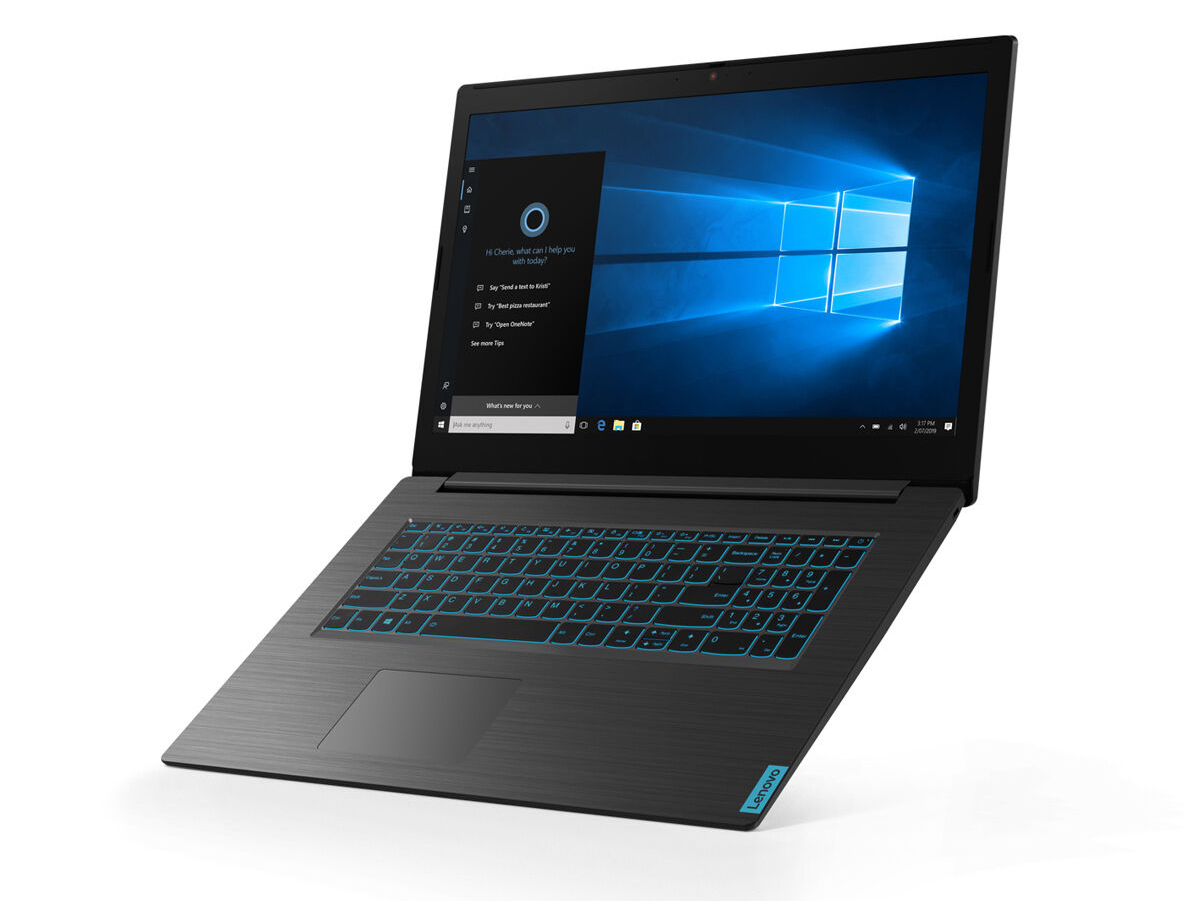
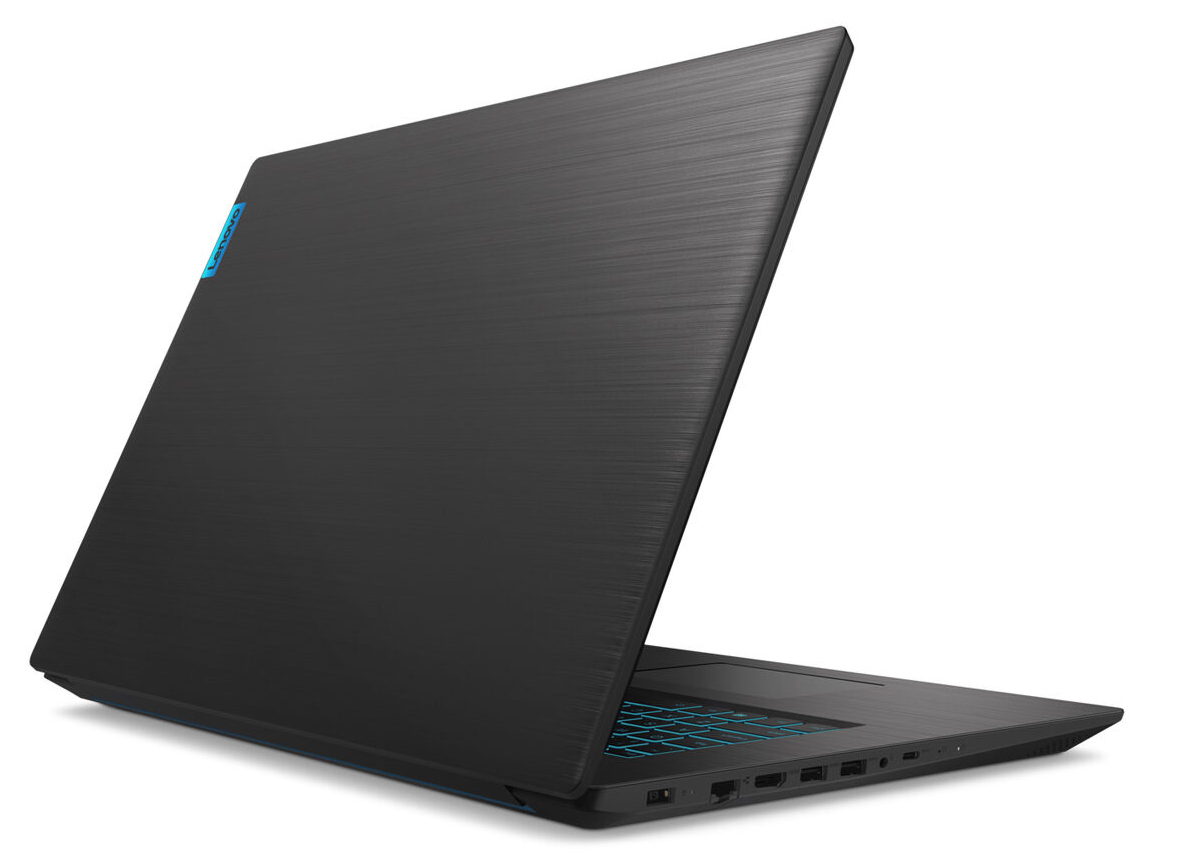
La tastiera chiclet si è dimostrata adatta per le attività quotidiane. Un punto positivo è che offre illuminazione. Questa è accompagnato da una buona durata della batteria. Mentre le dotazioni di connessione del notebook non sono troppo ricche, le connessioni più importanti sono presenti. D'altra parte, bisogna fare a meno di un lettore di schede di memoria.
Lenovo Ideapad L340-17IRH 81LL001YGE
- 09/13/2019 v7 (old)
Sascha Mölck
Price comparison
