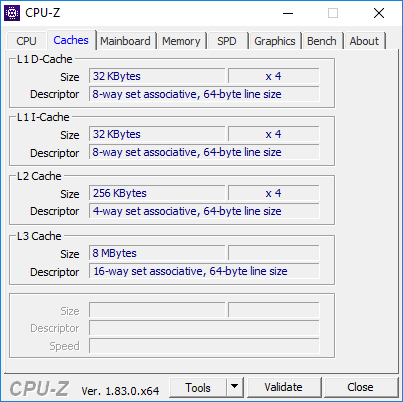
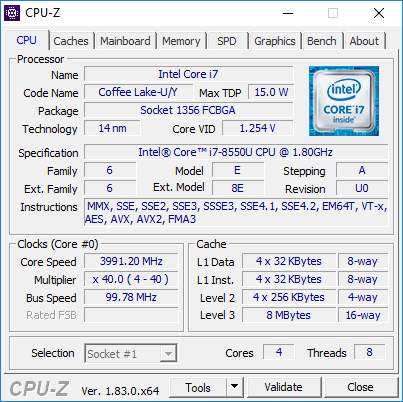
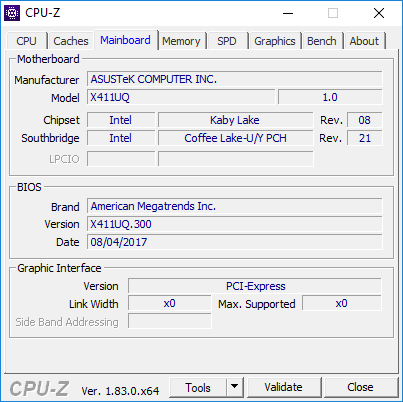
Recensione breve del Portatile Asus VivoBook S14 S410UQ (i7-8550U, 940MX, Full HD)
| SD Card Reader | |
| average JPG Copy Test (av. of 3 runs) | |
| Dell XPS 13 9370 i5 UHD (Toshiba Exceria Pro M501 64 GB UHS-II) | |
| Media della classe Multimedia (23 - 531, n=43, ultimi 2 anni) | |
| Dell Latitude 7480 (Toshiba (Exceria Pro SDXC UHS-II 64 GB) | |
| Asus ZenBook 13 UX331UN (Toshiba Exceria Pro M501) | |
| Lenovo IdeaPad 320s-14IKB (Toshiba Exceria Pro SDXC 64 GB UHS-II) | |
| Asus VivoBook S410UQ-NH74 (Toshiba Exceria Pro SDXC 64 GB UHS-II) | |
| Acer Swift 3 SF314-52G-89SL (Toshiba Exceria Pro SDXC 64 GB UHS-II) | |
| maximum AS SSD Seq Read Test (1GB) | |
| Dell XPS 13 9370 i5 UHD (Toshiba Exceria Pro M501 64 GB UHS-II) | |
| Media della classe Multimedia (27.9 - 1455, n=42, ultimi 2 anni) | |
| Dell Latitude 7480 (Toshiba (Exceria Pro SDXC UHS-II 64 GB) | |
| Lenovo IdeaPad 320s-14IKB (Toshiba Exceria Pro SDXC 64 GB UHS-II) | |
| Asus ZenBook 13 UX331UN (Toshiba Exceria Pro M501) | |
| Asus VivoBook S410UQ-NH74 (Toshiba Exceria Pro SDXC 64 GB UHS-II) | |
| Acer Swift 3 SF314-52G-89SL (Toshiba Exceria Pro SDXC 64 GB UHS-II) | |
| |||||||||||||||||||||||||
Distribuzione della luminosità: 84 %
Al centro con la batteria: 253.9 cd/m²
Contrasto: 819:1 (Nero: 0.31 cd/m²)
ΔE ColorChecker Calman: 6.03 | ∀{0.5-29.43 Ø4.73}
calibrated: 4.52
ΔE Greyscale Calman: 5.9 | ∀{0.09-98 Ø4.97}
56.59% sRGB (Calman 2D)
56.59% sRGB (Argyll 1.6.3 3D)
39.3% AdobeRGB 1998 (Argyll 1.6.3 3D)
39.3% AdobeRGB 1998 (Argyll 3D)
56.6% sRGB (Argyll 3D)
38.04% Display P3 (Argyll 3D)
Gamma: 2.25
CCT: 5814 K
| Asus VivoBook S410UQ-NH74 AUO B140HAN04.2, IPS, 14", 1920x1080 | Asus Zenbook UX3410UQ-GV077T Chi Mei N140HCE-EN1, IPS, 14", 1920x1080 | Acer Swift 3 SF314-52G-89SL AU Optronics B140HAN02.1, IPS, 14", 1920x1080 | Lenovo IdeaPad 320s-14IKB BOE CQ NV140FHM-N49, IPS, 14", 1920x1080 | Dell XPS 13 9370 i5 UHD ID: Sharp SHP148B, Name: LQ133D1, Dell P/N: 8XDHY, IPS, 13.3", 3840x2160 | Asus VivoBook S14 S406UA-BV023T BOE CQ NT140WHM-N44, TN LED, 14", 1366x768 | |
|---|---|---|---|---|---|---|
| Display | 76% | -5% | 3% | 77% | 2% | |
| Display P3 Coverage (%) | 38.04 | 67.2 77% | 36.09 -5% | 39.26 3% | 68.9 81% | 38.82 2% |
| sRGB Coverage (%) | 56.6 | 99.2 75% | 54.2 -4% | 57.6 2% | 98.4 74% | 58.2 3% |
| AdobeRGB 1998 Coverage (%) | 39.3 | 69.3 76% | 37.28 -5% | 40.56 3% | 69.5 77% | 40.11 2% |
| Response Times | -10% | 1% | -12% | -63% | 22% | |
| Response Time Grey 50% / Grey 80% * (ms) | 38.8 ? | 44 ? -13% | 41 ? -6% | 44 ? -13% | 67.2 ? -73% | 42 ? -8% |
| Response Time Black / White * (ms) | 27.2 ? | 29 ? -7% | 25 ? 8% | 30 ? -10% | 41.6 ? -53% | 13 ? 52% |
| PWM Frequency (Hz) | 60 ? | 357 ? | 2500 ? | 200 ? | ||
| Screen | 42% | 6% | 19% | 45% | -20% | |
| Brightness middle (cd/m²) | 253.9 | 381 50% | 233 -8% | 245 -4% | 496.4 96% | 215 -15% |
| Brightness (cd/m²) | 239 | 368 54% | 217 -9% | 235 -2% | 469 96% | 208 -13% |
| Brightness Distribution (%) | 84 | 84 0% | 88 5% | 71 -15% | 84 0% | 81 -4% |
| Black Level * (cd/m²) | 0.31 | 0.3 3% | 0.27 13% | 0.21 32% | 0.5 -61% | 0.4 -29% |
| Contrast (:1) | 819 | 1270 55% | 863 5% | 1167 42% | 993 21% | 538 -34% |
| Colorchecker dE 2000 * | 6.03 | 2.84 53% | 5.85 3% | 4.85 20% | 2.9 52% | 9.37 -55% |
| Colorchecker dE 2000 max. * | 24.7 | 6.5 74% | 11.51 53% | 8.99 64% | 5.26 79% | 15.84 36% |
| Colorchecker dE 2000 calibrated * | 4.52 | |||||
| Greyscale dE 2000 * | 5.9 | 4.02 32% | 4.87 17% | 2.64 55% | 3.9 34% | 10.52 -78% |
| Gamma | 2.25 98% | 2.42 91% | 2.47 89% | 2.18 101% | 2.066 106% | 2.45 90% |
| CCT | 5814 112% | 7430 87% | 6908 94% | 6161 106% | 7169 91% | 11214 58% |
| Color Space (Percent of AdobeRGB 1998) (%) | 39.3 | 56 42% | 34 -13% | 37 -6% | 63.9 63% | 37 -6% |
| Color Space (Percent of sRGB) (%) | 56.59 | 86 52% | 54 -5% | 57 1% | 98.2 74% | 58 2% |
| Media totale (Programma / Settaggio) | 36% /
42% | 1% /
3% | 3% /
11% | 20% /
37% | 1% /
-10% |
* ... Meglio usare valori piccoli
Tempi di risposta del Display
| ↔ Tempi di risposta dal Nero al Bianco | ||
|---|---|---|
| 27.2 ms ... aumenta ↗ e diminuisce ↘ combinato | ↗ 14 ms Incremento | 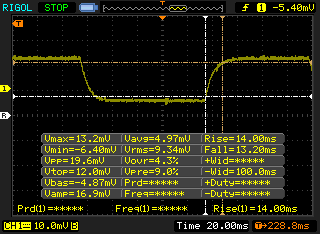 |
| ↘ 13.2 ms Calo | ||
| Lo schermo mostra tempi di risposta relativamente lenti nei nostri tests e potrebbe essere troppo lento per i gamers. In confronto, tutti i dispositivi di test variano da 0.1 (minimo) a 240 (massimo) ms. » 69 % di tutti i dispositivi è migliore. Questo significa che i tempi di risposta rilevati sono peggiori rispetto alla media di tutti i dispositivi testati (19.9 ms). | ||
| ↔ Tempo di risposta dal 50% Grigio all'80% Grigio | ||
| 38.8 ms ... aumenta ↗ e diminuisce ↘ combinato | ↗ 20 ms Incremento | 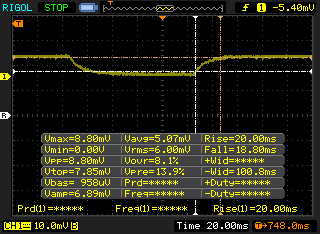 |
| ↘ 18.8 ms Calo | ||
| Lo schermo mostra tempi di risposta lenti nei nostri tests e sarà insoddisfacente per i gamers. In confronto, tutti i dispositivi di test variano da 0.165 (minimo) a 636 (massimo) ms. » 58 % di tutti i dispositivi è migliore. Questo significa che i tempi di risposta rilevati sono peggiori rispetto alla media di tutti i dispositivi testati (31.1 ms). | ||
Sfarfallio dello schermo / PWM (Pulse-Width Modulation)
| flickering dello schermo / PWM non rilevato | 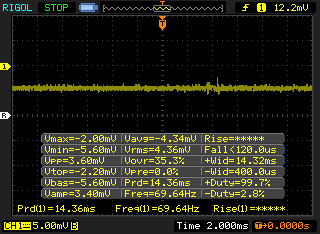 | ||
In confronto: 52 % di tutti i dispositivi testati non utilizza PWM per ridurre la luminosita' del display. Se è rilevato PWM, una media di 7794 (minimo: 5 - massimo: 343500) Hz è stata rilevata. | |||
| wPrime 2.10 - 1024m | |
| Dell Latitude 7480 | |
| Asus VivoBook S410UQ-NH74 | |
| Media Intel Core i7-8550U (258 - 435, n=11) | |
| Media della classe Multimedia (227 - 340, n=6, ultimi 2 anni) | |
| Dell XPS 13 9370 i5 UHD | |
* ... Meglio usare valori piccoli
| PCMark 8 Home Score Accelerated v2 | 3792 punti | |
| PCMark 8 Creative Score Accelerated v2 | 4871 punti | |
| PCMark 8 Work Score Accelerated v2 | 5054 punti | |
| PCMark 10 Score | 3433 punti | |
Aiuto | ||
| Asus VivoBook S410UQ-NH74 Micron 1100 MTFDDAV256TBN | Acer Swift 3 SF314-52G-89SL Intel SSD 600p SSDPEKKW512G7 | Lenovo IdeaPad 320s-14IKB Liteonit CV3-DE256 | HP Spectre 13-af033ng Samsung PM961 NVMe MZVLW512HMJP | Asus Zenbook UX3410UQ-GV077T SanDisk SD8SNAT256G1002 | Dell Latitude 7480 Intel SSDSCKKF256H6 | Media Micron 1100 MTFDDAV256TBN | |
|---|---|---|---|---|---|---|---|
| CrystalDiskMark 3.0 | 56% | -5% | 88% | -15% | 3% | -8% | |
| Write 4k QD32 (MB/s) | 295.6 | 496.2 68% | 238.7 -19% | 476 61% | 257.2 -13% | 252.8 -14% | 233 ? -21% |
| Read 4k QD32 (MB/s) | 248 | 462.6 87% | 334.8 35% | 543 119% | 147 -41% | 280.2 13% | 227 ? -8% |
| Write 4k (MB/s) | 101.9 | 133.6 31% | 61.6 -40% | 144 41% | 79.5 -22% | 90.5 -11% | 80.8 ? -21% |
| Read 4k (MB/s) | 28.01 | 13.98 -50% | 25.9 -8% | 60 114% | 22.78 -19% | 29.25 4% | 24.6 ? -12% |
| Write 512 (MB/s) | 352.3 | 483.3 37% | 258 -27% | 546 55% | 288 -18% | 306.8 -13% | 315 ? -11% |
| Read 512 (MB/s) | 259.4 | 616 137% | 272.8 5% | 515 99% | 289 11% | 354.3 37% | 315 ? 21% |
| Write Seq (MB/s) | 389.2 | 552 42% | 417.8 7% | 878 126% | 323.7 -17% | 418.6 8% | 379 ? -3% |
| Read Seq (MB/s) | 490.2 | 944 93% | 511 4% | 907 85% | 497 1% | 486.5 -1% | 465 ? -5% |

| 3DMark 11 Performance | 2844 punti | |
| 3DMark Ice Storm Standard Score | 43801 punti | |
| 3DMark Cloud Gate Standard Score | 9025 punti | |
| 3DMark Fire Strike Score | 1917 punti | |
| 3DMark Fire Strike Extreme Score | 940 punti | |
Aiuto | ||
| Tomb Raider | |
| 1920x1080 Ultra Preset AA:FX AF:16x (ordina per valore) | |
| Asus VivoBook S410UQ-NH74 | |
| Dell Latitude 7480 | |
| Acer Swift 3 SF315-41-R4W1 | |
| Media NVIDIA GeForce 940MX (18.3 - 29.4, n=7) | |
| 1366x768 High Preset AA:FX AF:8x (ordina per valore) | |
| Asus VivoBook S410UQ-NH74 | |
| Dell Latitude 7480 | |
| Acer Swift 3 SF315-41-R4W1 | |
| Media NVIDIA GeForce 940MX (34.5 - 62.6, n=8) | |
| 1366x768 Normal Preset AA:FX AF:4x (ordina per valore) | |
| Asus VivoBook S410UQ-NH74 | |
| Dell Latitude 7480 | |
| Acer Swift 3 SF315-41-R4W1 | |
| Media NVIDIA GeForce 940MX (58.6 - 96.4, n=7) | |
| 1024x768 Low Preset (ordina per valore) | |
| Asus VivoBook S410UQ-NH74 | |
| Dell Latitude 7480 | |
| Acer Swift 3 SF315-41-R4W1 | |
| Media NVIDIA GeForce 940MX (132.9 - 184.4, n=7) | |
| Rise of the Tomb Raider | |
| 1920x1080 Very High Preset AA:FX AF:16x (ordina per valore) | |
| Asus VivoBook S410UQ-NH74 | |
| Media NVIDIA GeForce 940MX (8.2 - 13.8, n=10) | |
| 1920x1080 High Preset AA:FX AF:4x (ordina per valore) | |
| Asus VivoBook S410UQ-NH74 | |
| HP Spectre 13-af033ng | |
| Acer Swift 3 SF315-41-R4W1 | |
| Media NVIDIA GeForce 940MX (10.4 - 17, n=17) | |
| 1366x768 Medium Preset AF:2x (ordina per valore) | |
| Asus VivoBook S410UQ-NH74 | |
| HP Spectre 13-af033ng | |
| Media NVIDIA GeForce 940MX (13.4 - 30.6, n=20) | |
| 1024x768 Lowest Preset (ordina per valore) | |
| Asus VivoBook S410UQ-NH74 | |
| HP Spectre 13-af033ng | |
| Acer Swift 3 SF315-41-R4W1 | |
| Media NVIDIA GeForce 940MX (26.9 - 52.8, n=20) | |
| basso | medio | alto | ultra | |
|---|---|---|---|---|
| Tomb Raider (2013) | 157.9 | 77 | 48.1 | 23.7 |
| BioShock Infinite (2013) | 108.4 | 63.1 | 53.2 | 19.8 |
| The Witcher 3 (2015) | 23 | |||
| Rise of the Tomb Raider (2016) | 44.8 | 26.5 | 14.5 | 11.3 |
Rumorosità
| Idle |
| 28.3 / 28.3 / 29.8 dB(A) |
| Sotto carico |
| 39 / 42.6 dB(A) |
 | ||
30 dB silenzioso 40 dB(A) udibile 50 dB(A) rumoroso |
||
min: | ||
| Asus VivoBook S410UQ-NH74 GeForce 940MX, i5-8550U, Micron 1100 MTFDDAV256TBN | Acer Swift 3 SF314-52G-89SL GeForce MX150, i5-8550U, Intel SSD 600p SSDPEKKW512G7 | Asus ZenBook 13 UX331UN GeForce MX150, i5-8550U, SanDisk SD8SN8U512G1002 | Lenovo IdeaPad 320s-14IKB GeForce 920MX, i5-7200U, Liteonit CV3-DE256 | Dell Latitude 7480 HD Graphics 620, i7-7600U, Intel SSDSCKKF256H6 | HP Spectre 13-af033ng UHD Graphics 620, i5-8550U, Samsung PM961 NVMe MZVLW512HMJP | Dell XPS 13 9370 i5 UHD UHD Graphics 620, i5-8250U, Toshiba XG5 KXG50ZNV256G | Asus VivoBook S14 S406UA-BV023T UHD Graphics 620, i5-8250U, SanDisk SD8SN8U256G1002 | Acer Swift 3 SF315-41-R4W1 Vega 8, R5 2500U, Intel SSD 600p SSDPEKKW256G7 | |
|---|---|---|---|---|---|---|---|---|---|
| Noise | 2% | -4% | -1% | 10% | 4% | 4% | -4% | -2% | |
| off /ambiente * (dB) | 28.3 | 30.5 -8% | 29.6 -5% | 30.13 -6% | 30.13 -6% | 29 -2% | 30.2 -7% | 31.8 -12% | |
| Idle Minimum * (dB) | 28.3 | 30.5 -8% | 29.6 -5% | 30.8 -9% | 28.6 -1% | 30.13 -6% | 29 -2% | 30.2 -7% | 31.8 -12% |
| Idle Average * (dB) | 28.3 | 30.5 -8% | 29.6 -5% | 30.8 -9% | 28.6 -1% | 30.13 -6% | 29 -2% | 30.2 -7% | 32.1 -13% |
| Idle Maximum * (dB) | 29.8 | 30.9 -4% | 29.6 1% | 30.8 -3% | 28.6 4% | 30.13 -1% | 29 3% | 31.3 -5% | 32.1 -8% |
| Load Average * (dB) | 39 | 35.6 9% | 41.7 -7% | 35.5 9% | 30.2 23% | 31.5 19% | 32 18% | 40.1 -3% | 33 15% |
| Witcher 3 ultra * (dB) | 40.6 | 35.1 14% | 43.5 -7% | ||||||
| Load Maximum * (dB) | 42.6 | 35.6 16% | 43.5 -2% | 36.2 15% | 31.2 27% | 33.5 21% | 40.1 6% | 40.4 5% | 34.8 18% |
* ... Meglio usare valori piccoli
(+) La temperatura massima sul lato superiore è di 39 °C / 102 F, rispetto alla media di 36.8 °C / 98 F, che varia da 21 a 71 °C per questa classe Multimedia.
(-) Il lato inferiore si riscalda fino ad un massimo di 47 °C / 117 F, rispetto alla media di 39.1 °C / 102 F
(+) In idle, la temperatura media del lato superiore è di 25.8 °C / 78 F, rispetto alla media deld ispositivo di 31.3 °C / 88 F.
(+) Riproducendo The Witcher 3, la temperatura media per il lato superiore e' di 27.9 °C / 82 F, rispetto alla media del dispositivo di 31.3 °C / 88 F.
(+) I poggiapolsi e il touchpad sono piu' freddi della temperatura della pelle con un massimo di 29.6 °C / 85.3 F e sono quindi freddi al tatto.
(±) La temperatura media della zona del palmo della mano di dispositivi simili e'stata di 28.7 °C / 83.7 F (-0.9 °C / -1.6 F).
Asus VivoBook S410UQ-NH74 analisi audio
(-) | altoparlanti non molto potenti (59.9 dB)
Bassi 100 - 315 Hz
(-) | quasi nessun basso - in media 15.6% inferiori alla media
(±) | la linearità dei bassi è media (13.5% delta rispetto alla precedente frequenza)
Medi 400 - 2000 Hz
(±) | medi ridotti - circa 5.2% inferiori alla media
(±) | linearità dei medi adeguata (8.3% delta rispetto alla precedente frequenza)
Alti 2 - 16 kHz
(+) | Alti bilanciati - appena 2.9% dalla media
(±) | la linearità degli alti è media (9.9% delta rispetto alla precedente frequenza)
Nel complesso 100 - 16.000 Hz
(±) | la linearità complessiva del suono è media (26.3% di differenza rispetto alla media
Rispetto alla stessa classe
» 92% di tutti i dispositivi testati in questa classe è stato migliore, 1% simile, 6% peggiore
» Il migliore ha avuto un delta di 5%, medio di 17%, peggiore di 45%
Rispetto a tutti i dispositivi testati
» 81% di tutti i dispositivi testati in questa classe è stato migliore, 4% similare, 15% peggiore
» Il migliore ha avuto un delta di 4%, medio di 24%, peggiore di 134%
Apple MacBook 12 (Early 2016) 1.1 GHz analisi audio
(+) | gli altoparlanti sono relativamente potenti (83.6 dB)
Bassi 100 - 315 Hz
(±) | bassi ridotti - in media 11.3% inferiori alla media
(±) | la linearità dei bassi è media (14.2% delta rispetto alla precedente frequenza)
Medi 400 - 2000 Hz
(+) | medi bilanciati - solo only 2.4% rispetto alla media
(+) | medi lineari (5.5% delta rispetto alla precedente frequenza)
Alti 2 - 16 kHz
(+) | Alti bilanciati - appena 2% dalla media
(+) | alti lineari (4.5% delta rispetto alla precedente frequenza)
Nel complesso 100 - 16.000 Hz
(+) | suono nel complesso lineare (10.2% differenza dalla media)
Rispetto alla stessa classe
» 7% di tutti i dispositivi testati in questa classe è stato migliore, 2% simile, 91% peggiore
» Il migliore ha avuto un delta di 5%, medio di 18%, peggiore di 53%
Rispetto a tutti i dispositivi testati
» 5% di tutti i dispositivi testati in questa classe è stato migliore, 1% similare, 94% peggiore
» Il migliore ha avuto un delta di 4%, medio di 24%, peggiore di 134%
| Off / Standby | |
| Idle | |
| Sotto carico |
|
Leggenda:
min: | |
| Asus VivoBook S410UQ-NH74 i5-8550U, GeForce 940MX, Micron 1100 MTFDDAV256TBN, IPS, 1920x1080, 14" | Acer Swift 3 SF314-52G-89SL i5-8550U, GeForce MX150, Intel SSD 600p SSDPEKKW512G7, IPS, 1920x1080, 14" | Lenovo IdeaPad 320s-14IKB i5-7200U, GeForce 920MX, Liteonit CV3-DE256, IPS, 1920x1080, 14" | HP Spectre 13-af033ng i5-8550U, UHD Graphics 620, Samsung PM961 NVMe MZVLW512HMJP, IPS, 1920x1080, 13.3" | Dell XPS 13 9370 i5 UHD i5-8250U, UHD Graphics 620, Toshiba XG5 KXG50ZNV256G, IPS, 3840x2160, 13.3" | Asus VivoBook S14 S406UA-BV023T i5-8250U, UHD Graphics 620, SanDisk SD8SN8U256G1002, TN LED, 1366x768, 14" | Acer Swift 3 SF315-41-R4W1 R5 2500U, Vega 8, Intel SSD 600p SSDPEKKW256G7, IPS, 1920x1080, 15.6" | |
|---|---|---|---|---|---|---|---|
| Power Consumption | -14% | 12% | 7% | -14% | 9% | -47% | |
| Idle Minimum * (Watt) | 3.5 | 4.4 -26% | 3.2 9% | 2.8 20% | 4.3 -23% | 3.7 -6% | 7.3 -109% |
| Idle Average * (Watt) | 5.65 | 6.6 -17% | 5.9 -4% | 6.2 -10% | 8 -42% | 5.6 1% | 9.7 -72% |
| Idle Maximum * (Watt) | 6.5 | 9.2 -42% | 6.7 -3% | 9.4 -45% | 8.1 -25% | 7.6 -17% | 13 -100% |
| Load Average * (Watt) | 52.3 | 61 -17% | 36.7 30% | 32.2 38% | 46.6 11% | 37.4 28% | 40.4 23% |
| Witcher 3 ultra * (Watt) | 46.2 | 40 13% | |||||
| Load Maximum * (Watt) | 54.5 | 50 8% | 39 28% | 36.6 33% | 49.8 9% | 33 39% | 42.2 23% |
* ... Meglio usare valori piccoli
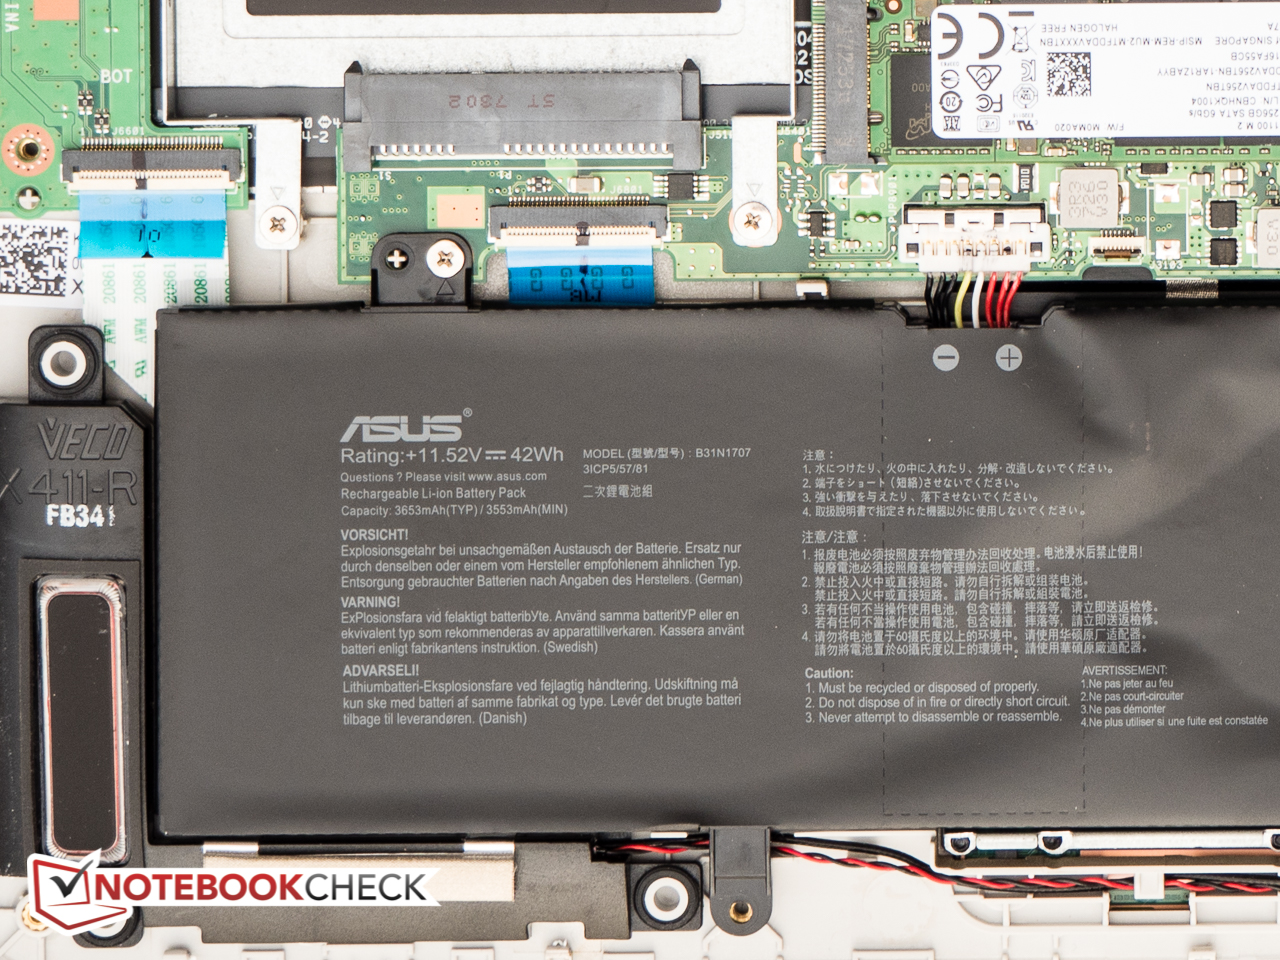
| Asus VivoBook S410UQ-NH74 i5-8550U, GeForce 940MX, 42 Wh | Acer Swift 3 SF314-52G-89SL i5-8550U, GeForce MX150, 48 Wh | Asus ZenBook 13 UX331UN i5-8550U, GeForce MX150, 50 Wh | Lenovo IdeaPad 320s-14IKB i5-7200U, GeForce 920MX, 52.5 Wh | Dell Latitude 7480 i7-7600U, HD Graphics 620, 60 Wh | HP Spectre 13-af033ng i5-8550U, UHD Graphics 620, 43 Wh | Dell XPS 13 9370 i5 UHD i5-8250U, UHD Graphics 620, 52 Wh | Asus VivoBook S14 S406UA-BV023T i5-8250U, UHD Graphics 620, 39 Wh | Acer Swift 3 SF315-41-R4W1 R5 2500U, Vega 8, 48 Wh | |
|---|---|---|---|---|---|---|---|---|---|
| Autonomia della batteria | -4% | 35% | 9% | 84% | -11% | 4% | -2% | -17% | |
| Reader / Idle (h) | 12.5 | 22 76% | 27.7 122% | 14.5 16% | 12.2 -2% | ||||
| WiFi v1.3 (h) | 8.1 | 7.8 -4% | 8.4 4% | 8.8 9% | 12 48% | 5.9 -27% | 6.8 -16% | 7.9 -2% | 5.2 -36% |
| Load (h) | 1.6 | 2 25% | 2.9 81% | 1.7 6% | 1.8 13% | 1.4 -13% |
Pro
Contro
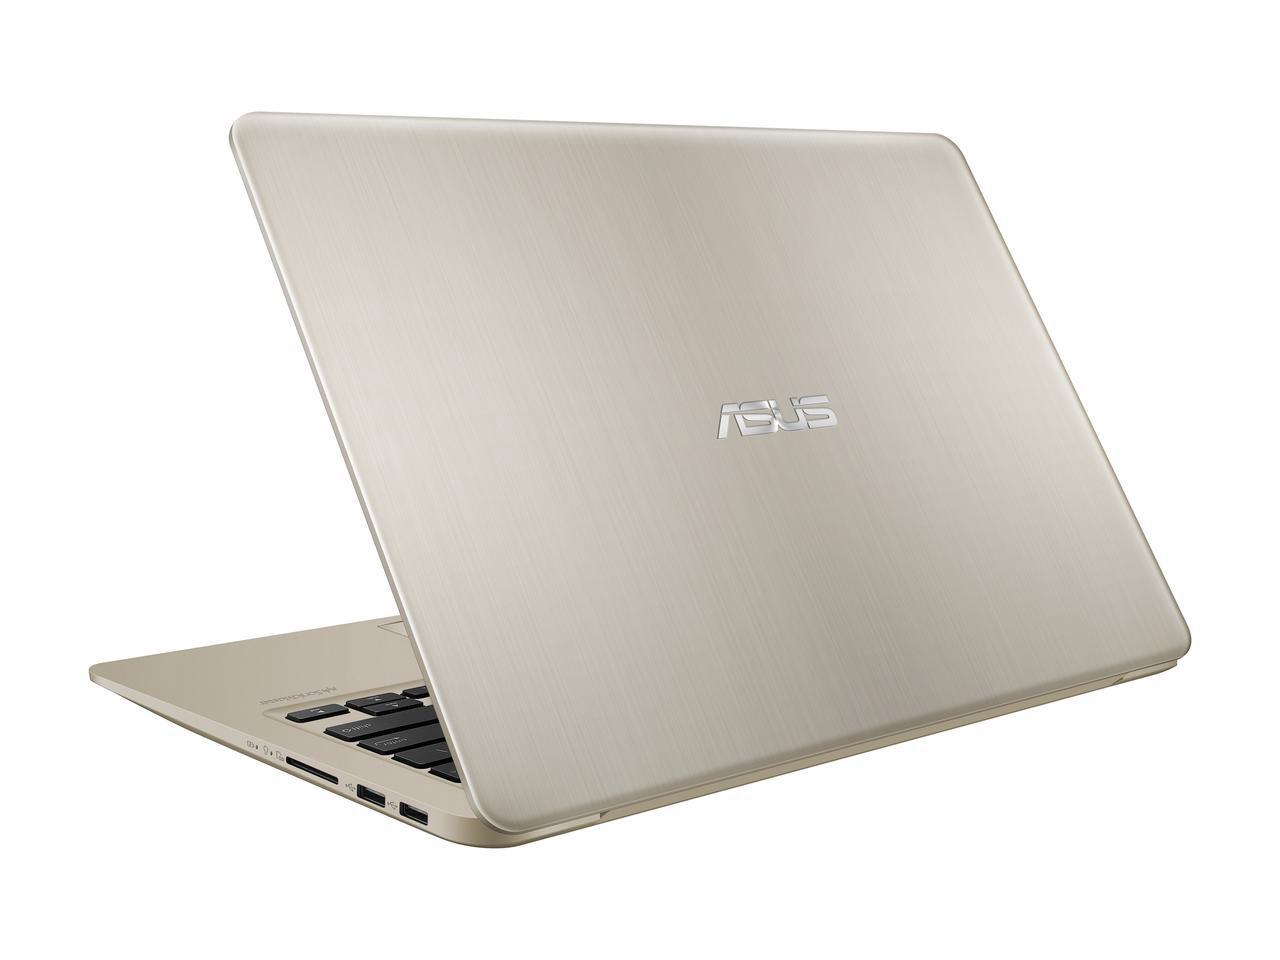

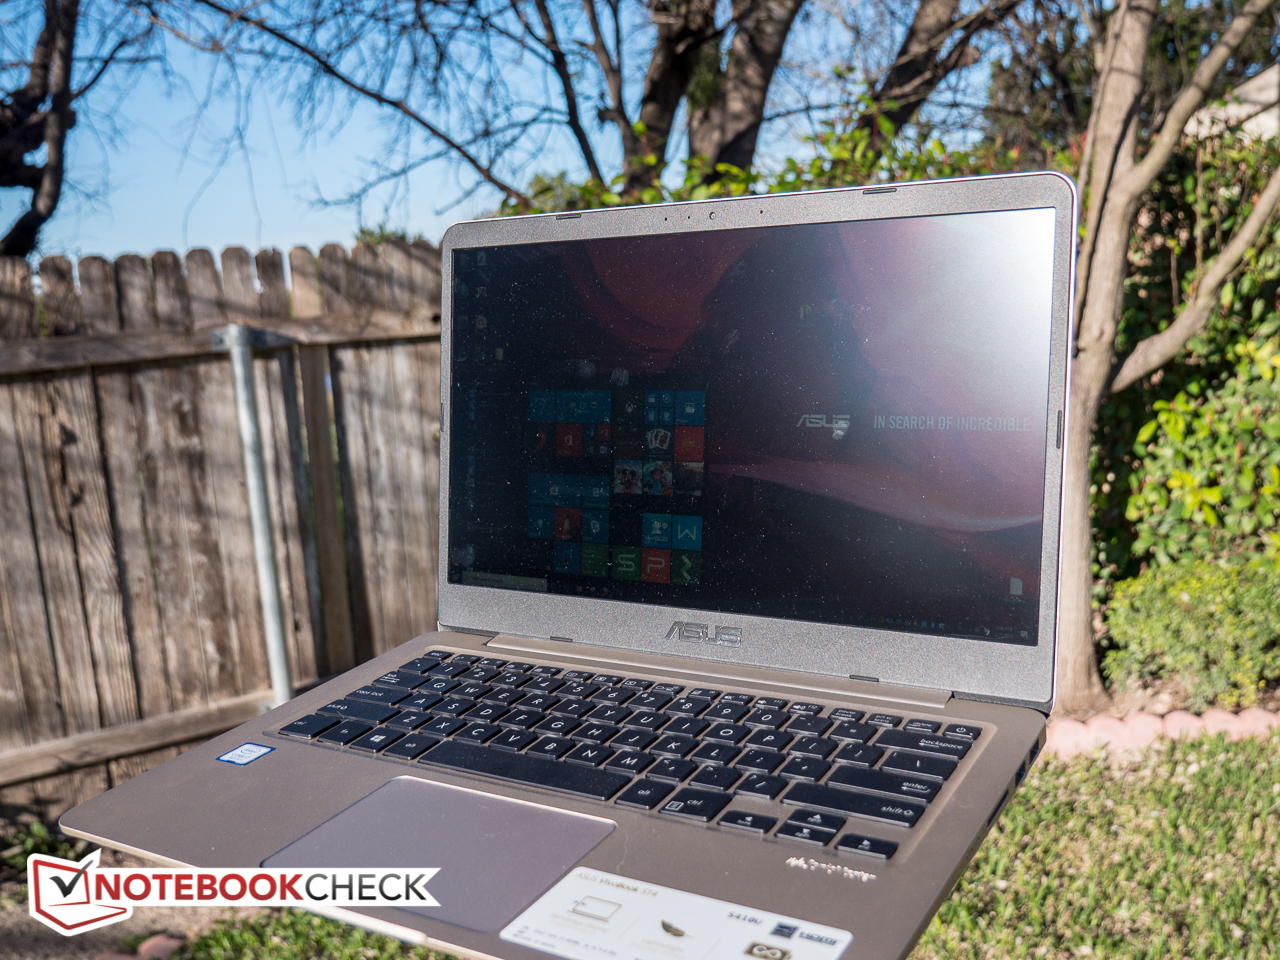
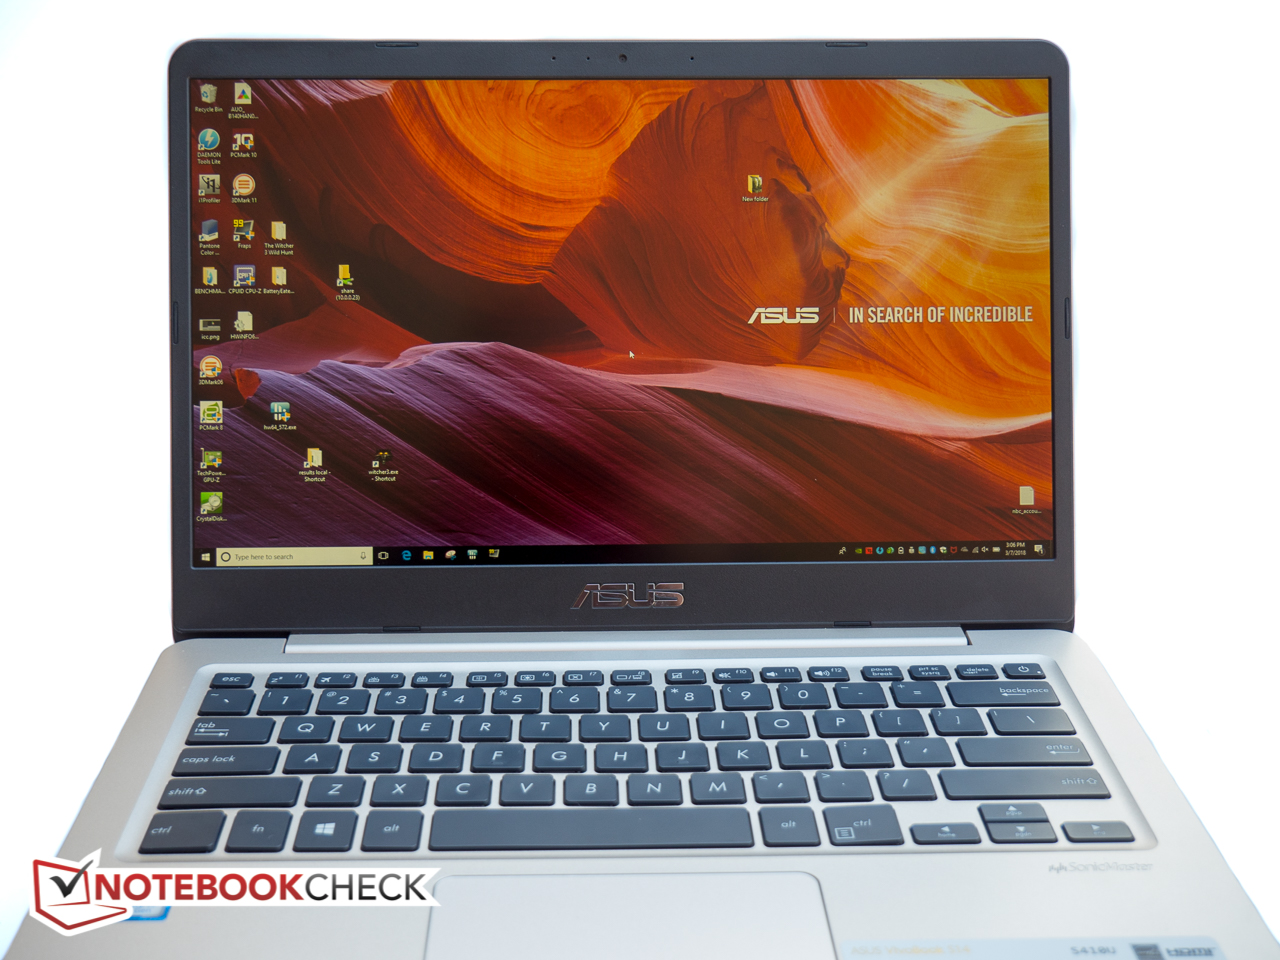
Il VivoBook S14 S410UQ-NH74 usa un display Full HD da 14" su uno chassis da 13.3". Sfortunatamente, il display non è particolarmente luminoso e presenta una scarsa accuratezza del colore e una copertura media degli spazi colore professionali. Nondimeno: il display IPS è senza dubbio un degno upgrade rispetto al display HD TN del VivoBook S14 S406UA. Sebbene il notebook abbia sicuramente un aspetto carino con il suo elegante design in metallo e plastica, la tastiera si flette troppo anche se si applicano solo moderate quantità di pressione. Di conseguenza, l'esperienza di digitazione non è così piacevole come potrebbe essere. Le prestazioni del sistema sono decenti, ma abbiamo riscontrato un forte throttling sotto carico massimo, poiché il singolo dissipatore e la singola ventola non sono in grado di reggere il calore generato. Abbiamo anche messo in dubbio la decisione di Asus di associare una CPU i7 di ottava generazione con una scheda grafica entry-level obsoleta. Molti modelli concorrenti incorporano già la più potente GeForce MX150.
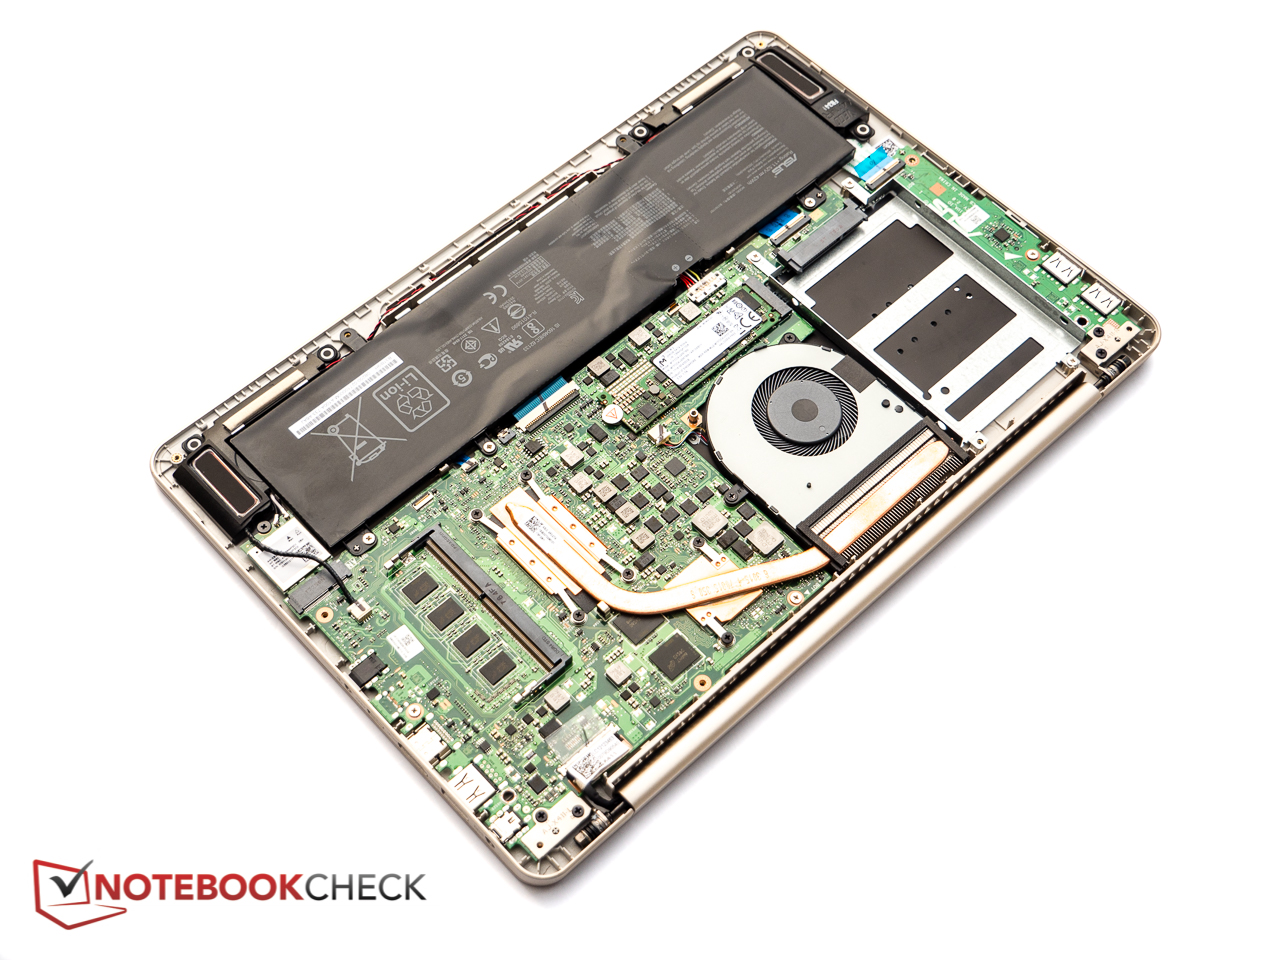
Tuttavia, il notebook rimane discreto con carichi di lavoro più leggeri e la batteria può durare tutto il giorno con un'attenta gestione della batteria. Apprezziamo anche il design sottile e leggero e il fatto che l'S14 sia dotato di un alloggiamento per disco rigido da 2,5 pollici vuoto e del corrispondente connettore SATA 3. Gli utenti che richiedono più spazio possono espandere in modo semplice ed economico lo spazio di archiviazione senza dover ricorrere a unità esterne.
A causa della notevole flessibilità della tastiera, il VivoBook S14 potrebbe non essere uno dei contendenti più forti nel segmento multimediale, ma resta una scelta decente per gli utenti che possono accettare le carenze citate.
Nota: si tratta di una recensione breve, con alcune sezioni non tradotte, per la versione integrale in inglese guardate qui.
Asus VivoBook S410UQ-NH74
- 03/10/2018 v6 (old)
Bernie Pechlaner
Price comparison
