

Recensione del Medion Erazer Beast X40: Notebook per il gaming con RTX 4090
Anche se rientra nella categoria dei portatili da gioco, l'Erazer Beast X40 è concepito anche per altri scenari di utilizzo molto impegnativi. Le prestazioni di calcolo necessarie sono fornite da una CPU Raptor Lake e da una GPU Ada Lovelace. Rispetto ai suoi predecessori Recensione del Medion Erazer Beast X30: gaming Notebook QHD sottile e potente , il laptop ha ricevuto un'importante revisione: Medion gli ha dato un nuovo formato dello schermo (16:10 invece di 16:9), un sistema di raffreddamento ad acqua opzionale e una tastiera meccanica.
L'X40 è basato su un barebone Tongfang (GM7PX9N) che è in gran parte identico a quello utilizzato per l' XMG Neo 17. È in competizione con prodotti del calibro di MSI Titan GT77 HX 13VI, Alienware x17 R2 P48E, Razer Blade 16 (inizio 2023)e Asus ROG Strix Scar 18 2023 G834JY.
Potenziali concorrenti a confronto
Punteggio | Data | Modello | Peso | Altezza | Dimensione | Risoluzione | Prezzo |
|---|---|---|---|---|---|---|---|
| 88.4 % v7 (old) | 03/2023 | Medion Erazer Beast X40 i9-13900HX, NVIDIA GeForce RTX 4090 Laptop GPU | 2.9 kg | 33 mm | 17.00" | 2560x1600 | |
| 89 % v7 (old) | 02/2023 | MSI Titan GT77 HX 13VI i9-13950HX, NVIDIA GeForce RTX 4090 Laptop GPU | 3.5 kg | 23 mm | 17.30" | 3840x2160 | |
| 91.2 % v7 (old) | 02/2023 | Razer Blade 16 Early 2023 i9-13950HX, NVIDIA GeForce RTX 4080 Laptop GPU | 2.4 kg | 21.99 mm | 16.00" | 2560x1600 | |
| 87.6 % v7 (old) | 09/2022 | SCHENKER XMG Neo 17 M22 R9 6900HX, GeForce RTX 3080 Ti Laptop GPU | 2.8 kg | 27 mm | 17.00" | 2560x1600 | |
| 89.2 % v7 (old) | 05/2022 | Alienware x17 R2 P48E i9-12900HK, GeForce RTX 3080 Ti Laptop GPU | 3.1 kg | 20.9 mm | 17.30" | 1920x1080 | |
| 86.6 % v7 (old) | 02/2023 | Asus ROG Strix Scar 18 2023 G834JY-N6005W i9-13980HX, NVIDIA GeForce RTX 4090 Laptop GPU | 3.1 kg | 30.8 mm | 18.00" | 2560x1600 |
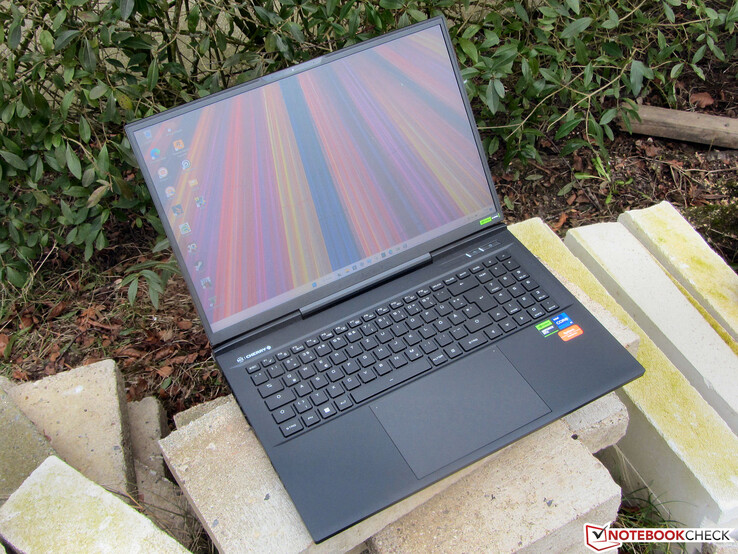
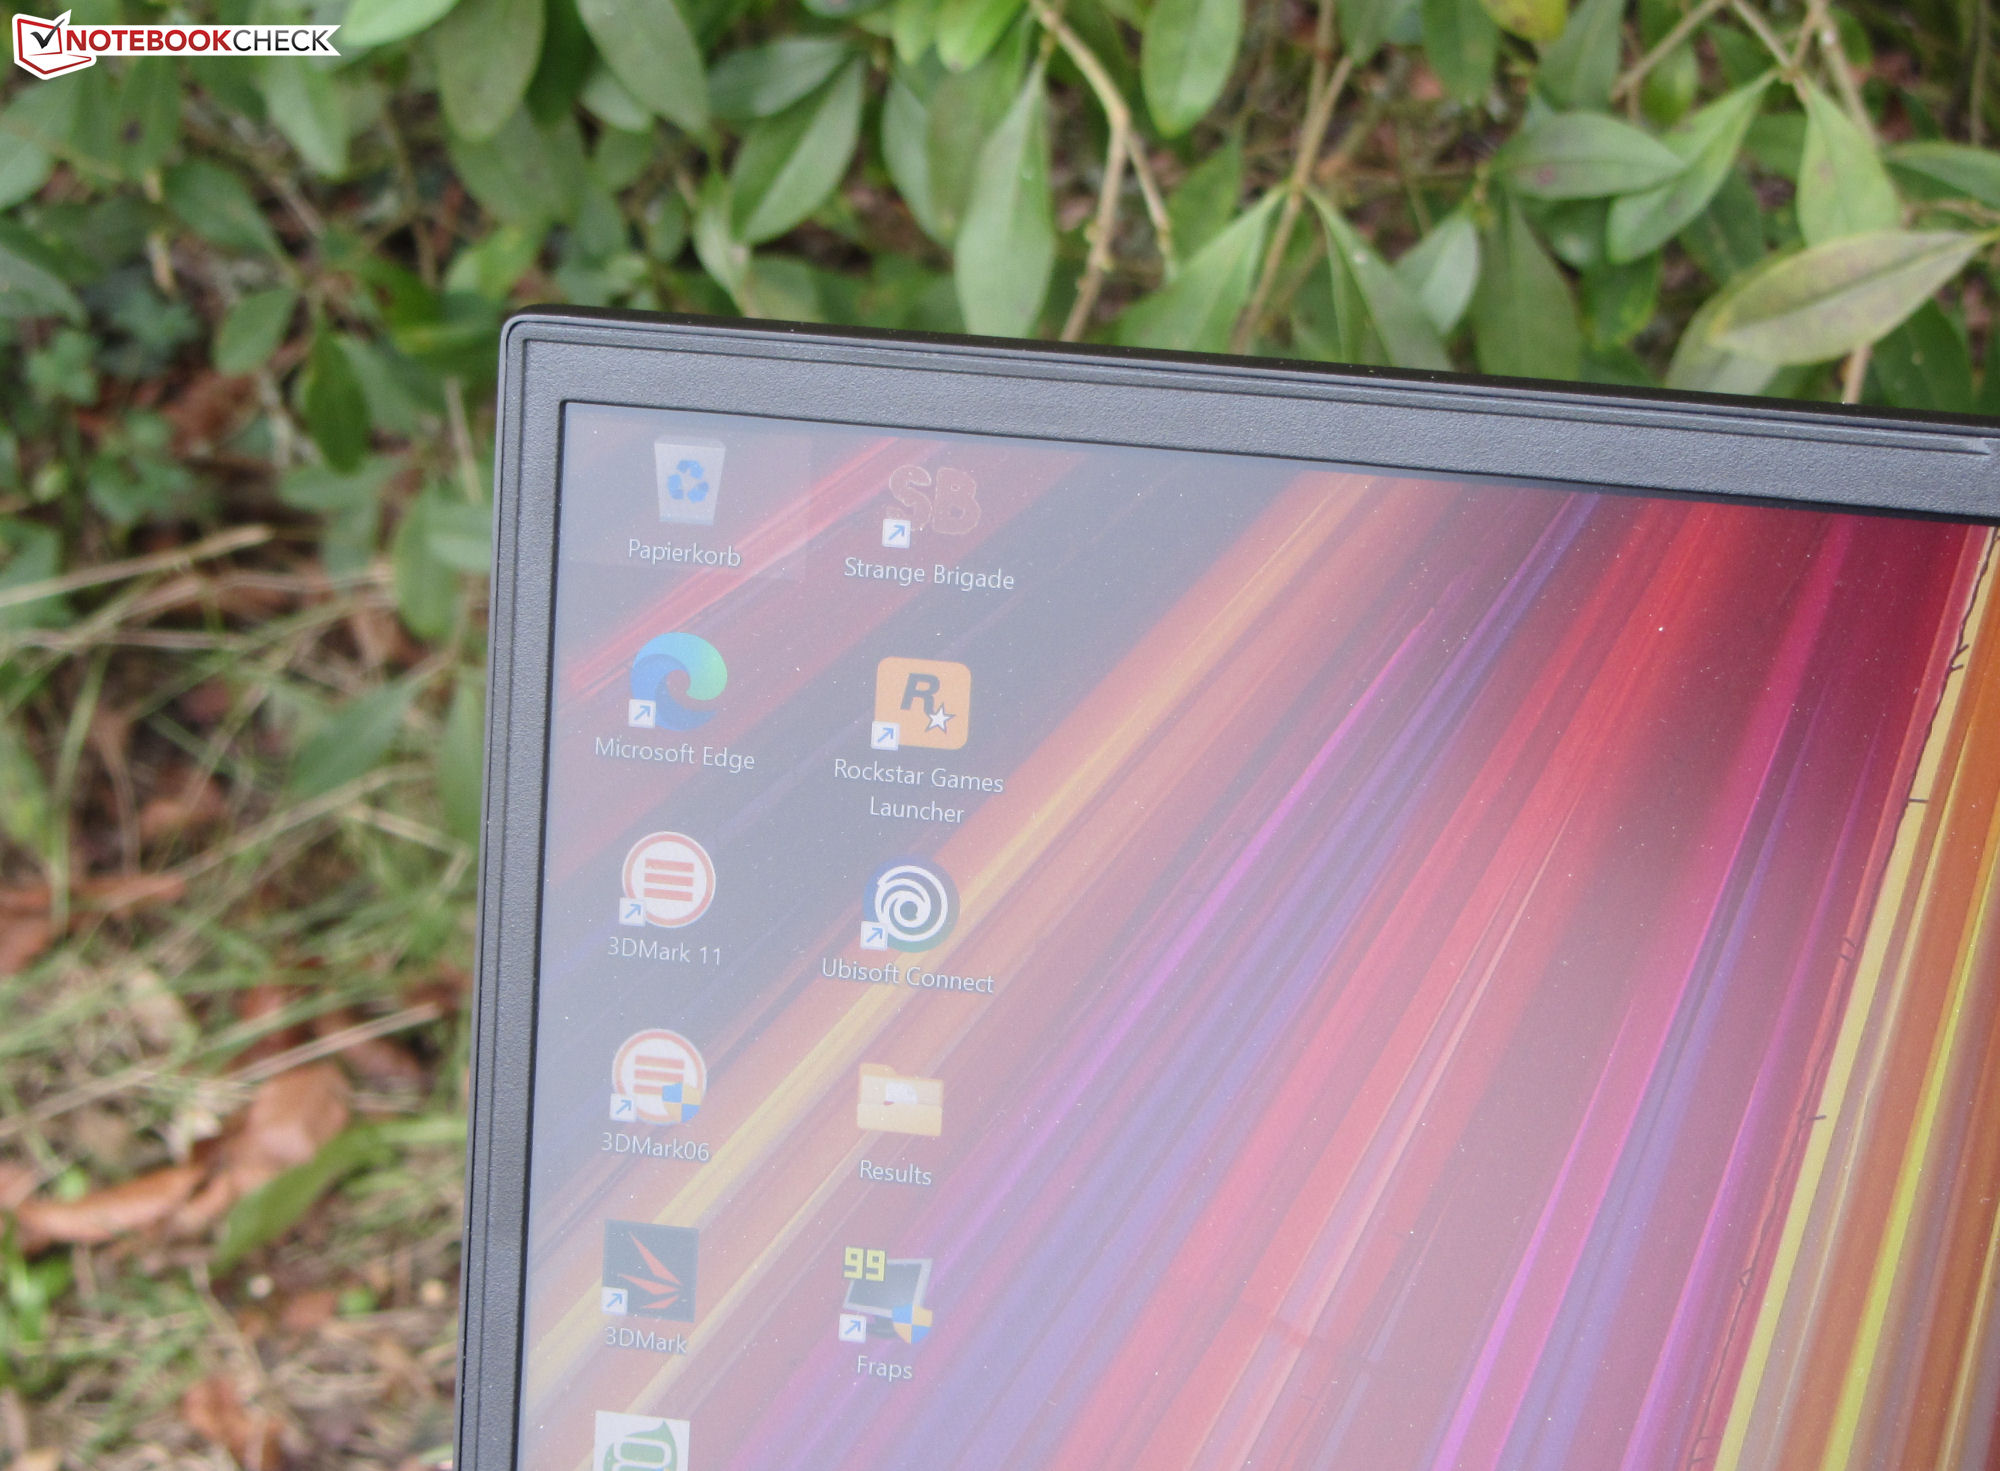
Case - L'Erazer ha uno chassis in metallo
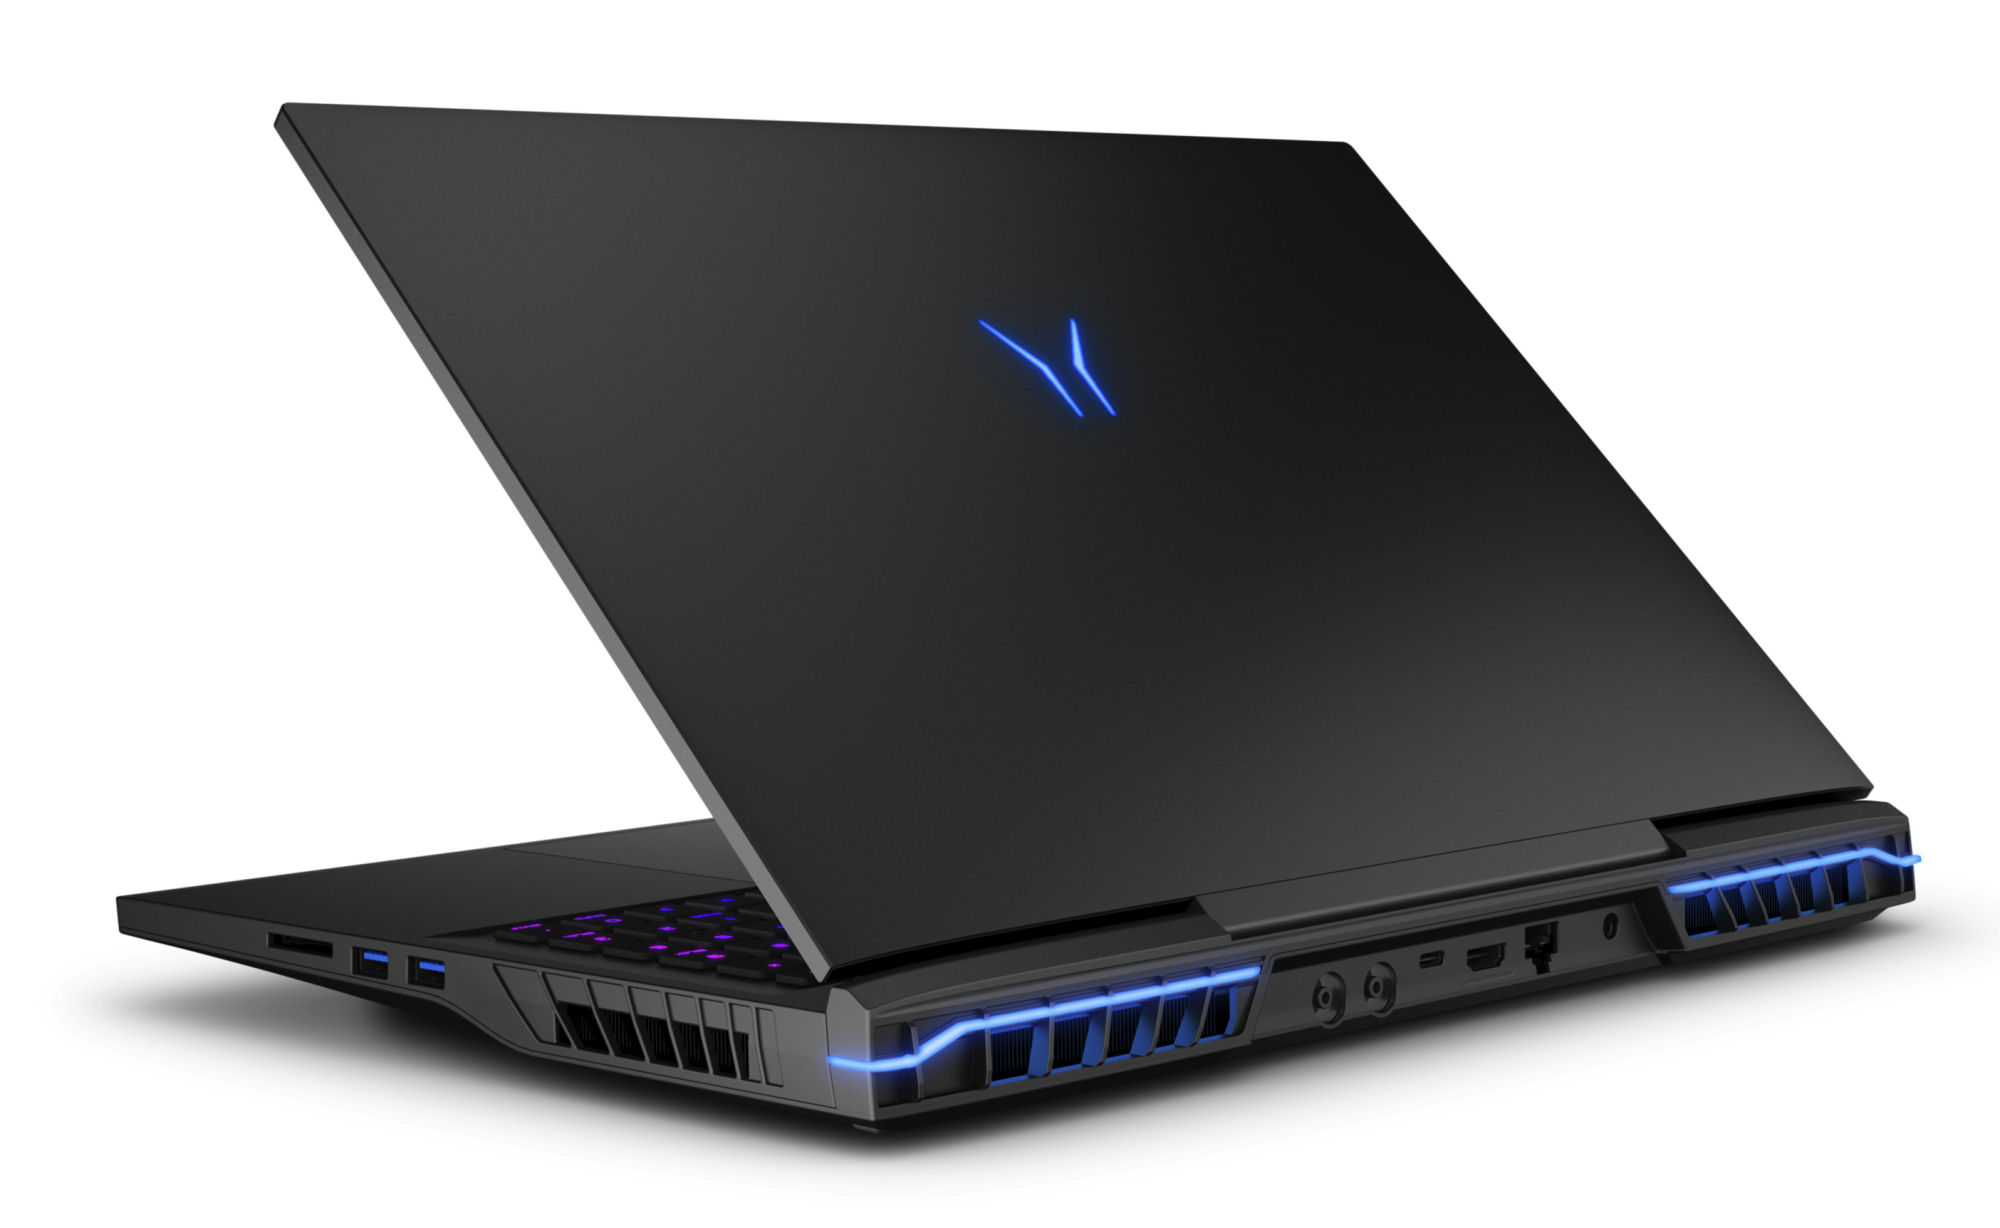
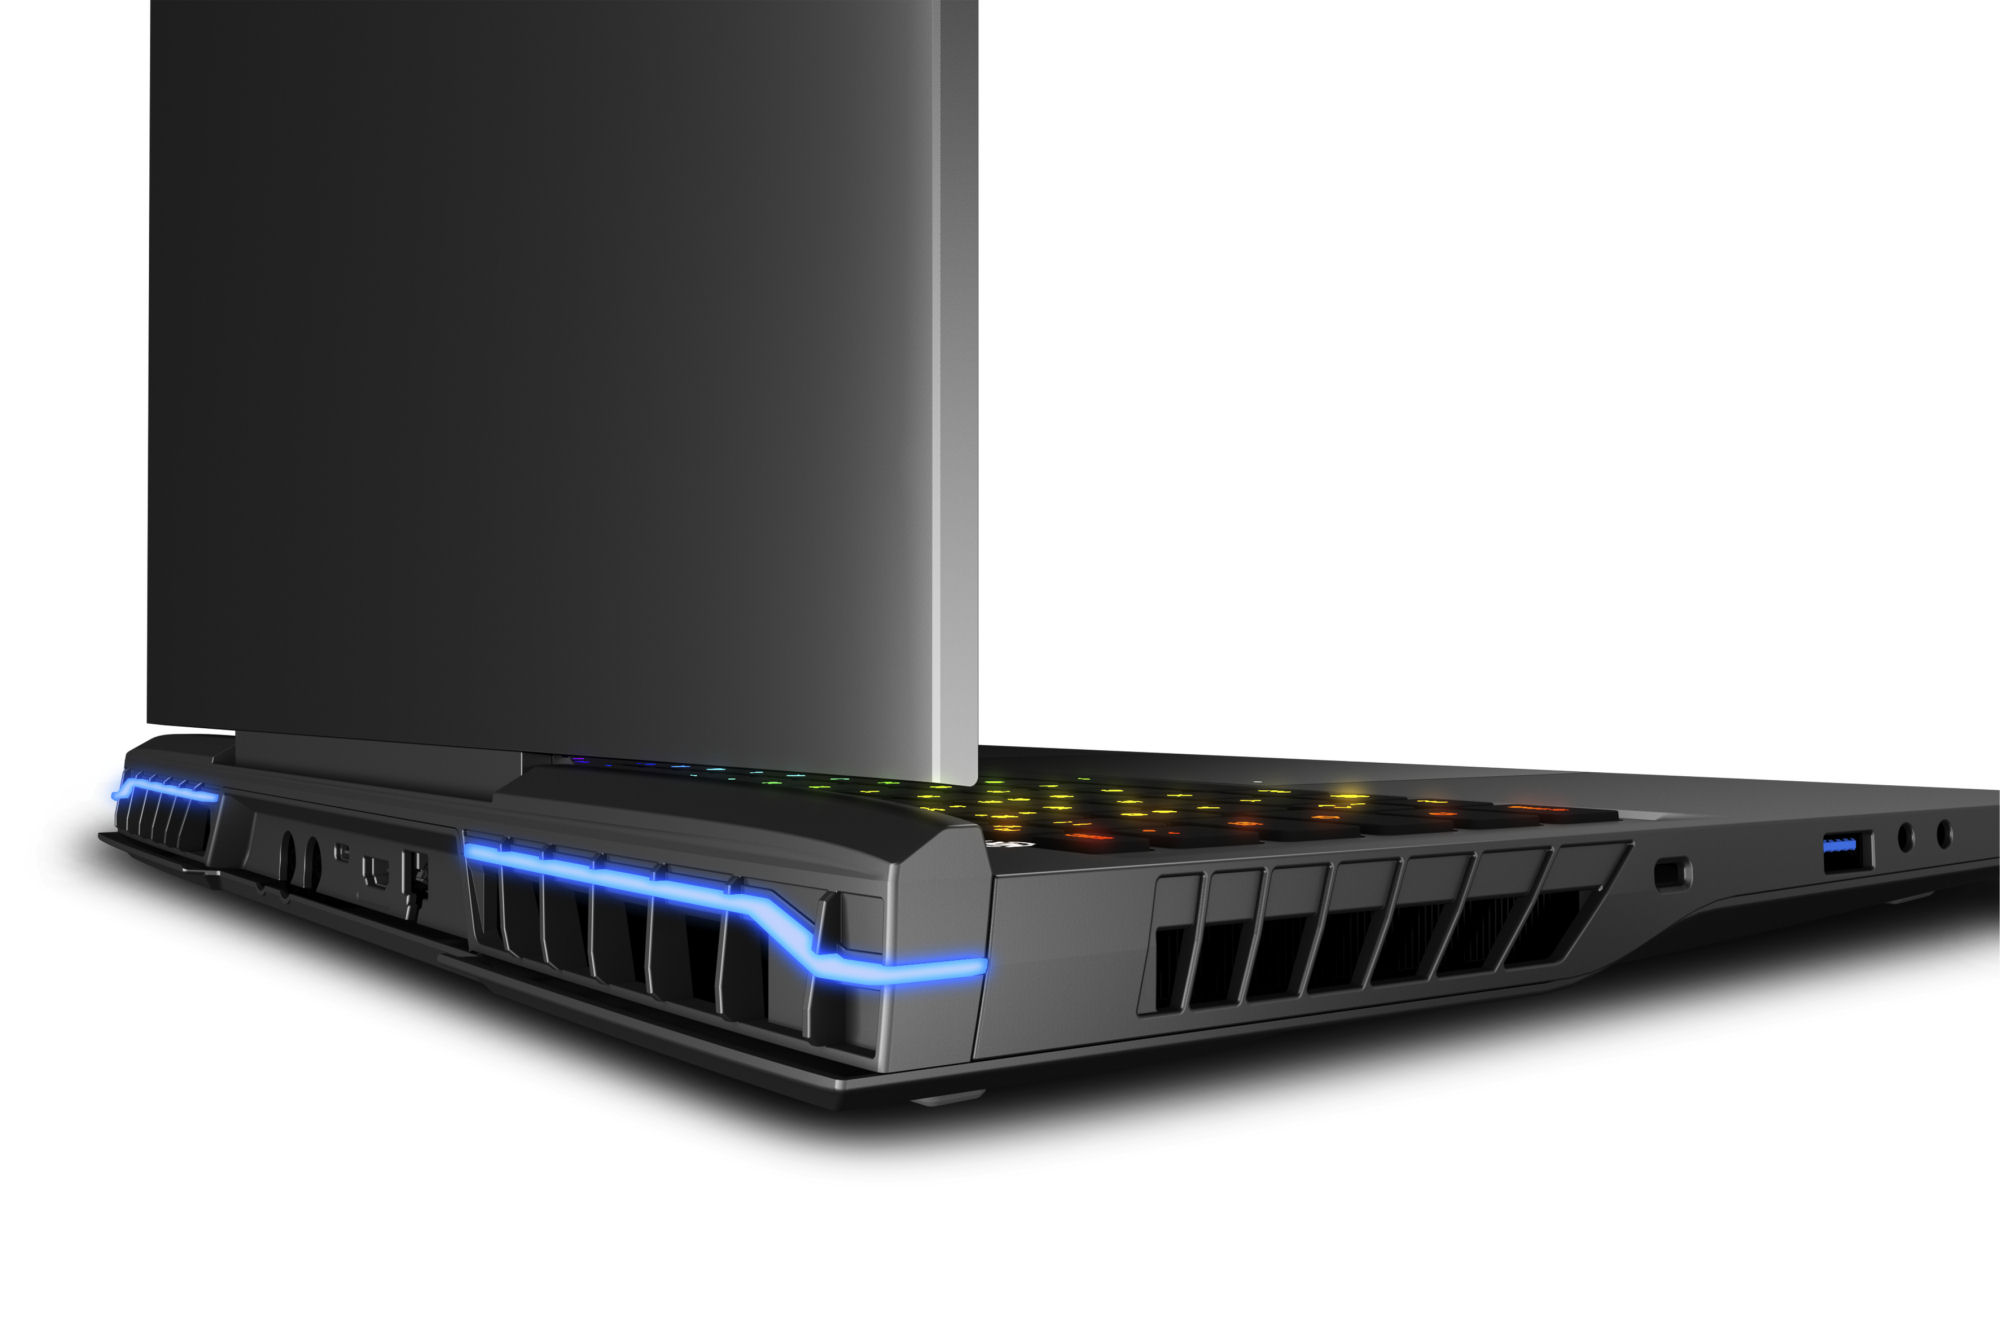
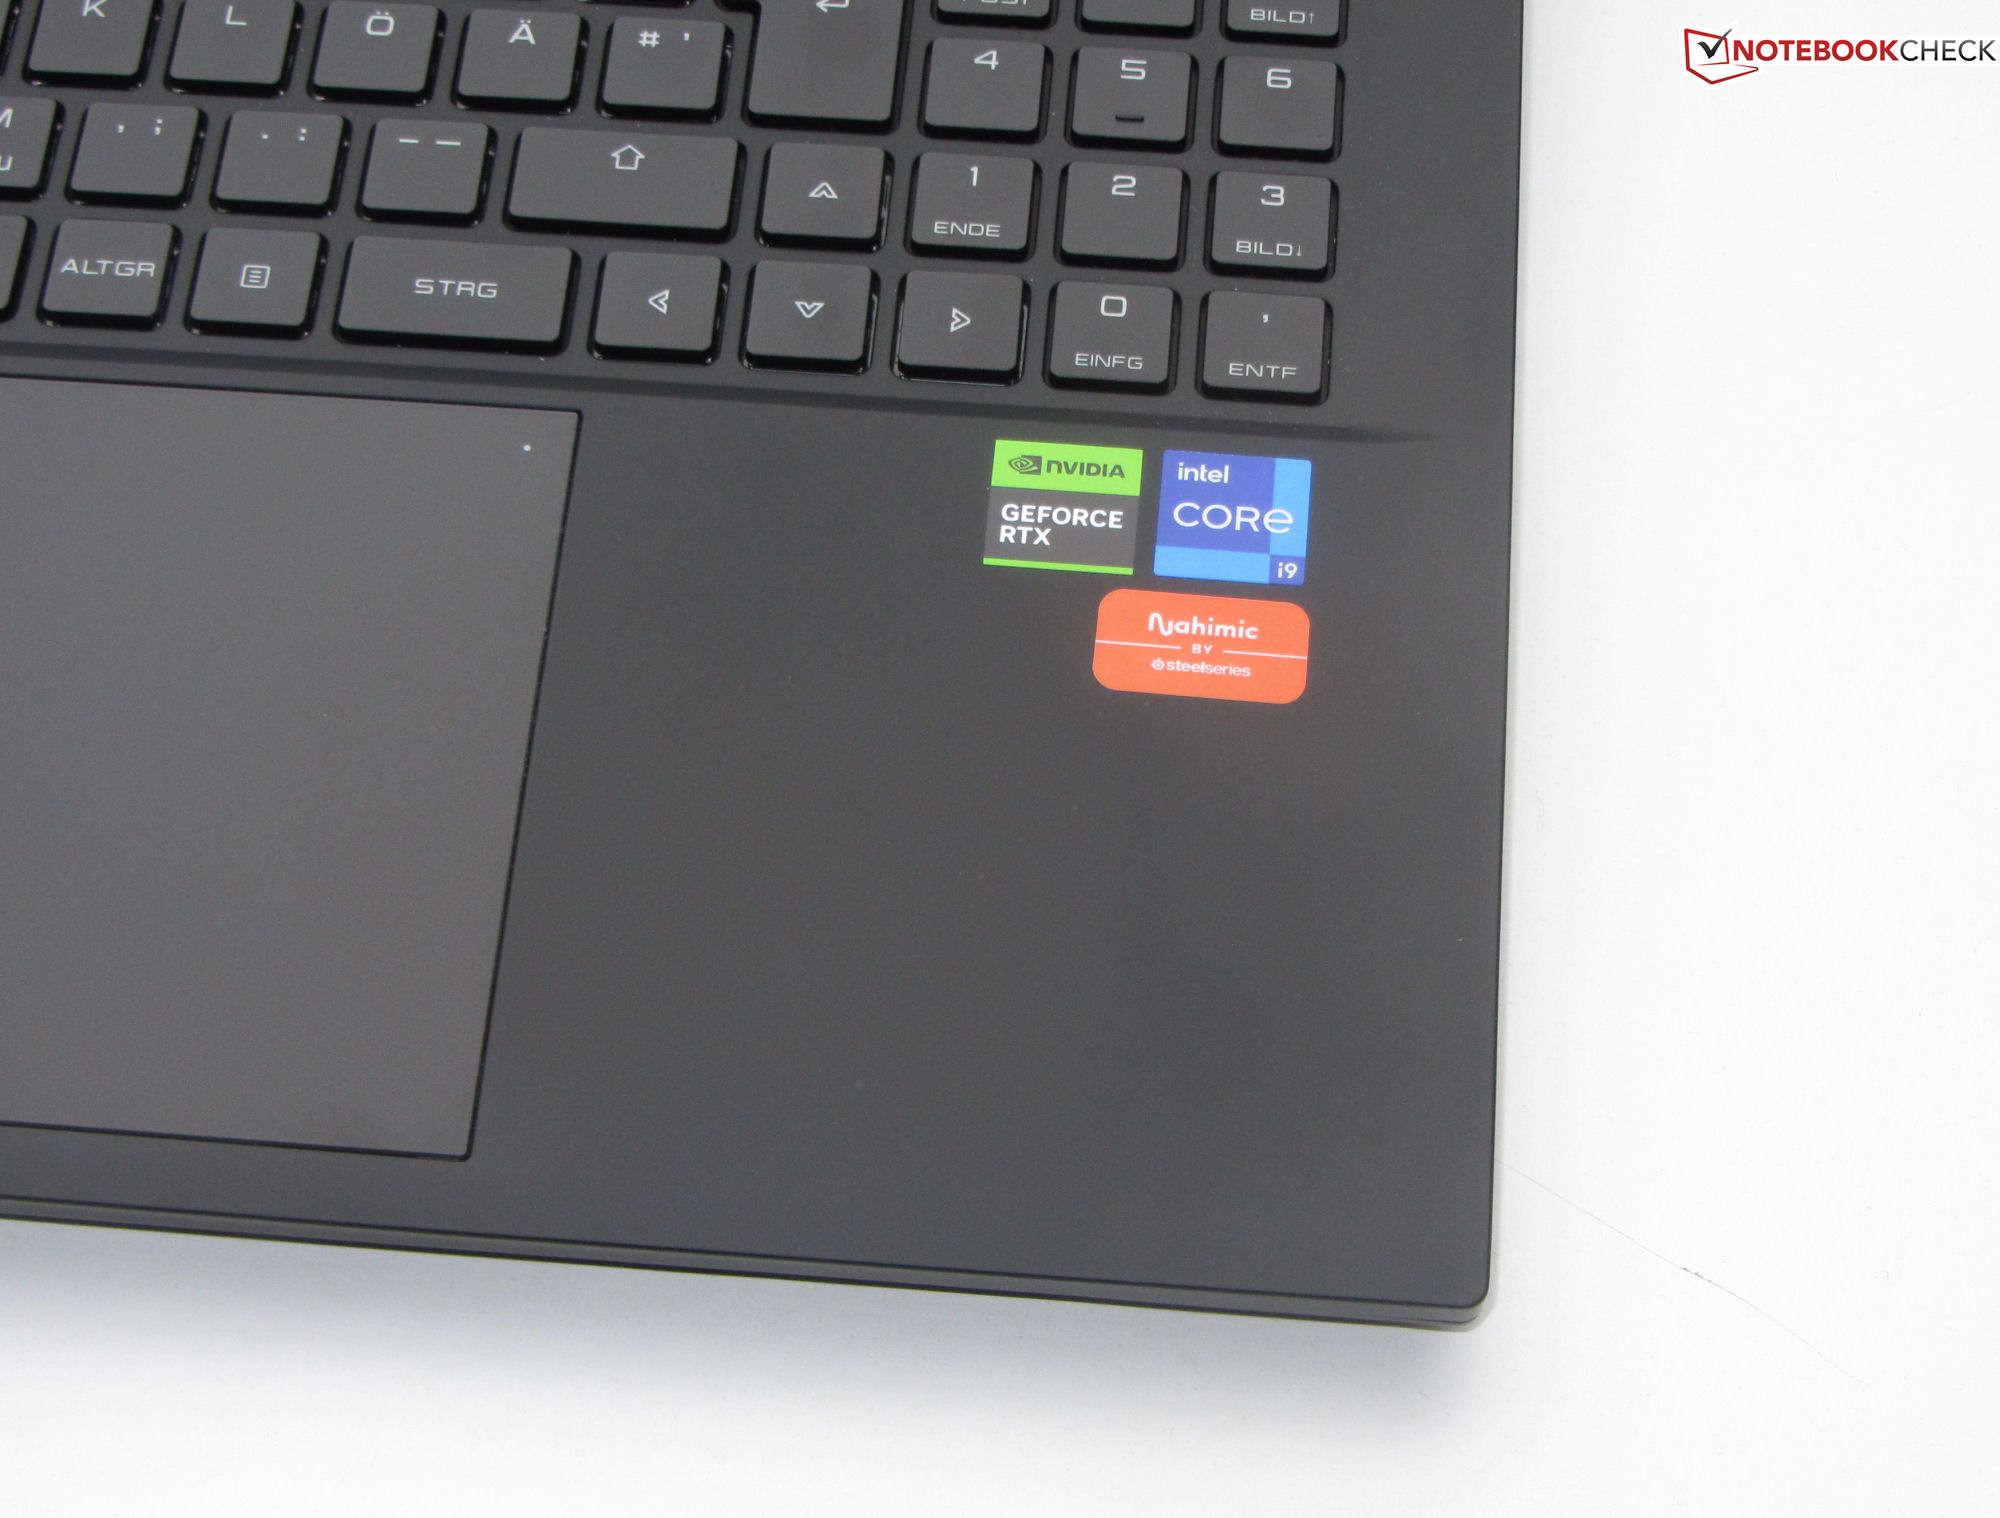
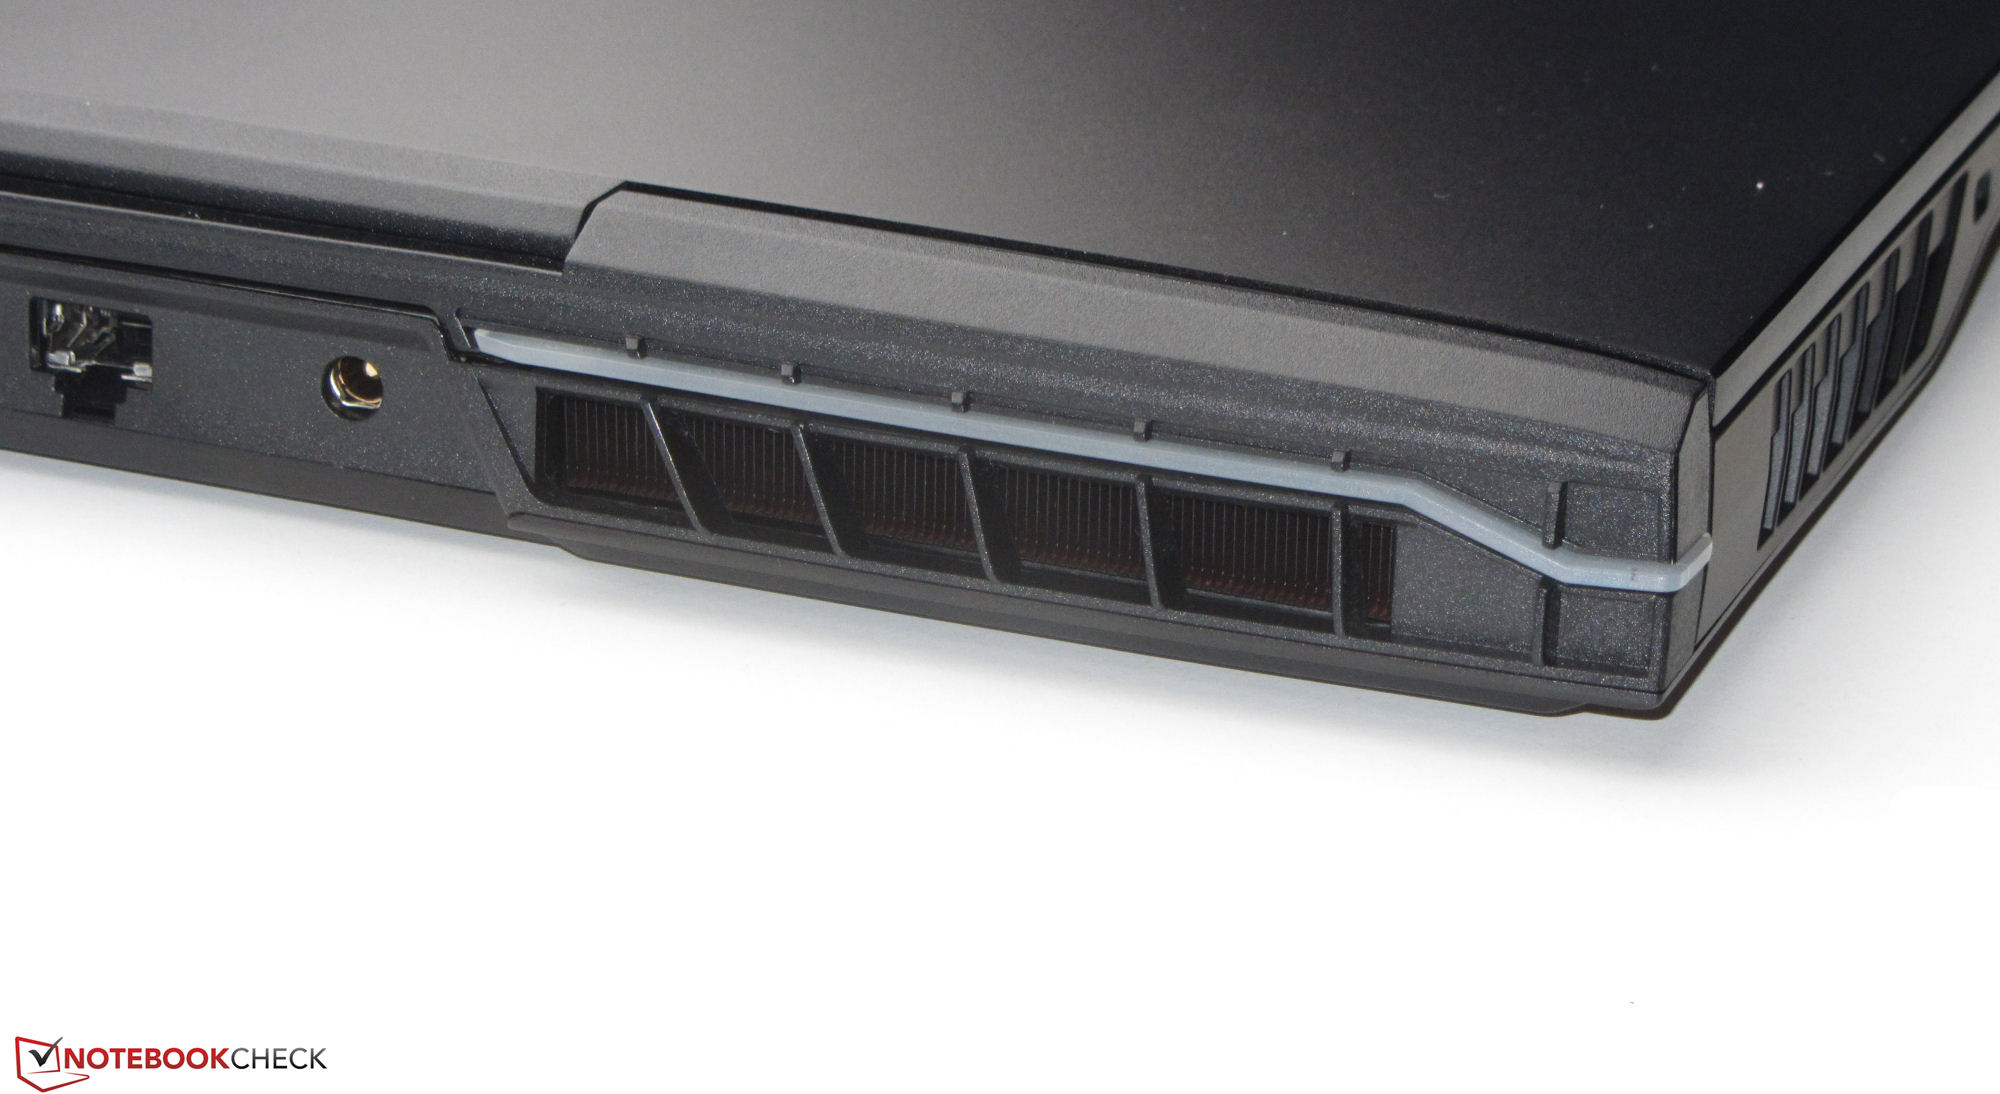
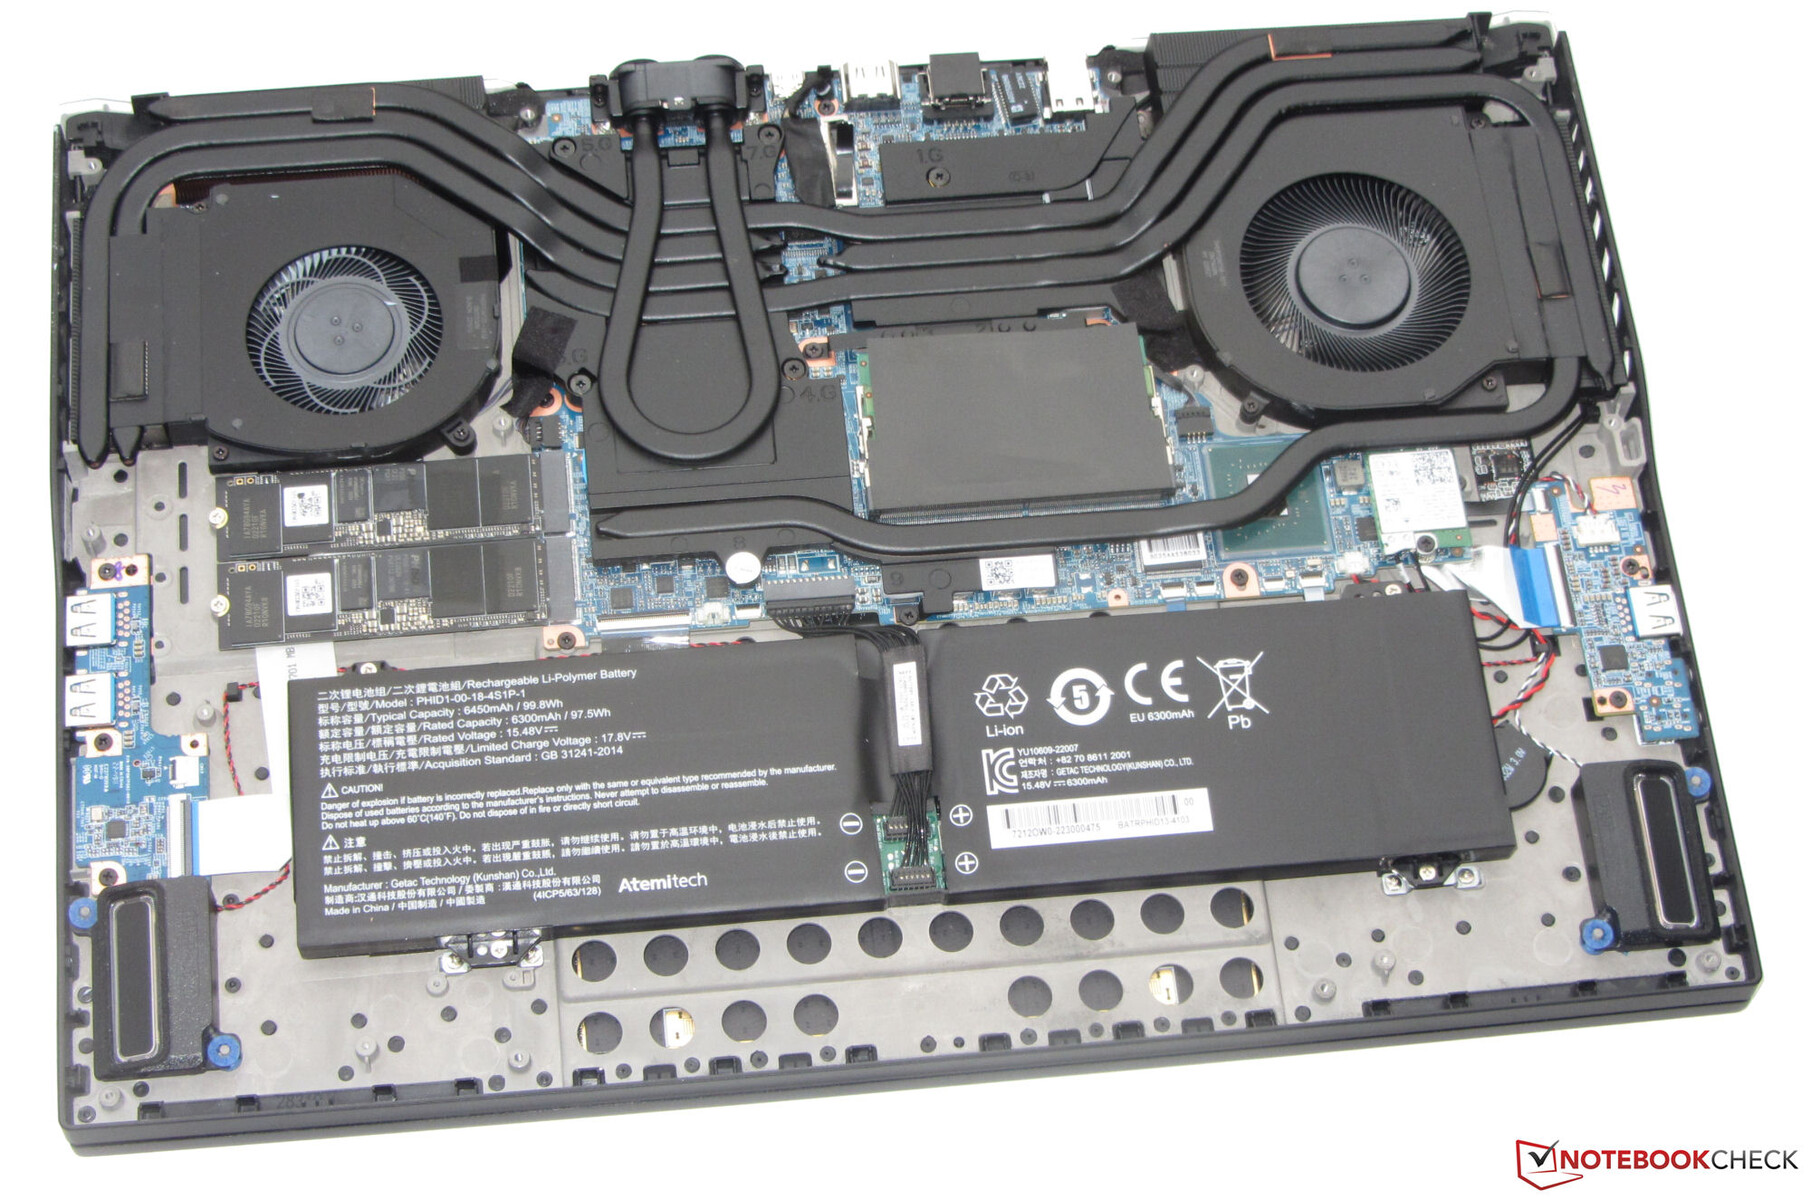
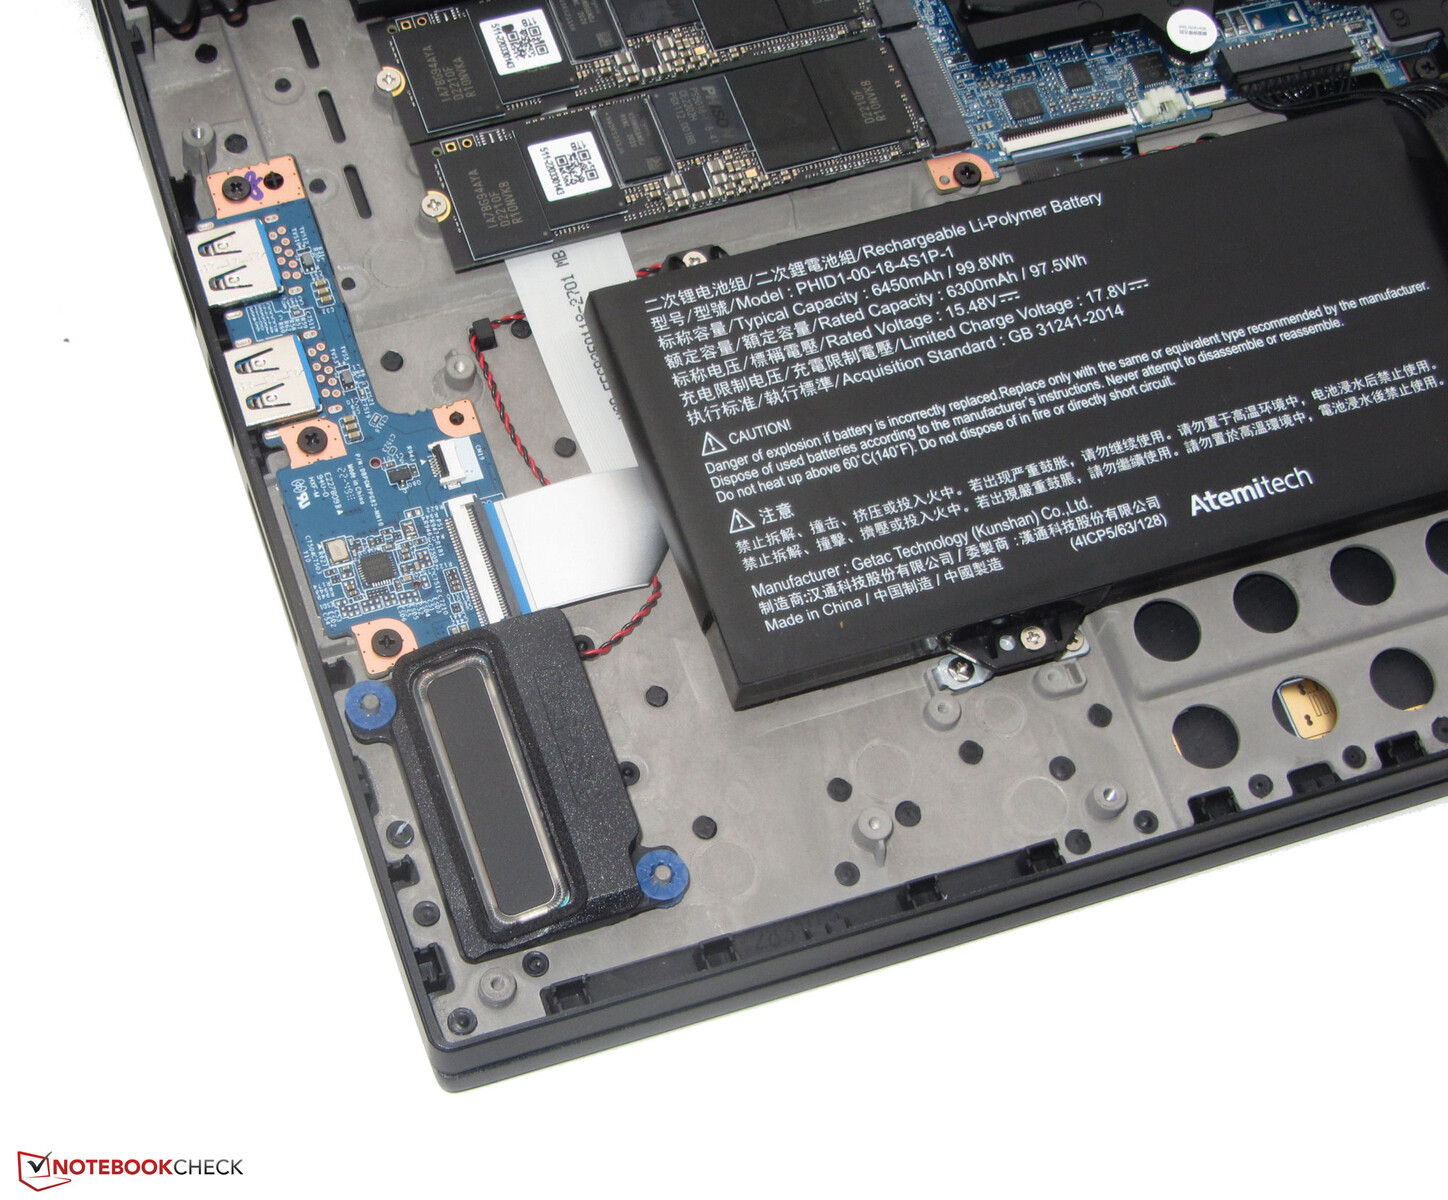
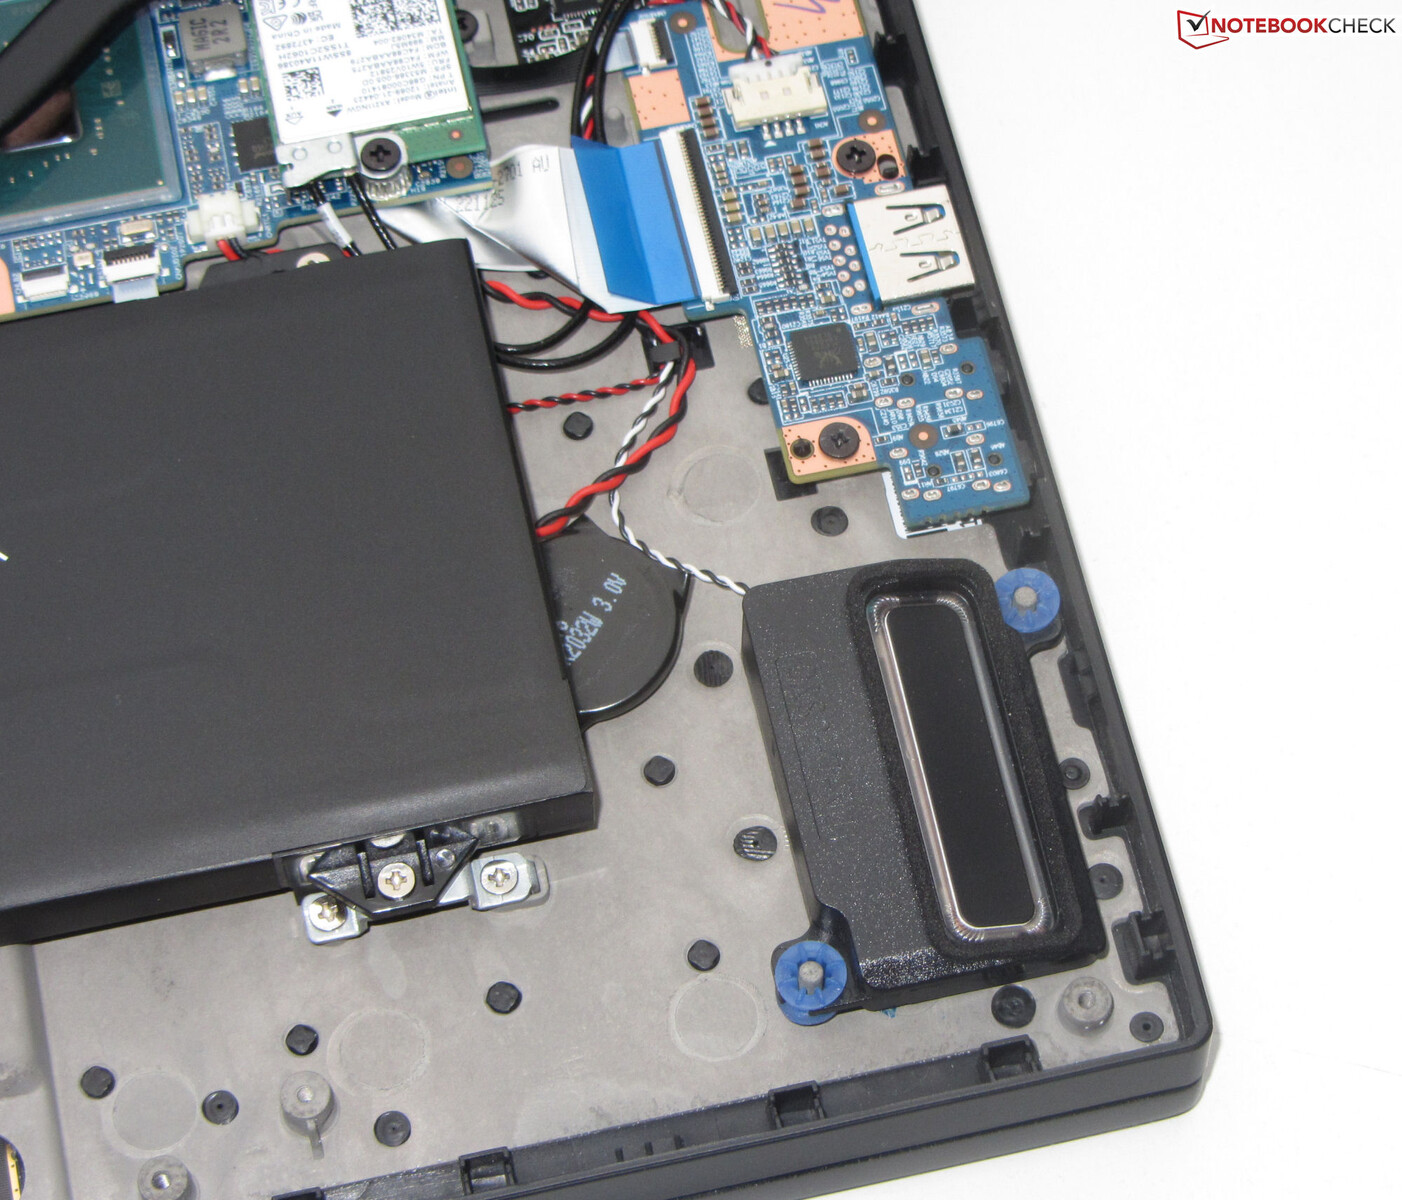
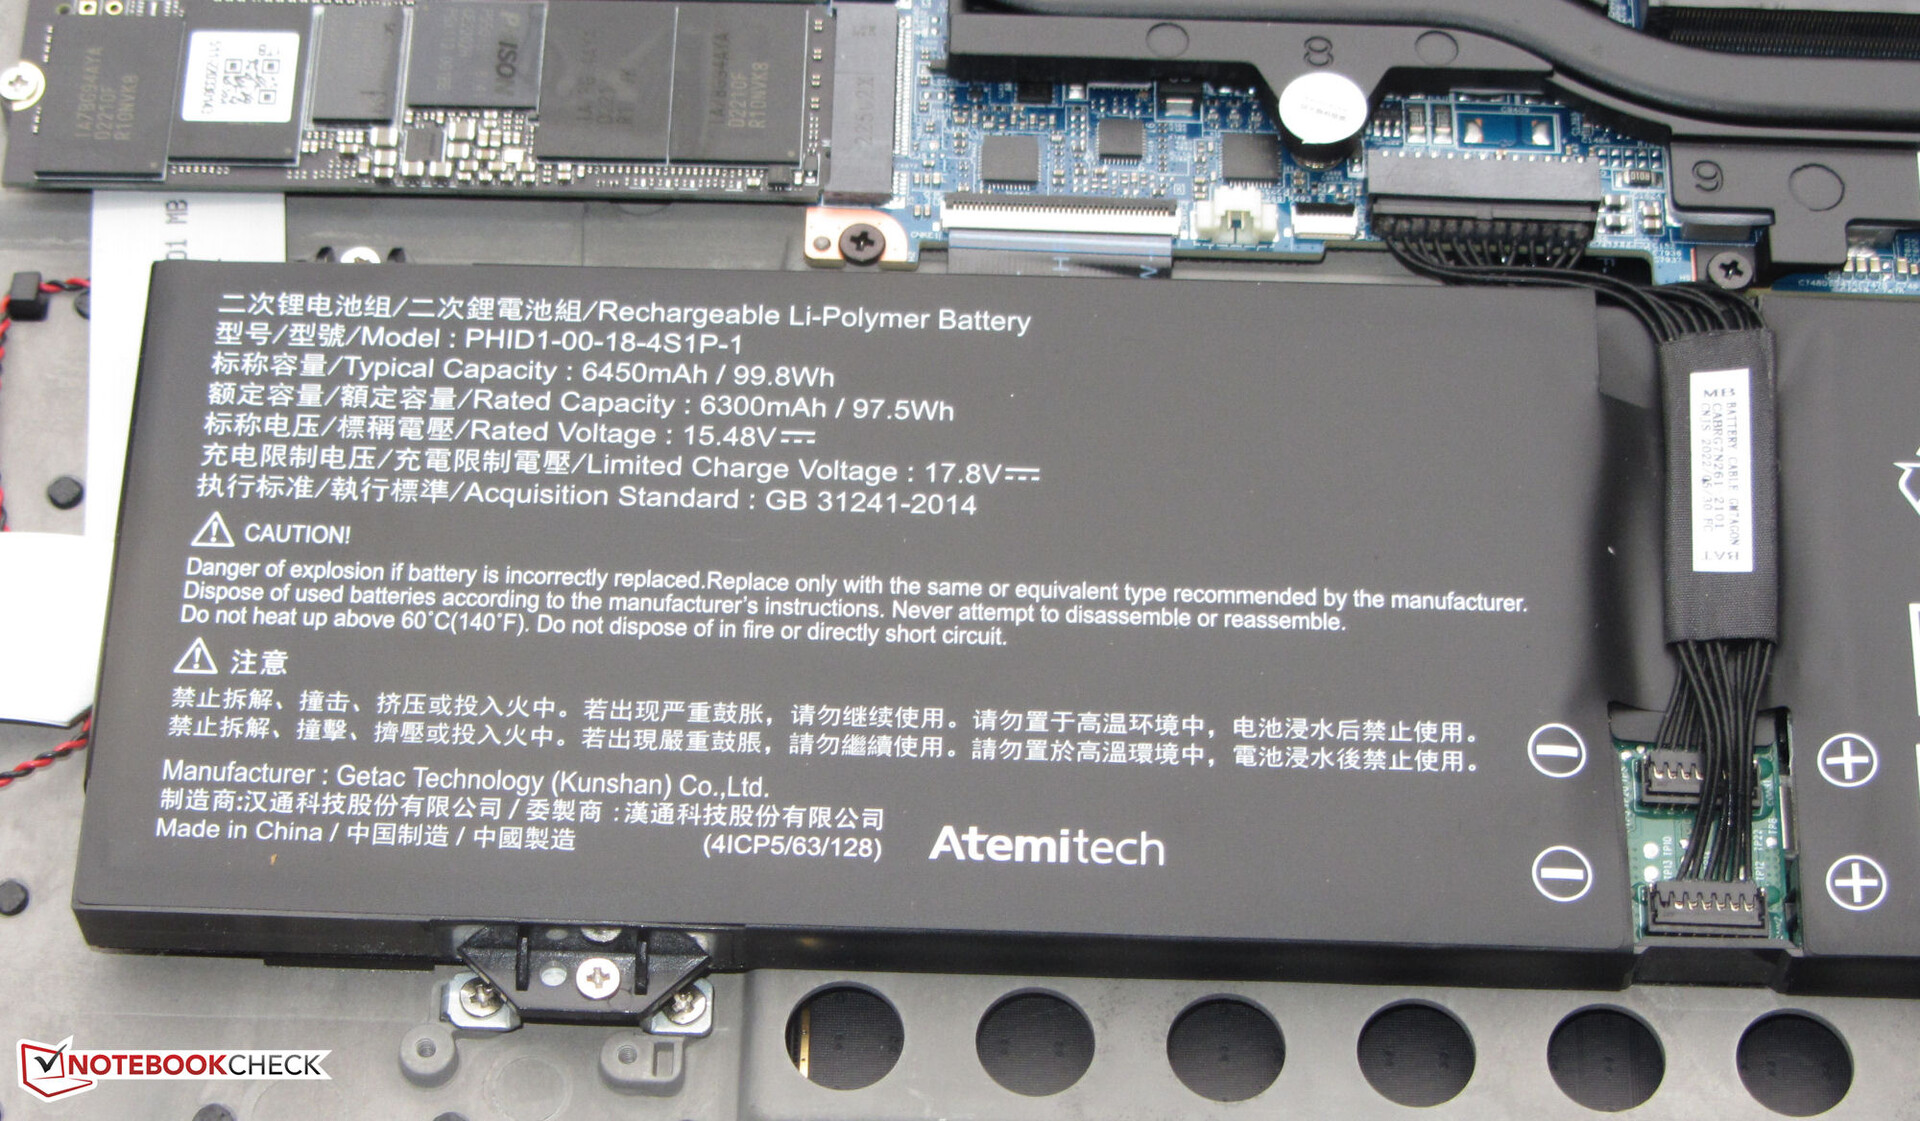
L'Erazer Beast X40 rifugge da un look appariscente e rumoroso a favore di un design sobrio che non spicca in un ambiente professionale. Come i suoi predecessori, l'X40 utilizza uno chassis in metallo nero con finiture opache. La sezione di base è ricoperta da un rivestimento in gomma grippante. La retroilluminazione della tastiera (RGB) e le due strisce LED completamente configurabili (RGB) sopra le bocchette di scarico posteriori danno un tocco di colore al portatile. La batteria, avvitata anziché incollata, e il resto dei componenti interni sono accessibili una volta rimosso il coperchio inferiore.
Non abbiamo notato alcun problema di lavorazione sull'unità in prova. Le fessure nello chassis sono ben strette e non ci sono materiali in eccesso nel processo di produzione. È praticamente impossibile torcere la sezione di base. Il coperchio può essere leggermente flesso, ma la quantità di elasticità è del tutto accettabile. Le cerniere mantengono il display saldamente in posizione e consentono di ripiegare lo schermo fino a circa 140 gradi. Il coperchio del portatile non può essere aperto con una sola mano.
Il Medion Erazer Beast X40 è uno dei dispositivi più compatti del nostro confronto e si colloca a metà strada per quanto riguarda il peso.
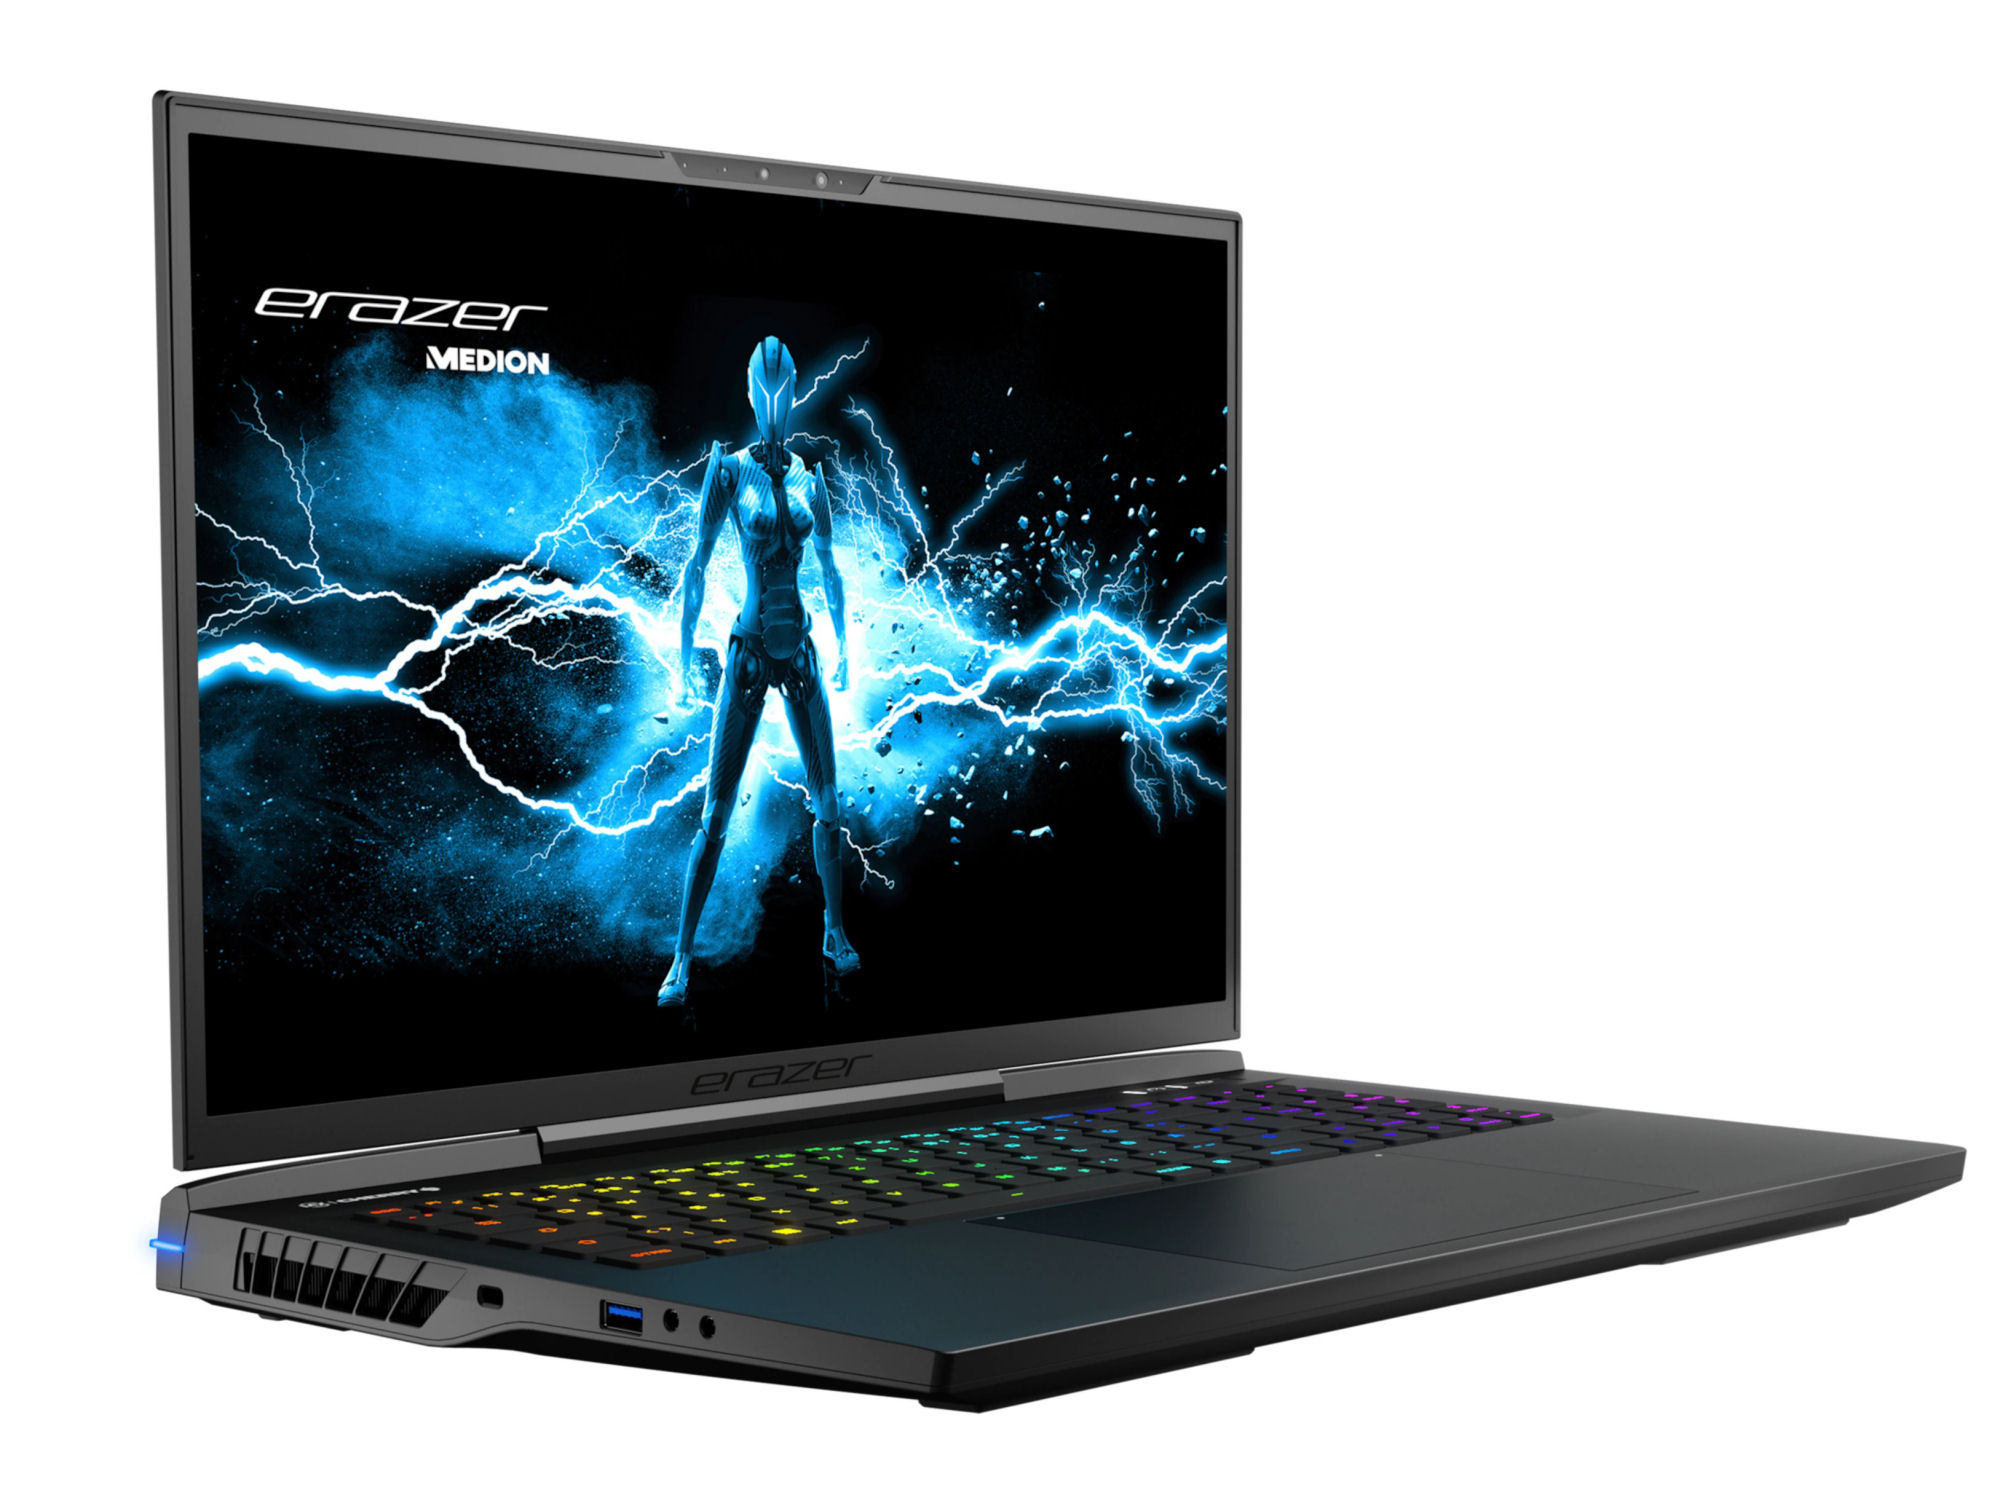
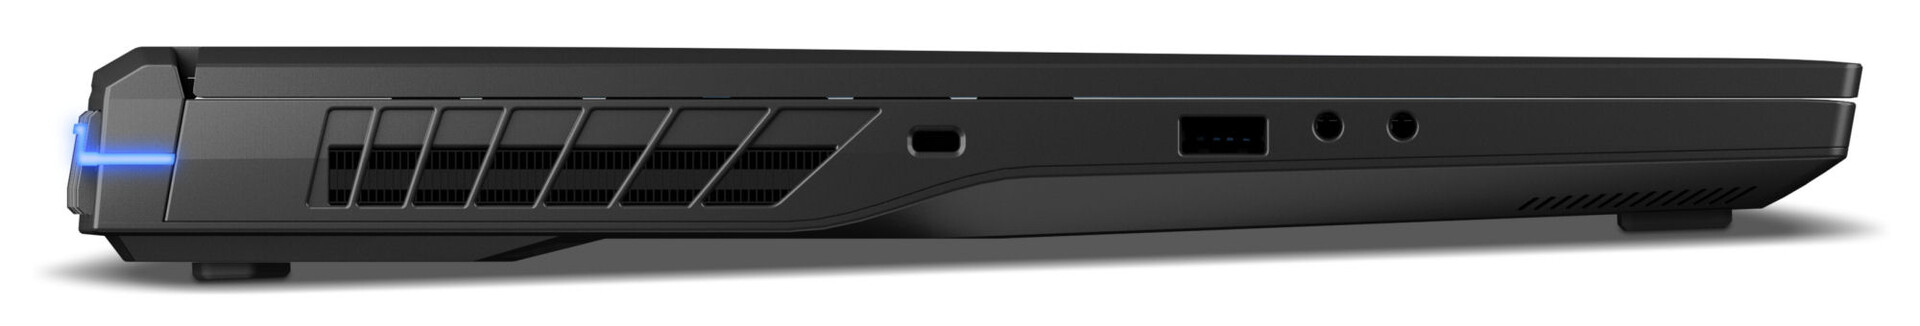
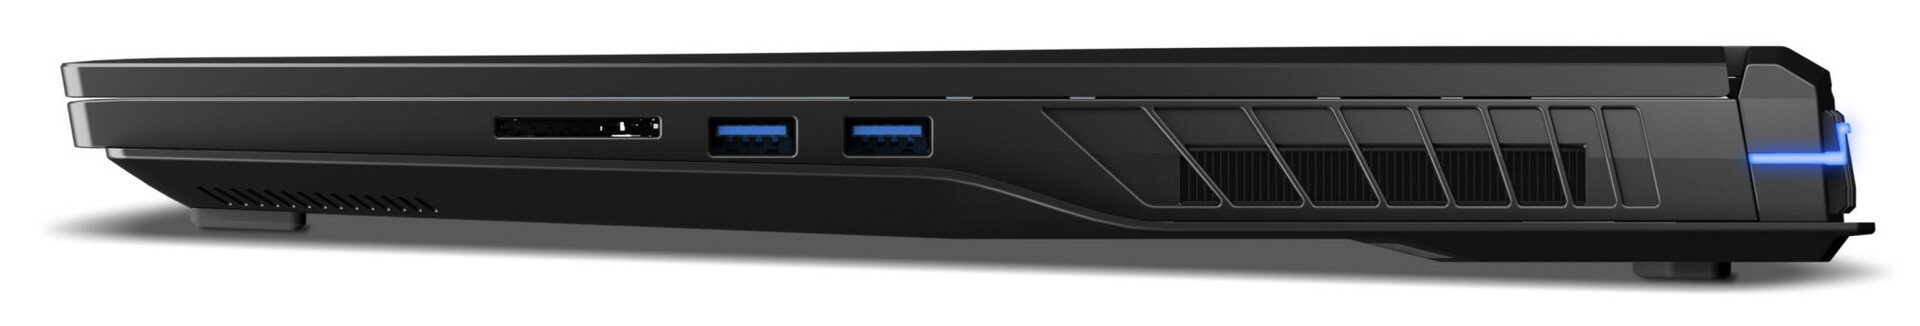
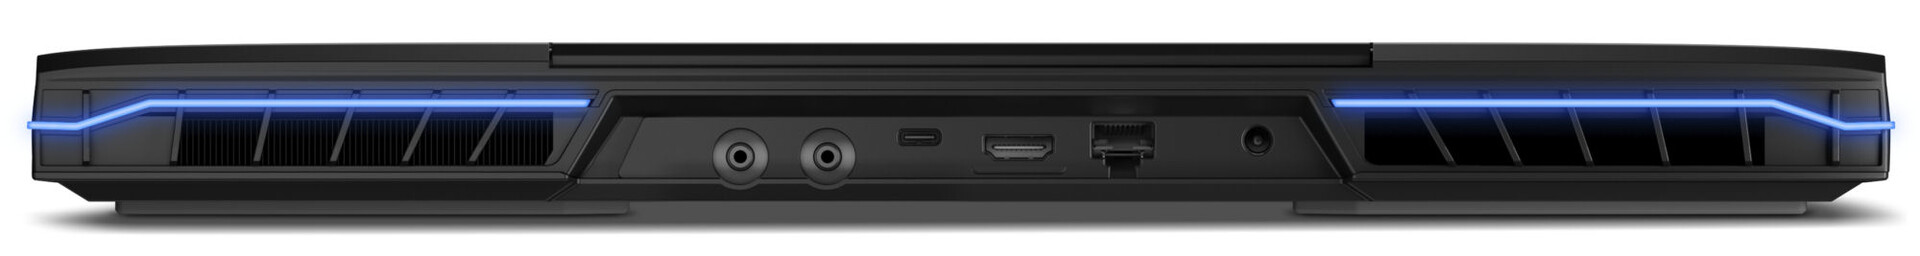
Specifiche - Thunderbolt 4 per la Bestia
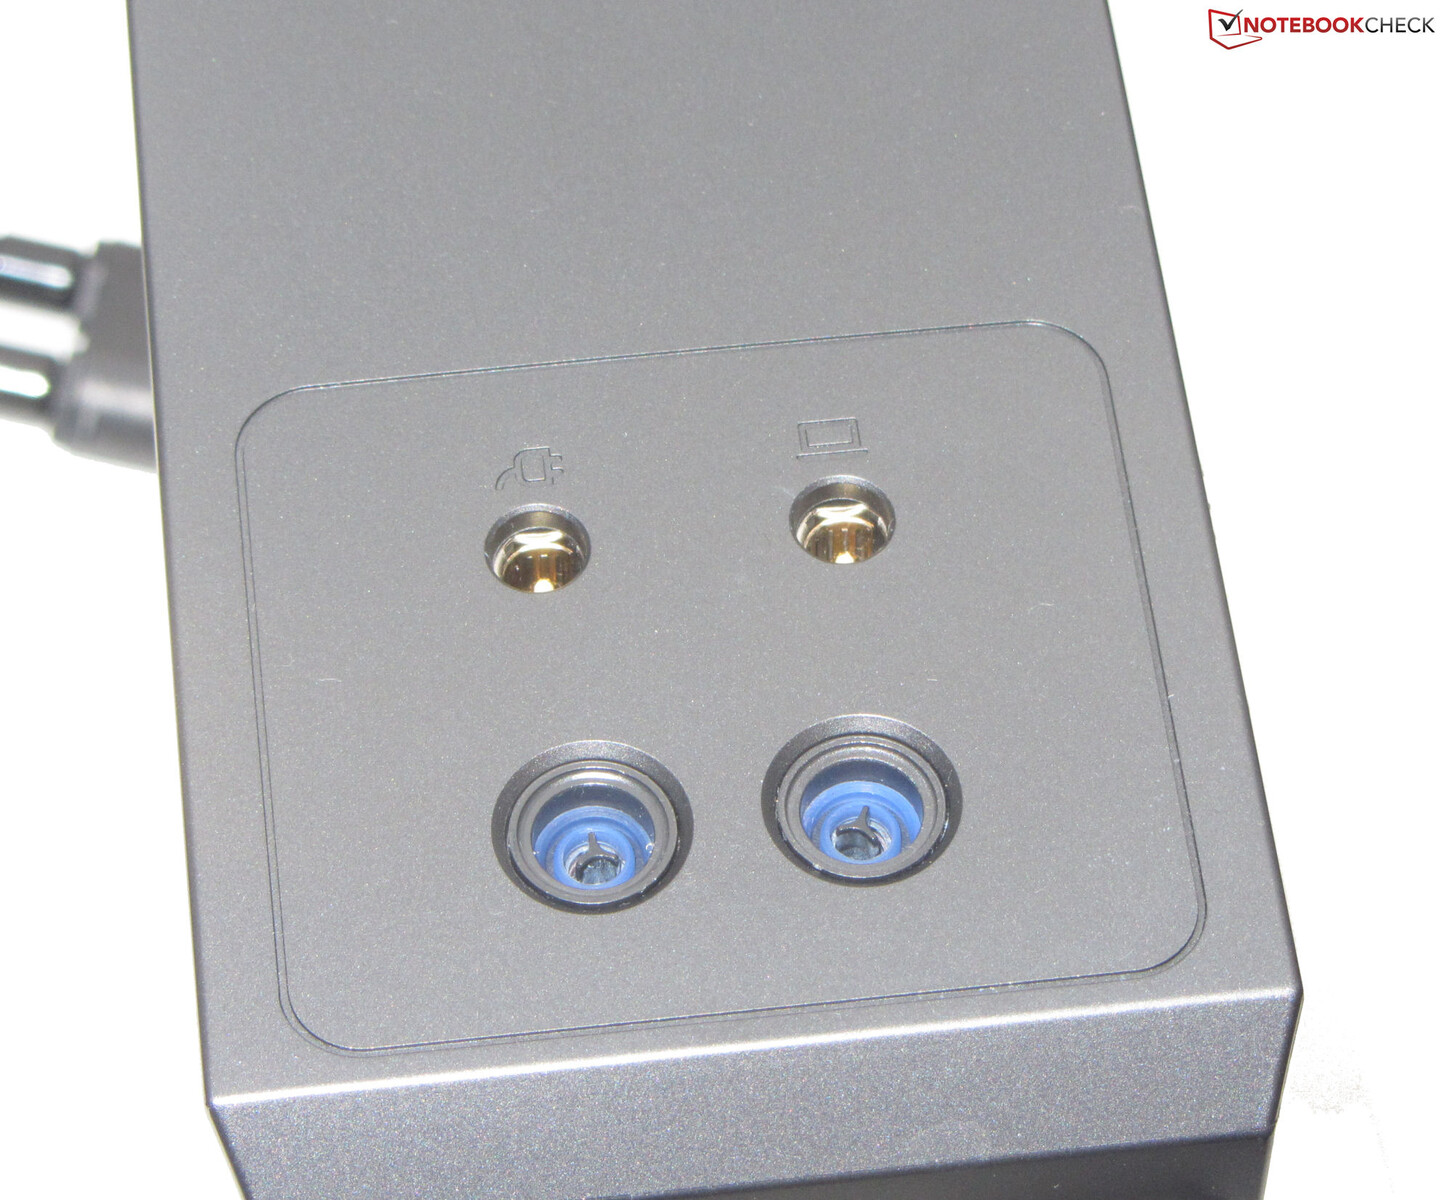
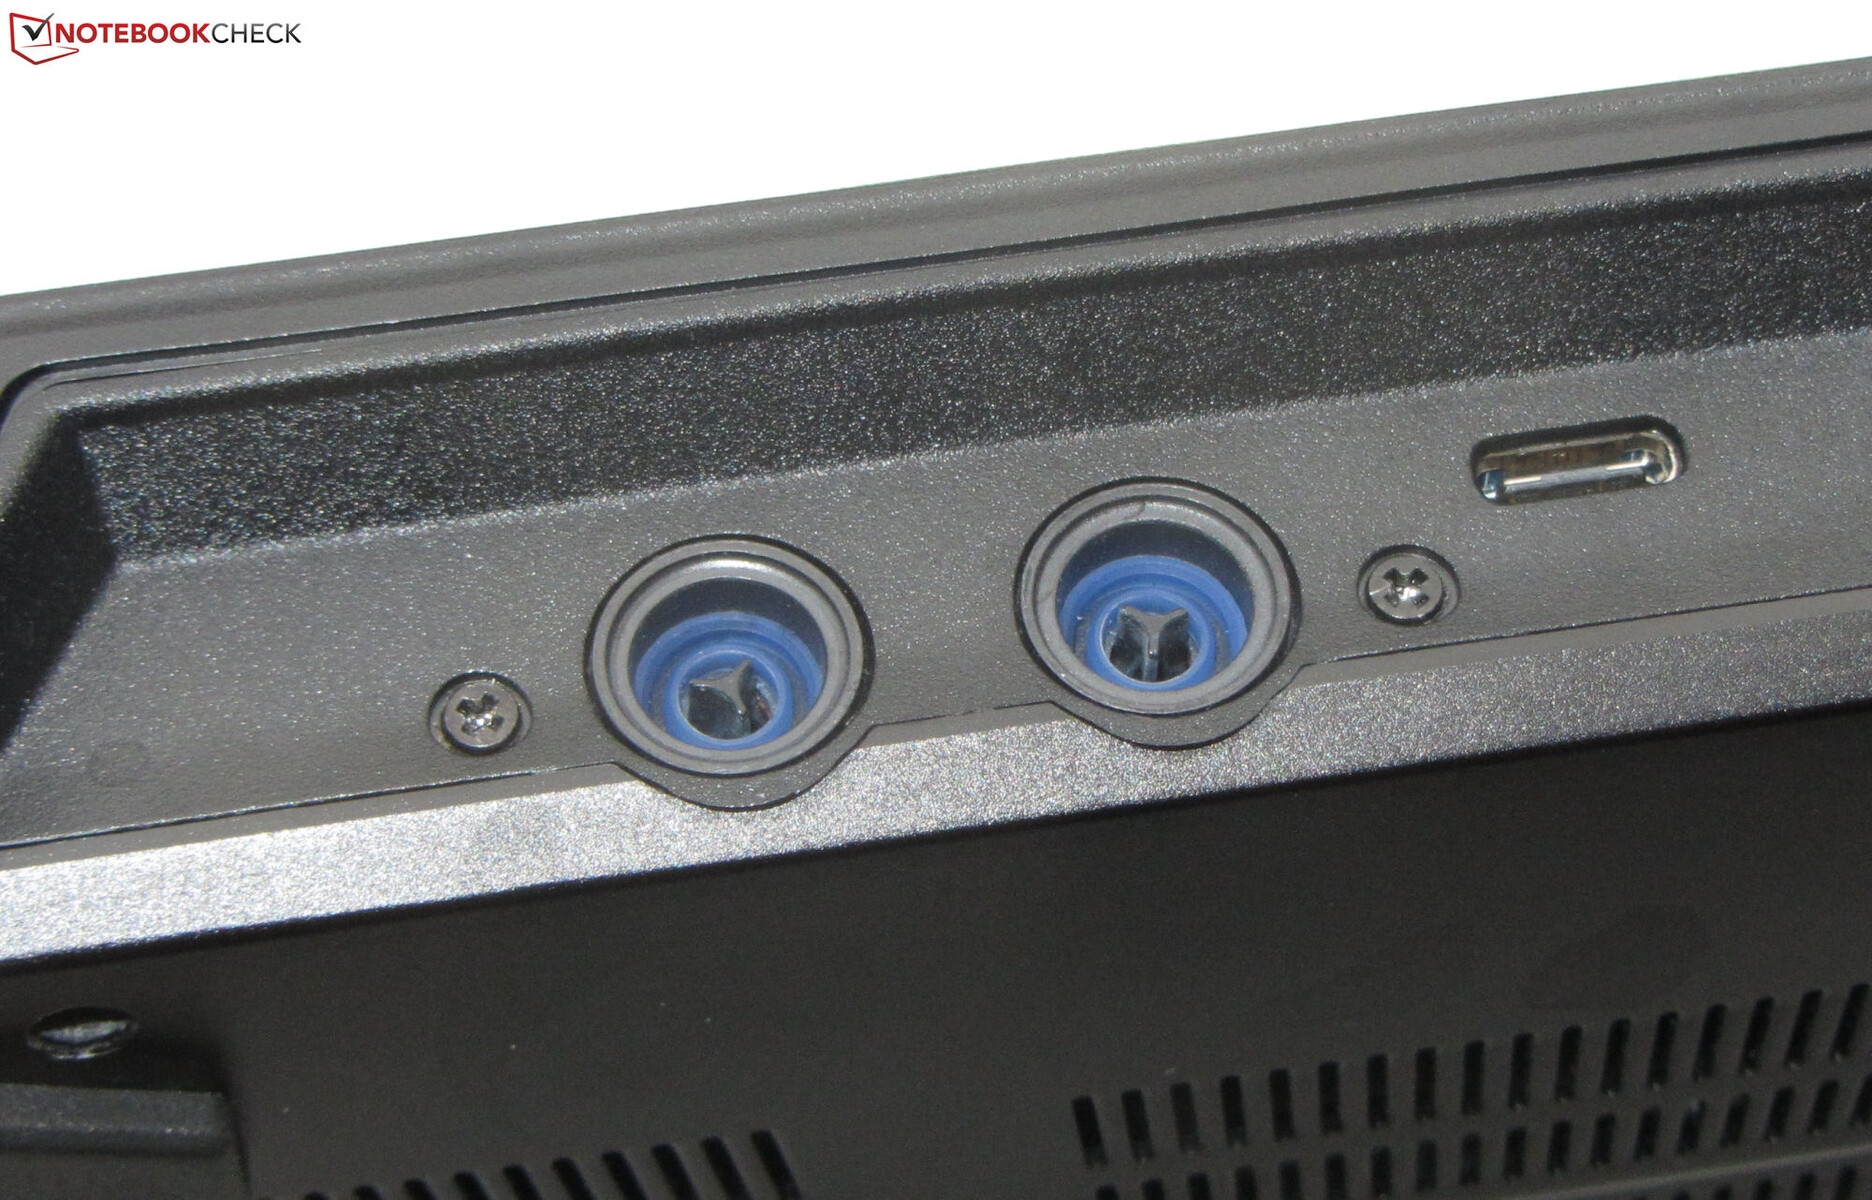
L'Erazer dispone di tre porte USB-A (2x USB 3.2 Gen 1, 1x USB 3.2 Gen 2) e di una porta USB-C (Thunderbolt 4). Quest'ultima non supporta Power Delivery ma è in grado di emettere segnali DisplayPort. Il portatile dispone di un totale di due uscite video (HDMI 2.1, DP), due jack audio (cuffie e mic-in), una porta Gigabit Ethernet e uno slot Kensington. Sul retro si trovano anche i connettori per la soluzione di raffreddamento ad acqua opzionale.
Lettore di schede SD
Il lettore di schede SD è un modello a media velocità che, insieme alla nostra scheda di riferimento AV Pro microSD 128 GB V60, è riuscito a raggiungere una velocità di 77 MB/s per il trasferimento di 250 immagini JPEG di circa 5 MB ciascuna e di 86 MB/s per la copia di grandi quantità di dati.
| SD Card Reader | |
| average JPG Copy Test (av. of 3 runs) | |
| Alienware x17 R2 P48E (AV Pro V60) | |
| Razer Blade 16 Early 2023 (AV PRO microSD 128 GB V60) | |
| Media della classe Gaming (19 - 204, n=67, ultimi 2 anni) | |
| MSI Titan GT77 HX 13VI (Angelibird AV Pro V60) | |
| Medion Erazer Beast X40 (AV PRO microSD 128 GB V60) | |
| SCHENKER XMG Neo 17 M22 (AV PRO microSD 128 GB V60) | |
| maximum AS SSD Seq Read Test (1GB) | |
| Alienware x17 R2 P48E (AV Pro V60) | |
| Razer Blade 16 Early 2023 (AV PRO microSD 128 GB V60) | |
| Media della classe Gaming (25.8 - 261, n=66, ultimi 2 anni) | |
| MSI Titan GT77 HX 13VI (Angelibird AV Pro V60) | |
| Medion Erazer Beast X40 (AV PRO microSD 128 GB V60) | |
Connettività
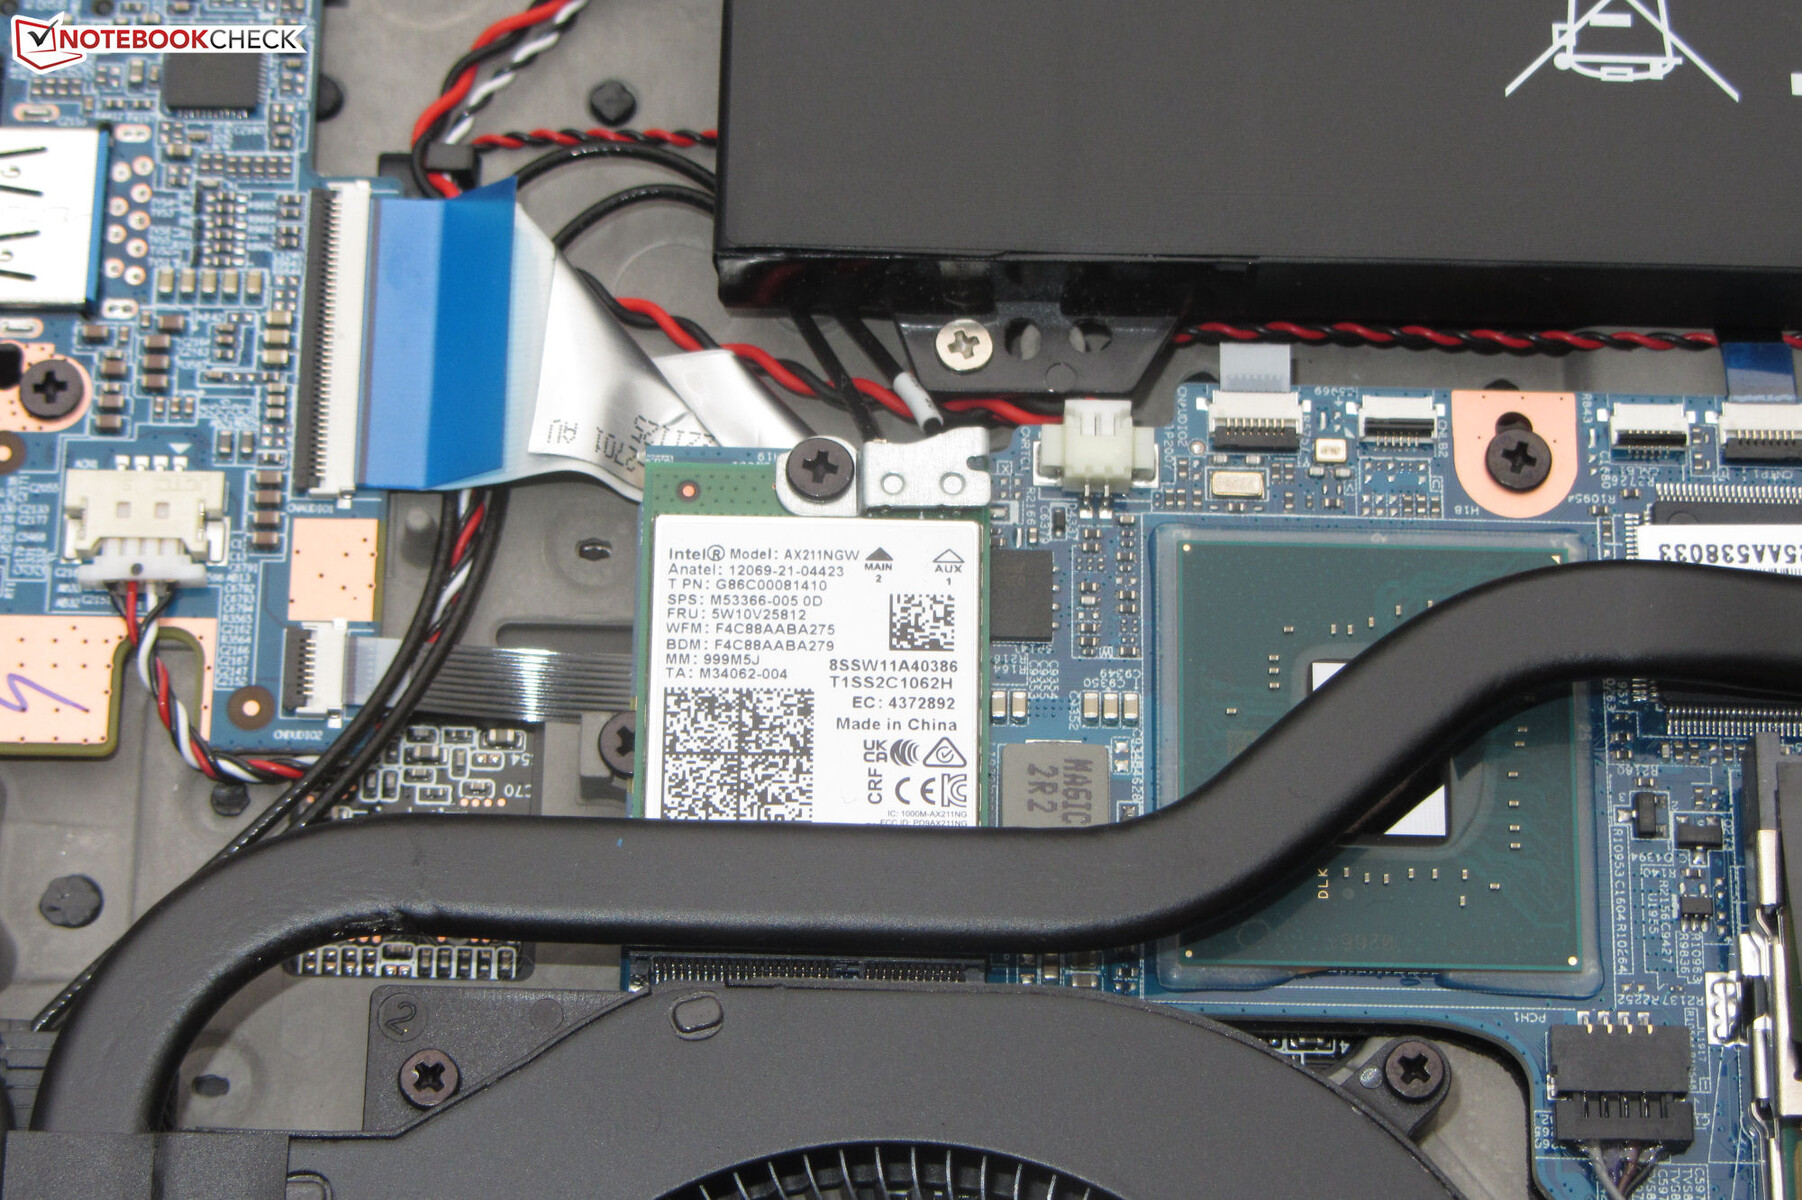
In condizioni ottimali (assenza di altri dispositivi Wi-Fi nelle immediate vicinanze, breve distanza tra il laptop e il PC server), l'Erazer ha fornito eccellenti velocità di trasferimento tramite Wi-Fi, perché Medion ha deciso di utilizzare un modulo Intel AX211 Wi-Fi 6E. Le connessioni di rete cablate sono gestite dal chip Realtek RTL8125 Gigabit Ethernet, capace di velocità fino a 2,5 Gbit/s.
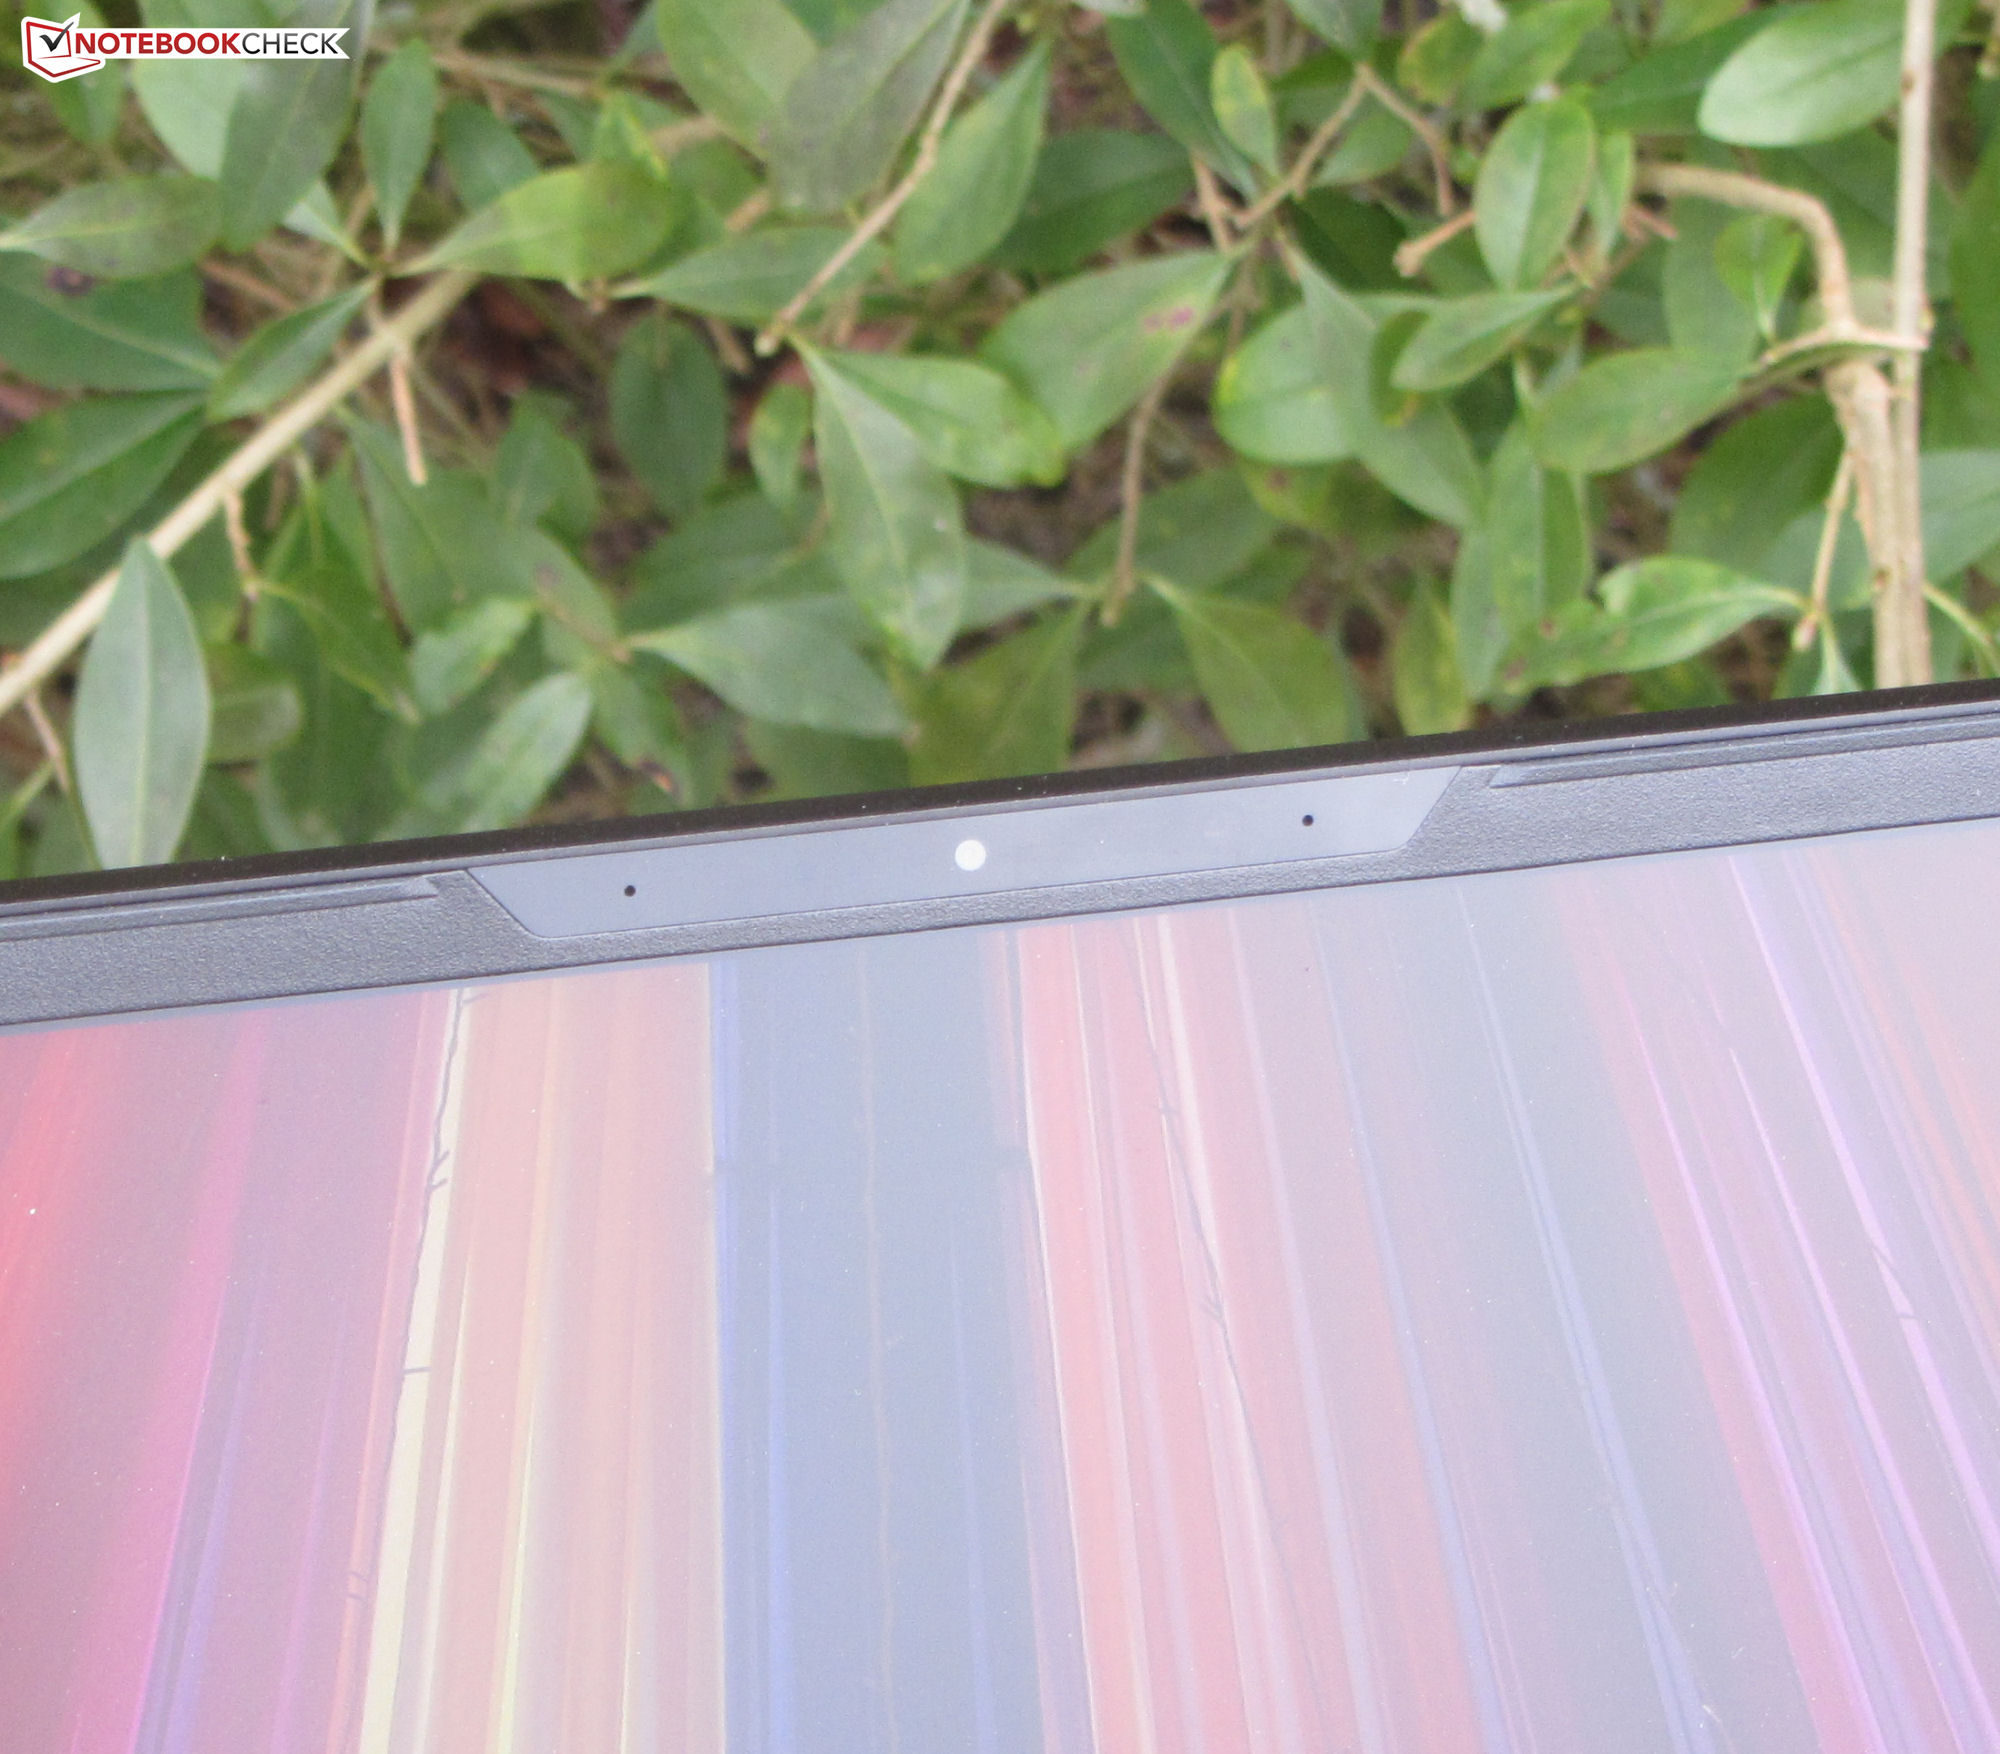
Webcam
La webcam da 2,1 MP cattura immagini a una risoluzione massima di 1.920 x 1.080. Manca di precisione cromatica: i colori prodotti dalla fotocamera si discostano notevolmente dai colori di riferimento. La webcam non dispone di un otturatore meccanico per la privacy.


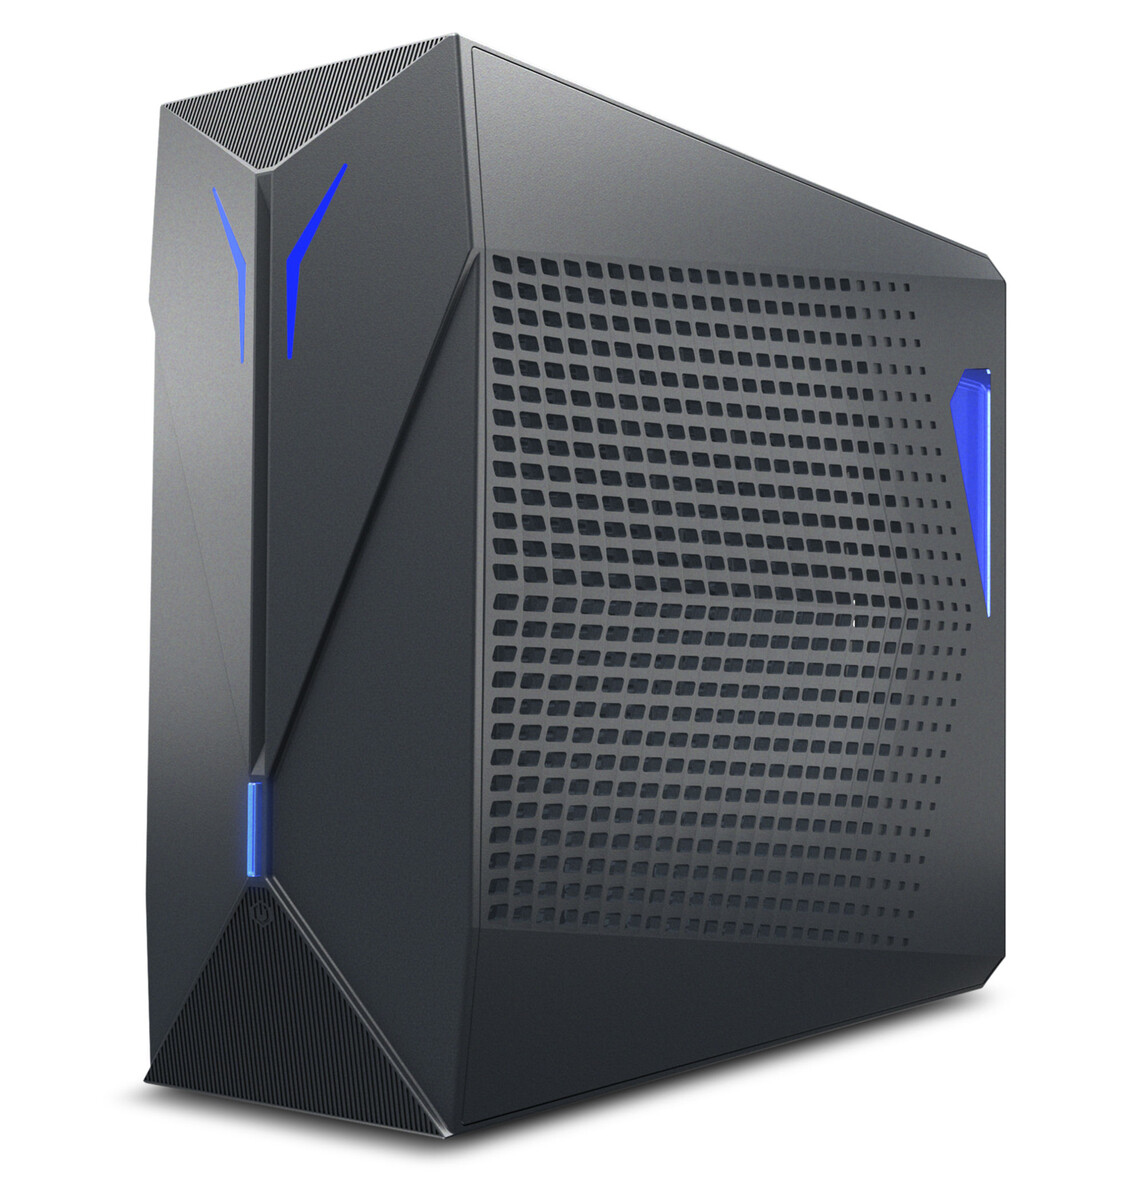
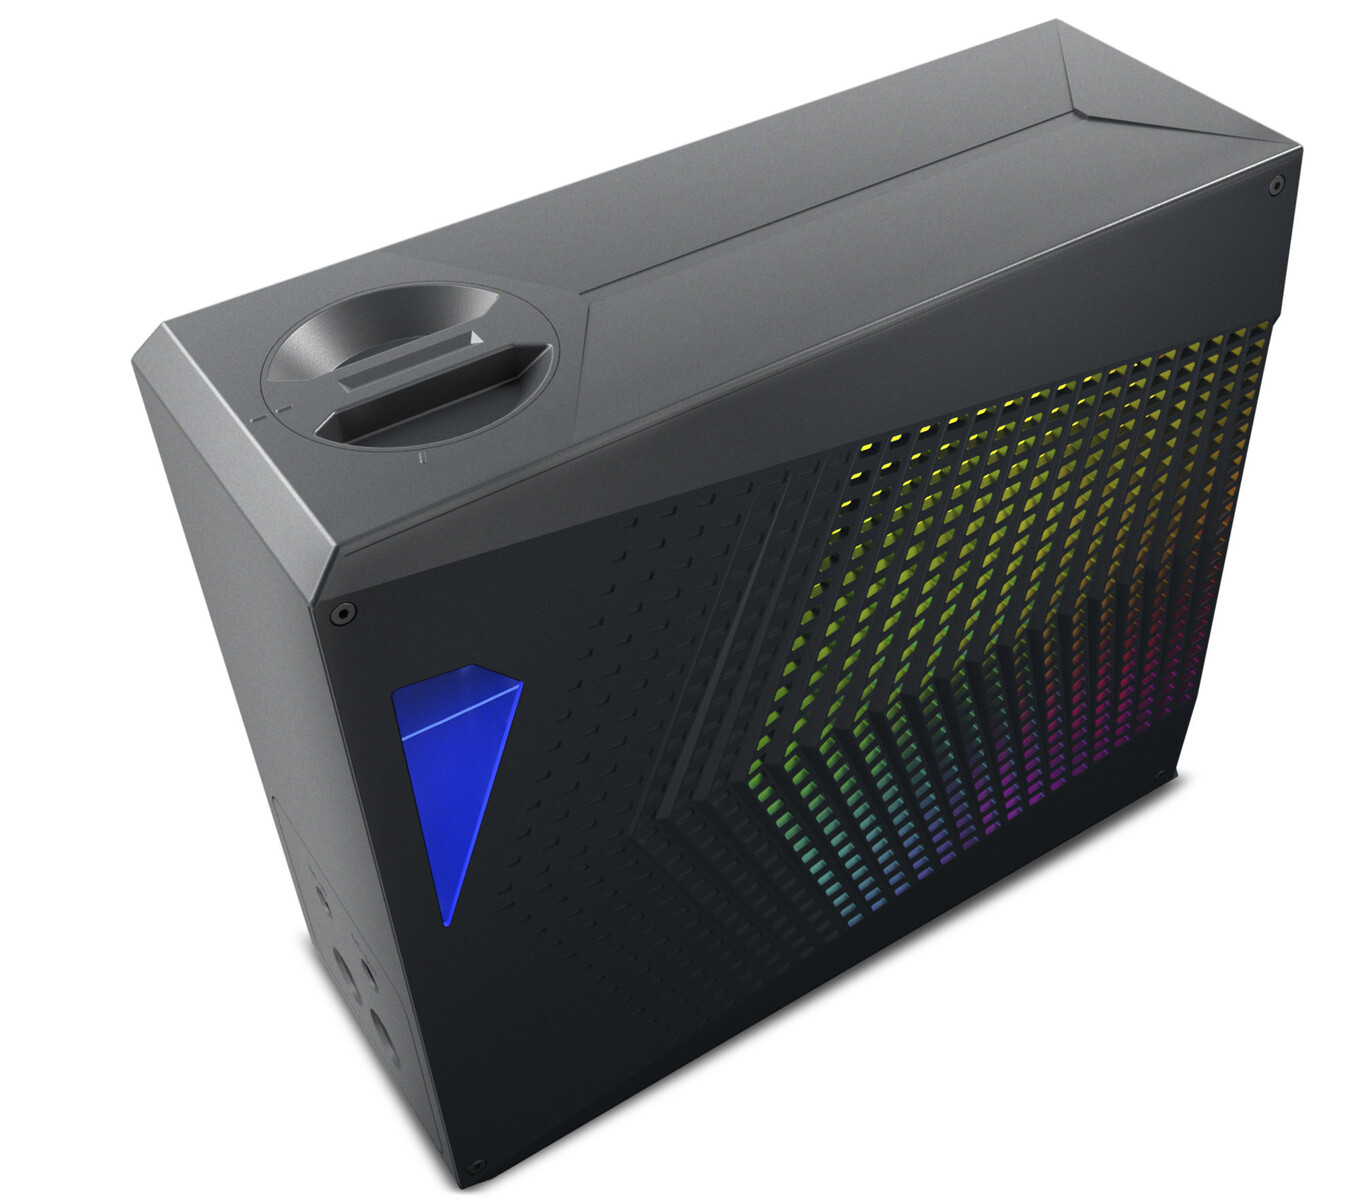
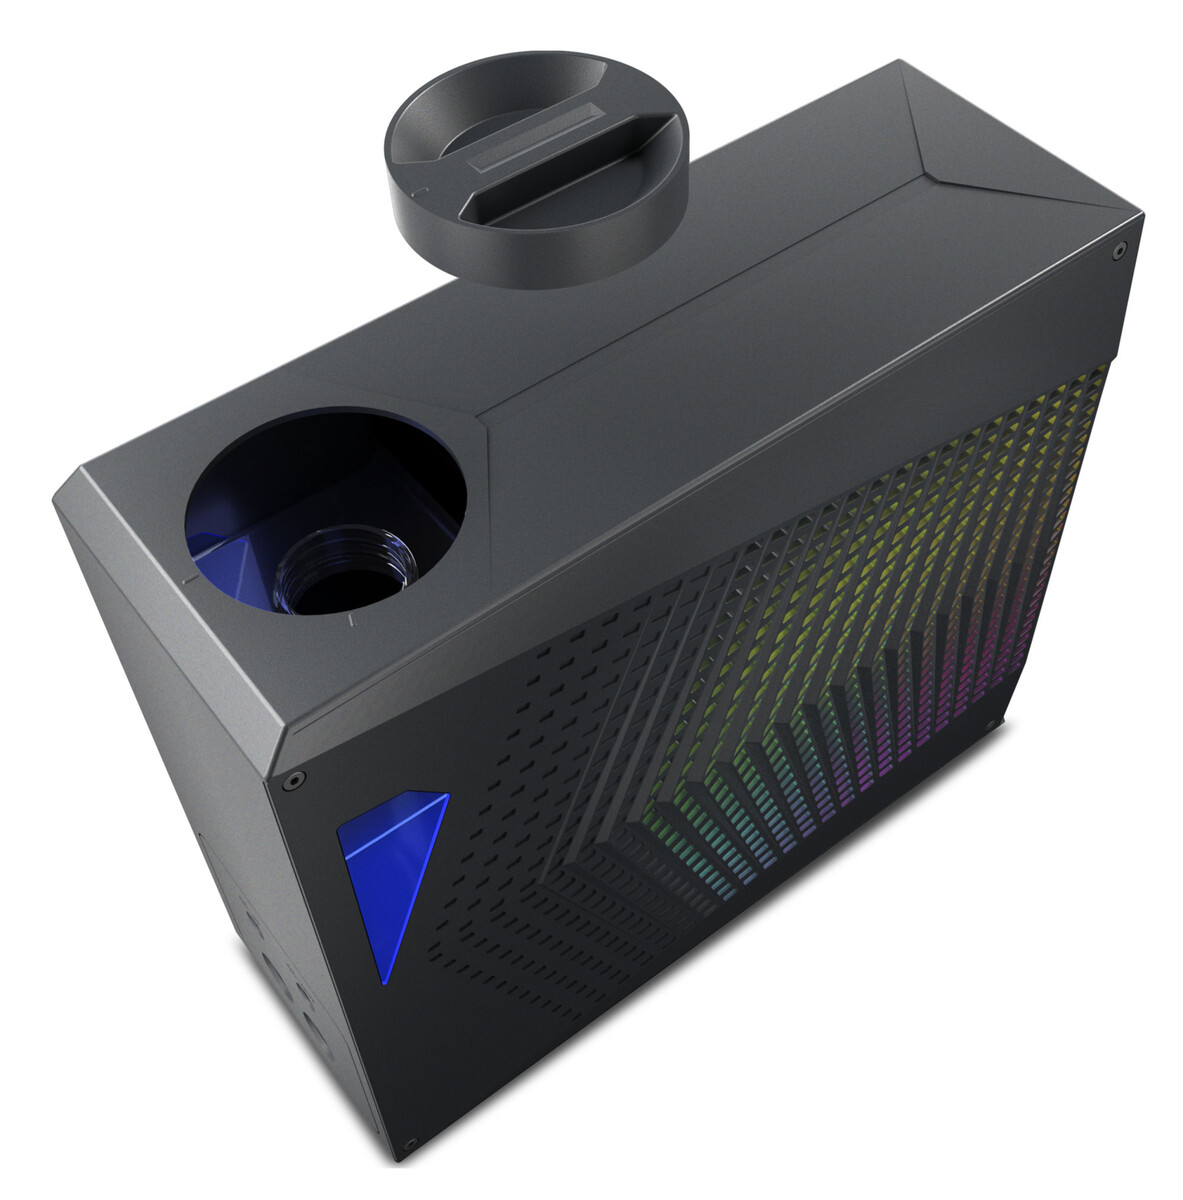
Accessori
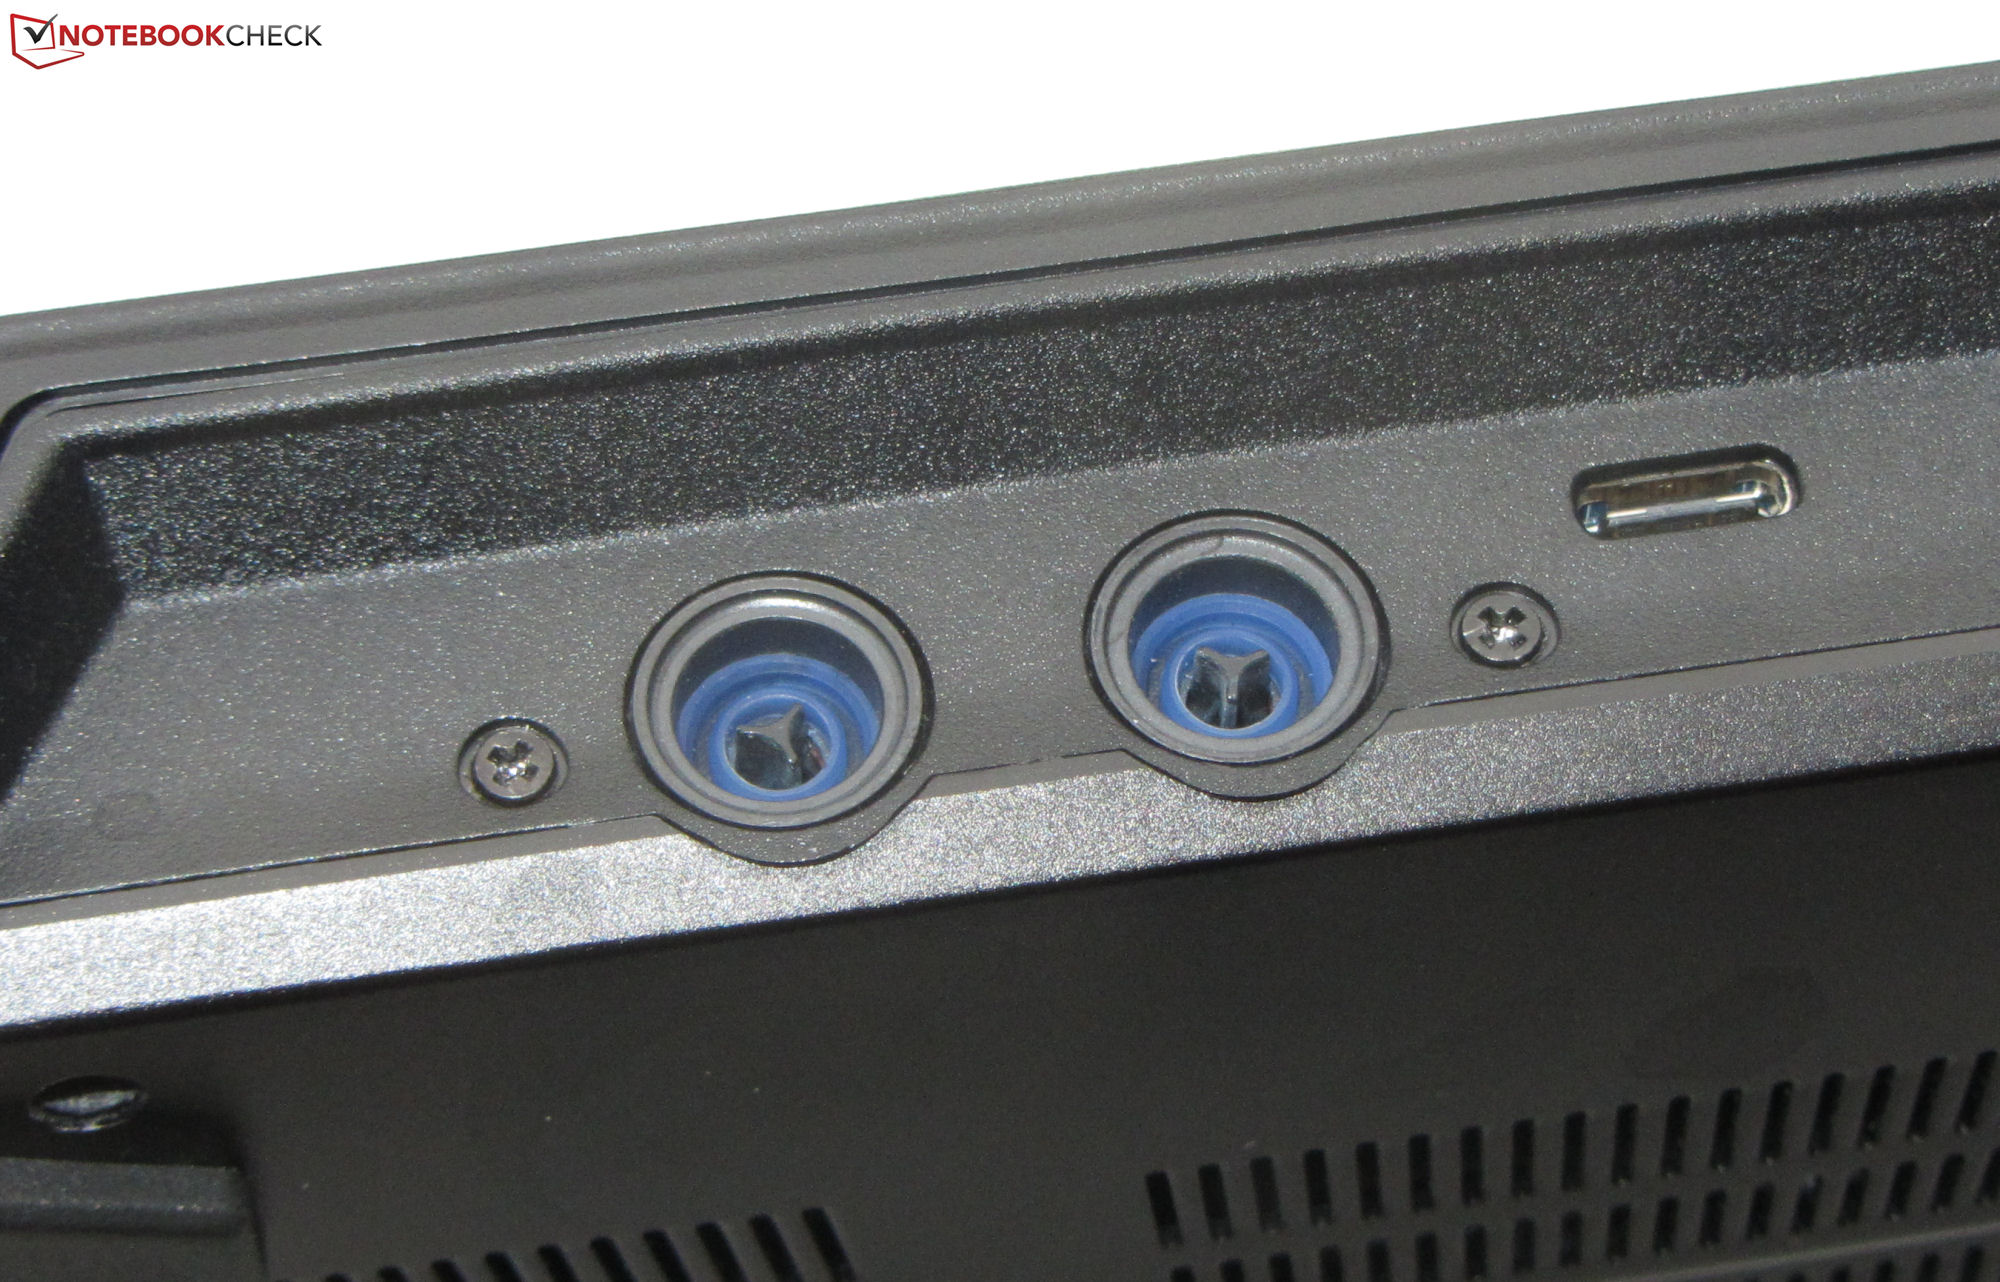
Il portatile viene fornito senza altri accessori oltre alla consueta documentazione e all'adattatore di corrente. Medion offre una soluzione opzionale di raffreddamento ad acqua esterna al prezzo di circa 250 euro (270 dollari), che l'azienda ci ha fornito per il test.
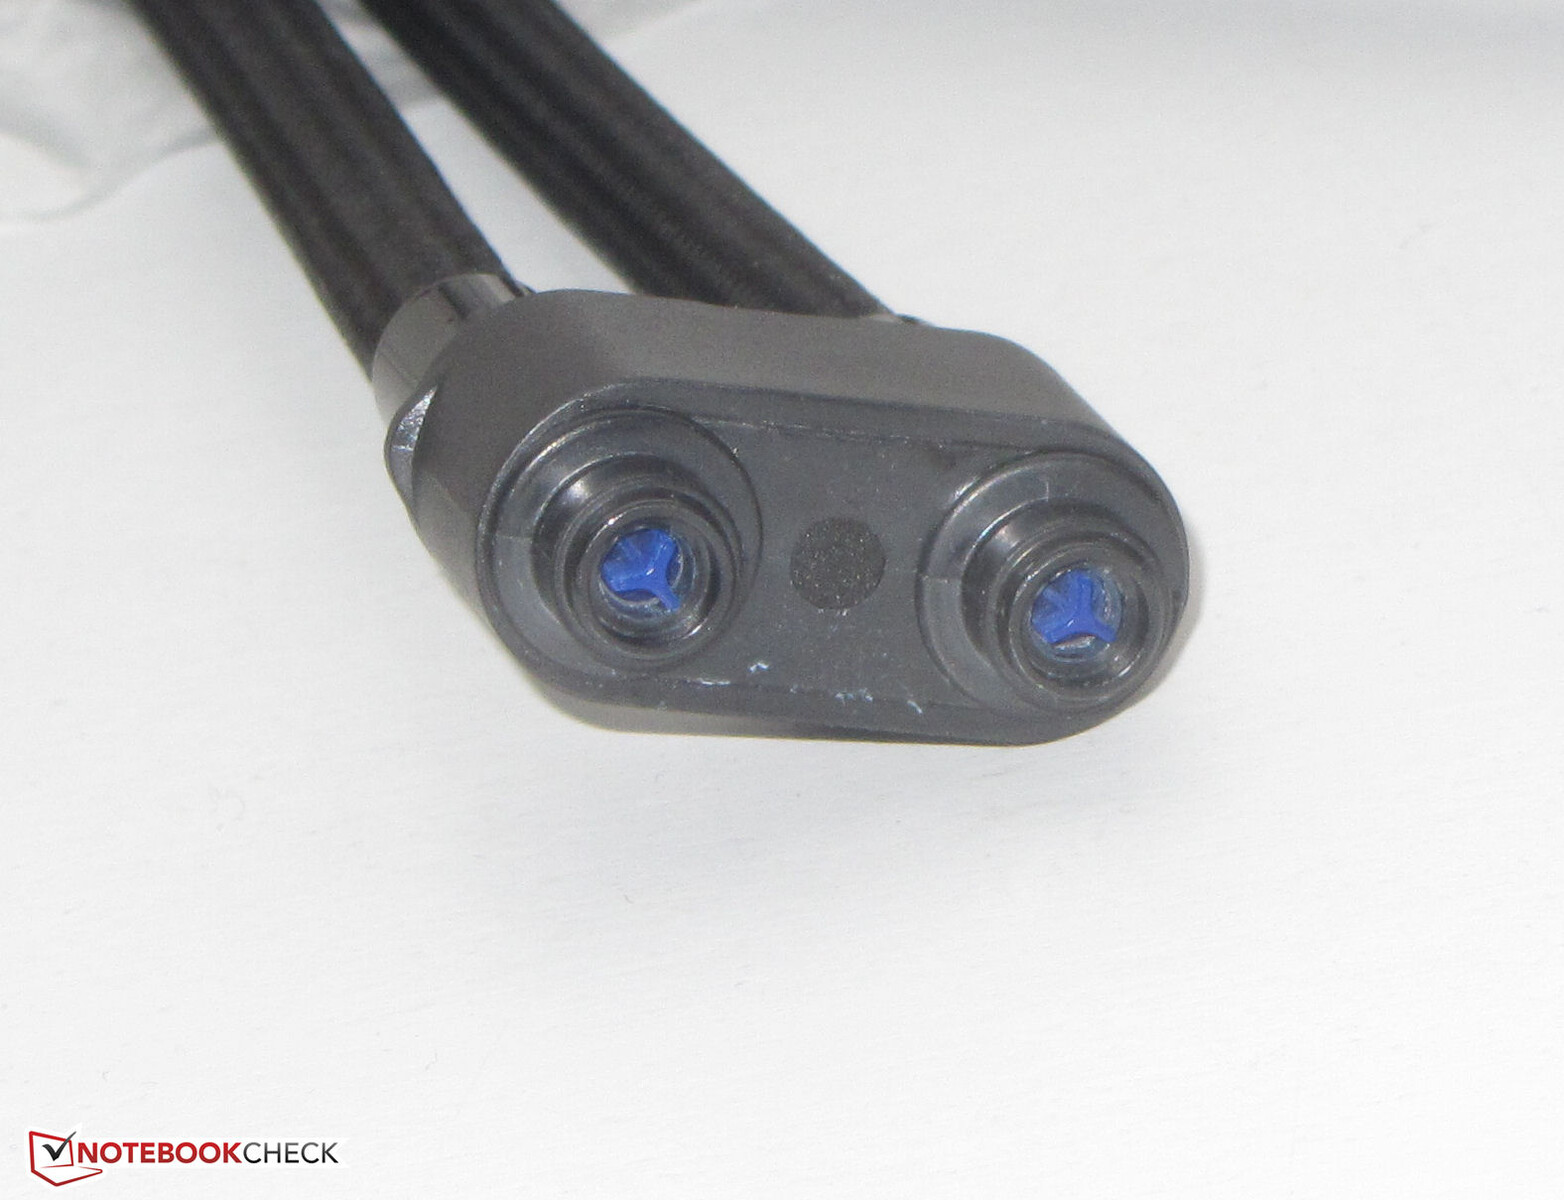
La piccola unità di raffreddamento è abbastanza facile da usare: basta riempirla di acqua distillata, collegare i cavi e i tubi e accenderla. Il portatile e l'unità di raffreddamento esterna comunicano tra loro tramite Bluetooth e la connessione viene stabilita automaticamente. Il caricabatterie del portatile alimenta sia l'X40 che l'unità di raffreddamento. I tubi dell'acqua sono tenuti in posizione magneticamente, senza bisogno di stringere le viti. Tuttavia, alcune gocce d'acqua possono fuoriuscire quando si scollegano i tubi.
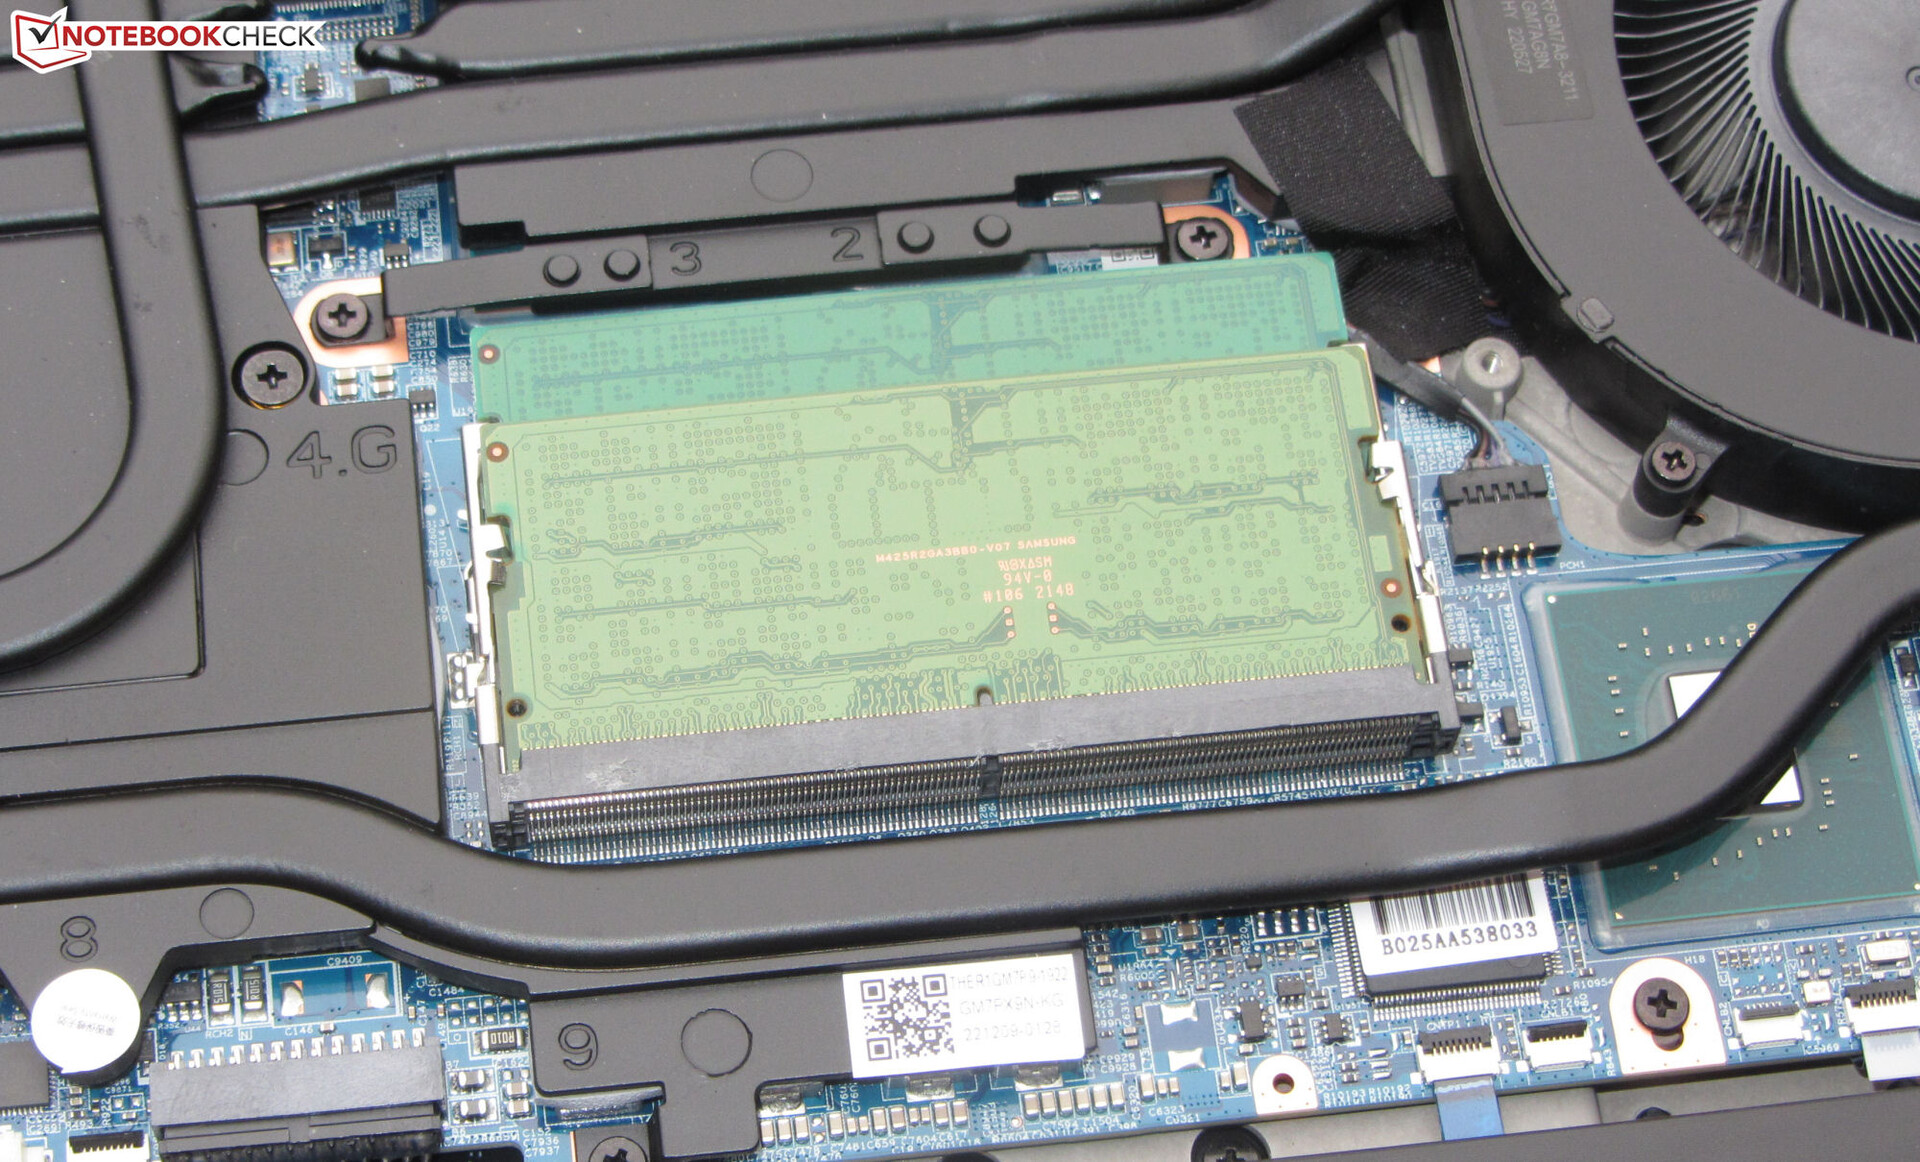
Manutenzione
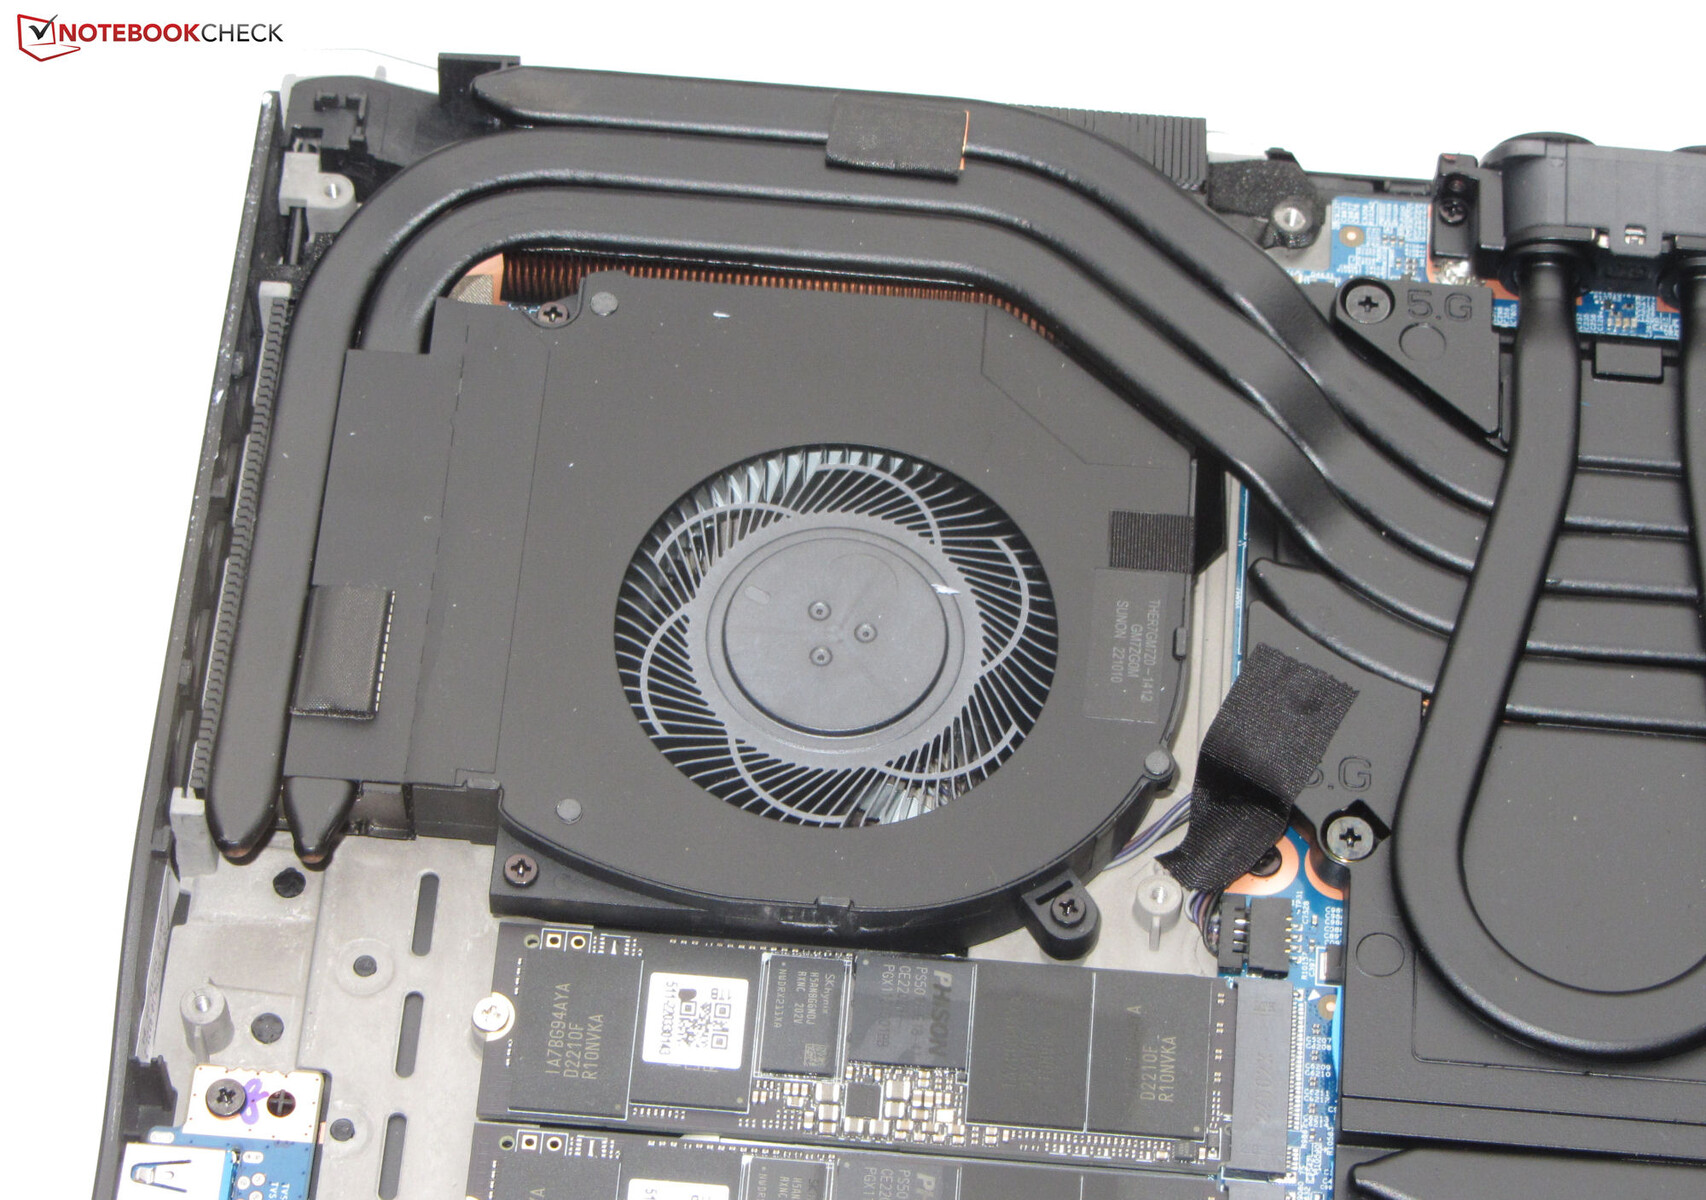
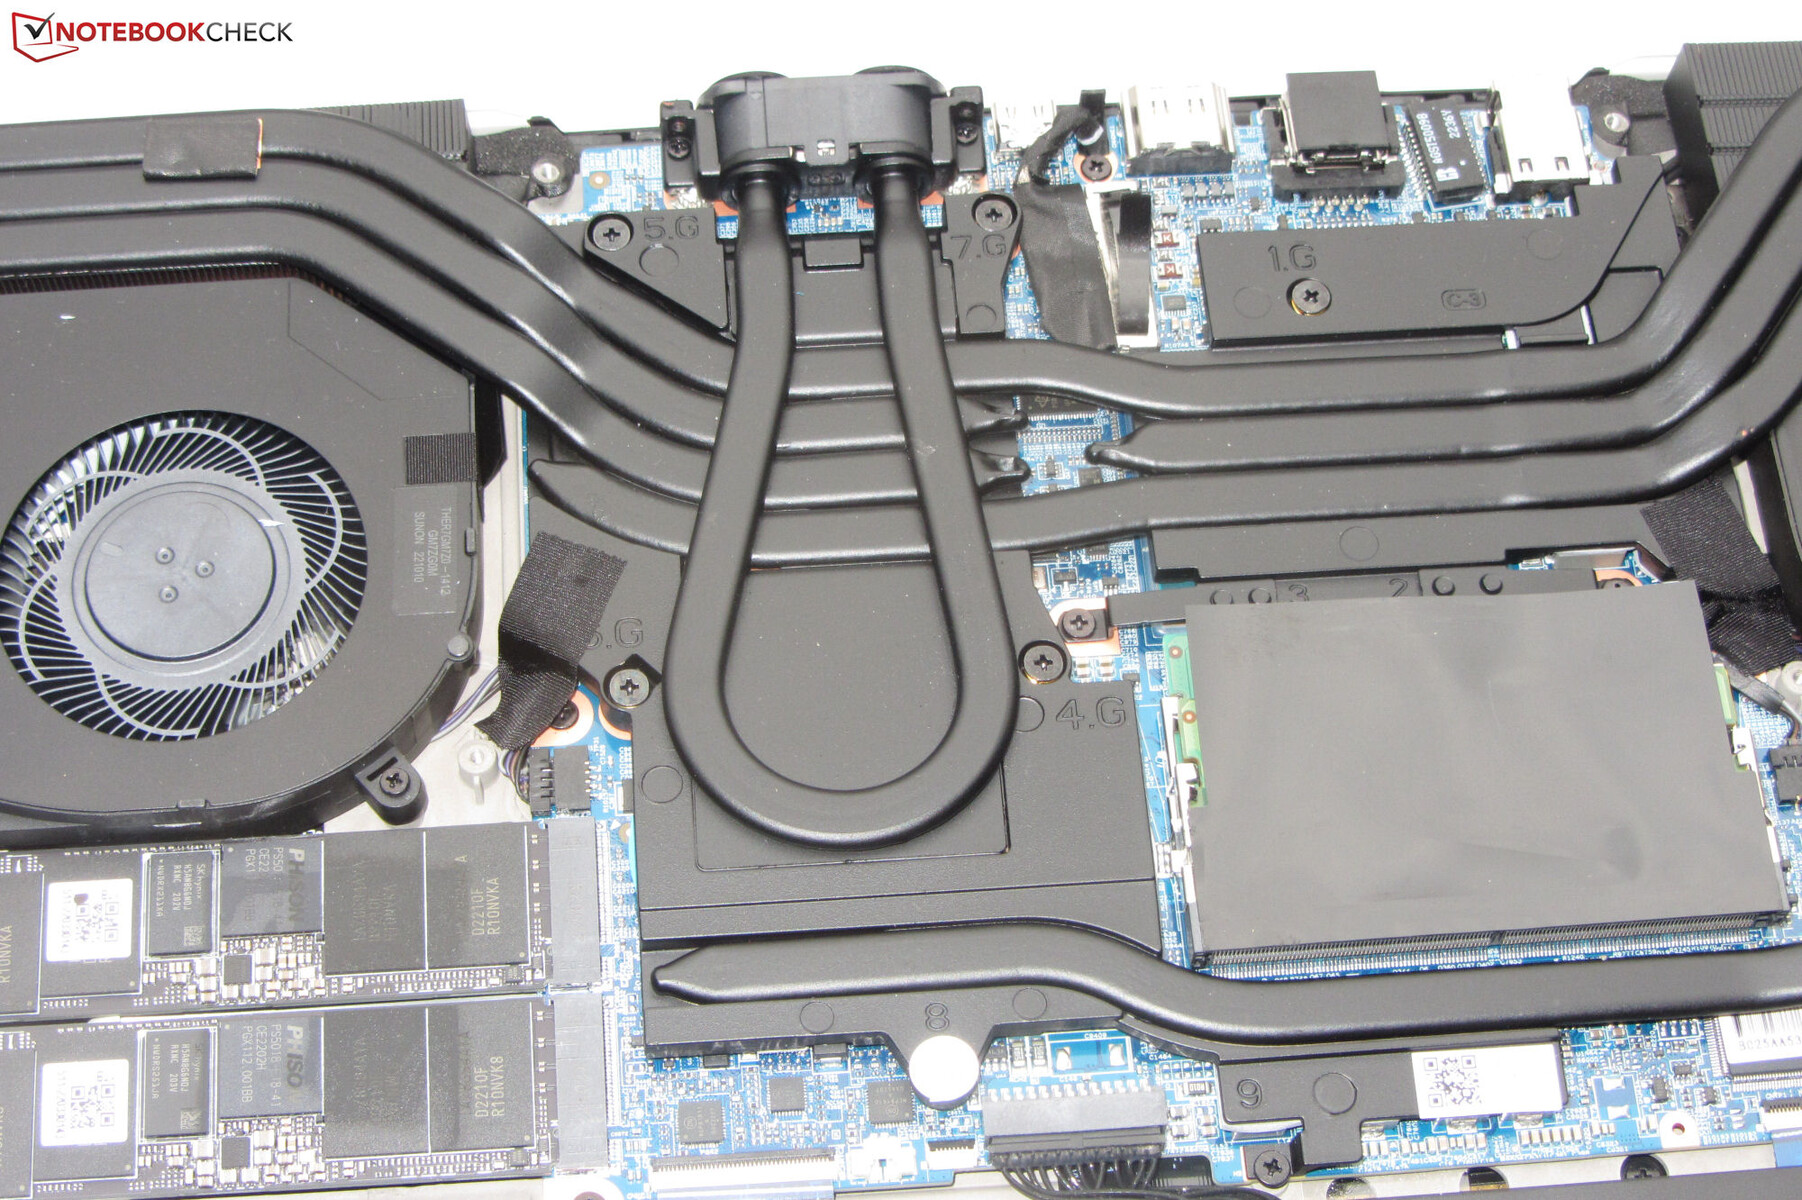
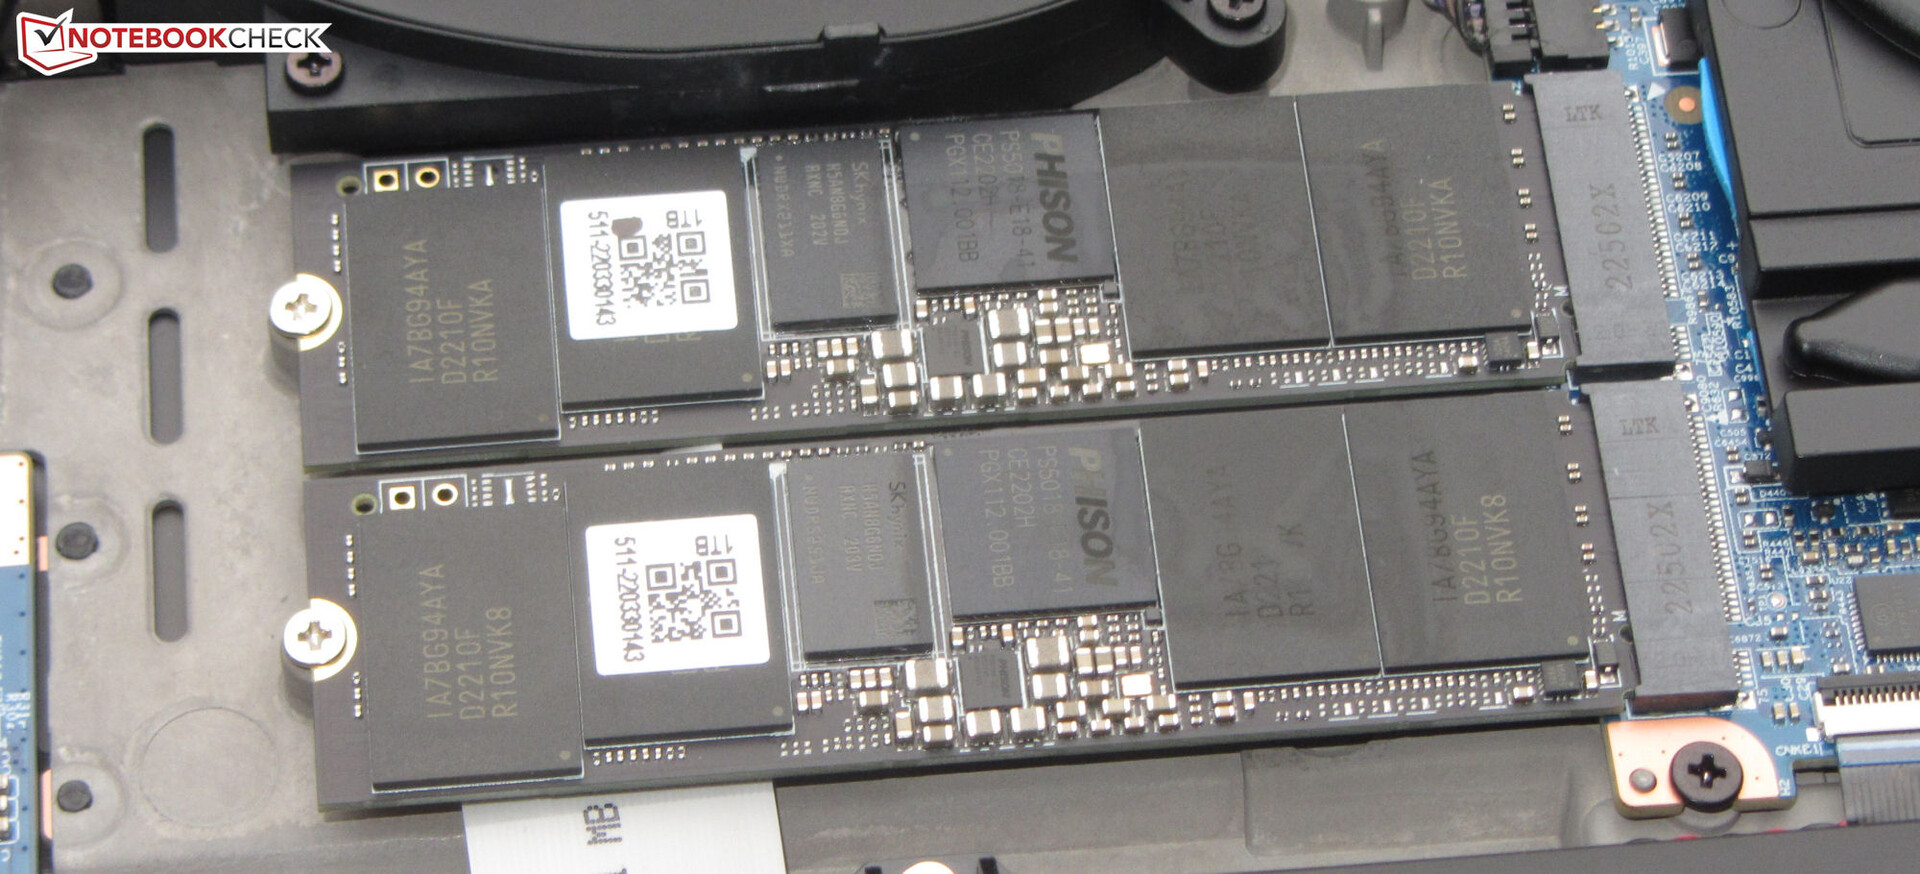
Per rimuovere il coperchio inferiore, è necessario allentare tutte le viti sul lato inferiore e altre due viti sul retro, accanto ai connettori di raffreddamento dell'acqua. Dopodiché, il coperchio inferiore può essere tirato via con un movimento brusco dalle prese d'aria di scarico. La rimozione del coperchio consente di accedere agli slot di memoria (entrambi in uso), alle due unità SSD PCIe 4.0, al modulo Wi-Fi, alle ventole, alla batteria del BIOS e alla batteria ricaricabile.
Garanzia
Medion offre una garanzia di due anni sull'Erazer. Sono disponibili opzioni di aggiornamento, ma devono essere acquistate insieme al portatile nel negozio online di Medion. Non è possibile aggiornare o estendere la garanzia dopo l'acquisto del portatile. L'estensione della garanzia di un anno costa quasi 200 euro (216 dollari).
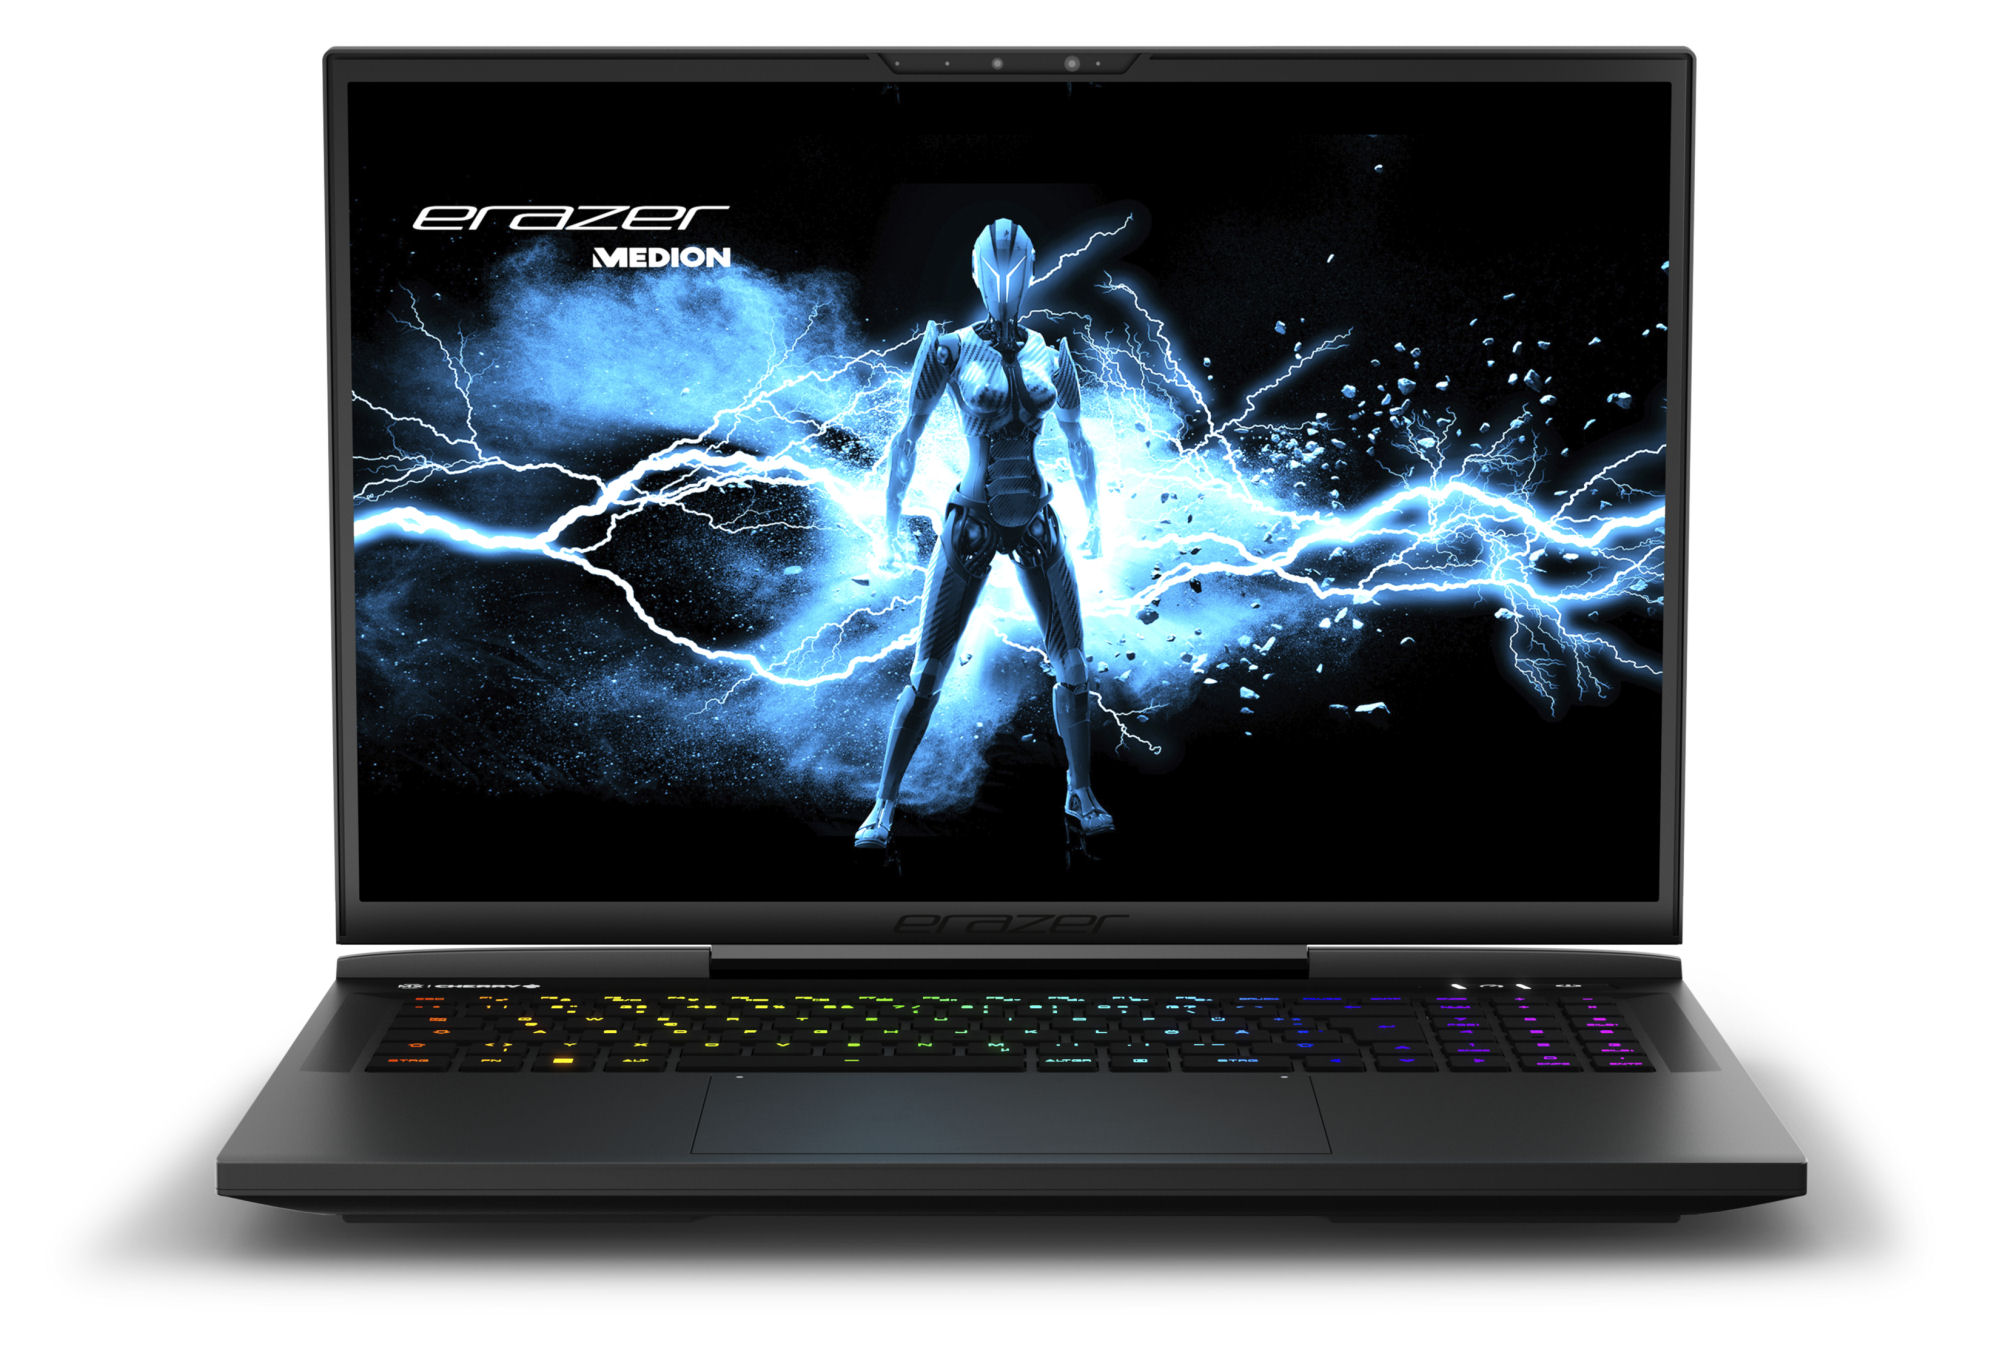
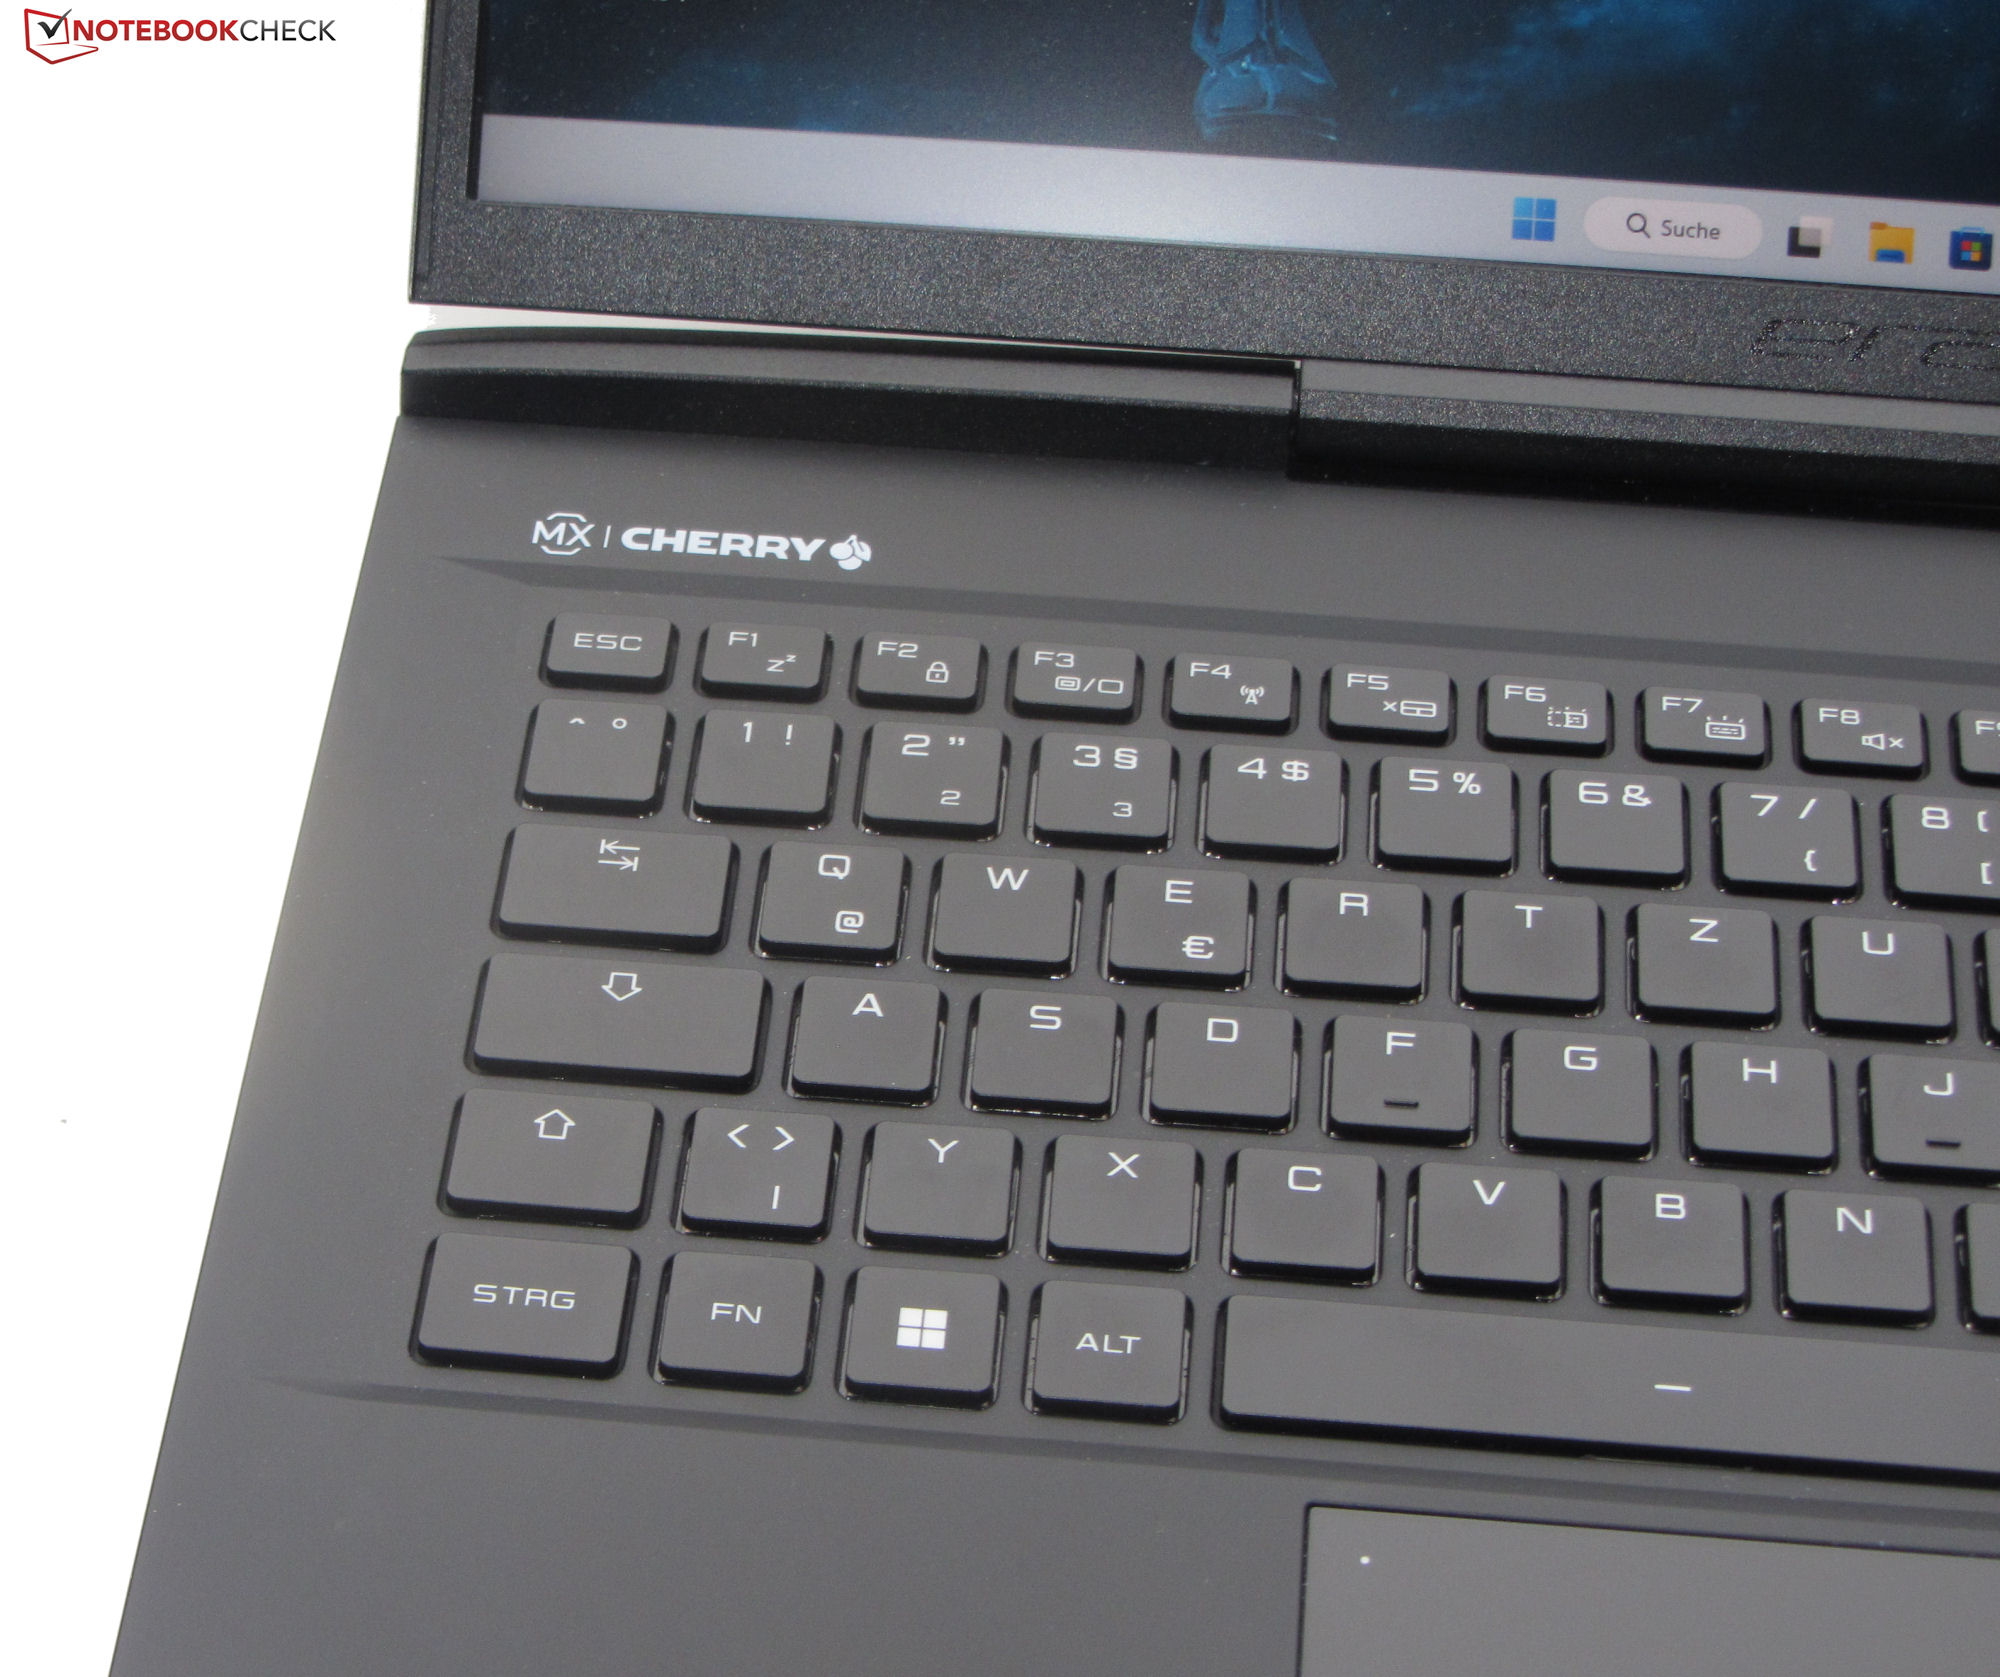
Dispositivi di input - Tastiera meccanica con interruttori Cherry MX
Tastiera
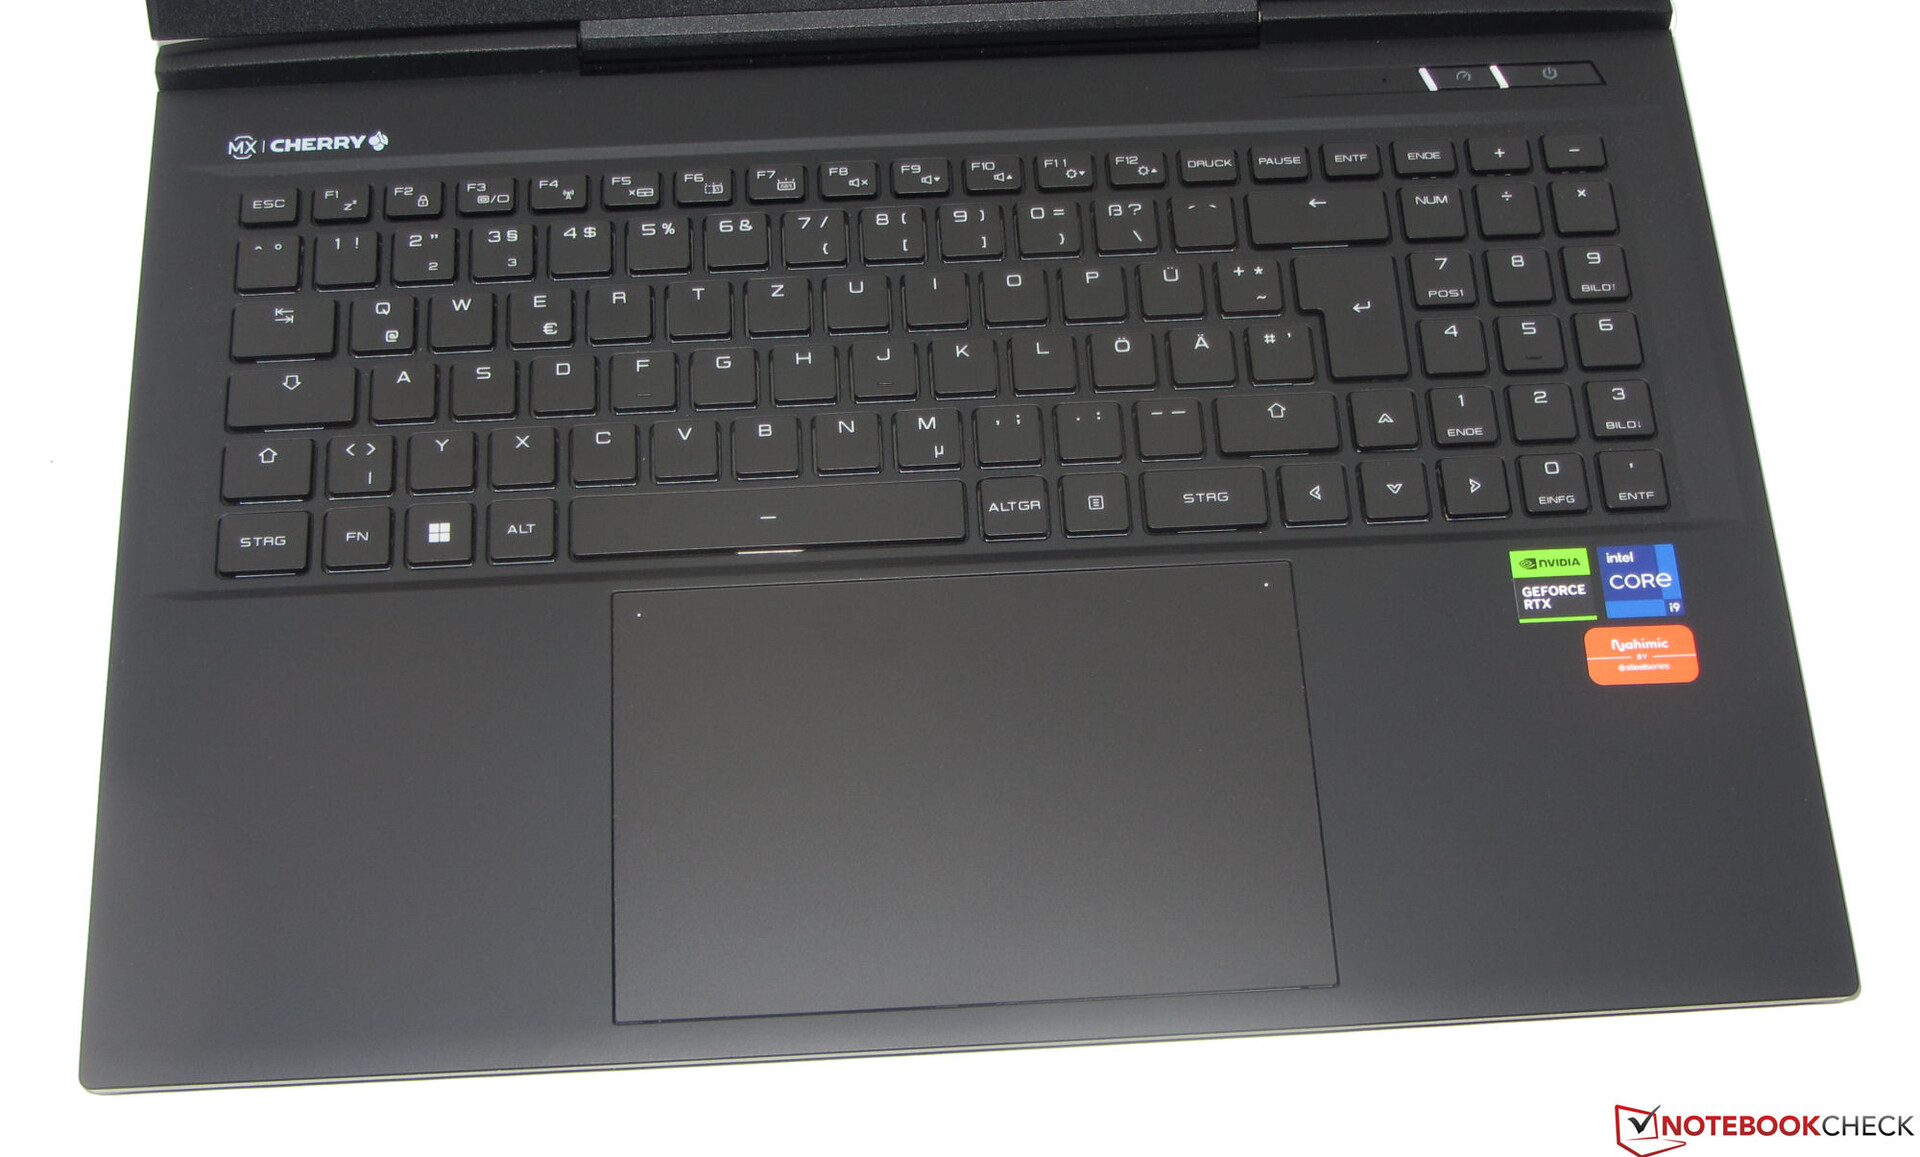
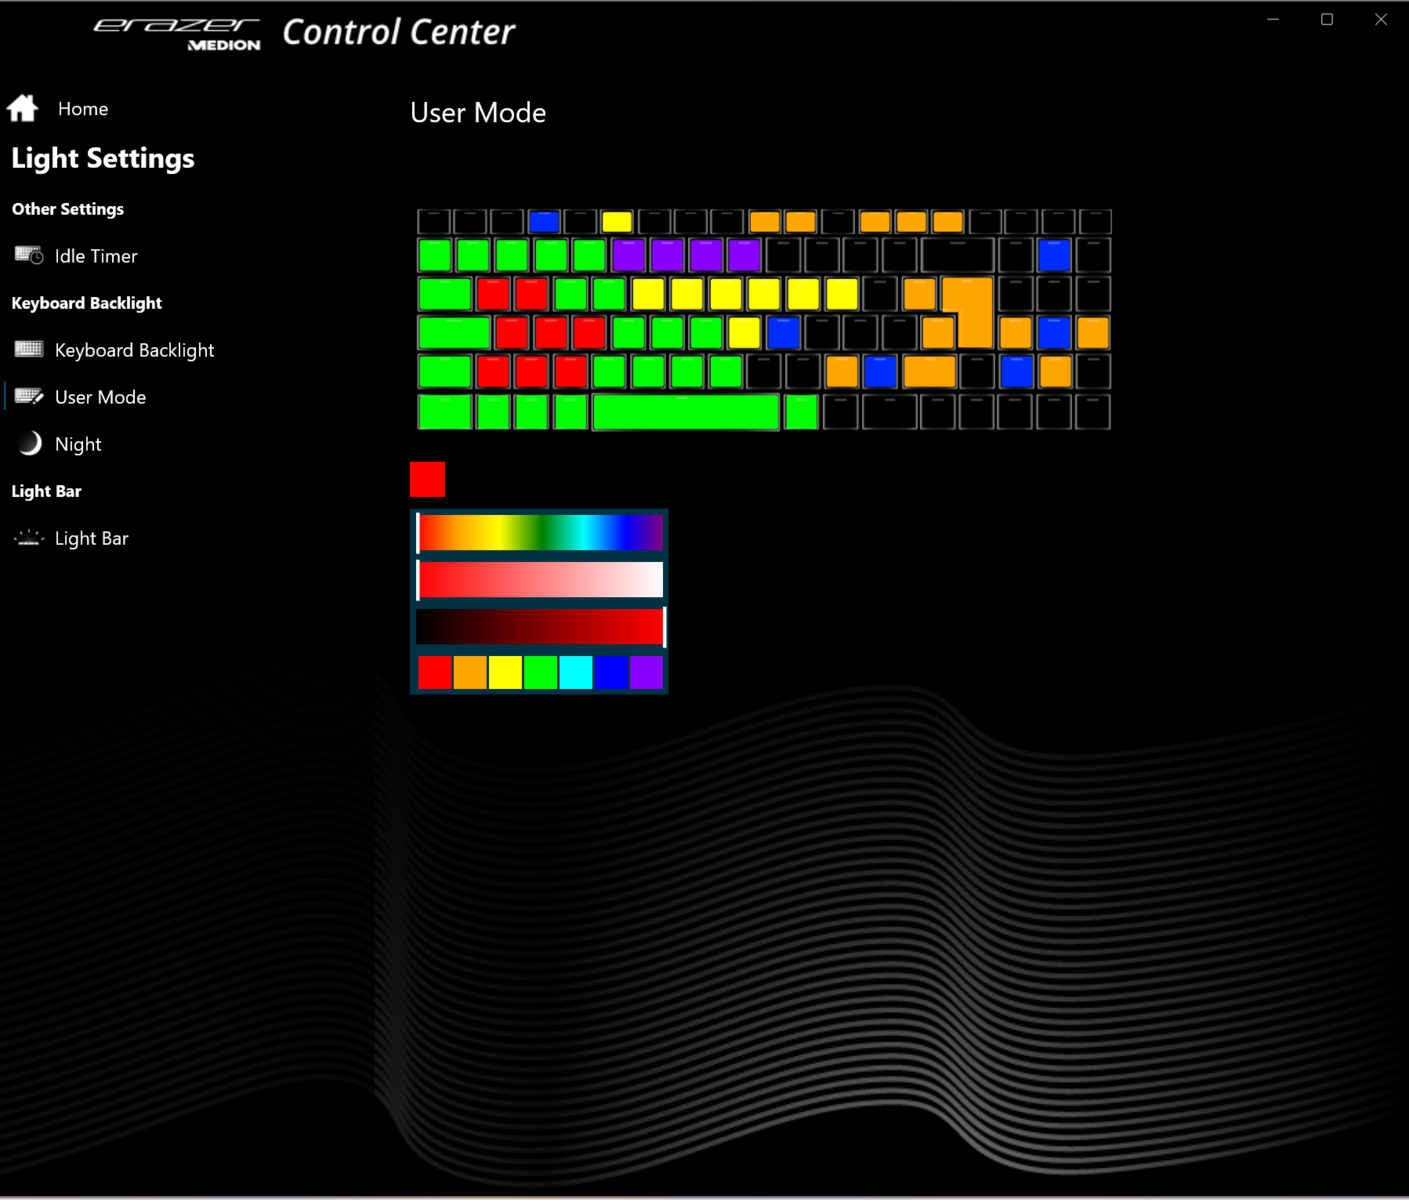
Le tastiere meccaniche sono generalmente note per la precisione degli input e del feedback, oltre che per la sensazione di digitazione di alto livello: la tastiera dell'X40 non è da meno. Gli interruttori Cherry MX offrono una corsa moderata e un punto di attuazione udibile e tattile. La tastiera non si flette durante la digitazione. Sono presenti due tasti funzione che consentono di regolare l'illuminazione RGB per tasto su uno dei quattro livelli di luminosità. Nel complesso, Erazer Beast X40 è una tastiera fantastica.
Touchpad
Con dimensioni di circa 15,5 x 10 cm (6,1 x 3,9"), il clickpad multitouch ha una superficie liscia che consente di far scorrere facilmente le dita. Offre una corsa breve e un punto di clic ben definito. Negli angoli superiori del pad sono presenti dei LED di stato. Toccando il LED di sinistra si attiva o disattiva l'intero touchpad, mentre il LED di destra serve per attivare o disattivare solo la metà destra del pad.
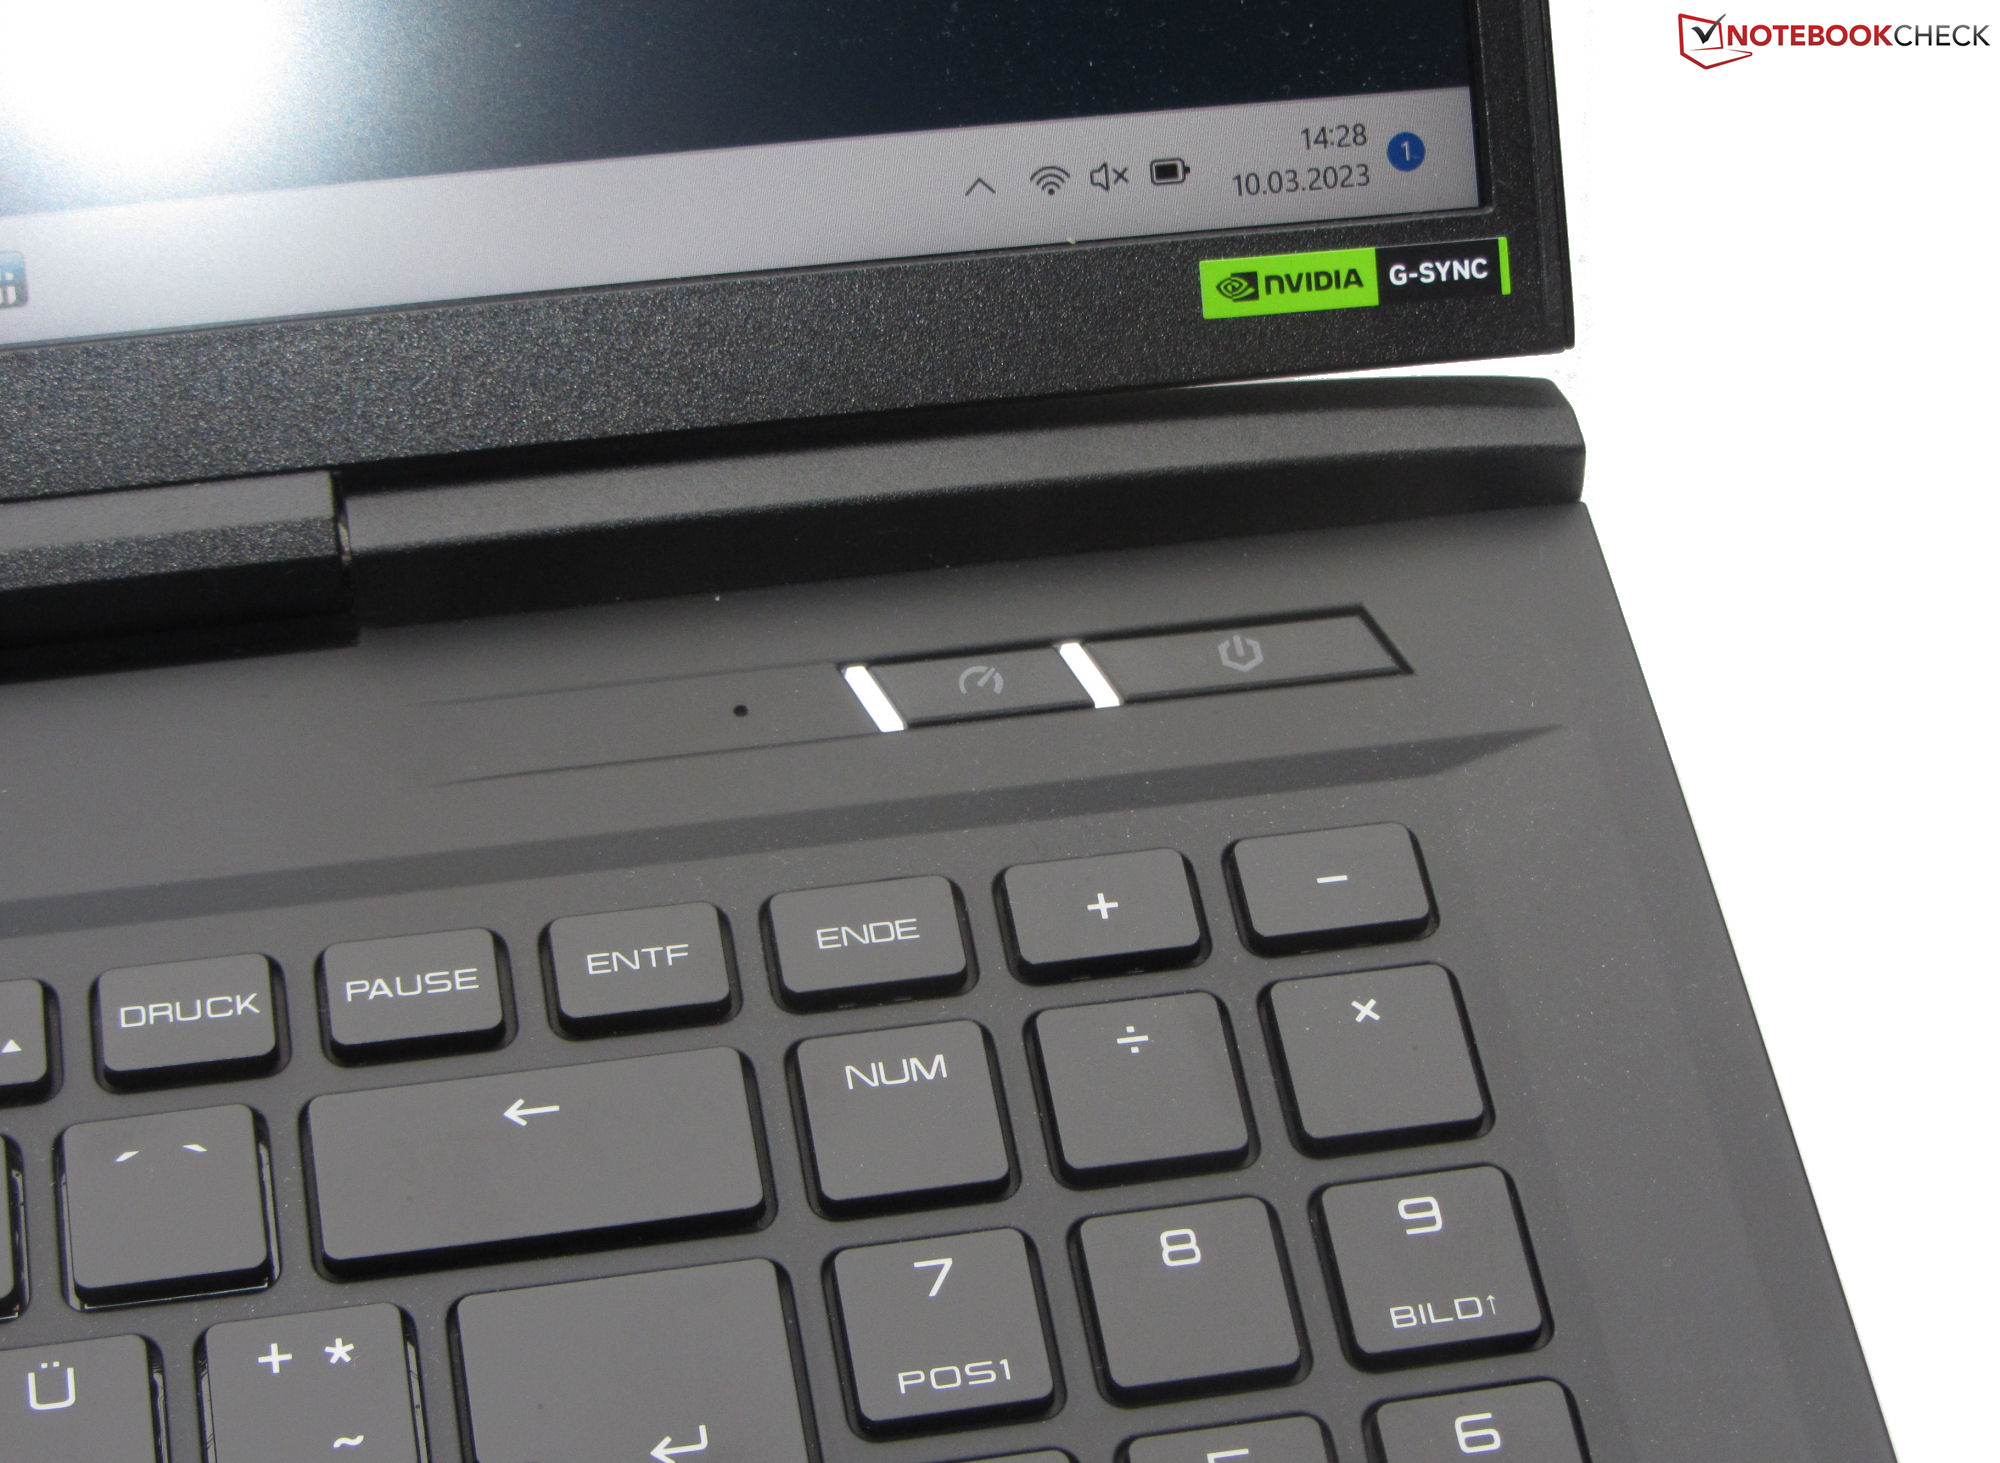
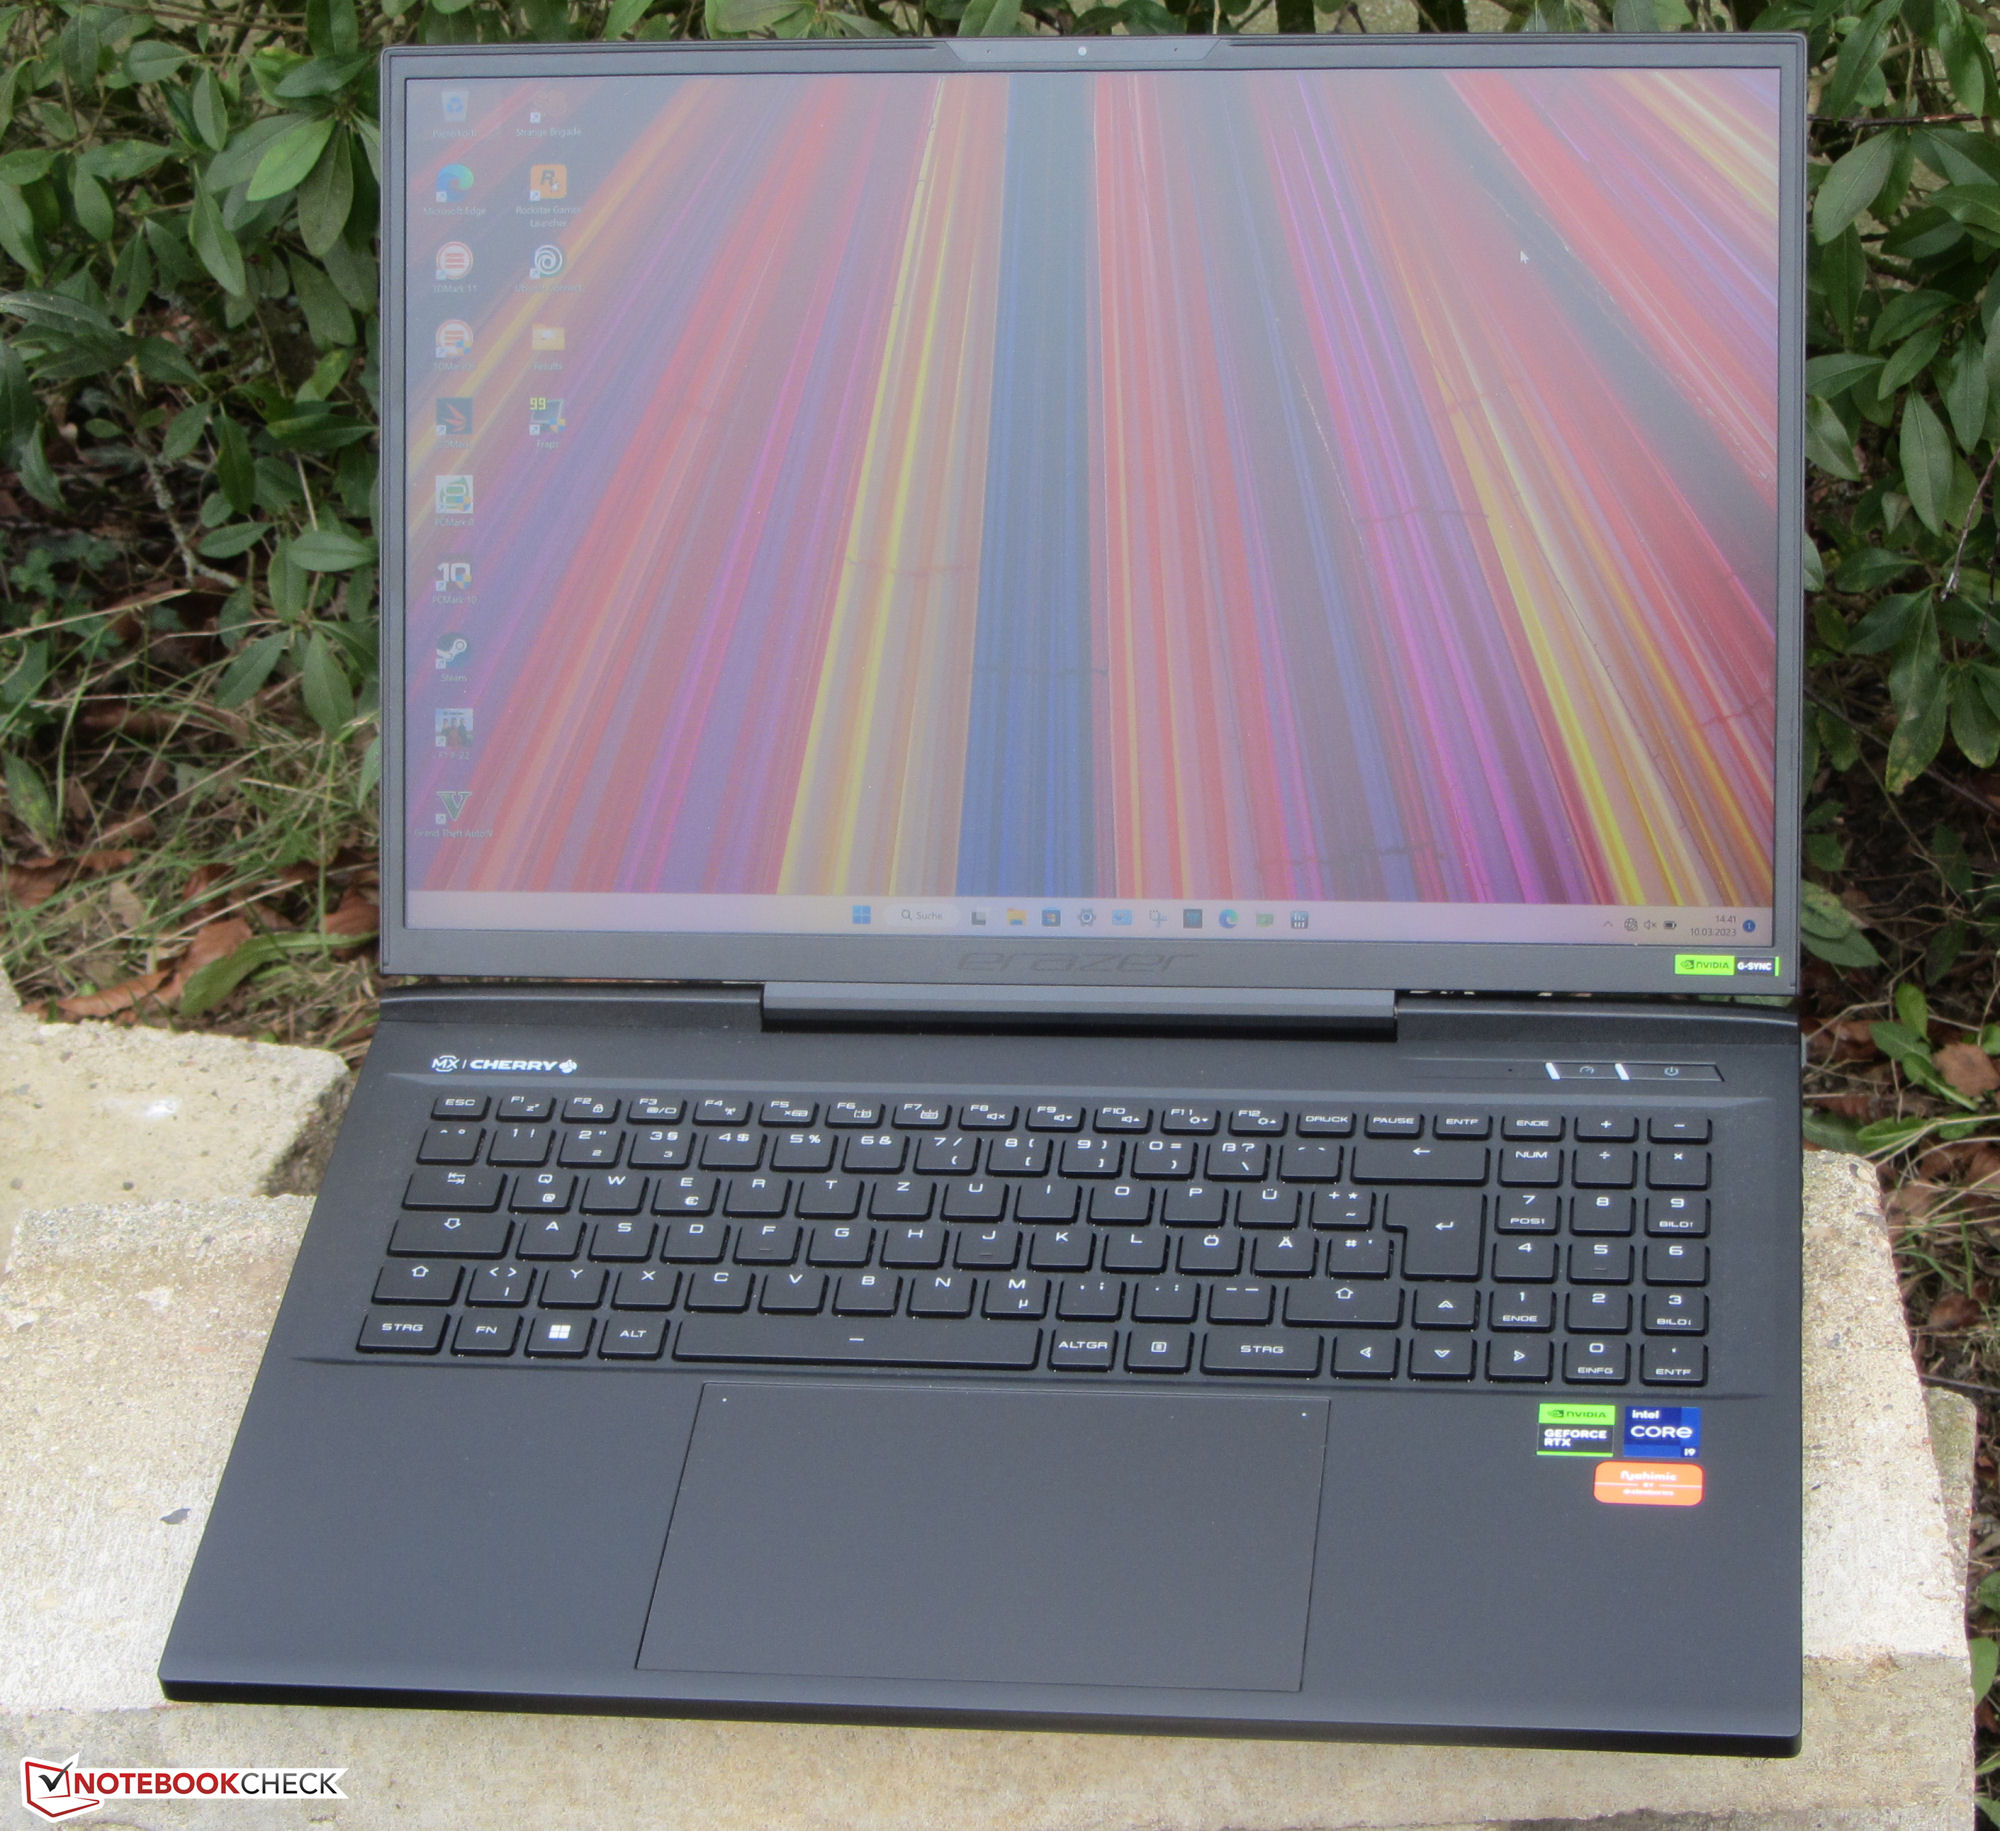
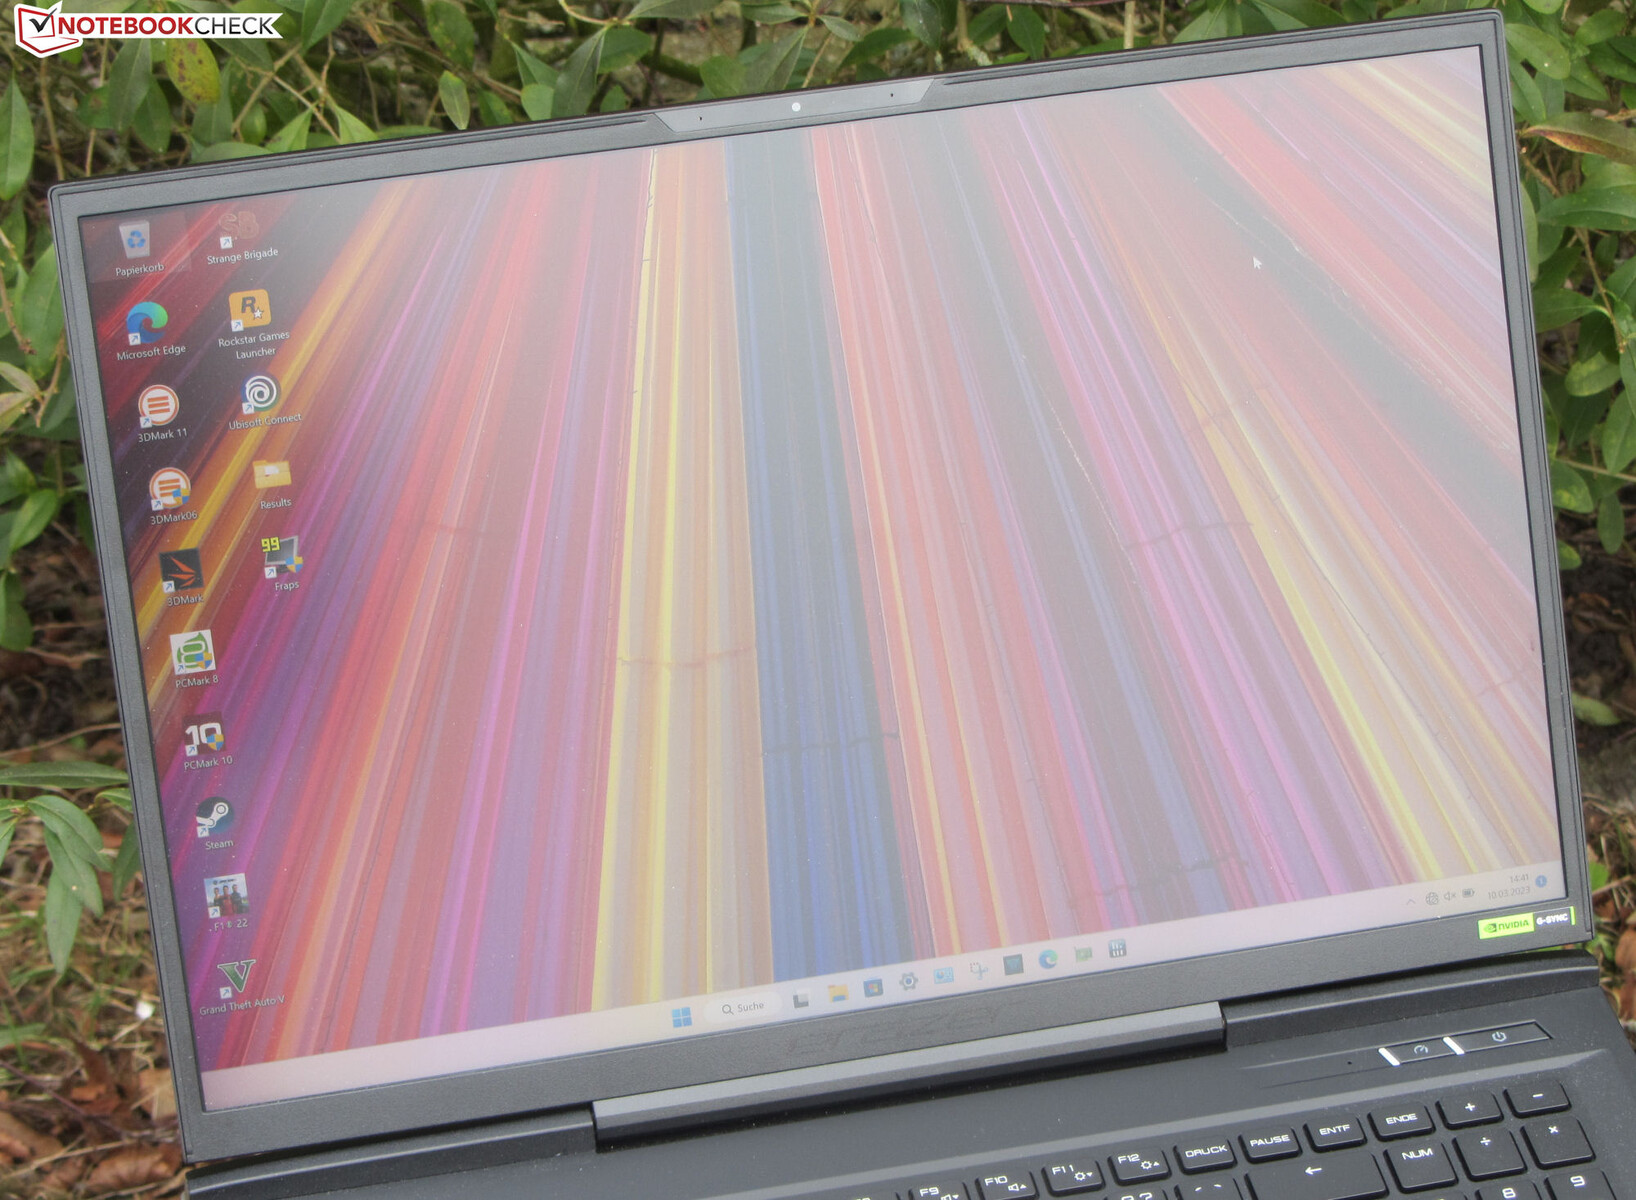
Display - QHD+ con rapporto di aspetto 16:10
Il display IPS opaco da 17 pollici (2.560 x 1.440) ha un rapporto di aspetto 16:10 e si distingue per la luminosità adeguata, i tempi di risposta rapidi, l'elevata frequenza di aggiornamento (240 Hz) e l'assenza di sfarfallio PWM. Tuttavia, il suo rapporto di contrasto è inferiore a quello considerato buono (>1.000:1).
Il pannello supporta G-Sync, una tecnologia che consente di adattare dinamicamente la frequenza di aggiornamento del display alla frequenza dei fotogrammi emessi dalla GPU. Questa tecnologia è progettata per offrire un'esperienza visiva più fluida, in particolare durante i giochi.
| |||||||||||||||||||||||||
Distribuzione della luminosità: 90 %
Al centro con la batteria: 384 cd/m²
Contrasto: 853:1 (Nero: 0.45 cd/m²)
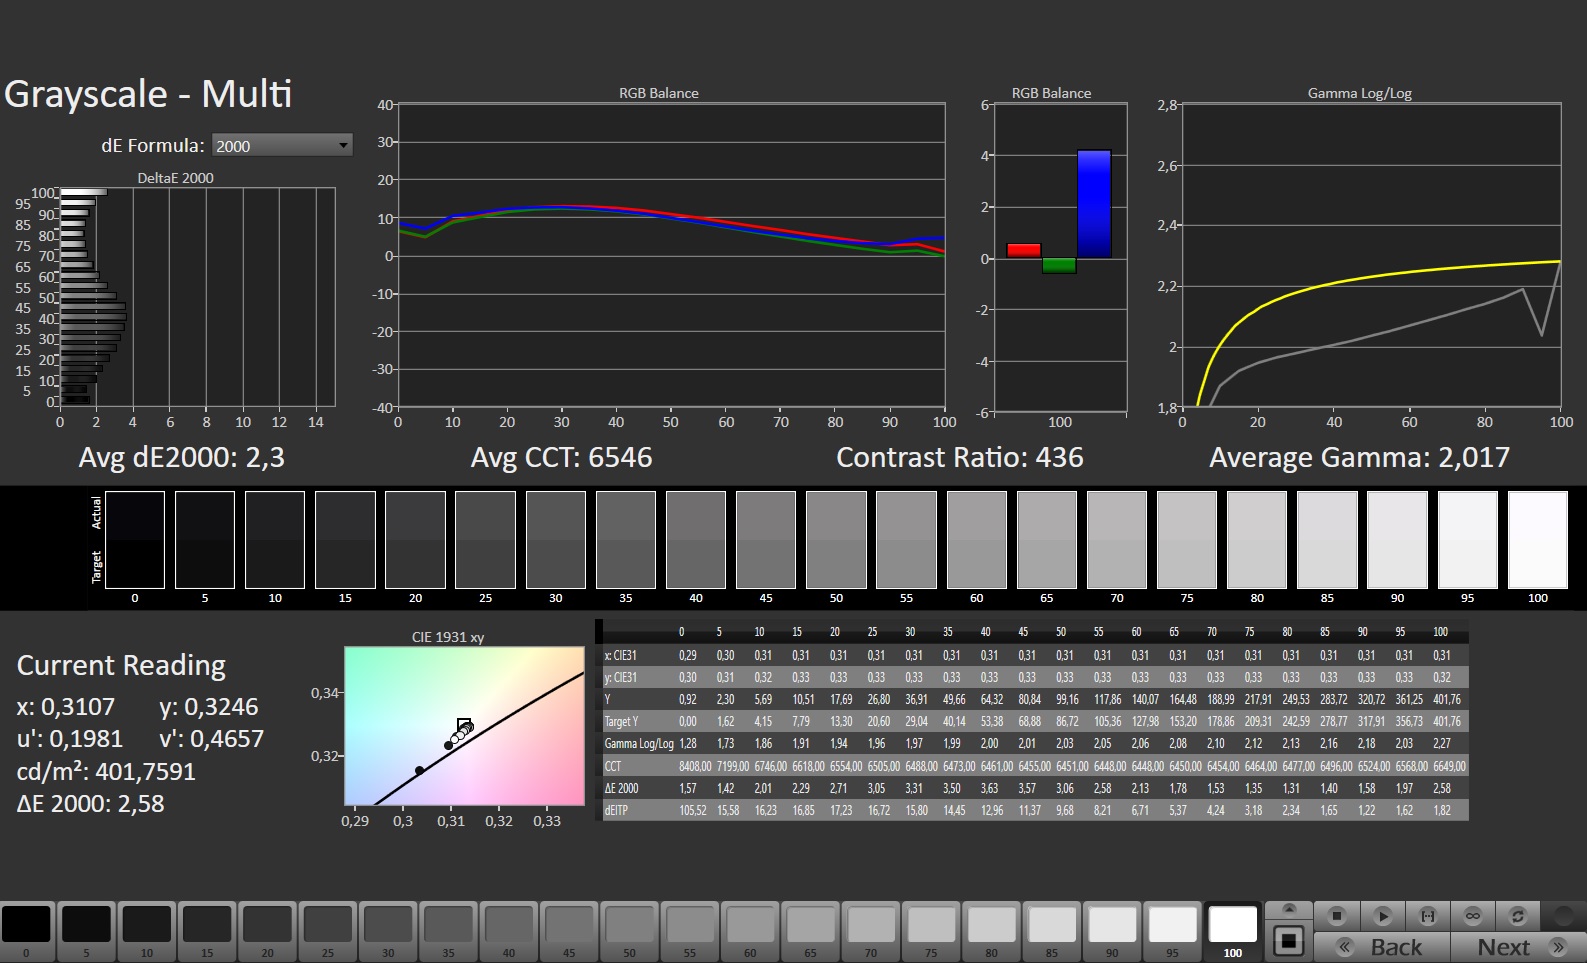
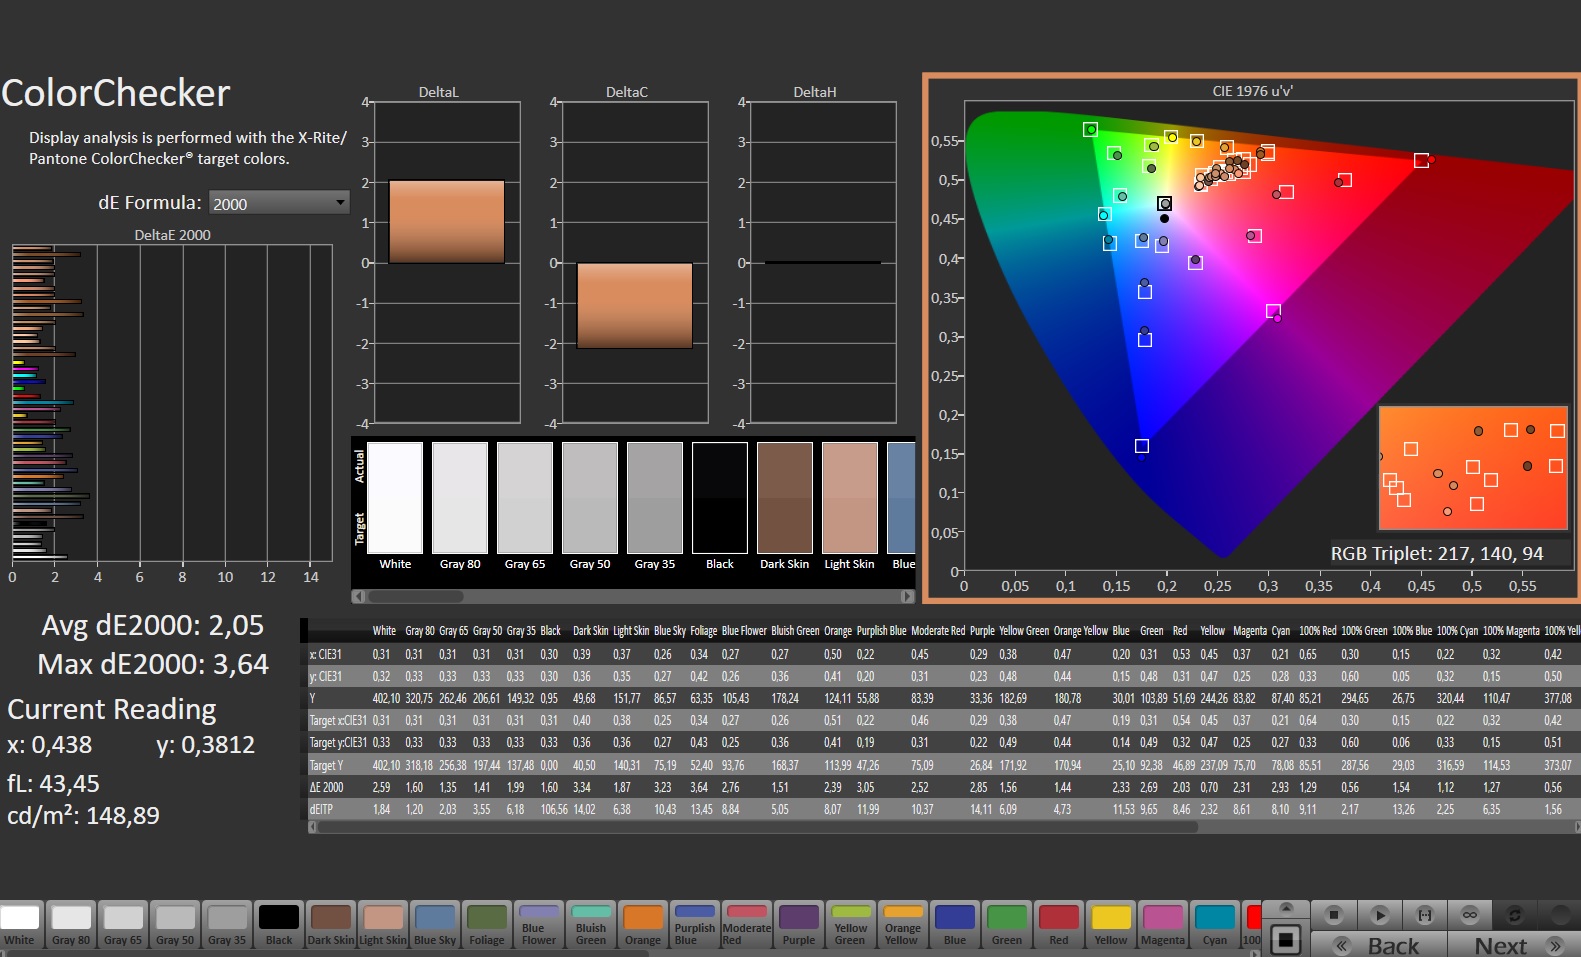
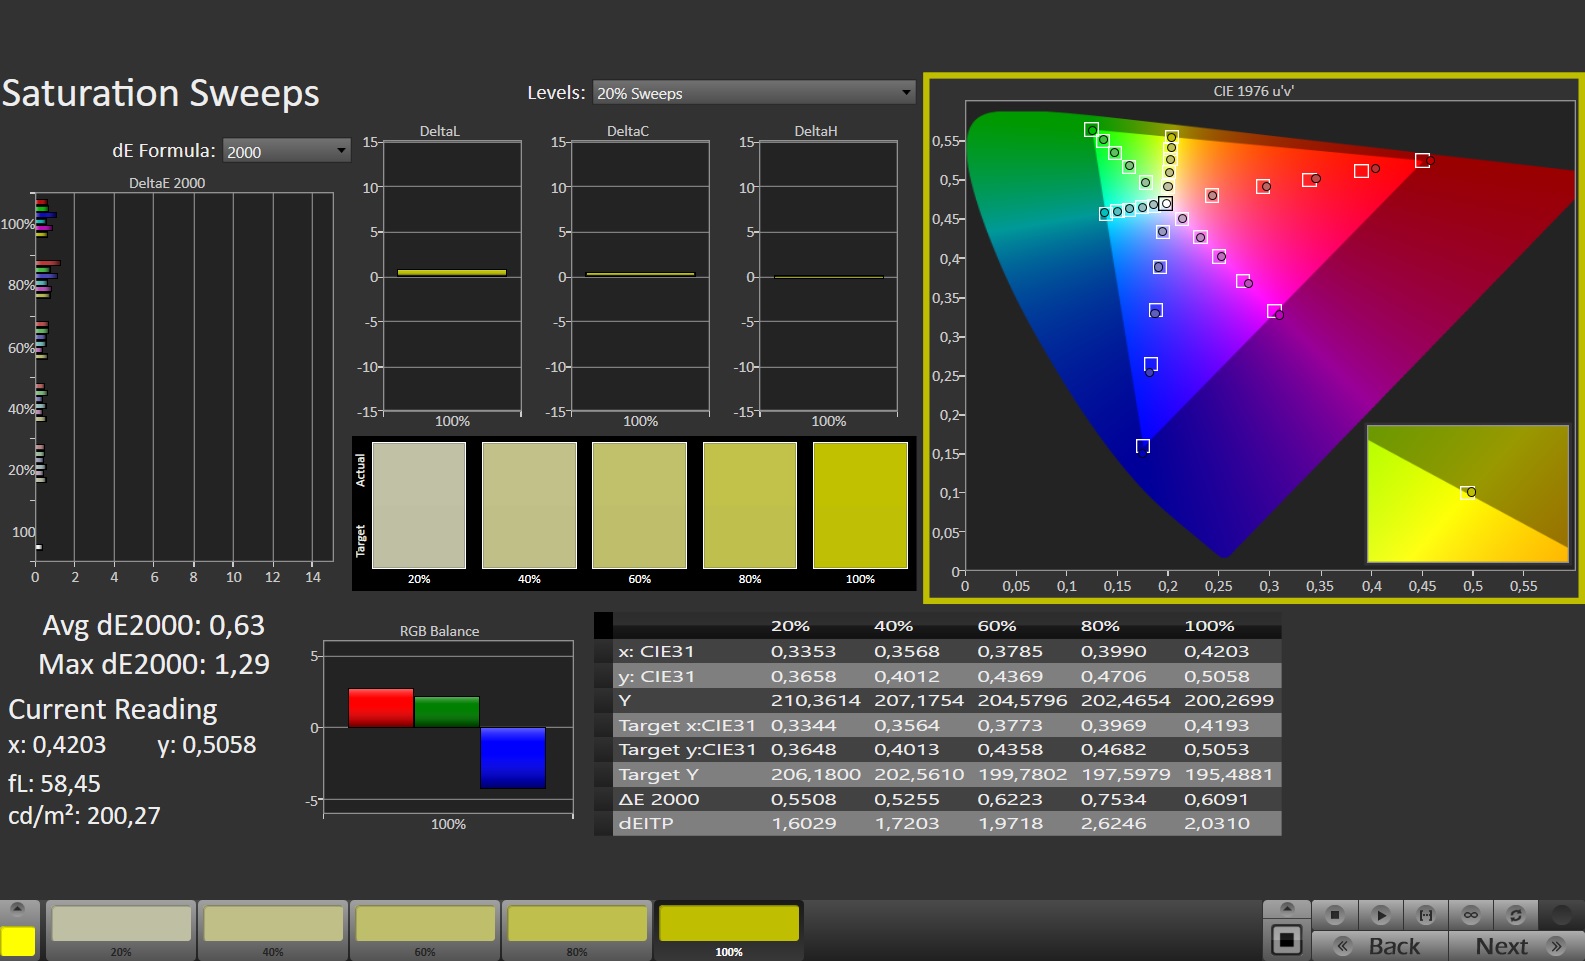
ΔE Color 2.05 | 0.5-29.43 Ø4.86, calibrated: 0.74
ΔE Greyscale 2.3 | 0.09-98 Ø5.1
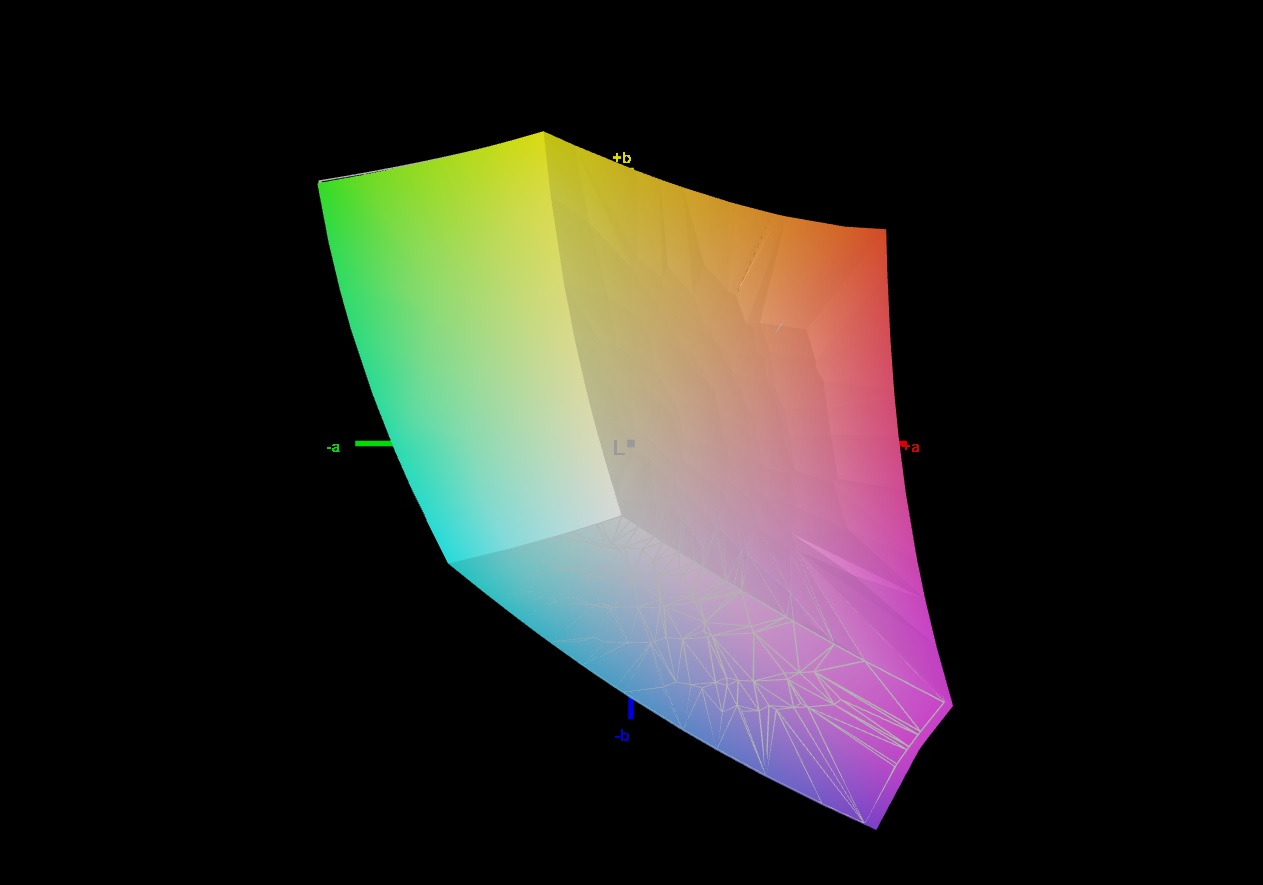
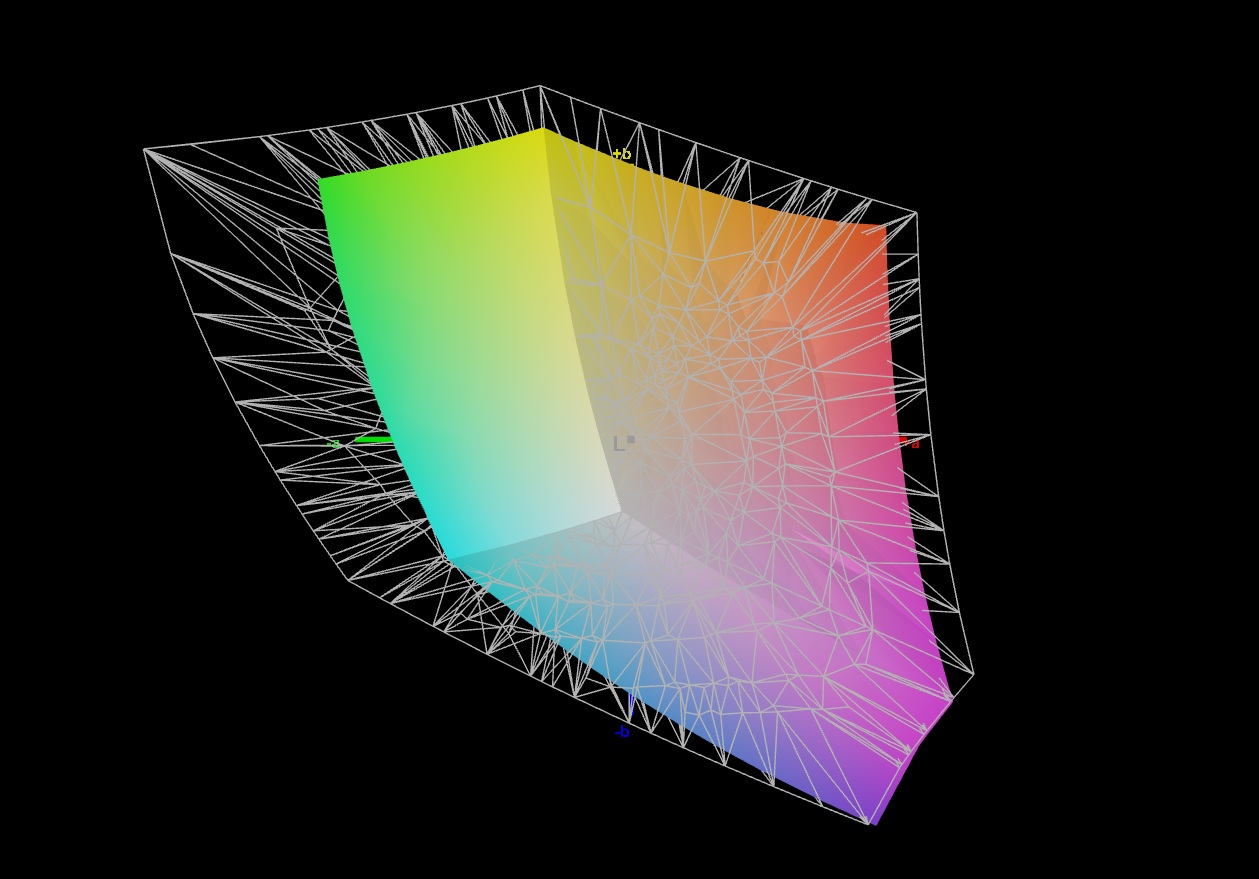
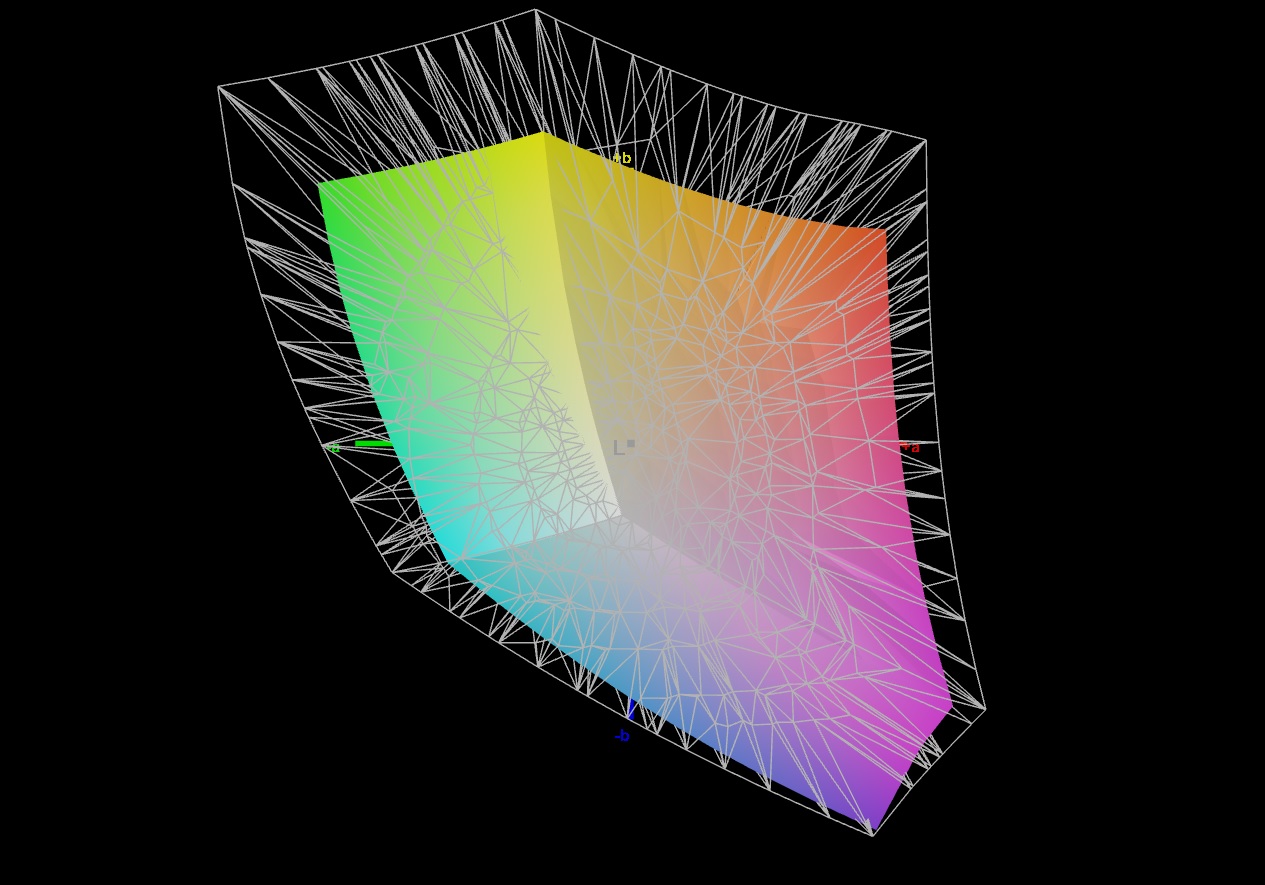
69.4% AdobeRGB 1998 (Argyll 2.2.0 3D)
99.8% sRGB (Argyll 2.2.0 3D)
68.6% Display P3 (Argyll 2.2.0 3D)
Gamma: 2.017
| Medion Erazer Beast X40 BOE NE170QDM-NZ1, IPS, 2560x1600, 17" | MSI Titan GT77 HX 13VI B173ZAN06.C, Mini-LED, 3840x2160, 17.3" | Razer Blade 16 Early 2023 CSOT T3 MNG007DA4-1, IPS, 2560x1600, 16" | SCHENKER XMG Neo 17 M22 BOE0A99, IPS, 2560x1600, 17" | Alienware x17 R2 P48E AU Optronics B173HAN, IPS, 1920x1080, 17.3" | Asus ROG Strix Scar 18 2023 G834JY-N6005W NE180QDM-NZ2, IPS, 2560x1600, 18" | |
|---|---|---|---|---|---|---|
| Display | 24% | 24% | 0% | 10% | 21% | |
| Display P3 Coverage | 68.6 | 94.9 38% | 98.5 44% | 69 1% | 79.2 15% | 97.2 42% |
| sRGB Coverage | 99.8 | 99.9 0% | 100 0% | 99.8 0% | 99.8 0% | 99.9 0% |
| AdobeRGB 1998 Coverage | 69.4 | 92.4 33% | 89.7 29% | 69.6 0% | 79.6 15% | 84.9 22% |
| Response Times | -248% | -9% | 12% | -17% | 19% | |
| Response Time Grey 50% / Grey 80% * | 11.3 ? | 38.4 ? -240% | 6.6 ? 42% | 10.8 ? 4% | 12.4 ? -10% | 5.41 ? 52% |
| Response Time Black / White * | 7.5 ? | 26.6 ? -255% | 12 ? -60% | 6.1 ? 19% | 9.2 ? -23% | 8.62 ? -15% |
| PWM Frequency | 2380 ? | |||||
| Screen | 78886% | -6% | 11% | -22% | -92% | |
| Brightness middle | 384 | 606 58% | 456.8 19% | 415 8% | 365.4 -5% | 490 28% |
| Brightness | 377 | 602 60% | 437 16% | 399 6% | 344 -9% | 468 24% |
| Brightness Distribution | 90 | 93 3% | 83 -8% | 90 0% | 85 -6% | 86 -4% |
| Black Level * | 0.45 | 0.0001 100% | 0.35 22% | 0.43 4% | 0.29 36% | 0.54 -20% |
| Contrast | 853 | 6060000 710334% | 1305 53% | 965 13% | 1260 48% | 907 6% |
| Colorchecker dE 2000 * | 2.05 | 4.8 -134% | 3.7 -80% | 1.44 30% | 3.17 -55% | 4.97 -142% |
| Colorchecker dE 2000 max. * | 3.64 | 8.2 -125% | 6.42 -76% | 2.33 36% | 7.69 -111% | 11.02 -203% |
| Colorchecker dE 2000 calibrated * | 0.74 | 1.8 -143% | 0.66 11% | 0.89 -20% | 0.51 31% | 2.97 -301% |
| Greyscale dE 2000 * | 2.3 | 6.5 -183% | 2.6 -13% | 1.8 22% | 5.3 -130% | 7.2 -213% |
| Gamma | 2.017 109% | 2.63 84% | 2.3 96% | 2.132 103% | 2.18 101% | 2.161 102% |
| CCT | 6546 99% | 6596 99% | 6108 106% | 6327 103% | 5879 111% | 6515 100% |
| Media totale (Programma / Settaggio) | 26221% /
50682% | 3% /
-0% | 8% /
9% | -10% /
-15% | -17% /
-52% |
* ... Meglio usare valori piccoli
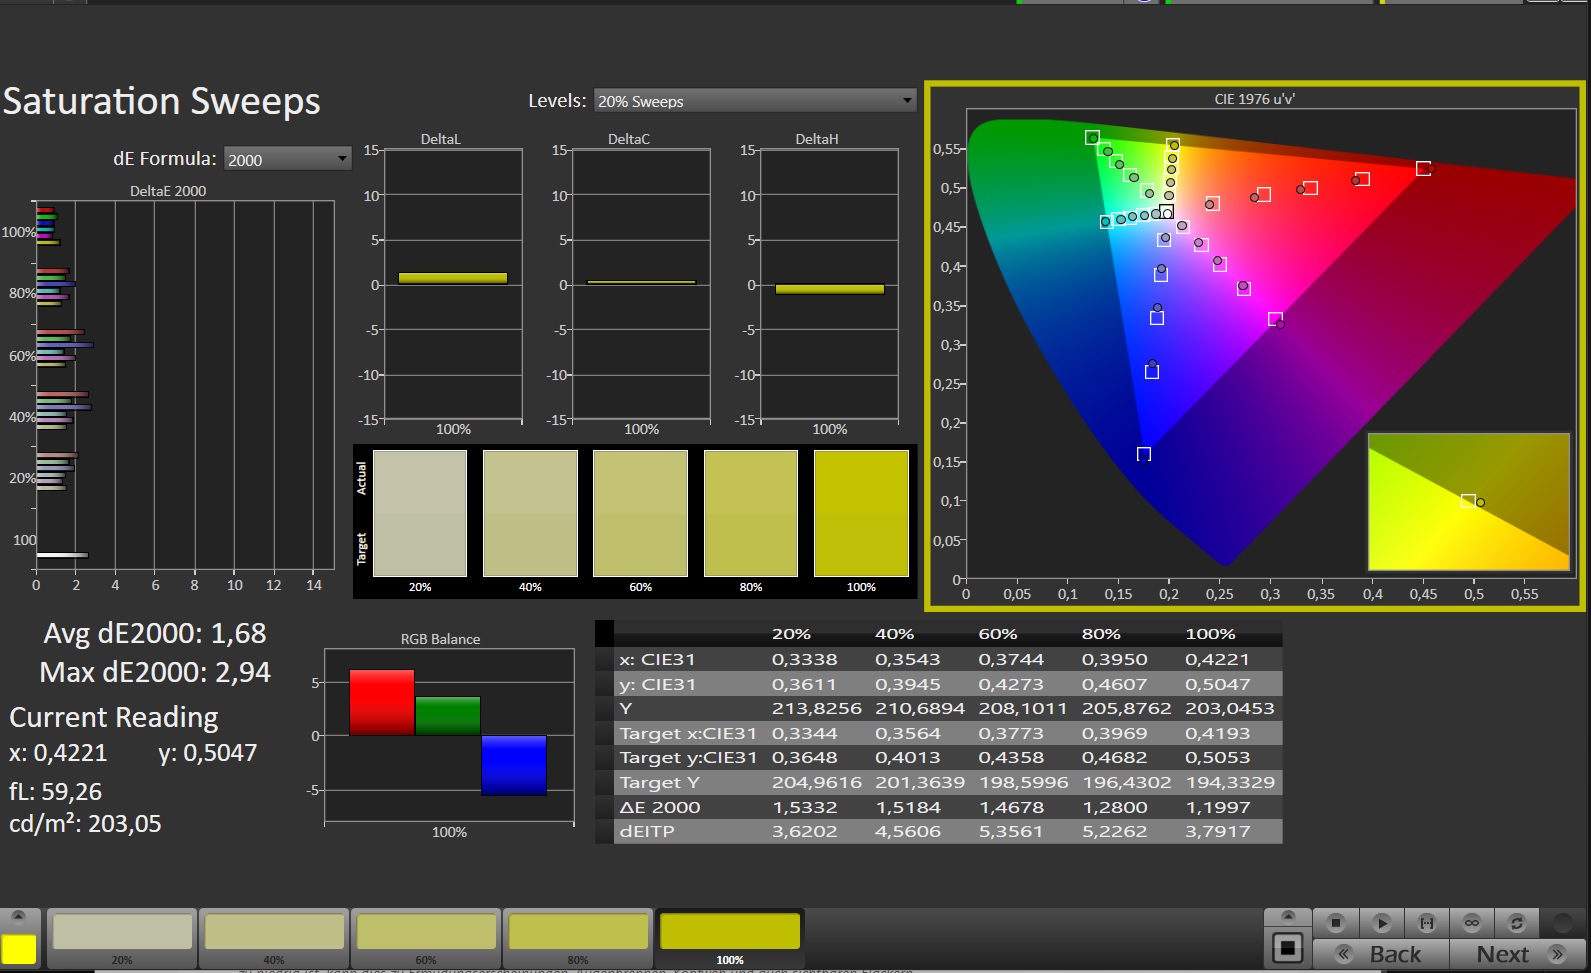
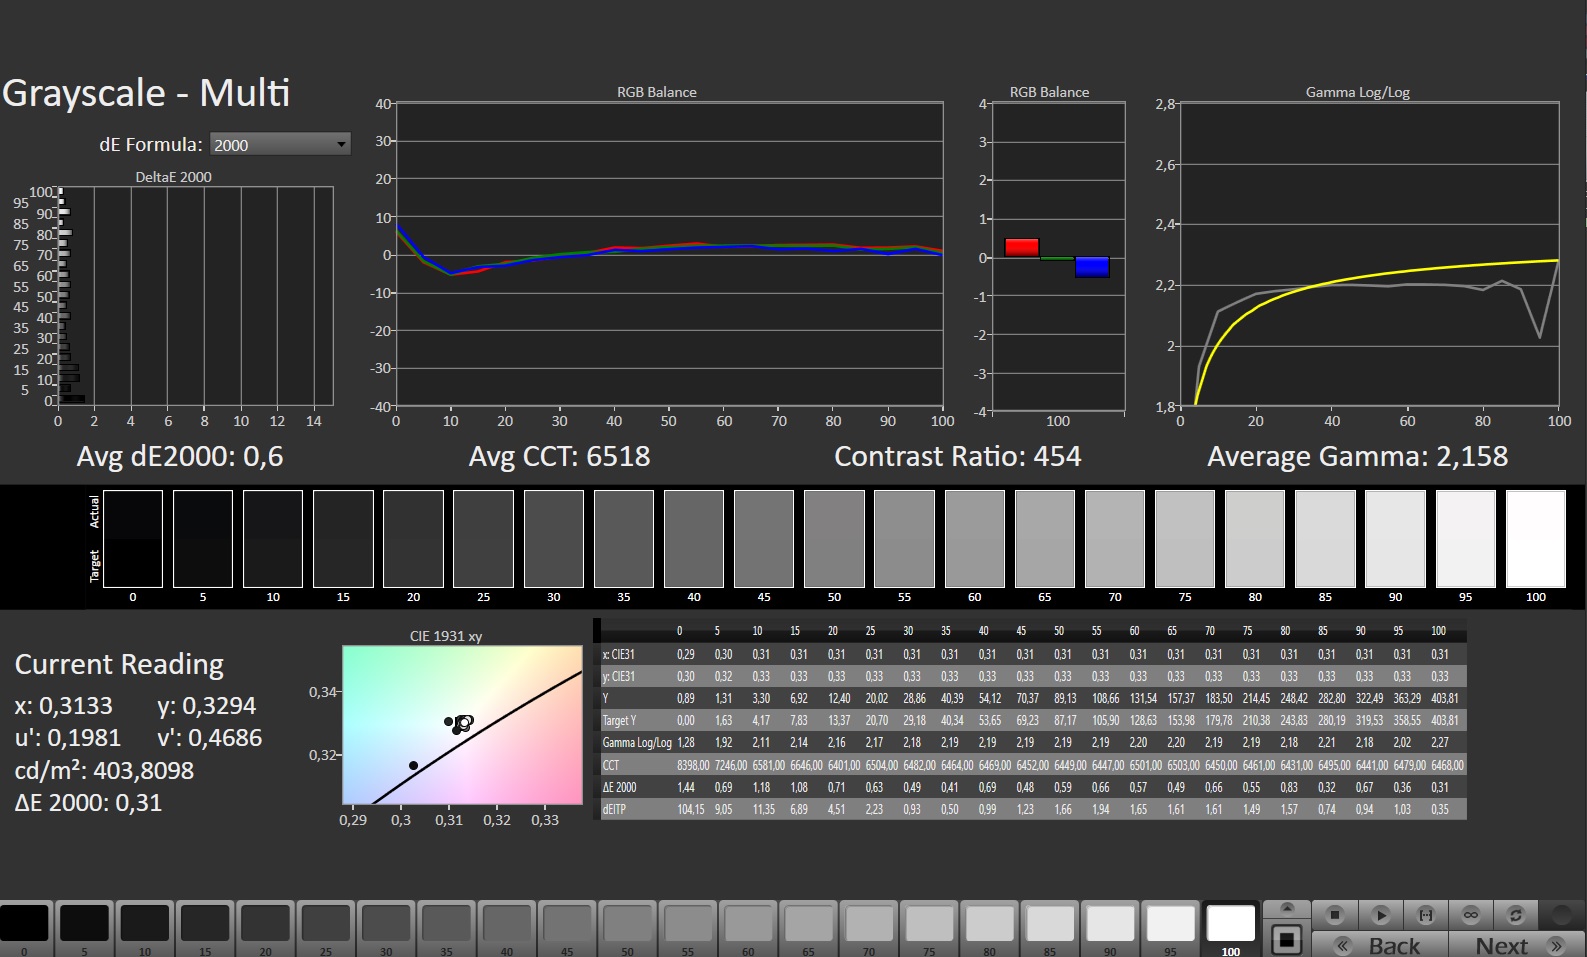
Il display ha già un'ottima riproduzione dei colori fin dall'inizio. La sua differenza cromatica media di circa 2 è significativamente inferiore alla soglia di ciò che è considerato buono (Delta E < 3). La calibrazione del display ha ridotto la differenza cromatica media a 0,74 e ha reso la scala di grigi più equilibrata. Il pannello è in grado di coprire l'intero spazio colore sRGB, ma non AdobeRGB e DCI-P3. I display di alcuni portatili della concorrenza hanno prestazioni migliori in termini di copertura del colore.

Tempi di risposta del Display
| ↔ Tempi di risposta dal Nero al Bianco | ||
|---|---|---|
| 7.5 ms ... aumenta ↗ e diminuisce ↘ combinato | ↗ 3.3 ms Incremento | 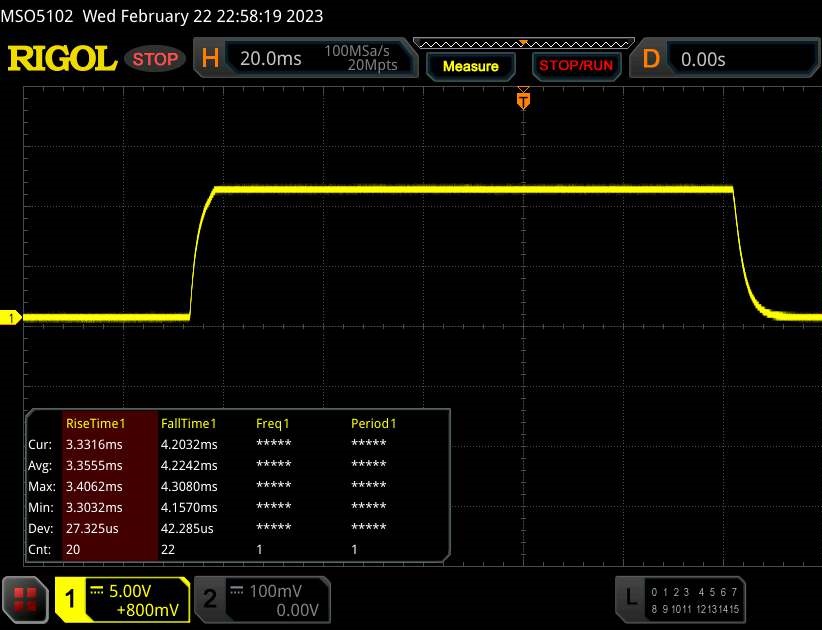 |
| ↘ 4.2 ms Calo | ||
| Lo schermo ha mostrato valori di risposta molto veloci nei nostri tests ed è molto adatto per i gaming veloce. In confronto, tutti i dispositivi di test variano da 0.1 (minimo) a 240 (massimo) ms. » 19 % di tutti i dispositivi è migliore. Questo significa che i tempi di risposta rilevati sono migliori rispettto alla media di tutti i dispositivi testati (20.7 ms). | ||
| ↔ Tempo di risposta dal 50% Grigio all'80% Grigio | ||
| 11.3 ms ... aumenta ↗ e diminuisce ↘ combinato | ↗ 5.4 ms Incremento | 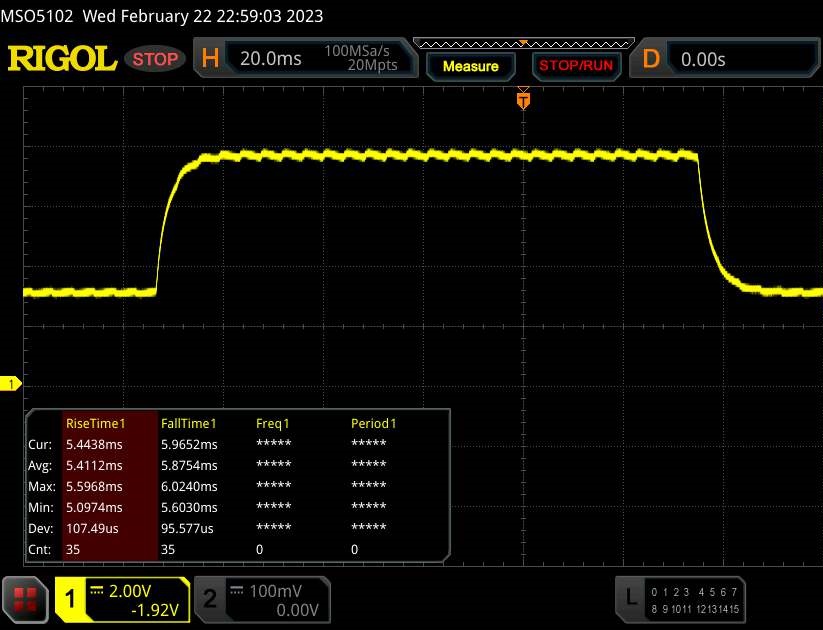 |
| ↘ 5.9 ms Calo | ||
| Lo schermo mostra buoni tempi di risposta durante i nostri tests, ma potrebbe essere troppo lento per i gamers competitivi. In confronto, tutti i dispositivi di test variano da 0.165 (minimo) a 636 (massimo) ms. » 22 % di tutti i dispositivi è migliore. Questo significa che i tempi di risposta rilevati sono migliori rispettto alla media di tutti i dispositivi testati (32.4 ms). | ||
Sfarfallio dello schermo / PWM (Pulse-Width Modulation)
| flickering dello schermo / PWM non rilevato | 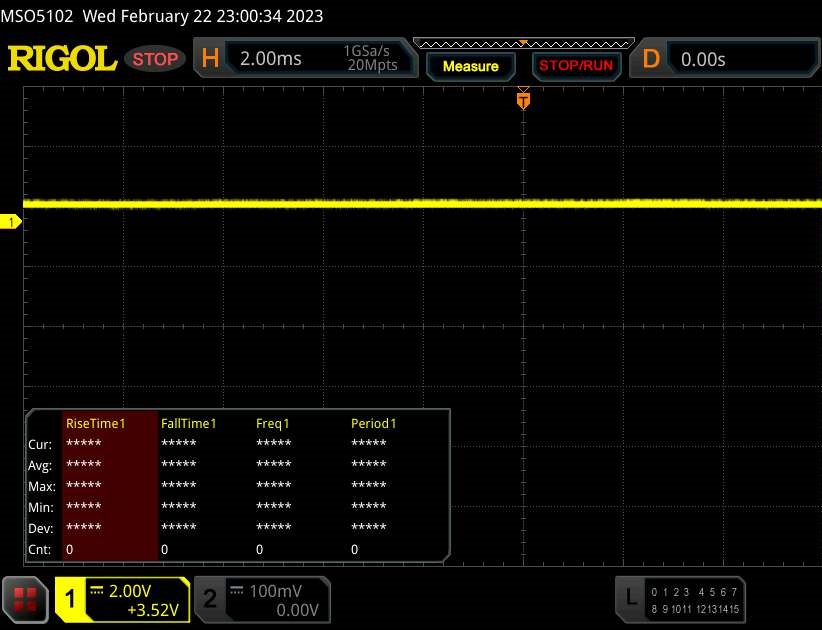 | ||
In confronto: 53 % di tutti i dispositivi testati non utilizza PWM per ridurre la luminosita' del display. Se è rilevato PWM, una media di 8439 (minimo: 5 - massimo: 343500) Hz è stata rilevata. | |||
Il pannello IPS ha un ampio angolo di visione ed è facilmente leggibile da qualsiasi posizione. Il display è sicuramente utilizzabile anche all'aperto, a condizione che il sole non sia eccessivamente luminoso.

Performance - Raptor Lake incontra Ada Lovelace
Anche se è stato progettato principalmente per i giochi QHD+, l'Erazer Beast X40 fa una buona figura anche in applicazioni come l'editing video e il rendering. La potenza di calcolo necessaria è fornita da Raptor Lake e Ada Lovelace. Il modello X40 oggetto di questa recensione può essere acquistato a circa 4.500 euro (4.856 dollari). Ma Medion offre anche una configurazione con specifiche leggermente inferiori (RTX 4080 e SSD da 1 TB; per il resto identica) a 3.500 euro (3.777 dollari).
Condizioni di prova
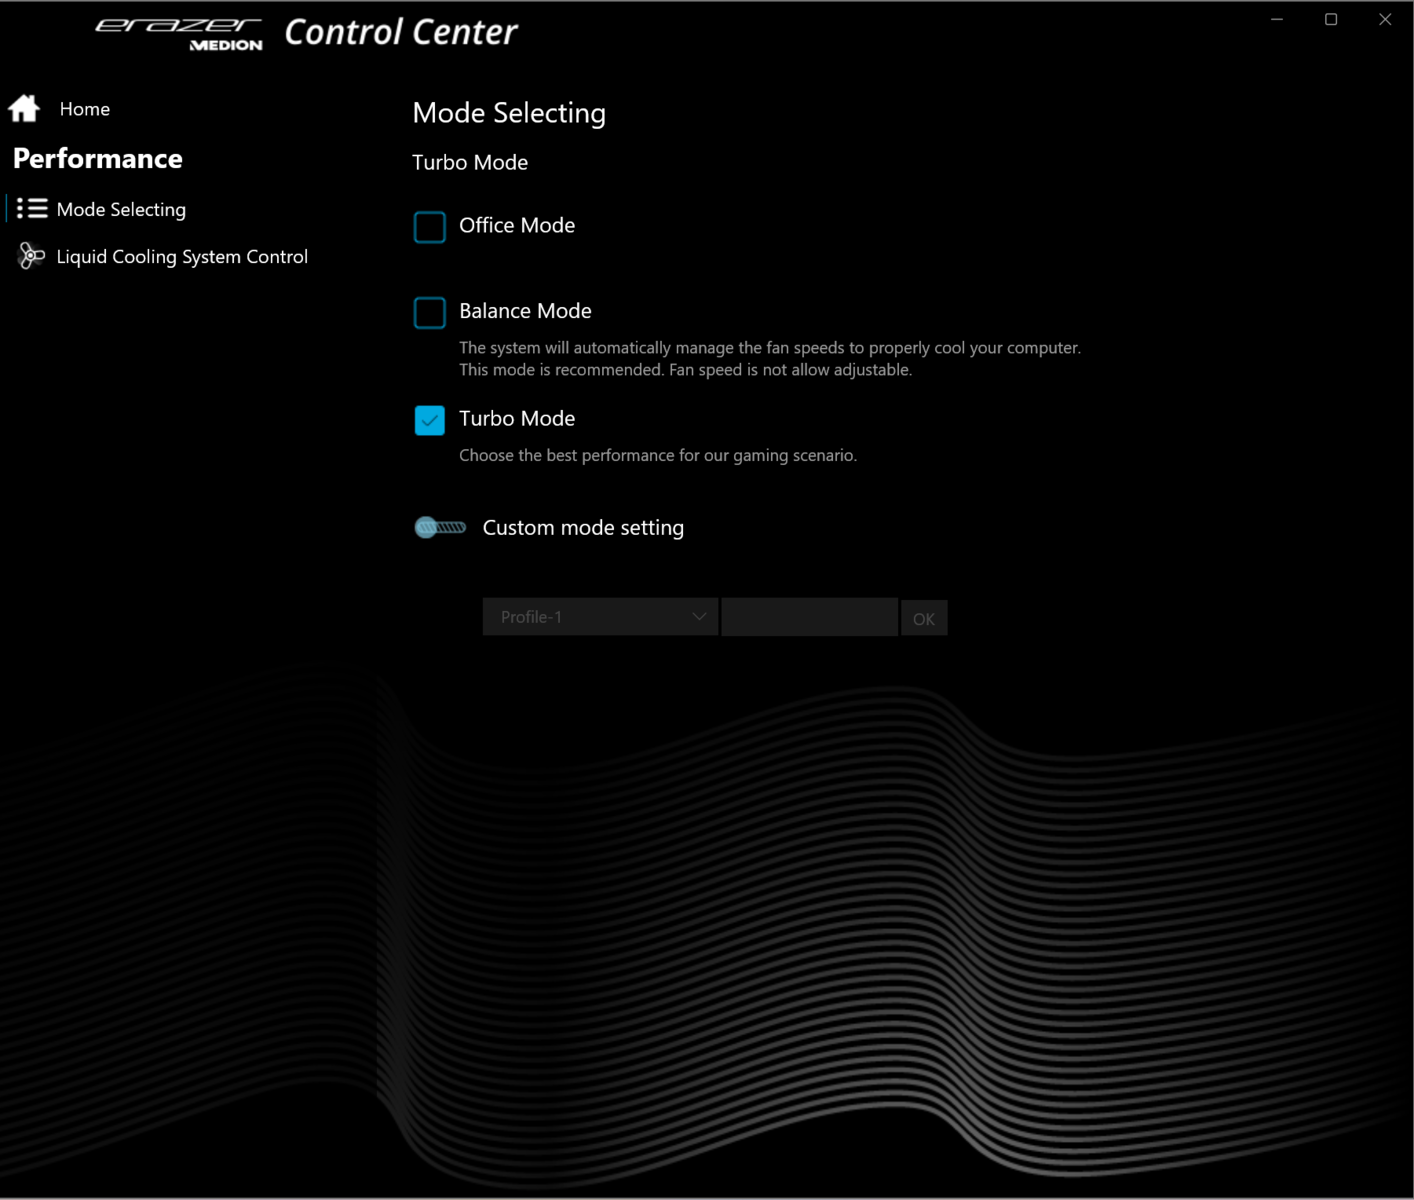
Sono disponibili tre modalità di prestazioni specificate dal produttore: Office, Balance e Turbo. Abbiamo utilizzato la modalità Turbo per i benchmark e la modalità Office per i nostri test di durata della batteria e abbiamo attivato Nvidia Optimus in entrambi i casi. Dopo aver completato questi test, abbiamo eseguito altri benchmark con la modalità dGPU attivata e l'unità di raffreddamento ad acqua esterna collegata. I risultati di questi test aggiuntivi sono riportati nella tabella di confronto, ma non sono stati presi in considerazione per la valutazione.
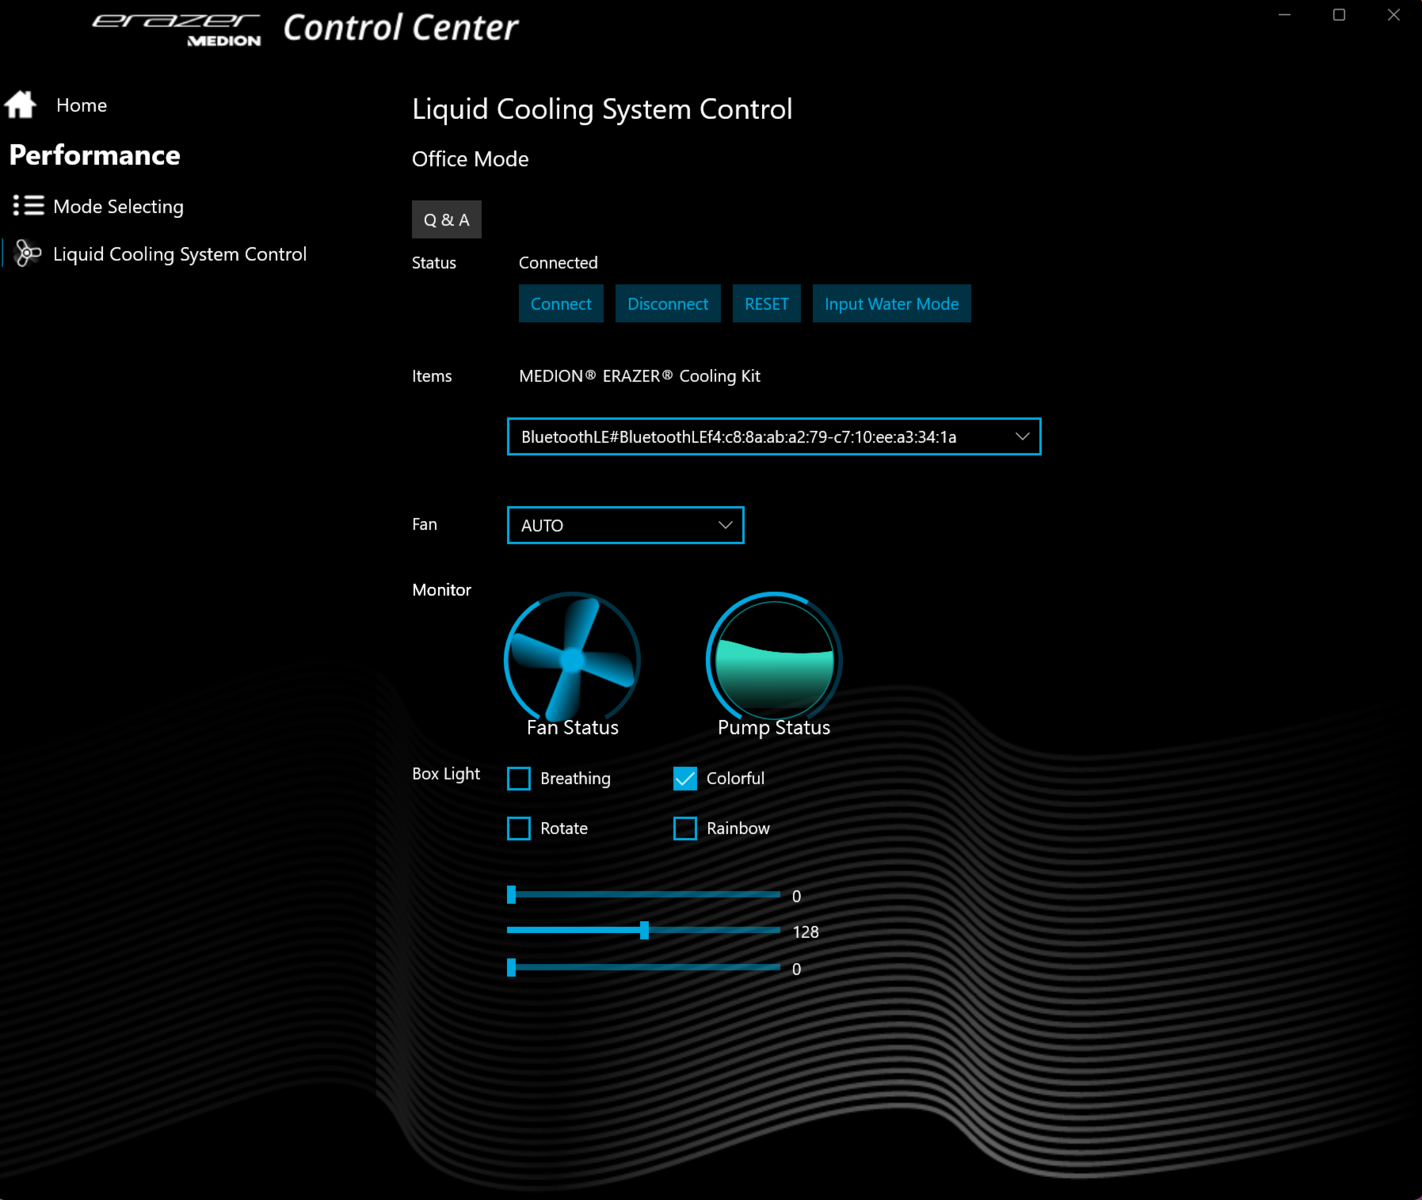
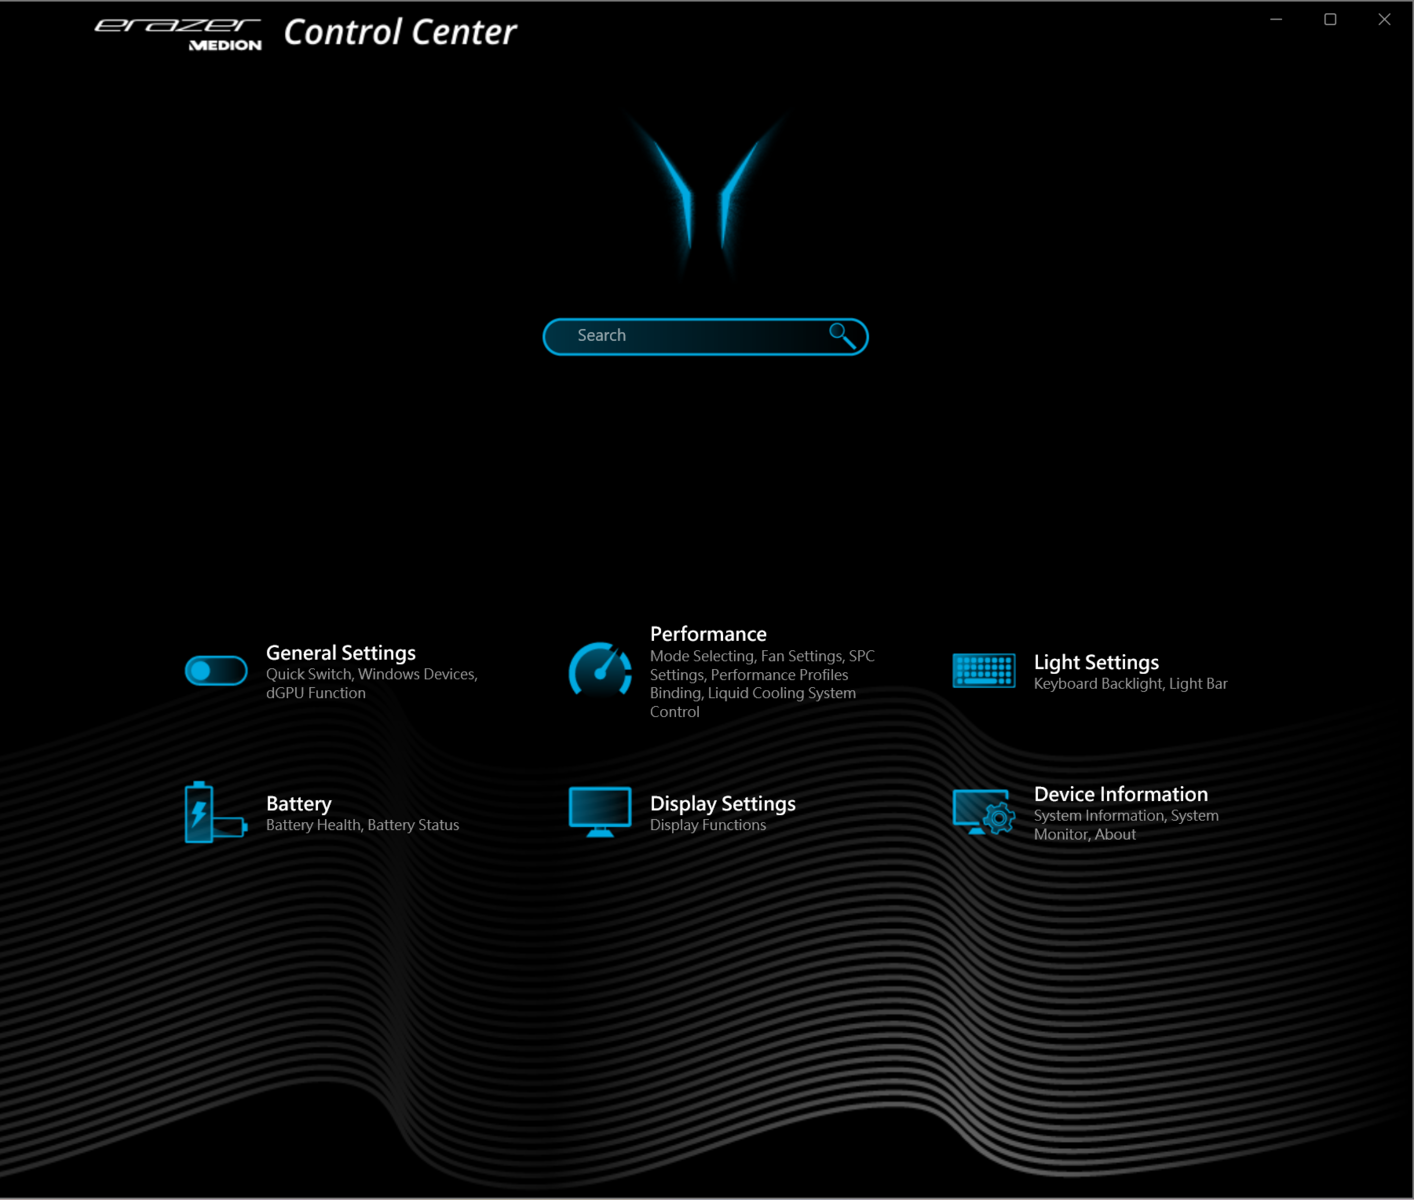
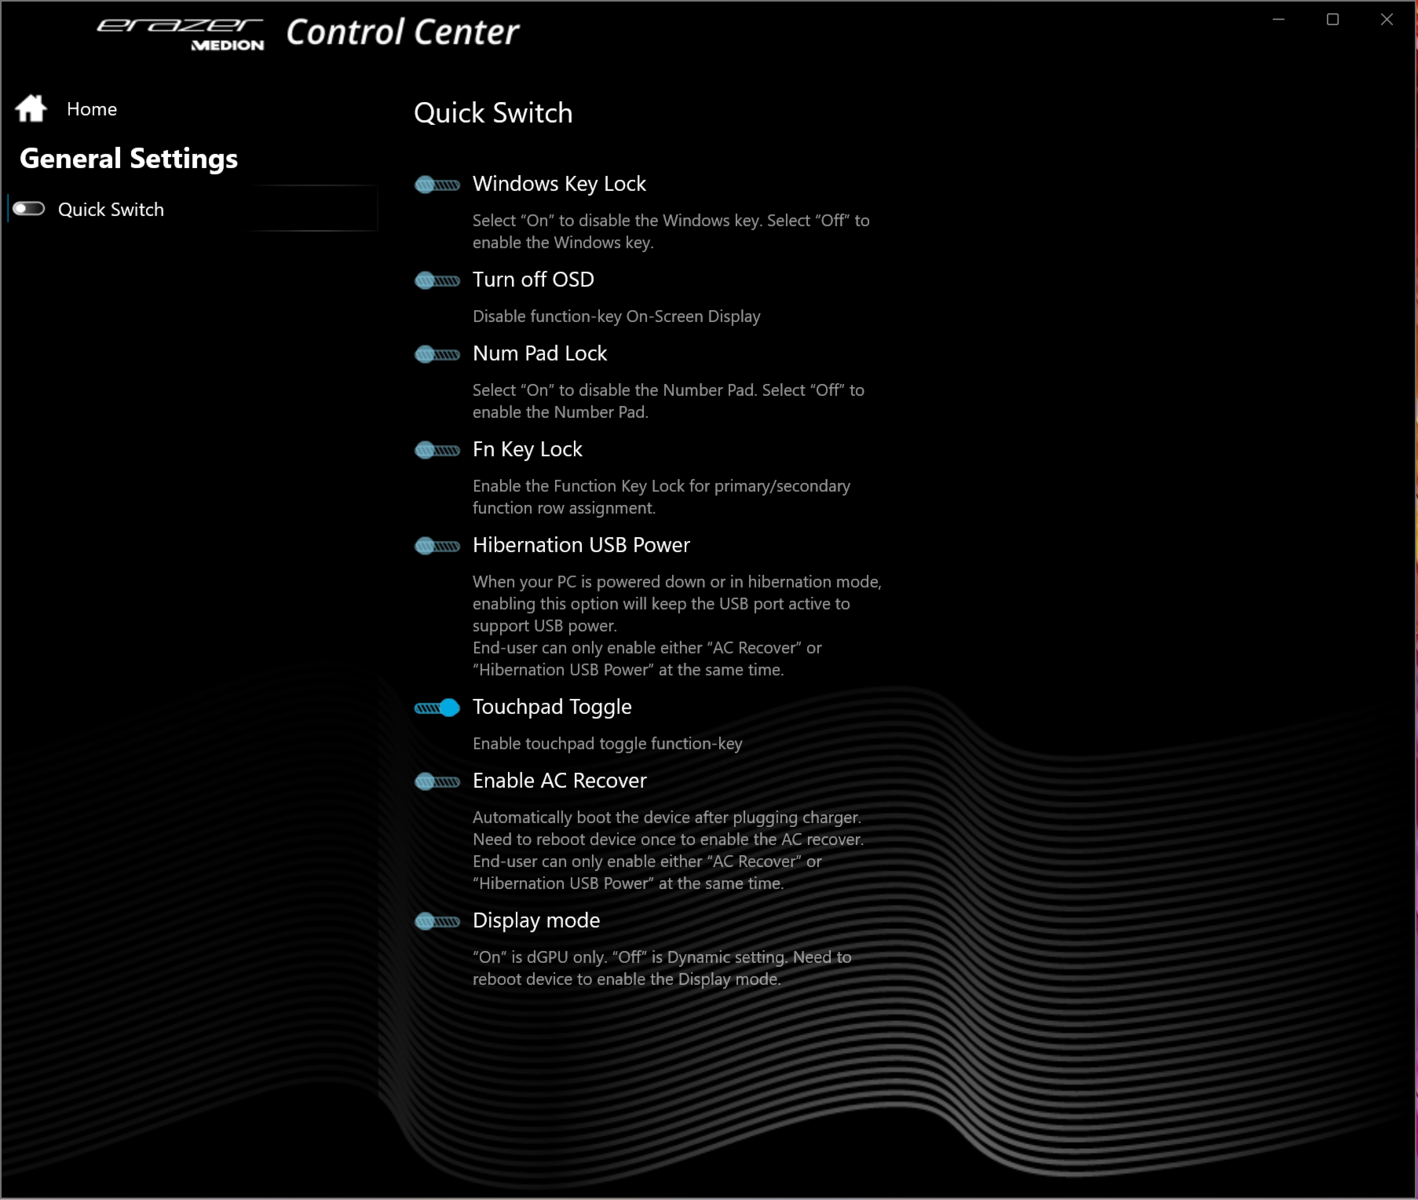
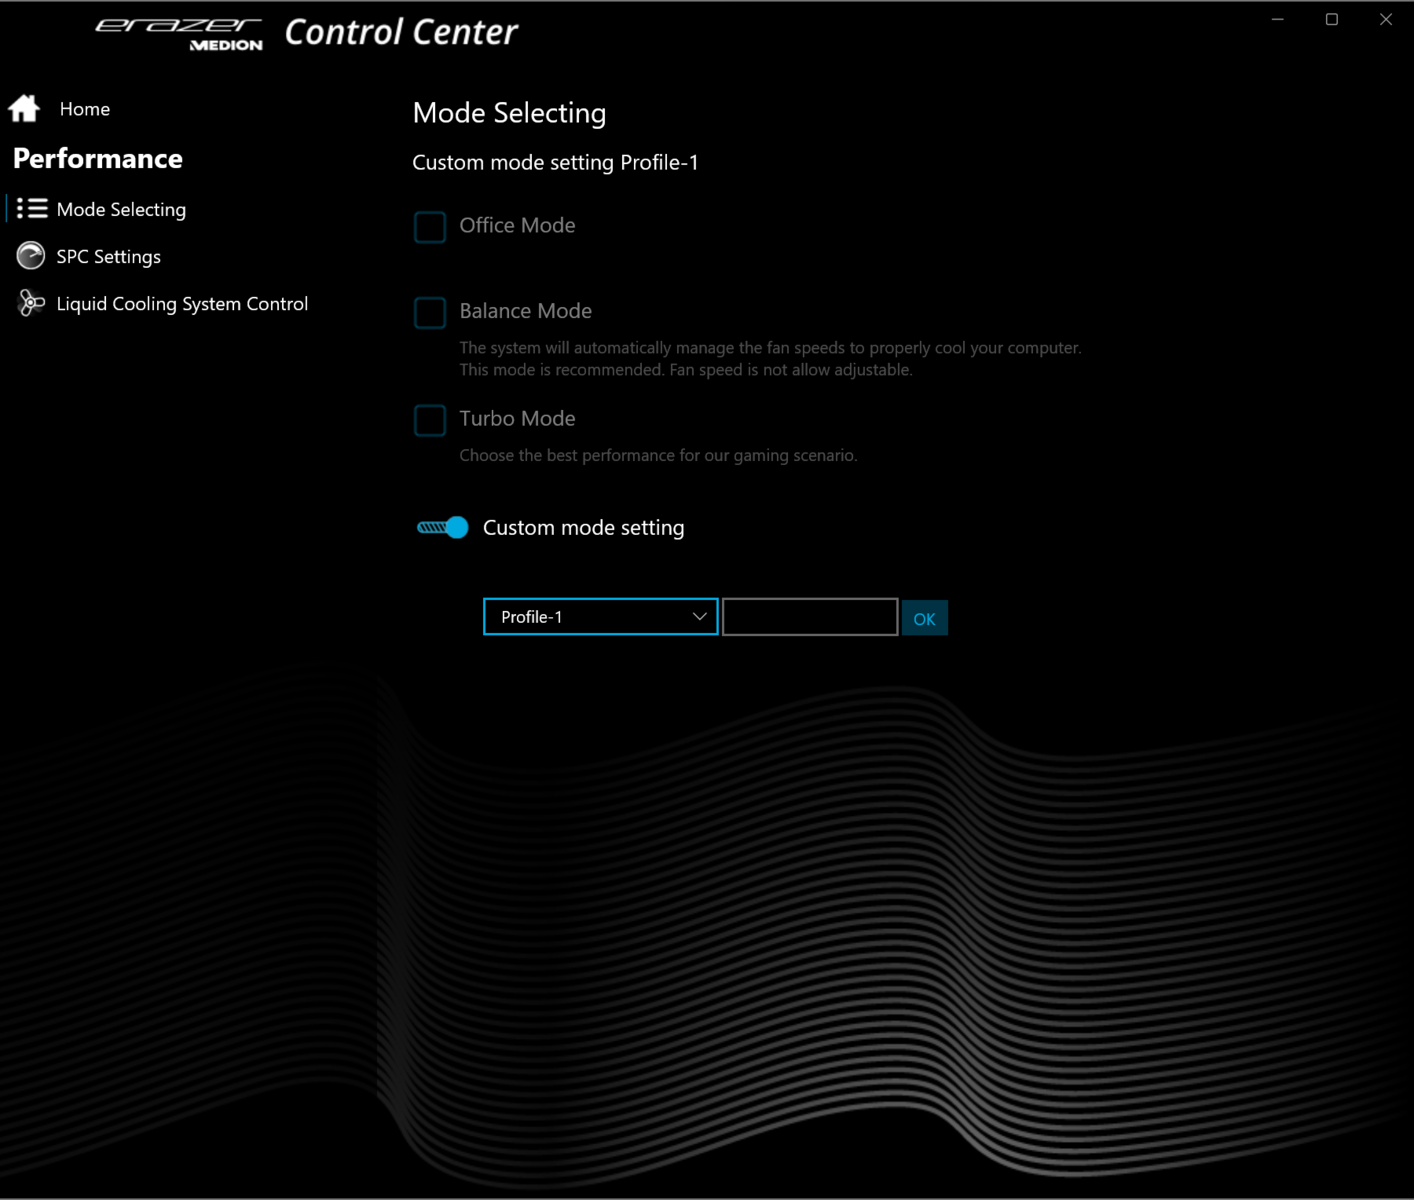
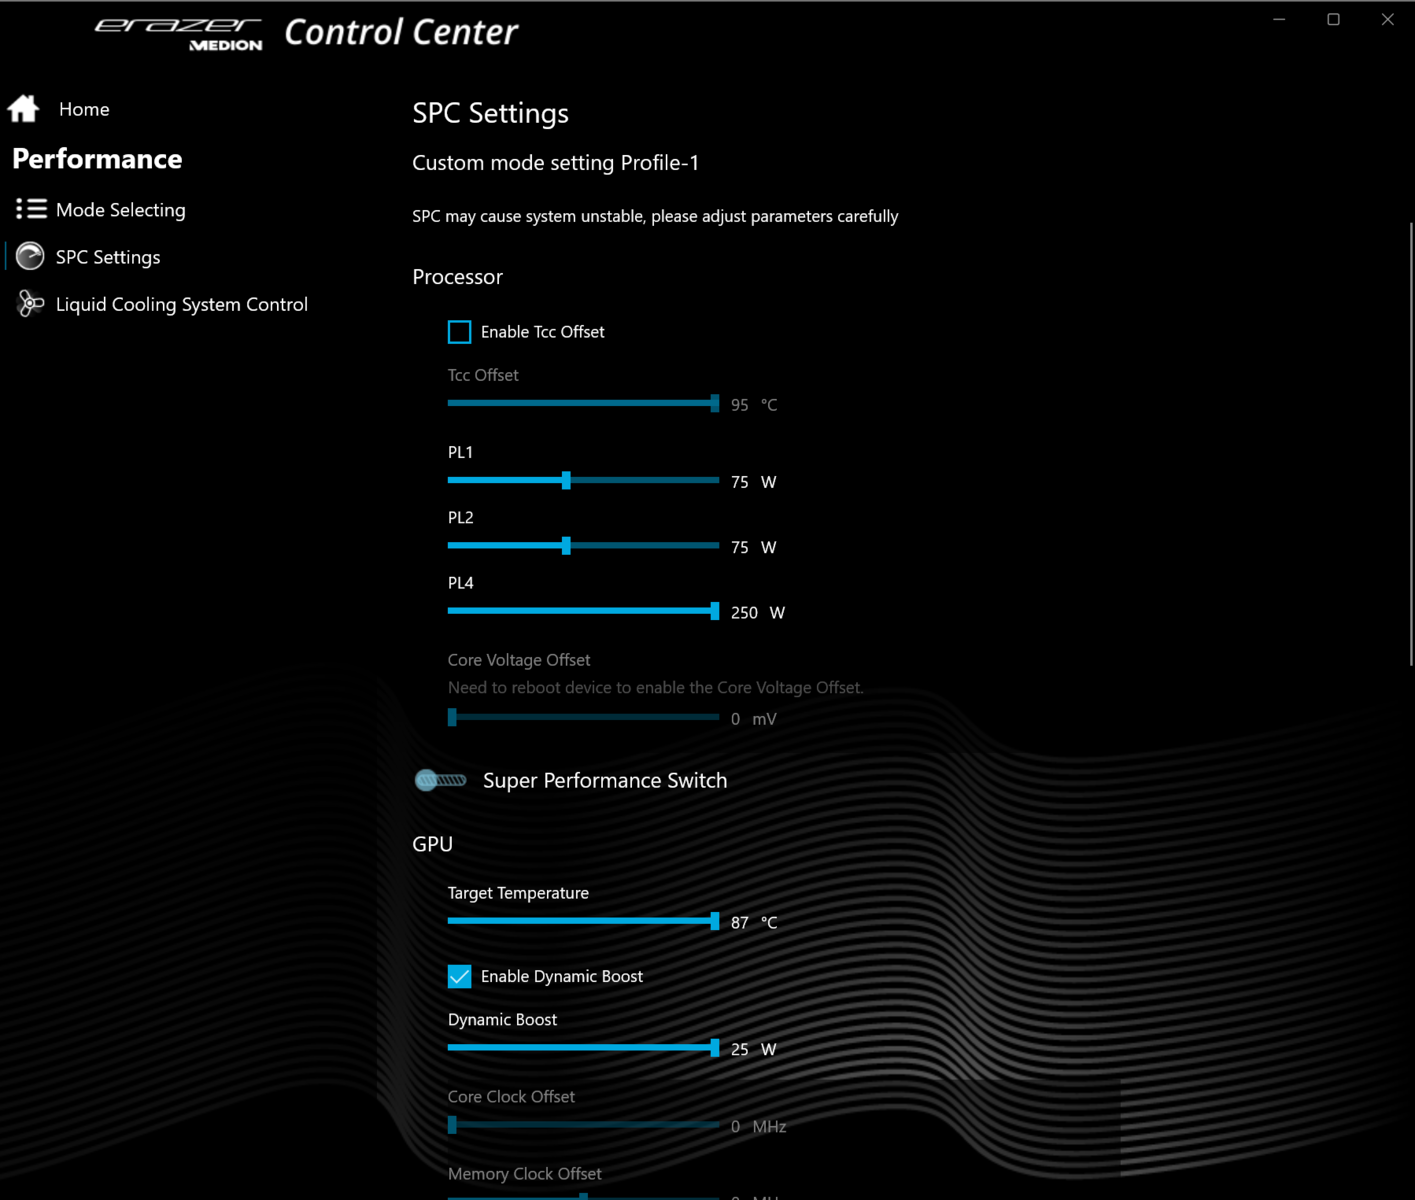
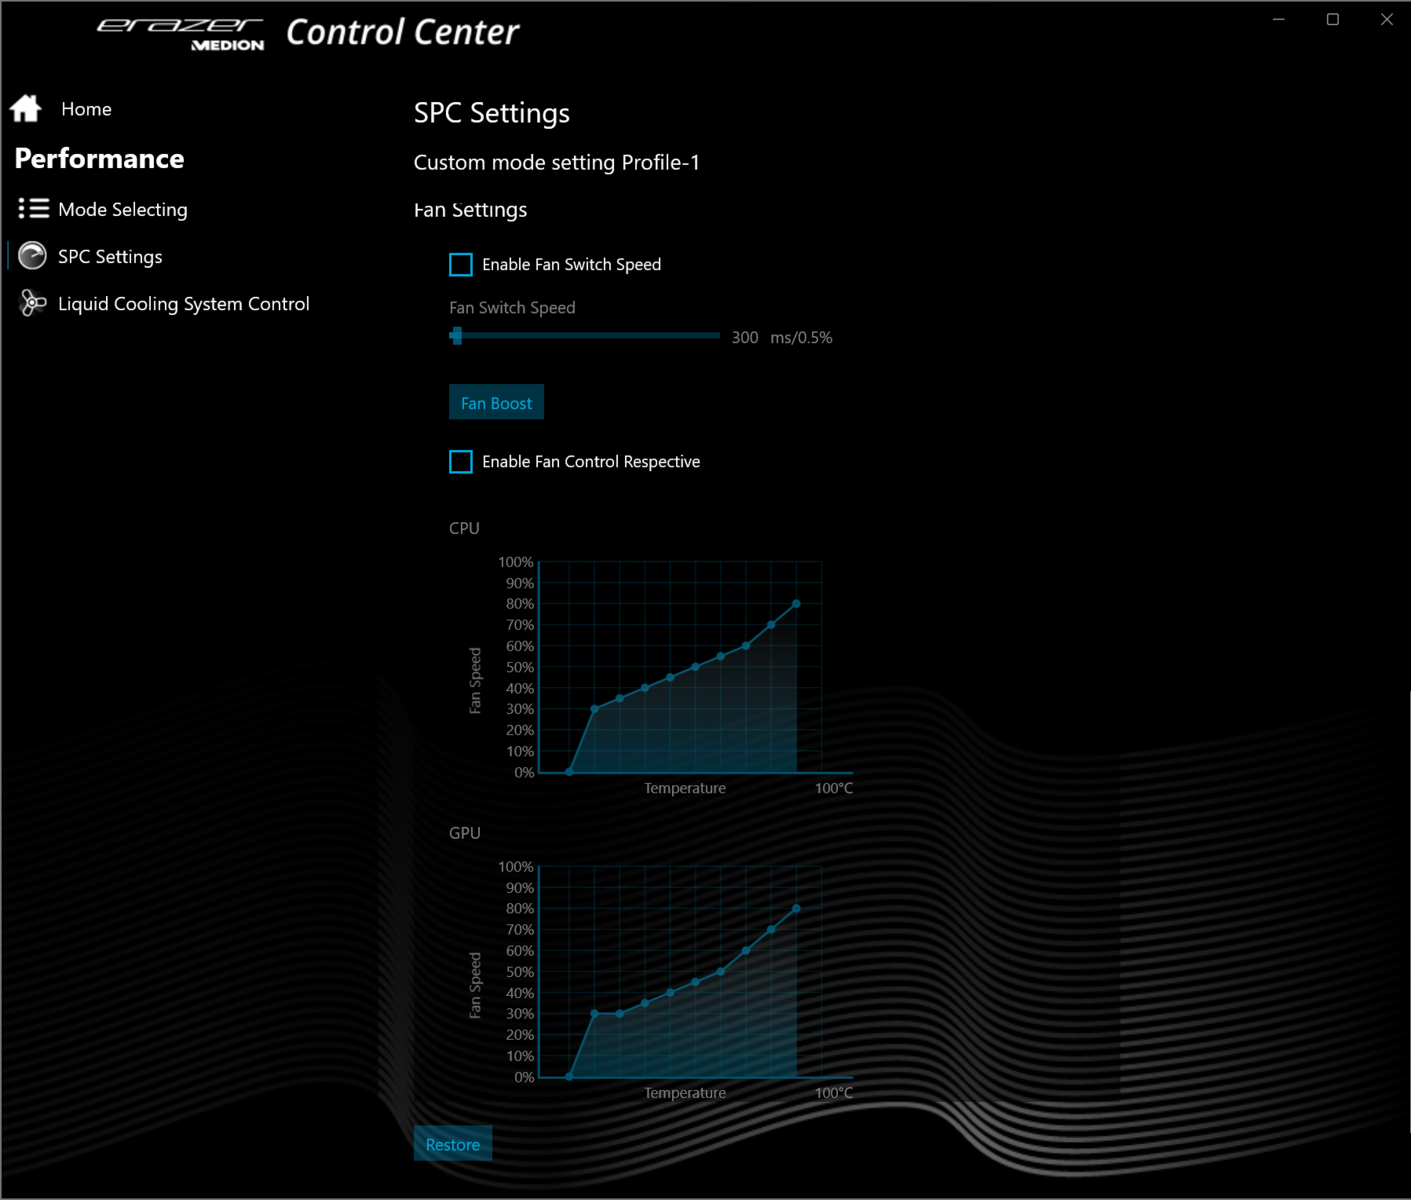
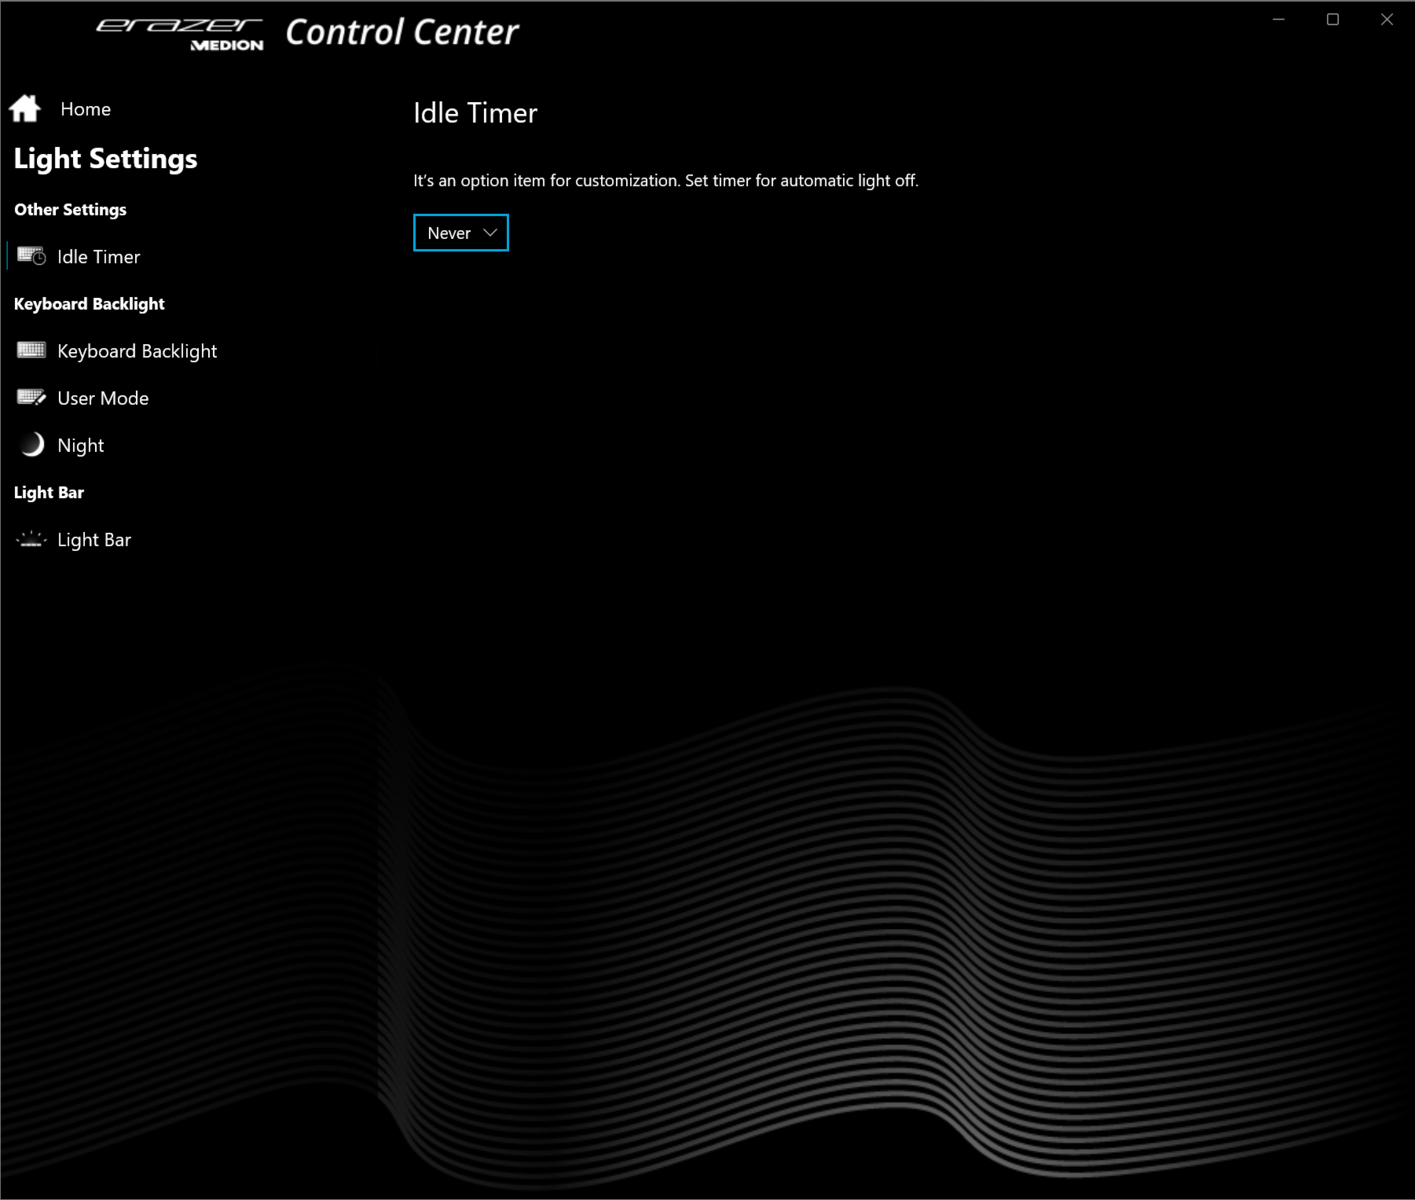
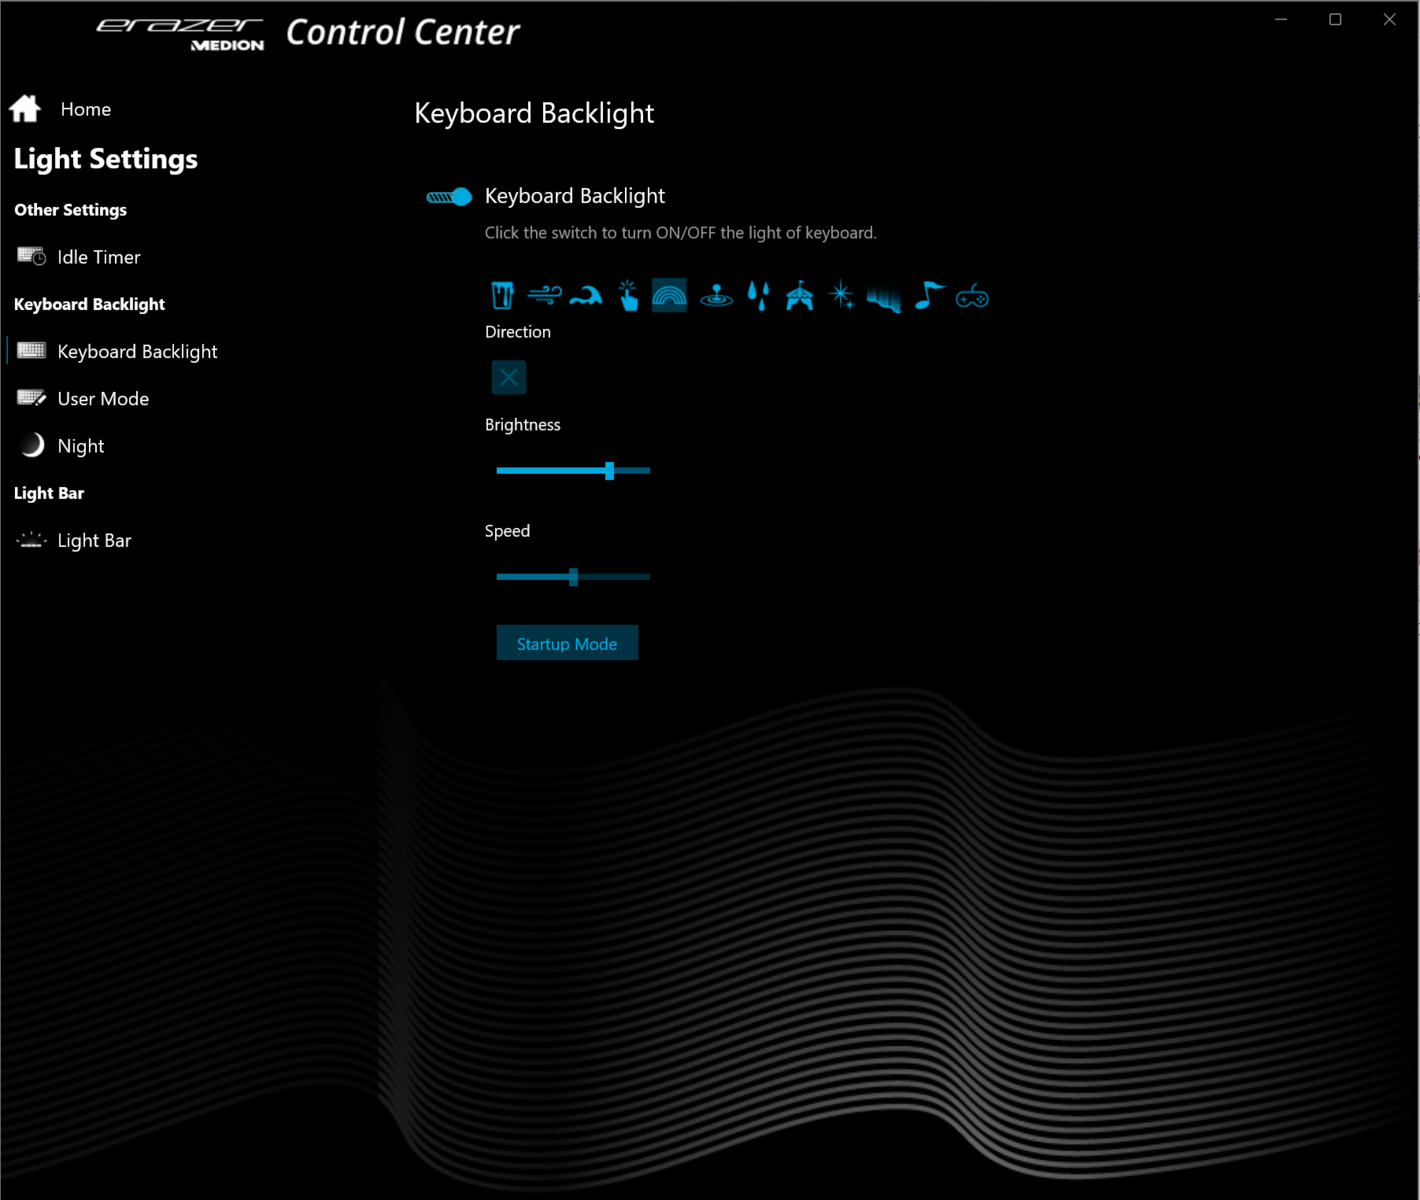
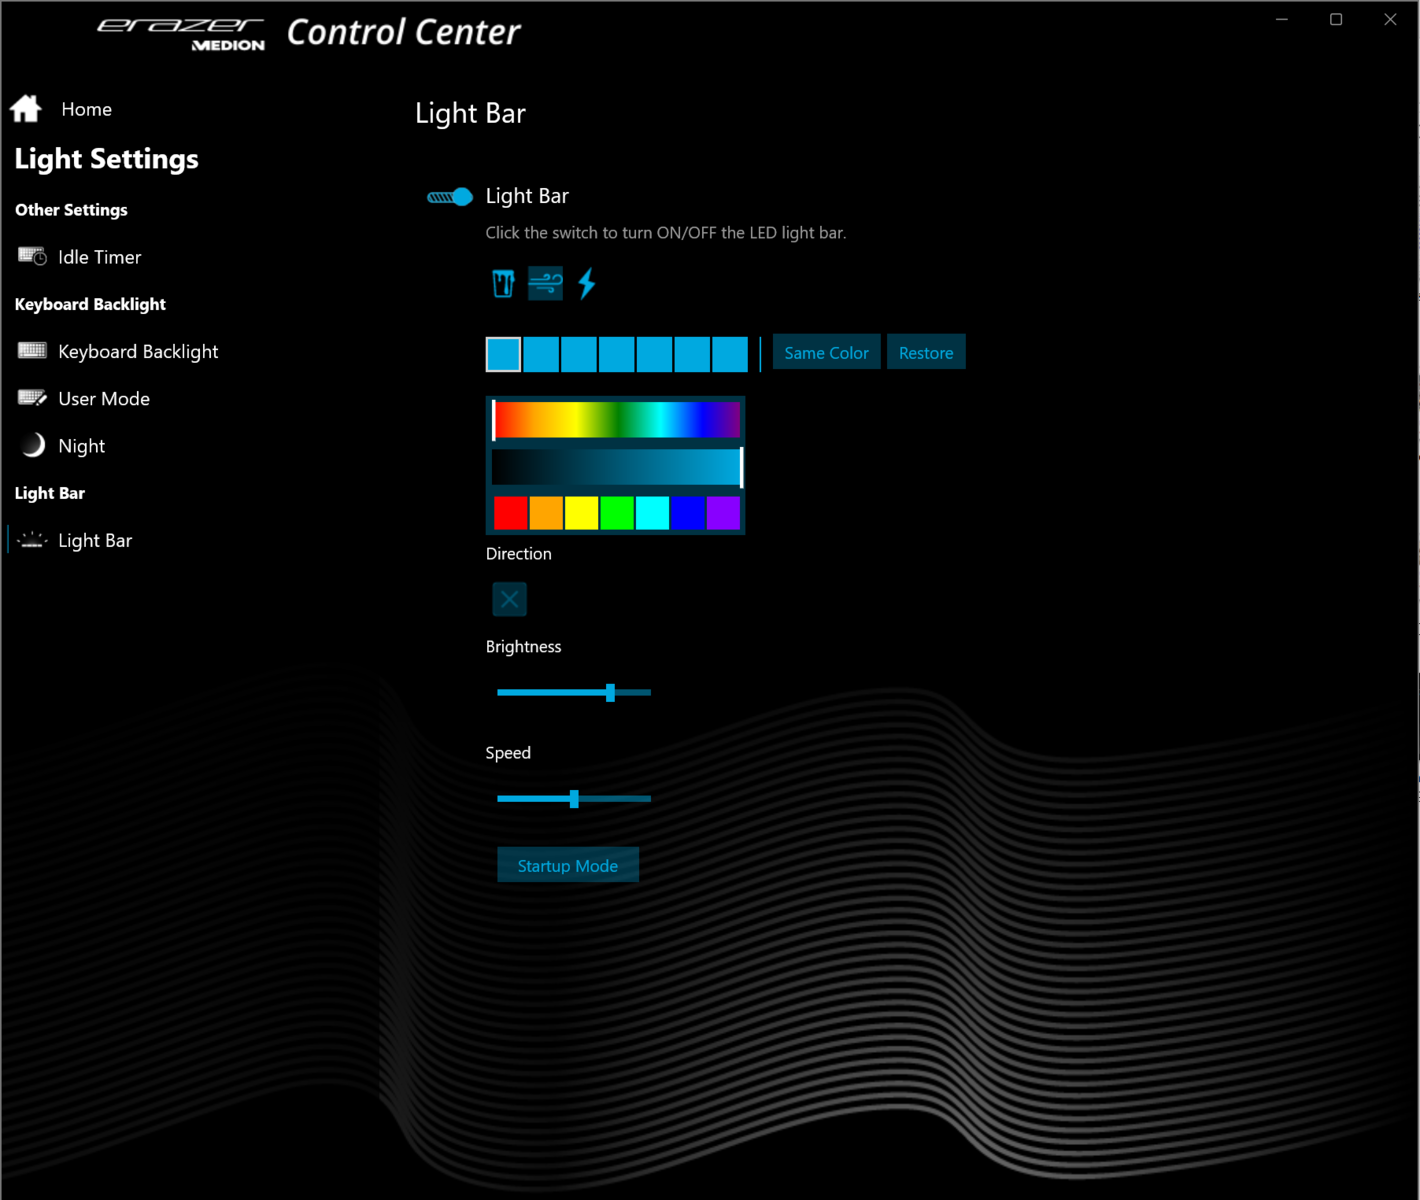
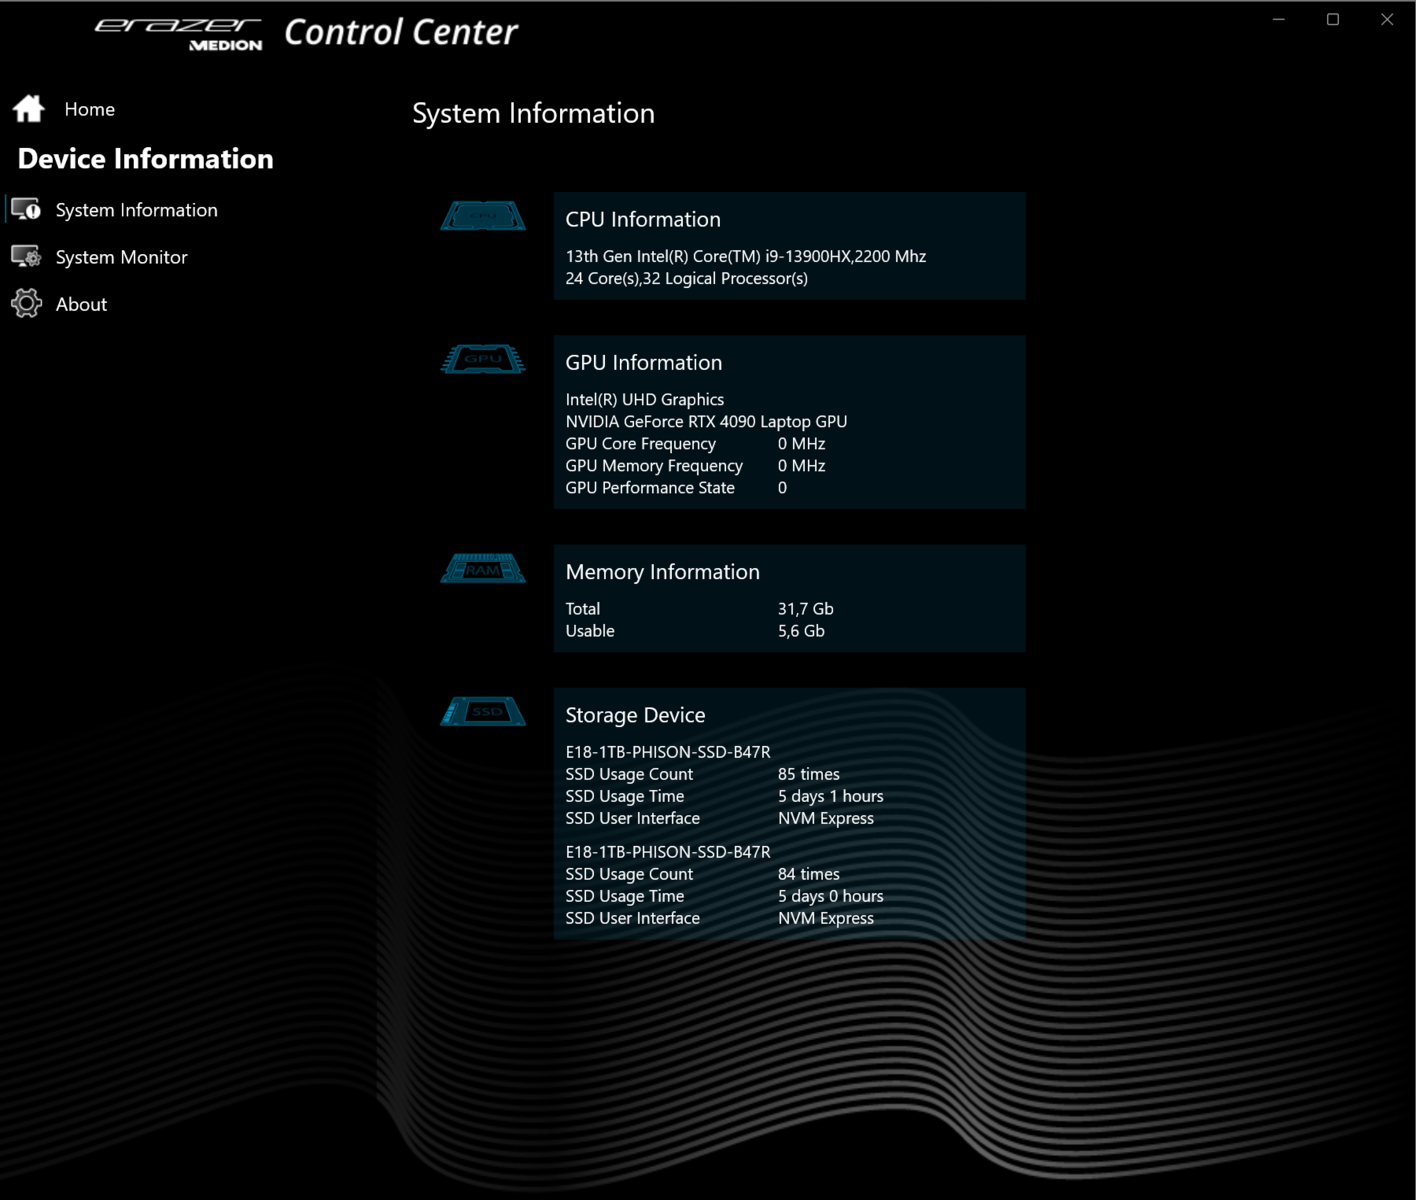
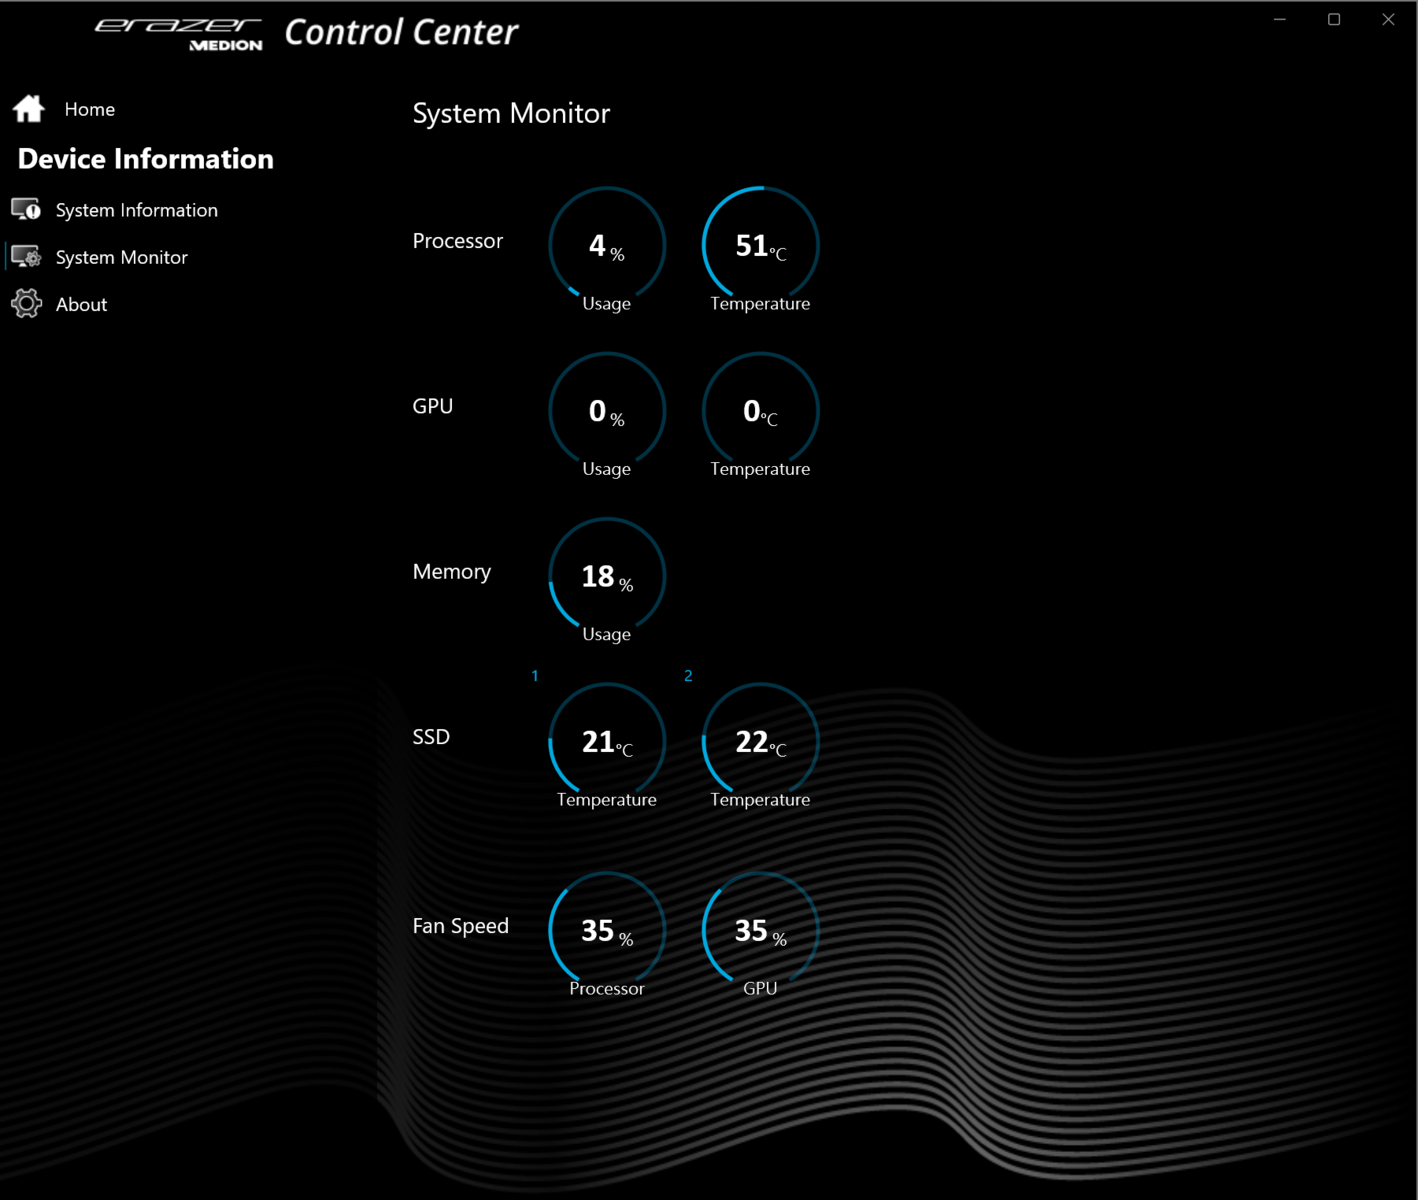
Gli utenti possono passare da una modalità all'altra utilizzando un pulsante dedicato accanto al pulsante di accensione. Un LED di stato indica quale modalità è attualmente attiva. È inoltre possibile creare profili personalizzati utilizzando il software Control Center preinstallato. Ad esempio, è possibile specificare i limiti di potenza della CPU, il TGP della GPU, i limiti di temperatura e così via.
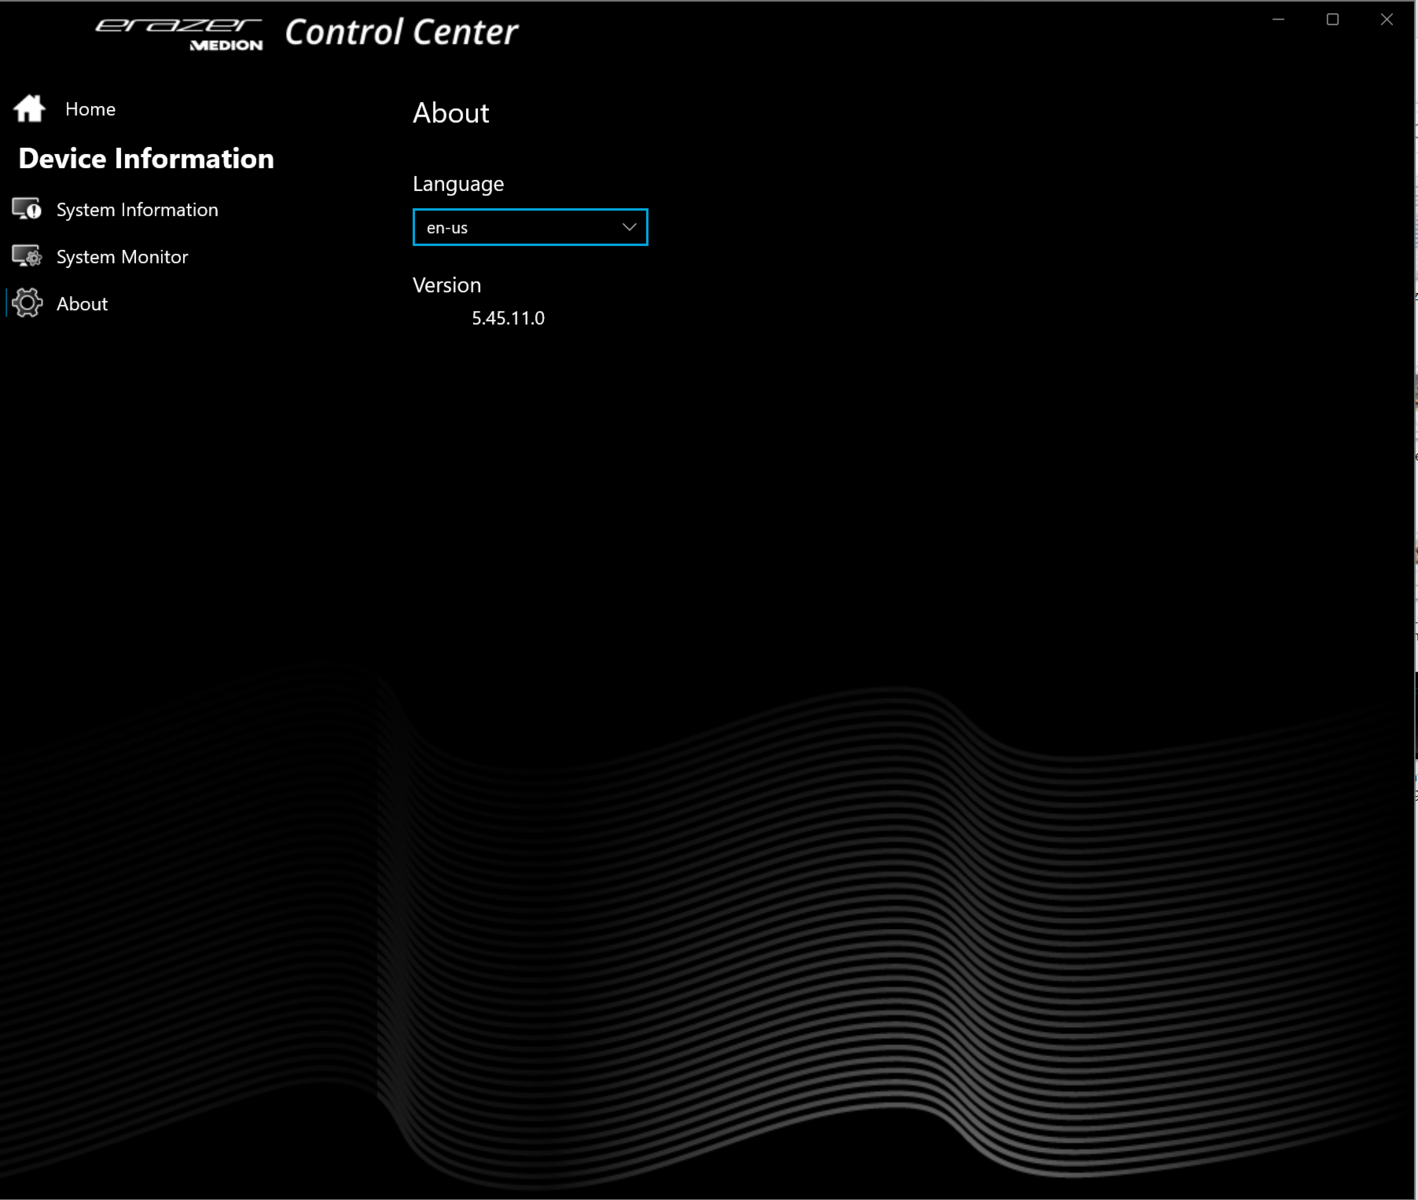
Nota: abbiamo utilizzato l'interfaccia utente inglese del software Control Center perché ci sono alcuni problemi con la traduzione in tedesco. Il software consente di passare da una lingua all'altra.
| Modalità Turbo | Modalità Balance | Modalità Ufficio | |
|---|---|---|---|
| Limite di potenza 1 | 160 Watt | 160 Watt | 160 Watt |
| Limite di potenza 2 | 160 Watt | 160 Watt | 160 Watt |
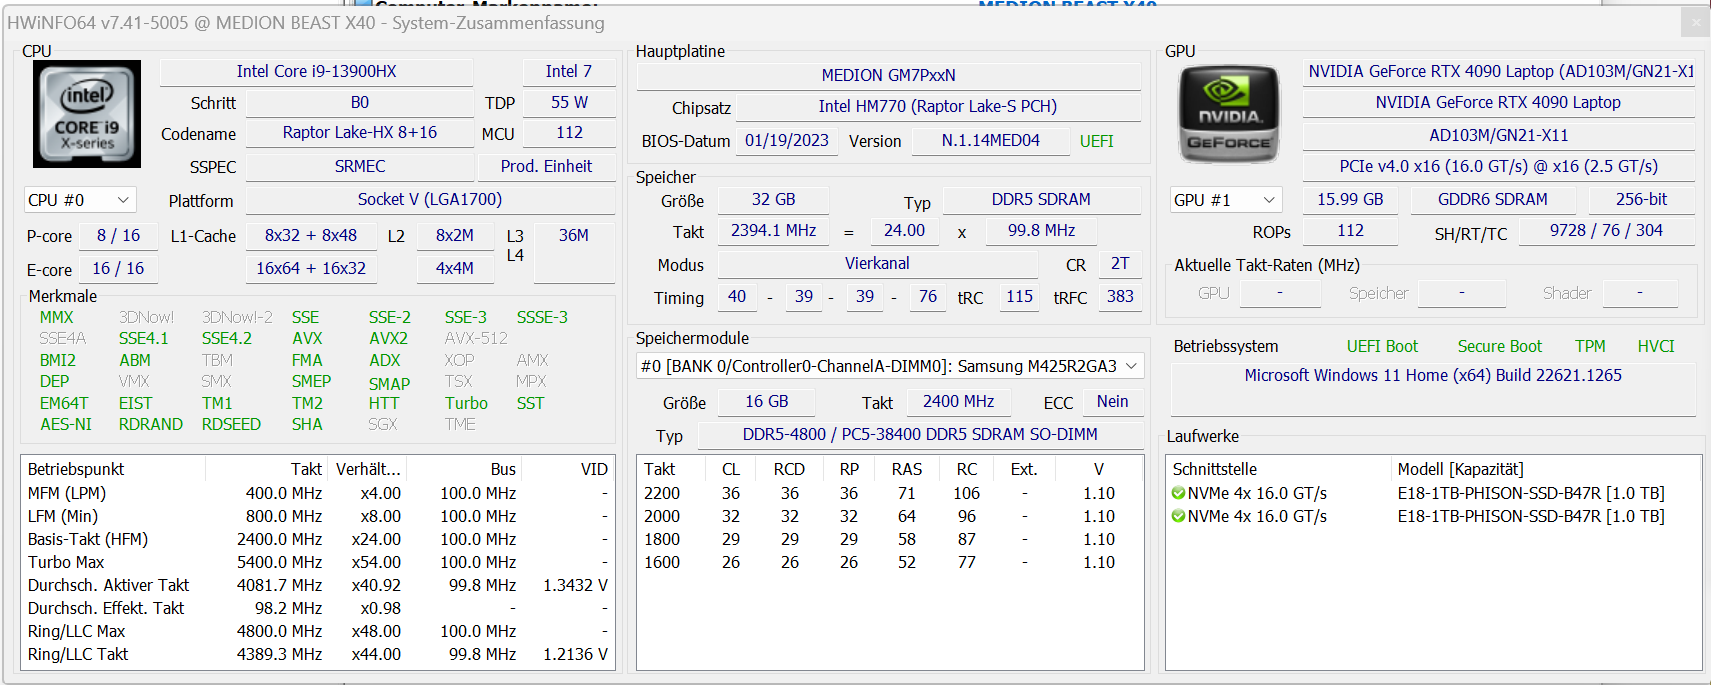
Processore
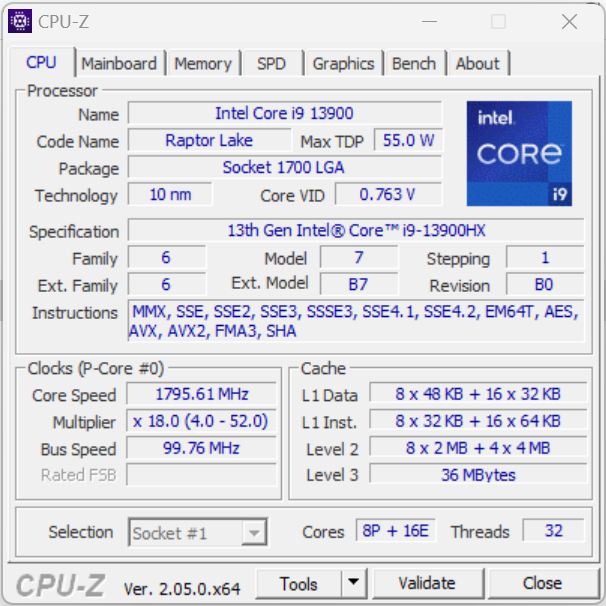
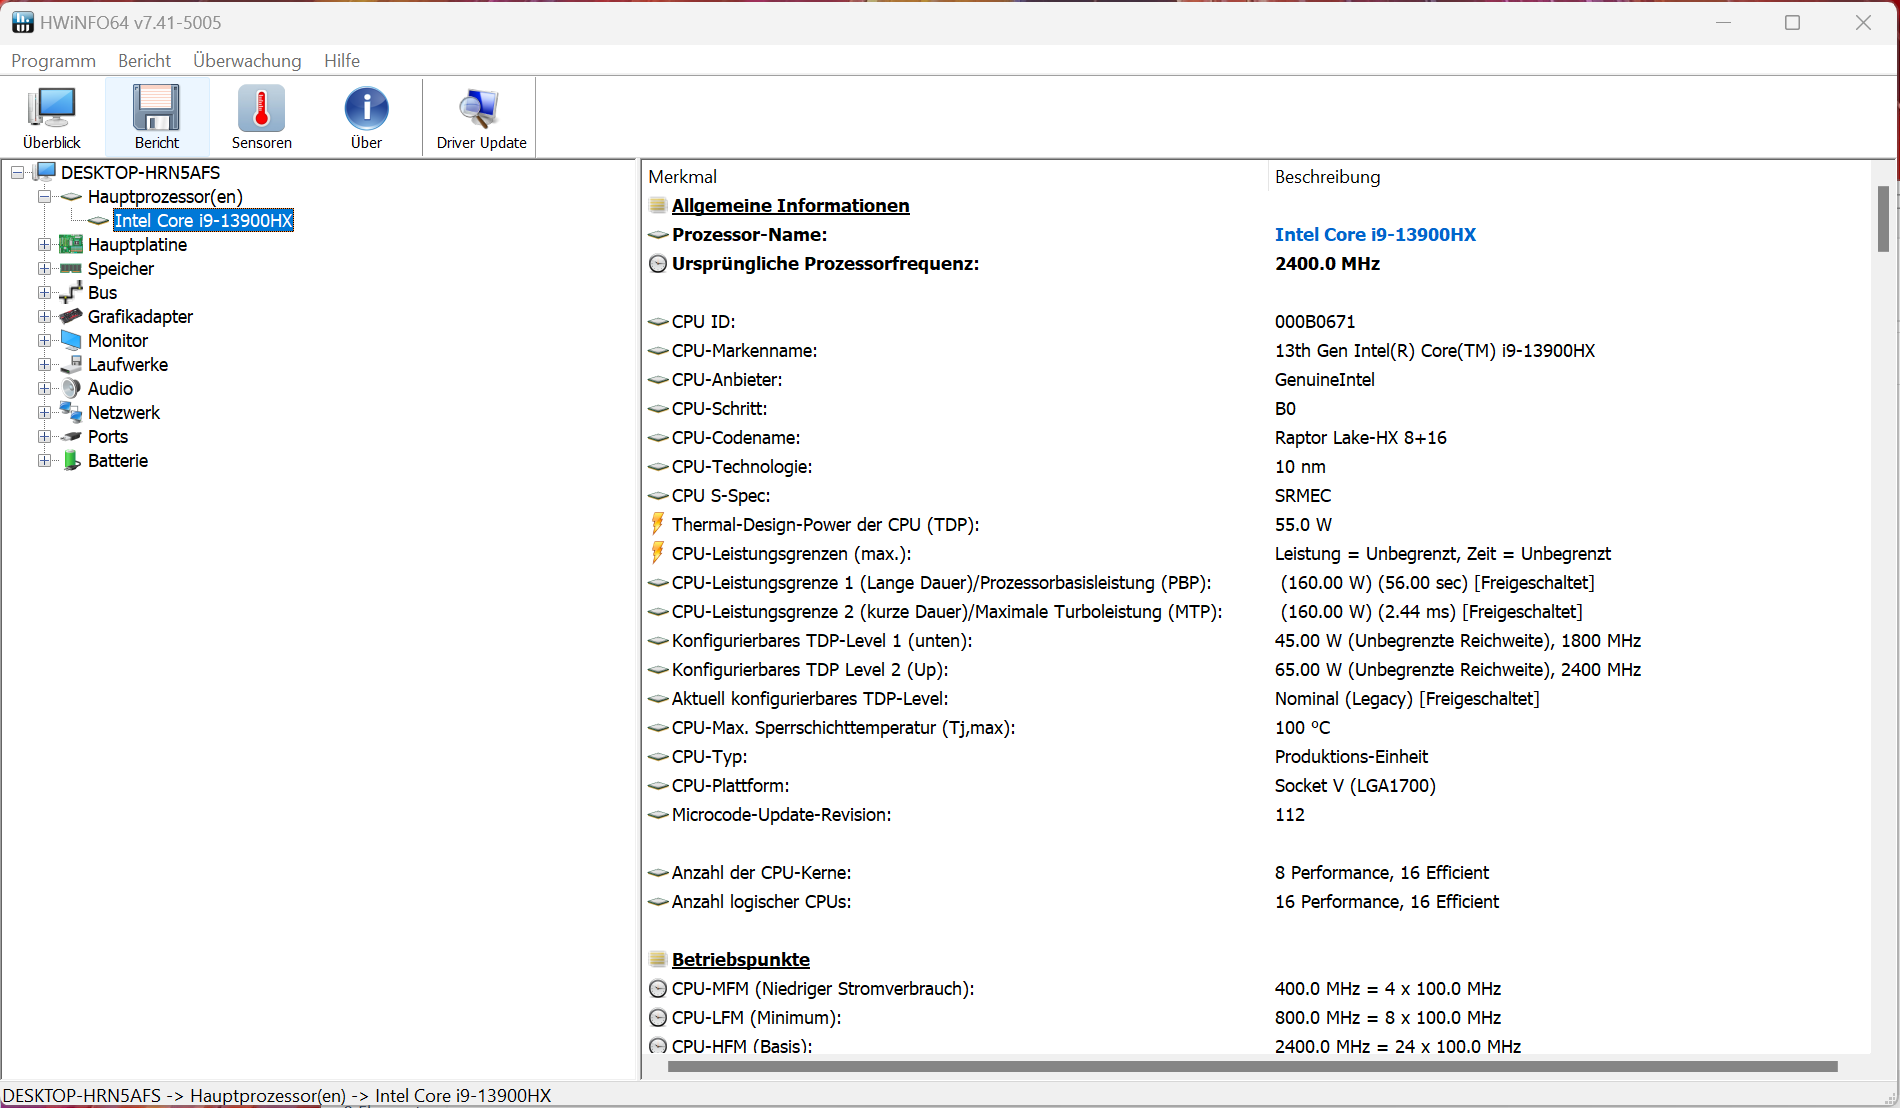
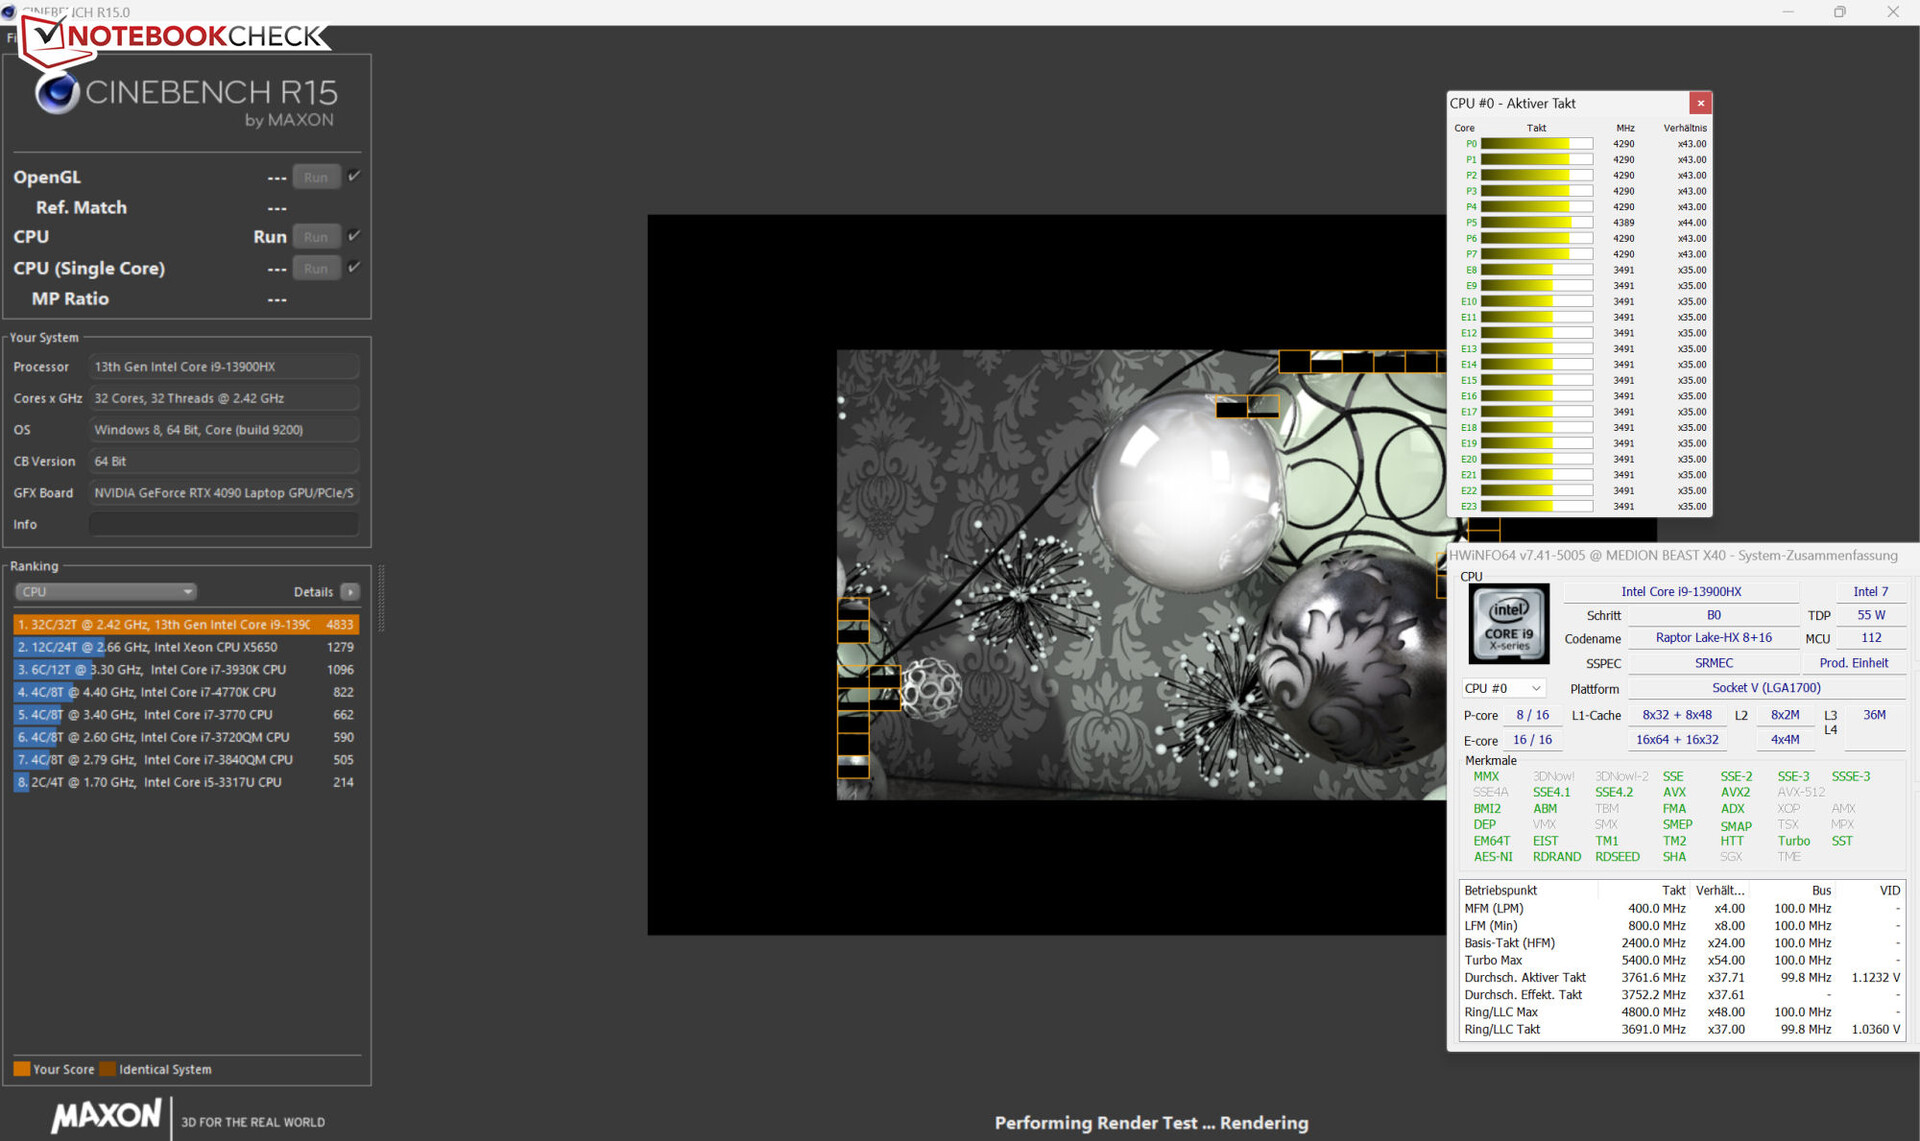
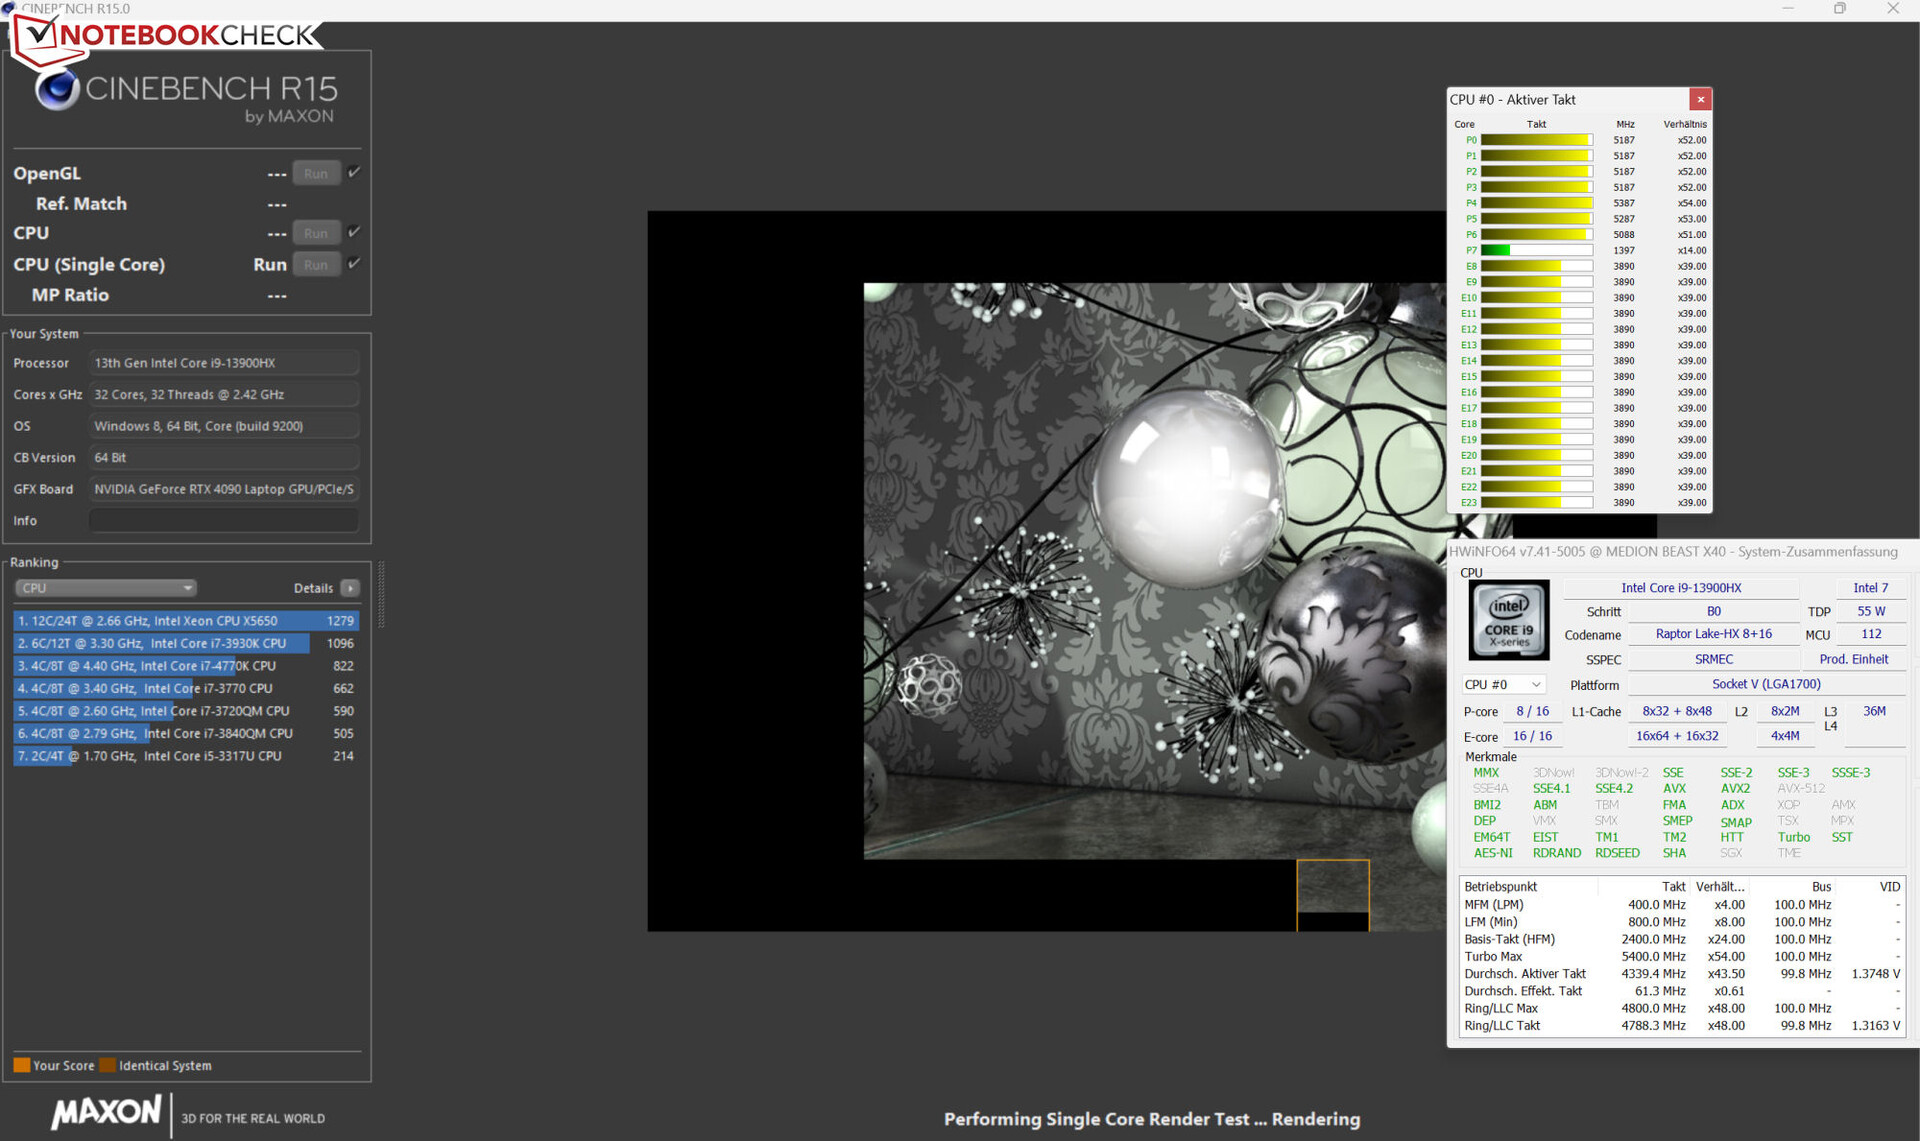
Il Core i9-13900HX (Raptor Lake) è composto da otto core per le prestazioni (Hyper-Threading, da 2,2 a 5,4 GHz) e sedici core per l'efficienza (senza Hyper-Threading, da 1,6 a 3,9 GHz), per un totale di 40 core logici. I risultati dei benchmark ottenuti sono leggermente superiori a quelli che la CPU può produrre in media.
Con l'Erazer Beast X40 collegato, la CPU ha eseguito Cinebench R15 a velocità di clock elevate o massime. Con l'alimentazione a batteria, le prestazioni in single-thread sono state solo marginalmente inferiori (punteggio: 228), mentre le prestazioni in multi-thread hanno subito un notevole calo (punteggio: 1.154). L'esecuzione di Cinebench 15 in loop ha dimostrato che la CPU è in grado di funzionare costantemente a velocità elevate quando è alimentata dalla rete elettrica.
L'uso dell'unità di raffreddamento ad acqua non ha portato a un aumento drastico delle prestazioni. Tuttavia, le prestazioni della CPU sono risultate più stabili in caso di carico multi-thread sostenuto (ciclo CB15) e la temperatura media della CPU è scesa di circa 5°C (9°F).
Cinebench R15 Multi Sustained Load
| CPU Performance Rating - Percent | |
| Asus ROG Strix Scar 18 2023 G834JY-N6005W | |
| MSI Titan GT77 HX 13VI | |
| Medion Erazer Beast X40 | |
| Medion Erazer Beast X40 | |
| Media Intel Core i9-13900HX | |
| Razer Blade 16 Early 2023 | |
| Media della classe Gaming | |
| Alienware x17 R2 P48E | |
| SCHENKER XMG Neo 17 M22 | |
| Cinebench R20 | |
| CPU (Multi Core) | |
| MSI Titan GT77 HX 13VI | |
| Asus ROG Strix Scar 18 2023 G834JY-N6005W | |
| Medion Erazer Beast X40 (dGPU, Cooling) | |
| Medion Erazer Beast X40 | |
| Media Intel Core i9-13900HX (9152 - 12541, n=20) | |
| Razer Blade 16 Early 2023 | |
| Media della classe Gaming (2179 - 15751, n=145, ultimi 2 anni) | |
| Alienware x17 R2 P48E | |
| SCHENKER XMG Neo 17 M22 | |
| CPU (Single Core) | |
| Asus ROG Strix Scar 18 2023 G834JY-N6005W | |
| MSI Titan GT77 HX 13VI | |
| Medion Erazer Beast X40 (dGPU, Cooling) | |
| Media Intel Core i9-13900HX (722 - 810, n=20) | |
| Medion Erazer Beast X40 | |
| Razer Blade 16 Early 2023 | |
| Media della classe Gaming (439 - 866, n=145, ultimi 2 anni) | |
| Alienware x17 R2 P48E | |
| SCHENKER XMG Neo 17 M22 | |
| Cinebench R15 | |
| CPU Multi 64Bit | |
| MSI Titan GT77 HX 13VI | |
| Medion Erazer Beast X40 | |
| Medion Erazer Beast X40 (dGPU, Cooling) | |
| Medion Erazer Beast X40 (dGPU, Cooling) | |
| Asus ROG Strix Scar 18 2023 G834JY-N6005W | |
| Razer Blade 16 Early 2023 | |
| Media Intel Core i9-13900HX (3913 - 4970, n=21) | |
| Media della classe Gaming (1537 - 6232, n=148, ultimi 2 anni) | |
| Alienware x17 R2 P48E | |
| SCHENKER XMG Neo 17 M22 | |
| CPU Single 64Bit | |
| Asus ROG Strix Scar 18 2023 G834JY-N6005W | |
| MSI Titan GT77 HX 13VI | |
| Medion Erazer Beast X40 | |
| Medion Erazer Beast X40 (dGPU, Cooling) | |
| Medion Erazer Beast X40 (dGPU, Cooling) | |
| Media Intel Core i9-13900HX (247 - 304, n=21) | |
| Media della classe Gaming (191.9 - 343, n=145, ultimi 2 anni) | |
| Razer Blade 16 Early 2023 | |
| Alienware x17 R2 P48E | |
| SCHENKER XMG Neo 17 M22 | |
| Blender - v2.79 BMW27 CPU | |
| SCHENKER XMG Neo 17 M22 | |
| Alienware x17 R2 P48E | |
| Media della classe Gaming (80 - 517, n=139, ultimi 2 anni) | |
| Media Intel Core i9-13900HX (101 - 153, n=21) | |
| Razer Blade 16 Early 2023 | |
| Medion Erazer Beast X40 | |
| Asus ROG Strix Scar 18 2023 G834JY-N6005W | |
| Medion Erazer Beast X40 (dGPU, Cooling) | |
| MSI Titan GT77 HX 13VI | |
| HWBOT x265 Benchmark v2.2 - 4k Preset | |
| Asus ROG Strix Scar 18 2023 G834JY-N6005W | |
| MSI Titan GT77 HX 13VI | |
| Medion Erazer Beast X40 (dGPU, Cooling) | |
| Medion Erazer Beast X40 | |
| Media Intel Core i9-13900HX (23.5 - 34.4, n=21) | |
| Razer Blade 16 Early 2023 | |
| Media della classe Gaming (7.7 - 44.3, n=143, ultimi 2 anni) | |
| Alienware x17 R2 P48E | |
| SCHENKER XMG Neo 17 M22 | |
| LibreOffice - 20 Documents To PDF | |
| SCHENKER XMG Neo 17 M22 | |
| Media della classe Gaming (19 - 96.6, n=141, ultimi 2 anni) | |
| Razer Blade 16 Early 2023 | |
| MSI Titan GT77 HX 13VI | |
| Medion Erazer Beast X40 | |
| Media Intel Core i9-13900HX (32.8 - 51.1, n=20) | |
| Alienware x17 R2 P48E | |
| Medion Erazer Beast X40 (dGPU, Cooling) | |
| Asus ROG Strix Scar 18 2023 G834JY-N6005W | |
| R Benchmark 2.5 - Overall mean | |
| SCHENKER XMG Neo 17 M22 | |
| Media della classe Gaming (0.3551 - 0.759, n=144, ultimi 2 anni) | |
| Alienware x17 R2 P48E | |
| Razer Blade 16 Early 2023 | |
| MSI Titan GT77 HX 13VI | |
| Media Intel Core i9-13900HX (0.375 - 0.4564, n=21) | |
| Medion Erazer Beast X40 | |
| Medion Erazer Beast X40 (dGPU, Cooling) | |
| Asus ROG Strix Scar 18 2023 G834JY-N6005W | |
* ... Meglio usare valori piccoli
AIDA64: FP32 Ray-Trace | FPU Julia | CPU SHA3 | CPU Queen | FPU SinJulia | FPU Mandel | CPU AES | CPU ZLib | FP64 Ray-Trace | CPU PhotoWorxx
| Performance Rating | |
| MSI Titan GT77 HX 13VI | |
| Asus ROG Strix Scar 18 2023 G834JY-N6005W | |
| Medion Erazer Beast X40 | |
| Medion Erazer Beast X40 | |
| Razer Blade 16 Early 2023 | |
| Media Intel Core i9-13900HX | |
| Media della classe Gaming | |
| SCHENKER XMG Neo 17 M22 | |
| Alienware x17 R2 P48E | |
| AIDA64 / FP32 Ray-Trace | |
| MSI Titan GT77 HX 13VI (v6.85.6300) | |
| Asus ROG Strix Scar 18 2023 G834JY-N6005W (v6.85.6300) | |
| Medion Erazer Beast X40 (v6.75.6100, dGPU, Cooling) | |
| Medion Erazer Beast X40 (v6.75.6100) | |
| Razer Blade 16 Early 2023 (v6.85.6300) | |
| Media della classe Gaming (7192 - 85542, n=143, ultimi 2 anni) | |
| Media Intel Core i9-13900HX (17589 - 27615, n=21) | |
| SCHENKER XMG Neo 17 M22 (v6.70.6000) | |
| Alienware x17 R2 P48E (v6.50.5800) | |
| AIDA64 / FPU Julia | |
| MSI Titan GT77 HX 13VI (v6.85.6300) | |
| Asus ROG Strix Scar 18 2023 G834JY-N6005W (v6.85.6300) | |
| Medion Erazer Beast X40 (v6.75.6100, dGPU, Cooling) | |
| Medion Erazer Beast X40 (v6.75.6100) | |
| Razer Blade 16 Early 2023 (v6.85.6300) | |
| Media Intel Core i9-13900HX (88686 - 137015, n=21) | |
| Media della classe Gaming (35040 - 252486, n=143, ultimi 2 anni) | |
| SCHENKER XMG Neo 17 M22 (v6.70.6000) | |
| Alienware x17 R2 P48E (v6.50.5800) | |
| AIDA64 / CPU SHA3 | |
| MSI Titan GT77 HX 13VI (v6.85.6300) | |
| Asus ROG Strix Scar 18 2023 G834JY-N6005W (v6.85.6300) | |
| Medion Erazer Beast X40 (v6.75.6100, dGPU, Cooling) | |
| Medion Erazer Beast X40 (v6.75.6100) | |
| Razer Blade 16 Early 2023 (v6.85.6300) | |
| Media Intel Core i9-13900HX (4362 - 7029, n=21) | |
| Media della classe Gaming (1728 - 10389, n=143, ultimi 2 anni) | |
| Alienware x17 R2 P48E (v6.50.5800) | |
| SCHENKER XMG Neo 17 M22 (v6.70.6000) | |
| AIDA64 / CPU Queen | |
| Asus ROG Strix Scar 18 2023 G834JY-N6005W (v6.85.6300) | |
| MSI Titan GT77 HX 13VI (v6.85.6300) | |
| Medion Erazer Beast X40 (v6.75.6100, dGPU, Cooling) | |
| Media Intel Core i9-13900HX (125644 - 141385, n=21) | |
| Razer Blade 16 Early 2023 (v6.85.6300) | |
| Medion Erazer Beast X40 (v6.75.6100) | |
| Media della classe Gaming (50699 - 200651, n=143, ultimi 2 anni) | |
| Alienware x17 R2 P48E (v6.50.5800) | |
| SCHENKER XMG Neo 17 M22 (v6.70.6000) | |
| AIDA64 / FPU SinJulia | |
| Asus ROG Strix Scar 18 2023 G834JY-N6005W (v6.85.6300) | |
| MSI Titan GT77 HX 13VI (v6.85.6300) | |
| Medion Erazer Beast X40 (v6.75.6100, dGPU, Cooling) | |
| Medion Erazer Beast X40 (v6.75.6100) | |
| Razer Blade 16 Early 2023 (v6.85.6300) | |
| Media Intel Core i9-13900HX (12334 - 17179, n=21) | |
| Media della classe Gaming (5020 - 32988, n=143, ultimi 2 anni) | |
| SCHENKER XMG Neo 17 M22 (v6.70.6000) | |
| Alienware x17 R2 P48E (v6.50.5800) | |
| AIDA64 / FPU Mandel | |
| MSI Titan GT77 HX 13VI (v6.85.6300) | |
| Asus ROG Strix Scar 18 2023 G834JY-N6005W (v6.85.6300) | |
| Medion Erazer Beast X40 (v6.75.6100, dGPU, Cooling) | |
| Medion Erazer Beast X40 (v6.75.6100) | |
| Razer Blade 16 Early 2023 (v6.85.6300) | |
| Media Intel Core i9-13900HX (43850 - 69202, n=21) | |
| Media della classe Gaming (17585 - 134044, n=143, ultimi 2 anni) | |
| SCHENKER XMG Neo 17 M22 (v6.70.6000) | |
| Alienware x17 R2 P48E (v6.50.5800) | |
| AIDA64 / CPU AES | |
| Media Intel Core i9-13900HX (89413 - 237881, n=21) | |
| MSI Titan GT77 HX 13VI (v6.85.6300) | |
| SCHENKER XMG Neo 17 M22 (v6.70.6000) | |
| Asus ROG Strix Scar 18 2023 G834JY-N6005W (v6.85.6300) | |
| Medion Erazer Beast X40 (v6.75.6100, dGPU, Cooling) | |
| Medion Erazer Beast X40 (v6.75.6100) | |
| Razer Blade 16 Early 2023 (v6.85.6300) | |
| Media della classe Gaming (19065 - 328679, n=143, ultimi 2 anni) | |
| Alienware x17 R2 P48E (v6.50.5800) | |
| AIDA64 / CPU ZLib | |
| MSI Titan GT77 HX 13VI (v6.85.6300) | |
| Asus ROG Strix Scar 18 2023 G834JY-N6005W (v6.85.6300) | |
| Medion Erazer Beast X40 (v6.75.6100, dGPU, Cooling) | |
| Medion Erazer Beast X40 (v6.75.6100) | |
| Razer Blade 16 Early 2023 (v6.85.6300) | |
| Media Intel Core i9-13900HX (1284 - 1958, n=21) | |
| Media della classe Gaming (373 - 2531, n=143, ultimi 2 anni) | |
| Alienware x17 R2 P48E (v6.50.5800) | |
| SCHENKER XMG Neo 17 M22 (v6.70.6000) | |
| AIDA64 / FP64 Ray-Trace | |
| MSI Titan GT77 HX 13VI (v6.85.6300) | |
| Asus ROG Strix Scar 18 2023 G834JY-N6005W (v6.85.6300) | |
| Medion Erazer Beast X40 (v6.75.6100, dGPU, Cooling) | |
| Medion Erazer Beast X40 (v6.75.6100) | |
| Razer Blade 16 Early 2023 (v6.85.6300) | |
| Media Intel Core i9-13900HX (9481 - 15279, n=21) | |
| Media della classe Gaming (3856 - 45446, n=143, ultimi 2 anni) | |
| SCHENKER XMG Neo 17 M22 (v6.70.6000) | |
| Alienware x17 R2 P48E (v6.50.5800) | |
| AIDA64 / CPU PhotoWorxx | |
| Razer Blade 16 Early 2023 (v6.85.6300) | |
| Media Intel Core i9-13900HX (42994 - 51994, n=21) | |
| Medion Erazer Beast X40 (v6.75.6100, dGPU, Cooling) | |
| Asus ROG Strix Scar 18 2023 G834JY-N6005W (v6.85.6300) | |
| Medion Erazer Beast X40 (v6.75.6100) | |
| MSI Titan GT77 HX 13VI (v6.85.6300) | |
| Media della classe Gaming (10805 - 62274, n=143, ultimi 2 anni) | |
| Alienware x17 R2 P48E (v6.50.5800) | |
| SCHENKER XMG Neo 17 M22 (v6.70.6000) | |
Prestazioni del sistema
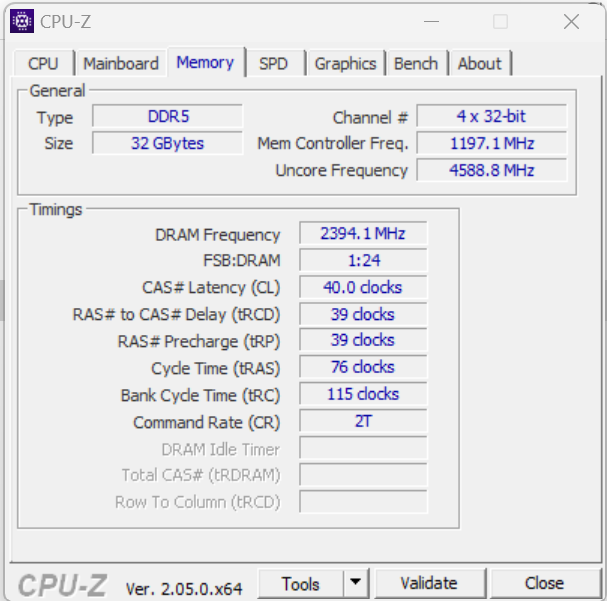
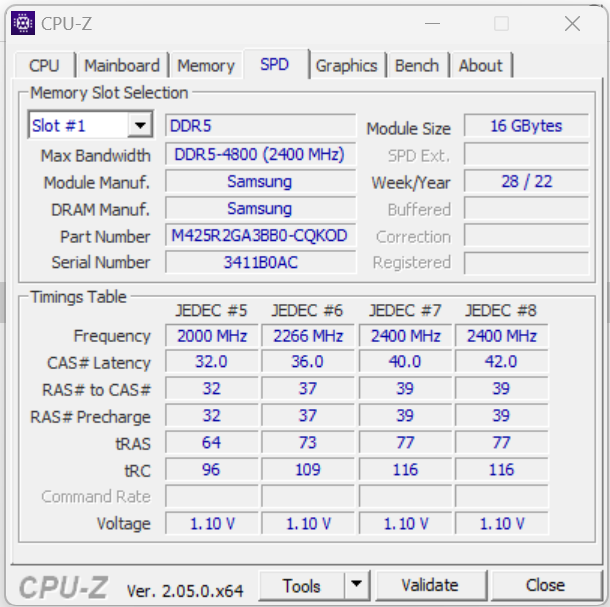
L'hardware all'interno di questo sistema scattante offre prestazioni più che sufficienti per attività come il gioco e il rendering. Il portatile è dotato di 32 GB di memoria in modalità dual-channel. Le velocità di trasferimento della memoria sono tipiche di una RAM DDR5-4800. Inoltre, nei nostri test il sistema ha ottenuto ottimi risultati con PCMark.
CrossMark: Overall | Productivity | Creativity | Responsiveness
| PCMark 10 / Score | |
| Medion Erazer Beast X40 (dGPU, Cooling) | |
| MSI Titan GT77 HX 13VI | |
| Asus ROG Strix Scar 18 2023 G834JY-N6005W | |
| Media Intel Core i9-13900HX, NVIDIA GeForce RTX 4090 Laptop GPU (7690 - 9331, n=8) | |
| Alienware x17 R2 P48E | |
| Media della classe Gaming (5776 - 9852, n=130, ultimi 2 anni) | |
| Medion Erazer Beast X40 | |
| Razer Blade 16 Early 2023 | |
| SCHENKER XMG Neo 17 M22 | |
| PCMark 10 / Essentials | |
| MSI Titan GT77 HX 13VI | |
| Medion Erazer Beast X40 (dGPU, Cooling) | |
| Media Intel Core i9-13900HX, NVIDIA GeForce RTX 4090 Laptop GPU (10972 - 11983, n=8) | |
| Medion Erazer Beast X40 | |
| Alienware x17 R2 P48E | |
| Razer Blade 16 Early 2023 | |
| Media della classe Gaming (9057 - 12600, n=130, ultimi 2 anni) | |
| SCHENKER XMG Neo 17 M22 | |
| PCMark 10 / Productivity | |
| Medion Erazer Beast X40 (dGPU, Cooling) | |
| Medion Erazer Beast X40 | |
| Media Intel Core i9-13900HX, NVIDIA GeForce RTX 4090 Laptop GPU (9038 - 11680, n=8) | |
| Alienware x17 R2 P48E | |
| Media della classe Gaming (6662 - 14612, n=130, ultimi 2 anni) | |
| MSI Titan GT77 HX 13VI | |
| SCHENKER XMG Neo 17 M22 | |
| Razer Blade 16 Early 2023 | |
| PCMark 10 / Digital Content Creation | |
| MSI Titan GT77 HX 13VI | |
| Medion Erazer Beast X40 (dGPU, Cooling) | |
| Razer Blade 16 Early 2023 | |
| Media Intel Core i9-13900HX, NVIDIA GeForce RTX 4090 Laptop GPU (10605 - 16395, n=8) | |
| Alienware x17 R2 P48E | |
| Media della classe Gaming (7440 - 19351, n=130, ultimi 2 anni) | |
| Medion Erazer Beast X40 | |
| SCHENKER XMG Neo 17 M22 | |
| CrossMark / Overall | |
| Medion Erazer Beast X40 (dGPU, Cooling) | |
| MSI Titan GT77 HX 13VI | |
| Medion Erazer Beast X40 | |
| Media Intel Core i9-13900HX, NVIDIA GeForce RTX 4090 Laptop GPU (1825 - 2295, n=8) | |
| Asus ROG Strix Scar 18 2023 G834JY-N6005W | |
| Media della classe Gaming (1247 - 2344, n=109, ultimi 2 anni) | |
| Alienware x17 R2 P48E | |
| SCHENKER XMG Neo 17 M22 | |
| Razer Blade 16 Early 2023 | |
| CrossMark / Productivity | |
| Medion Erazer Beast X40 (dGPU, Cooling) | |
| Medion Erazer Beast X40 | |
| MSI Titan GT77 HX 13VI | |
| Media Intel Core i9-13900HX, NVIDIA GeForce RTX 4090 Laptop GPU (1666 - 2166, n=8) | |
| Asus ROG Strix Scar 18 2023 G834JY-N6005W | |
| Media della classe Gaming (1299 - 2204, n=109, ultimi 2 anni) | |
| Alienware x17 R2 P48E | |
| SCHENKER XMG Neo 17 M22 | |
| Razer Blade 16 Early 2023 | |
| CrossMark / Creativity | |
| Asus ROG Strix Scar 18 2023 G834JY-N6005W | |
| MSI Titan GT77 HX 13VI | |
| Medion Erazer Beast X40 (dGPU, Cooling) | |
| Medion Erazer Beast X40 | |
| Media Intel Core i9-13900HX, NVIDIA GeForce RTX 4090 Laptop GPU (2162 - 2514, n=8) | |
| Media della classe Gaming (1275 - 2660, n=109, ultimi 2 anni) | |
| Alienware x17 R2 P48E | |
| SCHENKER XMG Neo 17 M22 | |
| Razer Blade 16 Early 2023 | |
| CrossMark / Responsiveness | |
| Medion Erazer Beast X40 (dGPU, Cooling) | |
| MSI Titan GT77 HX 13VI | |
| Medion Erazer Beast X40 | |
| Media Intel Core i9-13900HX, NVIDIA GeForce RTX 4090 Laptop GPU (1441 - 2275, n=8) | |
| Media della classe Gaming (1030 - 2330, n=109, ultimi 2 anni) | |
| Alienware x17 R2 P48E | |
| Asus ROG Strix Scar 18 2023 G834JY-N6005W | |
| SCHENKER XMG Neo 17 M22 | |
| Razer Blade 16 Early 2023 | |
| PCMark 8 Home Score Accelerated v2 | 4936 punti | |
| PCMark 8 Work Score Accelerated v2 | 6075 punti | |
| PCMark 10 Score | 7932 punti | |
Aiuto | ||
| AIDA64 / Memory Copy | |
| Razer Blade 16 Early 2023 | |
| Media Intel Core i9-13900HX (67716 - 78835, n=21) | |
| Medion Erazer Beast X40 | |
| Asus ROG Strix Scar 18 2023 G834JY-N6005W | |
| Media della classe Gaming (21750 - 97515, n=143, ultimi 2 anni) | |
| MSI Titan GT77 HX 13VI | |
| Alienware x17 R2 P48E | |
| SCHENKER XMG Neo 17 M22 | |
| AIDA64 / Memory Read | |
| Razer Blade 16 Early 2023 | |
| Media Intel Core i9-13900HX (73998 - 88462, n=21) | |
| Asus ROG Strix Scar 18 2023 G834JY-N6005W | |
| Medion Erazer Beast X40 | |
| Media della classe Gaming (22956 - 102937, n=143, ultimi 2 anni) | |
| MSI Titan GT77 HX 13VI | |
| Alienware x17 R2 P48E | |
| SCHENKER XMG Neo 17 M22 | |
| AIDA64 / Memory Write | |
| Razer Blade 16 Early 2023 | |
| Media Intel Core i9-13900HX (65472 - 77045, n=21) | |
| Media della classe Gaming (22297 - 108954, n=143, ultimi 2 anni) | |
| Asus ROG Strix Scar 18 2023 G834JY-N6005W | |
| Medion Erazer Beast X40 | |
| MSI Titan GT77 HX 13VI | |
| SCHENKER XMG Neo 17 M22 | |
| Alienware x17 R2 P48E | |
| AIDA64 / Memory Latency | |
| Razer Blade 16 Early 2023 | |
| Alienware x17 R2 P48E | |
| Media della classe Gaming (59.5 - 259, n=143, ultimi 2 anni) | |
| MSI Titan GT77 HX 13VI | |
| SCHENKER XMG Neo 17 M22 | |
| Asus ROG Strix Scar 18 2023 G834JY-N6005W | |
| Medion Erazer Beast X40 | |
| Media Intel Core i9-13900HX (80.4 - 91.1, n=21) | |
* ... Meglio usare valori piccoli
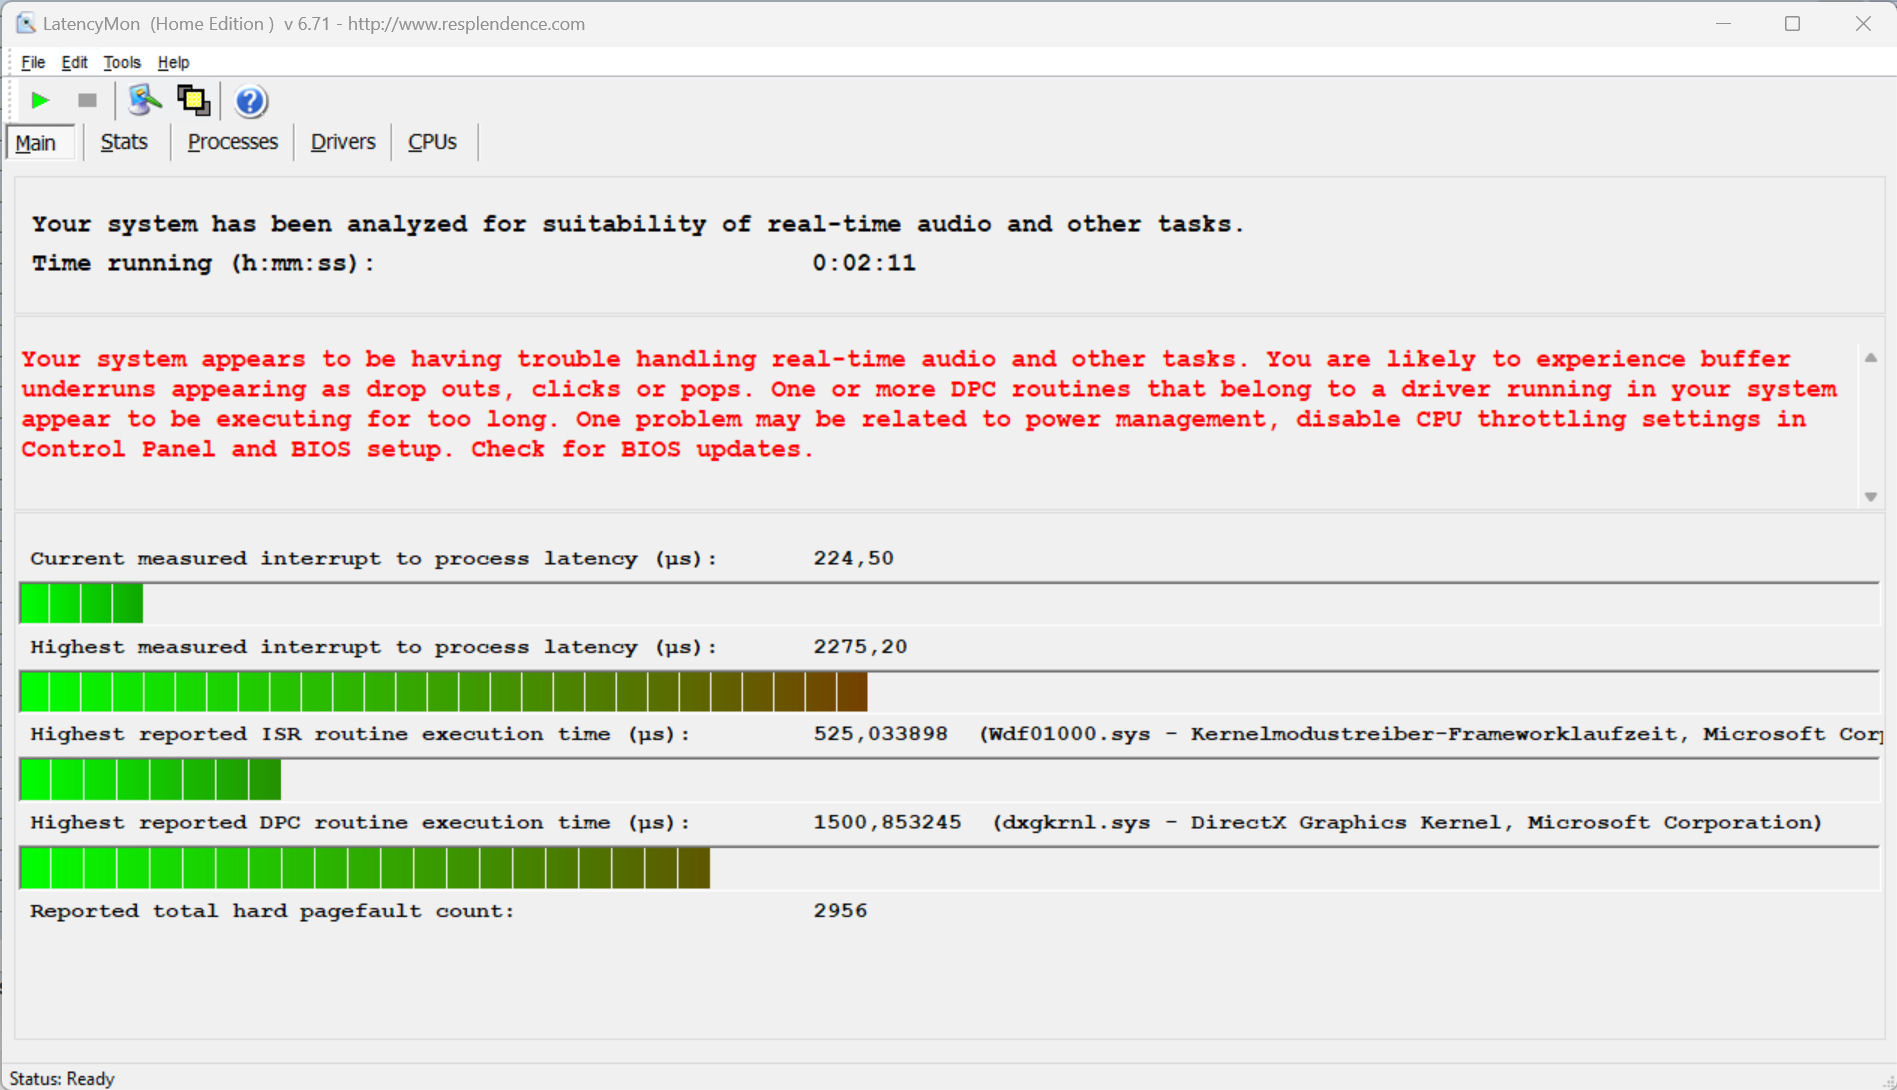
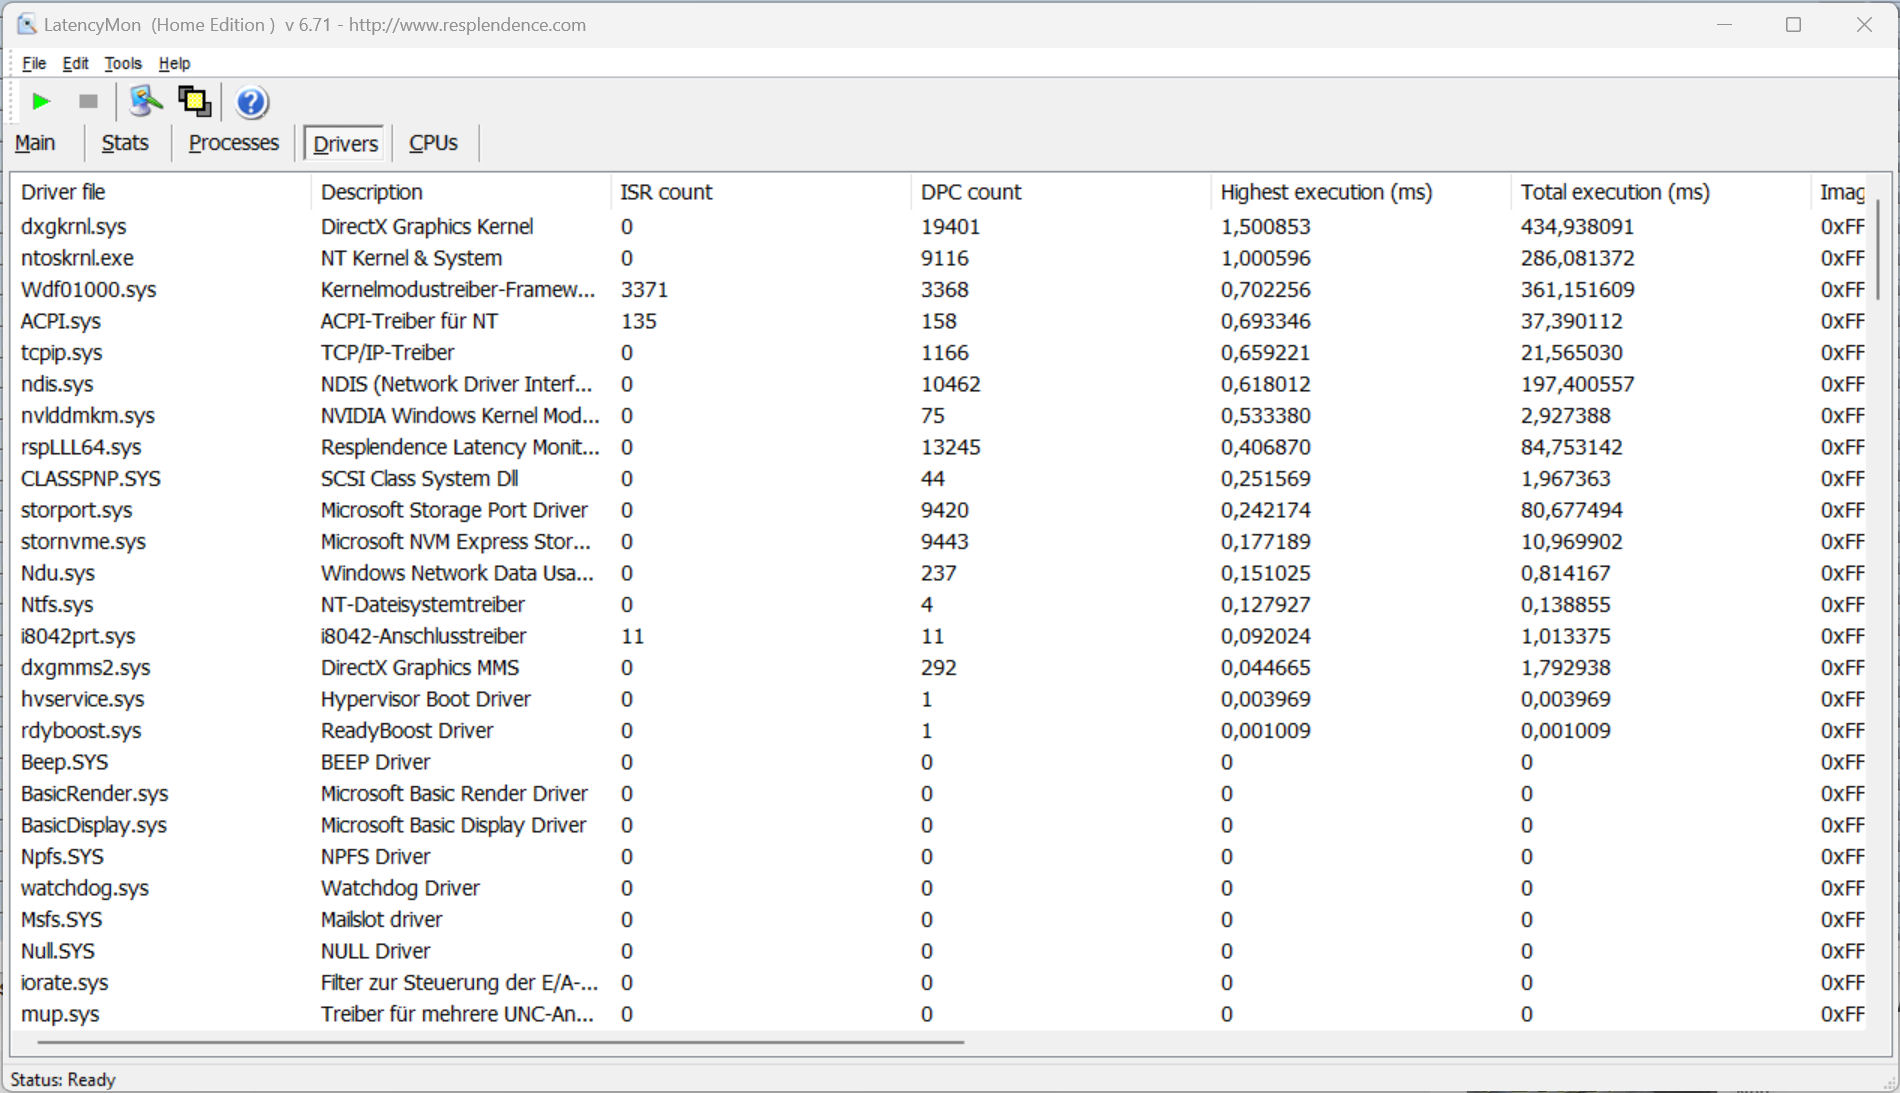
Latenza DPC
Il nostro test standardizzato di monitoraggio della latenza, che prevede la navigazione web, la riproduzione di video 4K e Prime95 ad alto carico, ha rivelato alcuni problemi. Il sistema sembra non essere adatto all'elaborazione di video e audio in tempo reale. Speriamo che i futuri aggiornamenti del software contribuiscano a correggere questi problemi.
| DPC Latencies / LatencyMon - interrupt to process latency (max), Web, Youtube, Prime95 | |
| MSI Titan GT77 HX 13VI | |
| SCHENKER XMG Neo 17 M22 | |
| Razer Blade 16 Early 2023 | |
| Medion Erazer Beast X40 | |
| Alienware x17 R2 P48E | |
| Asus ROG Strix Scar 18 2023 G834JY-N6005W | |
* ... Meglio usare valori piccoli
Memoria di massa
Medion ha dotato la nostra unità X40 di due SSD da 1 TB (PCIe 4.0, M.2-2280) prodotte da Phison. Una di esse funge da unità di sistema, mentre l'altra è utilizzata per l'archiviazione dei dati. Non solo le unità SSD non formano una configurazione RAID, ma il portatile stesso non supporta il RAID. Le unità incluse non sono tra le migliori unità SSD del mercato. Nonostante ciò, offrono comunque ottime prestazioni. Un altro aspetto positivo da menzionare è che non abbiamo notato alcun calo di prestazioni causato dal thermal throttling.

* ... Meglio usare valori piccoli
Sustained Load Read: DiskSpd Read Loop, Queue Depth 8
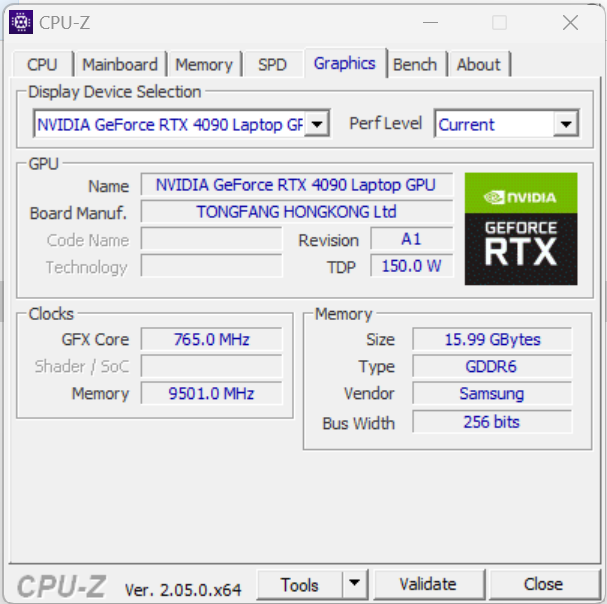
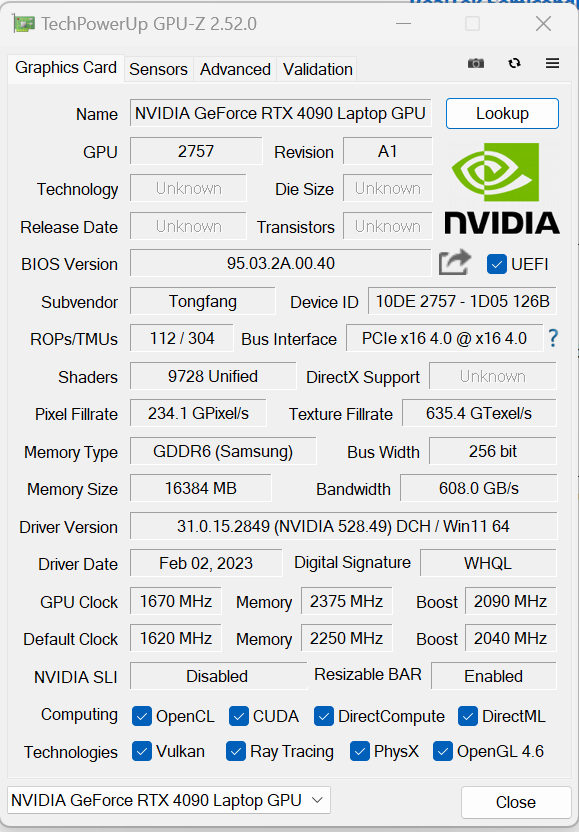
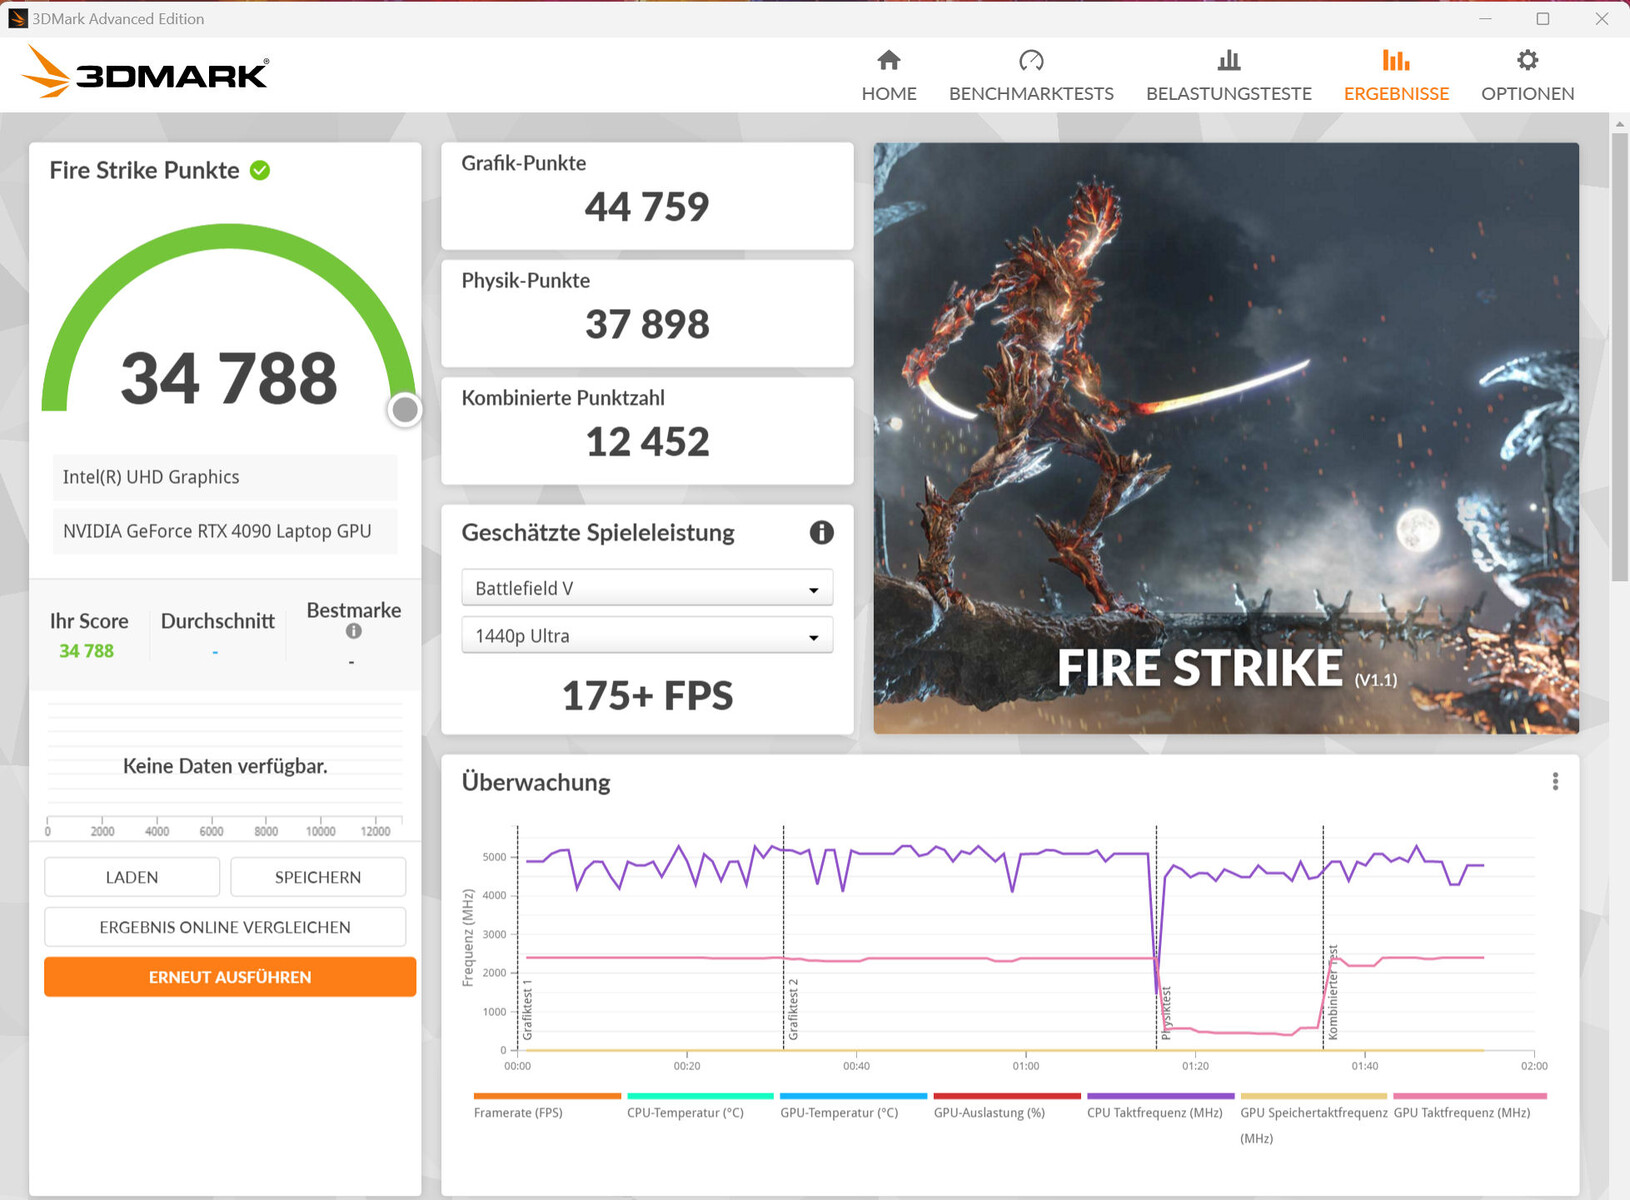
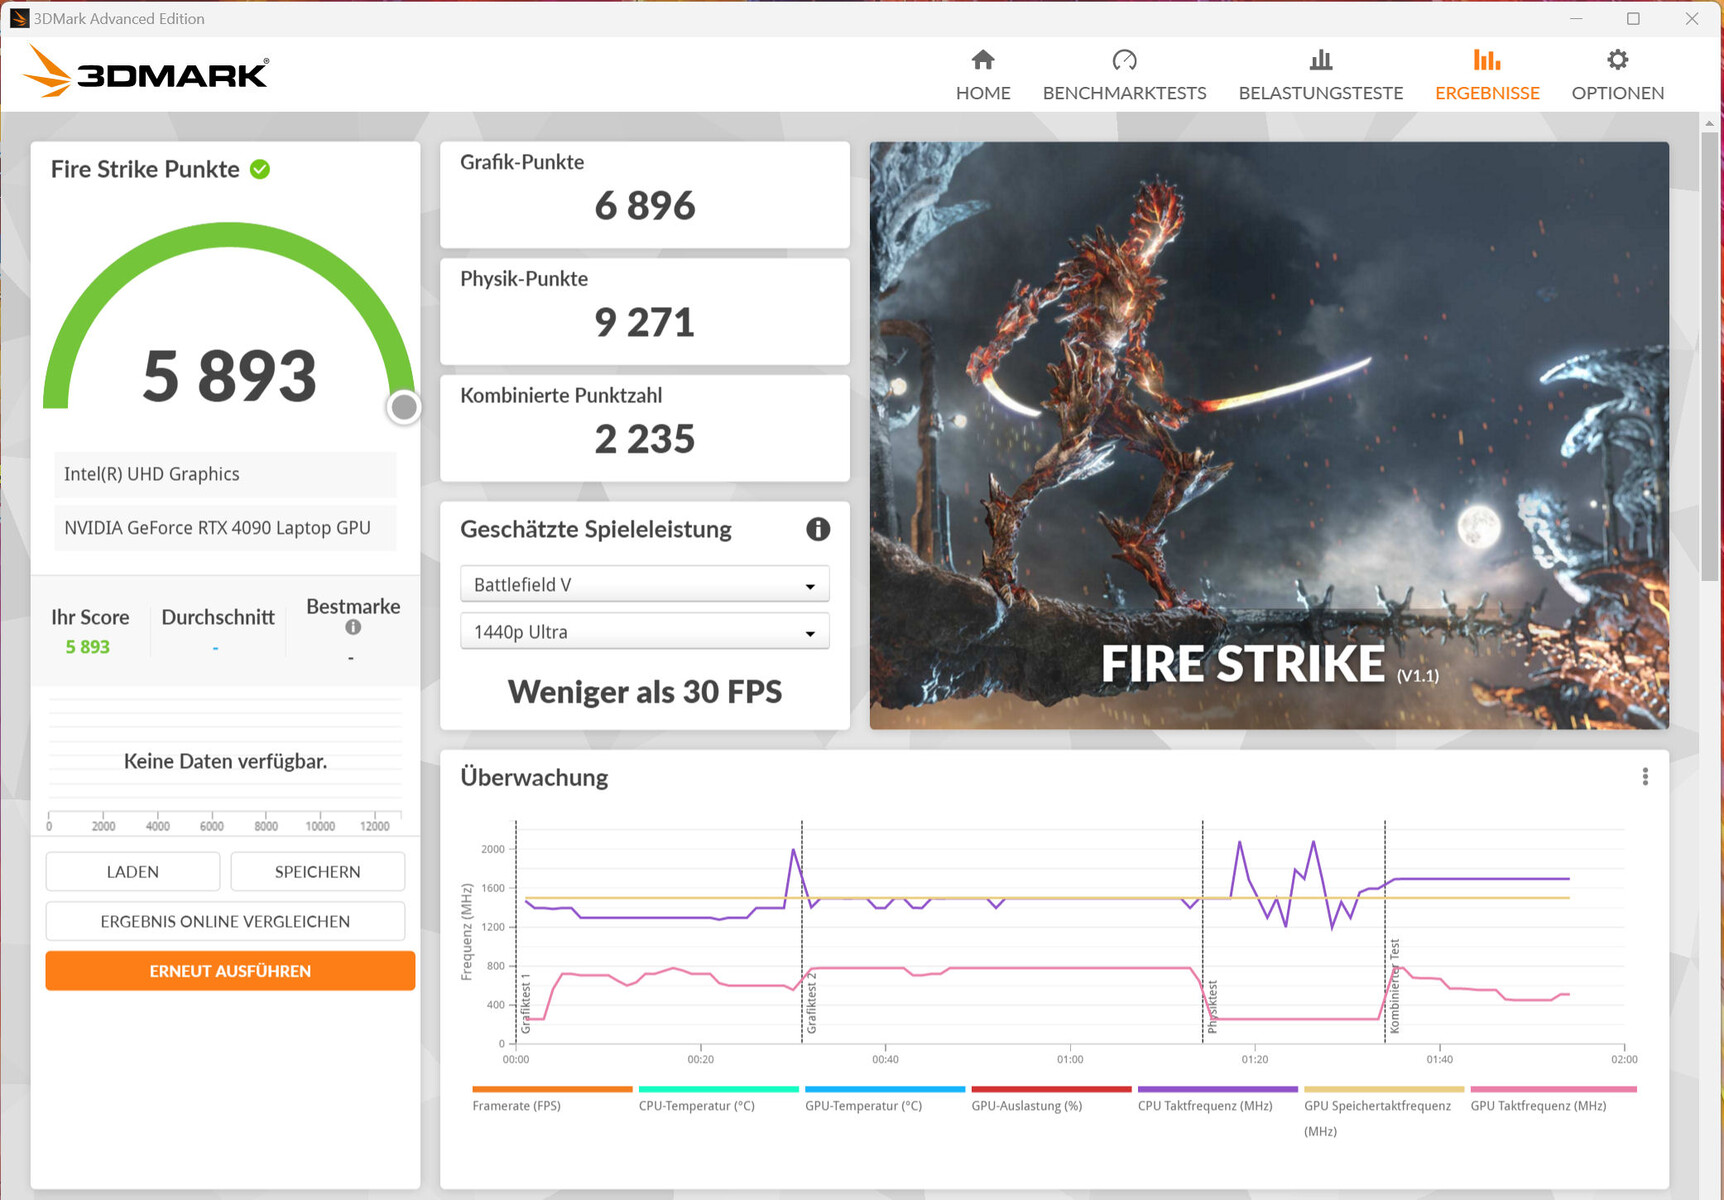
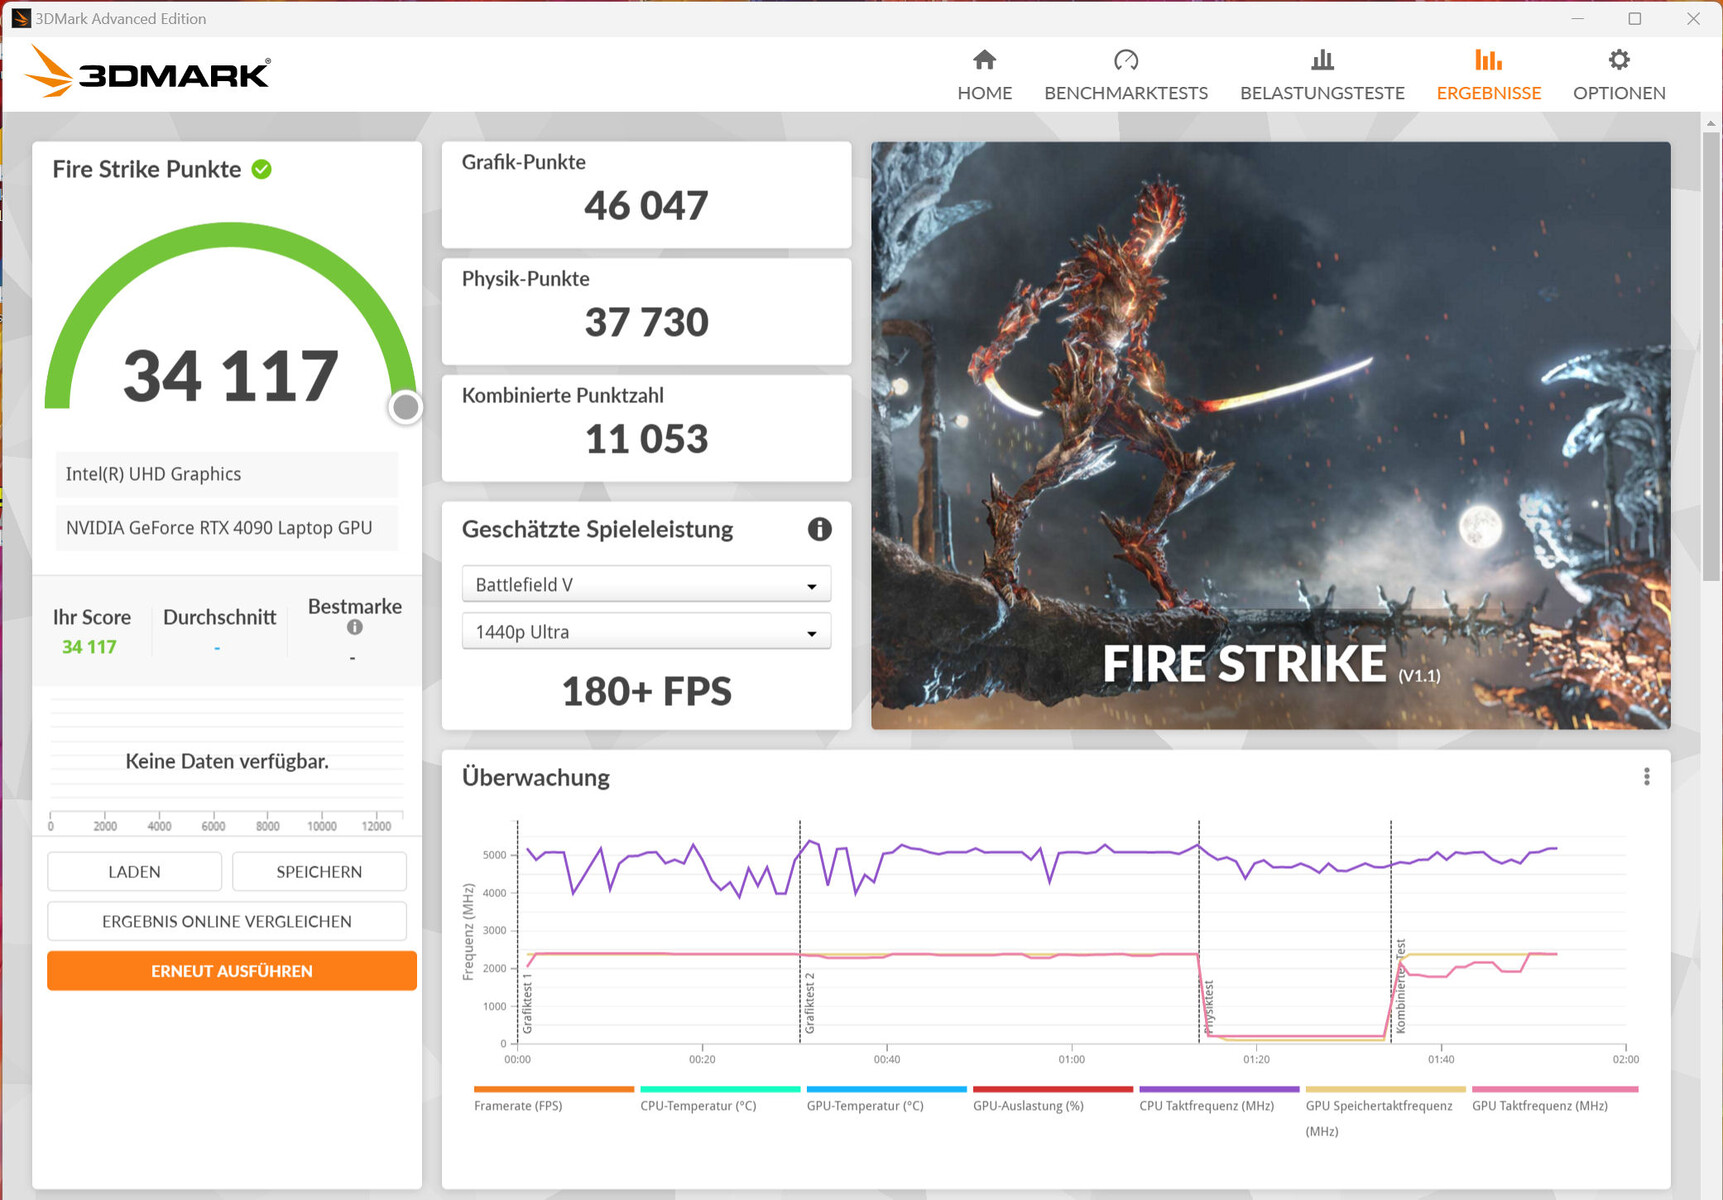
Scheda grafica
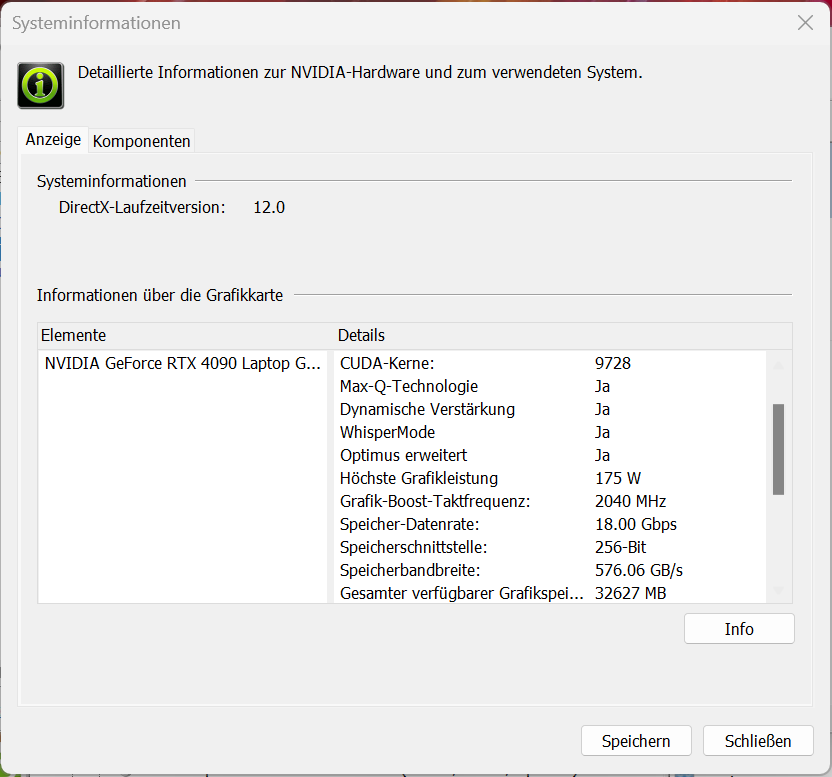
GeForce RTX 4090 Laptop è l'attuale GPU mobile di punta di Nvidia. Dispone di 9.728 unità di shading, un bus di memoria a 256 bit e 16.384 MB di memoria GDDR6 ad alta velocità. La RTX 4090 ha a disposizione fino a 175 watt di TGP (150 watt + 25 watt di Dynamic Boost), il massimo che si possa ottenere. Ma il TGP non è stato utilizzato appieno durante il nostro test Witcher 3.
I risultati del benchmark sono in media pari (modalità Optimus) o leggermente superiori (modalità dGPU) a quanto abbiamo visto finora con la RTX 4090 Laptop. Il portatile supporta anche la modalità Optimus avanzata. Il passaggio dalla modalità dGPU a quella Optimus non richiede il riavvio del computer.
Il raffreddamento ad acqua opzionale può dare un leggero aumento delle prestazioni in alcuni benchmark e giochi. Witcher 3 il gioco, ad esempio, ha funzionato con un frame rate più elevato durante i nostri test. Anche la temperatura media della GPU è risultata inferiore rispetto all'utilizzo del solo raffreddamento ad aria.
| 3DMark Performance Rating - Percent | |
| MSI Titan GT77 HX 13VI -1! | |
| Medion Erazer Beast X40 | |
| Medion Erazer Beast X40 | |
| Asus ROG Strix Scar 18 2023 G834JY-N6005W | |
| Medion Erazer Beast X40 | |
| Media NVIDIA GeForce RTX 4090 Laptop GPU | |
| Razer Blade 16 Early 2023 -1! | |
| Alienware x17 R2 P48E | |
| Media della classe Gaming | |
| SCHENKER XMG Neo 17 M22 -1! | |
| 3DMark 11 - 1280x720 Performance GPU | |
| Medion Erazer Beast X40 (dGPU, Cooling) | |
| MSI Titan GT77 HX 13VI | |
| Medion Erazer Beast X40 | |
| Medion Erazer Beast X40 (dGPU) | |
| Media NVIDIA GeForce RTX 4090 Laptop GPU (54073 - 73027, n=42) | |
| Asus ROG Strix Scar 18 2023 G834JY-N6005W | |
| Razer Blade 16 Early 2023 | |
| Media della classe Gaming (10741 - 72215, n=137, ultimi 2 anni) | |
| Alienware x17 R2 P48E | |
| SCHENKER XMG Neo 17 M22 | |
| 3DMark 06 Standard Score | 60717 punti | |
| 3DMark 11 Performance | 47487 punti | |
| 3DMark Cloud Gate Standard Score | 66757 punti | |
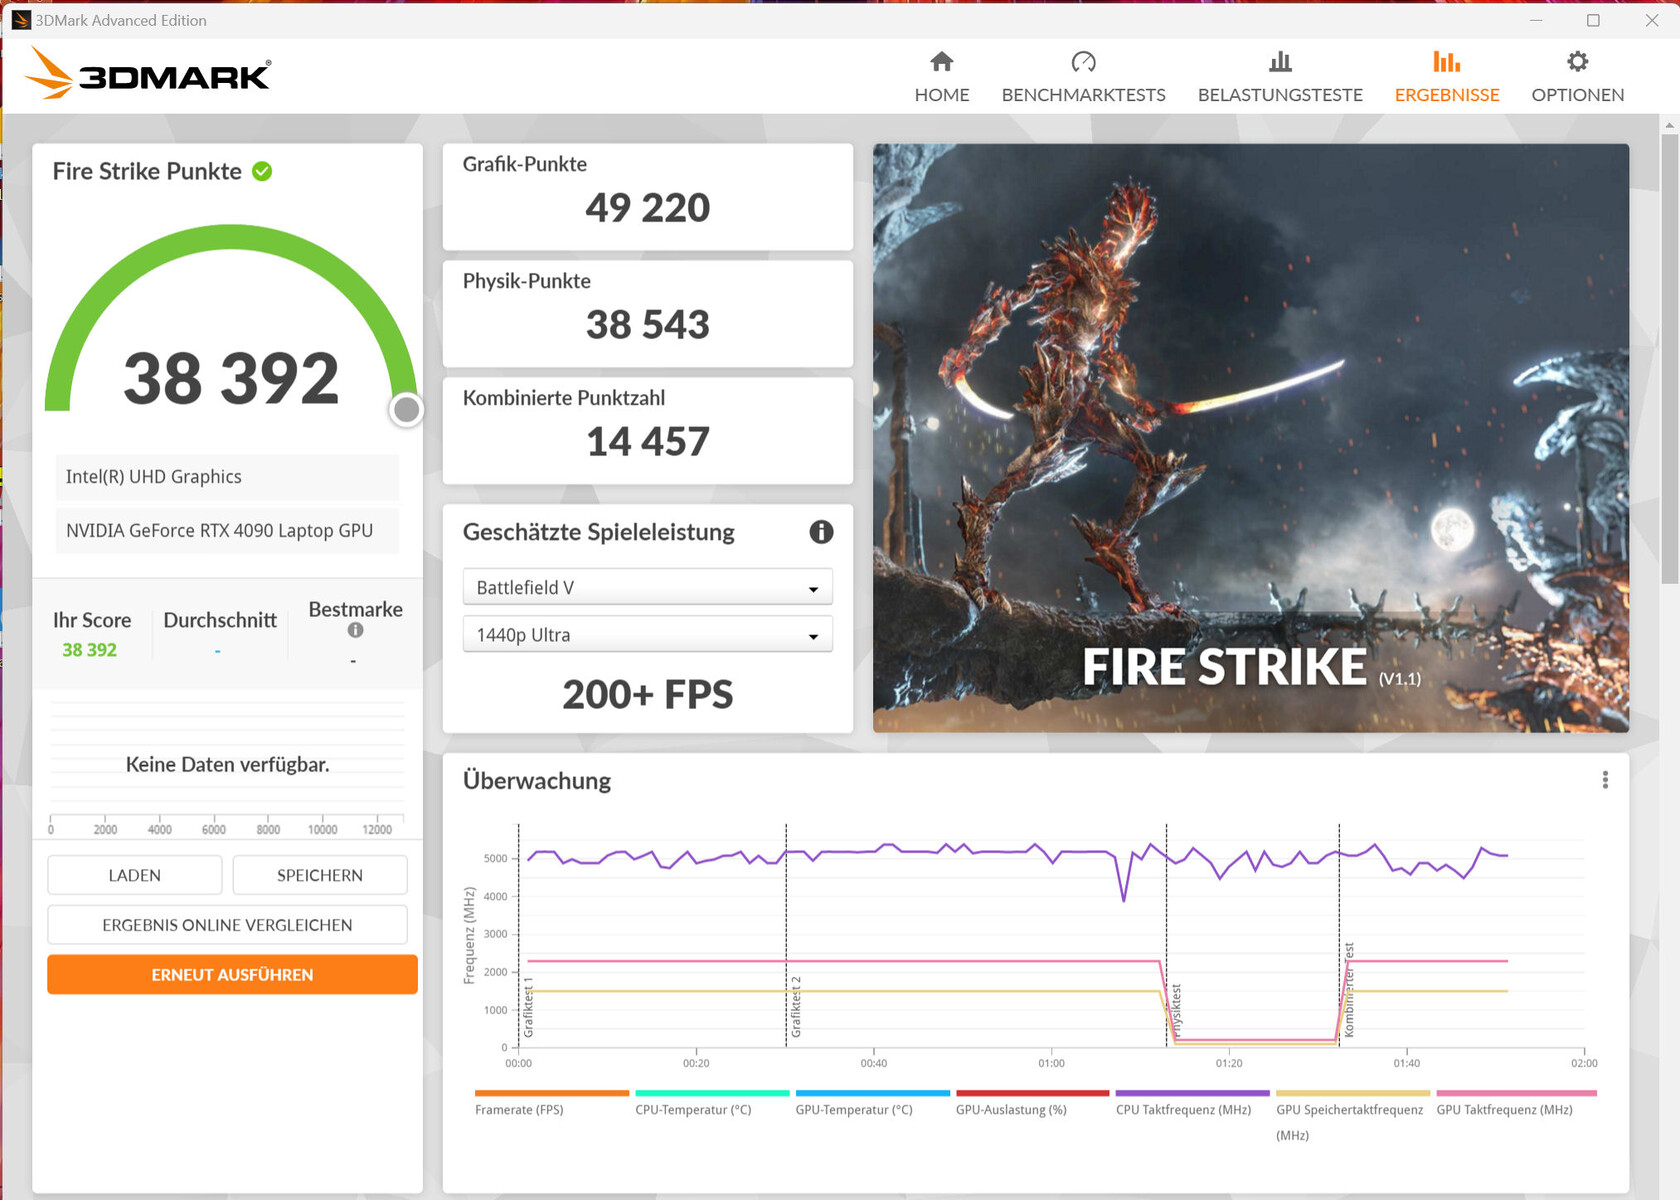
| 3DMark Fire Strike Score | 34788 punti | |
| 3DMark Time Spy Score | 19708 punti | |
Aiuto | ||
| Blender | |
| v3.3 Classroom OPTIX/RTX | |
| Media della classe Gaming (9.9 - 95, n=137, ultimi 2 anni) | |
| Razer Blade 16 Early 2023 (3.3.3) | |
| Medion Erazer Beast X40 (3.3.3) | |
| Media NVIDIA GeForce RTX 4090 Laptop GPU (9 - 19, n=39) | |
| Medion Erazer Beast X40 (3.3.3, dGPU, Cooling) | |
| MSI Titan GT77 HX 13VI (3.3.3) | |
| Asus ROG Strix Scar 18 2023 G834JY-N6005W (3.3.3) | |
| Medion Erazer Beast X40 (3.3.3, dGPU) | |
| v3.3 Classroom CUDA | |
| Media della classe Gaming (15 - 110, n=138, ultimi 2 anni) | |
| Razer Blade 16 Early 2023 (3.3.3) | |
| Medion Erazer Beast X40 (3.3.3) | |
| Medion Erazer Beast X40 (3.3.3, dGPU, Cooling) | |
| Media NVIDIA GeForce RTX 4090 Laptop GPU (16 - 24, n=39) | |
| Asus ROG Strix Scar 18 2023 G834JY-N6005W (3.3.3) | |
| Asus ROG Strix Scar 18 2023 G834JY-N6005W (3.3.3) | |
| Medion Erazer Beast X40 (3.3.3, dGPU) | |
| MSI Titan GT77 HX 13VI (3.3.3) | |
| Geekbench 5.5 | |
| OpenCL Score | |
| Medion Erazer Beast X40 (dGPU) | |
| MSI Titan GT77 HX 13VI | |
| Asus ROG Strix Scar 18 2023 G834JY-N6005W | |
| Media NVIDIA GeForce RTX 4090 Laptop GPU (6841 - 237138, n=39) | |
| Medion Erazer Beast X40 | |
| Medion Erazer Beast X40 (dGPU, Cooling) | |
| Razer Blade 16 Early 2023 | |
| Alienware x17 R2 P48E | |
| SCHENKER XMG Neo 17 M22 | |
| Media della classe Gaming (5039 - 274130, n=142, ultimi 2 anni) | |
| Vulkan Score 5.5 | |
| Medion Erazer Beast X40 (dGPU, Cooling) | |
| Media NVIDIA GeForce RTX 4090 Laptop GPU (49663 - 163089, n=28) | |
| MSI Titan GT77 HX 13VI | |
| Alienware x17 R2 P48E | |
| Medion Erazer Beast X40 (dGPU) | |
| Razer Blade 16 Early 2023 | |
| Media della classe Gaming (9296 - 177533, n=105, ultimi 2 anni) | |
| Asus ROG Strix Scar 18 2023 G834JY-N6005W | |
| V-Ray Benchmark Next 4.10 | |
| GPU | |
| Asus ROG Strix Scar 18 2023 G834JY-N6005W (v4.10.07 ) | |
| MSI Titan GT77 HX 13VI (v4.10.07 ) | |
| Medion Erazer Beast X40 (v4.10.07 ) | |
| Medion Erazer Beast X40 (v4.10.07, dGPU) | |
| Media NVIDIA GeForce RTX 4090 Laptop GPU (873 - 1334, n=30) | |
| Medion Erazer Beast X40 (v4.10.07, dGPU, Cooling ) | |
| Media della classe Gaming (54 - 1317, n=118, ultimi 2 anni) | |
| SCHENKER XMG Neo 17 M22 (v4.10.07 ) | |
| CPU | |
| MSI Titan GT77 HX 13VI (v4.10.07 ) | |
| Medion Erazer Beast X40 (v4.10.07, dGPU, Cooling) | |
| Asus ROG Strix Scar 18 2023 G834JY-N6005W (v4.10.07 ) | |
| Medion Erazer Beast X40 (v4.10.07 ) | |
| Medion Erazer Beast X40 (v4.10.07, dGPU) | |
| Media NVIDIA GeForce RTX 4090 Laptop GPU (18206 - 37629, n=30) | |
| Media della classe Gaming (6122 - 44129, n=118, ultimi 2 anni) | |
| SCHENKER XMG Neo 17 M22 (v4.10.07 ) | |
* ... Meglio usare valori piccoli
Prestazioni di gioco
L'X40 consente agli utenti di giocare a giochi con risoluzione QHD+ e impostazioni massime. È possibile utilizzare una risoluzione superiore se si collega il portatile a un monitor appropriato. I giochi che abbiamo testato funzionano generalmente con frame rate simili a quelli che abbiamo visto finora con la RTX 4090. A seconda del gioco, è possibile ottenere frame rate più elevati pilotando il display direttamente dalla GPU GeForce.
| Performance Rating - Percent | |
| Medion Erazer Beast X40 | |
| Medion Erazer Beast X40 | |
| Asus ROG Strix Scar 18 2023 G834JY-N6005W -1! | |
| MSI Titan GT77 HX 13VI | |
| Medion Erazer Beast X40 | |
| Media NVIDIA GeForce RTX 4090 Laptop GPU | |
| Razer Blade 16 Early 2023 | |
| Alienware x17 R2 P48E | |
| Media della classe Gaming | |
| SCHENKER XMG Neo 17 M22 | |
| The Witcher 3 - 1920x1080 Ultra Graphics & Postprocessing (HBAO+) | |
| Medion Erazer Beast X40 (dGPU) | |
| Medion Erazer Beast X40 (dGPU, Cooling) | |
| MSI Titan GT77 HX 13VI | |
| Media NVIDIA GeForce RTX 4090 Laptop GPU (139.2 - 216, n=35) | |
| Medion Erazer Beast X40 | |
| Razer Blade 16 Early 2023 | |
| Alienware x17 R2 P48E | |
| Media della classe Gaming (18.4 - 224, n=104, ultimi 2 anni) | |
| SCHENKER XMG Neo 17 M22 | |
| GTA V - 1920x1080 Highest Settings possible AA:4xMSAA + FX AF:16x | |
| Medion Erazer Beast X40 (dGPU) | |
| Medion Erazer Beast X40 | |
| Medion Erazer Beast X40 (dGPU, Cooling) | |
| Asus ROG Strix Scar 18 2023 G834JY-N6005W | |
| MSI Titan GT77 HX 13VI | |
| Razer Blade 16 Early 2023 | |
| Media NVIDIA GeForce RTX 4090 Laptop GPU (91.1 - 167.7, n=40) | |
| Alienware x17 R2 P48E | |
| Media della classe Gaming (12.1 - 168.2, n=123, ultimi 2 anni) | |
| SCHENKER XMG Neo 17 M22 | |
| Final Fantasy XV Benchmark - 1920x1080 High Quality | |
| MSI Titan GT77 HX 13VI (1.3) | |
| Medion Erazer Beast X40 (1.3, dGPU) | |
| Medion Erazer Beast X40 (1.3, dGPU, Cooling) | |
| Asus ROG Strix Scar 18 2023 G834JY-N6005W (1.3) | |
| Medion Erazer Beast X40 (1.3) | |
| Media NVIDIA GeForce RTX 4090 Laptop GPU (122.2 - 201, n=40) | |
| Razer Blade 16 Early 2023 (1.3) | |
| Alienware x17 R2 P48E (1.3) | |
| Media della classe Gaming (19.2 - 210, n=139, ultimi 2 anni) | |
| SCHENKER XMG Neo 17 M22 (1.3) | |
| Strange Brigade - 1920x1080 ultra AA:ultra AF:16 | |
| Medion Erazer Beast X40 (1.47.22.14 D3D12, dGPU, Cooling) | |
| Medion Erazer Beast X40 (1.47.22.14 D3D12, dGPU) | |
| MSI Titan GT77 HX 13VI (1.47.22.14 D3D12) | |
| Asus ROG Strix Scar 18 2023 G834JY-N6005W (1.47.22.14 D3D12) | |
| Medion Erazer Beast X40 (1.47.22.14 D3D12) | |
| Media NVIDIA GeForce RTX 4090 Laptop GPU (233 - 421, n=39) | |
| Razer Blade 16 Early 2023 (1.47.22.14 D3D12) | |
| Media della classe Gaming (38.9 - 434, n=135, ultimi 2 anni) | |
| Alienware x17 R2 P48E (1.47.22.14 D3D12) | |
| SCHENKER XMG Neo 17 M22 (1.47.22.14 D3D12) | |
| Dota 2 Reborn - 1920x1080 ultra (3/3) best looking | |
| Razer Blade 16 Early 2023 | |
| Asus ROG Strix Scar 18 2023 G834JY-N6005W | |
| MSI Titan GT77 HX 13VI | |
| Medion Erazer Beast X40 (dGPU, Cooling) | |
| Medion Erazer Beast X40 (dGPU) | |
| Media NVIDIA GeForce RTX 4090 Laptop GPU (115.7 - 220, n=42) | |
| Medion Erazer Beast X40 | |
| Alienware x17 R2 P48E | |
| Media della classe Gaming (65.1 - 220, n=142, ultimi 2 anni) | |
| SCHENKER XMG Neo 17 M22 | |
| X-Plane 11.11 - 1920x1080 high (fps_test=3) | |
| Asus ROG Strix Scar 18 2023 G834JY-N6005W | |
| Razer Blade 16 Early 2023 | |
| Medion Erazer Beast X40 (dGPU) | |
| Medion Erazer Beast X40 (dGPU, Cooling) | |
| MSI Titan GT77 HX 13VI | |
| MSI Titan GT77 HX 13VI | |
| Media NVIDIA GeForce RTX 4090 Laptop GPU (77.8 - 166.2, n=46) | |
| Medion Erazer Beast X40 | |
| Alienware x17 R2 P48E | |
| Media della classe Gaming (33.4 - 166.2, n=145, ultimi 2 anni) | |
| SCHENKER XMG Neo 17 M22 | |
| Returnal | |
| 1920x1080 Epic Preset | |
| Media NVIDIA GeForce RTX 4090 Laptop GPU (141 - 155, n=3) | |
| Medion Erazer Beast X40 | |
| Media della classe Gaming (27 - 109, n=16, ultimi 2 anni) | |
| 2560x1440 Epic Preset | |
| Media NVIDIA GeForce RTX 4090 Laptop GPU (113 - 119, n=3) | |
| Medion Erazer Beast X40 | |
| Media della classe Gaming (39 - 91, n=13, ultimi 2 anni) | |
| 1920x1080 Epic Preset + Epic Ray-Tracing | |
| Media NVIDIA GeForce RTX 4090 Laptop GPU (126 - 128, n=2) | |
| Medion Erazer Beast X40 | |
| Media della classe Gaming (4 - 74, n=3, ultimi 2 anni) | |
| Atomic Heart | |
| 1920x1080 Atomic Preset | |
| Media NVIDIA GeForce RTX 4090 Laptop GPU (128.6 - 166, n=3) | |
| Medion Erazer Beast X40 | |
| Media della classe Gaming (10.2 - 78, n=10, ultimi 2 anni) | |
| 2560x1440 Atomic Preset | |
| Media NVIDIA GeForce RTX 4090 Laptop GPU (93.8 - 135, n=3) | |
| Medion Erazer Beast X40 | |
| Media della classe Gaming (33.3 - 58.6, n=6, ultimi 2 anni) | |
| Hogwarts Legacy | |
| 1920x1080 Ultra Preset AA:High T | |
| Medion Erazer Beast X40 | |
| Media NVIDIA GeForce RTX 4090 Laptop GPU (41.2 - 166.1, n=4) | |
| Media della classe Gaming (10.3 - 108, n=12, ultimi 2 anni) | |
| 2560x1440 Ultra Preset AA:High T | |
| Medion Erazer Beast X40 | |
| Media NVIDIA GeForce RTX 4090 Laptop GPU (40.6 - 125.9, n=4) | |
| Media della classe Gaming (29.8 - 81, n=7, ultimi 2 anni) | |
| 1920x1080 Ultra Preset + Full Ray Tracing AA:High T | |
| Medion Erazer Beast X40 | |
| Media NVIDIA GeForce RTX 4090 Laptop GPU (52.2 - 67, n=3) | |
| Media della classe Gaming (40.6 - 66, n=2, ultimi 2 anni) | |
| Company of Heroes 3 | |
| 1920x1080 Maximum Settings | |
| Media NVIDIA GeForce RTX 4090 Laptop GPU (215 - 235, n=2) | |
| Medion Erazer Beast X40 | |
| Media della classe Gaming (43.8 - 134, n=7, ultimi 2 anni) | |
| 2560x1440 Maximum Settings | |
| Media NVIDIA GeForce RTX 4090 Laptop GPU (176.4 - 194.8, n=2) | |
| Medion Erazer Beast X40 | |
| Media della classe Gaming (62.9 - 92, n=3, ultimi 2 anni) | |
| Sons of the Forest | |
| 1920x1080 Ultra Preset AA:T | |
| Media NVIDIA GeForce RTX 4090 Laptop GPU (85.7 - 93.9, n=2) | |
| Medion Erazer Beast X40 | |
| Media della classe Gaming (14.8 - 87.5, n=12, ultimi 2 anni) | |
| 2560x1440 Ultra Preset AA:T | |
| Media NVIDIA GeForce RTX 4090 Laptop GPU (85.2 - 89.6, n=2) | |
| Medion Erazer Beast X40 | |
| Media della classe Gaming (45.5 - 64.2, n=5, ultimi 2 anni) | |
Per verificare se il portatile è in grado di eseguire giochi con frame rate per lo più stabili per un periodo prolungato, abbiamo eseguito The Witcher 3 per circa 60 minuti in Full HD e con impostazioni di qualità massime senza muovere il personaggio del giocatore. Non abbiamo osservato alcun calo di frame rate.
Witcher 3 FPS graph
| basso | medio | alto | ultra | QHD | |
|---|---|---|---|---|---|
| GTA V (2015) | 187.5 | 187.1 | 186 | 151.3 | 145.3 |
| The Witcher 3 (2015) | 586.4 | 511.4 | 363.8 | 195.1 | |
| Dota 2 Reborn (2015) | 215 | 193.5 | 182.6 | 171.5 | |
| Final Fantasy XV Benchmark (2018) | 232 | 207 | 176.2 | 146.7 | |
| X-Plane 11.11 (2018) | 187.1 | 162.9 | 128.3 | ||
| Far Cry 5 (2018) | 199 | 172 | 167 | 158 | 151 |
| Strange Brigade (2018) | 515 | 387 | 369 | 365 | 292 |
| Hunt Showdown (2020) | 367 | 285 | 262 | 168 | |
| Death Stranding (2020) | 179 | 171.4 | 166.6 | 163 | 162.1 |
| Yakuza Like a Dragon (2020) | 179.7 | 167.7 | 166.6 | 152.3 | 138.1 |
| Back 4 Blood (2021) | 403 | 309 | 309 | 327 | |
| Guardians of the Galaxy (2021) | 163 | 160 | 158 | 152 | 141 |
| Riders Republic (2021) | 209 | 200 | 185 | 179 | 146 |
| Elex 2 (2022) | 118.2 | 117.1 | 116.2 | 116.2 | 116.7 |
| F1 22 (2022) | 301 | 290 | 268 | 118.2 | 79.9 |
| The Quarry (2022) | 278 | 211 | 177.3 | 146.1 | 100.2 |
| Hogwarts Legacy (2023) | 242 | 204 | 186.5 | 166.1 | 125.9 |
| Returnal (2023) | 178 | 171 | 164 | 146 | 113 |
| Atomic Heart (2023) | 205 | 161.8 | 144.2 | 128.6 | 93.8 |
| Company of Heroes 3 (2023) | 285.3 | 262.9 | 235.2 | 215.2 | 176.4 |
| Sons of the Forest (2023) | 96.1 | 90 | 87.9 | 85.7 | 85.2 |
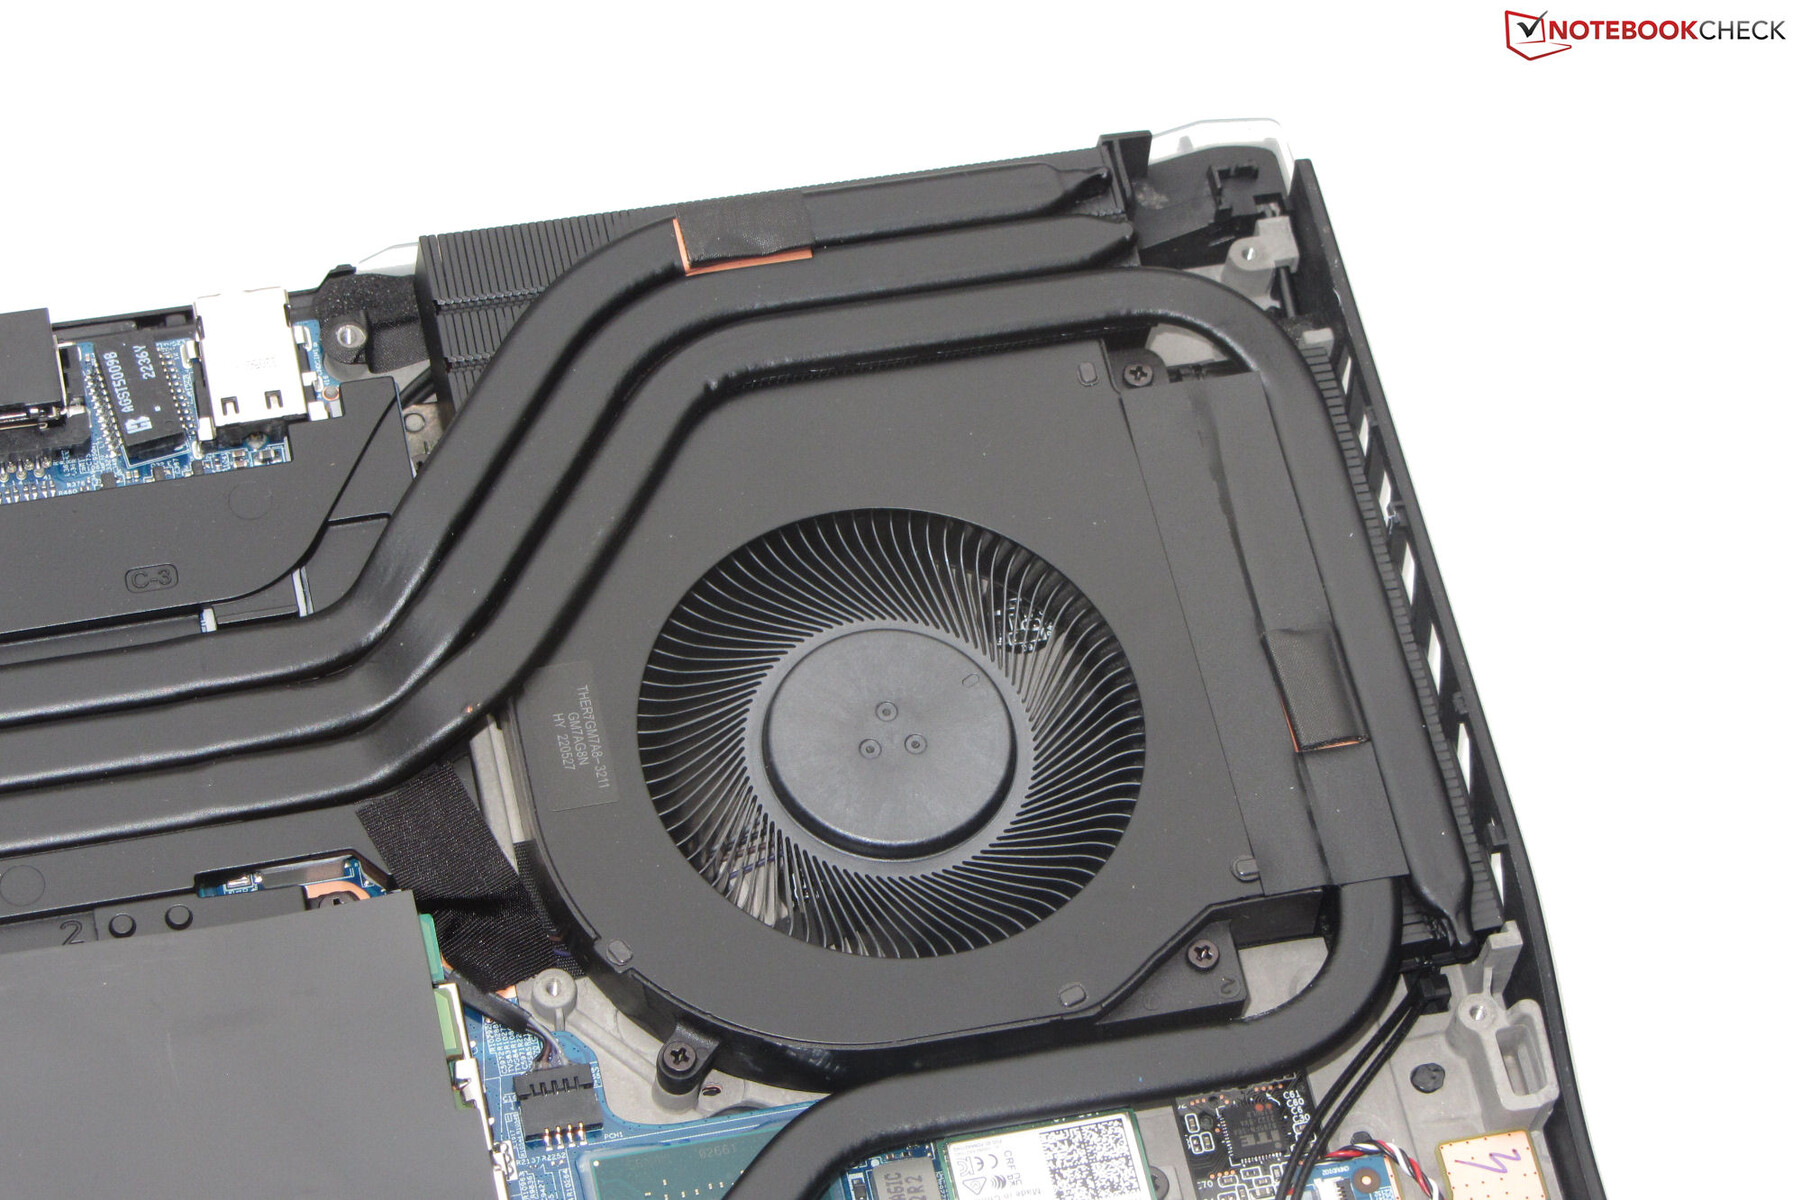
Emissioni - Il portatile Erazer può essere piuttosto rumoroso
Emissioni acustiche
Il portatile è relativamente silenzioso nell'uso quotidiano (ad esempio, applicazioni da ufficio, navigazione web). Le ventole possono anche smettere di girare di tanto in tanto. Non sorprende che l'X40 possa diventare piuttosto rumoroso sotto carico, producendo fino a 53 dB(A) di rumore durante lo stress test e il test Witcher 3. Nonostante i livelli di rumore piuttosto elevati, il suono prodotto dalle due ventole è complessivamente tollerabile: un fruscio è accompagnato da un sibilo sonoro che si trasforma gradualmente in un leggero fischio con l'aumentare della velocità delle ventole.
Le ventole del portatile si attenuano quando viene collegata l'unità di raffreddamento ad acqua esterna. Tuttavia, anche l'unità stessa contribuisce al rumore complessivo: sebbene la pompa sia relativamente silenziosa durante l'uso, la ventola all'interno del dissipatore fa più rumore. Tutto sommato, riteniamo che il rumore complessivo sia più gradevole quando si utilizza l'unità di raffreddamento ad acqua.
Rumorosità
| Idle |
| 25 / 29 / 35 dB(A) |
| Sotto carico |
| 51 / 53 dB(A) |
 | ||
30 dB silenzioso 40 dB(A) udibile 50 dB(A) rumoroso |
||
min: | ||
| Medion Erazer Beast X40 NVIDIA GeForce RTX 4090 Laptop GPU, i9-13900HX | MSI Titan GT77 HX 13VI NVIDIA GeForce RTX 4090 Laptop GPU, i9-13950HX | Razer Blade 16 Early 2023 NVIDIA GeForce RTX 4080 Laptop GPU, i9-13950HX | SCHENKER XMG Neo 17 M22 GeForce RTX 3080 Ti Laptop GPU, R9 6900HX | Alienware x17 R2 P48E GeForce RTX 3080 Ti Laptop GPU, i9-12900HK | Asus ROG Strix Scar 18 2023 G834JY-N6005W NVIDIA GeForce RTX 4090 Laptop GPU, i9-13980HX | |
|---|---|---|---|---|---|---|
| Noise | -3% | 13% | -3% | 15% | 4% | |
| off /ambiente * | 24 | 24.6 -3% | 23 4% | 26 -8% | 22.7 5% | 23.9 -0% |
| Idle Minimum * | 25 | 29.2 -17% | 23 8% | 26 -4% | 23.1 8% | 23.9 4% |
| Idle Average * | 29 | 29.2 -1% | 23 21% | 29 -0% | 23.1 20% | 32.6 -12% |
| Idle Maximum * | 35 | 29.2 17% | 23.6 33% | 40 -14% | 23.1 34% | 32.6 7% |
| Load Average * | 51 | 50.7 1% | 39 24% | 47 8% | 31.9 37% | 35.9 30% |
| Witcher 3 ultra * | 51 | 53.3 -5% | 51.6 -1% | 52 -2% | 52.5 -3% | |
| Load Maximum * | 53 | 61 -15% | 51.3 3% | 54 -2% | 52.5 1% | 55.8 -5% |
* ... Meglio usare valori piccoli
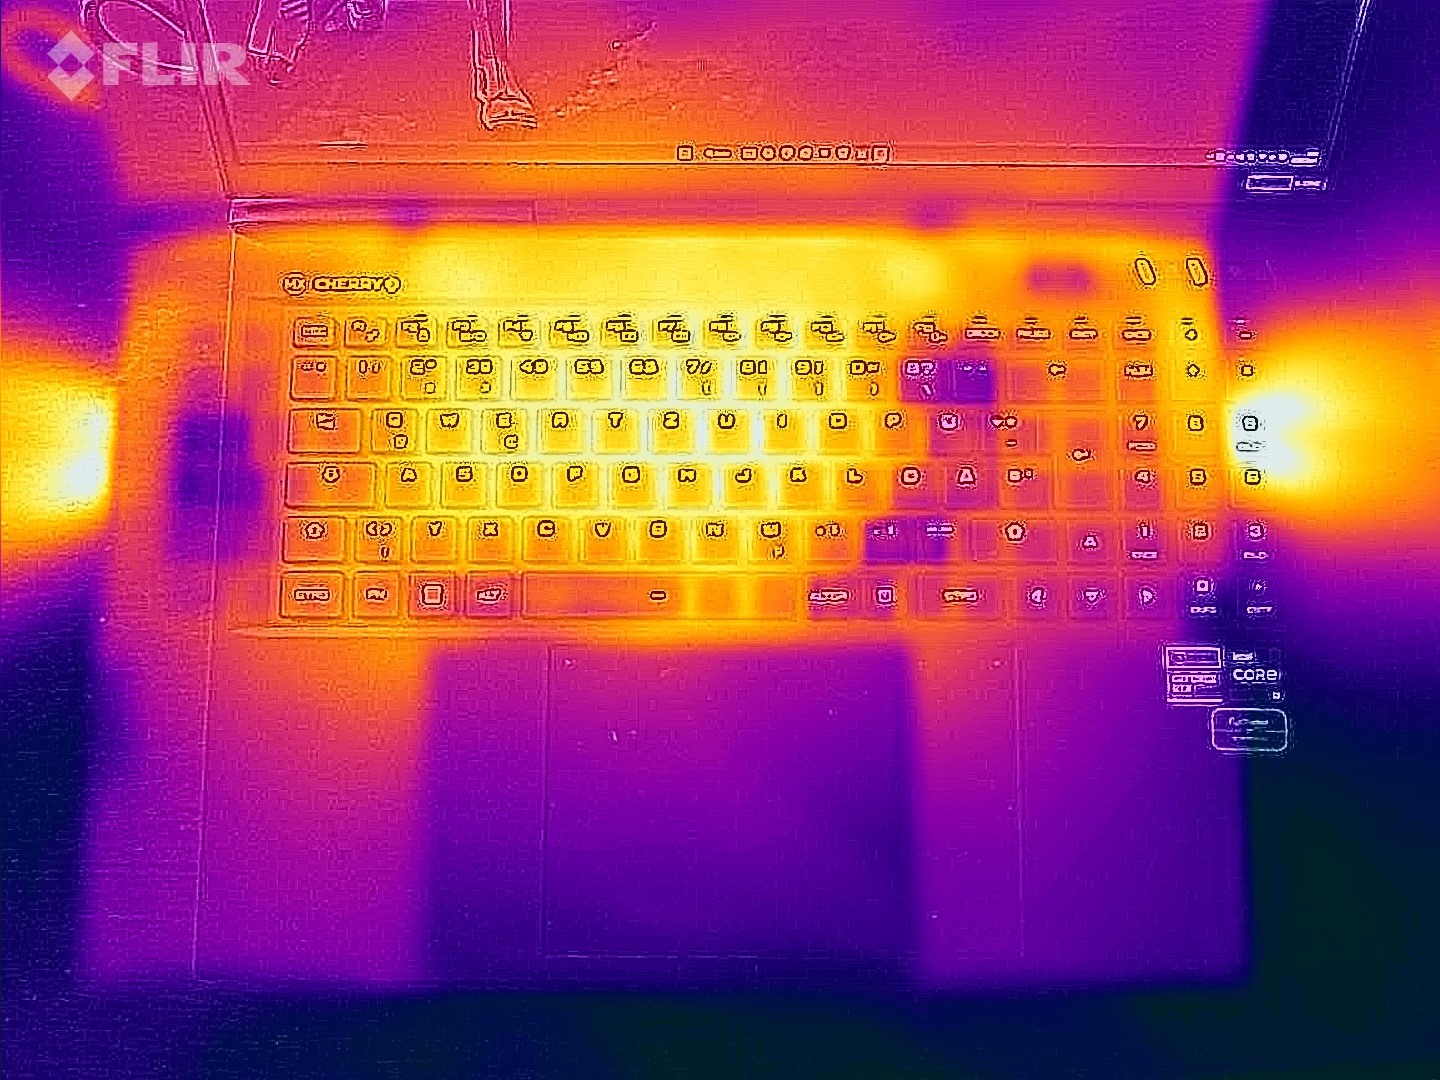
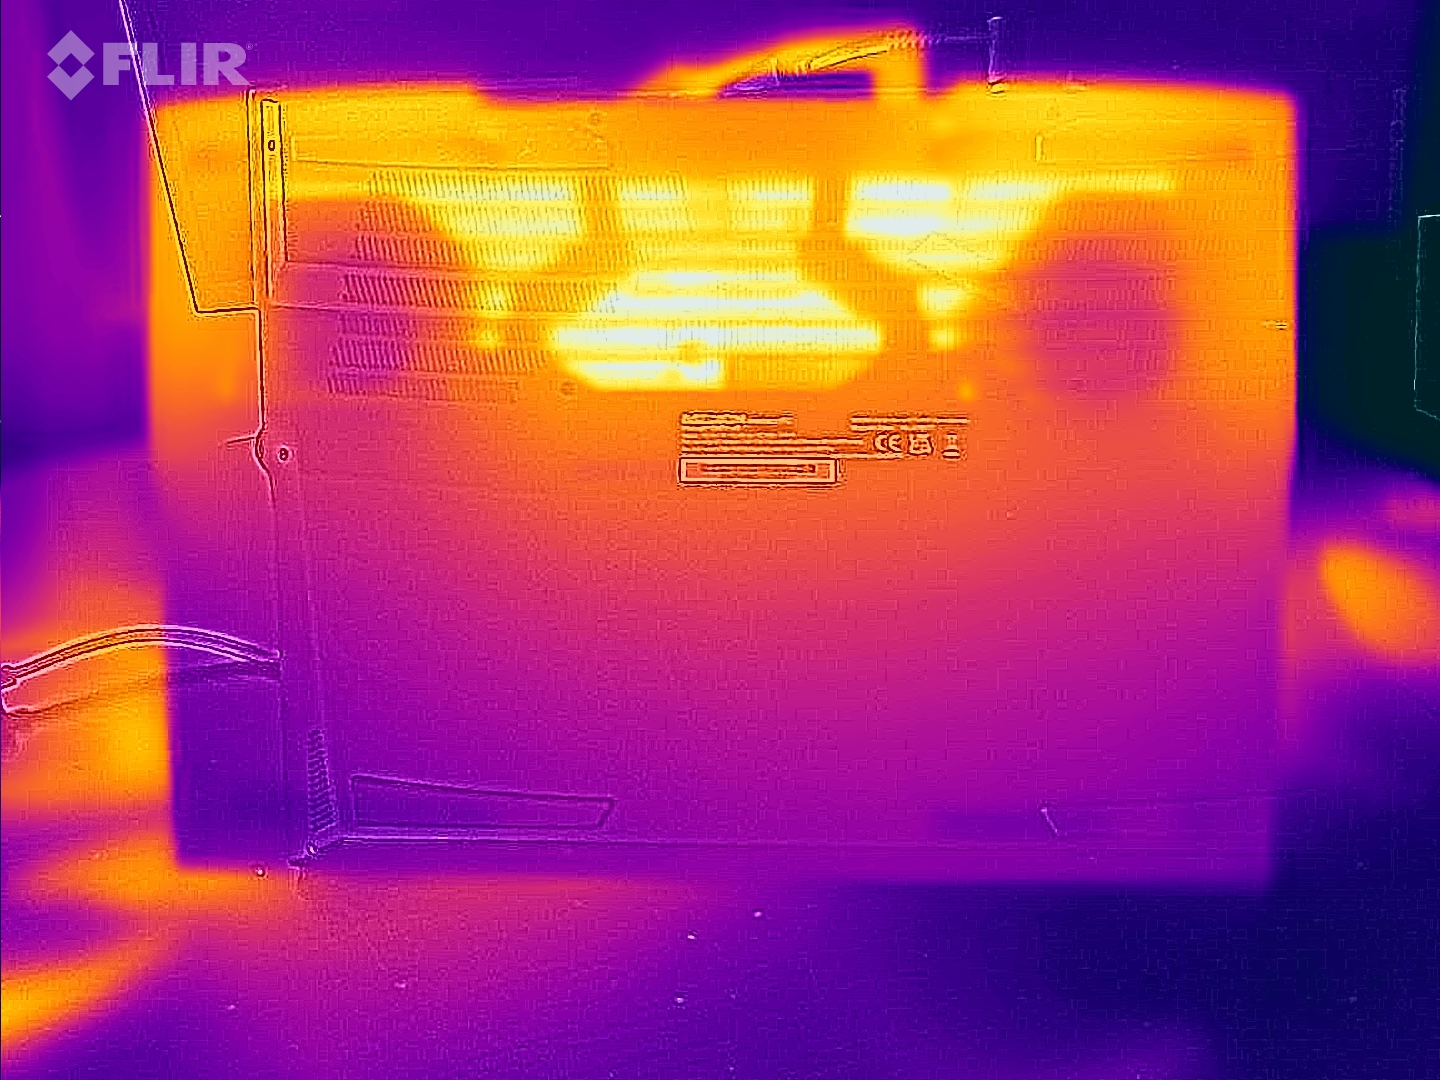
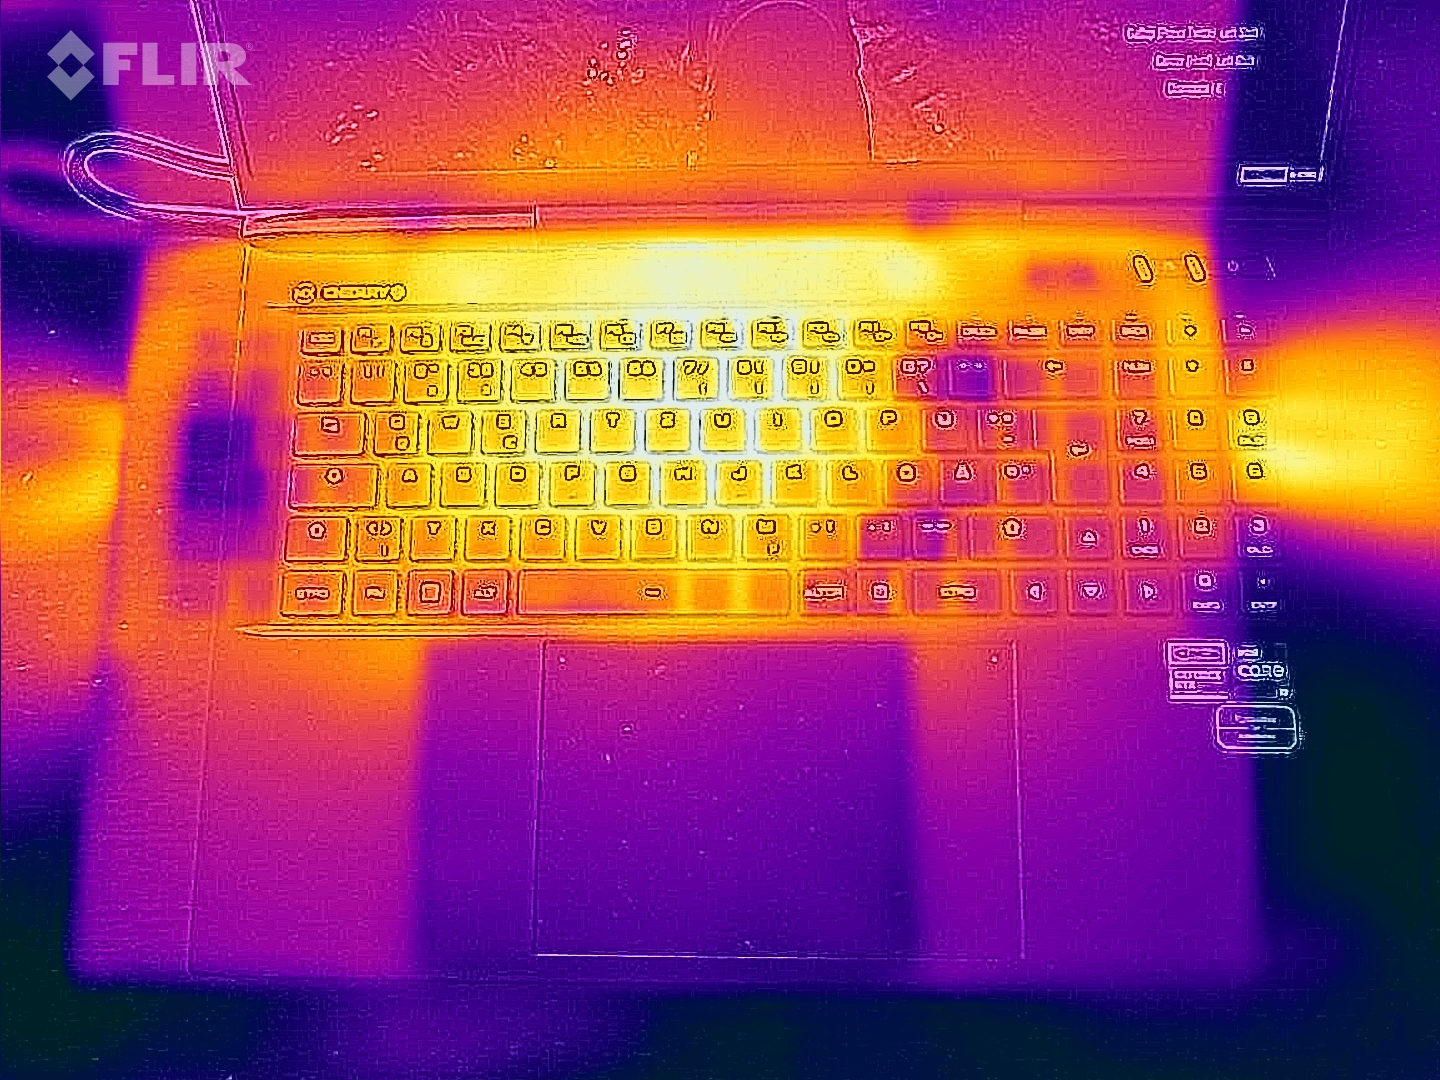
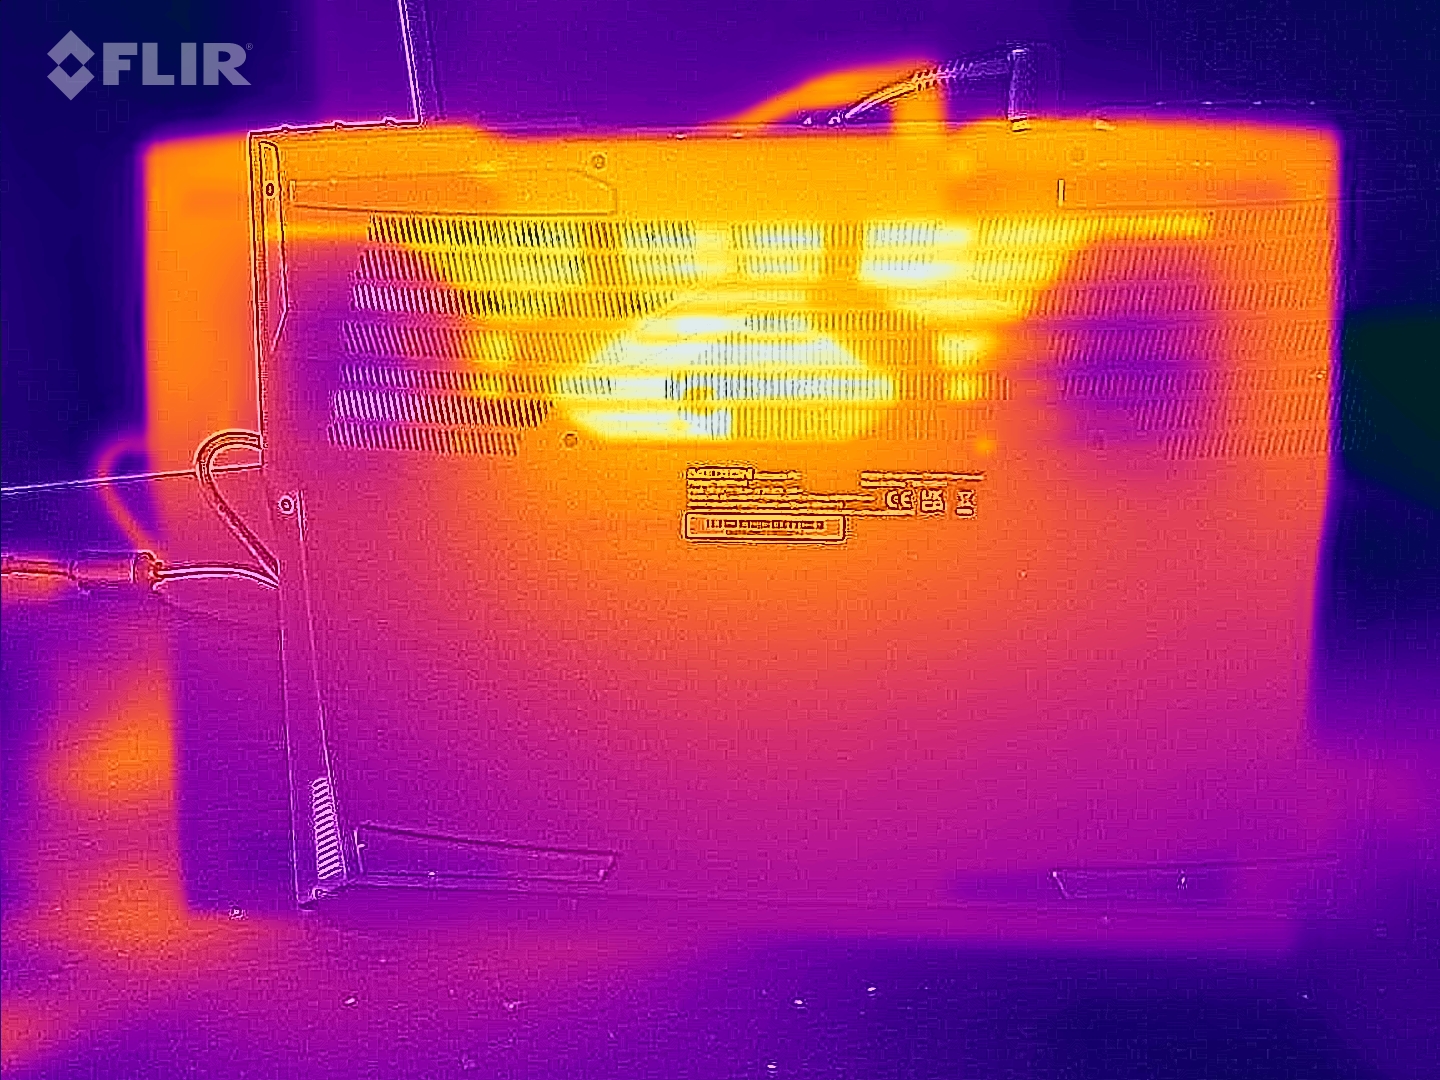
Temperatura
Le temperature dello chassis rimangono entro un intervallo accettabile nei casi di utilizzo quotidiano, come l'esecuzione di software per ufficio e browser Internet. Il portatile si scalda sensibilmente, ma non eccessivamente, sotto carico, come abbiamo notato durante lo stress test e il test Witcher 3. Anche le temperature della CPU non ci hanno dato motivo di preoccupazione.
(-) La temperatura massima sul lato superiore è di 48 °C / 118 F, rispetto alla media di 40.4 °C / 105 F, che varia da 21.2 a 68.8 °C per questa classe Gaming.
(-) Il lato inferiore si riscalda fino ad un massimo di 52 °C / 126 F, rispetto alla media di 43.3 °C / 110 F
(+) In idle, la temperatura media del lato superiore è di 28.2 °C / 83 F, rispetto alla media deld ispositivo di 33.9 °C / 93 F.
(-) Riproducendo The Witcher 3, la temperatura media per il lato superiore e' di 40.7 °C / 105 F, rispetto alla media del dispositivo di 33.9 °C / 93 F.
(+) I poggiapolsi e il touchpad raggiungono la temperatura massima della pelle (34 °C / 93.2 F) e quindi non sono caldi.
(-) La temperatura media della zona del palmo della mano di dispositivi simili e'stata di 28.9 °C / 84 F (-5.1 °C / -9.2 F).
| Medion Erazer Beast X40 Intel Core i9-13900HX, NVIDIA GeForce RTX 4090 Laptop GPU | MSI Titan GT77 HX 13VI Intel Core i9-13950HX, NVIDIA GeForce RTX 4090 Laptop GPU | Razer Blade 16 Early 2023 Intel Core i9-13950HX, NVIDIA GeForce RTX 4080 Laptop GPU | SCHENKER XMG Neo 17 M22 AMD Ryzen 9 6900HX, NVIDIA GeForce RTX 3080 Ti Laptop GPU | Alienware x17 R2 P48E Intel Core i9-12900HK, NVIDIA GeForce RTX 3080 Ti Laptop GPU | Asus ROG Strix Scar 18 2023 G834JY-N6005W Intel Core i9-13980HX, NVIDIA GeForce RTX 4090 Laptop GPU | |
|---|---|---|---|---|---|---|
| Heat | 13% | 9% | -2% | 4% | -0% | |
| Maximum Upper Side * | 48 | 40.6 15% | 40 17% | 49 -2% | 49.6 -3% | 54 -13% |
| Maximum Bottom * | 52 | 41.1 21% | 37.6 28% | 52 -0% | 42.4 18% | 46 12% |
| Idle Upper Side * | 30 | 26.2 13% | 32.4 -8% | 30 -0% | 29.2 3% | 30 -0% |
| Idle Bottom * | 31 | 30.3 2% | 31.4 -1% | 33 -6% | 32 -3% | 31 -0% |
* ... Meglio usare valori piccoli
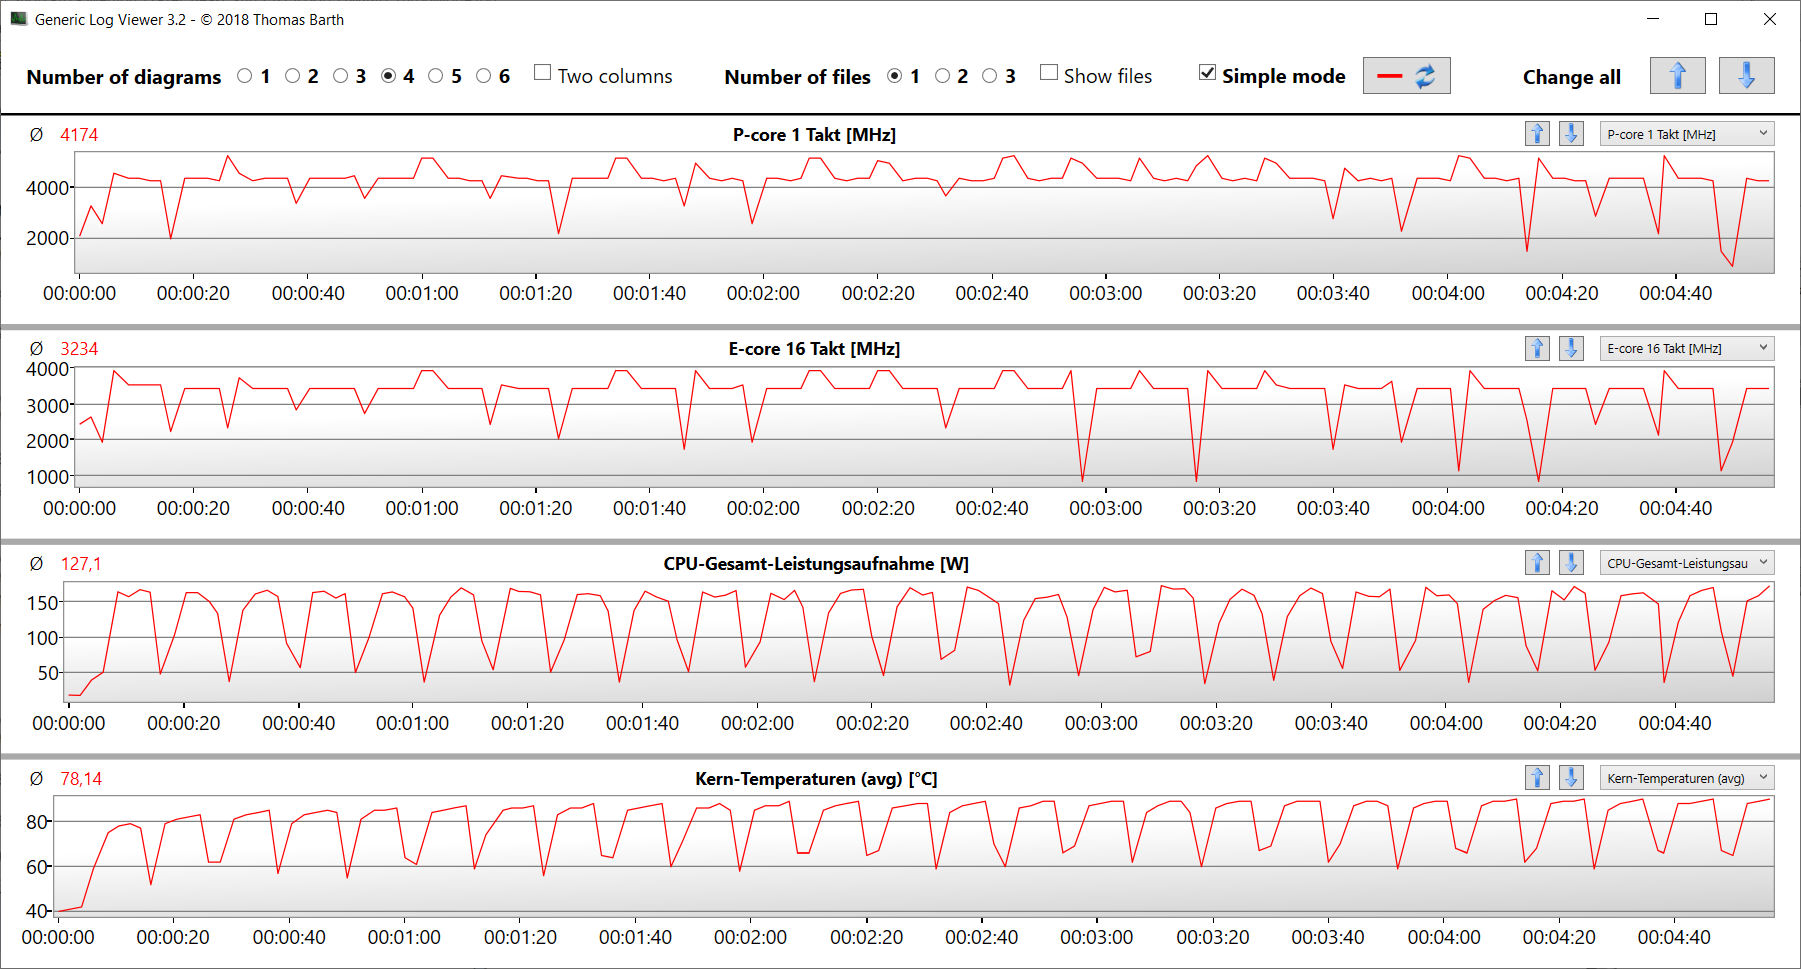
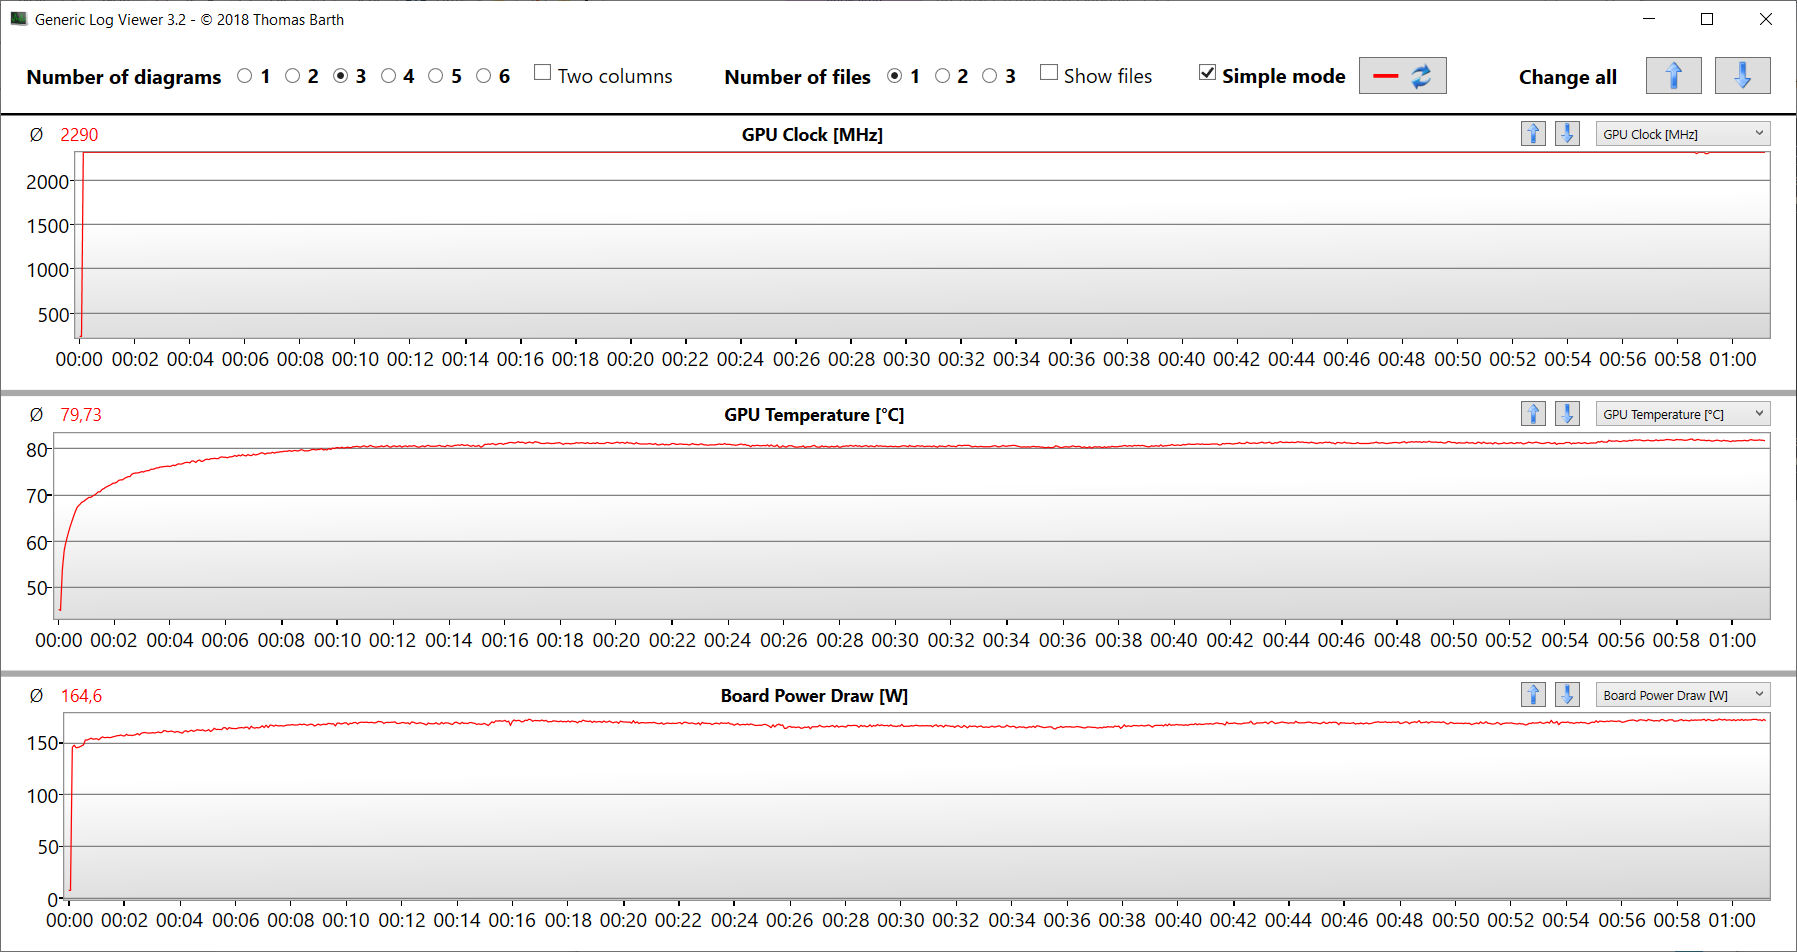
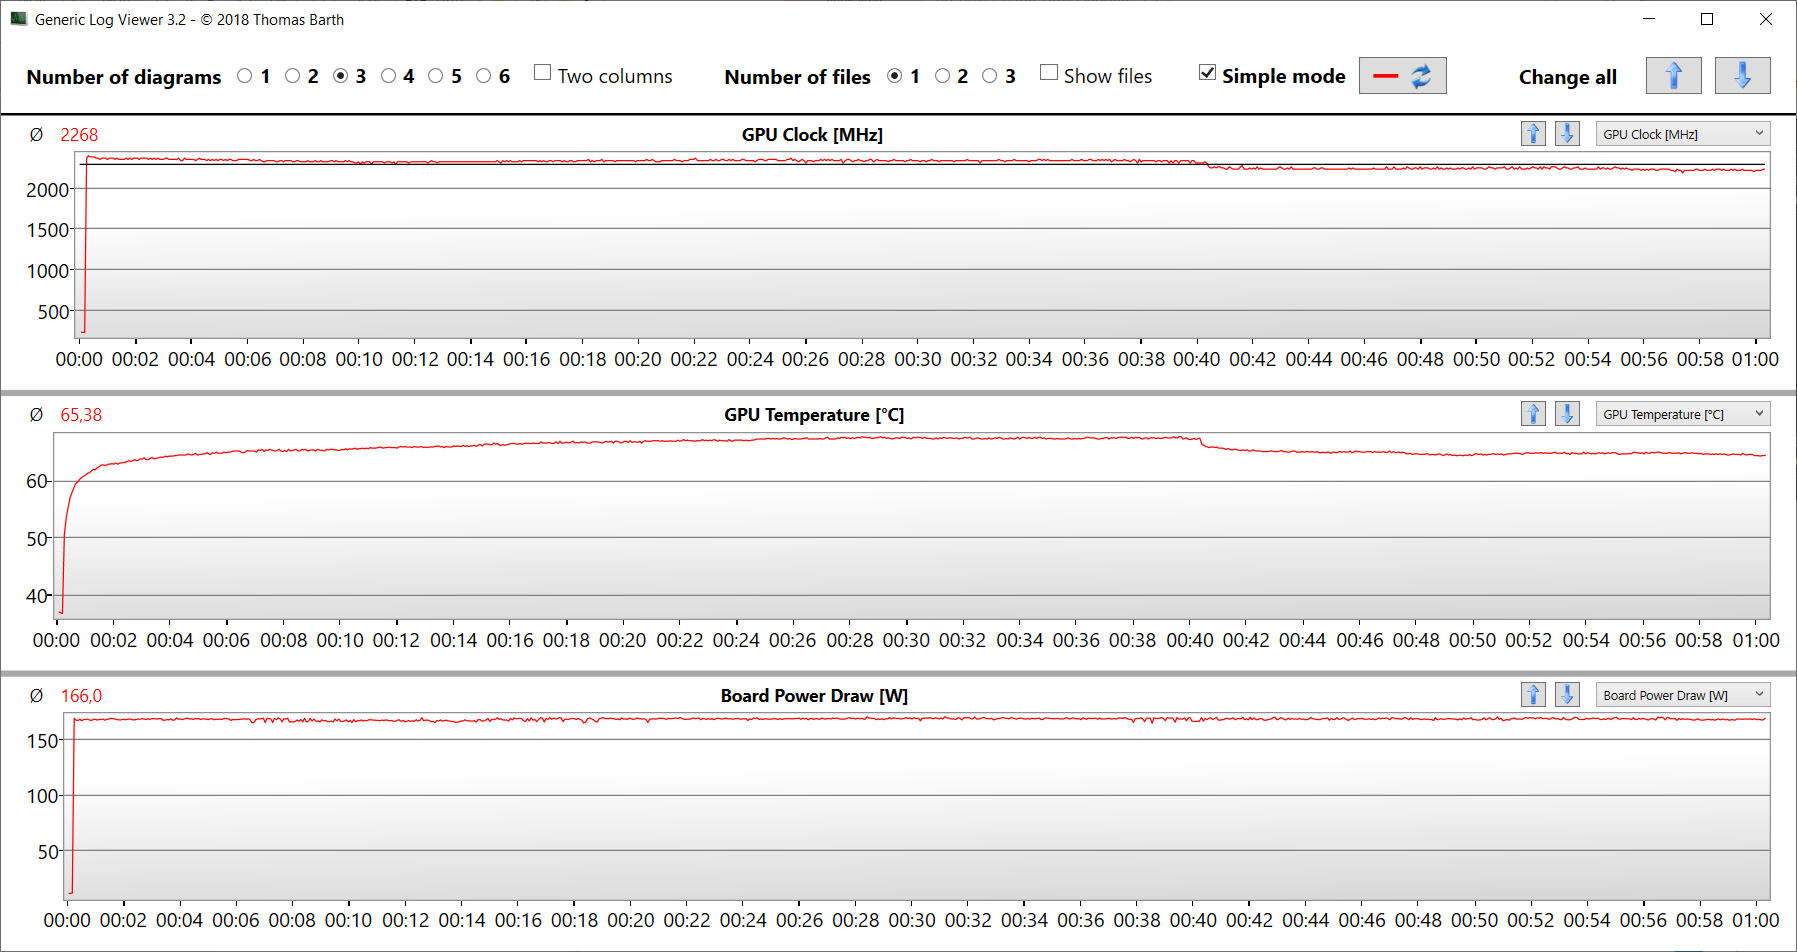
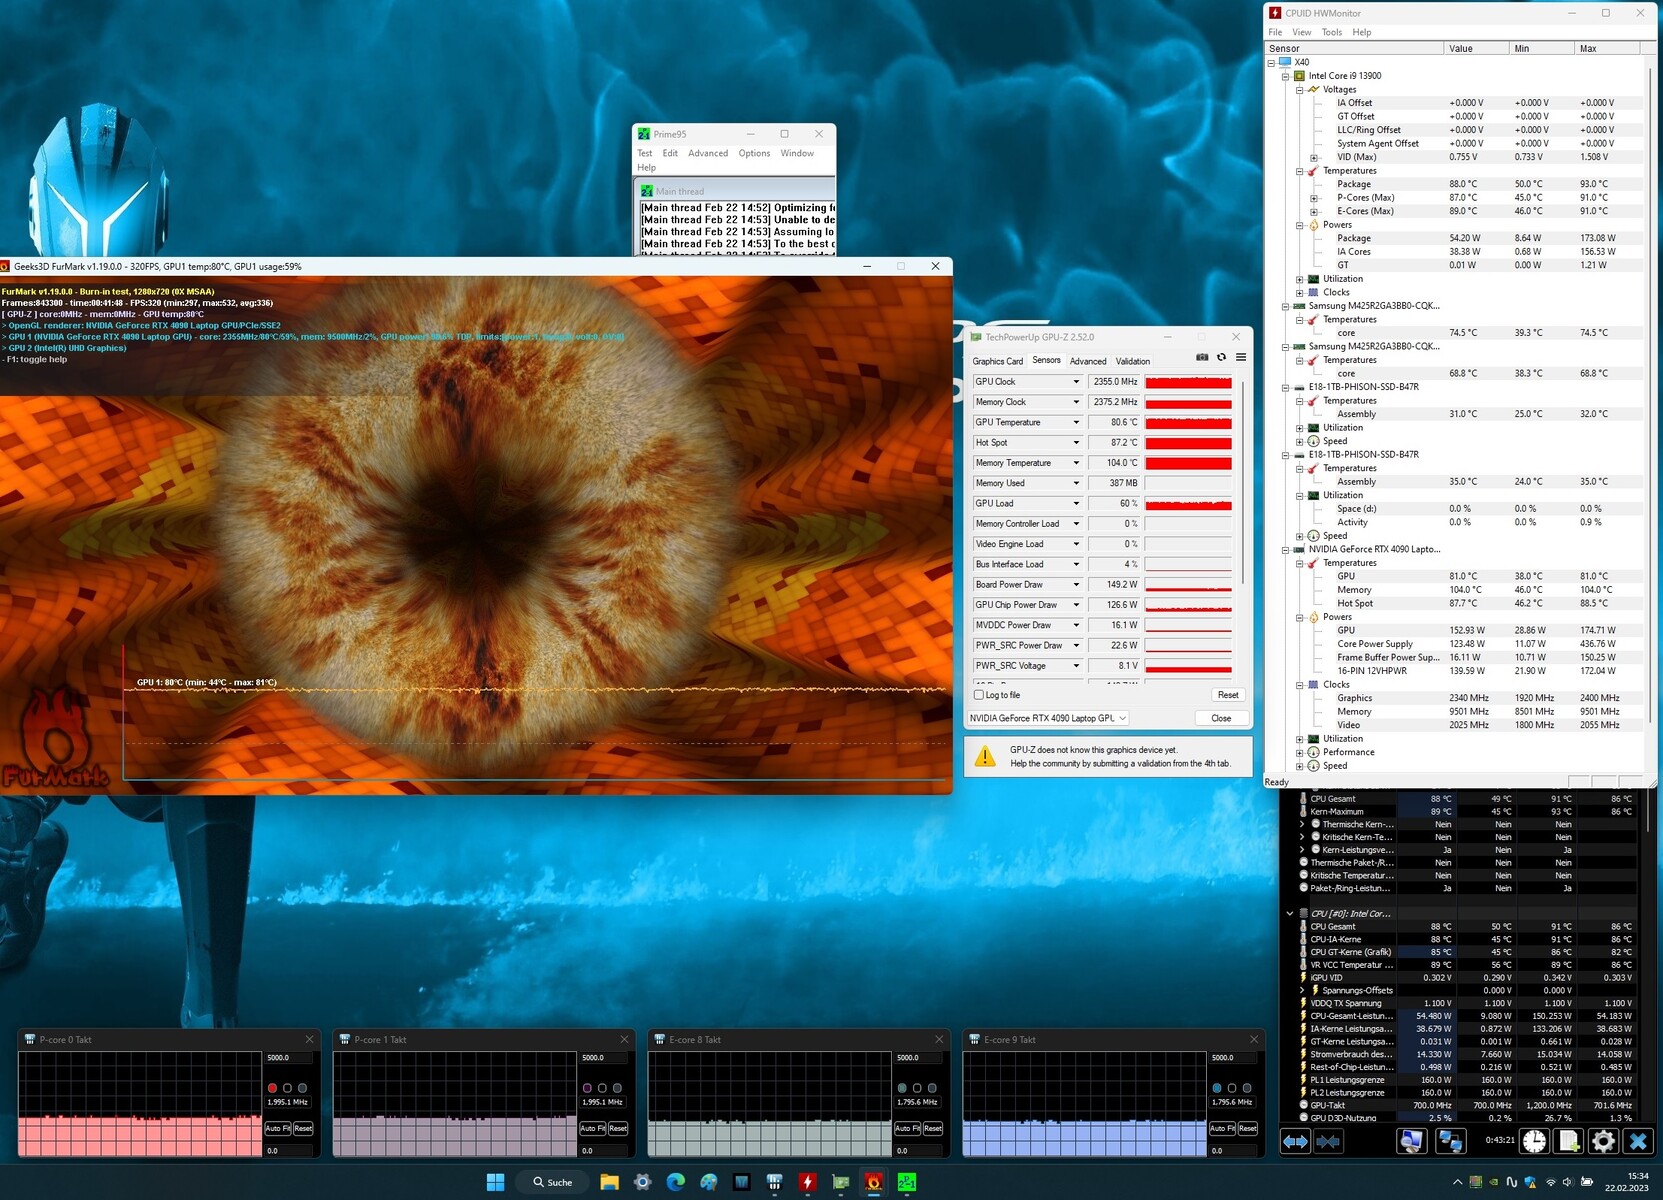
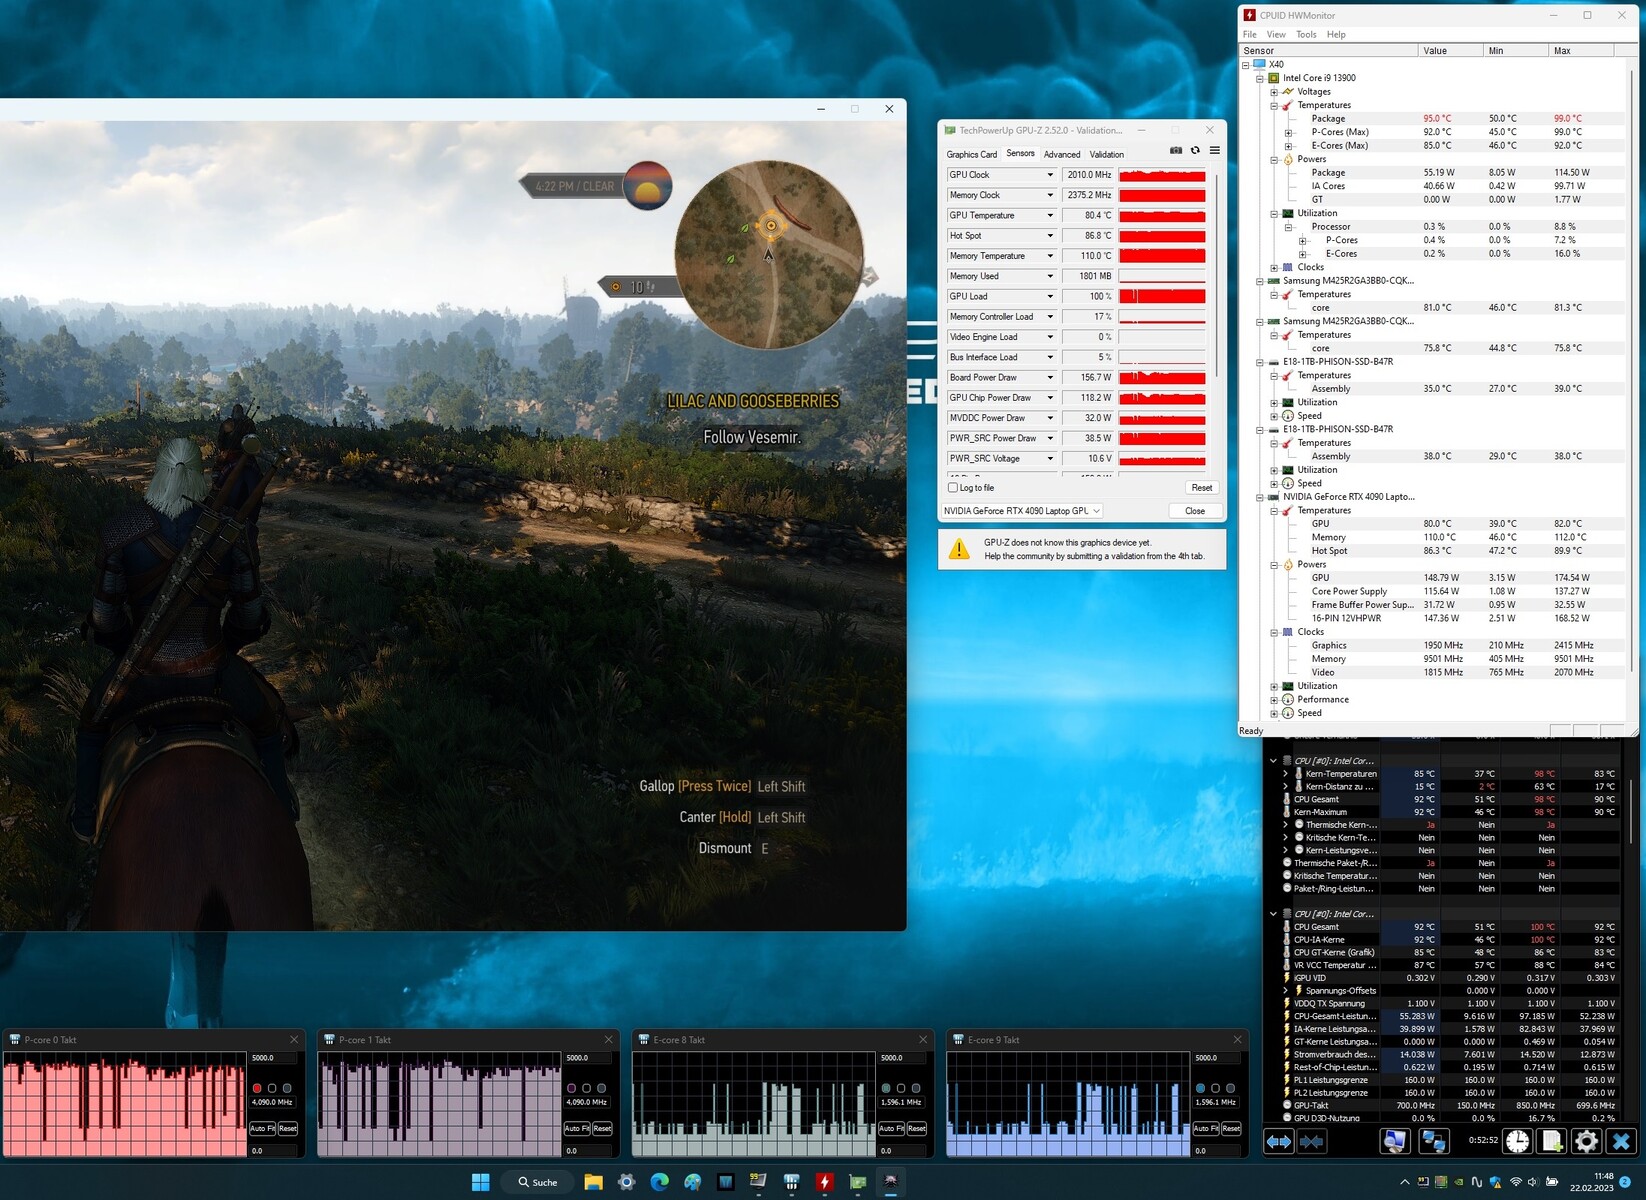
Test da sforzo
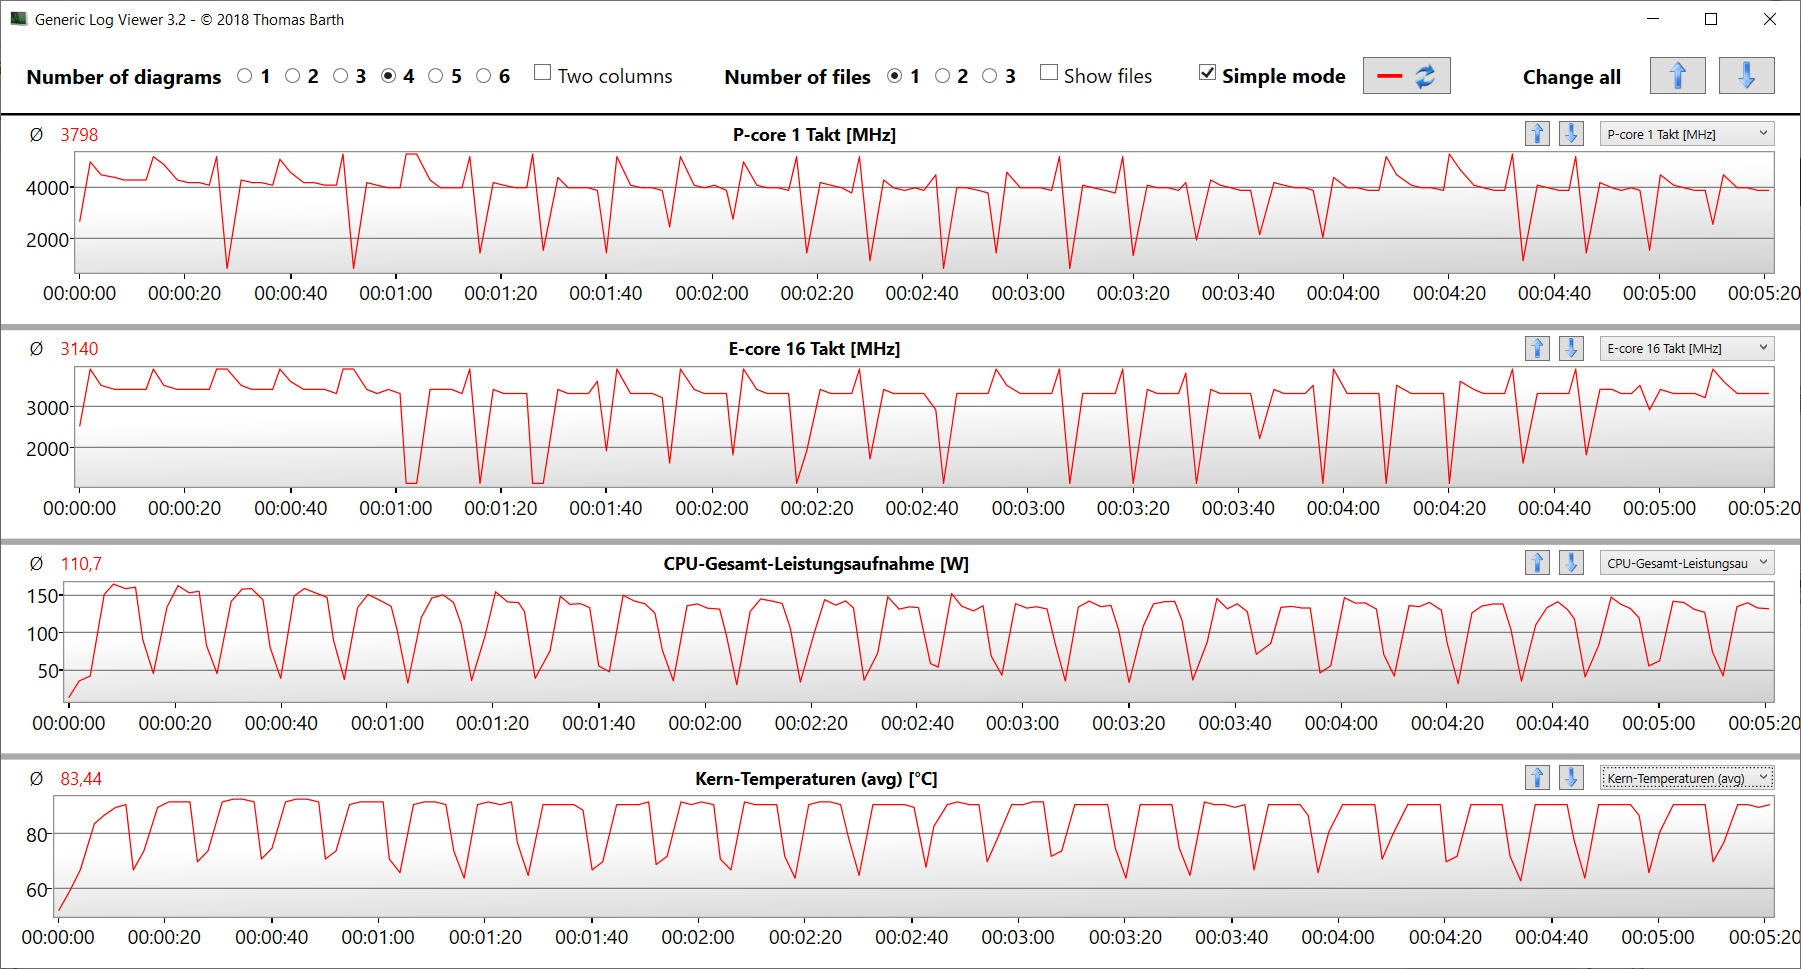
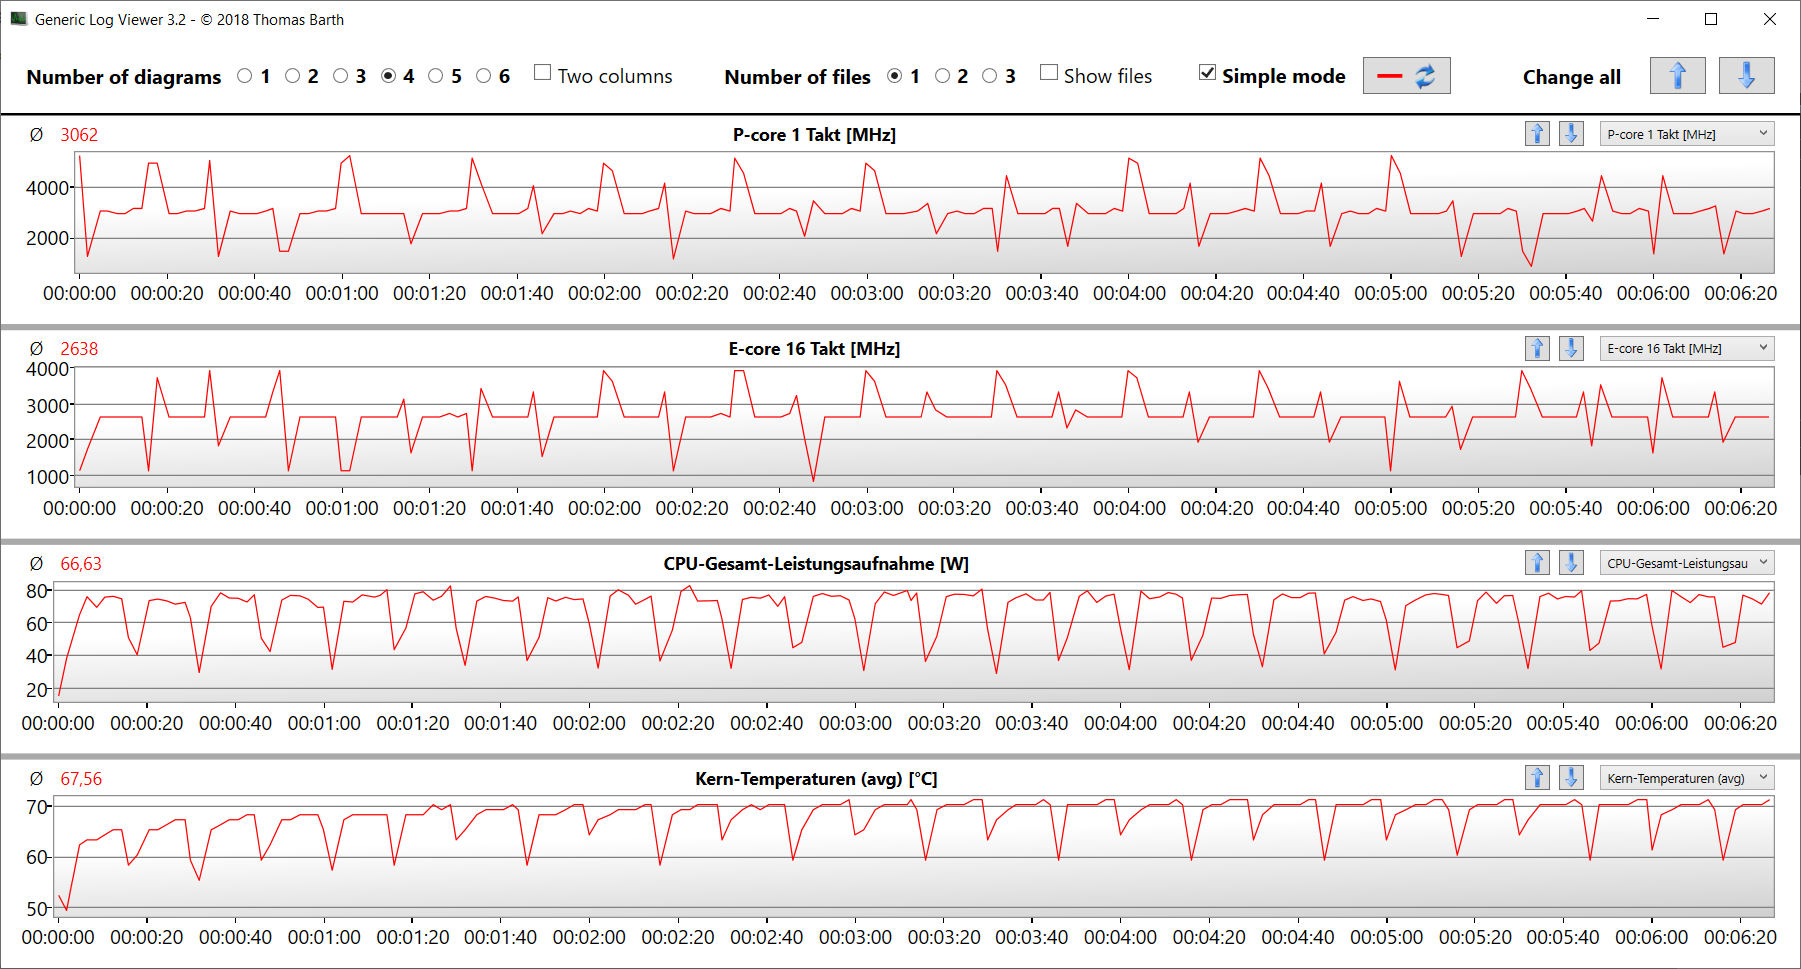
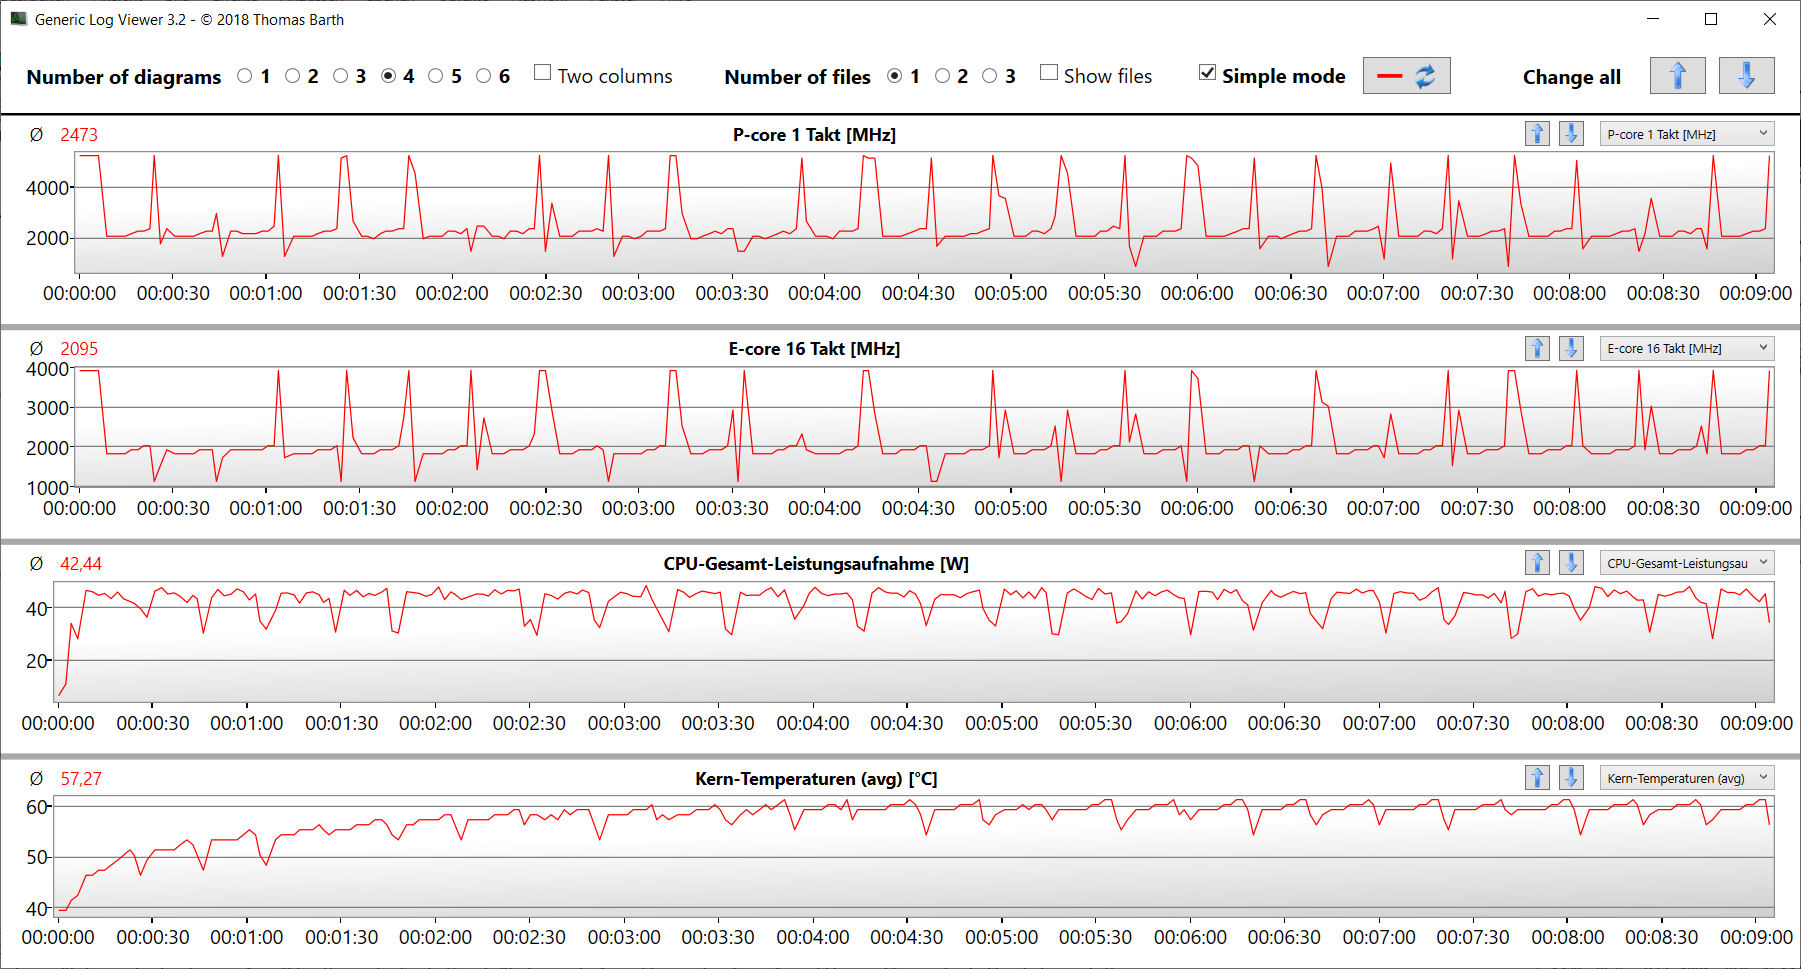
Per lo stress test, abbiamo lasciato che Prime95 e FurMark funzionassero per un periodo prolungato. Si tratta di uno scenario estremo progettato per valutare la stabilità del sistema a pieno carico. La CPU è partita con velocità di clock elevate (P-cores: 4 GHz, E-cores: 3,3 GHz) mentre la GPU oscillava tra 1 e 1,5 GHz. Dopo circa cinque minuti, i core P e i core E della CPU sono scesi gradualmente a 2 GHz e 1,8 GHz rispettivamente, mentre il clock della GPU è salito a circa 2,3-2,4 GHz
Altoparlanti
Gli altoparlanti stereo hanno un suono decente, ma non producono quasi nessun basso. Si consiglia di utilizzare un paio di cuffie o altoparlanti esterni per un'esperienza audio migliore.
Medion Erazer Beast X40 analisi audio
(+) | gli altoparlanti sono relativamente potenti (88 dB)
Bassi 100 - 315 Hz
(-) | quasi nessun basso - in media 20.2% inferiori alla media
(±) | la linearità dei bassi è media (8.4% delta rispetto alla precedente frequenza)
Medi 400 - 2000 Hz
(±) | medi elevati - circa 5.5% superiore alla media
(+) | medi lineari (6.5% delta rispetto alla precedente frequenza)
Alti 2 - 16 kHz
(+) | Alti bilanciati - appena 3.1% dalla media
(+) | alti lineari (5.8% delta rispetto alla precedente frequenza)
Nel complesso 100 - 16.000 Hz
(±) | la linearità complessiva del suono è media (16.1% di differenza rispetto alla media
Rispetto alla stessa classe
» 38% di tutti i dispositivi testati in questa classe è stato migliore, 7% simile, 55% peggiore
» Il migliore ha avuto un delta di 6%, medio di 18%, peggiore di 132%
Rispetto a tutti i dispositivi testati
» 24% di tutti i dispositivi testati in questa classe è stato migliore, 5% similare, 71% peggiore
» Il migliore ha avuto un delta di 4%, medio di 24%, peggiore di 134%
MSI Titan GT77 HX 13VI analisi audio
(+) | gli altoparlanti sono relativamente potenti (90.1 dB)
Bassi 100 - 315 Hz
(±) | bassi ridotti - in media 14.3% inferiori alla media
(±) | la linearità dei bassi è media (7.5% delta rispetto alla precedente frequenza)
Medi 400 - 2000 Hz
(+) | medi bilanciati - solo only 3.5% rispetto alla media
(+) | medi lineari (3.2% delta rispetto alla precedente frequenza)
Alti 2 - 16 kHz
(+) | Alti bilanciati - appena 1.9% dalla media
(+) | alti lineari (3.8% delta rispetto alla precedente frequenza)
Nel complesso 100 - 16.000 Hz
(+) | suono nel complesso lineare (11.1% differenza dalla media)
Rispetto alla stessa classe
» 8% di tutti i dispositivi testati in questa classe è stato migliore, 3% simile, 89% peggiore
» Il migliore ha avuto un delta di 6%, medio di 18%, peggiore di 132%
Rispetto a tutti i dispositivi testati
» 6% di tutti i dispositivi testati in questa classe è stato migliore, 2% similare, 93% peggiore
» Il migliore ha avuto un delta di 4%, medio di 24%, peggiore di 134%
Gestione dell'energia - L'X40 offre una resistenza abbastanza buona
Consumo di energia
Il consumo energetico dell'X40 ha raggiunto una media di 280 watt nel test Witcher 3 e un breve picco di 363 watt nello stress test. Mentre il consumo di energia è diminuito leggermente nel corso del test Witcher 3, ha fluttuato durante lo stress test. Al minimo, il portatile assorbe una quantità di energia abbastanza normale per l'hardware al suo interno. Il caricabatterie in dotazione ha una potenza nominale di 330 watt ed è quindi in grado di fornire energia sufficiente al portatile.
| Off / Standby | |
| Idle | |
| Sotto carico |
|
Leggenda:
min: | |
| Medion Erazer Beast X40 i9-13900HX, NVIDIA GeForce RTX 4090 Laptop GPU | MSI Titan GT77 HX 13VI i9-13950HX, NVIDIA GeForce RTX 4090 Laptop GPU | Razer Blade 16 Early 2023 i9-13950HX, NVIDIA GeForce RTX 4080 Laptop GPU | SCHENKER XMG Neo 17 M22 R9 6900HX, GeForce RTX 3080 Ti Laptop GPU | Alienware x17 R2 P48E i9-12900HK, GeForce RTX 3080 Ti Laptop GPU | Asus ROG Strix Scar 18 2023 G834JY-N6005W i9-13980HX, NVIDIA GeForce RTX 4090 Laptop GPU | Media NVIDIA GeForce RTX 4090 Laptop GPU | Media della classe Gaming | |
|---|---|---|---|---|---|---|---|---|
| Power Consumption | -5% | -14% | 31% | -42% | -30% | -15% | 5% | |
| Idle Minimum * | 11 | 14 -27% | 15.2 -38% | 7 36% | 24.1 -119% | 17.3 -57% | 16.2 ? -47% | 13.9 ? -26% |
| Idle Average * | 18 | 21.6 -20% | 22.8 -27% | 11 39% | 28.5 -58% | 27 -50% | 23.1 ? -28% | 19.8 ? -10% |
| Idle Maximum * | 30 | 24.8 17% | 49.8 -66% | 17 43% | 60 -100% | 46 -53% | 34.2 ? -14% | 27.3 ? 9% |
| Load Average * | 136 | 122.5 10% | 121.2 11% | 92 32% | 128.7 5% | 133 2% | 130.5 ? 4% | 104.8 ? 23% |
| Witcher 3 ultra * | 280 | 265 5% | 242 14% | 221 21% | 254 9% | |||
| Load Maximum * | 363 | 418 -15% | 273.7 25% | 306 16% | 323 11% | 329 9% | 324 ? 11% | 250 ? 31% |
* ... Meglio usare valori piccoli
Power consumption Witcher 3 / Stress test
Power consumption with external monitor
Durata della batteria
Il portatile da 17 pollici è durato rispettivamente 6h 22m e 6h 56m nel test Wi-Fi (accesso automatico ai siti web tramite uno script) e nel test video (riproduzione in loop del cortometraggio Big Buck Bunny, codificato in H.264, in Full HD). Per entrambi i test, tutte le funzioni di risparmio energetico sono state disattivate sul portatile e la luminosità dello schermo è stata impostata a circa 150 cd/m². Anche l'adattatore wireless è stato disattivato durante il test video.
Nel complesso, l'Erazer offre un'ottima durata della batteria per un portatile ad alte prestazioni come questo. È in grado di superare la maggior parte dei concorrenti, anche quelli con una capacità della batteria identica.
| Medion Erazer Beast X40 i9-13900HX, NVIDIA GeForce RTX 4090 Laptop GPU, 99.8 Wh | MSI Titan GT77 HX 13VI i9-13950HX, NVIDIA GeForce RTX 4090 Laptop GPU, 99.9 Wh | Razer Blade 16 Early 2023 i9-13950HX, NVIDIA GeForce RTX 4080 Laptop GPU, 95.2 Wh | SCHENKER XMG Neo 17 M22 R9 6900HX, GeForce RTX 3080 Ti Laptop GPU, 99 Wh | Alienware x17 R2 P48E i9-12900HK, GeForce RTX 3080 Ti Laptop GPU, 87 Wh | Asus ROG Strix Scar 18 2023 G834JY-N6005W i9-13980HX, NVIDIA GeForce RTX 4090 Laptop GPU, 90 Wh | Media della classe Gaming | |
|---|---|---|---|---|---|---|---|
| Autonomia della batteria | -18% | -13% | 15% | -63% | -13% | -3% | |
| Reader / Idle | 565 | 533 -6% | 722 28% | 234 -59% | 569 ? 1% | ||
| H.264 | 416 | 358 -14% | 398 -4% | 419 1% | 461 ? 11% | ||
| WiFi v1.3 | 382 | 319 -16% | 365 -4% | 537 41% | 117 -69% | 428 12% | 385 ? 1% |
| Load | 114 | 86 -25% | 81 -29% | 109 -4% | 46 -60% | 56 -51% | 84.5 ? -26% |
| Witcher 3 ultra | 53 | 76.3 ? |
Pro
Contro
Verdetto - Eccezionale notebook da gioco di fascia alta

Medion Erazer Beast X40 è un computer portatile progettato per scenari di utilizzo molto impegnativi, come l'editing video, il rendering e i giochi. La potenza di calcolo necessaria per queste applicazioni è fornita da una delle combinazioni CPU-GPU più potenti del momento: un processore Core i9-13900HX abbinato a una GeForce RTX 4090.
Il processore e la scheda grafica sono in grado di funzionare costantemente a velocità di clock elevate e l'X40 produce una quantità di calore e rumore abbastanza normale per questa classe di dispositivi.
Nel complesso, l'Erazer Beast X40 è un portatile interessante per il gioco e altre applicazioni impegnative.
Il display opaco da 17 pollici in formato 16:10 (QHD, IPS, 240Hz, G-Sync, sRGB) ha un ottimo aspetto per la maggior parte del tempo. L'unico aspetto negativo è che il contrasto è leggermente troppo basso. La superba tastiera meccanica (con illuminazione RGB) rende il portatile ancora più attraente. Chi non ha mai usato una tastiera meccanica prima d'ora si troverà di fronte a una nuova esperienza di digitazione. La porta Thunderbolt 4 del portatile offre opzioni di espansione (ad esempio, GPU esterna, soluzione docking) ma non supporta Power Delivery.
Una possibile alternativa all'Erazer Beast X40 è il modello Asus ROG Strix Scar 18 2023 G834JY. L'Asus ROG si distingue per il suo pannello da 18 pollici 16:10 QHD+, una maggiore quantità di RAM (64 GB) e il supporto RAID. Con un prezzo di circa 4.800 euro (5.177 dollari), si colloca nella stessa fascia di prezzo del Beast. Se il denaro non è un problema, potete dare un'occhiata al modelloMSI Titan GT77 HX 13V come altra alternativa. Offre prestazioni della CPU leggermente superiori, tre slot per SSD, supporto RAID e quattro socket per la RAM. Il display mini-LED eccezionalmente luminoso con un contrasto eccellente è un punto di forza del dispositivo. Ma il pacchetto complessivo vi costerà circa 6.600 euro (7.120 dollari).
Verdetto sul raffreddamento ad acqua
L'unità di raffreddamento ad acqua opzionale fa fondamentalmente quello che dovrebbe fare: migliorare le prestazioni (Medion promette un aumento fino al 10%) e ridurre il calore e il rumore. Nell'uso reale, tuttavia, l'aumento delle prestazioni è piuttosto modesto e il portatile è confinato in un luogo fisso. Gli unici vantaggi che rimangono sono la riduzione delle temperature e dei livelli di rumore. Spetta ai possessori di X40 decidere se questi vantaggi valgono i 250 euro (270 dollari) in più.
Prezzo e disponibilità
In Germania, la configurazione da recensire del Medion Erazer Beast X40 è disponibile presso Saturn.de e ha un prezzo di 4.499 euro (4.856 dollari).
Medion Erazer Beast X40
- 03/20/2023 v7 (old)
Sascha Mölck
Transparency
La selezione dei dispositivi da recensire viene effettuata dalla nostra redazione. Il campione di prova è stato fornito all'autore come prestito dal produttore o dal rivenditore ai fini di questa recensione. L'istituto di credito non ha avuto alcuna influenza su questa recensione, né il produttore ne ha ricevuto una copia prima della pubblicazione. Non vi era alcun obbligo di pubblicare questa recensione. Non accettiamo mai compensi o pagamenti in cambio delle nostre recensioni. In quanto società mediatica indipendente, Notebookcheck non è soggetta all'autorità di produttori, rivenditori o editori.
Ecco come Notebookcheck esegue i test
Ogni anno, Notebookcheck esamina in modo indipendente centinaia di laptop e smartphone utilizzando procedure standardizzate per garantire che tutti i risultati siano comparabili. Da circa 20 anni sviluppiamo continuamente i nostri metodi di prova e nel frattempo stabiliamo gli standard di settore. Nei nostri laboratori di prova, tecnici ed editori esperti utilizzano apparecchiature di misurazione di alta qualità. Questi test comportano un processo di validazione in più fasi. Il nostro complesso sistema di valutazione si basa su centinaia di misurazioni e parametri di riferimento ben fondati, che mantengono l'obiettività.Price comparison

