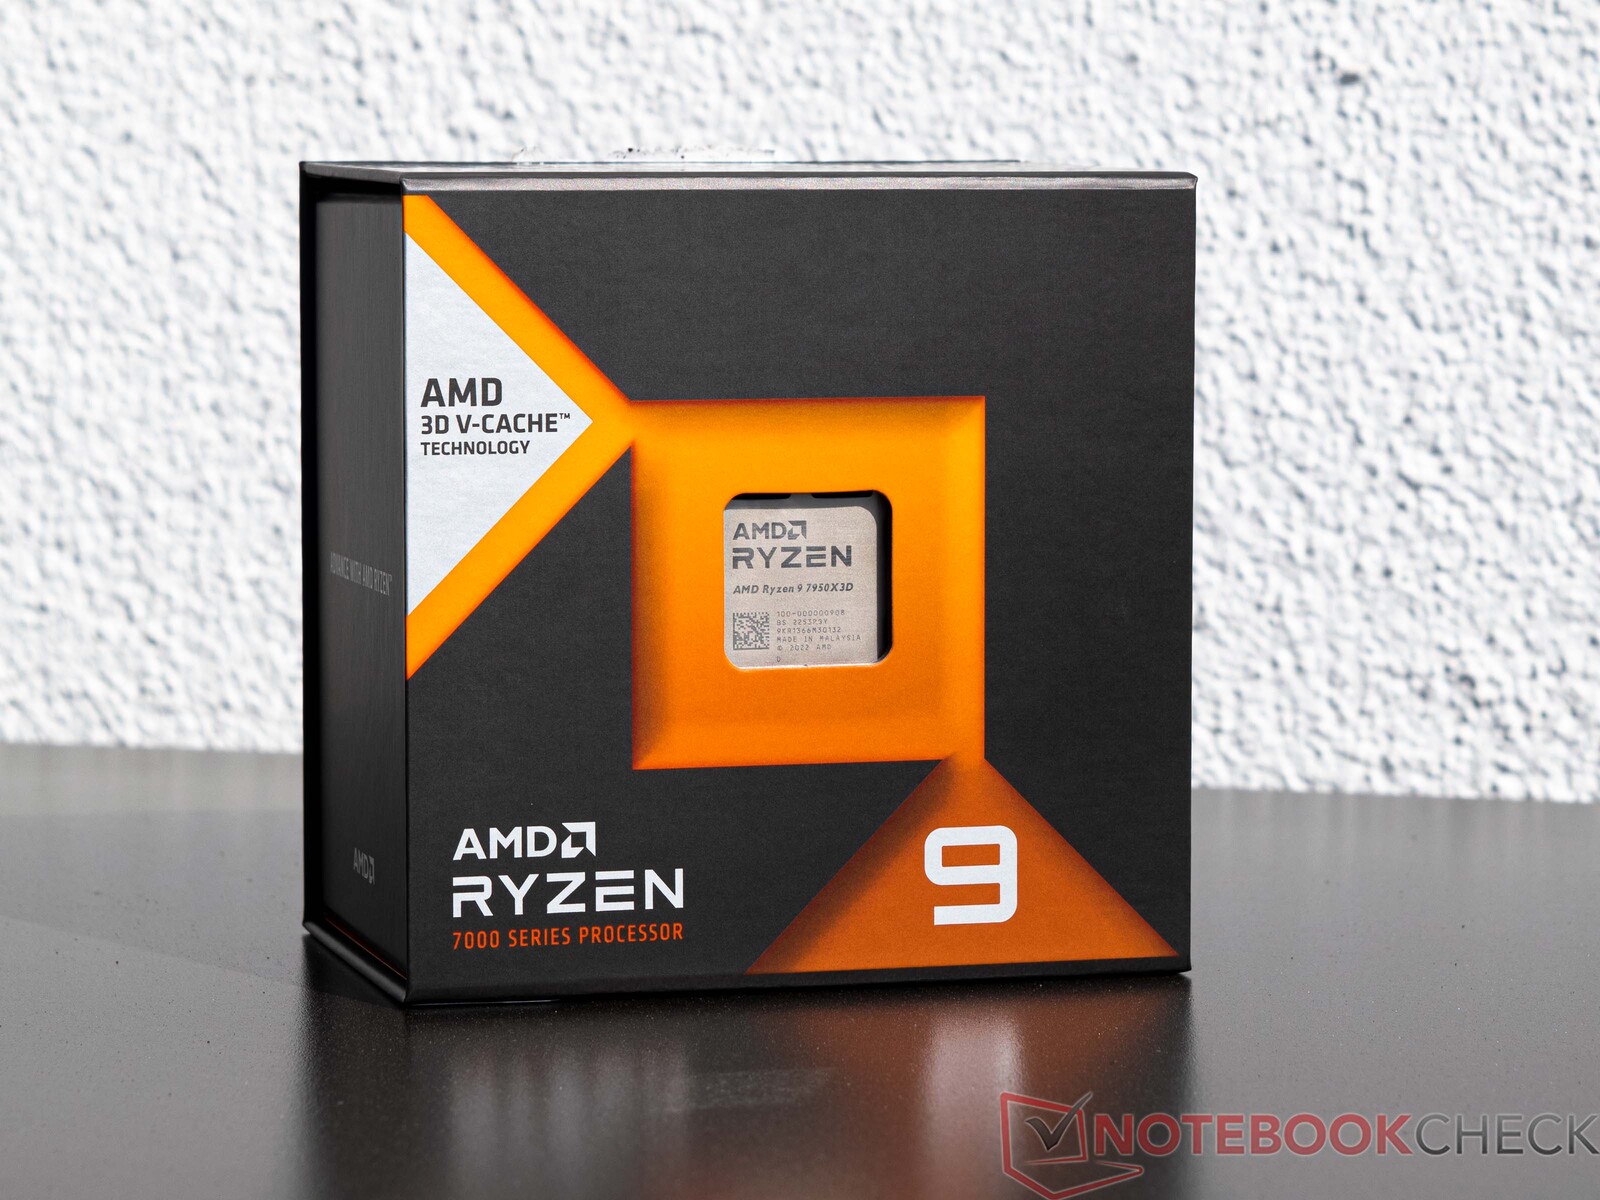
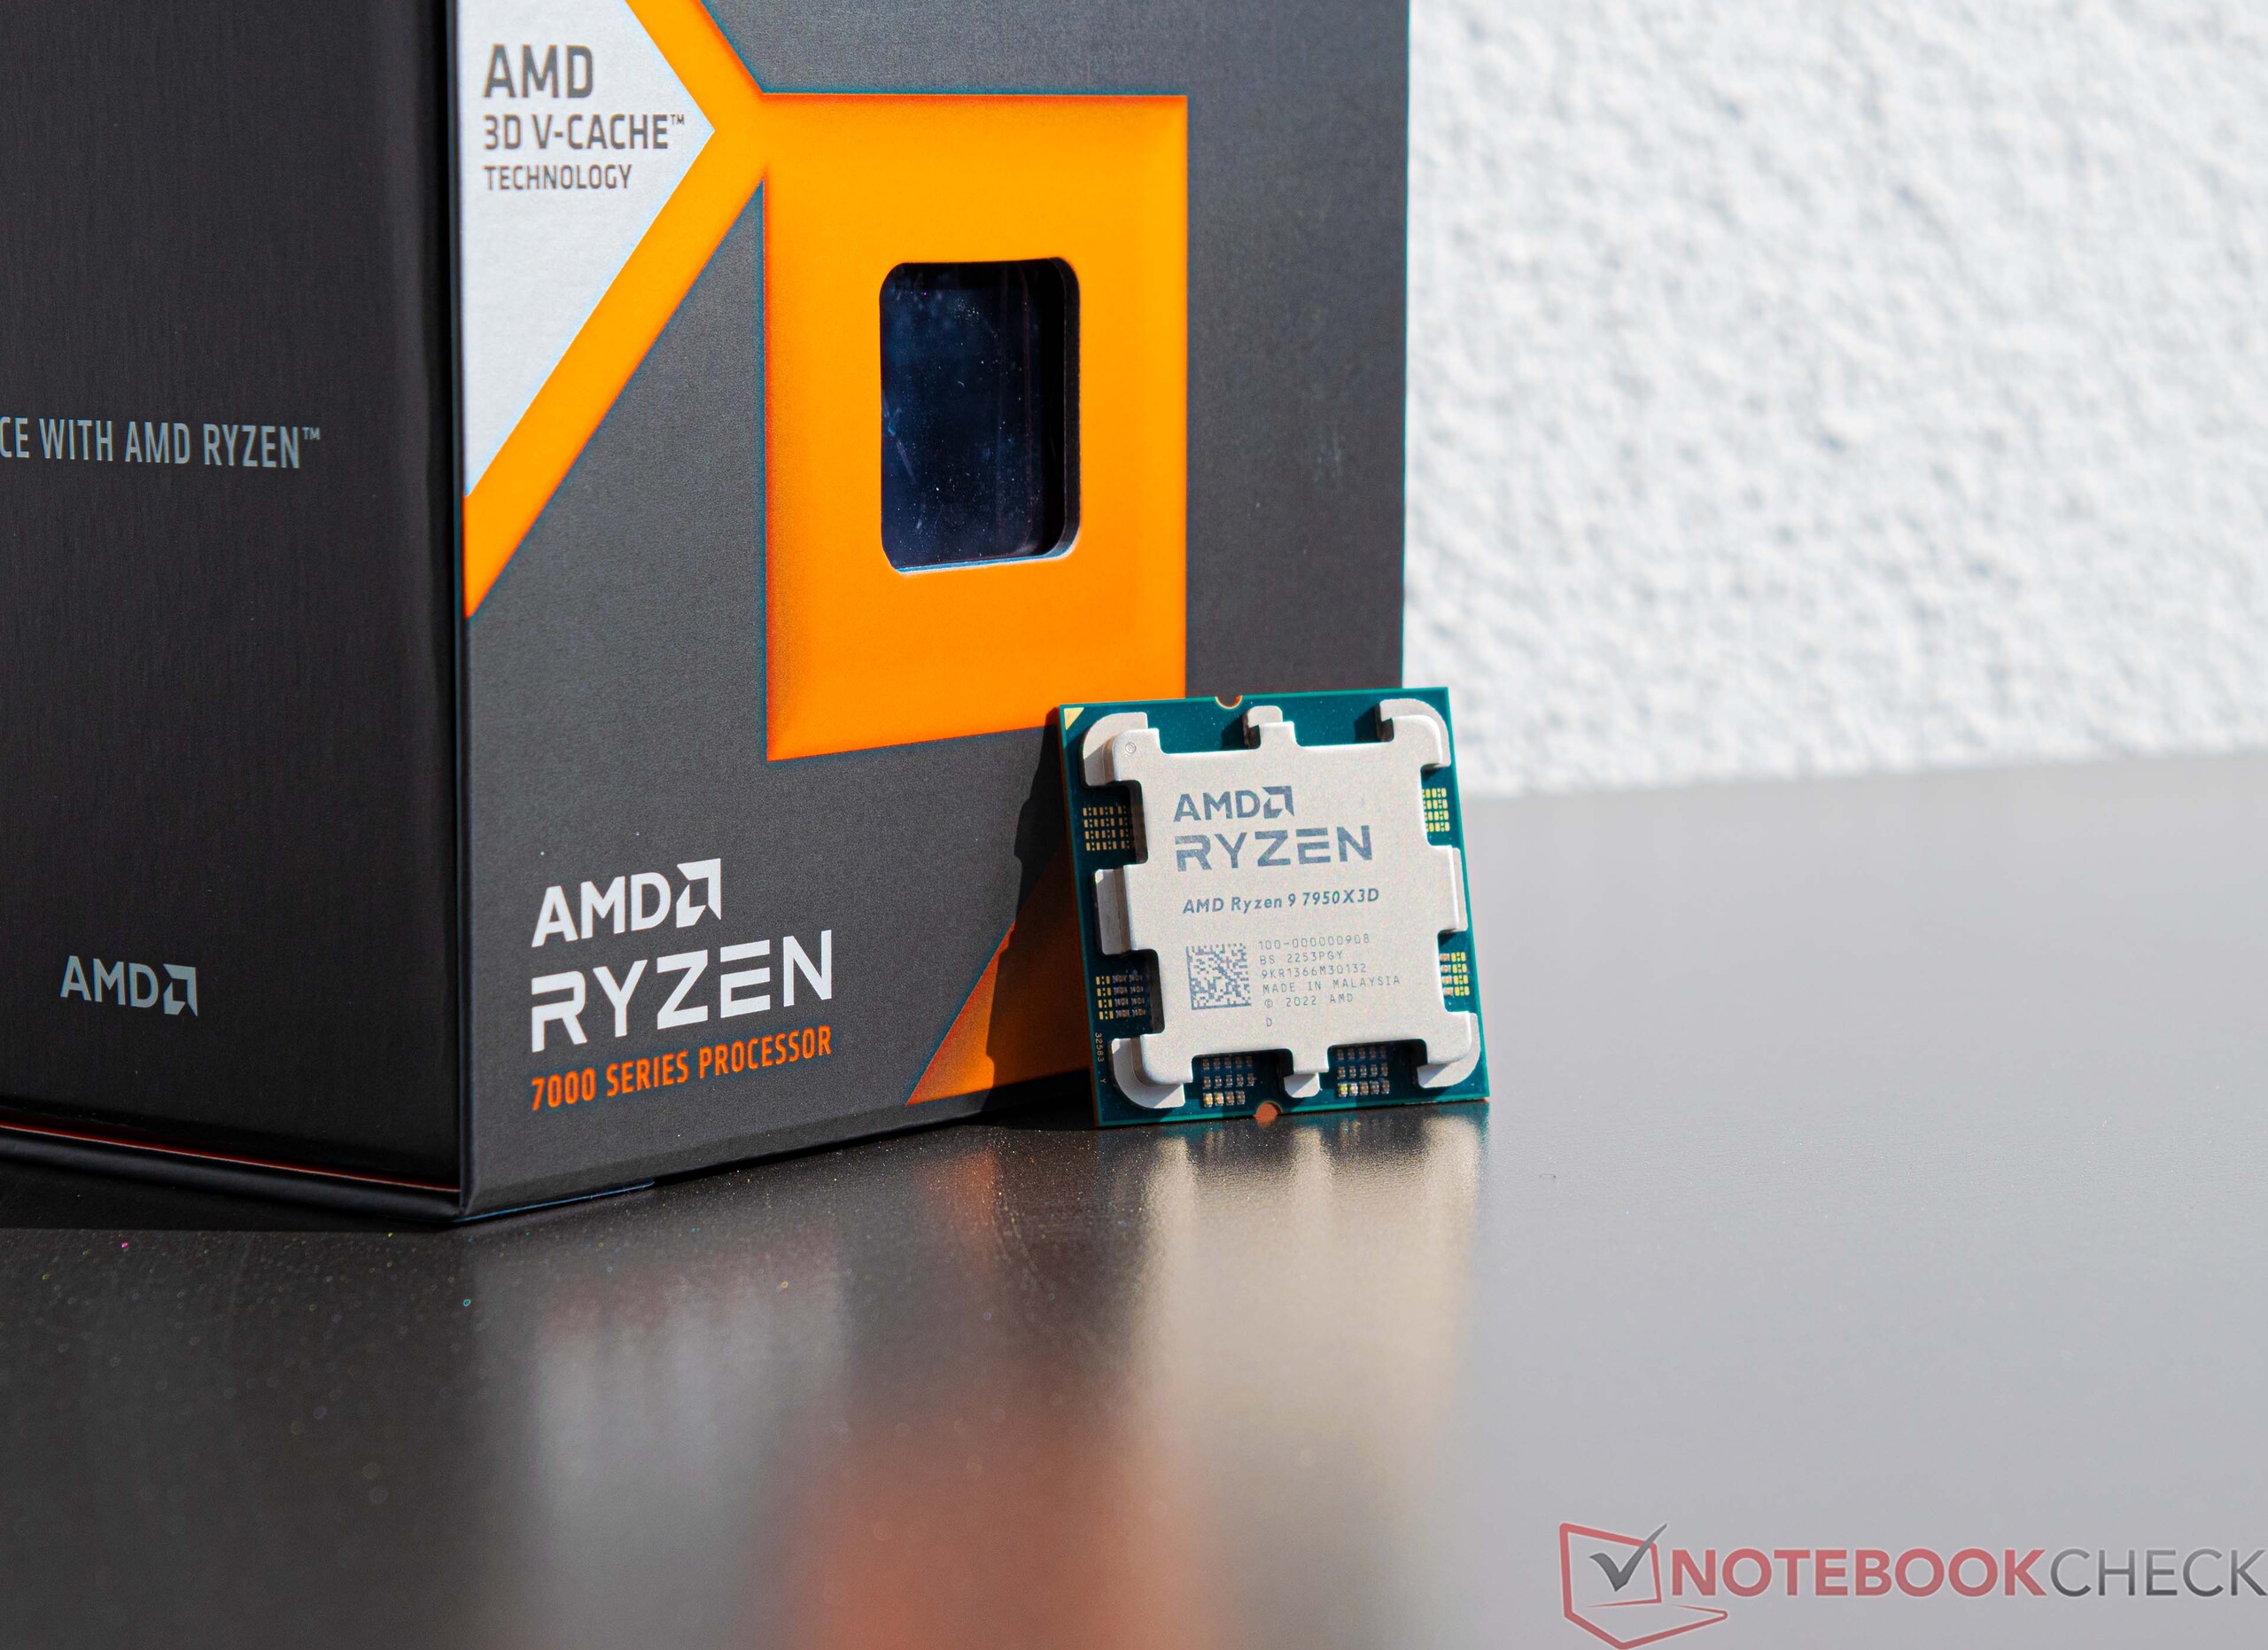
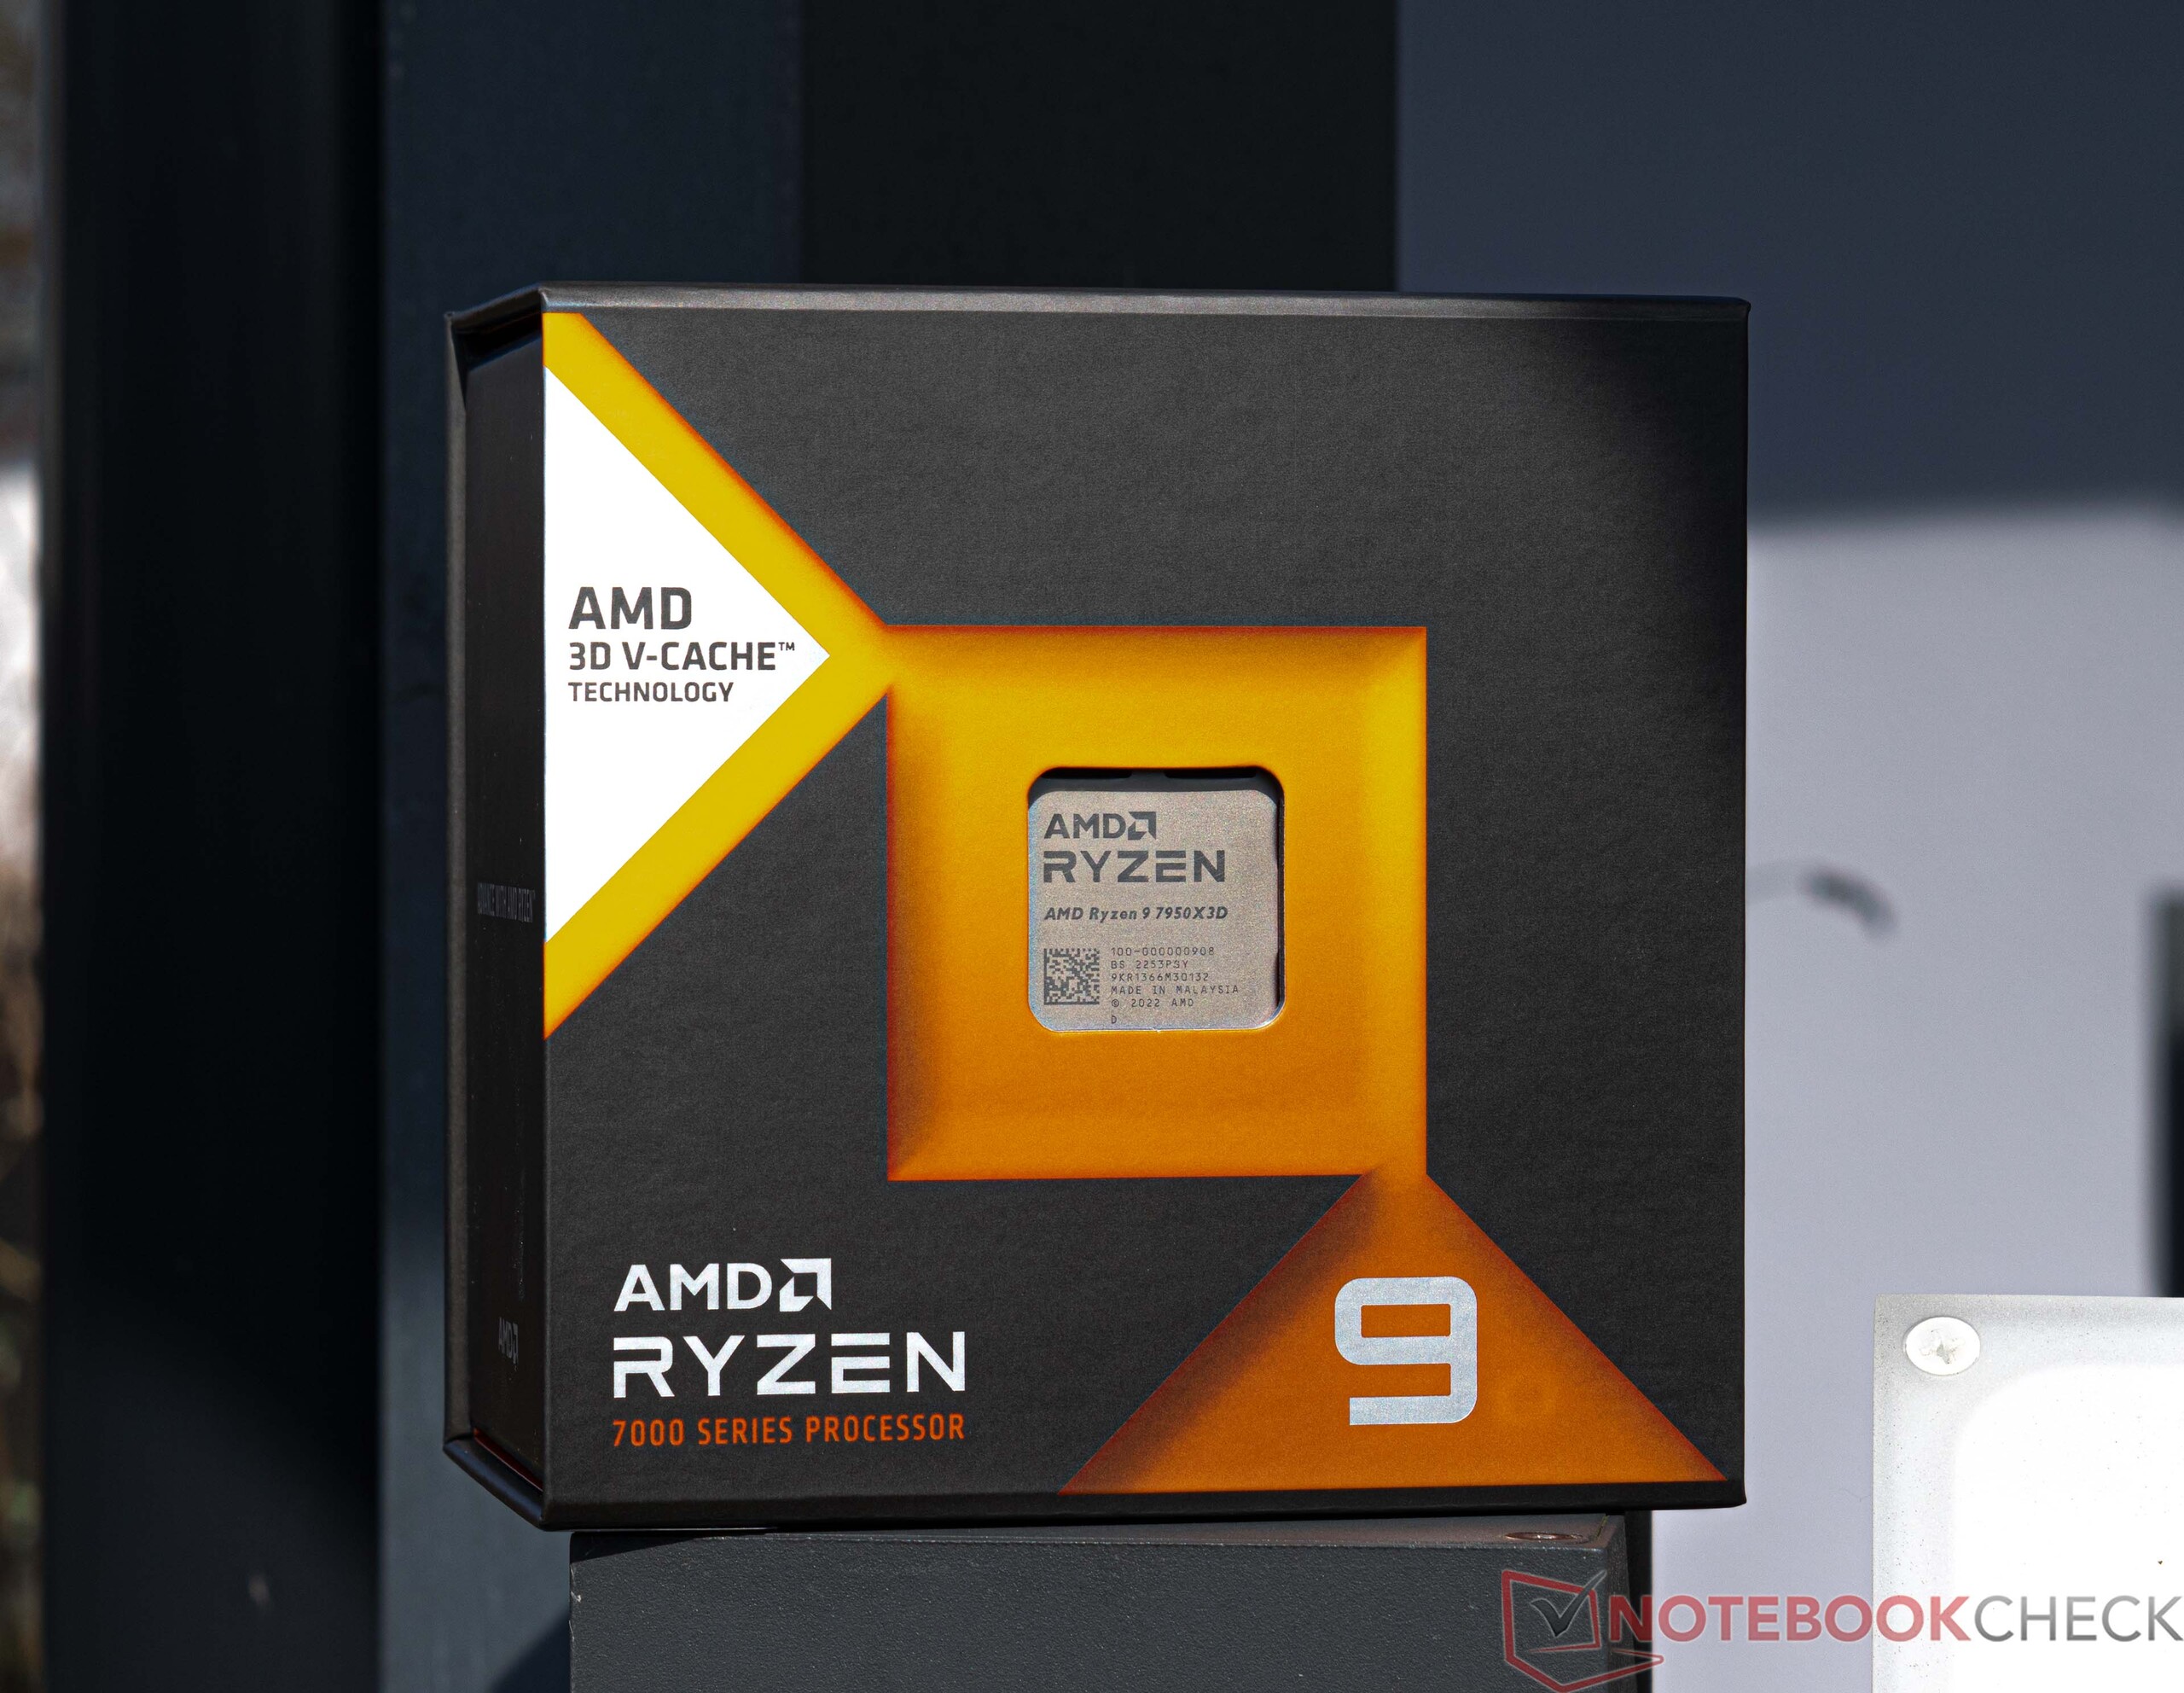
Recensione della CPU desktop AMD Ryzen 9 7950X3D: La nuova ammiraglia gaming con 3D V-Cache su socket AM5
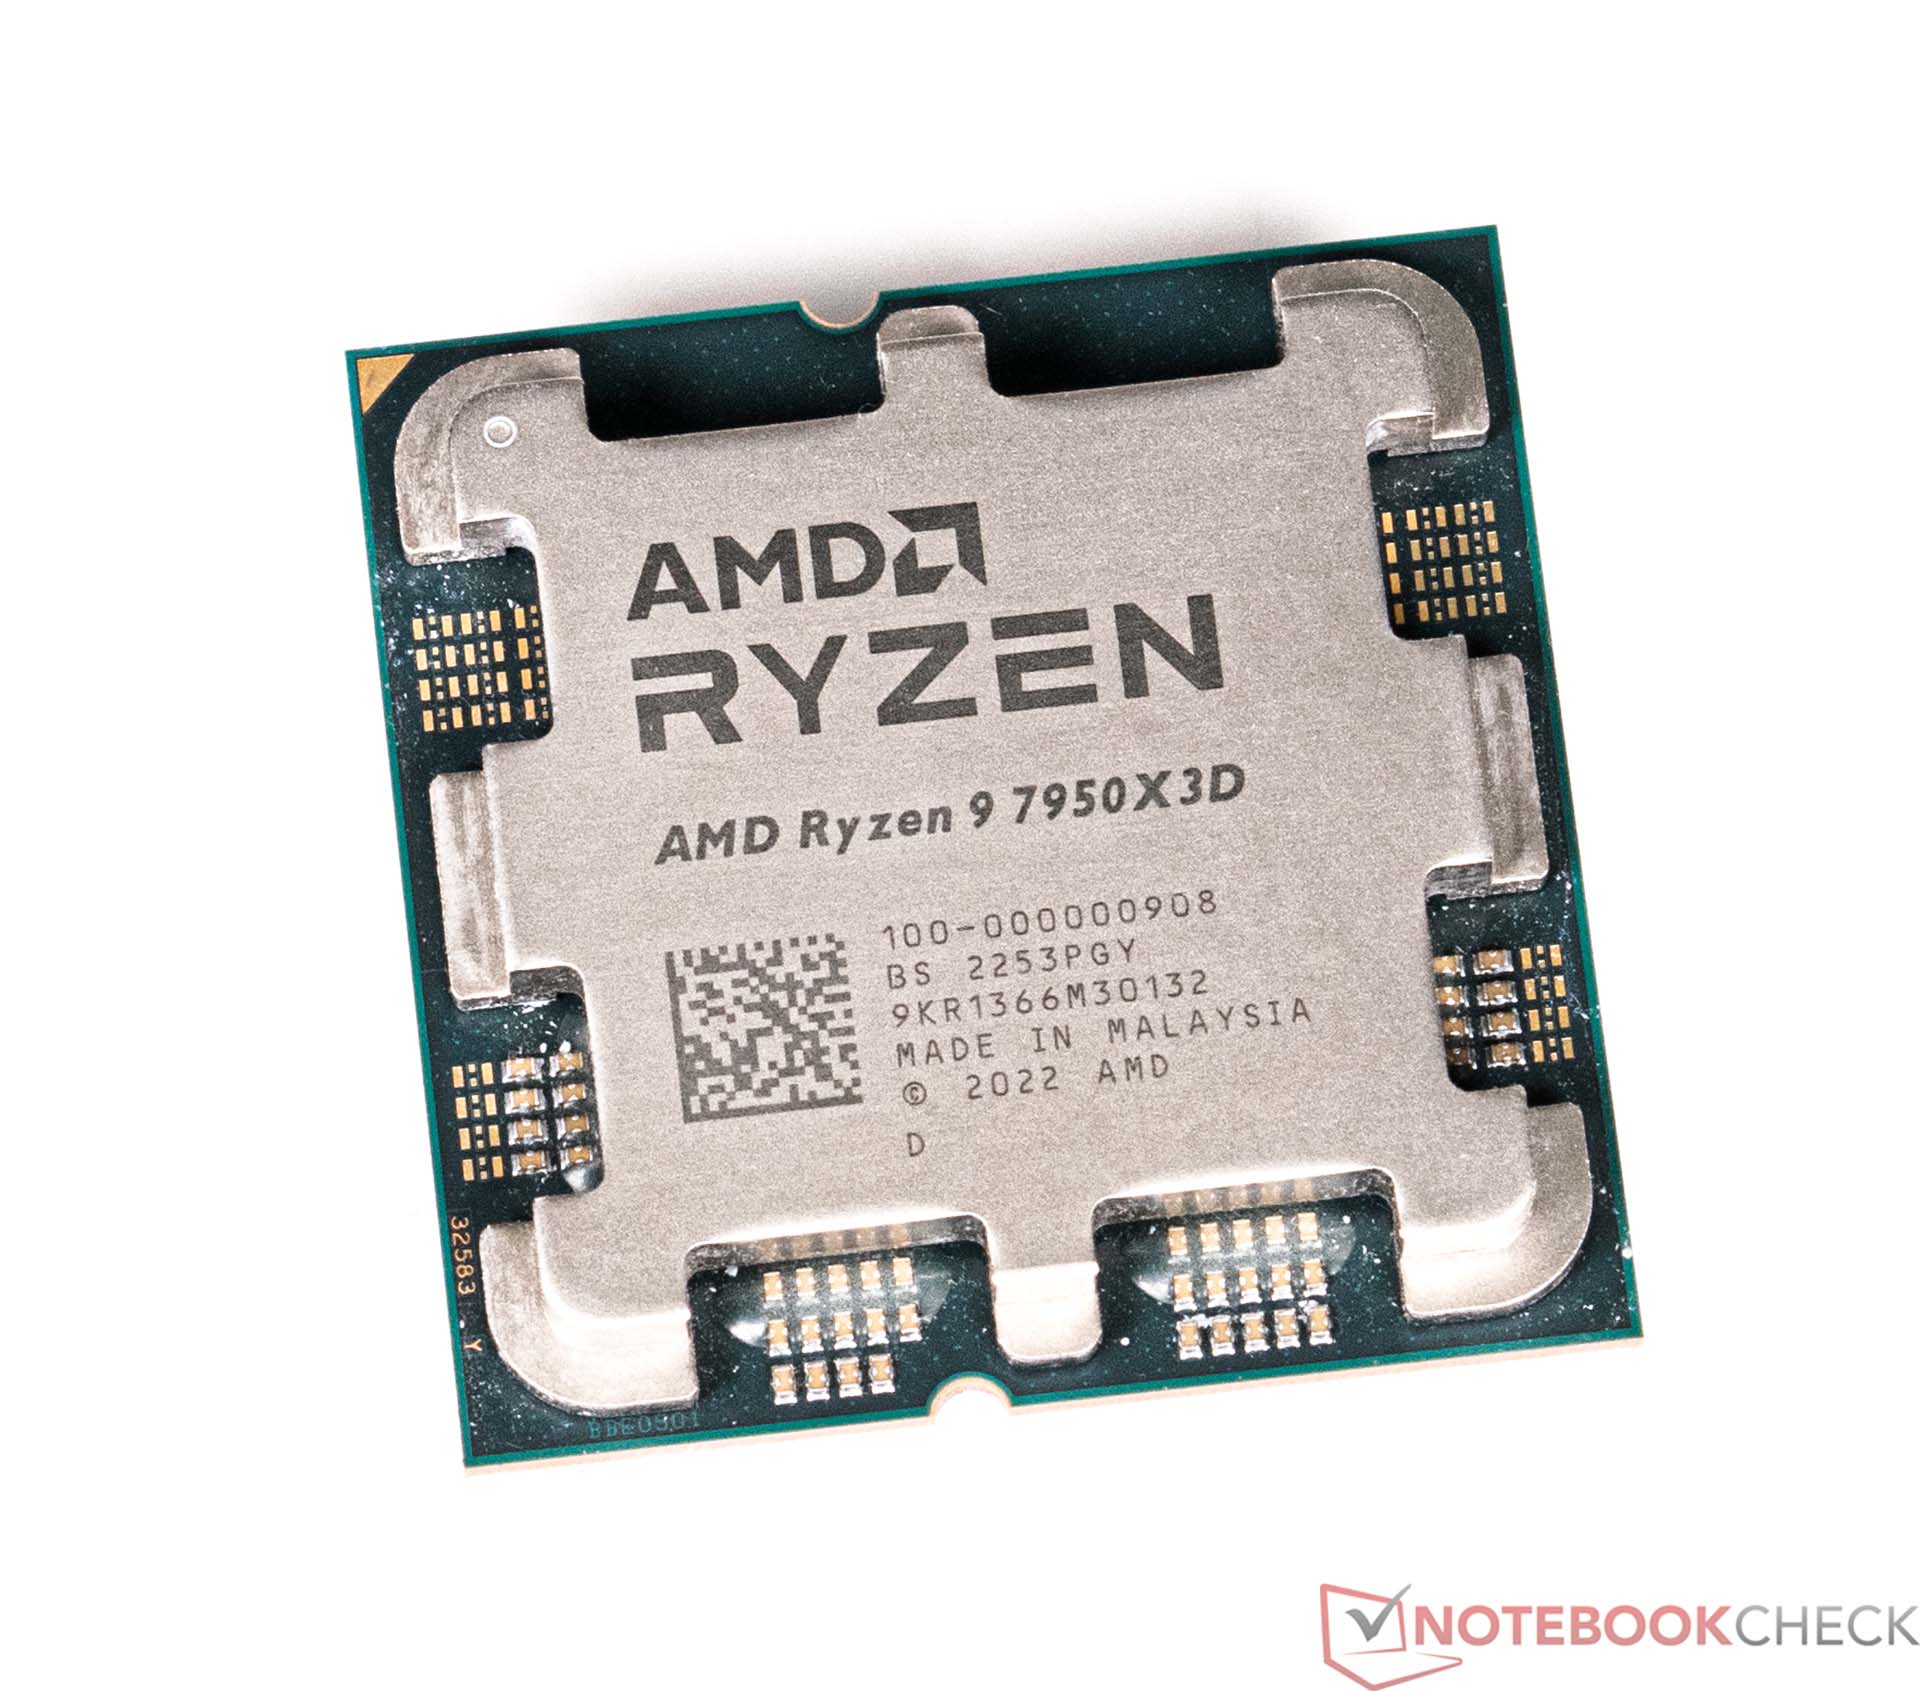
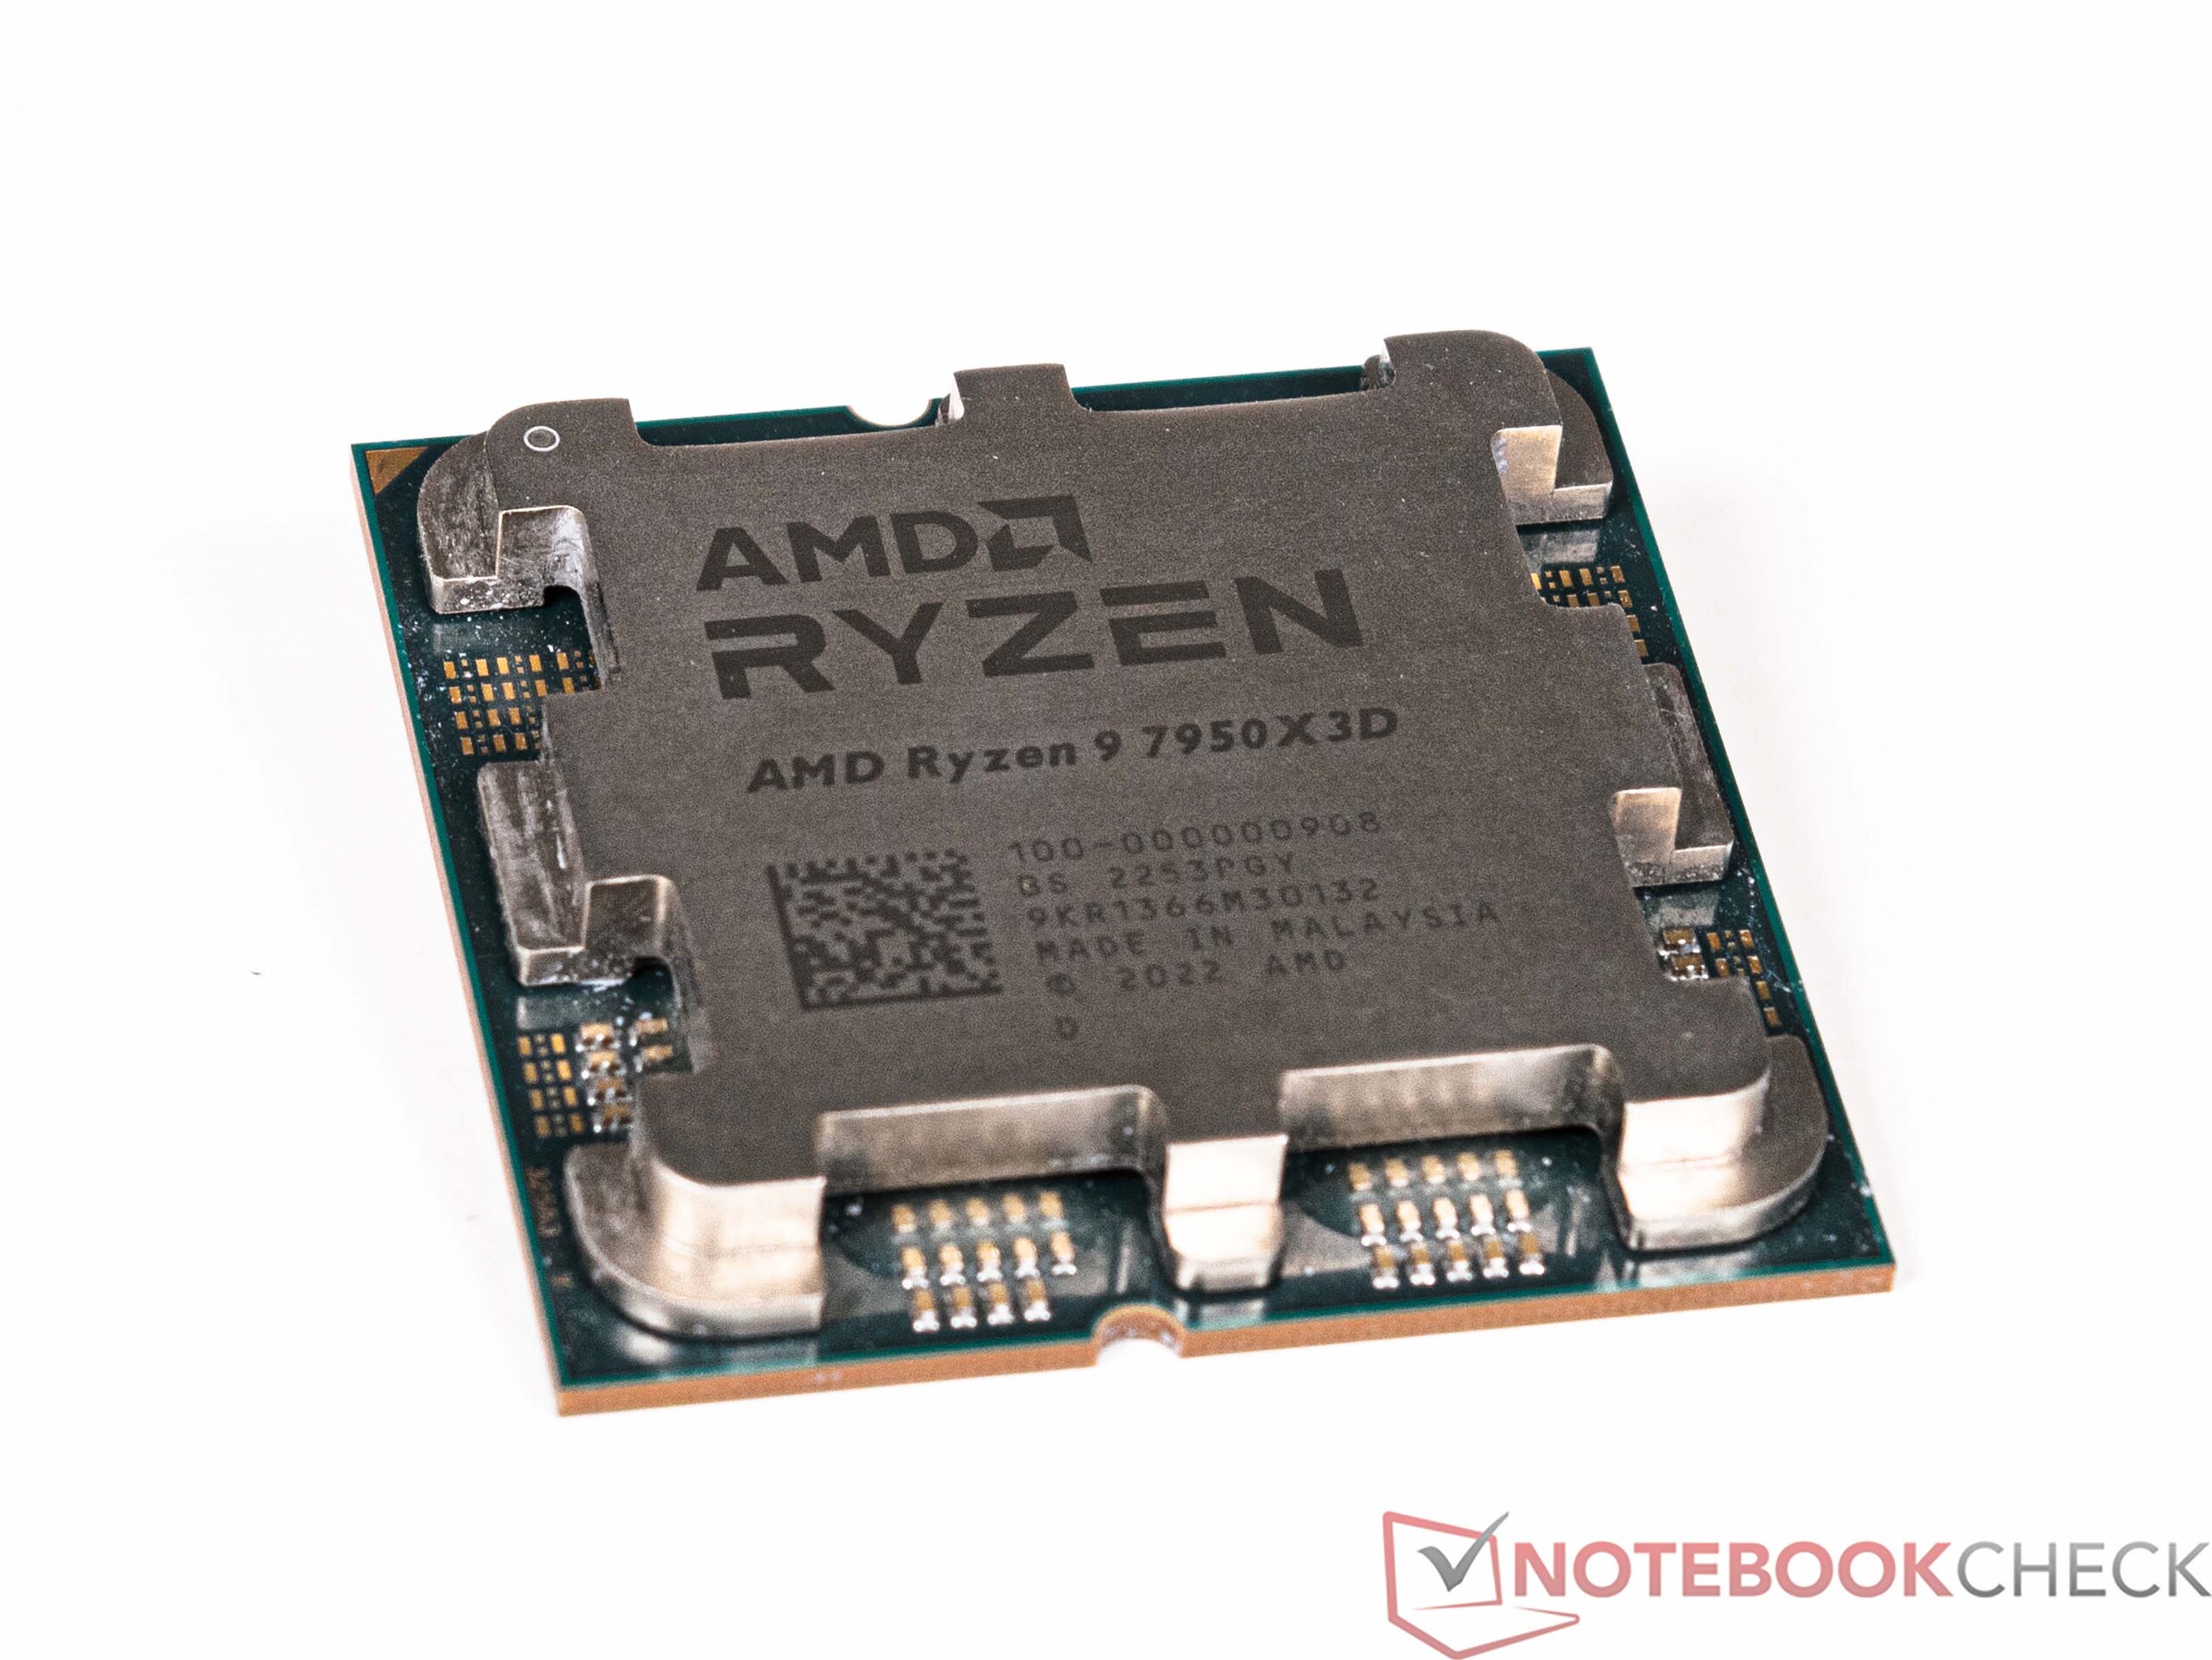
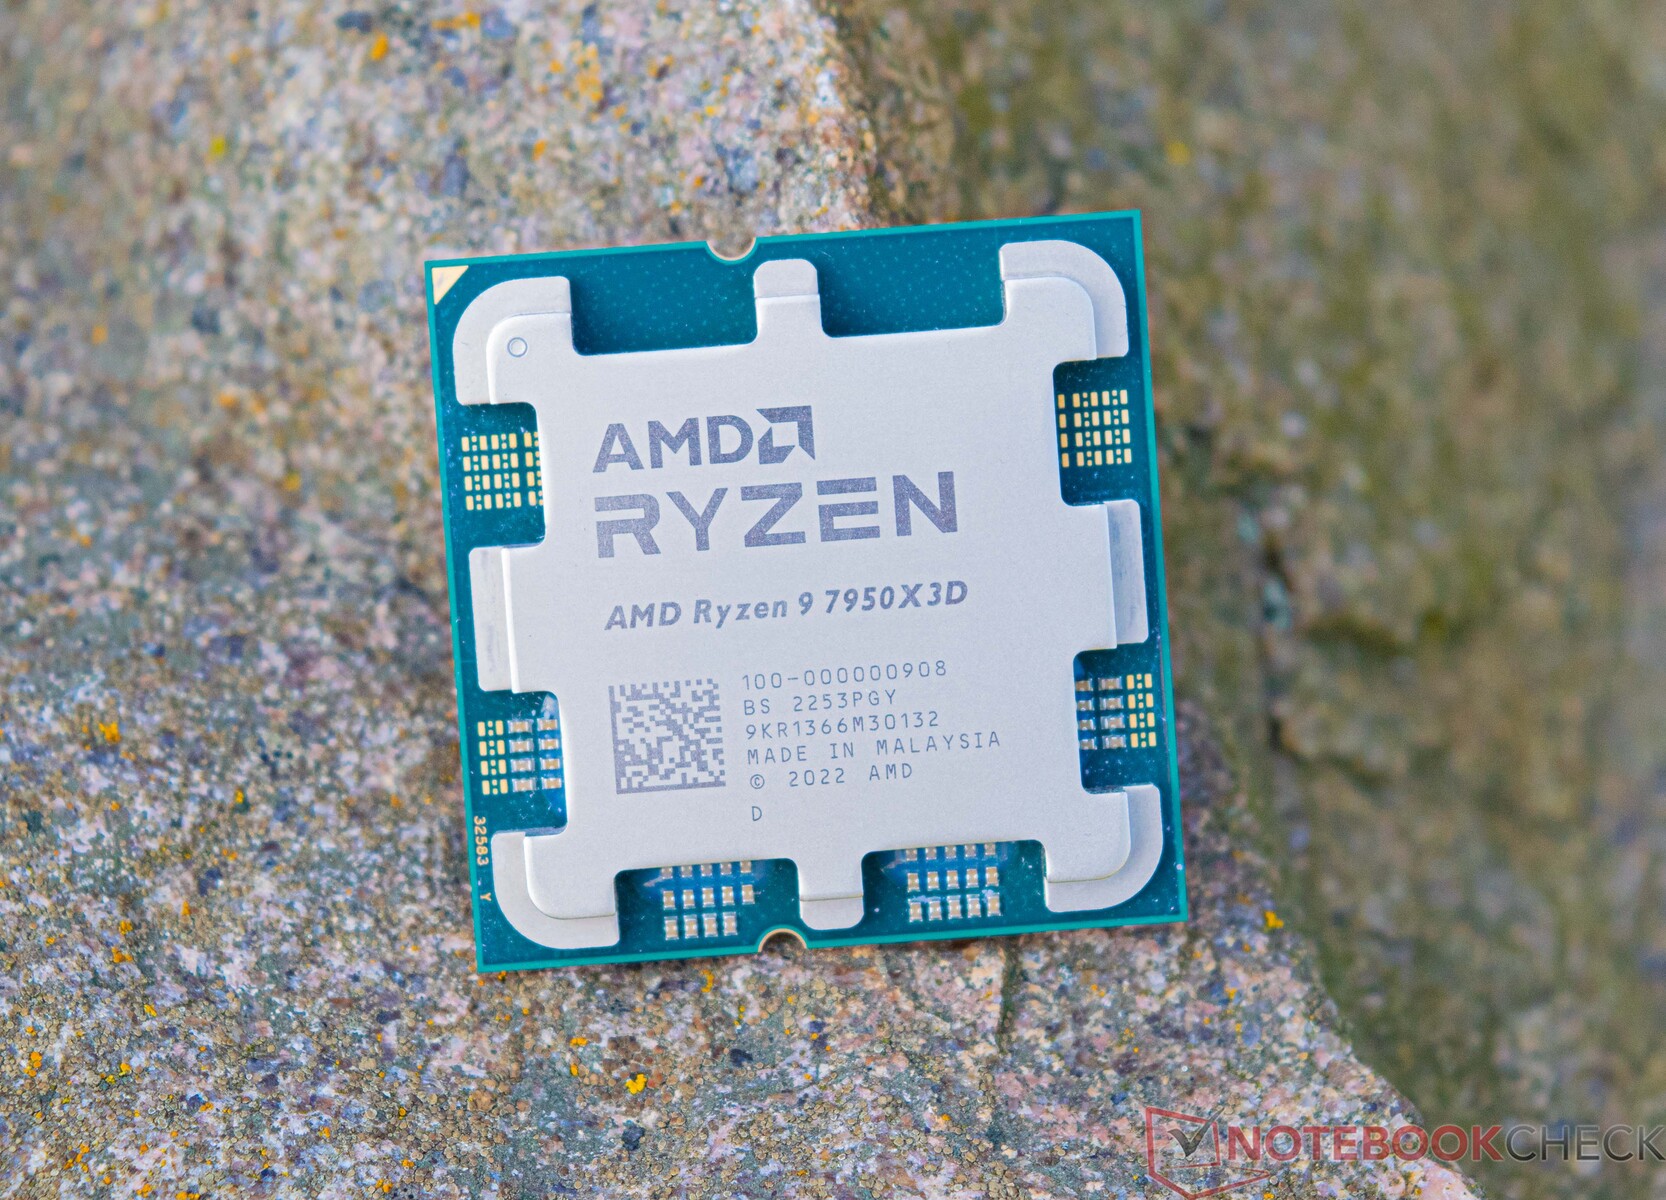
Non è passato molto tempo dalla presentazione della piattaforma AM5 per i nuovi processori Ryzen 7000 di AMD, prima che il produttore annunciasse i modelli X3D per il socket AM5 al CES di Las Vegas a gennaio. Ciò che rende speciali questi modelli è la loro V-Cache 3D, che dovrebbe garantire un significativo miglioramento delle prestazioni durante i giochi. Già con il vecchio socket AM4 è stato possibile ottenere ottime prestazioni di gioco con l'AMD Ryzen 7 5800X.AMD Ryzen 7 5800X3D. Ma sulla base del socket AM4, questa era l'unica CPU dotata di V-Cache 3D. Ora le cose sono cambiate con la nuova piattaforma AM5 e all'inizio dell'anno sono stati annunciati tre modelli. A partire dall'AMD Ryzen 9 7950X3D insieme all'AMD Ryzen 9 7900X3D, l'AMD Ryzen 7 7800X3D dovrebbe seguire nell'aprile 2023. Per la maggior parte dei giocatori, l'ultimo processore dovrebbe essere il modello più interessante della serie, non solo per il prezzo. La struttura interna dei due processori a 12 e 16 core è progettata con un solo CCD, compresa la veloce V-Cache 3D. Per capire questo, bisogna sapere che un CCD unisce 8 core della CPU come un cluster. Nei modelli AMD Ryzen 9 7950X3D e AMD Ryzen 9 7950X sono presenti 2 CCD con 8 core ciascuno, per un totale di 16 core a disposizione dell'utente. Ma questo significa anche che l'AMD Ryzen 9 7950X3D offre solo 8 core basati sulla veloce 3D V-Cache. Il secondo CCD è dotato solo della cache "normale". Per il più piccolo Ryzen 9 7900X3D, che continua ad avere 12 core di calcolo, sono corrispondentemente 6 i core dei 2 CCD che possono accedere alla V-Cache 3D.
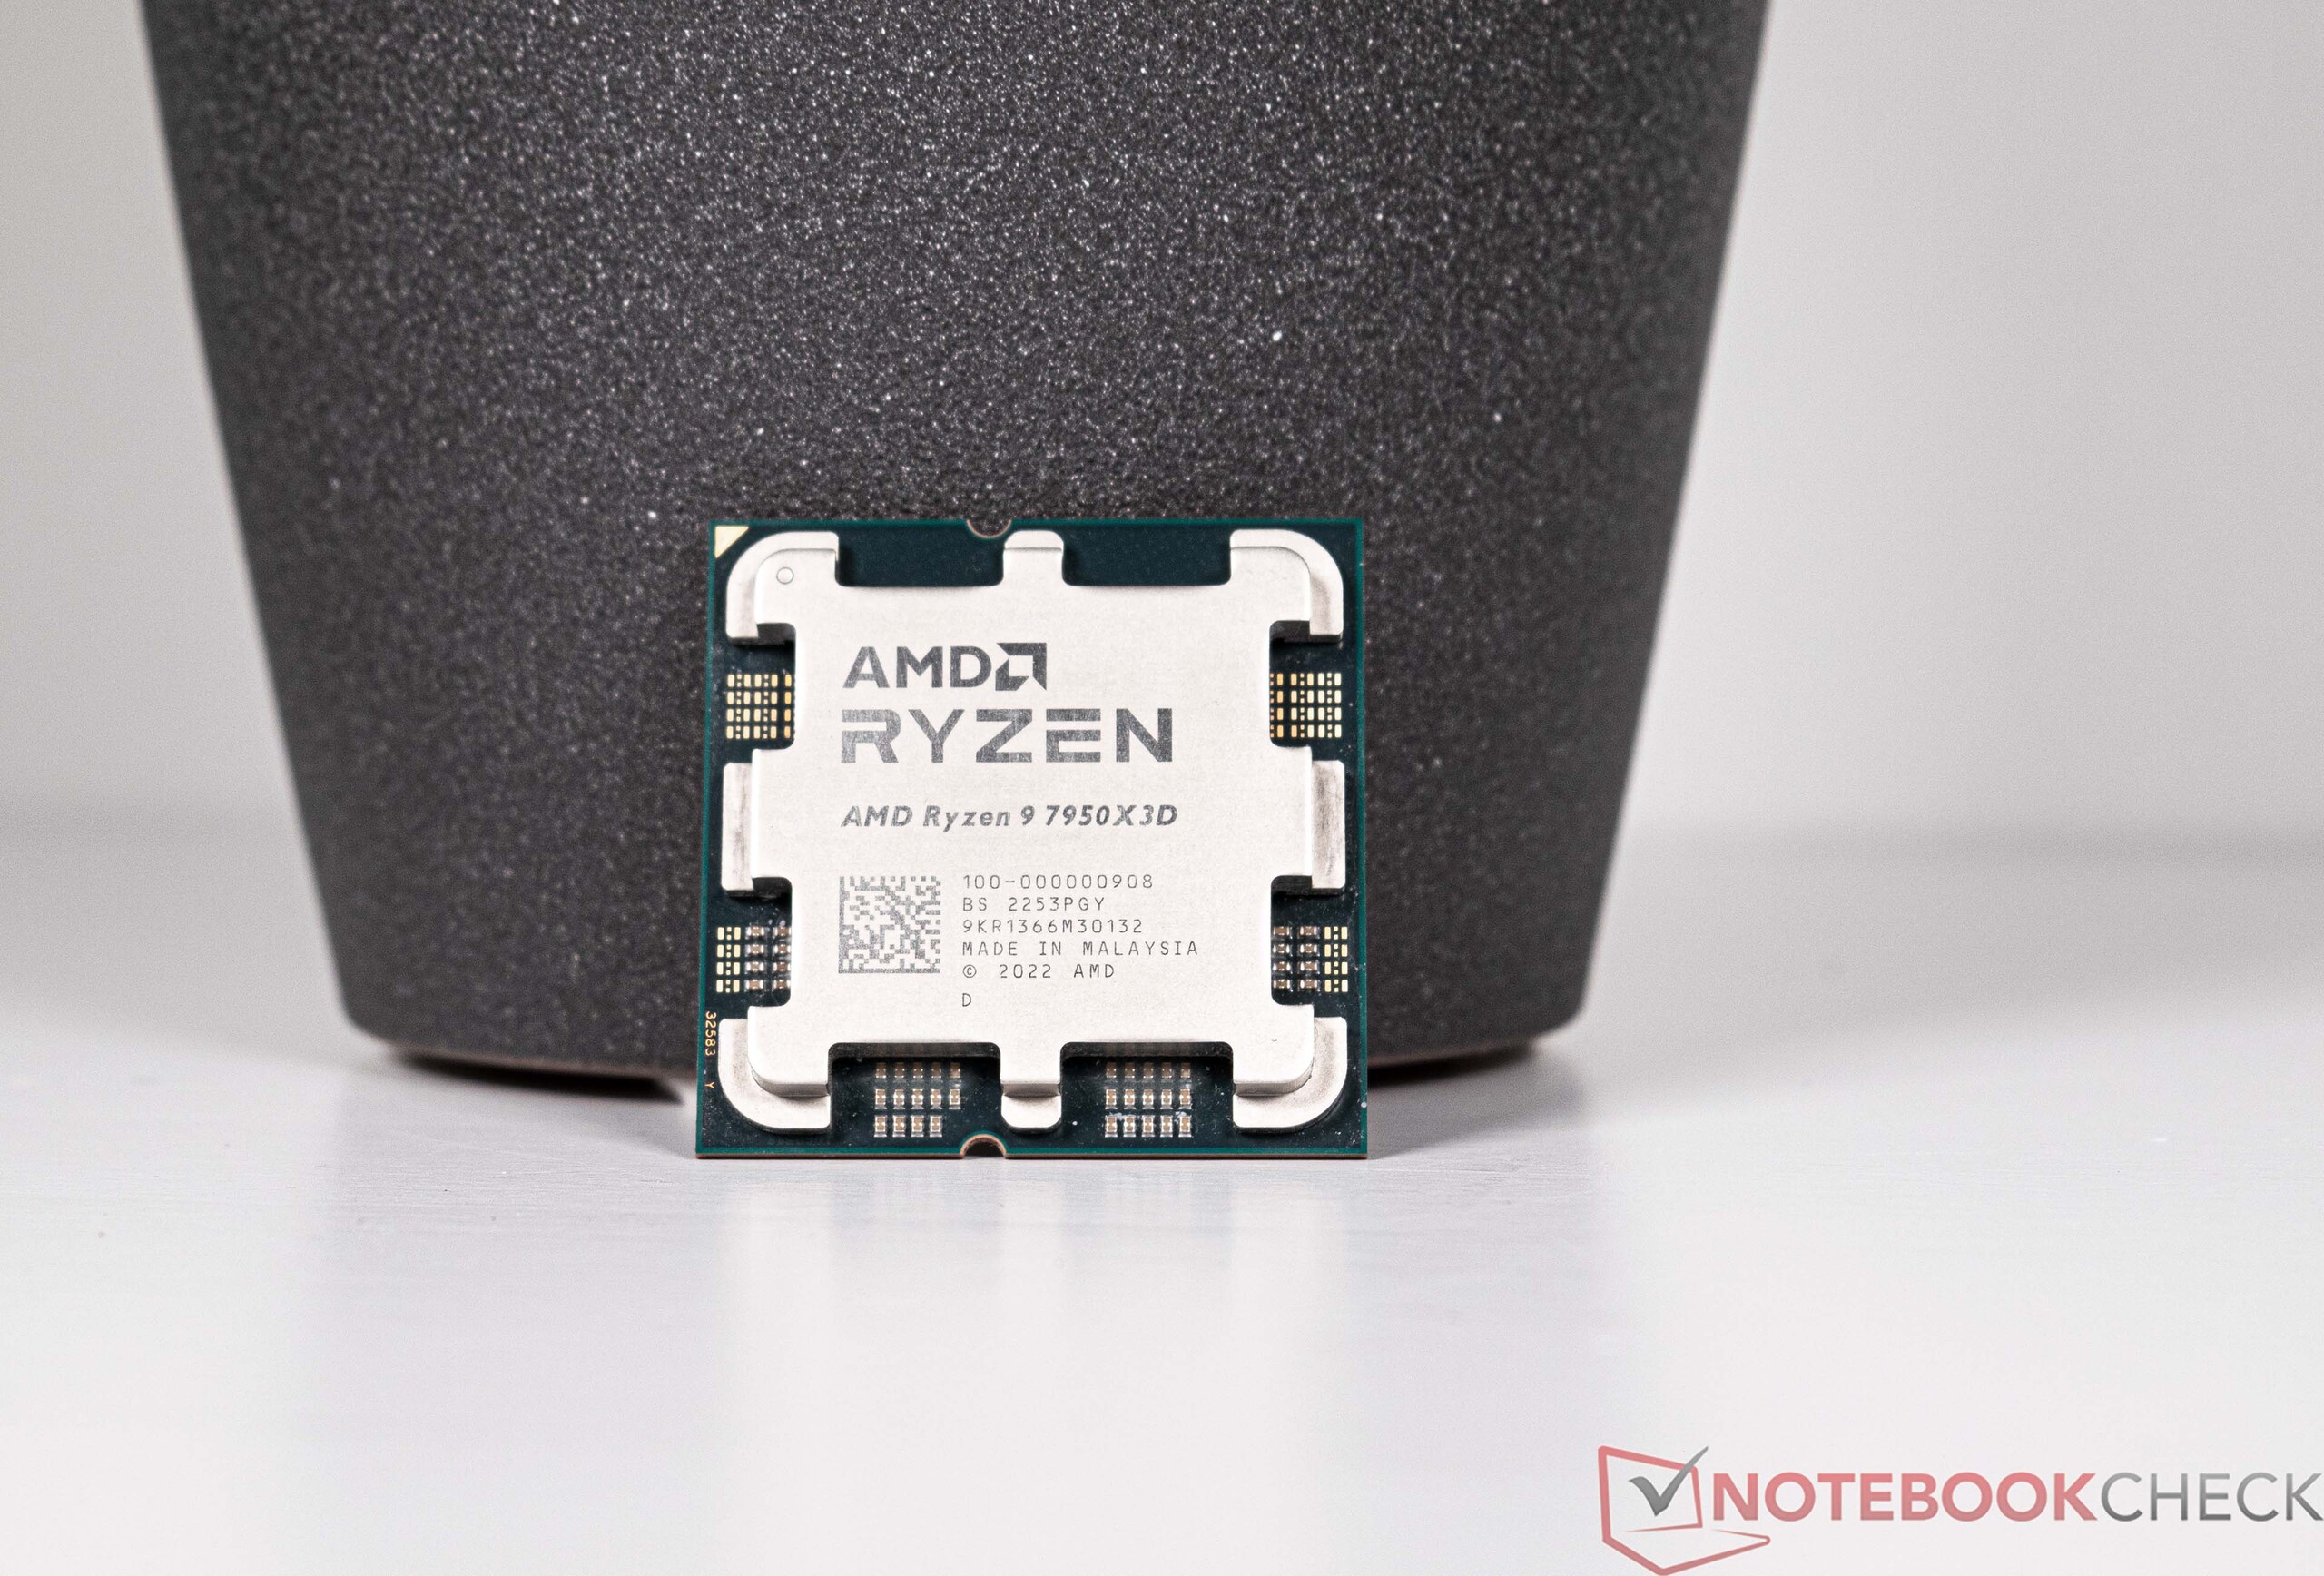
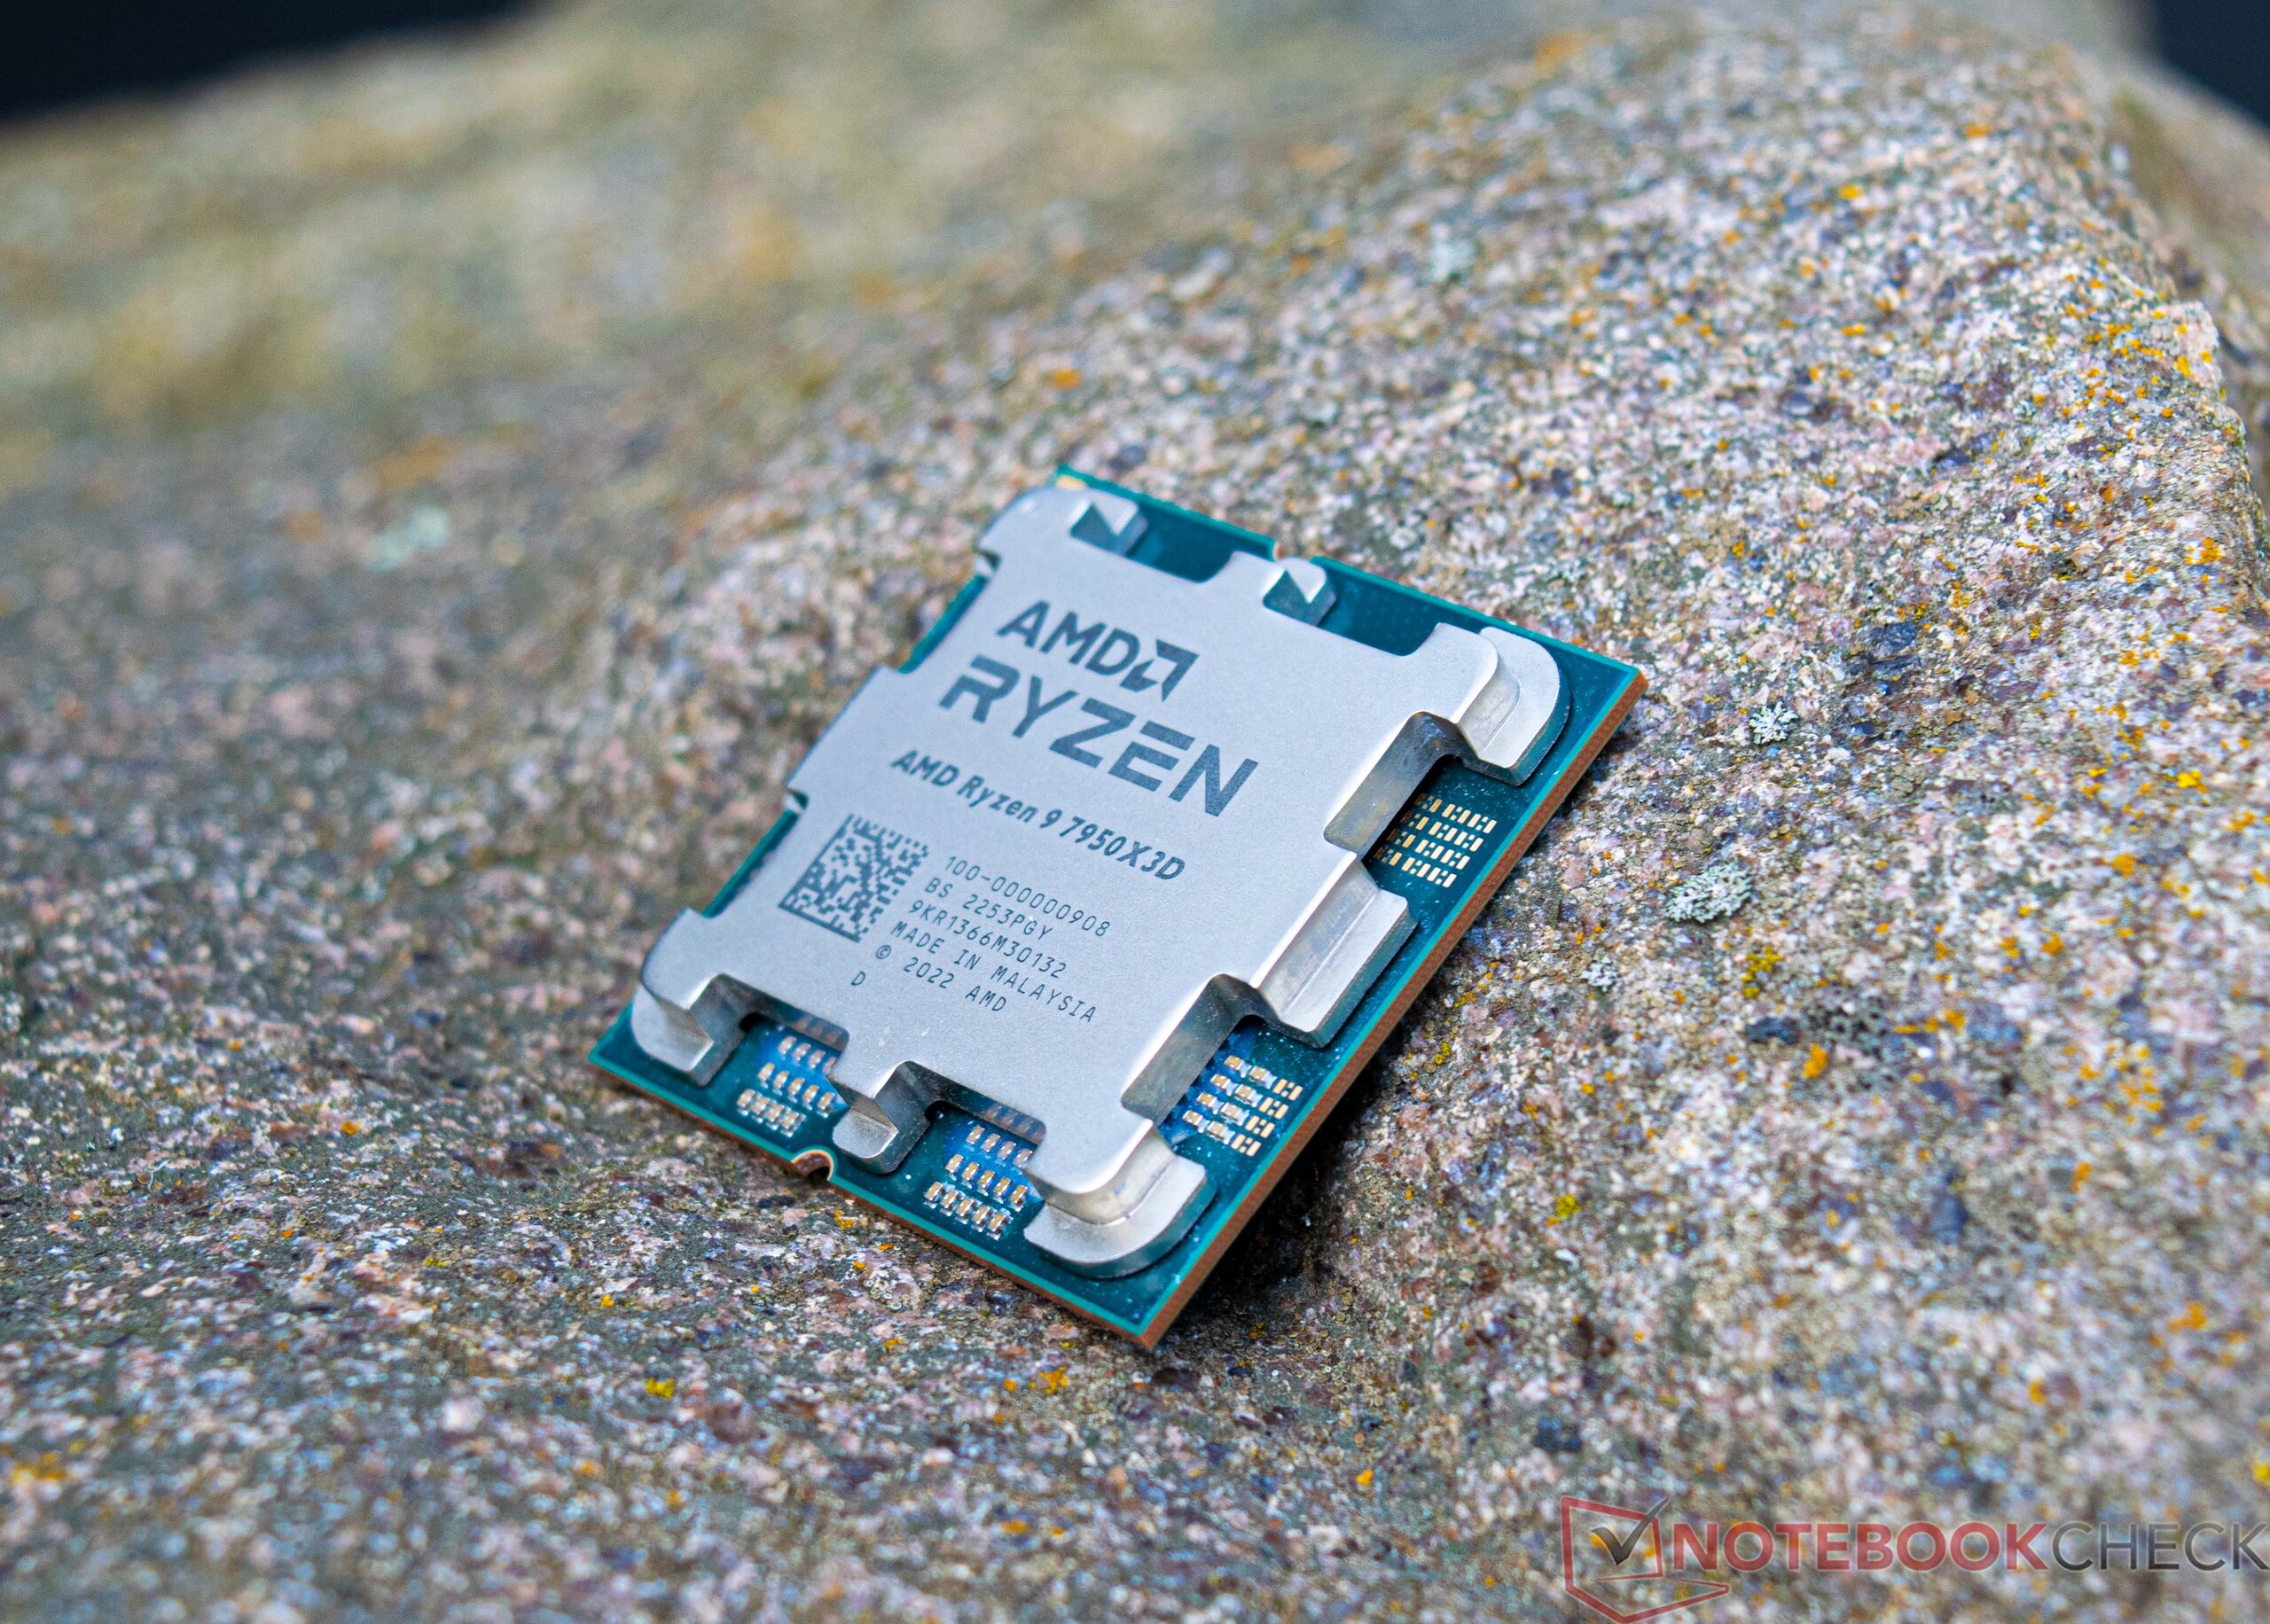
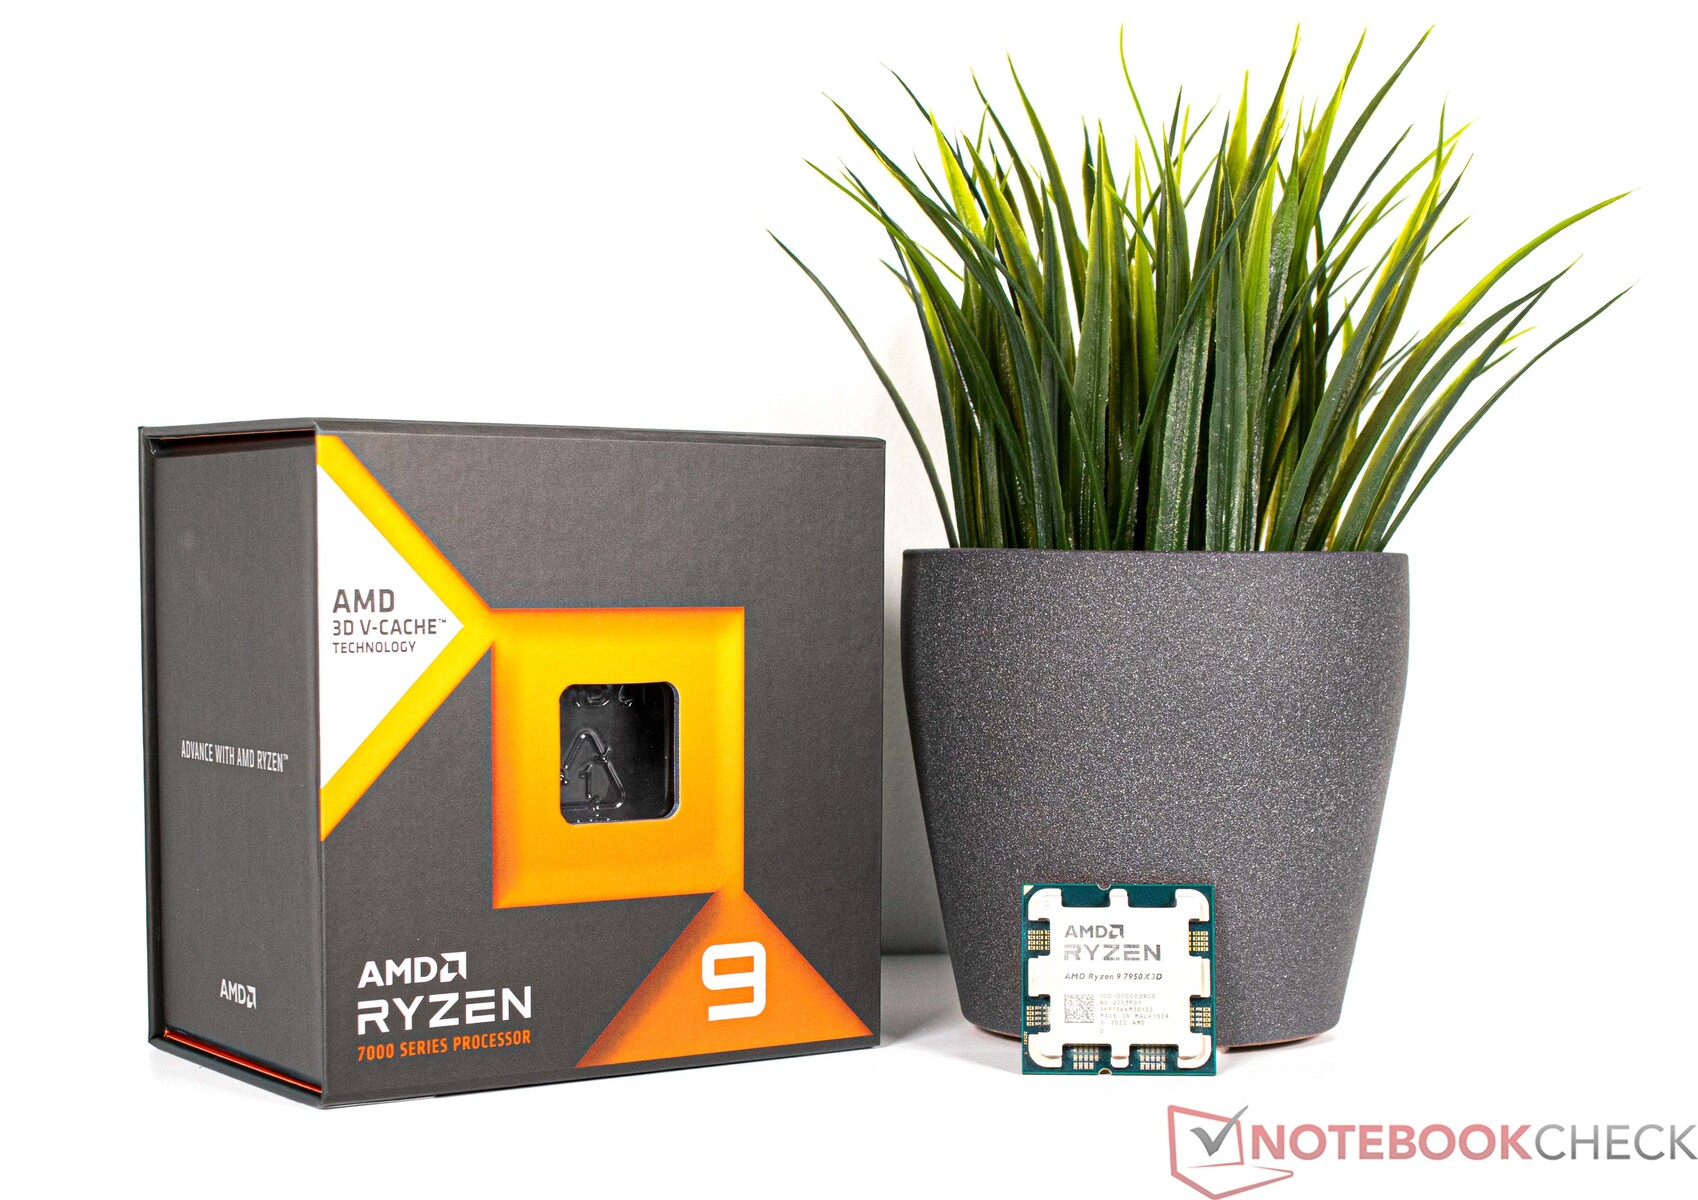
In questa recensione, diamo un'occhiata all'AMD Ryzen 9 7950X3D, che è la nuova ammiraglia della piattaforma AM5. Per un funzionamento fluido, è sicuramente necessario installare il driver del chipset più aggiornato per assicurarsi che l'assegnazione dei processi in background funzioni sempre correttamente e senza problemi. Fondamentalmente, gli interni dell'AMD Ryzen 9 7950X3D sono costruiti in modo simile alla versione non-X3D, il che significa che i due CCD sono collegati al die I/O tramite l'Infinity Fabric.
In termini di consumo energetico, non notiamo uno svantaggio rispetto ai modelli Ryzen 9 fino ad ora, poiché il TDP dei processori X3D è di soli 120 watt. Tuttavia, il PPT (Package Power Tracking) massimo è ora di soli 162 watt (mentre prima era di 230 watt). Potrete scoprire più avanti nel nostro test se la riduzione del consumo energetico ha qualche effetto e, in caso affermativo, quali sono.
Panoramica della famiglia AMD Ryzen 7000
| Modello | Cores/Threads | Velocità di clock di base | Velocità Turbo | L2-Cache | L3-Cache | TDP | PPT | Prezzo di lancio |
|---|---|---|---|---|---|---|---|---|
| Ryzen 9 7950X3D | 16/32 | 4,2 GHz | 5,7 GHz | 16x 1 MB | 128 MB | 120 Watt | 162 Watt | 699USD |
| Ryzen 9 7950X | 16/32 | 4,5 GHz | 5,7 GHz | 16x 1 MB | 64 MB | 170 Watt | 230W | 699 USD |
| Ryzen 9 7900X3D | 12/24 | 4,4 GHz | 5,6 GHz | 12x 1 MB | 128 MB | 120 Watt | 162 Watt | 599USD |
| Ryzen 9 7900X | 12/24 | 4,7 GHz | 5,6 GHz | 12x 1 MB | 64 MB | 170 Watt | 230W | 549 USD |
| Ryzen 7 7800X3D | 8/16 | 4,2 GHz | 5,0 GHz | 8x1 MB | 96 MB | 120 Watt | 162 Watt | 549USD |
| Ryzen 7 7700X | 8/16 | 4,5 GHz | 5,4 GHz | 8x 1 MB | 32 MB | 105 Watt | 142W | 399 USD |
| Ryzen 5 7600X | 6/12 | 4,7 GHz | 5,3 GHz | 6x 1 MB | 32 MB | 105 Watt | 142W | 299 USD |
Il sistema di test in dettaglio
Per i benchmark e i test che seguono utilizziamo il seguente sistema:
- Streacom BC1 V2 Open Benchtable
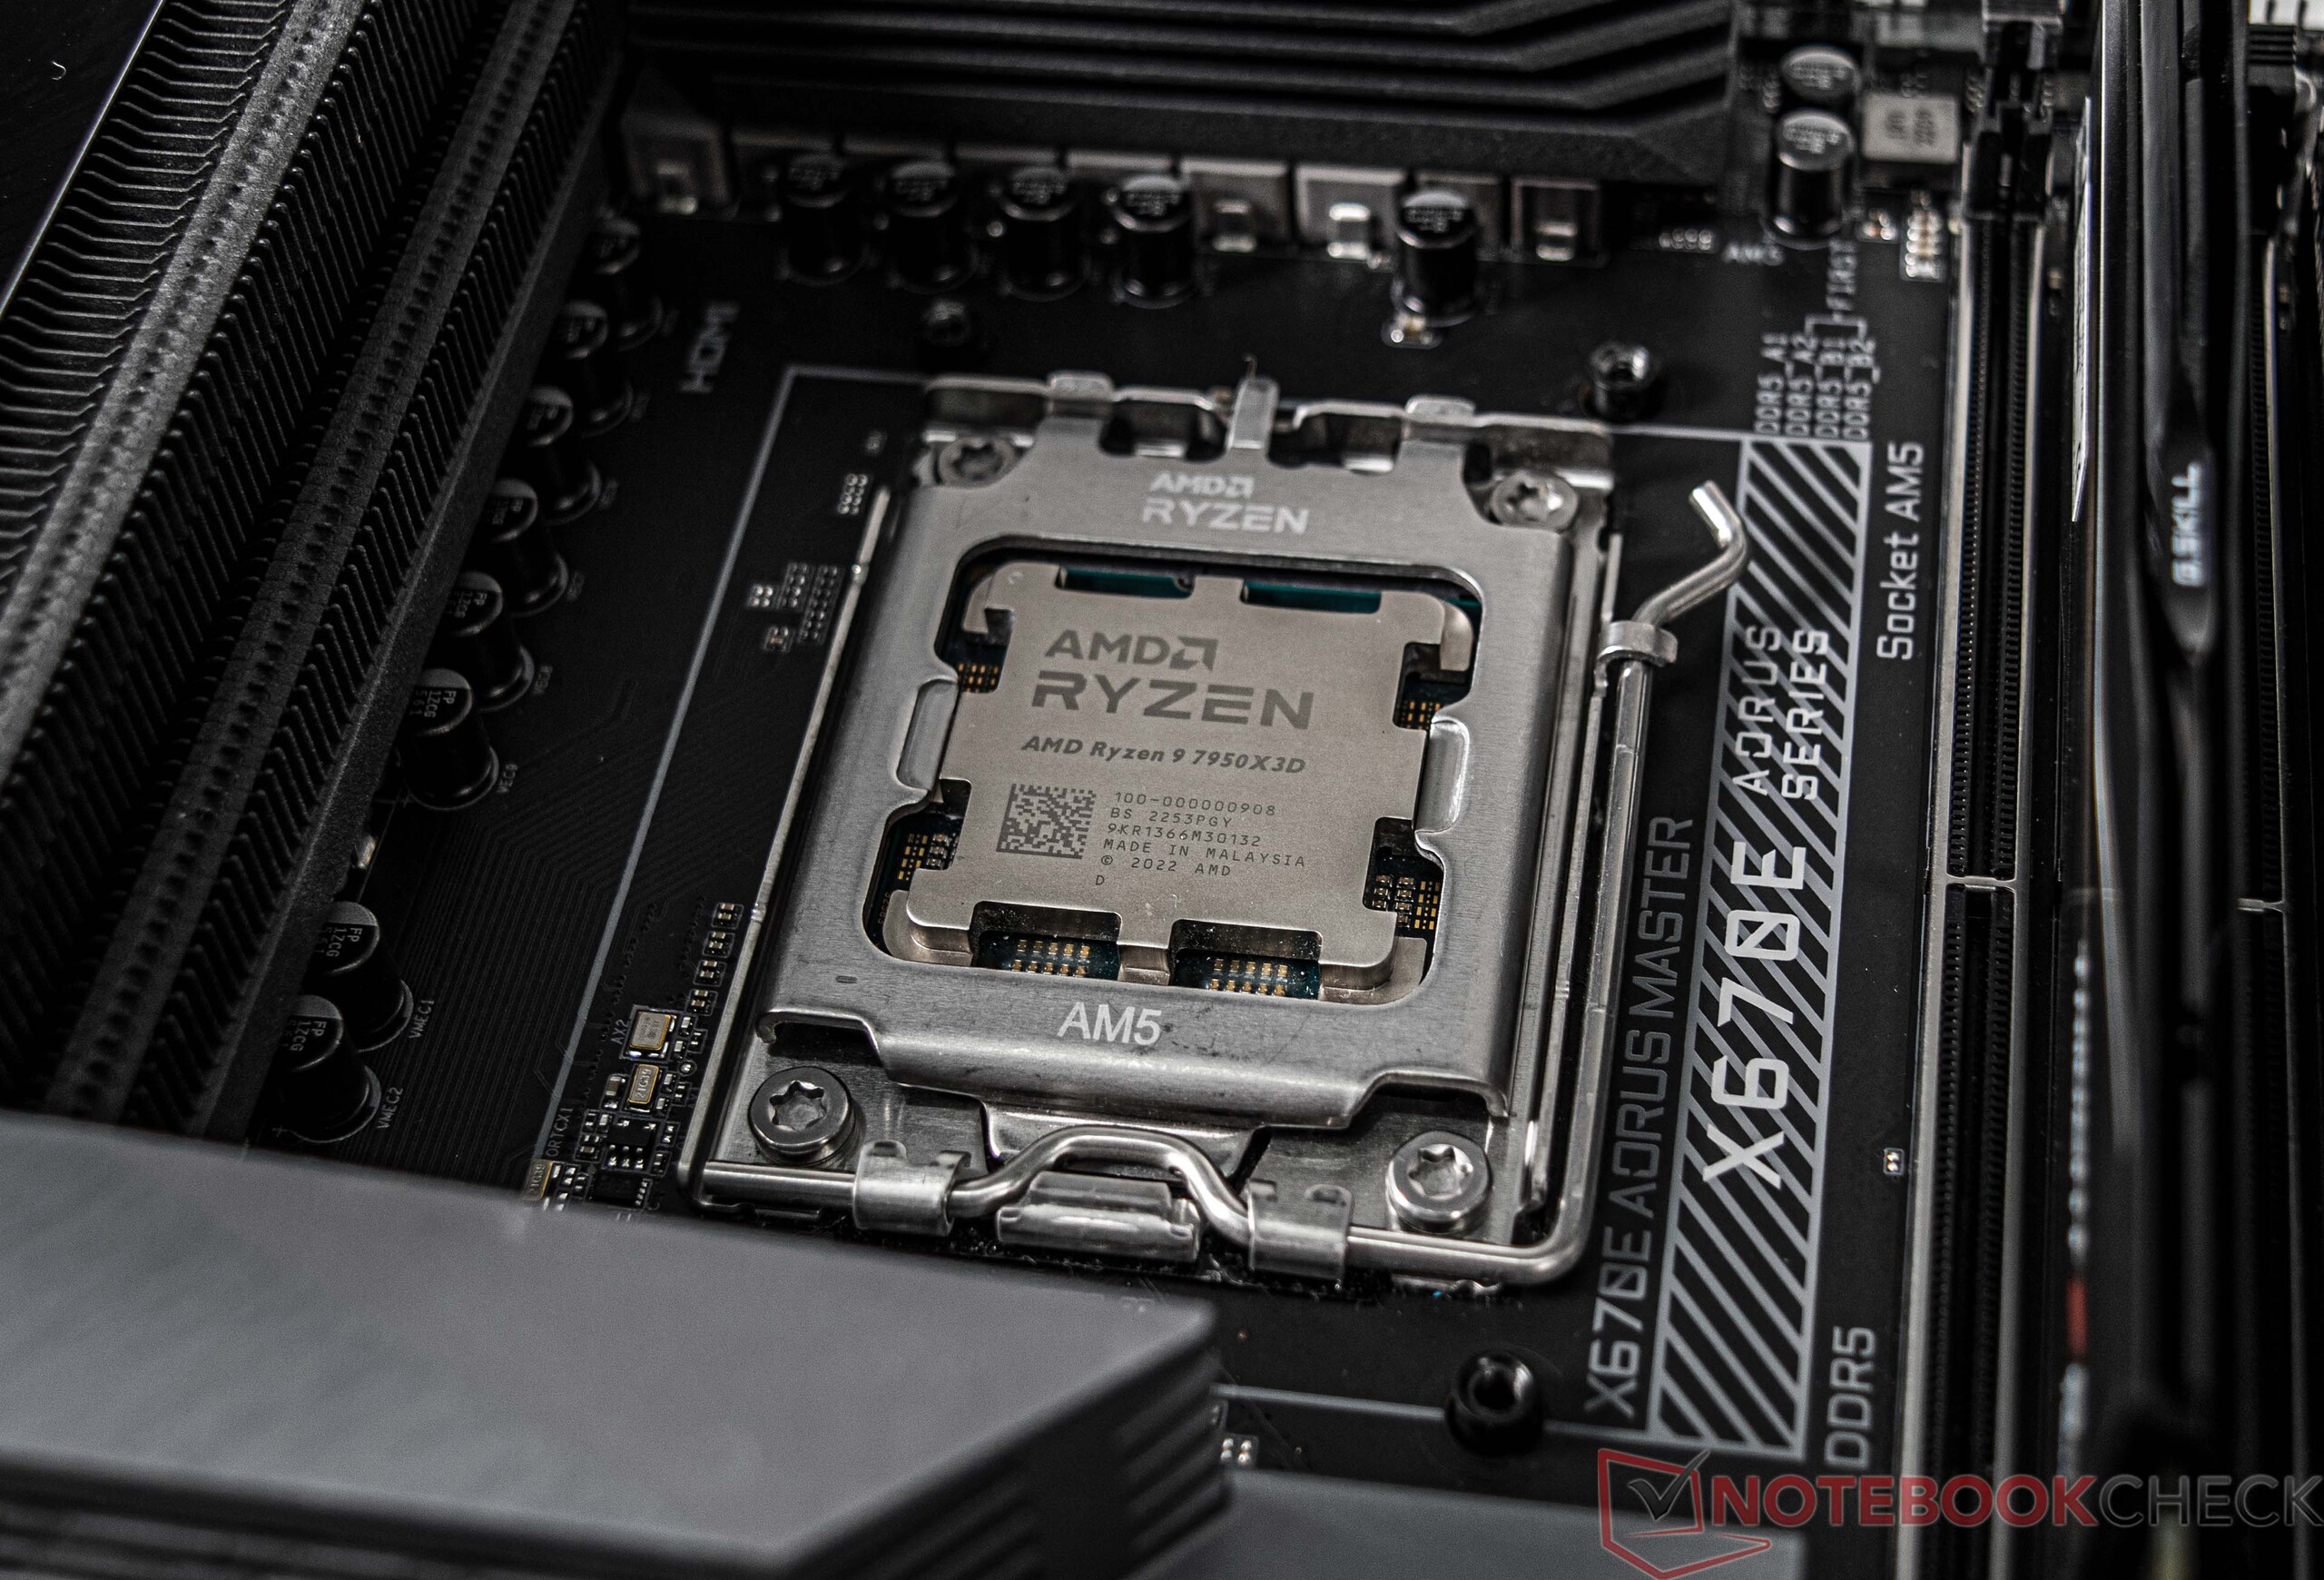
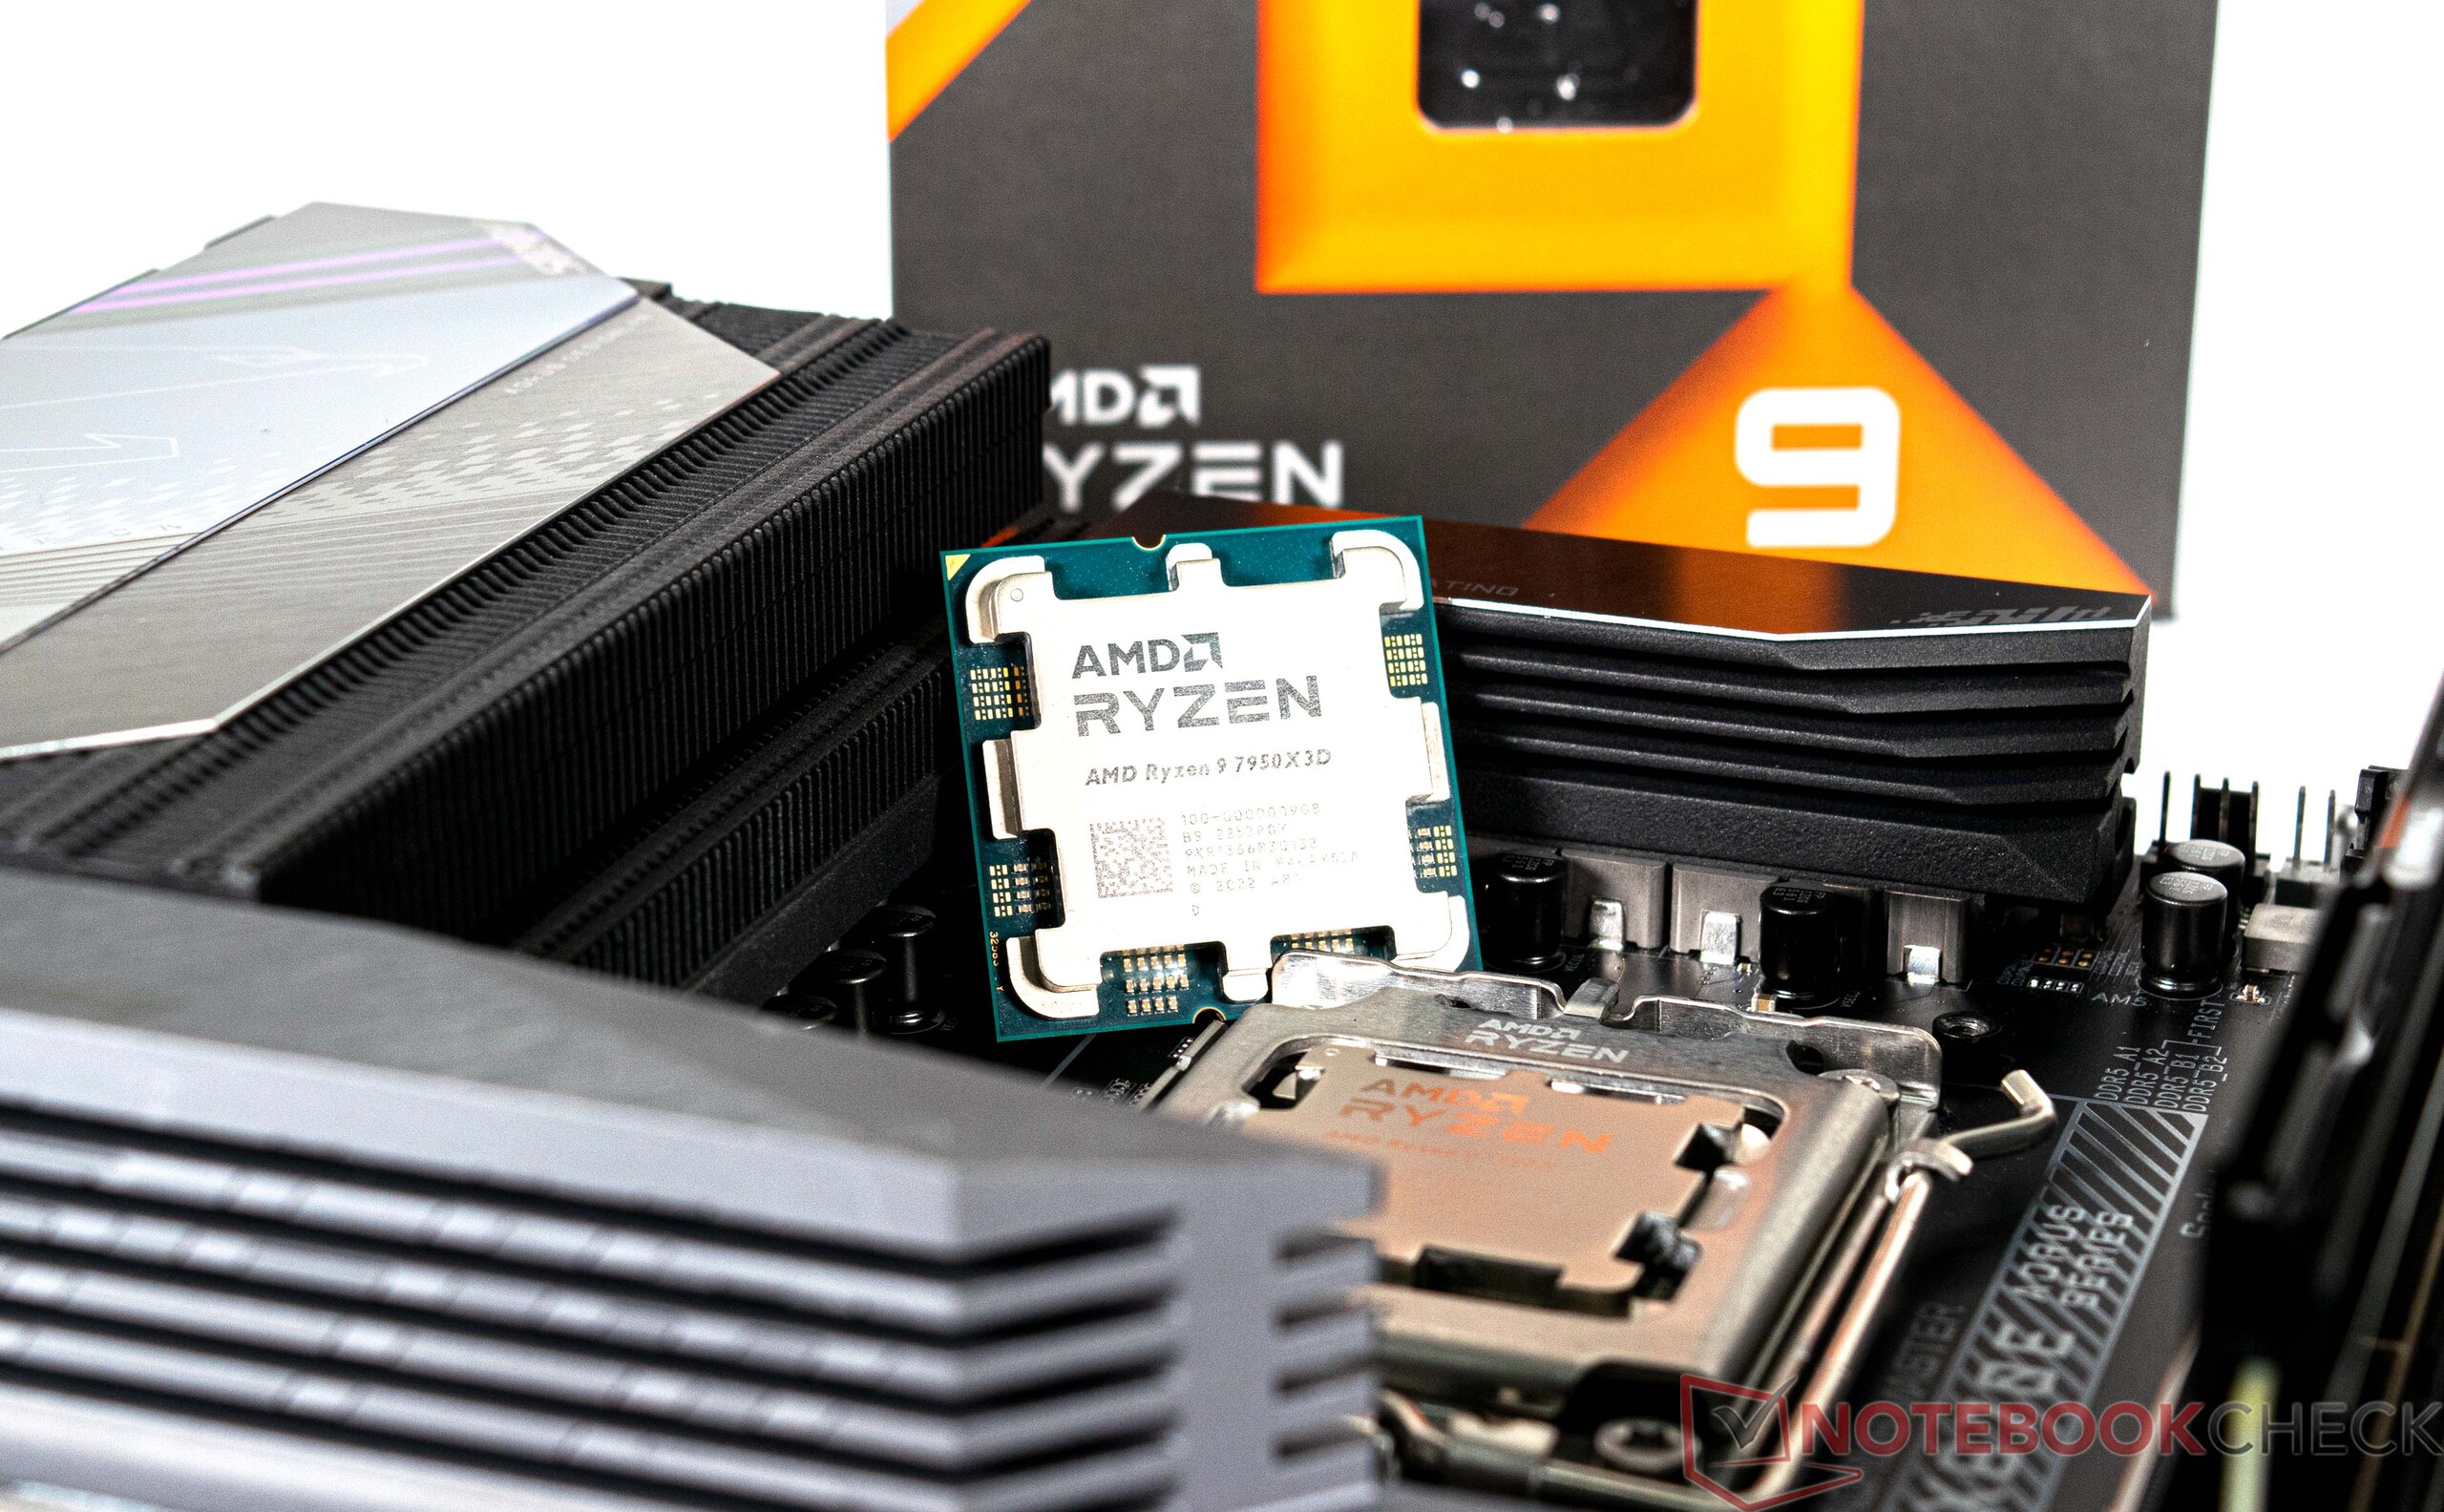
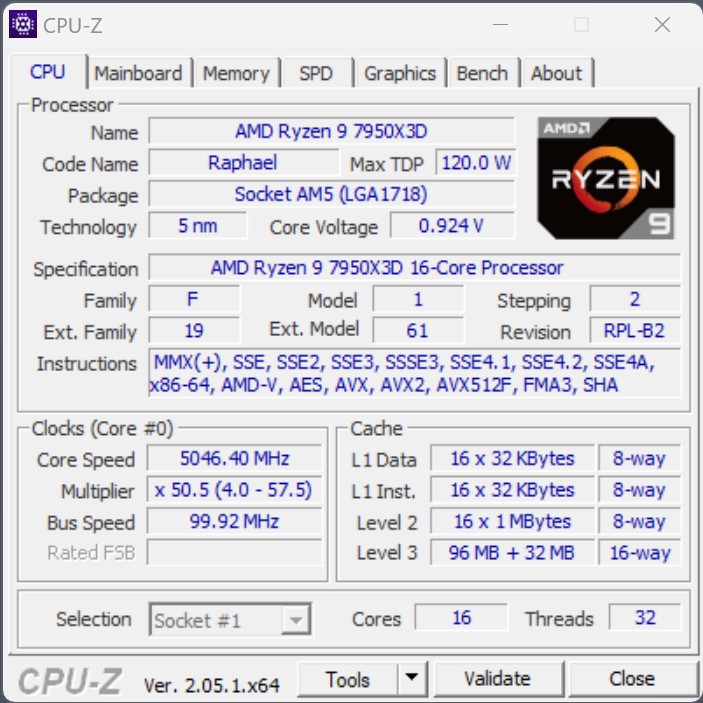
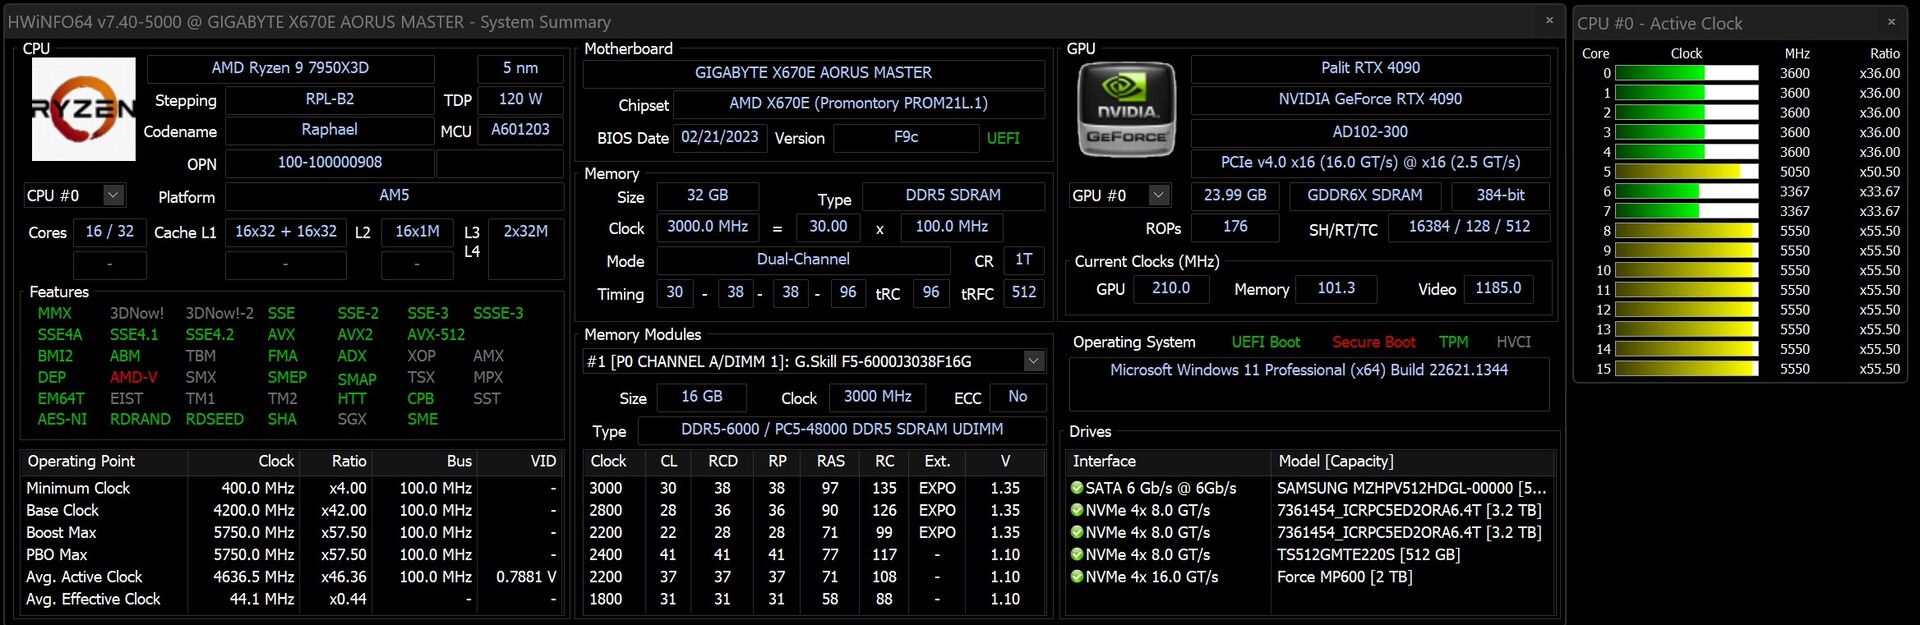
- AMD Ryzen 9 7950X3D
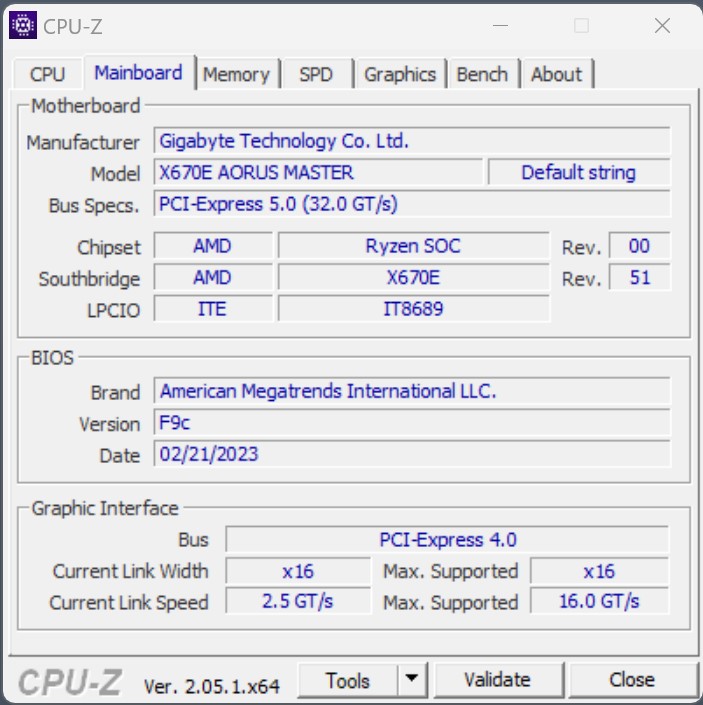
- Gigabyte X670E Aorus Master, BIOS: F9c
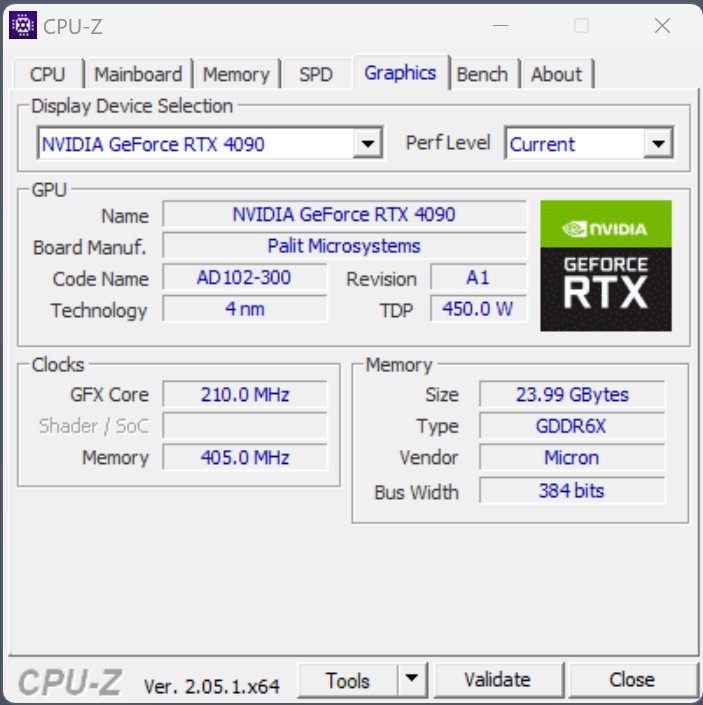
- Palit GeForce RTX 4090 GameRock OC
- Raffreddamento ad acqua ad anello personalizzato (pompa: Alphacool Aquastream XT Ultra, radiatore: Watercool MO-RA3 420 LT BLACK)
- EVGA SuperNOVA P+ 1.600W
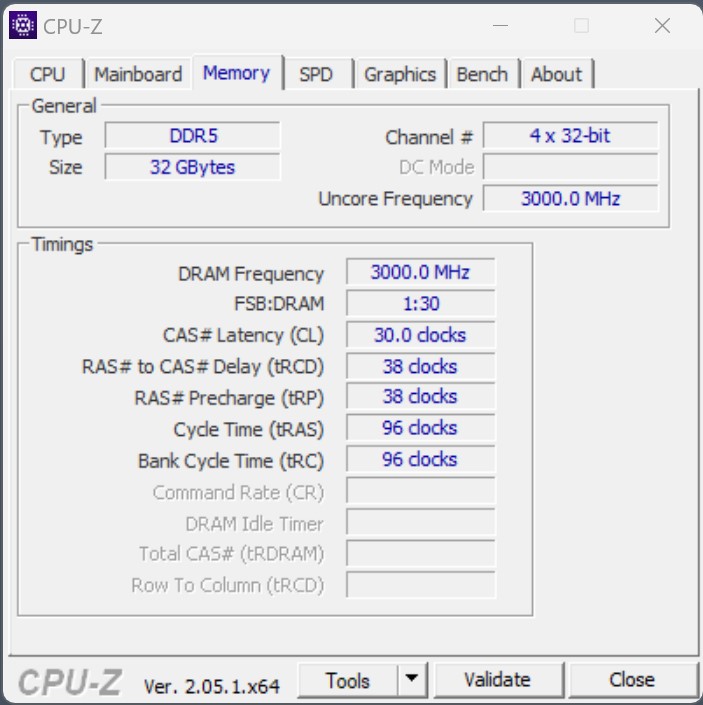
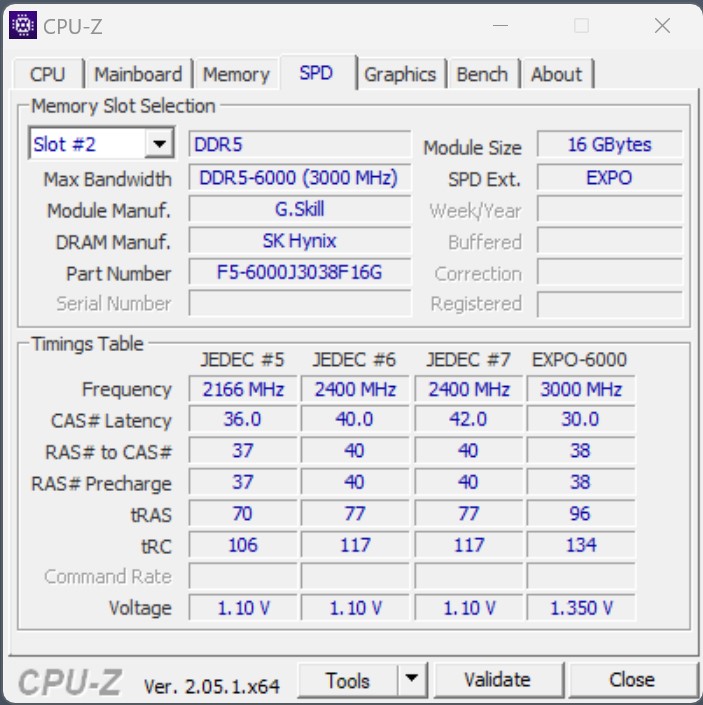
- G.Skill Trident Z5 Neo DDR5-6000 2x 16 GB, EXPO (DDR5-6000 CL30-38-38-96)
- SSD PCIe Intel Optane 905P da 480 GB
- Intel SSD DC P4618 PCIe 3.1 x8 6,4 TB (per i giochi)
- Microsoft Windows 11 Professional 64-Bit (versione 22H2)


Benchmark del processore
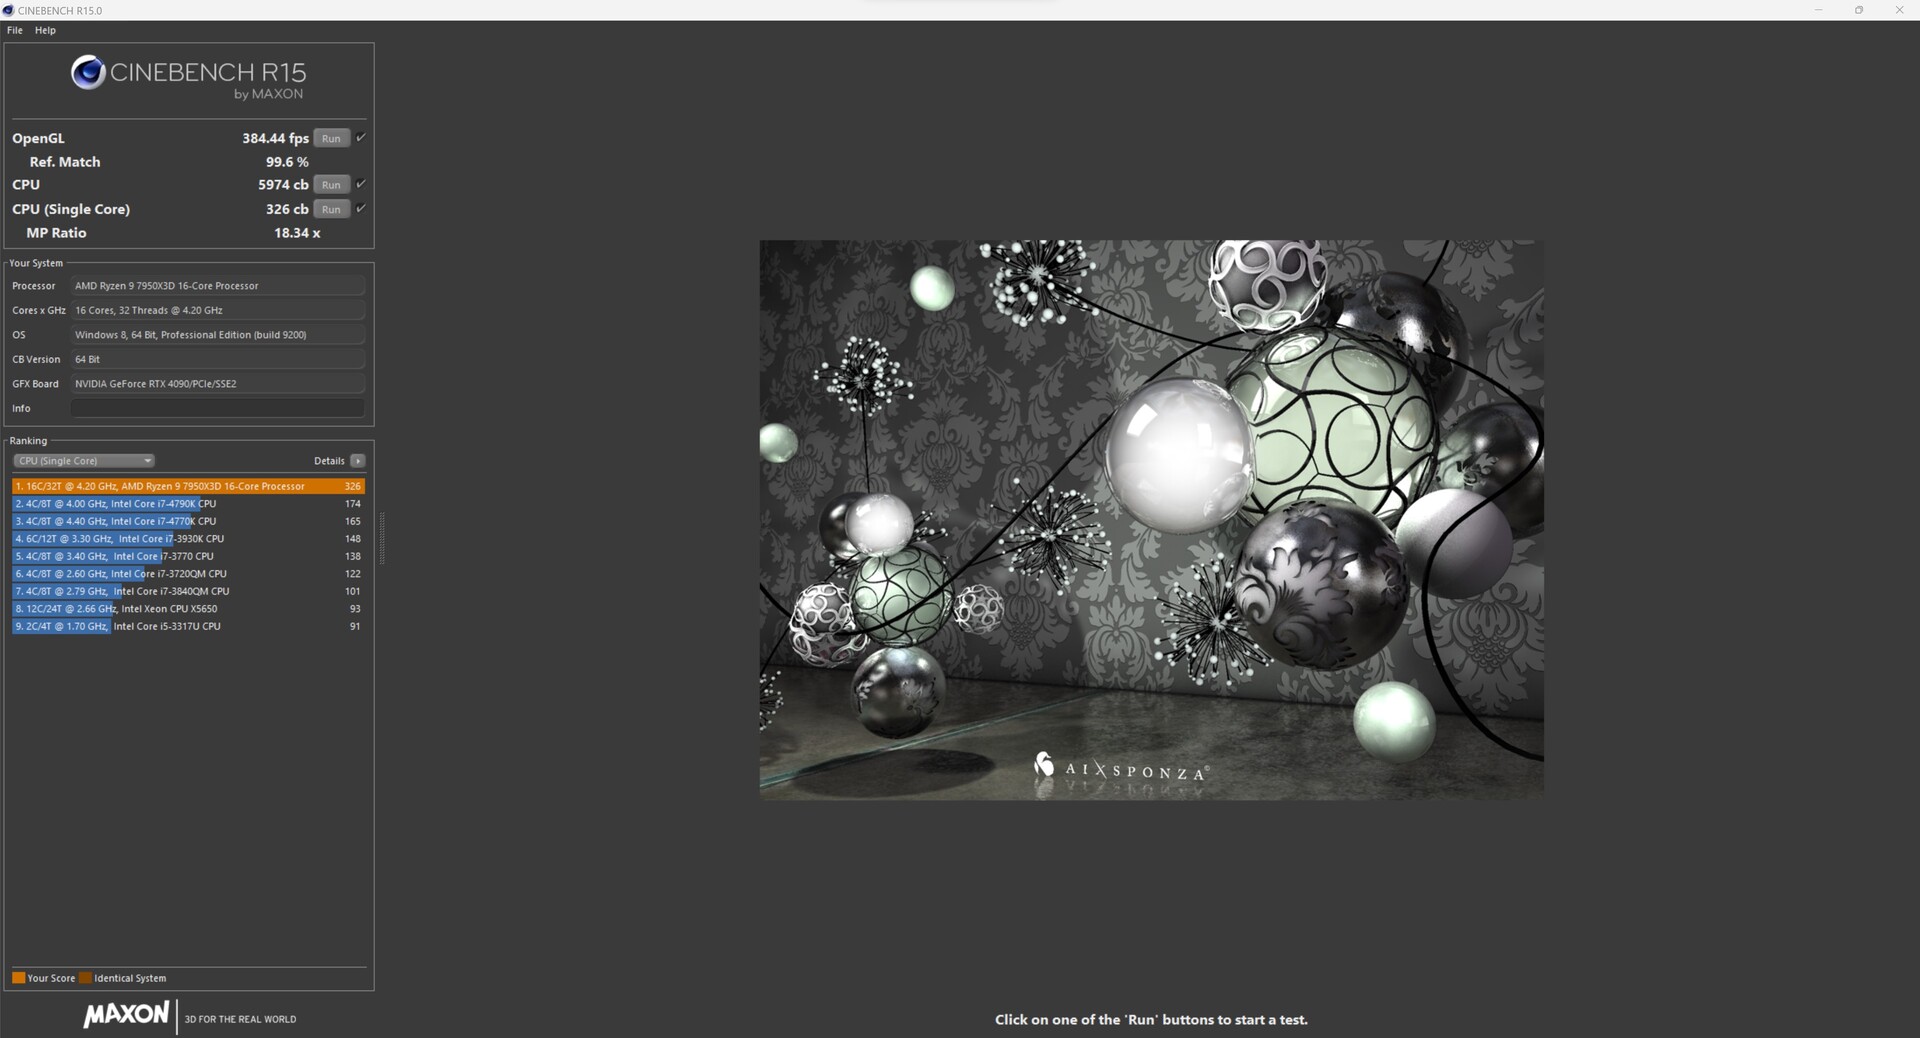
Abbiamo già avuto modo di farci un'idea delle enormi capacità prestazionali dell'AMD Ryzen 9 7950X AMD Ryzen 9 7950X. Allo stesso tempo, l'Intel Core i9-13900K era ancora leggermente più veloce in termini di prestazioni della CPU pura. Con l'AMD Ryzen 9 7950X3D eravamo ancora un po' scettici all'inizio, poiché il basso consumo energetico massimo della CPU ci poneva ancora qualche domanda. Ma dopo i primi test sulla CPU, siamo rimasti molto sorpresi dall'ottimo sviluppo delle prestazioni dell'AMD Ryzen 9 7950X3D. Nel complesso, è sufficiente per piazzarsi al secondo posto in questo confronto. Il precedente modello di punta di AMD, l'AMD Ryzen 9 7950X, deve ora accontentarsi del terzo posto. Allo stesso tempo, stiamo ancora vedendo un Intel Core i9-13900K in cima alle nostre classifiche di prestazioni. Tuttavia, il primo e il secondo posto sono separati da un solo punto percentuale, che soggettivamente non ha alcuna rilevanza nel funzionamento quotidiano.
Se si esaminano i singoli test, si possono notare alcuni punti di forza, ma anche punti deboli, che risultano in una buona media rispetto al Core i9-13900K di Intel. Utilizzando la V-Cache 3D, AMD è riuscita a migliorare leggermente l'IPC del processore a 16 core. Allo stesso tempo, si nota anche un leggero svantaggio nei benchmark multi-core, che può essere ricondotto a una velocità di clock inferiore sotto carico. Tuttavia, l'efficienza che AMD è riuscita a produrre con il suo nuovo Ryzen 9 7950X3D è ancora notevole. Per fare un confronto, senza limiti di potenza il Intel Core i9-13900Kè strozzato solo dalle temperature, che sotto carico raggiungono quasi sempre i 100 °C (212 °F). Ma non è stato solo qualche volta che abbiamo visto più di 300 watt nei nostri test nel test Cinebench R15 Multi. IlAMD Ryzen 9 7950X è stato un po' più efficiente, anche se ha quasi sempre raggiunto i 230 watt. Ora vediamo un AMD Ryzen 9 7950X3D che offre prestazioni altrettanto buone a soli 162 watt. Questo è sicuramente un percorso che va nella giusta direzione.
È possibile trovare ulteriori benchmark sui processori qui.
| Performance rating - Percent | |
| Intel Core i9-13900K | |
| AMD Ryzen 9 7950X | |
| AMD Ryzen 9 7950X3D | |
| Intel Core i7-13700K | |
| AMD Ryzen 9 7900X | |
| AMD Ryzen 9 5950X | |
| Cinebench R15 | |
| CPU Single 64Bit | |
| Intel Core i9-13900K | |
| AMD Ryzen 9 7950X3D | |
| AMD Ryzen 9 7900X | |
| AMD Ryzen 9 7950X | |
| Intel Core i7-13700K | |
| AMD Ryzen 9 5950X | |
| CPU Multi 64Bit | |
| AMD Ryzen 9 7950X | |
| Intel Core i9-13900K | |
| AMD Ryzen 9 7950X3D | |
| AMD Ryzen 9 7900X | |
| Intel Core i7-13700K | |
| AMD Ryzen 9 5950X | |
| Cinebench R20 | |
| CPU (Single Core) | |
| Intel Core i9-13900K | |
| Intel Core i7-13700K | |
| AMD Ryzen 9 7950X3D | |
| AMD Ryzen 9 7900X | |
| AMD Ryzen 9 7950X | |
| AMD Ryzen 9 5950X | |
| CPU (Multi Core) | |
| Intel Core i9-13900K | |
| AMD Ryzen 9 7950X | |
| AMD Ryzen 9 7950X3D | |
| Intel Core i7-13700K | |
| AMD Ryzen 9 7900X | |
| AMD Ryzen 9 5950X | |
| Cinebench R23 | |
| Single Core | |
| Intel Core i9-13900K | |
| Intel Core i7-13700K | |
| AMD Ryzen 9 7950X3D | |
| AMD Ryzen 9 7900X | |
| AMD Ryzen 9 7950X | |
| AMD Ryzen 9 5950X | |
| Multi Core | |
| Intel Core i9-13900K | |
| AMD Ryzen 9 7950X | |
| AMD Ryzen 9 7950X3D | |
| Intel Core i7-13700K | |
| AMD Ryzen 9 7900X | |
| AMD Ryzen 9 5950X | |
| Cinebench R11.5 | |
| CPU Single 64Bit | |
| Intel Core i9-13900K | |
| AMD Ryzen 9 7950X3D | |
| AMD Ryzen 9 7900X | |
| AMD Ryzen 9 7950X | |
| Intel Core i7-13700K | |
| AMD Ryzen 9 5950X | |
| CPU Multi 64Bit | |
| Intel Core i9-13900K | |
| AMD Ryzen 9 7950X | |
| AMD Ryzen 9 7950X3D | |
| AMD Ryzen 9 7900X | |
| Intel Core i7-13700K | |
| AMD Ryzen 9 5950X | |
| Blender - v2.79 BMW27 CPU | |
| AMD Ryzen 9 5950X | |
| AMD Ryzen 9 7900X | |
| Intel Core i7-13700K | |
| AMD Ryzen 9 7950X3D | |
| AMD Ryzen 9 7950X | |
| Intel Core i9-13900K | |
| wPrime 2.10 | |
| 32m | |
| AMD Ryzen 9 5950X | |
| Intel Core i7-13700K | |
| AMD Ryzen 9 7950X3D | |
| Intel Core i9-13900K | |
| AMD Ryzen 9 7900X | |
| AMD Ryzen 9 7950X | |
| 1024m | |
| Intel Core i7-13700K | |
| Intel Core i9-13900K | |
| AMD Ryzen 9 5950X | |
| AMD Ryzen 9 7900X | |
| AMD Ryzen 9 7950X3D | |
| AMD Ryzen 9 7950X | |
| X264 HD Benchmark 4.0 | |
| Pass 1 | |
| Intel Core i9-13900K | |
| Intel Core i7-13700K | |
| AMD Ryzen 9 7950X3D | |
| AMD Ryzen 9 7950X | |
| AMD Ryzen 9 7900X | |
| AMD Ryzen 9 5950X | |
| Pass 2 | |
| AMD Ryzen 9 7950X | |
| Intel Core i9-13900K | |
| AMD Ryzen 9 7950X3D | |
| AMD Ryzen 9 7900X | |
| Intel Core i7-13700K | |
| AMD Ryzen 9 5950X | |
| WinRAR - Result | |
| AMD Ryzen 9 7900X | |
| AMD Ryzen 9 7950X3D | |
| AMD Ryzen 9 7950X | |
| Intel Core i9-13900K | |
| Intel Core i7-13700K | |
| AMD Ryzen 9 5950X | |
| TrueCrypt | |
| AES Mean 100MB | |
| AMD Ryzen 9 7950X | |
| Intel Core i9-13900K | |
| AMD Ryzen 9 5950X | |
| AMD Ryzen 9 7950X3D | |
| Intel Core i7-13700K | |
| AMD Ryzen 9 7900X | |
| Twofish Mean 100MB | |
| Intel Core i9-13900K | |
| AMD Ryzen 9 7950X | |
| AMD Ryzen 9 7950X3D | |
| Intel Core i7-13700K | |
| AMD Ryzen 9 5950X | |
| AMD Ryzen 9 7900X | |
| Serpent Mean 100MB | |
| Intel Core i9-13900K | |
| AMD Ryzen 9 7950X | |
| AMD Ryzen 9 7950X3D | |
| AMD Ryzen 9 5950X | |
| Intel Core i7-13700K | |
| AMD Ryzen 9 7900X | |
| Geekbench 5.5 | |
| Multi-Core | |
| AMD Ryzen 9 7950X3D | |
| Intel Core i9-13900K | |
| AMD Ryzen 9 7950X | |
| AMD Ryzen 9 7900X | |
| Intel Core i7-13700K | |
| AMD Ryzen 9 5950X | |
| Single-Core | |
| AMD Ryzen 9 7950X3D | |
| Intel Core i9-13900K | |
| AMD Ryzen 9 7900X | |
| AMD Ryzen 9 7950X | |
| Intel Core i7-13700K | |
| AMD Ryzen 9 5950X | |
| Geekbench 5.0 | |
| 5.0 Multi-Core | |
| Intel Core i9-13900K | |
| AMD Ryzen 9 7950X3D | |
| AMD Ryzen 9 7950X | |
| AMD Ryzen 9 7900X | |
| Intel Core i7-13700K | |
| AMD Ryzen 9 5950X | |
| 5.0 Single-Core | |
| Intel Core i9-13900K | |
| AMD Ryzen 9 7900X | |
| AMD Ryzen 9 7950X3D | |
| AMD Ryzen 9 7950X | |
| Intel Core i7-13700K | |
| AMD Ryzen 9 5950X | |
| Geekbench 4.4 | |
| 64 Bit Single-Core Score | |
| Intel Core i9-13900K | |
| AMD Ryzen 9 7950X3D | |
| AMD Ryzen 9 7900X | |
| AMD Ryzen 9 7950X | |
| Intel Core i7-13700K | |
| AMD Ryzen 9 5950X | |
| 64 Bit Multi-Core Score | |
| AMD Ryzen 9 7950X3D | |
| Intel Core i9-13900K | |
| AMD Ryzen 9 7950X | |
| AMD Ryzen 9 7900X | |
| Intel Core i7-13700K | |
| AMD Ryzen 9 5950X | |
| 3DMark 11 - 1280x720 Performance Physics | |
| AMD Ryzen 9 7950X3D | |
| AMD Ryzen 9 7950X | |
| Intel Core i9-13900K | |
| Intel Core i7-13700K | |
| AMD Ryzen 9 7900X | |
| AMD Ryzen 9 5950X | |
| 7-Zip 18.03 | |
| 7z b 4 | |
| AMD Ryzen 9 7950X3D | |
| AMD Ryzen 9 7950X | |
| Intel Core i9-13900K | |
| AMD Ryzen 9 5950X | |
| AMD Ryzen 9 7900X | |
| Intel Core i7-13700K | |
| 7z b 4 -mmt1 | |
| AMD Ryzen 9 7950X3D | |
| AMD Ryzen 9 7900X | |
| AMD Ryzen 9 7950X | |
| Intel Core i9-13900K | |
| Intel Core i7-13700K | |
| AMD Ryzen 9 5950X | |
| HWBOT x265 Benchmark v2.2 - 4k Preset | |
| AMD Ryzen 9 7950X | |
| Intel Core i9-13900K | |
| AMD Ryzen 9 7950X3D | |
| AMD Ryzen 9 7900X | |
| Intel Core i7-13700K | |
| AMD Ryzen 9 5950X | |
| R Benchmark 2.5 - Overall mean | |
| AMD Ryzen 9 5950X | |
| Intel Core i7-13700K | |
| AMD Ryzen 9 7950X | |
| AMD Ryzen 9 7900X | |
| AMD Ryzen 9 7950X3D | |
| Intel Core i9-13900K | |
| LibreOffice - 20 Documents To PDF | |
| AMD Ryzen 9 5950X | |
| AMD Ryzen 9 7950X3D | |
| Intel Core i9-13900K | |
| AMD Ryzen 9 7950X | |
| AMD Ryzen 9 7900X | |
| Intel Core i7-13700K | |
| WebXPRT 3 - Overall | |
| AMD Ryzen 9 7950X3D | |
| AMD Ryzen 9 7900X | |
| Intel Core i9-13900K | |
| AMD Ryzen 9 7950X | |
| Intel Core i7-13700K | |
| AMD Ryzen 9 5950X | |
| Mozilla Kraken 1.1 - Total | |
| AMD Ryzen 9 5950X | |
| Intel Core i7-13700K | |
| AMD Ryzen 9 7950X | |
| AMD Ryzen 9 7950X3D | |
| Intel Core i9-13900K | |
| AMD Ryzen 9 7900X | |
| 3DMark | |
| 1920x1080 Fire Strike Physics | |
| Intel Core i9-13900K | |
| AMD Ryzen 9 7950X | |
| Intel Core i7-13700K | |
| AMD Ryzen 9 7950X3D | |
| AMD Ryzen 9 7900X | |
| AMD Ryzen 9 5950X | |
| 2560x1440 Time Spy CPU | |
| Intel Core i9-13900K | |
| Intel Core i7-13700K | |
| AMD Ryzen 9 7950X3D | |
| AMD Ryzen 9 7900X | |
| AMD Ryzen 9 7950X | |
| AMD Ryzen 9 5950X | |
* ... Meglio usare valori piccoli
AMD Ryzen 9 7950X3D vs. Cinebench R15 Multi loop
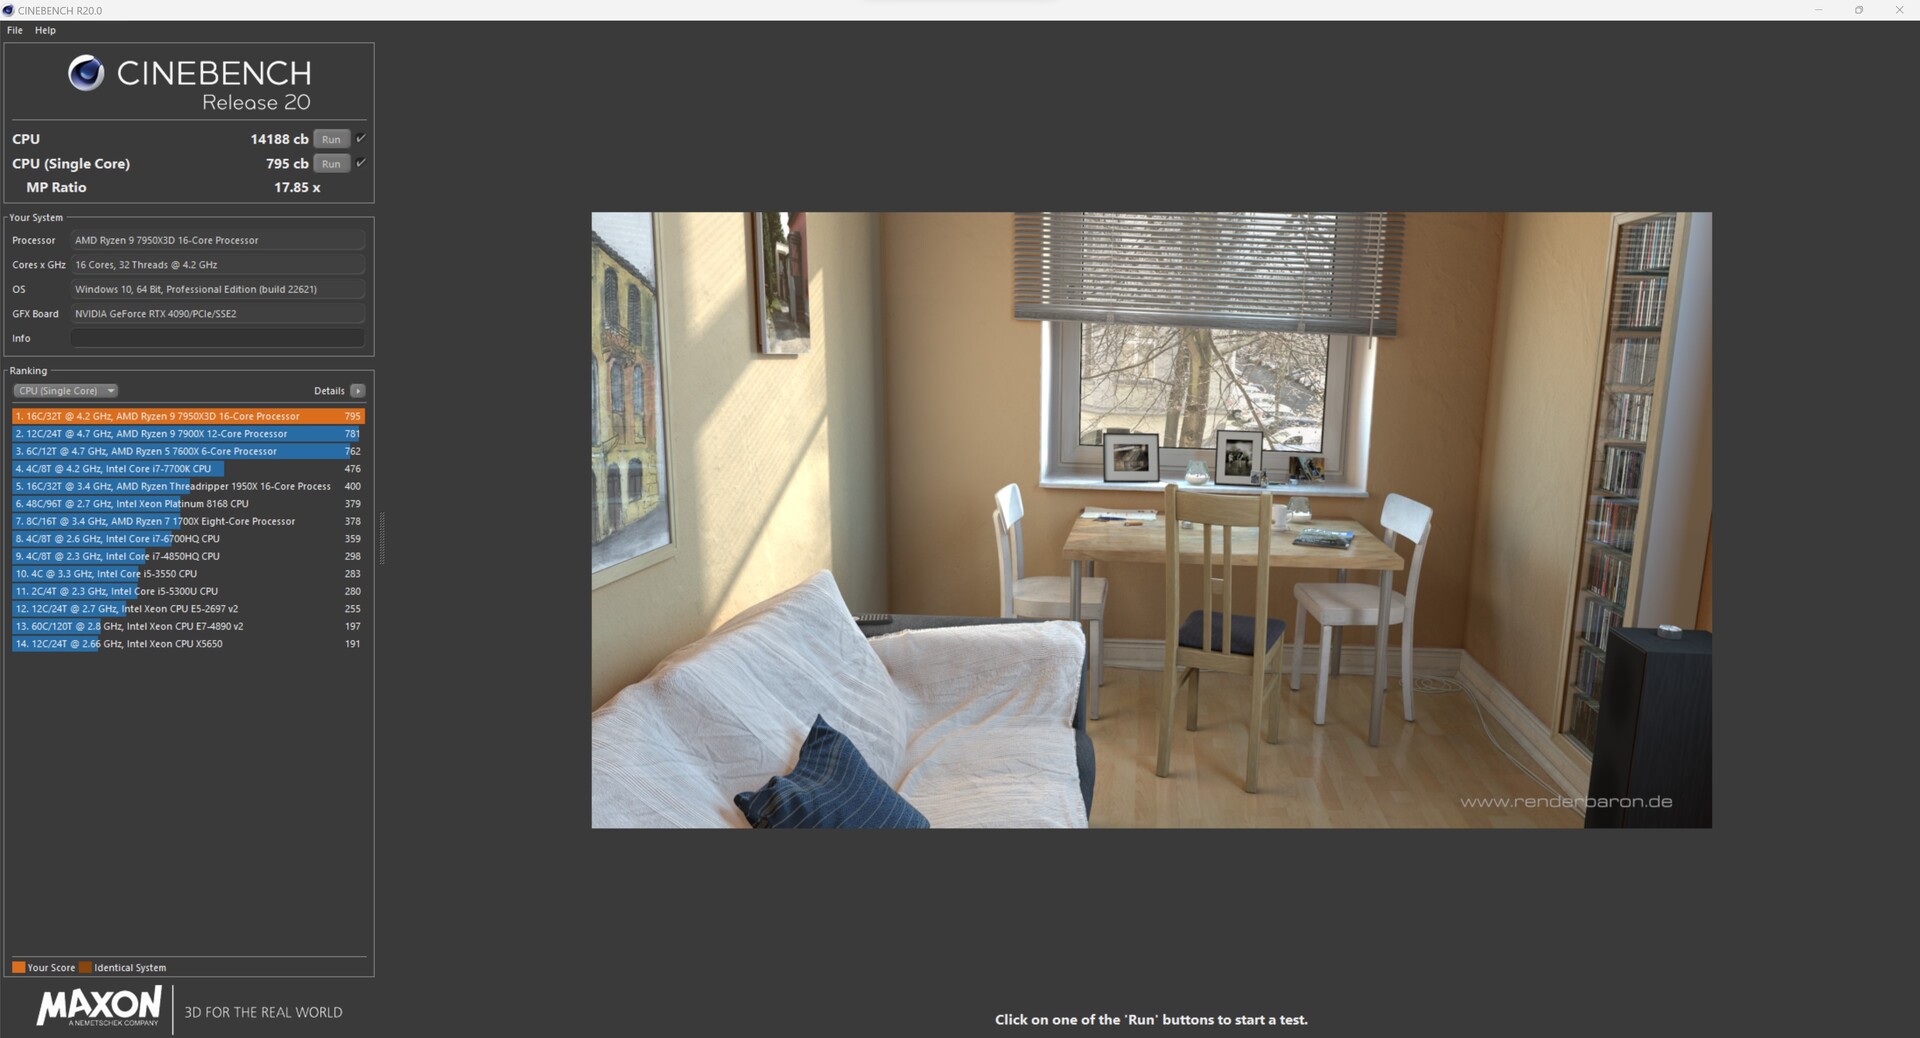
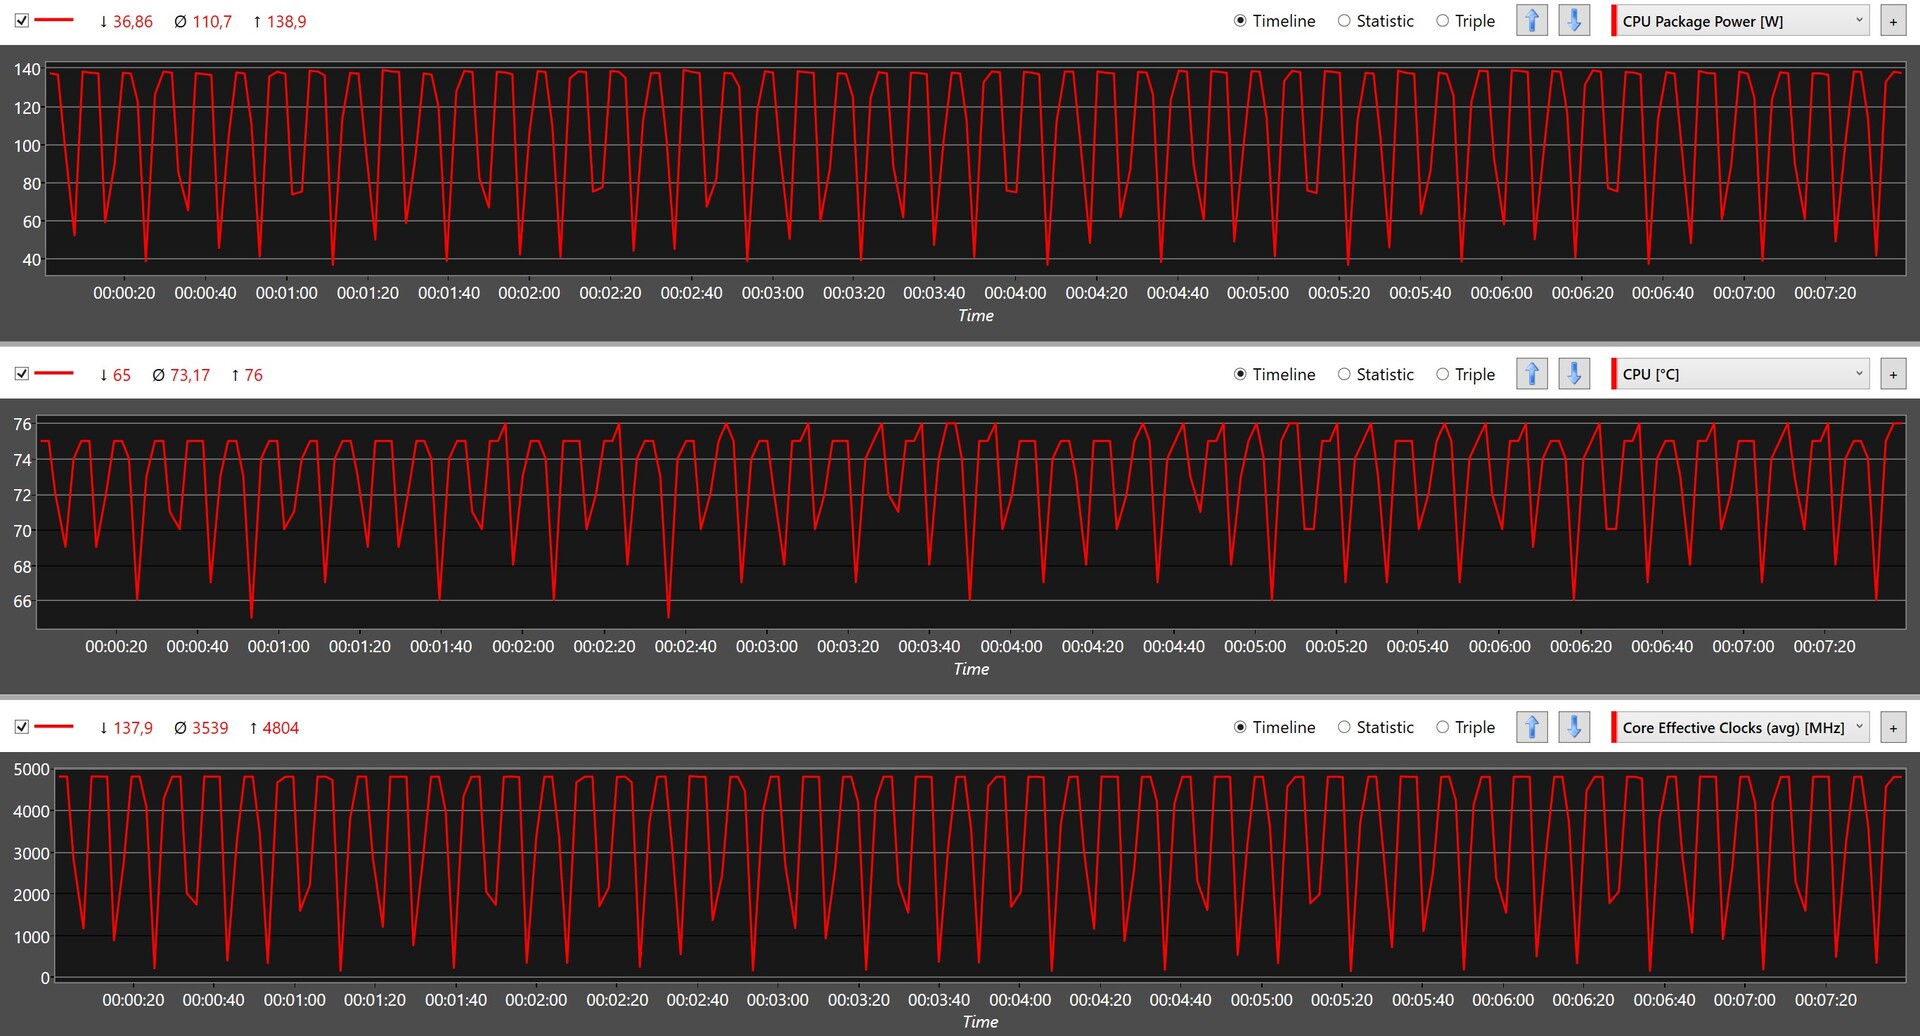
Le elevate prestazioni multithread riscontrate durante una singola esecuzione del test Cinebench R15 Multi possono essere mantenute costantemente anche nella nostra impostazione di test. Tutti i risultati del ciclo Cinebench R15 Multi variano solo in misura minima. Con una media di 5.942 punti, il nostro AMD Ryzen 9 7950X3D si posiziona al terzo posto in questo confronto, mentre l' AMD Ryzen 9 7950Xe Intel Core i9-13900Ksono ancora in grado di fornire prestazioni costanti leggermente superiori.
Benchmark sintetici e prestazioni delle applicazioni
Nei benchmark delle applicazioni sintetiche, vediamo un testa a testa simile tra tutti i modelli di punta. AMD Ryzen 9 7950X3D e AMD Ryzen 9 7950Xmostrano la stessa velocità nelle valutazioni delle prestazioni misurate, mentre con il Core i9-13900Kintel è di nuovo un piccolo passo avanti. Tuttavia, non si noterà alcuna differenza nel funzionamento quotidiano. Nei test sulla RAM, tutte le attuali CPU Ryzen 7000 beneficiano delle DDR5, che consentono di generare un throughput di dati significativamente più elevato. Anche i sistemi Intel che elenchiamo nel nostro confronto qui sono stati eseguiti con DDR5-RAM nei test di allora.
| Performance rating - Percent | |
| Intel Core i9-13900K | |
| AMD Ryzen 9 7950X | |
| AMD Ryzen 9 7950X3D | |
| Intel Core i7-13700K | |
| AMD Ryzen 9 7900X | |
| AMD Ryzen 9 5950X | |
| PCMark 10 | |
| Productivity | |
| AMD Ryzen 9 7950X3D | |
| AMD Ryzen 9 7950X | |
| Intel Core i7-13700K | |
| AMD Ryzen 9 7900X | |
| Intel Core i9-13900K | |
| AMD Ryzen 9 5950X | |
| Essentials | |
| Intel Core i9-13900K | |
| AMD Ryzen 9 7900X | |
| AMD Ryzen 9 7950X | |
| AMD Ryzen 9 7950X3D | |
| Intel Core i7-13700K | |
| AMD Ryzen 9 5950X | |
| 3DMark | |
| 1920x1080 Fire Strike Physics | |
| Intel Core i9-13900K | |
| AMD Ryzen 9 7950X | |
| Intel Core i7-13700K | |
| AMD Ryzen 9 7950X3D | |
| AMD Ryzen 9 7900X | |
| AMD Ryzen 9 5950X | |
| 2560x1440 Time Spy CPU | |
| Intel Core i9-13900K | |
| Intel Core i7-13700K | |
| AMD Ryzen 9 7950X3D | |
| AMD Ryzen 9 7900X | |
| AMD Ryzen 9 7950X | |
| AMD Ryzen 9 5950X | |
| 3DMark 11 - 1280x720 Performance Physics | |
| AMD Ryzen 9 7950X3D | |
| AMD Ryzen 9 7950X | |
| Intel Core i9-13900K | |
| Intel Core i7-13700K | |
| AMD Ryzen 9 7900X | |
| AMD Ryzen 9 5950X | |
| CrossMark - Overall | |
| Intel Core i9-13900K | |
| AMD Ryzen 9 7950X | |
| AMD Ryzen 9 7900X | |
| Intel Core i7-13700K | |
| AMD Ryzen 9 7950X3D | |
| AMD Ryzen 9 5950X | |
| AIDA64 / Memory Copy | |
| Intel Core i9-13900K | |
| AMD Ryzen 9 7950X3D | |
| Intel Core i7-13700K | |
| AMD Ryzen 9 7900X | |
| AMD Ryzen 9 7950X | |
| AMD Ryzen 9 5950X | |
| Media della classe (4514 - 234662, n=2223) | |
| AIDA64 / Memory Read | |
| Intel Core i9-13900K | |
| Intel Core i7-13700K | |
| AMD Ryzen 9 7950X3D | |
| AMD Ryzen 9 7950X | |
| AMD Ryzen 9 7900X | |
| AMD Ryzen 9 5950X | |
| Media della classe (4031 - 271066, n=2185) | |
| AIDA64 / Memory Write | |
| AMD Ryzen 9 7950X3D | |
| AMD Ryzen 9 7900X | |
| AMD Ryzen 9 7950X | |
| Intel Core i9-13900K | |
| Intel Core i7-13700K | |
| Media della classe (3506 - 242868, n=2190) | |
| AMD Ryzen 9 5950X | |
| AIDA64 / Memory Latency | |
| Media della classe (6.1 - 536, n=2251) | |
| Intel Core i9-13900K | |
| Intel Core i7-13700K | |
| AMD Ryzen 9 5950X | |
| AMD Ryzen 9 7950X3D | |
| AMD Ryzen 9 7950X | |
| AMD Ryzen 9 7900X | |
* ... Meglio usare valori piccoli
Parametri di gioco
Nei test di gioco, diamo un'occhiata alla parte probabilmente più interessante, dato che l'AMD Ryzen 9 7950X3D si rivolge chiaramente al settore dei giochi di fascia alta. In questa classe di prezzo, il processore si rivolge esclusivamente agli appassionati, analogamente a quanto fa Intel con i suoi modelli Core i9. Nel confronto diretto, l'AMD Ryzen 9 7950X3D supera l'Intel Core i9-13900K Intel Core i9-13900Ked è in grado di ottenere un vantaggio del 9% nei giochi che abbiamo messo a confronto. Rispetto al AMD Ryzen 9 7950Xvediamo un aumento delle prestazioni di circa il 6%, ma questo rappresenta una media. Quando ci avviciniamo al limite assoluto della CPU a 720p, il nuovo AMD Ryzen 9 7950X3D è in grado di aumentare le prestazioni del 20% in alcuni casi. Misurato con il preset 4K Ultra, il vantaggio scompare a causa del limite della GPU.
Tuttavia, di tanto in tanto troviamo anche alcuni giochi che non sono in grado di gestire in modo ottimale la V-Cache 3D. A volte, questo potrebbe anche essere legato a un'assegnazione errata dei core della CPU, ad esempio quando i giochi supportano solo 4 core. La combinazione di un AMD Ryzen 9 7950X3D e della Nvidia GeForce RTX 4090 è la migliore che si possa attualmente configurare in ambito consumer. Non sorprende quindi che tutti i giochi che abbiamo testato possano essere riprodotti senza problemi anche a 2.160p con le impostazioni di dettaglio massime.
Gaming Performance in Direct Comparison with Intel
| Performance rating - Percent | |
| AMD Ryzen 9 7950X3D | |
| AMD Ryzen 9 7950X | |
| Intel Core i9-13900K | |
| Intel Core i7-13700K | |
| F1 22 | |
| 1920x1080 Low Preset AA:T AF:16x | |
| AMD Ryzen 9 7950X3D | |
| AMD Ryzen 9 7950X | |
| Intel Core i9-13900K | |
| Intel Core i7-13700K | |
| 3840x2160 Ultra High Preset AA:T AF:16x | |
| AMD Ryzen 9 7950X | |
| Intel Core i7-13700K | |
| AMD Ryzen 9 7950X3D | |
| Intel Core i9-13900K | |
| Far Cry 5 | |
| 1280x720 Low Preset AA:T | |
| AMD Ryzen 9 7950X3D | |
| AMD Ryzen 9 7950X | |
| Intel Core i7-13700K | |
| Intel Core i9-13900K | |
| 3840x2160 Ultra Preset AA:T | |
| AMD Ryzen 9 7950X3D | |
| AMD Ryzen 9 7950X | |
| Intel Core i9-13900K | |
| Intel Core i7-13700K | |
| X-Plane 11.11 | |
| 1280x720 low (fps_test=1) | |
| Intel Core i9-13900K | |
| AMD Ryzen 9 7950X3D | |
| Intel Core i7-13700K | |
| AMD Ryzen 9 7950X | |
| 3840x2160 high (fps_test=3) | |
| AMD Ryzen 9 7950X3D | |
| Intel Core i9-13900K | |
| AMD Ryzen 9 7950X | |
| Intel Core i7-13700K | |
| Final Fantasy XV Benchmark | |
| 1280x720 Lite Quality | |
| Intel Core i7-13700K | |
| AMD Ryzen 9 7950X | |
| Intel Core i9-13900K | |
| AMD Ryzen 9 7950X3D | |
| 3840x2160 High Quality | |
| AMD Ryzen 9 7950X3D | |
| AMD Ryzen 9 7950X | |
| Intel Core i7-13700K | |
| Intel Core i9-13900K | |
| Dota 2 Reborn | |
| 1280x720 min (0/3) fastest | |
| AMD Ryzen 9 7950X3D | |
| AMD Ryzen 9 7950X | |
| Intel Core i9-13900K | |
| Intel Core i7-13700K | |
| 3840x2160 ultra (3/3) best looking | |
| AMD Ryzen 9 7950X3D | |
| AMD Ryzen 9 7950X | |
| Intel Core i9-13900K | |
| Intel Core i7-13700K | |
| The Witcher 3 | |
| 1024x768 Low Graphics & Postprocessing | |
| AMD Ryzen 9 7950X3D | |
| AMD Ryzen 9 7950X | |
| Intel Core i9-13900K | |
| Intel Core i7-13700K | |
| 3840x2160 High Graphics & Postprocessing (Nvidia HairWorks Off) | |
| AMD Ryzen 9 7950X | |
| Intel Core i9-13900K | |
| Intel Core i7-13700K | |
| AMD Ryzen 9 7950X3D | |
| F1 2021 | |
| 3840x2160 Ultra High Preset + Raytracing AA:T AF:16x | |
| AMD Ryzen 9 7950X3D | |
| Intel Core i7-13700K | |
| Intel Core i9-13900K | |
| AMD Ryzen 9 7950X | |
| 1280x720 Ultra Low Preset | |
| AMD Ryzen 9 7950X3D | |
| AMD Ryzen 9 7950X | |
| Intel Core i9-13900K | |
| Intel Core i7-13700K | |
| Shadow of the Tomb Raider | |
| 1280x720 Lowest Preset | |
| AMD Ryzen 9 7950X3D | |
| AMD Ryzen 9 7950X | |
| Intel Core i9-13900K | |
| Intel Core i7-13700K | |
| 3840x2160 Highest Preset AA:T | |
| Intel Core i7-13700K | |
| AMD Ryzen 9 7950X3D | |
| AMD Ryzen 9 7950X | |
| Intel Core i9-13900K | |
| GRID Legends | |
| 1280x720 Low Preset | |
| AMD Ryzen 9 7950X | |
| Intel Core i9-13900K | |
| Intel Core i7-13700K | |
| AMD Ryzen 9 7950X3D | |
| 3840x2160 Ultra Preset | |
| AMD Ryzen 9 7950X | |
| AMD Ryzen 9 7950X3D | |
| Intel Core i7-13700K | |
| Intel Core i9-13900K | |
| Borderlands 3 | |
| 1280x720 Very Low Overall Quality (DX11) | |
| AMD Ryzen 9 7950X3D | |
| Intel Core i9-13900K | |
| AMD Ryzen 9 7950X | |
| Intel Core i7-13700K | |
| 3840x2160 Badass Overall Quality (DX11) | |
| Intel Core i7-13700K | |
| AMD Ryzen 9 7950X3D | |
| AMD Ryzen 9 7950X | |
| Intel Core i9-13900K | |
| Tiny Tina's Wonderlands | |
| 1280x720 Lowest Preset (DX12) | |
| AMD Ryzen 9 7950X3D | |
| AMD Ryzen 9 7950X | |
| Intel Core i9-13900K | |
| Intel Core i7-13700K | |
| 3840x2160 Badass Preset (DX12) | |
| AMD Ryzen 9 7950X3D | |
| Intel Core i7-13700K | |
| AMD Ryzen 9 7950X | |
| Intel Core i9-13900K | |
| God of War | |
| 1280x720 Low Preset | |
| AMD Ryzen 9 7950X3D | |
| AMD Ryzen 9 7950X | |
| Intel Core i9-13900K | |
| Intel Core i7-13700K | |
| 3840x2160 Ultra Preset | |
| AMD Ryzen 9 7950X3D | |
| Intel Core i7-13700K | |
| Intel Core i9-13900K | |
| AMD Ryzen 9 7950X | |
| Far Cry New Dawn | |
| 1280x720 Low Preset | |
| AMD Ryzen 9 7950X3D | |
| Intel Core i9-13900K | |
| Intel Core i7-13700K | |
| AMD Ryzen 9 7950X | |
| 3840x2160 Ultra Preset | |
| AMD Ryzen 9 7950X3D | |
| Intel Core i9-13900K | |
| AMD Ryzen 9 7950X | |
| Intel Core i7-13700K | |
| Far Cry 6 | |
| 1280x720 Low Graphics Quality | |
| AMD Ryzen 9 7950X3D | |
| AMD Ryzen 9 7950X | |
| Intel Core i9-13900K | |
| Intel Core i7-13700K | |
| 3840x2160 Ultra Graphics Quality + HD Textures AA:T | |
| AMD Ryzen 9 7950X3D | |
| AMD Ryzen 9 7950X | |
| Intel Core i7-13700K | |
| Intel Core i9-13900K | |
AMD Ryzen 9 7950X3D with Nvidia GeForce RTX 4090
| basso | medio | alto | ultra | QHD | 4K DLSS | 4K | |
|---|---|---|---|---|---|---|---|
| GTA V (2015) | 188 | 187.6 | 187.5 | 160.2 | 160.9 | 186.5 | |
| The Witcher 3 (2015) | 864.7 | 825.1 | 657.2 | 305 | 275.2 | ||
| Dota 2 Reborn (2015) | 314.1 | 287.6 | 285 | 252.7 | 245.4 | ||
| Final Fantasy XV Benchmark (2018) | 234 | 233 | 232 | 225 | 157.6 | ||
| X-Plane 11.11 (2018) | 225 | 215 | 187.1 | 158.4 | |||
| Far Cry 5 (2018) | 299 | 269 | 262 | 248 | 246 | 182 | |
| Strange Brigade (2018) | 672 | 543 | 532 | 524 | 501 | 285 | |
| Shadow of the Tomb Raider (2018) | 383 | 371 | 372 | 361 | 315 | 187.6 | |
| Far Cry New Dawn (2019) | 255 | 225 | 218 | 199 | 200 | 171 | |
| Metro Exodus (2019) | 293 | 260 | 224 | 193.5 | 178.9 | 139.4 | |
| Control (2019) | 240 | 240 | 240 | 218 | 137.1 | 112.5 | |
| Borderlands 3 (2019) | 308 | 273 | 255 | 242 | 223 | 136.4 | |
| F1 2020 (2020) | 594 | 503 | 496 | 453 | 425 | 288 | |
| F1 2021 (2021) | 682 | 642 | 526 | 271 | 271 | 203 | |
| Far Cry 6 (2021) | 255 | 233 | 215 | 208 | 202 | 140.9 | |
| Guardians of the Galaxy (2021) | 266 | 266 | 266 | 266 | 265 | 193 | |
| Forza Horizon 5 (2021) | 357 | 283 | 275 | 214 | 201 | 166 | |
| God of War (2022) | 356 | 330 | 279 | 208 | 180.1 | 130.1 | |
| GRID Legends (2022) | 289 | 269 | 245 | 234 | 233 | 196.8 | |
| Cyberpunk 2077 1.6 (2022) | 252 | 248.4 | 238.5 | 238.2 | 167.3 | 82.6 | |
| Tiny Tina's Wonderlands (2022) | 477 | 395 | 328 | 299 | 234 | 131.3 | |
| F1 22 (2022) | 475 | 444 | 417 | 204 | 158.9 | 82.3 | |
| The Quarry (2022) | 444 | 345 | 302 | 263 | 195.2 | 81.6 | |
| A Plague Tale Requiem (2022) | 203 | 197.9 | 184.4 | 162.3 | 124.9 | 150.2 | 77 |
| Uncharted Legacy of Thieves Collection (2022) | 150.2 | 149.2 | 145.3 | 145.6 | 144 | 103.9 | |
| Call of Duty Modern Warfare 2 2022 (2022) | 334 | 301 | 249 | 241 | 191 | 185 | 129 |
| Spider-Man Miles Morales (2022) | 214 | 206 | 187.3 | 187.2 | 179.9 | 130 | |
| The Callisto Protocol (2022) | 282.1 | 269 | 264.9 | 230.6 | 195.1 | 126.4 | |
| High On Life (2023) | 437 | 390 | 331 | 300 | 224 | 107 | |
| The Witcher 3 v4 (2023) | 351 | 305 | 245 | 226 | 223 | 149.6 | |
| Dead Space Remake (2023) | 286 | 281 | 261 | 258 | 199.3 | 106.5 | |
| Hogwarts Legacy (2023) | 181.8 | 166 | 143.1 | 132.1 | 130.2 | 77.5 | |
| Returnal (2023) | 283 | 281 | 258 | 235 | 187 | 119 | |
| Atomic Heart (2023) | 331 | 279 | 262 | 230 | 184 | 111.8 | |
| Company of Heroes 3 (2023) | 414 | 393.9 | 362.7 | 356.3 | 315.9 | 213.9 | |
| Sons of the Forest (2023) | 156 | 151.5 | 145.5 | 145.3 | 140.8 | 128 |
Consumo energetico - Sorprendentemente efficiente
Siamo già rimasti positivamente sorpresi dalle prestazioni dell'AMD Ryzen 9 7950X3D. Inoltre, non dobbiamo dimenticare che AMD specifica un TDP di soli 120 watt per tutti gli attuali modelli X3D. I modelli X più assetati di energia sono in grado di consumare fino a 50 watt in più, con un massimo di 170 watt, quando i limiti di potenza sono attivi.
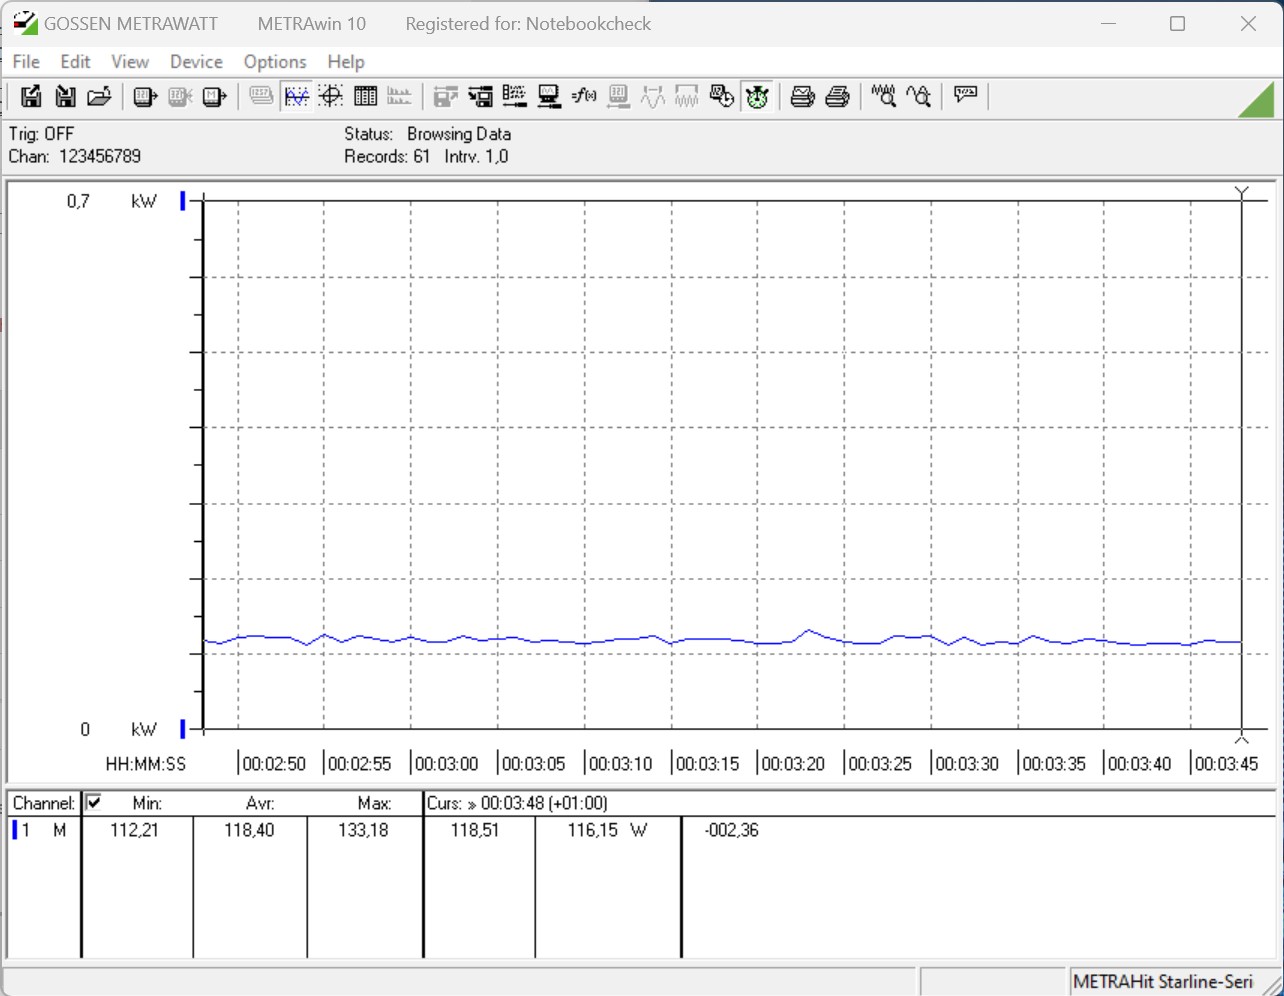
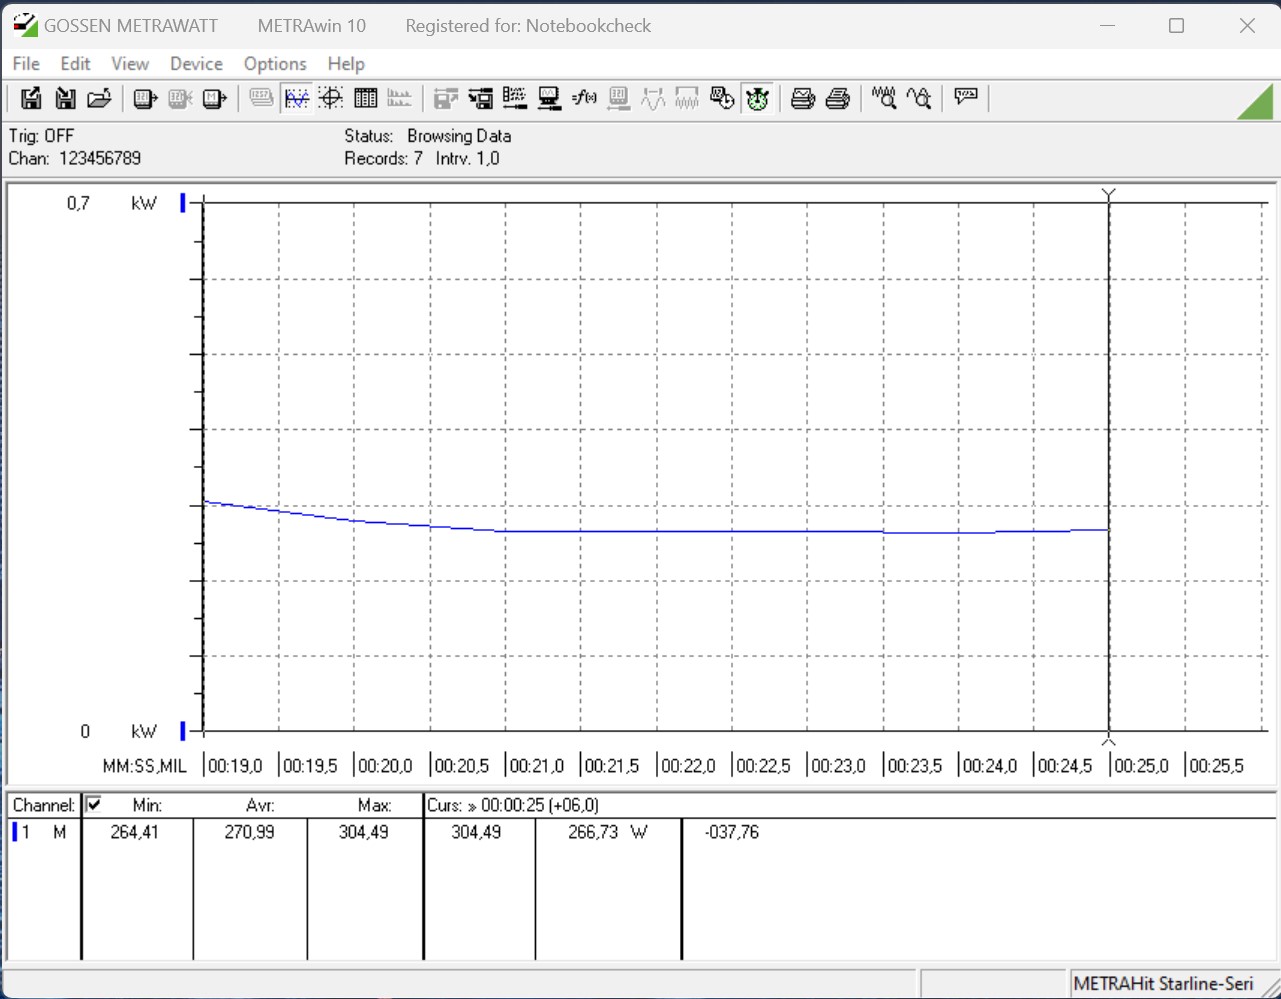
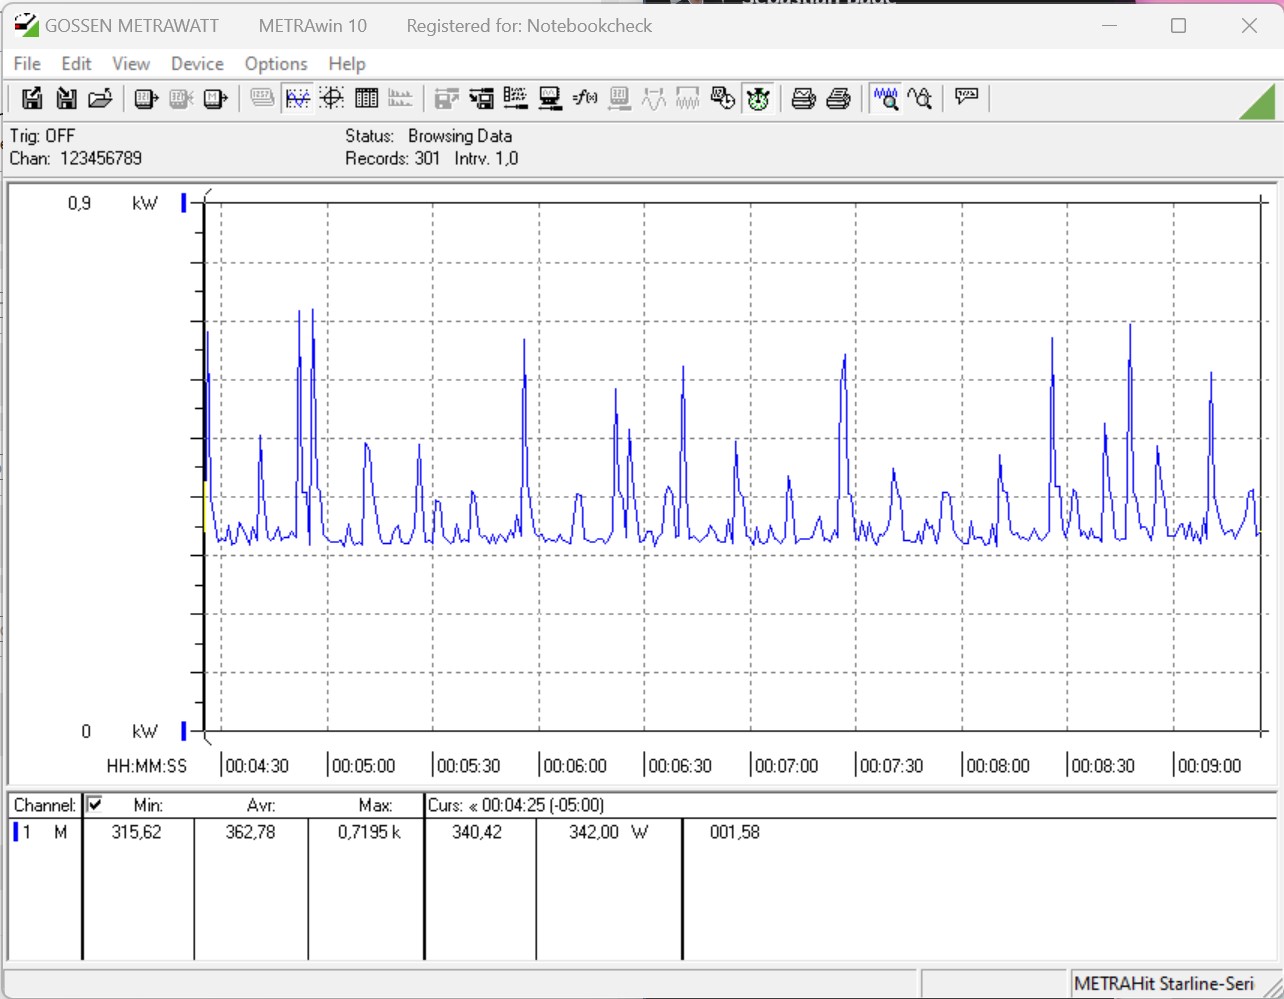
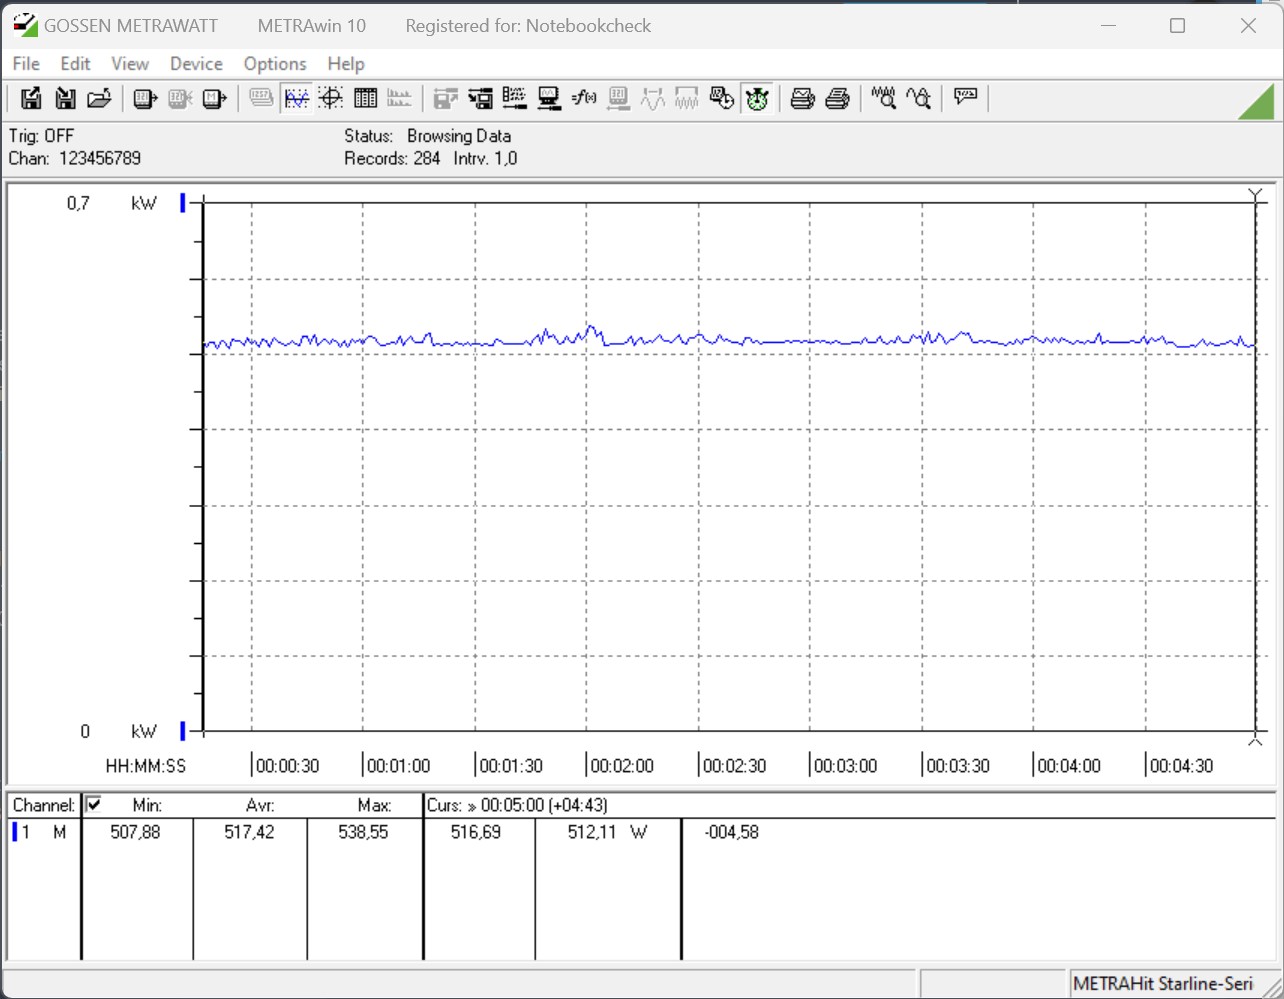
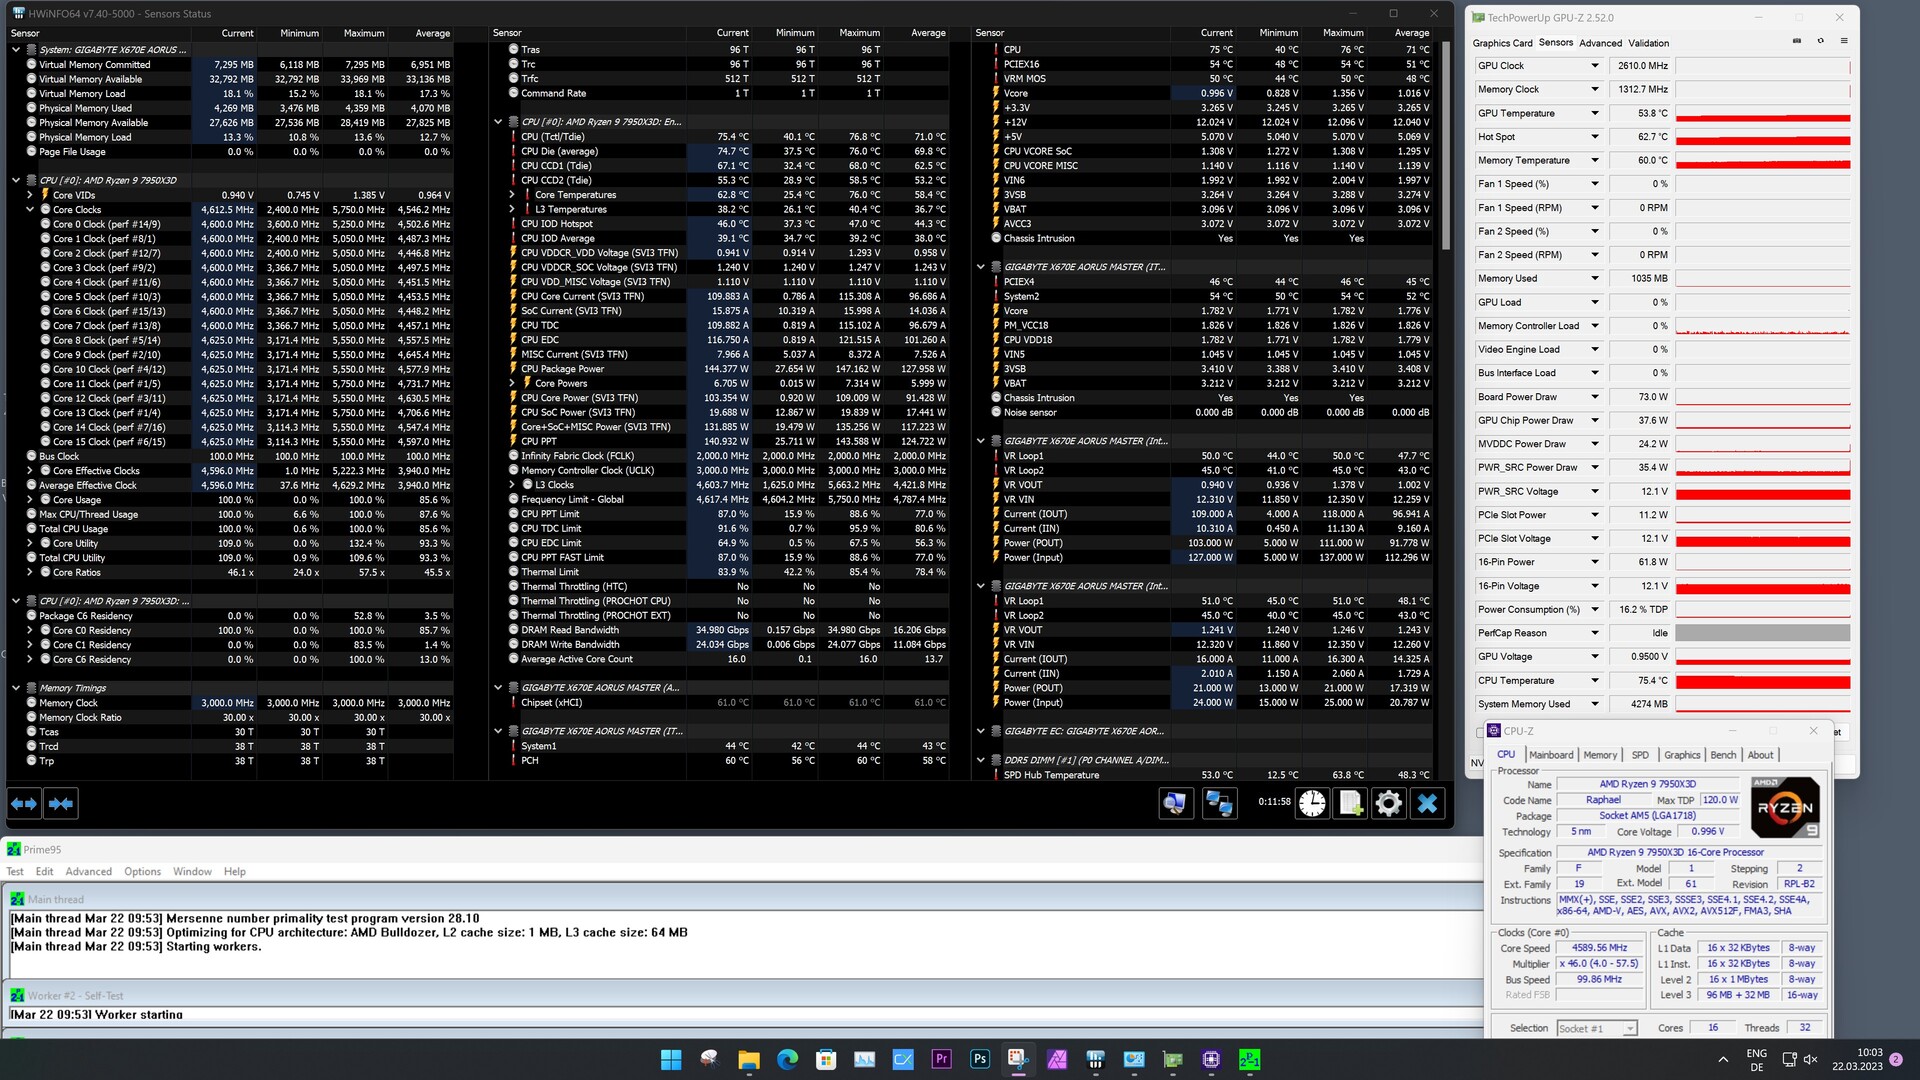
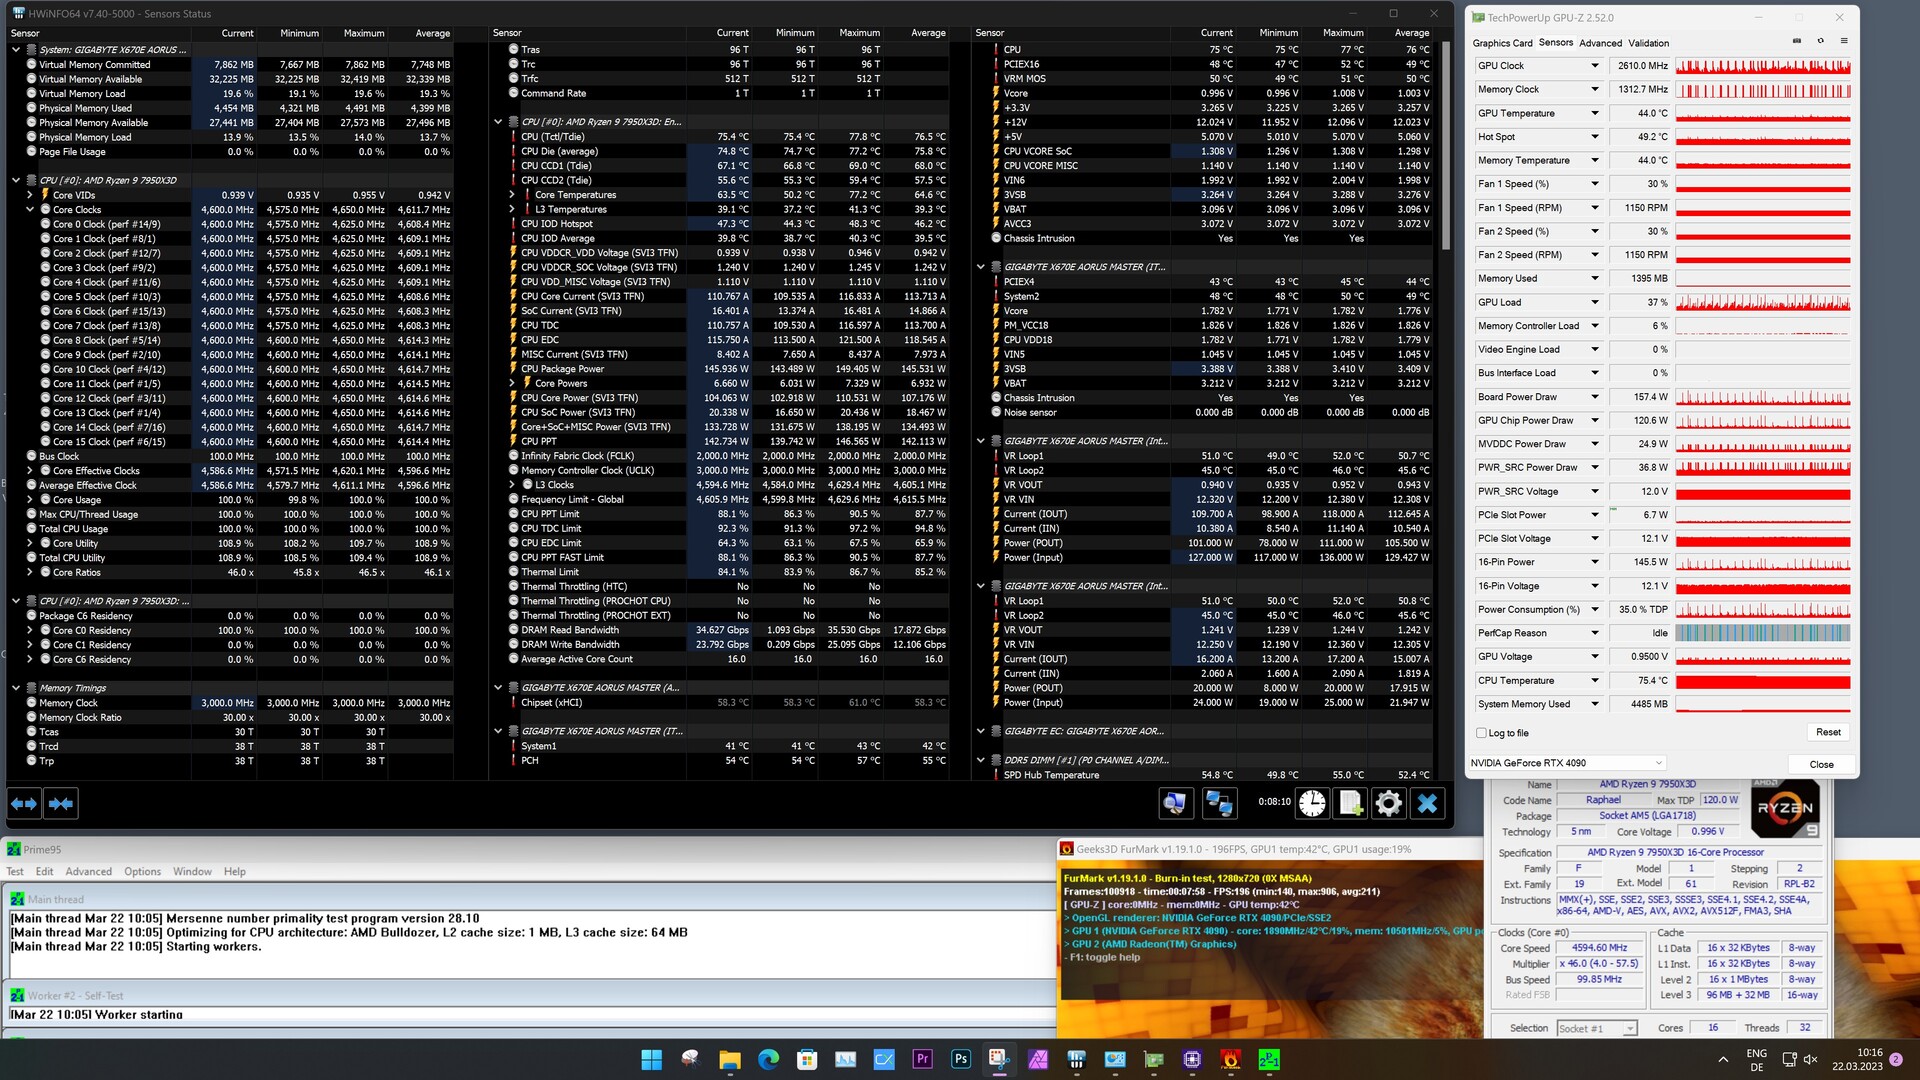
Tuttavia, durante il funzionamento in idle notiamo un consumo relativamente alto, superiore a 100 watt, con la nostra scheda madre di prova (Gigabyte X670E Aorus Master). Ma il nostro disincanto iniziale è seguito solo da risultati positivi, e con soli 273 watt nel test Cinebench R15 Multi, misuriamo un consumo significativamente inferiore a quello dei concorrenti di questa classe di prezzo. Questo si nota anche nello stress test Prime95 e durante i giochi. Tuttavia, quest'ultimo non è molto impegnativo per la CPU, quindi il vantaggio per l' Intel Core i9-13900Kè significativamente minore. La Nvidia GeForce RTX 4090 assicura la maggior parte del vantaggio durante il gioco.
Rispetto al Intel Core i9-13900Kvediamo un'efficienza significativamente superiore nell'AMD Ryzen 9 7950X3D. Considerando il risultato del test Cinebench R15 Multi, l'ammiraglia AMD viene superata, ma con 21,9 punti per watt, il più recente processore a 16 core è significativamente più avanti rispetto al concorrente Intel. Per fare un confronto, l'Intel Core i9-13900K raggiunge solo 12,9 punti per watt.
Grazie al basso consumo energetico massimo, anche il sistema di raffreddamento può risultare un po' più piccolo. Tuttavia, bisogna anche tenere presente che AMD ha fissato 89 °C (192 °F) come temperatura massima per l'AMD Ryzen 9 7950X3D, prima che la CPU debba essere strozzata. NelAMD Ryzen 9 7950Xil limite di temperatura era ancora di 95 °C (203 °F). IlIntel Core i9-13900Kè soggetto a throttling solo a partire da 100 °C (212 °F) quando i limiti di potenza sono disattivati. Durante il nostro stress test, non abbiamo mai superato il limite di 80 °C (176 °F) nella nostra impostazione di test, ma il responsabile è il buon raffreddamento. Nella stessa impostazione del test, ilAMD Ryzen 9 7900Xè diventato significativamente più caldo, raggiungendo più di 90 °C (194 °F). Il nostro consiglio per un raffreddamento adeguato va quindi a una soluzione AiO 240 o a un potente raffreddatore ad aria. Il Noctua NH-D15 si raccomanda in questo caso, se si vuole evitare di utilizzare una soluzione AiO.
| Power Consumption / Cinebench R15 Multi (external Monitor) | |
| Intel Core i9-13900K | |
| AMD Ryzen 9 7950X (Idle: 95.2 W) | |
| Intel Core i7-13700K | |
| AMD Ryzen 9 7900X | |
| AMD Ryzen 9 7950X3D | |
| AMD Ryzen 9 5950X (Idle: 78 W) | |
| Power Consumption / Cinebench R15 Multi Efficiency (external Monitor) | |
| AMD Ryzen 9 7950X3D | |
| AMD Ryzen 9 5950X | |
| AMD Ryzen 9 7950X | |
| AMD Ryzen 9 7900X | |
| Intel Core i9-13900K | |
| Power Consumption / Prime95 V2810 Stress (external Monitor) | |
| Intel Core i9-13900K | |
| Intel Core i7-13700K | |
| AMD Ryzen 9 7950X (Idle: 95.2 W) | |
| AMD Ryzen 9 7900X | |
| AMD Ryzen 9 7950X3D | |
| AMD Ryzen 9 5950X (Idle: 78 W) | |
| Power Consumption / The Witcher 3 ultra (external Monitor) | |
| AMD Ryzen 9 7900X | |
| AMD Ryzen 9 7950X (Idle: 95.2 W) | |
| Intel Core i7-13700K | |
| Intel Core i9-13900K | |
| AMD Ryzen 9 7950X3D | |
| AMD Ryzen 9 5950X (Idle: 78 W) | |
* ... Meglio usare valori piccoli
Power Consumption With External Monitor
Pro
Contro
Verdetto - Estremamente veloce e molto efficiente
Il nuovo socket AM5 non è disponibile sul mercato da molto tempo e AMD offre già nuove e più veloci CPU. Dopo la presentazione iniziale al CES di gennaio 2023, le aspettative sulle prestazioni dei nuovi processori X3D erano elevate. Nel nostro attuale test dell'AMD Ryzen 9 7950X3D, abbiamo stabilito che AMD ha fatto molte cose giuste, anche se i costi della piattaforma sono relativamente alti, a patto che si tratti di una base X670. A causa del requisito di DDR5, è necessario pagare di più per la memoria di lavoro rispetto al costo di DDR4.
Le prestazioni dell'AMD Ryzen 9 7950X3D sono convincenti, anche se le prestazioni multi-core pure risultano leggermente peggiori rispetto alla concorrenza. Nei giochi, l'AMD Ryzen 9 7950X3D è ancora una volta in grado di compensare questa situazione, piazzandosi al primo posto con un chiaro vantaggio. La differenza maggiore si nota in termini di consumo energetico. Nei nostri test, l'AMD Ryzen 9 7950X3D si rivela una CPU estremamente efficiente. Le prestazioni non sono affatto inferiori a quelle degli attuali modelli di punta e sotto carico l'AMD Ryzen 9 7950X3D è sempre significativamente più efficiente in termini di consumo energetico. Per questo motivo, non sarà necessario disporre di un sistema di raffreddamento molto potente, poiché è molto più facile controllare l'AMD Ryzen 9 7950X3D sotto carico rispetto a un Intel Core i9-13900k o AMD Ryzen 9 7950X.
Il Ryzen 9 7950X3D di AMD offre prestazioni eccellenti in tutti i settori ed è inoltre quasi sempre molto efficiente, una tendenza che ci è spesso sfuggita di recente.
Per riassumere, notiamo che con l'AMD Ryzen 9 7950X3D, AMD offre la CPU da gioco attualmente più veloce sul mercato. Tuttavia, spesso dipende dal gioco specifico, se è in grado di fornire tutte le prestazioni legate alla corretta assegnazione dei thread. A causa della struttura ibrida dei due diversi CCD, non è sempre scontato che venga preferito il CCD con la V-Cache 3D.
Prezzo e disponibilità
L'AMD Ryzen 9 7950X3D è in listino al prezzo di 699 dollari, ma al momento è indicato come esaurito nel negozio web di AMD https://shop-us-en.amd.com/processors/e allo stesso modo in altri posti come Newegg. Chi vuole acquistare un AMD Ryzen 9 7950X3D deve quindi avere un po' di pazienza e forse anche un po' di fortuna o di soldi in più. Amazon attualmente lo mette a listino a 1019 dollari con solo poche unità disponibili. La situazione sembra essere migliore con l'AMD Ryzen 9 7900X3D, leggermente più piccolo, e AMD lo propone a 599 dollari.
Transparency
La selezione dei dispositivi da recensire viene effettuata dalla nostra redazione. Il campione di prova è stato fornito gratuitamente all'autore dal produttore a scopo di revisione. Non vi è stata alcuna influenza di terze parti su questa recensione, né il produttore ne ha ricevuto una copia prima della pubblicazione. Non vi era alcun obbligo di pubblicare questa recensione. In quanto società mediatica indipendente, Notebookcheck non è soggetta all'autorità di produttori, rivenditori o editori.
Ecco come Notebookcheck esegue i test
Ogni anno, Notebookcheck esamina in modo indipendente centinaia di laptop e smartphone utilizzando procedure standardizzate per garantire che tutti i risultati siano comparabili. Da circa 20 anni sviluppiamo continuamente i nostri metodi di prova e nel frattempo stabiliamo gli standard di settore. Nei nostri laboratori di prova, tecnici ed editori esperti utilizzano apparecchiature di misurazione di alta qualità. Questi test comportano un processo di validazione in più fasi. Il nostro complesso sistema di valutazione si basa su centinaia di misurazioni e parametri di riferimento ben fondati, che mantengono l'obiettività.
