 Deutsch
 English
 Español
 Français
 Italiano
 Nederlands
 Polski
 Português
 Русский
 Türkçe
 Svenska
 Chinese
 Magyar
Recensione del Laptop Schenker XMG Pro 15 (Clevo PC50HS-D): Computer portatile per il gaming 4K sottile e leggero

Lo Schenker XMG Pro 15 della fine del 2021 è un portatile da gioco leggero e compatto da 15,6 pollici. È basato sul barebone Clevo (PC50HS-D) e alimentato da unCore-i7-11800HcPU e un mobileGeForce RTX 3080gPU. Esso compete direttamente con dispositivi come ilLenovo Legion S7 15ACH6, MSI Delta 15, Alienware x15e ilRazer Blade 15 Advanced (Mid 2021).
Potential competitors in comparison
Punteggio | Data | Modello | Peso | Altezza | Dimensione | Risoluzione | Miglior Prezzo |
|---|---|---|---|---|---|---|---|
| 84.6 % | 01/2022 | SCHENKER XMG Pro 15 (Late 2021) i7-11800H, GeForce RTX 3080 Laptop GPU | 2 kg | 19.8 mm | 15.60" | 3840x2160 | |
| 87.9 % | 11/2021 | Lenovo Legion S7 15ACH6 82K80030GE R9 5900HX, GeForce RTX 3060 Laptop GPU | 2 kg | 18.9 mm | 15.60" | 3840x2160 | |
| 87.2 % | 10/2021 | Alienware x15 RTX 3070 P111F i7-11800H, GeForce RTX 3070 Laptop GPU | 2.4 kg | 15.9 mm | 15.60" | 2560x1440 | |
| 88.9 % | 07/2021 | Razer Blade 15 Advanced (Mid 2021) i7-11800H, GeForce RTX 3080 Laptop GPU | 2 kg | 16.99 mm | 15.60" | 1920x1080 |
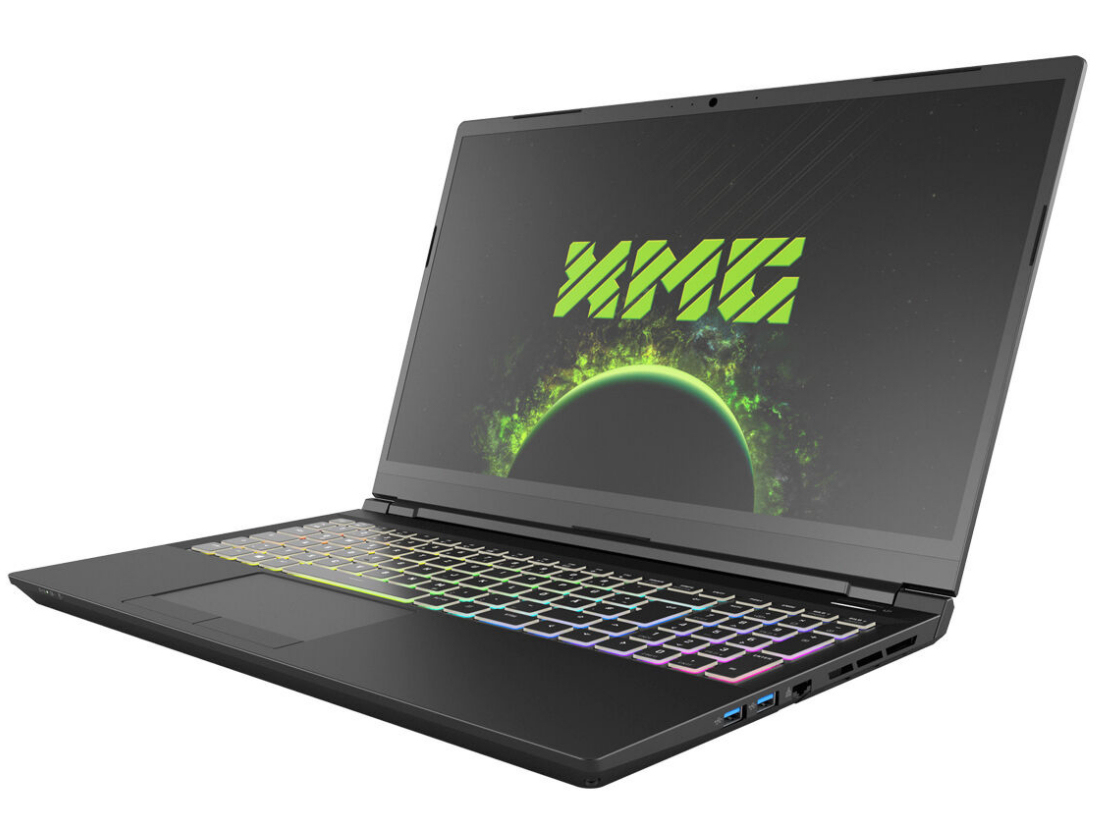
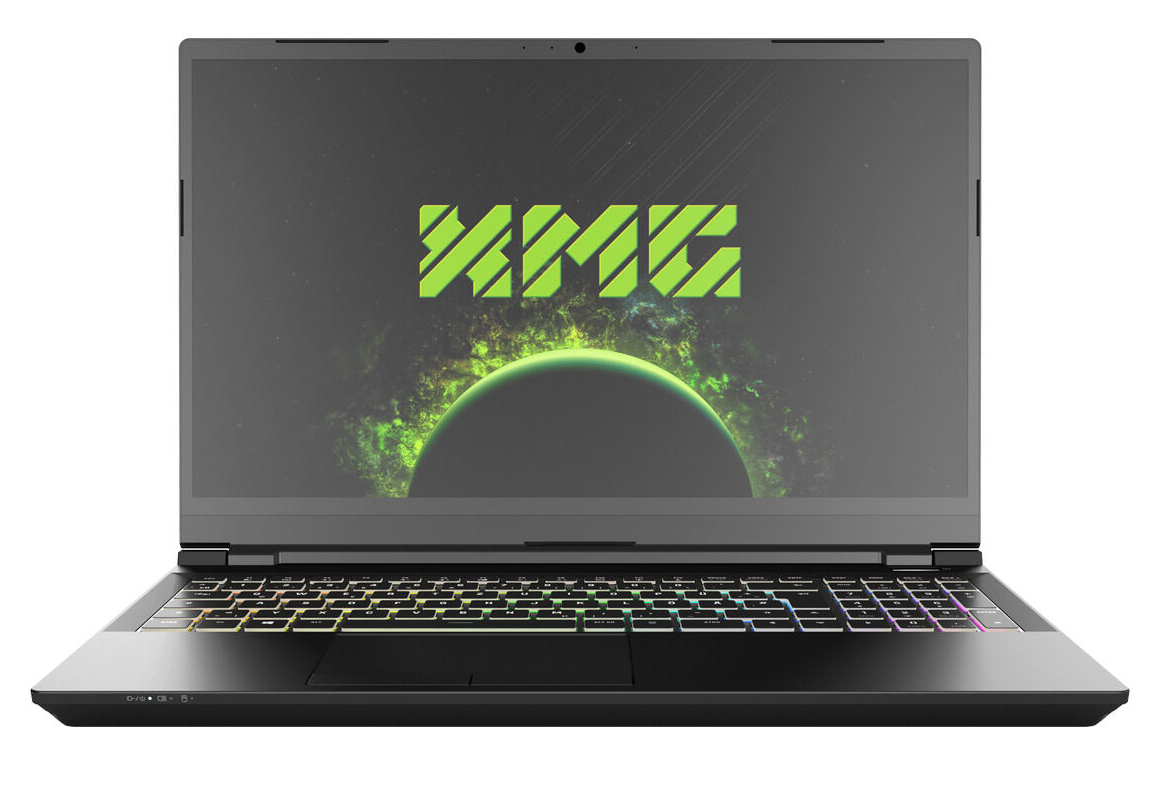
Caso - portatile Schenker con un telaio in metallo
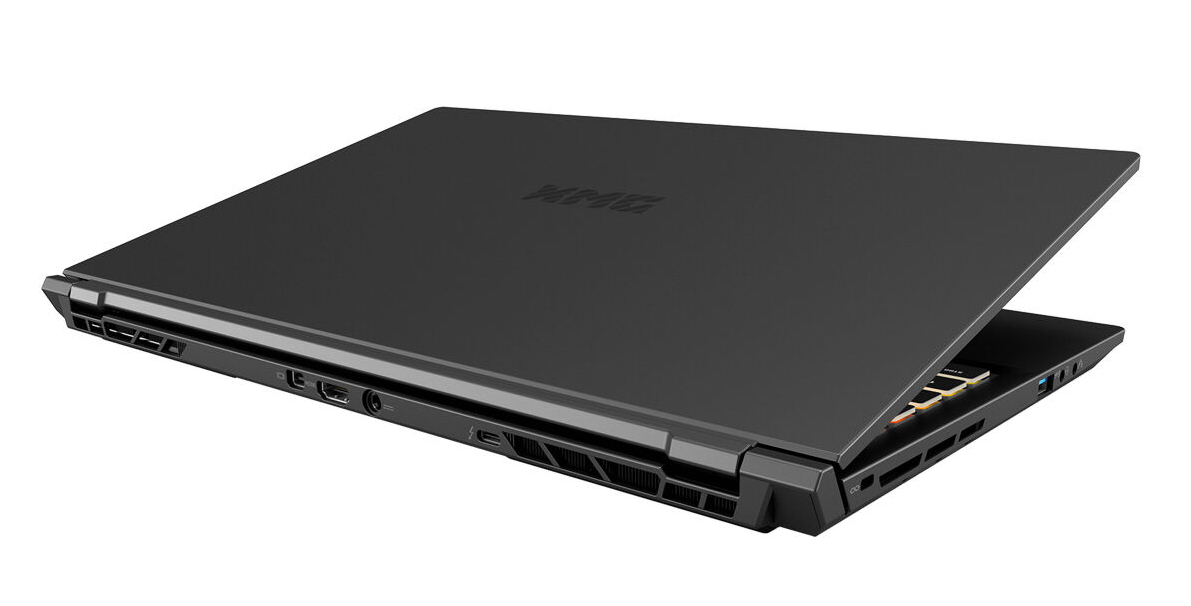
Per l'XMG Pro, Schenker usa un sottile chassis di metallo in nero opaco. Dal momento che il telaio semplice e tuttavia elegante viene fornito senza accenti visivi appariscenti, è adatto ad ambienti professionali. Rispetto al modelloXMG Pro 15 dall'inizio del 2021ci sono solo alcune piccole differenze. Non c'è uno sportello per la manutenzione e la batteria è fissa.
La costruzione non merita critiche. Le distanze sono uniformi e non ci sono sporgenze di materiale indesiderato. Mentre il coperchio e la base cedono leggermente quando vengono ruotati agli angoli, la rigidità è ancora solida nel complesso. Le cerniere tengono il coperchio saldamente in posizione, anche se permettono un certo traballamento. Il display può essere aperto fino a 130 gradi. È possibile aprire il portatile con una sola mano.
L'XMG Pro è uno dei dispositivi più compatti nel nostro confronto e solo leggermente più grande del Blade 15. Per la maggior parte, tutti i portatili nel nostro confronto sono pari in termini di peso. Solo lAlienware x15si discosta da questo e pesa circa 400 g in più.
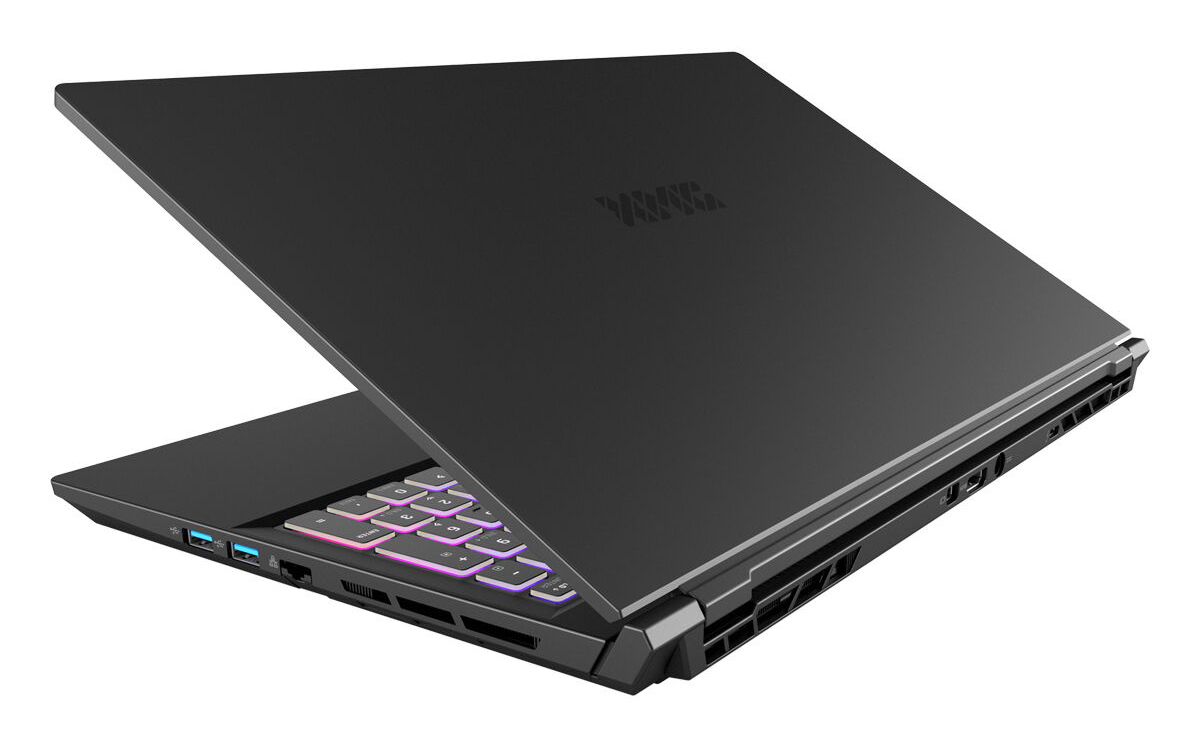
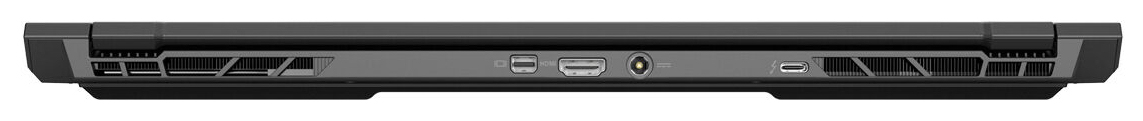
Connettività - Schenker XMG con Thunderbolt 4
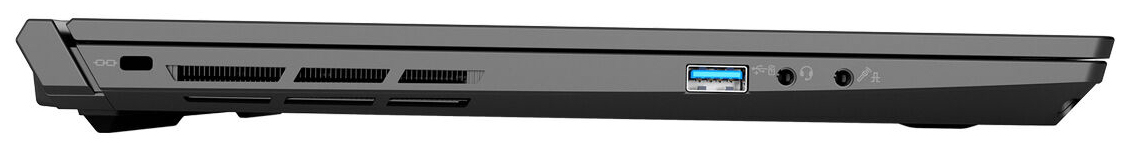
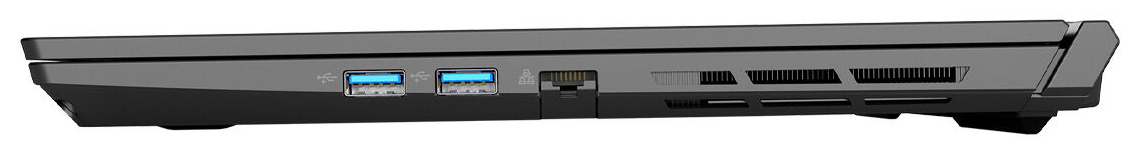
L'XMG Pro integra tre porte USB type-A (USB 3.2 Gen 1) e una porta USB type-C (Thunderbolt 4). Quest'ultima può essere collegata a una docking station ricca di funzioni o a una GPU esterna. Inoltre, la porta supporta DisplayPort via USB-C. In combinazione con la Mini DisplayPort e la porta HDMI, ci sono tre uscite video in totale. Tutte e tre le uscite video supportano G-Sync. Per la porta USB type-C, questa deve essere abilitata manualmente dal BIOS. Non c'è un lettore di schede integrato
Le porte sono distribuite su tre lati del notebook. Tutte e tre le uscite video si trovano sul retro del dispositivo. Di conseguenza, i cavi collegati corrono lungo il retro e non sono d'intralcio
Comunicazione
Il modulo Wi-Fi è basato su un chip Intel (AX201) e supporta gli standard 802.11a/b/g/n/ac/ax. In condizioni ottimali (nessun altro dispositivo Wi-Fi nelle vicinanze, notebook e server nelle immediate vicinanze), abbiamo osservato eccellenti velocità di trasferimento. Un controller Realtek Gigabit Ethernet gestisce la rete cablata. Non abbiamo riscontrato alcun problema durante i nostri test
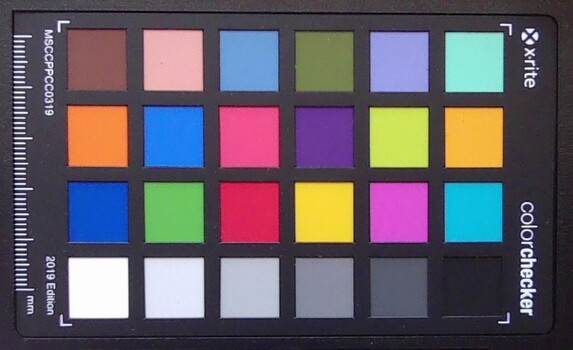
Webcam
La webcam (0,9 MP) cattura immagini con una risoluzione massima di 1280 x 720 pixel. L'accuratezza dei colori è lacunosa: I colori si discostano significativamente dai loro valori ideali
 GeForce RTX 3080 Laptop GPU, i7-11800H, Samsung SSD 980 Pro 1TB MZ-V8P1T0BW")
 GeForce RTX 3080 Laptop GPU, i7-11800H, Samsung SSD 980 Pro 1TB MZ-V8P1T0BW")
Accessori
A parte le informazioni sulla garanzia e un manuale, c'è un DVD di recupero, un panno per la pulizia, un thumbdrive USB e una vite M.2 inclusi nella confezione
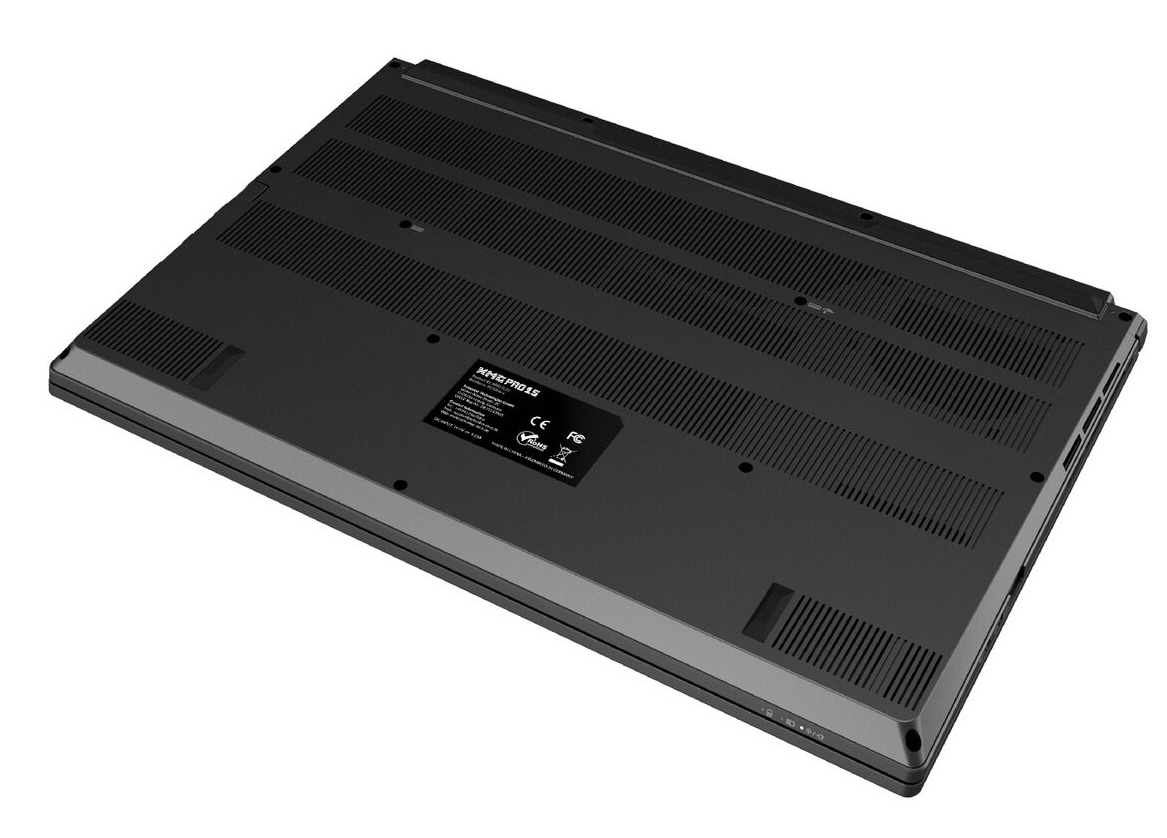
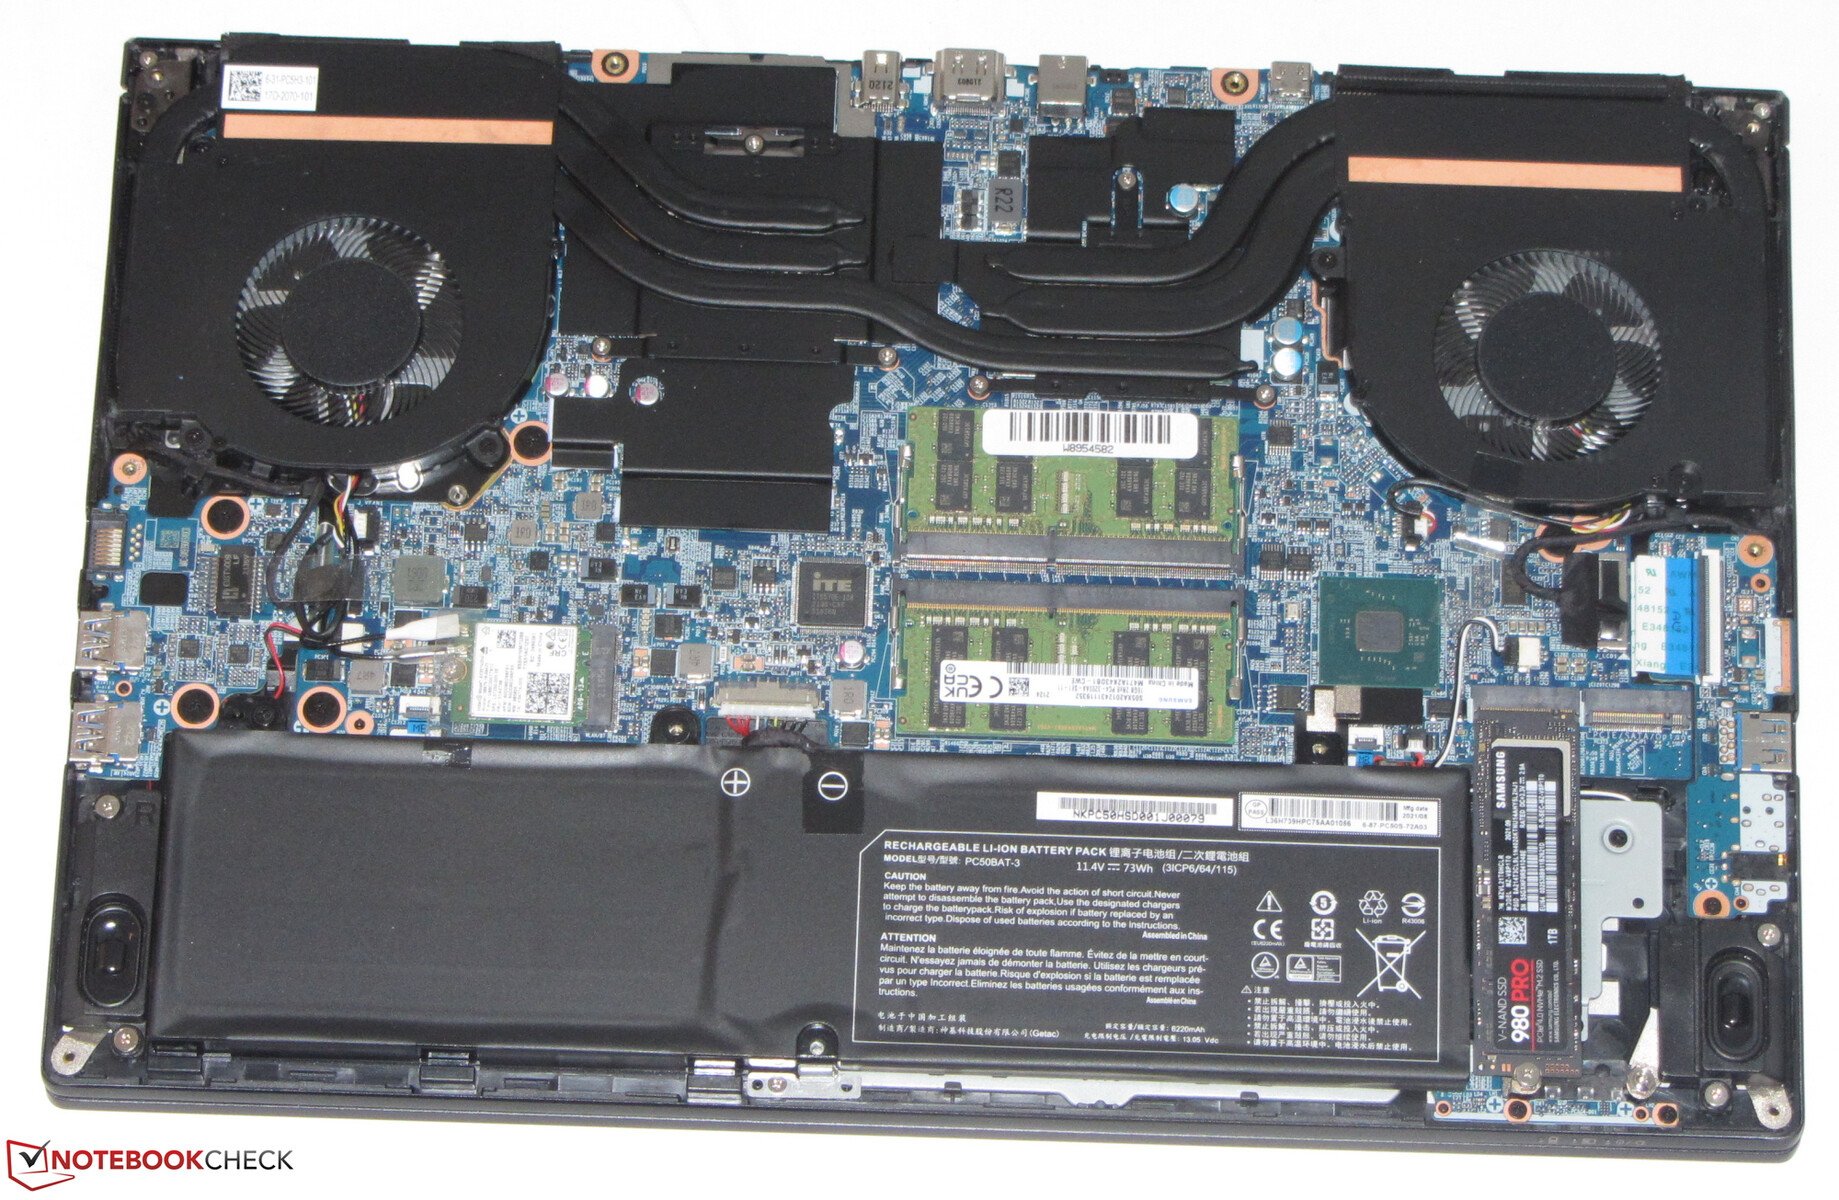
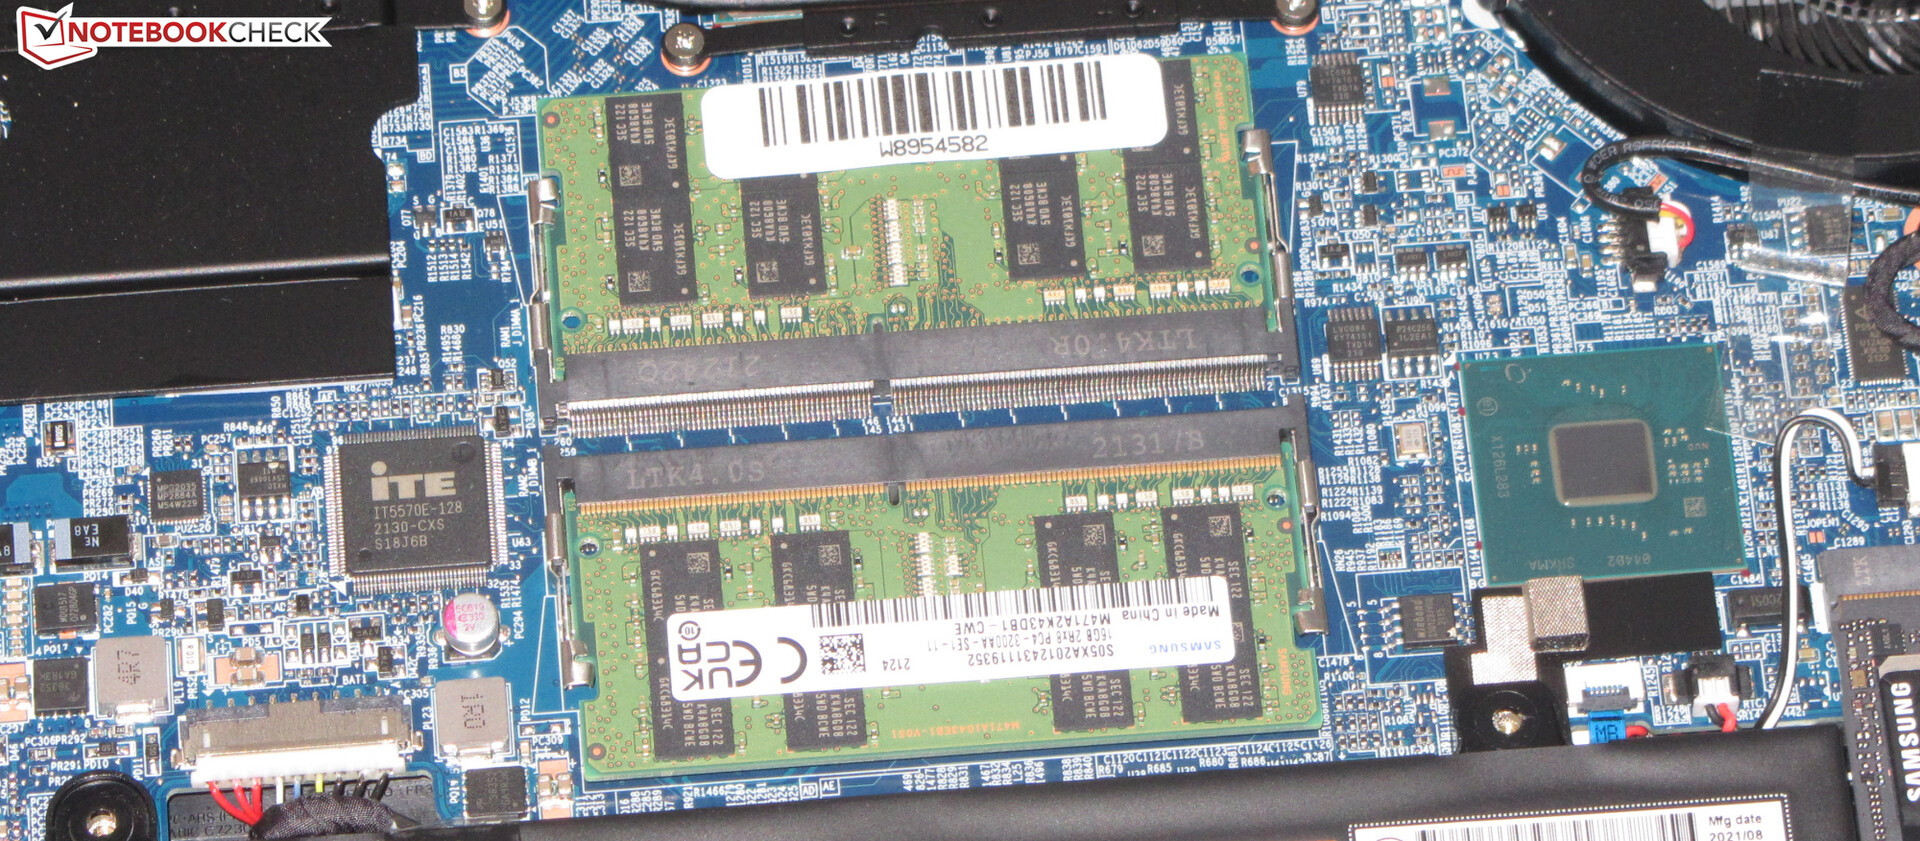
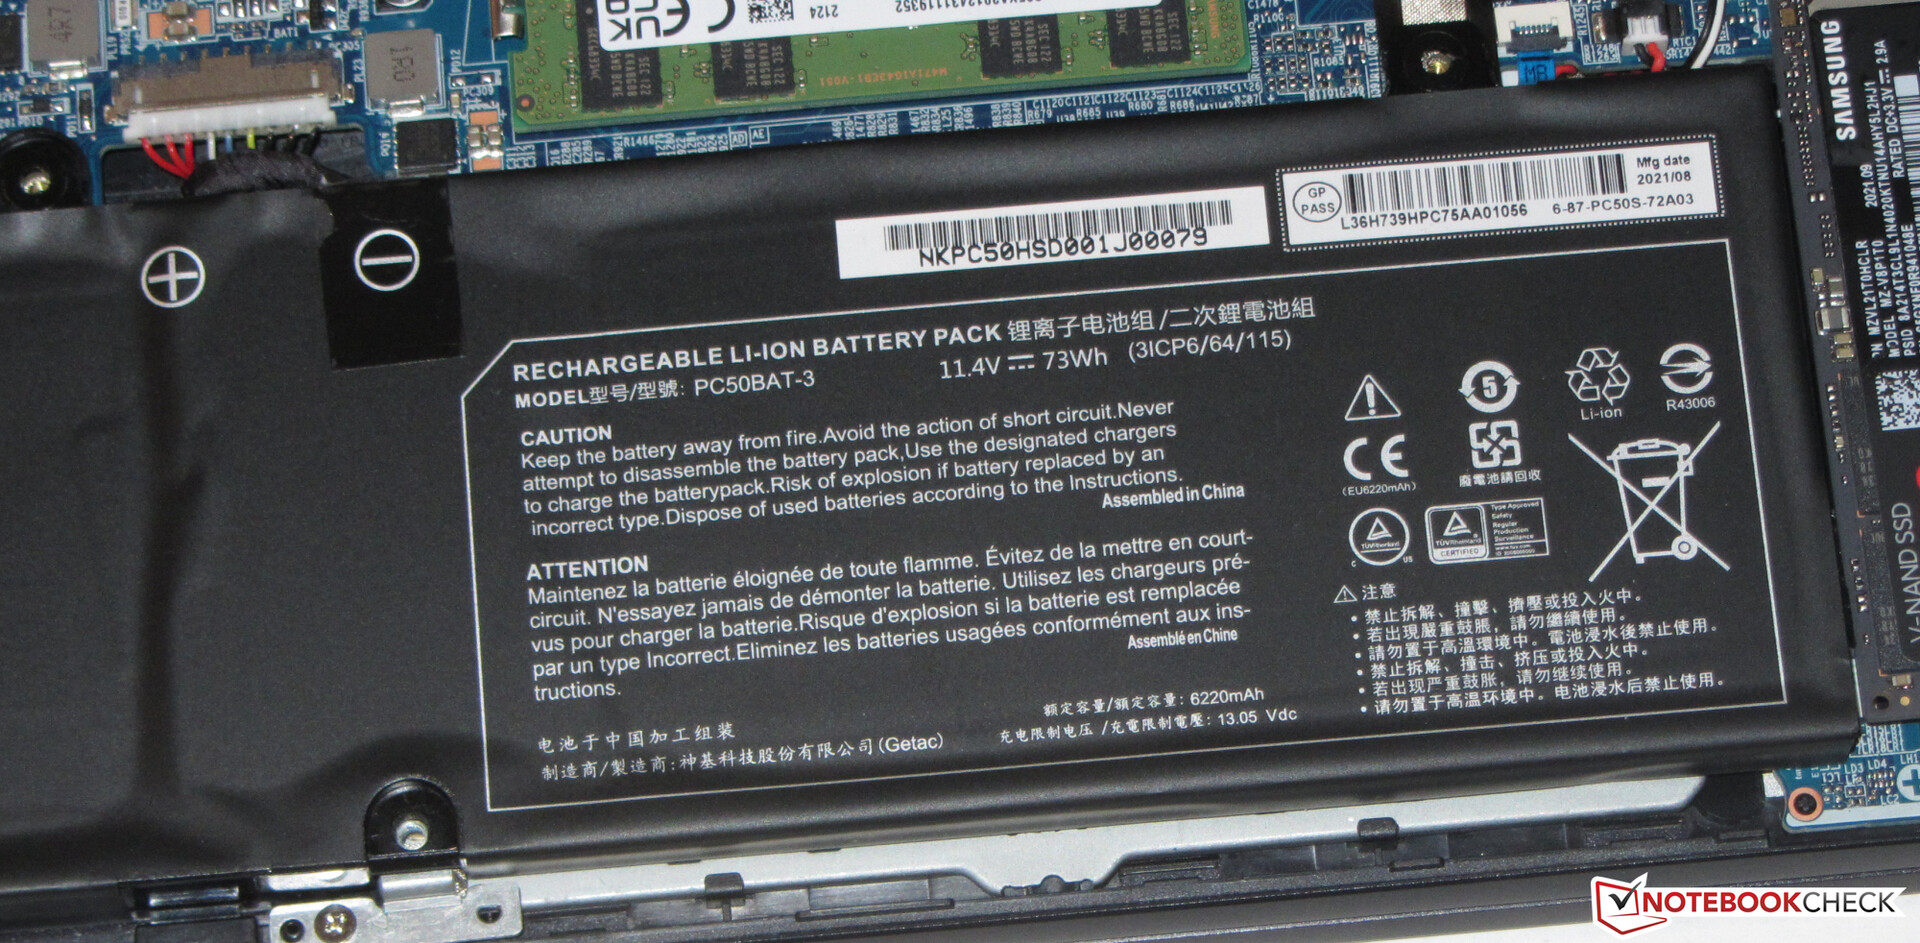
Manutenzione
Eseguire la manutenzione e l'aggiornamento del sistema è semplice. Dopo aver allentato tutte le viti sul fondo del dispositivo, la piastra inferiore può essere rimossa con l'aiuto di un oggetto con un bordo tagliente. Successivamente, gli utenti possono accedere all'SSD, allo slot secondario M.2, al modulo Wi-Fi, alla batteria, alla RAM e alle ventole
Garanzia
Il produttore offre una garanzia di base di due anni con un servizio di ritiro e restituzione in alcuni paesi europei, così come un servizio di riparazione rapida di 6 mesi (riparazione entro 48 ore). Un'estensione della garanzia a 36 mesi può costare da 100-149 euro (~$110-$170) - a seconda del periodo di riparazione rapida
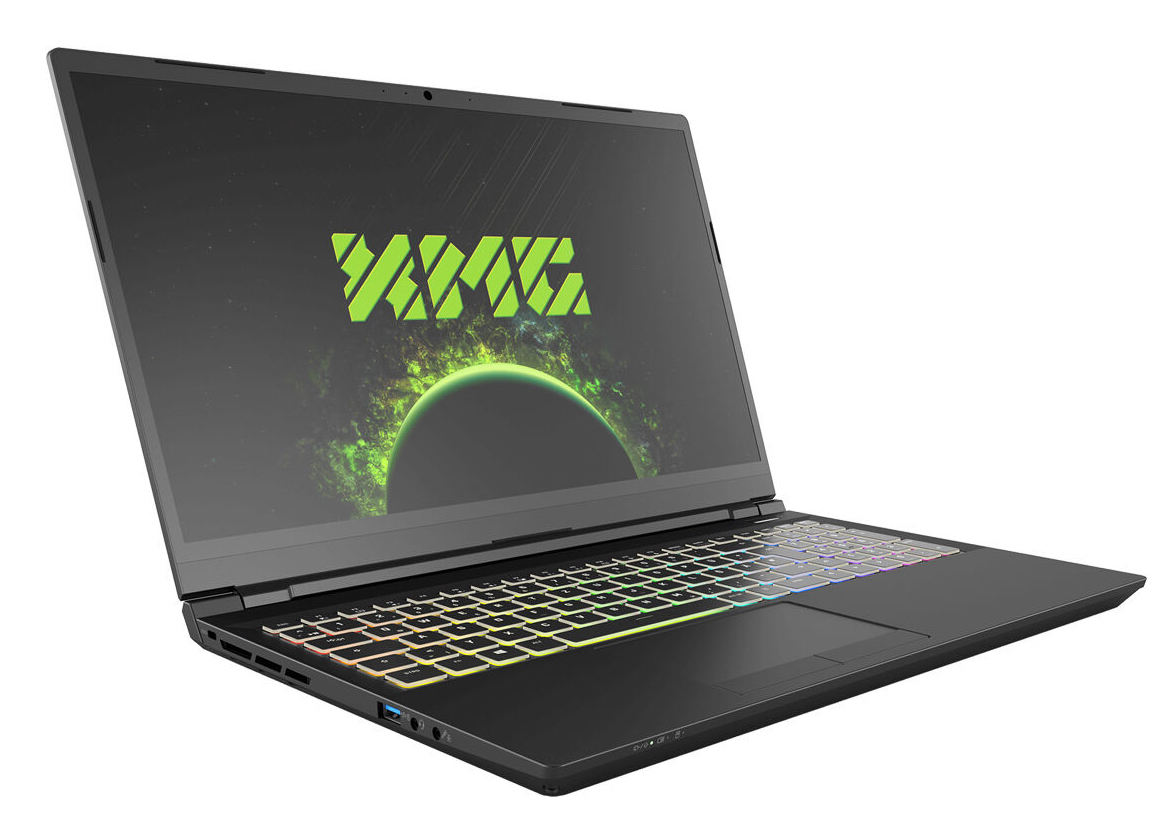
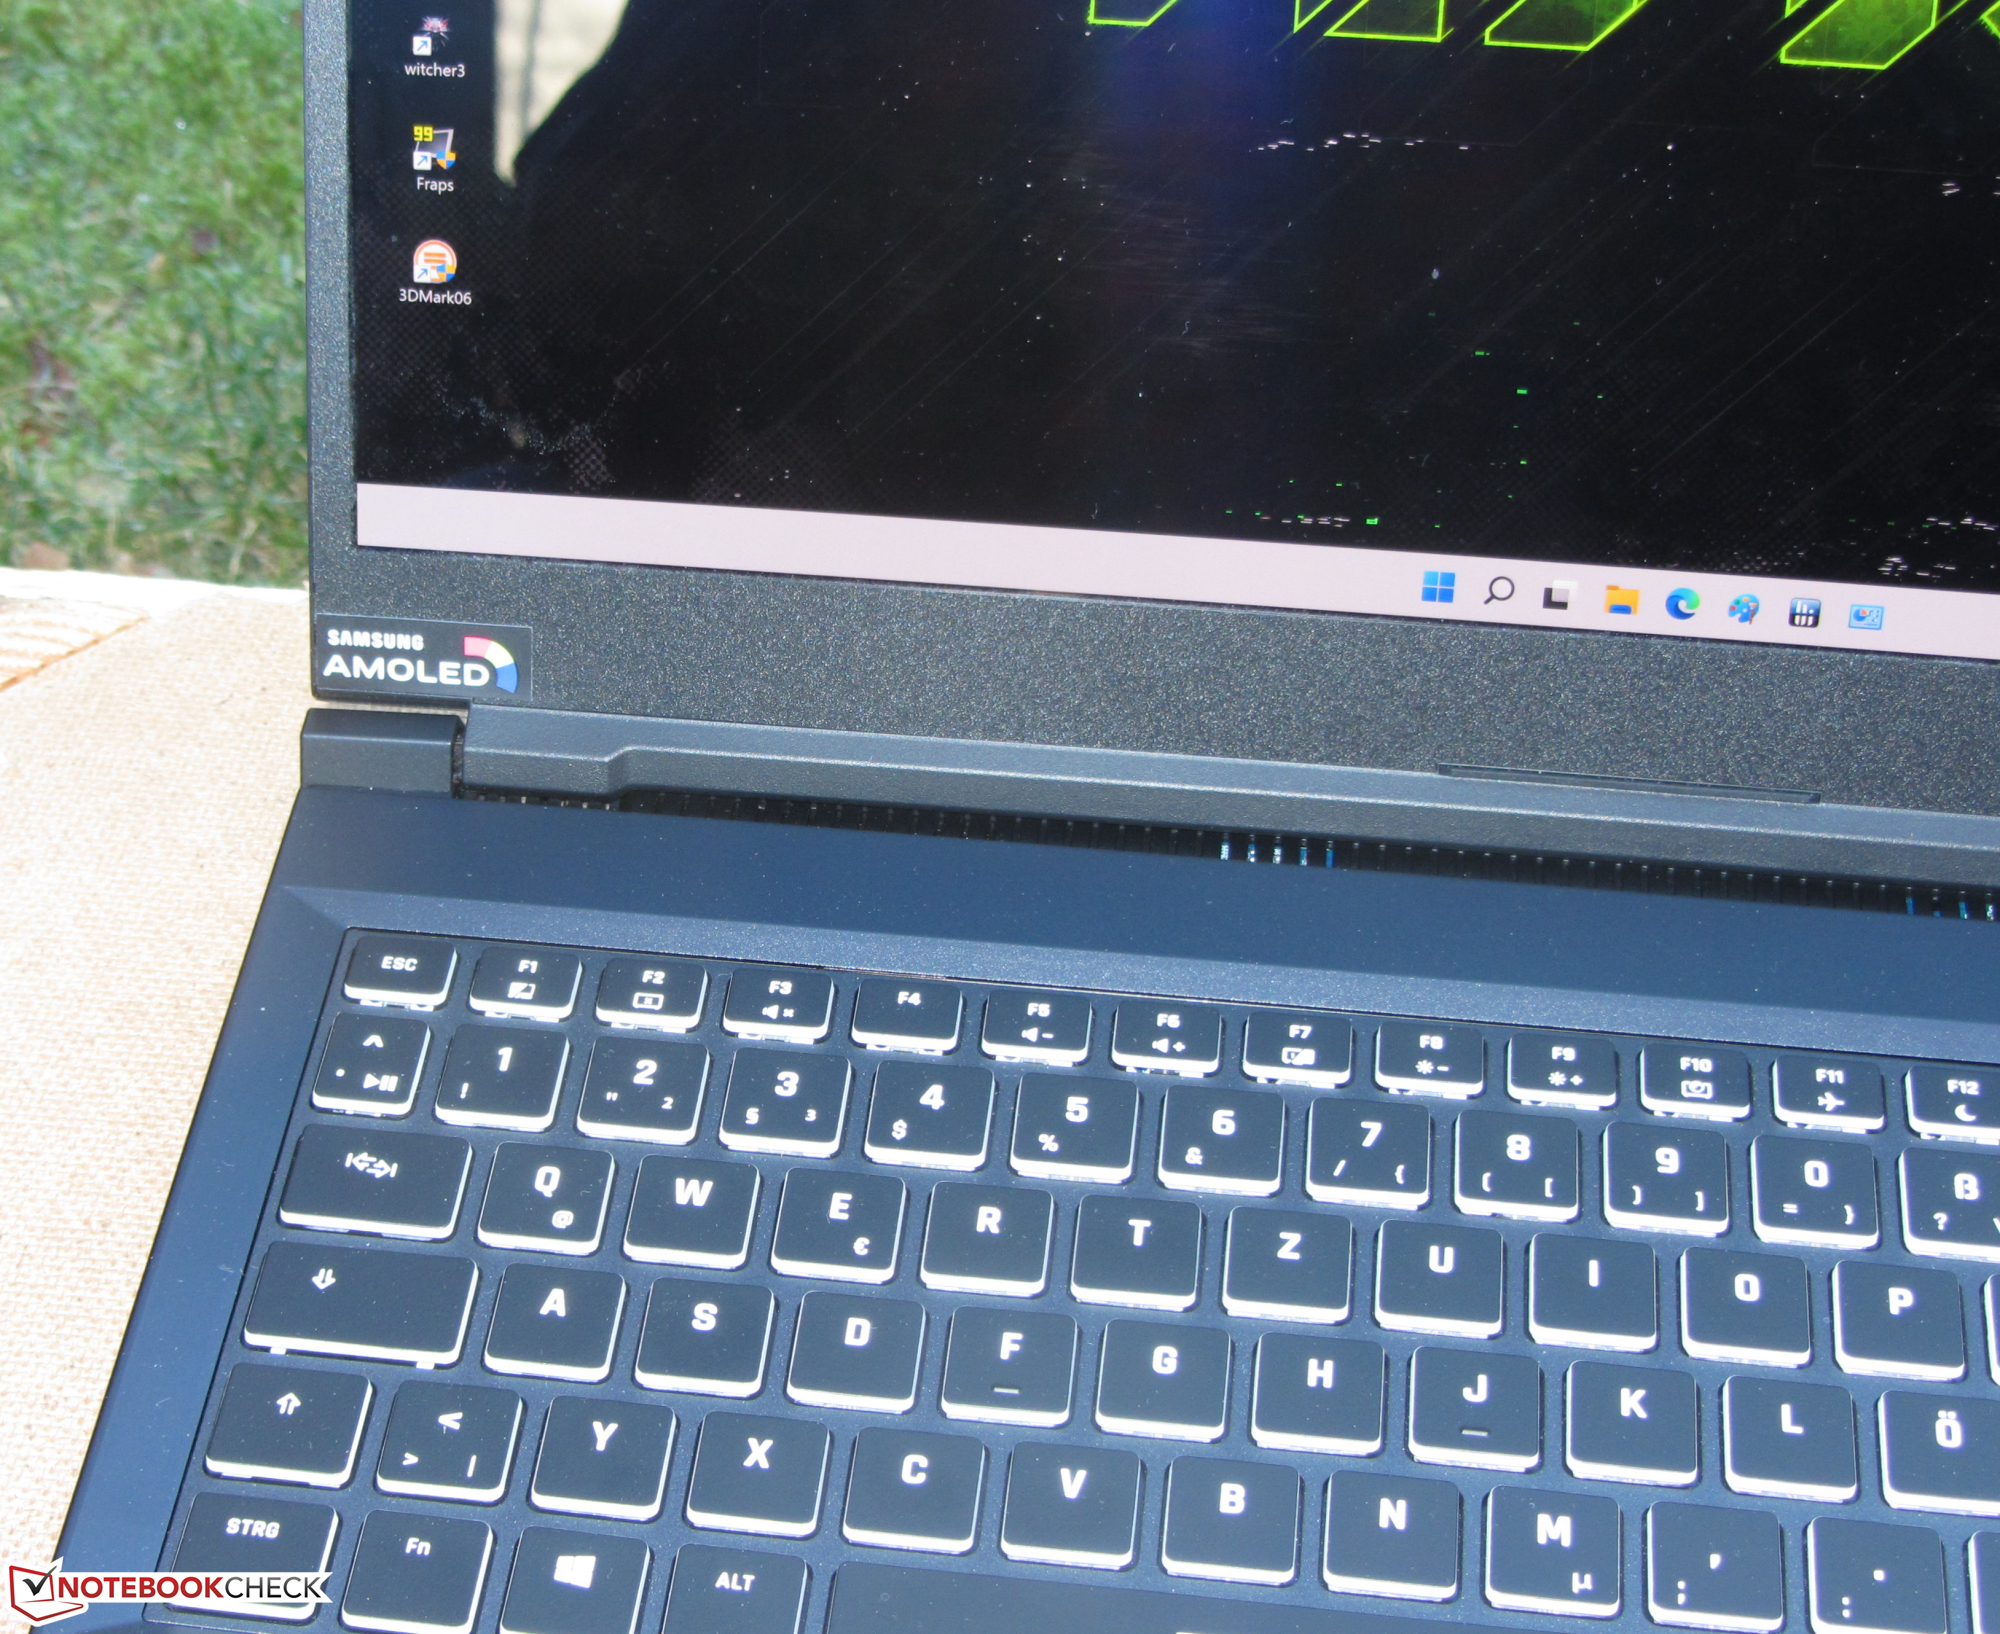
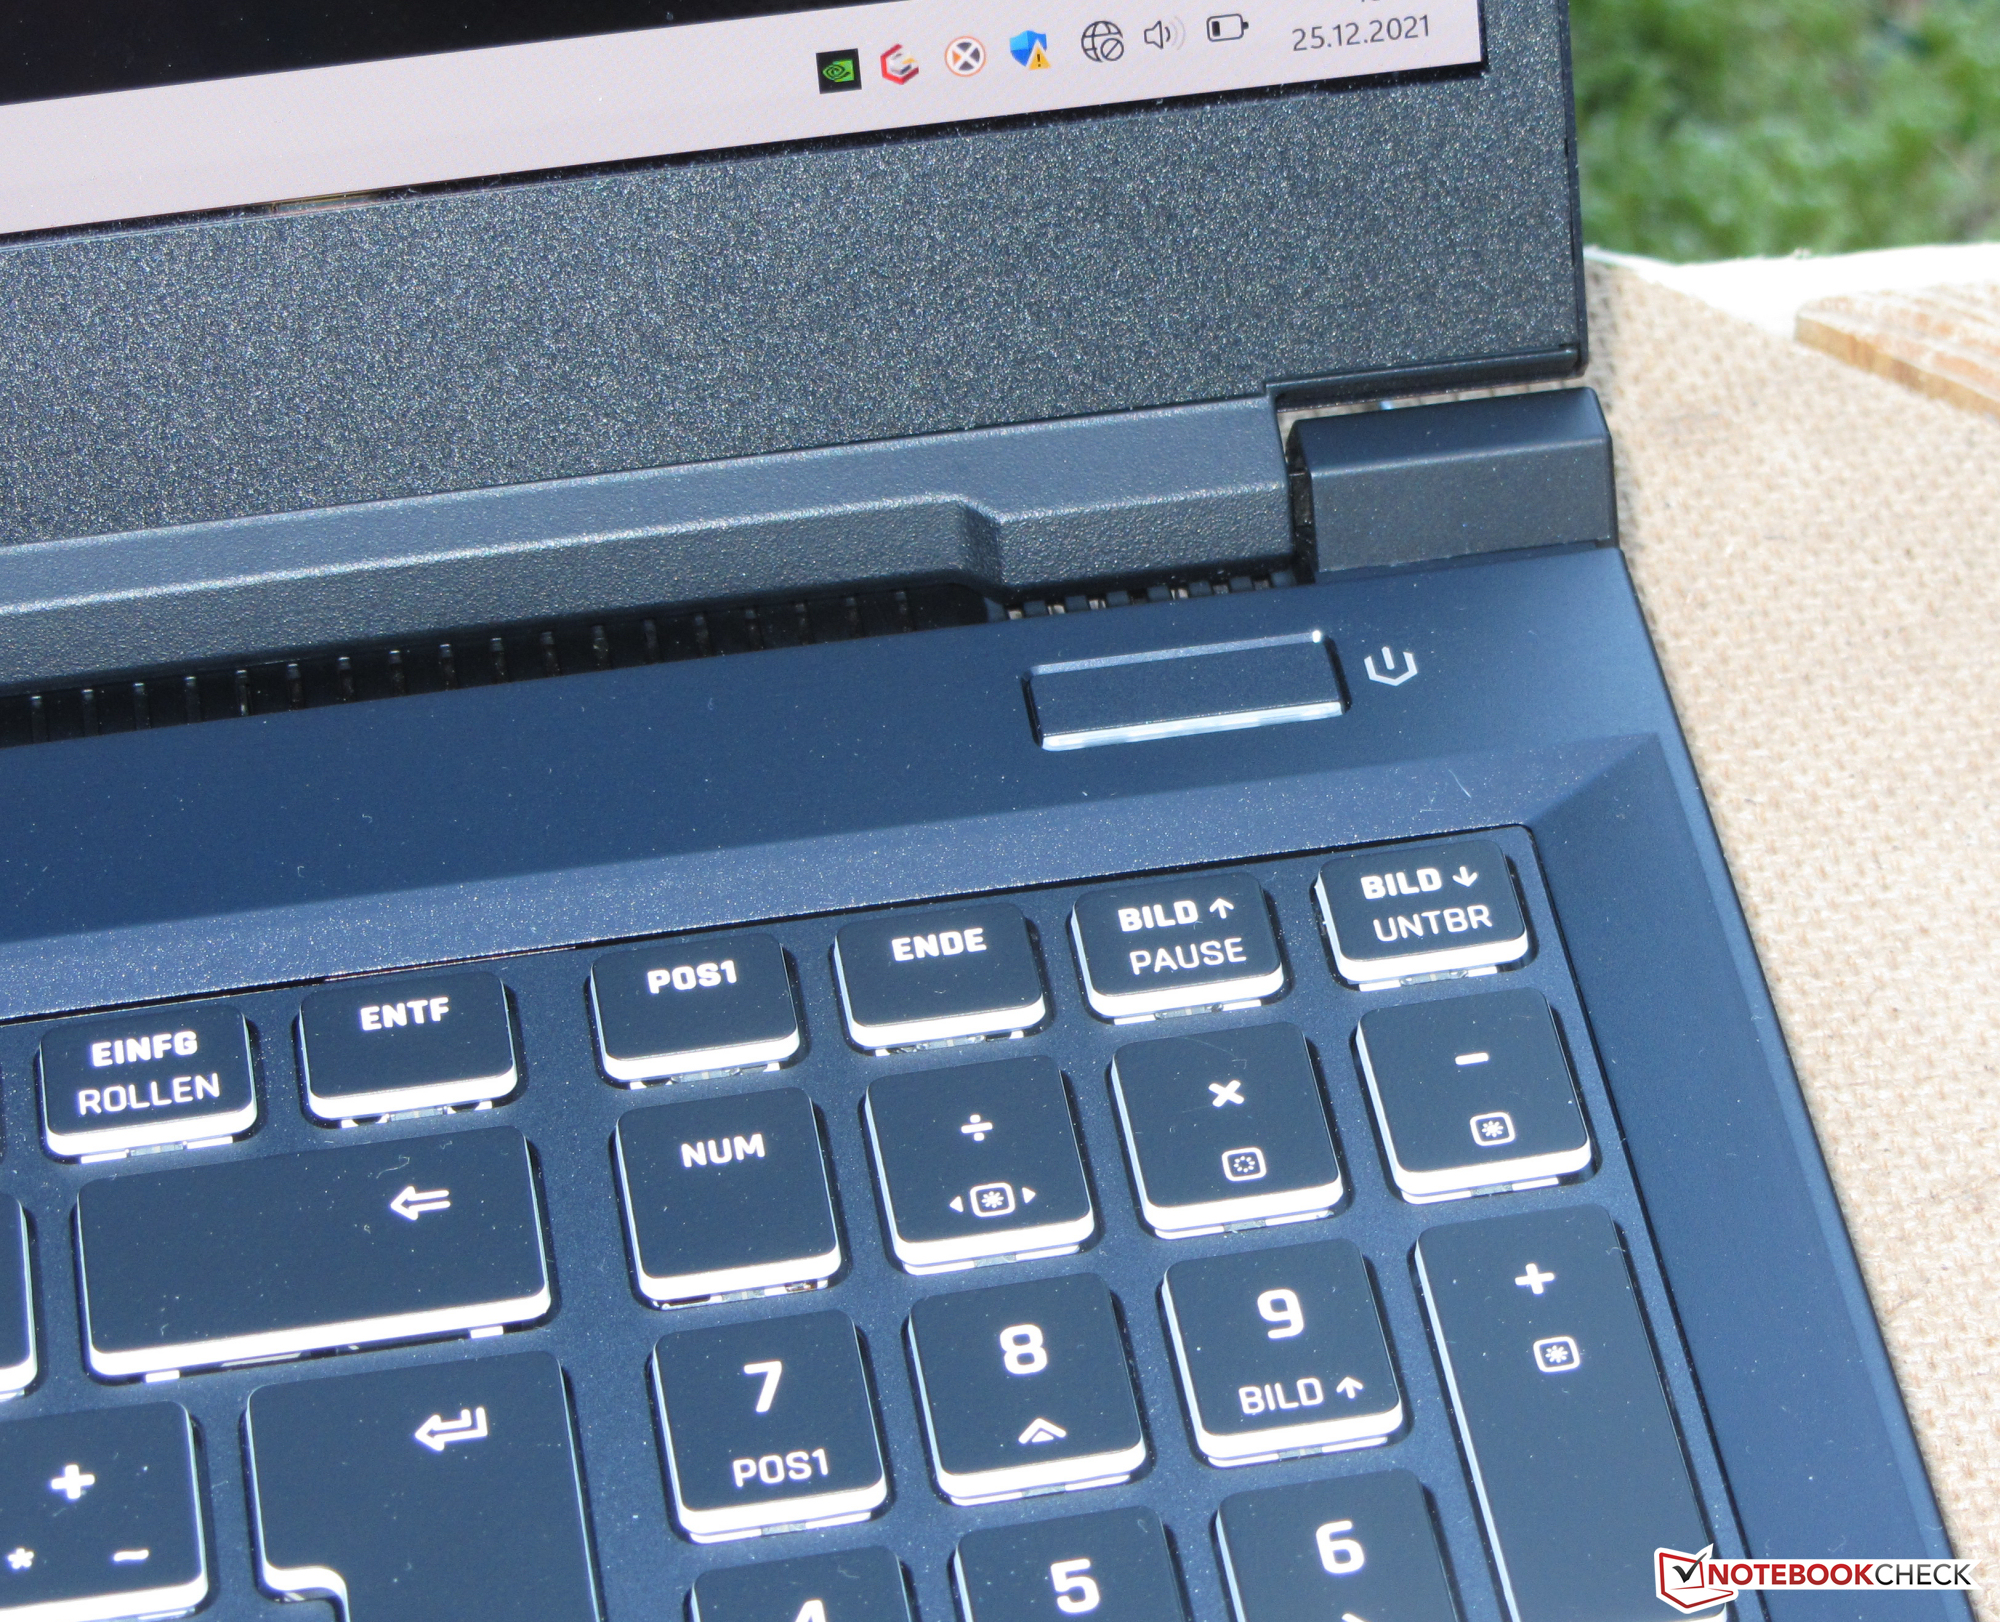
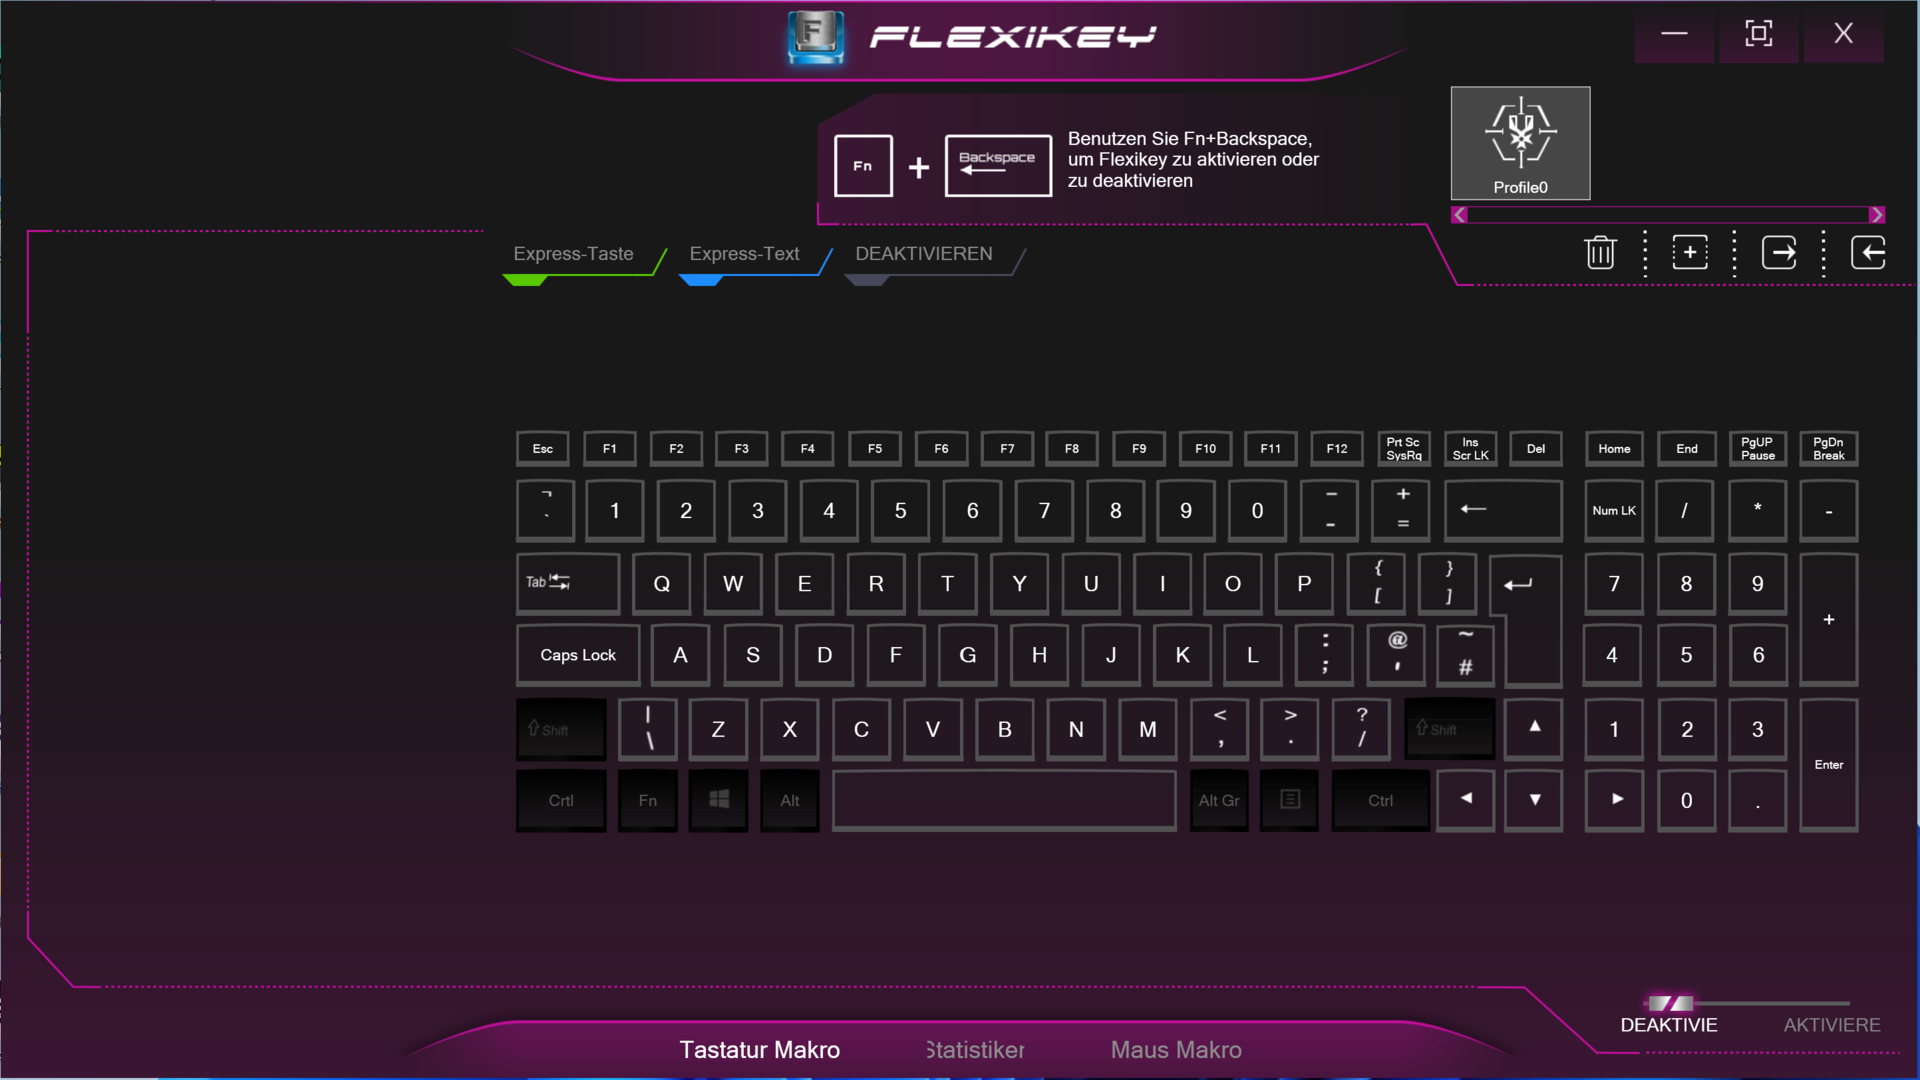
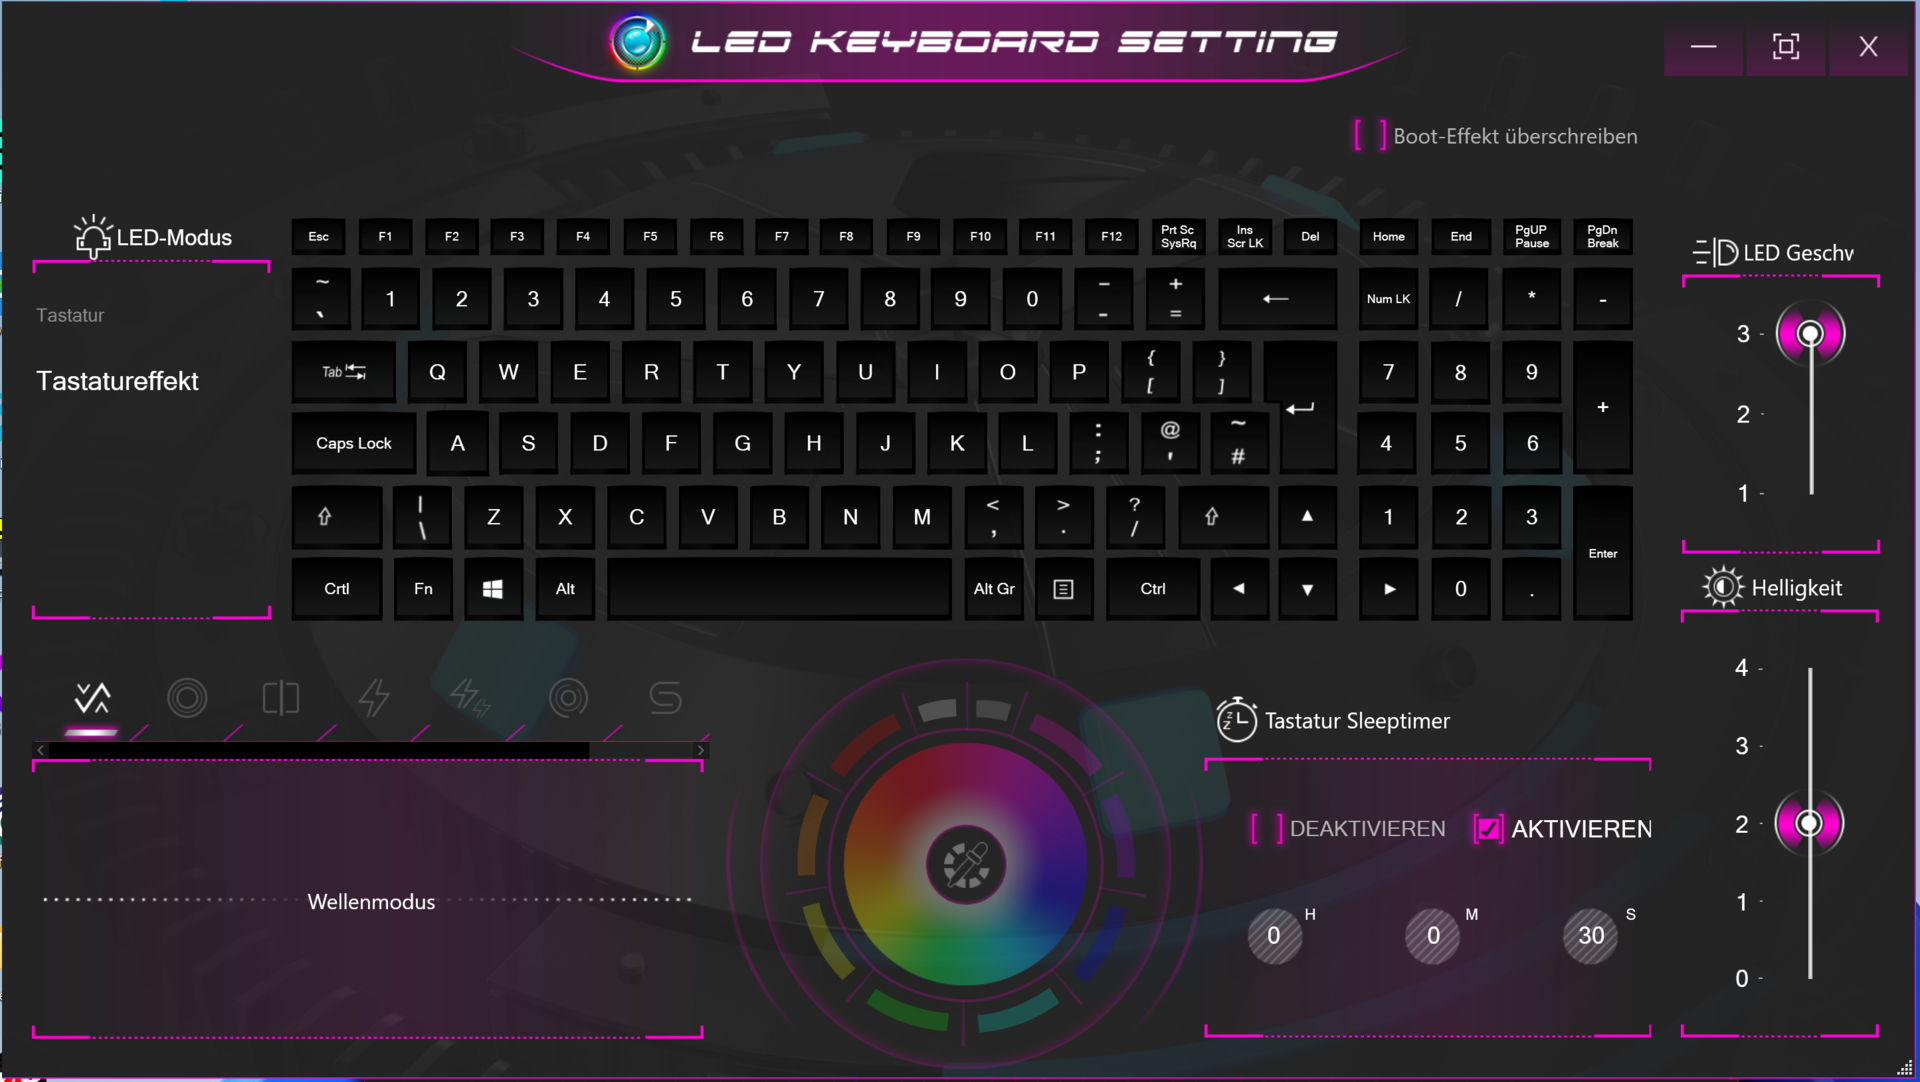
Dispositivi di input - Tastiera con retroilluminazione RGB
Tastiera
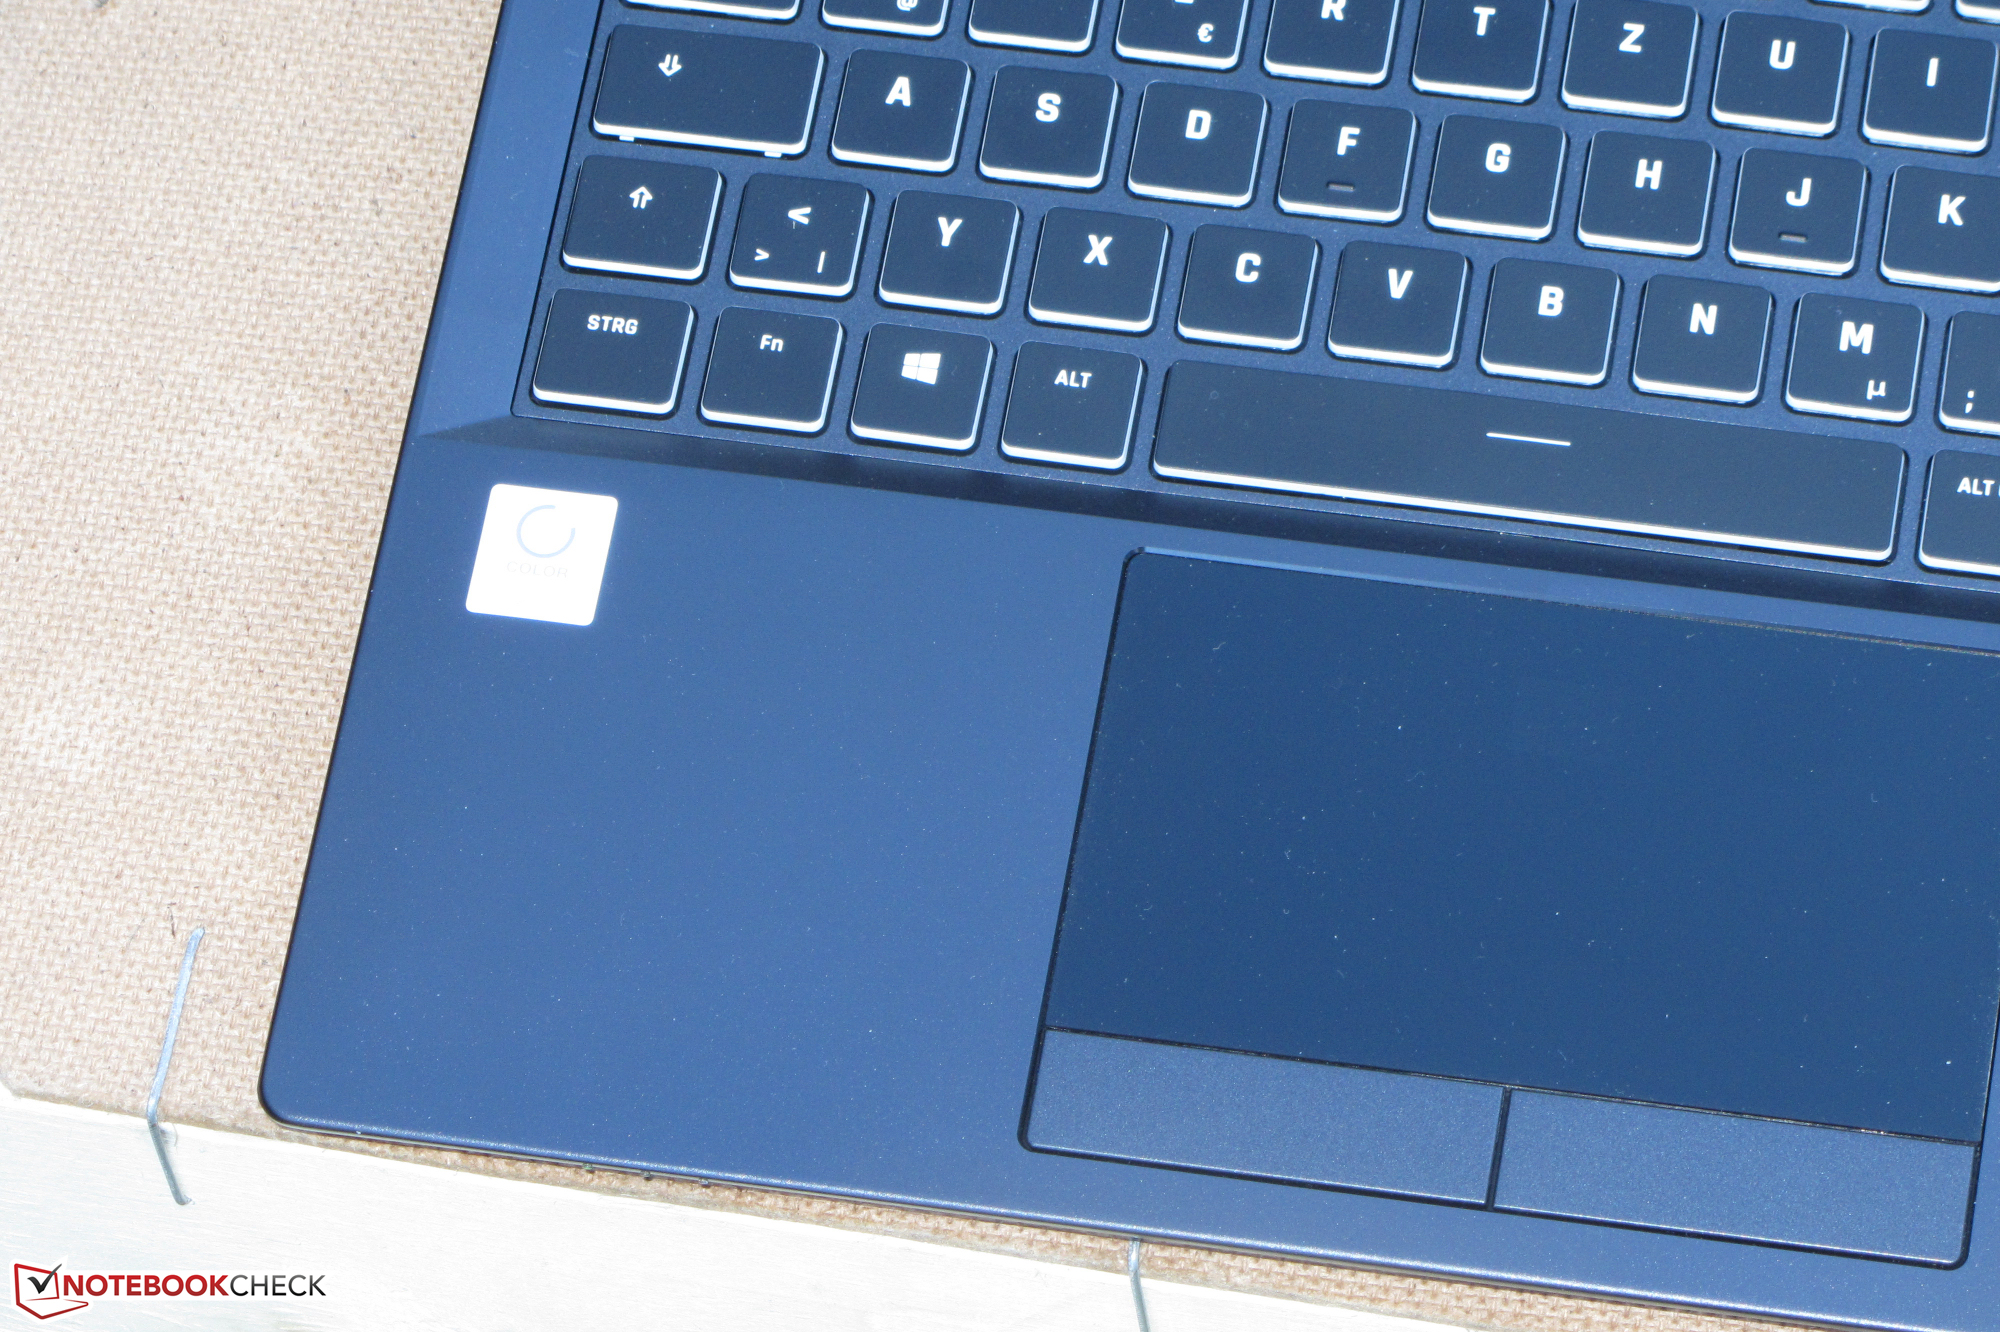
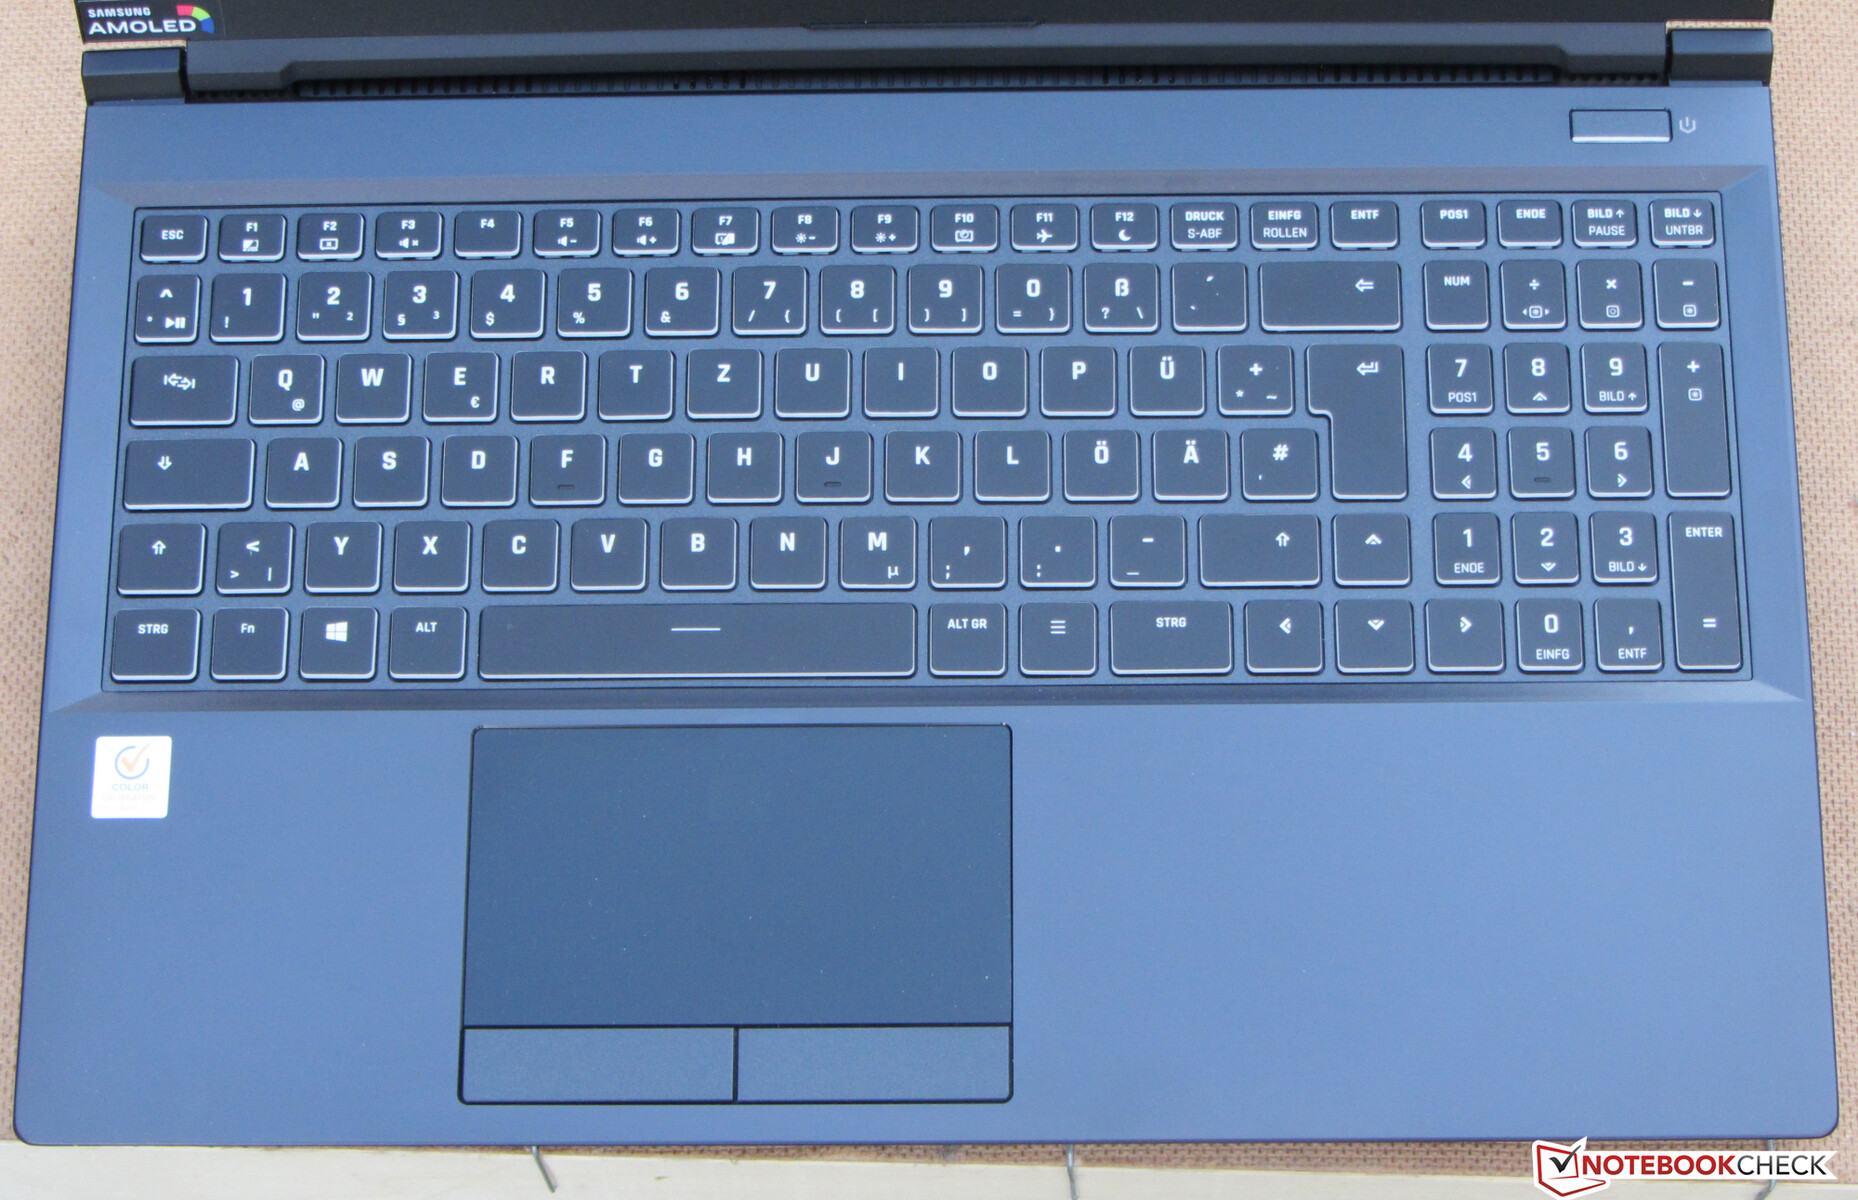
Il portatile Schenker è dotato di una tastiera chiclet RGB retroilluminata che include un tastierino numerico. I tasti piatti e lisci offrono una corsa media e un punto di attuazione distinto. Siamo soddisfatti del feedback dei tasti. L'area della tastiera cede leggermente durante la digitazione. Questo non ha finito per essere un problema durante i nostri test. La retroilluminazione della tastiera ha tre impostazioni di luminosità, che possono essere controllate tramite due tasti funzione. Nel complesso, la tastiera è adatta all'uso quotidiano
Touchpad
La superficie liscia (~10,8x6,1 cm) del touchpad supporta i gesti multi-touch e ha buone proprietà di scorrimento. Risponde bene agli input fino agli angoli. I due pulsanti del mouse dedicati offrono una corsa media e un punto di attuazione distinto
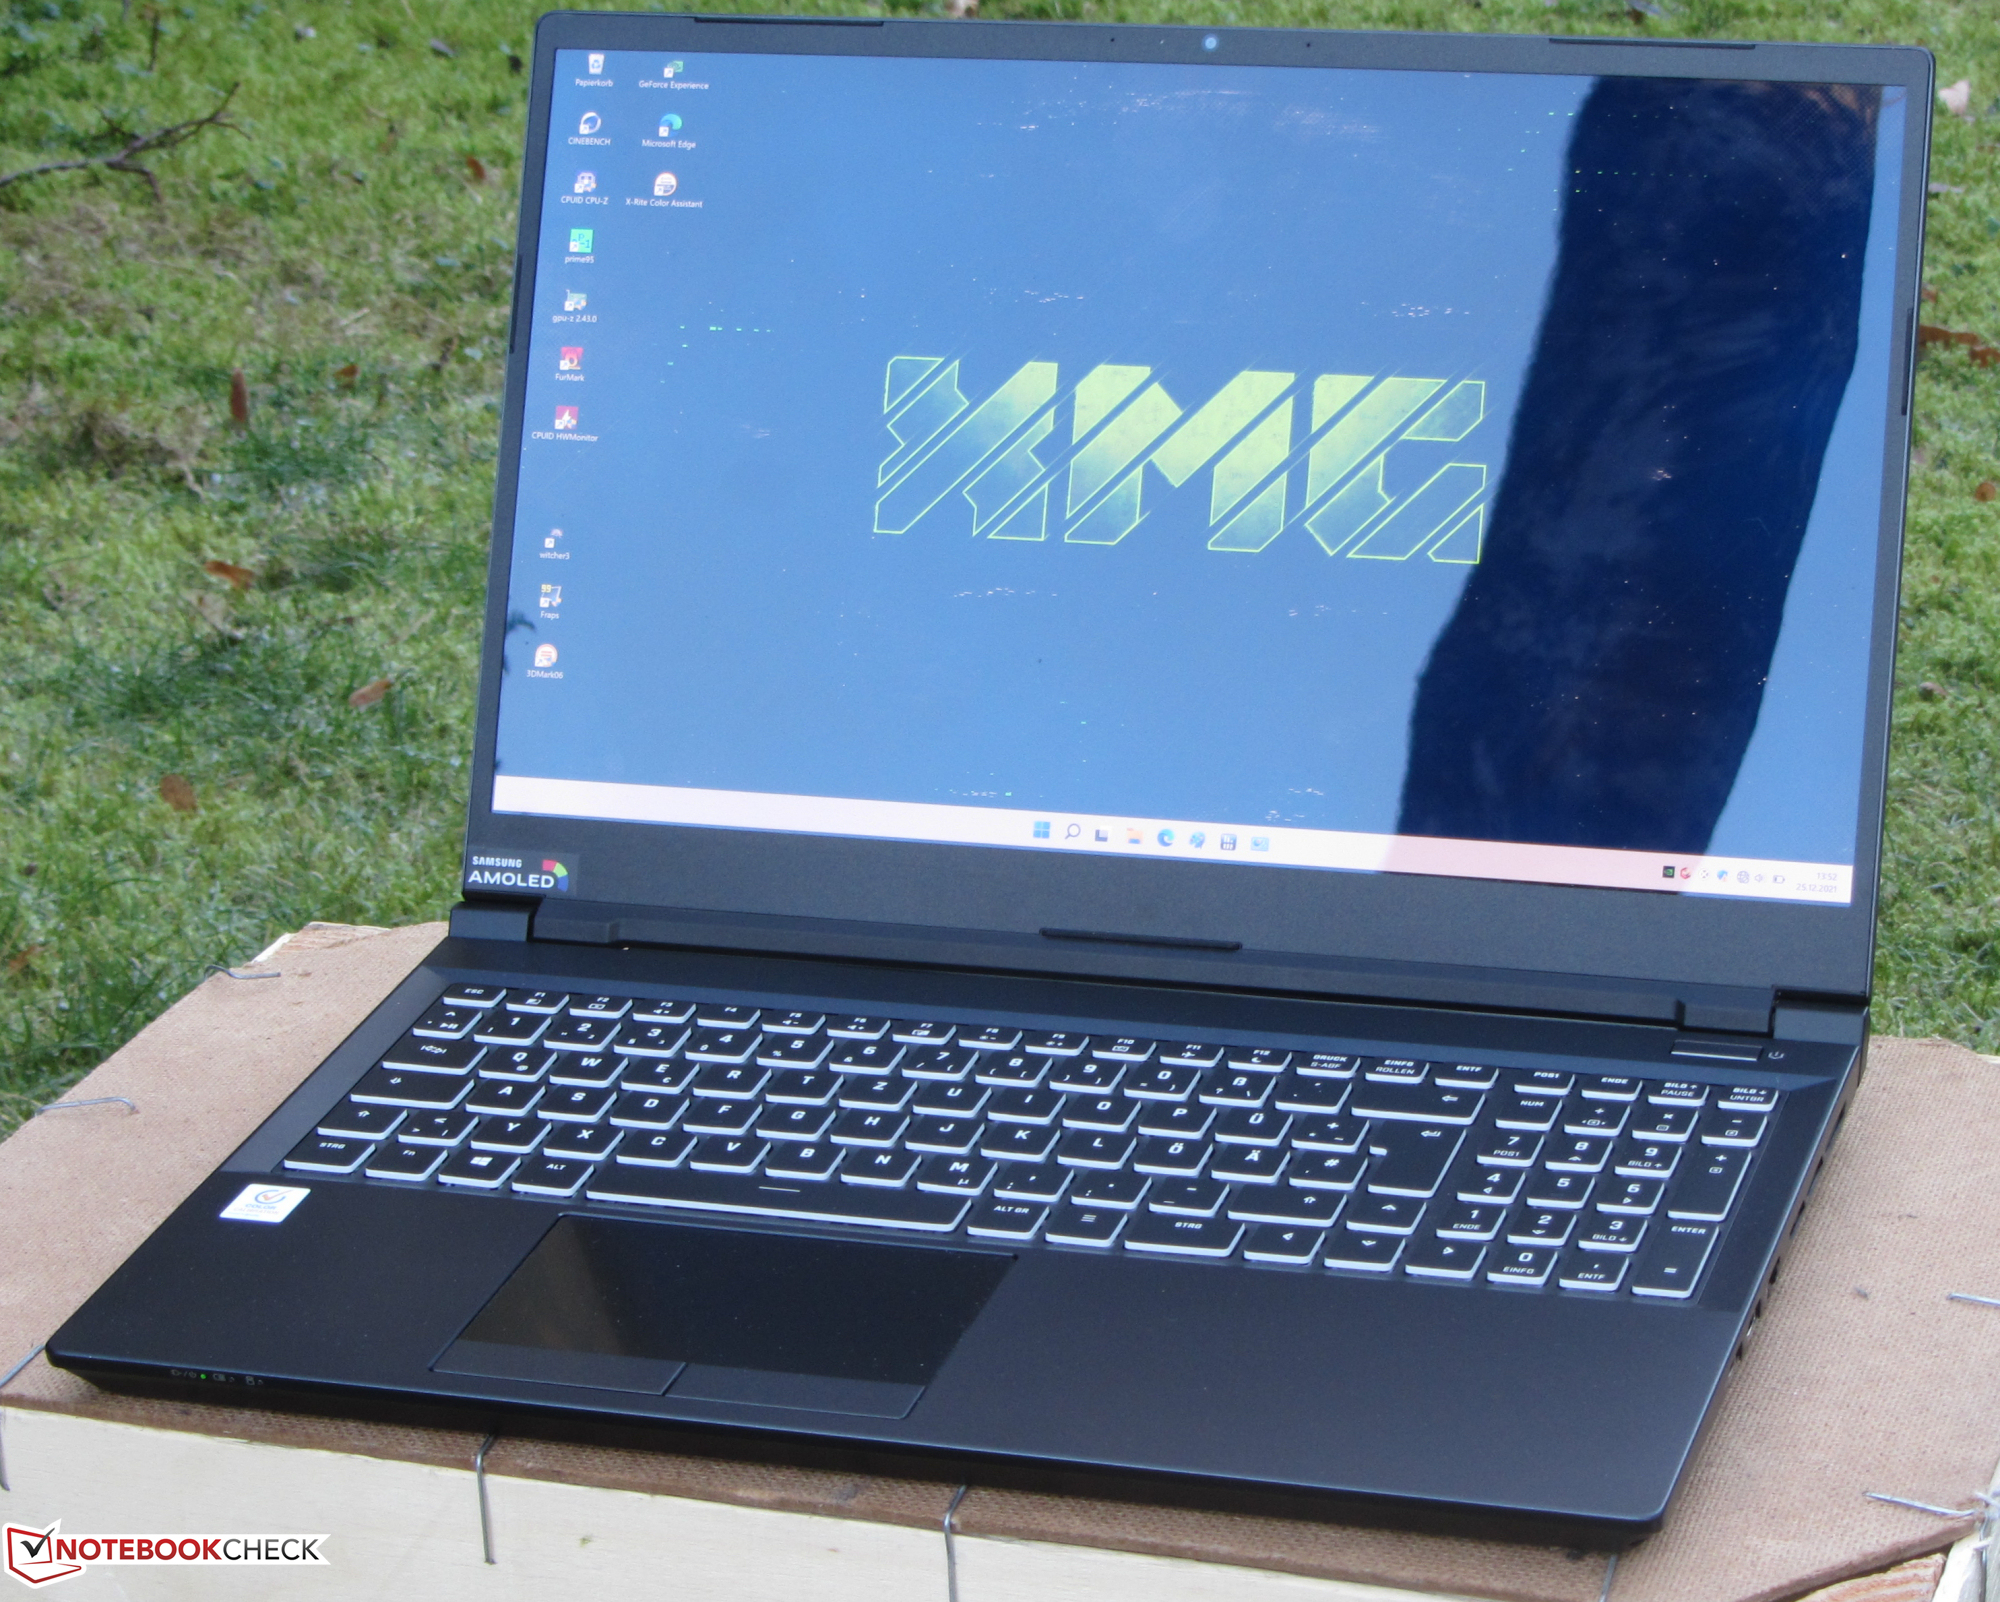
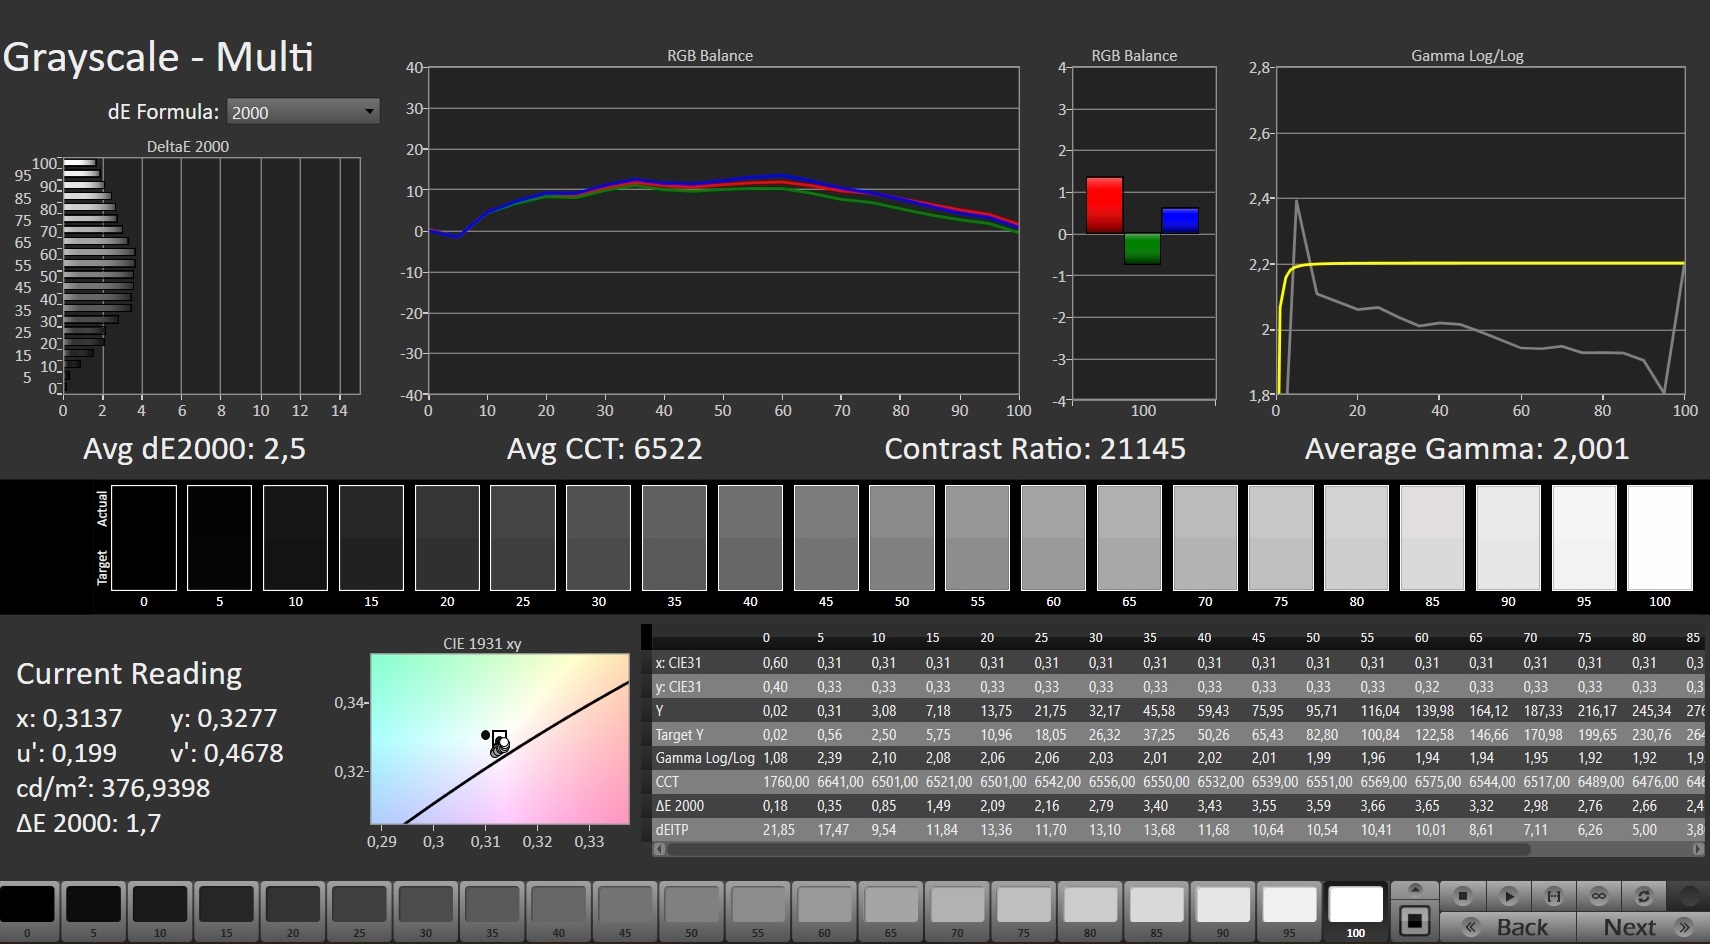
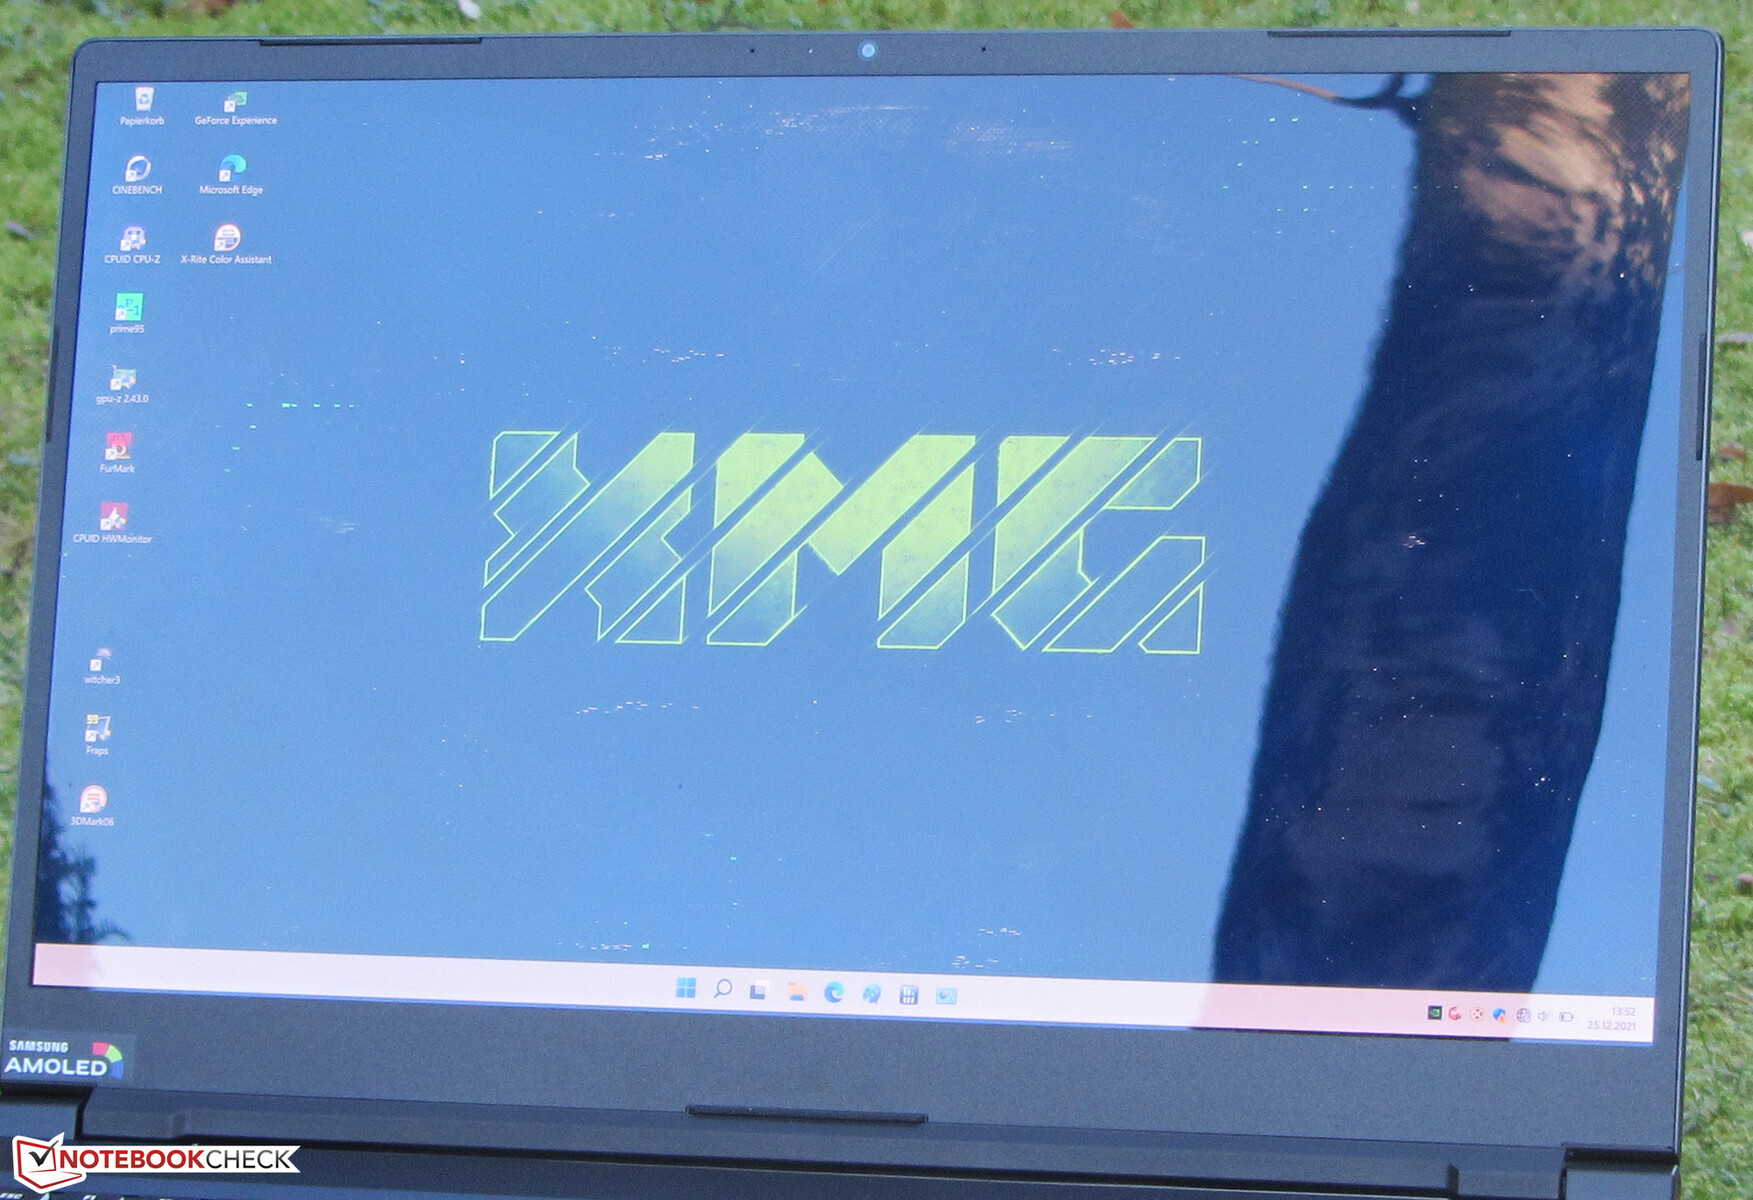
Display - Notebook da gioco con un pannello OLED 4K
Lo schermo OLED riflettente (3840 x 2160 pixel) offre un eccellente rapporto di contrasto (22150:1) così come il valore del nero (0,02) e brevi tempi di risposta. Anche la luminosità (433,7 nits) è piacevolmente alta. A livelli di luminosità dell'81% e inferiori, i nostri dispositivi di misurazione rilevano uno sfarfallio con una frequenza da 60 a 240 Hz. A causa della bassa frequenza, gli utenti sensibili possono soffrire di mal di testa o affaticamento della vista. In alternativa al pannello OLED, Schenker offre anche un display FHD opaco (IPS, 300 Hz). Lo stesso pannello può essere trovato sul Early-2021-Modell des XMG Proche abbiamo anche recensito
| |||||||||||||||||||||||||
Distribuzione della luminosità: 94 %
Al centro con la batteria: 443 cd/m²
Contrasto: 22150:1 (Nero: 0.02 cd/m²)
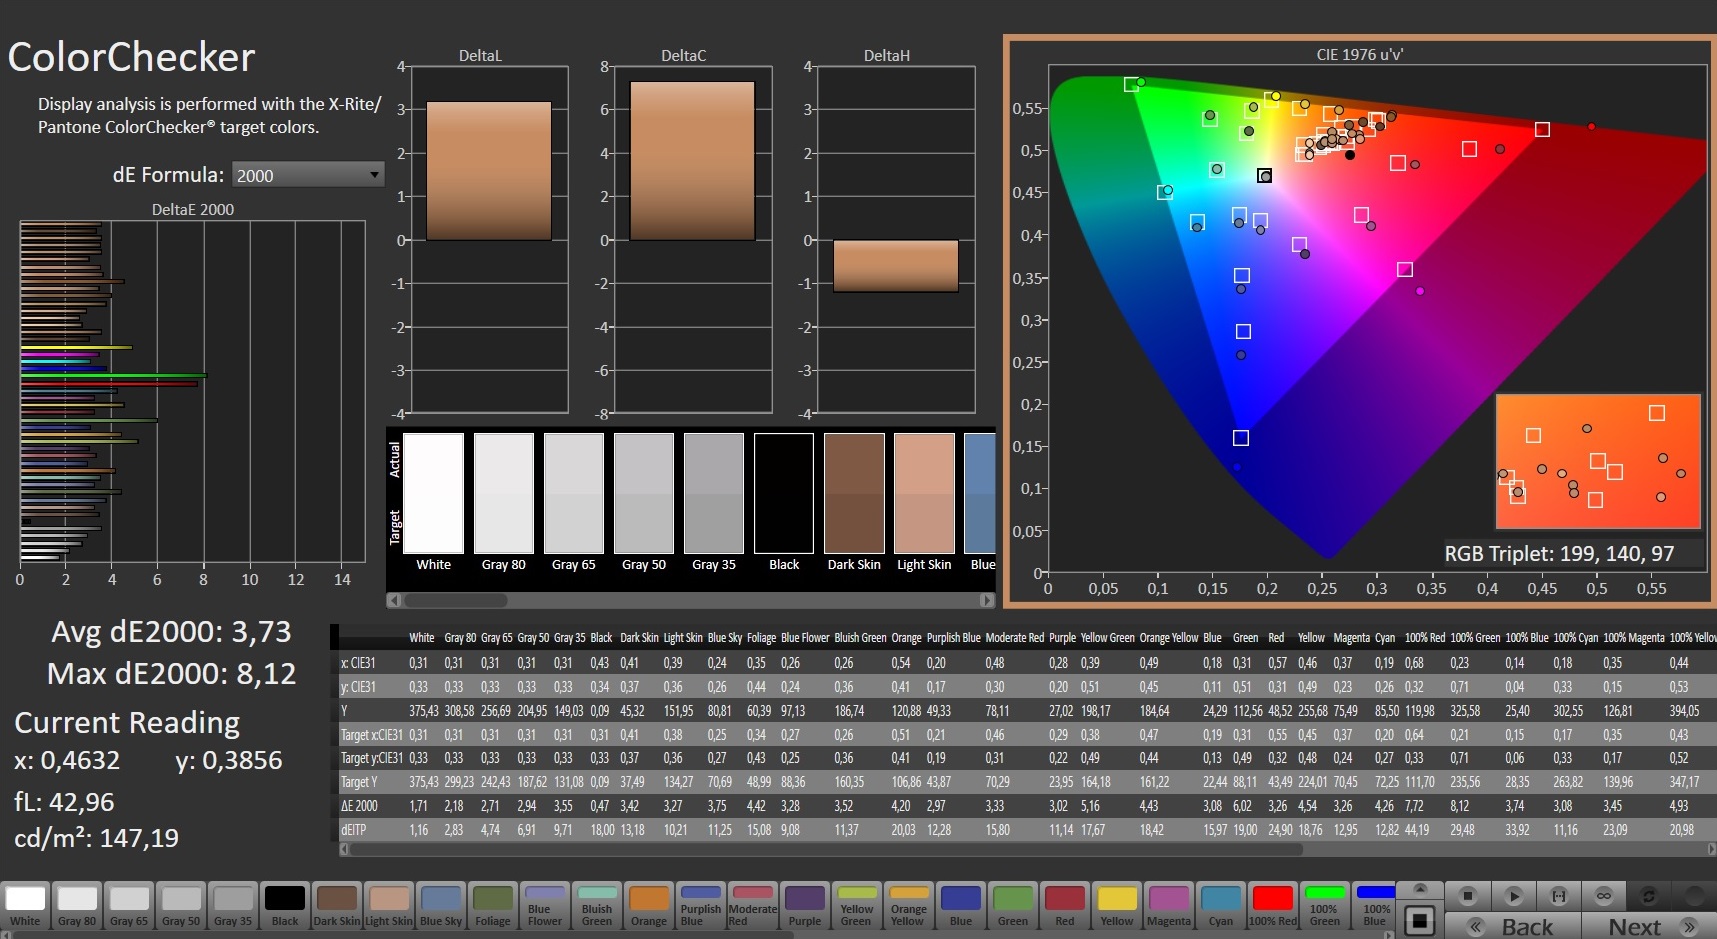
ΔE Color 3.73 | 0.5-29.43 Ø5
ΔE Greyscale 2.5 | 0.57-98 Ø5.3
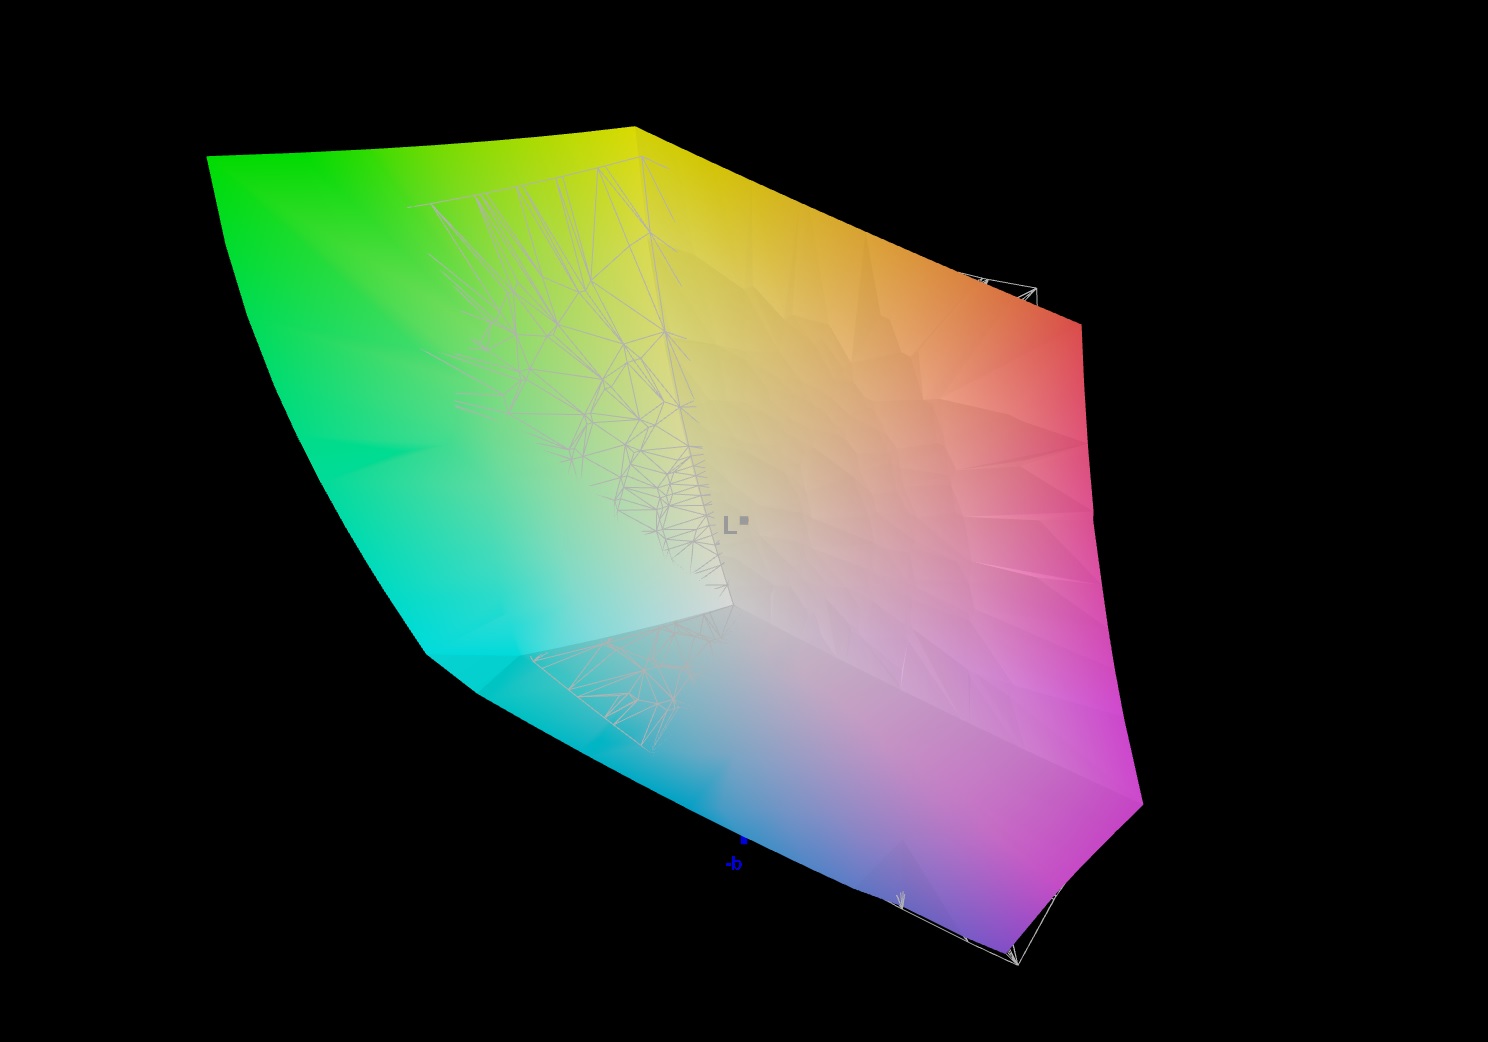
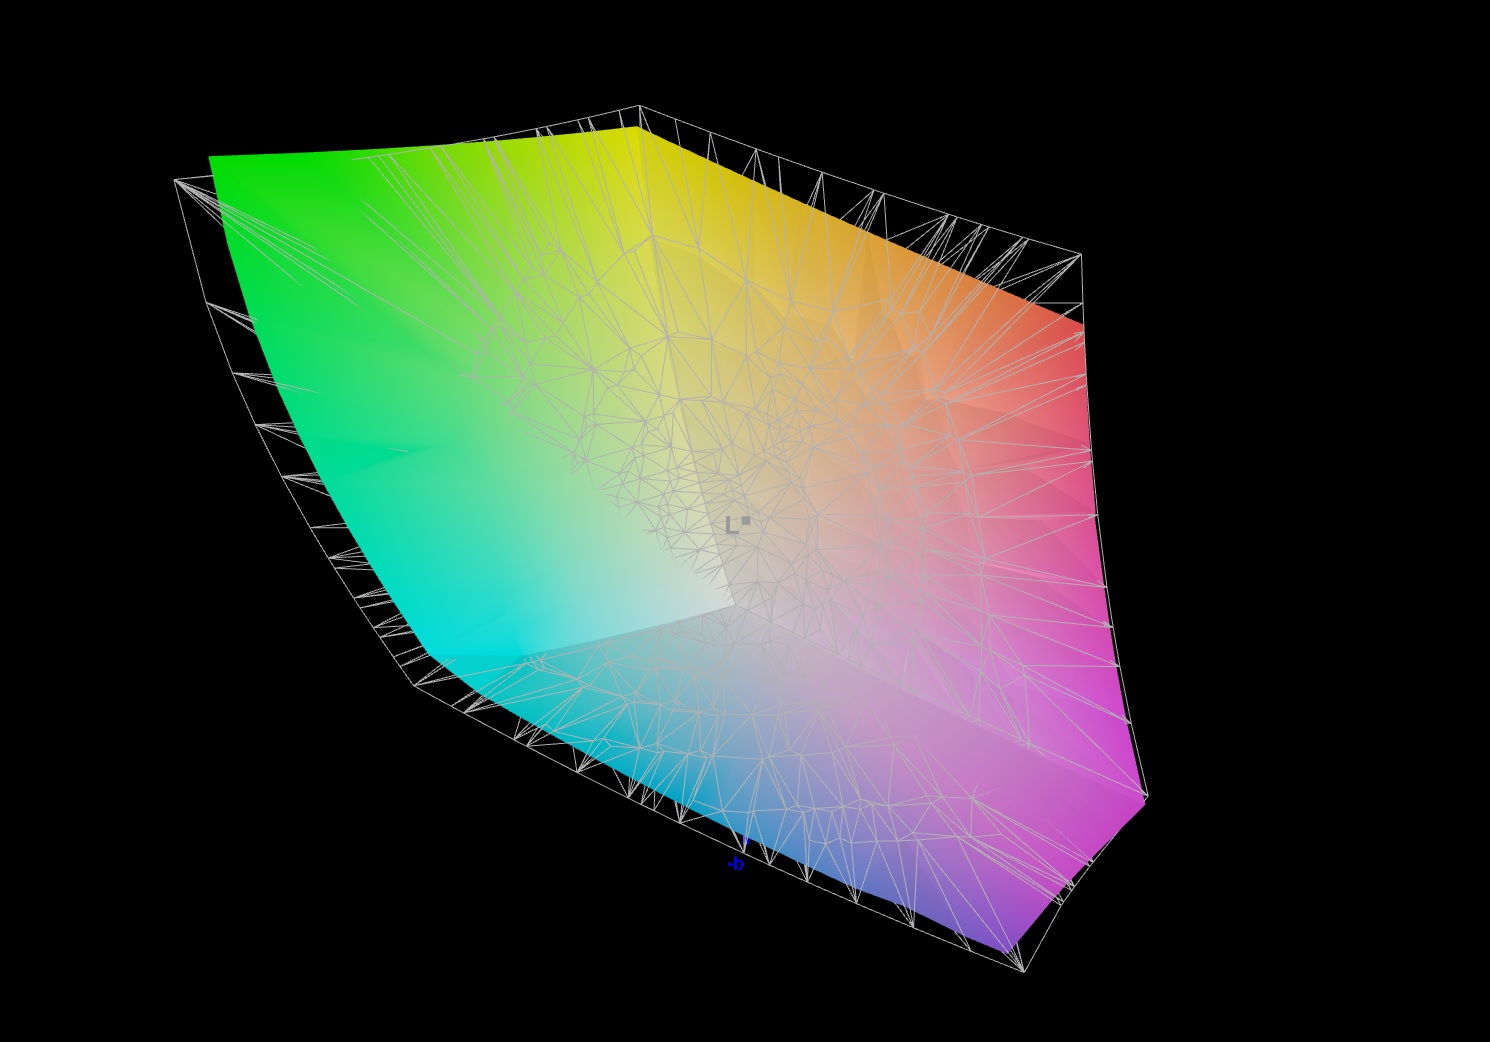
89.1% AdobeRGB 1998 (Argyll 2.2.0 3D)
97.7% sRGB (Argyll 2.2.0 3D)
81.2% Display P3 (Argyll 2.2.0 3D)
Gamma: 2.001
| SCHENKER XMG Pro 15 (Late 2021) Samsung ATNA56WR14-0, OLED, 3840x2160, 15.60 | Lenovo Legion S7 15ACH6 82K80030GE CSOT T3 MNF601EA1-6, IPS, 3840x2160, 15.60 | Alienware x15 RTX 3070 P111F LG Philips 156QHG, IPS, 2560x1440, 15.60 | Razer Blade 15 Advanced (Mid 2021) TL156VDXP02-0, IPS, 1920x1080, 15.60 | SCHENKER XMG Pro 15 (Early 2021, RTX 3080) AU Optronics AUO7A8C (B156HAN12.0), IPS, 1920x1080, 15.60 | MSI Delta 15 A5EFK LQ156M1JW03 (SHP155D), IPS-Level, 1920x1080, 15.60 | |
|---|---|---|---|---|---|---|
| Display | 5% | 11% | -14% | -11% | -14% | |
| Display P3 Coverage | 81.2 | 85.2 5% | 97.8 20% | 66.9 -18% | 69.2 -15% | 66.5 -18% |
| sRGB Coverage | 97.7 | 98.8 1% | 99.9 2% | 97.1 -1% | 99.7 2% | 97.8 0% |
| AdobeRGB 1998 Coverage | 89.1 | 98.2 10% | 69 -23% | 70.8 -21% | 67.6 -24% | |
| Response Times | -894% | -413% | -278% | -269% | 12783% | |
| Response Time Grey 50% / Grey 80% * | 3.2 ? | 31.6 ? -888% | 12 ? -275% | 4.2 ? -31% | 3.6 ? -13% | 12.8 ? -300% |
| Response Time Black / White * | 1.6 ? | 16 ? -900% | 10.4 ? -550% | 10 ? -525% | 10 ? -525% | 10.4 ? -550% |
| PWM Frequency | 60 ? | 23580 ? 39200% | ||||
| Screen | -222% | -305% | -194% | -133% | -240% | |
| Brightness middle | 443 | 607 37% | 409.5 -8% | 353.4 -20% | 327 -26% | 291 -34% |
| Brightness | 434 | 605 39% | 390 -10% | 340 -22% | 335 -23% | 266 -39% |
| Brightness Distribution | 94 | 93 -1% | 88 -6% | 92 -2% | 89 -5% | 88 -6% |
| Black Level * | 0.02 | 0.41 -1950% | 0.47 -2250% | 0.31 -1450% | 0.22 -1000% | 0.36 -1700% |
| Contrast | 22150 | 1480 -93% | 871 -96% | 1140 -95% | 1486 -93% | 808 -96% |
| Colorchecker dE 2000 * | 3.73 | 0.84 77% | 3.48 7% | 2.17 42% | 2.18 42% | 2.98 20% |
| Colorchecker dE 2000 max. * | 8.12 | 3.02 63% | 6.31 22% | 5.69 30% | 4.24 48% | 7.59 7% |
| Greyscale dE 2000 * | 2.5 | 1.1 56% | 5 -100% | 3.4 -36% | 2.6 -4% | 4.2 -68% |
| Gamma | 2.001 110% | 2.131 103% | 2.16 102% | 2.2 100% | 2.123 104% | 2.293 96% |
| CCT | 6522 100% | 6648 98% | 6591 99% | 6830 95% | 6815 95% | 7624 85% |
| Colorchecker dE 2000 calibrated * | 0.69 | 0.89 | 1.05 | 1 | 0.91 | |
| Color Space (Percent of AdobeRGB 1998) | 71 | |||||
| Color Space (Percent of sRGB) | 93 | |||||
| Media totale (Programma / Settaggio) | -370% /
-273% | -236% /
-270% | -162% /
-165% | -138% /
-126% | 4176% /
2599% |
* ... Meglio usare valori piccoli
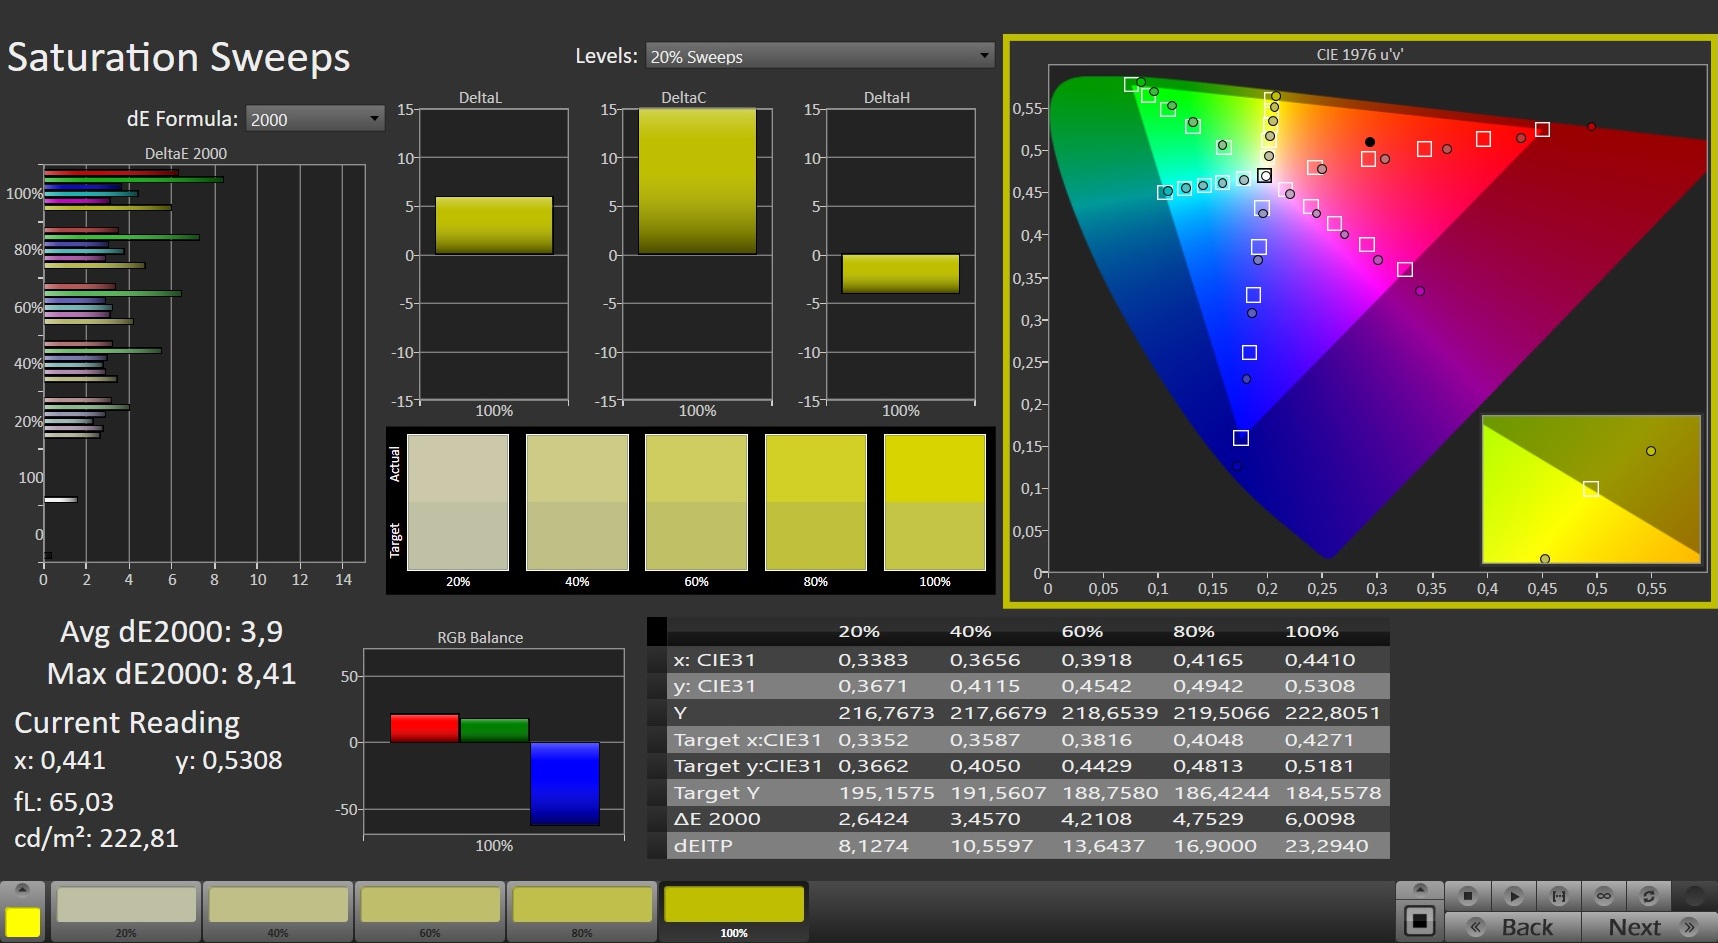
La certificazione X-Rite dello schermo assicura una rappresentazione naturale dei colori. Anche franco fabbrica, la deviazione di colore è molto bassa e impossibile da notare a occhio nudo. Il display non soffre di una tinta blu. La copertura dello spazio colore è ampia: Lo schermo può visualizzare il 98% e l'89% degli spazi colore sRGB e AdobeRGB, rispettivamente (potremmo ritestare questo, dato che Schenker raggiunge il 100% nei propri test)
Tempi di risposta del Display
| ↔ Tempi di risposta dal Nero al Bianco | ||
|---|---|---|
| 1.6 ms ... aumenta ↗ e diminuisce ↘ combinato | ↗ 1 ms Incremento |  |
| ↘ 0.6 ms Calo | ||
| Lo schermo ha mostrato valori di risposta molto veloci nei nostri tests ed è molto adatto per i gaming veloce. In confronto, tutti i dispositivi di test variano da 0.1 (minimo) a 240 (massimo) ms. » 4 % di tutti i dispositivi è migliore. Questo significa che i tempi di risposta rilevati sono migliori rispettto alla media di tutti i dispositivi testati (21.5 ms). | ||
| ↔ Tempo di risposta dal 50% Grigio all'80% Grigio | ||
| 3.2 ms ... aumenta ↗ e diminuisce ↘ combinato | ↗ 1.2 ms Incremento | 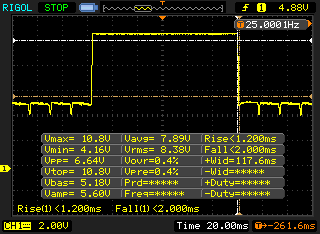 |
| ↘ 2 ms Calo | ||
| Lo schermo ha mostrato valori di risposta molto veloci nei nostri tests ed è molto adatto per i gaming veloce. In confronto, tutti i dispositivi di test variano da 0.2 (minimo) a 636 (massimo) ms. » 8 % di tutti i dispositivi è migliore. Questo significa che i tempi di risposta rilevati sono migliori rispettto alla media di tutti i dispositivi testati (33.7 ms). | ||
Sfarfallio dello schermo / PWM (Pulse-Width Modulation)
| flickering dello schermo / PWM rilevato | 60 Hz | ≤ 81 % settaggio luminosita' | 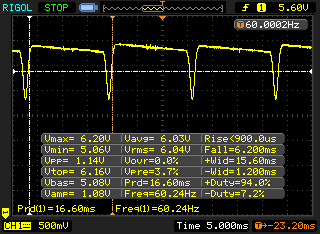 |
Il display sfarfalla a 60 Hz (Probabilmente a causa dell'uso di PWM) Flickering rilevato ad una luminosita' di 81 % o inferiore. Non dovrebbe verificarsi flickering o PWM sopra questo valore di luminosita'. La frequenza di 60 Hz è molto bassa, quindi il flickering potrebbe causare stanchezza agli occhi e mal di testa con un utilizzo prolungato. In confronto: 53 % di tutti i dispositivi testati non utilizza PWM per ridurre la luminosita' del display. Se è rilevato PWM, una media di 17900 (minimo: 5 - massimo: 3846000) Hz è stata rilevata. | |||
Poiché il pannello ha buoni angoli di visione, può essere letto da qualsiasi posizione. All'esterno, la lettura del contenuto del display può essere difficile a causa della sua natura riflettente

Prestazioni - Sufficienti per gli anni a venire
Con l'XMG Pro 15, Schenker ha creato un notebook da gioco sottile e compatto da 15,6 pollici con riserve di prestazioni sufficienti per far funzionare tutti i giochi attuali senza problemi

Condizioni di test
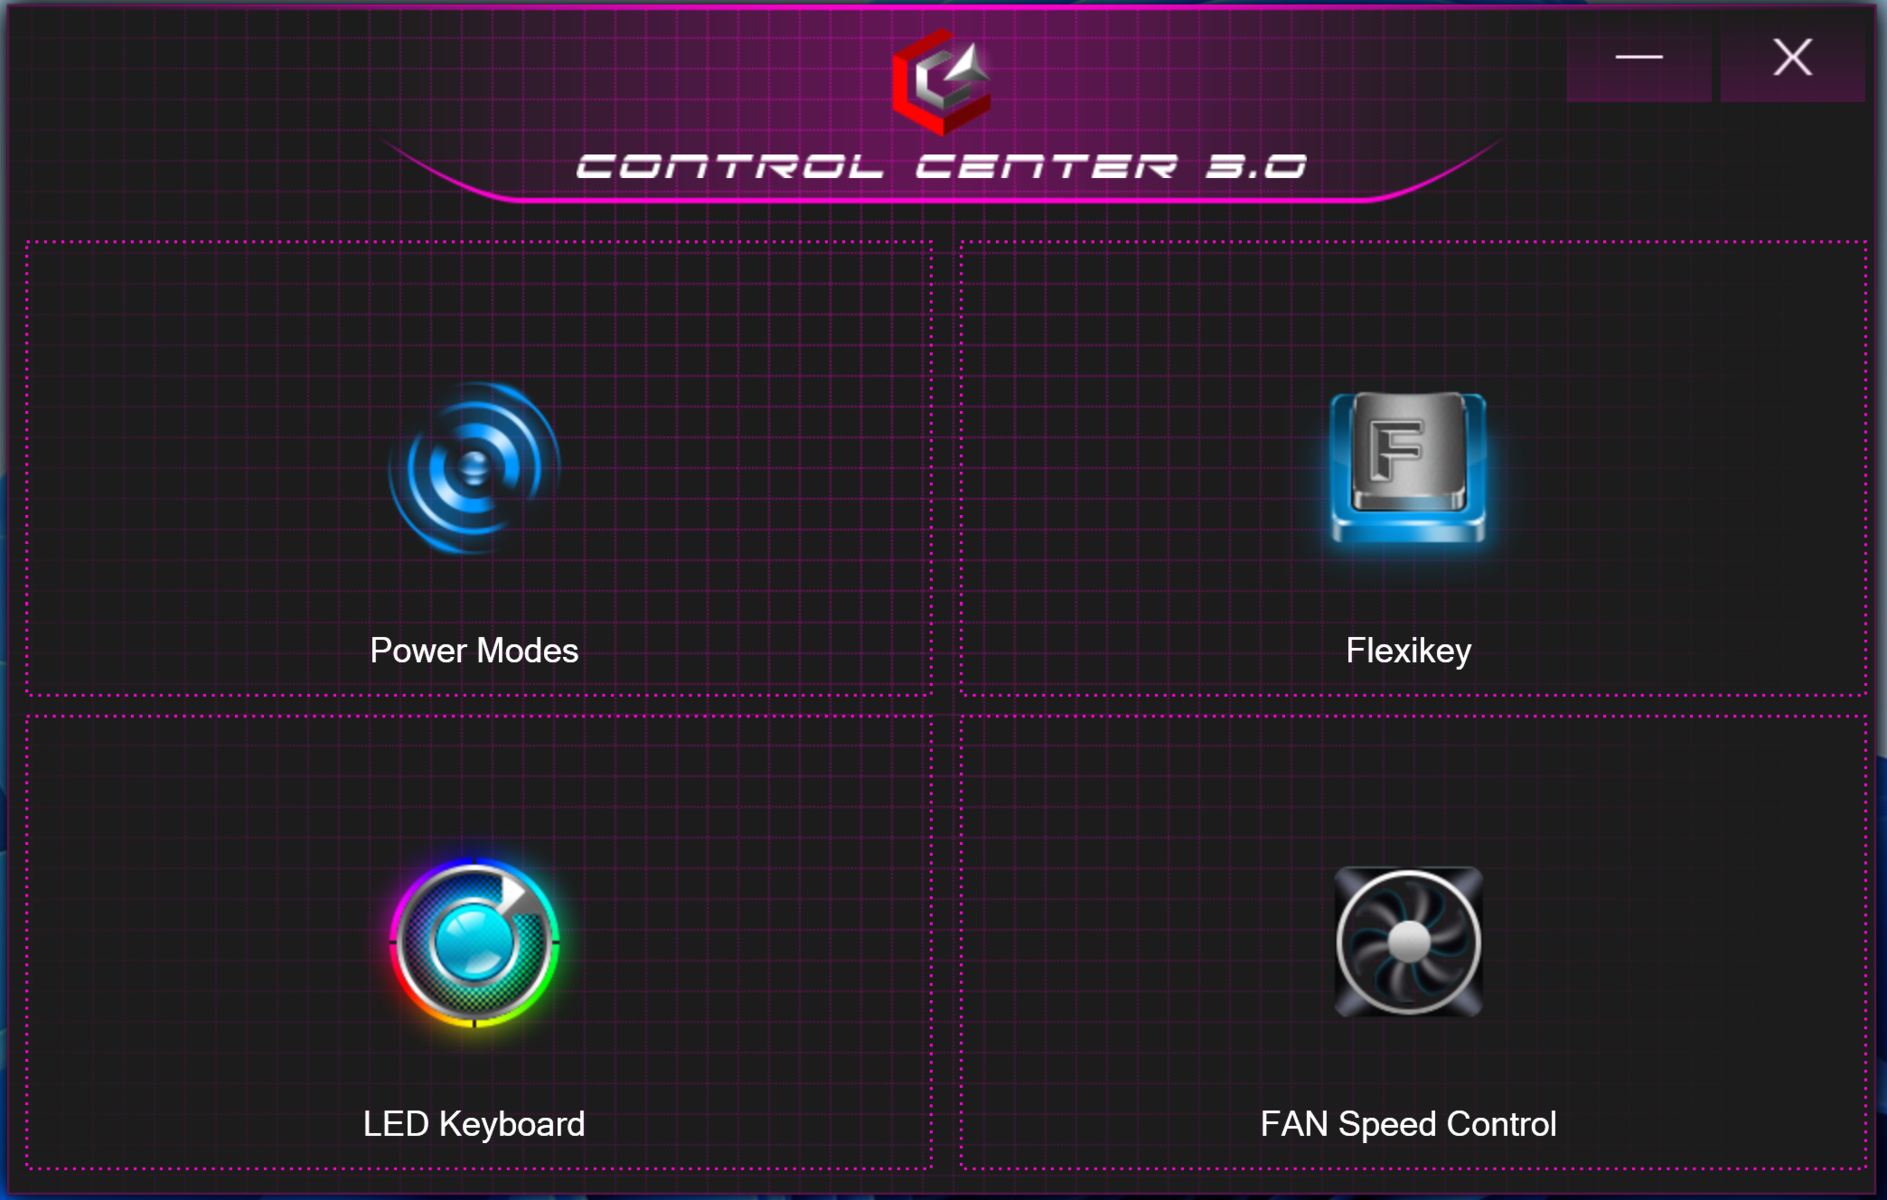
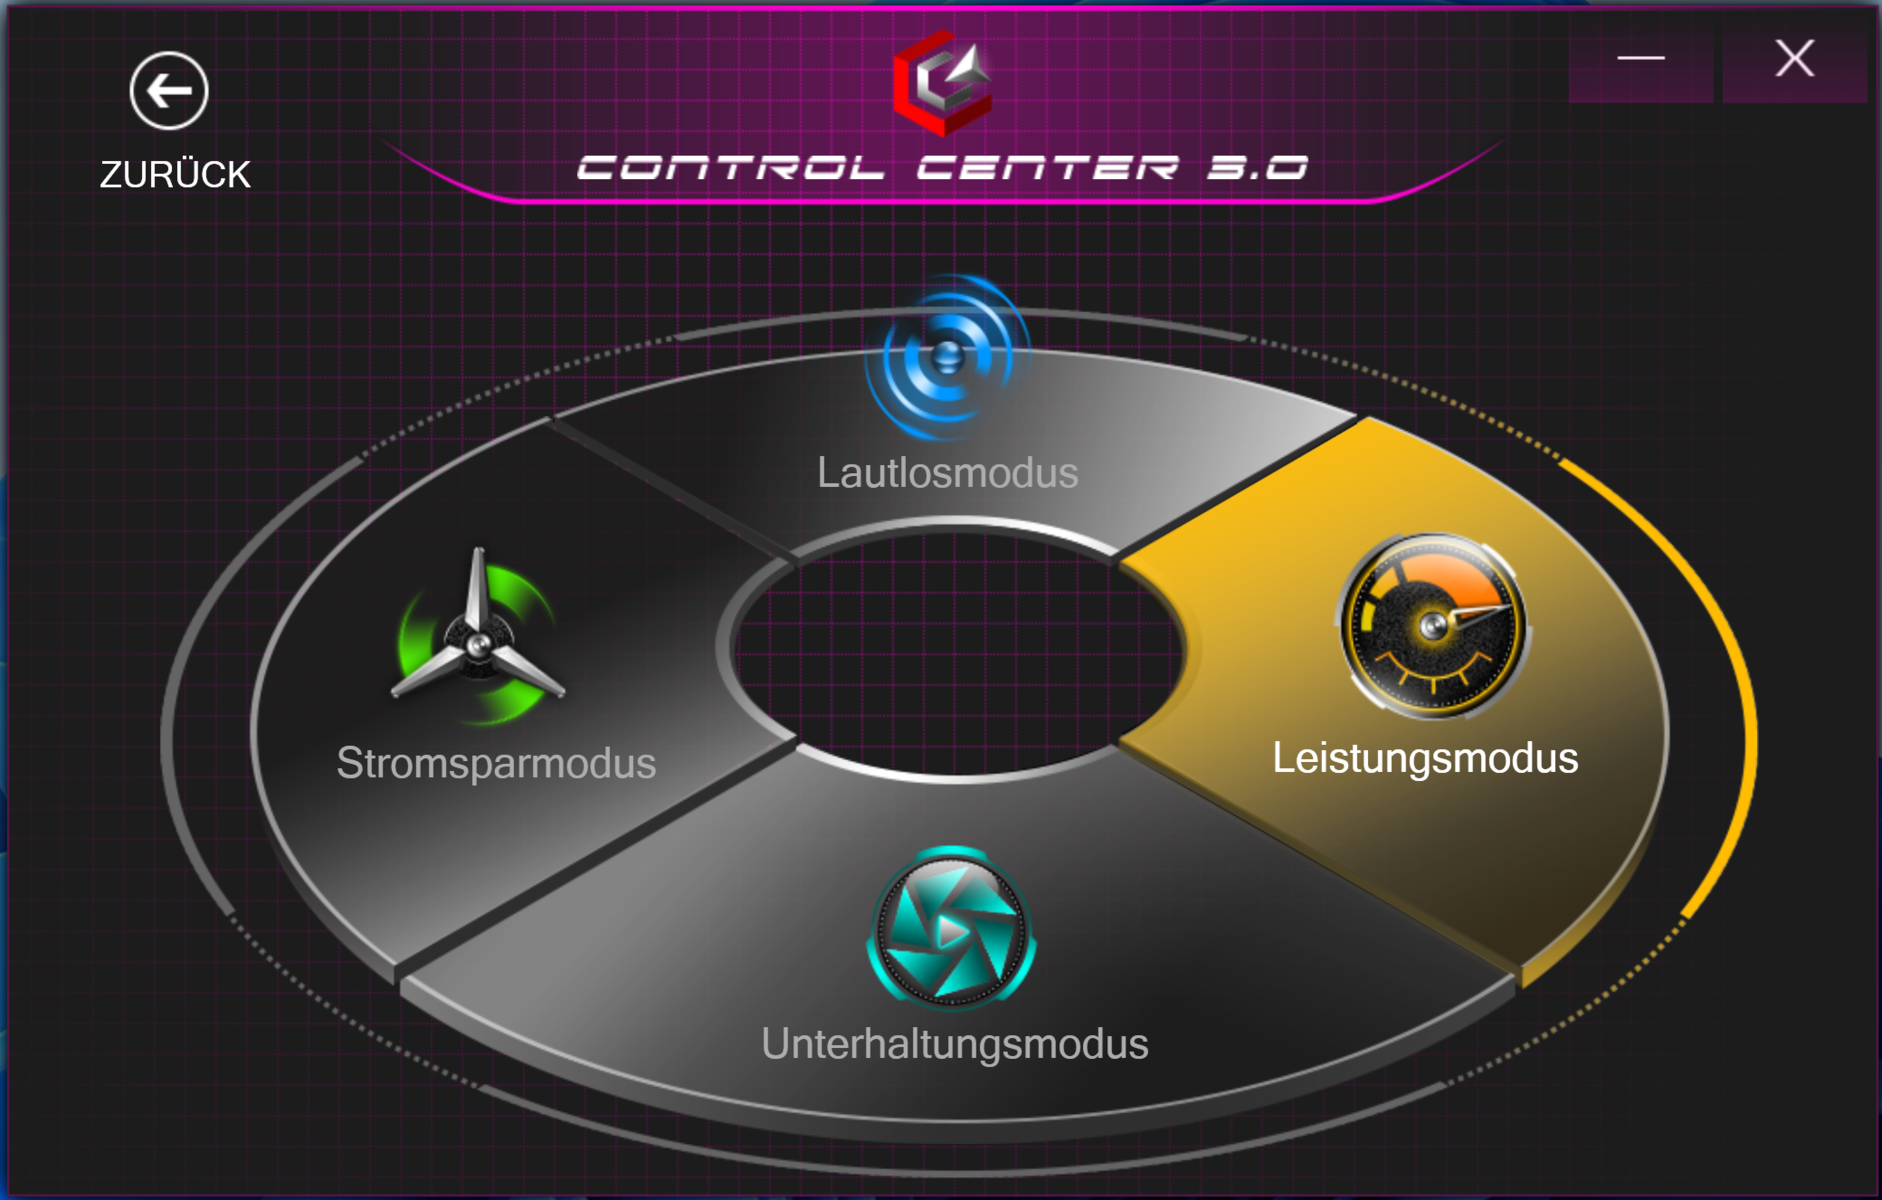
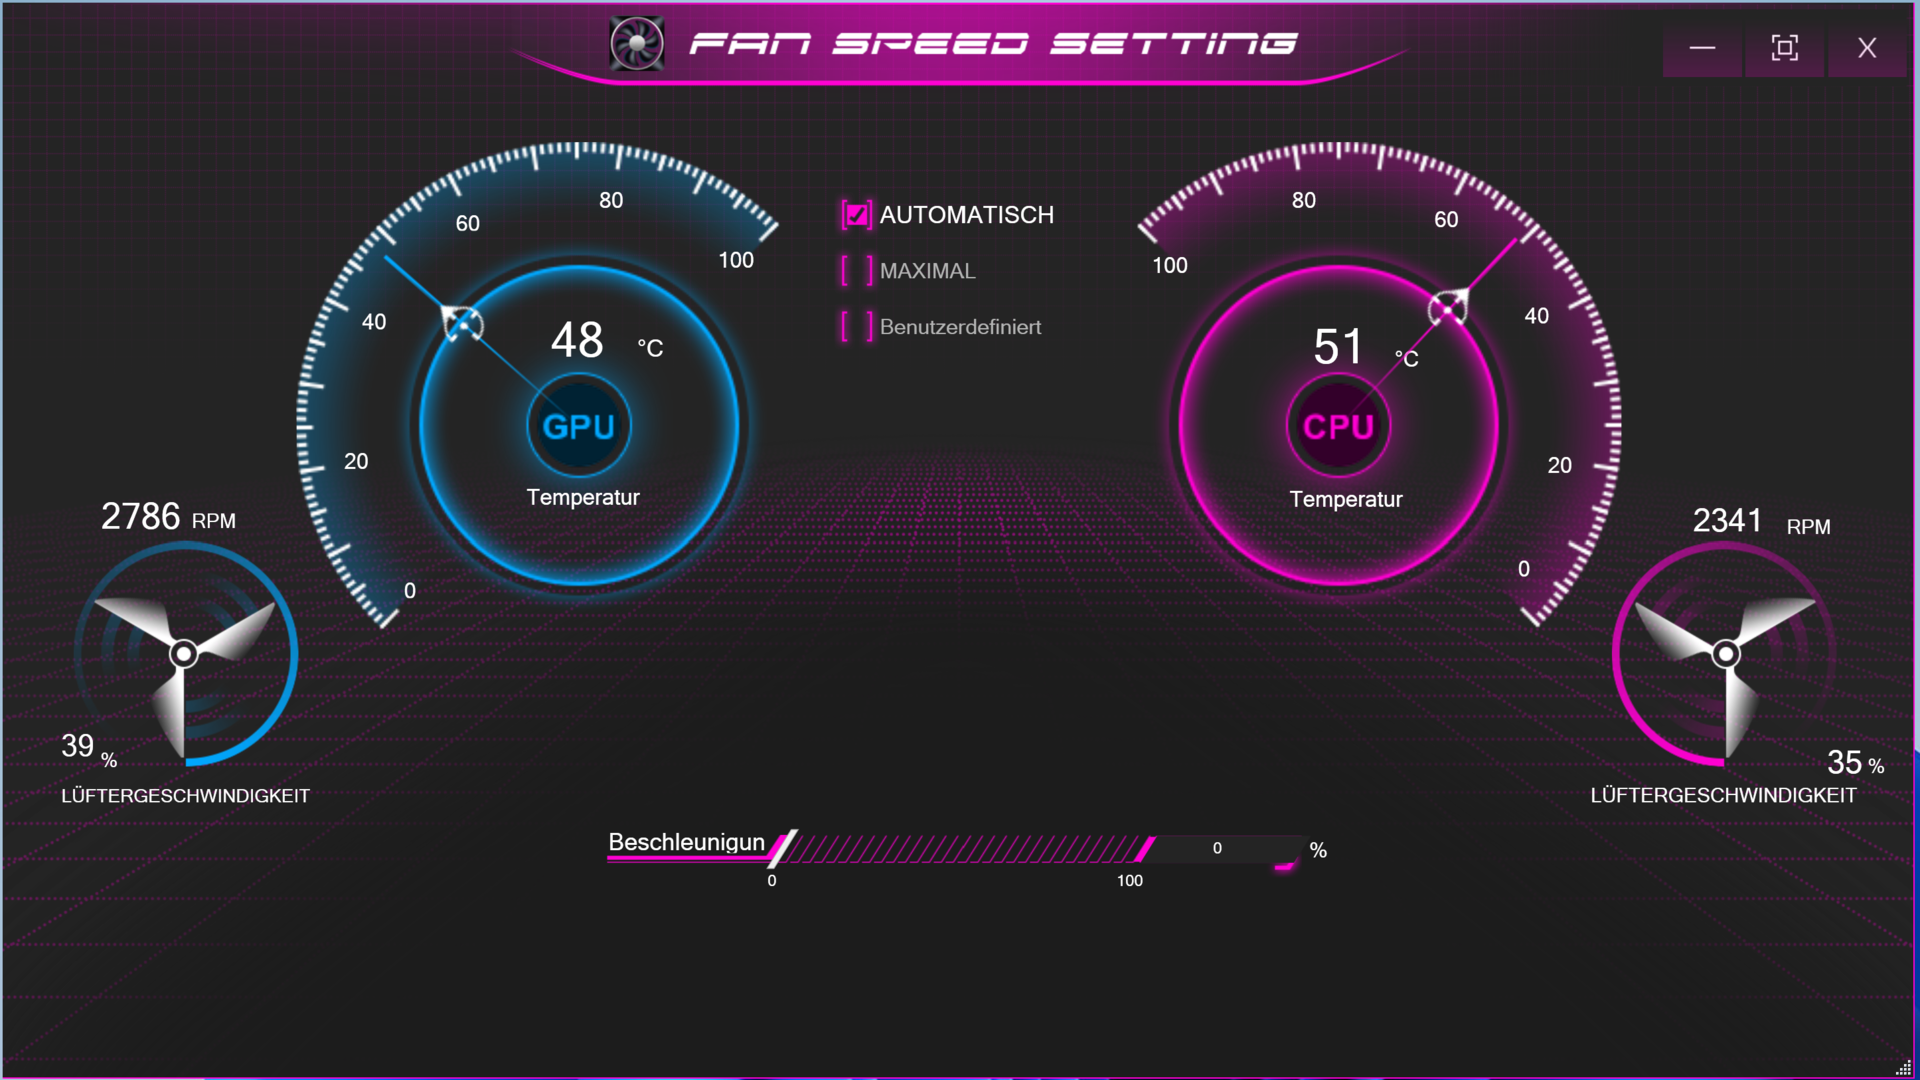
Il software preinstallato Control Center permette agli utenti di selezionare un profilo di potenza (vedi tabella), tra le altre cose. Il profilo di prestazione con controllo automatico della ventola è stato selezionato prima di eseguire qualsiasi benchmark. Diversi benchmark sono stati eseguiti anche utilizzando gli altri tre profili. I risultati possono essere trovati nelle tabelle di confronto. I test sulla durata della batteria sono stati eseguiti utilizzando la "modalità intrattenimento"
| Modalità performance | Modalità intrattenimento | Modalità risparmio energetico | Modalità silenziosa | |
|---|---|---|---|---|
| Limite di potenza 1 | 55 watts | 45 watts | 20 watts | 15 watts |
| Limite di potenza 2 | 135 watt | 90 watt | 90 watt | 90 watt |
| max. TGP | 105 watt | 90 watt | 80 watt | 80 watt |
Processore
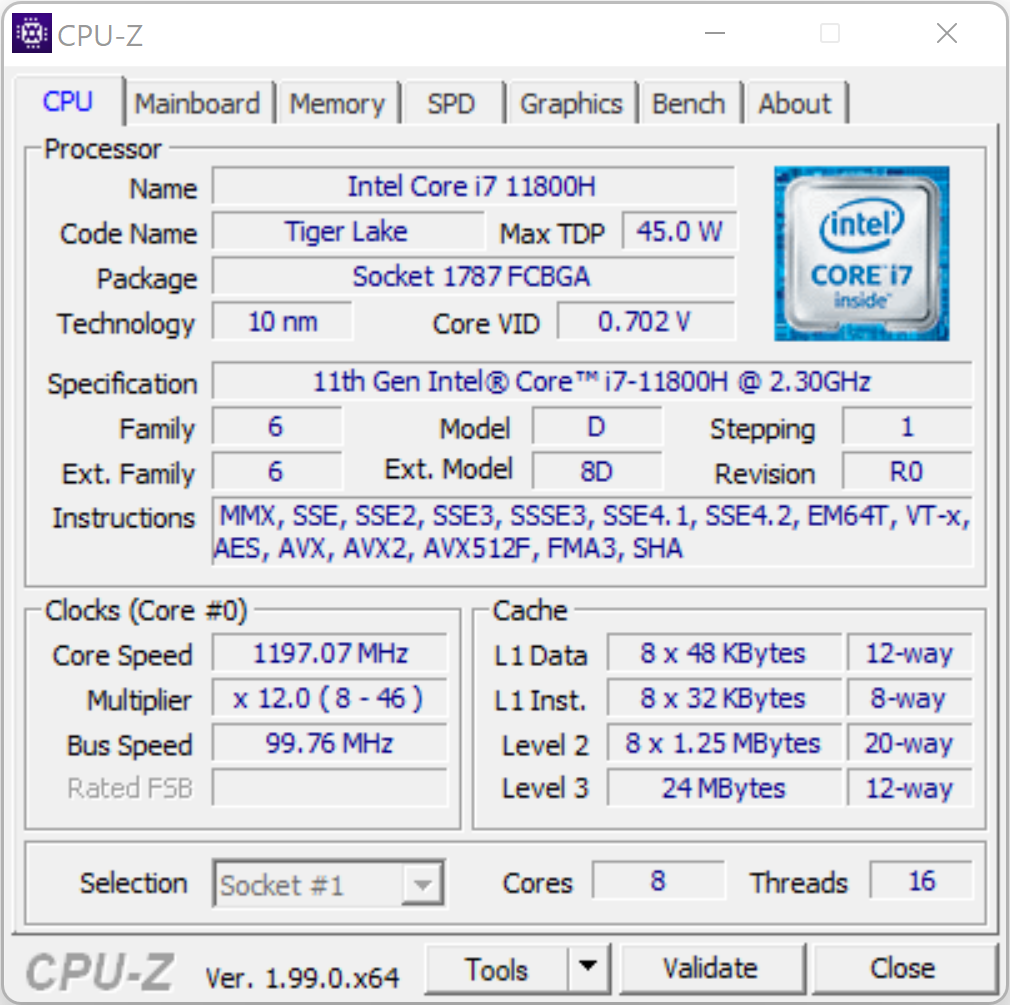
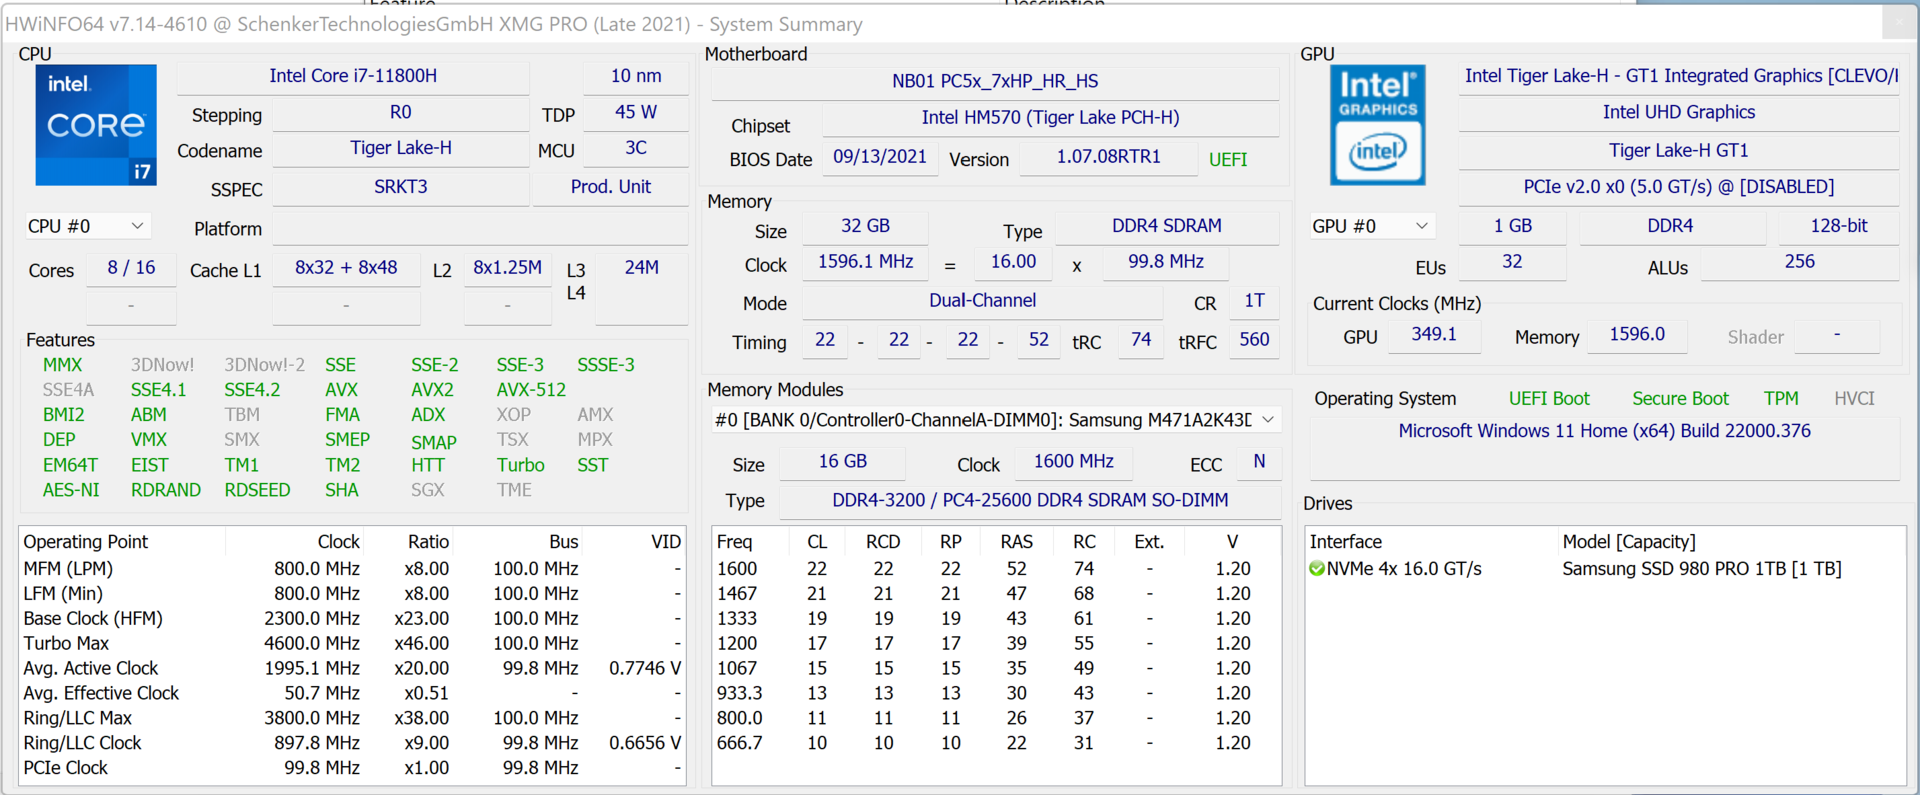
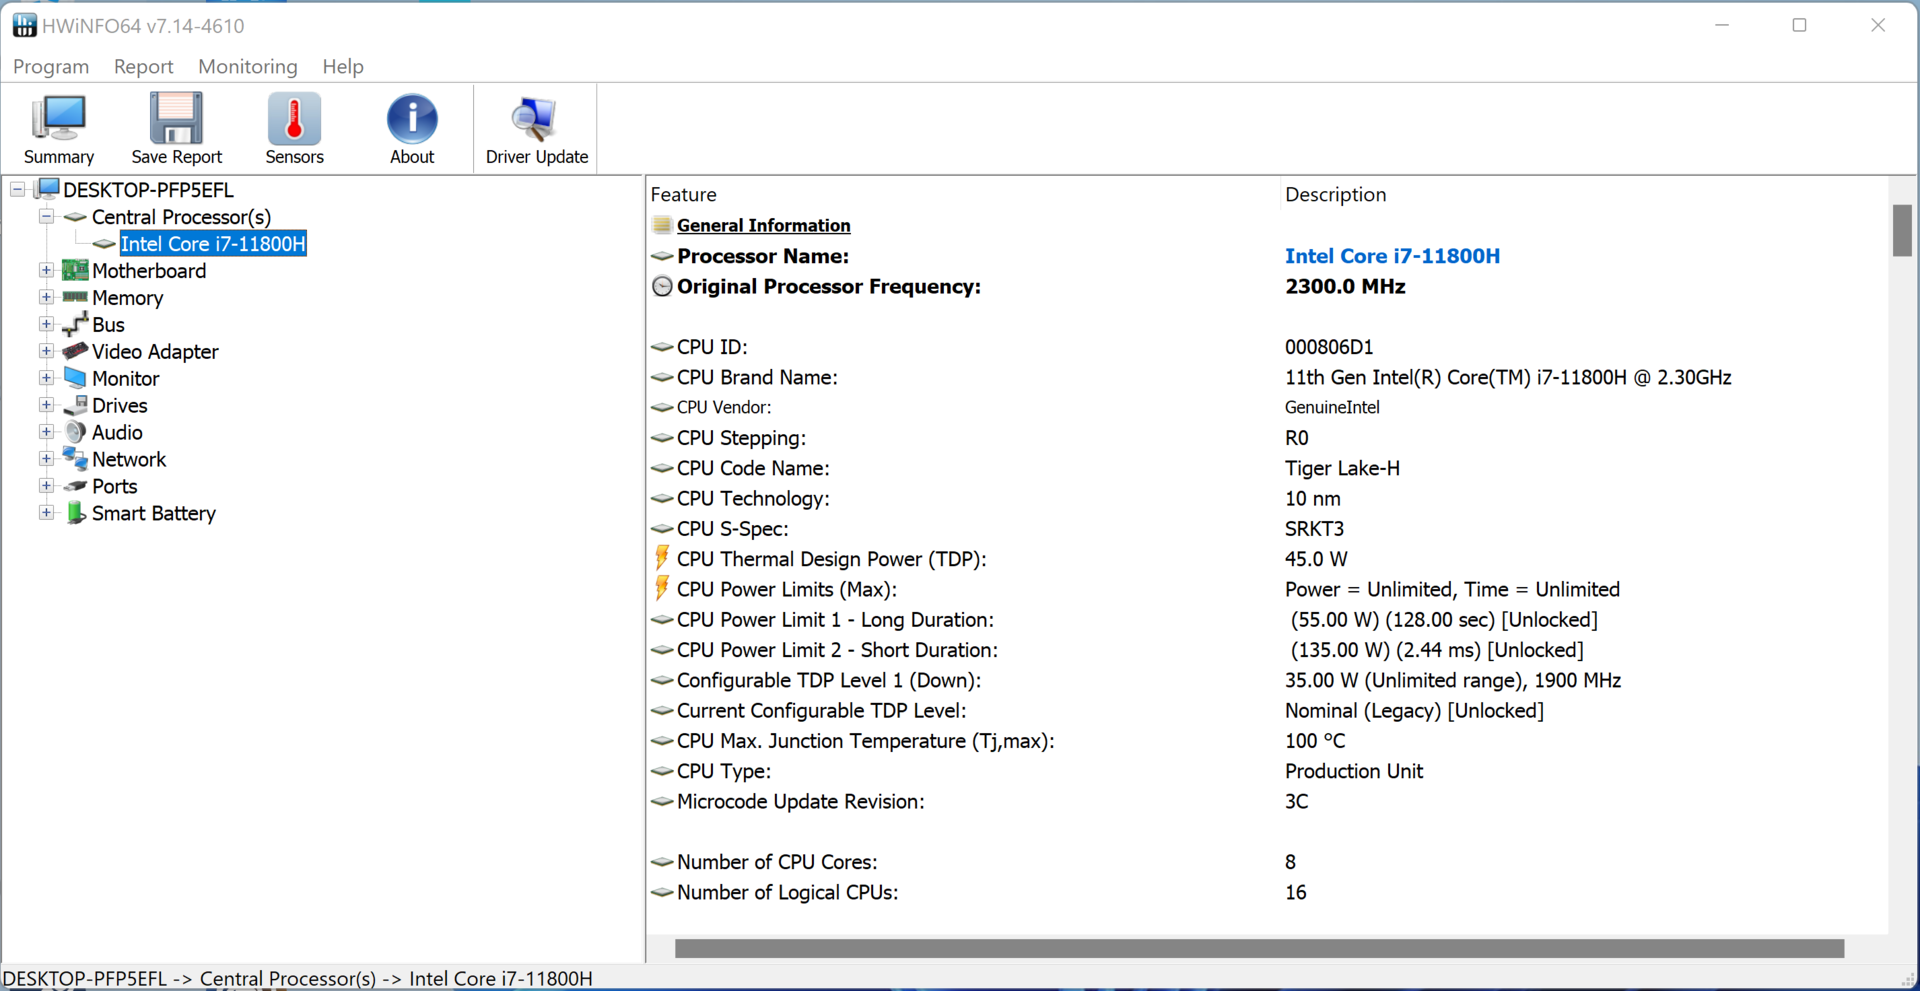
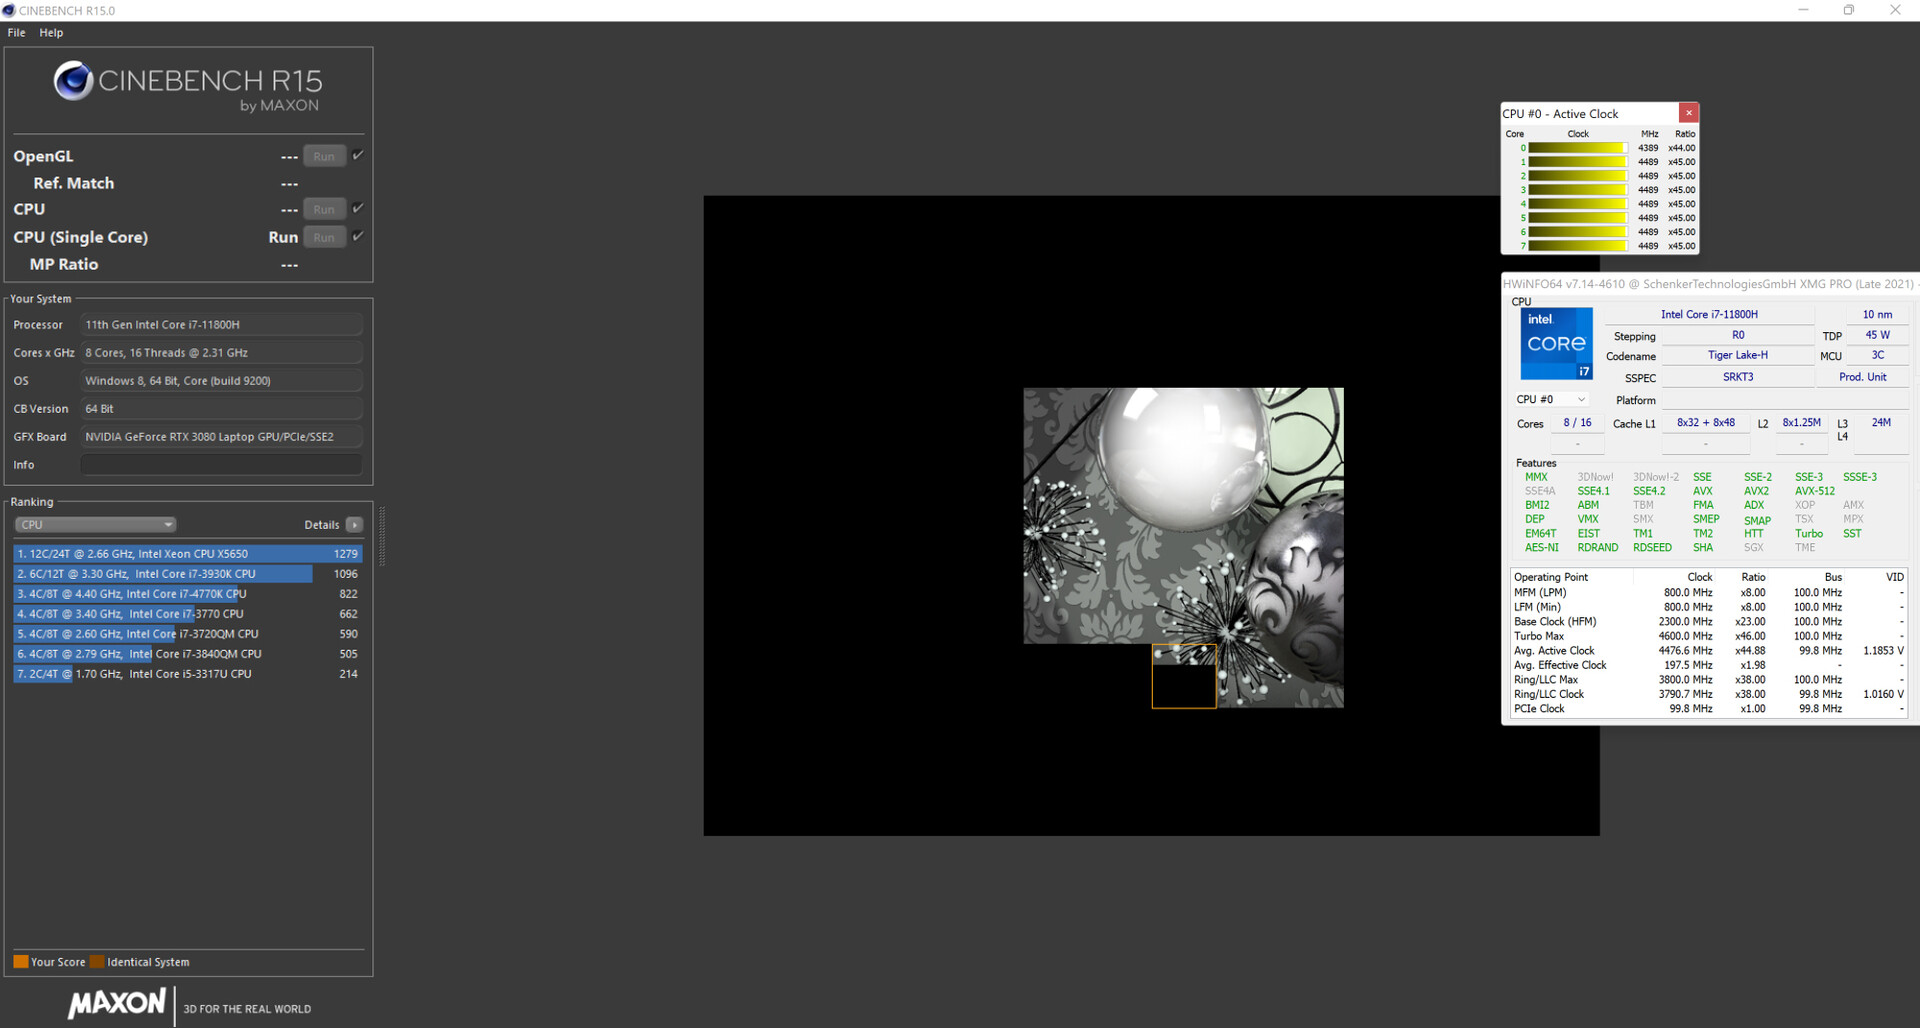
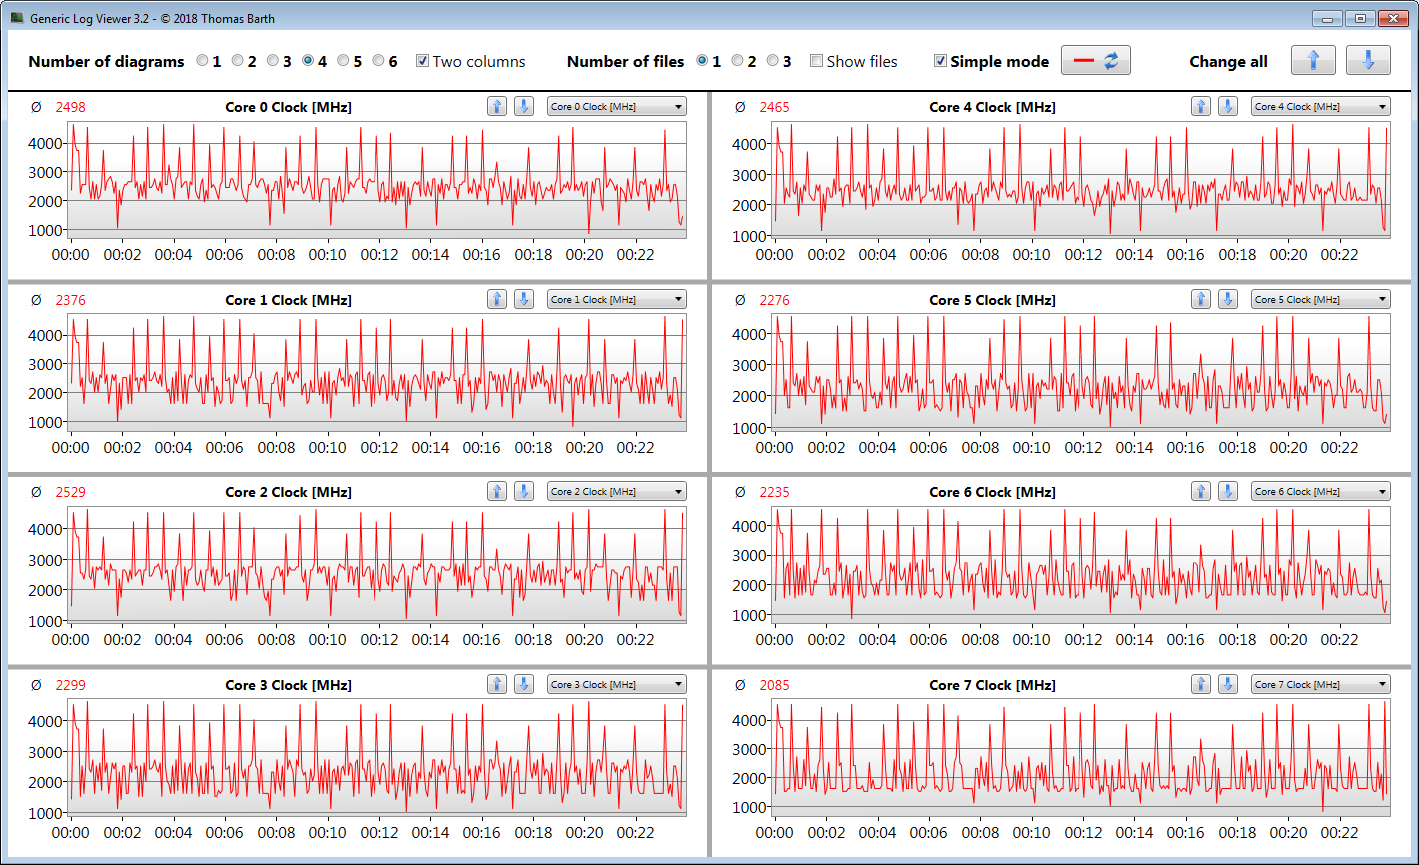
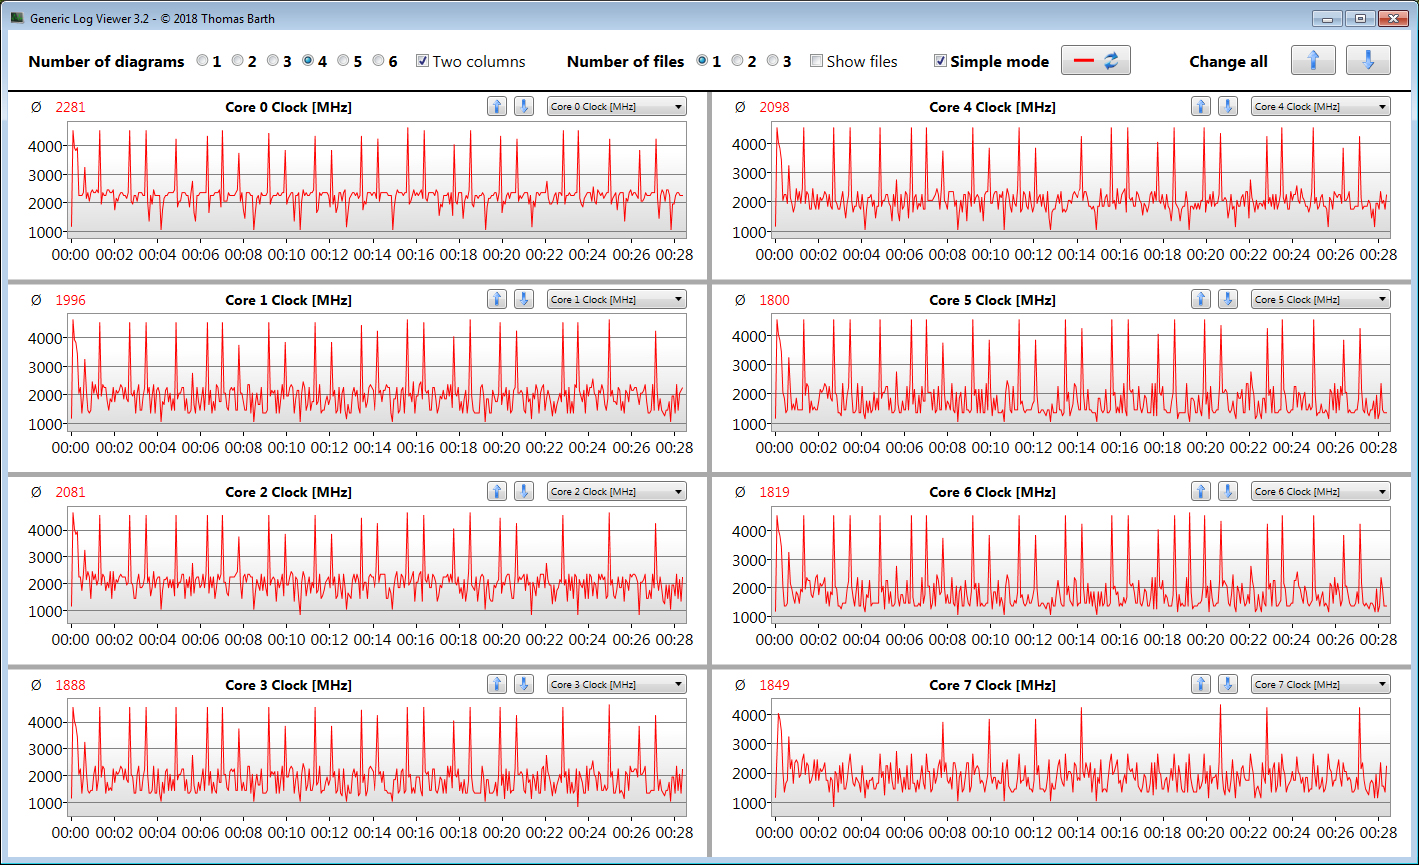
Il processo octa-core Core i7-11800H (Tiger Lake) gira ad un clock di base di 2.3 GHz. Con il Turbo, aumenta fino a 4.2 GHz (otto core) o 4.6 GHz (single core). Hyper-Threading (due thread per core) è supportato.
Durante il benchmark Cinebench R15 Multi, la CPU funziona da 4 a 4.1 GHz (in rete) o da 1 a 4.1 GHz (modalità batteria). Durante il benchmark single-thread, la CPU gira da 1,6 a 4,6 GHz in entrambi i casi
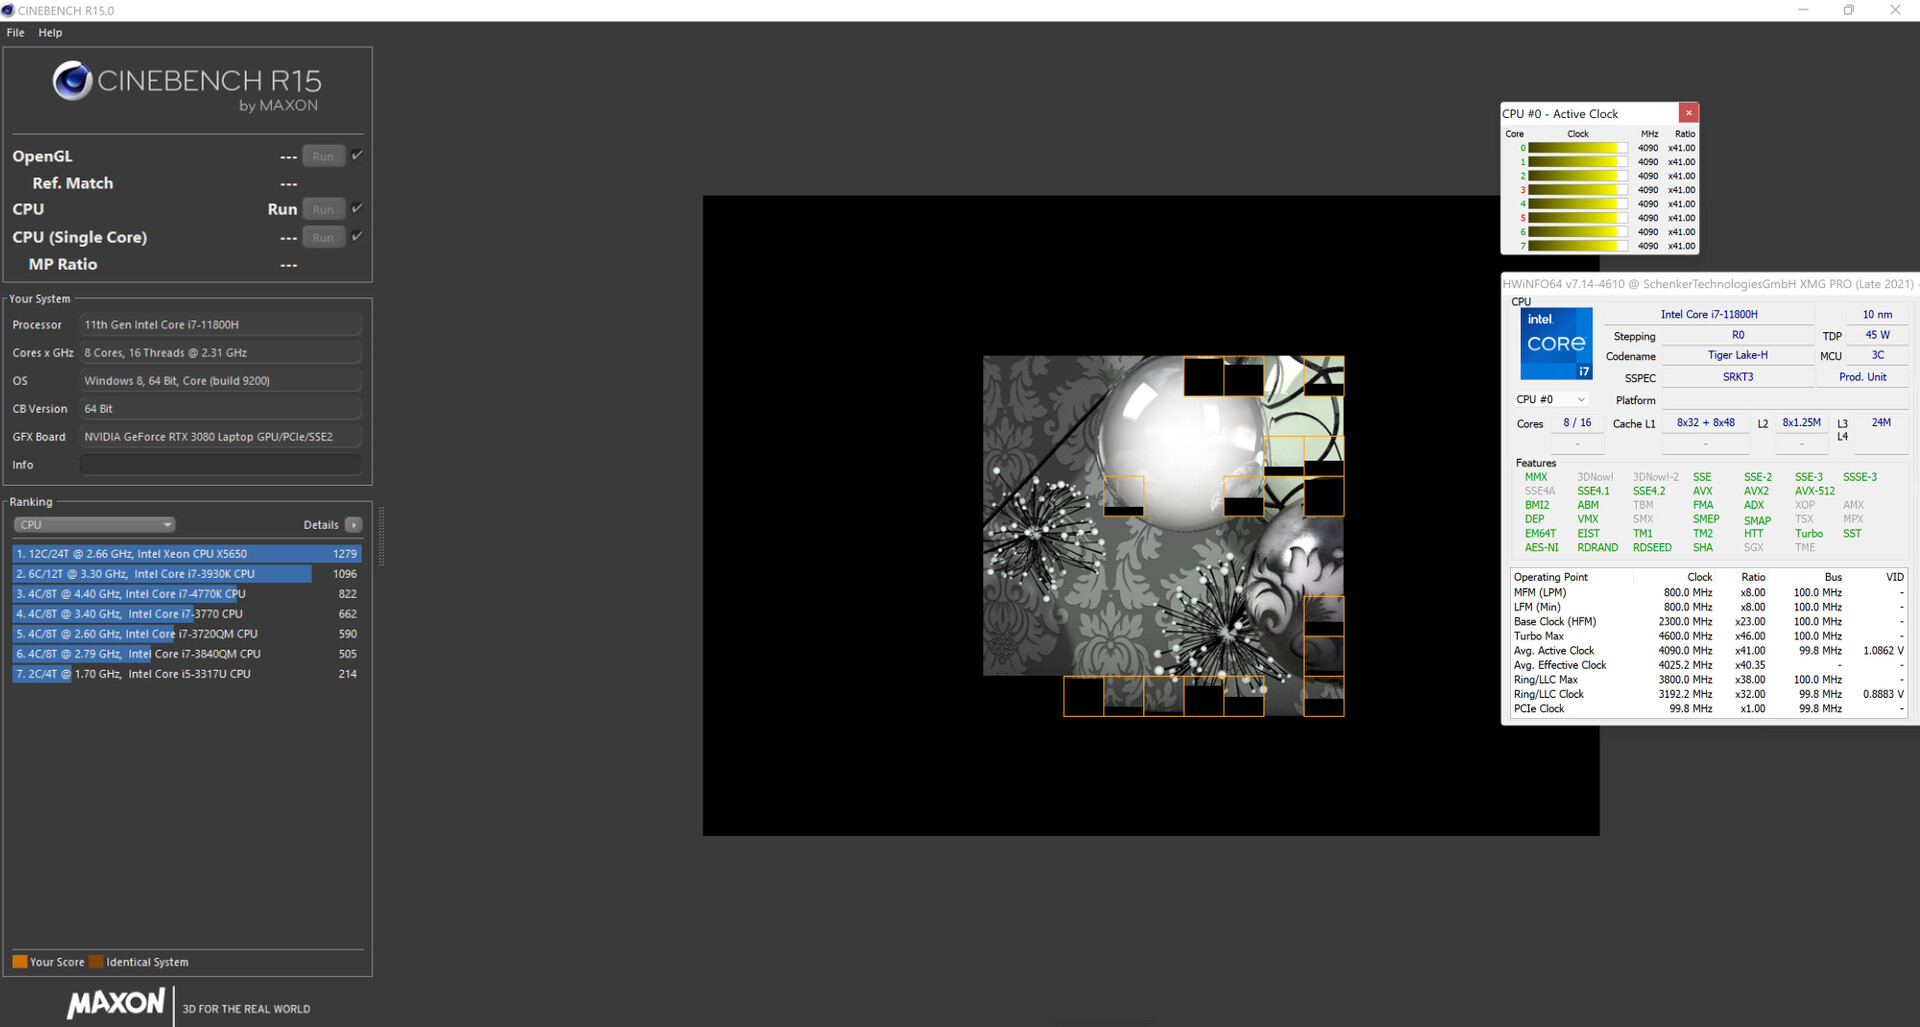
Eseguendo il benchmark Cinebench R15 multi-thread in un ciclo per almeno 30 minuti, determiniamo se il Turbo Boost della CPU è costantemente attivo. Questo risulta essere il caso e il Turbo funziona ad alte velocità di clock.
Con il profilo di alimentazione silenzioso, le prestazioni calano significativamente. Le alte frequenze del Turbo Boost sono poi raggiunte solo a intermittenza. Indipendentemente da ciò, le prestazioni ridotte sono più che sufficienti per i carichi di lavoro d'ufficio e di web-browsing e anche per il gaming leggero
Cinebench R15 Multi Loop
| CPU Performance Rating - Percent | |
| Media della classe Gaming | |
| SCHENKER XMG Pro 15 (Late 2021) | |
| MSI Delta 15 A5EFK | |
| Alienware x15 RTX 3070 P111F -2! | |
| Lenovo Legion S7 15ACH6 82K80030GE | |
| SCHENKER XMG Pro 15 (Late 2021) | |
| Razer Blade 15 Advanced (Mid 2021) -2! | |
| Media Intel Core i7-11800H | |
| SCHENKER XMG Pro 15 (Late 2021) | |
| SCHENKER XMG Pro 15 (Early 2021, RTX 3080) | |
| SCHENKER XMG Pro 15 (Late 2021) | |
| Cinebench R23 | |
| Multi Core | |
| Media della classe Gaming (2435 - 34613, n=232, ultimi 2 anni) | |
| Alienware x15 RTX 3070 P111F | |
| Lenovo Legion S7 15ACH6 82K80030GE | |
| SCHENKER XMG Pro 15 (Late 2021) | |
| SCHENKER XMG Pro 15 (Late 2021) (Unterhaltungsmodus) | |
| Razer Blade 15 Advanced (Mid 2021) | |
| MSI Delta 15 A5EFK | |
| Media Intel Core i7-11800H (6508 - 14088, n=48) | |
| SCHENKER XMG Pro 15 (Early 2021, RTX 3080) | |
| SCHENKER XMG Pro 15 (Late 2021) (Stromsparmodus) | |
| SCHENKER XMG Pro 15 (Late 2021) (Lautlosmodus) | |
| Single Core | |
| Media della classe Gaming (527 - 2235, n=230, ultimi 2 anni) | |
| Razer Blade 15 Advanced (Mid 2021) | |
| SCHENKER XMG Pro 15 (Late 2021) | |
| Alienware x15 RTX 3070 P111F | |
| SCHENKER XMG Pro 15 (Late 2021) (Unterhaltungsmodus) | |
| SCHENKER XMG Pro 15 (Late 2021) (Stromsparmodus) | |
| SCHENKER XMG Pro 15 (Late 2021) (Lautlosmodus) | |
| Media Intel Core i7-11800H (1386 - 1522, n=45) | |
| Lenovo Legion S7 15ACH6 82K80030GE | |
| MSI Delta 15 A5EFK | |
| SCHENKER XMG Pro 15 (Early 2021, RTX 3080) | |
| Cinebench R20 | |
| CPU (Multi Core) | |
| Media della classe Gaming (930 - 13769, n=230, ultimi 2 anni) | |
| Alienware x15 RTX 3070 P111F | |
| Lenovo Legion S7 15ACH6 82K80030GE | |
| SCHENKER XMG Pro 15 (Late 2021) | |
| Razer Blade 15 Advanced (Mid 2021) | |
| SCHENKER XMG Pro 15 (Late 2021) (Unterhaltungsmodus) | |
| MSI Delta 15 A5EFK | |
| Media Intel Core i7-11800H (2498 - 5408, n=50) | |
| SCHENKER XMG Pro 15 (Early 2021, RTX 3080) | |
| SCHENKER XMG Pro 15 (Late 2021) (Stromsparmodus) | |
| SCHENKER XMG Pro 15 (Late 2021) (Lautlosmodus) | |
| CPU (Single Core) | |
| Media della classe Gaming (169 - 855, n=230, ultimi 2 anni) | |
| SCHENKER XMG Pro 15 (Late 2021) | |
| Razer Blade 15 Advanced (Mid 2021) | |
| SCHENKER XMG Pro 15 (Late 2021) (Unterhaltungsmodus) | |
| SCHENKER XMG Pro 15 (Late 2021) (Stromsparmodus) | |
| Alienware x15 RTX 3070 P111F | |
| SCHENKER XMG Pro 15 (Late 2021) (Lautlosmodus) | |
| Lenovo Legion S7 15ACH6 82K80030GE | |
| MSI Delta 15 A5EFK | |
| Media Intel Core i7-11800H (520 - 586, n=47) | |
| SCHENKER XMG Pro 15 (Early 2021, RTX 3080) | |
| Cinebench R15 | |
| CPU Multi 64Bit | |
| Media della classe Gaming (400 - 5663, n=235, ultimi 2 anni) | |
| Lenovo Legion S7 15ACH6 82K80030GE | |
| Alienware x15 RTX 3070 P111F | |
| MSI Delta 15 A5EFK | |
| SCHENKER XMG Pro 15 (Late 2021) | |
| SCHENKER XMG Pro 15 (Late 2021) (Unterhaltungsmodus) | |
| Media Intel Core i7-11800H (1342 - 2173, n=50) | |
| Razer Blade 15 Advanced (Mid 2021) | |
| SCHENKER XMG Pro 15 (Early 2021, RTX 3080) | |
| SCHENKER XMG Pro 15 (Late 2021) (Stromsparmodus) | |
| SCHENKER XMG Pro 15 (Late 2021) (Lautlosmodus) | |
| CPU Single 64Bit | |
| Media della classe Gaming (79.2 - 318, n=234, ultimi 2 anni) | |
| MSI Delta 15 A5EFK | |
| Lenovo Legion S7 15ACH6 82K80030GE | |
| SCHENKER XMG Pro 15 (Late 2021) (Stromsparmodus) | |
| SCHENKER XMG Pro 15 (Late 2021) (Lautlosmodus) | |
| SCHENKER XMG Pro 15 (Late 2021) (Unterhaltungsmodus) | |
| Razer Blade 15 Advanced (Mid 2021) | |
| Alienware x15 RTX 3070 P111F | |
| SCHENKER XMG Pro 15 (Late 2021) | |
| Media Intel Core i7-11800H (201 - 231, n=46) | |
| SCHENKER XMG Pro 15 (Early 2021, RTX 3080) | |
| Blender - v2.79 BMW27 CPU | |
| SCHENKER XMG Pro 15 (Late 2021) (Lautlosmodus) | |
| SCHENKER XMG Pro 15 (Late 2021) (Stromsparmodus) | |
| SCHENKER XMG Pro 15 (Early 2021, RTX 3080) | |
| Media Intel Core i7-11800H (217 - 454, n=46) | |
| Razer Blade 15 Advanced (Mid 2021) | |
| SCHENKER XMG Pro 15 (Late 2021) (Unterhaltungsmodus) | |
| SCHENKER XMG Pro 15 (Late 2021) | |
| MSI Delta 15 A5EFK | |
| Lenovo Legion S7 15ACH6 82K80030GE | |
| Alienware x15 RTX 3070 P111F | |
| Media della classe Gaming (87 - 1259, n=228, ultimi 2 anni) | |
| 7-Zip 18.03 | |
| 7z b 4 | |
| Media della classe Gaming (11386 - 140932, n=229, ultimi 2 anni) | |
| Lenovo Legion S7 15ACH6 82K80030GE | |
| MSI Delta 15 A5EFK | |
| SCHENKER XMG Pro 15 (Late 2021) | |
| Razer Blade 15 Advanced (Mid 2021) | |
| SCHENKER XMG Pro 15 (Late 2021) (Unterhaltungsmodus) | |
| Alienware x15 RTX 3070 P111F | |
| Media Intel Core i7-11800H (33718 - 56758, n=46) | |
| SCHENKER XMG Pro 15 (Early 2021, RTX 3080) | |
| SCHENKER XMG Pro 15 (Late 2021) (Stromsparmodus) | |
| SCHENKER XMG Pro 15 (Late 2021) (Lautlosmodus) | |
| 7z b 4 -mmt1 | |
| Media della classe Gaming (2685 - 7581, n=229, ultimi 2 anni) | |
| Lenovo Legion S7 15ACH6 82K80030GE | |
| MSI Delta 15 A5EFK | |
| SCHENKER XMG Pro 15 (Late 2021) (Lautlosmodus) | |
| SCHENKER XMG Pro 15 (Late 2021) | |
| SCHENKER XMG Pro 15 (Late 2021) (Stromsparmodus) | |
| Media Intel Core i7-11800H (5138 - 5732, n=46) | |
| SCHENKER XMG Pro 15 (Late 2021) (Unterhaltungsmodus) | |
| Razer Blade 15 Advanced (Mid 2021) | |
| Alienware x15 RTX 3070 P111F | |
| SCHENKER XMG Pro 15 (Early 2021, RTX 3080) | |
| Geekbench 5.5 | |
| Multi-Core | |
| Media della classe Gaming (1946 - 22200, n=234, ultimi 2 anni) | |
| SCHENKER XMG Pro 15 (Late 2021) | |
| SCHENKER XMG Pro 15 (Late 2021) (Unterhaltungsmodus) | |
| SCHENKER XMG Pro 15 (Late 2021) (Stromsparmodus) | |
| MSI Delta 15 A5EFK | |
| Lenovo Legion S7 15ACH6 82K80030GE | |
| Media Intel Core i7-11800H (4655 - 9851, n=40) | |
| SCHENKER XMG Pro 15 (Early 2021, RTX 3080) | |
| SCHENKER XMG Pro 15 (Late 2021) (Lautlosmodus) | |
| Single-Core | |
| Media della classe Gaming (158 - 2210, n=234, ultimi 2 anni) | |
| SCHENKER XMG Pro 15 (Late 2021) | |
| SCHENKER XMG Pro 15 (Late 2021) (Stromsparmodus) | |
| MSI Delta 15 A5EFK | |
| Media Intel Core i7-11800H (1429 - 1625, n=40) | |
| SCHENKER XMG Pro 15 (Late 2021) (Unterhaltungsmodus) | |
| Lenovo Legion S7 15ACH6 82K80030GE | |
| SCHENKER XMG Pro 15 (Late 2021) (Lautlosmodus) | |
| SCHENKER XMG Pro 15 (Early 2021, RTX 3080) | |
| HWBOT x265 Benchmark v2.2 - 4k Preset | |
| Media della classe Gaming (3 - 37.6, n=232, ultimi 2 anni) | |
| Alienware x15 RTX 3070 P111F | |
| Lenovo Legion S7 15ACH6 82K80030GE | |
| SCHENKER XMG Pro 15 (Late 2021) | |
| MSI Delta 15 A5EFK | |
| Razer Blade 15 Advanced (Mid 2021) | |
| SCHENKER XMG Pro 15 (Late 2021) (Unterhaltungsmodus) | |
| Media Intel Core i7-11800H (7.38 - 17.4, n=46) | |
| SCHENKER XMG Pro 15 (Early 2021, RTX 3080) | |
| SCHENKER XMG Pro 15 (Late 2021) (Stromsparmodus) | |
| SCHENKER XMG Pro 15 (Late 2021) (Lautlosmodus) | |
| LibreOffice - 20 Documents To PDF | |
| Lenovo Legion S7 15ACH6 82K80030GE | |
| SCHENKER XMG Pro 15 (Early 2021, RTX 3080) | |
| SCHENKER XMG Pro 15 (Late 2021) (Unterhaltungsmodus) | |
| MSI Delta 15 A5EFK | |
| Alienware x15 RTX 3070 P111F | |
| Media della classe Gaming (32.8 - 332, n=226, ultimi 2 anni) | |
| SCHENKER XMG Pro 15 (Late 2021) | |
| Media Intel Core i7-11800H (38.6 - 59.9, n=45) | |
| Razer Blade 15 Advanced (Mid 2021) | |
| SCHENKER XMG Pro 15 (Late 2021) (Lautlosmodus) | |
| SCHENKER XMG Pro 15 (Late 2021) (Stromsparmodus) | |
| R Benchmark 2.5 - Overall mean | |
| SCHENKER XMG Pro 15 (Early 2021, RTX 3080) | |
| SCHENKER XMG Pro 15 (Late 2021) (Lautlosmodus) | |
| SCHENKER XMG Pro 15 (Late 2021) (Stromsparmodus) | |
| Alienware x15 RTX 3070 P111F | |
| Media Intel Core i7-11800H (0.548 - 0.615, n=46) | |
| SCHENKER XMG Pro 15 (Late 2021) (Unterhaltungsmodus) | |
| Razer Blade 15 Advanced (Mid 2021) | |
| SCHENKER XMG Pro 15 (Late 2021) | |
| MSI Delta 15 A5EFK | |
| Lenovo Legion S7 15ACH6 82K80030GE | |
| Media della classe Gaming (0.3609 - 4.47, n=229, ultimi 2 anni) | |
* ... Meglio usare valori piccoli
AIDA64: FP32 Ray-Trace | FPU Julia | CPU SHA3 | CPU Queen | FPU SinJulia | FPU Mandel | CPU AES | CPU ZLib | FP64 Ray-Trace | CPU PhotoWorxx
| Performance Rating | |
| Media della classe Gaming | |
| Lenovo Legion S7 15ACH6 82K80030GE | |
| MSI Delta 15 A5EFK | |
| SCHENKER XMG Pro 15 (Late 2021) | |
| Media Intel Core i7-11800H | |
| SCHENKER XMG Pro 15 (Early 2021, RTX 3080) | |
| SCHENKER XMG Pro 15 (Late 2021) | |
| SCHENKER XMG Pro 15 (Late 2021) | |
| Alienware x15 RTX 3070 P111F -9! | |
| Razer Blade 15 Advanced (Mid 2021) -9! | |
| AIDA64 / FP32 Ray-Trace | |
| Media della classe Gaming (3069 - 60169, n=225, ultimi 2 anni) | |
| Lenovo Legion S7 15ACH6 82K80030GE (v6.33.5700) | |
| SCHENKER XMG Pro 15 (Late 2021) (v6.50.5800) | |
| MSI Delta 15 A5EFK (v6.33.5700) | |
| Media Intel Core i7-11800H (8772 - 15961, n=20) | |
| SCHENKER XMG Pro 15 (Early 2021, RTX 3080) (v6.32.5600) | |
| SCHENKER XMG Pro 15 (Late 2021) (v6.50.5800, Stromsparmodus) | |
| SCHENKER XMG Pro 15 (Late 2021) (v6.50.5800, Lautlosmodus) | |
| AIDA64 / FPU Julia | |
| Lenovo Legion S7 15ACH6 82K80030GE (v6.33.5700) | |
| MSI Delta 15 A5EFK (v6.33.5700) | |
| Media della classe Gaming (18567 - 252486, n=225, ultimi 2 anni) | |
| SCHENKER XMG Pro 15 (Late 2021) (v6.50.5800) | |
| SCHENKER XMG Pro 15 (Early 2021, RTX 3080) (v6.32.5600) | |
| Media Intel Core i7-11800H (39404 - 65636, n=20) | |
| SCHENKER XMG Pro 15 (Late 2021) (v6.50.5800, Stromsparmodus) | |
| SCHENKER XMG Pro 15 (Late 2021) (v6.50.5800, Lautlosmodus) | |
| AIDA64 / CPU SHA3 | |
| SCHENKER XMG Pro 15 (Late 2021) (v6.50.5800) | |
| Media della classe Gaming (629 - 10389, n=225, ultimi 2 anni) | |
| Media Intel Core i7-11800H (2599 - 4439, n=20) | |
| Lenovo Legion S7 15ACH6 82K80030GE (v6.33.5700) | |
| SCHENKER XMG Pro 15 (Early 2021, RTX 3080) (v6.32.5600) | |
| MSI Delta 15 A5EFK (v6.33.5700) | |
| SCHENKER XMG Pro 15 (Late 2021) (v6.50.5800, Stromsparmodus) | |
| SCHENKER XMG Pro 15 (Late 2021) (v6.50.5800, Lautlosmodus) | |
| AIDA64 / CPU Queen | |
| Media della classe Gaming (15371 - 200651, n=225, ultimi 2 anni) | |
| MSI Delta 15 A5EFK (v6.33.5700) | |
| Lenovo Legion S7 15ACH6 82K80030GE (v6.33.5700) | |
| SCHENKER XMG Pro 15 (Late 2021) (v6.50.5800) | |
| SCHENKER XMG Pro 15 (Late 2021) (v6.50.5800, Lautlosmodus) | |
| SCHENKER XMG Pro 15 (Late 2021) (v6.50.5800, Stromsparmodus) | |
| Media Intel Core i7-11800H (85233 - 91941, n=20) | |
| SCHENKER XMG Pro 15 (Early 2021, RTX 3080) (v6.32.5600) | |
| AIDA64 / FPU SinJulia | |
| MSI Delta 15 A5EFK (v6.33.5700) | |
| Lenovo Legion S7 15ACH6 82K80030GE (v6.33.5700) | |
| Media della classe Gaming (2137 - 32988, n=225, ultimi 2 anni) | |
| SCHENKER XMG Pro 15 (Late 2021) (v6.50.5800) | |
| SCHENKER XMG Pro 15 (Early 2021, RTX 3080) (v6.32.5600) | |
| Media Intel Core i7-11800H (6420 - 9792, n=20) | |
| SCHENKER XMG Pro 15 (Late 2021) (v6.50.5800, Stromsparmodus) | |
| SCHENKER XMG Pro 15 (Late 2021) (v6.50.5800, Lautlosmodus) | |
| AIDA64 / FPU Mandel | |
| Lenovo Legion S7 15ACH6 82K80030GE (v6.33.5700) | |
| MSI Delta 15 A5EFK (v6.33.5700) | |
| Media della classe Gaming (10291 - 134044, n=225, ultimi 2 anni) | |
| SCHENKER XMG Pro 15 (Late 2021) (v6.50.5800) | |
| Media Intel Core i7-11800H (23365 - 39464, n=20) | |
| SCHENKER XMG Pro 15 (Early 2021, RTX 3080) (v6.32.5600) | |
| SCHENKER XMG Pro 15 (Late 2021) (v6.50.5800, Stromsparmodus) | |
| SCHENKER XMG Pro 15 (Late 2021) (v6.50.5800, Lautlosmodus) | |
| AIDA64 / CPU AES | |
| SCHENKER XMG Pro 15 (Late 2021) (v6.50.5800) | |
| Lenovo Legion S7 15ACH6 82K80030GE (v6.33.5700) | |
| MSI Delta 15 A5EFK (v6.33.5700) | |
| Media Intel Core i7-11800H (74617 - 149388, n=20) | |
| SCHENKER XMG Pro 15 (Late 2021) (v6.50.5800, Stromsparmodus) | |
| Media della classe Gaming (19065 - 328679, n=225, ultimi 2 anni) | |
| SCHENKER XMG Pro 15 (Late 2021) (v6.50.5800, Lautlosmodus) | |
| SCHENKER XMG Pro 15 (Early 2021, RTX 3080) (v6.32.5600) | |
| AIDA64 / CPU ZLib | |
| Media della classe Gaming (150.9 - 2409, n=225, ultimi 2 anni) | |
| Lenovo Legion S7 15ACH6 82K80030GE (v6.33.5700) | |
| MSI Delta 15 A5EFK (v6.33.5700) | |
| SCHENKER XMG Pro 15 (Late 2021) (v6.50.5800) | |
| SCHENKER XMG Pro 15 (Early 2021, RTX 3080) (v6.32.5600) | |
| SCHENKER XMG Pro 15 (Late 2021) (v6.50.5800, Stromsparmodus) | |
| SCHENKER XMG Pro 15 (Late 2021) (v6.50.5800, Lautlosmodus) | |
| Media Intel Core i7-11800H (461 - 830, n=43) | |
| Razer Blade 15 Advanced (Mid 2021) (v6.33.5700) | |
| Alienware x15 RTX 3070 P111F (v6.33.5700) | |
| AIDA64 / FP64 Ray-Trace | |
| Media della classe Gaming (1518 - 31796, n=225, ultimi 2 anni) | |
| SCHENKER XMG Pro 15 (Late 2021) (v6.50.5800) | |
| Lenovo Legion S7 15ACH6 82K80030GE (v6.33.5700) | |
| MSI Delta 15 A5EFK (v6.33.5700) | |
| Media Intel Core i7-11800H (4545 - 8717, n=21) | |
| SCHENKER XMG Pro 15 (Early 2021, RTX 3080) (v6.32.5600) | |
| SCHENKER XMG Pro 15 (Late 2021) (v6.50.5800, Stromsparmodus) | |
| SCHENKER XMG Pro 15 (Late 2021) (v6.50.5800, Lautlosmodus) | |
| AIDA64 / CPU PhotoWorxx | |
| Media della classe Gaming (10805 - 60161, n=226, ultimi 2 anni) | |
| SCHENKER XMG Pro 15 (Late 2021) (v6.50.5800) | |
| SCHENKER XMG Pro 15 (Late 2021) (v6.50.5800, Stromsparmodus) | |
| SCHENKER XMG Pro 15 (Late 2021) (v6.50.5800, Lautlosmodus) | |
| Media Intel Core i7-11800H (11898 - 26757, n=21) | |
| MSI Delta 15 A5EFK (v6.33.5700) | |
| SCHENKER XMG Pro 15 (Early 2021, RTX 3080) (v6.32.5600) | |
| Lenovo Legion S7 15ACH6 82K80030GE (v6.33.5700) | |
Prestazioni del sistema
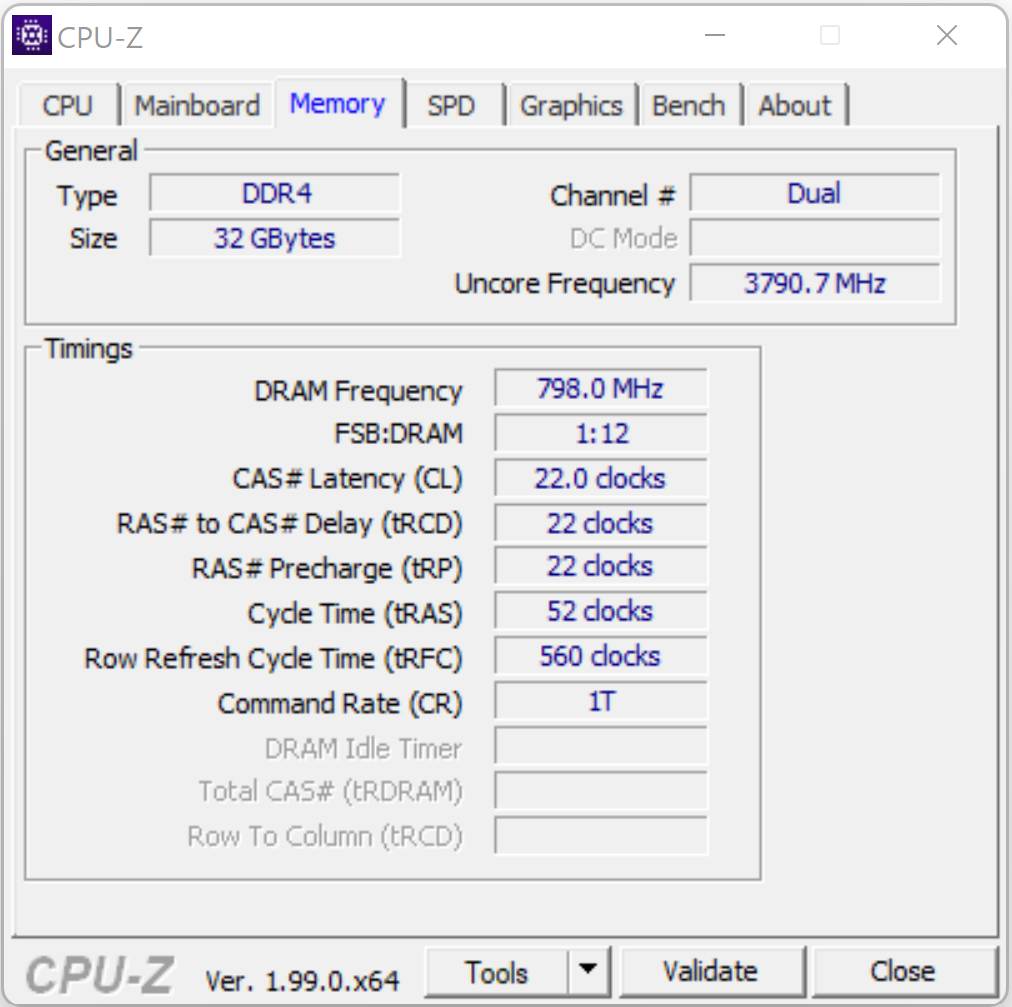
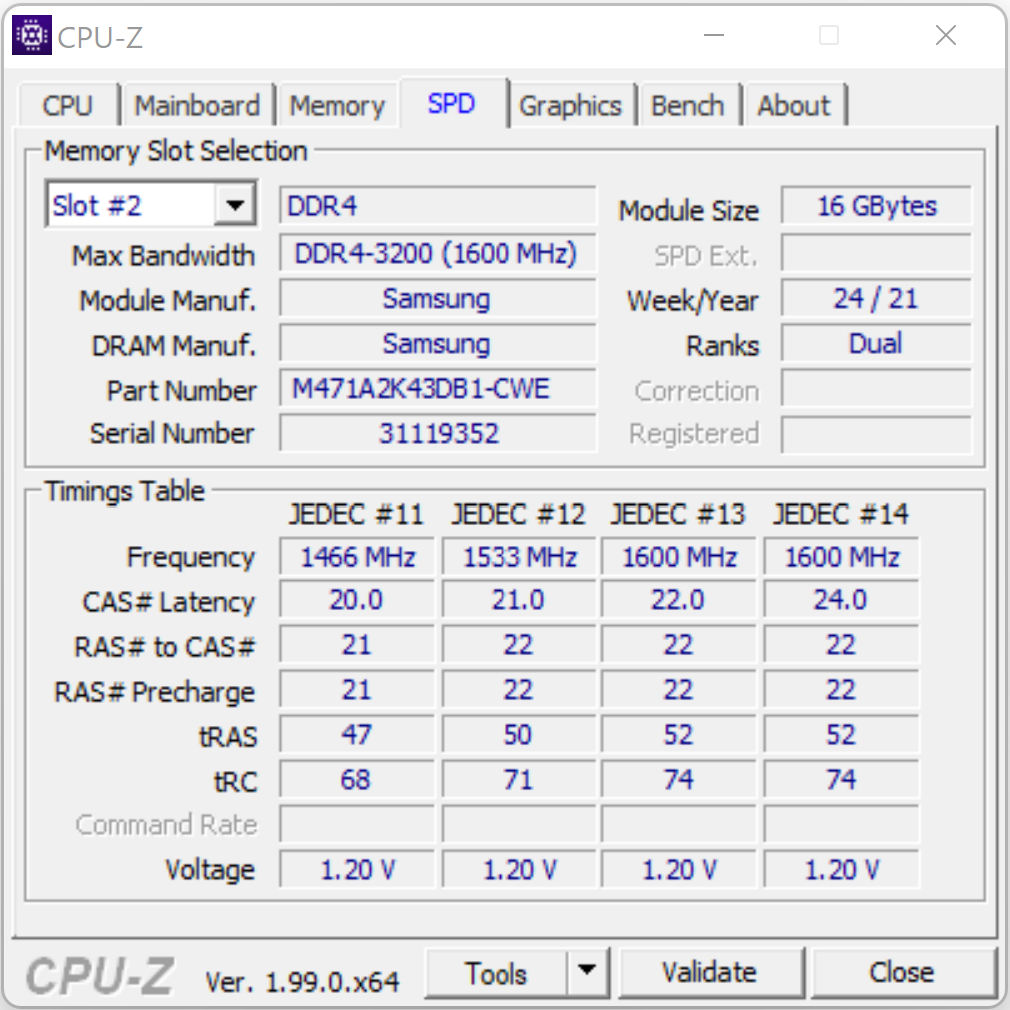
Il sistema è fluido e reattivo. I componenti sono più che sufficienti per carichi di lavoro impegnativi come il gioco e l'editing di video e foto. Le velocità di trasferimento della RAM corrispondono alle nostre aspettative per la RAM DDR4-3200. Infine, i risultati di PCMark sono eccellenti
| PCMark 8 Home Score Accelerated v2 | 3941 punti | |
| PCMark 8 Creative Score Accelerated v2 | 6411 punti | |
| PCMark 8 Work Score Accelerated v2 | 4756 punti | |
| PCMark 10 Score | 6673 punti | |
Aiuto | ||
| PCMark 10 / Score | |
| Media della classe Gaming (5235 - 9852, n=200, ultimi 2 anni) | |
| Razer Blade 15 Advanced (Mid 2021) | |
| MSI Delta 15 A5EFK | |
| Alienware x15 RTX 3070 P111F | |
| Media Intel Core i7-11800H, NVIDIA GeForce RTX 3080 Laptop GPU (6673 - 7470, n=11) | |
| SCHENKER XMG Pro 15 (Late 2021) | |
| Lenovo Legion S7 15ACH6 82K80030GE | |
| SCHENKER XMG Pro 15 (Early 2021, RTX 3080) | |
| PCMark 10 / Essentials | |
| Razer Blade 15 Advanced (Mid 2021) | |
| Media della classe Gaming (8300 - 12334, n=199, ultimi 2 anni) | |
| MSI Delta 15 A5EFK | |
| Alienware x15 RTX 3070 P111F | |
| Media Intel Core i7-11800H, NVIDIA GeForce RTX 3080 Laptop GPU (9862 - 11064, n=11) | |
| SCHENKER XMG Pro 15 (Late 2021) | |
| Lenovo Legion S7 15ACH6 82K80030GE | |
| SCHENKER XMG Pro 15 (Early 2021, RTX 3080) | |
| PCMark 10 / Productivity | |
| Media della classe Gaming (6662 - 11833, n=199, ultimi 2 anni) | |
| MSI Delta 15 A5EFK | |
| Media Intel Core i7-11800H, NVIDIA GeForce RTX 3080 Laptop GPU (8278 - 9803, n=11) | |
| Alienware x15 RTX 3070 P111F | |
| Razer Blade 15 Advanced (Mid 2021) | |
| Lenovo Legion S7 15ACH6 82K80030GE | |
| SCHENKER XMG Pro 15 (Early 2021, RTX 3080) | |
| SCHENKER XMG Pro 15 (Late 2021) | |
| PCMark 10 / Digital Content Creation | |
| Media della classe Gaming (6462 - 18475, n=199, ultimi 2 anni) | |
| Alienware x15 RTX 3070 P111F | |
| Razer Blade 15 Advanced (Mid 2021) | |
| MSI Delta 15 A5EFK | |
| Media Intel Core i7-11800H, NVIDIA GeForce RTX 3080 Laptop GPU (9881 - 11323, n=11) | |
| SCHENKER XMG Pro 15 (Late 2021) | |
| SCHENKER XMG Pro 15 (Early 2021, RTX 3080) | |
| Lenovo Legion S7 15ACH6 82K80030GE | |
| AIDA64 / Memory Copy | |
| Media della classe Gaming (21842 - 92565, n=225, ultimi 2 anni) | |
| SCHENKER XMG Pro 15 (Late 2021) | |
| Media Intel Core i7-11800H (24508 - 48144, n=21) | |
| MSI Delta 15 A5EFK | |
| Lenovo Legion S7 15ACH6 82K80030GE | |
| SCHENKER XMG Pro 15 (Early 2021, RTX 3080) | |
| AIDA64 / Memory Read | |
| Media della classe Gaming (24879 - 90647, n=225, ultimi 2 anni) | |
| SCHENKER XMG Pro 15 (Late 2021) | |
| MSI Delta 15 A5EFK | |
| Lenovo Legion S7 15ACH6 82K80030GE | |
| Media Intel Core i7-11800H (25882 - 50365, n=20) | |
| SCHENKER XMG Pro 15 (Early 2021, RTX 3080) | |
| AIDA64 / Memory Write | |
| Media della classe Gaming (21619 - 103259, n=225, ultimi 2 anni) | |
| SCHENKER XMG Pro 15 (Late 2021) | |
| MSI Delta 15 A5EFK | |
| Media Intel Core i7-11800H (22240 - 46214, n=20) | |
| Lenovo Legion S7 15ACH6 82K80030GE | |
| SCHENKER XMG Pro 15 (Early 2021, RTX 3080) | |
| AIDA64 / Memory Latency | |
| SCHENKER XMG Pro 15 (Late 2021) | |
| Media della classe Gaming (59.5 - 152.5, n=222, ultimi 2 anni) | |
| Lenovo Legion S7 15ACH6 82K80030GE | |
| MSI Delta 15 A5EFK | |
| SCHENKER XMG Pro 15 (Early 2021, RTX 3080) | |
| Media Intel Core i7-11800H (71.9 - 104.1, n=44) | |
| Razer Blade 15 Advanced (Mid 2021) | |
| Alienware x15 RTX 3070 P111F | |
* ... Meglio usare valori piccoli
Latenze DPC
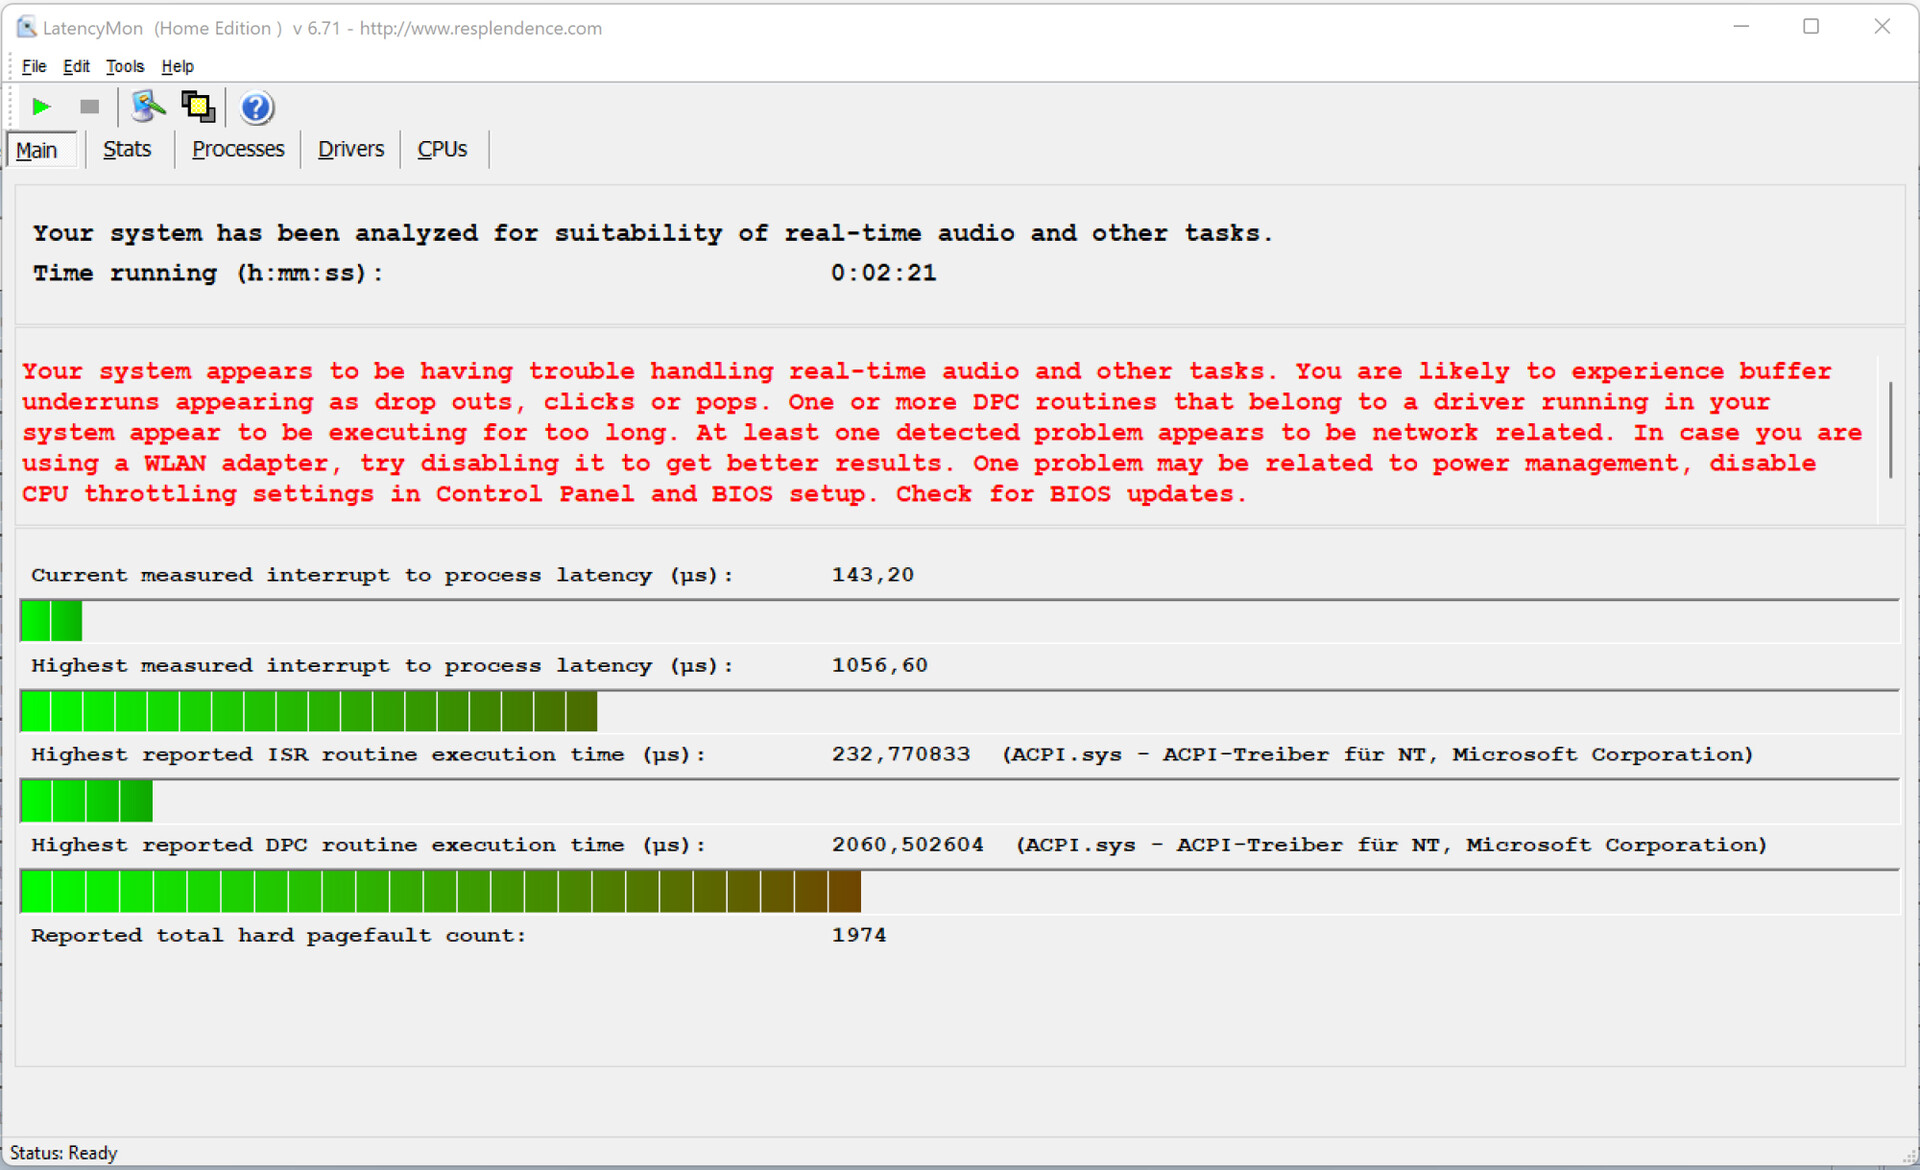
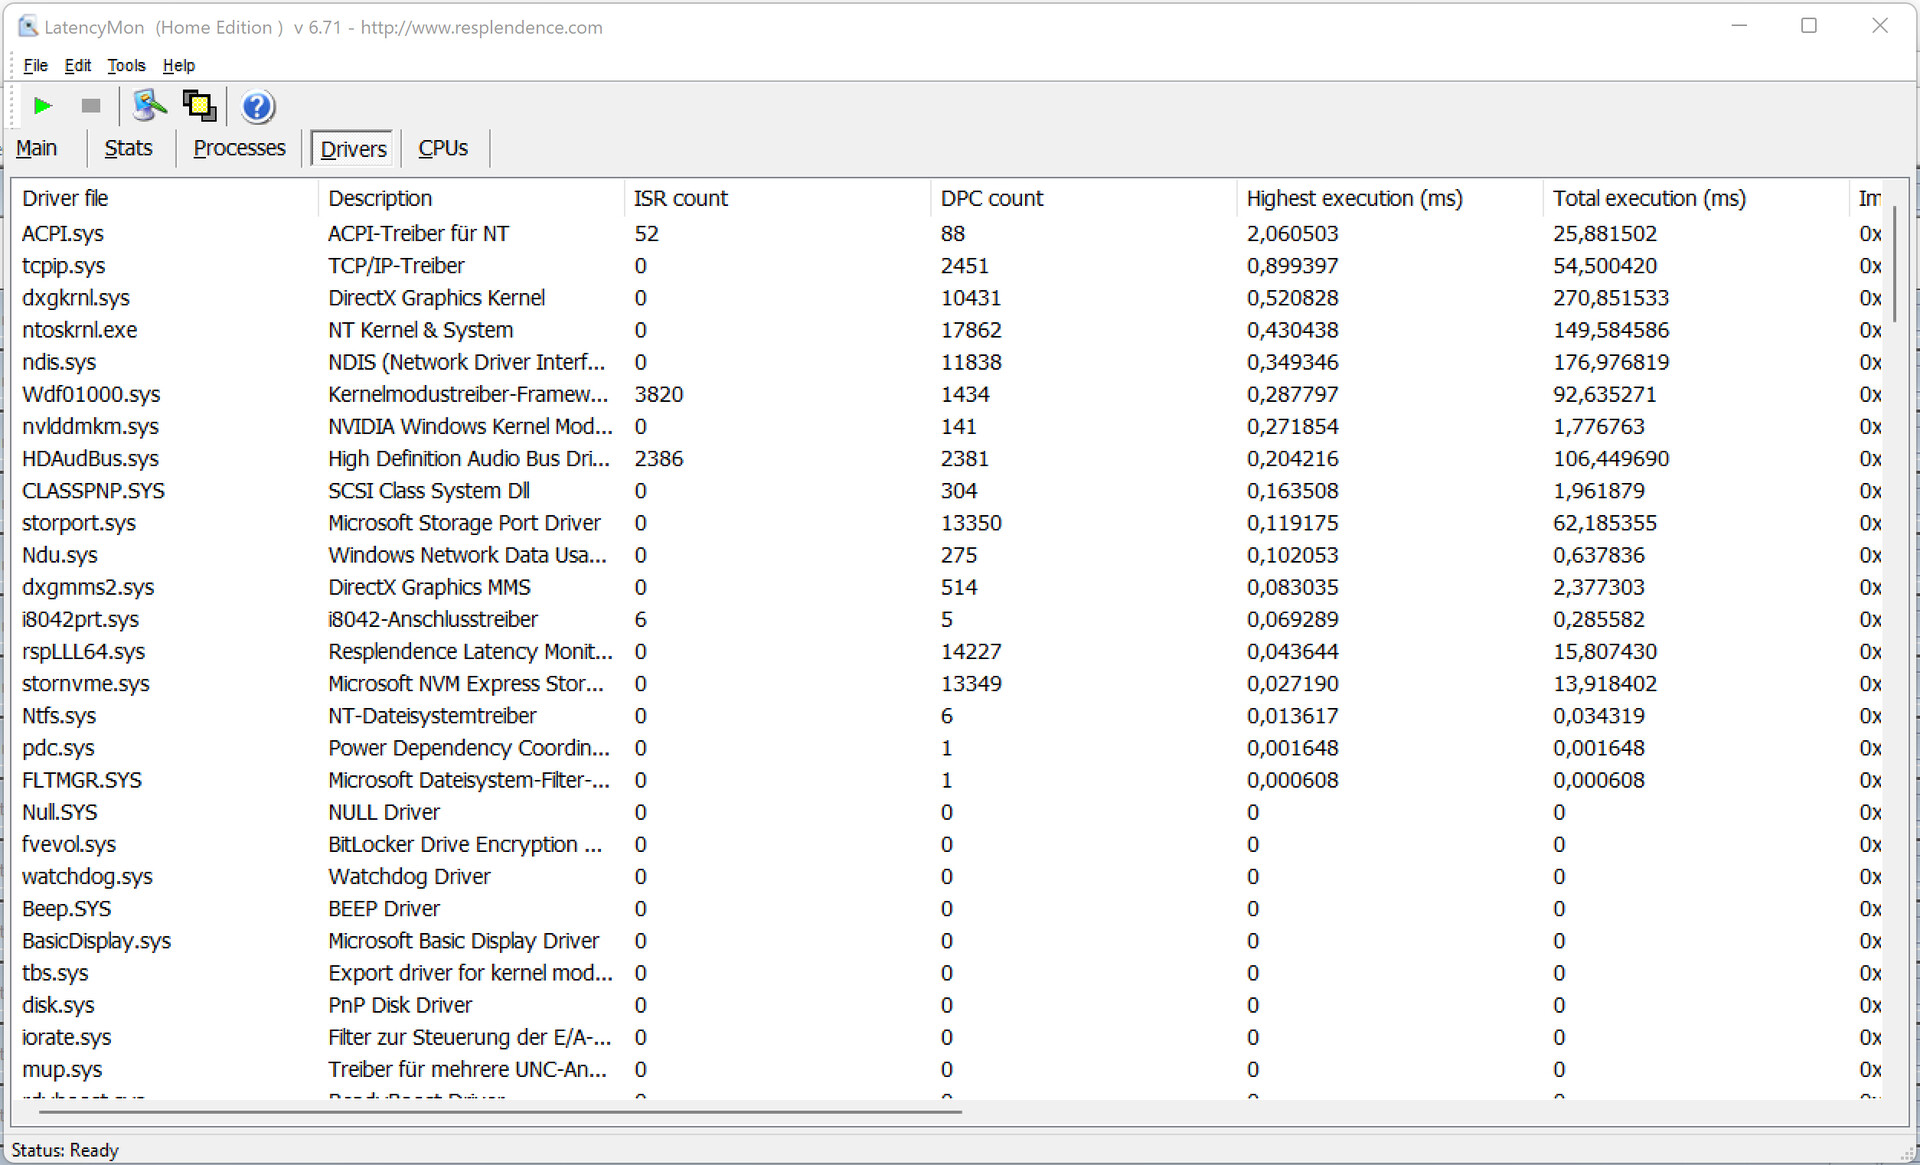
Il nostro test standardizzato LatencyMon (navigazione web, riproduzione di video 4K, carico elevato di Prime95) ha rivelato latenze DPC potenzialmente problematiche. Il sistema non sembra essere adatto all'editing video e audio in tempo reale. I futuri aggiornamenti del software potrebbero migliorare o esacerbare il problema
| DPC Latencies / LatencyMon - interrupt to process latency (max), Web, Youtube, Prime95 | |
| Razer Blade 15 Advanced (Mid 2021) | |
| MSI Delta 15 A5EFK | |
| Alienware x15 RTX 3070 P111F | |
| SCHENKER XMG Pro 15 (Late 2021) | |
| SCHENKER XMG Pro 15 (Early 2021, RTX 3080) | |
| Lenovo Legion S7 15ACH6 82K80030GE | |
* ... Meglio usare valori piccoli
Soluzione di stoccaggio
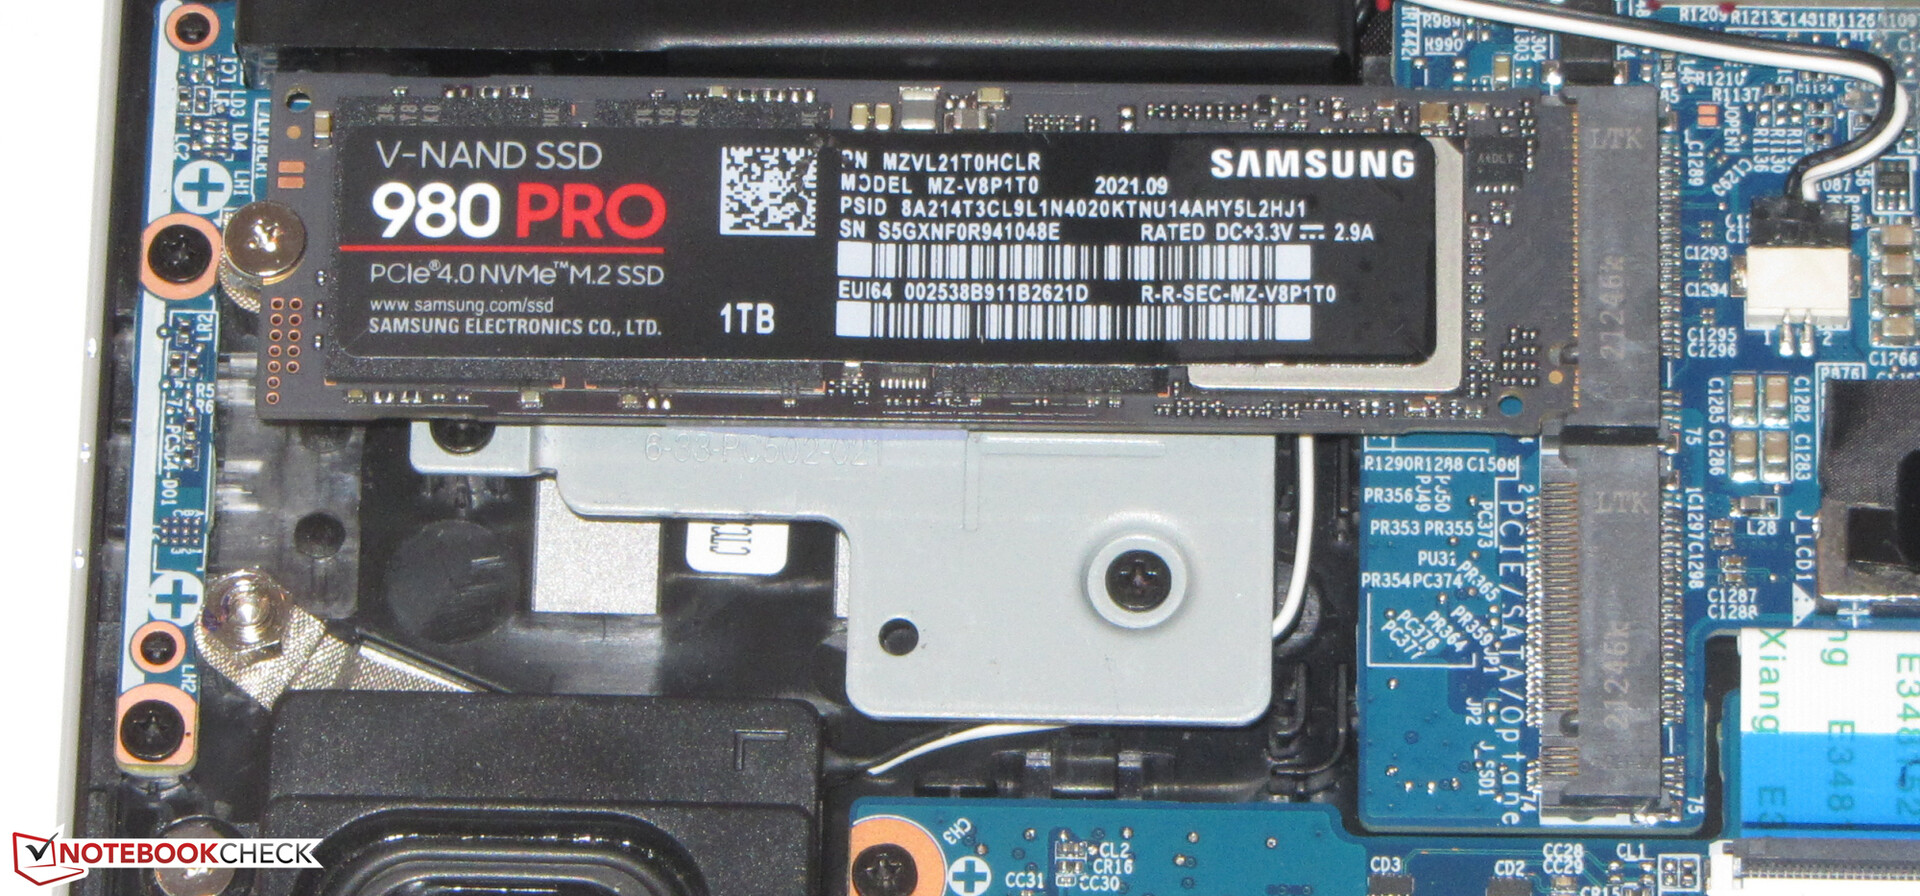
Un SSD Samsung da 1 TB (NVMe, M.2-2280) serve come unità di sistema e raggiunge eccellenti velocità di trasferimento grazie alla sua interfaccia PCIe 4. Il portatile supporta fino a due SSD M.2-2280 (1x PCIe 4.0, 1x PCIe 3.0/SATA) in totale. È supportato anche il RAID 0/1

* ... Meglio usare valori piccoli
Disk Throttling: DiskSpd Read Loop, Queue Depth 8
Prestazioni della GPU
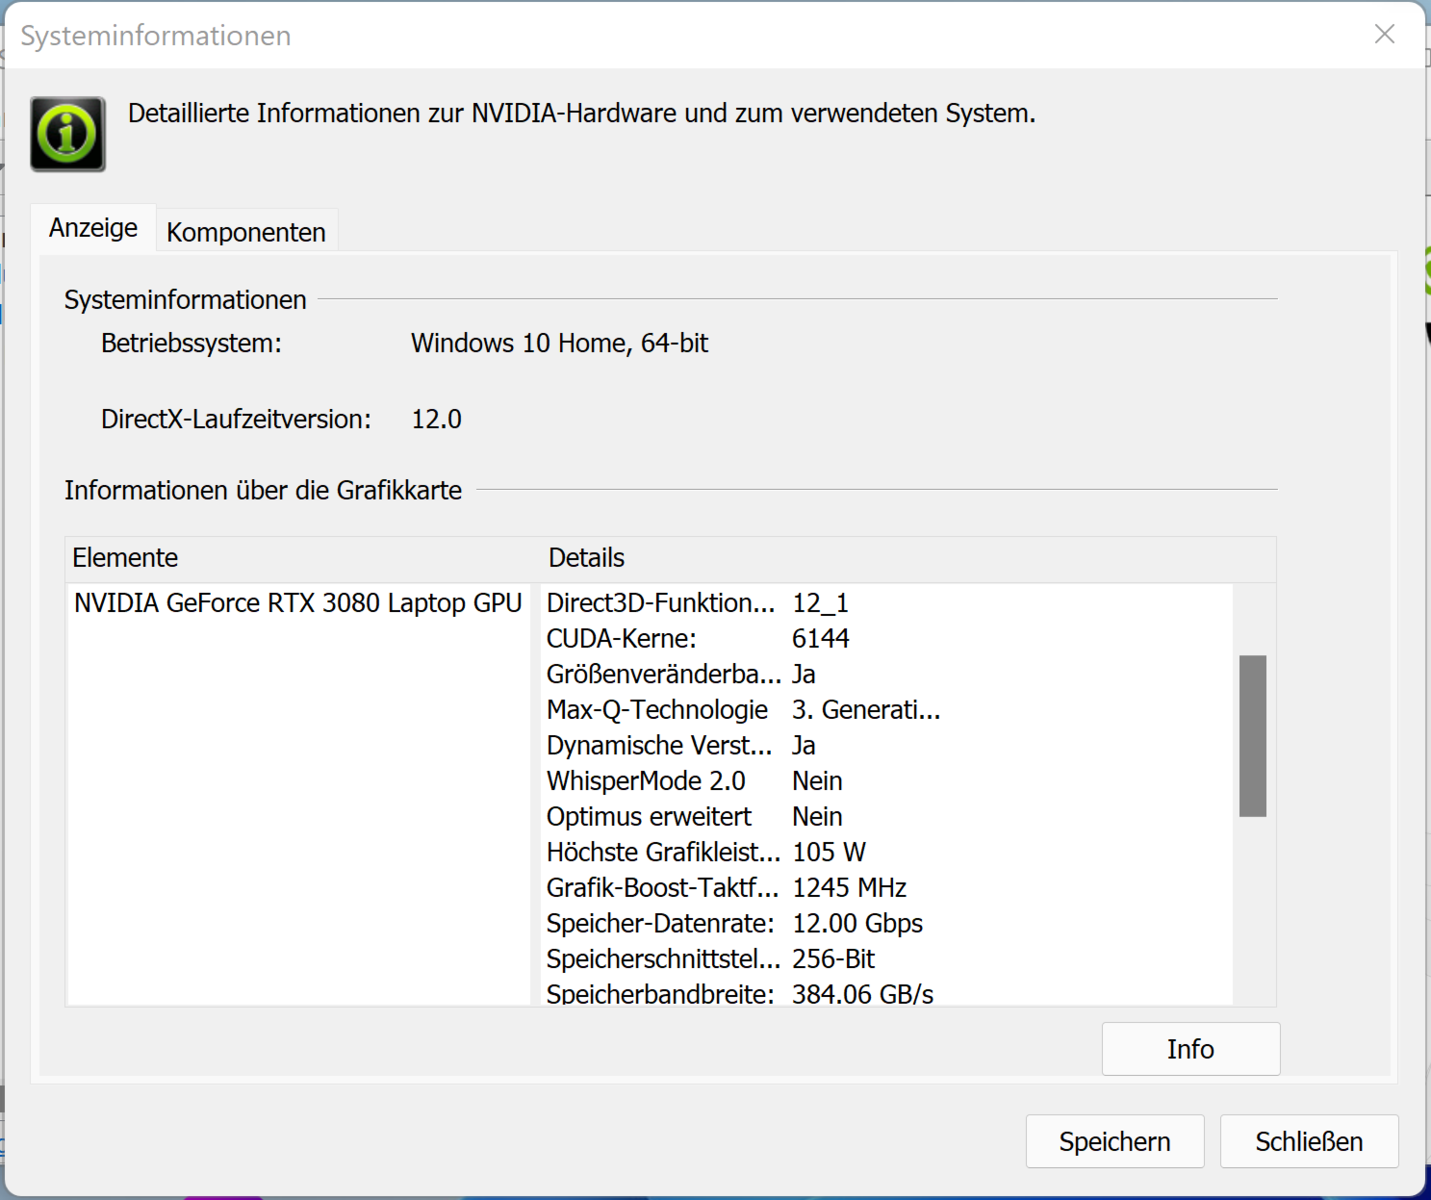
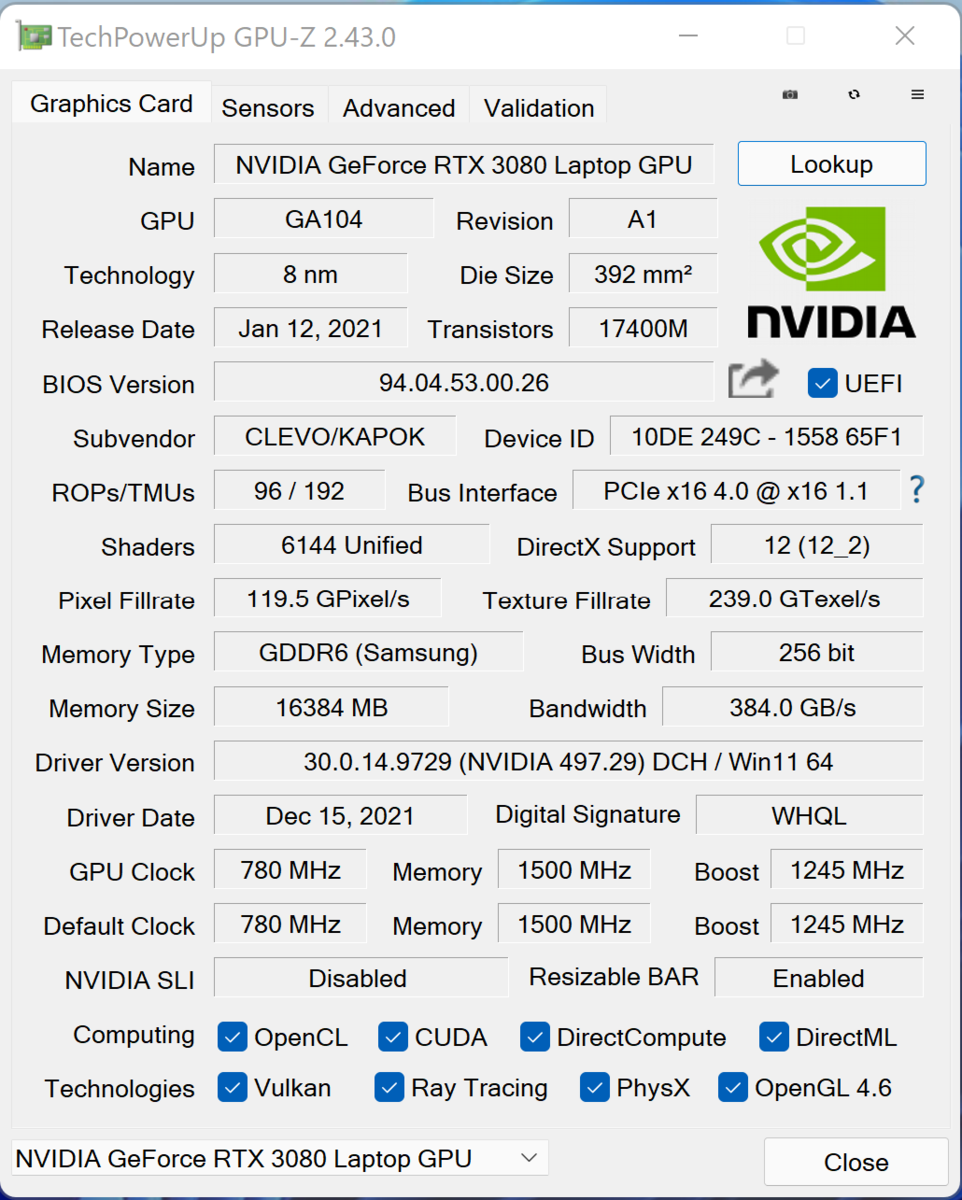
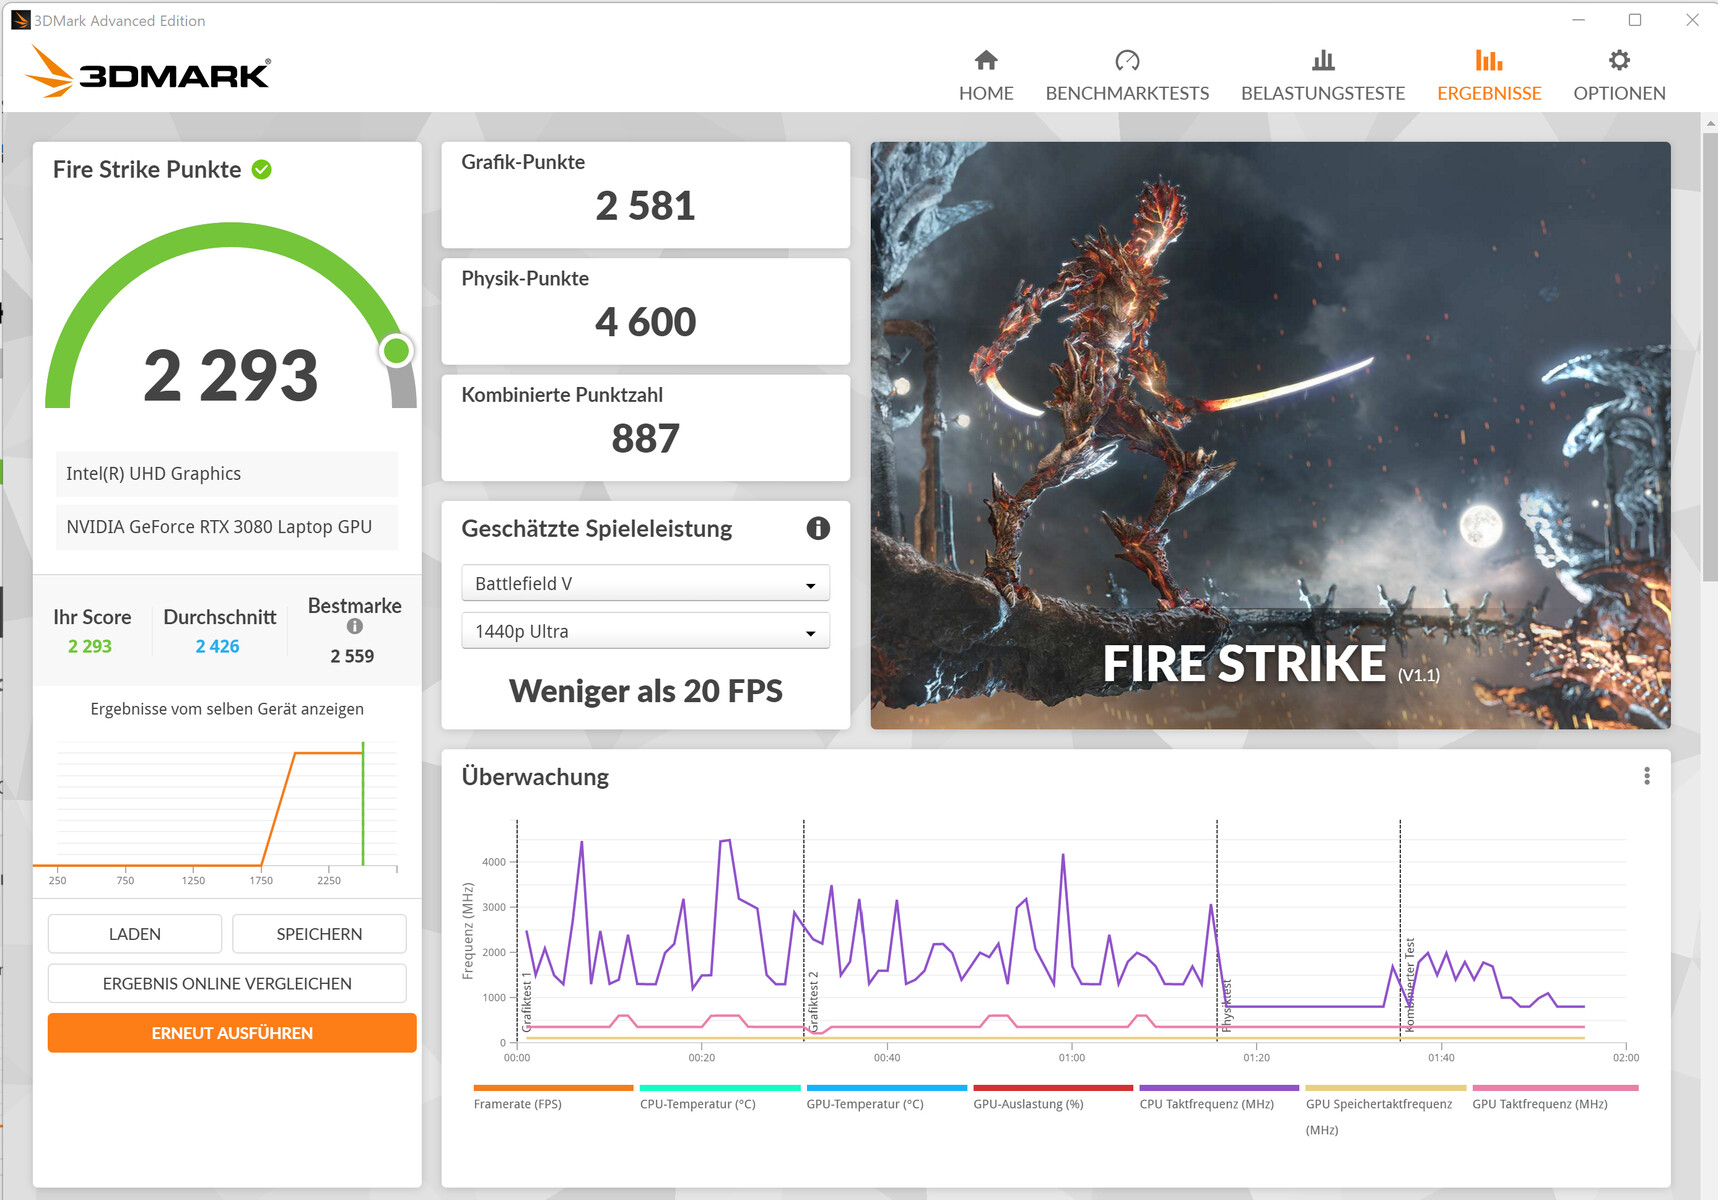
Le prestazioni effettive di una GPU RTX 3000 dipendono da numerosi fattori: La soluzione di raffreddamento, la configurazione della memoria e il TGP massimo, che il produttore può impostare su un valore all'interno di un range predefinito da Nvidia. Schenker ha impostato il TGP massimo della GeForce RTX 3080 GPU (panoramica di tutti i portatili RTX 3080 e dei loro TGP) a 105 watt (90 watt + 15 watt di Dynamic Boost)
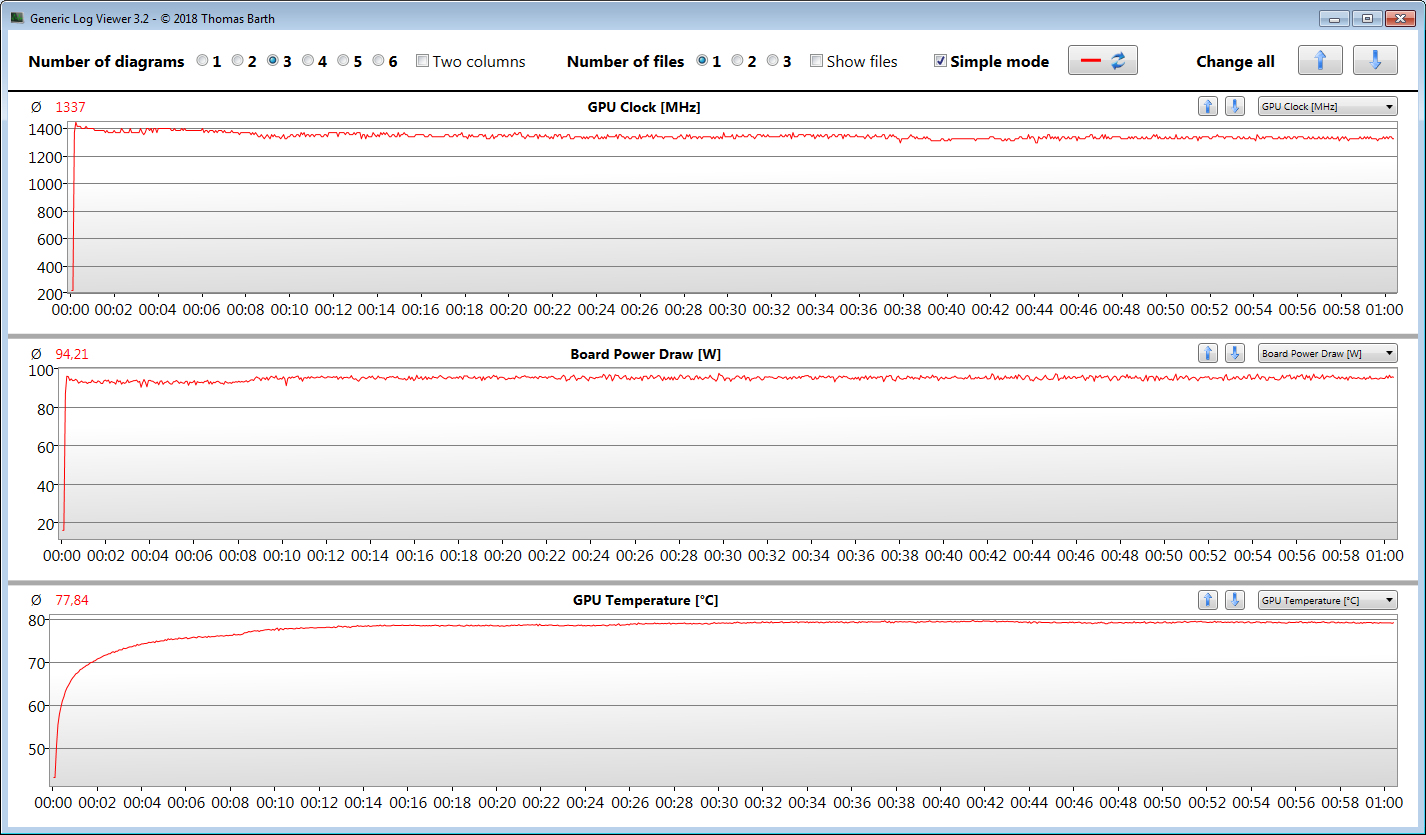
I risultati di 3DMark sono inferiori rispetto alla nostra media precedente per la RTX 3080. Qui, il TGP relativamente basso diventa evidente. I punteggi di Razer Blade 15 Advanced, che è il diretto concorrente del nostro dispositivo di test, sono comparabili. Il nostro Witcher 3 benchmark mostra che il TGP massimo può essere mantenuto per un periodo di tempo prolungato
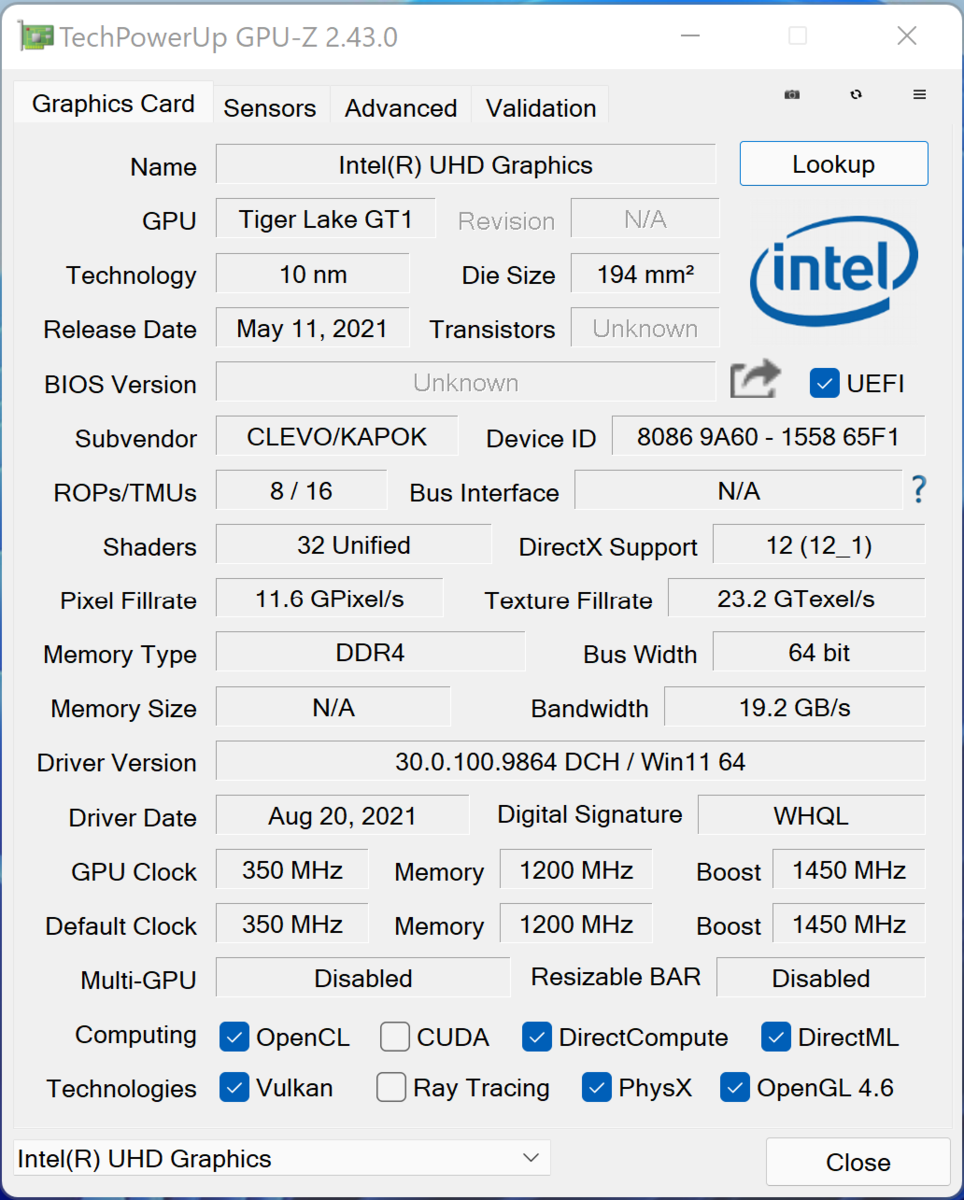
La GPU è dotata di una veloce memoria video GDDR6 (16384 MB). L'integrato UHD Graphics Xe GPU è abilitata e il portatile utilizza la tecnologia di commutazione grafica Optimus di Nvidia


| 3DMark 11 Performance | 29001 punti | |
| 3DMark Fire Strike Score | 19449 punti | |
| 3DMark Time Spy Score | 9882 punti | |
Aiuto | ||
| 3DMark Performance Rating - Percent | |
| Media della classe Gaming | |
| Media NVIDIA GeForce RTX 3080 Laptop GPU | |
| Razer Blade 15 Advanced (Mid 2021) | |
| SCHENKER XMG Pro 15 (Early 2021, RTX 3080) | |
| SCHENKER XMG Pro 15 (Late 2021) | |
| MSI Delta 15 A5EFK | |
| Alienware x15 RTX 3070 P111F | |
| SCHENKER XMG Pro 15 (Late 2021) -1! | |
| SCHENKER XMG Pro 15 (Late 2021) -1! | |
| Lenovo Legion S7 15ACH6 82K80030GE | |
| SCHENKER XMG Pro 15 (Late 2021) -1! | |
| 3DMark | |
| 1920x1080 Fire Strike Graphics | |
| Media della classe Gaming (781 - 53059, n=236, ultimi 2 anni) | |
| MSI Delta 15 A5EFK | |
| Media NVIDIA GeForce RTX 3080 Laptop GPU (16455 - 32366, n=45) | |
| Razer Blade 15 Advanced (Mid 2021) | |
| SCHENKER XMG Pro 15 (Early 2021, RTX 3080) | |
| SCHENKER XMG Pro 15 (Late 2021) | |
| SCHENKER XMG Pro 15 (Late 2021) (Unterhaltungsmodus) | |
| Alienware x15 RTX 3070 P111F | |
| SCHENKER XMG Pro 15 (Late 2021) (Lautlosmodus) | |
| Lenovo Legion S7 15ACH6 82K80030GE | |
| SCHENKER XMG Pro 15 (Late 2021) (Stromsparmodus) | |
| 2560x1440 Time Spy Graphics | |
| Media della classe Gaming (224 - 22547, n=234, ultimi 2 anni) | |
| Media NVIDIA GeForce RTX 3080 Laptop GPU (6407 - 13210, n=44) | |
| Razer Blade 15 Advanced (Mid 2021) | |
| SCHENKER XMG Pro 15 (Early 2021, RTX 3080) | |
| SCHENKER XMG Pro 15 (Late 2021) | |
| Alienware x15 RTX 3070 P111F | |
| SCHENKER XMG Pro 15 (Late 2021) (Unterhaltungsmodus) | |
| MSI Delta 15 A5EFK | |
| SCHENKER XMG Pro 15 (Late 2021) (Lautlosmodus) | |
| Lenovo Legion S7 15ACH6 82K80030GE | |
| SCHENKER XMG Pro 15 (Late 2021) (Stromsparmodus) | |
Prestazioni di gioco
Alla risoluzione FHD e alle impostazioni di qualità massima, l'hardware visualizza senza sforzo tutti i giochi attuali senza problemi. La scelta di risoluzioni più alte è anche possibile, anche se con impostazioni di dettaglio ridotte. Il frame rate si aggira intorno alla media della RTX 3080 - a volte il Pro 15 lo supera, altre volte rimane leggermente indietro
| The Witcher 3 - 1920x1080 Ultra Graphics & Postprocessing (HBAO+) | |
| Media della classe Gaming (8.61 - 216, n=227, ultimi 2 anni) | |
| Media NVIDIA GeForce RTX 3080 Laptop GPU (85.1 - 123, n=39) | |
| Razer Blade 15 Advanced (Mid 2021) | |
| Alienware x15 RTX 3070 P111F | |
| SCHENKER XMG Pro 15 (Late 2021) | |
| SCHENKER XMG Pro 15 (Early 2021, RTX 3080) | |
| MSI Delta 15 A5EFK | |
| SCHENKER XMG Pro 15 (Late 2021) (Lautlosmodus) | |
| Lenovo Legion S7 15ACH6 82K80030GE | |
| Dota 2 Reborn | |
| 1920x1080 ultra (3/3) best looking | |
| Media della classe Gaming (26.9 - 220, n=238, ultimi 2 anni) | |
| Razer Blade 15 Advanced (Mid 2021) | |
| SCHENKER XMG Pro 15 (Late 2021) | |
| Alienware x15 RTX 3070 P111F | |
| Media NVIDIA GeForce RTX 3080 Laptop GPU (98 - 156, n=44) | |
| SCHENKER XMG Pro 15 (Late 2021) (Unterhaltungsmodus) | |
| Lenovo Legion S7 15ACH6 82K80030GE | |
| SCHENKER XMG Pro 15 (Early 2021, RTX 3080) | |
| SCHENKER XMG Pro 15 (Late 2021) (Stromsparmodus) | |
| MSI Delta 15 A5EFK | |
| SCHENKER XMG Pro 15 (Late 2021) (Lautlosmodus) | |
| 3840x2160 ultra (3/3) best looking | |
| Media della classe Gaming (14.2 - 205, n=81, ultimi 2 anni) | |
| SCHENKER XMG Pro 15 (Late 2021) | |
| SCHENKER XMG Pro 15 (Late 2021) (Unterhaltungsmodus) | |
| Media NVIDIA GeForce RTX 3080 Laptop GPU (55.2 - 128, n=16) | |
| Lenovo Legion S7 15ACH6 82K80030GE | |
| SCHENKER XMG Pro 15 (Late 2021) (Lautlosmodus) | |
| SCHENKER XMG Pro 15 (Late 2021) (Stromsparmodus) | |
| X-Plane 11.11 | |
| 1920x1080 high (fps_test=3) | |
| Media della classe Gaming (12.4 - 166.2, n=243, ultimi 2 anni) | |
| Razer Blade 15 Advanced (Mid 2021) | |
| Alienware x15 RTX 3070 P111F | |
| SCHENKER XMG Pro 15 (Late 2021) | |
| SCHENKER XMG Pro 15 (Late 2021) (Unterhaltungsmodus) | |
| Media NVIDIA GeForce RTX 3080 Laptop GPU (65.6 - 113, n=43) | |
| SCHENKER XMG Pro 15 (Early 2021, RTX 3080) | |
| SCHENKER XMG Pro 15 (Late 2021) (Stromsparmodus) | |
| Lenovo Legion S7 15ACH6 82K80030GE | |
| SCHENKER XMG Pro 15 (Late 2021) (Lautlosmodus) | |
| 3840x2160 high (fps_test=3) | |
| Media della classe Gaming (12 - 145.5, n=76, ultimi 2 anni) | |
| SCHENKER XMG Pro 15 (Late 2021) | |
| Media NVIDIA GeForce RTX 3080 Laptop GPU (39.9 - 88, n=16) | |
| SCHENKER XMG Pro 15 (Late 2021) (Unterhaltungsmodus) | |
| SCHENKER XMG Pro 15 (Late 2021) (Stromsparmodus) | |
| Lenovo Legion S7 15ACH6 82K80030GE | |
| SCHENKER XMG Pro 15 (Late 2021) (Lautlosmodus) | |
| Strange Brigade | |
| 1920x1080 ultra AA:ultra AF:16 | |
| Media della classe Gaming (14.6 - 421, n=226, ultimi 2 anni) | |
| Media NVIDIA GeForce RTX 3080 Laptop GPU (117 - 219, n=33) | |
| Razer Blade 15 Advanced (Mid 2021) (1.47.22.14 D3D12) | |
| Alienware x15 RTX 3070 P111F (1.47.22.14 D3D12) | |
| SCHENKER XMG Pro 15 (Late 2021) (1.47.22.14 D3D12) | |
| MSI Delta 15 A5EFK (1.47.22.14 D3D12) | |
| SCHENKER XMG Pro 15 (Late 2021) (1.47.22.14 D3D12, Unterhaltungsmodus) | |
| SCHENKER XMG Pro 15 (Late 2021) (1.47.22.14 D3D12, Lautlosmodus) | |
| Lenovo Legion S7 15ACH6 82K80030GE (1.47.22.14 D3D12) | |
| SCHENKER XMG Pro 15 (Late 2021) (1.47.22.14 D3D12, Stromsparmodus) | |
| 2560x1440 ultra AA:ultra AF:16 | |
| Media della classe Gaming (79.8 - 322, n=139, ultimi 2 anni) | |
| Media NVIDIA GeForce RTX 3080 Laptop GPU (123 - 165, n=13) | |
| Alienware x15 RTX 3070 P111F (1.47.22.14 D3D12) | |
| SCHENKER XMG Pro 15 (Late 2021) (1.47.22.14 D3D12) | |
| Lenovo Legion S7 15ACH6 82K80030GE (1.47.22.14 D3D12) | |
| 3840x2160 ultra AA:ultra AF:16 | |
| Media della classe Gaming (54.5 - 298, n=57, ultimi 2 anni) | |
| Media NVIDIA GeForce RTX 3080 Laptop GPU (55.9 - 91.7, n=11) | |
| SCHENKER XMG Pro 15 (Late 2021) (1.47.22.14 D3D12) | |
| SCHENKER XMG Pro 15 (Late 2021) (1.47.22.14 D3D12, Unterhaltungsmodus) | |
| SCHENKER XMG Pro 15 (Late 2021) (1.47.22.14 D3D12, Lautlosmodus) | |
| Lenovo Legion S7 15ACH6 82K80030GE (1.47.22.14 D3D12) | |
| SCHENKER XMG Pro 15 (Late 2021) (1.47.22.14 D3D12, Stromsparmodus) | |
| F1 2021 | |
| 1920x1080 Ultra High Preset + Raytracing AA:T AF:16x | |
| Media della classe Gaming (13.5 - 271, n=63, ultimi 2 anni) | |
| SCHENKER XMG Pro 15 (Late 2021) (831795) | |
| SCHENKER XMG Pro 15 (Late 2021) (831795, Unterhaltungsmodus) | |
| Media NVIDIA GeForce RTX 3080 Laptop GPU (74.9 - 123.7, n=8) | |
| MSI Delta 15 A5EFK | |
| SCHENKER XMG Pro 15 (Late 2021) (831795, Lautlosmodus) | |
| Lenovo Legion S7 15ACH6 82K80030GE (815237) | |
| SCHENKER XMG Pro 15 (Late 2021) (831795, Stromsparmodus) | |
| 2560x1440 Ultra High Preset + Raytracing AA:T AF:16x | |
| Media della classe Gaming (47.5 - 204, n=39, ultimi 2 anni) | |
| SCHENKER XMG Pro 15 (Late 2021) (831795) | |
| Media NVIDIA GeForce RTX 3080 Laptop GPU (84 - 90.4, n=3) | |
| Lenovo Legion S7 15ACH6 82K80030GE (815237) | |
| 3840x2160 Ultra High Preset + Raytracing AA:T AF:16x | |
| Media della classe Gaming (47.6 - 115.1, n=22, ultimi 2 anni) | |
| SCHENKER XMG Pro 15 (Late 2021) (831795) | |
| SCHENKER XMG Pro 15 (Late 2021) (831795, Unterhaltungsmodus) | |
| Media NVIDIA GeForce RTX 3080 Laptop GPU (32.5 - 51.5, n=6) | |
| SCHENKER XMG Pro 15 (Late 2021) (831795, Lautlosmodus) | |
| Lenovo Legion S7 15ACH6 82K80030GE (815237) | |
| SCHENKER XMG Pro 15 (Late 2021) (831795, Stromsparmodus) | |
| Far Cry 6 | |
| 1920x1080 Ultra Graphics Quality + HD Textures AA:T | |
| Media della classe Gaming (14.7 - 167, n=35, ultimi 2 anni) | |
| Lenovo Legion S7 15ACH6 82K80030GE | |
| Media NVIDIA GeForce RTX 3080 Laptop GPU (55 - 104, n=4) | |
| MSI Delta 15 A5EFK | |
| SCHENKER XMG Pro 15 (Late 2021) | |
| 3840x2160 Ultra Graphics Quality + HD Textures AA:T | |
| Media della classe Gaming (3.38 - 92, n=18, ultimi 2 anni) | |
| Media NVIDIA GeForce RTX 3080 Laptop GPU (40 - 50, n=3) | |
| SCHENKER XMG Pro 15 (Late 2021) | |
| 1920x1080 Ultra Graphics Quality + HD Textures + DXR AA:T | |
| Media della classe Gaming (53 - 119, n=11, ultimi 2 anni) | |
| Media NVIDIA GeForce RTX 3080 Laptop GPU (59 - 84, n=3) | |
| Lenovo Legion S7 15ACH6 82K80030GE | |
| SCHENKER XMG Pro 15 (Late 2021) | |
| MSI Delta 15 A5EFK | |
| Forza Horizon 5 | |
| 1920x1080 Extreme Preset | |
| Media NVIDIA GeForce RTX 3080 Laptop GPU (81 - 84, n=3) | |
| SCHENKER XMG Pro 15 (Late 2021) | |
| Media della classe Gaming (19 - 124, n=11, ultimi 2 anni) | |
| 3840x2160 Extreme Preset | |
| Media della classe Gaming (50 - 95, n=2, ultimi 2 anni) | |
| Media NVIDIA GeForce RTX 3080 Laptop GPU (48 - 55, n=3) | |
| SCHENKER XMG Pro 15 (Late 2021) | |
| Battlefield 2042 | |
| 1920x1080 Ultra Preset | |
| Media della classe Gaming (106.1 - 172.6, n=2, ultimi 2 anni) | |
| Media NVIDIA GeForce RTX 3080 Laptop GPU (88.7 - 104, n=2) | |
| SCHENKER XMG Pro 15 (Late 2021) | |
| 3840x2160 Ultra Preset | |
| Media della classe Gaming (ultimi 2 anni) | |
| Media NVIDIA GeForce RTX 3080 Laptop GPU (43 - 50.2, n=2) | |
| SCHENKER XMG Pro 15 (Late 2021) | |
| 1920x1080 Ultra Preset + Ray Tracing | |
| Media della classe Gaming (ultimi 2 anni) | |
| Media NVIDIA GeForce RTX 3080 Laptop GPU (68 - 84.2, n=2) | |
| SCHENKER XMG Pro 15 (Late 2021) | |
Al fine di determinare se il frame rate rimane costante per un periodo prolungato, abbiamo lasciato inattivo The Witcher 3 per circa 60 minuti a risoluzione FHD e dettagli massimi. Il personaggio non è stato mosso per tutto il tempo. Con la modalità performance selezionata, non abbiamo osservato alcun calo di frame
Witcher 3 FPS Diagram
| basso | medio | alto | ultra | QHD | 4K | |
| GTA V (2015) | 184 | 180 | 166 | 102 | 85.7 | 93 |
| The Witcher 3 (2015) | 399 | 285 | 176 | 100 | 69.6 | |
| Dota 2 Reborn (2015) | 164 | 146 | 137 | 132 | 116 | |
| Final Fantasy XV Benchmark (2018) | 187 | 129 | 97.5 | 74.6 | 44.1 | |
| X-Plane 11.11 (2018) | 128 | 109 | 88.5 | 67.9 | ||
| Far Cry 5 (2018) | 163 | 130 | 123 | 115 | 95 | 54 |
| Strange Brigade (2018) | 465 | 244 | 201 | 176 | 130 | 76 |
| F1 2021 (2021) | 314 | 219 | 190 | 117 | 87.4 | 49.6 |
| Alan Wake Remastered (2021) | 121 | 111 | 108 | 64.6 | ||
| Far Cry 6 (2021) | 101 | 82 | 75 | 70 | 62 | 40 |
| Guardians of the Galaxy (2021) | 130 | 122 | 124 | 122 | 95 | 55 |
| Riders Republic (2021) | 155 | 137 | 113 | 104 | 74 | 41 |
| Forza Horizon 5 (2021) | 214 | 131 | 122 | 81 | 67 | 48 |
| Battlefield 2042 (2021) | 133 | 110 | 99.8 | 88.7 | 69.9 | 43 |
| Halo Infinite (2021) | 118 | 101 | 96.1 | 70.4 | 40.2 |
Emissioni - Lo Schenker Laptop fa molto rumore
Rumore di sistema
Durante l'uso quotidiano (ufficio, navigazione sul web), le due ventole tendono ad essere riservate e silenziose. Tuttavia, abbiamo notato che di tanto in tanto le ventole aumentano inutilmente - questo aumenta il livello di rumore fino a 41 dB(A). Sotto carico, le cose possono diventare molto rumorose con valori massimi di 58 dB(A) (stress test) e 53 dB(A) (Witcher 3 test). Il Razer Blade 15 produce costantemente meno rumore indipendentemente dal carico del sistema
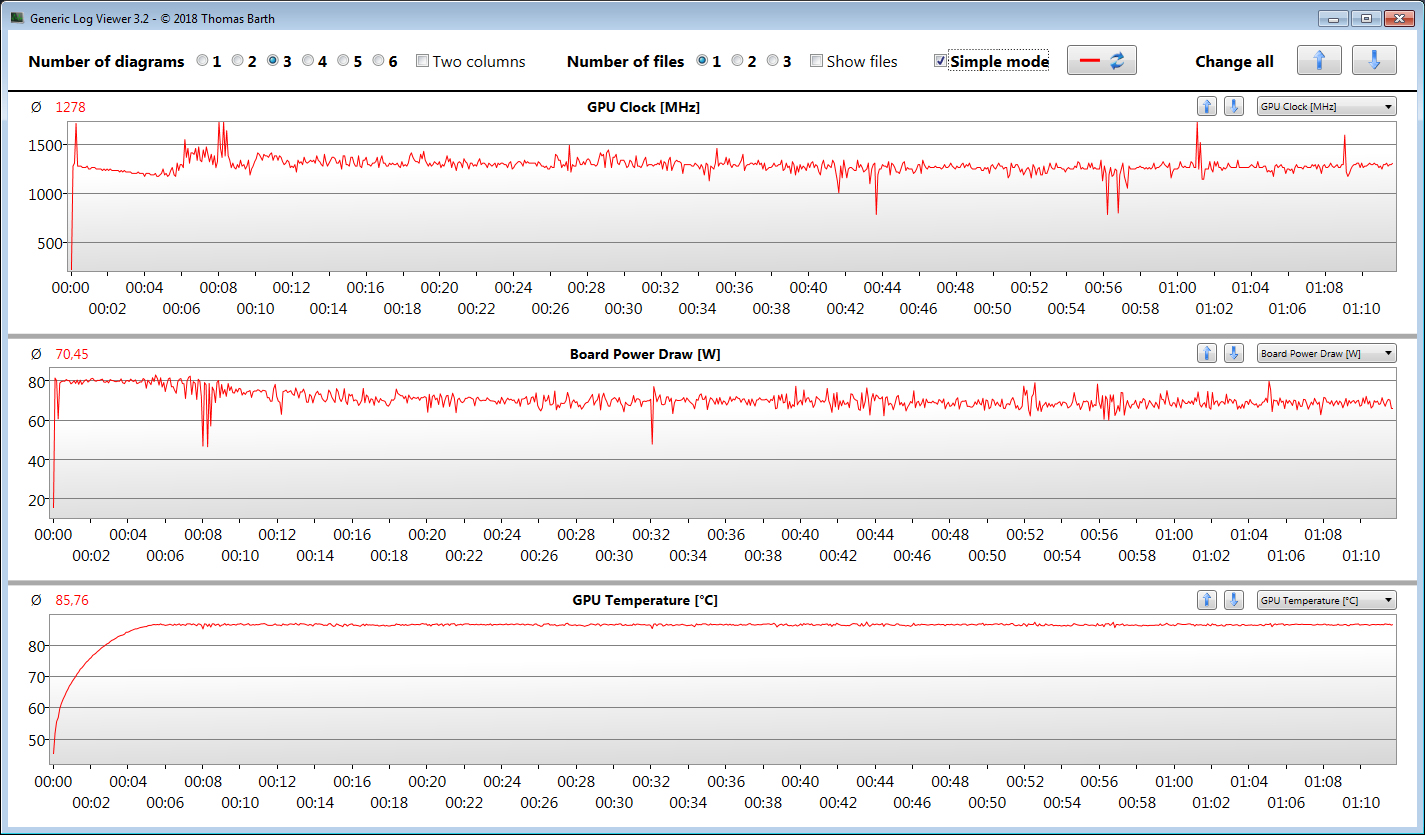
I livelli di rumore sotto carico possono essere ridotti selezionando il profilo di potenza silenzioso. Le ventole poi girano molto silenziosamente. Nel frattempo, le frequenze di clock della CPU e della GPU sono fortemente limitate. Anche se il gioco è ancora possibile in questa modalità, le impostazioni di qualità o la risoluzione dovranno probabilmente essere ridotte.
Rumorosità
| Idle |
| 31 / 37 / 41 dB(A) |
| Sotto carico |
| 56 / 58 dB(A) |
 | ||
30 dB silenzioso 40 dB(A) udibile 50 dB(A) rumoroso |
||
min: | ||
| SCHENKER XMG Pro 15 (Late 2021) i7-11800H, GeForce RTX 3080 Laptop GPU | Lenovo Legion S7 15ACH6 82K80030GE R9 5900HX, GeForce RTX 3060 Laptop GPU | Alienware x15 RTX 3070 P111F i7-11800H, GeForce RTX 3070 Laptop GPU | Razer Blade 15 Advanced (Mid 2021) i7-11800H, GeForce RTX 3080 Laptop GPU | SCHENKER XMG Pro 15 (Early 2021, RTX 3080) i7-10870H, GeForce RTX 3080 Laptop GPU | MSI Delta 15 A5EFK R9 5900HX, Radeon RX 6700M | |
|---|---|---|---|---|---|---|
| Noise | 11% | 19% | 19% | 4% | 10% | |
| off /ambiente * | 24 | 25 -4% | 24.1 -0% | 25.1 -5% | 25 -4% | 25 -4% |
| Idle Minimum * | 31 | 25 19% | 26.6 14% | 25.3 18% | 33 -6% | 25 19% |
| Idle Average * | 37 | 30 19% | 26.6 28% | 25.3 32% | 34 8% | 30 19% |
| Idle Maximum * | 41 | 36 12% | 26.6 35% | 25.3 38% | 35 15% | 40 2% |
| Load Average * | 56 | 42 25% | 30.9 45% | 42 25% | 51 9% | 47 16% |
| Witcher 3 ultra * | 53 | 53 -0% | 49.9 6% | 45.6 14% | 52 2% | 48 9% |
| Load Maximum * | 58 | 54 7% | 53.5 8% | 51.6 11% | 57 2% | 51 12% |
* ... Meglio usare valori piccoli
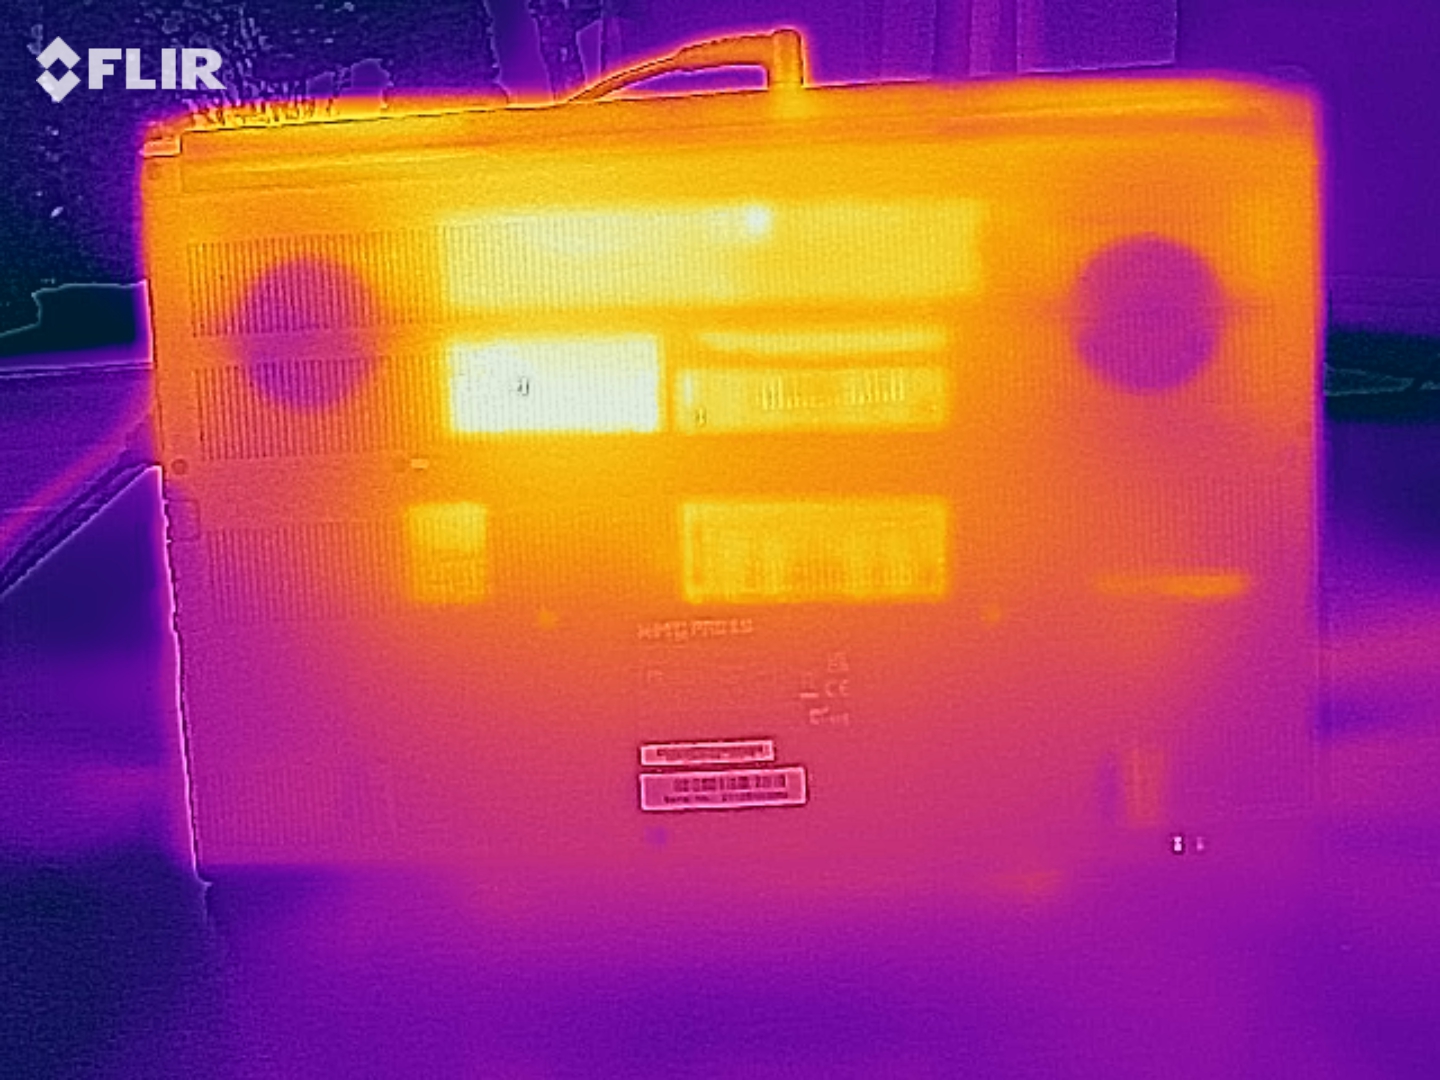
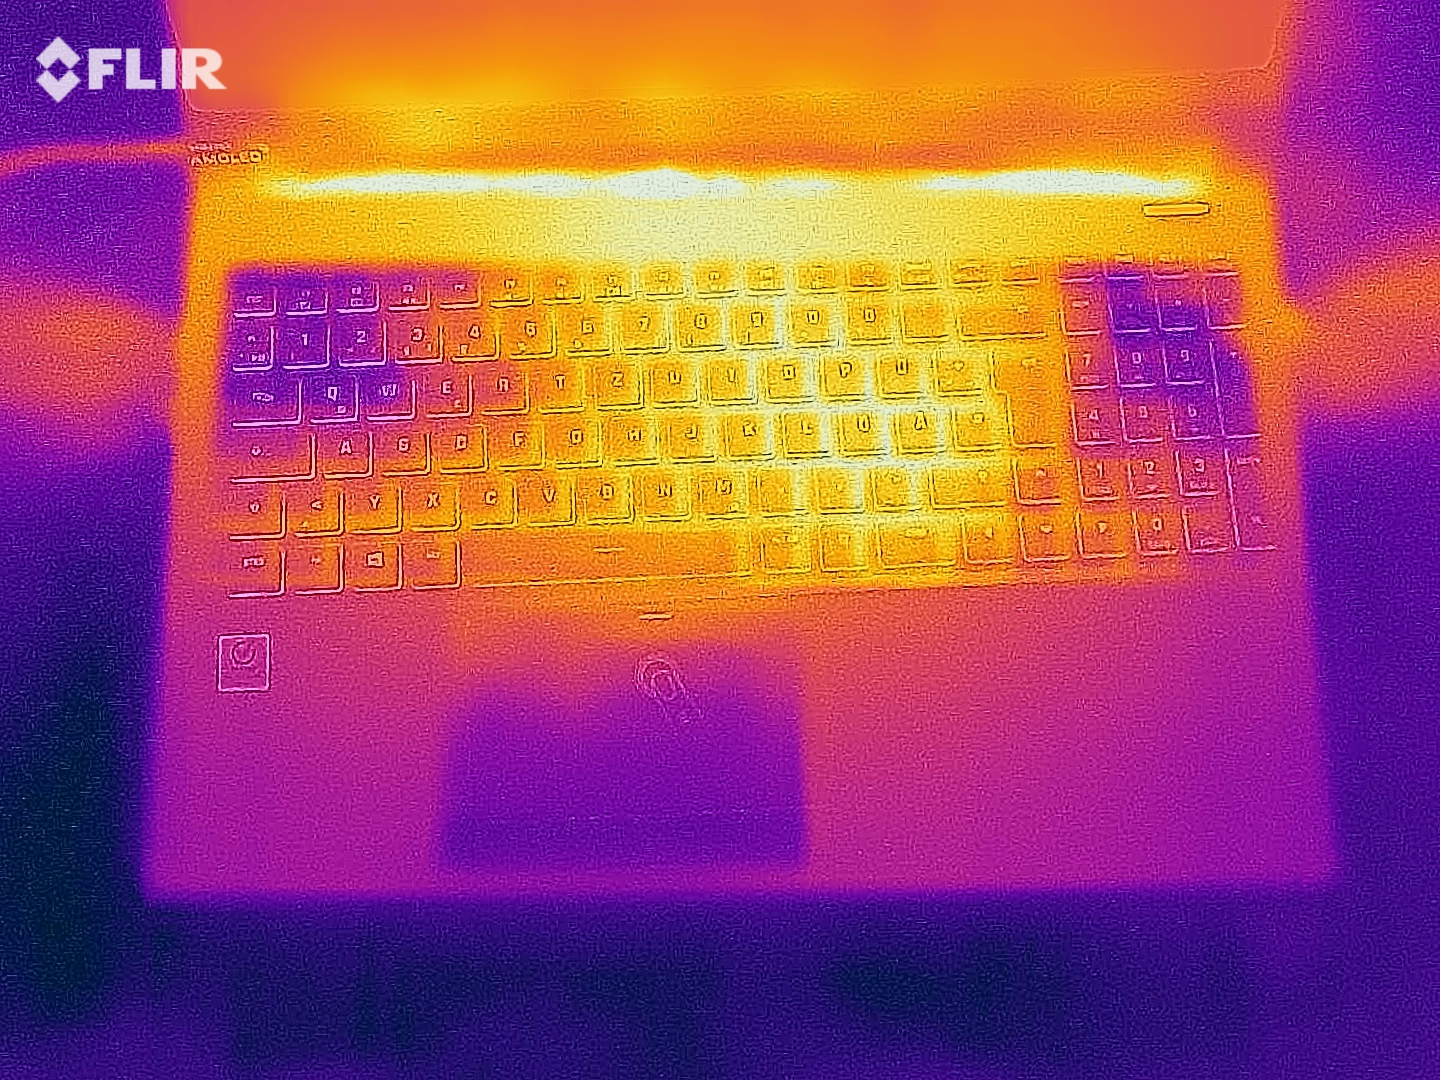
Temperatura
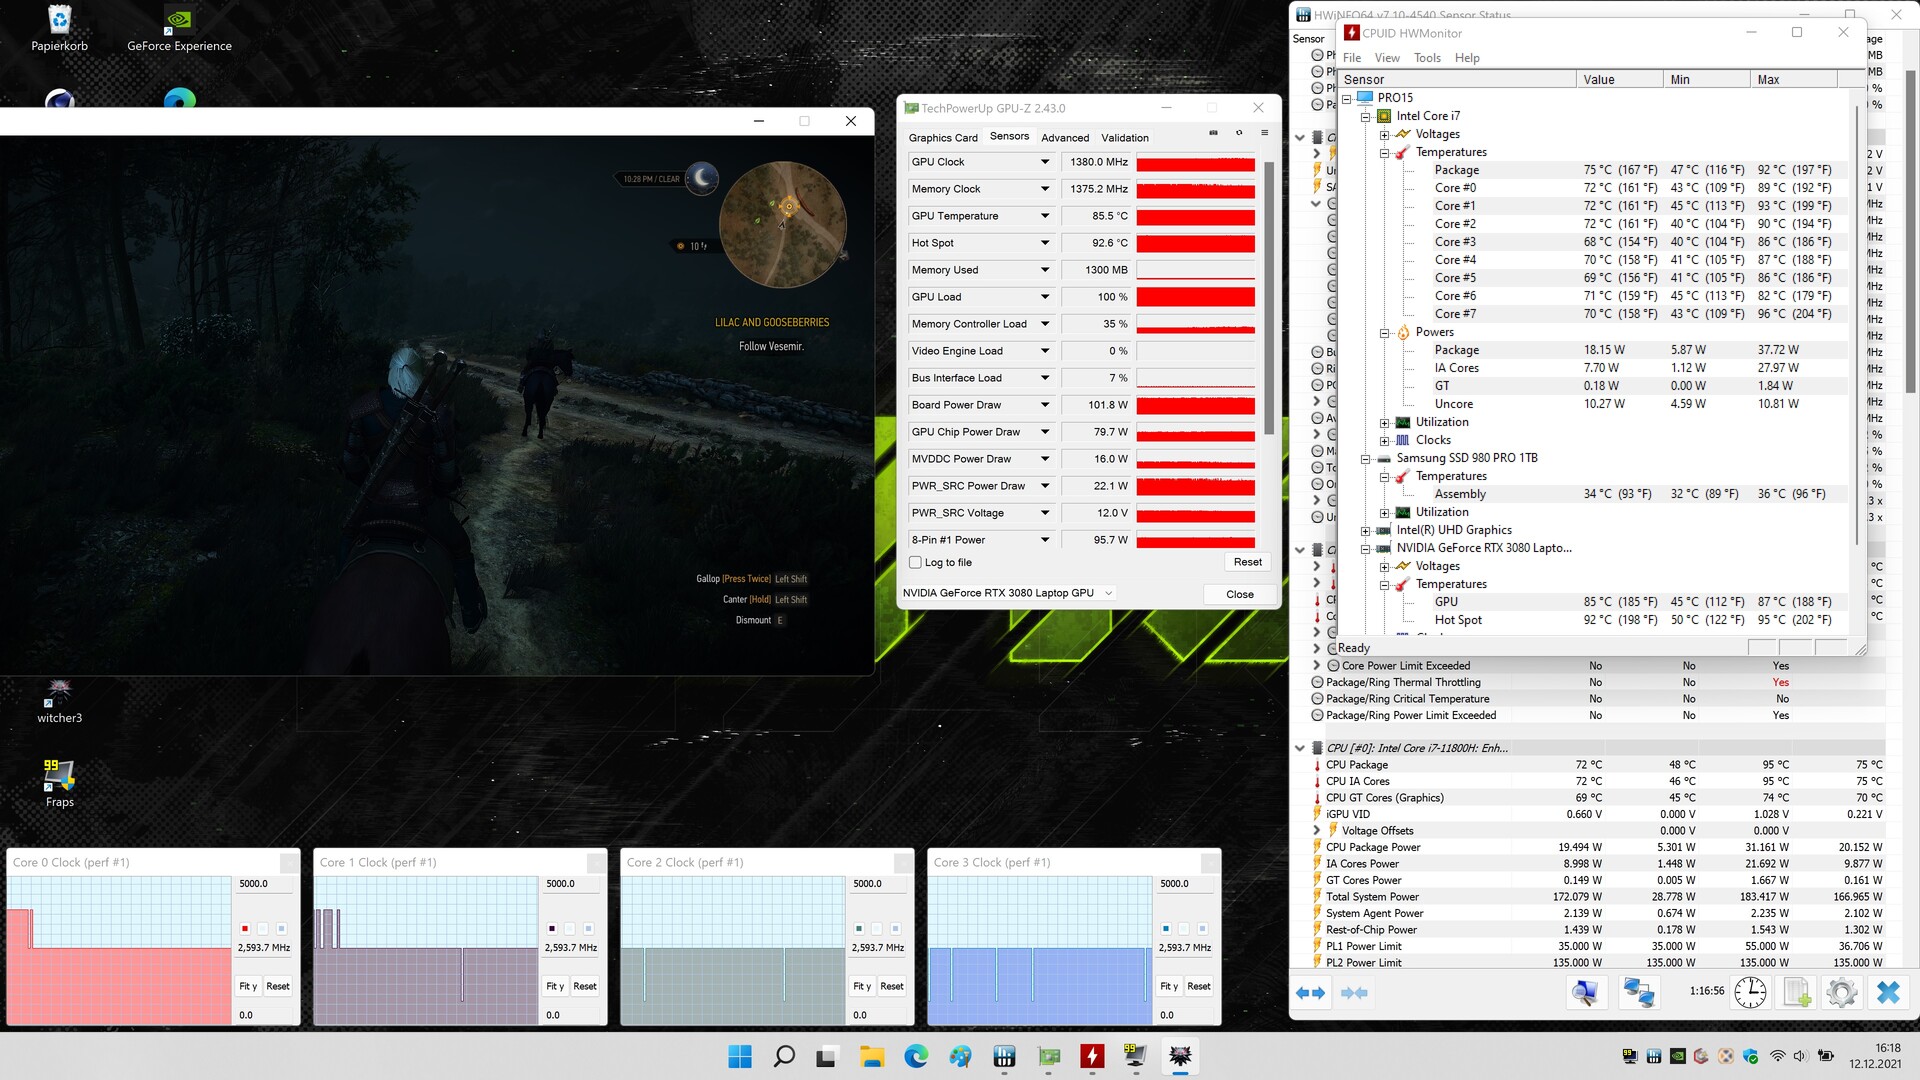
Durante l'uso quotidiano (ufficio, navigazione sul web), le temperature superficiali rimangono basse. Sotto carico (stress test, Witcher 3), il portatile diventa molto caldo. In alcuni punti, abbiamo misurato temperature superiori a 60 °C (140 °F). All'inizio del test, la CPU raggiunge una temperatura di 100 °C (212 °F) e quindi il massimo specificato da Intel. Successivamente, la temperatura si stabilizza tra 90 e 100 °C (194-212 °F)
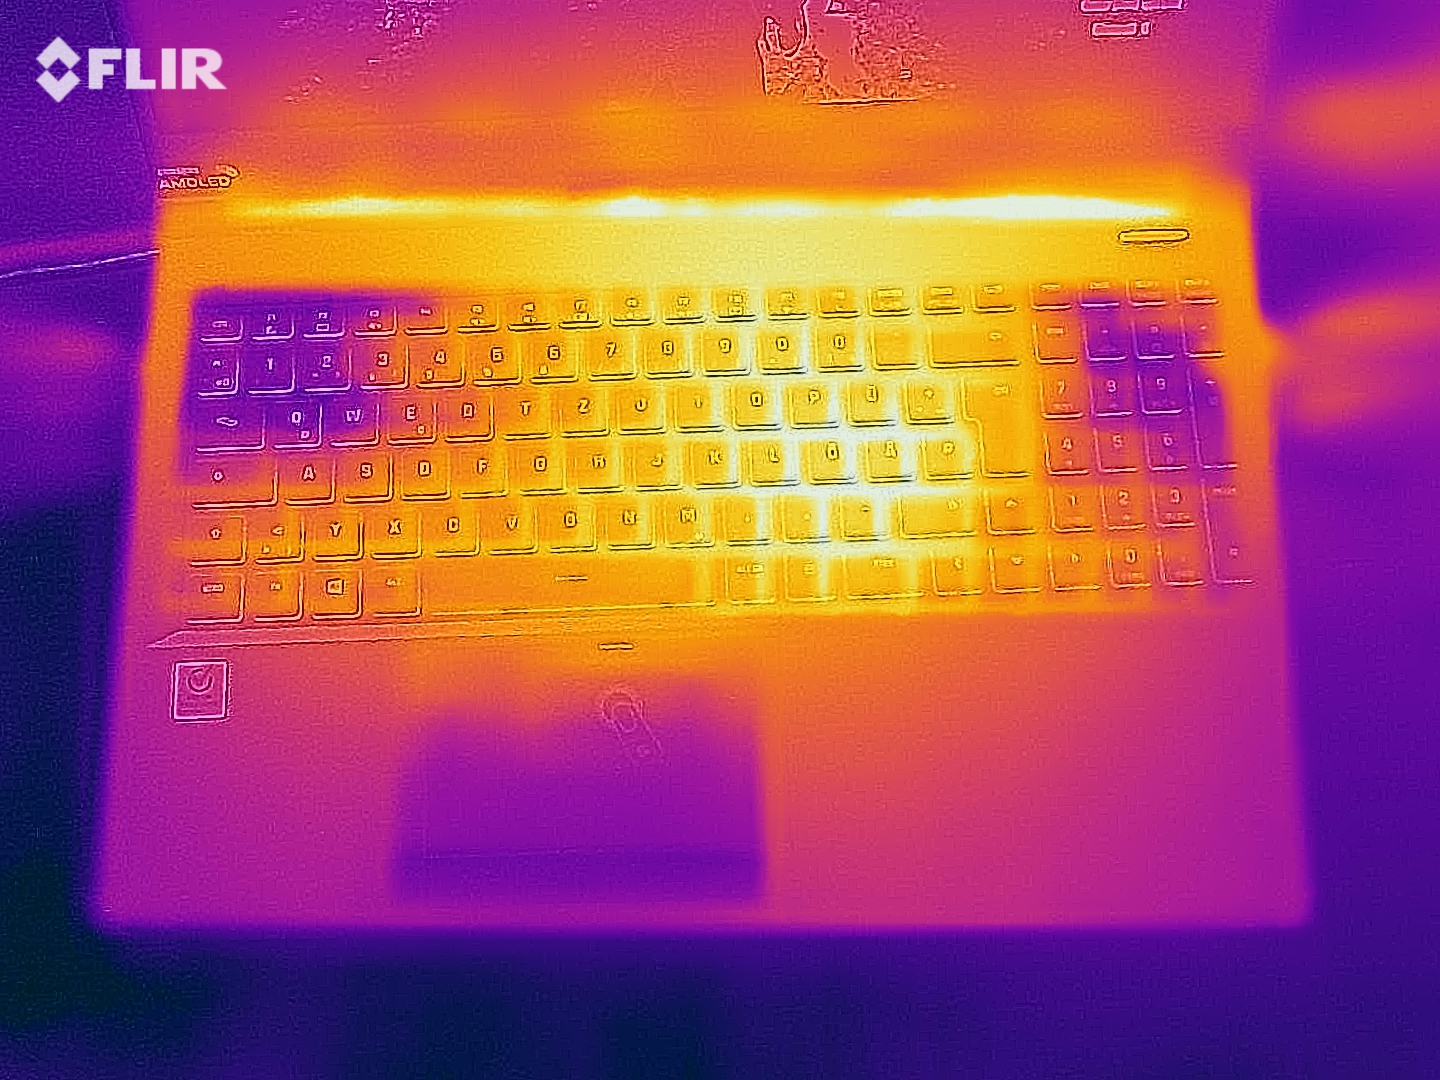
(±) La temperatura massima sul lato superiore è di 44 °C / 111 F, rispetto alla media di 40.4 °C / 105 F, che varia da 21.2 a 68.8 °C per questa classe Gaming.
(-) Il lato inferiore si riscalda fino ad un massimo di 60 °C / 140 F, rispetto alla media di 43.2 °C / 110 F
(+) In idle, la temperatura media del lato superiore è di 27.8 °C / 82 F, rispetto alla media deld ispositivo di 33.8 °C / 93 F.
(-) Riproducendo The Witcher 3, la temperatura media per il lato superiore e' di 44.2 °C / 112 F, rispetto alla media del dispositivo di 33.8 °C / 93 F.
(±) I poggiapolsi e il touchpad possono diventare molto caldi al tatto con un massimo di 38 °C / 100.4 F.
(-) La temperatura media della zona del palmo della mano di dispositivi simili e'stata di 28.9 °C / 84 F (-9.1 °C / -16.4 F).
| SCHENKER XMG Pro 15 (Late 2021) Intel Core i7-11800H, NVIDIA GeForce RTX 3080 Laptop GPU | Lenovo Legion S7 15ACH6 82K80030GE AMD Ryzen 9 5900HX, NVIDIA GeForce RTX 3060 Laptop GPU | Alienware x15 RTX 3070 P111F Intel Core i7-11800H, NVIDIA GeForce RTX 3070 Laptop GPU | Razer Blade 15 Advanced (Mid 2021) Intel Core i7-11800H, NVIDIA GeForce RTX 3080 Laptop GPU | SCHENKER XMG Pro 15 (Early 2021, RTX 3080) Intel Core i7-10870H, NVIDIA GeForce RTX 3080 Laptop GPU | MSI Delta 15 A5EFK AMD Ryzen 9 5900HX, AMD Radeon RX 6700M | |
|---|---|---|---|---|---|---|
| Heat | 5% | -3% | -8% | -7% | 1% | |
| Maximum Upper Side * | 44 | 49 -11% | 59.2 -35% | 51 -16% | 51 -16% | 50 -14% |
| Maximum Bottom * | 60 | 50 17% | 58 3% | 52 13% | 66 -10% | 55 8% |
| Idle Upper Side * | 30 | 29 3% | 28.4 5% | 35.2 -17% | 32 -7% | 31 -3% |
| Idle Bottom * | 34 | 30 12% | 29 15% | 37.8 -11% | 32 6% | 30 12% |
* ... Meglio usare valori piccoli
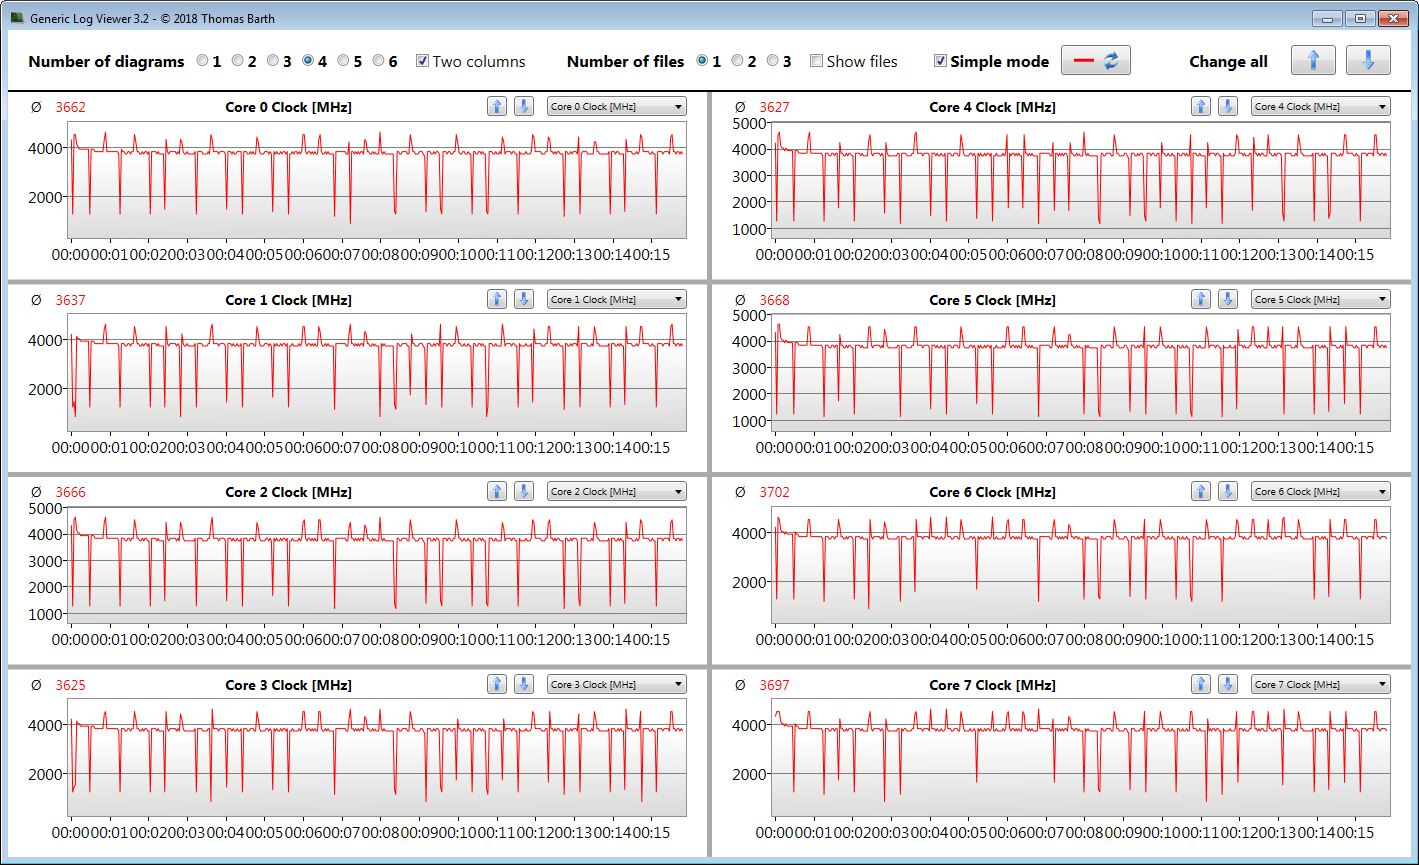
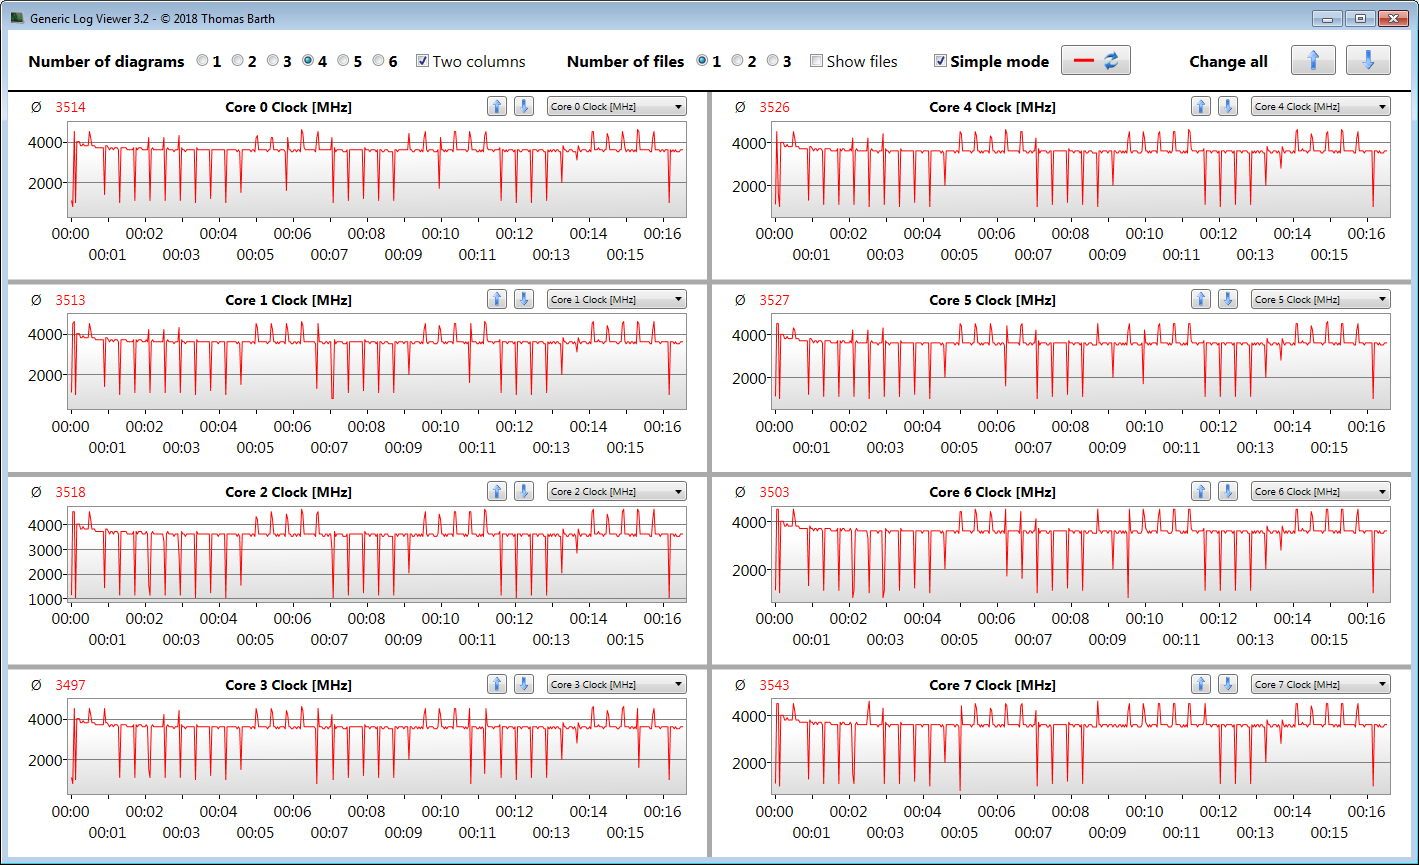
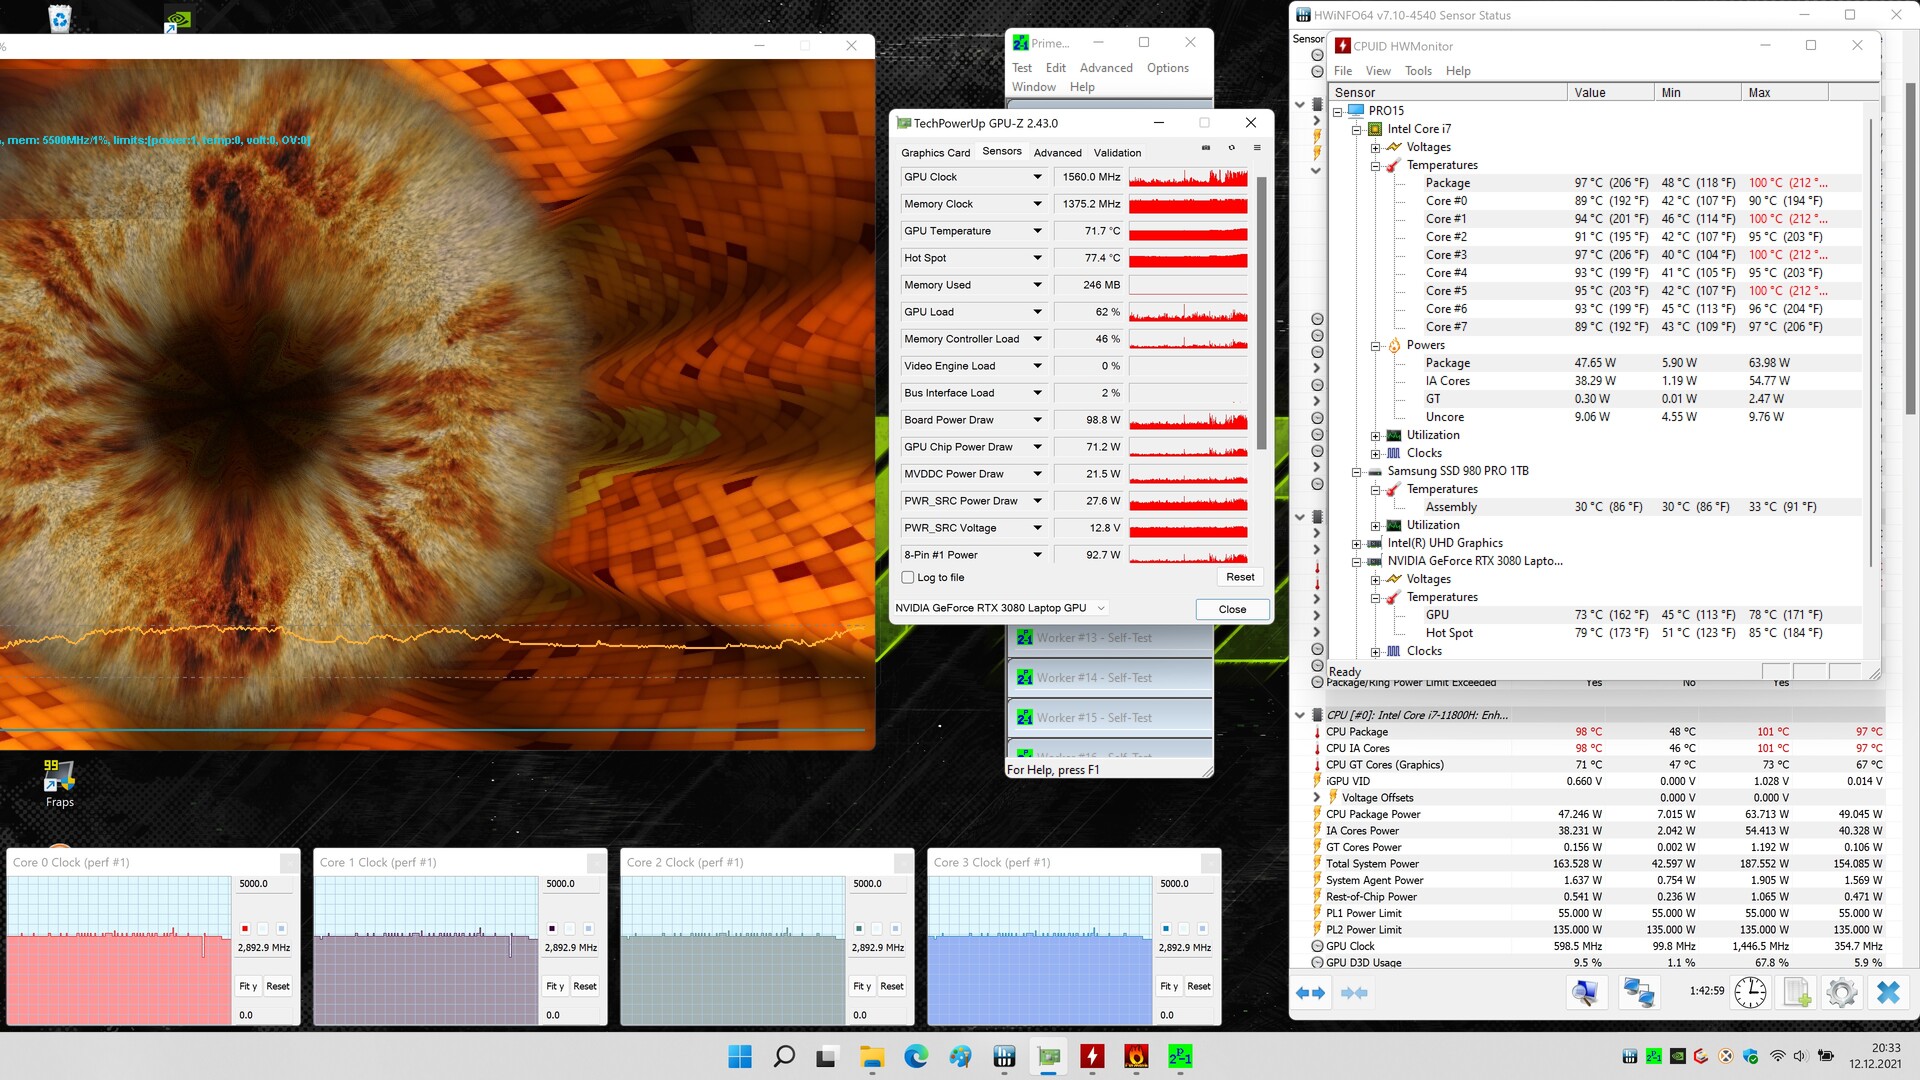
Test di stress
All'inizio del nostro stress test (eseguendo Prime95 e FurMark per almeno un'ora) la CPU (da 3.8 a 4.1 GHz) e la GPU (da 1300 a 1600 MHz) girano a velocità di clock abbastanza elevate. Dopo pochi minuti, le velocità di clock scendono rispettivamente a 2,9 GHz e da 500 a 1600 MHz, dove rimangono. Questo stress test rappresenta uno scenario estremo. Usiamo questo test per determinare se il sistema rimane stabile anche sotto carico massimo
Altoparlanti
Gli altoparlanti stereo producono un suono mediocre che manca di bassi. Il livello massimo del volume è relativamente alto. Raccomandiamo le cuffie o gli altoparlanti esterni per un'esperienza sonora migliore
SCHENKER XMG Pro 15 (Late 2021) analisi audio
(+) | gli altoparlanti sono relativamente potenti (89 dB)
Bassi 100 - 315 Hz
(-) | quasi nessun basso - in media 26% inferiori alla media
(±) | la linearità dei bassi è media (10.4% delta rispetto alla precedente frequenza)
Medi 400 - 2000 Hz
(±) | medi elevati - circa 10.2% superiore alla media
(±) | linearità dei medi adeguata (8% delta rispetto alla precedente frequenza)
Alti 2 - 16 kHz
(±) | alti elevati - circa 5.1% superiori alla media
(+) | alti lineari (5.5% delta rispetto alla precedente frequenza)
Nel complesso 100 - 16.000 Hz
(±) | la linearità complessiva del suono è media (22.5% di differenza rispetto alla media
Rispetto alla stessa classe
» 78% di tutti i dispositivi testati in questa classe è stato migliore, 6% simile, 16% peggiore
» Il migliore ha avuto un delta di 6%, medio di 18%, peggiore di 132%
Rispetto a tutti i dispositivi testati
» 61% di tutti i dispositivi testati in questa classe è stato migliore, 6% similare, 33% peggiore
» Il migliore ha avuto un delta di 4%, medio di 25%, peggiore di 134%
Razer Blade 15 Advanced (Mid 2021) analisi audio
(+) | gli altoparlanti sono relativamente potenti (84.6 dB)
Bassi 100 - 315 Hz
(-) | quasi nessun basso - in media 20.1% inferiori alla media
(±) | la linearità dei bassi è media (12.8% delta rispetto alla precedente frequenza)
Medi 400 - 2000 Hz
(+) | medi bilanciati - solo only 3.6% rispetto alla media
(+) | medi lineari (4.1% delta rispetto alla precedente frequenza)
Alti 2 - 16 kHz
(+) | Alti bilanciati - appena 4.9% dalla media
(±) | la linearità degli alti è media (8.3% delta rispetto alla precedente frequenza)
Nel complesso 100 - 16.000 Hz
(±) | la linearità complessiva del suono è media (15.8% di differenza rispetto alla media
Rispetto alla stessa classe
» 34% di tutti i dispositivi testati in questa classe è stato migliore, 7% simile, 59% peggiore
» Il migliore ha avuto un delta di 6%, medio di 18%, peggiore di 132%
Rispetto a tutti i dispositivi testati
» 20% di tutti i dispositivi testati in questa classe è stato migliore, 5% similare, 75% peggiore
» Il migliore ha avuto un delta di 4%, medio di 25%, peggiore di 134%
Gestione dell'energia - Schenker 15 con una durata della batteria decente
Consumo di energia
Il consumo energetico del modello Schenker non è niente di eccezionale. Corrisponde alle nostre aspettative per l'hardware installato. All'inizio del nostro stress test, l'assorbimento energetico raggiunge i 218 watt e poi scende rapidamente a circa 165 watt. Durante il nostro Witcher 3 test abbiamo osservato un consumo medio di 186 watt. Dato che non abbiamo riscontrato il consumo della batteria durante questo test, il caricabatterie incluso sembra essere sufficiente (valutato per 180 watt)
| Off / Standby | |
| Idle | |
| Sotto carico |
|
Leggenda:
min: Attualmente utilizziamo il Metrahit Energy, un multimetro digitale professionale per la misurazione della qualità della potenza e dell'energia monofase, per le nostre misurazioni. | |
| SCHENKER XMG Pro 15 (Late 2021) i7-11800H, GeForce RTX 3080 Laptop GPU | Lenovo Legion S7 15ACH6 82K80030GE R9 5900HX, GeForce RTX 3060 Laptop GPU | Alienware x15 RTX 3070 P111F i7-11800H, GeForce RTX 3070 Laptop GPU | Razer Blade 15 Advanced (Mid 2021) i7-11800H, GeForce RTX 3080 Laptop GPU | SCHENKER XMG Pro 15 (Early 2021, RTX 3080) i7-10870H, GeForce RTX 3080 Laptop GPU | MSI Delta 15 A5EFK R9 5900HX, Radeon RX 6700M | Media NVIDIA GeForce RTX 3080 Laptop GPU | Media della classe Gaming | |
|---|---|---|---|---|---|---|---|---|
| Power Consumption | 18% | -0% | -8% | 21% | 12% | -9% | 3% | |
| Idle Minimum * | 20 | 13 35% | 15.7 21% | 19.5 2% | 8 60% | 10 50% | 19.6 ? 2% | 13.8 ? 31% |
| Idle Average * | 22 | 16 27% | 20.3 8% | 23.3 -6% | 13 41% | 18 18% | 24.1 ? -10% | 19.2 ? 13% |
| Idle Maximum * | 26 | 23 12% | 43 -65% | 40.1 -54% | 22 15% | 25 4% | 33.3 ? -28% | 27 ? -4% |
| Load Average * | 103 | 95 8% | 94.4 8% | 98.9 4% | 97 6% | 101 2% | 107.9 ? -5% | 111.3 ? -8% |
| Witcher 3 ultra * | 186 | 156 16% | 167 10% | 174 6% | 179 4% | 187 -1% | ||
| Load Maximum * | 218 | 191 12% | 183.4 16% | 214 2% | 225 -3% | 217 -0% | 230 ? -6% | 251 ? -15% |
* ... Meglio usare valori piccoli
Energy Consumption Witcher 3 / Stress Test
Energy Consumption external Monitor
Durata della batteria
Il portatile da 15,6 pollici raggiunge tempi di esecuzione di 5:14 h e 6:32 h nei nostri test Wi-Fi (accesso a pagine web periodicamente tramite uno script) e video (cortometraggio Big Buck Bunny in loop, codec H.264, FHD). Per entrambi i test, abbiamo disabilitato tutti i meccanismi di risparmio energetico del notebook e impostato la luminosità del display a circa 150 cd/m². Per il test video, abbiamo anche disabilitato i moduli wireless
Pro
Contro
| SCHENKER XMG Pro 15 (Late 2021) i7-11800H, GeForce RTX 3080 Laptop GPU, 73 Wh | Lenovo Legion S7 15ACH6 82K80030GE R9 5900HX, GeForce RTX 3060 Laptop GPU, 71 Wh | Alienware x15 RTX 3070 P111F i7-11800H, GeForce RTX 3070 Laptop GPU, 87 Wh | Razer Blade 15 Advanced (Mid 2021) i7-11800H, GeForce RTX 3080 Laptop GPU, 80 Wh | SCHENKER XMG Pro 15 (Early 2021, RTX 3080) i7-10870H, GeForce RTX 3080 Laptop GPU, 73 Wh | MSI Delta 15 A5EFK R9 5900HX, Radeon RX 6700M, 82 Wh | Media della classe Gaming | |
|---|---|---|---|---|---|---|---|
| Autonomia della batteria | 17% | -8% | 12% | 7% | 26% | 3% | |
| Reader / Idle | 636 | 841 32% | 582 -8% | 506 -20% | 664 4% | 542 ? -15% | |
| H.264 | 392 | 449 15% | 332 -15% | 397 ? 1% | |||
| WiFi v1.3 | 314 | 421 34% | 366 17% | 353 12% | 433 38% | 474 51% | 368 ? 17% |
| Load | 78 | 69 -12% | 53 -32% | 97 24% | 96 23% | 84.1 ? 8% |
Verdetto - Lo Schenker XMG Pro 15 è un notebook da gioco ben costruito e compatto
Le prestazioni di gioco di questo portatile sottile corrispondono alla media di un dispositivo RTX 3080. Qui, il TGP relativamente basso di 105 watt diventa evidente. Mentre in FHD, la maggior parte dei giochi può essere giocata con le impostazioni di qualità massima, l'esecuzione alla risoluzione nativa del display (4K) tende a richiedere un abbassamento delle impostazioni di qualità
PCIe 4, Thunderbolt 4, OLED - Lo Schenker XMG Pro 15 (fine 2021) è dotato delle ultime tecnologie
Il Core i7-11800H CPU e GeForce RTX 3080 mobile GPU si comportano costantemente bene. Sotto carico, il portatile si riscalda considerevolmente e genera molto rumore. Il profilo di alimentazione silenzioso riduce il livello di rumore al costo di alcune prestazioni.
C'è spazio per due SSD M.2-2280 (1x PCIe 4.0, 1x PCIe 3.0/SATA) e supporto RAID 0/1. Il nostro dispositivo di test è equipaggiato con un velocissimo SSD PCIe-4 (1 TB). Mentre il suo tempo di esecuzione Wi-Fi nel mondo reale di circa 5-7 ore non è niente di cui scrivere a casa, sarebbe irragionevole aspettarsi molto di più da un portatile da gioco con uno schermo 4K. Purtroppo, la batteria non può essere ricaricata tramite la porta Thunderbolt 4 integrata.
Lo schermo OLED (3840 x 2160 pixel) è la caratteristica distintiva del Pro 15. Offre un'alta luminosità massima, un eccellente contrasto, grandi angoli di visione, brevi tempi di risposta, una buona accuratezza dei colori e un'ampia gamma di colori. Sfortunatamente, lo schermo è riflettente. Inoltre, abbiamo osservato uno sfarfallio PWM.
Un'alternativa all'XMG Pro è il Razer Blade 15 Advanced. È ancora più compatto e offre due porte Thunderbolt 4. Anche se la sua capacità della batteria è maggiore e viene fornito "solo" con un pannello FHD, la sua durata della batteria non supera significativamente quella del nostro portatile Schenker. Nel frattempo, il Lenovo Legion S7 15ACH6 (2000 euro o ~$2250). Mentre le sue prestazioni 3D sono significativamente più lente, brilla con uno schermo IPS 4K più luminoso e opaco, una migliore durata della batteria e una garanzia di tre anni. La più grande debolezza è il suo singolo modulo RAM saldato
Prezzo e disponibilità
Lo Schenker XMG Pro 15 (fine 2021) può essere configurato attraverso il negozio online Schenker. La nostra configurazione può essere acquistata per circa 3000 euro (~$3400). Il modello base parte da circa 2200 euro (~$2500)
SCHENKER XMG Pro 15 (Late 2021)
-
01/19/2022 v7
Sascha Mölck
Pricecompare

