

Verdetto - Look professionale per l'ufficio o la casa
Uno degli aspetti più attraenti di Beelink SEi13 Pro è il suo design ispirato al sito Apple, in quanto il sistema si integra meglio negli uffici o negli ambienti domestici rispetto ai vecchi design in plastica del SER7 SER7 o SEi12 della generazione SER7 o SEi12. La costruzione e i materiali di qualità superiore non hanno comportato un prezzo significativamente più alto, il che significa che SEi13 Pro rimane relativamente accessibile nella fascia tra i 500 e i 600 dollari.
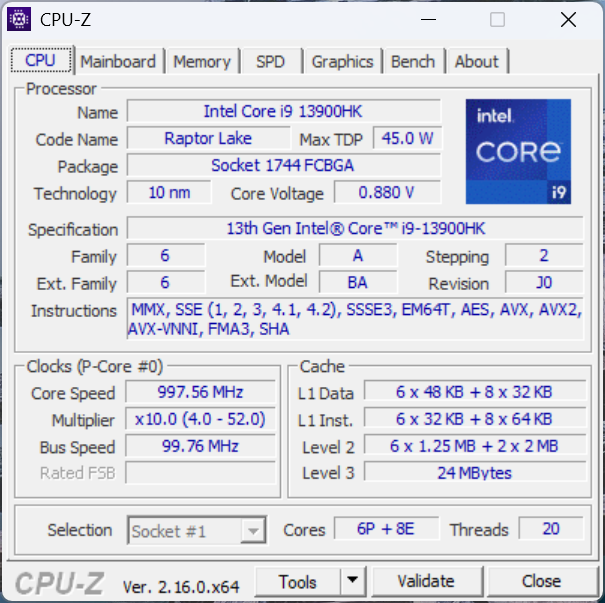
Anche le prestazioni della CPU e le porte rimangono forti, con il Core i9-13900HK e tre tipi di porte di uscita video più che sufficienti per la maggior parte delle configurazioni da ufficio o multimediali. Apprezziamo anche la sua silenziosità e le dimensioni più compatte rispetto al più grande e costoso GTi13 Ultra che è dotato dello stesso identico processore Intel per quasi lo stesso livello di prestazioni.
Mentre la maggior parte degli utenti troverà l'SEi13 Pro sufficiente, gli utenti più esigenti potrebbero lamentarsi della mancanza di accelerazione AI della CPU e delle prestazioni grafiche complessivamente deboli, anche per una GPU integrata. Gli altoparlanti stereo integrati, pur essendo buoni sulla carta, non sono abbastanza forti da riempire le sale conferenze o i salotti. La mancanza di funzioni come VESA, il supporto Thunderbolt e persino un lettore di schede SD possono limitare le opzioni di connettività e influire negativamente sull'esperienza dell'utente. L'aggiornamento al GTi13 Ultra risolve alcuni di questi problemi, mentre le alternative di AMD come il SER8 possono fornire una maggiore potenza grafica a circa lo stesso prezzo.
Pro
Contro
Prezzo e disponibilità
Amazon sta spedendo Beelink SEi13 Pro al prezzo di 540 dollari USA. Gli utenti possono anche acquistare direttamente dal produttore allo stesso prezzo.
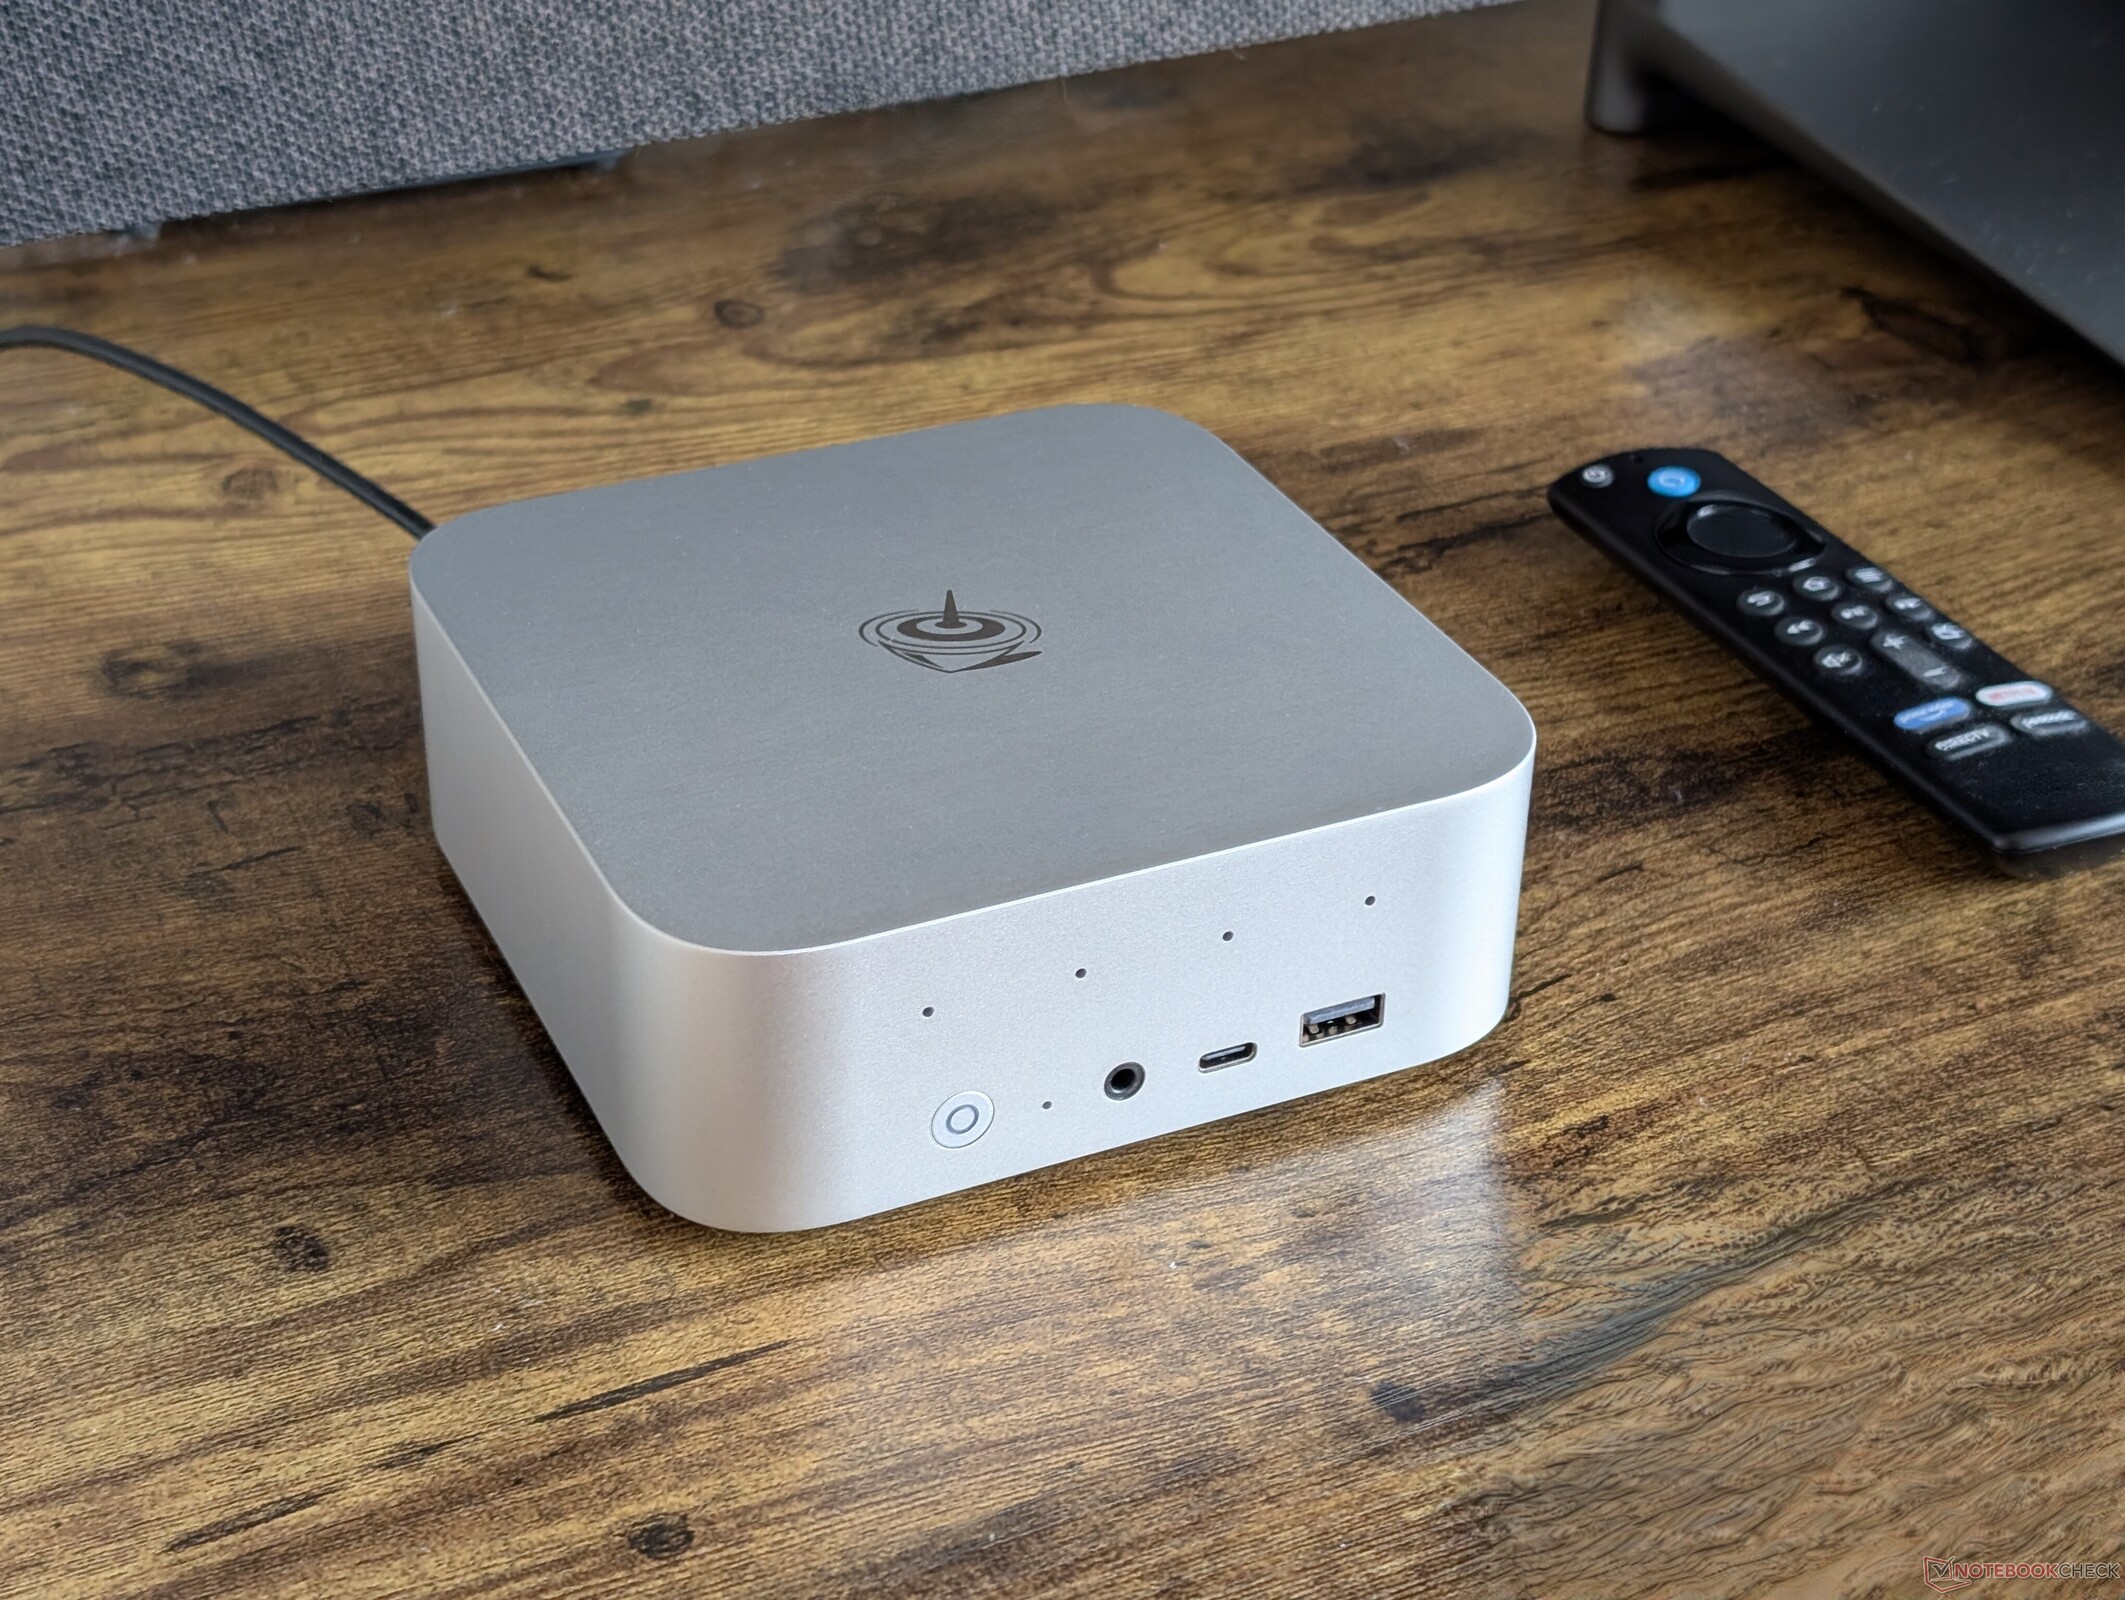
L'SEi13 Pro è un mini PC multimediale ispirato al Apple Mac Mini per la casa o l'ufficio. Si distingue per gli altoparlanti stereo integrati e il raffreddamento a camera di vapore, che non sono comuni in altri mini PC della stessa fascia di prezzo.
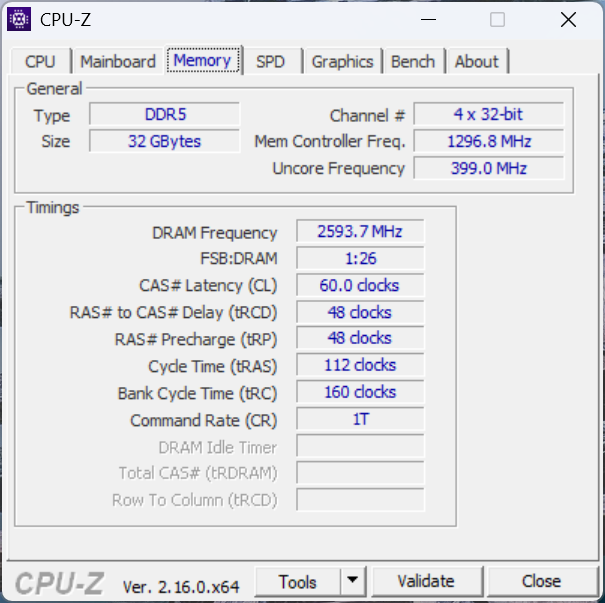
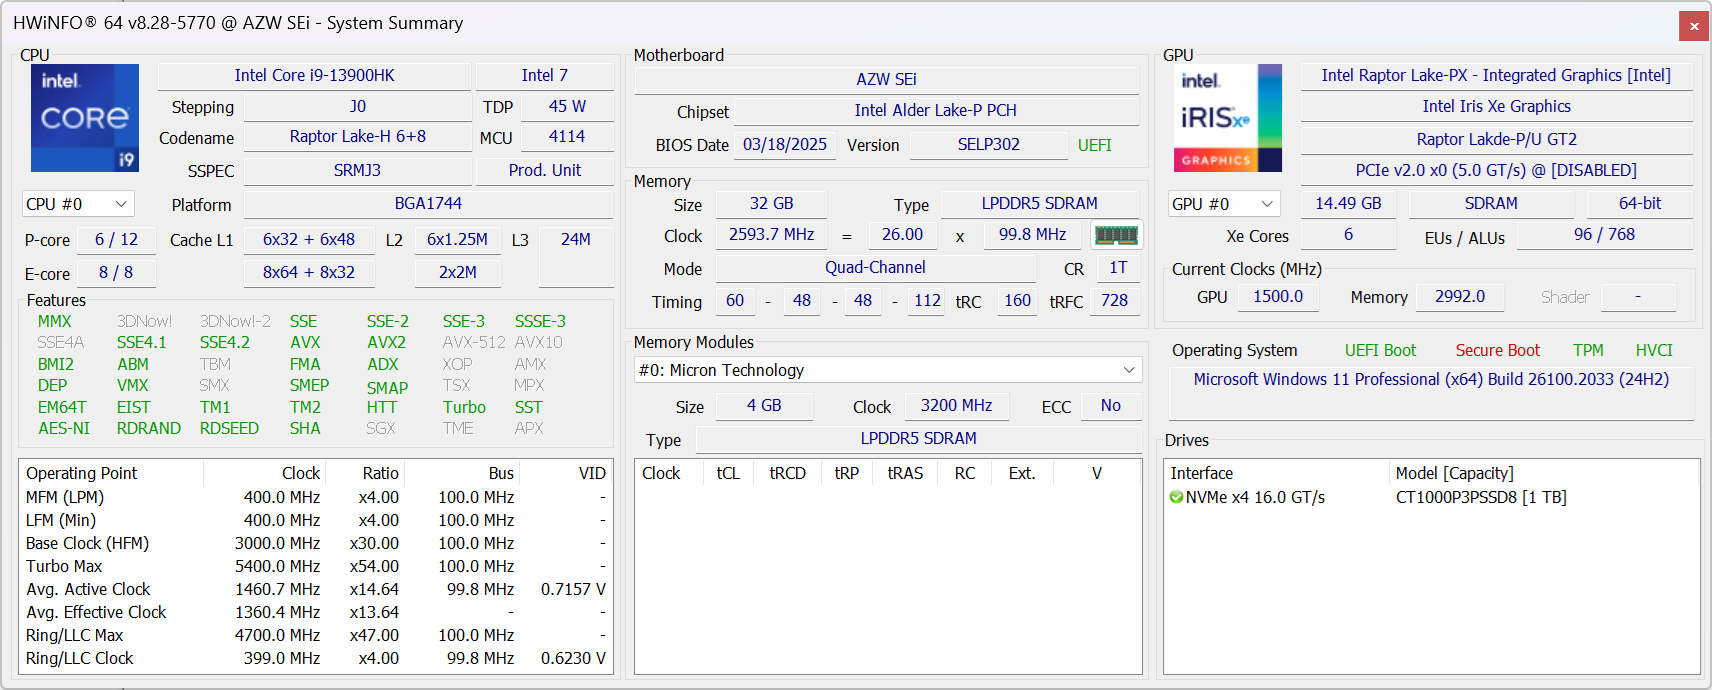
La nostra unità di prova viene fornita con la CPU Raptor Lake Core i9-13900HK, 32 GB di RAM e 1 TB di SSD per 540 dollari. Sono disponibili le opzioni di colore Grigio e Argento.
Altre recensioni di Beelink:
Specifiche
Caso
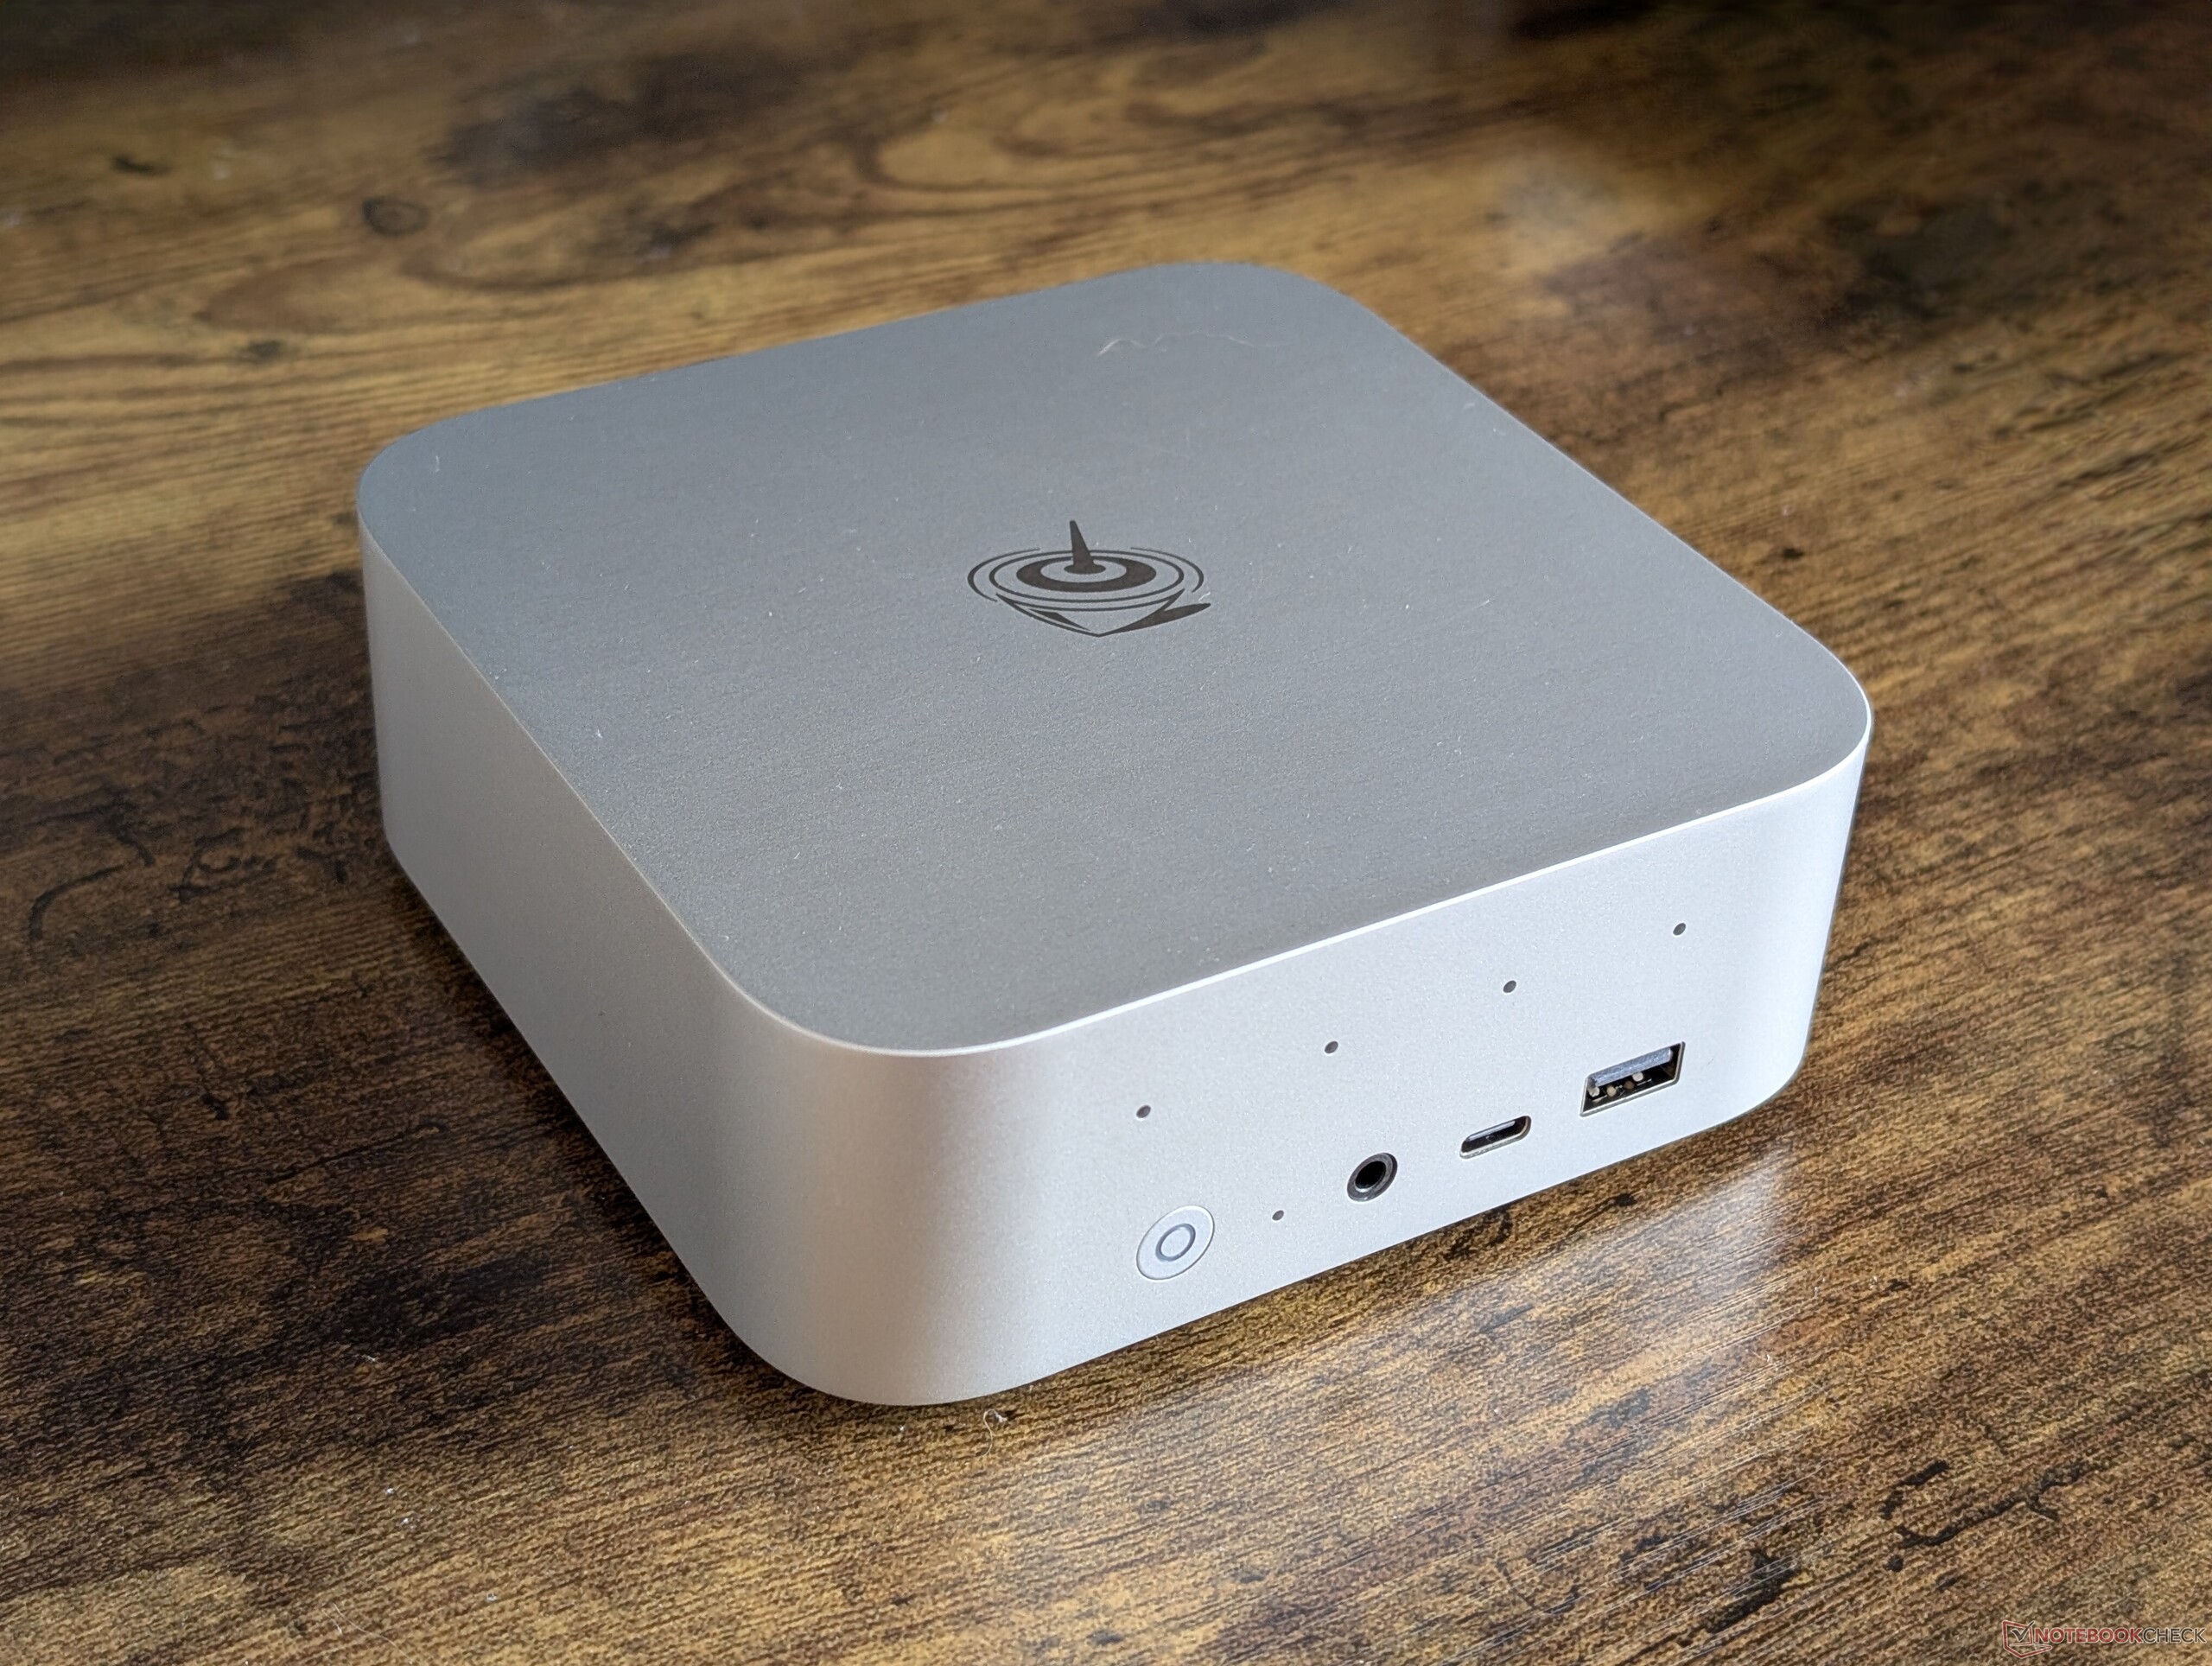
SEi13 Pro è essenzialmente una versione più piccola e leggera di GTi13 Ultra. Il materiale dell'involucro metallico rimane lo stesso, per un'impressione simile a quella del Mac Mini.
Connettività
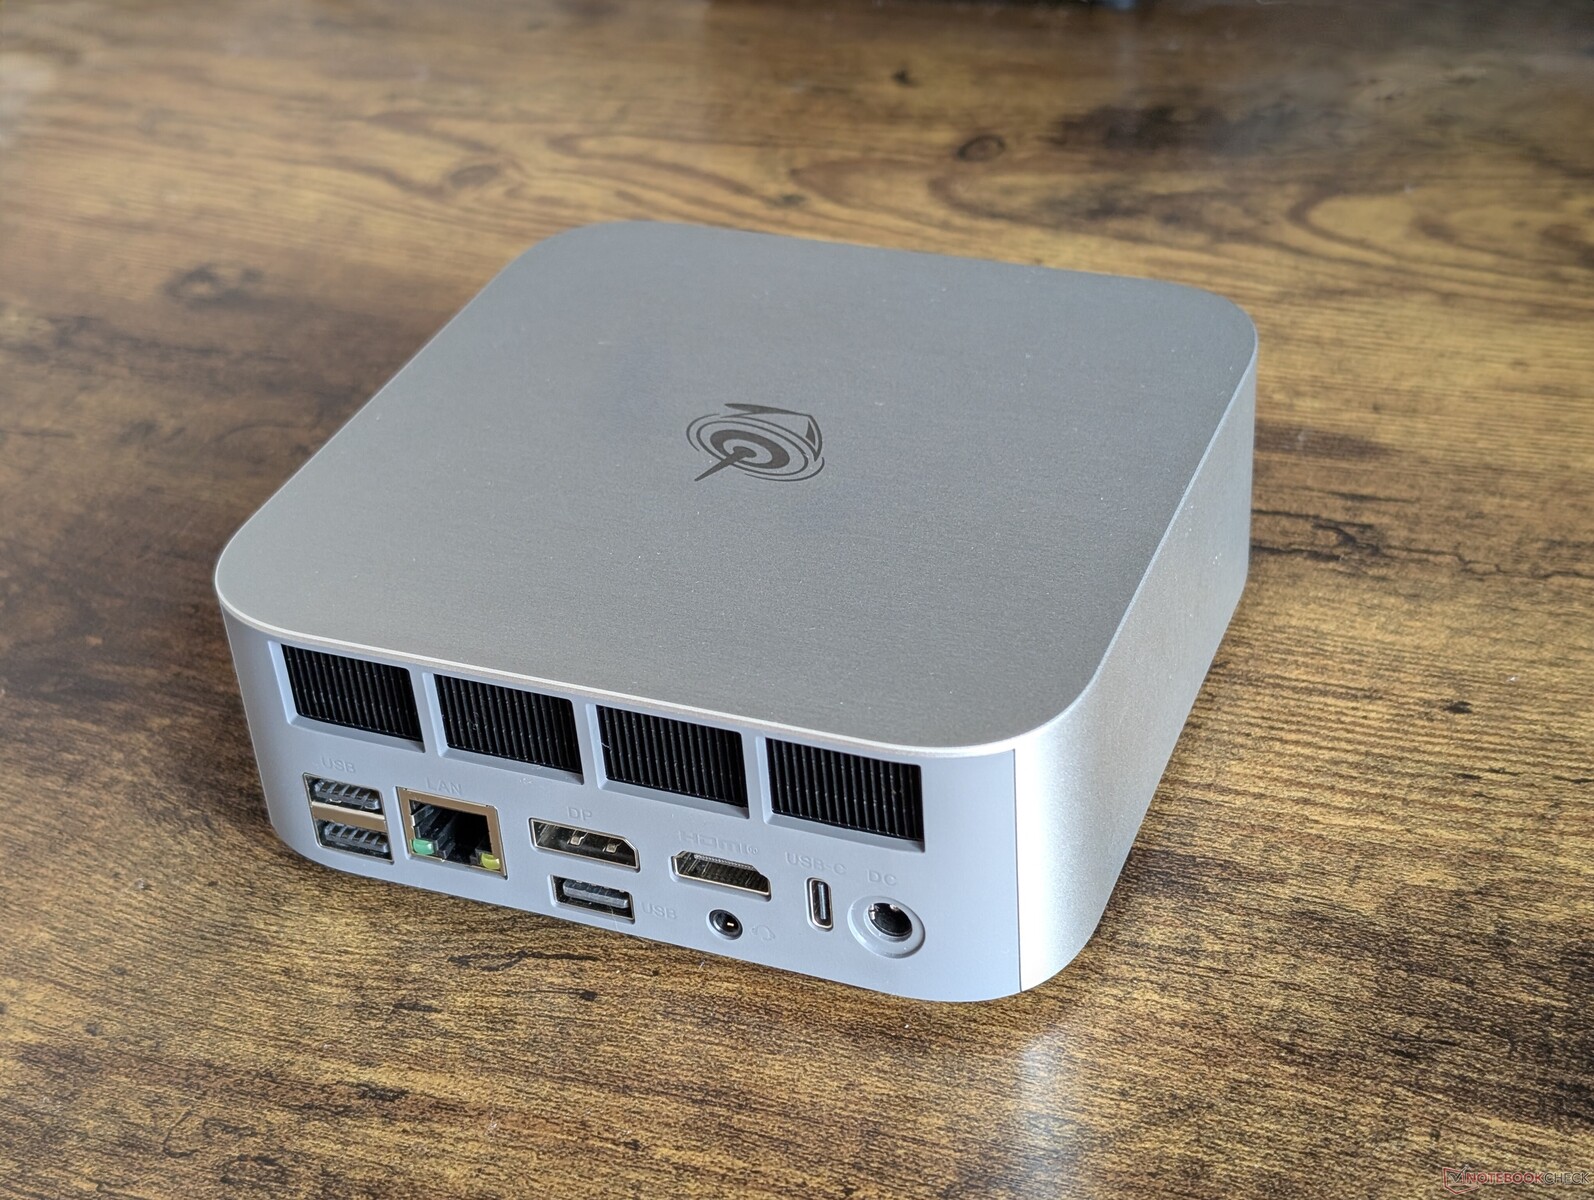
Le porte integrate sono quasi tutte presenti sul modello SEi13 Ultra, ad eccezione della diversa porta dell'adattatore CA e del minor numero di porte USB-A e RJ-45 lungo la parte posteriore. Anche il lettore di schede SD è stato eliminato.
Si noti che il sistema può essere alimentato tramite adattatori CA USB-C generici, nel caso in cui si dovesse perdere l'adattatore CA a botte da 100 W fornito con l'unità.
Comunicazione
| Networking | |
| iperf3 transmit AXE11000 | |
| Beelink SEi12 Core i5-1235U | |
| HP Z2 Mini G1a | |
| Beelink GTI13 Ultra | |
| BOSGAME M4 Neo | |
| Beelink SEi13 Pro | |
| iperf3 receive AXE11000 | |
| Beelink SEi12 Core i5-1235U | |
| BOSGAME M4 Neo | |
| HP Z2 Mini G1a | |
| Beelink GTI13 Ultra | |
| Beelink SEi13 Pro | |
| iperf3 transmit AXE11000 6GHz | |
| HP Z2 Mini G1a | |
| BOSGAME M4 Neo | |
| iperf3 receive AXE11000 6GHz | |
| HP Z2 Mini G1a | |
| BOSGAME M4 Neo | |
Manutenzione
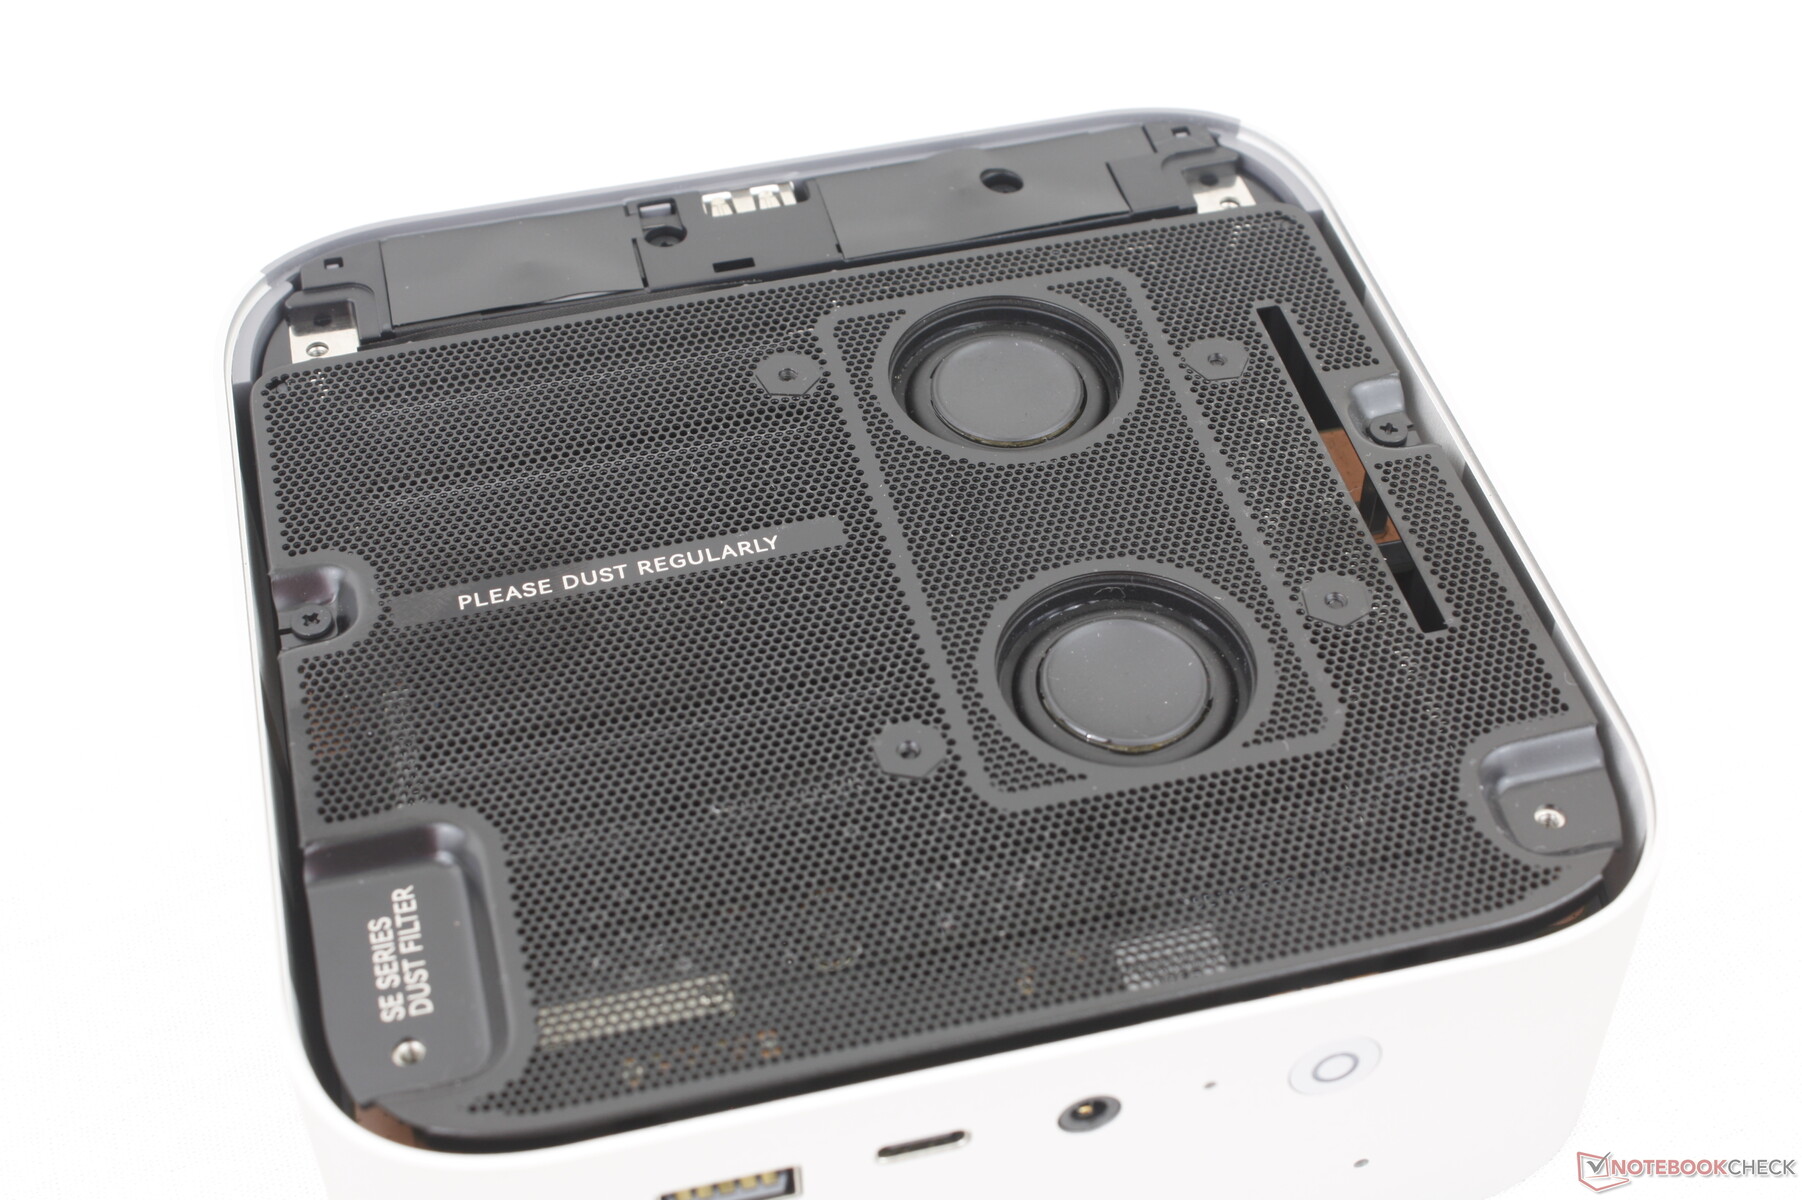
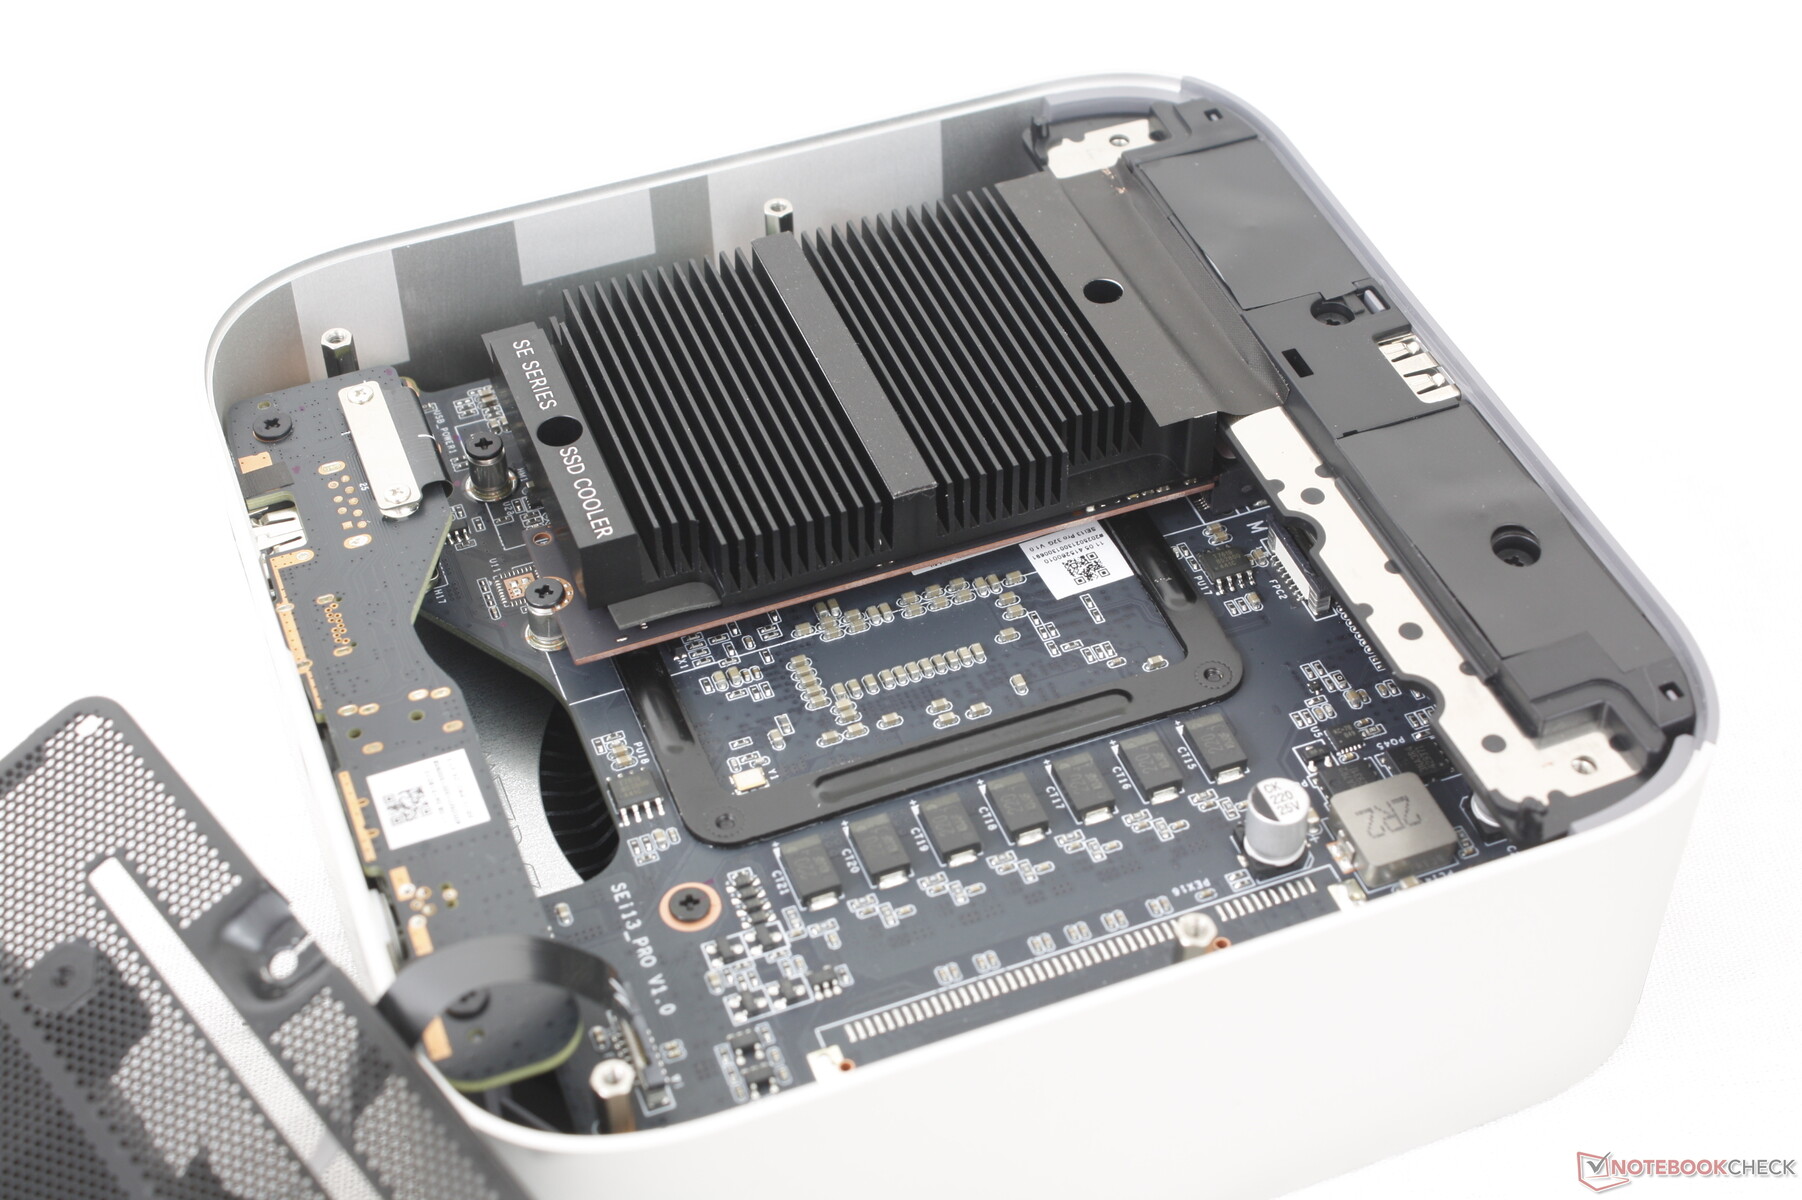
Gli aggiornamenti sono più semplici rispetto a GTi13 Ultra, poiché il design di SEi13 non ha una PSU integrata sulla scheda madre. Tuttavia, gli aggiornamenti sono limitati a due soli SSD M.2, in quanto la RAM è saldata, a differenza di quanto accade sul già citato GTi13 Ultra.
Sostenibilità
Il produttore non fa alcun riferimento ai materiali riciclati utilizzati durante la produzione. L'imballaggio stesso è tutto di cartone e carta con involucro di plastica.
Accessori e garanzia
La confezione di vendita include un cavo HDMI e un adattatore CA con manuale. Se acquistato negli Stati Uniti, si applica la consueta garanzia limitata di un anno del produttore.
Prestazioni
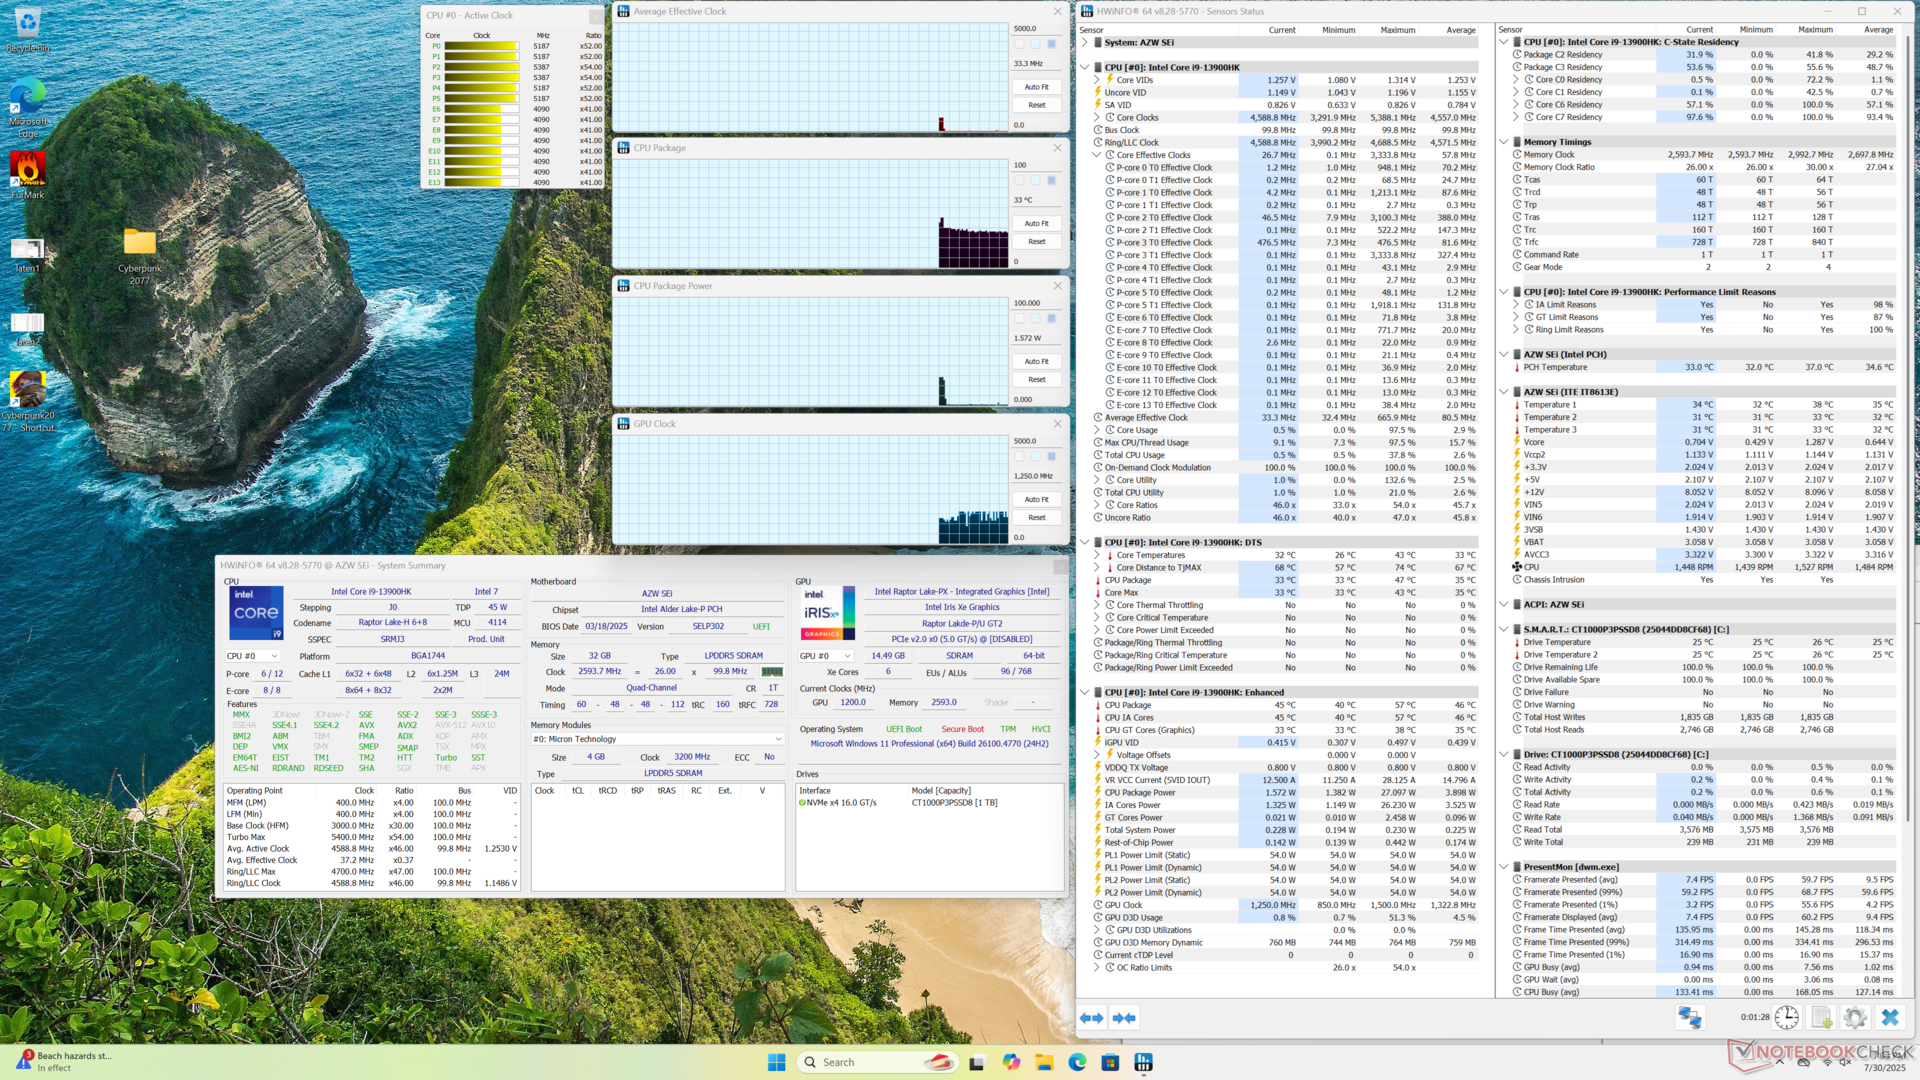
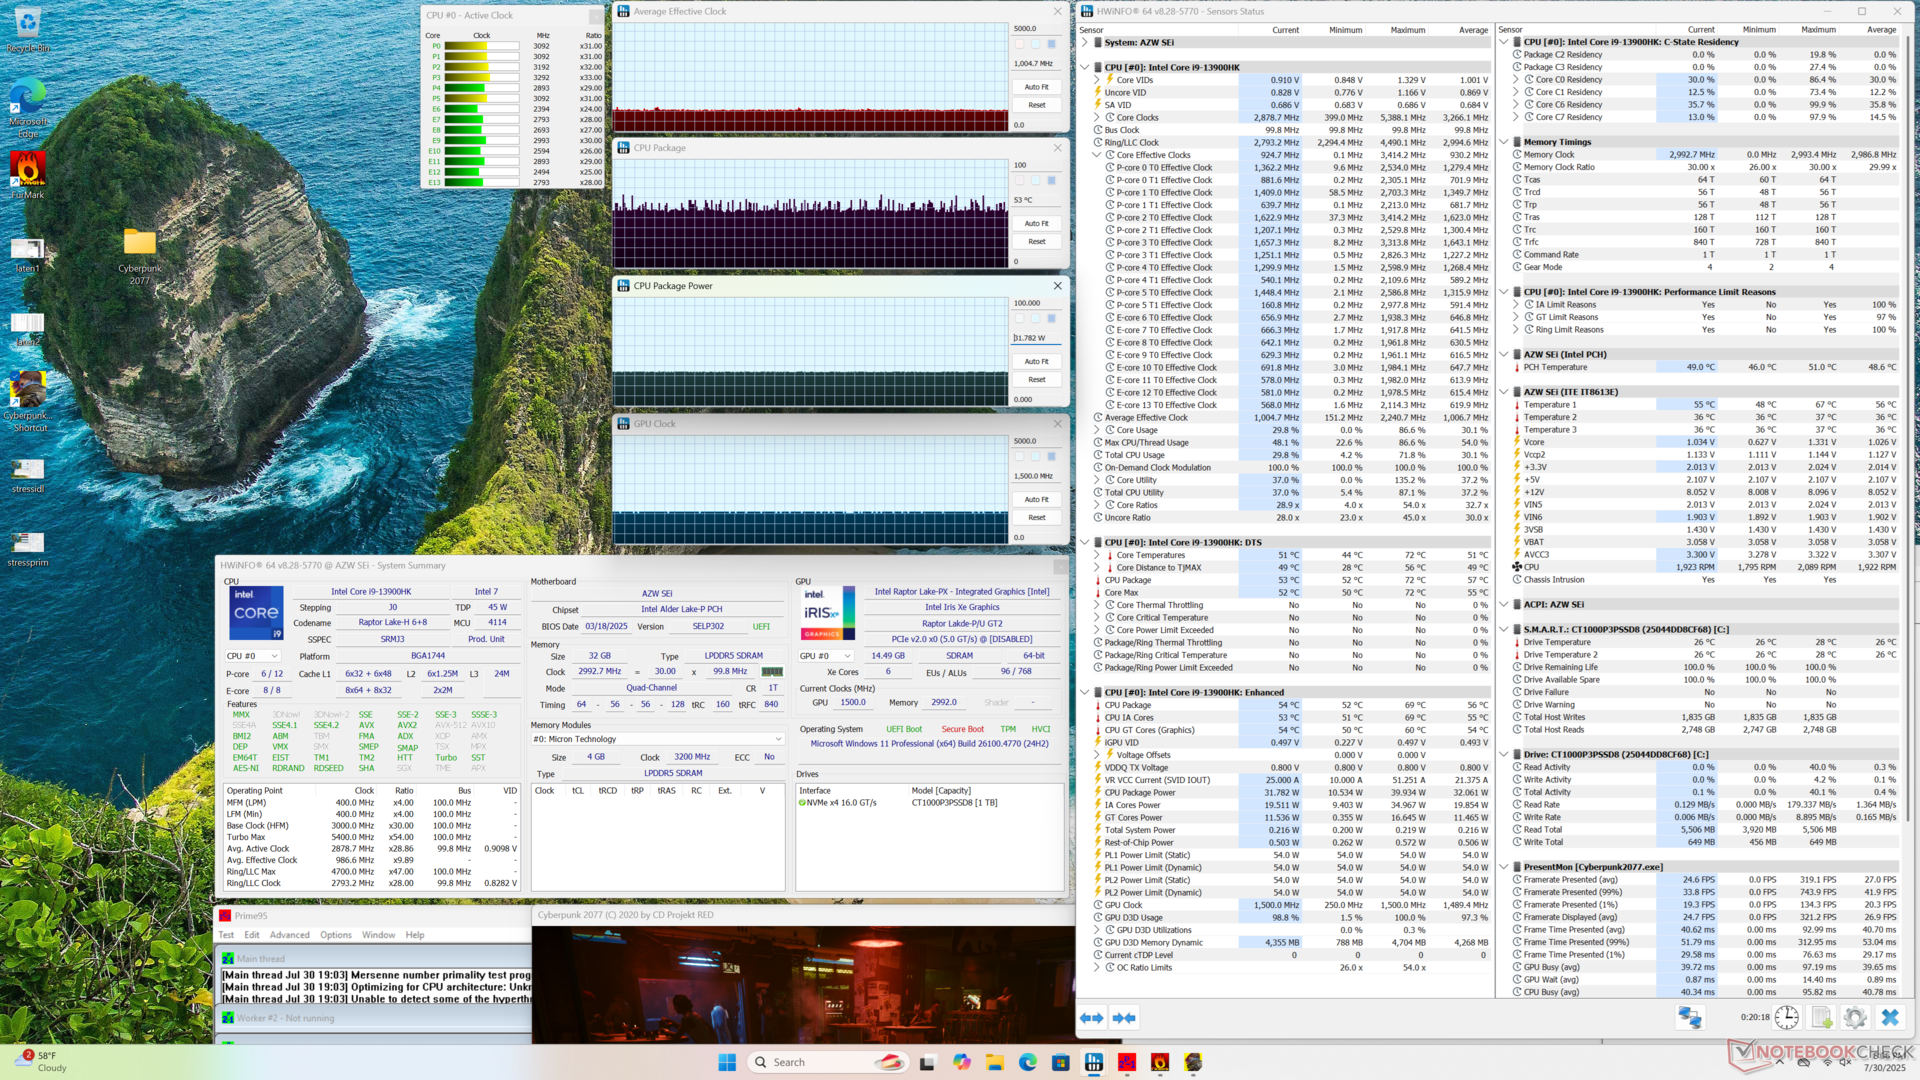
Condizioni del test
Abbiamo impostato Windows in modalità Prestazioni prima di eseguire i benchmark qui sotto.
Processore
Pur essendo ancora abbastanza veloce per il prezzo, il Core i9-13900HK manca di una NPU integrata per l'accelerazione AI.
Cinebench R15 Multi Loop
Cinebench R23: Multi Core | Single Core
Cinebench R20: CPU (Multi Core) | CPU (Single Core)
Cinebench R15: CPU Multi 64Bit | CPU Single 64Bit
Blender: v2.79 BMW27 CPU
7-Zip 18.03: 7z b 4 | 7z b 4 -mmt1
Geekbench 6.4: Multi-Core | Single-Core
Geekbench 5.5: Multi-Core | Single-Core
HWBOT x265 Benchmark v2.2: 4k Preset
LibreOffice : 20 Documents To PDF
R Benchmark 2.5: Overall mean
| CPU Performance Rating | |
| Minisforum MS-A2 | |
| HP Z2 Mini G1a | |
| Acemagic F3A | |
| Geekom Mini IT15, Ultra 9 285H | |
| Khadas Mind 2s | |
| Beelink GTI13 Ultra | |
| BOSGAME M4 Neo | |
| Media Intel Core i9-13900HK | |
| Geekom Mini IT13 | |
| Beelink SEi13 Pro | |
| Minix Elite EU512-AI -2! | |
| BMAX B9 Power | |
| Beelink SEi12 Core i5-1235U -2! | |
| NiPoGi AM06 Pro | |
| Cinebench R20 / CPU (Multi Core) | |
| HP Z2 Mini G1a | |
| Minisforum MS-A2 | |
| Acemagic F3A | |
| Geekom Mini IT15, Ultra 9 285H | |
| Khadas Mind 2s | |
| BOSGAME M4 Neo | |
| Beelink GTI13 Ultra | |
| Media Intel Core i9-13900HK (4968 - 7542, n=4) | |
| Beelink SEi13 Pro | |
| Minix Elite EU512-AI | |
| BMAX B9 Power | |
| Geekom Mini IT13 | |
| Beelink SEi12 Core i5-1235U | |
| NiPoGi AM06 Pro | |
| Cinebench R20 / CPU (Single Core) | |
| Minisforum MS-A2 | |
| Geekom Mini IT15, Ultra 9 285H | |
| Khadas Mind 2s | |
| Acemagic F3A | |
| Beelink GTI13 Ultra | |
| HP Z2 Mini G1a | |
| Media Intel Core i9-13900HK (549 - 798, n=4) | |
| BOSGAME M4 Neo | |
| Geekom Mini IT13 | |
| Minix Elite EU512-AI | |
| Beelink SEi12 Core i5-1235U | |
| Beelink SEi13 Pro | |
| BMAX B9 Power | |
| NiPoGi AM06 Pro | |
| Cinebench R15 / CPU Multi 64Bit | |
| HP Z2 Mini G1a | |
| Minisforum MS-A2 | |
| Acemagic F3A | |
| Geekom Mini IT15, Ultra 9 285H | |
| Khadas Mind 2s | |
| BOSGAME M4 Neo | |
| Media Intel Core i9-13900HK (2004 - 2950, n=4) | |
| Beelink GTI13 Ultra | |
| Beelink SEi13 Pro | |
| BMAX B9 Power | |
| Minix Elite EU512-AI | |
| Geekom Mini IT13 | |
| Beelink SEi12 Core i5-1235U | |
| NiPoGi AM06 Pro | |
| Cinebench R15 / CPU Single 64Bit | |
| Minisforum MS-A2 | |
| Acemagic F3A | |
| Khadas Mind 2s | |
| Geekom Mini IT15, Ultra 9 285H | |
| HP Z2 Mini G1a | |
| Beelink GTI13 Ultra | |
| BOSGAME M4 Neo | |
| Media Intel Core i9-13900HK (204 - 296, n=4) | |
| Geekom Mini IT13 | |
| Minix Elite EU512-AI | |
| Beelink SEi12 Core i5-1235U | |
| Beelink SEi13 Pro | |
| BMAX B9 Power | |
| NiPoGi AM06 Pro | |
| Geekbench 6.4 / Multi-Core | |
| Minisforum MS-A2 | |
| HP Z2 Mini G1a | |
| Geekom Mini IT15, Ultra 9 285H | |
| Khadas Mind 2s | |
| Beelink GTI13 Ultra | |
| BOSGAME M4 Neo | |
| Acemagic F3A | |
| Geekom Mini IT13 | |
| Media Intel Core i9-13900HK (7103 - 13309, n=4) | |
| BMAX B9 Power | |
| Beelink SEi13 Pro | |
| NiPoGi AM06 Pro | |
| Geekbench 6.4 / Single-Core | |
| Minisforum MS-A2 | |
| Geekom Mini IT15, Ultra 9 285H | |
| Acemagic F3A | |
| Khadas Mind 2s | |
| HP Z2 Mini G1a | |
| Beelink GTI13 Ultra | |
| BOSGAME M4 Neo | |
| Geekom Mini IT13 | |
| Media Intel Core i9-13900HK (1849 - 2883, n=4) | |
| Beelink SEi13 Pro | |
| BMAX B9 Power | |
| NiPoGi AM06 Pro | |
| HWBOT x265 Benchmark v2.2 / 4k Preset | |
| Minisforum MS-A2 | |
| HP Z2 Mini G1a | |
| Acemagic F3A | |
| Geekom Mini IT15, Ultra 9 285H | |
| BOSGAME M4 Neo | |
| Khadas Mind 2s | |
| Beelink GTI13 Ultra | |
| Media Intel Core i9-13900HK (14.2 - 21.9, n=4) | |
| Beelink SEi13 Pro | |
| BMAX B9 Power | |
| Minix Elite EU512-AI | |
| Geekom Mini IT13 | |
| Beelink SEi12 Core i5-1235U | |
| NiPoGi AM06 Pro | |
| LibreOffice / 20 Documents To PDF | |
| NiPoGi AM06 Pro | |
| Minix Elite EU512-AI | |
| Acemagic F3A | |
| BMAX B9 Power | |
| HP Z2 Mini G1a | |
| Beelink SEi13 Pro | |
| Geekom Mini IT13 | |
| Beelink SEi12 Core i5-1235U | |
| BOSGAME M4 Neo | |
| Media Intel Core i9-13900HK (37.3 - 56, n=4) | |
| Khadas Mind 2s | |
| Minisforum MS-A2 | |
| Geekom Mini IT15, Ultra 9 285H | |
| Beelink GTI13 Ultra | |
Cinebench R23: Multi Core | Single Core
Cinebench R20: CPU (Multi Core) | CPU (Single Core)
Cinebench R15: CPU Multi 64Bit | CPU Single 64Bit
Blender: v2.79 BMW27 CPU
7-Zip 18.03: 7z b 4 | 7z b 4 -mmt1
Geekbench 6.4: Multi-Core | Single-Core
Geekbench 5.5: Multi-Core | Single-Core
HWBOT x265 Benchmark v2.2: 4k Preset
LibreOffice : 20 Documents To PDF
R Benchmark 2.5: Overall mean
* ... Meglio usare valori piccoli
AIDA64: FP32 Ray-Trace | FPU Julia | CPU SHA3 | CPU Queen | FPU SinJulia | FPU Mandel | CPU AES | CPU ZLib | FP64 Ray-Trace | CPU PhotoWorxx
| Performance Rating | |
| HP Z2 Mini G1a | |
| BOSGAME M4 Neo | |
| Beelink GTI13 Ultra | |
| Media Intel Core i9-13900HK | |
| BMAX B9 Power | |
| Beelink SEi13 Pro | |
| Beelink SEi12 Core i5-1235U | |
| AIDA64 / FP32 Ray-Trace | |
| HP Z2 Mini G1a | |
| BOSGAME M4 Neo | |
| Beelink SEi13 Pro | |
| Media Intel Core i9-13900HK (12351 - 18326, n=4) | |
| Beelink GTI13 Ultra | |
| BMAX B9 Power | |
| Beelink SEi12 Core i5-1235U | |
| AIDA64 / FPU Julia | |
| HP Z2 Mini G1a | |
| BOSGAME M4 Neo | |
| Beelink GTI13 Ultra | |
| Media Intel Core i9-13900HK (61409 - 92925, n=4) | |
| Beelink SEi13 Pro | |
| BMAX B9 Power | |
| Beelink SEi12 Core i5-1235U | |
| AIDA64 / CPU SHA3 | |
| HP Z2 Mini G1a | |
| BOSGAME M4 Neo | |
| Media Intel Core i9-13900HK (2923 - 4190, n=4) | |
| Beelink GTI13 Ultra | |
| Beelink SEi13 Pro | |
| BMAX B9 Power | |
| Beelink SEi12 Core i5-1235U | |
| AIDA64 / CPU Queen | |
| HP Z2 Mini G1a | |
| BOSGAME M4 Neo | |
| Beelink GTI13 Ultra | |
| Media Intel Core i9-13900HK (75615 - 118166, n=4) | |
| Beelink SEi13 Pro | |
| BMAX B9 Power | |
| Beelink SEi12 Core i5-1235U | |
| AIDA64 / FPU SinJulia | |
| HP Z2 Mini G1a | |
| BOSGAME M4 Neo | |
| Beelink GTI13 Ultra | |
| Media Intel Core i9-13900HK (7427 - 11249, n=4) | |
| Beelink SEi13 Pro | |
| BMAX B9 Power | |
| Beelink SEi12 Core i5-1235U | |
| AIDA64 / FPU Mandel | |
| HP Z2 Mini G1a | |
| BOSGAME M4 Neo | |
| Beelink SEi13 Pro | |
| Beelink GTI13 Ultra | |
| Media Intel Core i9-13900HK (30549 - 45616, n=4) | |
| BMAX B9 Power | |
| Beelink SEi12 Core i5-1235U | |
| AIDA64 / CPU AES | |
| HP Z2 Mini G1a | |
| BMAX B9 Power | |
| BOSGAME M4 Neo | |
| Media Intel Core i9-13900HK (68508 - 100891, n=4) | |
| Beelink GTI13 Ultra | |
| Beelink SEi13 Pro | |
| Beelink SEi12 Core i5-1235U | |
| AIDA64 / CPU ZLib | |
| HP Z2 Mini G1a | |
| Beelink GTI13 Ultra | |
| Media Intel Core i9-13900HK (797 - 1249, n=4) | |
| BOSGAME M4 Neo | |
| Beelink SEi13 Pro | |
| BMAX B9 Power | |
| Beelink SEi12 Core i5-1235U | |
| AIDA64 / FP64 Ray-Trace | |
| HP Z2 Mini G1a | |
| BOSGAME M4 Neo | |
| Media Intel Core i9-13900HK (6839 - 10018, n=4) | |
| Beelink SEi13 Pro | |
| Beelink GTI13 Ultra | |
| BMAX B9 Power | |
| Beelink SEi12 Core i5-1235U | |
| AIDA64 / CPU PhotoWorxx | |
| HP Z2 Mini G1a | |
| Beelink GTI13 Ultra | |
| BOSGAME M4 Neo | |
| Media Intel Core i9-13900HK (15421 - 49539, n=4) | |
| Beelink SEi12 Core i5-1235U | |
| BMAX B9 Power | |
| Beelink SEi13 Pro | |
Prestazioni del sistema
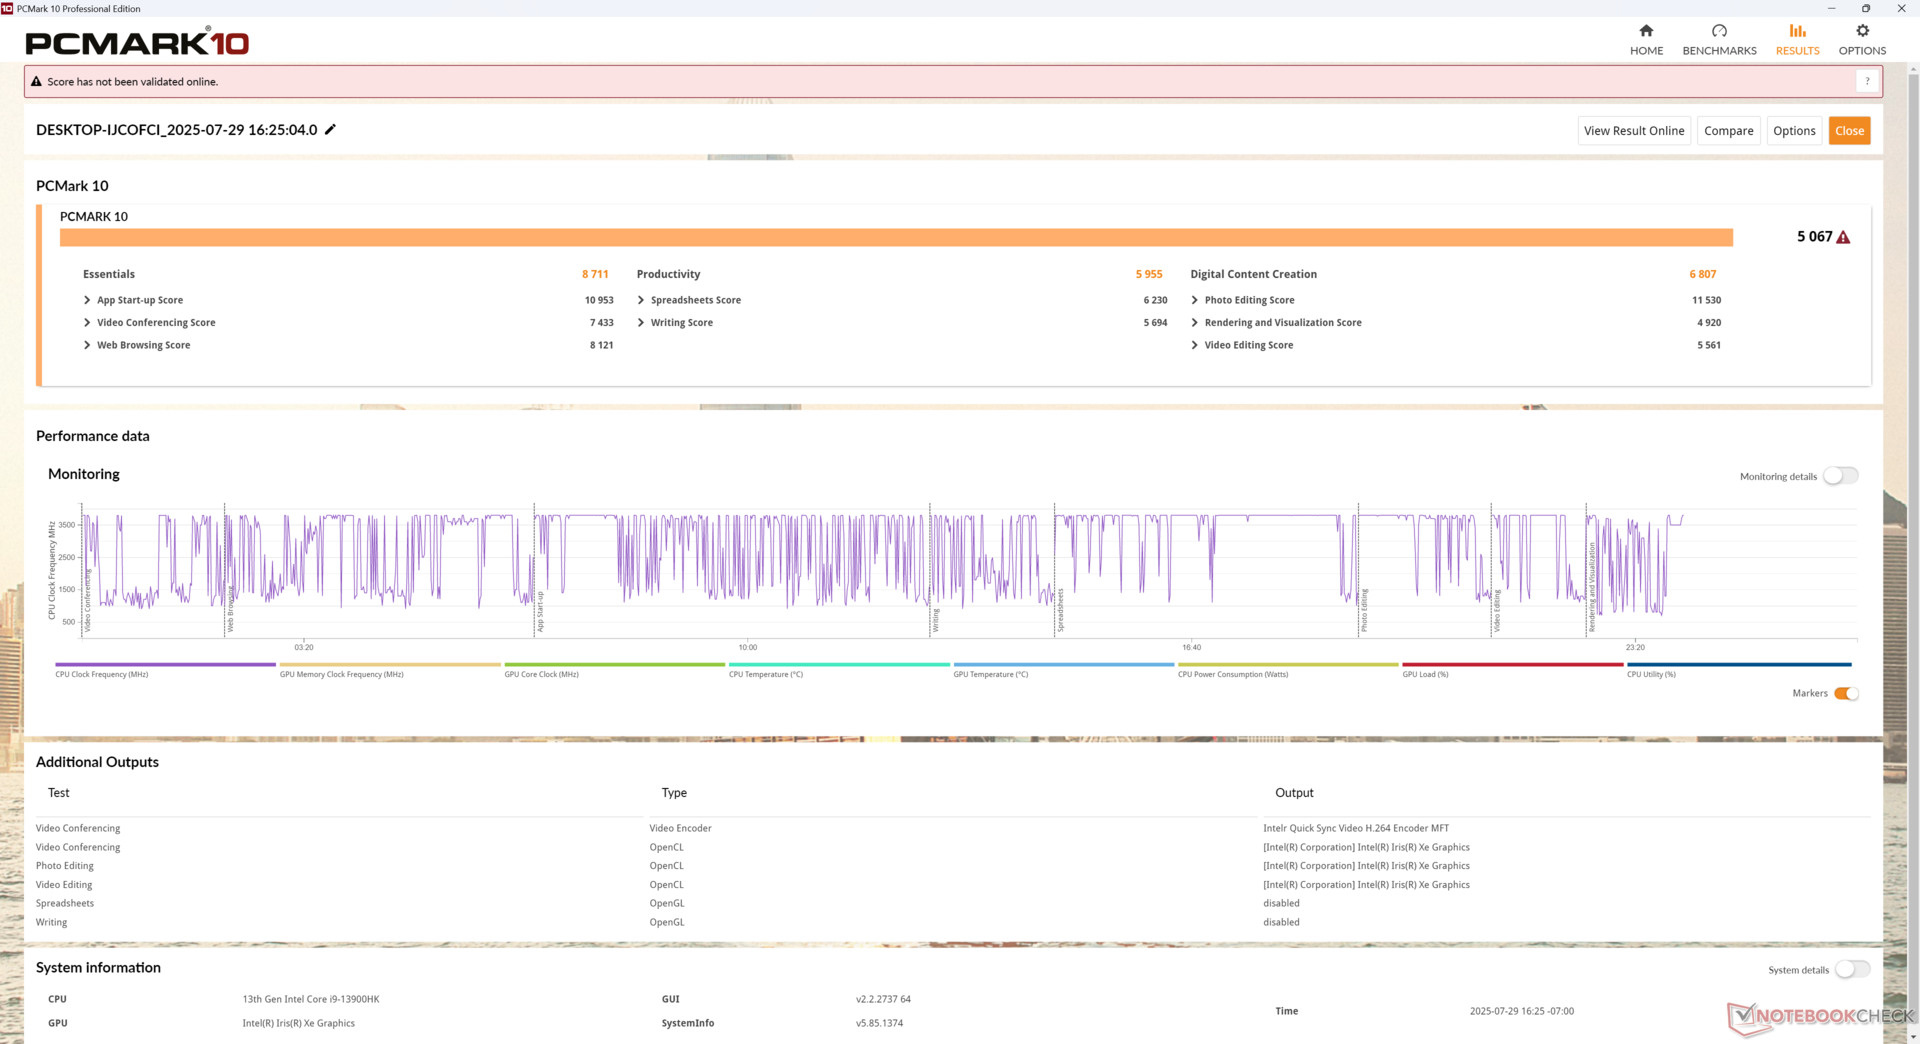
PCMark 10: Score | Essentials | Productivity | Digital Content Creation
CrossMark: Overall | Productivity | Creativity | Responsiveness
WebXPRT 3: Overall
WebXPRT 4: Overall
Mozilla Kraken 1.1: Total
| Performance Rating | |
| HP Z2 Mini G1a | |
| Beelink GTI13 Ultra | |
| BOSGAME M4 Neo | |
| Beelink SEi12 Core i5-1235U | |
| Beelink SEi13 Pro -4! | |
| BMAX B9 Power -4! | |
| PCMark 10 / Score | |
| HP Z2 Mini G1a | |
| BOSGAME M4 Neo | |
| Beelink GTI13 Ultra | |
| Beelink SEi12 Core i5-1235U | |
| PCMark 10 / Essentials | |
| Beelink GTI13 Ultra | |
| Beelink SEi12 Core i5-1235U | |
| HP Z2 Mini G1a | |
| BOSGAME M4 Neo | |
| PCMark 10 / Productivity | |
| HP Z2 Mini G1a | |
| BOSGAME M4 Neo | |
| Beelink GTI13 Ultra | |
| Beelink SEi12 Core i5-1235U | |
| PCMark 10 / Digital Content Creation | |
| HP Z2 Mini G1a | |
| BOSGAME M4 Neo | |
| Beelink GTI13 Ultra | |
| Beelink SEi12 Core i5-1235U | |
| CrossMark / Overall | |
| Beelink GTI13 Ultra | |
| HP Z2 Mini G1a | |
| BOSGAME M4 Neo | |
| Beelink SEi12 Core i5-1235U | |
| Beelink SEi13 Pro | |
| BMAX B9 Power | |
| CrossMark / Productivity | |
| Beelink GTI13 Ultra | |
| BOSGAME M4 Neo | |
| Beelink SEi12 Core i5-1235U | |
| HP Z2 Mini G1a | |
| Beelink SEi13 Pro | |
| BMAX B9 Power | |
| CrossMark / Creativity | |
| HP Z2 Mini G1a | |
| Beelink GTI13 Ultra | |
| BOSGAME M4 Neo | |
| Beelink SEi12 Core i5-1235U | |
| BMAX B9 Power | |
| Beelink SEi13 Pro | |
| CrossMark / Responsiveness | |
| Beelink GTI13 Ultra | |
| Beelink SEi12 Core i5-1235U | |
| BOSGAME M4 Neo | |
| Beelink SEi13 Pro | |
| HP Z2 Mini G1a | |
| BMAX B9 Power | |
| WebXPRT 3 / Overall | |
| Beelink GTI13 Ultra | |
| HP Z2 Mini G1a | |
| BOSGAME M4 Neo | |
| Beelink SEi12 Core i5-1235U | |
| BMAX B9 Power | |
| Beelink SEi13 Pro | |
| WebXPRT 4 / Overall | |
| Beelink GTI13 Ultra | |
| HP Z2 Mini G1a | |
| BOSGAME M4 Neo | |
| Beelink SEi12 Core i5-1235U | |
| Beelink SEi13 Pro | |
| BMAX B9 Power | |
| Mozilla Kraken 1.1 / Total | |
| BMAX B9 Power | |
| Beelink SEi13 Pro | |
| Beelink SEi12 Core i5-1235U | |
| BOSGAME M4 Neo | |
| Beelink GTI13 Ultra | |
| HP Z2 Mini G1a | |
* ... Meglio usare valori piccoli
» No benchmarks for this notebook found!
| AIDA64 / Memory Copy | |
| HP Z2 Mini G1a | |
| Beelink GTI13 Ultra | |
| BOSGAME M4 Neo | |
| Beelink SEi13 Pro | |
| Media Intel Core i9-13900HK (45935 - 74460, n=4) | |
| Beelink SEi12 Core i5-1235U | |
| BMAX B9 Power | |
| AIDA64 / Memory Read | |
| HP Z2 Mini G1a | |
| Beelink GTI13 Ultra | |
| BOSGAME M4 Neo | |
| Media Intel Core i9-13900HK (34298 - 74896, n=4) | |
| Beelink SEi12 Core i5-1235U | |
| BMAX B9 Power | |
| Beelink SEi13 Pro | |
| AIDA64 / Memory Write | |
| HP Z2 Mini G1a | |
| BOSGAME M4 Neo | |
| Beelink SEi13 Pro | |
| Beelink GTI13 Ultra | |
| Media Intel Core i9-13900HK (47347 - 85917, n=4) | |
| Beelink SEi12 Core i5-1235U | |
| BMAX B9 Power | |
| AIDA64 / Memory Latency | |
| HP Z2 Mini G1a | |
| Beelink SEi13 Pro | |
| BMAX B9 Power | |
| Media Intel Core i9-13900HK (83 - 115.3, n=4) | |
| Beelink SEi12 Core i5-1235U | |
| BOSGAME M4 Neo | |
| Beelink GTI13 Ultra | |
* ... Meglio usare valori piccoli
Latenza DPC
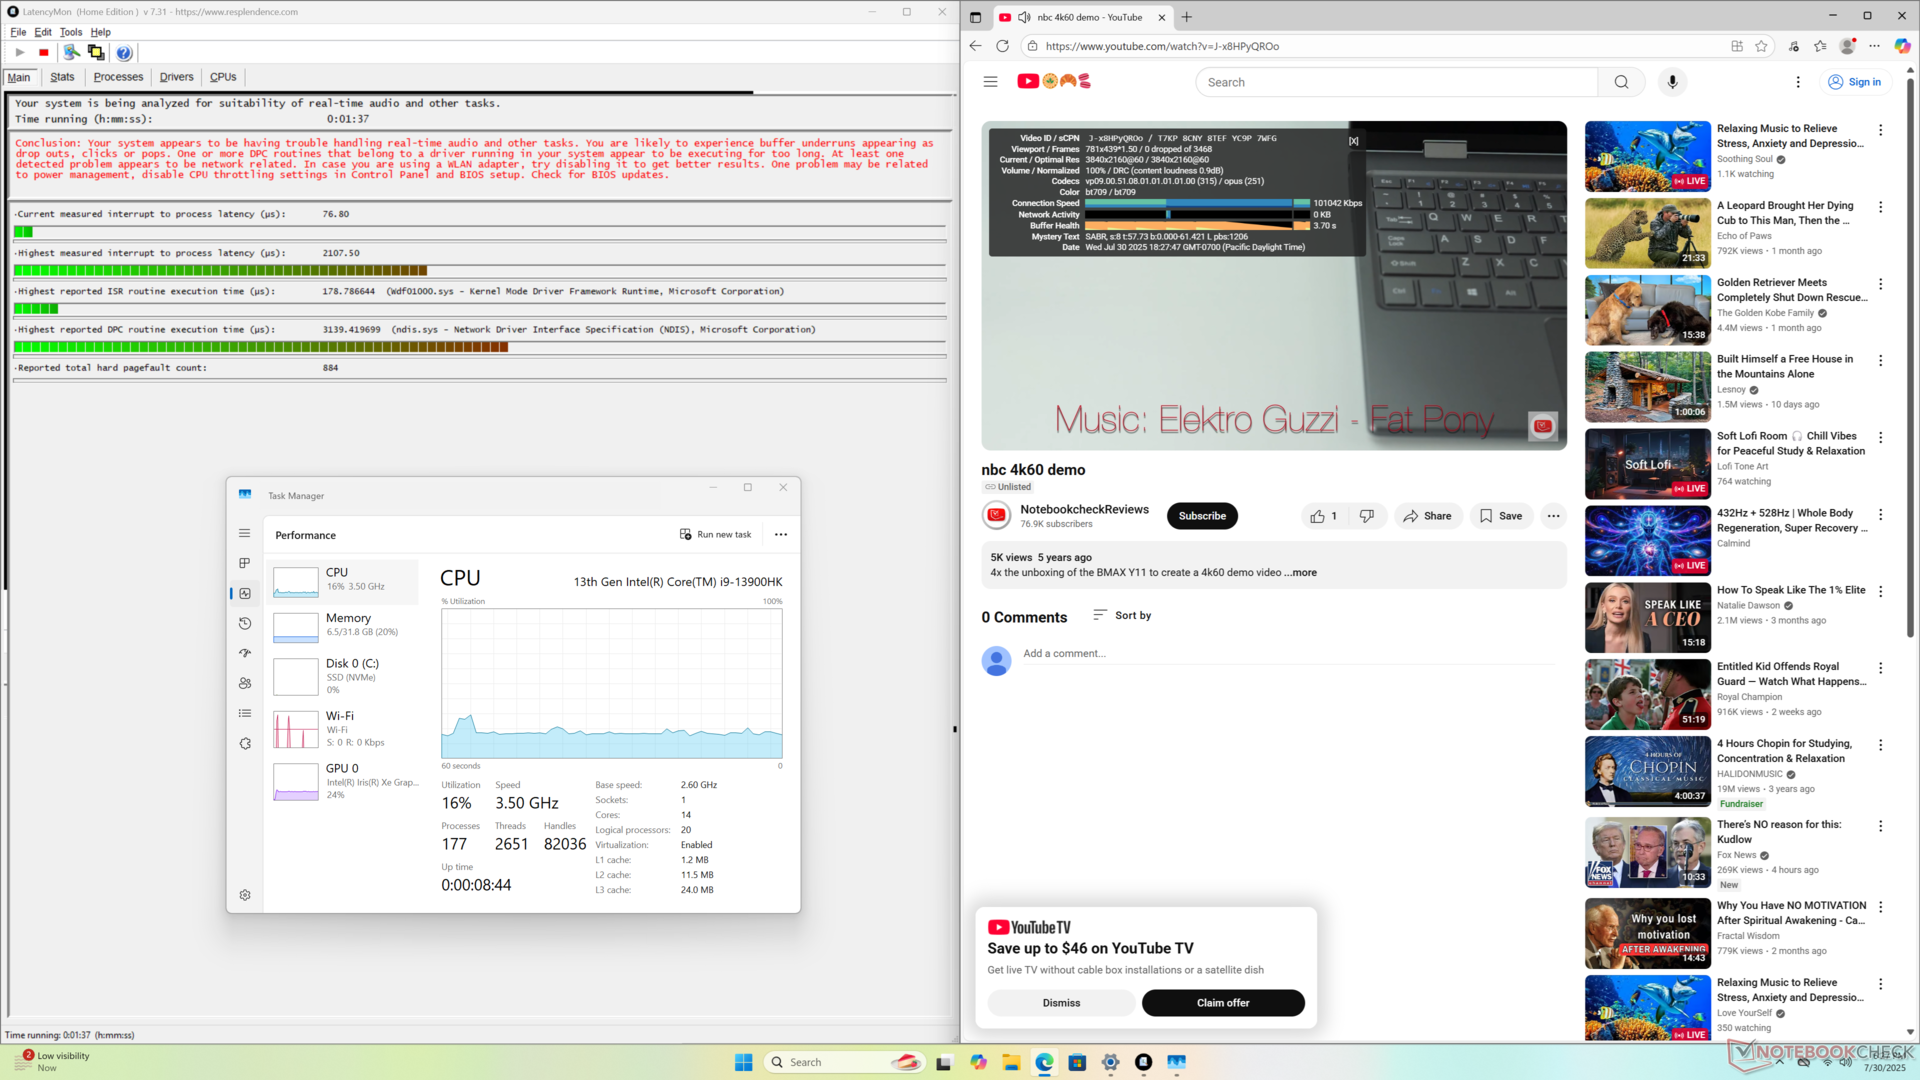
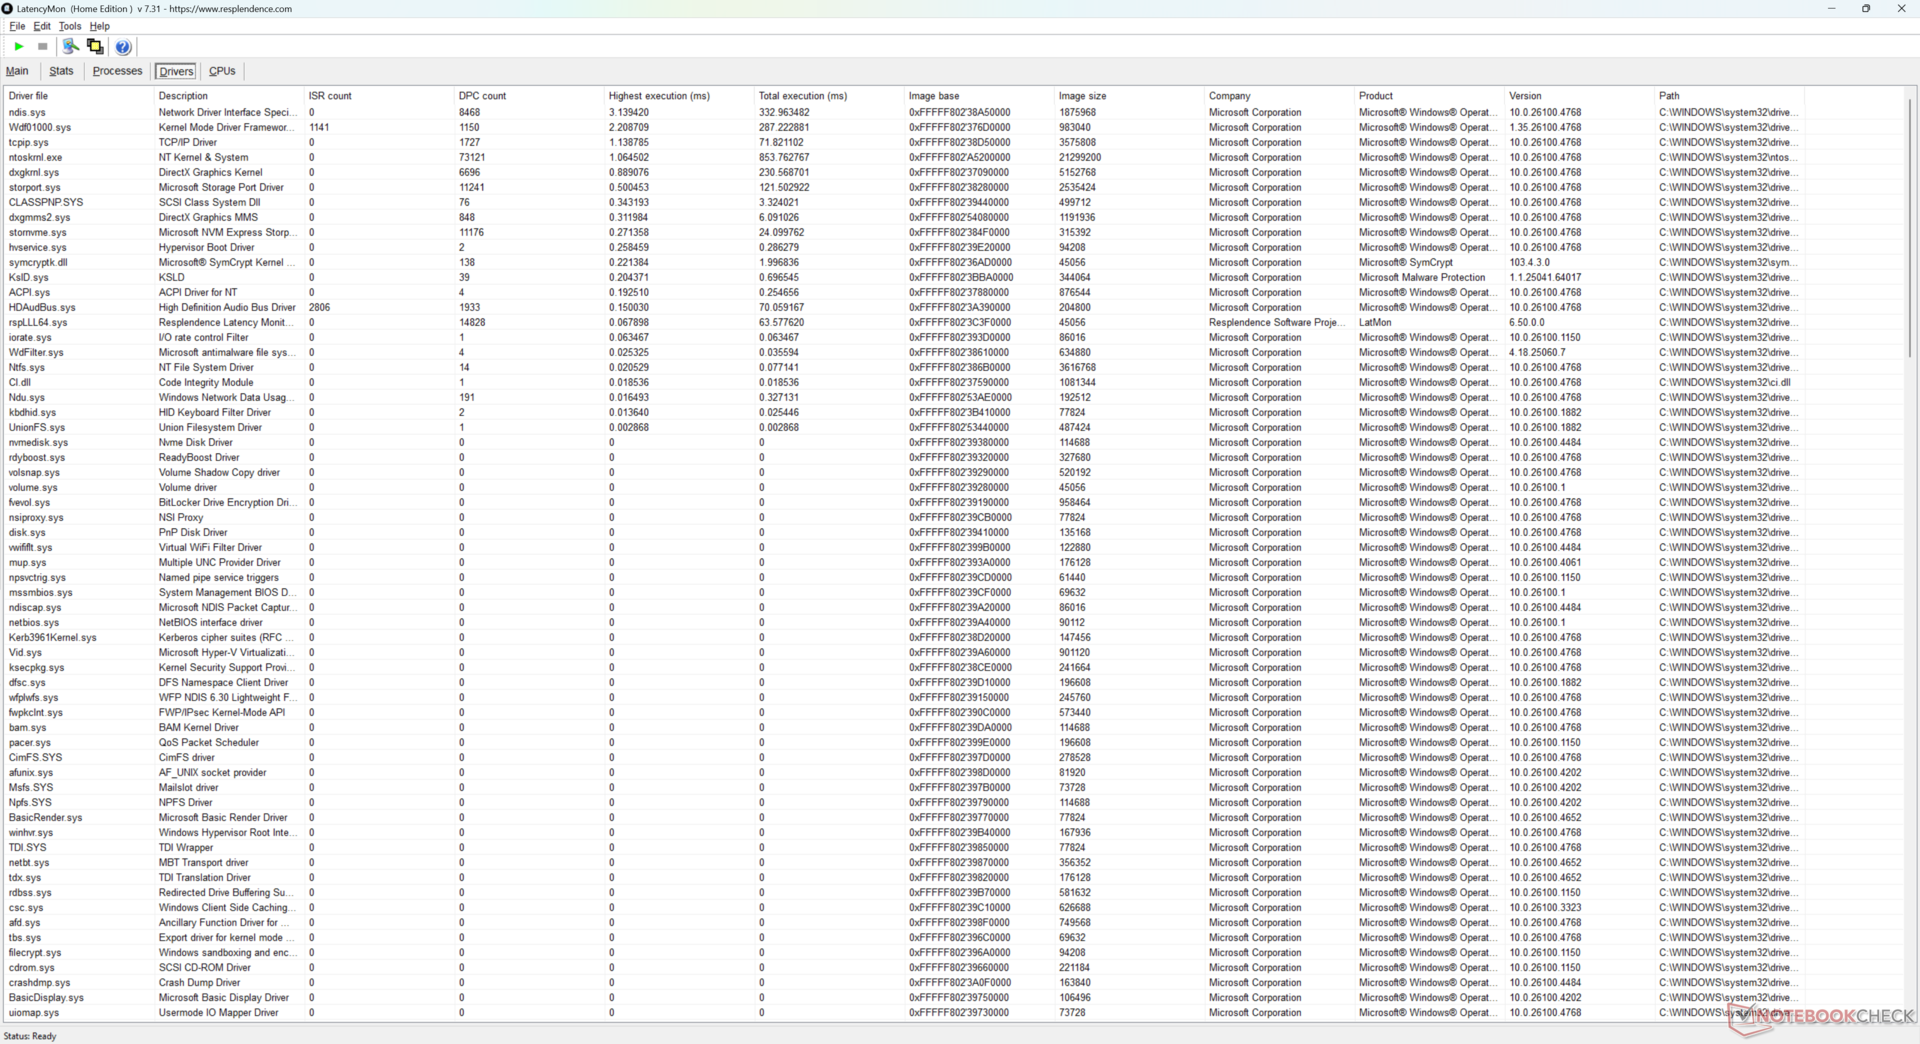
| DPC Latencies / LatencyMon - interrupt to process latency (max), Web, Youtube, Prime95 | |
| HP Z2 Mini G1a | |
| Beelink SEi13 Pro | |
| Beelink GTI13 Ultra | |
| Beelink SEi12 Core i5-1235U | |
| BOSGAME M4 Neo | |
* ... Meglio usare valori piccoli
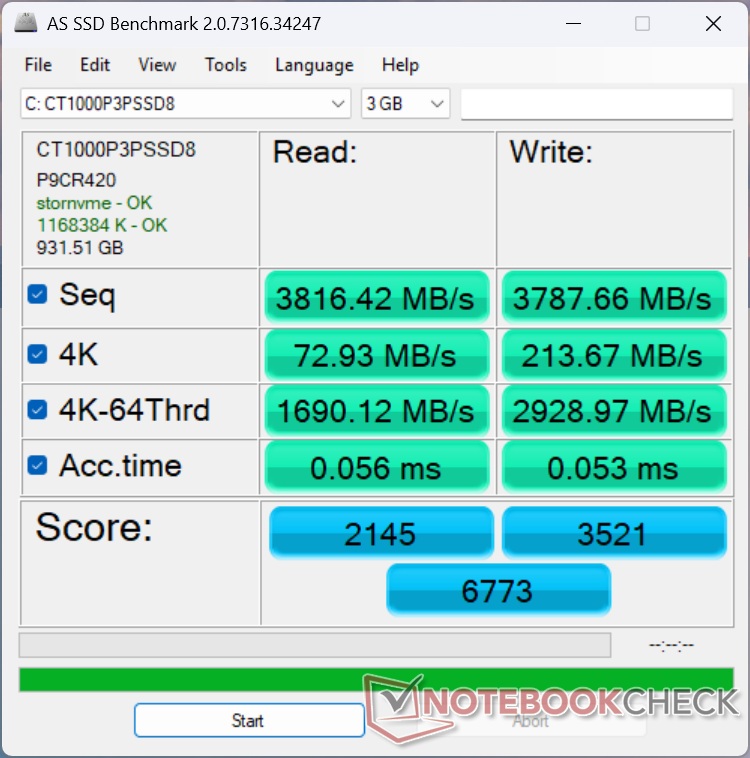
Dispositivi di archiviazione
Per il raffreddamento di entrambi gli slot SSD è incluso un grande diffusore di calore.
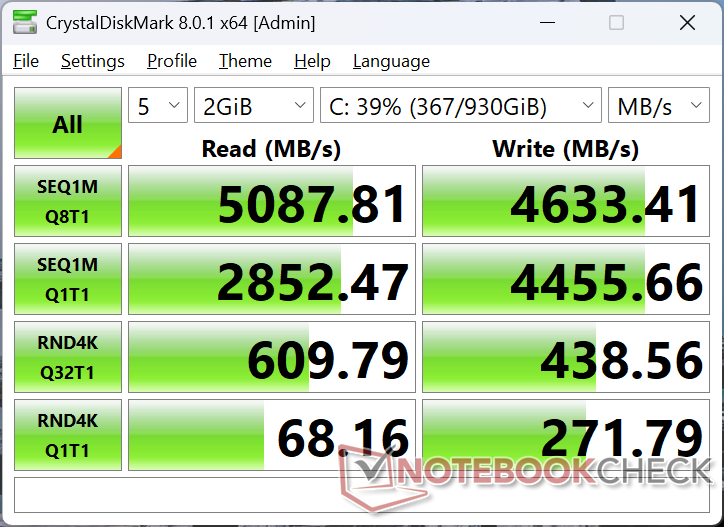

| Drive Performance Rating - Percent | |
| Beelink GTI13 Ultra | |
| Beelink SEi13 Pro | |
| HP Z2 Mini G1a | |
| BOSGAME M4 Neo | |
| Beelink SEi12 Core i5-1235U | |
| BMAX B9 Power | |
* ... Meglio usare valori piccoli
Disk Throttling: DiskSpd Read Loop, Queue Depth 8
Prestazioni della GPU
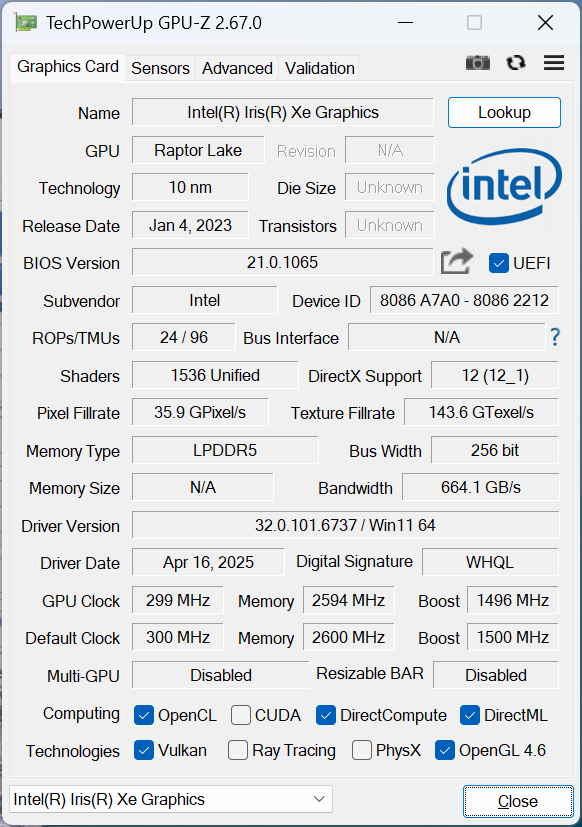
La Iris Xe Graphics G7 96 EUs si trova qualche generazione indietro rispetto all'attuale serie Arc ed è una delle GPU integrate più lente disponibili. Anche se non è adatta ai giochi, è comunque abbastanza potente per lo streaming fluido in 4K.
Vale la pena ricordare che sia X-Plane 11.11 che il benchmark Cyberpunk 2077 si bloccavano sempre, anche dopo molteplici tentativi e reset.
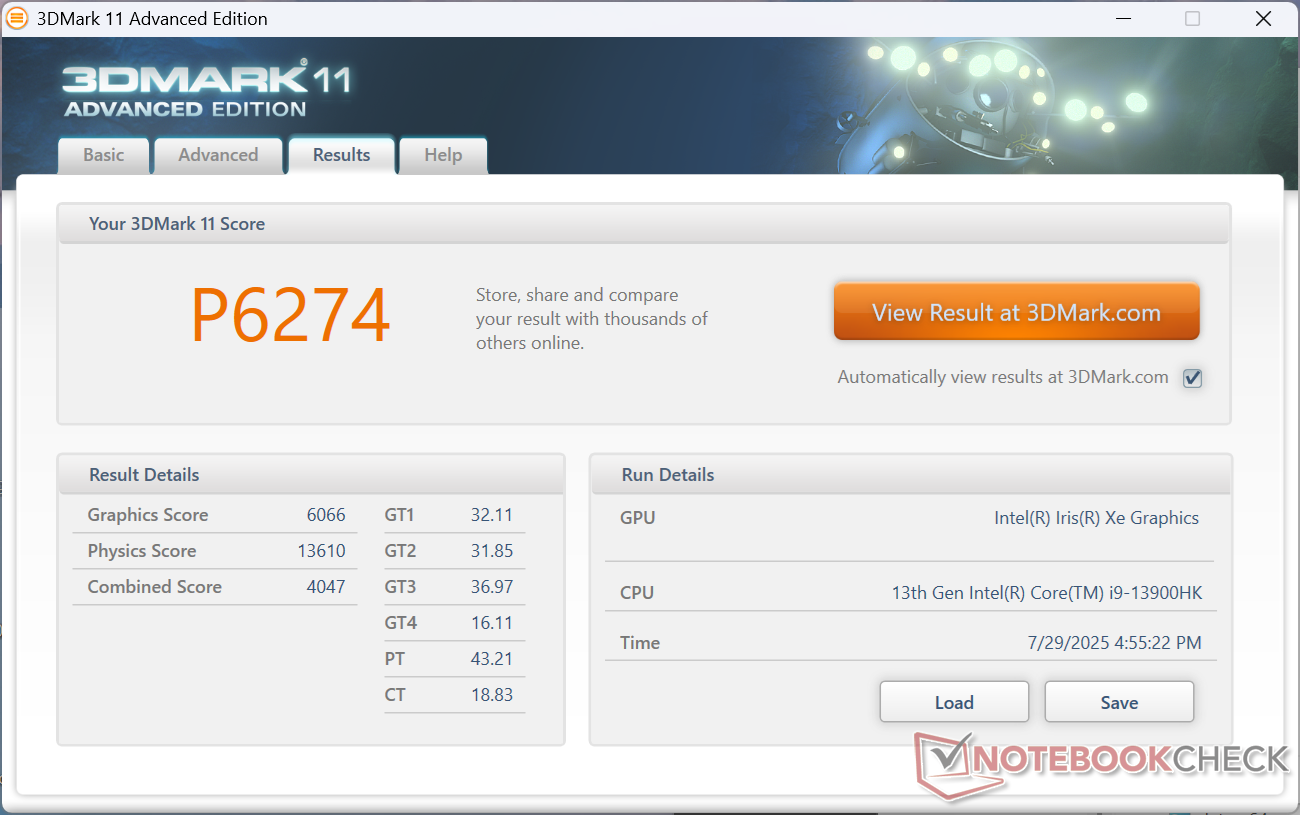
| 3DMark 11 Performance | 6274 punti | |
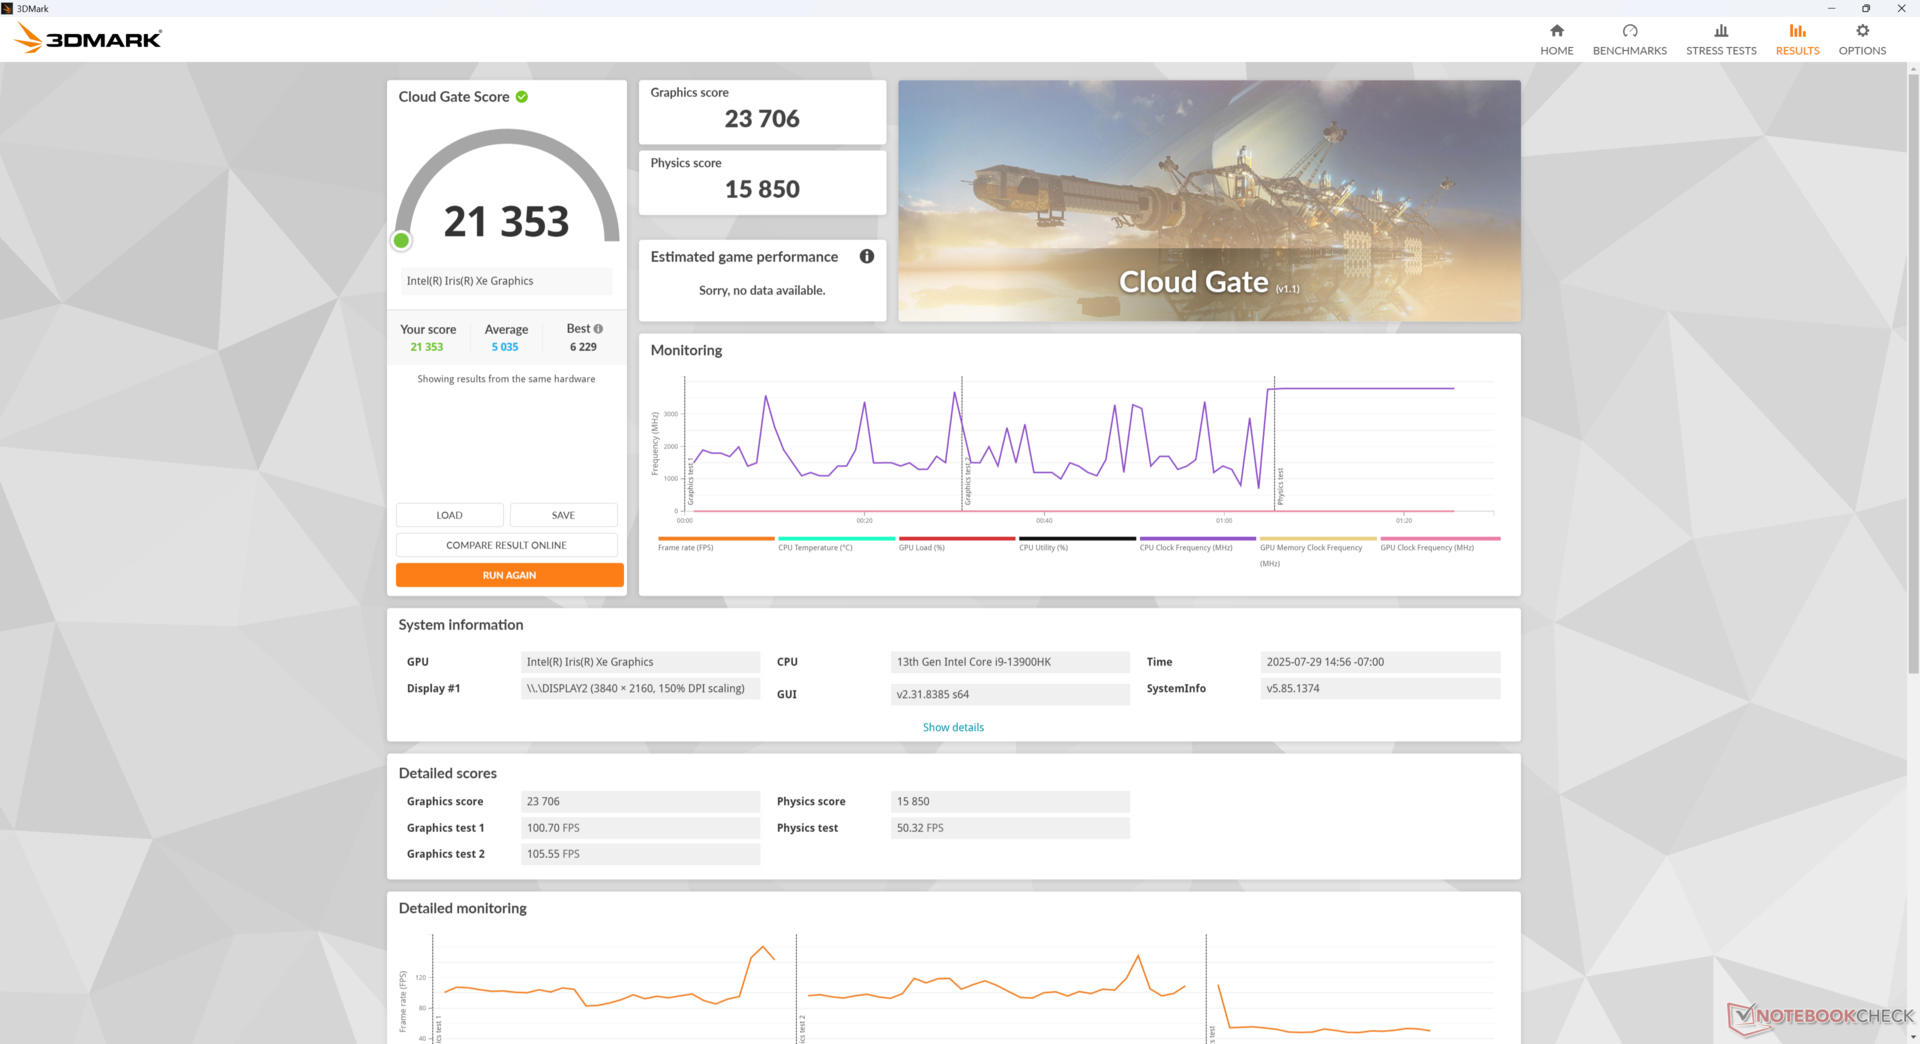
| 3DMark Cloud Gate Standard Score | 21353 punti | |
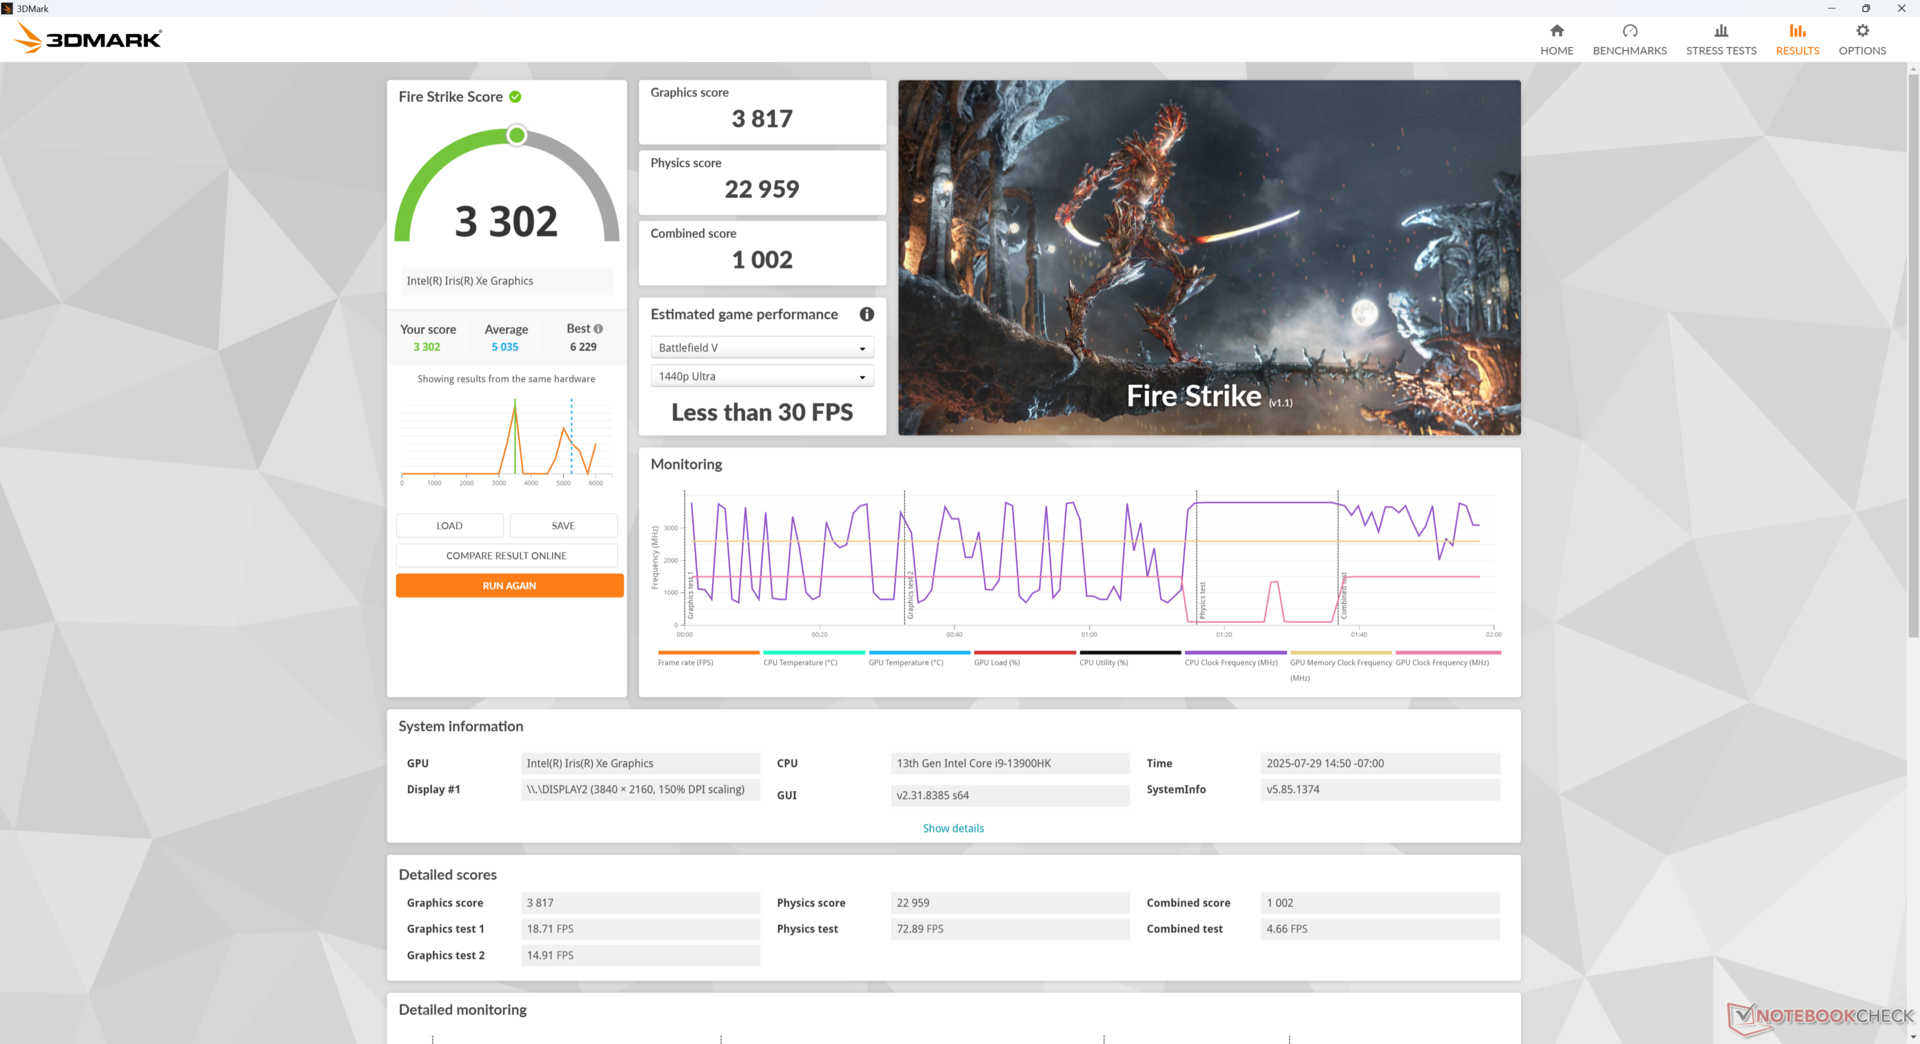
| 3DMark Fire Strike Score | 3302 punti | |
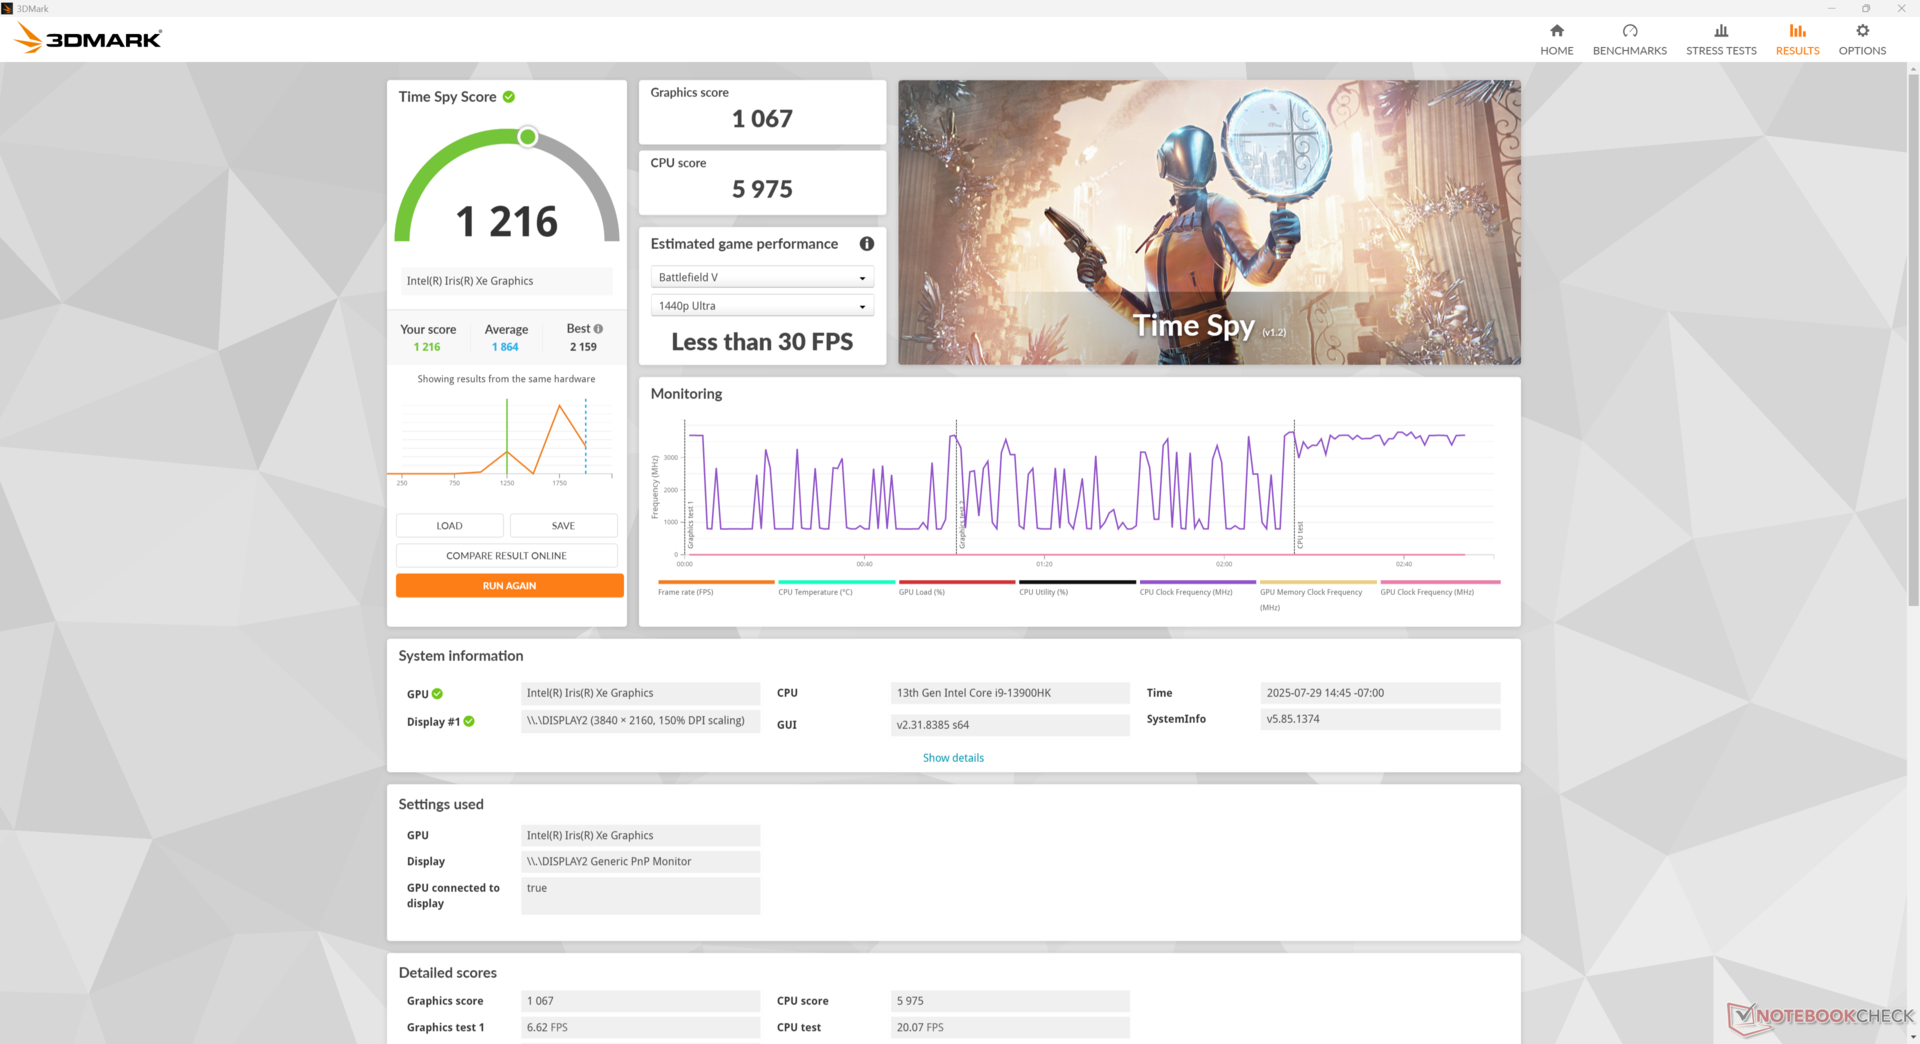
| 3DMark Time Spy Score | 1216 punti | |
Aiuto | ||
* ... Meglio usare valori piccoli
Cyberpunk 2077 ultra FPS Chart
| basso | medio | alto | ultra | |
|---|---|---|---|---|
| GTA V (2015) | 67.2 | 56.2 | 11.7 | 4.79 |
| Dota 2 Reborn (2015) | 84.4 | 68 | 46.1 | 44 |
| Final Fantasy XV Benchmark (2018) | 30.2 | 14.9 | 10.7 | |
| Strange Brigade (2018) | 67 | 23.4 | 20.1 | 17 |
| Baldur's Gate 3 (2023) | 12.9 | 10.7 | 9.2 | 9.2 |
| Cyberpunk 2077 2.2 Phantom Liberty (2023) | ||||
| F1 24 (2024) | 25.7 | 23.8 | 18 | 14.8 |
Emissioni
Rumore del sistema
I livelli di rumorosità della ventola sono leggermente più alti rispetto al più grande GTi13 Ultra. Tuttavia, il soffitto è notevolmente più basso rispetto a quello di alternative come il BOSGAME M4 Neo o il vecchio e più lento SEi12.
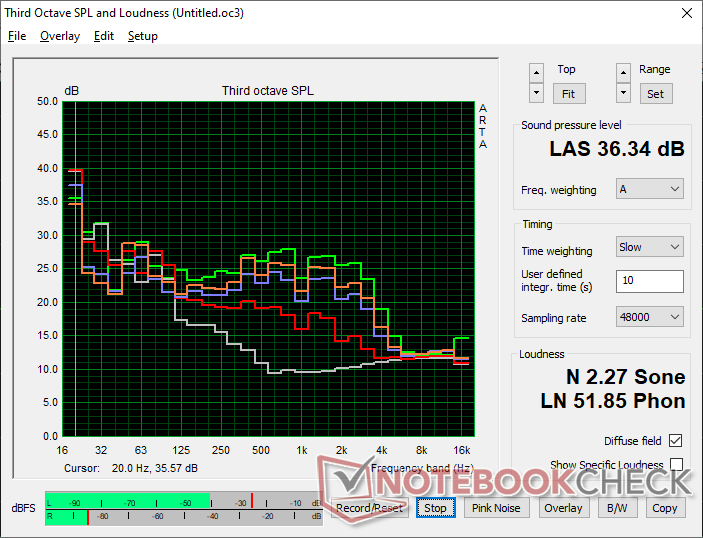
Rumorosità
| Idle |
| 28 / 28 / 28 dB(A) |
| Sotto carico |
| 32.6 / 36.3 dB(A) |
 | ||
30 dB silenzioso 40 dB(A) udibile 50 dB(A) rumoroso |
||
min: | ||
| Beelink SEi13 Pro Iris Xe G7 96EUs, i9-13900HK, Crucial P3 Plus CT1000P3PSSD8 | Beelink GTI13 Ultra Iris Xe G7 96EUs, i9-13900HK, Crucial P5 Plus 1TB CT1000P5PSSD8 | Beelink SEi12 Core i5-1235U Iris Xe G7 80EUs, i5-1235U, Kingston NV1 SNVS/500GCN | HP Z2 Mini G1a Radeon 8060S, Ryzen AI Max+ PRO 395, Samsung PM9A1 MZVL22T0HBLB | BOSGAME M4 Neo Radeon 780M, R7 7840HS, Kingston OM8PGP41024N-A0 | |
|---|---|---|---|---|---|
| Noise | 5% | -1% | -37% | -23% | |
| off /ambiente * | 23.1 | 23.4 -1% | 23.3 -1% | 24.9 -8% | 24.3 -5% |
| Idle Minimum * | 28 | 26.5 5% | 27.8 1% | 32.1 -15% | 37.6 -34% |
| Idle Average * | 28 | 26.7 5% | 27.8 1% | 32.4 -16% | 37.9 -35% |
| Idle Maximum * | 28 | 28.5 -2% | 27.8 1% | 32.6 -16% | 38 -36% |
| Load Average * | 32.6 | 30.6 6% | 32 2% | 41.1 -26% | 40.8 -25% |
| Cyberpunk 2077 ultra * | 34.3 | 32.5 5% | 67 -95% | 40.18 -17% | |
| Load Maximum * | 36.3 | 30.8 15% | 39.2 -8% | 67.3 -85% | 40.2 -11% |
| Witcher 3 ultra * | 34.1 | 70 |
* ... Meglio usare valori piccoli
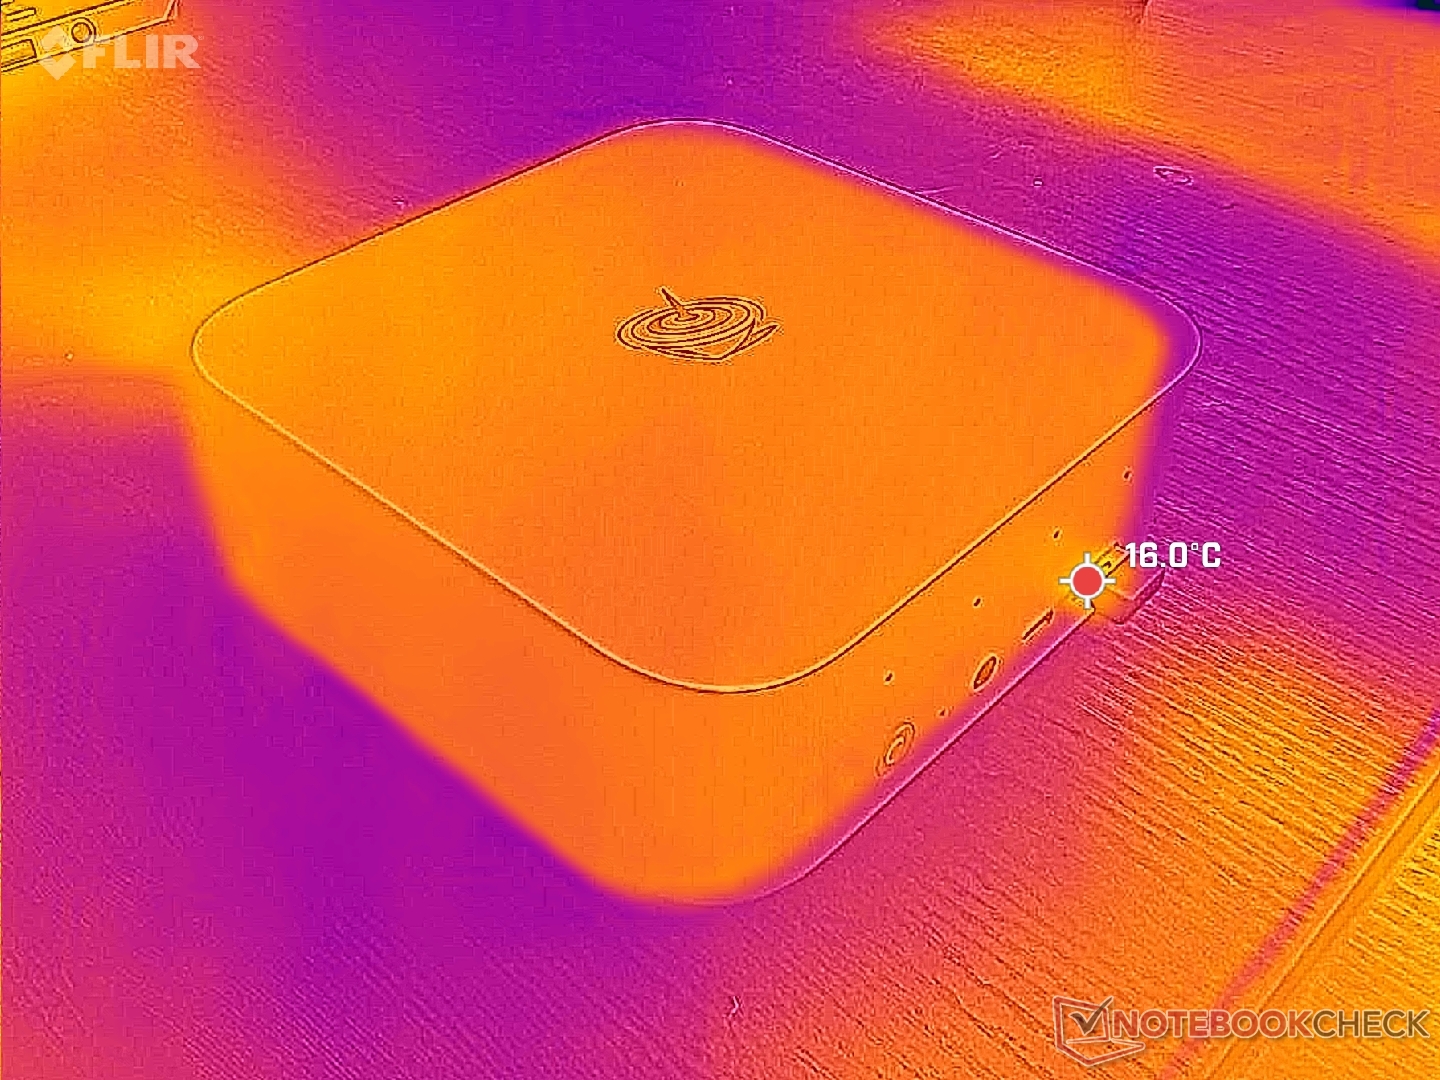
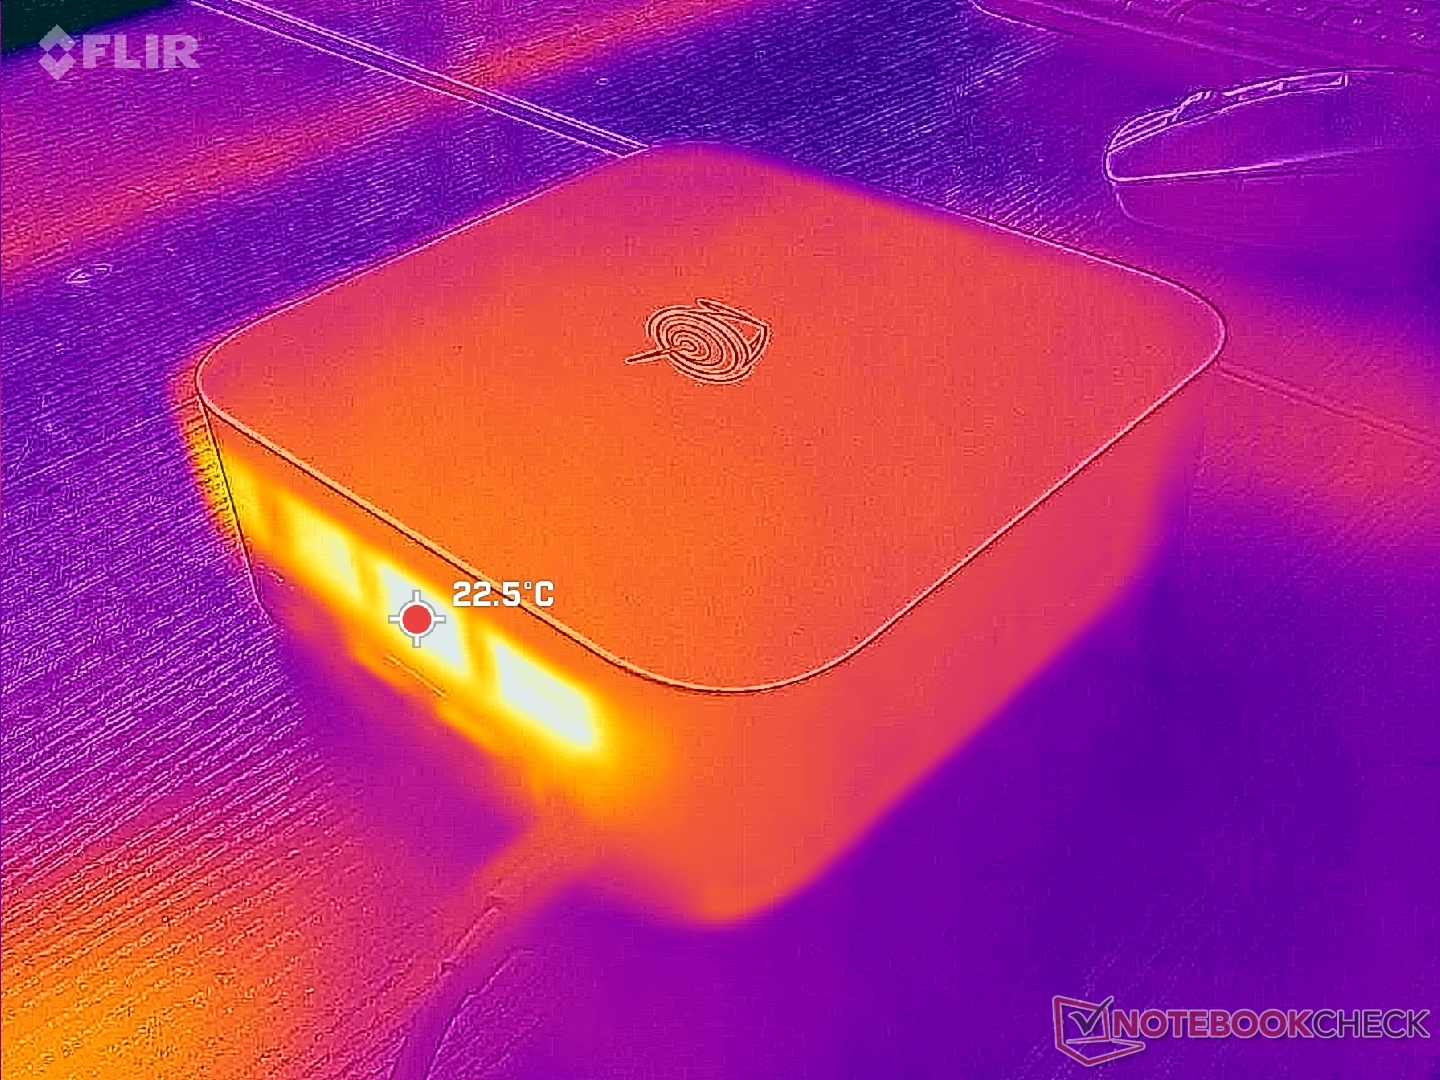
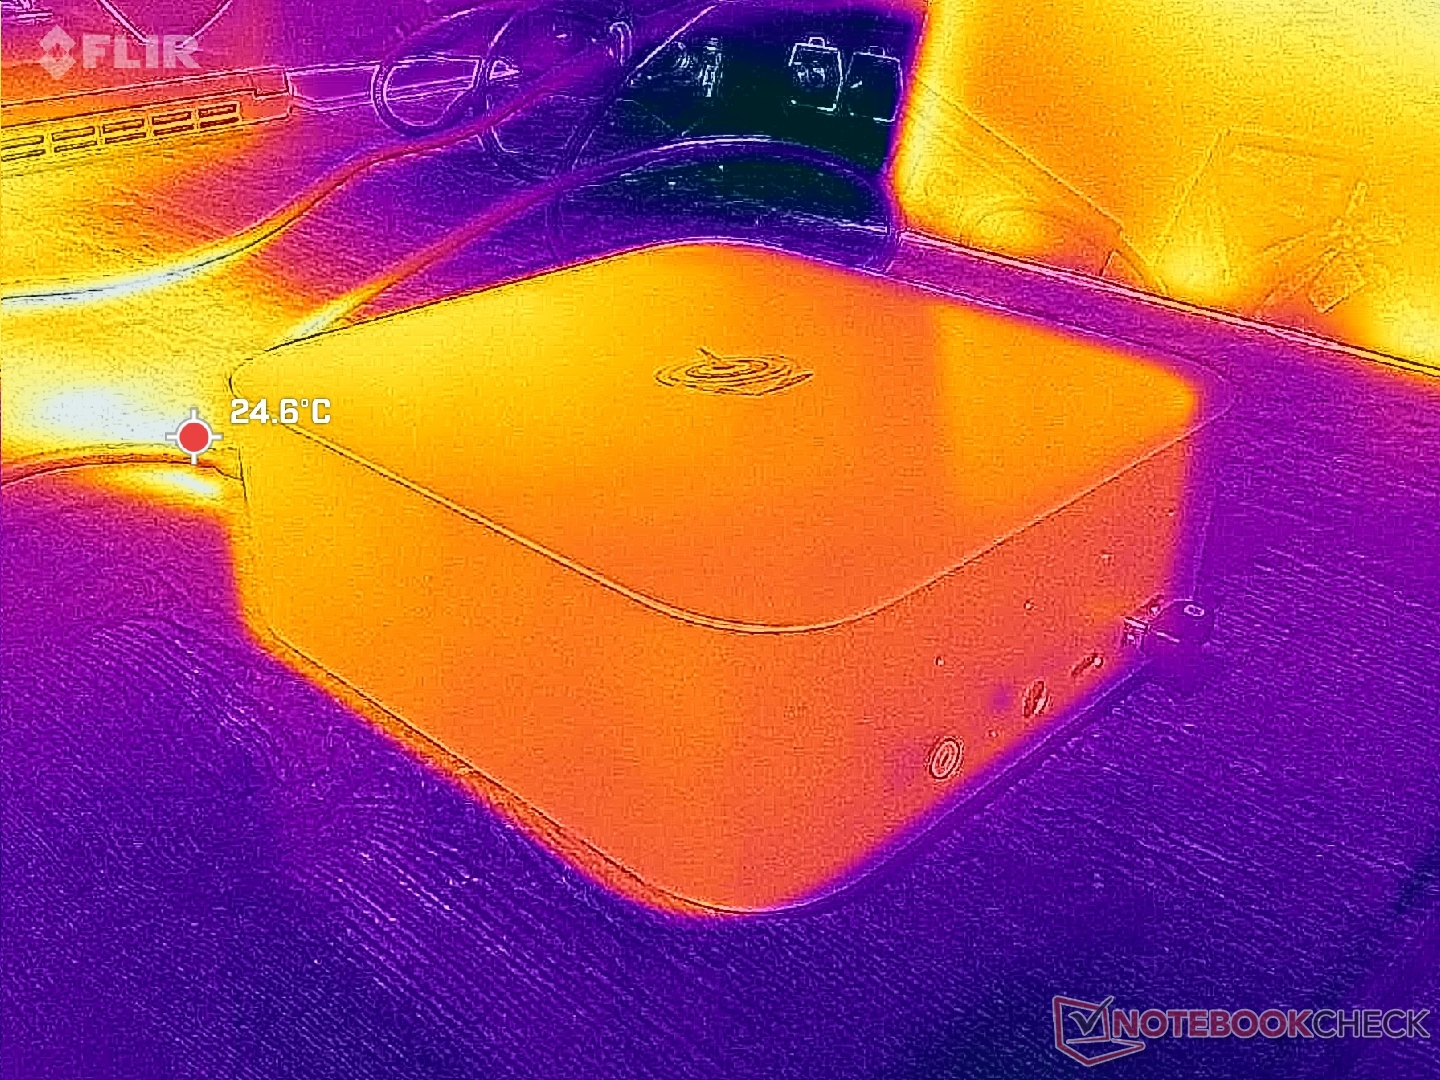
Temperatura
Il calore disperso fuoriesce dalla parte posteriore, mentre l'aria fresca entra dalla parte inferiore. La superficie superiore diventa calda, ma mai fastidiosamente calda, nonostante la presenza di poche griglie di ventilazione.
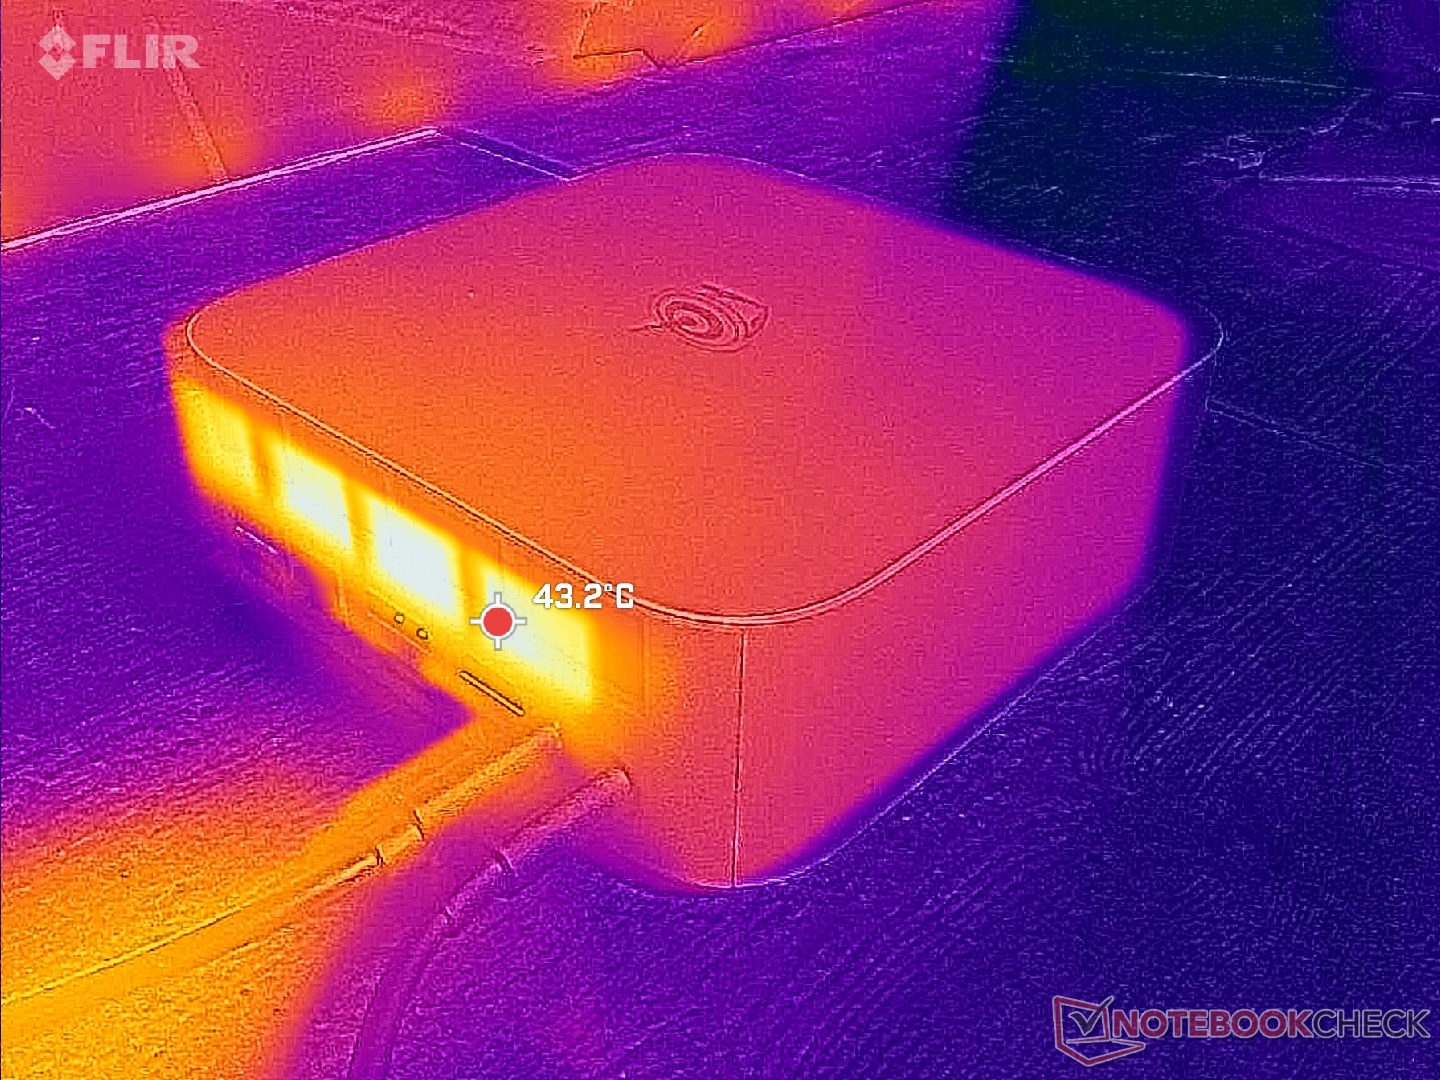
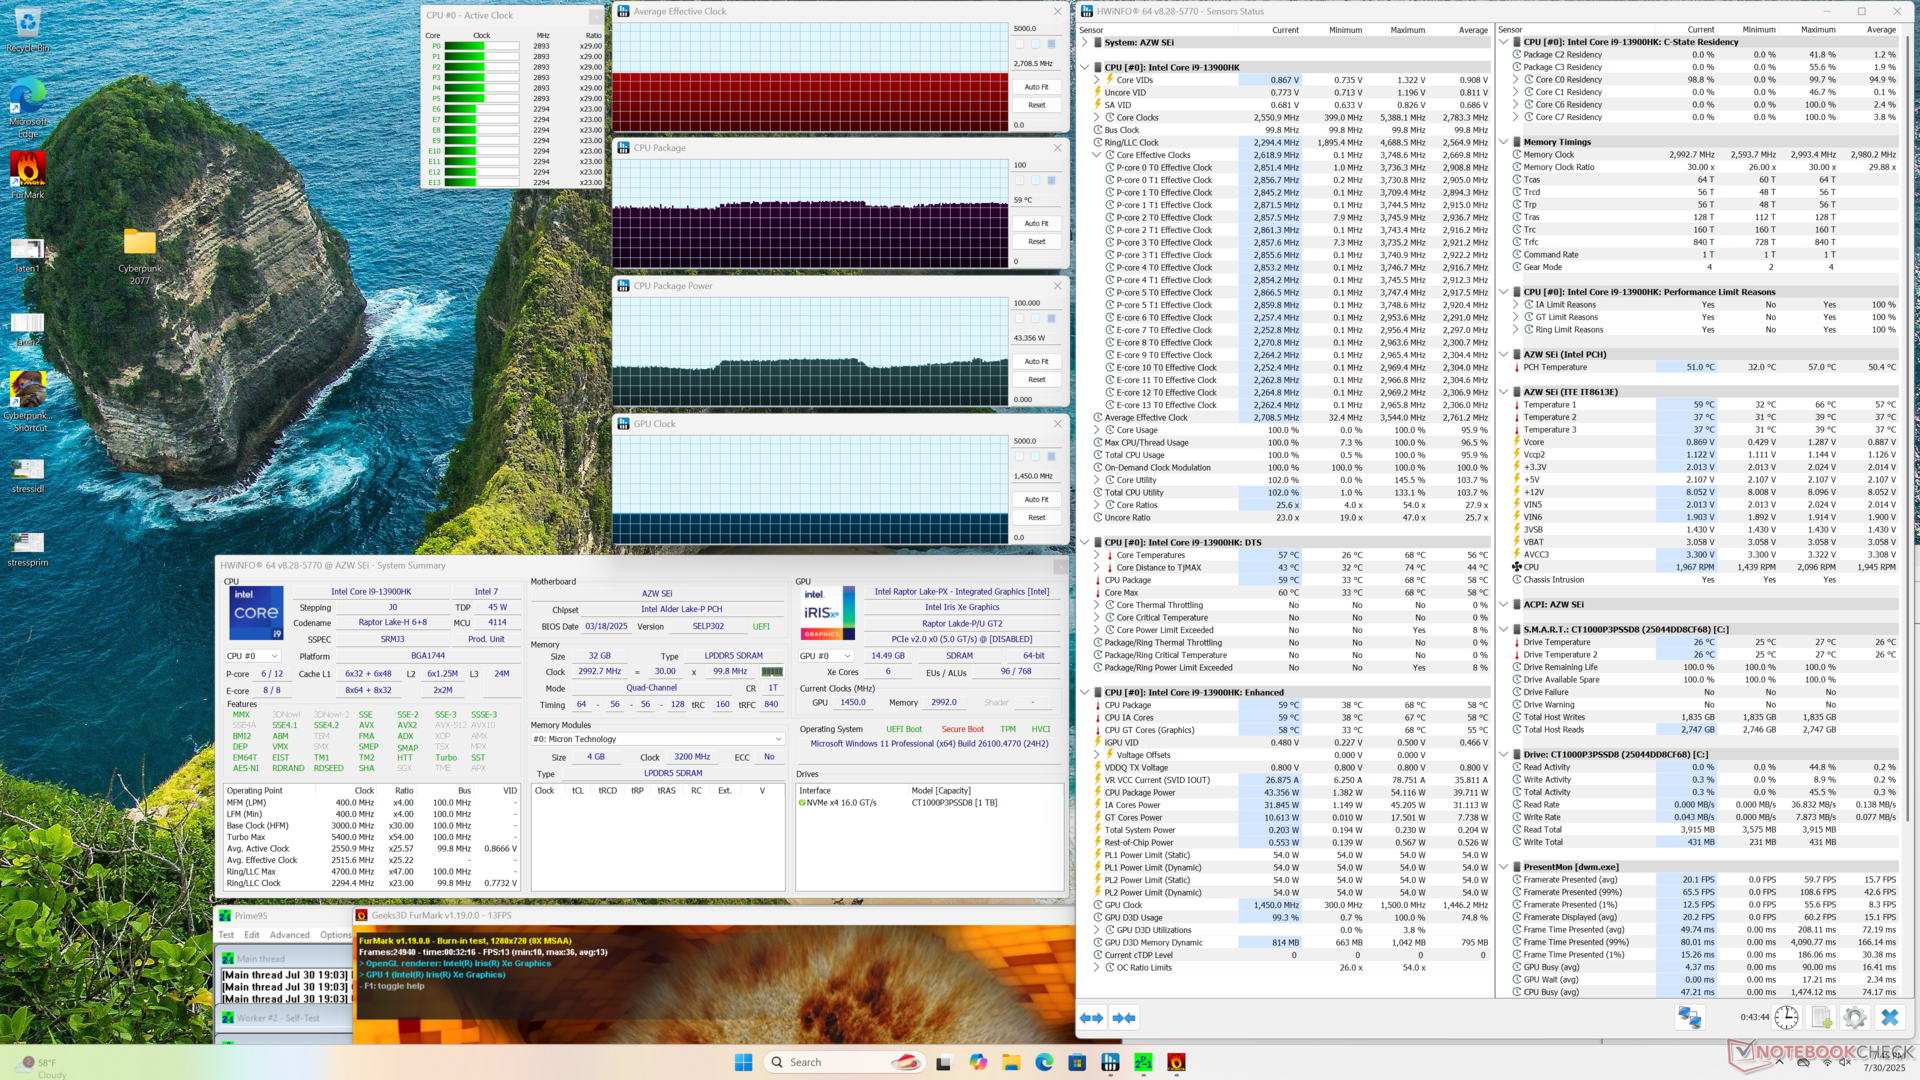
Test da sforzo
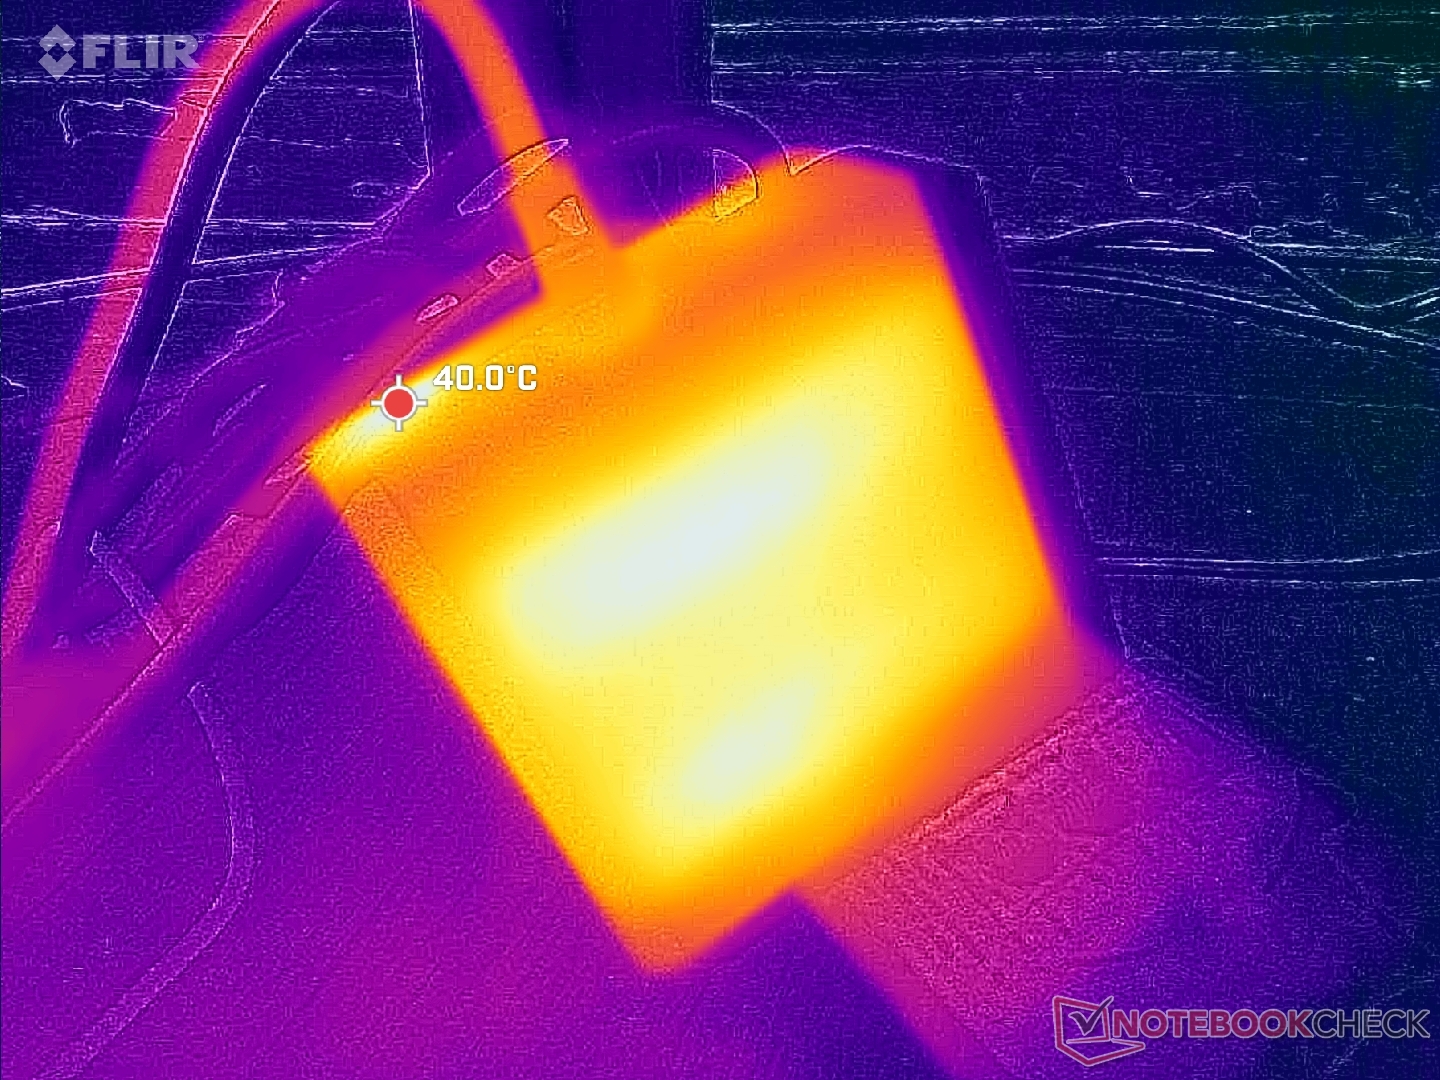
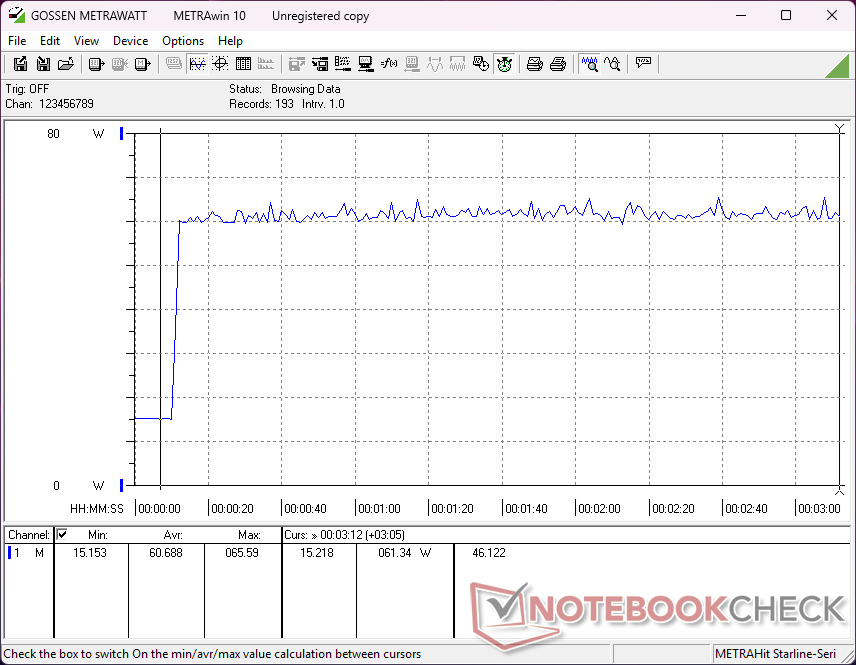
La CPU si stabilizza a 3,5 GHz, 44 W e 60 C quando si esegue lo stress Prime95, che in realtà è più freddo di quello che abbiamo osservato su GTI13 Ultra di qualche grado.

| Clock medio della CPU (GHz) | Clock della GPU (MHz) | Temperatura media della CPU (°C) | |
| Sistema inattivo | -- | -- | 33 |
| Stress Prime95 | 3,5 | -- | 60 |
| Prime95 + FurMark Stress | 2,7 | 1450 | 59 |
| Cyberpunk 2077 Stress | 1,0 | 1500 | 53 |
Altoparlanti
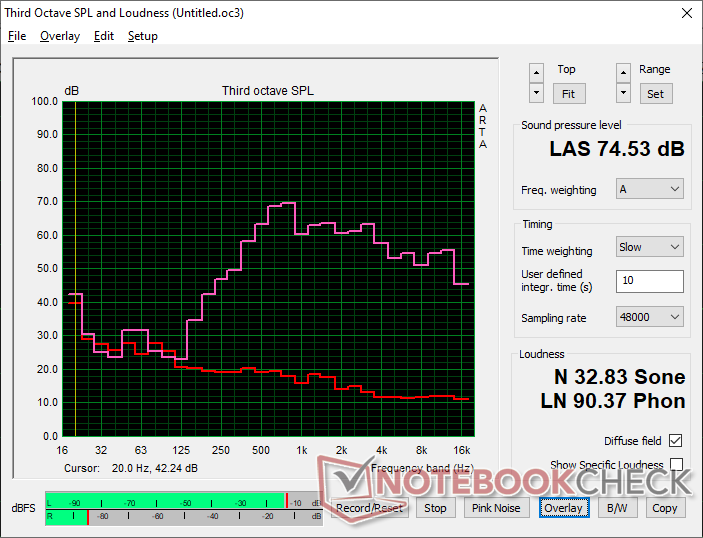
Beelink SEi13 Pro analisi audio
(±) | potenza degli altiparlanti media ma buona (74.5 dB)
Bassi 100 - 315 Hz
(-) | quasi nessun basso - in media 18.9% inferiori alla media
(±) | la linearità dei bassi è media (12.7% delta rispetto alla precedente frequenza)
Medi 400 - 2000 Hz
(±) | medi elevati - circa 7.9% superiore alla media
(±) | linearità dei medi adeguata (11.9% delta rispetto alla precedente frequenza)
Alti 2 - 16 kHz
(+) | Alti bilanciati - appena 3.5% dalla media
(±) | la linearità degli alti è media (8.1% delta rispetto alla precedente frequenza)
Nel complesso 100 - 16.000 Hz
(±) | la linearità complessiva del suono è media (26.7% di differenza rispetto alla media
Rispetto alla stessa classe
» 65% di tutti i dispositivi testati in questa classe è stato migliore, 5% simile, 30% peggiore
» Il migliore ha avuto un delta di 13%, medio di 25%, peggiore di 64%
Rispetto a tutti i dispositivi testati
» 81% di tutti i dispositivi testati in questa classe è stato migliore, 4% similare, 15% peggiore
» Il migliore ha avuto un delta di 4%, medio di 24%, peggiore di 134%
Apple MacBook Pro 16 2021 M1 Pro analisi audio
(+) | gli altoparlanti sono relativamente potenti (84.7 dB)
Bassi 100 - 315 Hz
(+) | bassi buoni - solo 3.8% dalla media
(+) | bassi in lineaa (5.2% delta rispetto alla precedente frequenza)
Medi 400 - 2000 Hz
(+) | medi bilanciati - solo only 1.3% rispetto alla media
(+) | medi lineari (2.1% delta rispetto alla precedente frequenza)
Alti 2 - 16 kHz
(+) | Alti bilanciati - appena 1.9% dalla media
(+) | alti lineari (2.7% delta rispetto alla precedente frequenza)
Nel complesso 100 - 16.000 Hz
(+) | suono nel complesso lineare (4.6% differenza dalla media)
Rispetto alla stessa classe
» 0% di tutti i dispositivi testati in questa classe è stato migliore, 0% simile, 100% peggiore
» Il migliore ha avuto un delta di 5%, medio di 18%, peggiore di 45%
Rispetto a tutti i dispositivi testati
» 0% di tutti i dispositivi testati in questa classe è stato migliore, 0% similare, 100% peggiore
» Il migliore ha avuto un delta di 4%, medio di 24%, peggiore di 134%
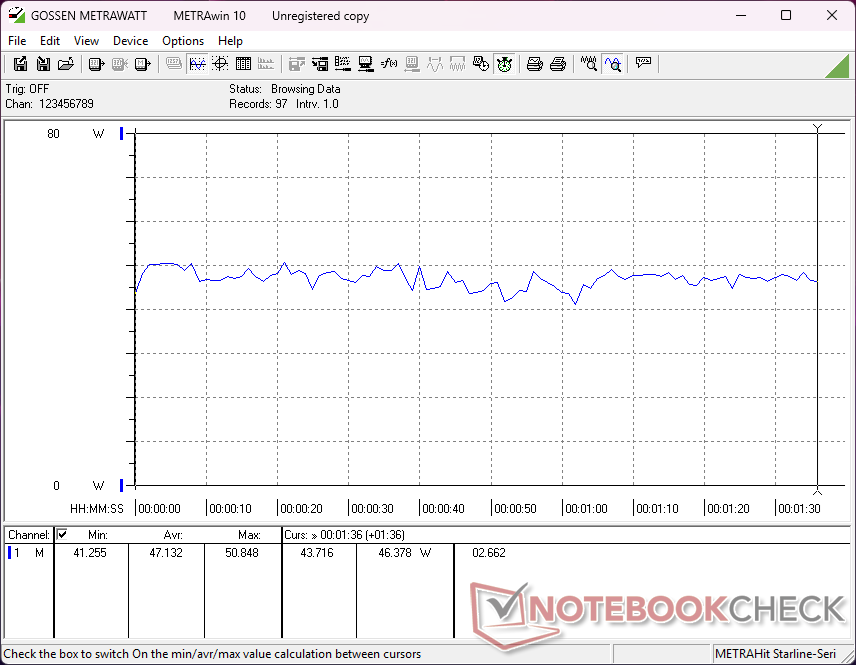
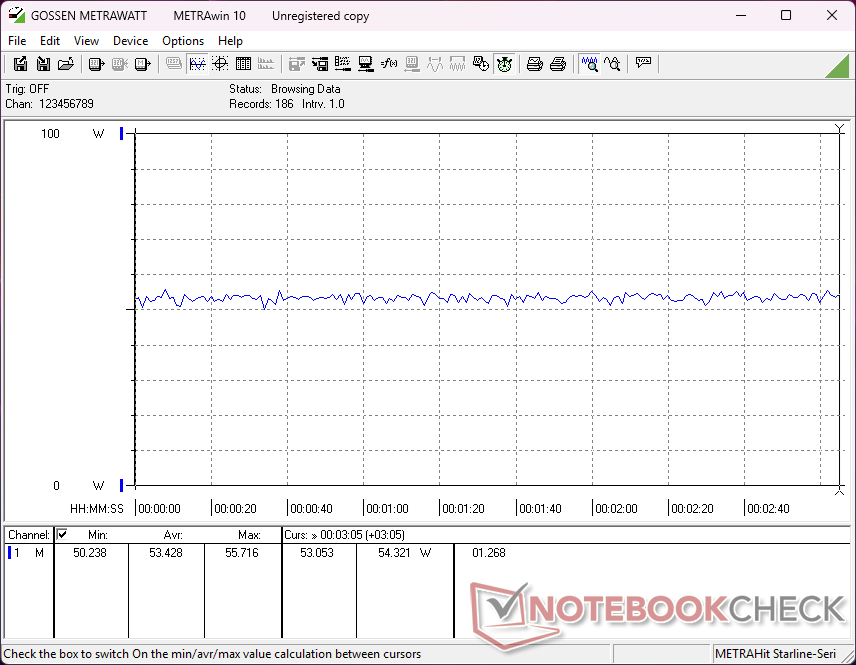
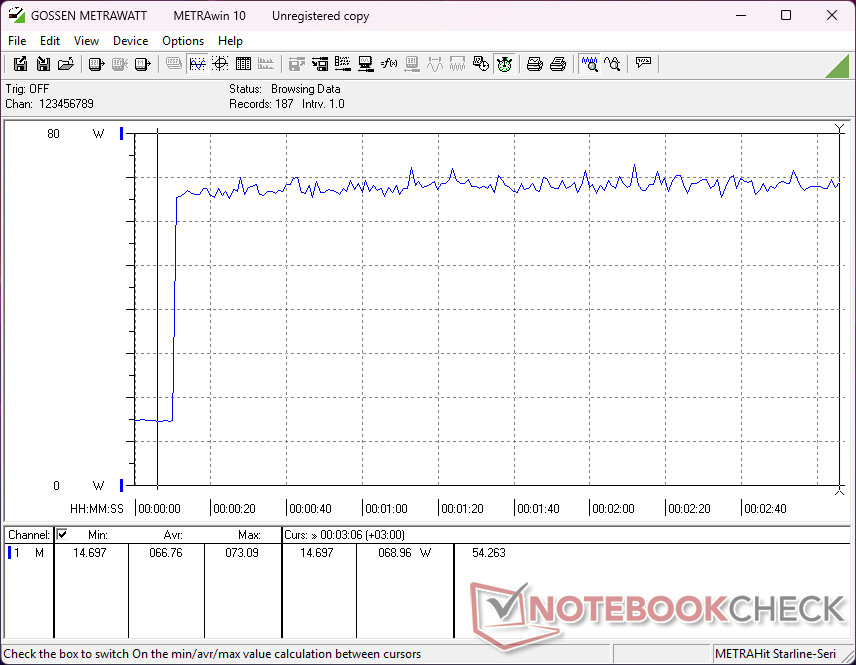
Gestione dell'energia
Consumo di energia
Il sistema richiede meno energia rispetto al GTi13 Ultra quando è sotto carico, in quanto la CPU raggiunge un massimo di 44 W per impostazione predefinita, rispetto ai 55 W di quest'ultima. Anche il consumo è inferiore a quello del BOSGAME M4ma quest'ultimo offre prestazioni grafiche più veloci per compensare.
| Off / Standby | |
| Idle | |
| Sotto carico |
|
Leggenda:
min: | |
| Beelink SEi13 Pro i9-13900HK, Iris Xe G7 96EUs, Crucial P3 Plus CT1000P3PSSD8, , x, | Beelink GTI13 Ultra i9-13900HK, Iris Xe G7 96EUs, Crucial P5 Plus 1TB CT1000P5PSSD8, , x, | Beelink SEi12 Core i5-1235U i5-1235U, Iris Xe G7 80EUs, Kingston NV1 SNVS/500GCN, , x, | HP Z2 Mini G1a Ryzen AI Max+ PRO 395, Radeon 8060S, Samsung PM9A1 MZVL22T0HBLB, , x, | BOSGAME M4 Neo R7 7840HS, Radeon 780M, Kingston OM8PGP41024N-A0, , x, | |
|---|---|---|---|---|---|
| Power Consumption | -31% | -17% | -69% | 1% | |
| Idle Minimum * | 14.5 | 15.7 -8% | 15.8 -9% | 7.1 51% | 7.6 48% |
| Idle Average * | 14.9 | 16.5 -11% | 16.8 -13% | 9.5 36% | 9.1 39% |
| Idle Maximum * | 15.8 | 16.5 -4% | 17 -8% | 13.8 13% | 11.1 30% |
| Load Average * | 47.1 | 77.3 -64% | 54.4 -15% | 76.7 -63% | 67.2 -43% |
| Cyberpunk 2077 ultra external monitor * | 53.4 | 91.9 -72% | 195.1 -265% | 81.3 -52% | |
| Cyberpunk 2077 ultra * | 53.4 | ||||
| Load Maximum * | 85.7 | 106 -24% | 119.1 -39% | 245.4 -186% | 98.4 -15% |
| Witcher 3 ultra * | 50.7 |
* ... Meglio usare valori piccoli
Power Consumption Cyberpunk / Stress Test
Power Consumption external Monitor
Valutazione Notebookcheck
Beelink SEi13 Pro
- 08/01/2025 v8
Allen Ngo
 Total Sustainability Score:
 Potenziali concorrenti a confronto
Transparency
La selezione dei dispositivi da recensire viene effettuata dalla nostra redazione. Il campione di prova è stato fornito all'autore come prestito dal produttore o dal rivenditore ai fini di questa recensione. L'istituto di credito non ha avuto alcuna influenza su questa recensione, né il produttore ne ha ricevuto una copia prima della pubblicazione. Non vi era alcun obbligo di pubblicare questa recensione. Non accettiamo mai compensi o pagamenti in cambio delle nostre recensioni. In quanto società mediatica indipendente, Notebookcheck non è soggetta all'autorità di produttori, rivenditori o editori.
Ecco come Notebookcheck esegue i test
Ogni anno, Notebookcheck esamina in modo indipendente centinaia di laptop e smartphone utilizzando procedure standardizzate per garantire che tutti i risultati siano comparabili. Da circa 20 anni sviluppiamo continuamente i nostri metodi di prova e nel frattempo stabiliamo gli standard di settore. Nei nostri laboratori di prova, tecnici ed editori esperti utilizzano apparecchiature di misurazione di alta qualità. Questi test comportano un processo di validazione in più fasi. Il nostro complesso sistema di valutazione si basa su centinaia di misurazioni e parametri di riferimento ben fondati, che mantengono l'obiettività.
