Notebookcheck Logo

Recensione dell'Intel Core i7-1185G7 - Primi Benchmarks Tiger Lake

Tiger Lake vs. Renoir Intel ci ha dato l'opportunità di testsare la nuova CPU di fascia alta per i notebooks sottili. Il nuovo chip Tiger Lake di Intel utilizza una nuova e più potente scheda grafica integrata, in modo da poter colmare il divario rispetto ad AMD. Abbiamo dato un'occhiata più da vicino ad un portatile per lo sviluppo di Intel e abbiamo testato le capacità del nuovo chip in numerosi benchmarks e con diverse configurazioni TDP.
Recensione della CPU Intel Core i7-1185G7

Sistma di Test

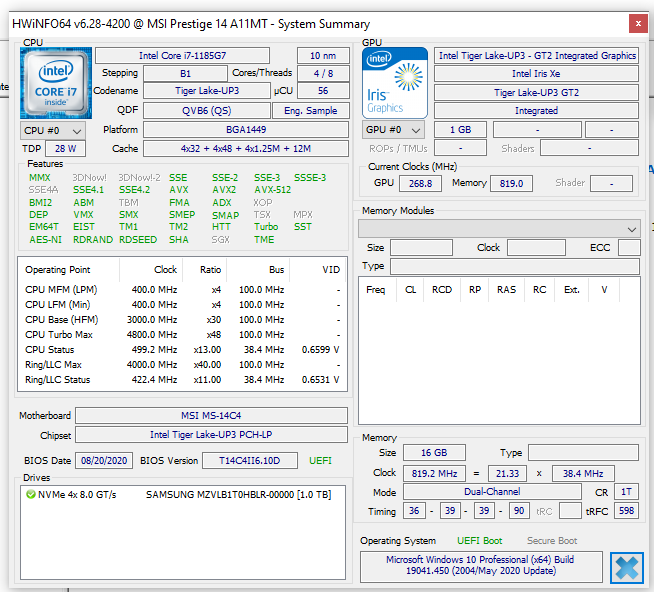
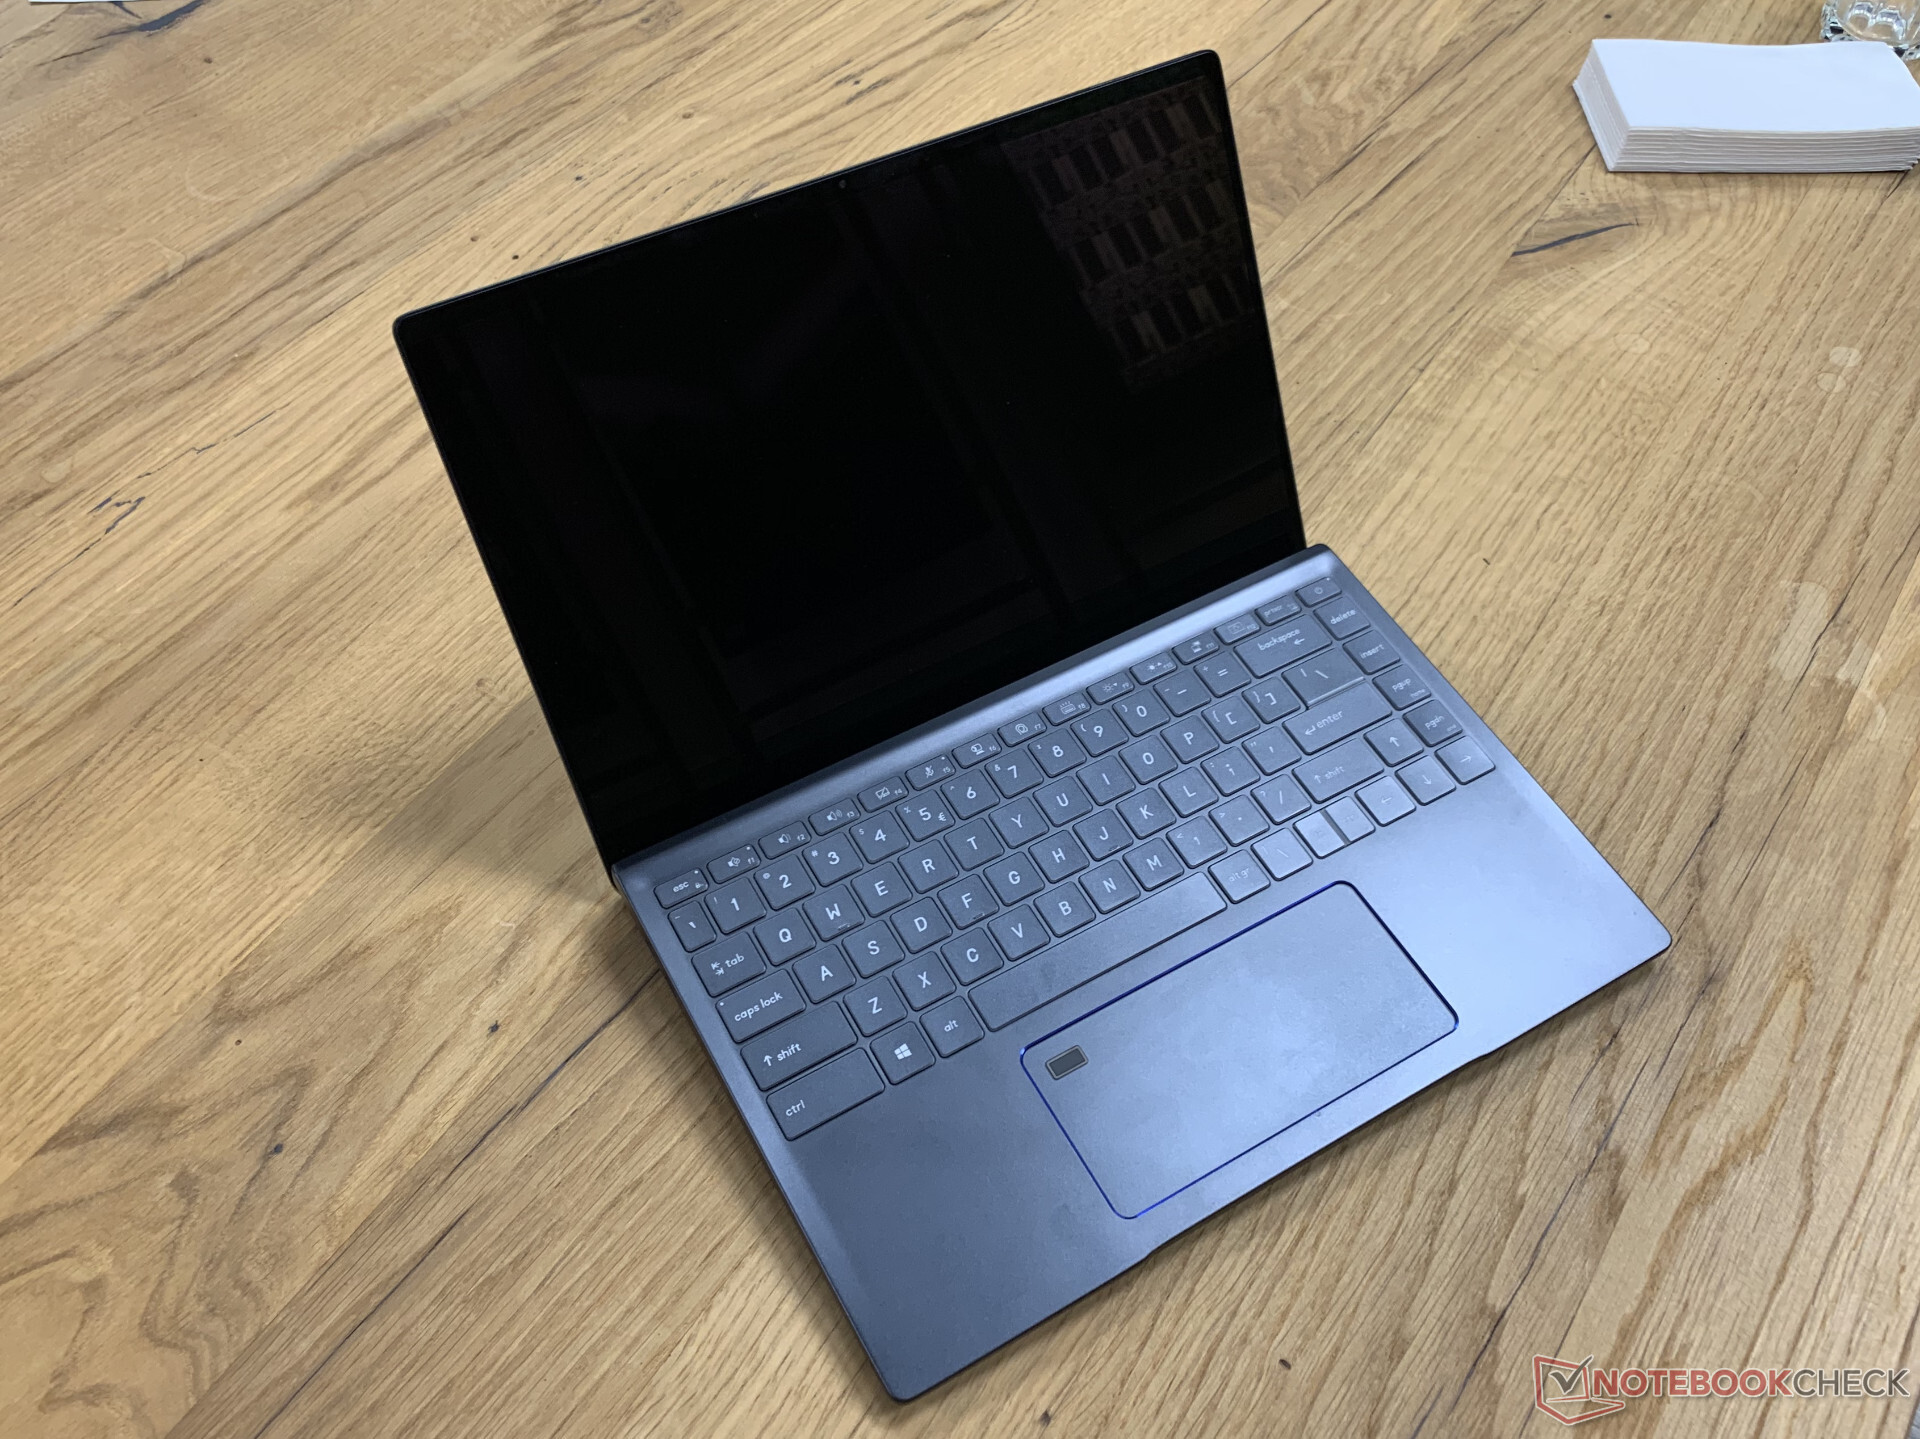
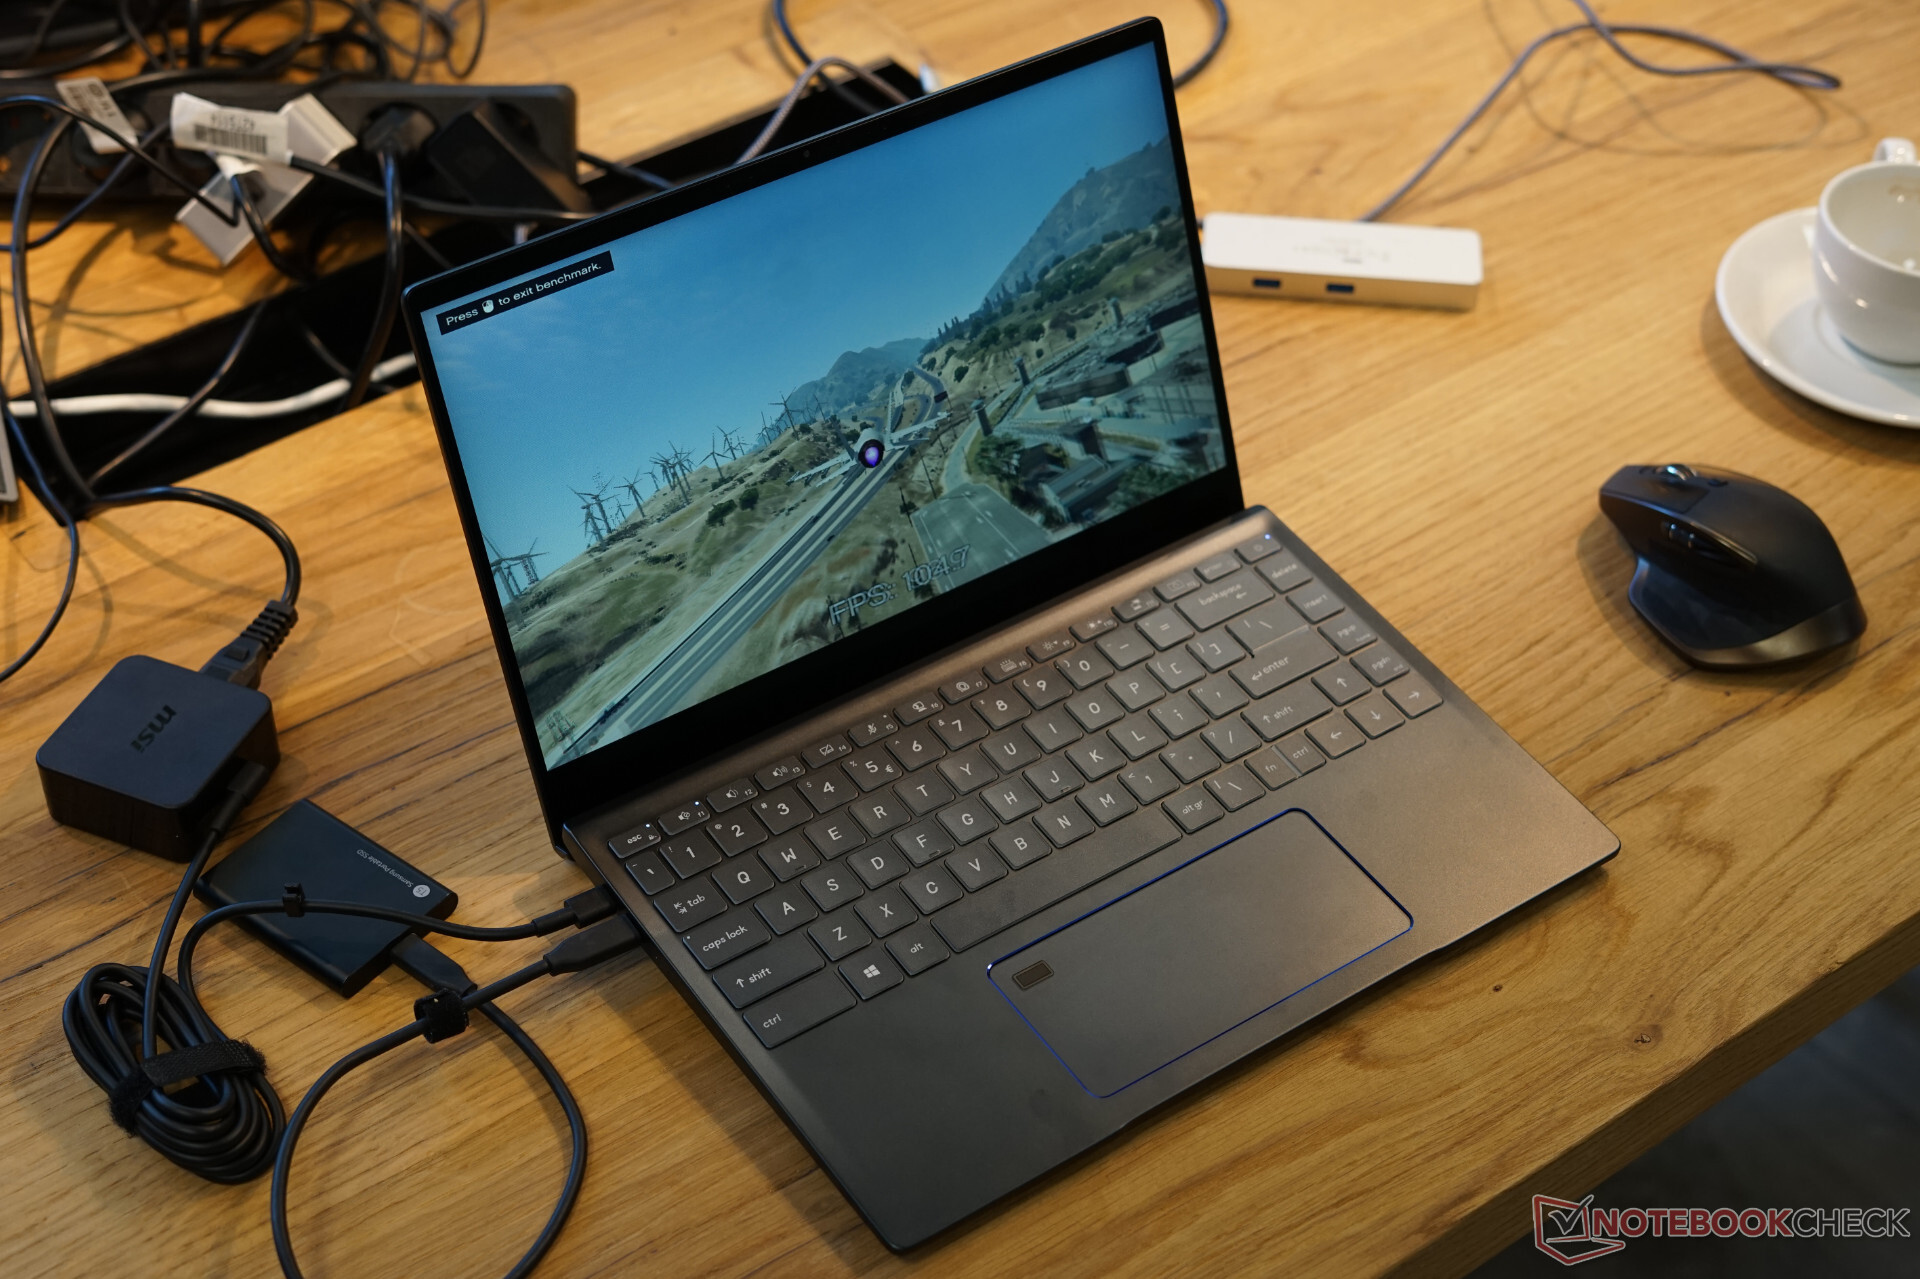
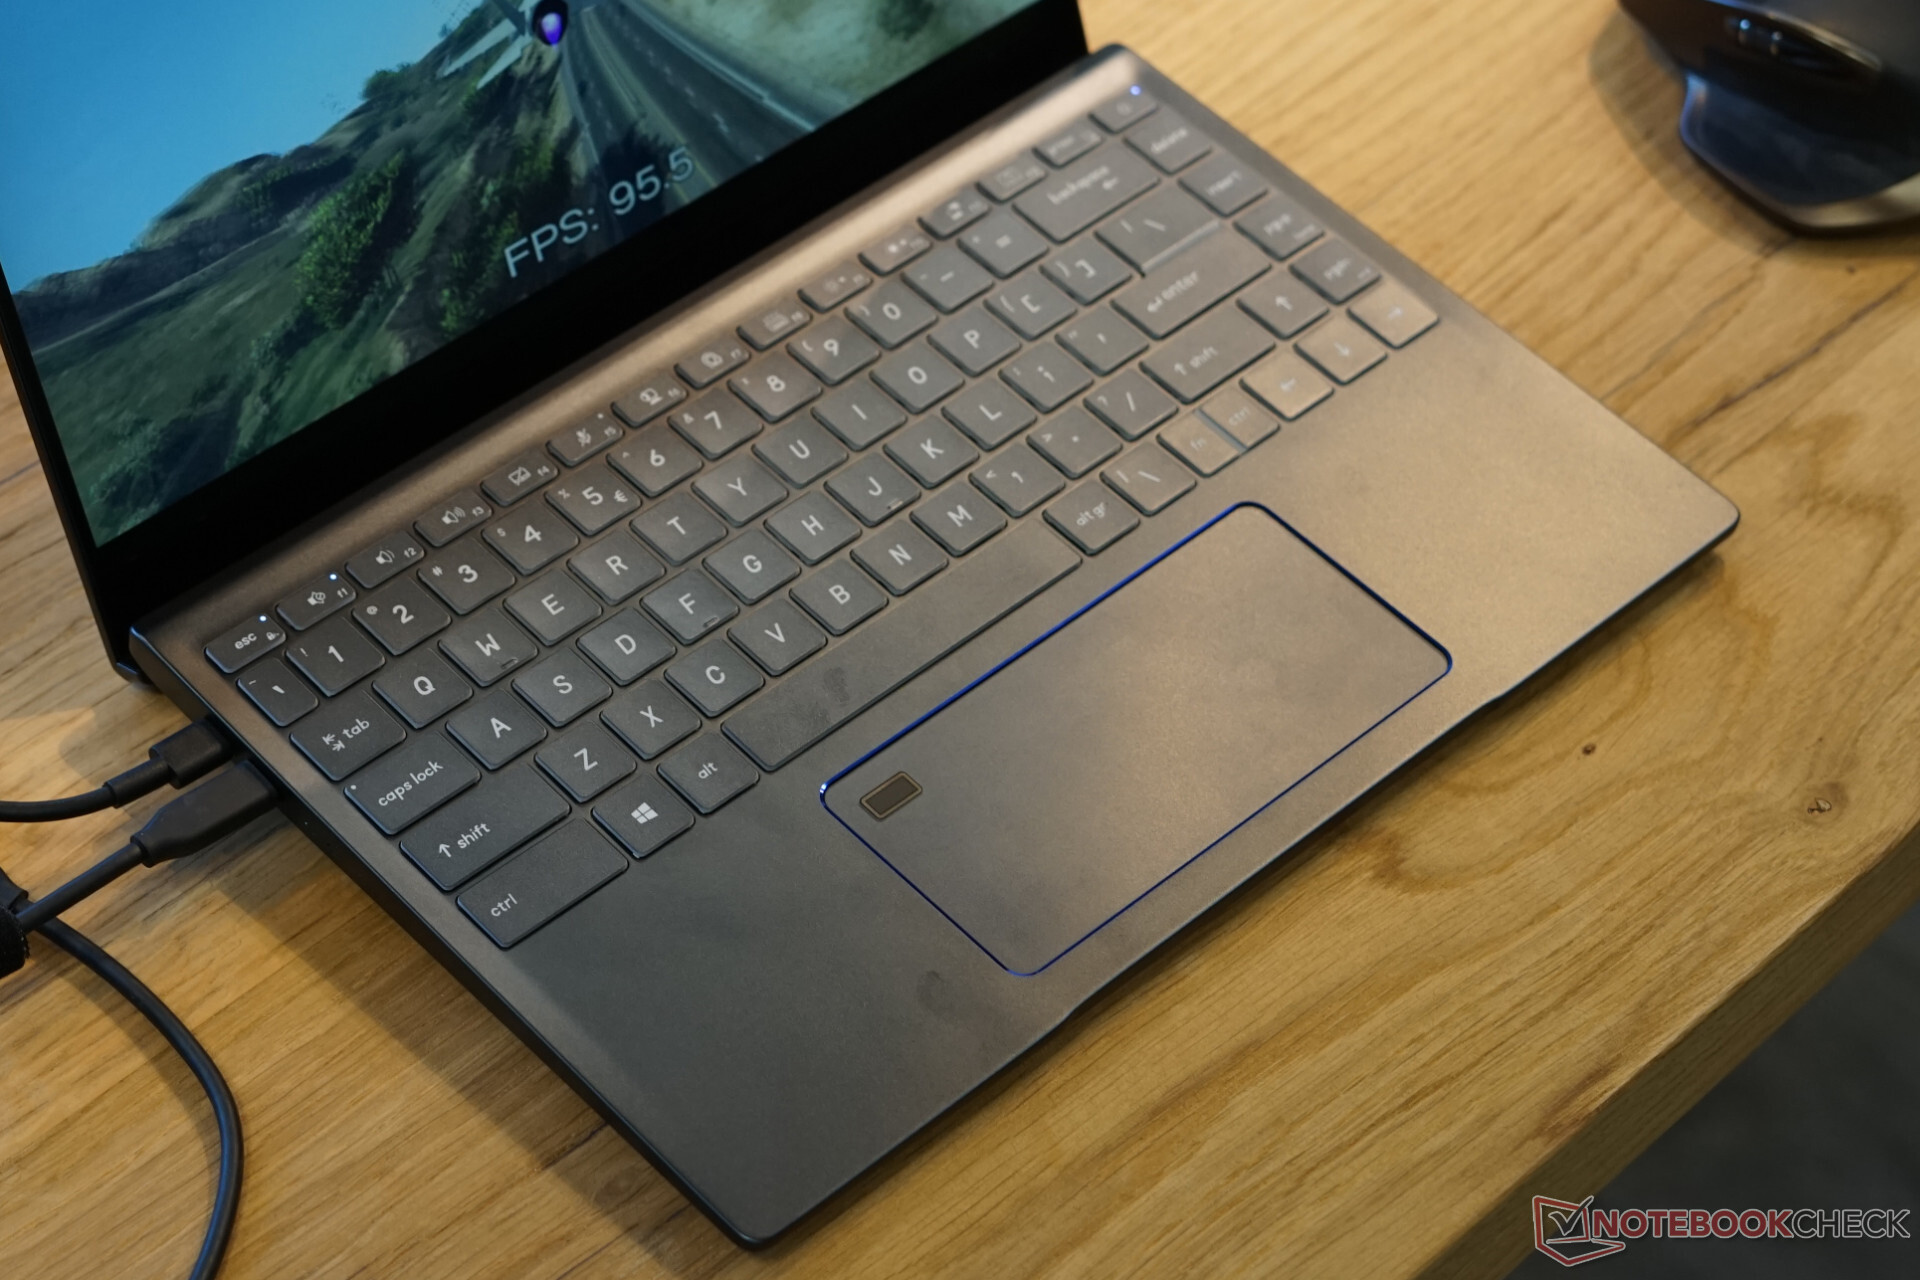
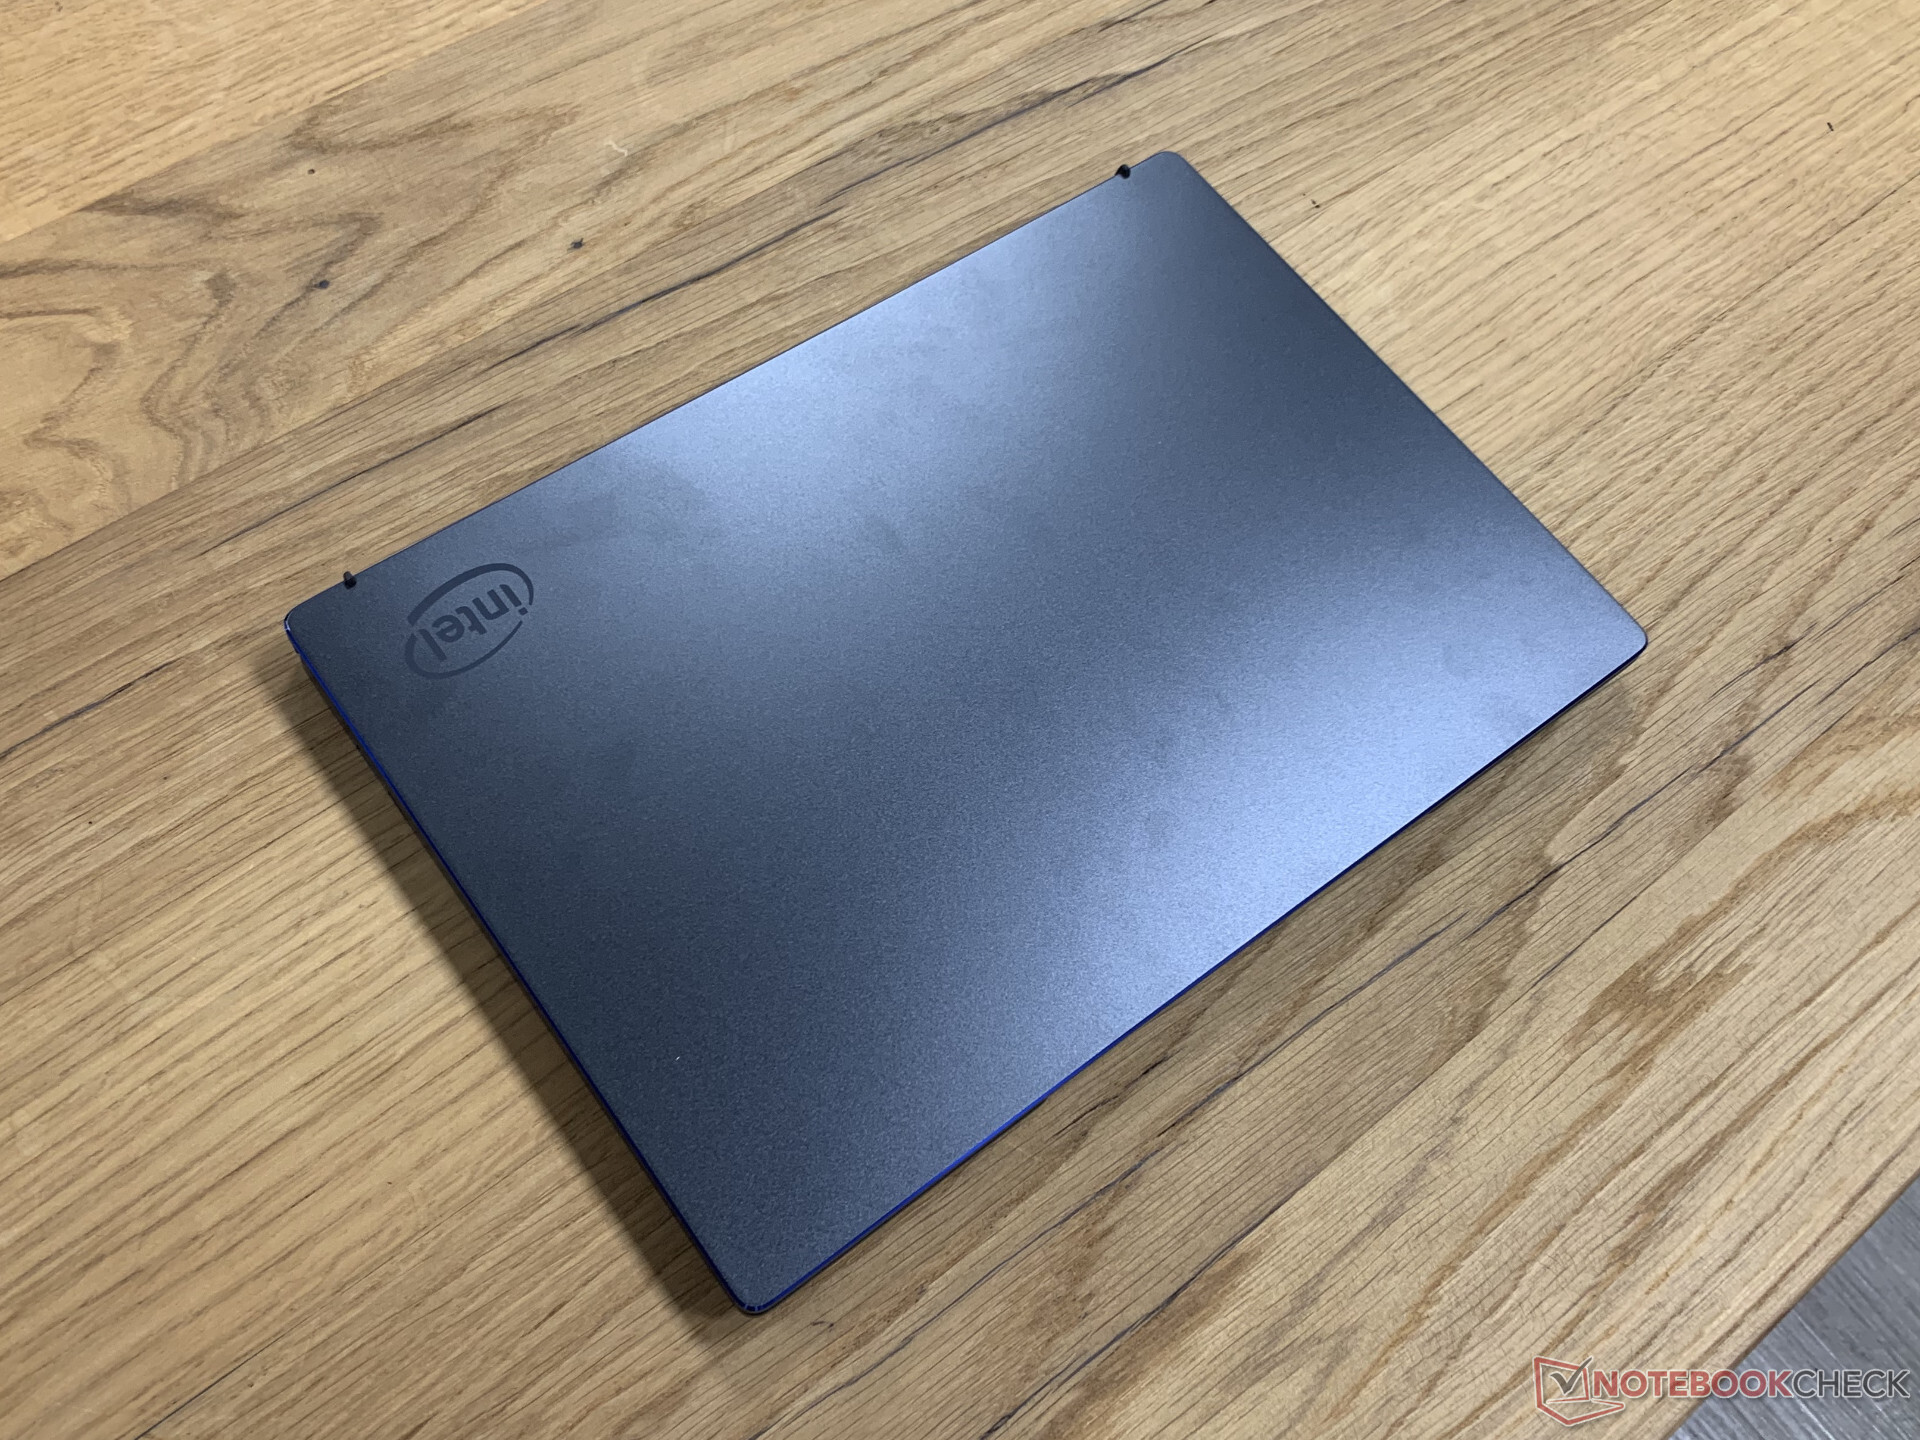
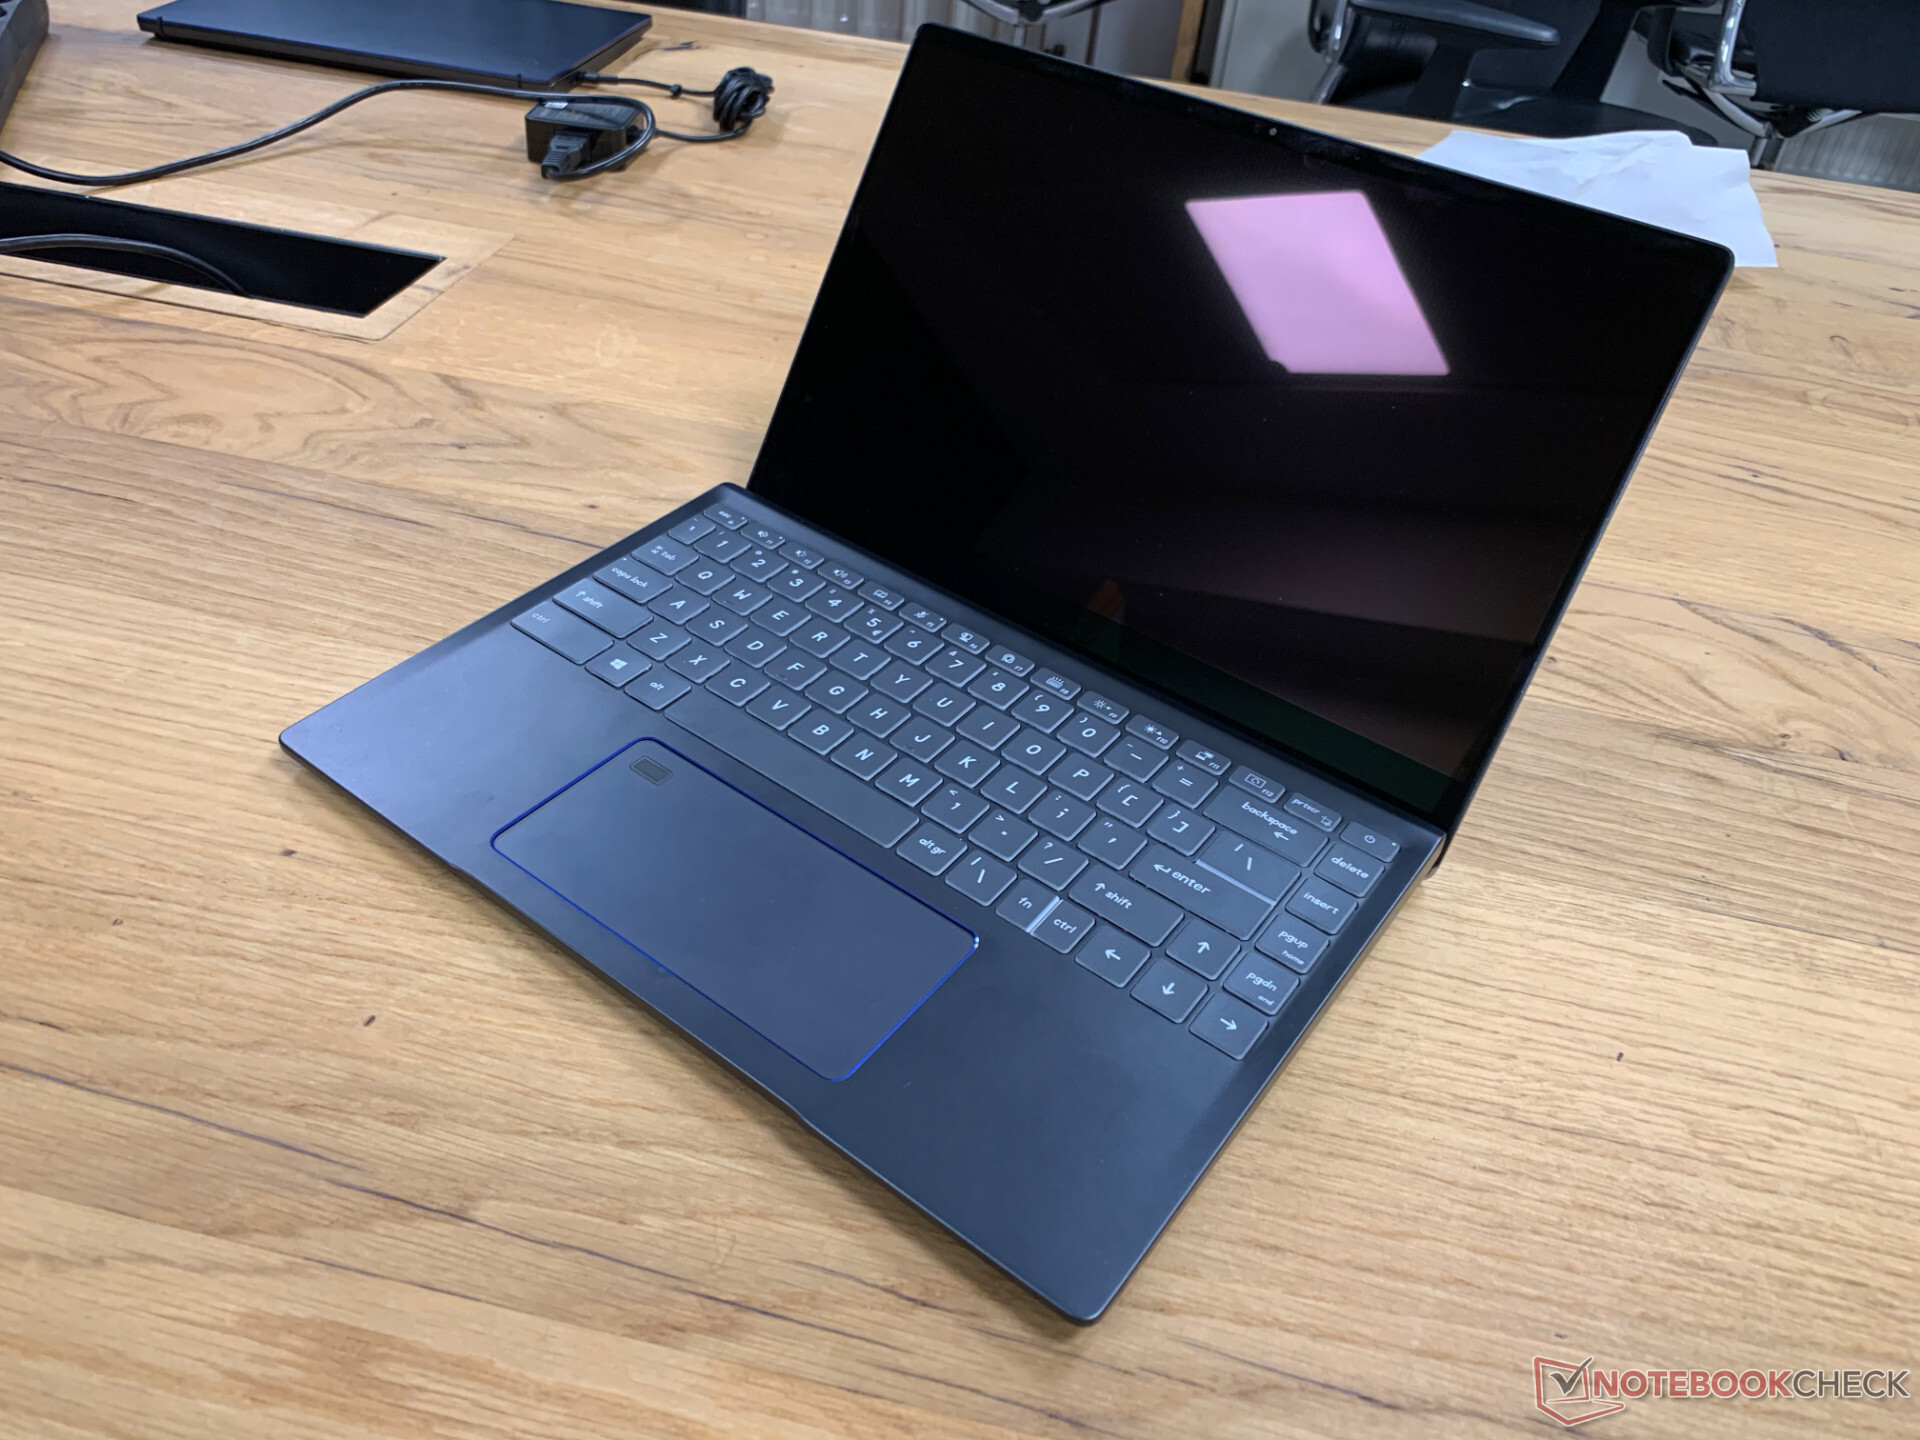
Abbiamo testato un "Intel Reference Design System", che è stato costruito per Intel. Si basa sul notebook barebone MSI Prestige 14 (recensito con la Comet Lake), che non sarà disponibile per la vendita al dettaglio. Si tratta di un notebook relativamente sottile di 14", che si solleva leggermente quando si apre lo schermo e aspira l'aria dal fondo. Il rumore della ventola è stato moderato durante i nostri benchmarks. Il telaio in alluminio si è riscaldato abbastanza, ma non è stato troppo male. Purtroppo non ci è stato permesso di pubblicare alcuna foto degli interni.

Abbiamo potuto selezionare tre diversi livelli di prestazioni per i nostri benchmarks:

  1. Batteria migliore: 15 Watt PL1 (carico sostenuto, HWInfo: 14.8 W duarnte Blender) e 54W PL2 (28s carico di picco, HWInfo 54.5W durante Blender)
  2. Prestazioni migliori: 28 Watt PL1 (carico sostenuto, HWInfo: 27.9 W durante Blender) e 54W PL2 (28s carico di picco, HWInfo: 54 W durante Blender)
  3. Prestazioni migliori: 28 Watt o 36 Watt con Dynamic Tuning (carico sostenuto, HWInfo 35.3W durante Blender) e 54 W PL2 (HWInfo 54.7 W durante Blender)

Intel ha raccomandato la modalità "Better Performance", perché probabilmente sarà la più rappresentativa per le unità di produzione. Abbiamo quindi eseguito la maggior parte dei nostri test con 28W e abbiamo controllato solo i singoli test con 15W e 36W (Dynamic Tuning). Il Dynamic Tuning mantiene i 36W PL1 fino a quando le temperature interne e le temperature "superficiale" non diventano troppo alte, altrimenti scenderà a 28W.

Intel Reference Design Laptop 28W
Processore
Intel Core i7-1185G7 4 x 3 - 4.8 GHz, 28 W PL2 / Short Burst, 56 W PL1 / Sustained, Tiger Lake-UP3
Scheda grafica
Memoria
16 GB 
, LDDR4X-4266 Dual Channel
Schermo
14.00 pollici 16:9, 1920 x 1080 pixel 157 PPI, lucido: si, 60 Hz
Harddisk
Samsung PM981a MZVLB1T0HBLR, 1024 GB 
Porte di connessione
2 Thunderbolt
Rete
Intel Wi-Fi 6 AX201 (a/b/g/h/n = Wi-Fi 4/ac = Wi-Fi 5/ax = Wi-Fi 6/)
Sistema Operativo
Microsoft Windows 10 Pro 64 Bit
Prezzo
0 Euro
Nota: il produttore potrebbe usare componenti di fornitori diversi pannelli dei diplay, drive o banchi di memoria con specifiche simili.


Prestazioni CPU - Ice Lake con Turbo

Il Core i7-1185G7 che abbiamo testato è il modello di fascia alta per il lancio della generazione Tiger Lake U e offre quattro cores di processore (micro architettura Willow Cove), che possono funzionare fino a 4,8 GHz. Ciò significa che il clock di picco è molto più alto rispetto a Ice Lake e dovrebbe portare a prestazioni più elevate del singolo core. Rispetto agli attuali modelli di punta di AMD, Intel utilizza ancora quattro cores e preferisce utilizzare il chip die per un'unità grafica più potente, oltre al Wi-Fi (parzialmente) integrato e al Thunderbolt 4.

Se guardiamo solo alle prestazioni del processore, c'è un vantaggio impressionante rispetto al vecchio Core i7-1065G7 (come nel Dell XPS 13 9300, per esempio). Rispetto ai veloci processori AMD Renoir, il sistema di test si trova tra i due chip a 8 cores Ryzen 7 4700U e 4800U - impressionante. Le elevate prestazioni del single-core fanno davvero la differenza in questo caso. L'i7-1185G7 può battere tutti i rivali nei test Single-Core Cinebench. Anche un desktop Core i9-10900K o Ryzen 7 3800XT sono leggermente più lenti. Se si guarda ai benchmarks multi-core, come il test Blender, che richiede molto tempo, i chip 8-cores di AMD hanno ancora un grande vantaggio. Tuttavia, Intel può colmare il divario rispetto alla CPU Ryzen 5 4500U 6-cores, che mostra ancora una volta il potenziale di prestazioni dei quattro cores di Tiger Lake.

Rispetto ai chip Comet lake-U e alla serie H di Intel, Tiger Lake si comporta ancora una volta molto bene. La serie U è chiaramente battuta - nonostante i 6 cores (che difficilmente ripagano a causa della bassa dotazione di TDP). La serie H con 8 cores vince ancora nei test multi-core, ma i chip quad-core più piccoli come il Core i5-10300H vengono battuti.

Performance Rating - Percent
Media Intel Core i9-10980HK
 
84.4 pt
Media Intel Core i7-10875H
 
78.9 pt
Lenovo Yoga Slim 7-14ARE
AMD Ryzen 7 4800U
74.7 pt
Intel Reference Design Laptop 35W Dynamic Tuning -4!
Intel Core i7-1185G7
72.9 pt
Media Intel Core i7-10750H
 
69 pt
Intel Reference Design Laptop 28W
Intel Core i7-1185G7
62.7 pt
Media AMD Ryzen 7 4700U
 
61.9 pt
Media Intel Core i7-1165G7
 
58.2 pt
Xiaomi RedmiBook 16 R5
AMD Ryzen 5 4500U
56.8 pt
Media Intel Core i5-10300H
 
54.1 pt
Media AMD Ryzen 5 4500U
 
53.9 pt
Intel Reference Design Laptop 15W
Intel Core i7-1185G7
52.7 pt
Media Intel Core i7-10710U
 
52.7 pt
Dell XPS 13 9300 4K UHD
Intel Core i7-1065G7
48.4 pt
Media Intel Core i7-10810U
 
48.4 pt
Media Intel Core i7-1065G7
 
41.9 pt
Media AMD Ryzen 3 4300U
 
40.6 pt
Cinebench R20
CPU (Multi Core)
Media Intel Core i9-10980HK
  (3526 - 4487, n=13)
3933 Points +78%
Media Intel Core i7-10875H
  (1986 - 4176, n=32)
3455 Points +56%
Lenovo Yoga Slim 7-14ARE
AMD Ryzen 7 4800U
3213 Points +45%
Media Intel Core i7-10750H
  (1749 - 3325, n=43)
2848 Points +29%
Media AMD Ryzen 7 4700U
  (2401 - 3095, n=9)
2698 Points +22%
Xiaomi RedmiBook 16 R5
AMD Ryzen 5 4500U
2440 Points +10%
Intel Reference Design Laptop 35W Dynamic Tuning
Intel Core i7-1185G7
2402 Points +8%
Media AMD Ryzen 5 4500U
  (1843 - 2530, n=13)
2236 Points +1%
Intel Reference Design Laptop 28W
Intel Core i7-1185G7
2214 Points
Media Intel Core i5-10300H
  (1397 - 2240, n=15)
2046 Points -8%
Media Intel Core i7-10710U
  (1181 - 2598, n=5)
2012 Points -9%
Media Intel Core i7-1165G7
  (1060 - 2657, n=81)
1967 Points -11%
Media Intel Core i7-10810U
  (1498 - 2344, n=5)
1778 Points -20%
Intel Reference Design Laptop 15W
Intel Core i7-1185G7
1560 Points -30%
Media AMD Ryzen 3 4300U
  (1432 - 1609, n=3)
1537 Points -31%
Media Intel Core i7-1065G7
  (1081 - 2024, n=31)
1510 Points -32%
Dell XPS 13 9300 4K UHD
Intel Core i7-1065G7
1396 Points -37%
CPU (Single Core)
Intel Reference Design Laptop 35W Dynamic Tuning
Intel Core i7-1185G7
593 Points +2%
Intel Reference Design Laptop 28W
Intel Core i7-1185G7
580 Points
Intel Reference Design Laptop 15W
Intel Core i7-1185G7
553 Points -5%
Media Intel Core i7-1165G7
  (442 - 589, n=81)
552 Points -5%
Media Intel Core i9-10980HK
  (465 - 507, n=13)
488 Points -16%
Media Intel Core i7-10875H
  (430 - 524, n=32)
486 Points -16%
Lenovo Yoga Slim 7-14ARE
AMD Ryzen 7 4800U
474 Points -18%
Media Intel Core i7-10750H
  (431 - 504, n=43)
473 Points -18%
Media AMD Ryzen 7 4700U
  (448 - 478, n=9)
467 Points -19%
Media Intel Core i7-10710U
  (429 - 480, n=4)
457 Points -21%
Dell XPS 13 9300 4K UHD
Intel Core i7-1065G7
453 Points -22%
Xiaomi RedmiBook 16 R5
AMD Ryzen 5 4500U
451 Points -22%
Media AMD Ryzen 5 4500U
  (424 - 453, n=12)
446 Points -23%
Media Intel Core i5-10300H
  (312 - 470, n=15)
443 Points -24%
Media Intel Core i7-1065G7
  (358 - 474, n=31)
438 Points -24%
Media Intel Core i7-10810U
  (396 - 447, n=5)
425 Points -27%
Media AMD Ryzen 3 4300U
  (412 - 427, n=3)
420 Points -28%
Blender - v2.79 BMW27 CPU
Media AMD Ryzen 3 4300U
  (868 - 907, n=2)
888 Seconds * -63%
Media Intel Core i7-1065G7
  (675 - 1650, n=23)
882 Seconds * -62%
Intel Reference Design Laptop 15W
Intel Core i7-1185G7
745 Seconds * -37%
Media Intel Core i7-10810U
  (571 - 875, n=5)
689 Seconds * -26%
Dell XPS 13 9300 4K UHD
Intel Core i7-1065G7
681 Seconds * -25%
Media Intel Core i7-10710U
  (468 - 892, n=4)
649 Seconds * -19%
Media Intel Core i7-1165G7
  (468 - 1138, n=80)
618 Seconds * -13%
Media AMD Ryzen 5 4500U
  (533 - 748, n=11)
603 Seconds * -11%
Intel Reference Design Laptop 28W
Intel Core i7-1185G7
545 Seconds *
Xiaomi RedmiBook 16 R5
AMD Ryzen 5 4500U
533 Seconds * +2%
Media Intel Core i5-10300H
  (479 - 555, n=14)
515 Seconds * +6%
Intel Reference Design Laptop 35W Dynamic Tuning
Intel Core i7-1185G7
513 Seconds * +6%
Media AMD Ryzen 7 4700U
  (407 - 537, n=8)
480 Seconds * +12%
Media Intel Core i7-10750H
  (322 - 587, n=43)
389 Seconds * +29%
Media Intel Core i7-10875H
  (259 - 535, n=30)
327 Seconds * +40%
Lenovo Yoga Slim 7-14ARE
AMD Ryzen 7 4800U
322 Seconds * +41%
Media Intel Core i9-10980HK
  (239 - 299, n=13)
277 Seconds * +49%
Cinebench R15
CPU Single 64Bit
Intel Reference Design Laptop 35W Dynamic Tuning
Intel Core i7-1185G7
230 Points +3%
Intel Reference Design Laptop 28W
Intel Core i7-1185G7
224 Points
Intel Reference Design Laptop 15W
Intel Core i7-1185G7
216 Points -4%
Media Intel Core i7-1165G7
  (115 - 230, n=78)
212 Points -5%
Media Intel Core i9-10980HK
  (198 - 219, n=15)
207 Points -8%
Media Intel Core i7-10875H
  (190 - 220, n=37)
204 Points -9%
Media Intel Core i7-10750H
  (184 - 213, n=45)
196.7 Points -12%
Lenovo Yoga Slim 7-14ARE
AMD Ryzen 7 4800U
182 Points -19%
Dell XPS 13 9300 4K UHD
Intel Core i7-1065G7
182 Points -19%
Media AMD Ryzen 7 4700U
  (176 - 185, n=11)
180.3 Points -20%
Xiaomi RedmiBook 16 R5
AMD Ryzen 5 4500U
176 Points -21%
Media Intel Core i7-10810U
  (161 - 183, n=5)
175.6 Points -22%
Media Intel Core i7-10710U
  (138 - 194, n=8)
174.9 Points -22%
Media Intel Core i7-1065G7
  (141 - 190, n=35)
174.2 Points -22%
Media Intel Core i5-10300H
  (108 - 194, n=17)
174 Points -22%
Media AMD Ryzen 5 4500U
  (156 - 177, n=13)
172.8 Points -23%
Media AMD Ryzen 3 4300U
  (162.8 - 165, n=2)
163.9 Points -27%
CPU Multi 64Bit
Media Intel Core i9-10980HK
  (1606 - 1862, n=15)
1739 Points +80%
Lenovo Yoga Slim 7-14ARE
AMD Ryzen 7 4800U
1639 (1505.17min - 1639.01max) Points +70%
Media Intel Core i7-10875H
  (1003 - 1833, n=38)
1554 Points +61%
Media Intel Core i7-10750H
  (804 - 1418, n=50)
1263 Points +31%
Media AMD Ryzen 7 4700U
  (801 - 1253, n=12)
1091 Points +13%
Intel Reference Design Laptop 35W Dynamic Tuning
Intel Core i7-1185G7
1066 Points +10%
Xiaomi RedmiBook 16 R5
AMD Ryzen 5 4500U
966 (866.27min - 966.32max) Points 0%
Intel Reference Design Laptop 28W
Intel Core i7-1185G7
966 Points
Intel Reference Design Laptop 28W
Intel Core i7-1185G7
866 (754.55min - 866.1max) Points -10%
Media Intel Core i7-10710U
  (513 - 1113, n=8)
957 Points -1%
Media AMD Ryzen 5 4500U
  (715 - 1007, n=18)
896 Points -7%
Media Intel Core i7-1165G7
  (553 - 1027, n=86)
846 Points -12%
Media Intel Core i5-10300H
  (536 - 921, n=17)
825 Points -15%
Media Intel Core i7-10810U
  (623 - 1064, n=4)
799 Points -17%
Dell XPS 13 9300 4K UHD
Intel Core i7-1065G7
760 (489.25min - 610.17max) Points -21%
Intel Reference Design Laptop 15W
Intel Core i7-1185G7
702 Points -27%
Intel Reference Design Laptop 15W
Intel Core i7-1185G7
628 (619.66min - 627.69max) Points -35%
Media Intel Core i7-1065G7
  (288 - 836, n=36)
648 Points -33%
Media AMD Ryzen 3 4300U
  (545 - 580, n=2)
563 Points -42%
7-Zip 18.03
7z b 4 -mmt1
Media Intel Core i9-10980HK
  (5081 - 5542, n=13)
5386 MIPS 0%
Intel Reference Design Laptop 28W
Intel Core i7-1185G7
5368 MIPS
Media Intel Core i7-10875H
  (5071 - 5780, n=31)
5360 MIPS 0%
Media Intel Core i7-1165G7
  (4478 - 5507, n=80)
5182 MIPS -3%
Intel Reference Design Laptop 15W
Intel Core i7-1185G7
5153 MIPS -4%
Media Intel Core i7-10750H
  (4504 - 5470, n=43)
5114 MIPS -5%
Media Intel Core i5-10300H
  (2945 - 4956, n=14)
4704 MIPS -12%
Media Intel Core i7-10710U
  (4425 - 4727, n=4)
4609 MIPS -14%
Media Intel Core i7-10810U
  (4398 - 4794, n=5)
4561 MIPS -15%
Dell XPS 13 9300 4K UHD
Intel Core i7-1065G7
4438 MIPS -17%
Lenovo Yoga Slim 7-14ARE
AMD Ryzen 7 4800U
4436 MIPS -17%
Media AMD Ryzen 7 4700U
  (4208 - 4470, n=8)
4361 MIPS -19%
Xiaomi RedmiBook 16 R5
AMD Ryzen 5 4500U
4321 MIPS -20%
Media AMD Ryzen 5 4500U
  (4235 - 4338, n=11)
4290 MIPS -20%
Media Intel Core i7-1065G7
  (3289 - 4589, n=24)
4284 MIPS -20%
Media AMD Ryzen 3 4300U
  (4014 - 4113, n=2)
4064 MIPS -24%
7z b 4
Media Intel Core i9-10980HK
  (43786 - 49275, n=13)
47126 MIPS +88%
Lenovo Yoga Slim 7-14ARE
AMD Ryzen 7 4800U
44804 MIPS +79%
Media Intel Core i7-10875H
  (29844 - 49562, n=31)
43117 MIPS +72%
Media Intel Core i7-10750H
  (26040 - 37345, n=43)
33946 MIPS +35%
Media AMD Ryzen 7 4700U
  (26652 - 33890, n=8)
30273 MIPS +21%
Xiaomi RedmiBook 16 R5
AMD Ryzen 5 4500U
25891 MIPS +3%
Intel Reference Design Laptop 28W
Intel Core i7-1185G7
25086 MIPS
Media AMD Ryzen 5 4500U
  (22466 - 25891, n=11)
24384 MIPS -3%
Media Intel Core i7-10710U
  (16713 - 29948, n=4)
23912 MIPS -5%
Media Intel Core i5-10300H
  (15146 - 24841, n=14)
23295 MIPS -7%
Media Intel Core i7-1165G7
  (15347 - 27405, n=80)
22935 MIPS -9%
Media Intel Core i7-10810U
  (16072 - 25244, n=5)
21290 MIPS -15%
Dell XPS 13 9300 4K UHD
Intel Core i7-1065G7
21139 MIPS -16%
Intel Reference Design Laptop 15W
Intel Core i7-1185G7
18936 MIPS -25%
Media Intel Core i7-1065G7
  (10406 - 22898, n=24)
17024 MIPS -32%
Media AMD Ryzen 3 4300U
  (15043 - 16605, n=2)
15824 MIPS -37%
HWBOT x265 Benchmark v2.2 - 4k Preset
Media Intel Core i9-10980HK
  (12 - 14.6, n=13)
13 fps +101%
Media Intel Core i7-10875H
  (7.27 - 14.1, n=27)
11.7 fps +81%
Lenovo Yoga Slim 7-14ARE
AMD Ryzen 7 4800U
10.77 fps +67%
Media Intel Core i7-10750H
  (5.54 - 11.6, n=43)
9.61 fps +49%
Media AMD Ryzen 7 4700U
  (6.79 - 10.1, n=8)
8.44 fps +31%
Xiaomi RedmiBook 16 R5
AMD Ryzen 5 4500U
7.16 fps +11%
Media Intel Core i5-10300H
  (6.13 - 7.78, n=14)
7.1 fps +10%
Media AMD Ryzen 5 4500U
  (5.86 - 7.33, n=10)
6.8 fps +5%
Intel Reference Design Laptop 28W
Intel Core i7-1185G7
6.46 fps
Media Intel Core i7-1165G7
  (1.39 - 8.47, n=80)
6.3 fps -2%
Dell XPS 13 9300 4K UHD
Intel Core i7-1065G7
6.08 fps -6%
Media Intel Core i7-10710U
  (4.2 - 7.95, n=4)
5.94 fps -8%
Media Intel Core i7-10810U
  (3.81 - 6.45, n=5)
5.31 fps -18%
Intel Reference Design Laptop 15W
Intel Core i7-1185G7
5.02 fps -22%
Media AMD Ryzen 3 4300U
  (4.37 - 5.36, n=2)
4.87 fps -25%
Media Intel Core i7-1065G7
  (2.2 - 6.38, n=22)
4.58 fps -29%
R Benchmark 2.5 - Overall mean
Media Intel Core i7-1065G7
  (0.661 - 0.798, n=18)
0.708 sec * -24%
Dell XPS 13 9300 4K UHD
Intel Core i7-1065G7
0.682 sec * -19%
Media Intel Core i7-10810U
  (0.651 - 0.717, n=5)
0.682 sec * -19%
Media Intel Core i5-10300H
  (0.625 - 1.088, n=14)
0.68 sec * -19%
Media AMD Ryzen 3 4300U
  (0.652 - 0.686, n=2)
0.669 sec * -17%
Media Intel Core i7-10710U
  (0.649 - 0.674, n=2)
0.662 sec * -16%
Media AMD Ryzen 5 4500U
  (0.614 - 0.654, n=10)
0.636 sec * -11%
Xiaomi RedmiBook 16 R5
AMD Ryzen 5 4500U
0.634 sec * -11%
Media AMD Ryzen 7 4700U
  (0.598 - 0.651, n=8)
0.618 sec * -8%
Lenovo Yoga Slim 7-14ARE
AMD Ryzen 7 4800U
0.613 sec * -7%
Media Intel Core i7-10750H
  (0.578 - 0.708, n=42)
0.611 sec * -7%
Media Intel Core i7-1165G7
  (0.552 - 1.002, n=80)
0.594 sec * -4%
Media Intel Core i7-10875H
  (0.546 - 0.662, n=29)
0.582 sec * -2%
Intel Reference Design Laptop 15W
Intel Core i7-1185G7
0.579 sec * -1%
Media Intel Core i9-10980HK
  (0.561 - 0.596, n=13)
0.576 sec * -1%
Intel Reference Design Laptop 28W
Intel Core i7-1185G7
0.571 sec *

* ... Meglio usare valori piccoli

Le prestazioni sostenute sono stabili sul portatile di riferimento di Intel, e non vediamo il solito calo dopo che il benchmark iniziale funziona in modalità 28W o 15W.

0501001502002503003504004505005506006507007508008509009501000105011001150120012501300135014001450150015501600Tooltip
Intel Reference Design Laptop 28W Intel Core i7-1185G7, Intel Core i7-1185G7: Ø853 (754.55-866.1)
Lenovo Yoga Slim 7-14ARE AMD Ryzen 7 4800U, AMD Ryzen 7 4800U: Ø1522 (1505.17-1639.01)
Dell XPS 13 9300 4K UHD Intel Core i7-1065G7, Intel Core i7-1065G7: Ø573 (480.43-760.86)
Intel Reference Design Laptop 15W Intel Core i7-1185G7, Intel Core i7-1185G7: Ø625 (619.66-627.69)

Come abbiamo già riferito durante il lancio, la Tiger Lake non utilizza più limiti fissi di TDP, ma i produttori possono scegliere tra 15 e 28W (a seconda della soluzione di raffreddamento). Compreso il Dynamic Tuning, la CPU può anche consumare fino a 36W per periodi più lunghi. I nostri benchmarks mostrano chiaramente che queste impostazioni TDP hanno un effetto massiccio sulle prestazioni. Le prestazioni single-core non ne risentono molto, perché il limite dei 15W è già sufficiente per i clock elevati, ma le prestazioni della CPU diminuiranno rispettivamente del 27% o del 31% rispetto all'impostazione massima. Ciò significa che ci saranno ancora notevoli differenze di prestazioni tra un notebook e l'altro. Non si può semplicemente guardare il nome del modello come i7-1185G7 per conoscere le prestazioni che si otterranno.

Cinebench R20
CPU (Multi Core)
Media Intel Core i9-10980HK
  (3526 - 4487, n=13)
3933 Points +78%
Media Intel Core i7-10875H
  (1986 - 4176, n=32)
3455 Points +56%
Lenovo Yoga Slim 7-14ARE
AMD Ryzen 7 4800U, AMD Radeon RX Vega 8 (Ryzen 4000/5000)
3213 Points +45%
Media AMD Ryzen 7 4800U
  (2943 - 3306, n=4)
3178 Points +44%
Media AMD Ryzen 7 4700U
  (2401 - 3095, n=9)
2698 Points +22%
Media AMD Ryzen 5 4600U
  (2544 - 2796, n=3)
2628 Points +19%
Xiaomi RedmiBook 16 R5
AMD Ryzen 5 4500U, AMD Radeon RX Vega 6 (Ryzen 4000/5000)
2440 Points +10%
Intel Reference Design Laptop 35W Dynamic Tuning
Intel Core i7-1185G7, Intel Iris Xe Graphics G7 96EUs
2402 Points +8%
Media AMD Ryzen 5 4500U
  (1843 - 2530, n=13)
2236 Points +1%
Intel Reference Design Laptop 28W
Intel Core i7-1185G7, Intel Iris Xe Graphics G7 96EUs
2214 Points
Media Intel Core i5-10300H
  (1397 - 2240, n=15)
2046 Points -8%
Media Intel Core i7-1165G7
  (1060 - 2657, n=81)
1967 Points -11%
Intel Reference Design Laptop 15W
Intel Core i7-1185G7, Intel Iris Xe Graphics G7 96EUs
1560 Points -30%
Media AMD Ryzen 3 4300U
  (1432 - 1609, n=3)
1537 Points -31%
CPU (Single Core)
Intel Reference Design Laptop 35W Dynamic Tuning
Intel Core i7-1185G7, Intel Iris Xe Graphics G7 96EUs
593 Points +2%
Intel Reference Design Laptop 28W
Intel Core i7-1185G7, Intel Iris Xe Graphics G7 96EUs
580 Points
Intel Reference Design Laptop 15W
Intel Core i7-1185G7, Intel Iris Xe Graphics G7 96EUs
553 Points -5%
Media Intel Core i7-1165G7
  (442 - 589, n=81)
552 Points -5%
Media Intel Core i9-10980HK
  (465 - 507, n=13)
488 Points -16%
Media Intel Core i7-10875H
  (430 - 524, n=32)
486 Points -16%
Media AMD Ryzen 7 4800U
  (474 - 488, n=4)
481 Points -17%
Lenovo Yoga Slim 7-14ARE
AMD Ryzen 7 4800U, AMD Radeon RX Vega 8 (Ryzen 4000/5000)
474 Points -18%
Media AMD Ryzen 7 4700U
  (448 - 478, n=9)
467 Points -19%
Xiaomi RedmiBook 16 R5
AMD Ryzen 5 4500U, AMD Radeon RX Vega 6 (Ryzen 4000/5000)
451 Points -22%
Media AMD Ryzen 5 4600U
  (447 - 453, n=3)
449 Points -23%
Media AMD Ryzen 5 4500U
  (424 - 453, n=12)
446 Points -23%
Media Intel Core i5-10300H
  (312 - 470, n=15)
443 Points -24%
Media AMD Ryzen 3 4300U
  (412 - 427, n=3)
420 Points -28%
Blender - v2.79 BMW27 CPU
Media AMD Ryzen 3 4300U
  (868 - 907, n=2)
888 Seconds * -63%
Intel Reference Design Laptop 15W
Intel Core i7-1185G7, Intel Iris Xe Graphics G7 96EUs
745 Seconds * -37%
Media Intel Core i7-1165G7
  (468 - 1138, n=80)
618 Seconds * -13%
Media AMD Ryzen 5 4500U
  (533 - 748, n=11)
603 Seconds * -11%
Intel Reference Design Laptop 28W
Intel Core i7-1185G7, Intel Iris Xe Graphics G7 96EUs
545 Seconds *
Xiaomi RedmiBook 16 R5
AMD Ryzen 5 4500U, AMD Radeon RX Vega 6 (Ryzen 4000/5000)
533 Seconds * +2%
Media Intel Core i5-10300H
  (479 - 555, n=14)
515 Seconds * +6%
Intel Reference Design Laptop 35W Dynamic Tuning
Intel Core i7-1185G7, Intel Iris Xe Graphics G7 96EUs
513 Seconds * +6%
Media AMD Ryzen 7 4700U
  (407 - 537, n=8)
480 Seconds * +12%
Media AMD Ryzen 5 4600U
  ()
402 Seconds * +26%
Media AMD Ryzen 7 4800U
  (322 - 374, n=3)
345 Seconds * +37%
Media Intel Core i7-10875H
  (259 - 535, n=30)
327 Seconds * +40%
Lenovo Yoga Slim 7-14ARE
AMD Ryzen 7 4800U, AMD Radeon RX Vega 8 (Ryzen 4000/5000)
322 Seconds * +41%
Media Intel Core i9-10980HK
  (239 - 299, n=13)
277 Seconds * +49%

* ... Meglio usare valori piccoli

Prestazioni con le Applicazioni - PCMark 10

Usiamo ancora il normale PCMark 10 per le prestazioni con le applicazioni, che includono software free come LibreOffice, GIMP, Firefox e Chromium. Grazie al veloce SSD PM981a da 1TB di Samsung, l'MSI barebone con Tiger Lake ottime prestazioni. Il sistema resta solo un po' indietro nella parte di Content Creation, ma gli altri due sub test producono punteggi ancora più alti rispetto ai veloci notebook gaming con CPU CML-H a 8 cores (i9-10980HK). Il punteggio complessivo è più basso sul sistema i7-1185G7, ma è nettamente superiore al Lenovo Yoga Slim 7 con CPU Ryzen 7 4800U. Il risultato è un indicatore di quanto bene i sistemi basati su Tiger Lake dovrebbero (o potrebbero, rispettivamente) gestire le attività d'ufficio e produttive.

PCMark 10 / Score
Media Intel Core i9-10980HK
  (5277 - 6988, n=12)
6288 Points +13%
Media Intel Core i7-10875H
  (4884 - 6739, n=24)
5970 Points +7%
Intel Reference Design Laptop 28W
Intel Core i7-1185G7, Intel Iris Xe Graphics G7 96EUs, Samsung PM981a MZVLB1T0HBLR
5561 Points
Lenovo Yoga Slim 7-14ARE
AMD Ryzen 7 4800U, AMD Radeon RX Vega 8 (Ryzen 4000/5000), Samsung SSD PM981a MZVLB512HBJQ
5383 Points -3%
Media AMD Ryzen 7 4800U
  (5233 - 5383, n=3)
5291 Points -5%
Media Intel Core i7-1165G7
  (4531 - 5931, n=72)
5070 Points -9%
Media AMD Ryzen 7 4700U
  (4527 - 5307, n=8)
4898 Points -12%
Xiaomi RedmiBook 16 R5
AMD Ryzen 5 4500U, AMD Radeon RX Vega 6 (Ryzen 4000/5000), Samsung PM881 MZNLH512HALU-0000/07
4784 Points -14%
Media AMD Ryzen 5 4600U
  ()
4772 Points -14%
Media Intel Core i5-10300H
  (4077 - 5301, n=13)
4748 Points -15%
Media AMD Ryzen 5 4500U
  (4393 - 5024, n=12)
4683 Points -16%
Dell XPS 13 9300 4K UHD
Intel Core i7-1065G7, Intel Iris Plus Graphics G7 (Ice Lake 64 EU), Intel SSDPEMKF512G8 NVMe SSD
4451 Points -20%
Media AMD Ryzen 3 4300U
  ()
4322 Points -22%
PCMark 10 / Essentials
Intel Reference Design Laptop 28W
Intel Core i7-1185G7, Intel Iris Xe Graphics G7 96EUs, Samsung PM981a MZVLB1T0HBLR
10484 Points
Media Intel Core i9-10980HK
  (9312 - 10829, n=12)
9798 Points -7%
Media Intel Core i7-1165G7
  (8026 - 11505, n=72)
9763 Points -7%
Lenovo Yoga Slim 7-14ARE
AMD Ryzen 7 4800U, AMD Radeon RX Vega 8 (Ryzen 4000/5000), Samsung SSD PM981a MZVLB512HBJQ
9637 Points -8%
Media Intel Core i7-10875H
  (7547 - 10458, n=24)
9567 Points -9%
Media AMD Ryzen 7 4800U
  (9188 - 9637, n=3)
9403 Points -10%
Media AMD Ryzen 5 4600U
  ()
9352 Points -11%
Dell XPS 13 9300 4K UHD
Intel Core i7-1065G7, Intel Iris Plus Graphics G7 (Ice Lake 64 EU), Intel SSDPEMKF512G8 NVMe SSD
9096 Points -13%
Media AMD Ryzen 7 4700U
  (8303 - 9559, n=8)
9009 Points -14%
Xiaomi RedmiBook 16 R5
AMD Ryzen 5 4500U, AMD Radeon RX Vega 6 (Ryzen 4000/5000), Samsung PM881 MZNLH512HALU-0000/07
8905 Points -15%
Media Intel Core i5-10300H
  (7148 - 9874, n=13)
8714 Points -17%
Media AMD Ryzen 5 4500U
  (8204 - 9124, n=11)
8669 Points -17%
Media AMD Ryzen 3 4300U
  ()
8600 Points -18%
PCMark 10 / Productivity
Intel Reference Design Laptop 28W
Intel Core i7-1185G7, Intel Iris Xe Graphics G7 96EUs, Samsung PM981a MZVLB1T0HBLR
8770 Points
Media Intel Core i9-10980HK
  (7641 - 9337, n=12)
8502 Points -3%
Media Intel Core i7-10875H
  (7534 - 9070, n=24)
8179 Points -7%
Media AMD Ryzen 7 4800U
  (7631 - 8091, n=3)
7879 Points -10%
Lenovo Yoga Slim 7-14ARE
AMD Ryzen 7 4800U, AMD Radeon RX Vega 8 (Ryzen 4000/5000), Samsung SSD PM981a MZVLB512HBJQ
7631 Points -13%
Media Intel Core i5-10300H
  (6732 - 8058, n=13)
7374 Points -16%
Media Intel Core i7-1165G7
  (5570 - 9317, n=72)
7252 Points -17%
Media AMD Ryzen 7 4700U
  (5348 - 7945, n=8)
7201 Points -18%
Xiaomi RedmiBook 16 R5
AMD Ryzen 5 4500U, AMD Radeon RX Vega 6 (Ryzen 4000/5000), Samsung PM881 MZNLH512HALU-0000/07
7096 Points -19%
Media AMD Ryzen 5 4500U
  (6400 - 7752, n=11)
6987 Points -20%
Dell XPS 13 9300 4K UHD
Intel Core i7-1065G7, Intel Iris Plus Graphics G7 (Ice Lake 64 EU), Intel SSDPEMKF512G8 NVMe SSD
6912 Points -21%
Media AMD Ryzen 3 4300U
  ()
6489 Points -26%
Media AMD Ryzen 5 4600U
  ()
6230 Points -29%
PCMark 10 / Digital Content Creation
Media Intel Core i9-10980HK
  (5177 - 10217, n=12)
8238 Points +62%
Media Intel Core i7-10875H
  (4563 - 9448, n=24)
7517 Points +48%
Lenovo Yoga Slim 7-14ARE
AMD Ryzen 7 4800U, AMD Radeon RX Vega 8 (Ryzen 4000/5000), Samsung SSD PM981a MZVLB512HBJQ
5758 Points +13%
Media AMD Ryzen 7 4800U
  (5123 - 5758, n=3)
5434 Points +7%
Intel Reference Design Laptop 28W
Intel Core i7-1185G7, Intel Iris Xe Graphics G7 96EUs, Samsung PM981a MZVLB1T0HBLR
5075 Points
Media AMD Ryzen 5 4600U
  ()
5062 Points 0%
Media Intel Core i7-1165G7
  (4083 - 6957, n=72)
5045 Points -1%
Media AMD Ryzen 7 4700U
  (4459 - 5495, n=8)
4947 Points -3%
Xiaomi RedmiBook 16 R5
AMD Ryzen 5 4500U, AMD Radeon RX Vega 6 (Ryzen 4000/5000), Samsung PM881 MZNLH512HALU-0000/07
4704 Points -7%
Media Intel Core i5-10300H
  (2928 - 6003, n=13)
4621 Points -9%
Media AMD Ryzen 5 4500U
  (4189 - 4808, n=11)
4517 Points -11%
Media AMD Ryzen 3 4300U
  ()
3926 Points -23%
Dell XPS 13 9300 4K UHD
Intel Core i7-1065G7, Intel Iris Plus Graphics G7 (Ice Lake 64 EU), Intel SSDPEMKF512G8 NVMe SSD
3807 Points -25%

Prestazioni GPU - L'architettura Xe promette prestazioni elevate

Prestazioni elevate dell'Iris Xe nei tests 3DMark

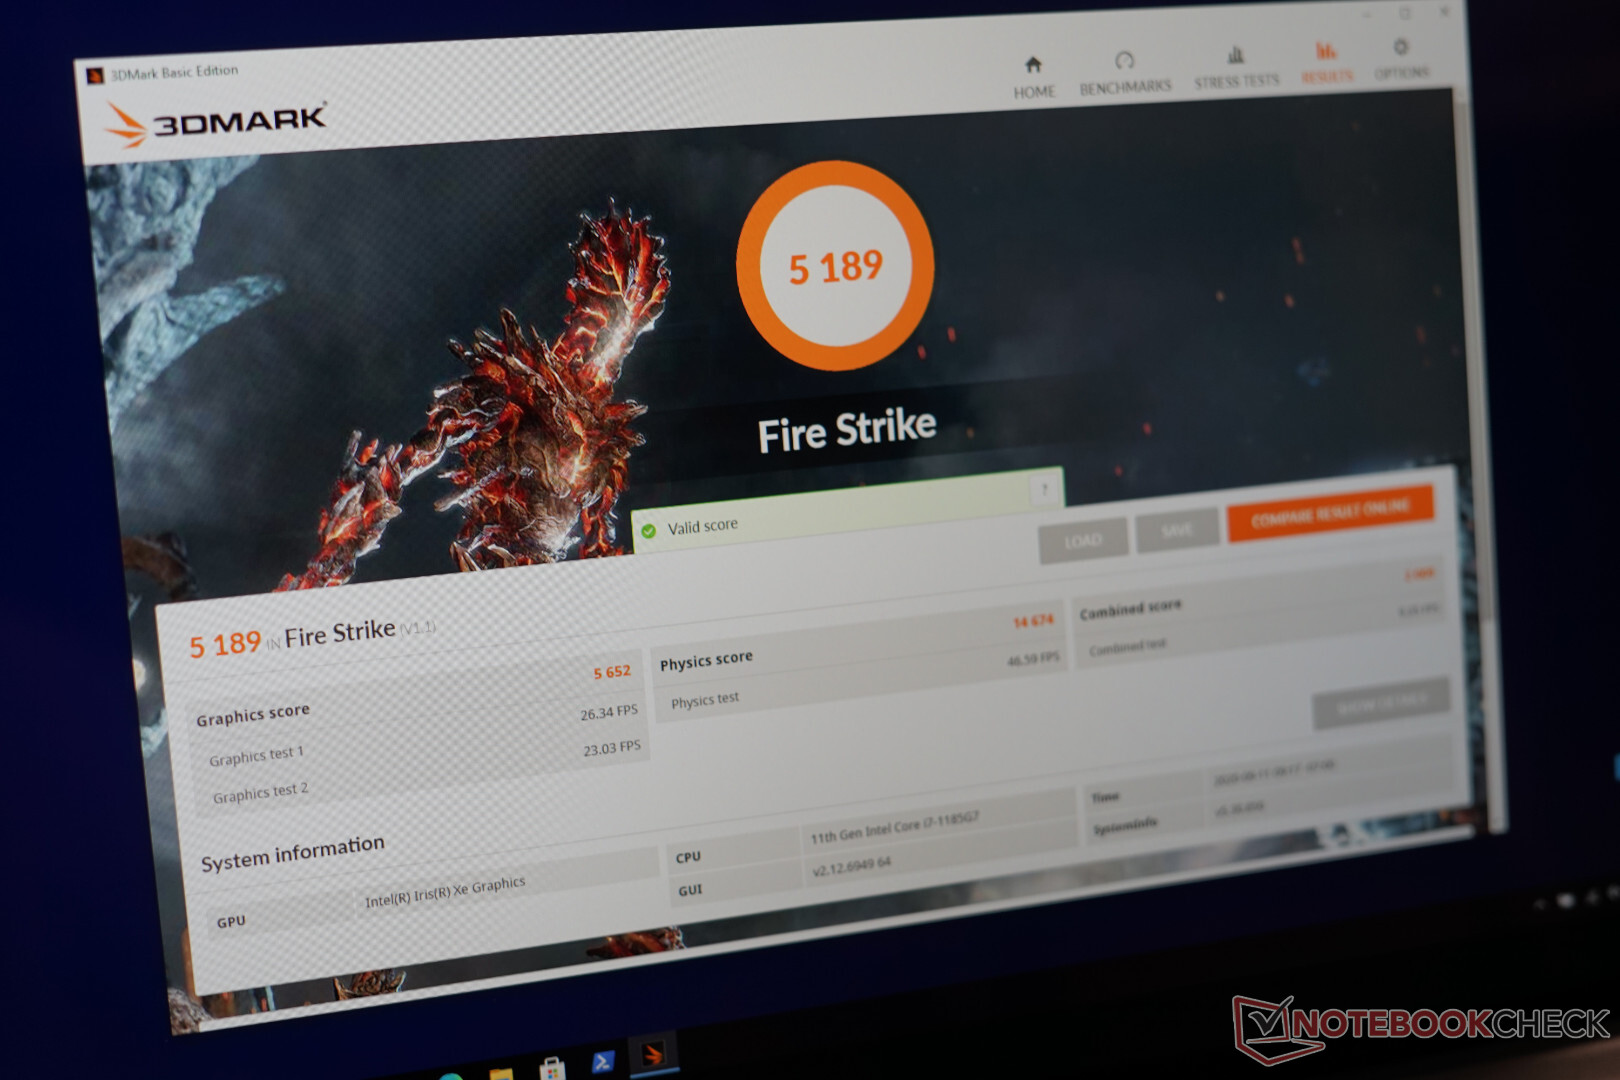
I processori Tiger Lake sono i primi chip con la nuova generazione grafica Xe. Intel lo chiama solo "Intel Iris Xe Graphics" sul nostro Core i7-1185G7, ed è supportato da 16 GB LPDDR4x-4266 di RAM in una configurazione dual-channel. Tuttavia, l'iGPU non ha una propria memoria grafica (ad eccezione delle cache). Intel pubblicizza un grande vantaggio di prestazioni rispetto alla generazione Ice Lake, quindi è un grande miglioramento dopo un lungo periodo di iGPU familiari.

La nuova GPU Xe si comporta estremamente bene nei benchmarks grafici sintetici. È alla pari con una AMD Radeon Pro 560X dedicata nell'Apple MacBook Pro 15 e le iGPU Ryzen più veloci (come la RX Vega 8 nella Ryzen 4000) sono chiaramente battute. Anche le schede grafiche mobili di Nvidia come la GeForce MX350 sono molto più lente e il punteggio è più paragonabile al nuovo MX450.

Le prestazioni di calcolo della GPU in V-Ray non sono così impressionanti, ma sono ancora alla pari con le vecchie GeForce MX250/MX330. Le GPU AMD sono più potenti in questo test.

3DMark
2560x1440 Time Spy Graphics
Media NVIDIA GeForce MX450
  (1086 - 2300, n=16)
1796 Points +11%
Media NVIDIA GeForce GTX 1050 Mobile
  (1416 - 2130, n=11)
1672 Points +3%
Intel Reference Design Laptop 28W
Intel Iris Xe Graphics G7 96EUs, Intel Core i7-1185G7
1618 Points
Media NVIDIA GeForce GTX 1050 Max-Q
  (1596 - 1634, n=2)
1615 Points 0%
Apple MacBook Pro 15 2018 (2.6 GHz, 560X)
AMD Radeon Pro 560X, Intel Core i7-8850H
1614 Points 0%
Intel Reference Design Laptop 35W Dynamic Tuning
Intel Iris Xe Graphics G7 96EUs, Intel Core i7-1185G7
1614 Points 0%
Media NVIDIA GeForce MX350
  (1123 - 1595, n=12)
1322 Points -18%
Lenovo Yoga Slim 7-14ARE
AMD Radeon RX Vega 8 (Ryzen 4000/5000), AMD Ryzen 7 4800U
1173 Points -28%
Media AMD Radeon RX Vega 8 (Ryzen 4000/5000)
  (540 - 1557, n=54)
1156 Points -29%
Media NVIDIA GeForce MX250
  (881 - 1169, n=22)
1070 Points -34%
Media AMD Radeon RX Vega 7
  (496 - 1249, n=57)
991 Points -39%
Media AMD Radeon RX Vega 9
  ()
872 Points -46%
Media AMD Radeon RX Vega 6 (Ryzen 4000/5000)
  (650 - 996, n=22)
821 Points -49%
Xiaomi RedmiBook 16 R5
AMD Radeon RX Vega 6 (Ryzen 4000/5000), AMD Ryzen 5 4500U
783 Points -52%
Media Intel Iris Plus Graphics G7 (Ice Lake 64 EU)
  (526 - 851, n=23)
744 Points -54%
1920x1080 Fire Strike Graphics
Media NVIDIA GeForce GTX 1050 Mobile
  (4935 - 6651, n=43)
6022 Points +7%
Apple MacBook Pro 15 2018 (2.6 GHz, 560X)
AMD Radeon Pro 560X, Intel Core i7-8850H
5699 Points +1%
Media NVIDIA GeForce GTX 1050 Max-Q
  (5616 - 5792, n=4)
5677 Points 0%
Intel Reference Design Laptop 28W
Intel Iris Xe Graphics G7 96EUs, Intel Core i7-1185G7
5652 Points
Media NVIDIA GeForce MX450
  (4336 - 5753, n=17)
4869 Points -14%
Media NVIDIA GeForce MX350
  (3999 - 4656, n=14)
4390 Points -22%
Lenovo Yoga Slim 7-14ARE
AMD Radeon RX Vega 8 (Ryzen 4000/5000), AMD Ryzen 7 4800U
3938 Points -30%
Media AMD Radeon RX Vega 8 (Ryzen 4000/5000)
  (1694 - 5041, n=54)
3676 Points -35%
Media NVIDIA GeForce MX250
  (2939 - 3885, n=29)
3531 Points -38%
Media AMD Radeon RX Vega 7
  (1772 - 4037, n=62)
3189 Points -44%
Media AMD Radeon RX Vega 9
  ()
2789 Points -51%
Media AMD Radeon RX Vega 6 (Ryzen 4000/5000)
  (2122 - 3239, n=23)
2673 Points -53%
Xiaomi RedmiBook 16 R5
AMD Radeon RX Vega 6 (Ryzen 4000/5000), AMD Ryzen 5 4500U
2656 Points -53%
Media Intel Iris Plus Graphics G7 (Ice Lake 64 EU)
  (1418 - 3156, n=27)
2594 Points -54%
Basemark GPU 1.2 - 1920x1080 Vulkan Medium Offscreen
Media NVIDIA GeForce MX450
  ()
235 fps +16%
Intel Reference Design Laptop 28W
Intel Iris Xe Graphics G7 96EUs, Intel Core i7-1185G7
202 (105min, 155P1 - 432max) fps
Apple MacBook Pro 15 2018 (2.6 GHz, 560X)
AMD Radeon Pro 560X, Intel Core i7-8850H
182 (113min, 133P1 - 370max) fps -10%
Apple MacBook Pro 15 2018 (2.6 GHz, 560X)
AMD Radeon Pro 560X, Intel Core i7-8850H
177.5 (107min - 390max) fps -12%
Intel Reference Design Laptop 15W
Intel Iris Xe Graphics G7 96EUs, Intel Core i7-1185G7
172 (89.2min, 133P1 - 403max) fps -15%
Media AMD Radeon RX Vega 8 (Ryzen 4000/5000)
  (76.9 - 289, n=9)
150.5 fps -25%
Media AMD Radeon RX Vega 7
  (104.6 - 289, n=10)
134.4 fps -33%
Media Intel Iris Plus Graphics G7 (Ice Lake 64 EU)
  ()
102 fps -50%
Media AMD Radeon RX Vega 6 (Ryzen 4000/5000)
  (82.6 - 104.6, n=2)
93.6 fps -54%
Xiaomi RedmiBook 16 R5
AMD Radeon RX Vega 6 (Ryzen 4000/5000), AMD Ryzen 5 4500U
82.6 (47.9min, 62.3P1 - 176max) fps -59%
Cinebench R15 - OpenGL 64Bit
Media NVIDIA GeForce MX450
  (84.6 - 150, n=19)
127 fps +19%
Media NVIDIA GeForce MX350
  (97.5 - 140, n=11)
116.7 fps +9%
Media AMD Radeon RX Vega 8 (Ryzen 4000/5000)
  (37.4 - 1714, n=55)
111.1 fps +4%
Intel Reference Design Laptop 28W
Intel Iris Xe Graphics G7 96EUs, Intel Core i7-1185G7
107 fps
Media NVIDIA GeForce GTX 1050 Max-Q
  (64.5 - 119.9, n=4)
100.9 fps -6%
Apple MacBook Pro 15 2018 (2.6 GHz, 560X)
AMD Radeon Pro 560X, Intel Core i7-8850H
98.4 fps -8%
Media NVIDIA GeForce GTX 1050 Mobile
  (0.99 - 122.9, n=41)
97.3 fps -9%
Media NVIDIA GeForce MX250
  (48.5 - 114.8, n=30)
96.8 fps -10%
Intel Reference Design Laptop 15W
Intel Iris Xe Graphics G7 96EUs, Intel Core i7-1185G7
88.3 fps -17%
Lenovo Yoga Slim 7-14ARE
AMD Radeon RX Vega 8 (Ryzen 4000/5000), AMD Ryzen 7 4800U
75.4 fps -30%
Lenovo Yoga Slim 7-14ARE
AMD Radeon RX Vega 8 (Ryzen 4000/5000), AMD Ryzen 7 4800U
73.1 fps -32%
Lenovo Yoga Slim 7-14ARE
AMD Radeon RX Vega 8 (Ryzen 4000/5000), AMD Ryzen 7 4800U
72.7 fps -32%
Media AMD Radeon RX Vega 7
  (37.3 - 123.2, n=59)
73.3 fps -31%
Media Intel Iris Plus Graphics G7 (Ice Lake 64 EU)
  (38.4 - 74.5, n=30)
62.8 fps -41%
Media AMD Radeon RX Vega 6 (Ryzen 4000/5000)
  (47.5 - 91.3, n=23)
59.6 fps -44%
Xiaomi RedmiBook 16 R5
AMD Radeon RX Vega 6 (Ryzen 4000/5000), AMD Ryzen 5 4500U
59.4 fps -44%
Media AMD Radeon RX Vega 9
  ()
55 fps -49%
V-Ray Benchmark Next 4.10 - GPU
Media NVIDIA GeForce GTX 1050 Mobile
  ()
61 mpaths +85%
Media AMD Radeon RX Vega 8 (Ryzen 4000/5000)
  (31 - 83, n=47)
59.9 mpaths +82%
Lenovo Yoga Slim 7-14ARE
AMD Radeon RX Vega 8 (Ryzen 4000/5000), AMD Ryzen 7 4800U
47 mpaths +42%
Media AMD Radeon RX Vega 7
  (14 - 70, n=47)
46.2 mpaths +40%
Media AMD Radeon RX Vega 6 (Ryzen 4000/5000)
  (30 - 52, n=15)
39.4 mpaths +19%
Intel Reference Design Laptop 35W Dynamic Tuning
Intel Iris Xe Graphics G7 96EUs, Intel Core i7-1185G7
37 mpaths +12%
Media NVIDIA GeForce MX350
  (33 - 41, n=10)
35.9 mpaths +9%
Media NVIDIA GeForce MX450
  (28 - 40, n=17)
34.6 mpaths +5%
Xiaomi RedmiBook 16 R5
AMD Radeon RX Vega 6 (Ryzen 4000/5000), AMD Ryzen 5 4500U
33 mpaths 0%
Intel Reference Design Laptop 28W
Intel Iris Xe Graphics G7 96EUs, Intel Core i7-1185G7
33 mpaths
Intel Reference Design Laptop 28W
Intel Iris Xe Graphics G7 96EUs, Intel Core i7-1185G7
29 mpaths -12%
Media NVIDIA GeForce MX250
  (24 - 34, n=5)
29.6 mpaths -10%
Intel Reference Design Laptop 15W
Intel Iris Xe Graphics G7 96EUs, Intel Core i7-1185G7
25 mpaths -24%
Media Intel Iris Plus Graphics G7 (Ice Lake 64 EU)
  (17 - 28, n=5)
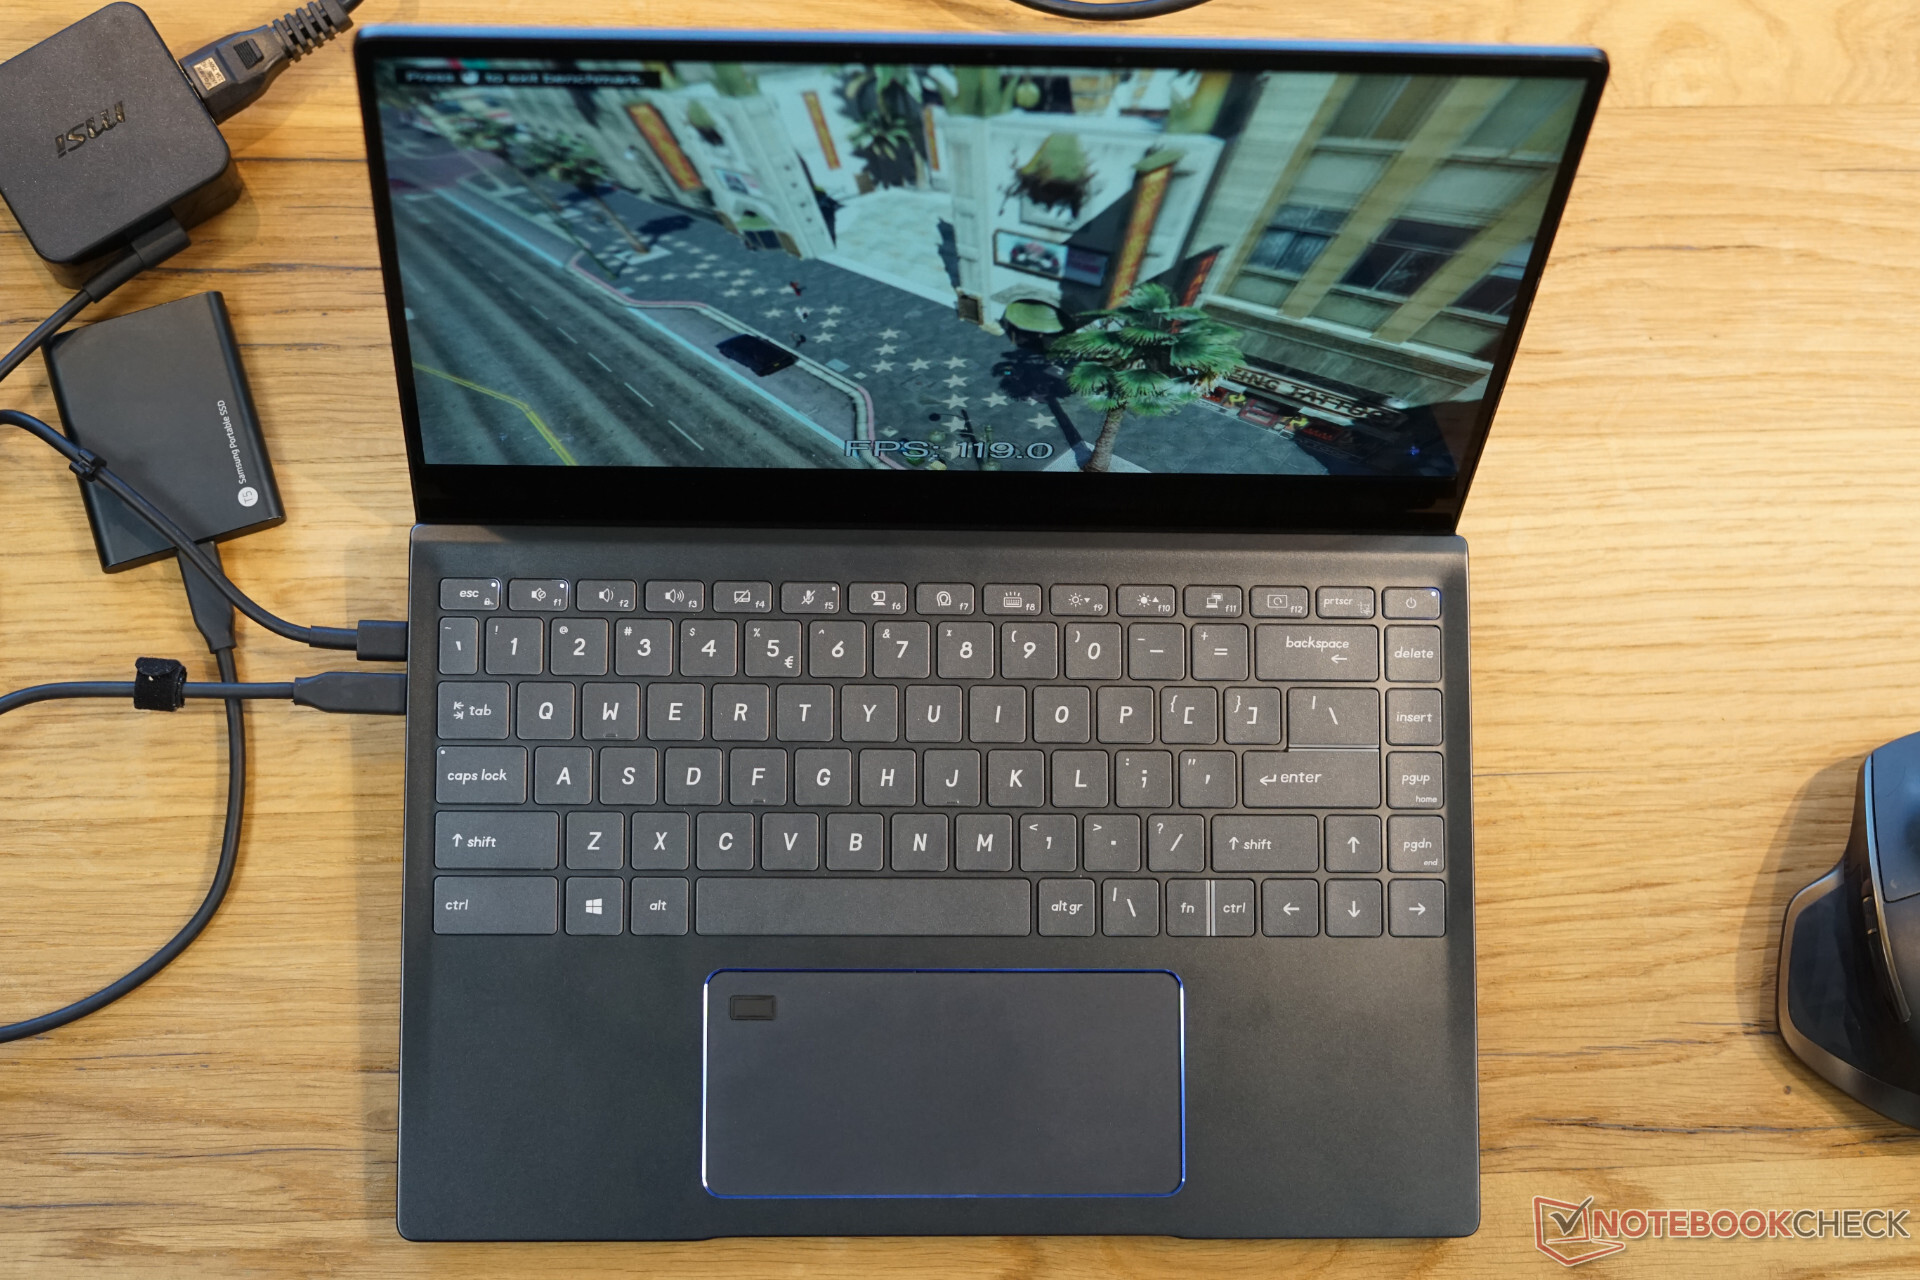
21.2 mpaths -36%

Prestazioni Gaming

Gli errori grafici devono essere eliminati sulle unità di vendita al dettaglio

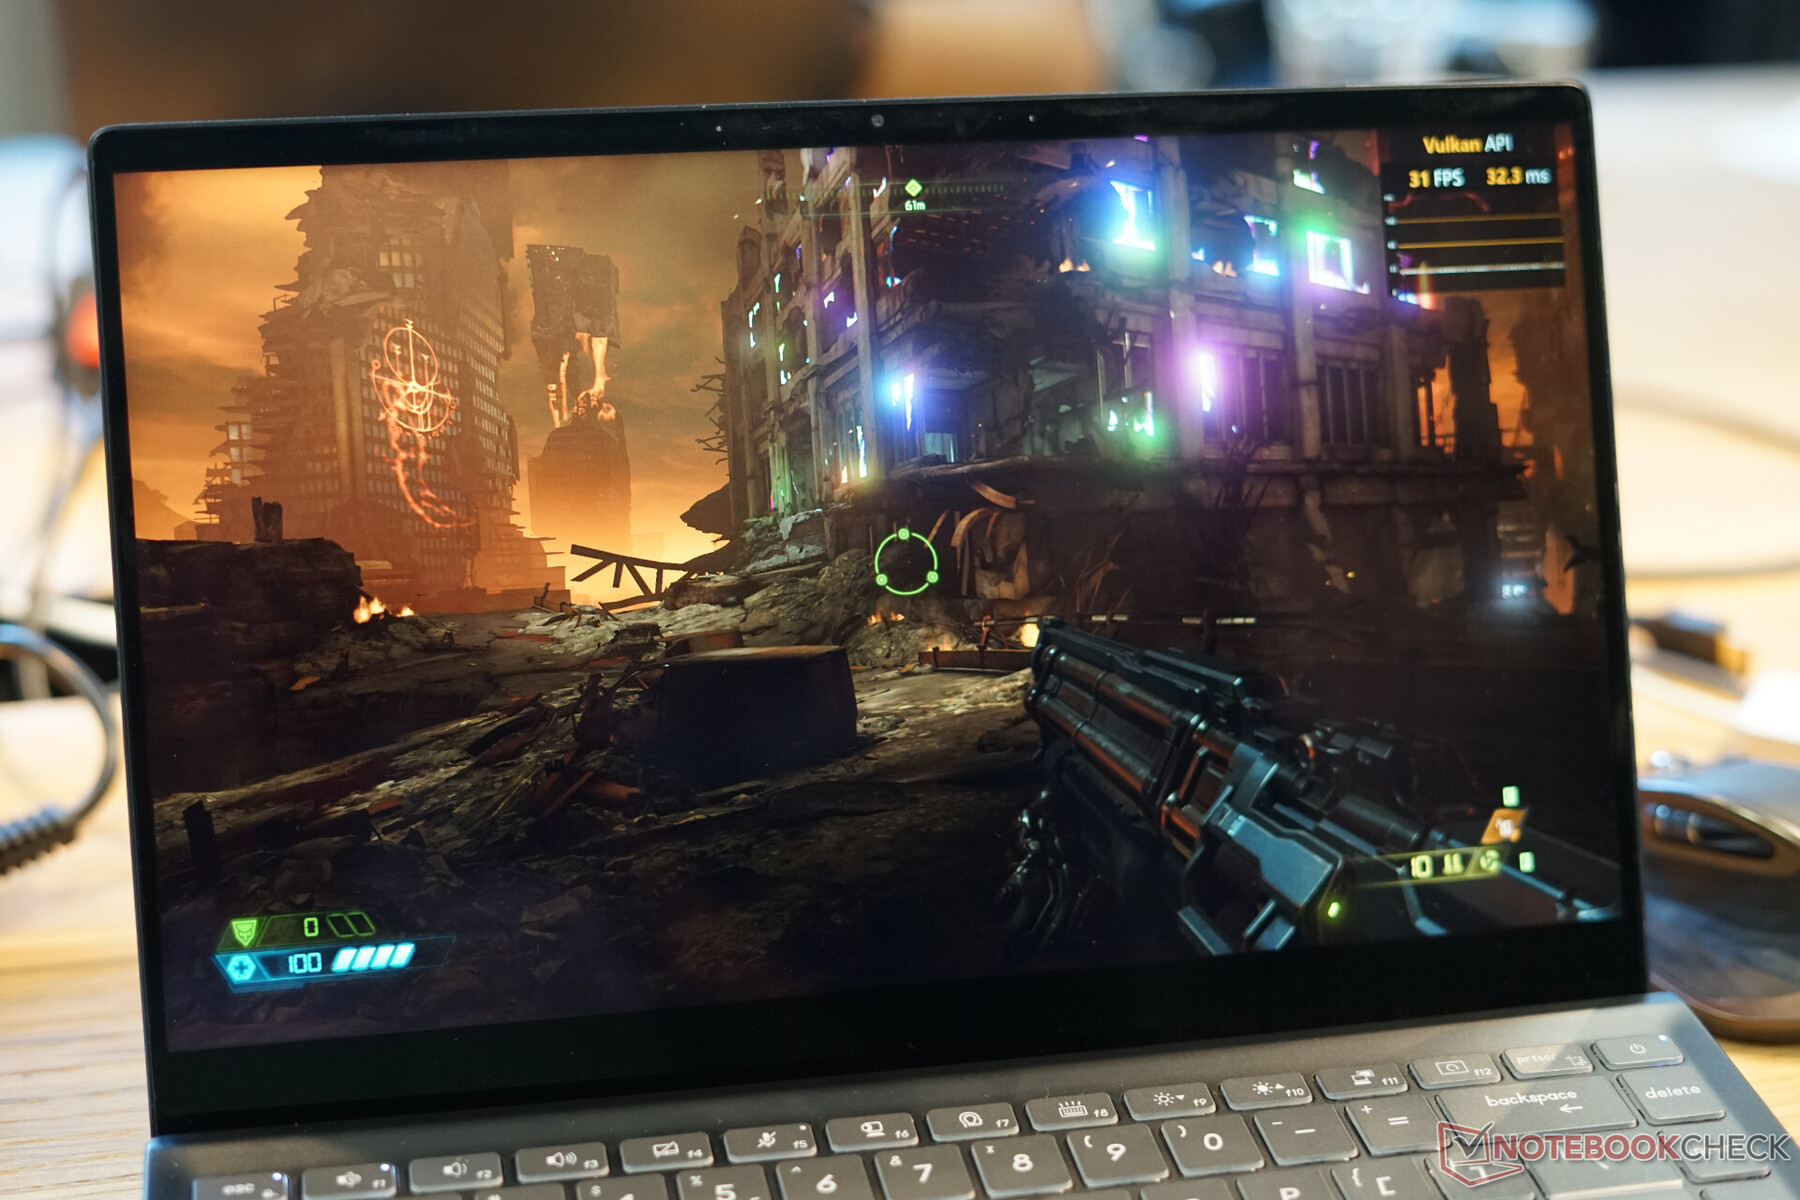
Grazie alle prestazioni molto più elevate della GPU, l'iGPU è molto più adatta ai giochi rispetto alle precedenti iGPU. Abbiamo testato un paio di titoli e anche Doom Eternal ha funzionato senza problemi con un buon frame rate, ma non abbiamo registrato il risultato a causa di un errore grafico causato dai driver beta.

Il titolo impegnativo "The Witcher 3" mostra molto bene le prestazioni della iGPU. E' quasi alla pari con la GeForce GTX 1050 Max-Q e giocabile a 1080p e con impostazioni elevate a 35 FPS. La GeForce MX350 è molto più lenta, ma la situazione cambia in GTA 5, dove la MX350 può gestire un chiaro vantaggio. L'AMD Vega 7 nell'Acer Swift 3 SF314 è chiaramente battuto entrambe le volte.

Il nostro test su una versione più vecchia di DOTA 2 pone la Xe dietro l'MX350 e alla pari con la Vega 7, mentre la Vega 8 nella Slim 7 è ancora un po' più veloce.

I test di gioco nel mondo reale dimostrano ancora una volta che le prestazioni dipendono dai drivers, dalle ottimizzazioni e dalla memoria grafica. Non si può sempre dire che le GPU dedicate come un MX350 con la veloce GDDR5 VRAM siano sempre battute, ma si può vedere il potenziale prestazionale dell'Iris Xe e che rende superflue le dGPU entry-level.

The Witcher 3 - 1920x1080 High Graphics & Postprocessing (Nvidia HairWorks Off)
Media NVIDIA GeForce GTX 1050 Mobile
  (29.1 - 43, n=29)
38 fps +6%
Media NVIDIA GeForce GTX 1050 Max-Q
  (34 - 41, n=3)
36.5 fps +2%
Intel Reference Design Laptop 28W
Intel Iris Xe Graphics G7 96EUs, Intel Core i7-1185G7
35.9 (31min - 41max) fps
Media NVIDIA GeForce MX450
  (21 - 46, n=16)
34.8 fps -3%
Media NVIDIA GeForce MX350
  (20.6 - 29.9, n=13)
26.3 fps -27%
Lenovo Yoga Slim 7-14ARE
AMD Radeon RX Vega 8 (Ryzen 4000/5000), AMD Ryzen 7 4800U
23.1 fps -36%
Media AMD Radeon RX Vega 8 (Ryzen 4000/5000)
  (8.7 - 26.8, n=46)
20.6 fps -43%
Media NVIDIA GeForce MX250
  (16.3 - 23.1, n=27)
20.1 fps -44%
Media AMD Radeon RX Vega 7
  (8.96 - 26.2, n=49)
18.1 fps -50%
Media Intel Iris Plus Graphics G7 (Ice Lake 64 EU)
  (10.9 - 20.1, n=18)
17 fps -53%
Xiaomi RedmiBook 16 R5
AMD Radeon RX Vega 6 (Ryzen 4000/5000), AMD Ryzen 5 4500U
15.7 (13min - 18max) fps -56%
Media AMD Radeon RX Vega 6 (Ryzen 4000/5000)
  (10.7 - 19.4, n=20)
15 fps -58%
Media AMD Radeon RX Vega 9
  ()
13.3 fps -63%
GTA V - 1920x1080 High/On (Advanced Graphics Off) AA:2xMSAA + FX AF:8x
Media NVIDIA GeForce GTX 1050 Mobile
  ()
65.9 fps +119%
Media NVIDIA GeForce GTX 1050 Max-Q
  (61.8 - 62.1, n=2)
62 fps +106%
Media NVIDIA GeForce MX450
  (30.6 - 68.3, n=11)
54.1 fps +80%
Media NVIDIA GeForce MX350
  (45.8 - 49.5, n=3)
47.4 fps +57%
Media NVIDIA GeForce MX250
  (35.9 - 41.5, n=4)
38.4 fps +28%
Intel Reference Design Laptop 28W
Intel Iris Xe Graphics G7 96EUs, Intel Core i7-1185G7
30.1 (7.4min, 20P1 - 122max) fps
Lenovo Yoga Slim 7-14ARE
AMD Radeon RX Vega 8 (Ryzen 4000/5000), AMD Ryzen 7 4800U
29.8 (3.22min, 21.3P1 - 83.4max) fps -1%
Media AMD Radeon RX Vega 8 (Ryzen 4000/5000)
  (13.8 - 40.6, n=44)
26.1 fps -13%
Media AMD Radeon RX Vega 7
  (11.3 - 32.2, n=36)
22.7 fps -25%
Media AMD Radeon RX Vega 6 (Ryzen 4000/5000)
  (20.1 - 24.6, n=6)
21.5 fps -29%
Xiaomi RedmiBook 16 R5
AMD Radeon RX Vega 6 (Ryzen 4000/5000), AMD Ryzen 5 4500U
20.5 (2.05min, 14.5P1 - 33.2max) fps -32%
Media Intel Iris Plus Graphics G7 (Ice Lake 64 EU)
  (12.7 - 13.3, n=2)
13 fps -57%
Dota 2 Reborn - 1920x1080 ultra (3/3) best looking
Media NVIDIA GeForce GTX 1050 Mobile
  (94.9 - 117, n=4)
106 fps +115%
Media NVIDIA GeForce GTX 1050 Max-Q
  ()
104.1 fps +111%
Media NVIDIA GeForce MX450
  (34.9 - 104.6, n=20)
79.9 fps +62%
Media NVIDIA GeForce MX350
  (52.3 - 80.6, n=14)
72.5 fps +47%
Media NVIDIA GeForce MX250
  (7.8 - 67.5, n=21)
53.6 fps +9%
Lenovo Yoga Slim 7-14ARE
AMD Radeon RX Vega 8 (Ryzen 4000/5000), AMD Ryzen 7 4800U
52.5 (47.3min) fps +6%
Intel Reference Design Laptop 28W
Intel Iris Xe Graphics G7 96EUs, Intel Core i7-1185G7
49.4 (33.1min) fps
Media AMD Radeon RX Vega 8 (Ryzen 4000/5000)
  (23.3 - 72, n=57)
48.6 fps -2%
Media AMD Radeon RX Vega 7
  (23.3 - 58.2, n=58)
41.9 fps -15%
Media AMD Radeon RX Vega 6 (Ryzen 4000/5000)
  (30.4 - 66.1, n=21)
40 fps -19%
Xiaomi RedmiBook 16 R5
AMD Radeon RX Vega 6 (Ryzen 4000/5000), AMD Ryzen 5 4500U
39.8 (36.6min) fps -19%
Intel Reference Design Laptop 15W
Intel Iris Xe Graphics G7 96EUs, Intel Core i7-1185G7
38 (25.9min) fps -23%
Media Intel Iris Plus Graphics G7 (Ice Lake 64 EU)
  (16.4 - 35.7, n=18)
26.9 fps -46%
X-Plane 11.11 - 1920x1080 high (fps_test=3)
Media NVIDIA GeForce GTX 1050 Max-Q
  ()
65.1 fps +56%
Media NVIDIA GeForce GTX 1050 Mobile
  (44.6 - 66.7, n=2)
55.7 fps +34%
Media NVIDIA GeForce MX450
  (35.4 - 71.4, n=20)
54.9 fps +32%
Media NVIDIA GeForce MX350
  (30.2 - 63.7, n=14)
48 fps +15%
Intel Reference Design Laptop 28W
Intel Iris Xe Graphics G7 96EUs, Intel Core i7-1185G7
41.7 fps
Media NVIDIA GeForce MX250
  (9.8 - 52.6, n=17)
39.4 fps -6%
Intel Reference Design Laptop 15W
Intel Iris Xe Graphics G7 96EUs, Intel Core i7-1185G7
33.1 fps -21%
Lenovo Yoga Slim 7-14ARE
AMD Radeon RX Vega 8 (Ryzen 4000/5000), AMD Ryzen 7 4800U
30.5 fps -27%
Media AMD Radeon RX Vega 8 (Ryzen 4000/5000)
  (19.1 - 43.1, n=57)
30.5 fps -27%
Media AMD Radeon RX Vega 7
  (17.4 - 35.7, n=56)
27.2 fps -35%
Xiaomi RedmiBook 16 R5
AMD Radeon RX Vega 6 (Ryzen 4000/5000), AMD Ryzen 5 4500U
26.2 fps -37%
Media AMD Radeon RX Vega 6 (Ryzen 4000/5000)
  (22.6 - 29.9, n=20)
25.8 fps -38%
Media Intel Iris Plus Graphics G7 (Ice Lake 64 EU)
  (10.8 - 19.7, n=18)
15 fps -64%

Giudizio Complessivo

I nostri benchmarks iniziali con un sistema di riferimento di Intel con il nuovo chip high-end Tiger Lake-U, il Core i7-1185G7, sono molto promettenti e il chip lascia un'ottima impressione. Intel mostra di cosa è capace una versione ben configurata con sufficiente raffreddamento. Le prestazioni sono molto impressionanti per una CPU quad-core e sia i chip Intel che quelli a 6 cores di AMD sono battuti. Il veloce Ryzen 7 4800U a 8 cores è ancora in vantaggio in molti test multi-core per questo segmento TDP, ma il vero punto forte è l'eccellente prestazione single-core grazie ai clock elevati. L'efficiente processore mobile è in grado di battere anche modelli desktop di fascia alta come l'i9-10900K. Questo si traduce anche in eccellenti risultati nei benchmarks applicativi, come dimostra il PCMark 10.

La GPU Iris Xe integrata è un altro punto di forza. Intel riesce a battere le GPU dedicate entry-level come la GeForce MX330 o la 350 nei test sintetici, ma dobbiamo aspettare e vedere come saranno le prestazioni di gioco nel mondo reale. I nostri test iniziali sono promettenti sotto questo aspetto.

Le prestazioni di Tiger Lake sono ancora discrete a 15 Watt, quindi speriamo anche che ci saranno modelli veloci da 6W. Tuttavia, la designazione del modello da sola non mostra le prestazioni, ma dipende davvero dalla configurazione del TDP e dalle prestazioni di raffreddamento.

Please share our article, every link counts!
> Recensioni e prove di notebook, tablets e smartphones > Recensioni e prove > Recensioni e prove > Recensione dell'Intel Core i7-1185G7 - Primi Benchmarks Tiger Lake
Klaus Hinum, 2020-09-17 (Update: 2020-09-17)