Recensione dell'Asus ROG Strix SCAR 16 2025: Il laptop RTX 5090 e il mini LED all'interno di un laptop gaming.
Il 16 pollici più veloce di Asus.
ROG Strix SCAR 16 è l'ammiraglia da gioco da 16 pollici di Asus, dotata di Core Ultra 275HX, GeForce RTX 5090 Laptop con 24 GB di VRAM e un mini display LED da 240 Hz.Andreas Osthoff, 👁 Andreas Osthoff (traduzione a cura di DeepL / Ninh Duy) Pubblicato 🇺🇸 🇩🇪 ...
Verdetto - Prestazioni complete e un ottimo display
Come per il più grande Strix SCAR 18, le prestazioni di gioco del più piccolo Strix SCAR 16 sono eccellenti, soprattutto perché non c'è perdita di prestazioni rispetto al modello da 18 pollici. Tuttavia, il suo vantaggio in termini di prestazioni rispetto all'RTX 5080 Laptop non è enorme, soprattutto con la risoluzione WQHD nativa del laptop, e se non può beneficiare della sua VRAM più grande in nessun altro modo, le consigliamo di scegliere la configurazione con l'RTX 5080 Laptop. Il display mini LED del dispositivo è impressionante, offre ampie funzionalità e modalità operative, ha ottenuto valori molto buoni durante il nostro test e dispone di profili di colore precisi subito dopo l'acquisto.
La qualità del suo case è buona e dispone di ampi elementi di illuminazione, ma purtroppo è realizzato interamente in plastica e le sue superfici nere sono molto sensibili alle macchie di sporco. Le opzioni di manutenzione del portatile sono buone e si può accedere ai suoi componenti con facilità; inoltre, è già dotato di Thunderbolt 5. La maggior parte delle porte si trova sul lato sinistro del dispositivo e nessuna sul retro.
Nel complesso, il nuovo ROG Strix SCAR 16 è un notebook da gioco impressionante con componenti potenti. Rispetto al normale ROG Strix G16lo Strix SCAR 16 beneficia soprattutto del suo mini pannello LED, ma questo ha un prezzo di circa 550 dollari in più.
Pro
Contro
Prezzo e disponibilità
Al momento in cui scriviamo, ROG Strix SCAR 16 G635 non è ancora disponibile per l'acquisto negli Stati Uniti. Il prezzo di vendita è di circa 4.300 dollari.
Sommario
- Verdetto - Prestazioni complete e un ottimo display
- Specifiche
- Custodia e connettività
- Dispositivi di input - Tastiera confortevole
- Display - Mini LED a 240 Hz
- Prestazioni - Laptop Arrow Lake-HX & RTX 5090
- Emissioni e gestione dell'energia
- Valutazione totale di Notebookcheck
- Possibili alternative a confronto
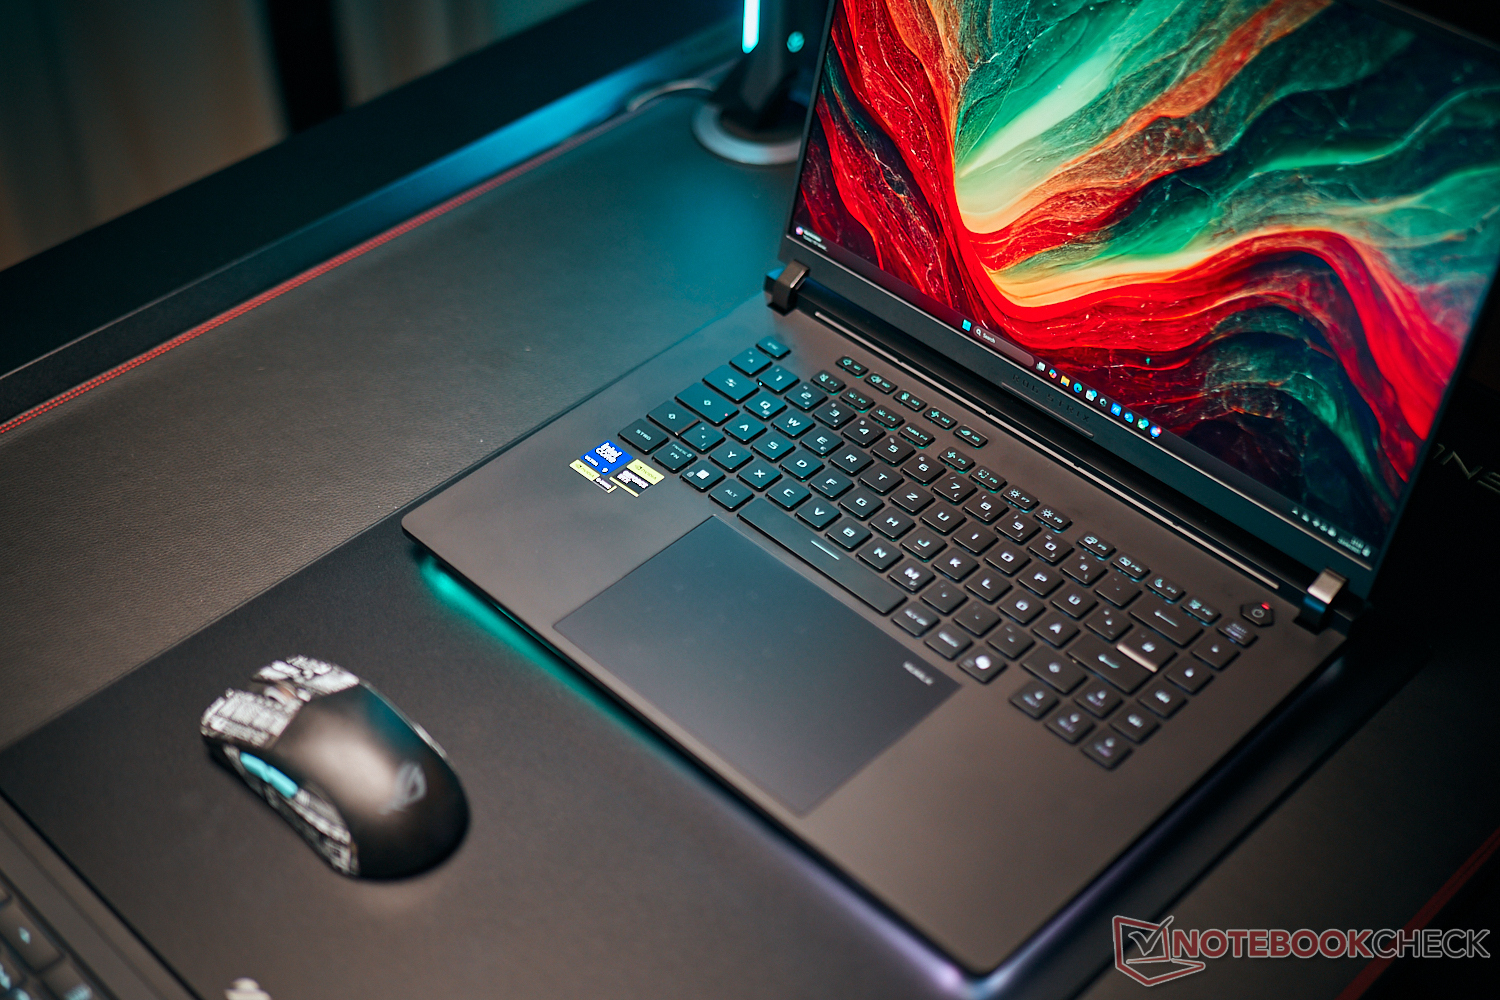
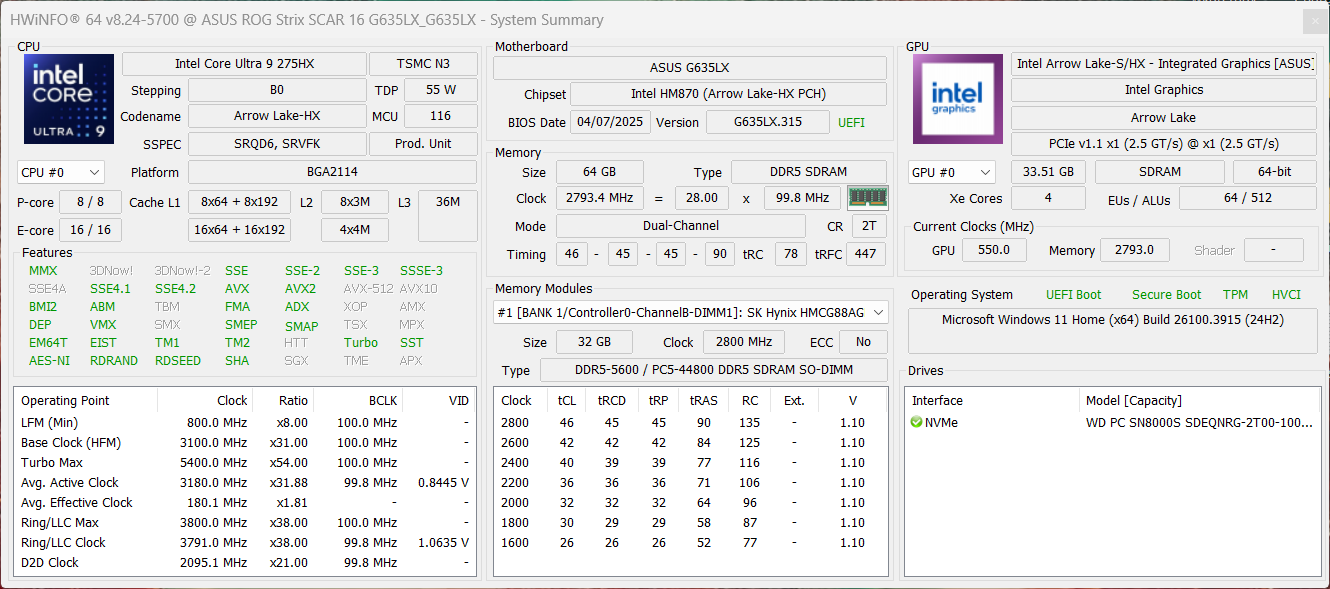
Strix SCAR 16 è il gamer da 16 pollici più veloce di Asus, che combina componenti di fascia alta con un mini schermo LED e ampi elementi di illuminazione. Abbiamo testato la variante con il Core Ultra 9 275HXe la GeForce RTX 5090 Laptop, 64 GB di RAM, un SSD da 2 TB e un pannello mini LED da 240 Hz per un prezzo di circa 5.630 dollari.
Specifiche
Custodia e connettività
In generale, il design del case del portatile, con le sue superfici nere e il display AniME vision sul coperchio, è lo stesso del più grande SCAR 18. La qualità è buona (sia per quanto riguarda la costruzione che la stabilità), ma dato il prezzo, ci si aspetta di vedere un po' di metallo. Inoltre, le sue superfici nere sono estremamente suscettibili alle macchie di sporco. D'altro canto, le opzioni di illuminazione sono ampie e la nuova striscia LED avvolgente è impressionante.
Asus ha installato due moderne porte Thunderbolt 5 e un numero sufficiente di porte USB, anche se tutte le porte si trovano sui due lati (più a sinistra). La fotocamera a 1080p del dispositivo (senza otturatore meccanico) fa il suo lavoro e il suo modulo WLAN supporta già lo standard Wi-Fi 7. Durante il nostro test, la velocità di trasferimento è stata stabile e veloce. Non è un computer portatile Copilot+, ma supporta gli Effetti Studio della webcam e la sottotitolazione in diretta.


| Networking | |
| Asus ROG Strix Scar 16 2025 | |
| iperf3 transmit AXE11000 | |
| iperf3 receive AXE11000 | |
| Asus ROG Strix G16 G615 | |
| iperf3 transmit AXE11000 | |
| iperf3 receive AXE11000 | |
| Lenovo Legion Pro 7i 16 Gen 10 | |
| iperf3 transmit AXE11000 | |
| iperf3 receive AXE11000 | |
| iperf3 transmit AXE11000 6GHz | |
| iperf3 receive AXE11000 6GHz | |
| HP Omen Max 16 ah000 | |
| iperf3 transmit AXE11000 | |
| iperf3 receive AXE11000 | |
| iperf3 transmit AXE11000 6GHz | |
| iperf3 receive AXE11000 6GHz | |
| Aorus MASTER 16 AM6H | |
| iperf3 transmit AXE11000 | |
| iperf3 receive AXE11000 | |
| iperf3 transmit AXE11000 6GHz | |
| iperf3 receive AXE11000 6GHz | |
| Asus ROG Strix Scar 16 G634JZR | |
| iperf3 transmit AXE11000 | |
| iperf3 receive AXE11000 | |
| iperf3 transmit AXE11000 6GHz | |
| iperf3 receive AXE11000 6GHz | |


Manutenzione

Per sbloccare la piastra di base, tutto ciò che deve fare è spingere un cursore. Non potrebbe essere più facile e all'interno è possibile accedere ai due slot per la RAM, ai due SSD M.2 2280, alla batteria e alle ventole. Tuttavia, il modulo WLAN è saldato.


Sostenibilità
Asus non ha fornito informazioni sull'impronta diCO2 del dispositivo o sulle certificazioni ambientali. La sua confezione è quasi interamente in cartone.
Dispositivi di input - Tastiera confortevole
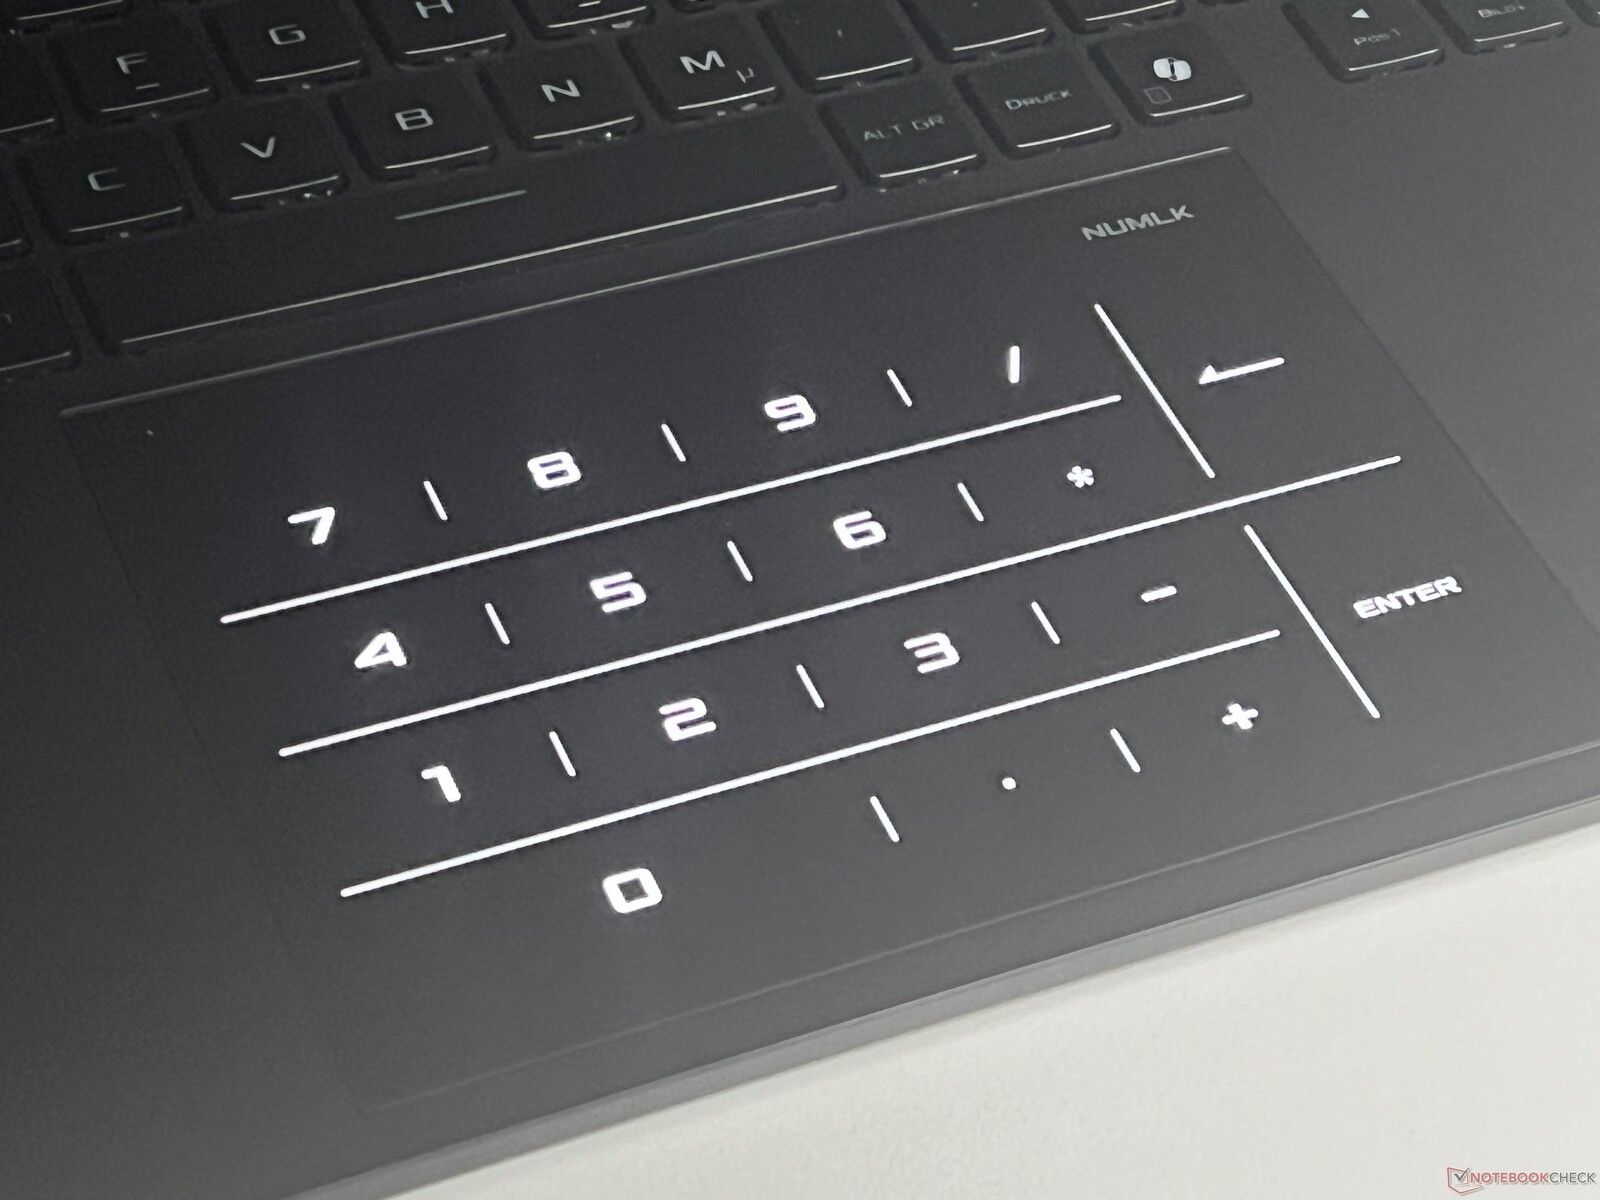
La versione da 16 pollici di Strix SCAR non dispone di un tastierino numerico, ma per il resto offre la stessa confortevole esperienza di digitazione del modello più grande SCAR 18. In sostituzione, è possibile visualizzare un tastierino numerico sul ClickPad. Questo è piacevole e scorrevole ed emette clic meccanici ovattati e di alta qualità. La retroilluminazione della tastiera può essere regolata individualmente per ogni tasto, ma non può essere attivata da un sensore.


Display - Mini LED a 240 Hz
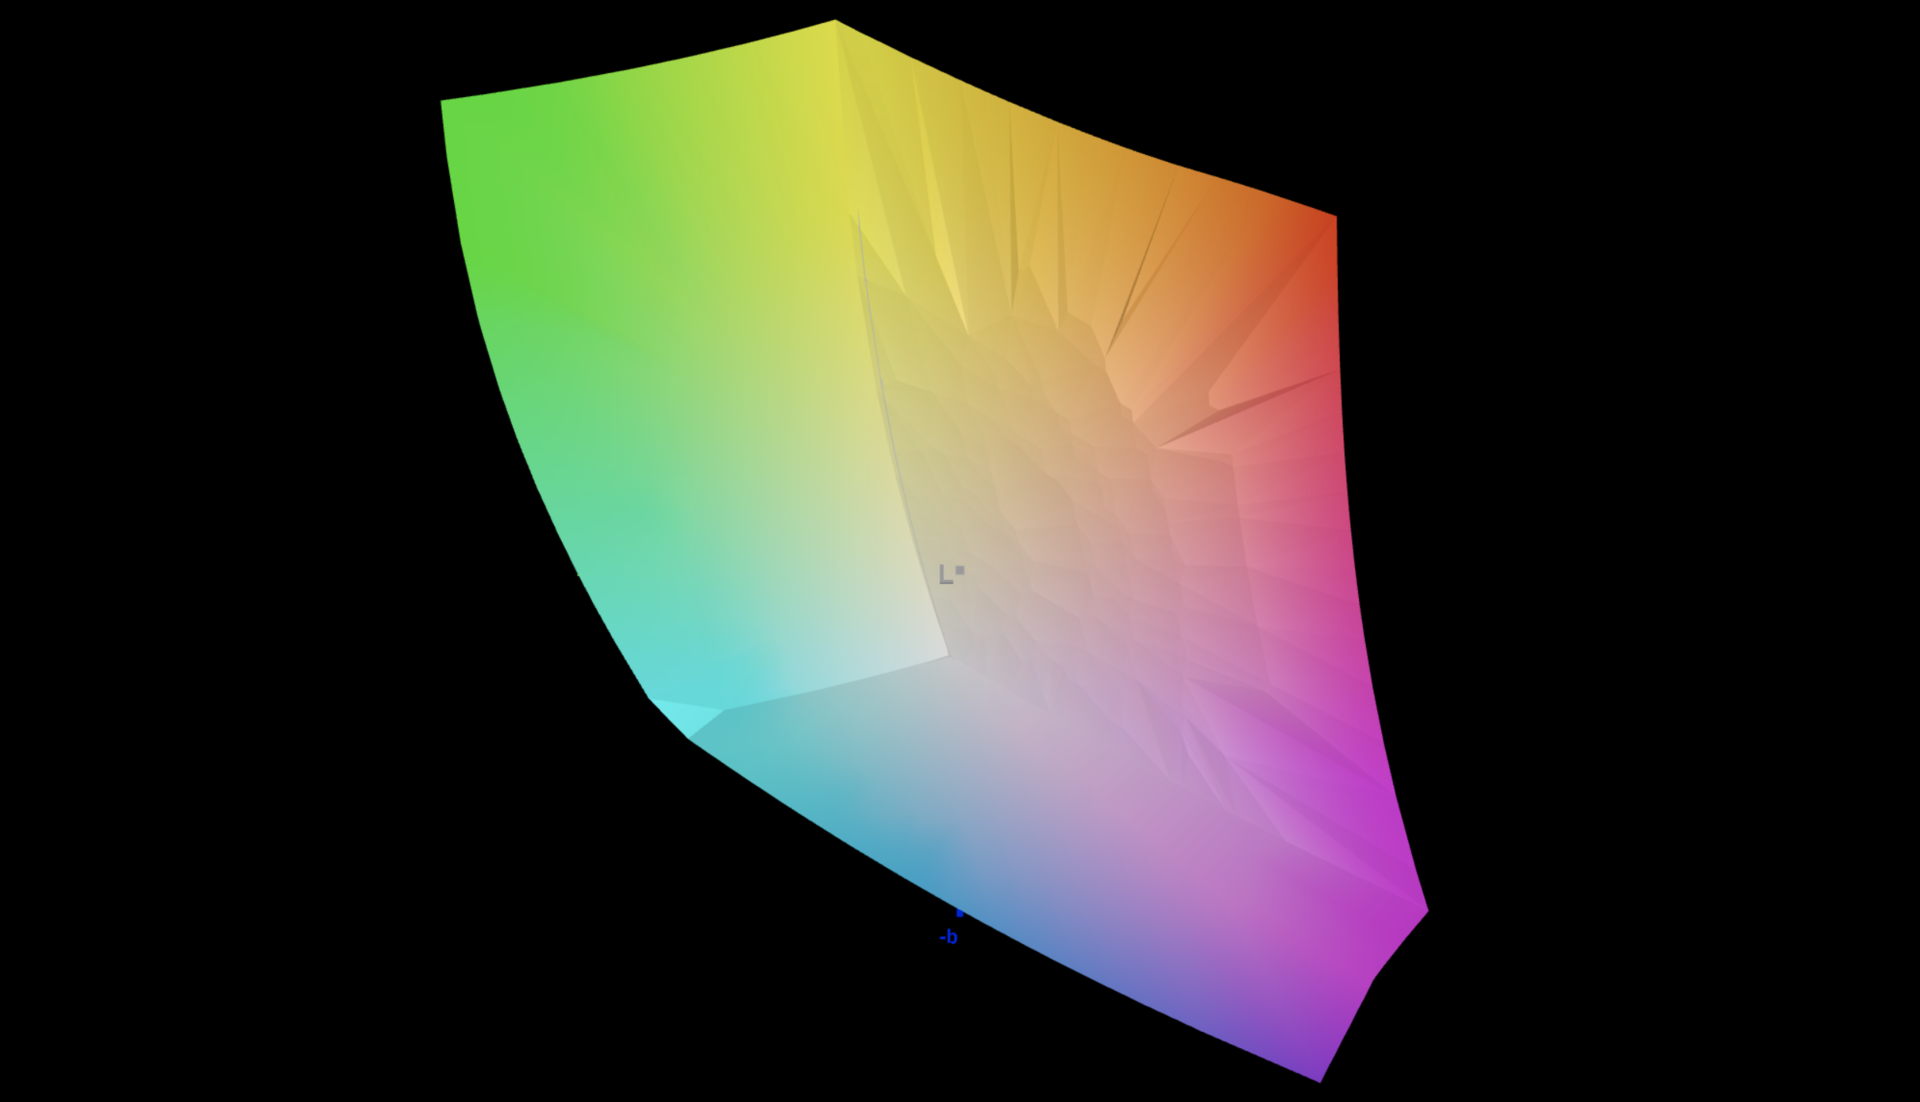
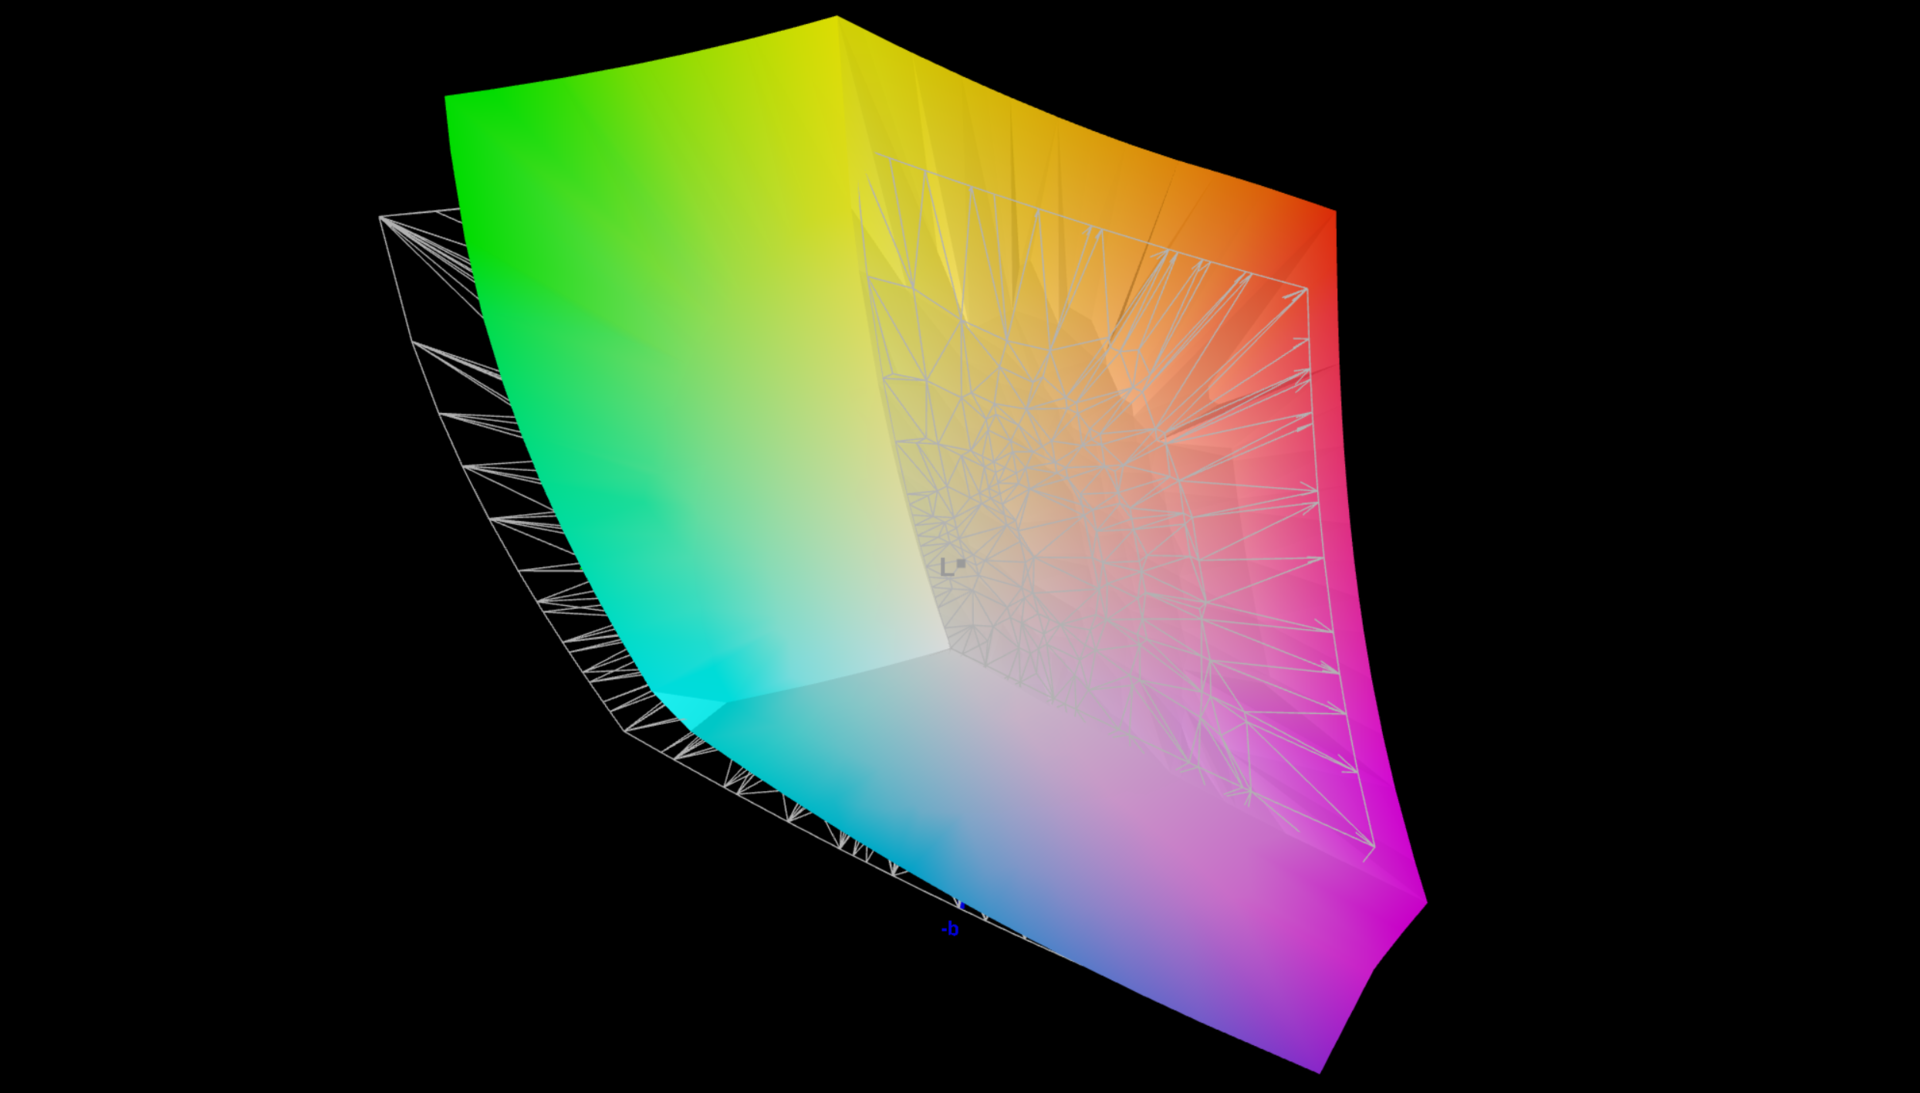
Mentre Strix G16 è dotato di un pannello IPS, Strix SCAR 16 ha ancora un pannello mini LED opaco (2.560 x 1.600 pixel, 240 Hz). Abbiamo descritto le ampie caratteristiche di questo pannello nella nostra recensione dello più grande SCAR 18 e nel complesso, la qualità delle immagini è semplicemente eccezionale. I suoi tempi di risposta sono rapidi e, sebbene lo sfarfallio PWM sia presente, è a una frequenza estremamente elevata di 20 kHz.
In modalità SDR, la sua luminosità è superiore a 770 cd/m² e in modalità HDR, abbiamo notato addirittura oltre 1.400 cd/m². Tuttavia, il suo livello di nero non è 0 in modalità SDR (solo in modalità HDR), ma il suo rapporto di contrasto è comunque molto elevato. Asus offre anche profili di colore molto accurati per gli spazi di colore P3/sRGB direttamente dalla confezione, e non siamo riusciti a ridurre ulteriormente le deviazioni del display con la nostra calibrazione. Il local dimming può essere disattivato, quindi il pannello è adatto anche all'editing di immagini senza alcuna restrizione.


| |||||||||||||||||||||||||
Distribuzione della luminosità: 91 %
Al centro con la batteria: 719 cd/m²
Contrasto: 10771:1 (Nero: 0.07 cd/m²)
ΔE ColorChecker Calman: 1 | ∀{0.5-29.43 Ø4.73}
ΔE Greyscale Calman: 1 | ∀{0.09-98 Ø4.97}
88.4% AdobeRGB 1998 (Argyll 3D)
100% sRGB (Argyll 3D)
99.9% Display P3 (Argyll 3D)
Gamma: 2.14
CCT: 6493 K
| Asus ROG Strix Scar 16 2025 NE160QDM-NM8, Mini-LED, 2560x1600, 16", 240 Hz | Asus ROG Strix G16 G615 NE160QDM-NZC, IPS, 2560x1600, 16", 240 Hz | Lenovo Legion Pro 7i 16 Gen 10 Samsung ATNA60HU01-0, OLED, 2560x1600, 16", 240 Hz | HP Omen Max 16 ah000 Samsung ATNA60DL02-0, OLED, 2560x1600, 16", 240 Hz | Aorus MASTER 16 AM6H ATNA60DL03-0 (SDC41AB), OLED, 2560x1600, 16", 240 Hz | Asus ROG Strix Scar 16 G634JZR BOE NE160QDM-NM7, Mini LED, 2560x1600, 16", 240 Hz | |
|---|---|---|---|---|---|---|
| Display | 0% | 2% | 4% | 0% | 1% | |
| Display P3 Coverage (%) | 99.9 | 99.1 -1% | 99.5 0% | 99.7 0% | 95.3 -5% | 99.8 0% |
| sRGB Coverage (%) | 100 | 99.9 0% | 100 0% | 100 0% | 98.8 -1% | 100 0% |
| AdobeRGB 1998 Coverage (%) | 88.4 | 89.1 1% | 94.4 7% | 98.2 11% | 94.1 6% | 90.8 3% |
| Response Times | 31% | 96% | 95% | 96% | 3% | |
| Response Time Grey 50% / Grey 80% * (ms) | 7 ? | 4.6 ? 34% | 0.28 ? 96% | 0.29 ? 96% | 0.24 ? 97% | 5 ? 29% |
| Response Time Black / White * (ms) | 8.4 ? | 6.1 ? 27% | 0.43 ? 95% | 0.47 ? 94% | 0.43 ? 95% | 10.4 ? -24% |
| PWM Frequency (Hz) | 20555 ? | 1438 ? | 960 ? | 960 | 2040 ? | |
| PWM Amplitude * (%) | 29 | 31 | 47 | |||
| Screen | -117% | -81% | -106% | -80% | -83% | |
| Brightness middle (cd/m²) | 754 | 545 -28% | 490.4 -35% | 376.5 -50% | 435 -42% | 490 -35% |
| Brightness (cd/m²) | 773 | 536 -31% | 498 -36% | 382 -51% | 437 -43% | 487 -37% |
| Brightness Distribution (%) | 91 | 89 -2% | 97 7% | 96 5% | 96 5% | 94 3% |
| Black Level * (cd/m²) | 0.07 | 0.41 -486% | 0.08 -14% | 0.4 -471% | ||
| Contrast (:1) | 10771 | 1329 -88% | 5438 -50% | 1225 -89% | ||
| Colorchecker dE 2000 * | 1 | 1.6 -60% | 3.2 -220% | 3.67 -267% | 2.42 -142% | 1.08 -8% |
| Colorchecker dE 2000 max. * | 2 | 4 -100% | 6.04 -202% | 7.24 -262% | 4.81 -140% | 2.38 -19% |
| Greyscale dE 2000 * | 1 | 2.4 -140% | 1 -0% | 1.1 -10% | 3.11 -211% | 1.1 -10% |
| Gamma | 2.14 103% | 2.25 98% | 2.24 98% | 2.25 98% | 2.48 89% | 2.13 103% |
| CCT | 6493 100% | 6737 96% | 6373 102% | 6319 103% | 6270 104% | 6724 97% |
| Colorchecker dE 2000 calibrated * | 0.8 | 0.84 | 0.94 | 2.03 | 0.9 | |
| Media totale (Programma / Settaggio) | -29% /
-67% | 6% /
-26% | -2% /
-39% | 5% /
-34% | -26% /
-51% |
* ... Meglio usare valori piccoli


Tempi di risposta del Display
| ↔ Tempi di risposta dal Nero al Bianco | ||
|---|---|---|
| 8.4 ms ... aumenta ↗ e diminuisce ↘ combinato | ↗ 4 ms Incremento | 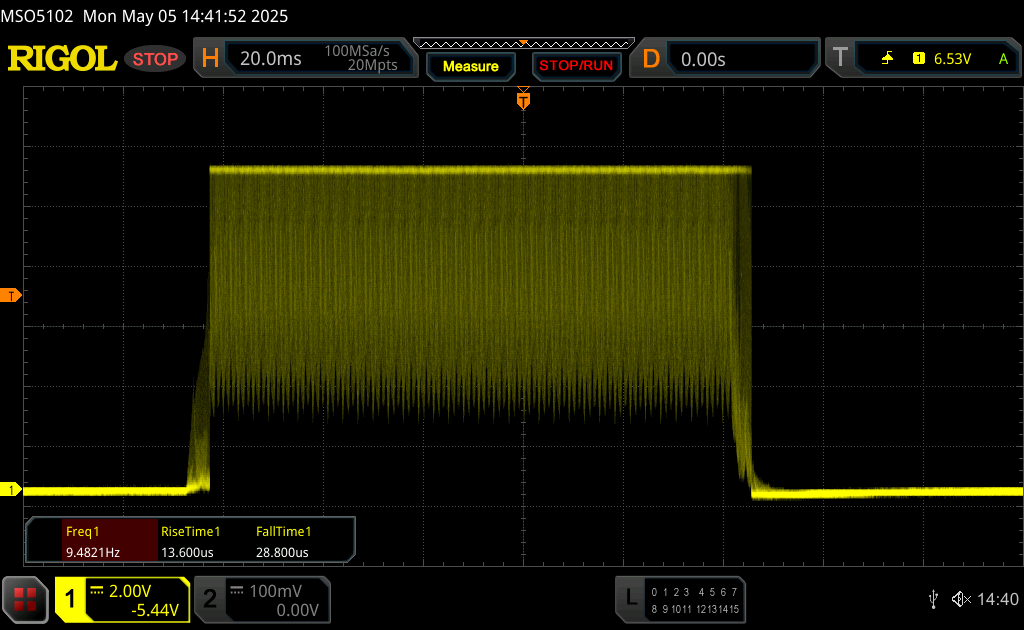 |
| ↘ 4.4 ms Calo | ||
| Lo schermo mostra veloci tempi di risposta durante i nostri tests e dovrebbe esere adatto al gaming In confronto, tutti i dispositivi di test variano da 0.1 (minimo) a 240 (massimo) ms. » 24 % di tutti i dispositivi è migliore. Questo significa che i tempi di risposta rilevati sono migliori rispettto alla media di tutti i dispositivi testati (19.9 ms). | ||
| ↔ Tempo di risposta dal 50% Grigio all'80% Grigio | ||
| 7 ms ... aumenta ↗ e diminuisce ↘ combinato | ↗ 5 ms Incremento | 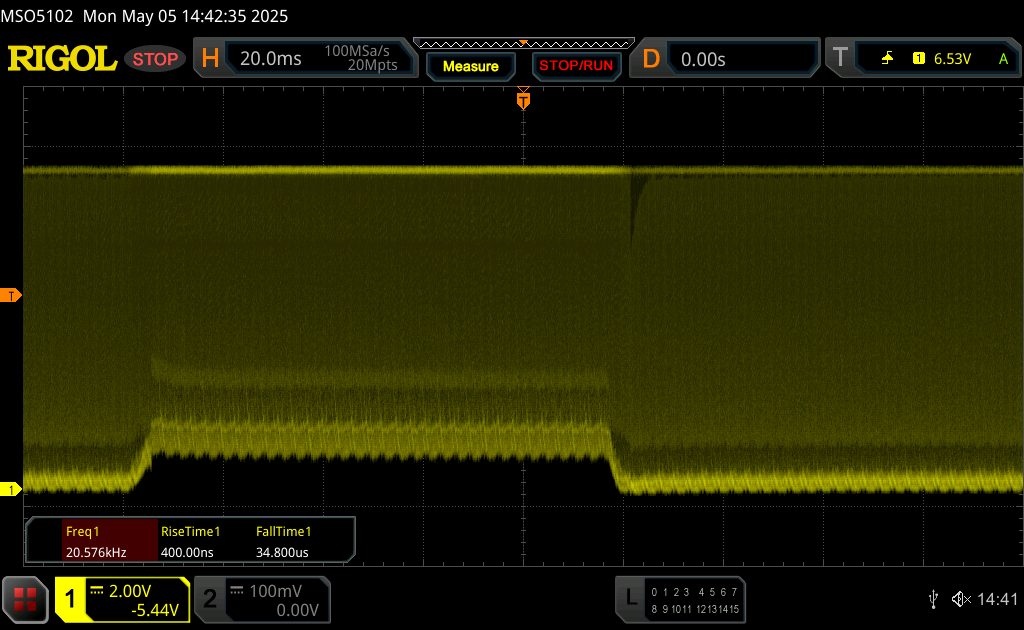 |
| ↘ 2 ms Calo | ||
| Lo schermo ha mostrato valori di risposta molto veloci nei nostri tests ed è molto adatto per i gaming veloce. In confronto, tutti i dispositivi di test variano da 0.165 (minimo) a 636 (massimo) ms. » 20 % di tutti i dispositivi è migliore. Questo significa che i tempi di risposta rilevati sono migliori rispettto alla media di tutti i dispositivi testati (31.1 ms). | ||
Sfarfallio dello schermo / PWM (Pulse-Width Modulation)
| flickering dello schermo / PWM rilevato | 20555 Hz | ≤ 100 % settaggio luminosita' |  |
Il display sfarfalla a 20555 Hz (Probabilmente a causa dell'uso di PWM) Flickering rilevato ad una luminosita' di 100 % o inferiore. Non dovrebbe verificarsi flickering o PWM sopra questo valore di luminosita'. La frequenza di 20555 Hz è abbastanza alta, quindi la maggioranza degli utenti sensibili al PWM non dovrebbero notare alcun flickering. In confronto: 52 % di tutti i dispositivi testati non utilizza PWM per ridurre la luminosita' del display. Se è rilevato PWM, una media di 7798 (minimo: 5 - massimo: 343500) Hz è stata rilevata. | |||


Prestazioni - Laptop Arrow Lake-HX & RTX 5090


Condizioni di test
ROG Strix SCAR 16 offre tutti i profili energetici abituali. Abbiamo eseguito i seguenti benchmark e misurazioni in modalità Turbo. In modalità batteria, la modalità massima disponibile è Prestazioni.
| Profilo energetico | TDP | CB2024 Multi | TGP | Time Spy Grafica | CP 2077 QHD Ultra | emissioni sonore massime della ventola |
|---|---|---|---|---|---|---|
| Silenzioso | 75/45 watt | 1.517 punti | 55 watt | 10.442 punti | 46,2 fps | 35,3 dB(A) |
| Prestazioni | 165/100 watt | 1.972 punti | 160 watt | 22.787 punti | 99,9fps | 48,8 dB(A) |
| Turbo | 165/145 watt | 2.196 punti | 175 watt | 23.600 punti | 107,7 fps | 53,6 dB(A) |
| Batteria | 65/50 watt | 1.584 punti | 55 watt | 9.712 punti | 46,5 fps | 34,5 dB(A) |
Processore - Core Ultra 9 275HX
Il nuovo Core Ultra 9 275HX di Intel di fascia alta Core Ultra 9 275HX può quasi raggiungere il suo pieno potenziale nello Strix SCAR 16 grazie ai suoi elevati limiti di potenza, arrivando appena davanti ai concorrenti da 16 pollici in tutti i benchmark della CPU. Ha ottenuto solo il 9% di vantaggio rispetto al vecchio SCAR 16, mentre solo il più grande ROG Strix SCAR 18 era ancora leggermente più veloce. Inoltre, le sue prestazioni sono rimaste molto stabili.
Cinebench R15 Multi continuous test
Cinebench 2024: CPU Multi Core | CPU Single Core
Cinebench R23: Multi Core | Single Core
Cinebench R20: CPU (Multi Core) | CPU (Single Core)
Cinebench R15: CPU Multi 64Bit | CPU Single 64Bit
Blender: v2.79 BMW27 CPU
7-Zip 18.03: 7z b 4 | 7z b 4 -mmt1
Geekbench 6.7: Multi-Core | Single-Core
Geekbench 5.5: Multi-Core | Single-Core
HWBOT x265 Benchmark v2.2: 4k Preset
LibreOffice : 20 Documents To PDF
R Benchmark 2.5: Overall mean
| CPU Performance rating | |
| Asus Strix Scar 18 G835LX | |
| Asus ROG Strix Scar 16 2025 | |
| Asus ROG Strix G16 G615 | |
| Lenovo Legion Pro 7i 16 Gen 10 | |
| Media Intel Core Ultra 9 275HX | |
| Aorus MASTER 16 AM6H -2! | |
| Asus ROG Strix Scar 16 G634JZR | |
| HP Omen Max 16 ah000 | |
| Media della classe Gaming | |
| Cinebench 2024 / CPU Multi Core | |
| Asus Strix Scar 18 G835LX | |
| Asus ROG Strix G16 G615 | |
| Asus ROG Strix Scar 16 2025 | |
| Lenovo Legion Pro 7i 16 Gen 10 | |
| Media Intel Core Ultra 9 275HX (1547 - 2288, n=27) | |
| HP Omen Max 16 ah000 | |
| Asus ROG Strix Scar 16 G634JZR | |
| Media della classe Gaming (486 - 2298, n=92, ultimi 2 anni) | |
| Cinebench 2024 / CPU Single Core | |
| Asus Strix Scar 18 G835LX | |
| Asus ROG Strix G16 G615 | |
| Lenovo Legion Pro 7i 16 Gen 10 | |
| Media Intel Core Ultra 9 275HX (123.1 - 138.2, n=27) | |
| HP Omen Max 16 ah000 | |
| Asus ROG Strix Scar 16 2025 | |
| Asus ROG Strix Scar 16 G634JZR | |
| Media della classe Gaming (95 - 138.2, n=92, ultimi 2 anni) | |
| Cinebench R23 / Multi Core | |
| Asus Strix Scar 18 G835LX | |
| Asus ROG Strix Scar 16 2025 | |
| Lenovo Legion Pro 7i 16 Gen 10 | |
| Aorus MASTER 16 AM6H | |
| Media Intel Core Ultra 9 275HX (30712 - 40970, n=31) | |
| Asus ROG Strix G16 G615 | |
| HP Omen Max 16 ah000 | |
| Asus ROG Strix Scar 16 G634JZR | |
| Media della classe Gaming (10488 - 40970, n=113, ultimi 2 anni) | |
| Cinebench R23 / Single Core | |
| Asus Strix Scar 18 G835LX | |
| Aorus MASTER 16 AM6H | |
| Lenovo Legion Pro 7i 16 Gen 10 | |
| Media Intel Core Ultra 9 275HX (2009 - 2267, n=31) | |
| Asus ROG Strix Scar 16 G634JZR | |
| Asus ROG Strix G16 G615 | |
| Asus ROG Strix Scar 16 2025 | |
| HP Omen Max 16 ah000 | |
| Media della classe Gaming (1166 - 2356, n=113, ultimi 2 anni) | |
| Cinebench R20 / CPU (Multi Core) | |
| Asus Strix Scar 18 G835LX | |
| Asus ROG Strix Scar 16 2025 | |
| Aorus MASTER 16 AM6H | |
| Lenovo Legion Pro 7i 16 Gen 10 | |
| Media Intel Core Ultra 9 275HX (12026 - 16108, n=30) | |
| Asus ROG Strix G16 G615 | |
| HP Omen Max 16 ah000 | |
| Asus ROG Strix Scar 16 G634JZR | |
| Media della classe Gaming (4029 - 16108, n=112, ultimi 2 anni) | |
| Cinebench R20 / CPU (Single Core) | |
| Asus Strix Scar 18 G835LX | |
| Asus ROG Strix G16 G615 | |
| Aorus MASTER 16 AM6H | |
| Media Intel Core Ultra 9 275HX (774 - 870, n=30) | |
| Asus ROG Strix Scar 16 2025 | |
| Asus ROG Strix Scar 16 G634JZR | |
| Lenovo Legion Pro 7i 16 Gen 10 | |
| HP Omen Max 16 ah000 | |
| Media della classe Gaming (442 - 895, n=112, ultimi 2 anni) | |
| Cinebench R15 / CPU Multi 64Bit | |
| Asus Strix Scar 18 G835LX | |
| Asus ROG Strix G16 G615 | |
| Asus ROG Strix Scar 16 2025 | |
| Lenovo Legion Pro 7i 16 Gen 10 | |
| Aorus MASTER 16 AM6H | |
| Media Intel Core Ultra 9 275HX (4737 - 6271, n=30) | |
| HP Omen Max 16 ah000 | |
| Asus ROG Strix Scar 16 G634JZR | |
| Media della classe Gaming (1578 - 6271, n=113, ultimi 2 anni) | |
| Cinebench R15 / CPU Single 64Bit | |
| Asus Strix Scar 18 G835LX | |
| Asus ROG Strix Scar 16 2025 | |
| Asus ROG Strix G16 G615 | |
| Lenovo Legion Pro 7i 16 Gen 10 | |
| Aorus MASTER 16 AM6H | |
| Media Intel Core Ultra 9 275HX (306 - 343, n=31) | |
| HP Omen Max 16 ah000 | |
| Asus ROG Strix Scar 16 G634JZR | |
| Media della classe Gaming (188.8 - 343, n=112, ultimi 2 anni) | |
| Blender / v2.79 BMW27 CPU | |
| Media della classe Gaming (80 - 330, n=110, ultimi 2 anni) | |
| Asus ROG Strix Scar 16 G634JZR | |
| HP Omen Max 16 ah000 | |
| Media Intel Core Ultra 9 275HX (82 - 116, n=29) | |
| Aorus MASTER 16 AM6H | |
| Lenovo Legion Pro 7i 16 Gen 10 | |
| Asus Strix Scar 18 G835LX | |
| Asus ROG Strix Scar 16 2025 | |
| Asus ROG Strix G16 G615 | |
| 7-Zip 18.03 / 7z b 4 | |
| Asus Strix Scar 18 G835LX | |
| Asus ROG Strix Scar 16 G634JZR | |
| Asus ROG Strix Scar 16 2025 | |
| Asus ROG Strix G16 G615 | |
| Lenovo Legion Pro 7i 16 Gen 10 | |
| Media Intel Core Ultra 9 275HX (98236 - 124155, n=30) | |
| Aorus MASTER 16 AM6H | |
| HP Omen Max 16 ah000 | |
| Media della classe Gaming (33491 - 148086, n=111, ultimi 2 anni) | |
| 7-Zip 18.03 / 7z b 4 -mmt1 | |
| Asus ROG Strix Scar 16 G634JZR | |
| Asus ROG Strix G16 G615 | |
| Asus Strix Scar 18 G835LX | |
| Media Intel Core Ultra 9 275HX (6026 - 7149, n=30) | |
| Aorus MASTER 16 AM6H | |
| Asus ROG Strix Scar 16 2025 | |
| Lenovo Legion Pro 7i 16 Gen 10 | |
| Media della classe Gaming (4199 - 7436, n=111, ultimi 2 anni) | |
| HP Omen Max 16 ah000 | |
| Geekbench 6.7 / Multi-Core | |
| Asus Strix Scar 18 G835LX | |
| Asus ROG Strix Scar 16 2025 | |
| Asus ROG Strix G16 G615 | |
| Media Intel Core Ultra 9 275HX (16033 - 21668, n=33) | |
| Aorus MASTER 16 AM6H | |
| Lenovo Legion Pro 7i 16 Gen 10 | |
| Asus ROG Strix Scar 16 G634JZR | |
| HP Omen Max 16 ah000 | |
| Media della classe Gaming (6625 - 22104, n=112, ultimi 2 anni) | |
| Geekbench 6.7 / Single-Core | |
| Asus Strix Scar 18 G835LX | |
| Asus ROG Strix Scar 16 2025 | |
| Lenovo Legion Pro 7i 16 Gen 10 | |
| Aorus MASTER 16 AM6H | |
| Media Intel Core Ultra 9 275HX (2843 - 3160, n=33) | |
| Asus ROG Strix Scar 16 G634JZR | |
| Asus ROG Strix G16 G615 | |
| HP Omen Max 16 ah000 | |
| Media della classe Gaming (1490 - 3259, n=112, ultimi 2 anni) | |
| Geekbench 5.5 / Multi-Core | |
| Asus Strix Scar 18 G835LX | |
| Asus ROG Strix Scar 16 2025 | |
| Asus ROG Strix G16 G615 | |
| Media Intel Core Ultra 9 275HX (19105 - 25855, n=31) | |
| Lenovo Legion Pro 7i 16 Gen 10 | |
| Aorus MASTER 16 AM6H | |
| Asus ROG Strix Scar 16 G634JZR | |
| HP Omen Max 16 ah000 | |
| Media della classe Gaming (6460 - 27010, n=111, ultimi 2 anni) | |
| Geekbench 5.5 / Single-Core | |
| Asus Strix Scar 18 G835LX | |
| Asus ROG Strix Scar 16 2025 | |
| Aorus MASTER 16 AM6H | |
| Asus ROG Strix Scar 16 G634JZR | |
| Media Intel Core Ultra 9 275HX (2033 - 2292, n=31) | |
| Lenovo Legion Pro 7i 16 Gen 10 | |
| Asus ROG Strix G16 G615 | |
| Media della classe Gaming (986 - 2474, n=111, ultimi 2 anni) | |
| HP Omen Max 16 ah000 | |
| HWBOT x265 Benchmark v2.2 / 4k Preset | |
| Asus Strix Scar 18 G835LX | |
| Asus ROG Strix Scar 16 2025 | |
| Asus ROG Strix G16 G615 | |
| Lenovo Legion Pro 7i 16 Gen 10 | |
| Media Intel Core Ultra 9 275HX (30.7 - 43.8, n=30) | |
| Aorus MASTER 16 AM6H | |
| HP Omen Max 16 ah000 | |
| Asus ROG Strix Scar 16 G634JZR | |
| Media della classe Gaming (11.5 - 44.3, n=111, ultimi 2 anni) | |
| LibreOffice / 20 Documents To PDF | |
| Media della classe Gaming (19 - 88.8, n=111, ultimi 2 anni) | |
| Asus ROG Strix Scar 16 G634JZR | |
| Media Intel Core Ultra 9 275HX (33.2 - 62.1, n=30) | |
| HP Omen Max 16 ah000 | |
| Asus Strix Scar 18 G835LX | |
| Asus ROG Strix Scar 16 2025 | |
| Aorus MASTER 16 AM6H | |
| Asus ROG Strix G16 G615 | |
| Lenovo Legion Pro 7i 16 Gen 10 | |
| R Benchmark 2.5 / Overall mean | |
| HP Omen Max 16 ah000 | |
| Aorus MASTER 16 AM6H | |
| Media della classe Gaming (0.3439 - 0.759, n=112, ultimi 2 anni) | |
| Media Intel Core Ultra 9 275HX (0.3943 - 0.4568, n=30) | |
| Asus ROG Strix Scar 16 2025 | |
| Lenovo Legion Pro 7i 16 Gen 10 | |
| Asus ROG Strix G16 G615 | |
| Asus Strix Scar 18 G835LX | |
| Asus ROG Strix Scar 16 G634JZR | |
* ... Meglio usare valori piccoli
AIDA64: FP32 Ray-Trace | FPU Julia | CPU SHA3 | CPU Queen | FPU SinJulia | FPU Mandel | CPU AES | CPU ZLib | FP64 Ray-Trace | CPU PhotoWorxx
| Performance rating | |
| Asus ROG Strix Scar 16 2025 | |
| Asus ROG Strix G16 G615 | |
| Aorus MASTER 16 AM6H | |
| Lenovo Legion Pro 7i 16 Gen 10 | |
| Media Intel Core Ultra 9 275HX | |
| HP Omen Max 16 ah000 | |
| Asus ROG Strix Scar 16 G634JZR | |
| Media della classe Gaming | |
| AIDA64 / FP32 Ray-Trace | |
| Asus ROG Strix Scar 16 2025 | |
| Asus ROG Strix G16 G615 | |
| Aorus MASTER 16 AM6H | |
| Lenovo Legion Pro 7i 16 Gen 10 | |
| Media Intel Core Ultra 9 275HX (28039 - 39895, n=30) | |
| HP Omen Max 16 ah000 | |
| Media della classe Gaming (10227 - 85542, n=110, ultimi 2 anni) | |
| Asus ROG Strix Scar 16 G634JZR | |
| AIDA64 / FPU Julia | |
| Asus ROG Strix G16 G615 | |
| Asus ROG Strix Scar 16 2025 | |
| Aorus MASTER 16 AM6H | |
| Lenovo Legion Pro 7i 16 Gen 10 | |
| Media Intel Core Ultra 9 275HX (140254 - 200744, n=30) | |
| HP Omen Max 16 ah000 | |
| Media della classe Gaming (51376 - 238426, n=110, ultimi 2 anni) | |
| Asus ROG Strix Scar 16 G634JZR | |
| AIDA64 / CPU SHA3 | |
| Asus ROG Strix Scar 16 2025 | |
| Asus ROG Strix G16 G615 | |
| Aorus MASTER 16 AM6H | |
| Lenovo Legion Pro 7i 16 Gen 10 | |
| Media Intel Core Ultra 9 275HX (6710 - 9817, n=30) | |
| HP Omen Max 16 ah000 | |
| Asus ROG Strix Scar 16 G634JZR | |
| Media della classe Gaming (2180 - 9817, n=110, ultimi 2 anni) | |
| AIDA64 / CPU Queen | |
| Asus ROG Strix Scar 16 G634JZR | |
| Asus ROG Strix Scar 16 2025 | |
| Asus ROG Strix G16 G615 | |
| Lenovo Legion Pro 7i 16 Gen 10 | |
| Aorus MASTER 16 AM6H | |
| Media Intel Core Ultra 9 275HX (113887 - 140937, n=30) | |
| HP Omen Max 16 ah000 | |
| Media della classe Gaming (49785 - 173351, n=101, ultimi 2 anni) | |
| AIDA64 / FPU SinJulia | |
| Asus ROG Strix Scar 16 G634JZR | |
| Media della classe Gaming (4424 - 33636, n=110, ultimi 2 anni) | |
| Lenovo Legion Pro 7i 16 Gen 10 | |
| Asus ROG Strix Scar 16 2025 | |
| Asus ROG Strix G16 G615 | |
| Aorus MASTER 16 AM6H | |
| Media Intel Core Ultra 9 275HX (11172 - 14425, n=30) | |
| HP Omen Max 16 ah000 | |
| AIDA64 / FPU Mandel | |
| Asus ROG Strix G16 G615 | |
| Asus ROG Strix Scar 16 2025 | |
| Aorus MASTER 16 AM6H | |
| Lenovo Legion Pro 7i 16 Gen 10 | |
| Media Intel Core Ultra 9 275HX (72596 - 104508, n=30) | |
| HP Omen Max 16 ah000 | |
| Media della classe Gaming (25115 - 128721, n=110, ultimi 2 anni) | |
| Asus ROG Strix Scar 16 G634JZR | |
| AIDA64 / CPU AES | |
| Asus ROG Strix Scar 16 G634JZR | |
| Asus ROG Strix G16 G615 | |
| Lenovo Legion Pro 7i 16 Gen 10 | |
| Asus ROG Strix Scar 16 2025 | |
| Media Intel Core Ultra 9 275HX (105608 - 247074, n=30) | |
| Aorus MASTER 16 AM6H | |
| HP Omen Max 16 ah000 | |
| Media della classe Gaming (39258 - 247074, n=110, ultimi 2 anni) | |
| AIDA64 / CPU ZLib | |
| Asus ROG Strix G16 G615 | |
| Asus ROG Strix Scar 16 2025 | |
| Aorus MASTER 16 AM6H | |
| Lenovo Legion Pro 7i 16 Gen 10 | |
| Media Intel Core Ultra 9 275HX (1582 - 2263, n=30) | |
| HP Omen Max 16 ah000 | |
| Asus ROG Strix Scar 16 G634JZR | |
| Media della classe Gaming (574 - 2531, n=110, ultimi 2 anni) | |
| AIDA64 / FP64 Ray-Trace | |
| Asus ROG Strix Scar 16 2025 | |
| Asus ROG Strix G16 G615 | |
| Aorus MASTER 16 AM6H | |
| Lenovo Legion Pro 7i 16 Gen 10 | |
| Media Intel Core Ultra 9 275HX (14847 - 21854, n=30) | |
| HP Omen Max 16 ah000 | |
| Media della classe Gaming (5509 - 45446, n=110, ultimi 2 anni) | |
| Asus ROG Strix Scar 16 G634JZR | |
| AIDA64 / CPU PhotoWorxx | |
| Asus ROG Strix Scar 16 2025 | |
| Lenovo Legion Pro 7i 16 Gen 10 | |
| Media Intel Core Ultra 9 275HX (37482 - 62916, n=30) | |
| Asus ROG Strix Scar 16 G634JZR | |
| HP Omen Max 16 ah000 | |
| Aorus MASTER 16 AM6H | |
| Asus ROG Strix G16 G615 | |
| Media della classe Gaming (12271 - 89891, n=110, ultimi 2 anni) | |
Prestazioni del sistema
Come previsto, Strix SCAR 16 è un dispositivo super veloce e non abbiamo avuto problemi di stabilità del sistema durante il nostro test. C'è stato solo un leggero intoppo quando si cambiava grafica, ma questo è in linea con lo stato attuale della tecnologia.
CrossMark: Overall | Productivity | Creativity | Responsiveness
WebXPRT 3: Overall
WebXPRT 4: Overall
Mozilla Kraken 1.1: Total
| PCMark 10 / Score | |
| Lenovo Legion Pro 7i 16 Gen 10 | |
| Asus ROG Strix G16 G615 | |
| Asus ROG Strix Scar 16 2025 | |
| HP Omen Max 16 ah000 | |
| Media Intel Core Ultra 9 275HX, NVIDIA GeForce RTX 5090 Laptop (7474 - 9497, n=11) | |
| Media della classe Gaming (5828 - 11574, n=96, ultimi 2 anni) | |
| Aorus MASTER 16 AM6H | |
| Asus ROG Strix Scar 16 G634JZR | |
| PCMark 10 / Essentials | |
| Asus ROG Strix Scar 16 G634JZR | |
| Lenovo Legion Pro 7i 16 Gen 10 | |
| Asus ROG Strix G16 G615 | |
| Asus ROG Strix Scar 16 2025 | |
| HP Omen Max 16 ah000 | |
| Media Intel Core Ultra 9 275HX, NVIDIA GeForce RTX 5090 Laptop (9994 - 11369, n=12) | |
| Media della classe Gaming (8810 - 12600, n=100, ultimi 2 anni) | |
| Aorus MASTER 16 AM6H | |
| PCMark 10 / Productivity | |
| Media della classe Gaming (6845 - 18766, n=98, ultimi 2 anni) | |
| Media Intel Core Ultra 9 275HX, NVIDIA GeForce RTX 5090 Laptop (9122 - 10925, n=11) | |
| Lenovo Legion Pro 7i 16 Gen 10 | |
| Aorus MASTER 16 AM6H | |
| Asus ROG Strix G16 G615 | |
| Asus ROG Strix Scar 16 2025 | |
| HP Omen Max 16 ah000 | |
| Asus ROG Strix Scar 16 G634JZR | |
| PCMark 10 / Digital Content Creation | |
| Lenovo Legion Pro 7i 16 Gen 10 | |
| HP Omen Max 16 ah000 | |
| Asus ROG Strix G16 G615 | |
| Asus ROG Strix Scar 16 2025 | |
| Media Intel Core Ultra 9 275HX, NVIDIA GeForce RTX 5090 Laptop (9952 - 19234, n=11) | |
| Aorus MASTER 16 AM6H | |
| Asus ROG Strix Scar 16 G634JZR | |
| Media della classe Gaming (7602 - 19657, n=98, ultimi 2 anni) | |
| CrossMark / Overall | |
| Aorus MASTER 16 AM6H | |
| Media Intel Core Ultra 9 275HX, NVIDIA GeForce RTX 5090 Laptop (1995 - 2339, n=12) | |
| Asus ROG Strix G16 G615 | |
| Asus ROG Strix Scar 16 2025 | |
| Asus ROG Strix Scar 16 G634JZR | |
| Lenovo Legion Pro 7i 16 Gen 10 | |
| HP Omen Max 16 ah000 | |
| Media della classe Gaming (1366 - 2409, n=98, ultimi 2 anni) | |
| CrossMark / Productivity | |
| Aorus MASTER 16 AM6H | |
| Media Intel Core Ultra 9 275HX, NVIDIA GeForce RTX 5090 Laptop (1847 - 2211, n=12) | |
| Asus ROG Strix G16 G615 | |
| Asus ROG Strix Scar 16 2025 | |
| Lenovo Legion Pro 7i 16 Gen 10 | |
| Asus ROG Strix Scar 16 G634JZR | |
| Media della classe Gaming (1386 - 2254, n=98, ultimi 2 anni) | |
| HP Omen Max 16 ah000 | |
| CrossMark / Creativity | |
| Asus ROG Strix Scar 16 2025 | |
| Media Intel Core Ultra 9 275HX, NVIDIA GeForce RTX 5090 Laptop (2170 - 2642, n=12) | |
| Aorus MASTER 16 AM6H | |
| Asus ROG Strix G16 G615 | |
| Asus ROG Strix Scar 16 G634JZR | |
| Lenovo Legion Pro 7i 16 Gen 10 | |
| HP Omen Max 16 ah000 | |
| Media della classe Gaming (1343 - 2729, n=98, ultimi 2 anni) | |
| CrossMark / Responsiveness | |
| Aorus MASTER 16 AM6H | |
| Media Intel Core Ultra 9 275HX, NVIDIA GeForce RTX 5090 Laptop (1673 - 2217, n=12) | |
| Asus ROG Strix G16 G615 | |
| Asus ROG Strix Scar 16 G634JZR | |
| Media della classe Gaming (1226 - 2334, n=98, ultimi 2 anni) | |
| Asus ROG Strix Scar 16 2025 | |
| HP Omen Max 16 ah000 | |
| Lenovo Legion Pro 7i 16 Gen 10 | |
| WebXPRT 3 / Overall | |
| HP Omen Max 16 ah000 | |
| Lenovo Legion Pro 7i 16 Gen 10 | |
| Asus ROG Strix G16 G615 | |
| Media Intel Core Ultra 9 275HX, NVIDIA GeForce RTX 5090 Laptop (315 - 372, n=12) | |
| Aorus MASTER 16 AM6H | |
| Asus ROG Strix Scar 16 2025 | |
| Media della classe Gaming (242 - 532, n=101, ultimi 2 anni) | |
| Asus ROG Strix Scar 16 G634JZR | |
| WebXPRT 4 / Overall | |
| Asus ROG Strix Scar 16 2025 | |
| Asus ROG Strix G16 G615 | |
| Aorus MASTER 16 AM6H | |
| Lenovo Legion Pro 7i 16 Gen 10 | |
| Media Intel Core Ultra 9 275HX, NVIDIA GeForce RTX 5090 Laptop (301 - 341, n=11) | |
| Asus ROG Strix Scar 16 G634JZR | |
| Media della classe Gaming (176.4 - 354, n=101, ultimi 2 anni) | |
| Mozilla Kraken 1.1 / Total | |
| Media della classe Gaming (391 - 590, n=106, ultimi 2 anni) | |
| Asus ROG Strix Scar 16 G634JZR | |
| HP Omen Max 16 ah000 | |
| Asus ROG Strix Scar 16 2025 | |
| Media Intel Core Ultra 9 275HX, NVIDIA GeForce RTX 5090 Laptop (402 - 424, n=12) | |
| Aorus MASTER 16 AM6H | |
| Lenovo Legion Pro 7i 16 Gen 10 | |
| Asus ROG Strix G16 G615 | |
* ... Meglio usare valori piccoli
| PCMark 10 Score | 8819 punti | |
Aiuto | ||
| AIDA64 / Memory Copy | |
| Asus ROG Strix G16 G615 | |
| Lenovo Legion Pro 7i 16 Gen 10 | |
| Asus ROG Strix Scar 16 2025 | |
| Media Intel Core Ultra 9 275HX (56003 - 94460, n=30) | |
| Asus ROG Strix Scar 16 G634JZR | |
| HP Omen Max 16 ah000 | |
| Aorus MASTER 16 AM6H | |
| Media della classe Gaming (21750 - 129946, n=110, ultimi 2 anni) | |
| AIDA64 / Memory Read | |
| Lenovo Legion Pro 7i 16 Gen 10 | |
| Asus ROG Strix Scar 16 2025 | |
| Asus ROG Strix Scar 16 G634JZR | |
| Media Intel Core Ultra 9 275HX (55795 - 97151, n=30) | |
| HP Omen Max 16 ah000 | |
| Asus ROG Strix G16 G615 | |
| Aorus MASTER 16 AM6H | |
| Media della classe Gaming (22956 - 118858, n=110, ultimi 2 anni) | |
| AIDA64 / Memory Write | |
| Lenovo Legion Pro 7i 16 Gen 10 | |
| Asus ROG Strix Scar 16 2025 | |
| Media Intel Core Ultra 9 275HX (55663 - 116129, n=30) | |
| HP Omen Max 16 ah000 | |
| Asus ROG Strix Scar 16 G634JZR | |
| Media della classe Gaming (22297 - 135096, n=110, ultimi 2 anni) | |
| Asus ROG Strix G16 G615 | |
| Aorus MASTER 16 AM6H | |
| AIDA64 / Memory Latency | |
| HP Omen Max 16 ah000 | |
| Media Intel Core Ultra 9 275HX (105.8 - 161.6, n=30) | |
| Aorus MASTER 16 AM6H | |
| Asus ROG Strix G16 G615 | |
| Asus ROG Strix Scar 16 2025 | |
| Lenovo Legion Pro 7i 16 Gen 10 | |
| Media della classe Gaming (75.3 - 259, n=110, ultimi 2 anni) | |
| Asus ROG Strix Scar 16 G634JZR | |
* ... Meglio usare valori piccoli
Latenze DPC
Nel nostro test di latenza standardizzato (navigazione web, riproduzione YouTube 4K, carico della CPU), il dispositivo di prova con l'attuale versione del BIOS ha mostrato leggere limitazioni quando si utilizzavano applicazioni audio in tempo reale.


| DPC Latencies / LatencyMon - interrupt to process latency (max), Web, Youtube, Prime95 | |
| Asus ROG Strix Scar 16 G634JZR | |
| Asus ROG Strix Scar 16 2025 | |
| Aorus MASTER 16 AM6H | |
| HP Omen Max 16 ah000 | |
| Asus ROG Strix G16 G615 | |
| Lenovo Legion Pro 7i 16 Gen 10 | |
* ... Meglio usare valori piccoli
Dispositivo di archiviazione
ROG Strix SCAR 16 dispone di due slot per SSD M.2 2280, ma non supportano ancora il PCIe 5.0. Il nostro dispositivo di prova è dotato di un'unità da 2 TB (1,73 TB liberi per l'utente) di Western Digital, che ha fornito velocità di trasferimento elevate e stabili durante il nostro test.

* ... Meglio usare valori piccoli
Reading continuous performance: DiskSpd Read Loop, Queue Depth 8
Prestazioni della GPU
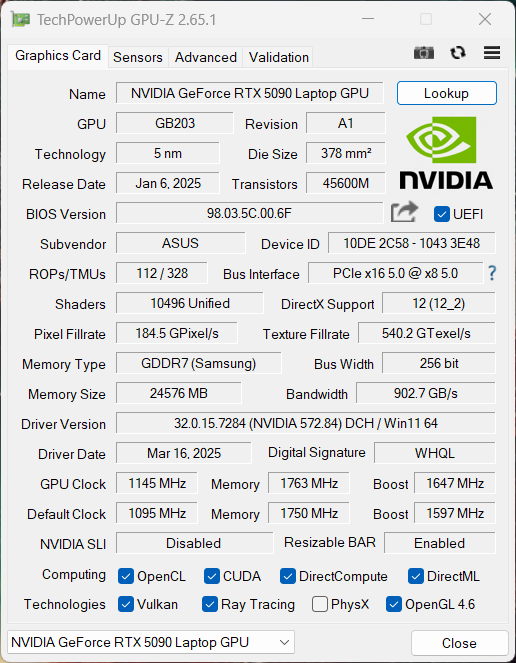
Il nostro dispositivo di prova utilizza la nuova GeForce RTX 5090 Laptop con 24 GB di VRAM (Advanced Optimus). Si tratta della versione da 175 watt (150 watt + 25 watt Dynamic Boost), e i suoi risultati di benchmark sono stati molto buoni. Non abbiamo notato alcuno svantaggio rispetto al più grande ROG Strix SCAR 18.
Le sue prestazioni sono altrettanto buone quando si gioca, anche se il 5090 Laptop non è ancora riuscito a mostrare i suoi punti di forza nei nostri test standard a 1080p. Nella risoluzione QHD, il 5090 Laptop ha quasi sempre superato il 5080 Laptop, ma come abbiamo visto nella nostra Analisi della GPUil 5090 Laptop è particolarmente adatto alla risoluzione 4K. Se vuole giocare solo sul display interno del dispositivo e non beneficia della VRAM aggiuntiva in nessun altro modo (ad esempio per l'editing video), allora la RTX 5080 Laptop è perfettamente adeguata.
| 3DMark 11 Performance | 47965 punti | |
| 3DMark Fire Strike Score | 38818 punti | |
| 3DMark Time Spy Score | 22241 punti | |
| 3DMark Steel Nomad Score | 6008 punti | |
Aiuto | ||
| Blender / v3.3 Classroom OPTIX/RTX | |
| Media della classe Gaming (9 - 32, n=112, ultimi 2 anni) | |
| Asus ROG Strix Scar 16 2025 | |
| Asus ROG Strix Scar 16 G634JZR | |
| HP Omen Max 16 ah000 | |
| Lenovo Legion Pro 7i 16 Gen 10 | |
| Media NVIDIA GeForce RTX 5090 Laptop (9 - 18, n=21) | |
| Asus ROG Strix G16 G615 | |
| Aorus MASTER 16 AM6H | |
| Blender / v3.3 Classroom CUDA | |
| Media della classe Gaming (15 - 228, n=112, ultimi 2 anni) | |
| Asus ROG Strix Scar 16 G634JZR | |
| Asus ROG Strix G16 G615 | |
| Asus ROG Strix Scar 16 2025 | |
| Lenovo Legion Pro 7i 16 Gen 10 | |
| Media NVIDIA GeForce RTX 5090 Laptop (15 - 37, n=20) | |
| Aorus MASTER 16 AM6H | |
| HP Omen Max 16 ah000 | |
| Blender / v3.3 Classroom CPU | |
| Media della classe Gaming (122 - 565, n=108, ultimi 2 anni) | |
| Asus ROG Strix Scar 16 G634JZR | |
| Media NVIDIA GeForce RTX 5090 Laptop (123 - 282, n=21) | |
| HP Omen Max 16 ah000 | |
| Aorus MASTER 16 AM6H | |
| Lenovo Legion Pro 7i 16 Gen 10 | |
| Asus ROG Strix Scar 16 2025 | |
| Asus ROG Strix G16 G615 | |
* ... Meglio usare valori piccoli
| F1 24 - 2560x1440 Ultra High Preset AA:T AF:16x | |
| HP Omen Max 16 ah000 | |
| Asus ROG Strix Scar 16 2025 | |
| Media NVIDIA GeForce RTX 5090 Laptop (72.5 - 106.9, n=22) | |
| Aorus MASTER 16 AM6H | |
| Asus ROG Strix G16 G615 | |
| Media della classe Gaming (29.8 - 106.9, n=60, ultimi 2 anni) | |
| Call of Duty Black Ops 6 - 2560x1440 Extreme Preset | |
| Media NVIDIA GeForce RTX 5090 Laptop (92 - 151, n=8) | |
| Media della classe Gaming (60 - 151, n=15, ultimi 2 anni) | |
| Asus ROG Strix Scar 16 2025 | |
Cyberpunk 2077 ultra FPS diagram
| basso | medio | alto | ultra | QHD | |
|---|---|---|---|---|---|
| GTA V (2015) | 162.8 | 158 | |||
| Dota 2 Reborn (2015) | 223 | 184.1 | 177.5 | 167.2 | |
| Final Fantasy XV Benchmark (2018) | 234 | 230 | 194.6 | 157 | |
| X-Plane 11.11 (2018) | 158 | 143.3 | 115.9 | ||
| Strange Brigade (2018) | 553 | 398 | 397 | 375 | 315 |
| Baldur's Gate 3 (2023) | 250 | 218.2 | 196.7 | 193.3 | 141.7 |
| Cyberpunk 2077 (2023) | 191.2 | 187.9 | 168.9 | 153.6 | 107.7 |
| Alan Wake 2 (2023) | 130.5 | 129.6 | 120.6 | 83.4 | |
| F1 24 (2024) | 324 | 144.2 | 97.8 | ||
| Call of Duty Black Ops 6 (2024) | 201 | 186 | 135 | 128 | 92 |
| Indiana Jones and the Great Circle (2024) | 187.5 | 138.2 | 121.9 | 99.1 |
Emissioni e gestione dell'energia
Emissioni di rumore

Il raffreddamento del portatile è costituito da una grande camera di vapore e da tre ventole. Consigliamo sempre di utilizzare la modalità Quiet per le attività semplici, in quanto le ventole vengono spesso disattivate. In modalità Turbo, invece, abbiamo notato un rumore di fondo costante di 29 dB(A). Durante il gioco, ha anche raggiunto rapidamente i 53,6 dB(A). I rivali diventano un po' più rumorosi, ma anche in questo caso non è possibile evitare le cuffie. Non c'erano altri rumori elettronici provenienti dal nostro dispositivo di prova.
Rumorosità
| Idle |
| 29 / 29 / 29 dB(A) |
| Sotto carico |
| 40.5 / 53.6 dB(A) |
 | ||
30 dB silenzioso 40 dB(A) udibile 50 dB(A) rumoroso |
||
min: | ||
| Asus ROG Strix Scar 16 2025 GeForce RTX 5090 Laptop, Ultra 9 275HX, WD PC SN8000S 2TB | Asus ROG Strix G16 G615 GeForce RTX 5080 Laptop, Ultra 9 275HX, Micron 2500 1TB MTFDKBA1T0QGN | Lenovo Legion Pro 7i 16 Gen 10 GeForce RTX 5080 Laptop, Ultra 9 275HX, SK Hynix HFS001TEJ9X115N | HP Omen Max 16 ah000 GeForce RTX 5090 Laptop, Ultra 9 275HX, WDC PC SN810 2TB | Aorus MASTER 16 AM6H GeForce RTX 5090 Laptop, Ultra 9 275HX, Kingston OM8PGP41024Q-A0 | Asus ROG Strix Scar 16 G634JZR GeForce RTX 4080 Laptop GPU, i9-14900HX, SK hynix PC801 HFS002TEJ9X101N | |
|---|---|---|---|---|---|---|
| Noise | 1% | 12% | -4% | 6% | -7% | |
| off /ambiente * (dB) | 23.8 | 24 -1% | 22.9 4% | 22.8 4% | 23 3% | 21.07 11% |
| Idle Minimum * (dB) | 29 | 24 17% | 22.9 21% | 29 -0% | 23 21% | 29.75 -3% |
| Idle Average * (dB) | 29 | 30.1 -4% | 22.9 21% | 29 -0% | 23 21% | 29.75 -3% |
| Idle Maximum * (dB) | 29 | 30.1 -4% | 26.3 9% | 29 -0% | 23 21% | 29.75 -3% |
| Load Average * (dB) | 40.5 | 41.1 -1% | 27.8 31% | 47.7 -18% | 40.46 -0% | 54.85 -35% |
| Cyberpunk 2077 ultra * (dB) | 53.6 | 54.2 -1% | 54.2 -1% | 54.8 -2% | 59.75 -11% | |
| Load Maximum * (dB) | 53.6 | 54.2 -1% | 53.9 -1% | 61.1 -14% | 59.75 -11% | 58 -8% |
| Witcher 3 ultra * (dB) | 57.8 |
* ... Meglio usare valori piccoli
Temperatura
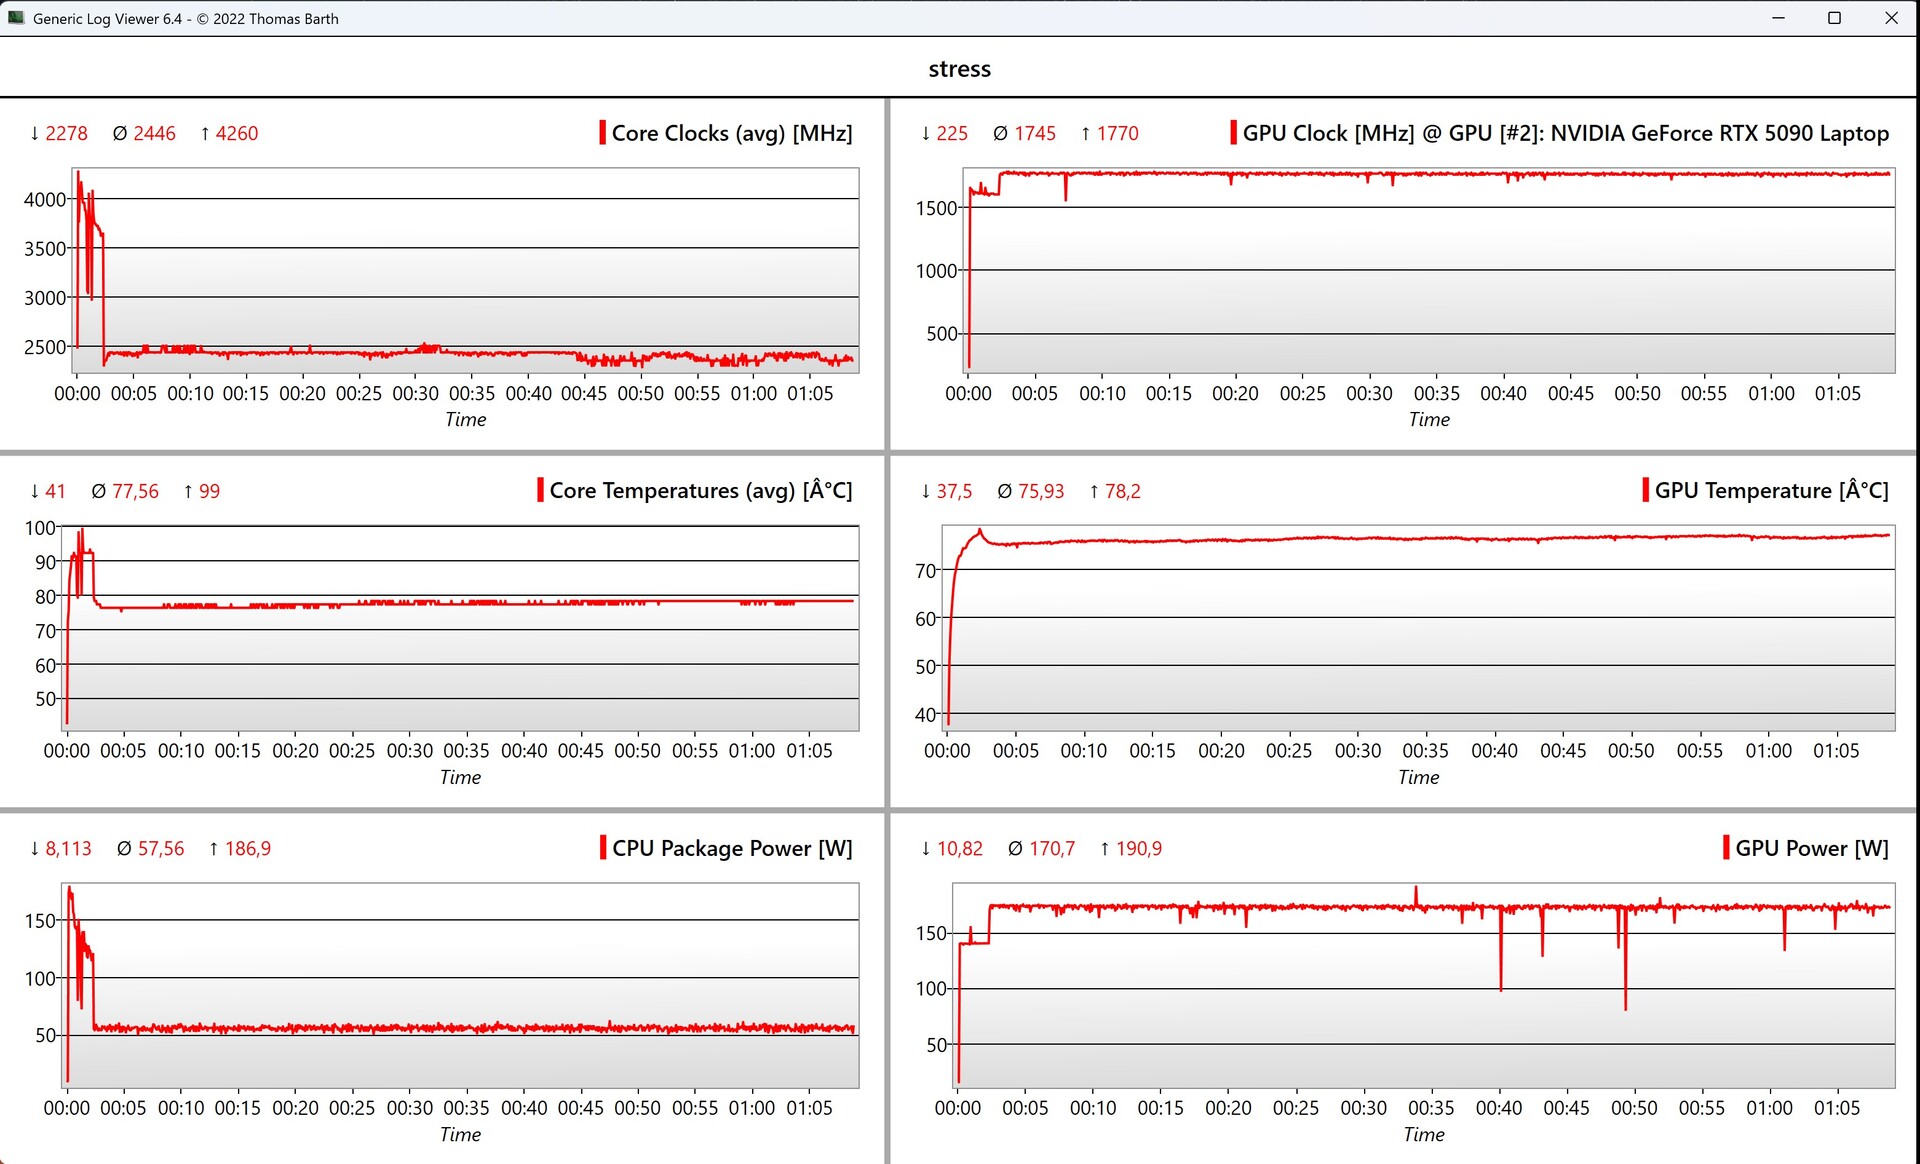
Le superfici del portatile rimangono molto fresche a basso carico e non ci sono state restrizioni durante il gioco durante il nostro test, dato che abbiamo misurato solo poco più di 45 °C nell'area posteriore del lato inferiore. Anche così, la tastiera in particolare è rimasta molto più fresca. Durante lo stress test, il processore e la scheda grafica si sono stabilizzati rispettivamente a 50 e 175 watt.
(±) La temperatura massima sul lato superiore è di 44.2 °C / 112 F, rispetto alla media di 40.4 °C / 105 F, che varia da 21.2 a 68.8 °C per questa classe Gaming.
(-) Il lato inferiore si riscalda fino ad un massimo di 48.1 °C / 119 F, rispetto alla media di 43.2 °C / 110 F
(+) In idle, la temperatura media del lato superiore è di 30.8 °C / 87 F, rispetto alla media deld ispositivo di 33.9 °C / 93 F.
(±) 3: The average temperature for the upper side is 35.1 °C / 95 F, compared to the average of 33.9 °C / 93 F for the class Gaming.
(+) I poggiapolsi e il touchpad raggiungono la temperatura massima della pelle (34.3 °C / 93.7 F) e quindi non sono caldi.
(-) La temperatura media della zona del palmo della mano di dispositivi simili e'stata di 28.8 °C / 83.8 F (-5.5 °C / -9.9 F).


| Asus ROG Strix Scar 16 2025 Intel Core Ultra 9 275HX, NVIDIA GeForce RTX 5090 Laptop | Asus ROG Strix G16 G615 Intel Core Ultra 9 275HX, NVIDIA GeForce RTX 5080 Laptop | Lenovo Legion Pro 7i 16 Gen 10 Intel Core Ultra 9 275HX, NVIDIA GeForce RTX 5080 Laptop | HP Omen Max 16 ah000 Intel Core Ultra 9 275HX, NVIDIA GeForce RTX 5090 Laptop | Aorus MASTER 16 AM6H Intel Core Ultra 9 275HX, NVIDIA GeForce RTX 5090 Laptop | Asus ROG Strix Scar 16 G634JZR Intel Core i9-14900HX, NVIDIA GeForce RTX 4080 Laptop GPU | |
|---|---|---|---|---|---|---|
| Heat | 13% | 7% | 11% | -2% | -2% | |
| Maximum Upper Side * (°C) | 44.2 | 39.6 10% | 42.6 4% | 42.8 3% | 39 12% | 47.8 -8% |
| Maximum Bottom * (°C) | 48.1 | 49.7 -3% | 41.2 14% | 50.2 -4% | 51 -6% | 52.2 -9% |
| Idle Upper Side * (°C) | 33 | 26.3 20% | 32.6 1% | 27.6 16% | 36 -9% | 32.4 2% |
| Idle Bottom * (°C) | 36.1 | 27.3 24% | 32.4 10% | 26.2 27% | 38 -5% | 33 9% |
* ... Meglio usare valori piccoli
Altoparlanti
I suoi altoparlanti stereo fanno un buon lavoro nel complesso e sono perfettamente adeguati per i video o per la musica. Tuttavia, le rumorose ventole del portatile intralciano il gioco.
Asus ROG Strix Scar 16 2025 analisi audio
(±) | potenza degli altiparlanti media ma buona (81.4 dB)
Bassi 100 - 315 Hz
(±) | bassi ridotti - in media 8.4% inferiori alla media
(±) | la linearità dei bassi è media (9.7% delta rispetto alla precedente frequenza)
Medi 400 - 2000 Hz
(±) | medi elevati - circa 5.4% superiore alla media
(+) | medi lineari (2.9% delta rispetto alla precedente frequenza)
Alti 2 - 16 kHz
(+) | Alti bilanciati - appena 1.3% dalla media
(+) | alti lineari (3.8% delta rispetto alla precedente frequenza)
Nel complesso 100 - 16.000 Hz
(+) | suono nel complesso lineare (10.7% differenza dalla media)
Rispetto alla stessa classe
» 7% di tutti i dispositivi testati in questa classe è stato migliore, 2% simile, 91% peggiore
» Il migliore ha avuto un delta di 6%, medio di 18%, peggiore di 132%
Rispetto a tutti i dispositivi testati
» 6% di tutti i dispositivi testati in questa classe è stato migliore, 2% similare, 93% peggiore
» Il migliore ha avuto un delta di 4%, medio di 24%, peggiore di 134%
Asus ROG Strix G16 G615 analisi audio
(+) | gli altoparlanti sono relativamente potenti (82.2 dB)
Bassi 100 - 315 Hz
(±) | bassi ridotti - in media 7.5% inferiori alla media
(±) | la linearità dei bassi è media (7.4% delta rispetto alla precedente frequenza)
Medi 400 - 2000 Hz
(+) | medi bilanciati - solo only 2.9% rispetto alla media
(+) | medi lineari (3.6% delta rispetto alla precedente frequenza)
Alti 2 - 16 kHz
(+) | Alti bilanciati - appena 2.8% dalla media
(±) | la linearità degli alti è media (8.3% delta rispetto alla precedente frequenza)
Nel complesso 100 - 16.000 Hz
(+) | suono nel complesso lineare (9.4% differenza dalla media)
Rispetto alla stessa classe
» 3% di tutti i dispositivi testati in questa classe è stato migliore, 2% simile, 95% peggiore
» Il migliore ha avuto un delta di 6%, medio di 18%, peggiore di 132%
Rispetto a tutti i dispositivi testati
» 3% di tutti i dispositivi testati in questa classe è stato migliore, 1% similare, 96% peggiore
» Il migliore ha avuto un delta di 4%, medio di 24%, peggiore di 134%
Lenovo Legion Pro 7i 16 Gen 10 analisi audio
(±) | potenza degli altiparlanti media ma buona (81.4 dB)
Bassi 100 - 315 Hz
(±) | bassi ridotti - in media 7.6% inferiori alla media
(±) | la linearità dei bassi è media (9.4% delta rispetto alla precedente frequenza)
Medi 400 - 2000 Hz
(+) | medi bilanciati - solo only 4.1% rispetto alla media
(+) | medi lineari (4.8% delta rispetto alla precedente frequenza)
Alti 2 - 16 kHz
(+) | Alti bilanciati - appena 1.9% dalla media
(+) | alti lineari (4.8% delta rispetto alla precedente frequenza)
Nel complesso 100 - 16.000 Hz
(+) | suono nel complesso lineare (9.4% differenza dalla media)
Rispetto alla stessa classe
» 3% di tutti i dispositivi testati in questa classe è stato migliore, 2% simile, 95% peggiore
» Il migliore ha avuto un delta di 6%, medio di 18%, peggiore di 132%
Rispetto a tutti i dispositivi testati
» 3% di tutti i dispositivi testati in questa classe è stato migliore, 1% similare, 96% peggiore
» Il migliore ha avuto un delta di 4%, medio di 24%, peggiore di 134%
HP Omen Max 16 ah000 analisi audio
(±) | potenza degli altiparlanti media ma buona (77.9 dB)
Bassi 100 - 315 Hz
(±) | bassi ridotti - in media 9.9% inferiori alla media
(±) | la linearità dei bassi è media (13.4% delta rispetto alla precedente frequenza)
Medi 400 - 2000 Hz
(+) | medi bilanciati - solo only 2.3% rispetto alla media
(+) | medi lineari (4.3% delta rispetto alla precedente frequenza)
Alti 2 - 16 kHz
(+) | Alti bilanciati - appena 1.9% dalla media
(+) | alti lineari (4.8% delta rispetto alla precedente frequenza)
Nel complesso 100 - 16.000 Hz
(+) | suono nel complesso lineare (11.4% differenza dalla media)
Rispetto alla stessa classe
» 9% di tutti i dispositivi testati in questa classe è stato migliore, 3% simile, 88% peggiore
» Il migliore ha avuto un delta di 6%, medio di 18%, peggiore di 132%
Rispetto a tutti i dispositivi testati
» 7% di tutti i dispositivi testati in questa classe è stato migliore, 2% similare, 91% peggiore
» Il migliore ha avuto un delta di 4%, medio di 24%, peggiore di 134%
Aorus MASTER 16 AM6H analisi audio
(±) | potenza degli altiparlanti media ma buona (75.36 dB)
Bassi 100 - 315 Hz
(±) | bassi ridotti - in media 12.6% inferiori alla media
(±) | la linearità dei bassi è media (9% delta rispetto alla precedente frequenza)
Medi 400 - 2000 Hz
(+) | medi bilanciati - solo only 2.8% rispetto alla media
(+) | medi lineari (4.4% delta rispetto alla precedente frequenza)
Alti 2 - 16 kHz
(+) | Alti bilanciati - appena 1.8% dalla media
(+) | alti lineari (3.8% delta rispetto alla precedente frequenza)
Nel complesso 100 - 16.000 Hz
(+) | suono nel complesso lineare (13.5% differenza dalla media)
Rispetto alla stessa classe
» 19% di tutti i dispositivi testati in questa classe è stato migliore, 7% simile, 73% peggiore
» Il migliore ha avuto un delta di 6%, medio di 18%, peggiore di 132%
Rispetto a tutti i dispositivi testati
» 14% di tutti i dispositivi testati in questa classe è stato migliore, 4% similare, 82% peggiore
» Il migliore ha avuto un delta di 4%, medio di 24%, peggiore di 134%
Asus ROG Strix Scar 16 G634JZR analisi audio
(±) | potenza degli altiparlanti media ma buona (79 dB)
Bassi 100 - 315 Hz
(±) | bassi ridotti - in media 7.1% inferiori alla media
(±) | la linearità dei bassi è media (9% delta rispetto alla precedente frequenza)
Medi 400 - 2000 Hz
(±) | medi elevati - circa 5.5% superiore alla media
(+) | medi lineari (3.3% delta rispetto alla precedente frequenza)
Alti 2 - 16 kHz
(+) | Alti bilanciati - appena 1.4% dalla media
(+) | alti lineari (2.6% delta rispetto alla precedente frequenza)
Nel complesso 100 - 16.000 Hz
(+) | suono nel complesso lineare (9.8% differenza dalla media)
Rispetto alla stessa classe
» 5% di tutti i dispositivi testati in questa classe è stato migliore, 1% simile, 94% peggiore
» Il migliore ha avuto un delta di 6%, medio di 18%, peggiore di 132%
Rispetto a tutti i dispositivi testati
» 4% di tutti i dispositivi testati in questa classe è stato migliore, 1% similare, 95% peggiore
» Il migliore ha avuto un delta di 4%, medio di 24%, peggiore di 134%
Consumo di energia

ROG Strix SCAR 16 non è affatto un computer portatile frugale e il suo mini pannello LED richiede molta energia, soprattutto ad alti livelli di luminosità. Durante lo stress test, abbiamo misurato brevemente un massimo di 370 watt, che poi si è rapidamente stabilizzato a circa 310 watt. Quando si gioca, ci si può aspettare circa 290 watt, motivo per cui l'alimentatore da 380 watt in dotazione è decisamente sufficiente. Il consumo in standby di 2,3 watt (nonostante l'illuminazione disattivata) è troppo elevato.
| Off / Standby | |
| Idle | |
| Sotto carico |
|
Leggenda:
min: | |
| Asus ROG Strix Scar 16 2025 Ultra 9 275HX, GeForce RTX 5090 Laptop, WD PC SN8000S 2TB, Mini-LED, 2560x1600, 16" | Asus ROG Strix G16 G615 Ultra 9 275HX, GeForce RTX 5080 Laptop, Micron 2500 1TB MTFDKBA1T0QGN, IPS, 2560x1600, 16" | Lenovo Legion Pro 7i 16 Gen 10 Ultra 9 275HX, GeForce RTX 5080 Laptop, SK Hynix HFS001TEJ9X115N, OLED, 2560x1600, 16" | HP Omen Max 16 ah000 Ultra 9 275HX, GeForce RTX 5090 Laptop, WDC PC SN810 2TB, OLED, 2560x1600, 16" | Aorus MASTER 16 AM6H Ultra 9 275HX, GeForce RTX 5090 Laptop, Kingston OM8PGP41024Q-A0, OLED, 2560x1600, 16" | Asus ROG Strix Scar 16 G634JZR i9-14900HX, GeForce RTX 4080 Laptop GPU, SK hynix PC801 HFS002TEJ9X101N, Mini LED, 2560x1600, 16" | Media NVIDIA GeForce RTX 5090 Laptop | Media della classe Gaming | |
|---|---|---|---|---|---|---|---|---|
| Power Consumption | 23% | -11% | 17% | 8% | 31% | 19% | 36% | |
| Idle Minimum * (Watt) | 22.5 | 10.8 52% | 28.5 -27% | 9.9 56% | 25 -11% | 10.71 52% | 16.2 ? 28% | 13.3 ? 41% |
| Idle Average * (Watt) | 32.2 | 17.7 45% | 38.8 -20% | 28.6 11% | 29.4 9% | 14.75 54% | 24.3 ? 25% | 19 ? 41% |
| Idle Maximum * (Watt) | 34.3 | 18.8 45% | 45.6 -33% | 47.1 -37% | 31 10% | 30 13% | 30.3 ? 12% | 24.5 ? 29% |
| Load Average * (Watt) | 169.3 | 139.4 18% | 132.2 22% | 141.8 16% | 109 36% | 135 20% | 135.3 ? 20% | 108.1 ? 36% |
| Cyberpunk 2077 ultra * (Watt) | 294 | 295 -0% | 318 -8% | 253 14% | 290 1% | |||
| Cyberpunk 2077 ultra external monitor * (Watt) | 288 | 291 -1% | 319 -11% | 230 20% | 292 -1% | |||
| Load Maximum * (Watt) | 371.5 | 359.3 3% | 384 -3% | 233 37% | 325 13% | 307 17% | 336 ? 10% | 254 ? 32% |
| Witcher 3 ultra * (Watt) | 286 |
* ... Meglio usare valori piccoli
Power consumption Cyberpunk / stress test
Power consumption with external monitor
Tempi di esecuzione
L'elevato consumo inattivo del portatile si manifesta nella durata della batteria. Durante il test WLAN a 150 cd/m², abbiamo misurato ancora 6,5 ore, ma alla massima luminosità non è riuscito a raggiungere nemmeno le 3 ore.

Valutazione totale di Notebookcheck
Asus ROG Strix Scar 16 2025
- 05/07/2025 v8
Andreas Osthoff
 Total Sustainability Score:
 Possibili alternative a confronto
Transparency
La selezione dei dispositivi da recensire viene effettuata dalla nostra redazione. Il campione di prova è stato fornito all'autore come prestito dal produttore o dal rivenditore ai fini di questa recensione. L'istituto di credito non ha avuto alcuna influenza su questa recensione, né il produttore ne ha ricevuto una copia prima della pubblicazione. Non vi era alcun obbligo di pubblicare questa recensione. In quanto società mediatica indipendente, Notebookcheck non è soggetta all'autorità di produttori, rivenditori o editori.
Ecco come Notebookcheck esegue i test
Ogni anno, Notebookcheck esamina in modo indipendente centinaia di laptop e smartphone utilizzando procedure standardizzate per garantire che tutti i risultati siano comparabili. Da circa 20 anni sviluppiamo continuamente i nostri metodi di prova e nel frattempo stabiliamo gli standard di settore. Nei nostri laboratori di prova, tecnici ed editori esperti utilizzano apparecchiature di misurazione di alta qualità. Questi test comportano un processo di validazione in più fasi. Il nostro complesso sistema di valutazione si basa su centinaia di misurazioni e parametri di riferimento ben fondati, che mantengono l'obiettività.
