Recensione del laptop Asus ZenBook 14X (2023): Ultrabook OLED al limite

Asus ha leggermente rinnovato l'Asus ZenBook 14X, che ora assomiglia molto all'ultrabook compatto da 13 pollici ZenBook S13. Tuttavia, il peso del 14 pollici con il suo telaio eccezionalmente buono è significativamente più alto, con 1,56 chilogrammi. In cambio, Asus installa il molto più potente Intel Core i9-13900H e, se necessario, una Nvidia GeForce RTX 3050. Come il predecessore, è installato un display OLED da 2,8K, che è stato aggiornato da 90 Hz a un ottimo 120 Hz.
Poiché non ci sono molti concorrenti con display OLED nel segmento dei 14 pollici, abbiamo incluso anche i concorrenti IPS per un confronto. Interessante è il tablet Asus ROG Flow Z13 GZ301V, dotato dello stesso potente processore Intel Core i9.
Potenziali concorrenti a confronto
Punteggio | Data | Modello | Peso | Altezza | Dimensione | Risoluzione | Prezzo |
|---|---|---|---|---|---|---|---|
| 88.5 % v7 (old) | 06/2023 | Asus ZenBook 14X UX3404VC i9-13900H, Iris Xe G7 96EUs | 1.6 kg | 16.9 mm | 14.50" | 2880x1800 | |
| 91.9 % v7 (old) | 06/2022 | Apple MacBook Pro 13 2022 M2 M2, M2 10-Core GPU | 1.4 kg | 15.6 mm | 13.30" | 2560x1600 | |
| 89.2 % v7 (old) | 04/2023 | Lenovo Slim Pro 7 14ARP8 R7 7735HS, GeForce RTX 3050 6GB Laptop GPU | 1.6 kg | 15.6 mm | 14.50" | 2560x1600 | |
| 89.1 % v7 (old) | 04/2023 | Asus ROG Flow Z13 GZ301V i9-13900H, GeForce RTX 4060 Laptop GPU | 1.6 kg | 14.2 mm | 13.40" | 2560x1600 | |
| 87.3 % v7 (old) | 09/2022 | Dell XPS 13 Plus 9320 i7-1280P OLED i7-1280P, Iris Xe G7 96EUs | 1.3 kg | 15.28 mm | 13.40" | 3456x2160 | |
| 87.2 % v7 (old) | 09/2022 | Dell Inspiron 14 Plus 7420 i7-12700H, GeForce RTX 3050 4GB Laptop GPU | 1.7 kg | 18.87 mm | 14.00" | 2240x1400 | |
| 86.6 % v7 (old) | 10/2022 | LG Gram 14Z90Q i5-1240P, Iris Xe G7 80EUs | 980 gr | 16.8 mm | 14.00" | 1920x1200 |
Custodia - Non c'è niente di più pregiato di questo
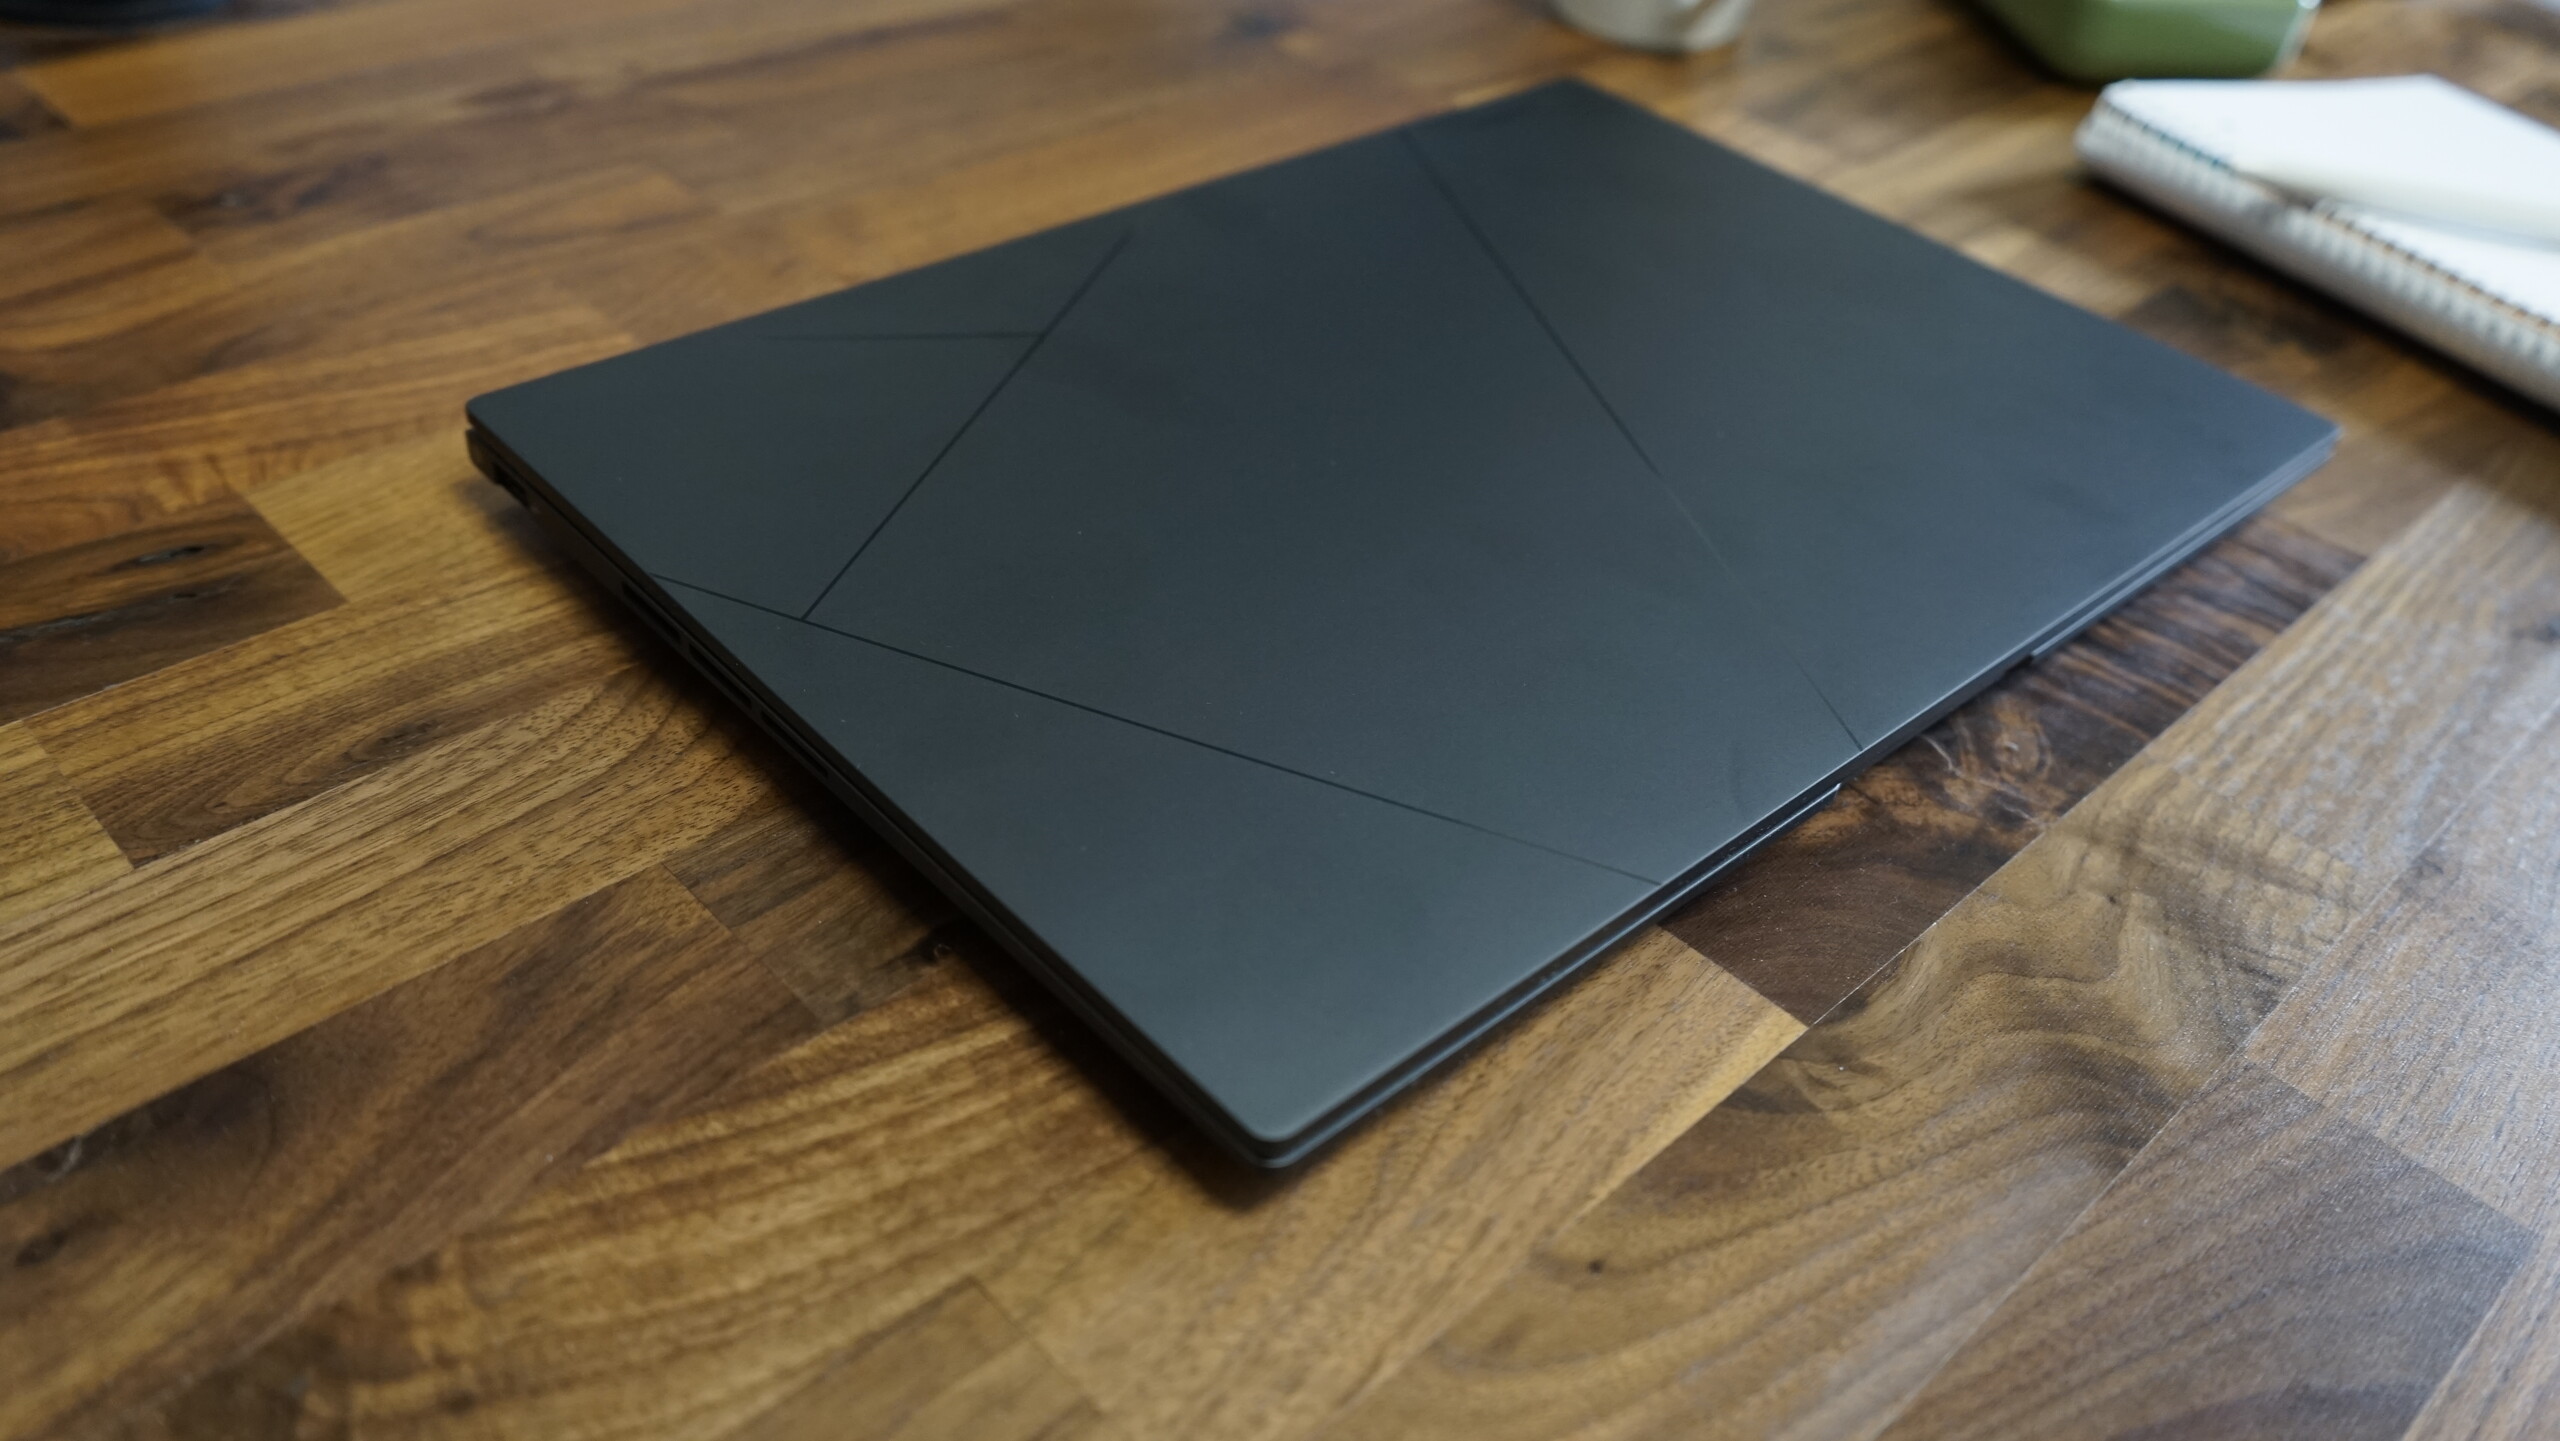
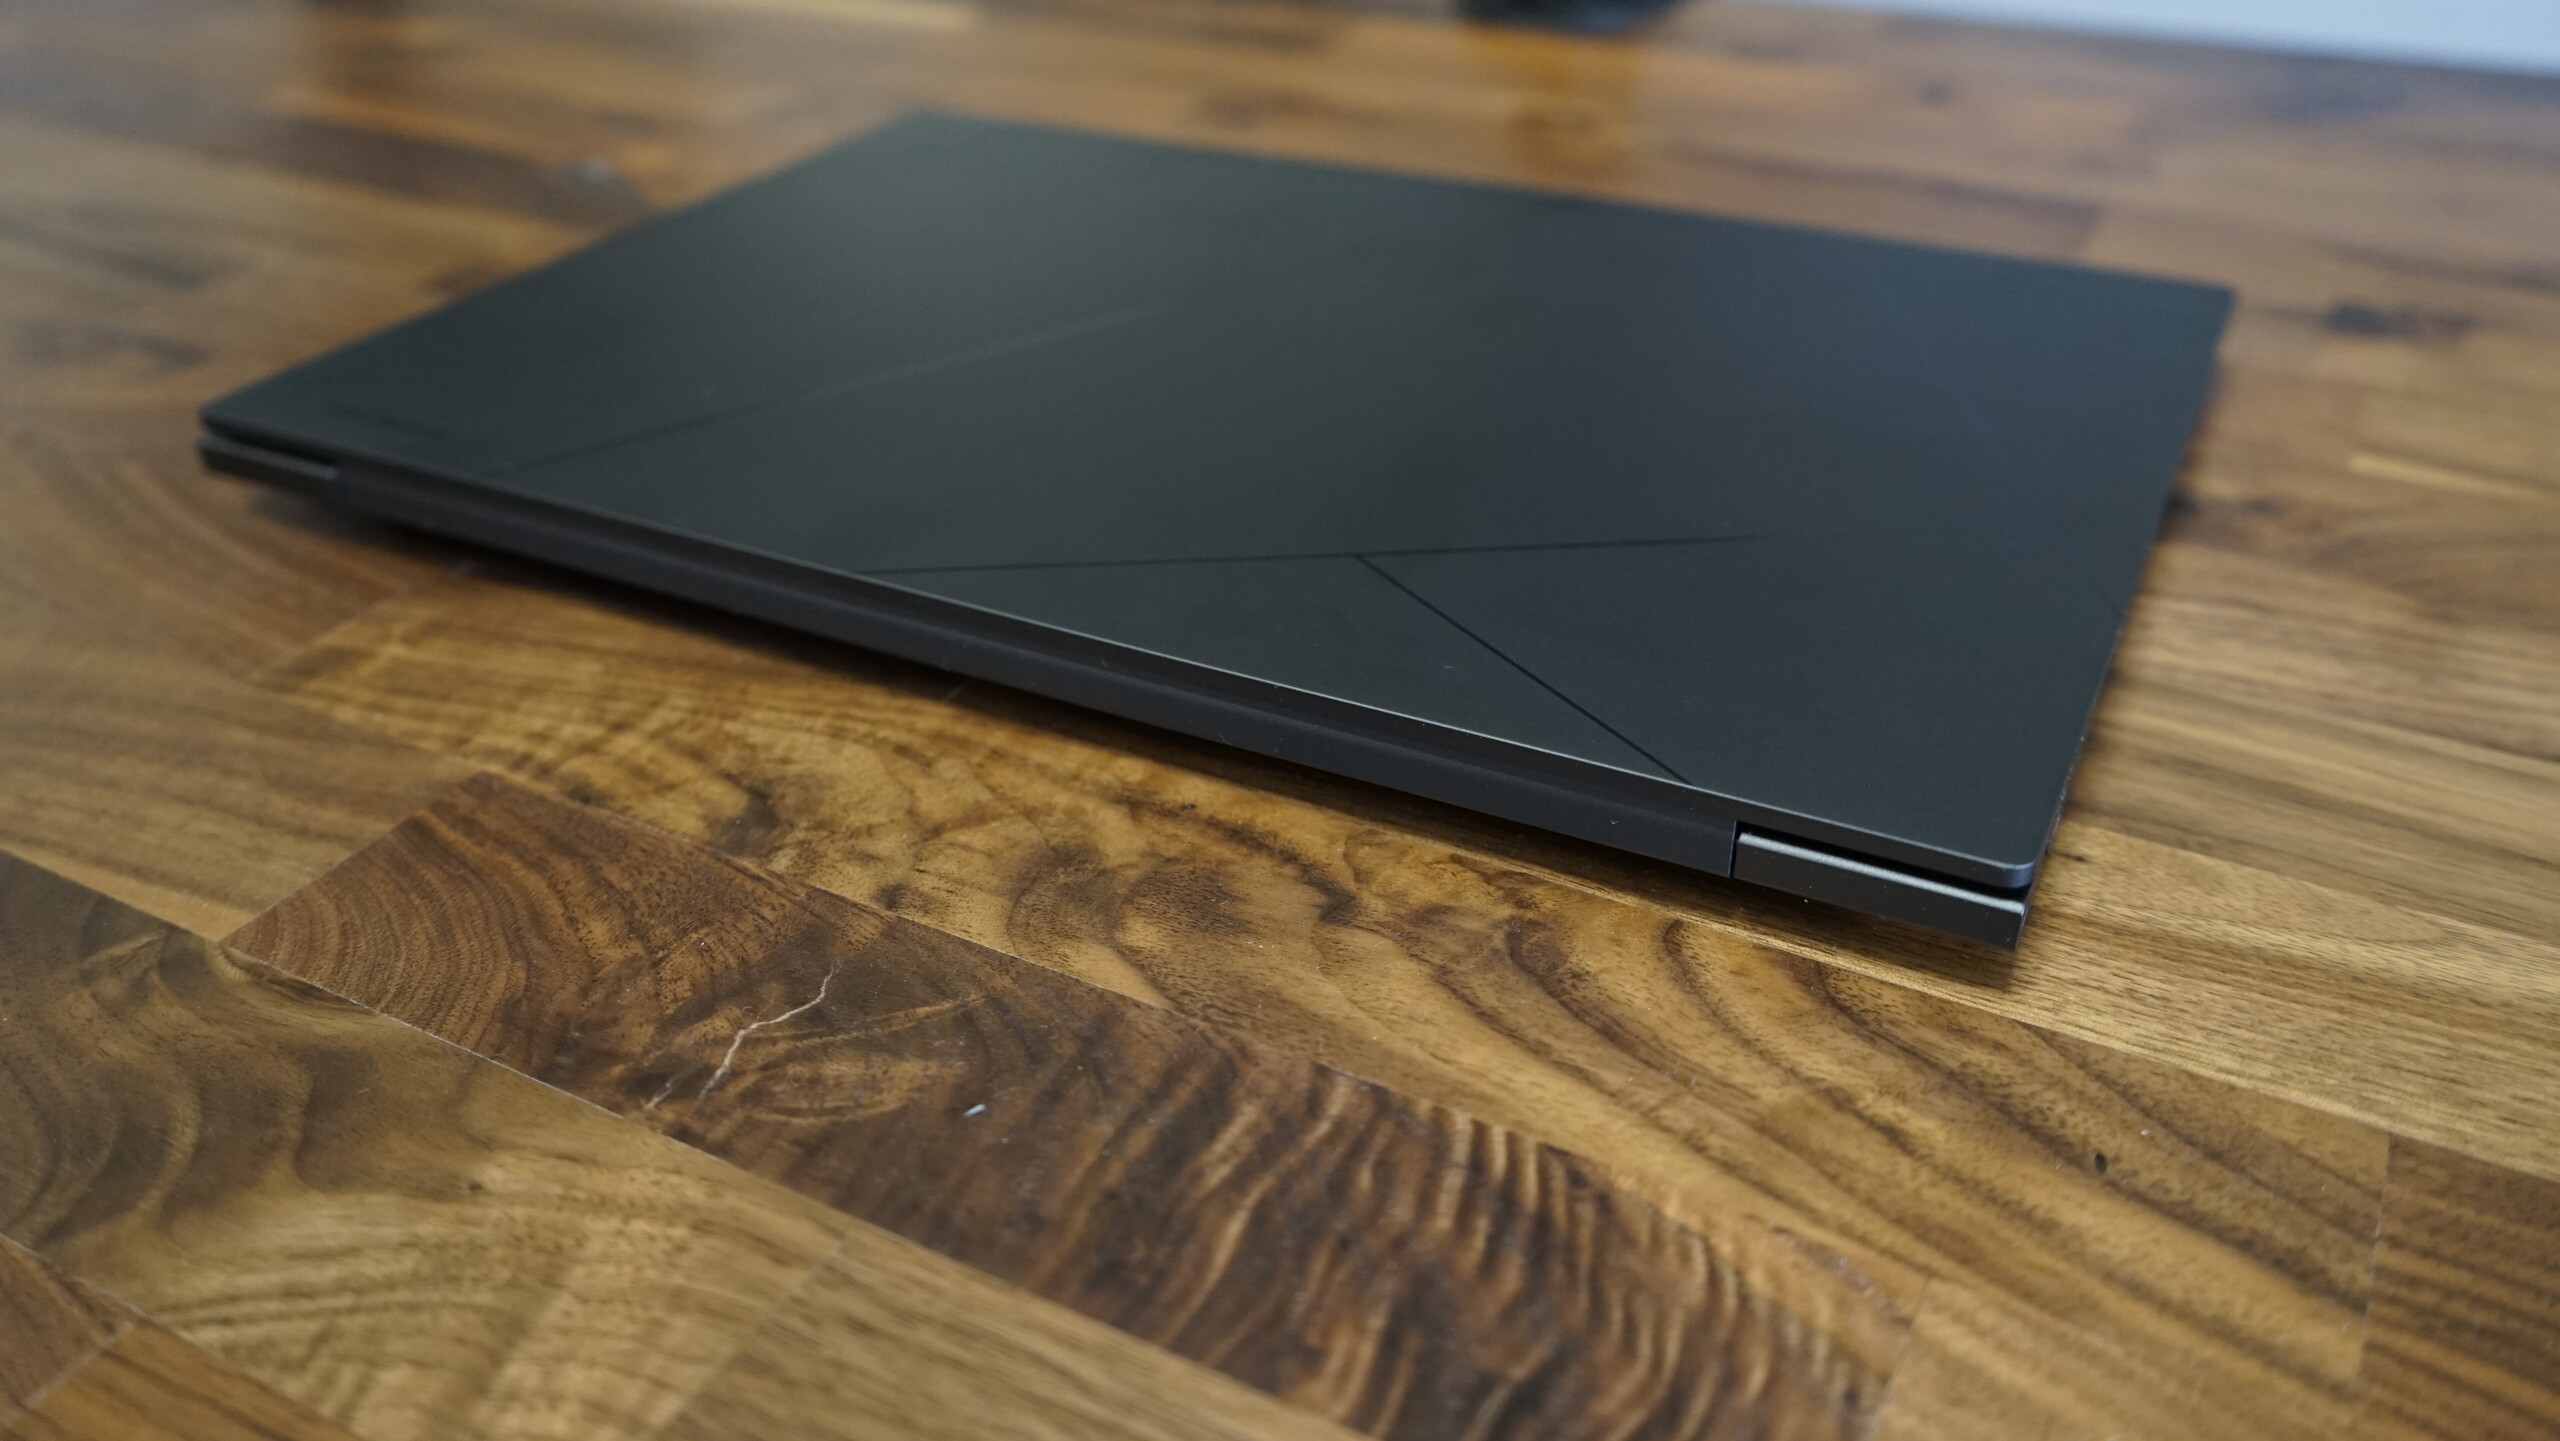
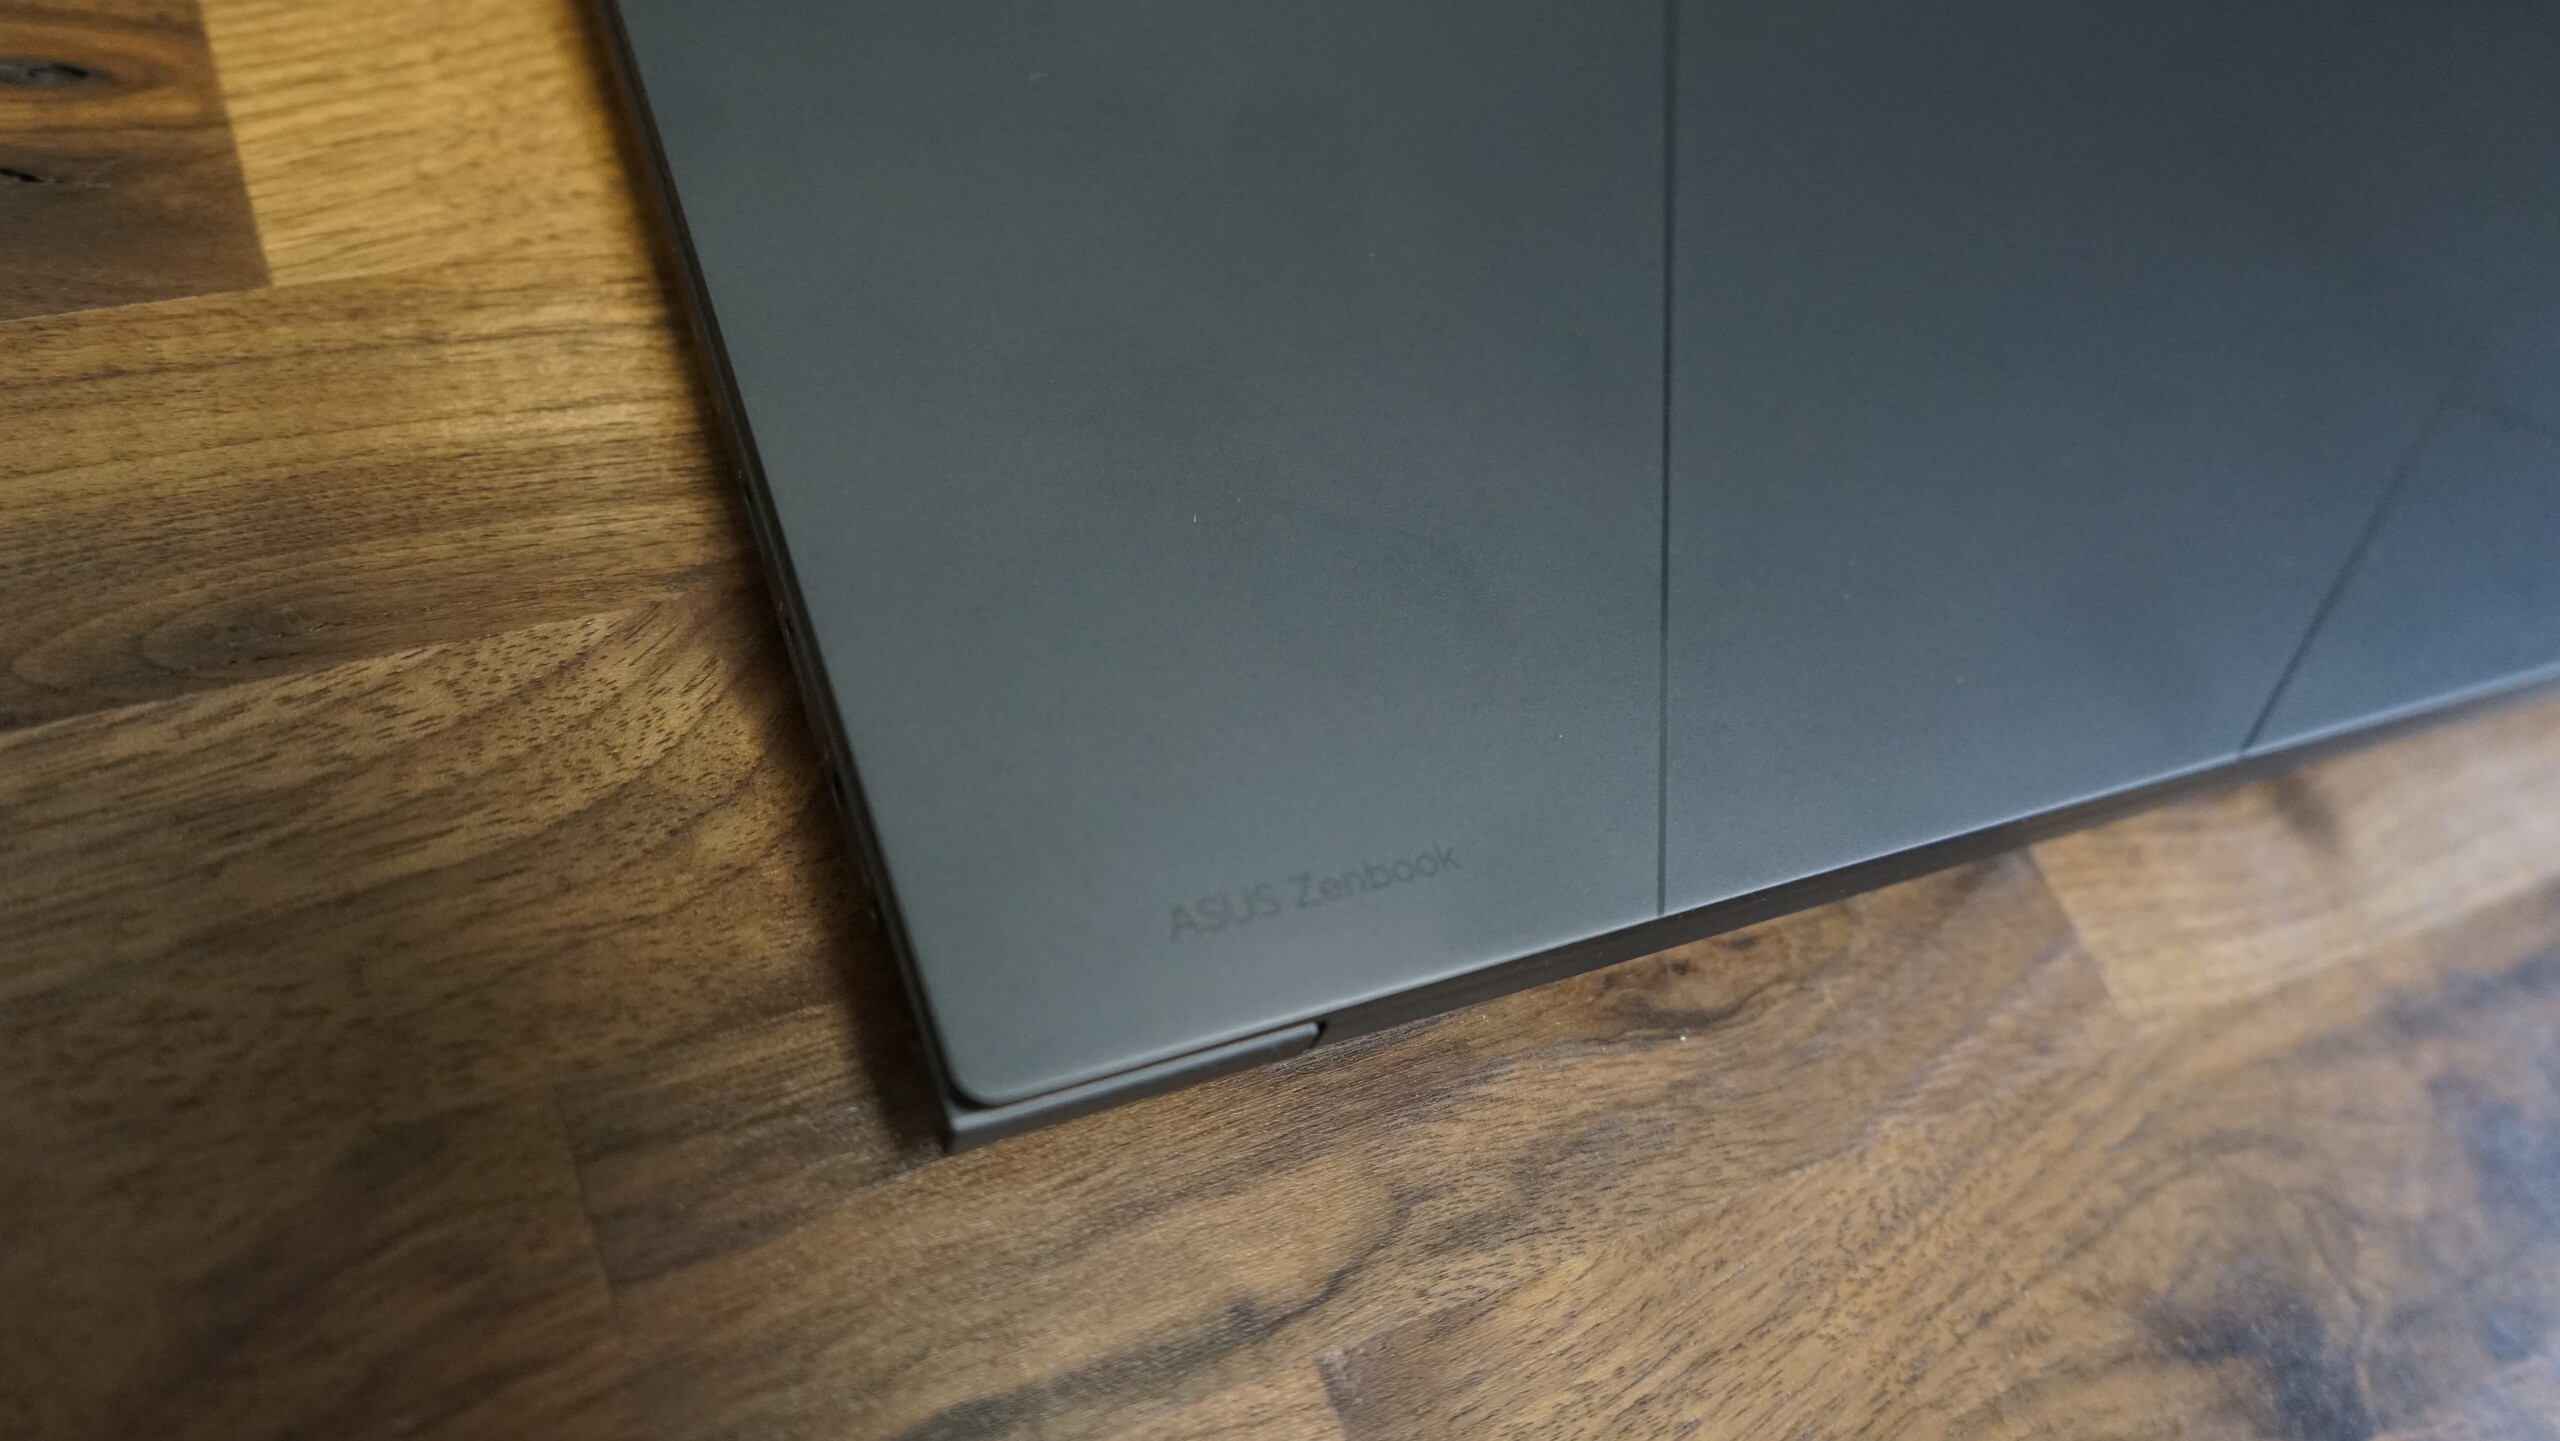
Il case del nuovo Asus ZenBook 14X assomiglia in gran parte al predecessore, ma è ancora leggermente diverso nel design. L'intero chassis è realizzato in alluminio ed è quindi particolarmente robusto e resistente alle torsioni, il che si riflette anche nel peso maggiore. Il coperchio non può essere deformato senza forza e presenta lo stesso logo ProArt dello ZenBook S 13 del 2023. Il nuovo ZenBook è disponibile nei colori Sandstone Beige o Inkwell Gray. La variante grigia della nostra recensione sembra di alta qualità ed elegante, ma le impronte digitali si notano rapidamente
Quando è chiuso, il coperchio è fissato magneticamente alla base. Le cerniere, come il resto del case, sono di alta qualità e ben salde. Tuttavia, è possibile aprire il portatile con una sola mano. Nonostante le cerniere strette, il display non oscilla avanti e indietro durante la digitazione, poiché la base è sufficientemente pesante e stabile.
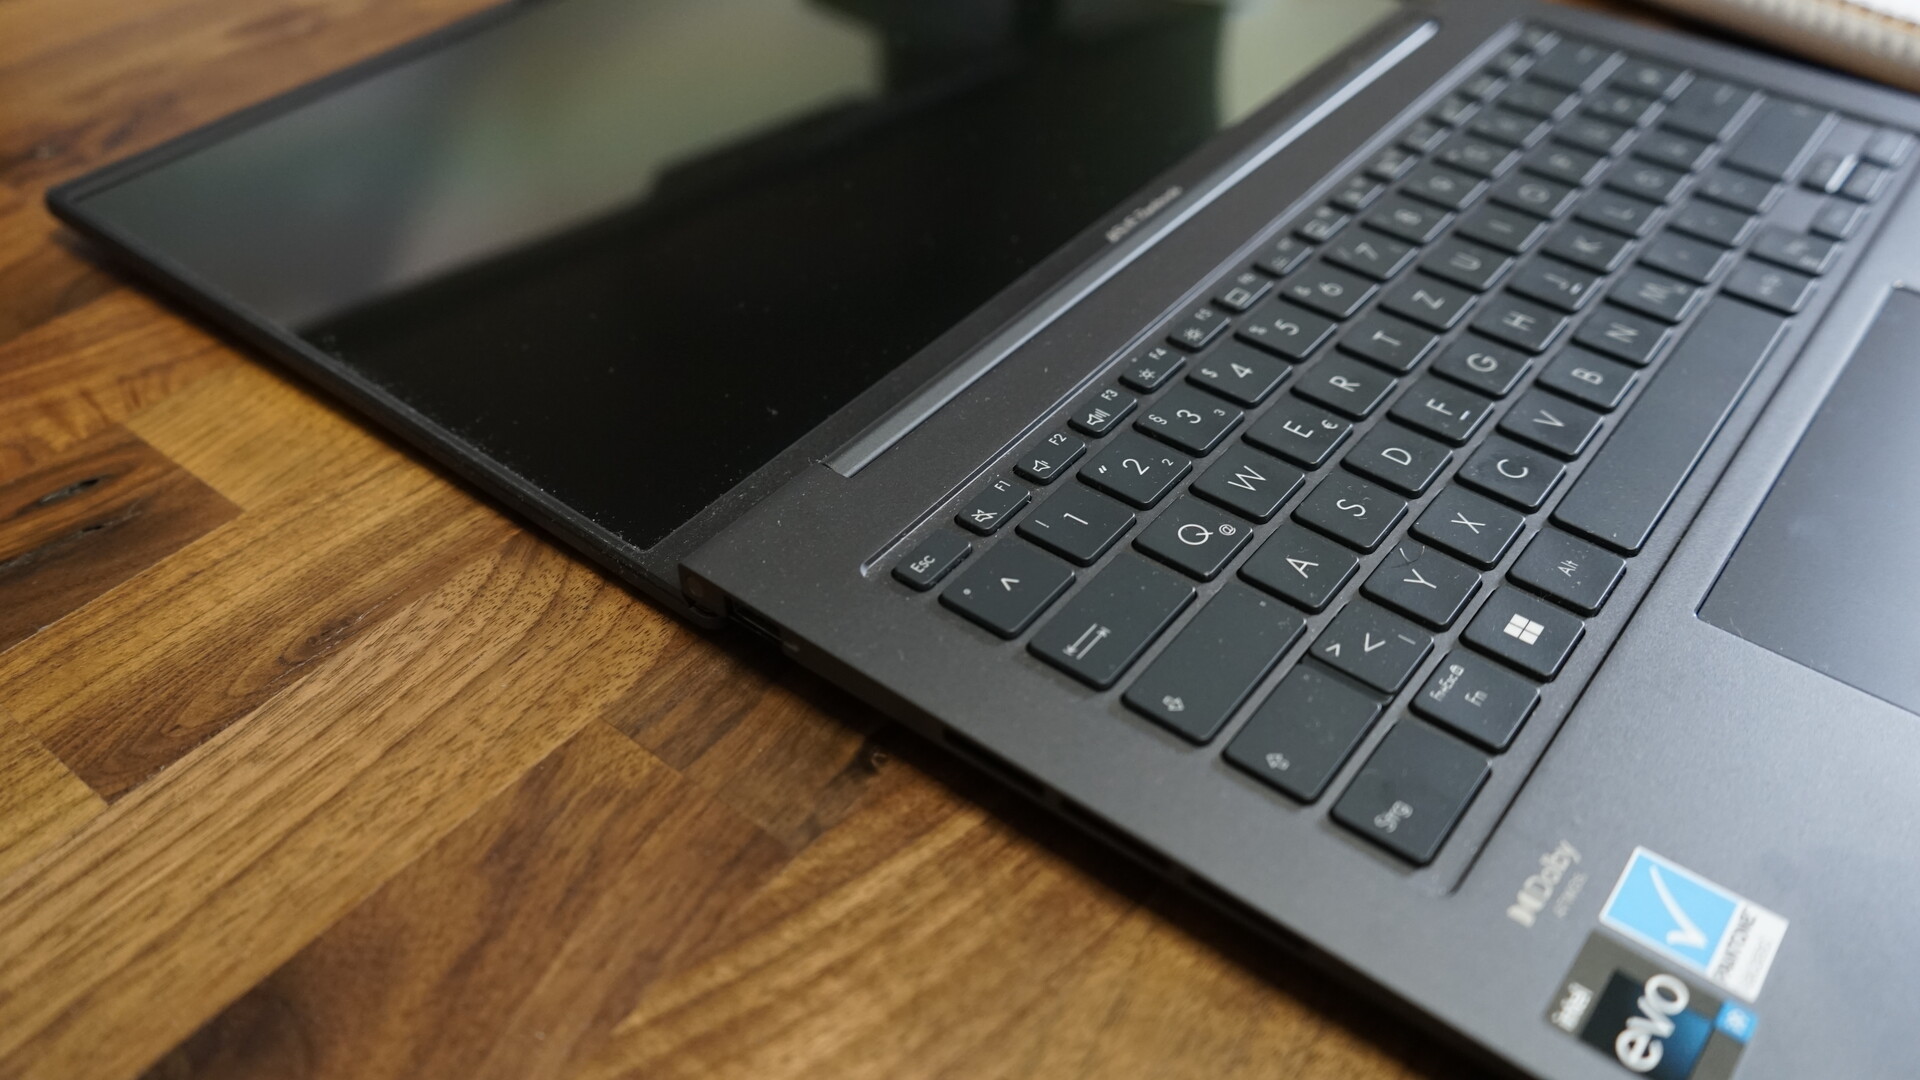
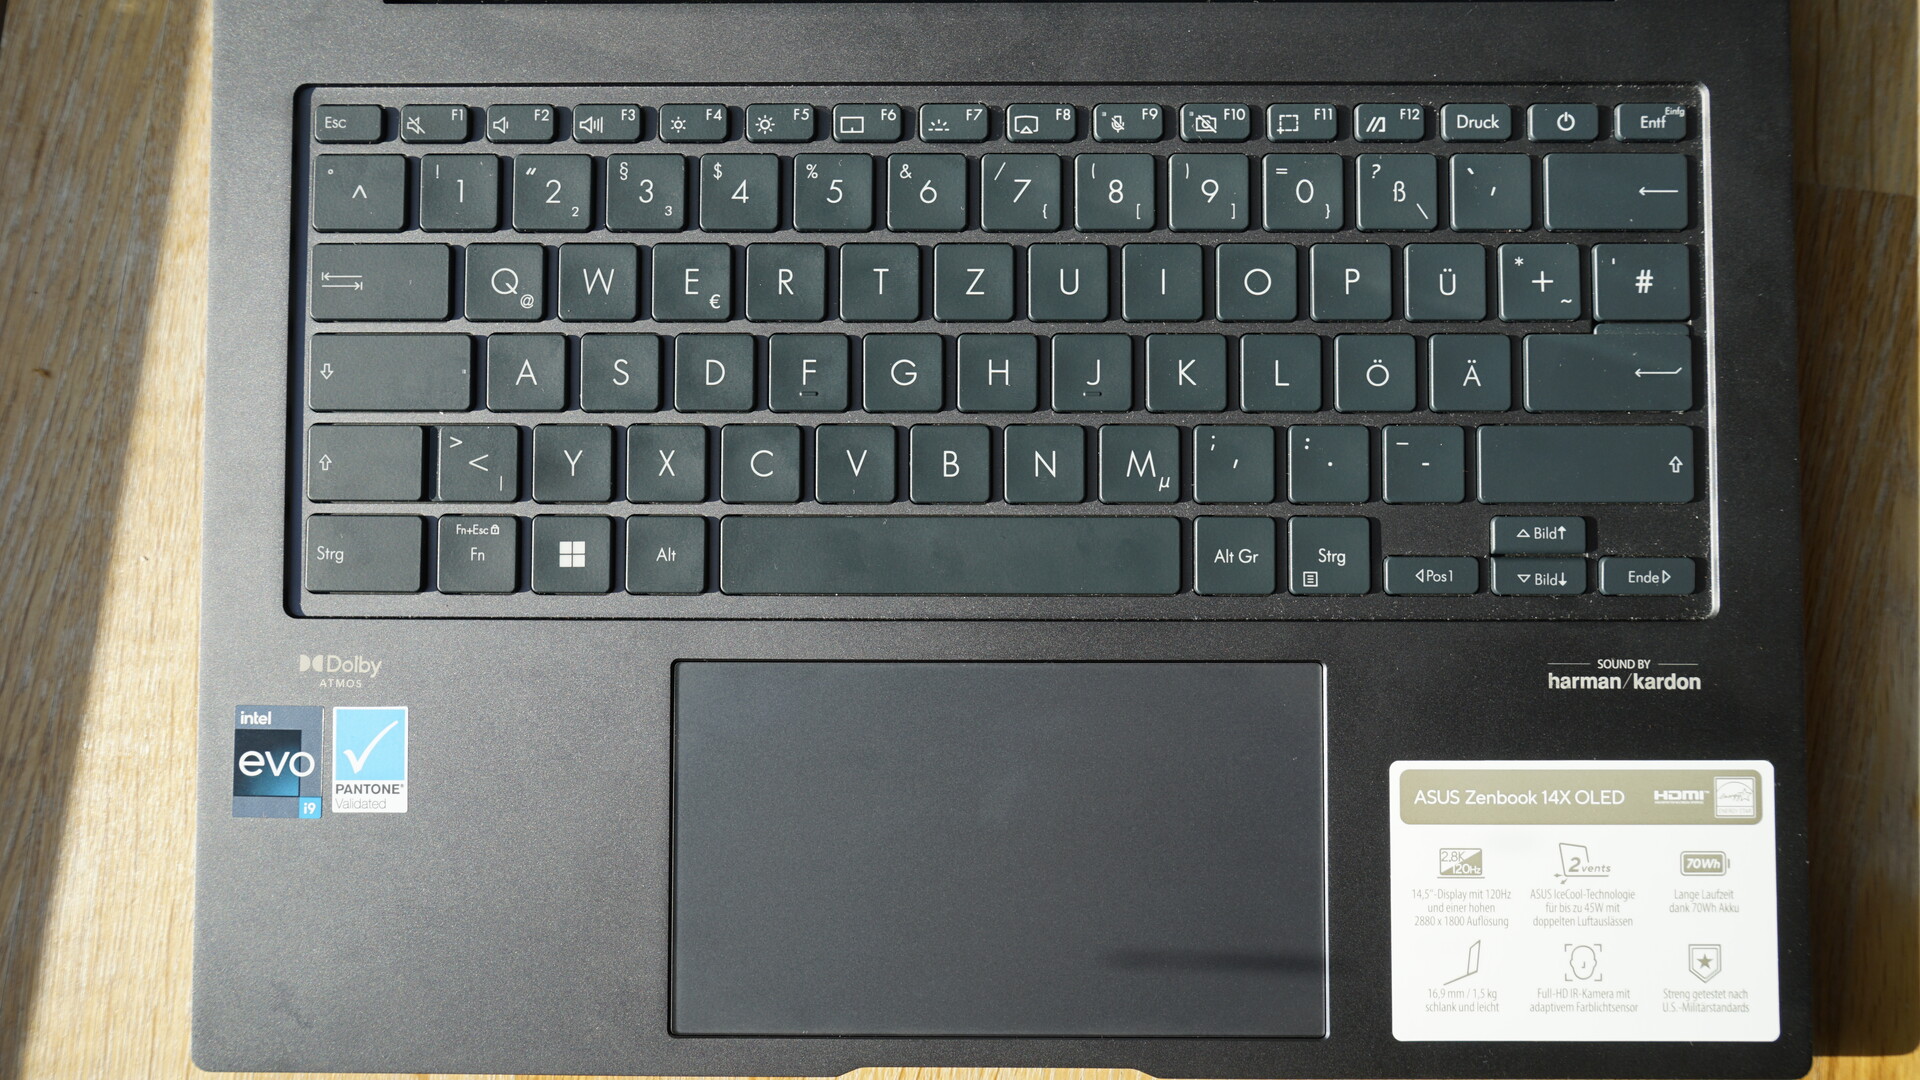
Il design robusto si estende anche all'area della tastiera. Anche in questo caso, lo ZenBook è estremamente robusto e l'area della tastiera non cede da nessuna parte.
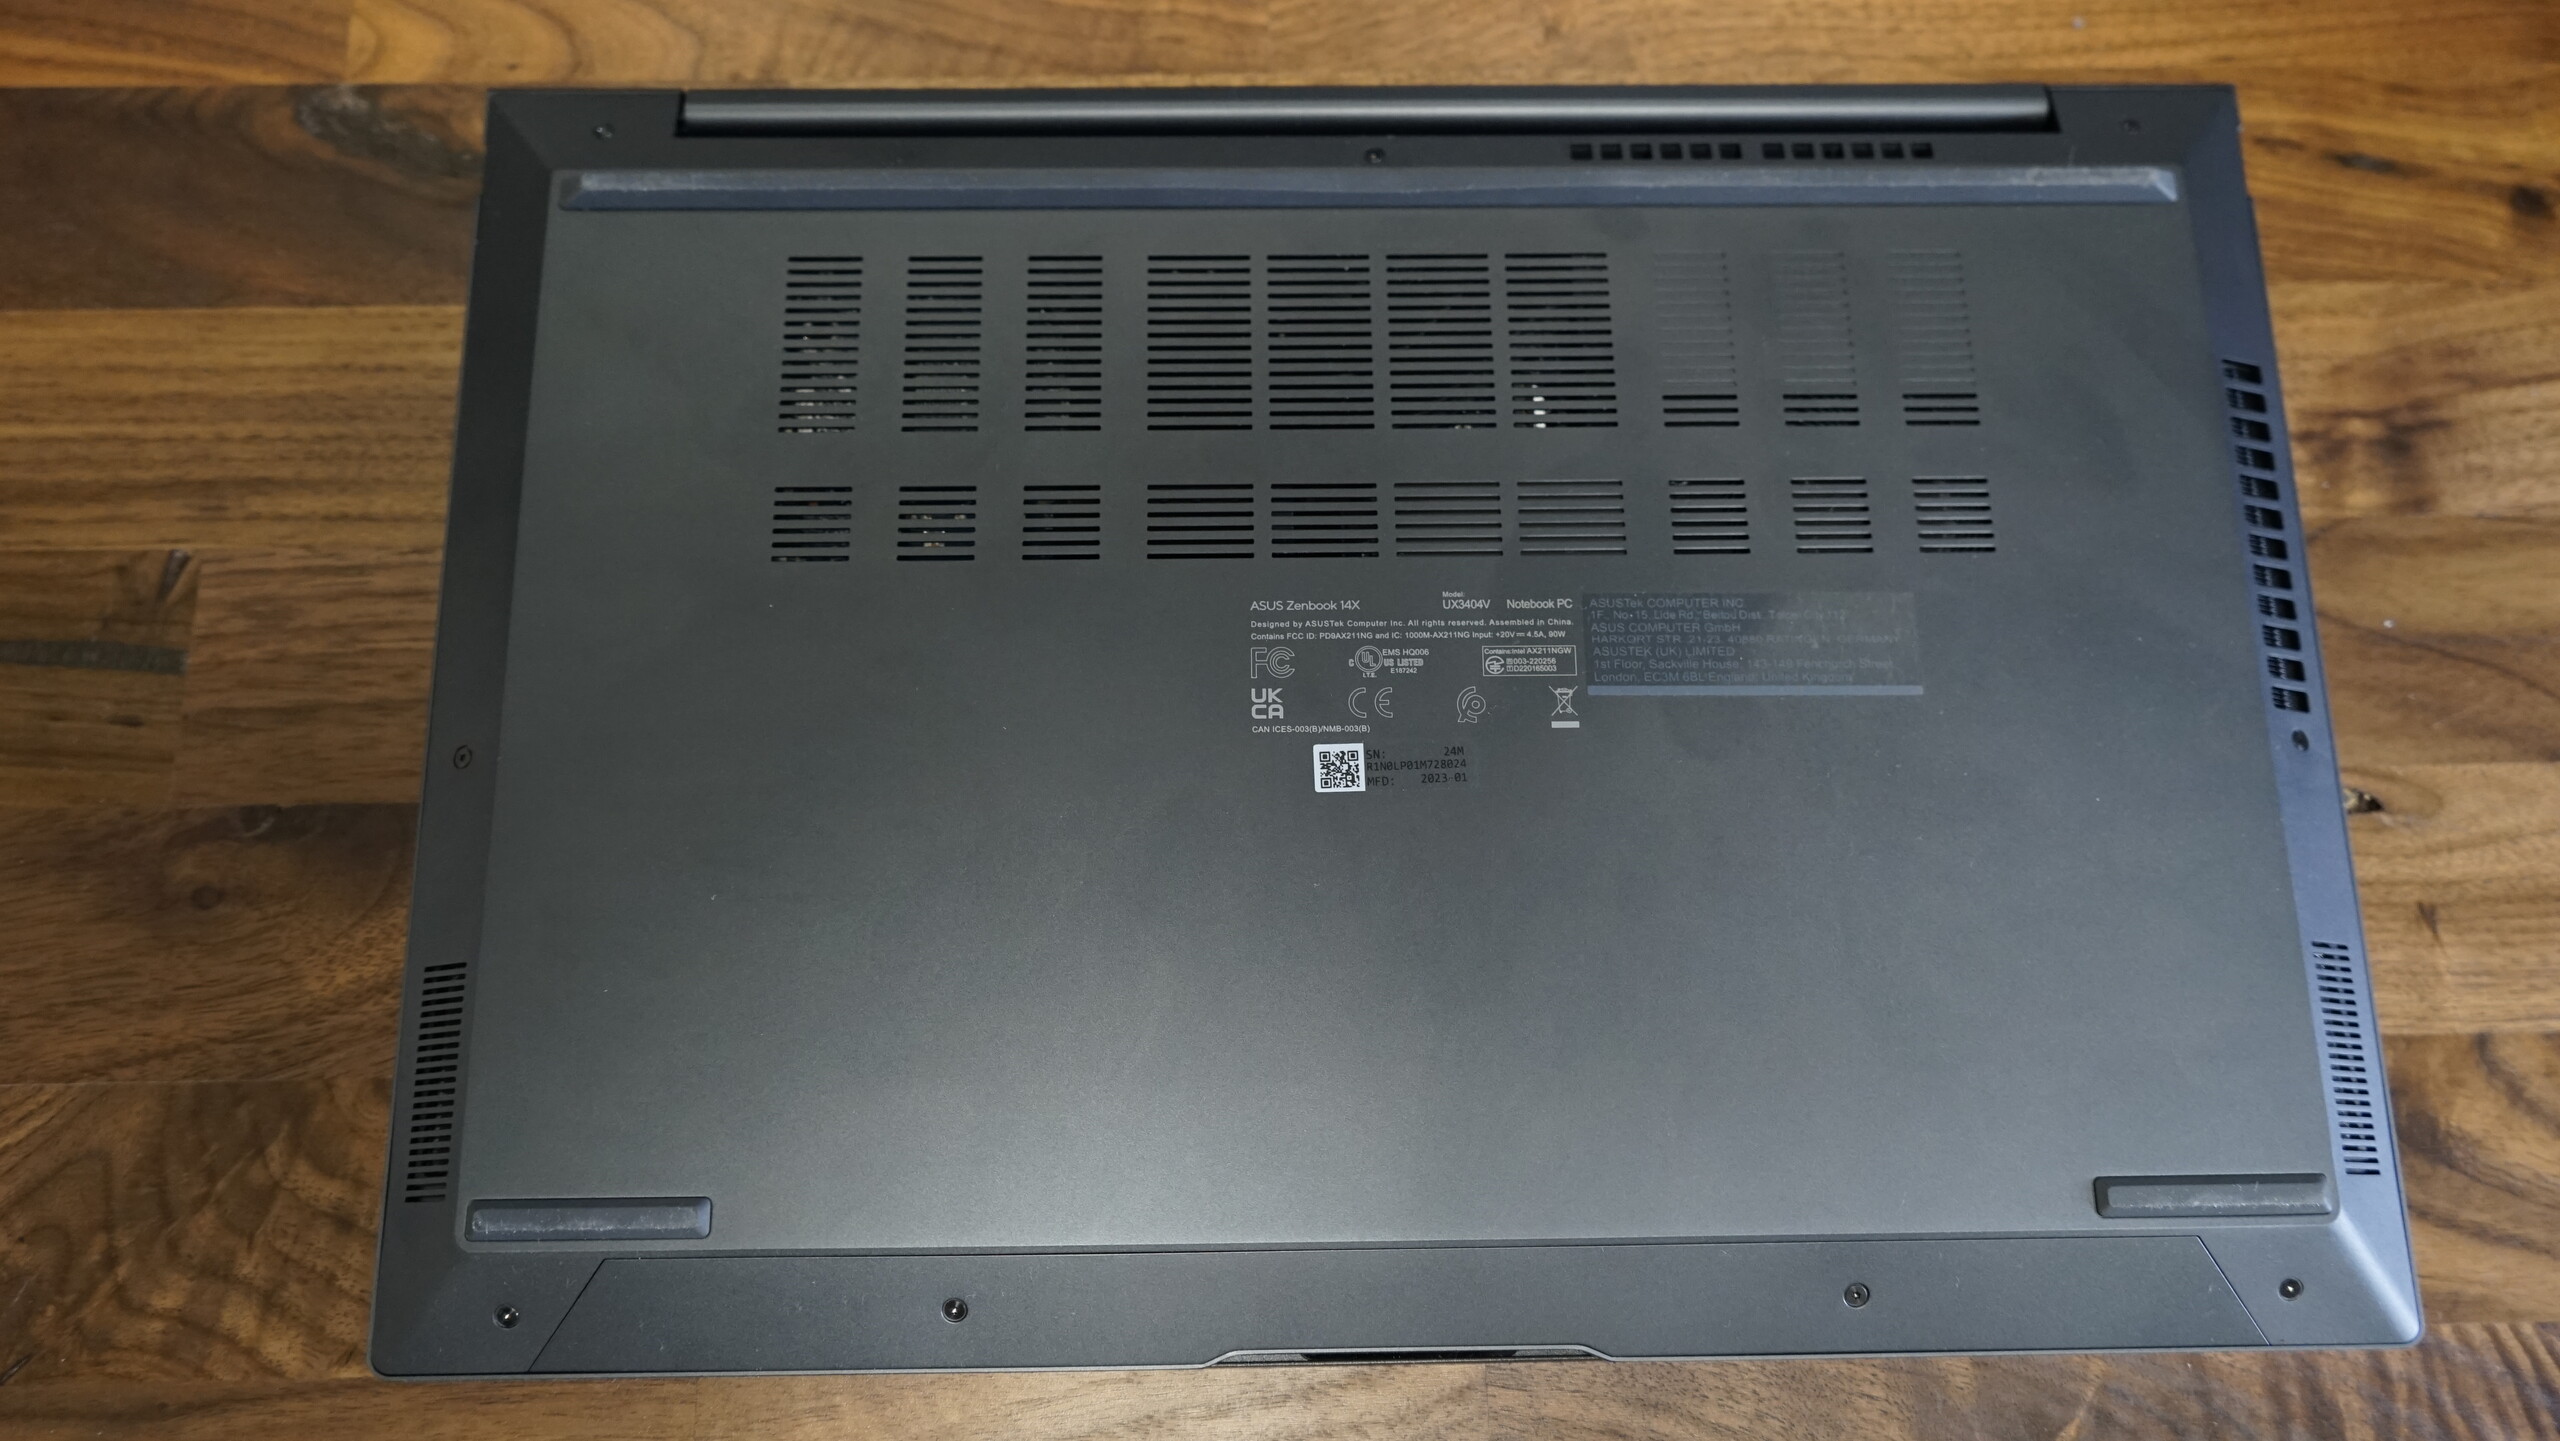
A differenza dello ZenBook S 13 del 2023, il nuovo ZenBook 14X non utilizza il meccanismo ErgoLift, ma si rifà al design classico. I piedini relativamente grandi sul fondo offrono spazio sufficiente alle ventole per lavorare senza limitazioni.
La versione precedente dello ZenBook 14X pesava più di molti altri subnotebook, con un peso di 1,406 kg. Lo ZenBook 14X 2023 ha aumentato il peso e ora pesa 1,56 kg. Nel campo di confronto, il Lenovo Slim Pro 7 14ARP8 e Dell Inspiron 14 Plus 7420sono ancora più alti, e il Asus ROG Flow Z13 GZ301Vcon lo stesso processore Intel Core i9 pesa quasi esattamente lo stesso, 1,551 kg. Con i suoi 16,9 mm, lo ZenBook 14X si colloca nella fascia media e non è così superiore alla media in termini di profondità.
Attrezzatura

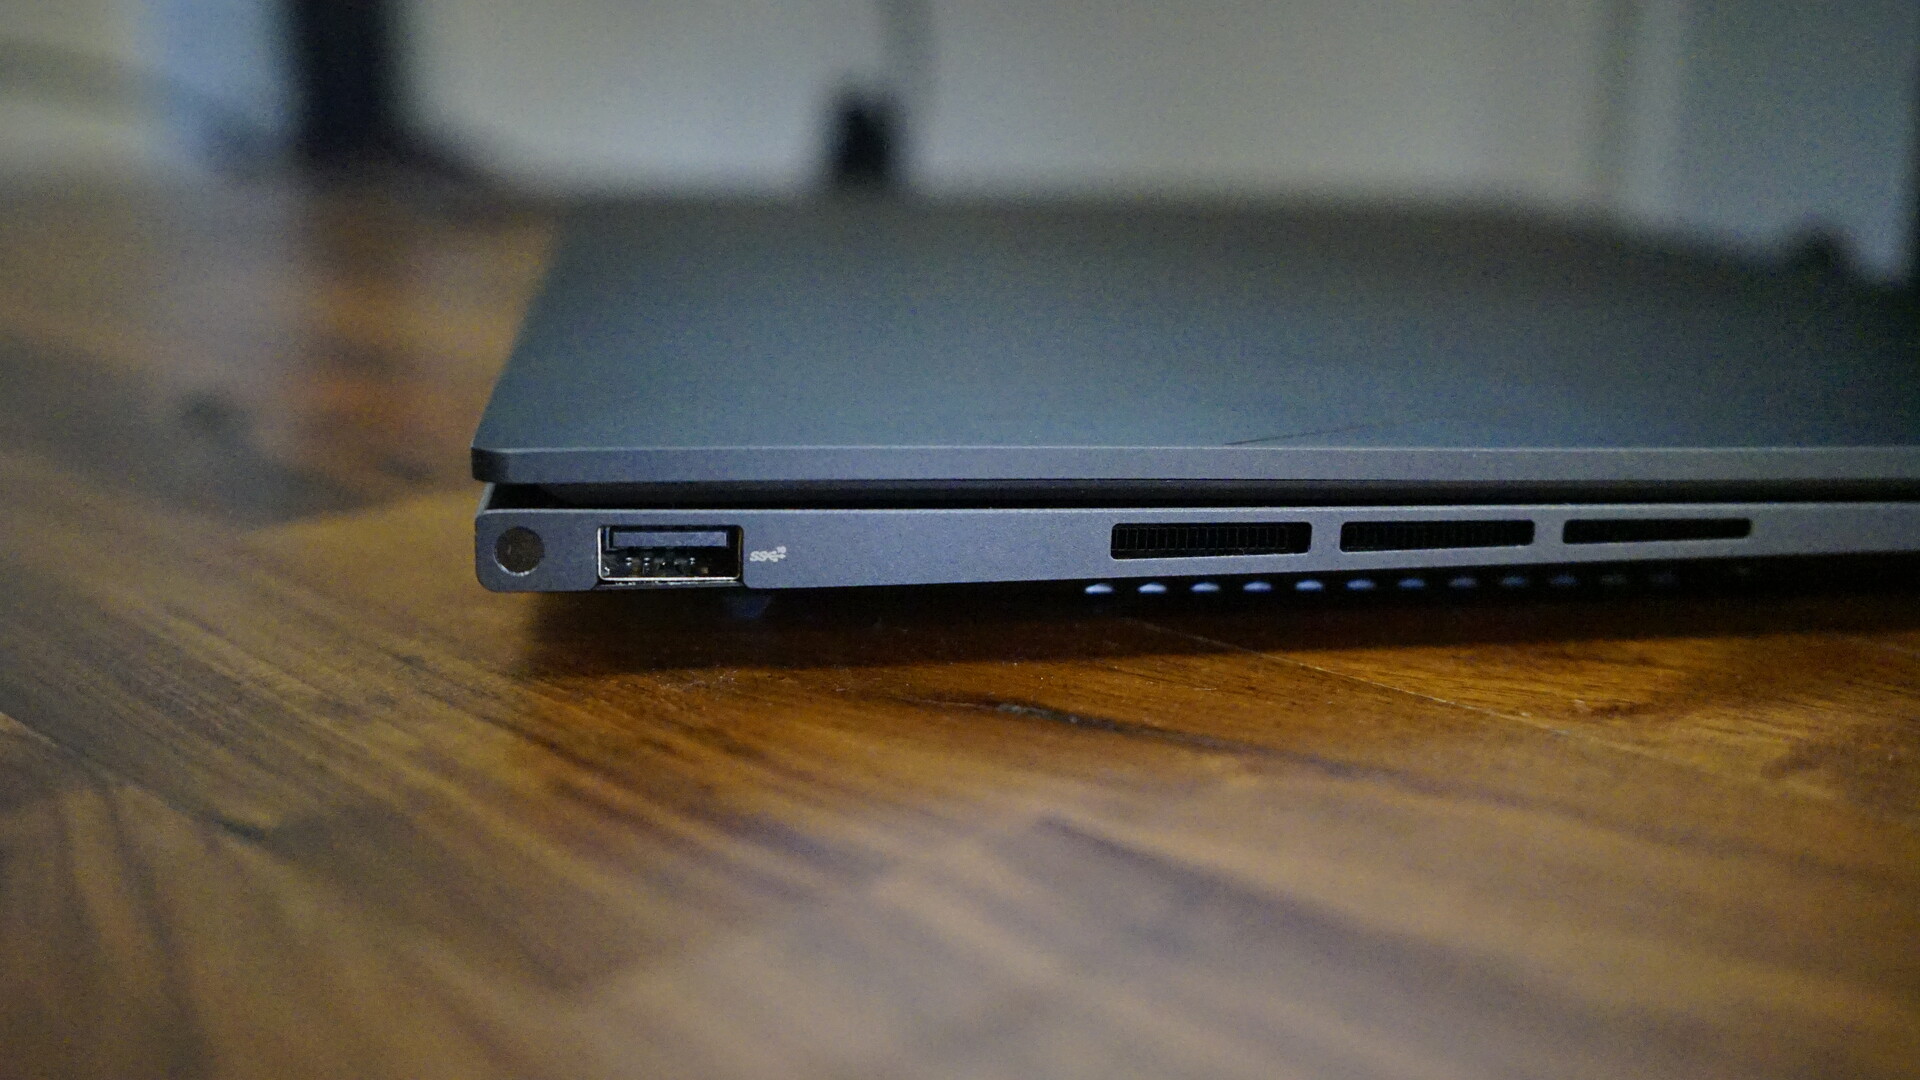
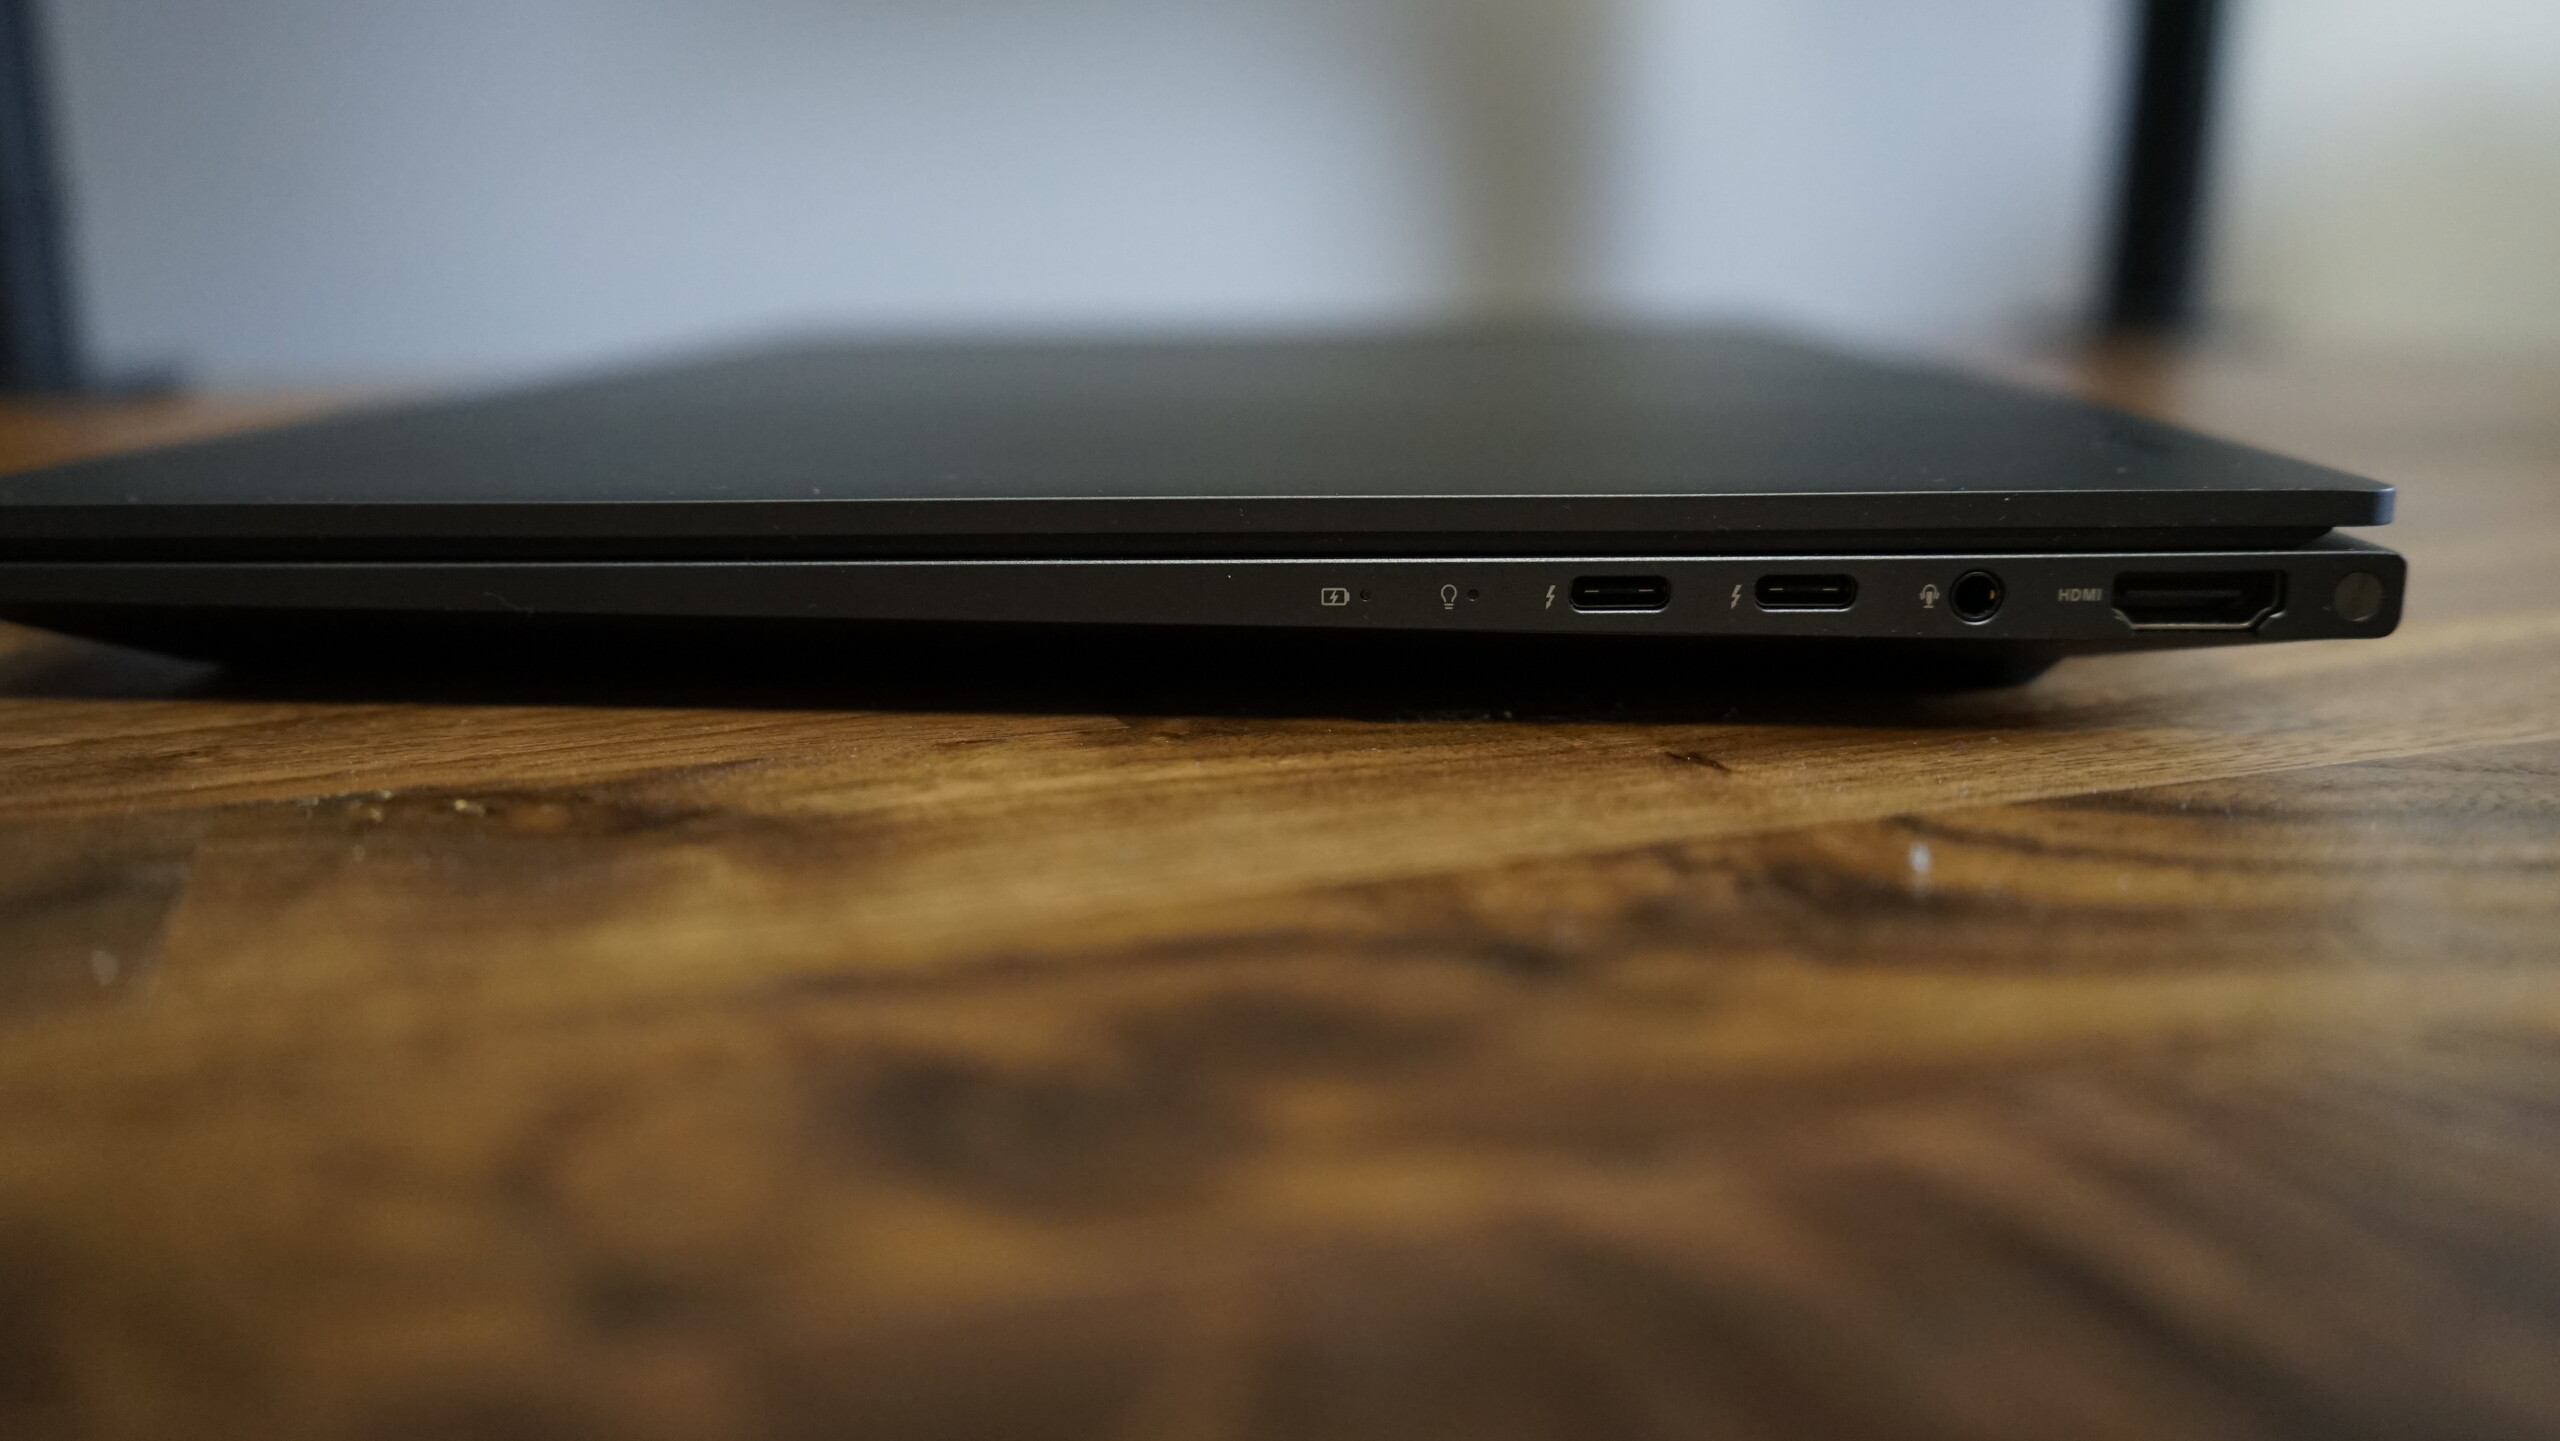
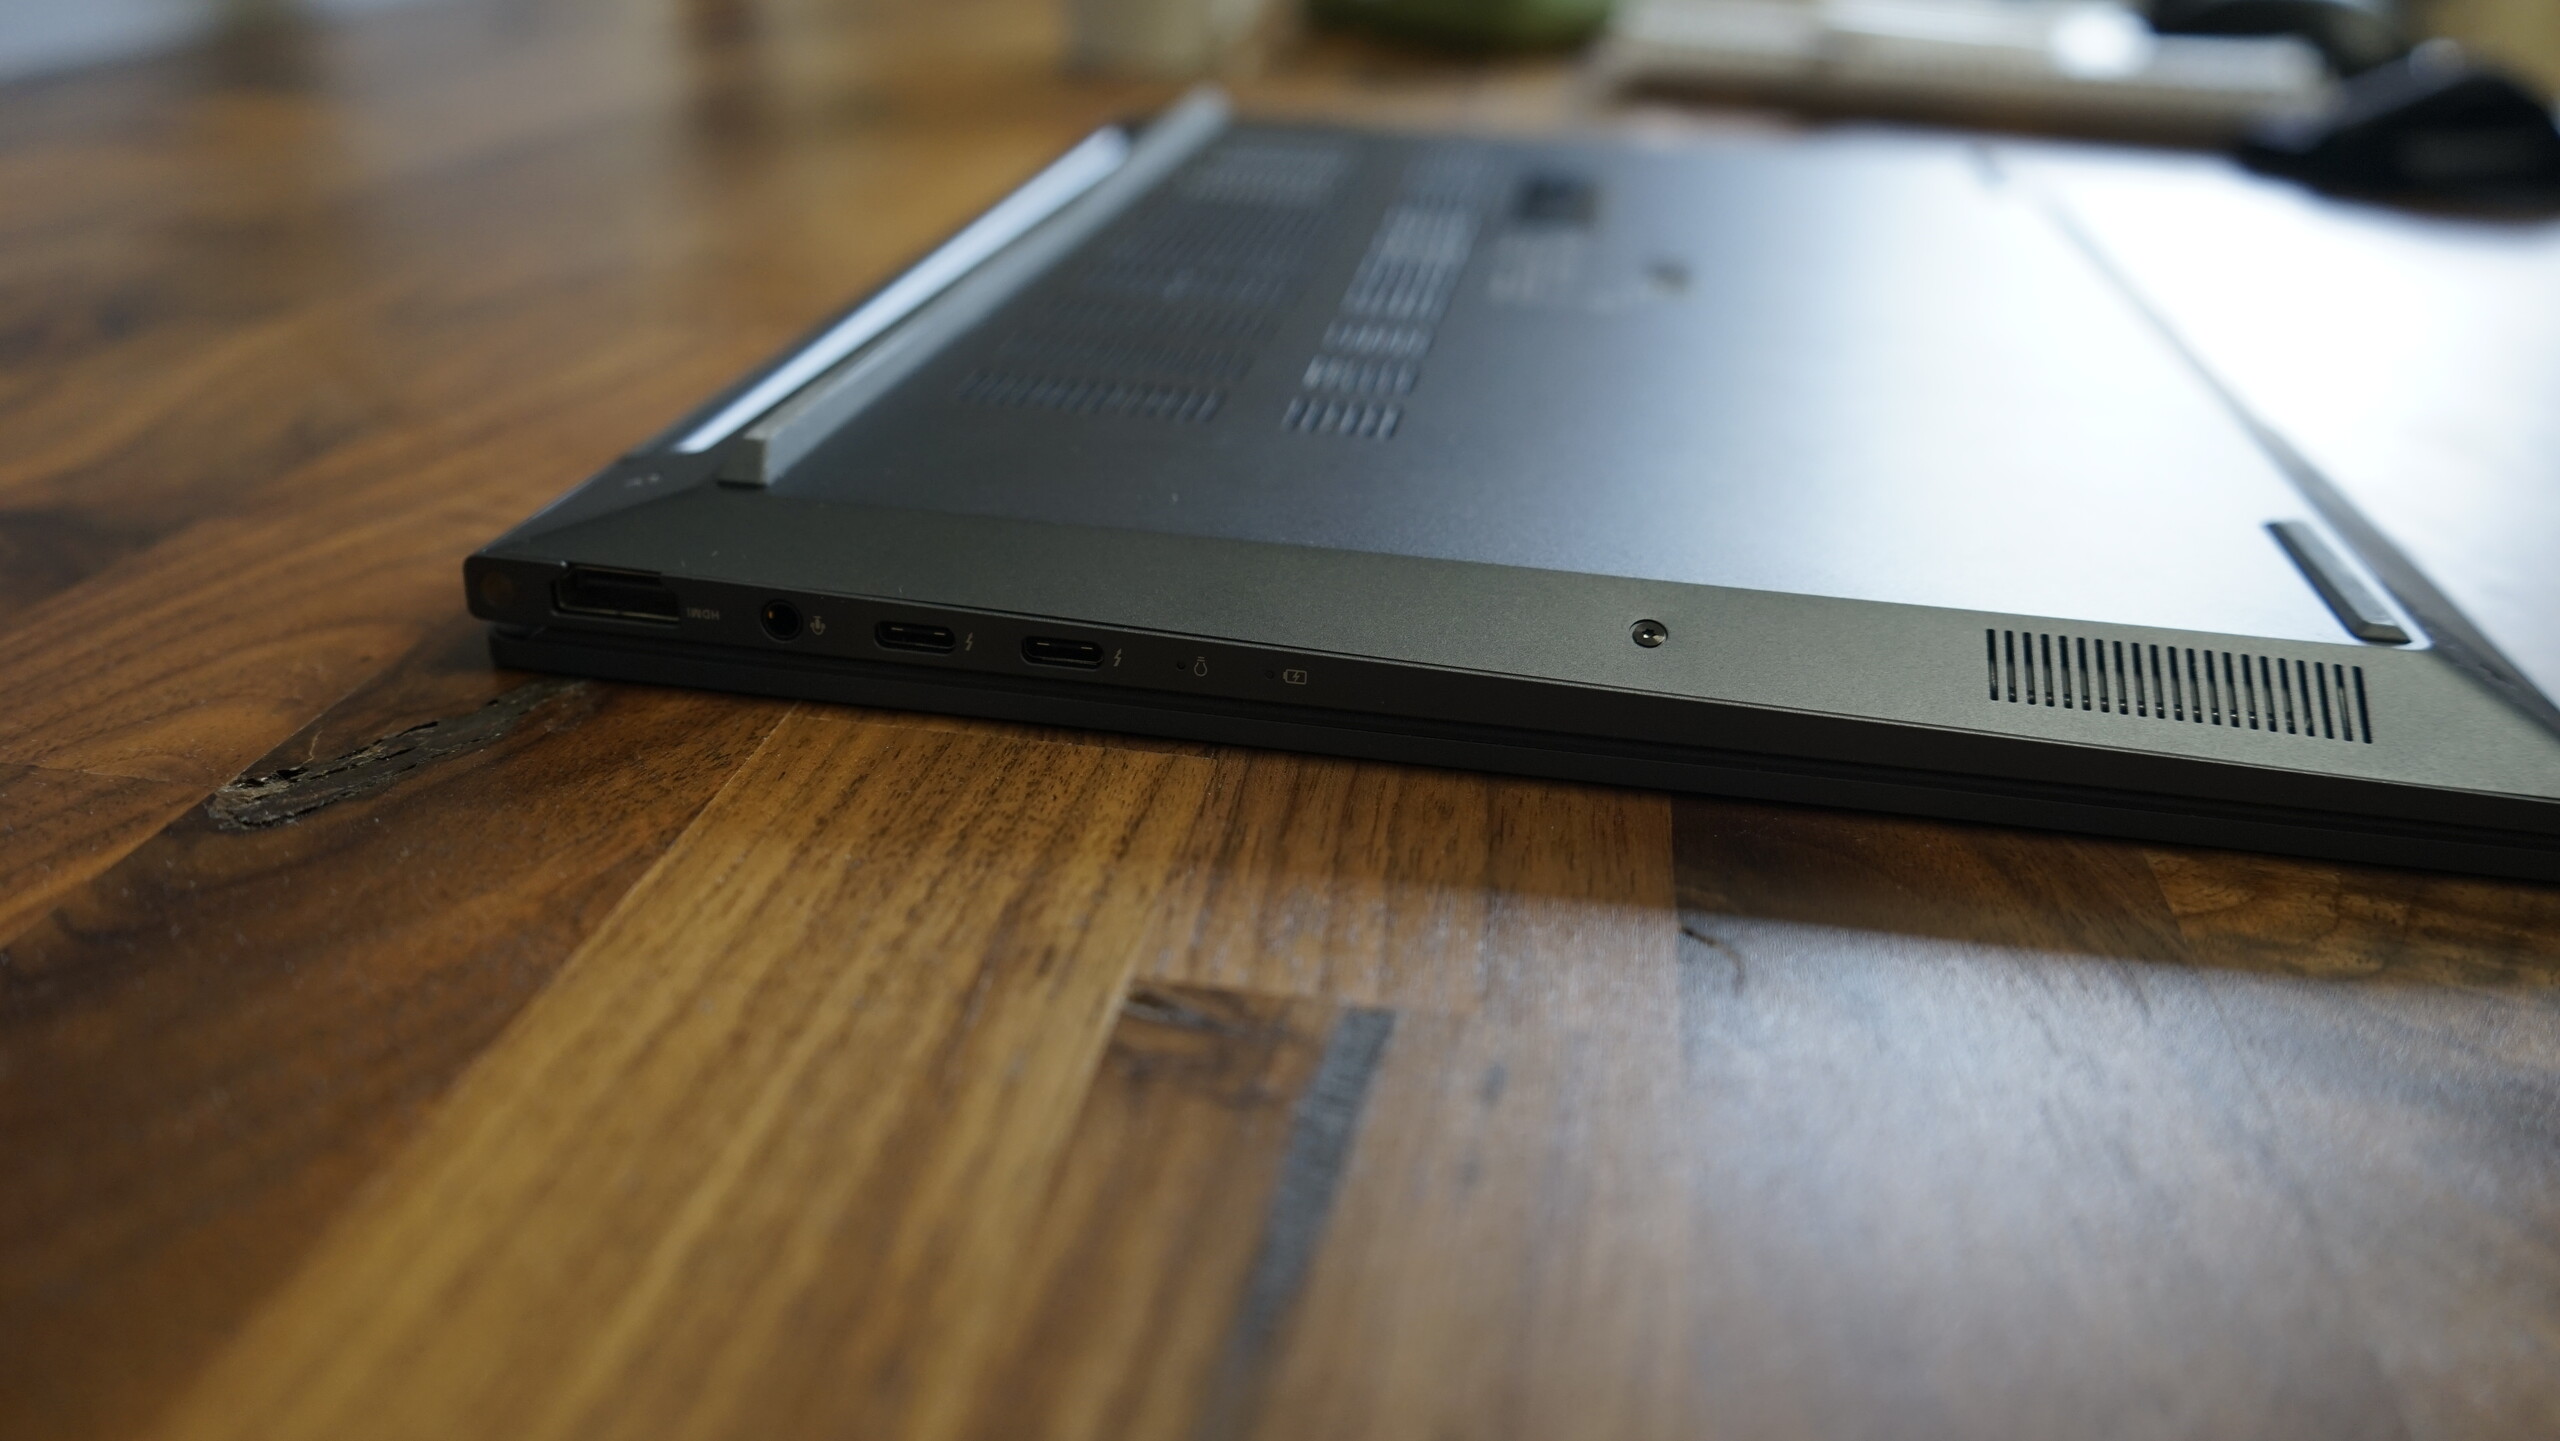
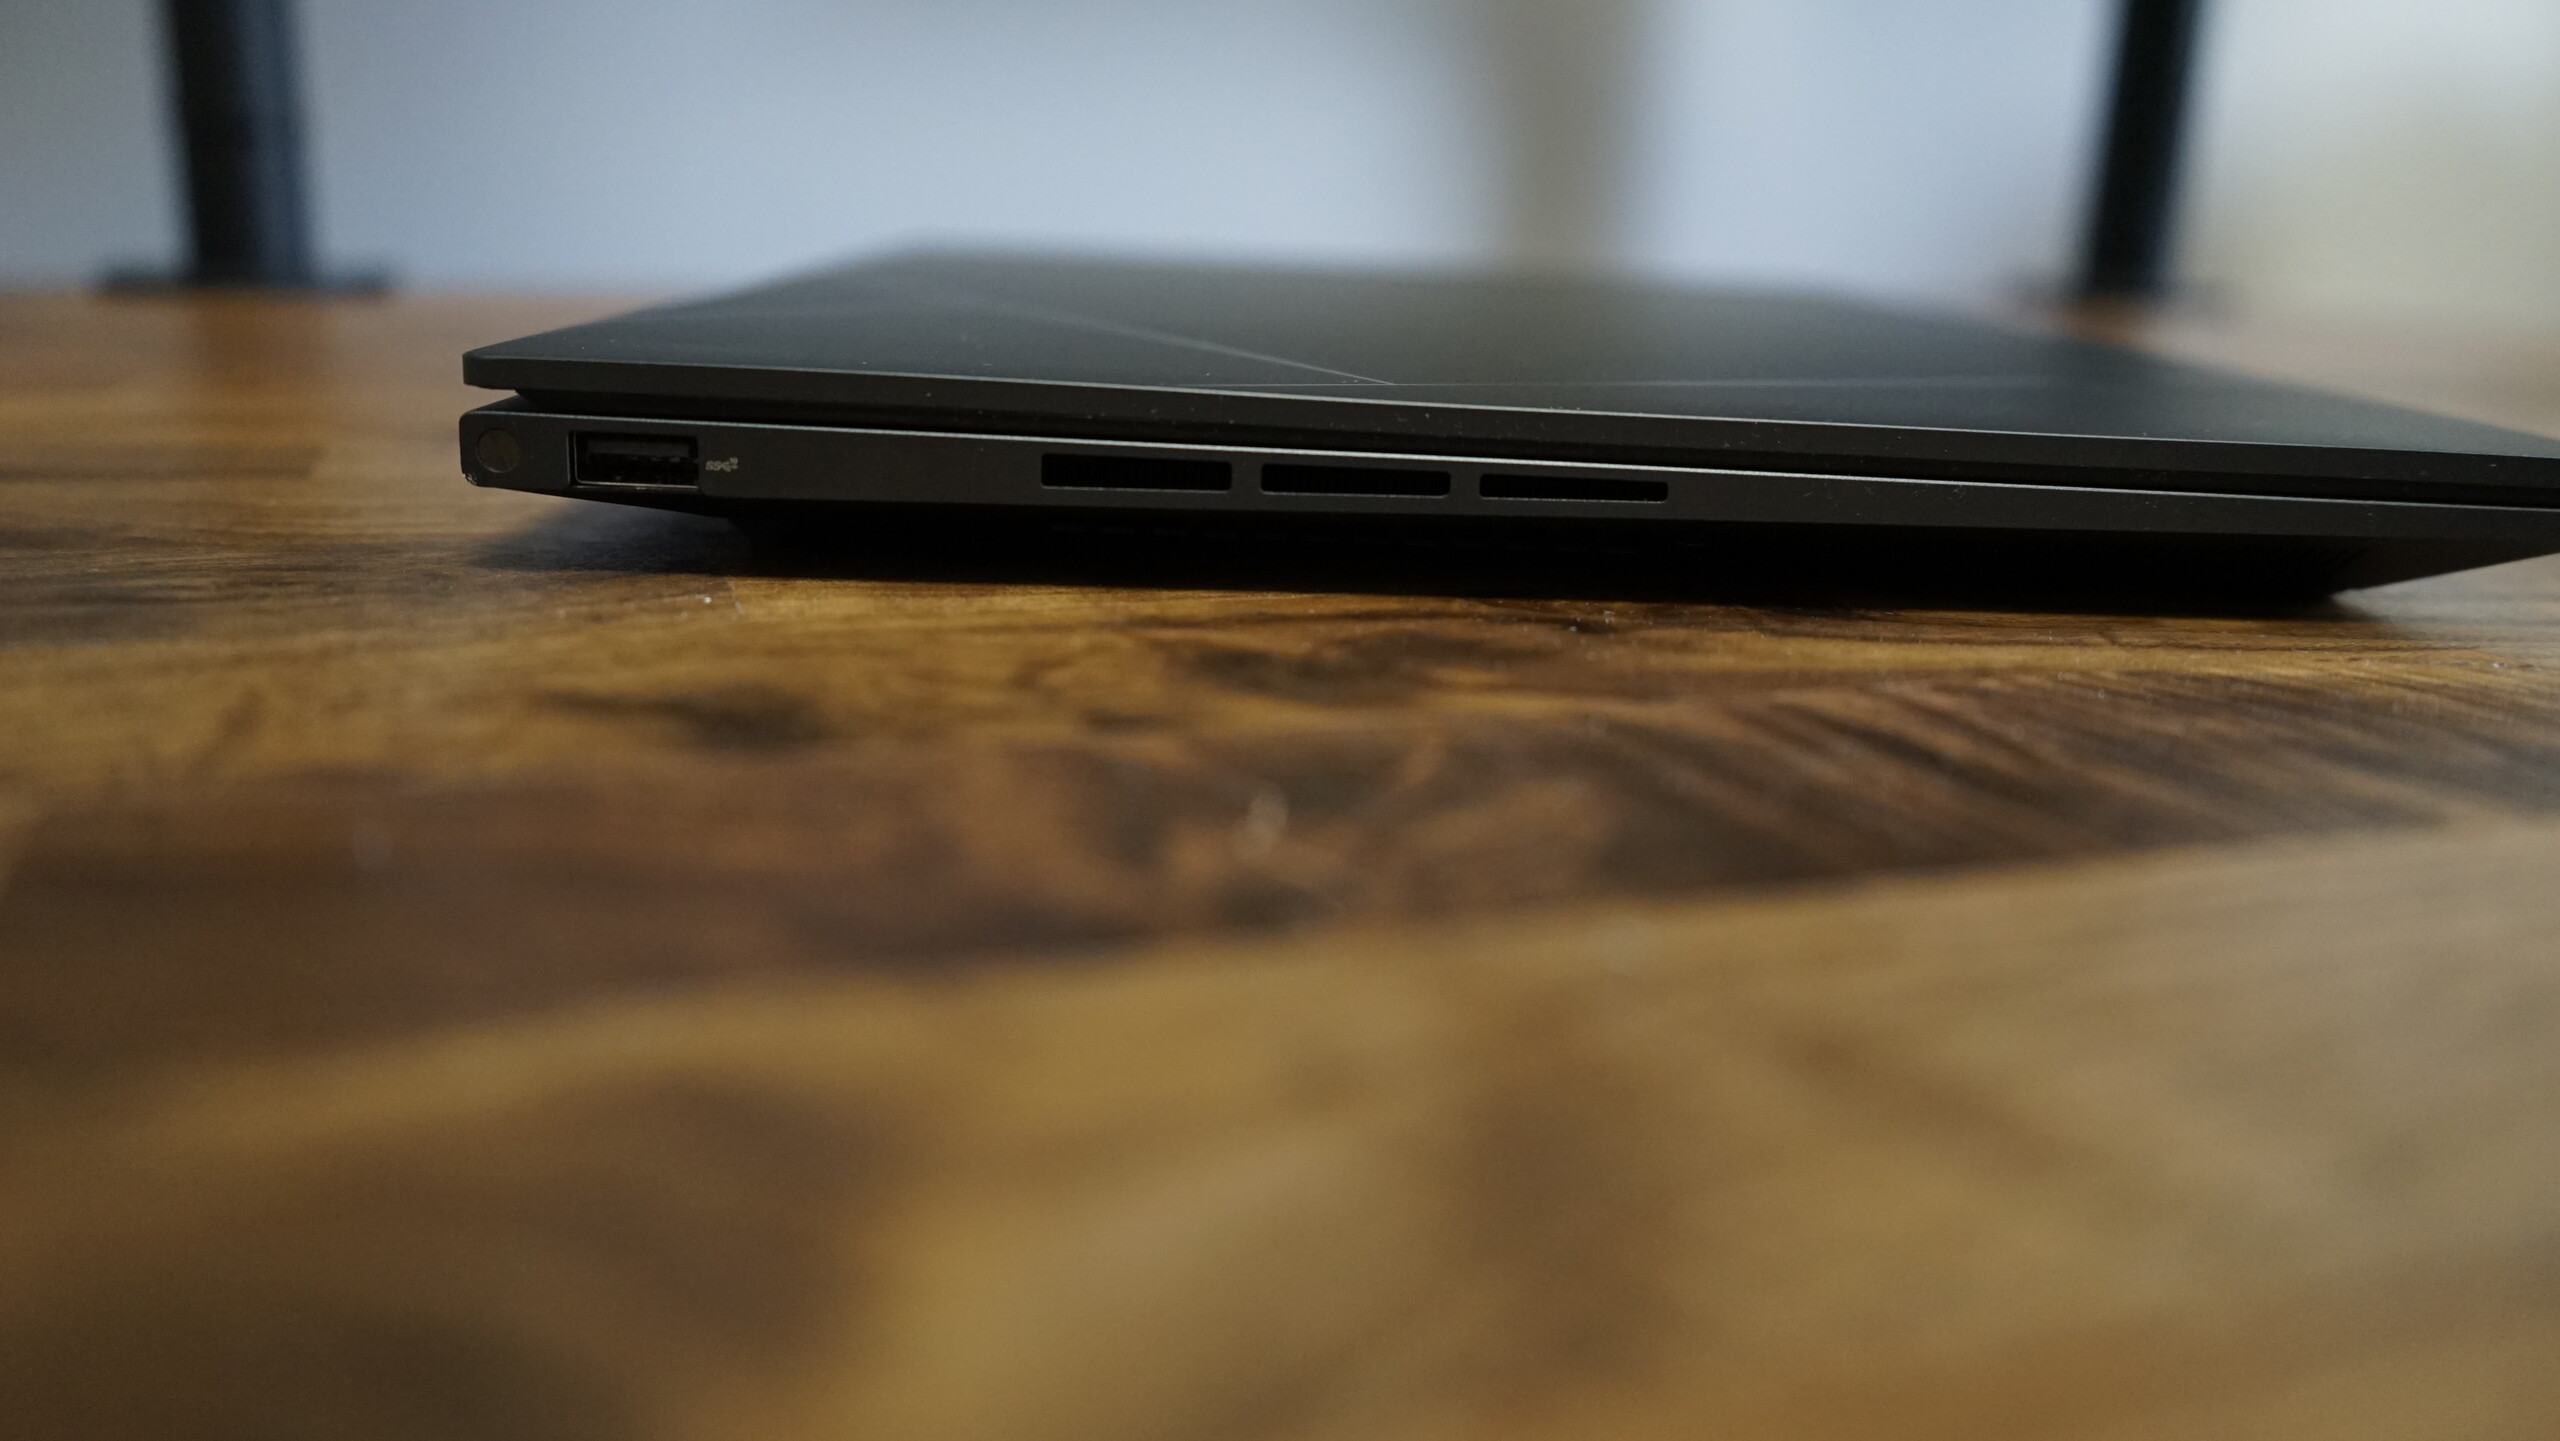
Rispetto al predecessore, il lettore microSD purtroppo non è più disponibile. Anche la posizione delle altre porte è cambiata. Sul lato sinistro è presente una sola porta USB 3.2 Gen 2 Type-A. Tutte le altre porte, ovvero le due porte Thunderbolt, una porta HDMI 2.1 e la porta audio combo, si trovano ora sulla destra. Entrambe le porte Thunderbolt possono essere utilizzate per la ricarica, quindi ne avremmo preferito una su entrambi i lati.
Comunicazione
Il modulo Intel Wi-Fi 6E-AX211 installato è sostituibile e offre risultati solidi senza problemi di connettività. I risultati della scheda sono superiori alla media per questo modello. Il modulo non solo supporta l'ultimo standard WLAN Wi-Fi 6E, ma anche Bluetooth 5.2.
Webcam
Asus ha aggiornato la webcam rispetto al modello precedente e ora offre una risoluzione Full HD anziché 720p. Windows Hello è possibile grazie al sensore IR integrato per il riconoscimento facciale. Rispetto allo scorso anno, la qualità dell'immagine è notevolmente migliorata, ma i risultati dipendono molto dalle condizioni di illuminazione.


Accessori
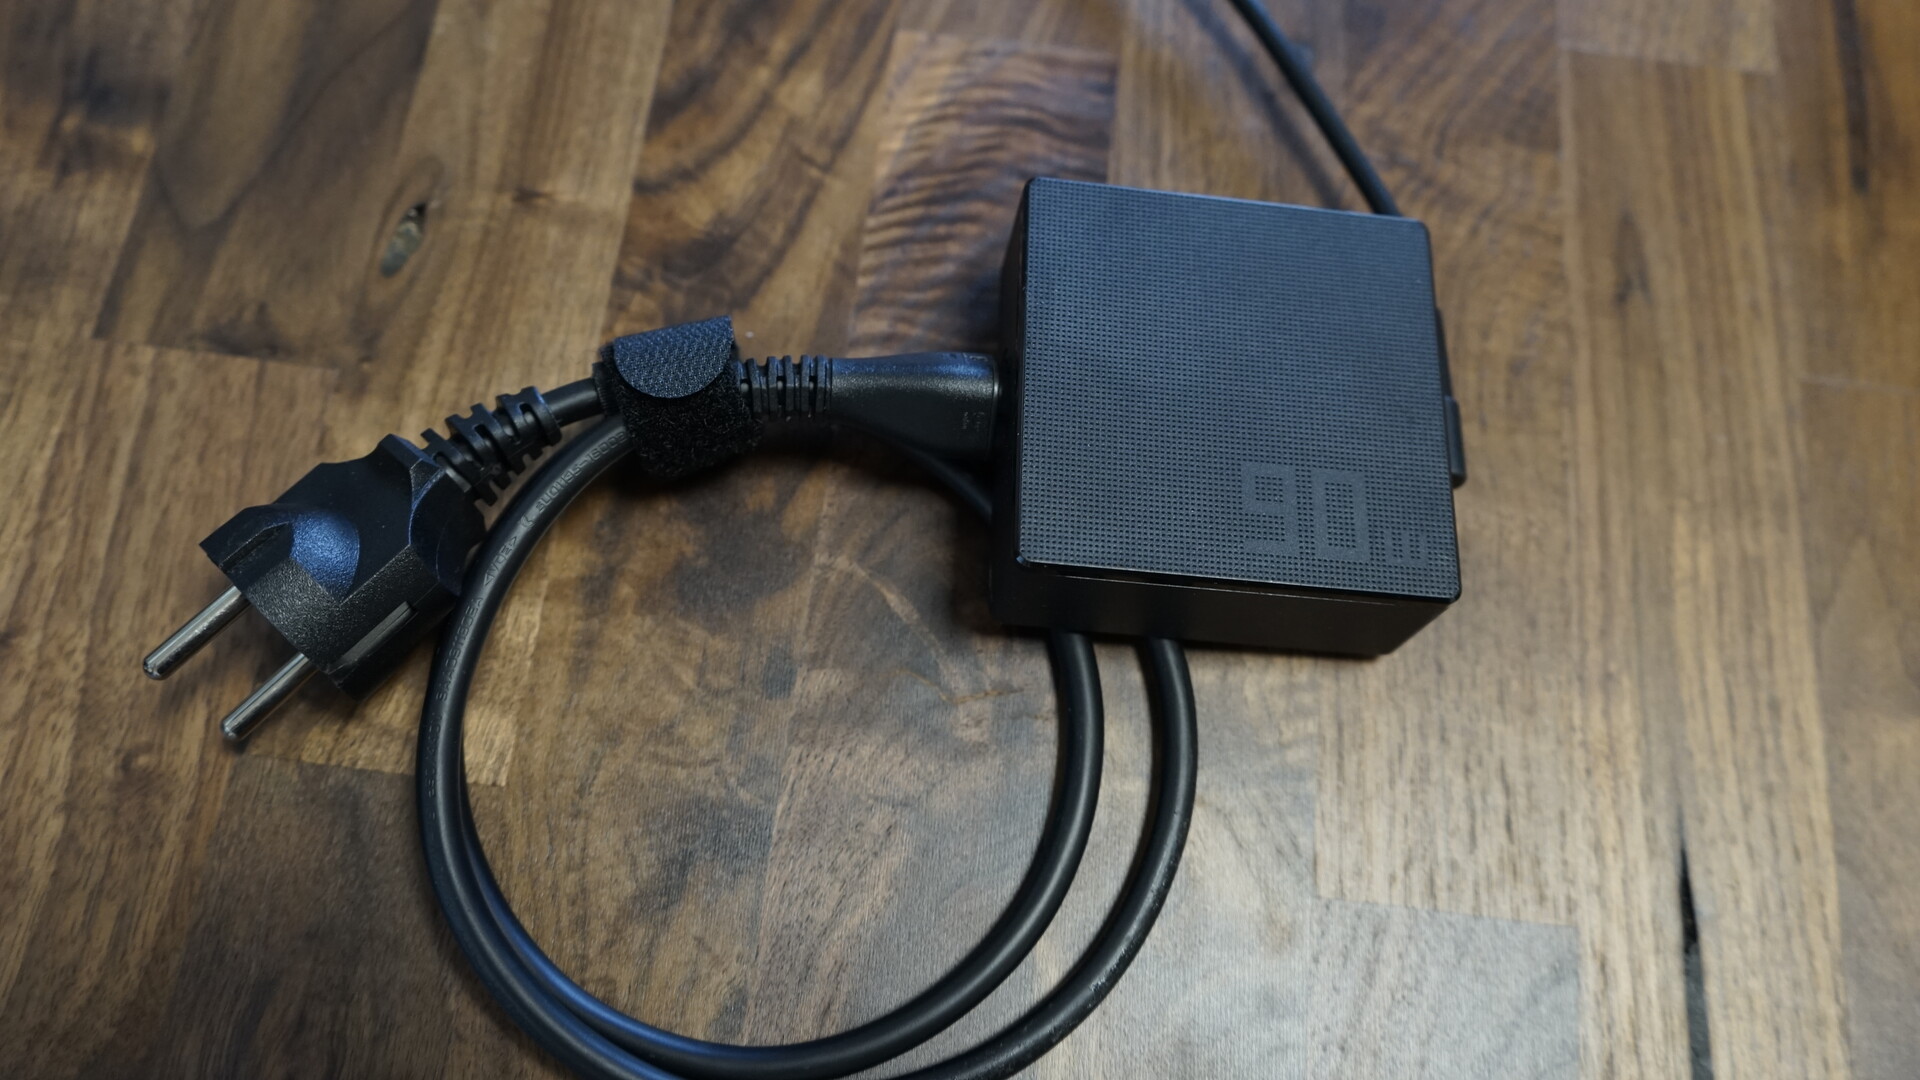
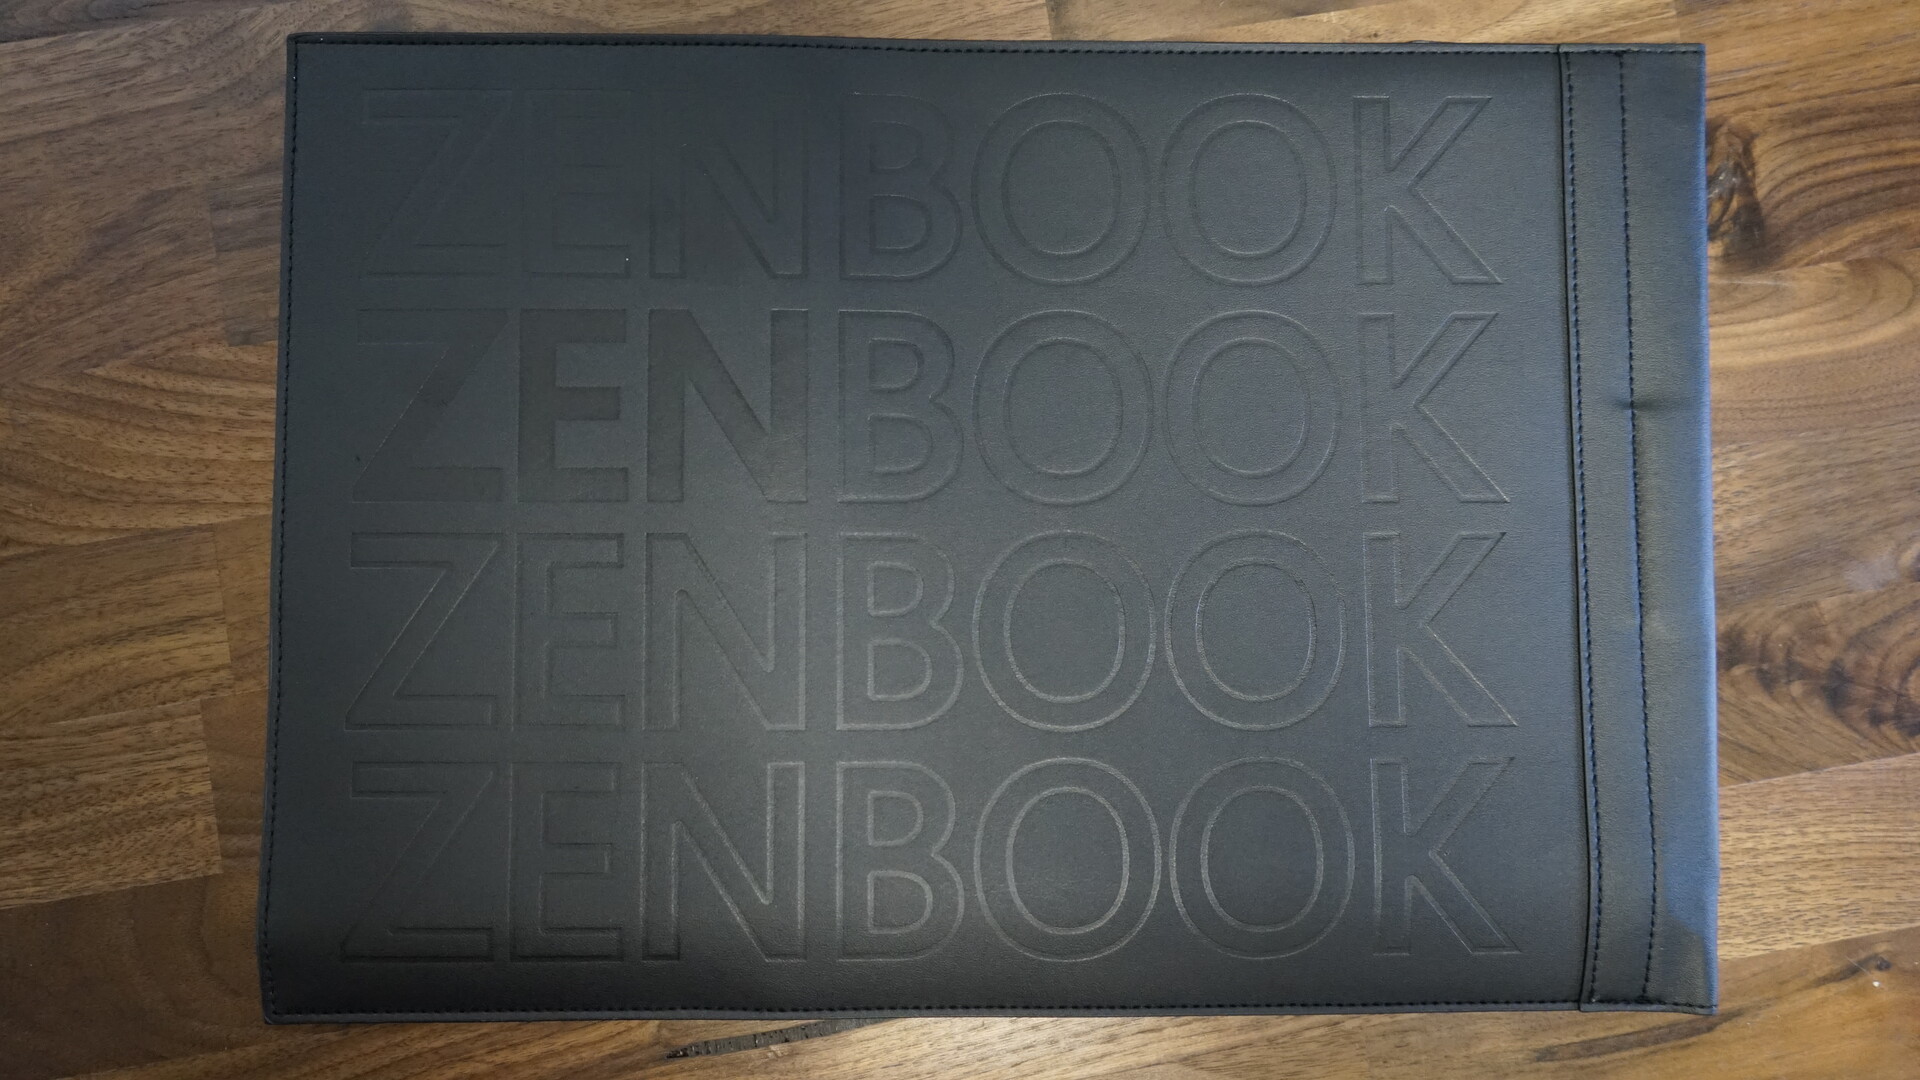
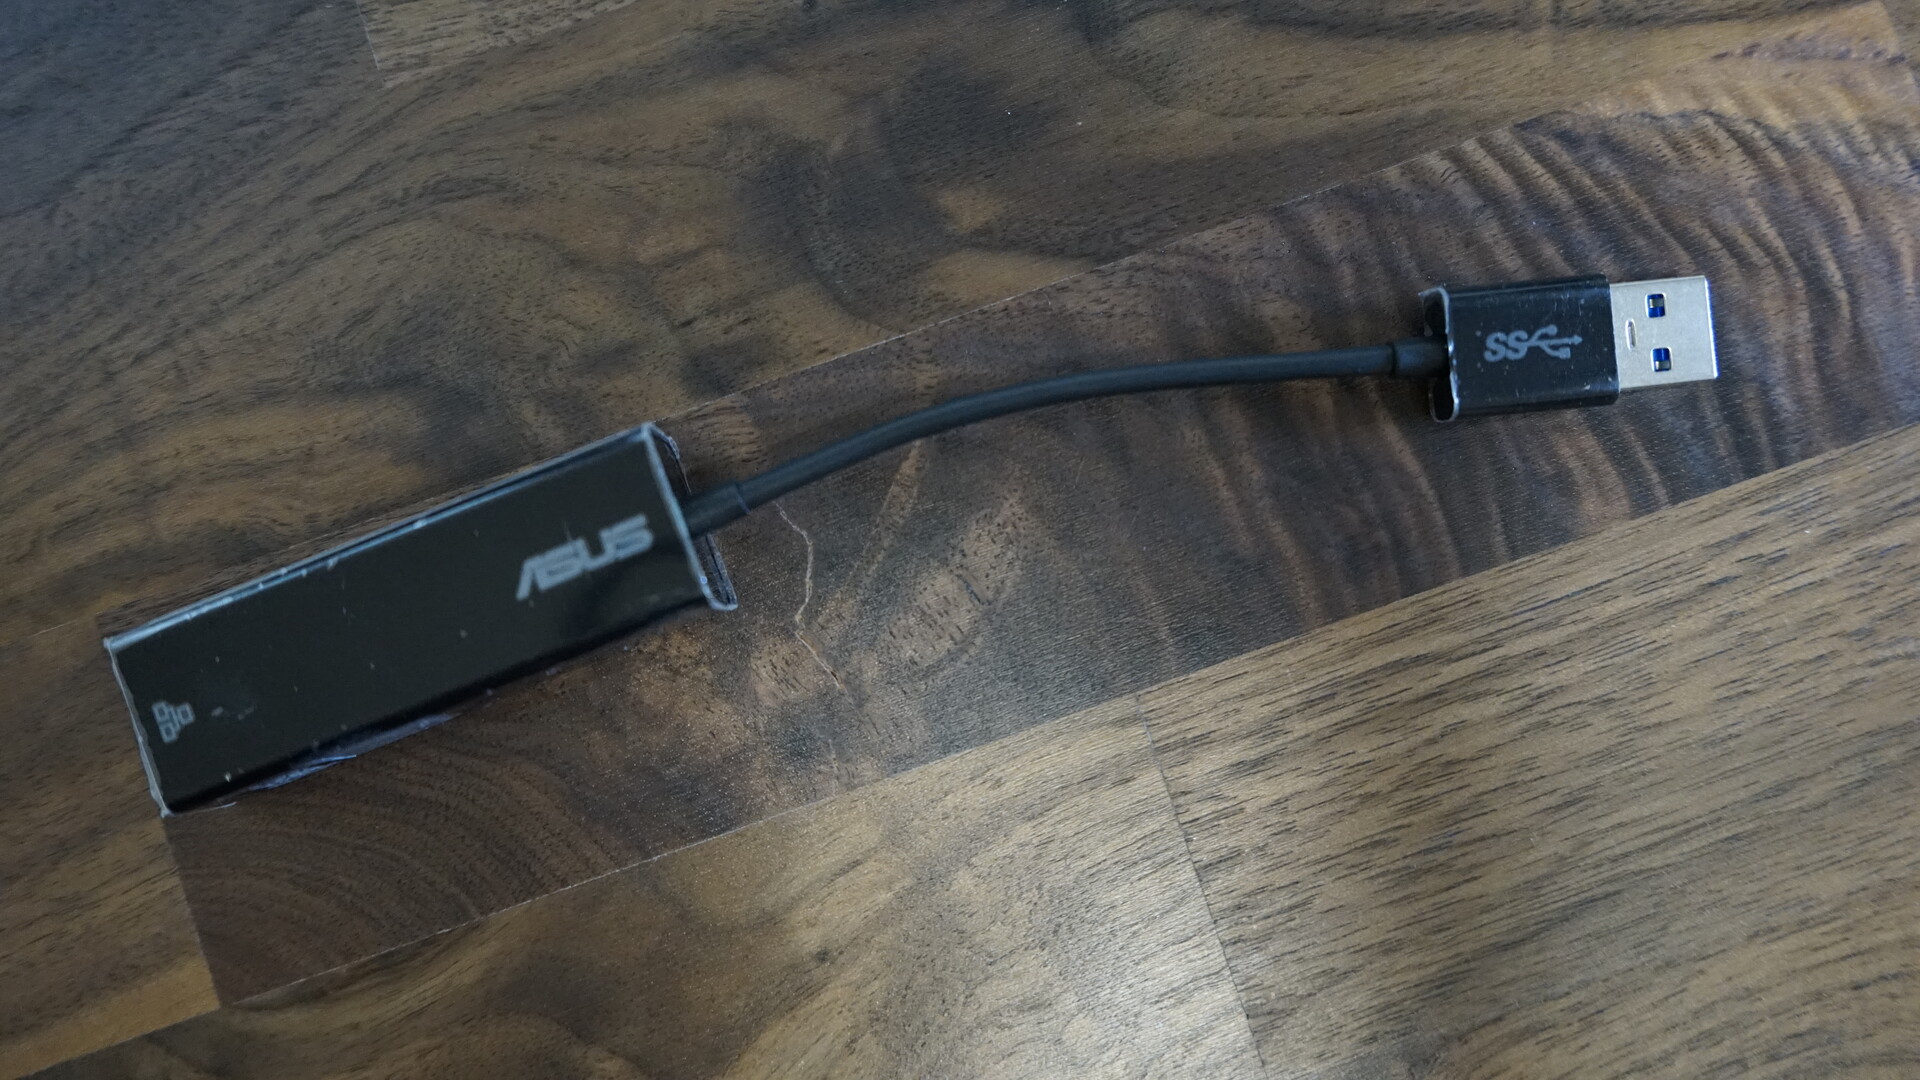
Gli accessori dell'Asus ZenBook 14X consistono in un alimentatore compatto da 90 watt, un adattatore Ethernet USB Type-A e una pratica custodia protettiva. La custodia protettiva è realizzata in plastica con un rivestimento interno morbido al tatto.
Manutenzione
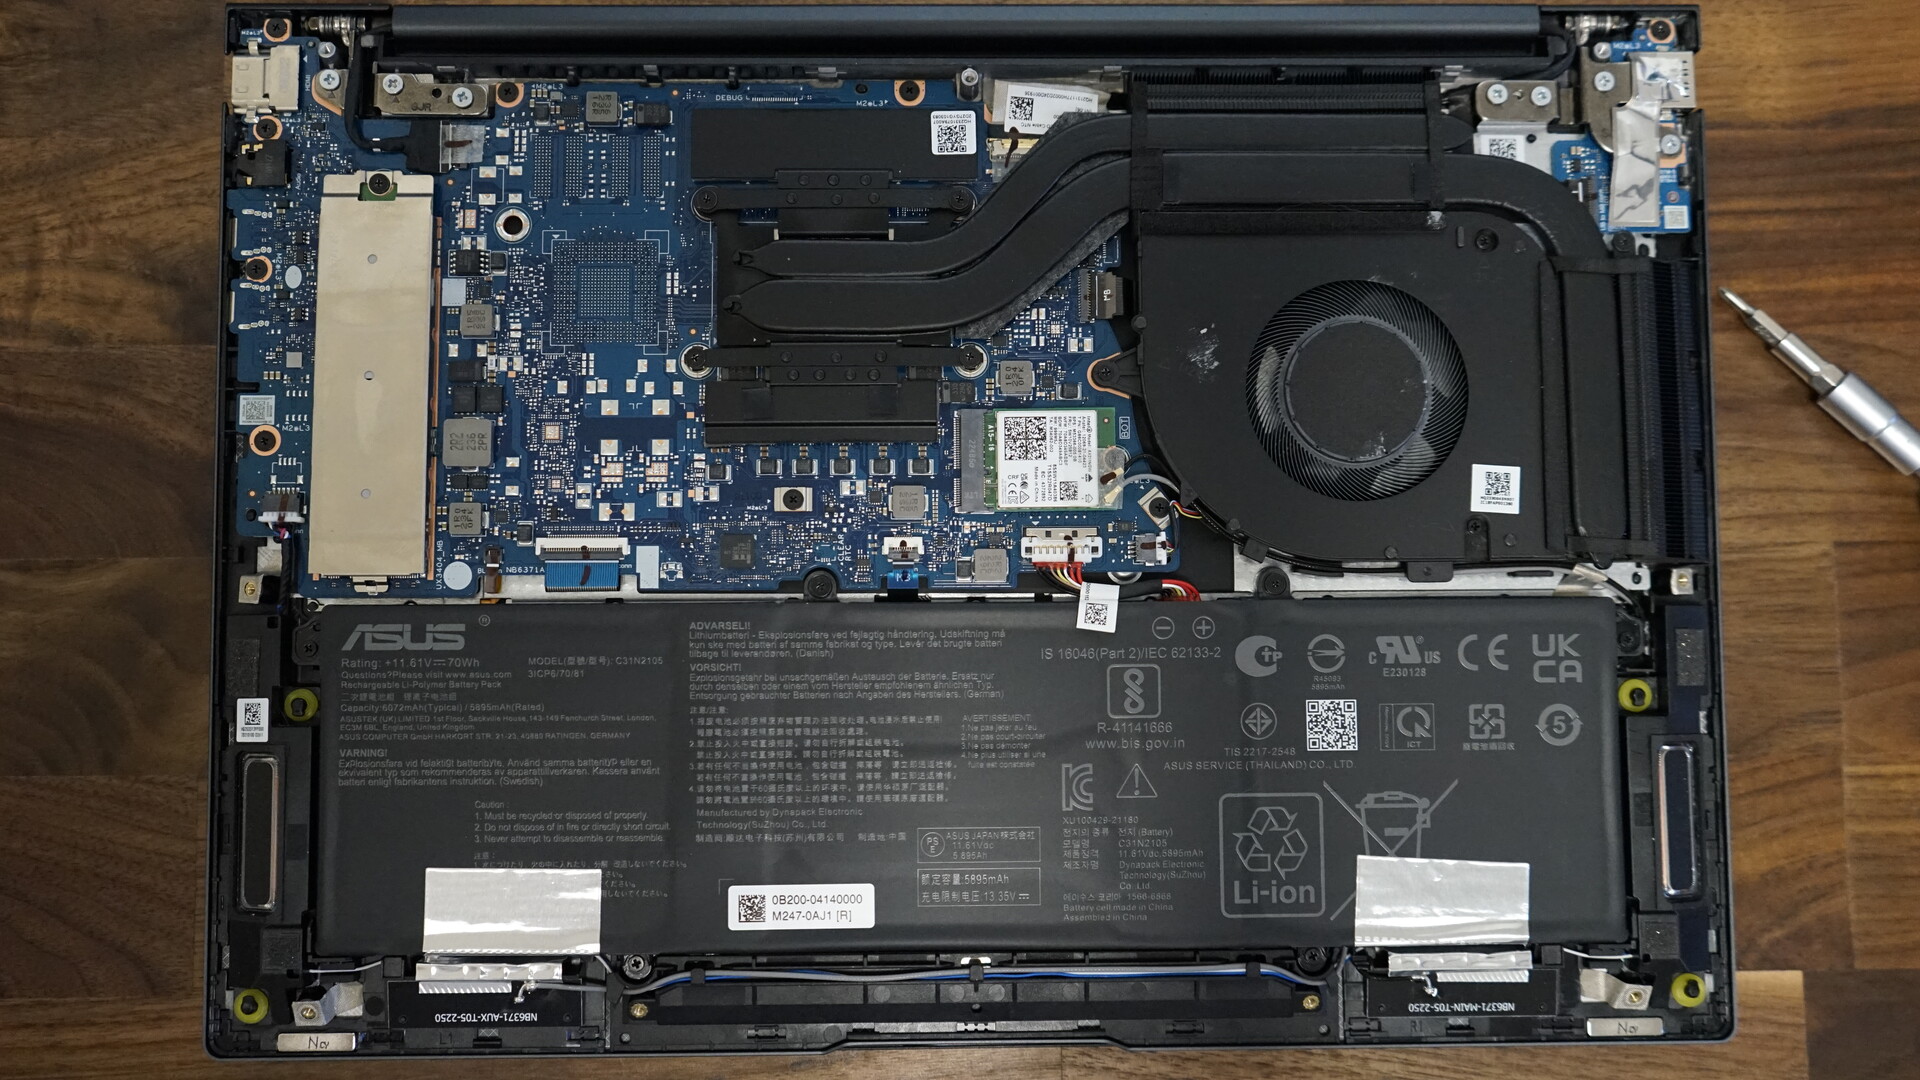
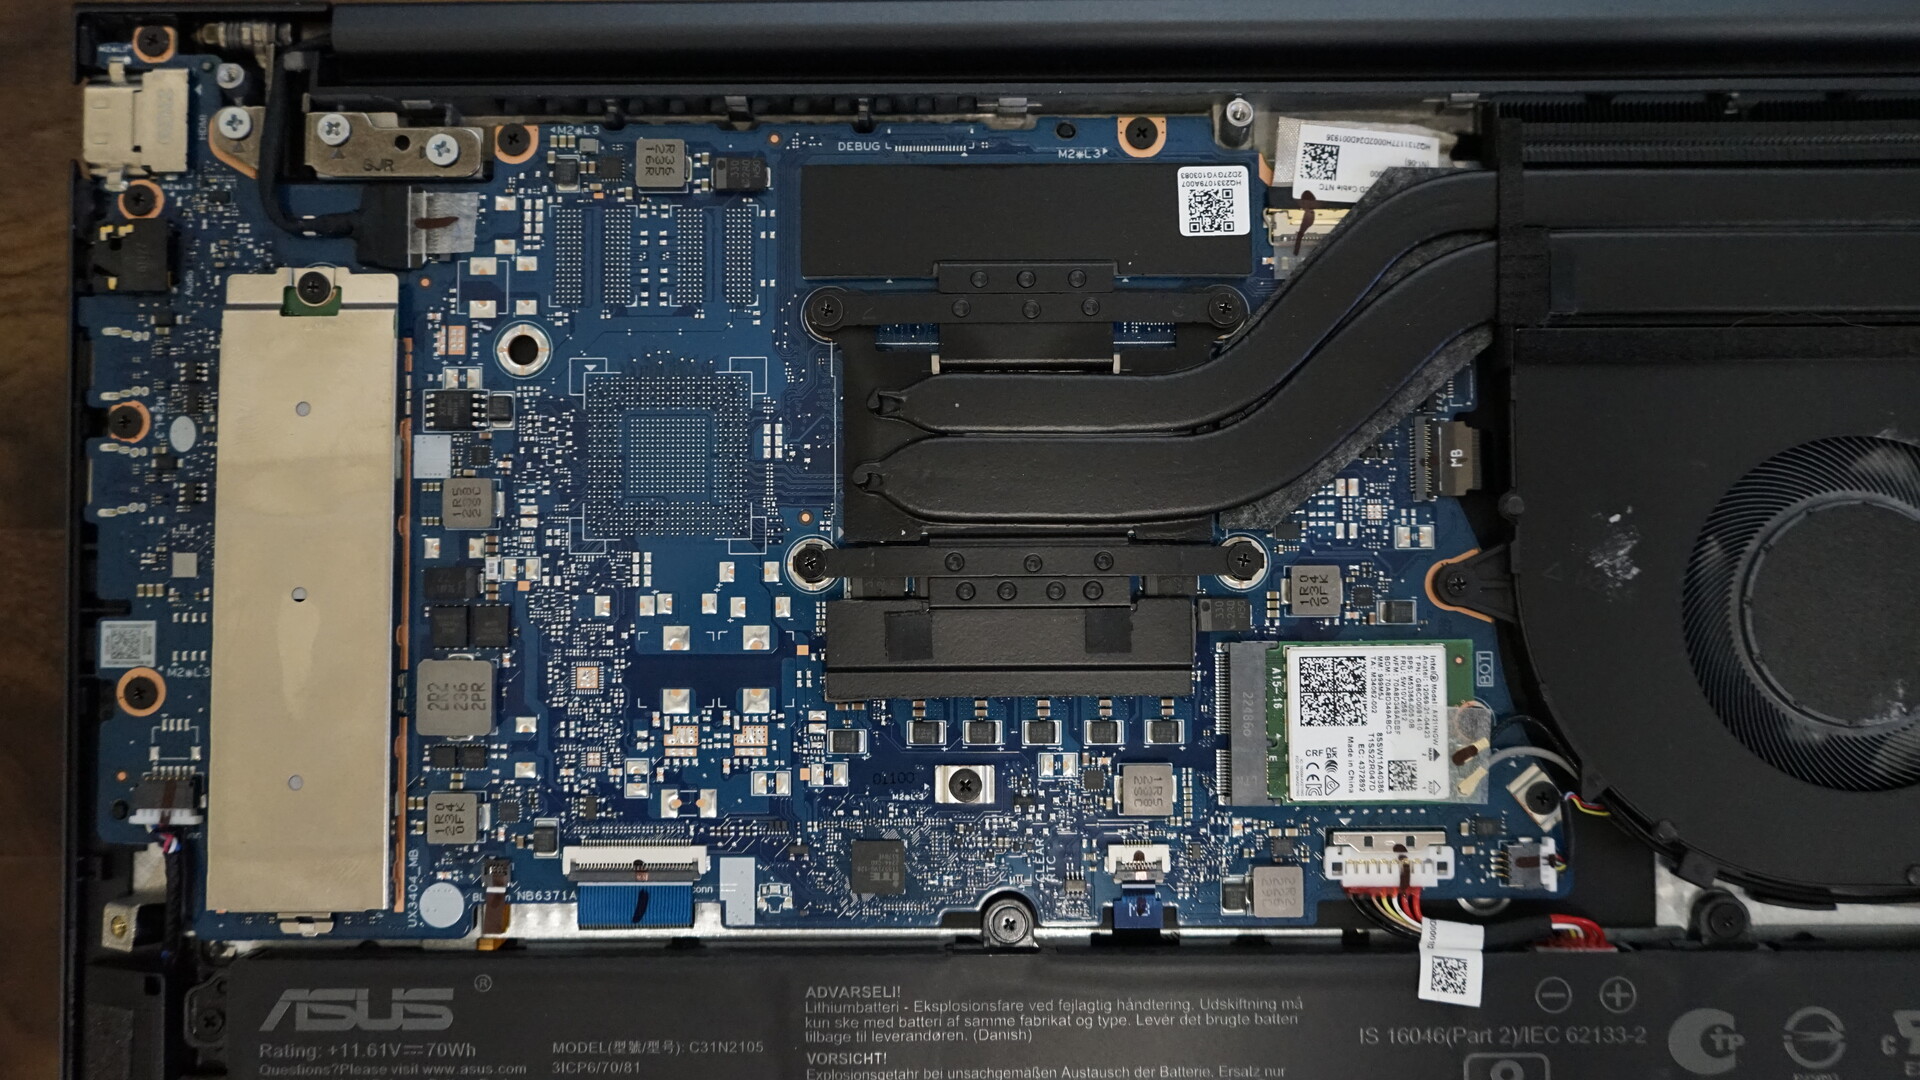
L'apertura dello ZenBook è relativamente semplice e dal fondo è necessario rimuovere solo nove viti facilmente accessibili. Il modulo Wi-Fi, la batteria e l'SSD sono sostituibili, mentre la RAM è saldata. La struttura interna rivela anche la differenza di raffreddamento rispetto al predecessore, poiché nel modello 2023 è installata una sola ventola.
Garanzia
Asus fornisce una garanzia di ritiro e restituzione di due anni in Germania. Questa garanzia potrebbe essere diversa in altri paesi, quindi gli acquirenti interessati dovrebbero verificare prima dell'acquisto.
Dispositivi di ingresso
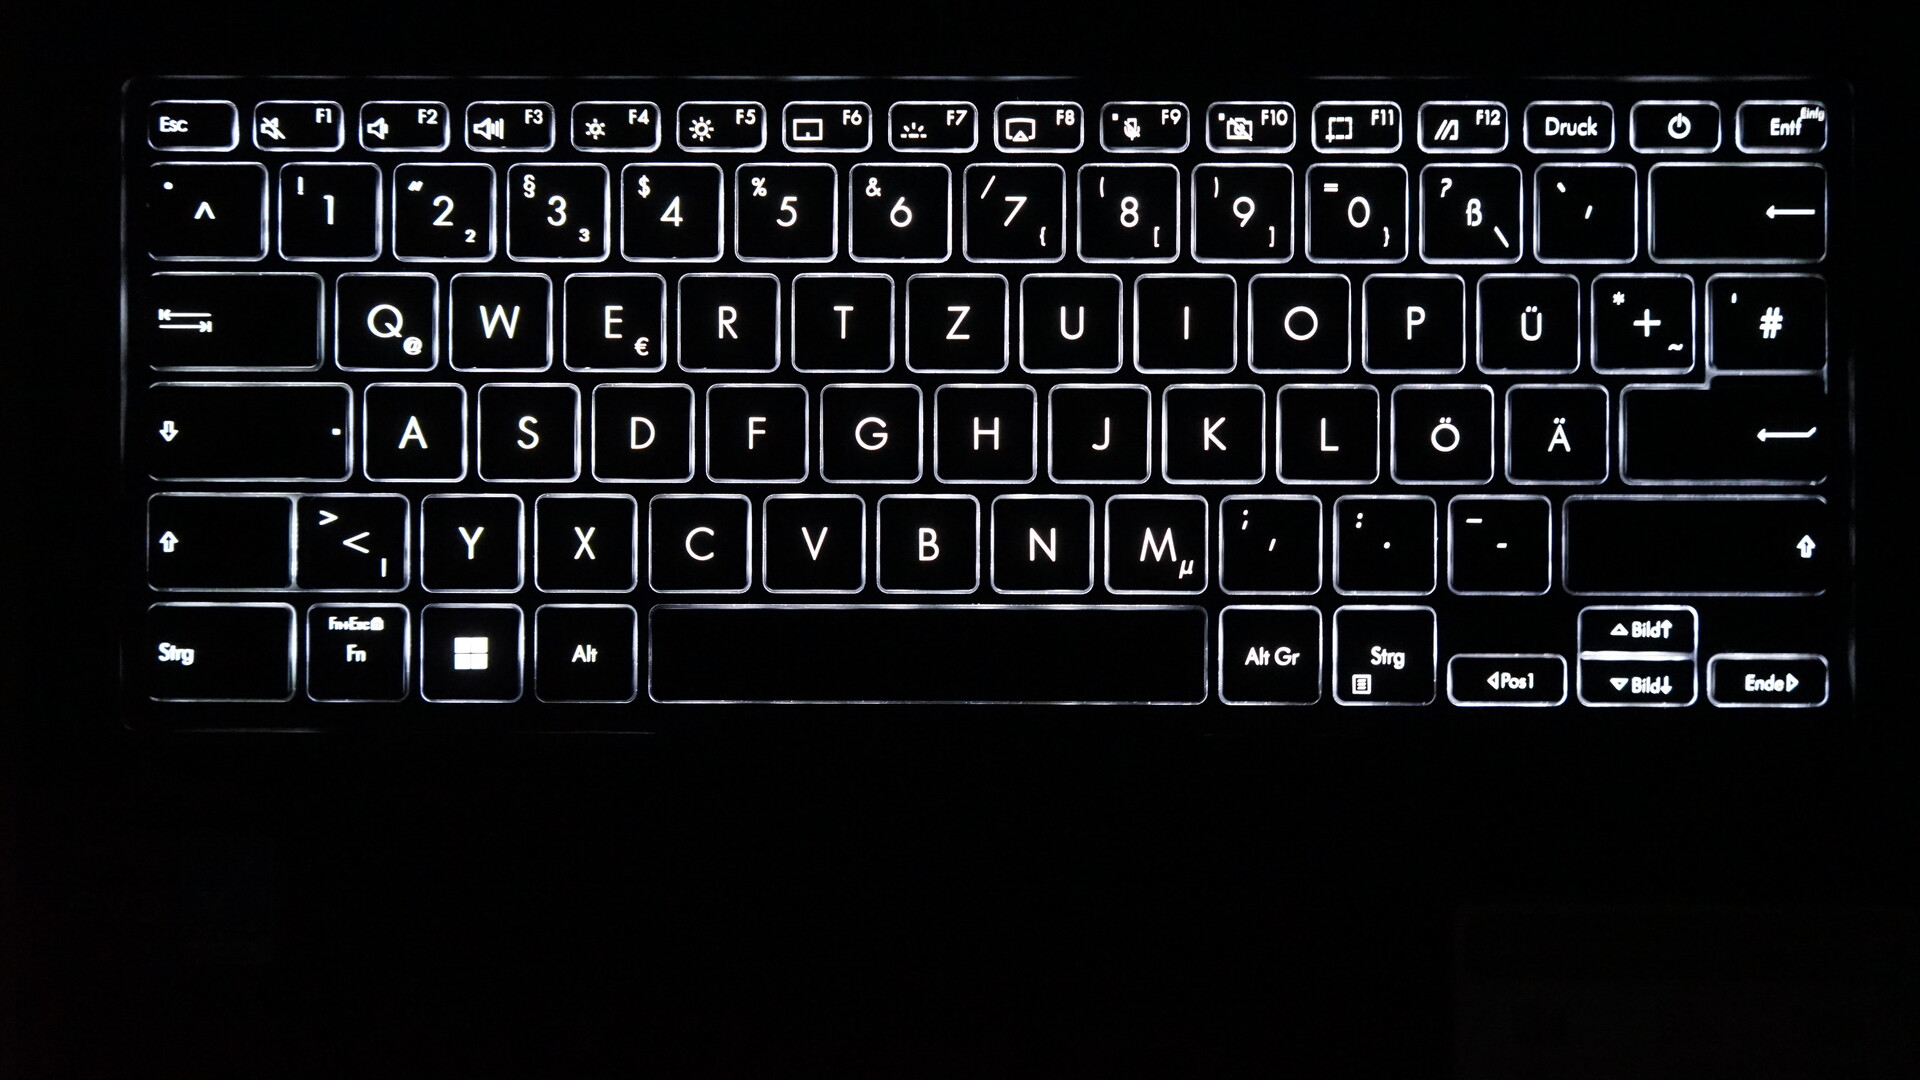
La tastiera del modello 2023 è priva dei tasti immagine e del tasto di fine corsa. Questi sono invece presenti come funzione secondaria sui tasti freccia. I tasti sono opachi e antiscivolo, con un punto di pressione molto chiaro, una corsa solida e una corsa decisa. La sensazione di digitazione è molto nitida e il rumore di battitura è da moderato a silenzioso. La retroilluminazione bianca è a tre livelli e la luce è distribuita in modo molto uniforme, per cui lavorare in ambienti bui non è un problema. La spaziatura dei tasti è di 2,5 mm, come nel modello precedente, il che offre una piacevole sensazione di digitazione senza limitazioni. La solida base dello ZenBook si nota anche durante la digitazione, fornendo una superficie stabile e inflessibile
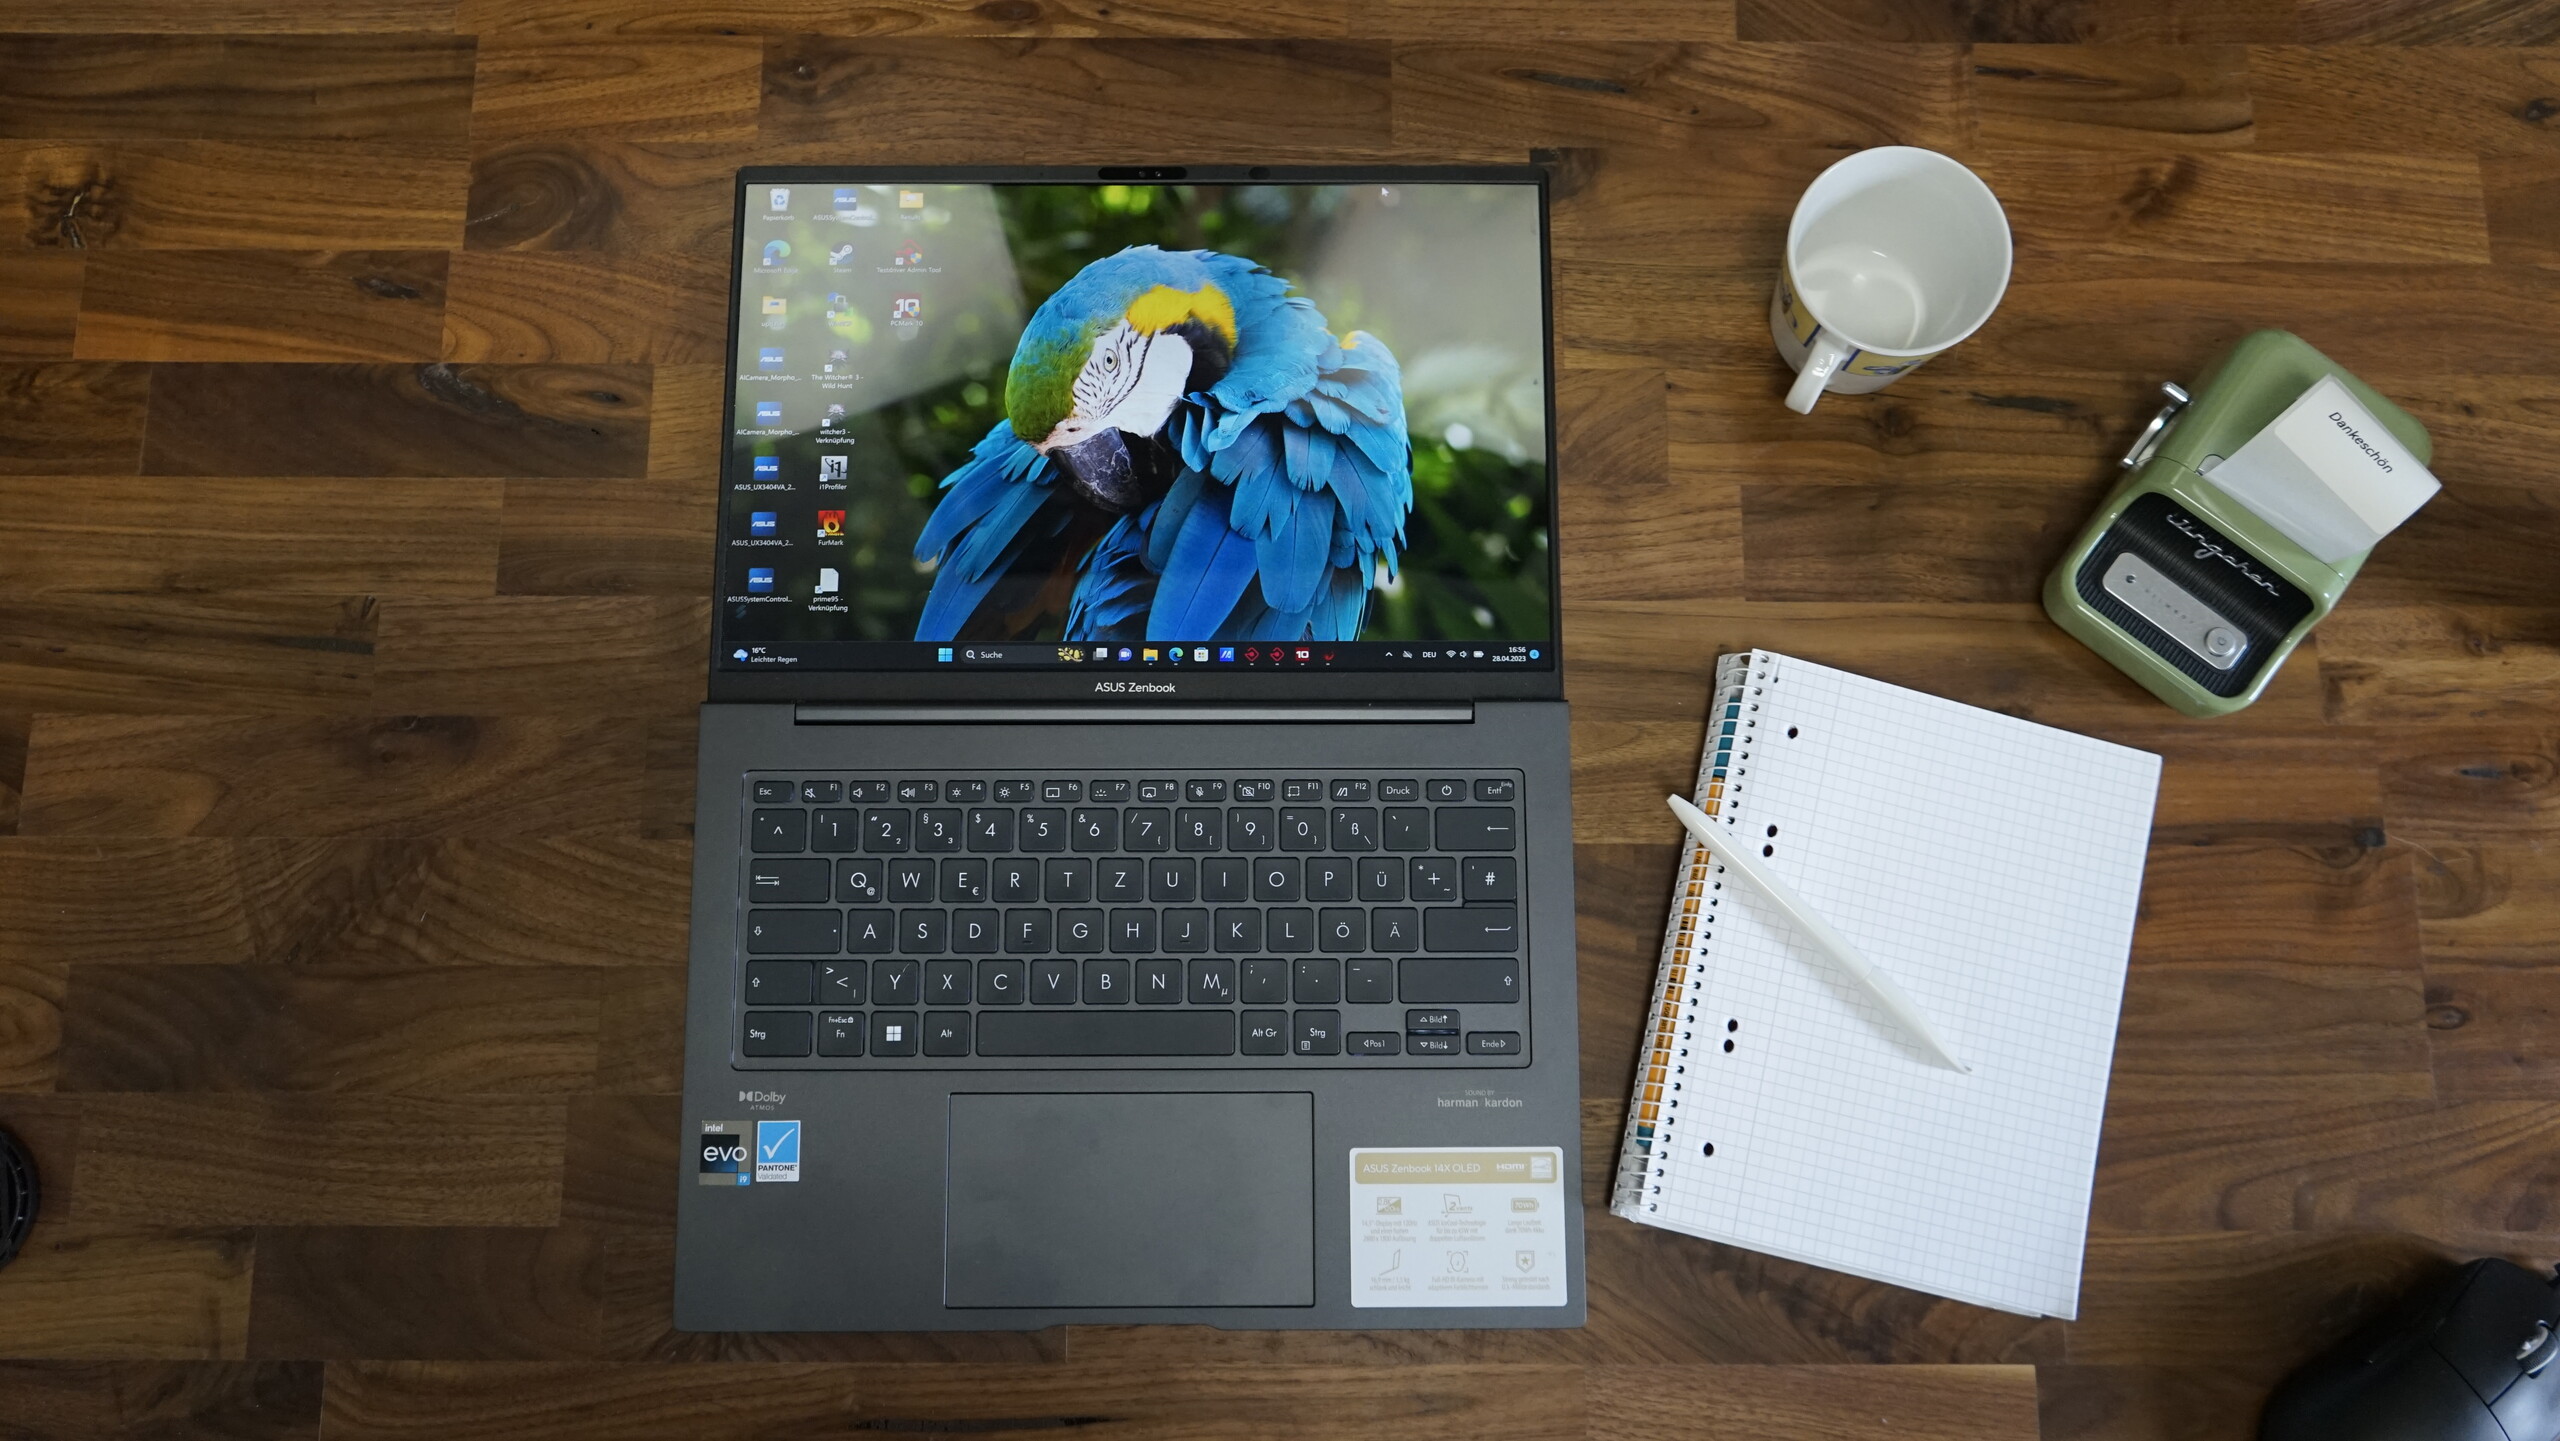
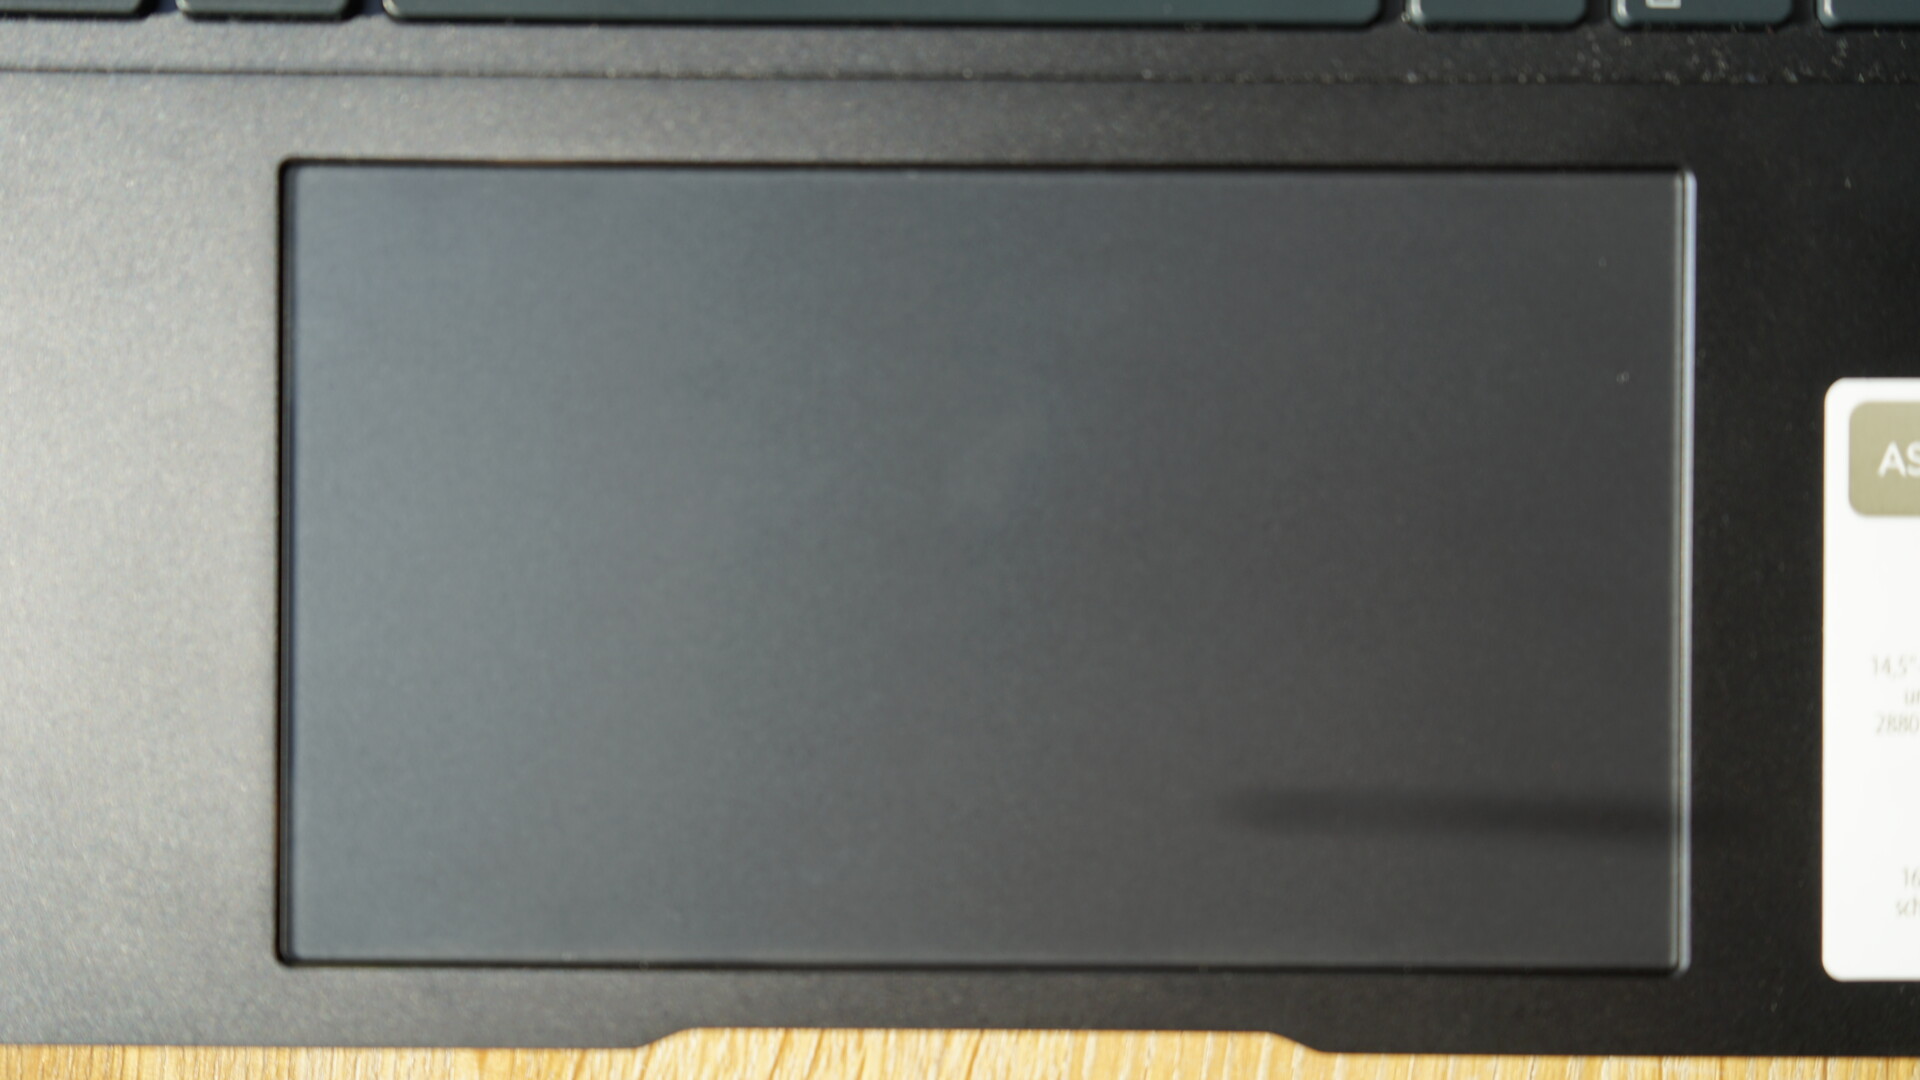
Il clickpad misura 13 x 7,6 cm ed è quindi sufficientemente ampio per i movimenti del puntatore e i gesti con un massimo di quattro dita. Le proprietà di scorrimento sono molto buone e i clic su entrambi i lati sono stabili e di alta qualità, con un suono solido. Il tastierino numerico, integrato nel touchpad del dispositivo dello scorso anno, non è più disponibile come tale nel nostro dispositivo in prova.
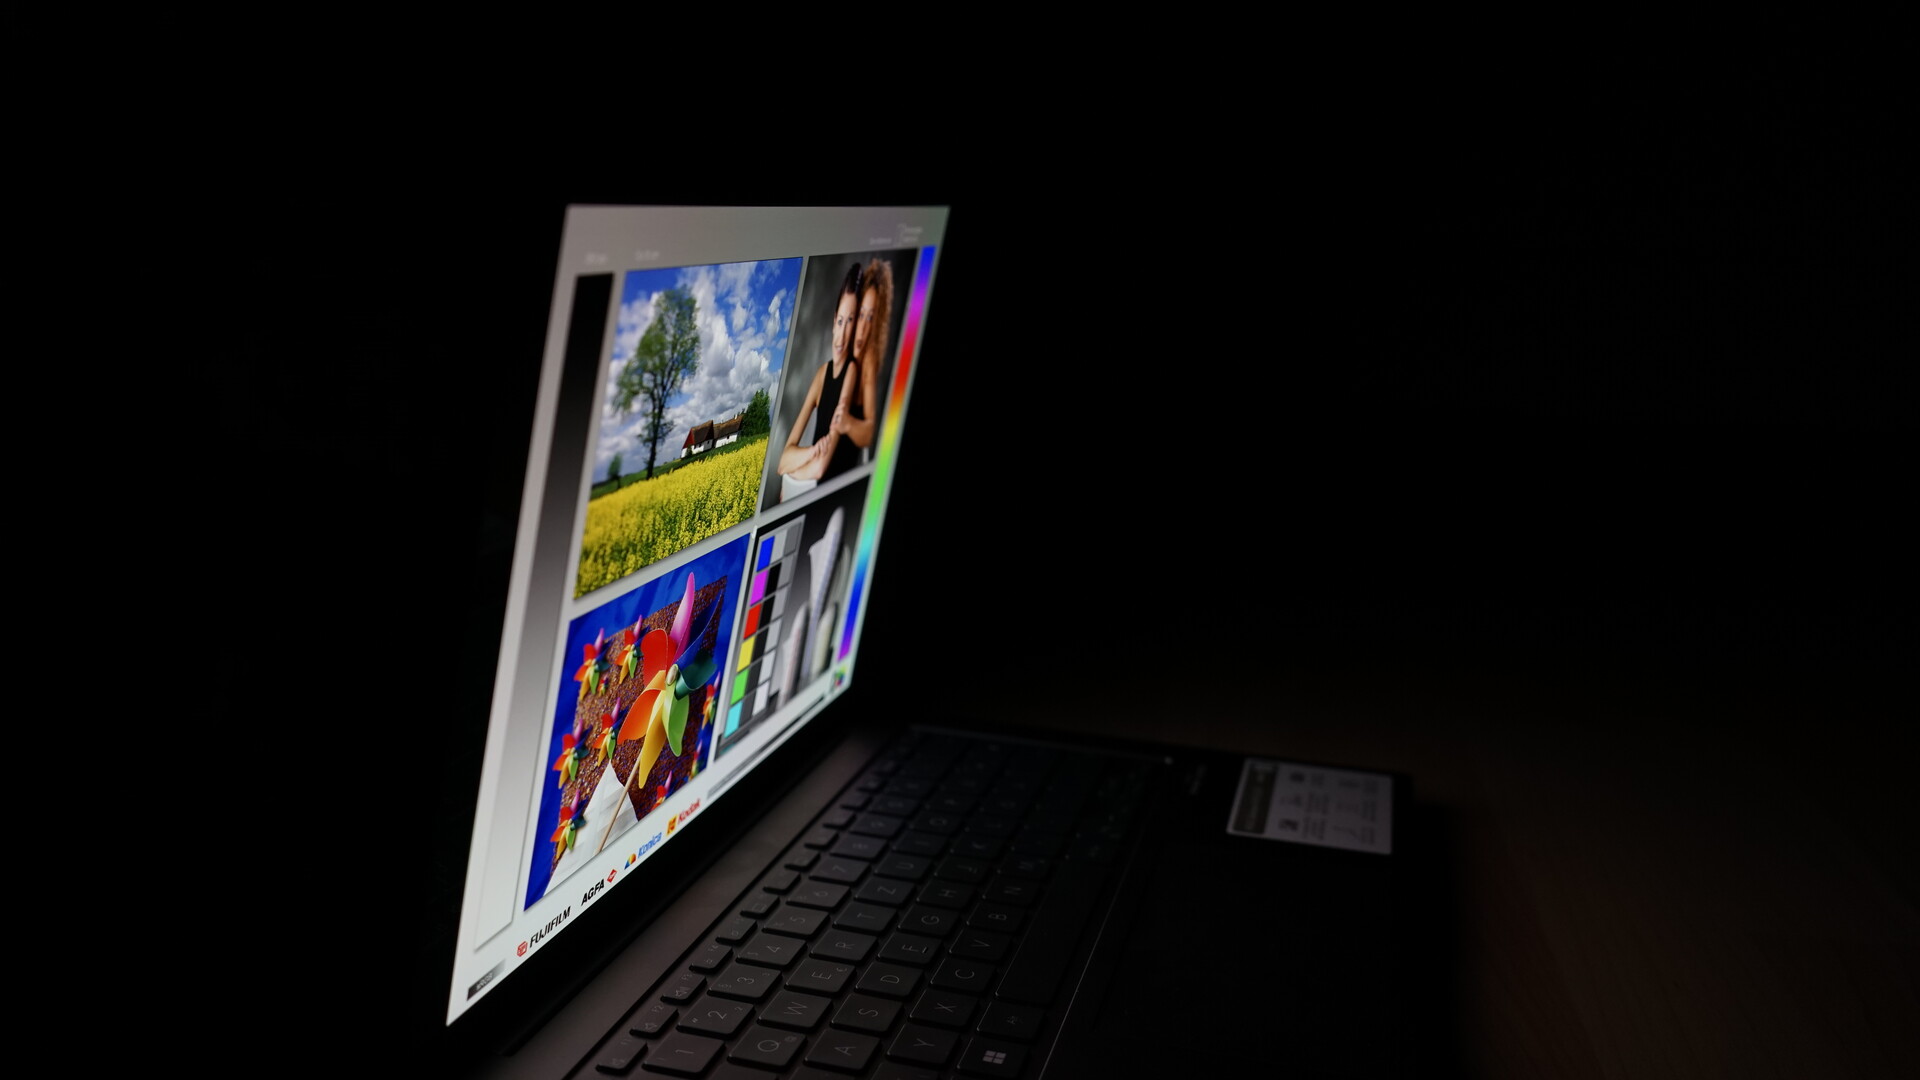
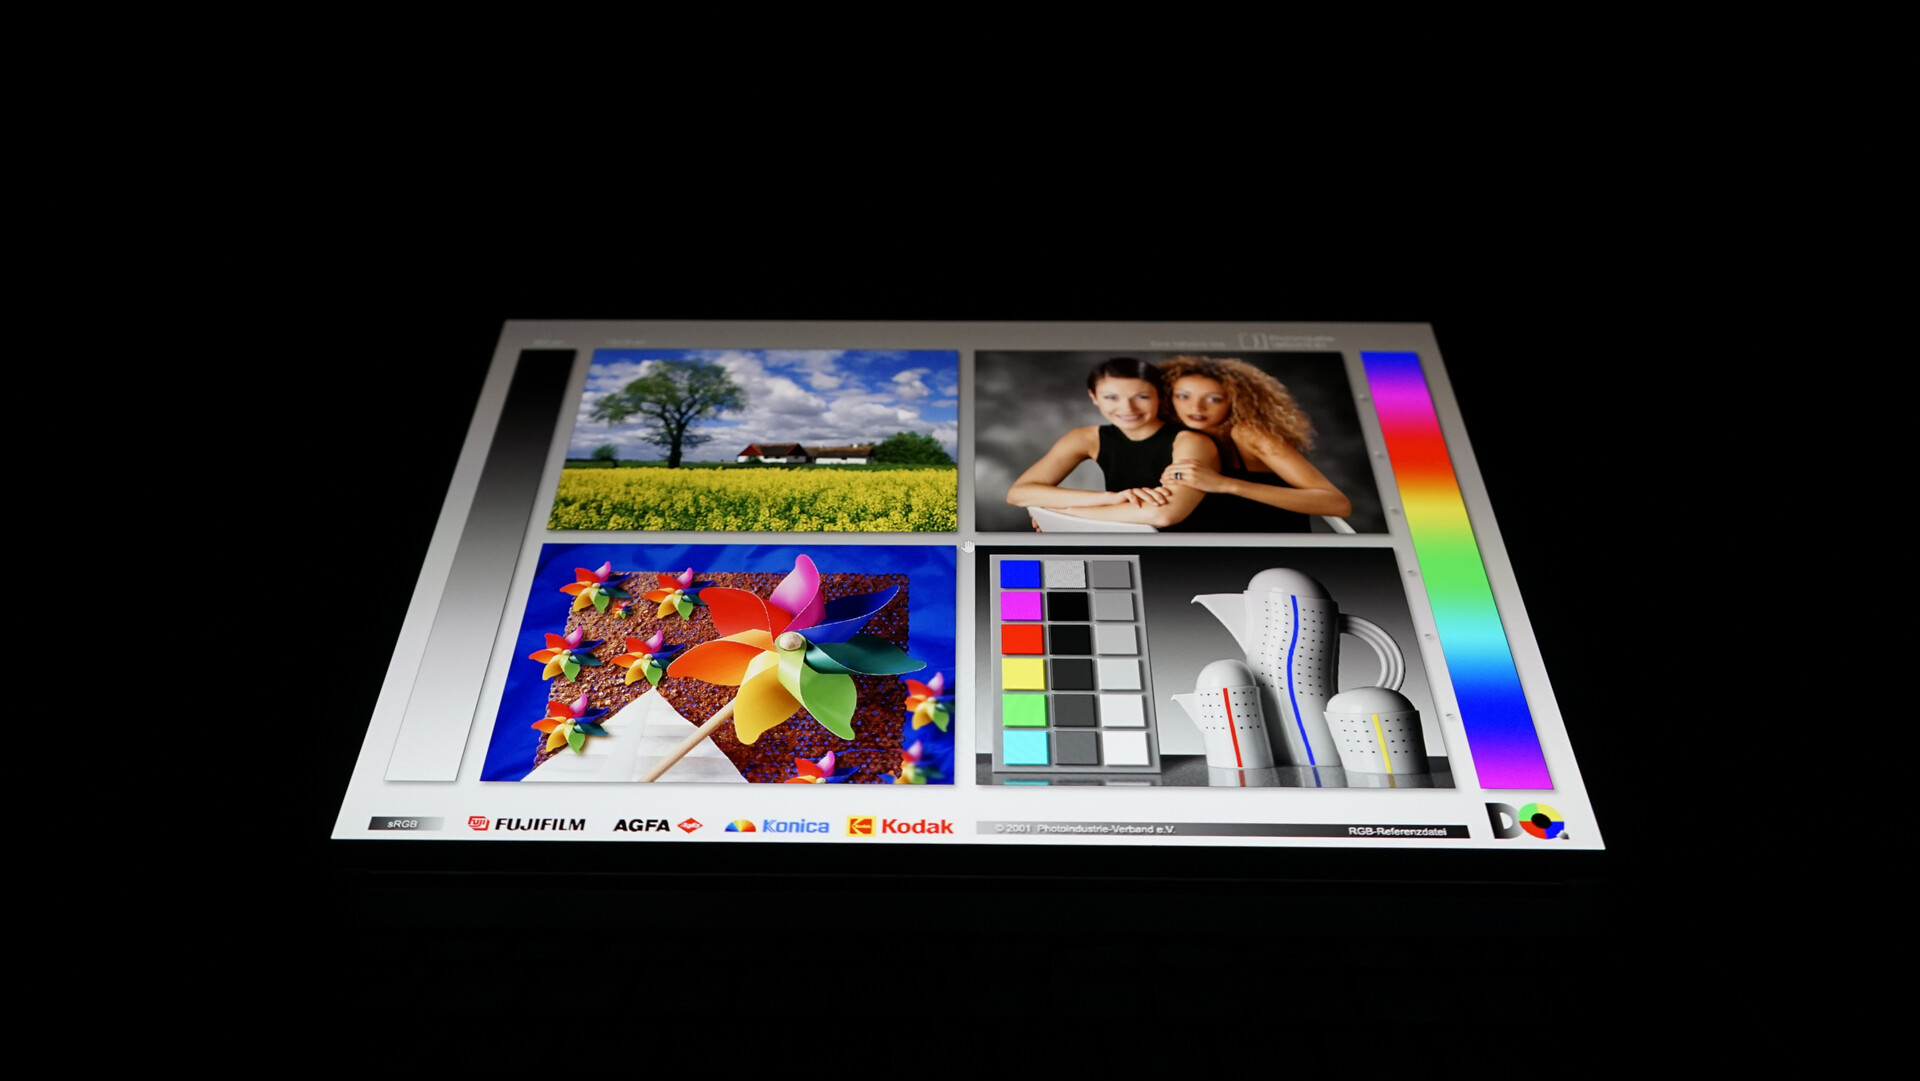
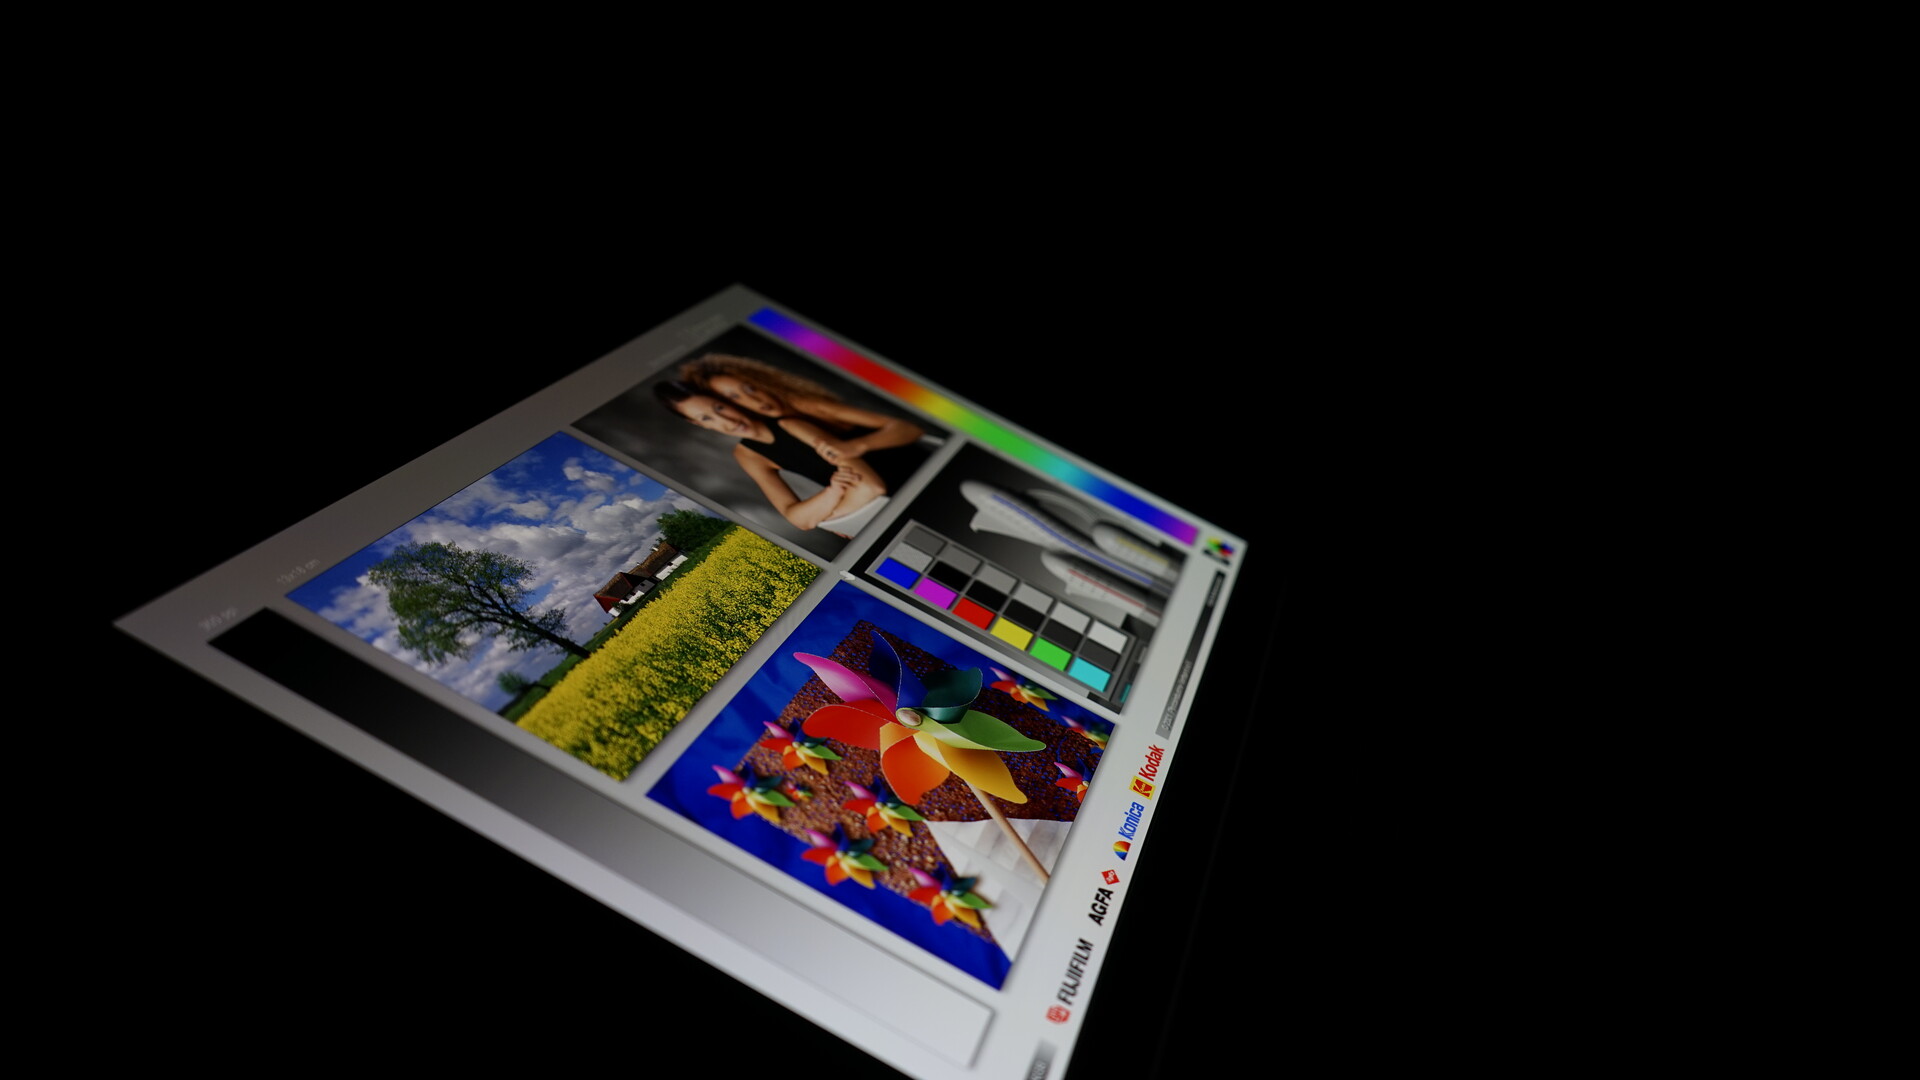
Display - 2,8K e 120 Hz
Il protagonista dell'Asus ZenBook 14X è il pannello OLED da 14 pollici. Il display lucido offre una risoluzione di 2.880x1.800 in formato 16:10, una frequenza di aggiornamento di 120 Hz e un tempo di risposta di soli 2 millisecondi. La variante che abbiamo testato è quella non touch. In alternativa, Asus offre anche il display con funzione touch
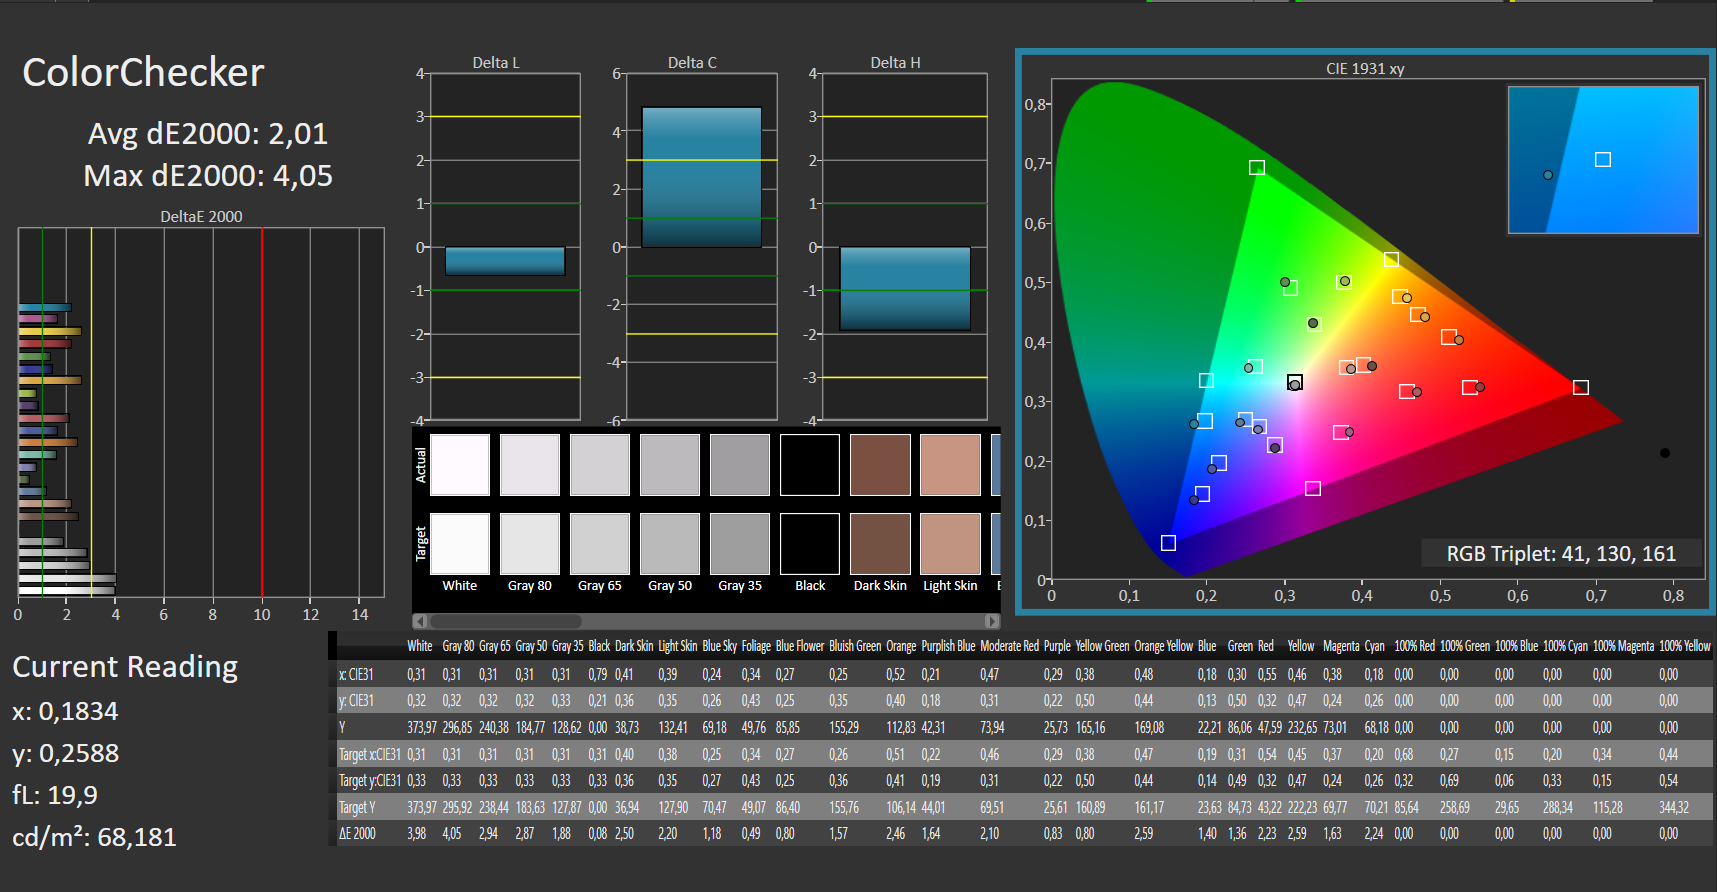
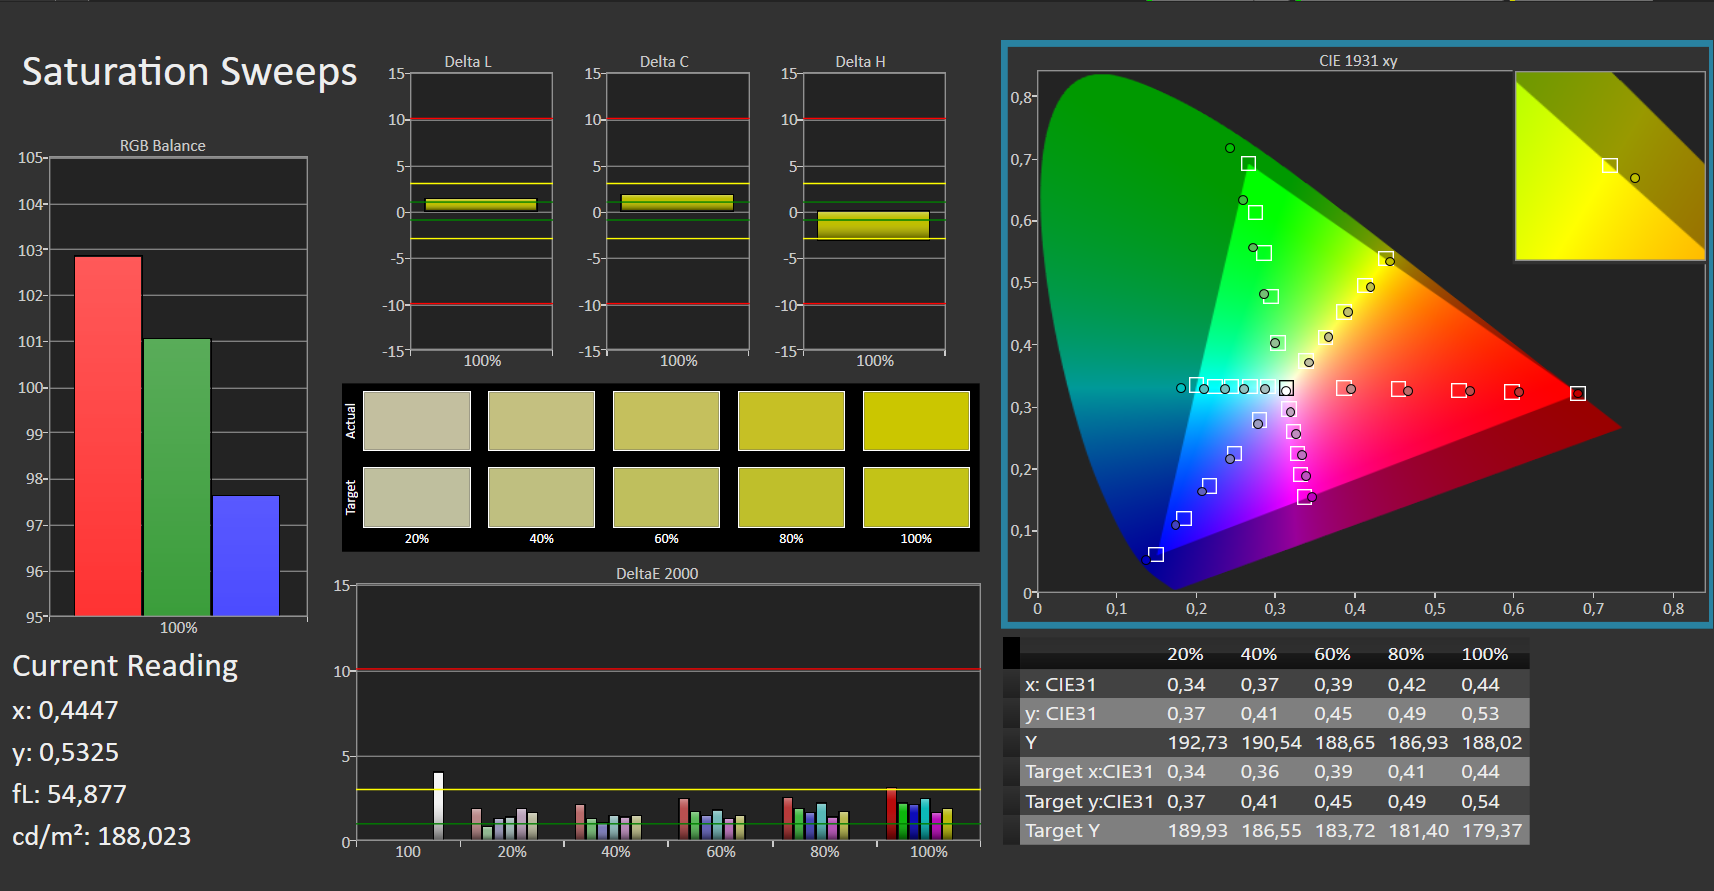
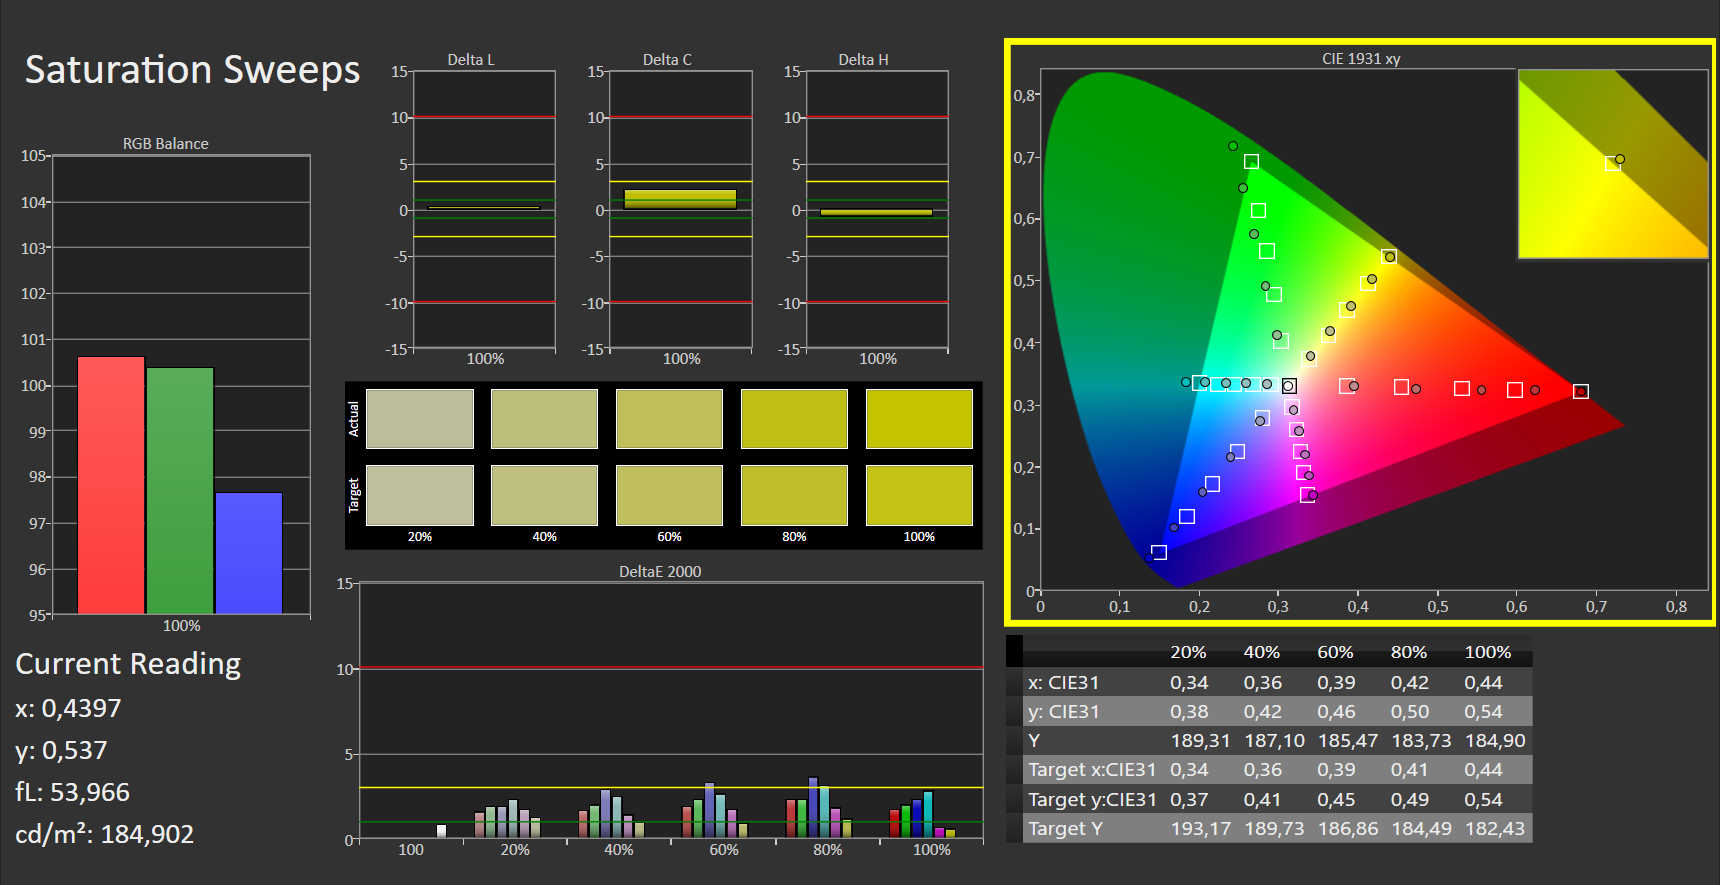
Secondo Asus, la gamma cromatica DCI-P3 è al 100%, ma le nostre misurazioni hanno dato come risultato "solo" il 99%. Lo spazio colore sRGB, invece, raggiunge il 100% di copertura e lo spazio colore AdobeRGB il 95%. Secondo il produttore, la luminosità del display è stimata in una media di 400 nit. Abbiamo misurato una media di 376 cd/m2 e un massimo di 381 cd/m2, quindi non possiamo confermare pienamente le affermazioni di Asus. Come di consueto per i pannelli OLED, l'illuminazione è distribuita in modo omogeneo al 98%.
Le impostazioni di luminosità più basse riducono il rischio di burn-in dei display OLED e la funzione pixel shift è attivata di default tramite l'app MyAsus. Tutti i pixel sono quindi sempre minimamente in movimento, evitando così immagini statiche. L'impostazione può essere disattivata tramite l'app, ma non abbiamo notato che la funzione fosse attiva durante i nostri test.
| |||||||||||||||||||||||||
Distribuzione della luminosità: 98 %
Al centro con la batteria: 376 cd/m²
Contrasto: 37200:1 (Nero: 0.01 cd/m²)
ΔE ColorChecker Calman: 2.01 | ∀{0.5-29.43 Ø4.71}
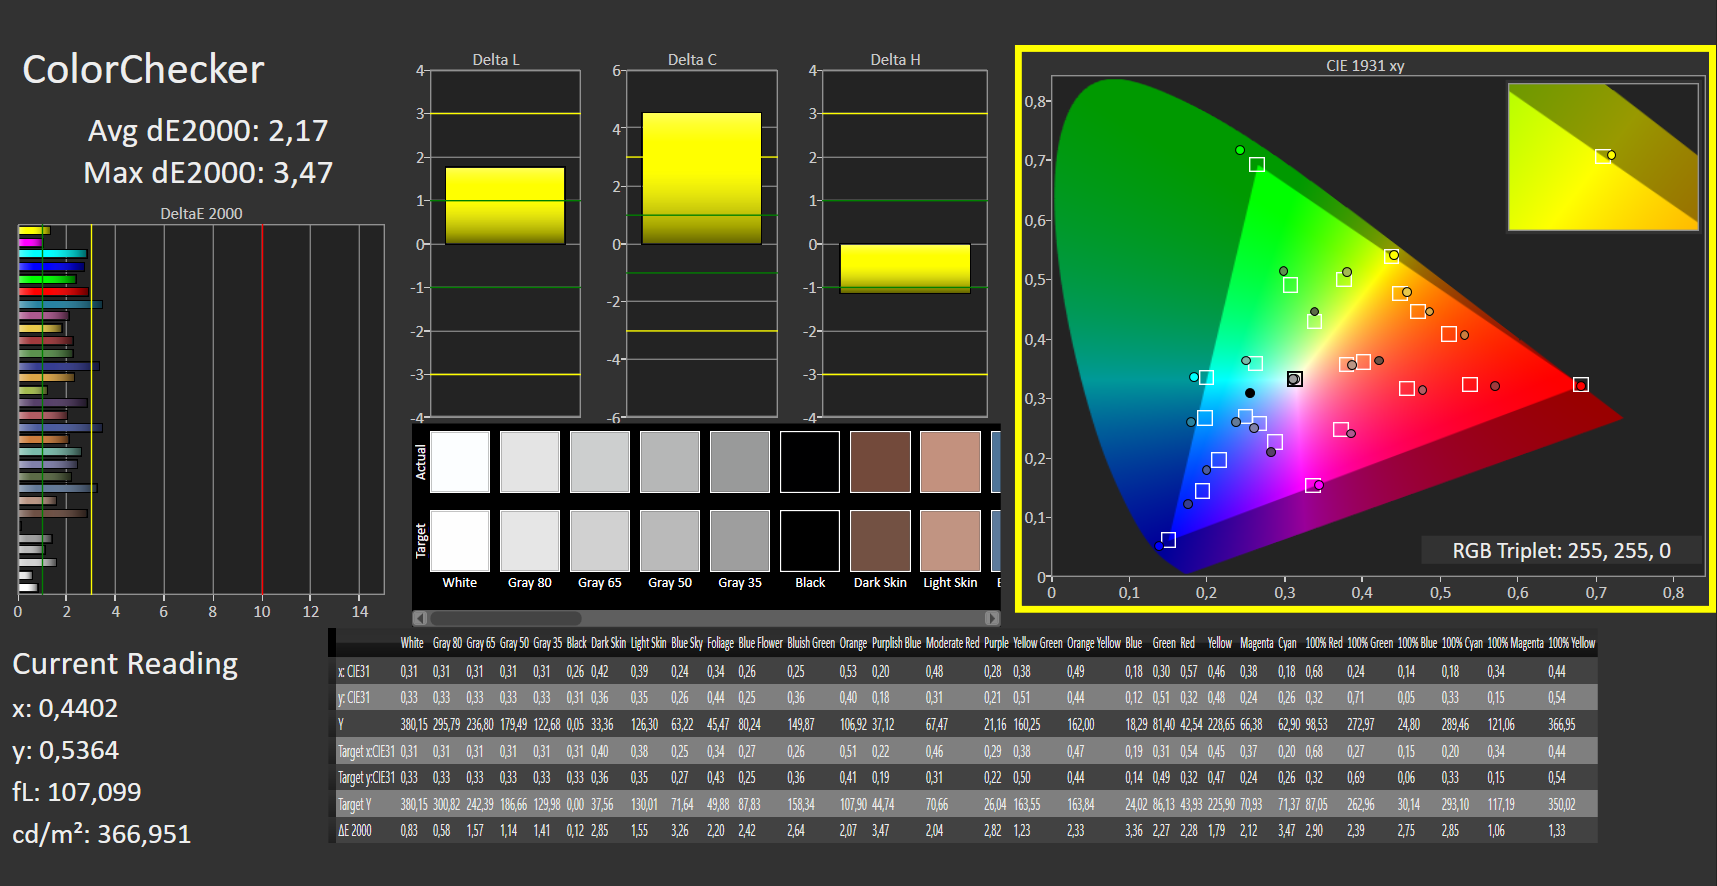
calibrated: 2.17
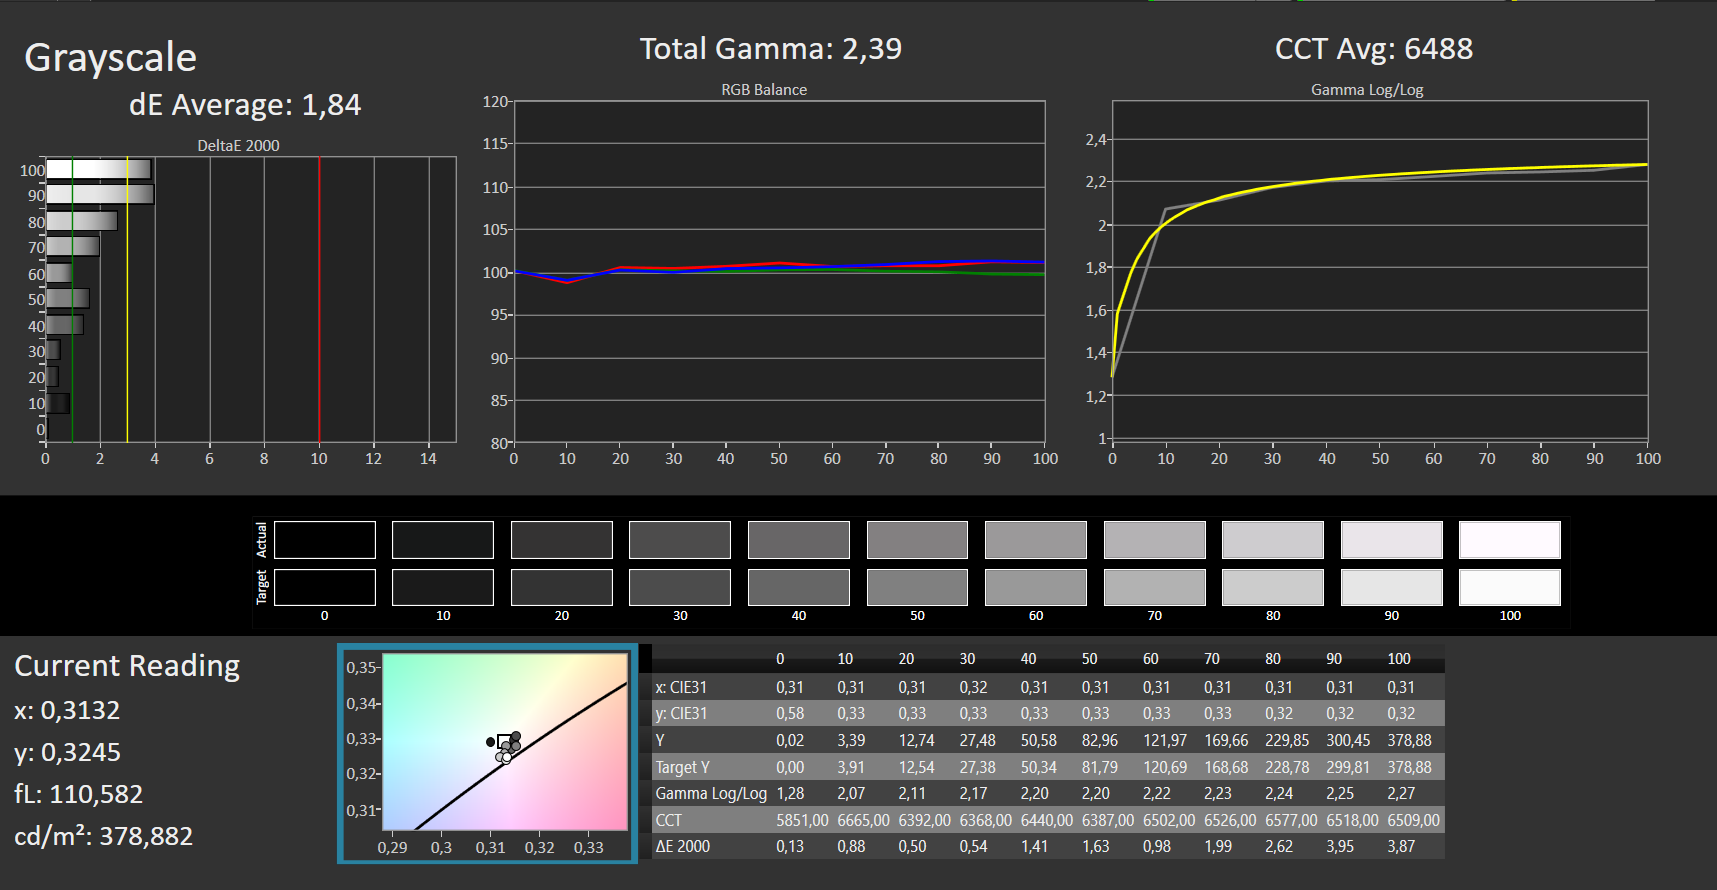
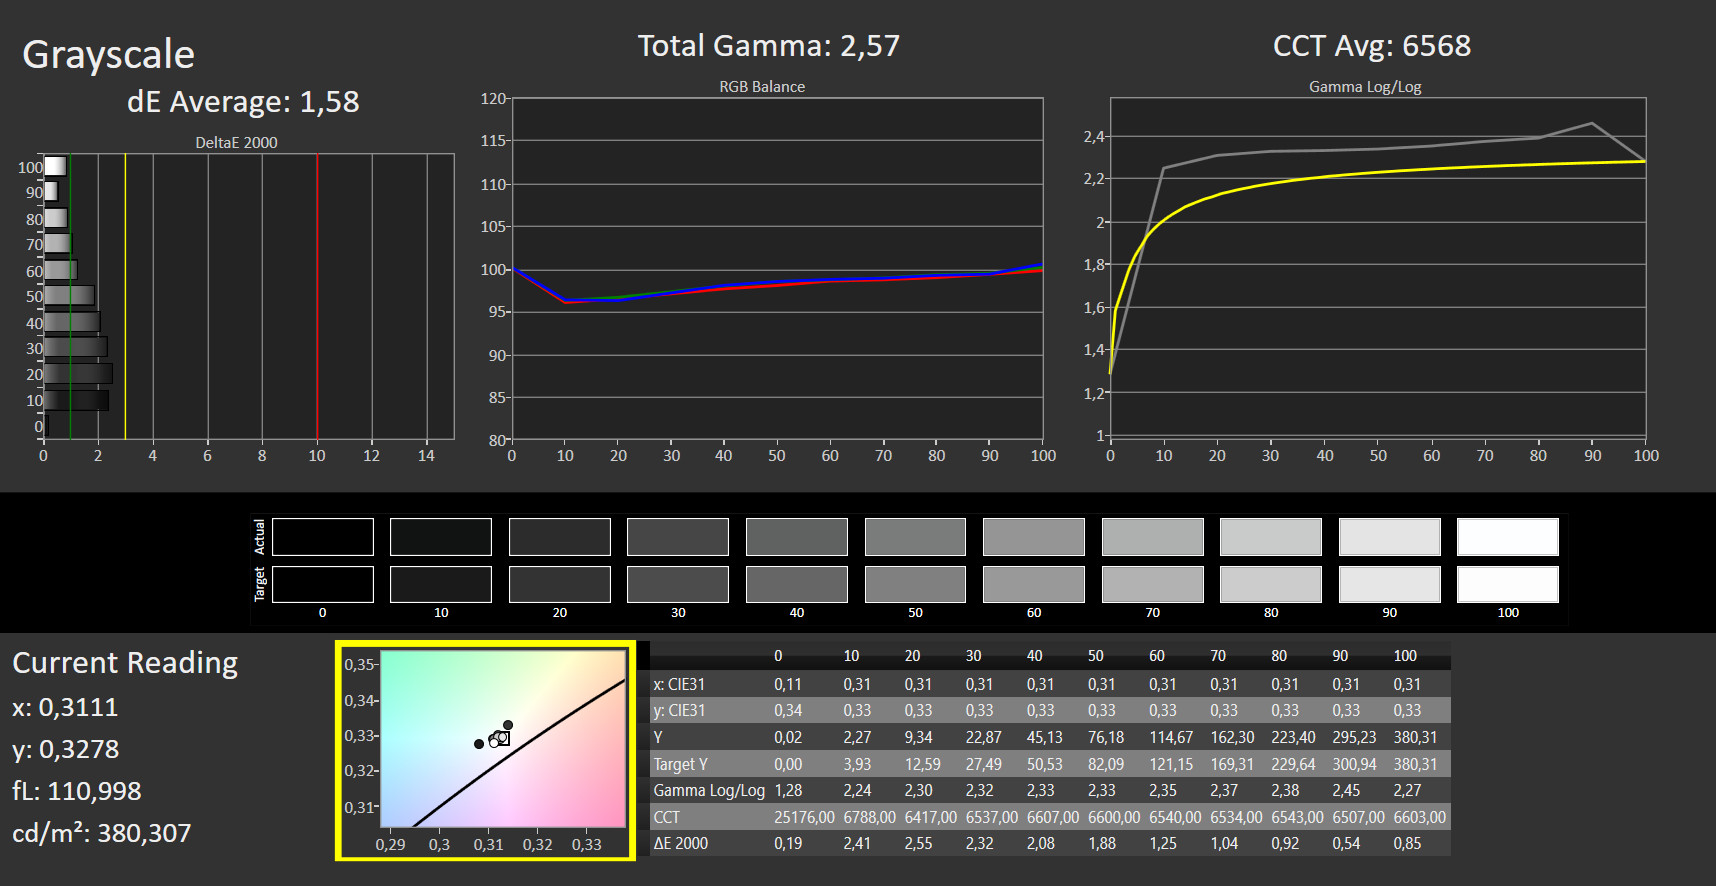
ΔE Greyscale Calman: 1.84 | ∀{0.09-98 Ø4.96}
95% AdobeRGB 1998 (Argyll 3D)
100% sRGB (Argyll 3D)
99% Display P3 (Argyll 3D)
Gamma: 2.39
CCT: 6488 K
| Asus ZenBook 14X UX3404VC Samsung, OLED, 2880x1800, 14.5" | Apple MacBook Pro 13 2022 M2 IPS, 2560x1600, 13.3" | Dell XPS 13 Plus 9320 i7-1280P OLED Samsung 134XK04, OLED, 3456x2160, 13.4" | Lenovo Slim Pro 7 14ARP8 LEN89C1, IPS, 2560x1600, 14.5" | LG Gram 14Z90Q LG LP140WU1-SPF1, IPS, 1920x1200, 14" | Dell Inspiron 14 Plus 7420 InfoVision 140NWHE, IPS, 2240x1400, 14" | Asus ROG Flow Z13 GZ301V TL134ADXP01-0, IPS, 2560x1600, 13.4" | |
|---|---|---|---|---|---|---|---|
| Display | -2% | 2% | -16% | -4% | -20% | -4% | |
| Display P3 Coverage (%) | 99 | 98.8 0% | 99.5 1% | 72.9 -26% | 98.4 -1% | 68.8 -31% | 97 -2% |
| sRGB Coverage (%) | 100 | 100 0% | 100 0% | 98.2 -2% | 99.9 0% | 99.3 -1% | 99.9 0% |
| AdobeRGB 1998 Coverage (%) | 95 | 87.9 -7% | 98.4 4% | 74.6 -21% | 85.9 -10% | 69.5 -27% | 85.3 -10% |
| Response Times | -1645% | -18% | -1178% | -1700% | -1290% | -225% | |
| Response Time Grey 50% / Grey 80% * (ms) | 2 ? | 42 ? -2000% | 2.6 ? -30% | 31.8 ? -1490% | 47.5 ? -2275% | 32.8 ? -1540% | 6.5 ? -225% |
| Response Time Black / White * (ms) | 2 ? | 27.8 ? -1290% | 2.1 ? -5% | 19.3 ? -865% | 24.5 ? -1125% | 22.8 ? -1040% | 6.5 ? -225% |
| PWM Frequency (Hz) | 250 ? | 117780 ? | 59.5 | ||||
| Screen | -319% | -13% | -368% | -324% | -334% | -482% | |
| Brightness middle (cd/m²) | 372 | 514 38% | 371.8 0% | 344.7 -7% | 341 -8% | 331.1 -11% | 537 44% |
| Brightness (cd/m²) | 376 | 497 32% | 374 -1% | 334 -11% | 305 -19% | 326 -13% | 511 36% |
| Brightness Distribution (%) | 98 | 93 -5% | 98 0% | 92 -6% | 87 -11% | 85 -13% | 88 -10% |
| Black Level * (cd/m²) | 0.01 | 0.31 -3000% | 0.31 -3000% | 0.26 -2500% | 0.29 -2800% | 0.45 -4400% | |
| Contrast (:1) | 37200 | 1658 -96% | 1112 -97% | 1312 -96% | 1142 -97% | 1193 -97% | |
| Colorchecker dE 2000 * | 2.01 | 1.1 45% | 2.37 -18% | 3.01 -50% | 3.11 -55% | 2.23 -11% | 1.49 26% |
| Colorchecker dE 2000 max. * | 4.05 | 2.3 43% | 6.1 -51% | 6.3 -56% | 8.29 -105% | 5.44 -34% | 3.68 9% |
| Colorchecker dE 2000 calibrated * | 2.17 | 0.6 72% | 0.83 62% | 0.83 62% | 0.63 71% | 1.12 48% | |
| Greyscale dE 2000 * | 1.84 | 1.8 2% | 2 -9% | 4.6 -150% | 5.3 -188% | 3.6 -96% | 1.66 10% |
| Gamma | 2.39 92% | 2.23 99% | 2.29 96% | 2.28 96% | 2.037 108% | 2.21 100% | 2.43 91% |
| CCT | 6488 100% | 6764 96% | 6261 104% | 6420 101% | 7571 86% | 6022 108% | 6772 96% |
| Media totale (Programma / Settaggio) | -655% /
-440% | -10% /
-10% | -521% /
-409% | -676% /
-452% | -548% /
-403% | -237% /
-343% |
* ... Meglio usare valori piccoli
Come di consueto con i display OLED, il contrasto è eccellente. Il nero dello ZenBook 14X è ricco e i colori sono vivaci. Il display OLED è chiaramente superiore ai display IPS di dispositivi analoghi in termini di tempi di risposta. Le impostazioni dell'immagine e del display possono essere regolate individualmente tramite il software MyAsus.

Le nostre misurazioni del DeltaE della scala di grigi e dei colori hanno prodotto valori molto buoni tra 1,8 e 2,0 prima della calibrazione. La calibrazione ha migliorato il DeltaE della scala dei grigi a 1,6, mentre quello dei colori è peggiorato a 2,2. Questi risultati suggeriscono che il display è già calibrato e ulteriori calibrazioni non offrono alcun valore aggiunto.
Tempi di risposta del Display
| ↔ Tempi di risposta dal Nero al Bianco | ||
|---|---|---|
| 2 ms ... aumenta ↗ e diminuisce ↘ combinato | ↗ 1 ms Incremento |  |
| ↘ 1 ms Calo | ||
| Lo schermo ha mostrato valori di risposta molto veloci nei nostri tests ed è molto adatto per i gaming veloce. In confronto, tutti i dispositivi di test variano da 0.1 (minimo) a 240 (massimo) ms. » 11 % di tutti i dispositivi è migliore. Questo significa che i tempi di risposta rilevati sono migliori rispettto alla media di tutti i dispositivi testati (19.8 ms). | ||
| ↔ Tempo di risposta dal 50% Grigio all'80% Grigio | ||
| 2 ms ... aumenta ↗ e diminuisce ↘ combinato | ↗ 1 ms Incremento |  |
| ↘ 1 ms Calo | ||
| Lo schermo ha mostrato valori di risposta molto veloci nei nostri tests ed è molto adatto per i gaming veloce. In confronto, tutti i dispositivi di test variano da 0.165 (minimo) a 636 (massimo) ms. » 10 % di tutti i dispositivi è migliore. Questo significa che i tempi di risposta rilevati sono migliori rispettto alla media di tutti i dispositivi testati (31 ms). | ||
Sfarfallio dello schermo / PWM (Pulse-Width Modulation)
| flickering dello schermo / PWM rilevato | 250 Hz | ≤ 70 % settaggio luminosita' |  |
Il display sfarfalla a 250 Hz (Probabilmente a causa dell'uso di PWM) Flickering rilevato ad una luminosita' di 70 % o inferiore. Non dovrebbe verificarsi flickering o PWM sopra questo valore di luminosita'. La frequenza di 250 Hz è relativamente bassa, quindi gli utenti sensibili potrebbero notare il flickering ed accusare stanchezza agli occhi a questo livello di luminosità e a livelli inferiori. In confronto: 52 % di tutti i dispositivi testati non utilizza PWM per ridurre la luminosita' del display. Se è rilevato PWM, una media di 7754 (minimo: 5 - massimo: 343500) Hz è stata rilevata. | |||


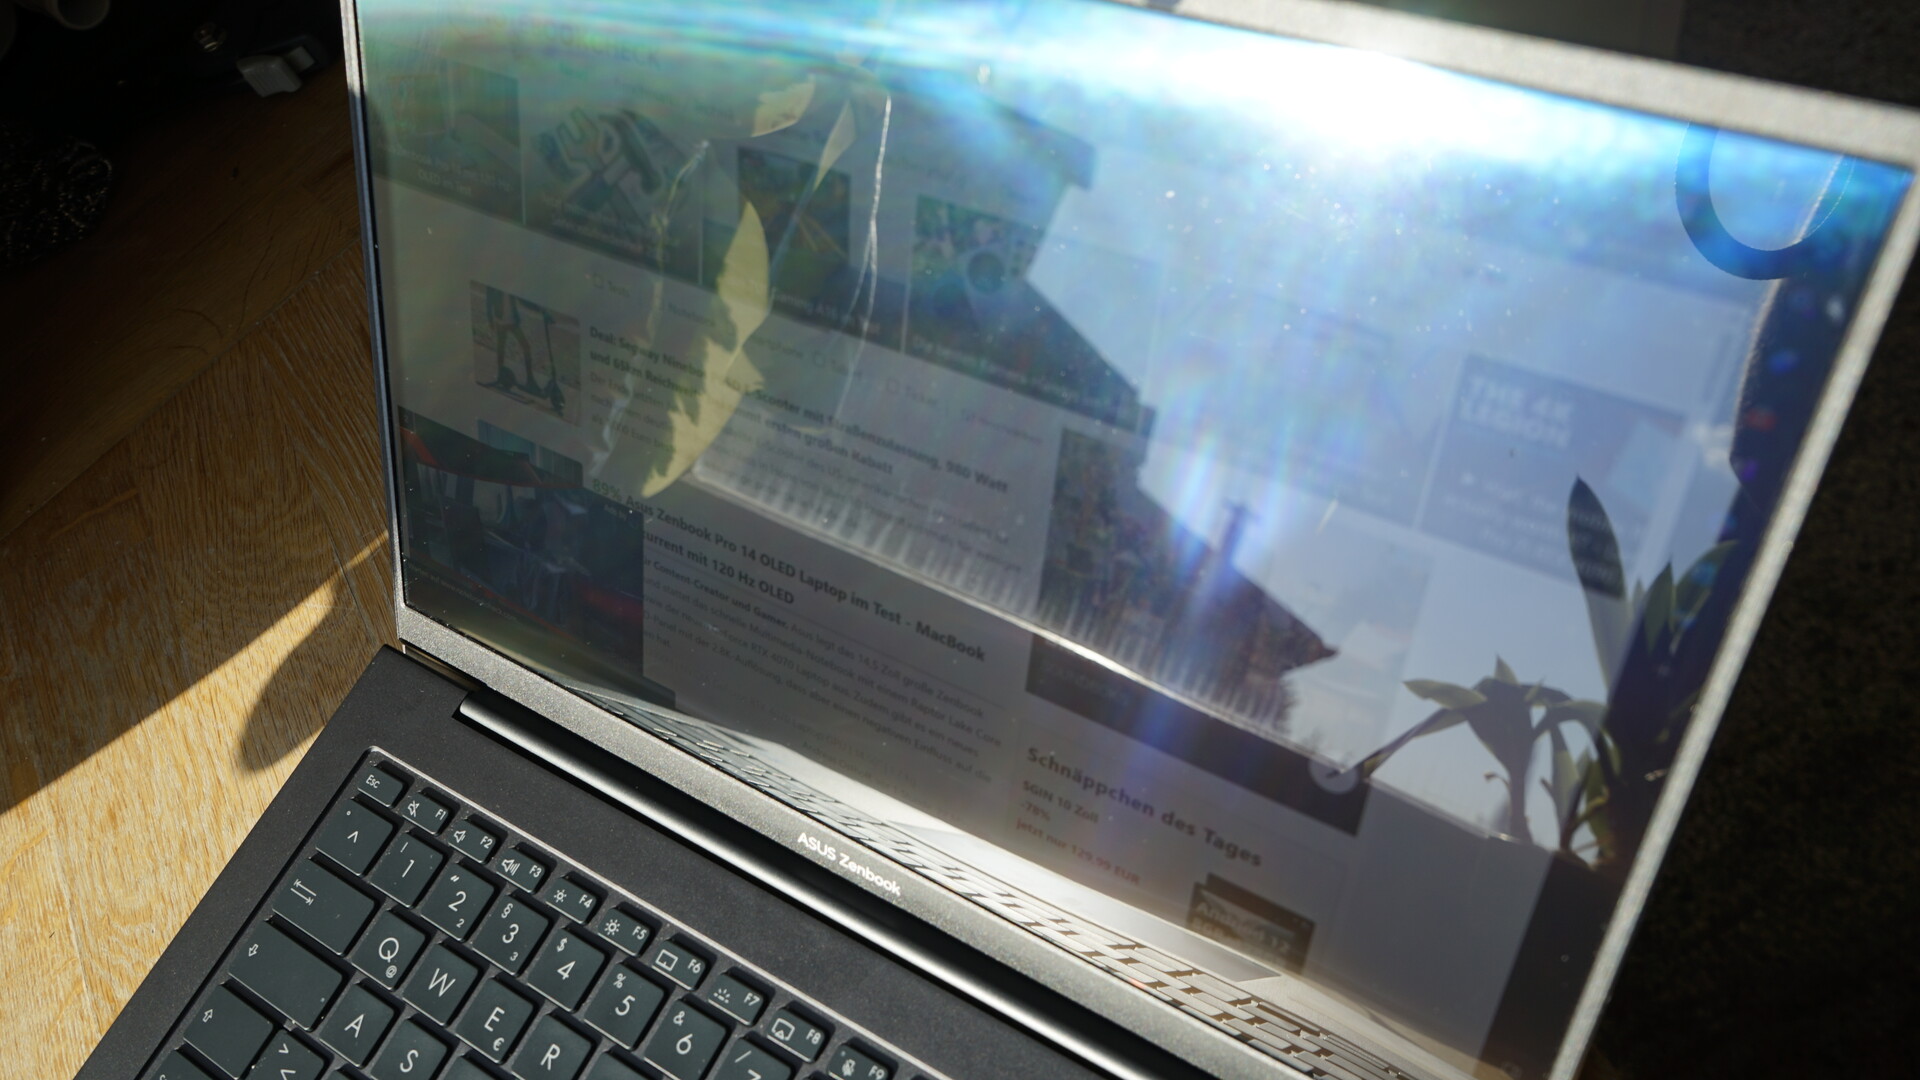
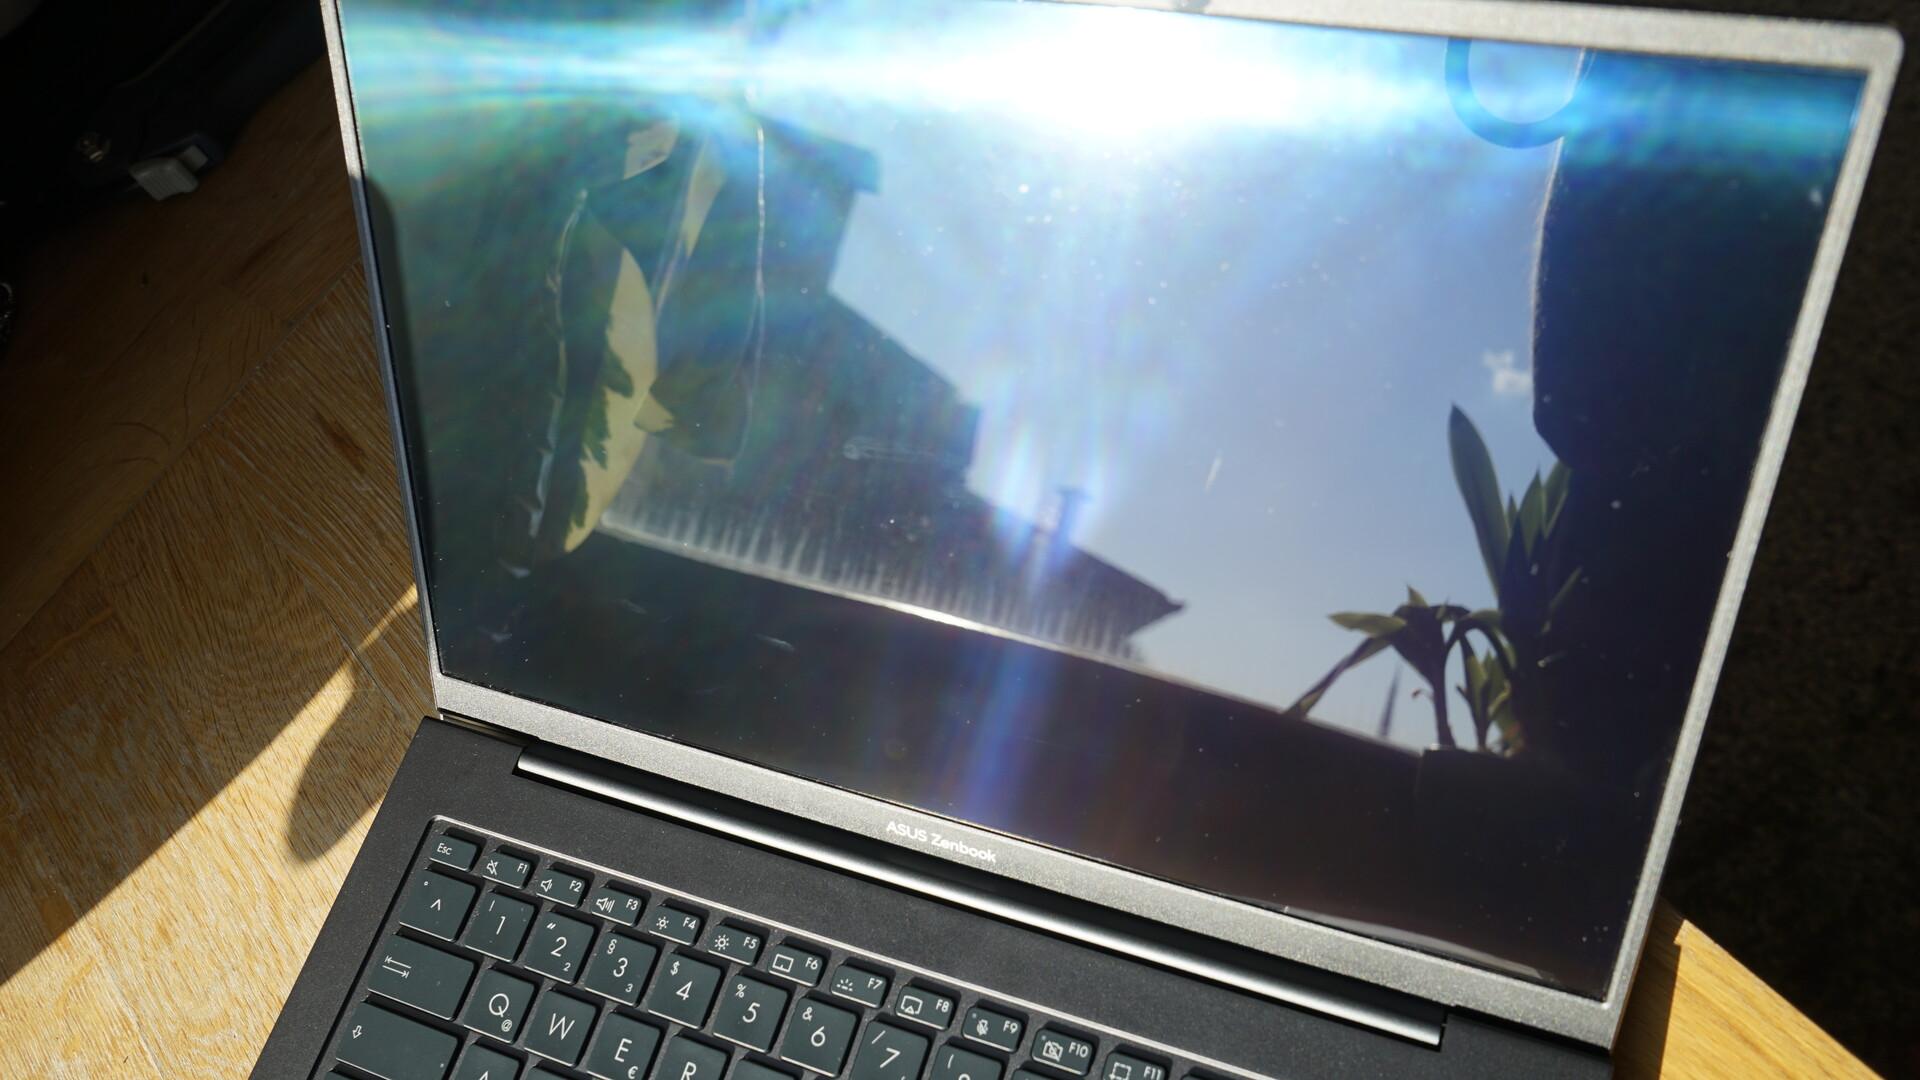
Il display OLED dell'Asus ZenBook 14X ha problemi alla luce diretta del sole. Il display antiriflesso è difficilmente gestibile e non è più possibile una visione confortevole dello schermo. Anche la luminosità di picco leggermente superiore rispetto al predecessore non aiuta.
Come al solito con i pannelli OLED, non c'è nulla da criticare per quanto riguarda la stabilità dell'angolo di visione. I colori e la luminosità rimangono perfettamente stabili, anche ad angoli molto stretti. Come di consueto per i pannelli OLED, una certa tinta blu è visibile ad angoli molto stretti.

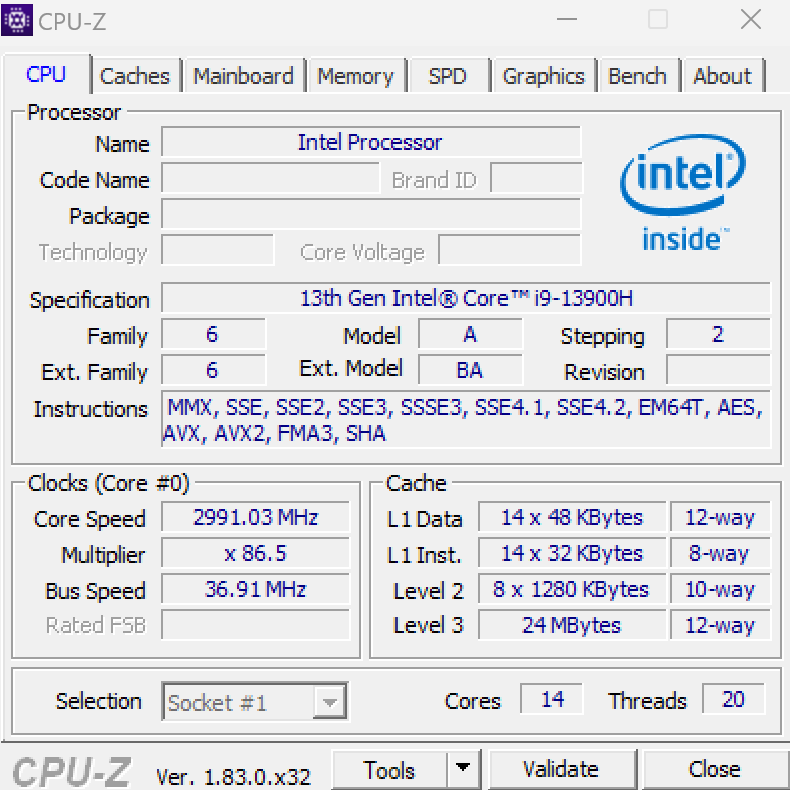
Prestazioni - Potente Intel i9-13900H
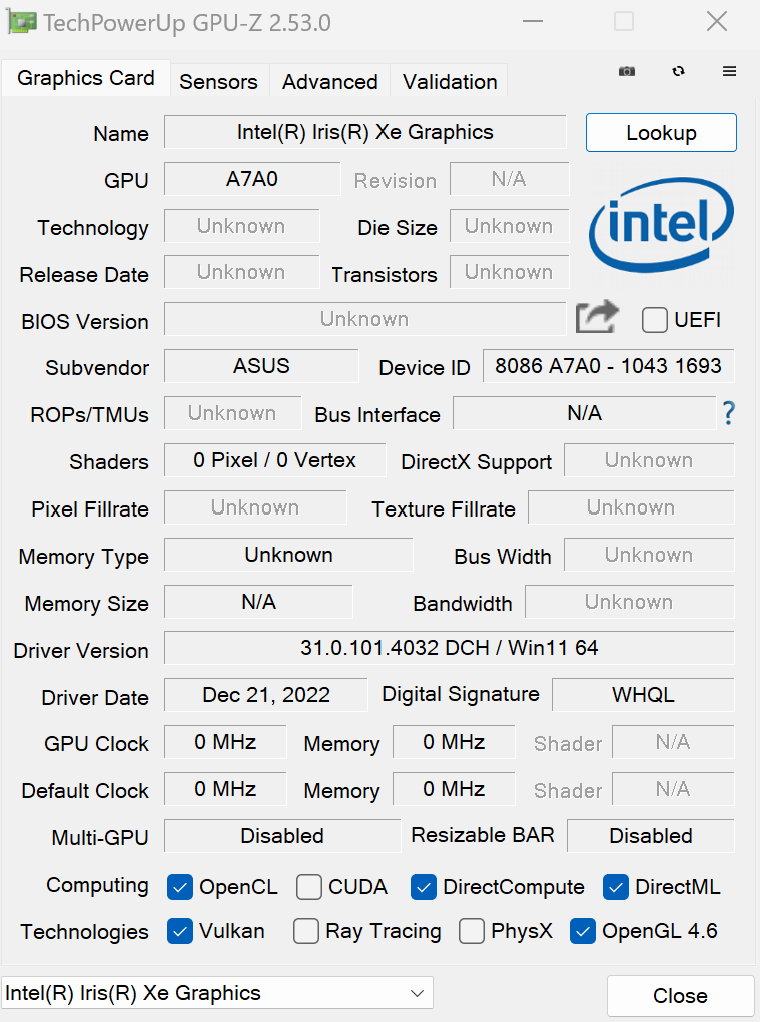
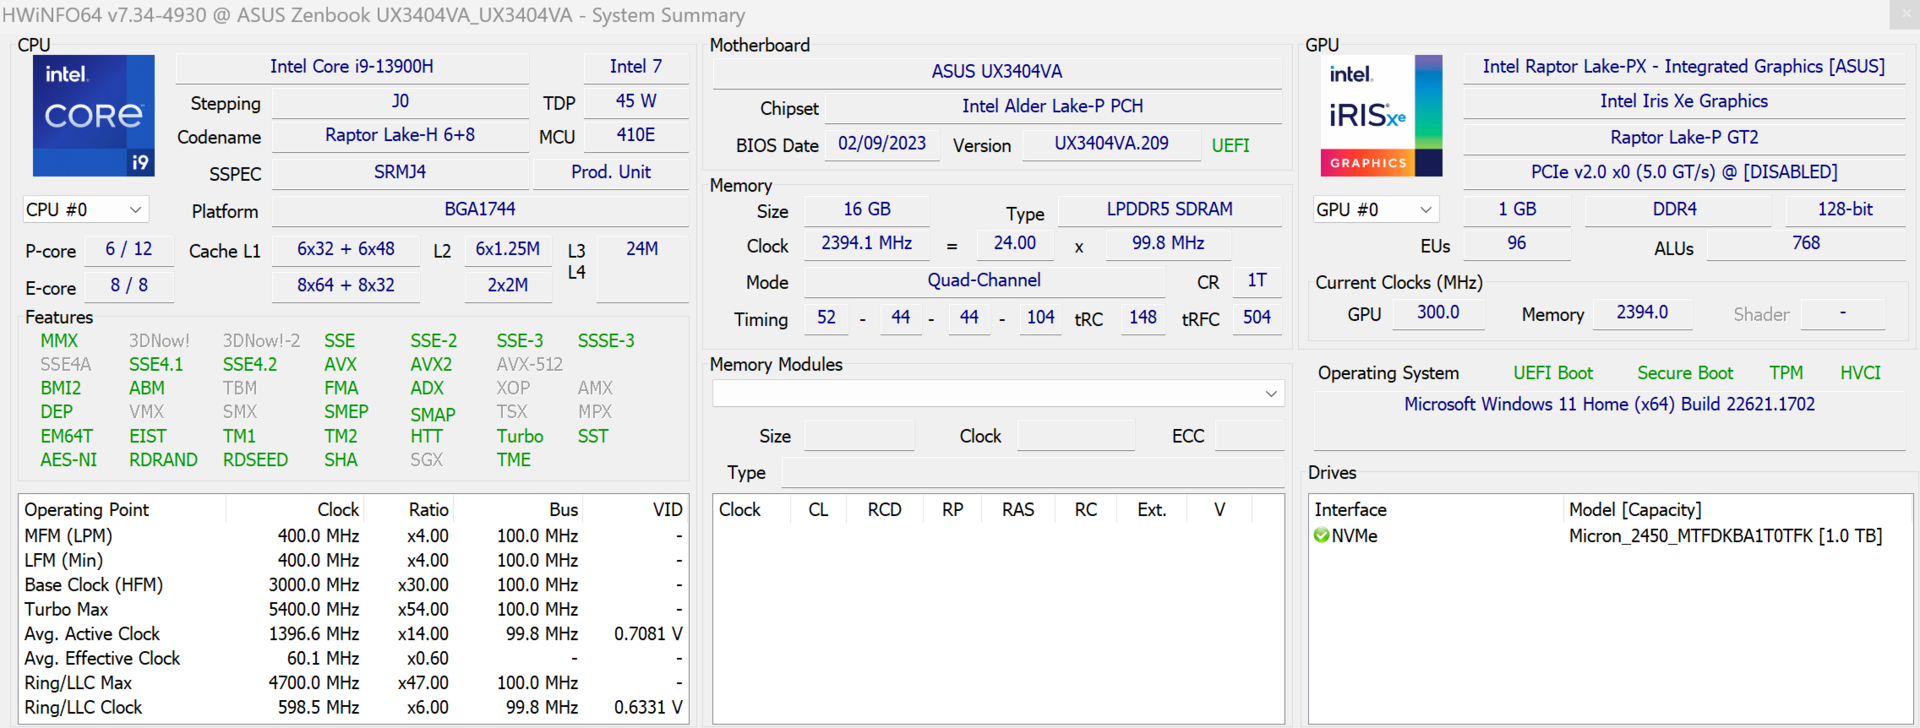
Asus installa l'Intel CoreIntel Core i9-13900Hnel nuovo ZenBook 14X, che, con l'eccezione dell' Asus ROG Flow Z13si trova solo nei notebook più grandi. Il nostro modello di prova è la variante senza scheda grafica dedicata. Pertanto, qui viene utilizzata solo la grafica interna Intel Iris X. L'altro hardware comprende 16 GB di RAM LPDDR5 (onboard) e un disco rigido M.2 NVME PCIe da 1 TB.
Condizioni di test
Tramite l'app MyAsus è possibile selezionare tre diversi profili di prestazioni per lo ZenBook 14X: Silenzioso, Standard e Prestazioni. Quest'ultimo può essere utilizzato solo con l'alimentatore inserito. I benchmark sono stati eseguiti in modalità Performance , mentre i test di resistenza della batteria sono stati eseguiti in modalità Silent . La modalità Performance è stata utilizzata per il test del consumo energetico massimo, mentre le emissioni acustiche sono state controllate per tutte e tre le modalità.
| Modalità Performance | Modalità Standard | Modalità Silenziosa | |
|---|---|---|---|
| CPU PL1 (HWInfo) | 80 watt | 80 watt | 40 watt |
| CPU PL2 (HWInfo) | 80 watt | 80 watt | 80 watt |
Processore
L'Intel Core i9-13900H è una CPU mobile di fascia alta della serie H di Raptor Lake. La CPU combina 6 core di prestazioni con 8 core di efficienza. Poiché i core P supportano l'hyperthreading, il processore dispone di 20 thread. Mentre i core P hanno un clock da 2,6 a 5,4 GHz, i core E sono compresi tra 1,9 e 4,1 GHz
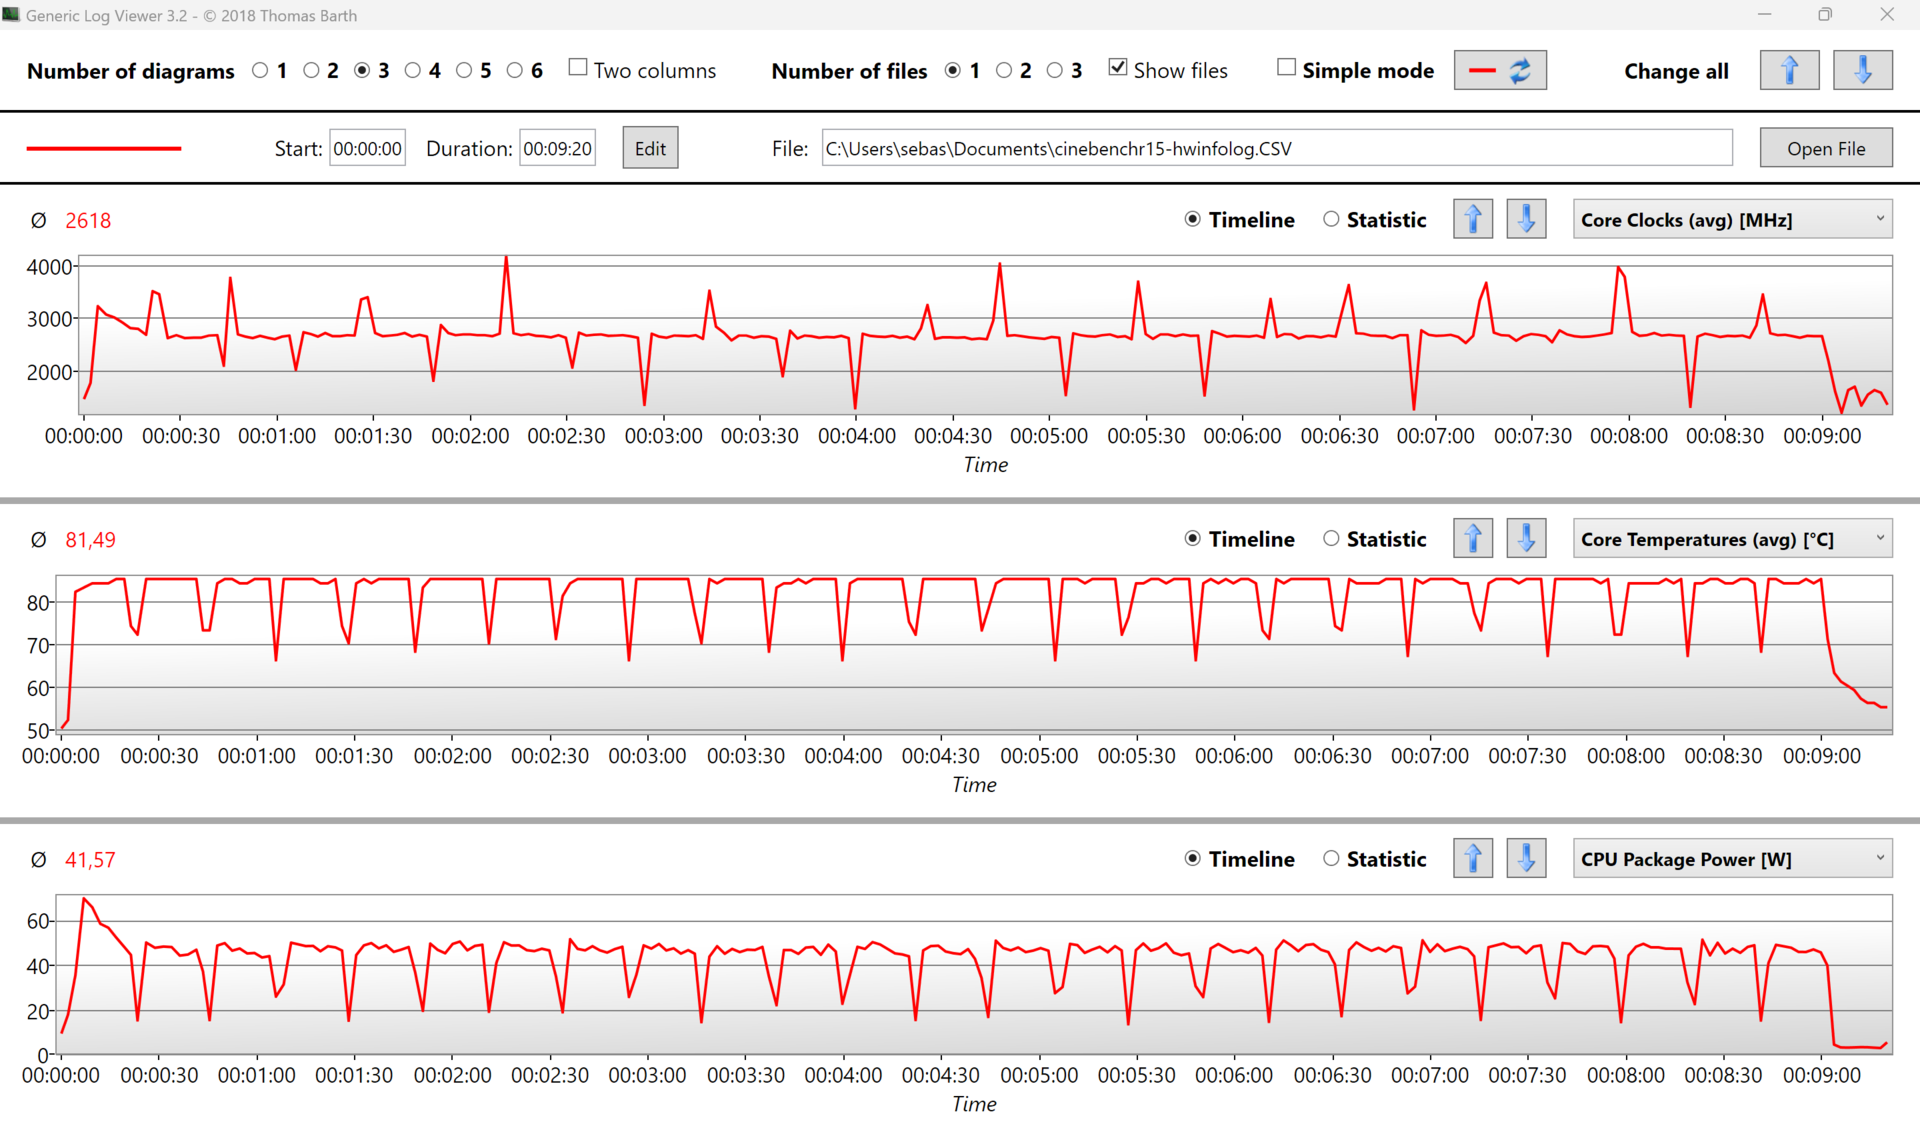
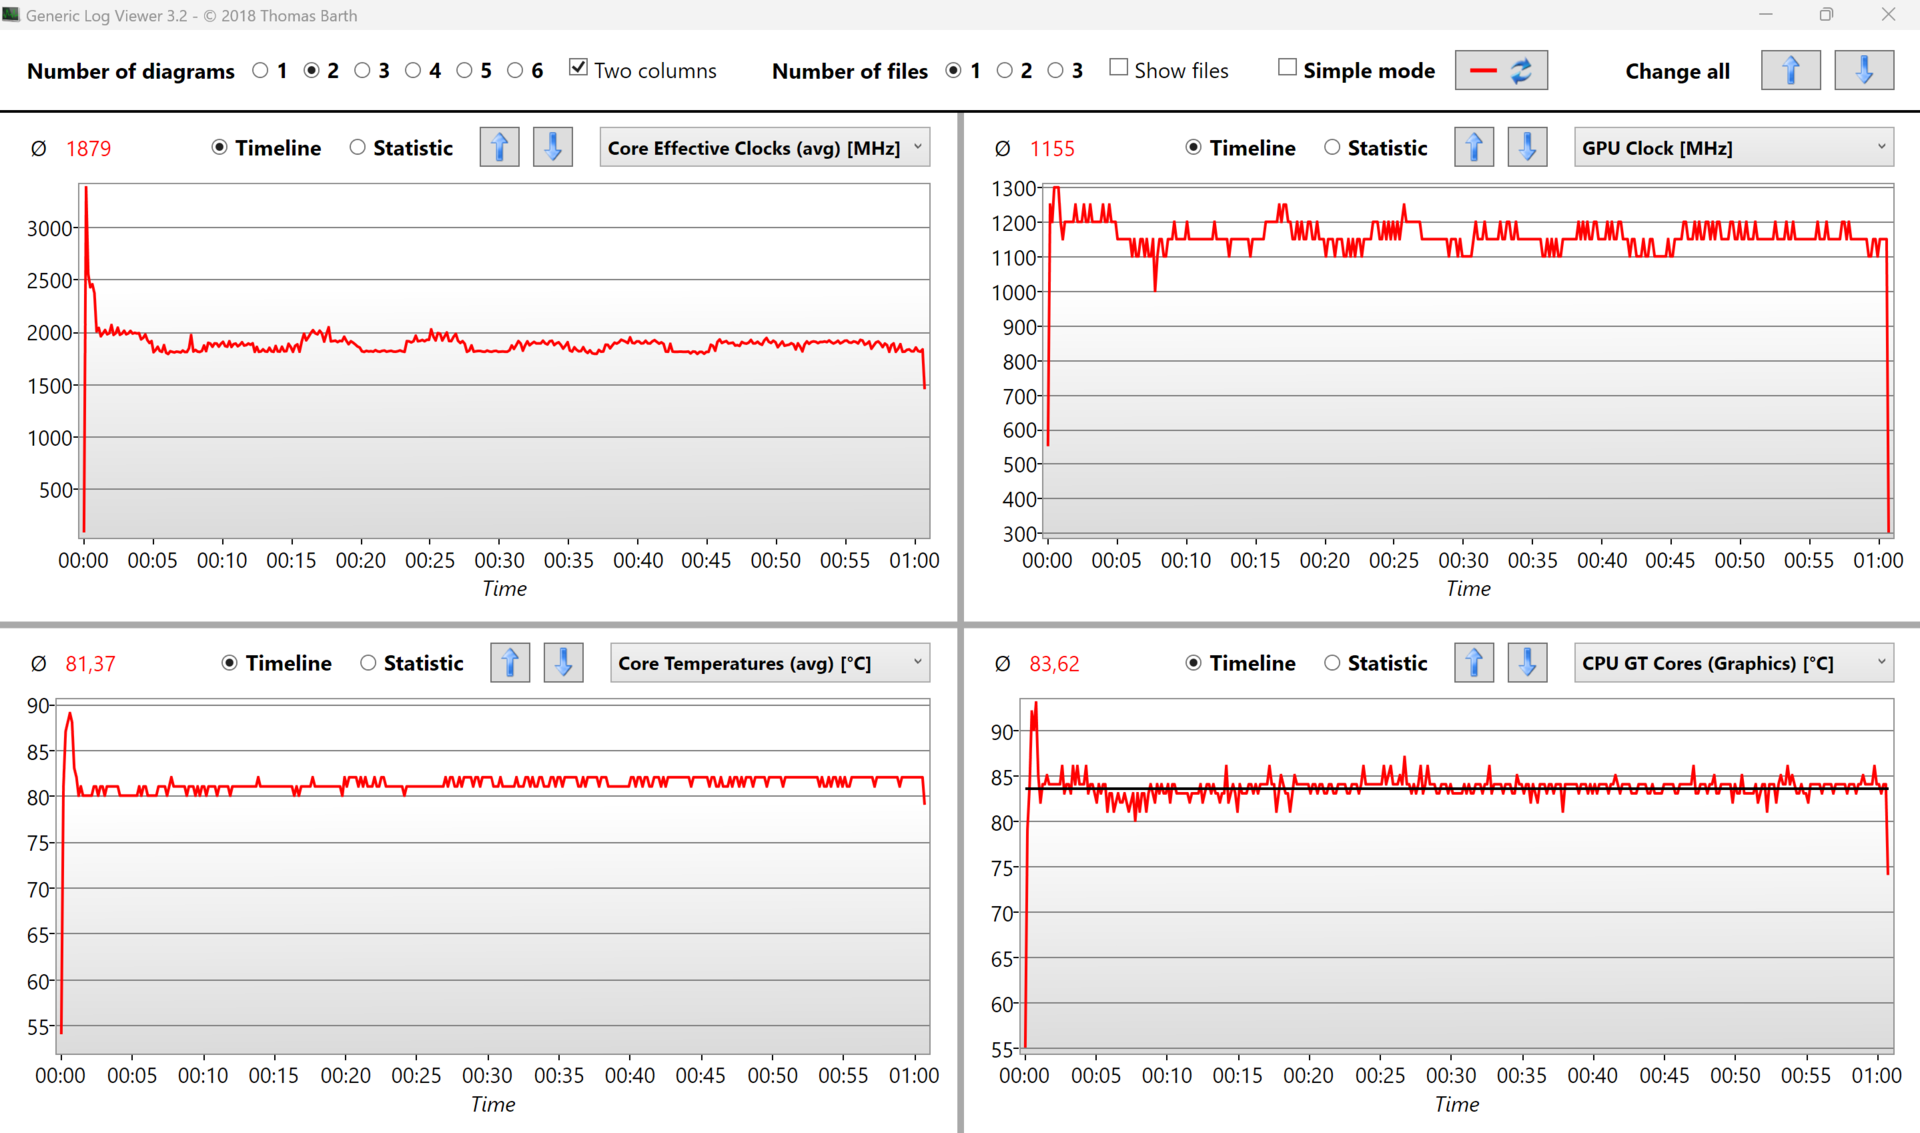
Nel ciclo di Cinebench si nota un brusco calo del punteggio dopo la prima esecuzione, che poi si stabilizza brevemente tra i 2250 e i 2300 punti, ma scende nuovamente dopo la quinta esecuzione per poi assestarsi intorno ai 2150 punti. Per il piccolo formato dello ZenBook, questo sarebbe comunque un buon risultato se non fosse per l'Asus ROG Flow Z13, che si comporta meglio come tablet con lo stesso processore. Poiché il processore raggiunge rapidamente i 99°C sotto carico, si può supporre che la soluzione a ventola singola limiti le prestazioni.
Il processore è in grado di consumare quasi 80 watt per brevi periodi di tempo, ma poi si attesta su una media di circa 40 watt dopo la prima esecuzione. Dopo circa 10 minuti, tuttavia, il consumo scende a circa 20 watt. Di conseguenza, la media è di 36 watt sotto carico sostenuto. Il ciclo Cinebench mostra che il processore Intel è in grado di mantenere prestazioni elevate anche sotto carico prolungato.
Cinebench R15 Multi Sustained Load
Cinebench R23: Multi Core | Single Core
Cinebench R20: CPU (Multi Core) | CPU (Single Core)
Cinebench R15: CPU Multi 64Bit | CPU Single 64Bit
Blender: v2.79 BMW27 CPU
7-Zip 18.03: 7z b 4 | 7z b 4 -mmt1
Geekbench 5.5: Multi-Core | Single-Core
HWBOT x265 Benchmark v2.2: 4k Preset
LibreOffice : 20 Documents To PDF
R Benchmark 2.5: Overall mean
| CPU Performance rating | |
| Asus ROG Flow Z13 GZ301V | |
| Media Intel Core i9-13900H | |
| Asus ZenBook 14X UX3404VC | |
| Dell Inspiron 14 Plus 7420 | |
| Media della classe Subnotebook | |
| Dell XPS 13 Plus 9320 i7-1280P OLED | |
| Lenovo Slim Pro 7 14ARP8 | |
| Apple MacBook Pro 13 2022 M2 -5! | |
| LG Gram 14Z90Q | |
| Cinebench R23 / Multi Core | |
| Asus ROG Flow Z13 GZ301V | |
| Media Intel Core i9-13900H (11997 - 20385, n=28) | |
| Asus ZenBook 14X UX3404VC | |
| Dell Inspiron 14 Plus 7420 | |
| Lenovo Slim Pro 7 14ARP8 | |
| Media della classe Subnotebook (1555 - 21812, n=60, ultimi 2 anni) | |
| Dell XPS 13 Plus 9320 i7-1280P OLED | |
| Apple MacBook Pro 13 2022 M2 | |
| LG Gram 14Z90Q | |
| Cinebench R23 / Single Core | |
| Asus ROG Flow Z13 GZ301V | |
| Asus ZenBook 14X UX3404VC | |
| Media Intel Core i9-13900H (1297 - 2054, n=26) | |
| Dell Inspiron 14 Plus 7420 | |
| Media della classe Subnotebook (358 - 2213, n=61, ultimi 2 anni) | |
| Dell XPS 13 Plus 9320 i7-1280P OLED | |
| Apple MacBook Pro 13 2022 M2 | |
| Lenovo Slim Pro 7 14ARP8 | |
| LG Gram 14Z90Q | |
| Cinebench R20 / CPU (Multi Core) | |
| Asus ROG Flow Z13 GZ301V | |
| Media Intel Core i9-13900H (4935 - 7716, n=25) | |
| Asus ZenBook 14X UX3404VC | |
| Dell Inspiron 14 Plus 7420 | |
| Lenovo Slim Pro 7 14ARP8 | |
| Media della classe Subnotebook (579 - 8541, n=57, ultimi 2 anni) | |
| Dell XPS 13 Plus 9320 i7-1280P OLED | |
| Apple MacBook Pro 13 2022 M2 | |
| LG Gram 14Z90Q | |
| Cinebench R20 / CPU (Single Core) | |
| Asus ROG Flow Z13 GZ301V | |
| Asus ZenBook 14X UX3404VC | |
| Media Intel Core i9-13900H (428 - 792, n=25) | |
| Dell Inspiron 14 Plus 7420 | |
| Media della classe Subnotebook (128 - 832, n=57, ultimi 2 anni) | |
| Dell XPS 13 Plus 9320 i7-1280P OLED | |
| Lenovo Slim Pro 7 14ARP8 | |
| LG Gram 14Z90Q | |
| Apple MacBook Pro 13 2022 M2 | |
| Cinebench R15 / CPU Multi 64Bit | |
| Asus ROG Flow Z13 GZ301V | |
| Media Intel Core i9-13900H (2061 - 3100, n=26) | |
| Asus ZenBook 14X UX3404VC | |
| Dell Inspiron 14 Plus 7420 | |
| Lenovo Slim Pro 7 14ARP8 | |
| Media della classe Subnotebook (327 - 3345, n=57, ultimi 2 anni) | |
| Dell XPS 13 Plus 9320 i7-1280P OLED | |
| Apple MacBook Pro 13 2022 M2 | |
| LG Gram 14Z90Q | |
| Cinebench R15 / CPU Single 64Bit | |
| Asus ROG Flow Z13 GZ301V | |
| Media Intel Core i9-13900H (211 - 297, n=26) | |
| Asus ZenBook 14X UX3404VC | |
| Media della classe Subnotebook (72.4 - 322, n=57, ultimi 2 anni) | |
| Dell Inspiron 14 Plus 7420 | |
| Dell XPS 13 Plus 9320 i7-1280P OLED | |
| Apple MacBook Pro 13 2022 M2 | |
| Lenovo Slim Pro 7 14ARP8 | |
| LG Gram 14Z90Q | |
| Blender / v2.79 BMW27 CPU | |
| Apple MacBook Pro 13 2022 M2 | |
| LG Gram 14Z90Q | |
| Media della classe Subnotebook (159 - 2271, n=58, ultimi 2 anni) | |
| Dell XPS 13 Plus 9320 i7-1280P OLED | |
| Dell Inspiron 14 Plus 7420 | |
| Lenovo Slim Pro 7 14ARP8 | |
| Asus ZenBook 14X UX3404VC | |
| Media Intel Core i9-13900H (166 - 268, n=24) | |
| Asus ROG Flow Z13 GZ301V | |
| 7-Zip 18.03 / 7z b 4 | |
| Asus ROG Flow Z13 GZ301V | |
| Media Intel Core i9-13900H (45045 - 79032, n=25) | |
| Asus ZenBook 14X UX3404VC | |
| Dell Inspiron 14 Plus 7420 | |
| Lenovo Slim Pro 7 14ARP8 | |
| Dell XPS 13 Plus 9320 i7-1280P OLED | |
| Media della classe Subnotebook (11668 - 77867, n=57, ultimi 2 anni) | |
| LG Gram 14Z90Q | |
| 7-Zip 18.03 / 7z b 4 -mmt1 | |
| Asus ROG Flow Z13 GZ301V | |
| Asus ZenBook 14X UX3404VC | |
| Media Intel Core i9-13900H (3665 - 6600, n=25) | |
| Dell Inspiron 14 Plus 7420 | |
| Media della classe Subnotebook (2643 - 6699, n=59, ultimi 2 anni) | |
| Dell XPS 13 Plus 9320 i7-1280P OLED | |
| Lenovo Slim Pro 7 14ARP8 | |
| LG Gram 14Z90Q | |
| Geekbench 5.5 / Multi-Core | |
| Asus ROG Flow Z13 GZ301V | |
| Media Intel Core i9-13900H (9094 - 15410, n=26) | |
| Asus ZenBook 14X UX3404VC | |
| Dell Inspiron 14 Plus 7420 | |
| Dell XPS 13 Plus 9320 i7-1280P OLED | |
| Media della classe Subnotebook (2557 - 17218, n=49, ultimi 2 anni) | |
| Lenovo Slim Pro 7 14ARP8 | |
| Apple MacBook Pro 13 2022 M2 | |
| LG Gram 14Z90Q | |
| Geekbench 5.5 / Single-Core | |
| Asus ROG Flow Z13 GZ301V | |
| Asus ZenBook 14X UX3404VC | |
| Apple MacBook Pro 13 2022 M2 | |
| Media della classe Subnotebook (726 - 2224, n=49, ultimi 2 anni) | |
| Media Intel Core i9-13900H (1140 - 2043, n=26) | |
| Dell XPS 13 Plus 9320 i7-1280P OLED | |
| Dell Inspiron 14 Plus 7420 | |
| LG Gram 14Z90Q | |
| Lenovo Slim Pro 7 14ARP8 | |
| HWBOT x265 Benchmark v2.2 / 4k Preset | |
| Asus ROG Flow Z13 GZ301V | |
| Media Intel Core i9-13900H (14.1 - 22.3, n=25) | |
| Asus ZenBook 14X UX3404VC | |
| Lenovo Slim Pro 7 14ARP8 | |
| Dell Inspiron 14 Plus 7420 | |
| Dell XPS 13 Plus 9320 i7-1280P OLED | |
| Media della classe Subnotebook (0.97 - 25.1, n=57, ultimi 2 anni) | |
| LG Gram 14Z90Q | |
| LibreOffice / 20 Documents To PDF | |
| Lenovo Slim Pro 7 14ARP8 | |
| Media della classe Subnotebook (39.9 - 220, n=56, ultimi 2 anni) | |
| LG Gram 14Z90Q | |
| Dell XPS 13 Plus 9320 i7-1280P OLED | |
| Dell Inspiron 14 Plus 7420 | |
| Asus ZenBook 14X UX3404VC | |
| Media Intel Core i9-13900H (34.4 - 82.8, n=25) | |
| Asus ROG Flow Z13 GZ301V | |
| R Benchmark 2.5 / Overall mean | |
| Lenovo Slim Pro 7 14ARP8 | |
| LG Gram 14Z90Q | |
| Media della classe Subnotebook (0.4024 - 1.456, n=58, ultimi 2 anni) | |
| Dell XPS 13 Plus 9320 i7-1280P OLED | |
| Dell Inspiron 14 Plus 7420 | |
| Media Intel Core i9-13900H (0.4052 - 0.723, n=25) | |
| Asus ZenBook 14X UX3404VC | |
| Asus ROG Flow Z13 GZ301V | |
* ... Meglio usare valori piccoli
AIDA64: FP32 Ray-Trace | FPU Julia | CPU SHA3 | CPU Queen | FPU SinJulia | FPU Mandel | CPU AES | CPU ZLib | FP64 Ray-Trace | CPU PhotoWorxx
| Performance rating | |
| Asus ROG Flow Z13 GZ301V | |
| Media Intel Core i9-13900H | |
| Lenovo Slim Pro 7 14ARP8 | |
| Asus ZenBook 14X UX3404VC | |
| Dell Inspiron 14 Plus 7420 | |
| Media della classe Subnotebook | |
| Dell XPS 13 Plus 9320 i7-1280P OLED | |
| LG Gram 14Z90Q | |
| AIDA64 / FP32 Ray-Trace | |
| Asus ROG Flow Z13 GZ301V | |
| Lenovo Slim Pro 7 14ARP8 | |
| Media Intel Core i9-13900H (6788 - 19557, n=25) | |
| Asus ZenBook 14X UX3404VC | |
| Media della classe Subnotebook (1135 - 32888, n=58, ultimi 2 anni) | |
| Dell Inspiron 14 Plus 7420 | |
| Dell XPS 13 Plus 9320 i7-1280P OLED | |
| LG Gram 14Z90Q | |
| AIDA64 / FPU Julia | |
| Lenovo Slim Pro 7 14ARP8 | |
| Asus ROG Flow Z13 GZ301V | |
| Media Intel Core i9-13900H (22551 - 95579, n=25) | |
| Asus ZenBook 14X UX3404VC | |
| Media della classe Subnotebook (5218 - 123315, n=58, ultimi 2 anni) | |
| Dell Inspiron 14 Plus 7420 | |
| Dell XPS 13 Plus 9320 i7-1280P OLED | |
| LG Gram 14Z90Q | |
| AIDA64 / CPU SHA3 | |
| Media Intel Core i9-13900H (2491 - 4270, n=25) | |
| Asus ROG Flow Z13 GZ301V | |
| Asus ZenBook 14X UX3404VC | |
| Lenovo Slim Pro 7 14ARP8 | |
| Media della classe Subnotebook (444 - 5287, n=58, ultimi 2 anni) | |
| Dell Inspiron 14 Plus 7420 | |
| Dell XPS 13 Plus 9320 i7-1280P OLED | |
| LG Gram 14Z90Q | |
| AIDA64 / CPU Queen | |
| Asus ROG Flow Z13 GZ301V | |
| Asus ZenBook 14X UX3404VC | |
| Media Intel Core i9-13900H (65121 - 120936, n=25) | |
| Dell Inspiron 14 Plus 7420 | |
| Dell XPS 13 Plus 9320 i7-1280P OLED | |
| Lenovo Slim Pro 7 14ARP8 | |
| LG Gram 14Z90Q | |
| Media della classe Subnotebook (10579 - 95002, n=48, ultimi 2 anni) | |
| AIDA64 / FPU SinJulia | |
| Lenovo Slim Pro 7 14ARP8 | |
| Asus ROG Flow Z13 GZ301V | |
| Media Intel Core i9-13900H (6108 - 11631, n=25) | |
| Asus ZenBook 14X UX3404VC | |
| Dell Inspiron 14 Plus 7420 | |
| Dell XPS 13 Plus 9320 i7-1280P OLED | |
| Media della classe Subnotebook (744 - 18418, n=58, ultimi 2 anni) | |
| LG Gram 14Z90Q | |
| AIDA64 / FPU Mandel | |
| Lenovo Slim Pro 7 14ARP8 | |
| Asus ROG Flow Z13 GZ301V | |
| Media Intel Core i9-13900H (11283 - 48474, n=25) | |
| Asus ZenBook 14X UX3404VC | |
| Media della classe Subnotebook (3341 - 65433, n=58, ultimi 2 anni) | |
| Dell Inspiron 14 Plus 7420 | |
| Dell XPS 13 Plus 9320 i7-1280P OLED | |
| LG Gram 14Z90Q | |
| AIDA64 / CPU AES | |
| Media Intel Core i9-13900H (3691 - 149377, n=25) | |
| Asus ROG Flow Z13 GZ301V | |
| Asus ZenBook 14X UX3404VC | |
| Dell Inspiron 14 Plus 7420 | |
| Dell XPS 13 Plus 9320 i7-1280P OLED | |
| Media della classe Subnotebook (638 - 96917, n=58, ultimi 2 anni) | |
| Lenovo Slim Pro 7 14ARP8 | |
| LG Gram 14Z90Q | |
| AIDA64 / CPU ZLib | |
| Asus ROG Flow Z13 GZ301V | |
| Media Intel Core i9-13900H (789 - 1254, n=25) | |
| Asus ZenBook 14X UX3404VC | |
| Dell Inspiron 14 Plus 7420 | |
| Lenovo Slim Pro 7 14ARP8 | |
| Media della classe Subnotebook (164.9 - 1379, n=58, ultimi 2 anni) | |
| Dell XPS 13 Plus 9320 i7-1280P OLED | |
| LG Gram 14Z90Q | |
| AIDA64 / FP64 Ray-Trace | |
| Asus ROG Flow Z13 GZ301V | |
| Media Intel Core i9-13900H (3655 - 10716, n=25) | |
| Lenovo Slim Pro 7 14ARP8 | |
| Asus ZenBook 14X UX3404VC | |
| Media della classe Subnotebook (610 - 17495, n=58, ultimi 2 anni) | |
| Dell Inspiron 14 Plus 7420 | |
| Dell XPS 13 Plus 9320 i7-1280P OLED | |
| LG Gram 14Z90Q | |
| AIDA64 / CPU PhotoWorxx | |
| Media della classe Subnotebook (6569 - 85600, n=58, ultimi 2 anni) | |
| Dell XPS 13 Plus 9320 i7-1280P OLED | |
| Asus ROG Flow Z13 GZ301V | |
| Asus ZenBook 14X UX3404VC | |
| Media Intel Core i9-13900H (10871 - 50488, n=25) | |
| Dell Inspiron 14 Plus 7420 | |
| Lenovo Slim Pro 7 14ARP8 | |
| LG Gram 14Z90Q | |
Prestazioni del sistema
La nostra impressione soggettiva sulle prestazioni dello ZenBook 14X è molto buona e non abbiamo registrato limitazioni o ritardi evidenti nei nostri test. I risultati nei benchmark sintetici sono nella media, ma rispetto alla variante AMD dello ZenBook dello scorso anno, qui si ottengono risultati molto migliori.
CrossMark: Overall | Productivity | Creativity | Responsiveness
| PCMark 10 / Score | |
| Asus ROG Flow Z13 GZ301V | |
| Media della classe Subnotebook (4920 - 9939, n=46, ultimi 2 anni) | |
| Dell Inspiron 14 Plus 7420 | |
| Lenovo Slim Pro 7 14ARP8 | |
| Asus ZenBook 14X UX3404VC | |
| Media Intel Core i9-13900H, Intel Iris Xe Graphics G7 96EUs (5944 - 6802, n=8) | |
| Dell XPS 13 Plus 9320 i7-1280P OLED | |
| LG Gram 14Z90Q | |
| PCMark 10 / Essentials | |
| Asus ROG Flow Z13 GZ301V | |
| Media Intel Core i9-13900H, Intel Iris Xe Graphics G7 96EUs (10347 - 12286, n=8) | |
| Asus ZenBook 14X UX3404VC | |
| Dell XPS 13 Plus 9320 i7-1280P OLED | |
| Media della classe Subnotebook (8552 - 11646, n=46, ultimi 2 anni) | |
| Dell Inspiron 14 Plus 7420 | |
| Lenovo Slim Pro 7 14ARP8 | |
| LG Gram 14Z90Q | |
| PCMark 10 / Productivity | |
| Asus ROG Flow Z13 GZ301V | |
| Media della classe Subnotebook (5435 - 16606, n=46, ultimi 2 anni) | |
| Dell Inspiron 14 Plus 7420 | |
| Lenovo Slim Pro 7 14ARP8 | |
| Asus ZenBook 14X UX3404VC | |
| Media Intel Core i9-13900H, Intel Iris Xe Graphics G7 96EUs (7319 - 8526, n=8) | |
| Dell XPS 13 Plus 9320 i7-1280P OLED | |
| LG Gram 14Z90Q | |
| PCMark 10 / Digital Content Creation | |
| Asus ROG Flow Z13 GZ301V | |
| Media della classe Subnotebook (5722 - 13779, n=46, ultimi 2 anni) | |
| Lenovo Slim Pro 7 14ARP8 | |
| Dell Inspiron 14 Plus 7420 | |
| Media Intel Core i9-13900H, Intel Iris Xe Graphics G7 96EUs (7527 - 8155, n=8) | |
| Asus ZenBook 14X UX3404VC | |
| Dell XPS 13 Plus 9320 i7-1280P OLED | |
| LG Gram 14Z90Q | |
| CrossMark / Overall | |
| Asus ROG Flow Z13 GZ301V | |
| Media Intel Core i9-13900H, Intel Iris Xe Graphics G7 96EUs (1766 - 2146, n=7) | |
| Asus ZenBook 14X UX3404VC | |
| Dell XPS 13 Plus 9320 i7-1280P OLED | |
| Dell Inspiron 14 Plus 7420 | |
| Media della classe Subnotebook (365 - 2356, n=60, ultimi 2 anni) | |
| Apple MacBook Pro 13 2022 M2 | |
| Lenovo Slim Pro 7 14ARP8 | |
| CrossMark / Productivity | |
| Asus ROG Flow Z13 GZ301V | |
| Media Intel Core i9-13900H, Intel Iris Xe Graphics G7 96EUs (1684 - 2064, n=7) | |
| Asus ZenBook 14X UX3404VC | |
| Dell XPS 13 Plus 9320 i7-1280P OLED | |
| Dell Inspiron 14 Plus 7420 | |
| Media della classe Subnotebook (364 - 2277, n=60, ultimi 2 anni) | |
| Apple MacBook Pro 13 2022 M2 | |
| Lenovo Slim Pro 7 14ARP8 | |
| CrossMark / Creativity | |
| Asus ROG Flow Z13 GZ301V | |
| Asus ZenBook 14X UX3404VC | |
| Media Intel Core i9-13900H, Intel Iris Xe Graphics G7 96EUs (1789 - 2224, n=7) | |
| Dell XPS 13 Plus 9320 i7-1280P OLED | |
| Dell Inspiron 14 Plus 7420 | |
| Media della classe Subnotebook (372 - 2743, n=60, ultimi 2 anni) | |
| Apple MacBook Pro 13 2022 M2 | |
| Lenovo Slim Pro 7 14ARP8 | |
| CrossMark / Responsiveness | |
| Media Intel Core i9-13900H, Intel Iris Xe Graphics G7 96EUs (1474 - 2171, n=7) | |
| Asus ROG Flow Z13 GZ301V | |
| Asus ZenBook 14X UX3404VC | |
| Dell XPS 13 Plus 9320 i7-1280P OLED | |
| Dell Inspiron 14 Plus 7420 | |
| Media della classe Subnotebook (312 - 1854, n=60, ultimi 2 anni) | |
| Lenovo Slim Pro 7 14ARP8 | |
| Apple MacBook Pro 13 2022 M2 | |
| PCMark 10 Score | 6330 punti | |
Aiuto | ||
| AIDA64 / Memory Copy | |
| Media della classe Subnotebook (14554 - 131023, n=58, ultimi 2 anni) | |
| Asus ZenBook 14X UX3404VC | |
| Media Intel Core i9-13900H (37448 - 74486, n=25) | |
| AIDA64 / Memory Read | |
| Media della classe Subnotebook (15948 - 127174, n=58, ultimi 2 anni) | |
| Media Intel Core i9-13900H (41599 - 75433, n=25) | |
| Asus ZenBook 14X UX3404VC | |
| AIDA64 / Memory Write | |
| Media della classe Subnotebook (15709 - 135141, n=58, ultimi 2 anni) | |
| Asus ZenBook 14X UX3404VC | |
| Media Intel Core i9-13900H (36152 - 88505, n=25) | |
| AIDA64 / Memory Latency | |
| Media della classe Subnotebook (6.1 - 159.9, n=56, ultimi 2 anni) | |
| Asus ZenBook 14X UX3404VC | |
| Media Intel Core i9-13900H (75.8 - 102.3, n=25) | |
* ... Meglio usare valori piccoli
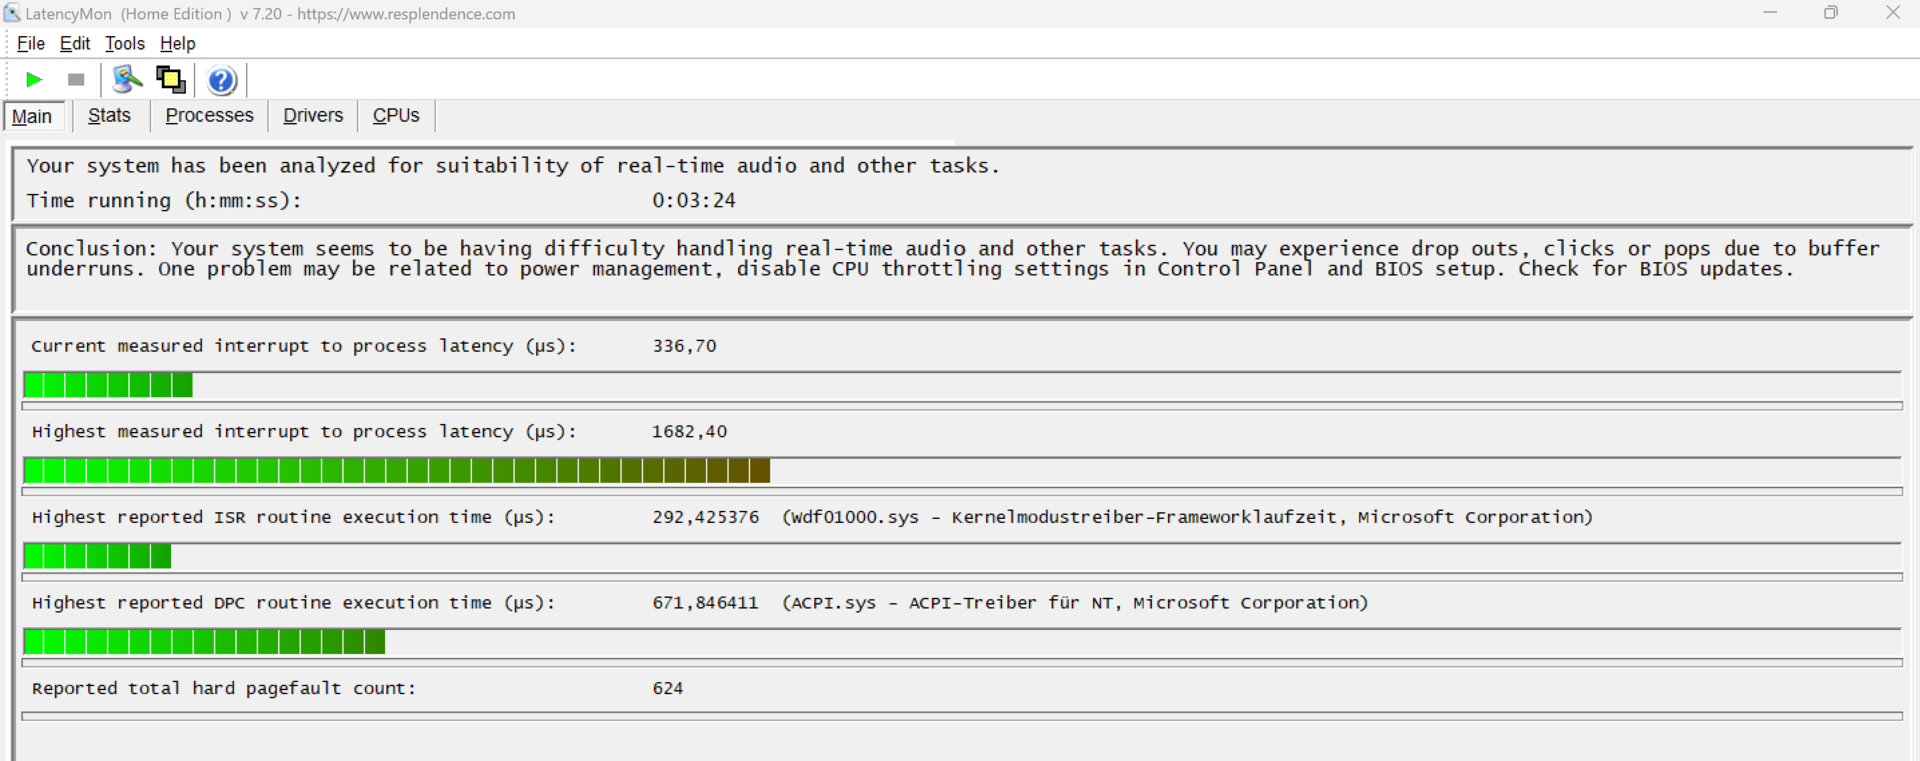
Latenza DPC
Il nostro test di latenza standardizzato (navigazione web, riproduzione di YouTube in 4K, carico della CPU) ha rivelato anomalie. Pertanto, il sistema non è adatto per l'editing video e audio in tempo reale senza limitazioni. La situazione potrebbe cambiare con le prossime versioni del BIOS e dei driver dei dispositivi.
| DPC Latencies / LatencyMon - interrupt to process latency (max), Web, Youtube, Prime95 | |
| Asus ROG Flow Z13 GZ301V | |
| Asus ZenBook 14X UX3404VC | |
| Lenovo Slim Pro 7 14ARP8 | |
| LG Gram 14Z90Q | |
| Dell Inspiron 14 Plus 7420 | |
| Dell XPS 13 Plus 9320 i7-1280P OLED | |
* ... Meglio usare valori piccoli
Dispositivi di archiviazione
Asus installa nello ZenBook 14X un'unità SSD Micron 2450 PCIe 4.0 con una capacità di archiviazione di 1 TB. 862 GB sono disponibili alla prima accensione. L'SSD si comporta bene rispetto alla media dei subnotebook, ma la nostra tabella di benchmark mostra chiari svantaggi rispetto a dispositivi analoghi.

* ... Meglio usare valori piccoli
Sustained Read Performance: DiskSpd Read Loop, Queue Depth 8
Scheda grafica
L'Asus ZenBook 14X utilizza la ben nota Iris XE Graphics G7 integrata di Intel nella versione più veloce con 96 EU e una velocità di clock massima di 1.300 MHz. L'iGPU è facilmente sufficiente per le attività di tutti i giorni, ma è necessario scendere a compromessi per i servizi più impegnativi come i giochi. Il predecessore basato su AMD ha prestazioni migliori grazie alla Radeon RX Vega 8 di AMD.
Vale la pena notare, tuttavia, che l'iGPU del nuovo Asus ZenBook 14X ha prestazioni migliori del 14% rispetto alla media dell'Intel Iris Xe Graphics G7.
| 3DMark Cloud Gate Standard Score | 22427 punti | |
| 3DMark Fire Strike Score | 5160 punti | |
Aiuto | ||
| Blender - v3.3 Classroom CPU | |
| Media Intel Iris Xe Graphics G7 96EUs (336 - 1259, n=109) | |
| Media della classe Subnotebook (241 - 861, n=60, ultimi 2 anni) | |
| Asus ZenBook 14X UX3404VC | |
* ... Meglio usare valori piccoli
Prestazioni di gioco
Come già accennato, le prestazioni di gioco dell'iGPU Intel rimangono mediocri. AMD è chiaramente in vantaggio con laRadeon 680M e la 780Mi giochi più vecchi sono giocabili a risoluzioni inferiori e con impostazioni grafiche ridotte, ma il potenziale del display a 120 Hz dell'Asus ZenBook 14X non è affatto esaurito. Se si desiderano maggiori prestazioni, è possibile dotare lo ZenBook di una scheda grafica dedicata Nvidia GeForce RTX 3050, che rende giocabile la maggior parte dei giochi, almeno a impostazioni grafiche inferiori.
| The Witcher 3 - 1920x1080 Ultra Graphics & Postprocessing (HBAO+) | |
| Asus ROG Flow Z13 GZ301V | |
| Lenovo Slim Pro 7 14ARP8 | |
| Dell Inspiron 14 Plus 7420 | |
| Media della classe Subnotebook (13.9 - 34.6, n=12, ultimi 2 anni) | |
| Asus ZenBook 14X UX3404VC | |
| Dell XPS 13 Plus 9320 i7-1280P OLED | |
| LG Gram 14Z90Q | |
| GTA V - 1920x1080 Highest AA:4xMSAA + FX AF:16x | |
| Asus ROG Flow Z13 GZ301V | |
| Lenovo Slim Pro 7 14ARP8 | |
| Dell Inspiron 14 Plus 7420 | |
| Media della classe Subnotebook (10.7 - 43.7, n=56, ultimi 2 anni) | |
| Dell XPS 13 Plus 9320 i7-1280P OLED | |
| Asus ZenBook 14X UX3404VC | |
| Final Fantasy XV Benchmark - 1920x1080 High Quality | |
| Asus ROG Flow Z13 GZ301V | |
| Lenovo Slim Pro 7 14ARP8 | |
| Dell Inspiron 14 Plus 7420 | |
| Media della classe Subnotebook (11.6 - 54.5, n=54, ultimi 2 anni) | |
| Dell XPS 13 Plus 9320 i7-1280P OLED | |
| LG Gram 14Z90Q | |
| Strange Brigade - 1920x1080 ultra AA:ultra AF:16 | |
| Asus ROG Flow Z13 GZ301V | |
| Dell Inspiron 14 Plus 7420 | |
| Media della classe Subnotebook (19 - 101.3, n=50, ultimi 2 anni) | |
| Dell XPS 13 Plus 9320 i7-1280P OLED | |
| Asus ZenBook 14X UX3404VC | |
| Asus ZenBook 14X UX3404VC | |
| Dota 2 Reborn - 1920x1080 ultra (3/3) best looking | |
| Asus ROG Flow Z13 GZ301V | |
| Dell Inspiron 14 Plus 7420 | |
| Lenovo Slim Pro 7 14ARP8 | |
| Media della classe Subnotebook (13 - 97, n=61, ultimi 2 anni) | |
| Asus ZenBook 14X UX3404VC | |
| Dell XPS 13 Plus 9320 i7-1280P OLED | |
| LG Gram 14Z90Q | |
L'iGPU dello ZenBook 14X funziona in modo stabile nel test Witcher. Eseguendo Witcher 3 (in loop) con impostazioni Ultra e risoluzione FHD ha prodotto una media di 17 fps.
Witcher 3 FPS chart
| basso | medio | alto | ultra | QHD | |
|---|---|---|---|---|---|
| GTA V (2015) | 116.7 | 103.9 | 25.2 | 10.6 | 6.79 |
| The Witcher 3 (2015) | 87 | 59 | 33 | 17 | |
| Dota 2 Reborn (2015) | 126.5 | 94.1 | 74.9 | 68.3 | |
| X-Plane 11.11 (2018) | 50.8 | 41.8 | 34.5 | ||
| Far Cry 5 (2018) | 55 | 30 | 28 | 26 | 17 |
| Strange Brigade (2018) | 99.7 | 42.5 | 34 | 27.2 | 19.6 |
| F1 22 (2022) | 52.8 | 48.7 | 34.1 | 26.1 | 18.7 |
Emissioni
Rumore - Poco rumoroso
Con un massimo di 45,5 dB(A), lo ZenBook 14X è sicuramente uno dei subnotebook più silenziosi sul mercato. Le ventole sono appena percettibili nell'uso quotidiano e il dispositivo rimane in media sotto i 40 dB(A), anche sotto carico. Tuttavia, poiché è installata una sola ventola (rispetto al modello dello scorso anno), il sistema di raffreddamento è un po' più debole e questo limita l'Intel Core i9-13900H. In modalità Performance , inoltre, la ventola gira più frequentemente durante le normali attività d'ufficio e non rimane mai completamente silenziosa nemmeno in modalità Standard
D'altra parte, la modalità Silent può essere attivata per ottenere un piccolo calo delle prestazioni, in cui il subnotebook è appena udibile.
Rumorosità
| Idle |
| 25.2 / 25.2 / 26.5 dB(A) |
| Sotto carico |
| 39.8 / 45.5 dB(A) |
 | ||
30 dB silenzioso 40 dB(A) udibile 50 dB(A) rumoroso |
||
min: | ||
| Asus ZenBook 14X UX3404VC Iris Xe G7 96EUs, i9-13900H, Micron 2450 1TB MTFDKBA1T0TFK | Apple MacBook Pro 13 2022 M2 M2 10-Core GPU, M2, Apple SSD AP1024Z | Dell XPS 13 Plus 9320 i7-1280P OLED Iris Xe G7 96EUs, i7-1280P, WDC PC SN810 512GB | Lenovo Slim Pro 7 14ARP8 GeForce RTX 3050 6GB Laptop GPU, R7 7735HS, SK hynix PC801 HFS512GEJ9X115N | LG Gram 14Z90Q Iris Xe G7 80EUs, i5-1240P, Samsung PM9A1 MZVL2512HCJQ | Dell Inspiron 14 Plus 7420 GeForce RTX 3050 4GB Laptop GPU, i7-12700H, SK Hynix BC711 512GB HFM512GD3GX013N | Asus ROG Flow Z13 GZ301V GeForce RTX 4060 Laptop GPU, i9-13900H, WD PC SN740 SDDPTQD-1T00 | |
|---|---|---|---|---|---|---|---|
| Noise | 10% | 10% | 5% | 3% | 1% | 5% | |
| off /ambiente * (dB) | 25.2 | 23.9 5% | 23.4 7% | 22.7 10% | 25 1% | 23.2 8% | 24 5% |
| Idle Minimum * (dB) | 25.2 | 23.9 5% | 23.4 7% | 22.8 10% | 26 -3% | 23.2 8% | 24 5% |
| Idle Average * (dB) | 25.2 | 23.9 5% | 23.4 7% | 22.8 10% | 27 -7% | 23.2 8% | 24 5% |
| Idle Maximum * (dB) | 26.5 | 23.9 10% | 23.4 12% | 22.8 14% | 28 -6% | 23.2 12% | 24 9% |
| Load Average * (dB) | 39.8 | 23.9 40% | 35 12% | 43.8 -10% | 35 12% | 47.5 -19% | 38.61 3% |
| Load Maximum * (dB) | 45.5 | 49 -8% | 39.9 12% | 47.1 -4% | 36 21% | 51.7 -14% | 43.59 4% |
| Witcher 3 ultra * (dB) | 34.6 | 41.6 | 43.8 | 36 | 51.7 | 41.24 |
* ... Meglio usare valori piccoli
Temperatura
Nell'uso quotidiano (ufficio, internet), le temperature rimangono all'interno di un intervallo poco evidente e solo l'area centrale sopra la tastiera si scalda leggermente sotto carico. La singola ventola aspira l'aria dal basso ed espelle il calore residuo sul lato sinistro e sul retro. Di conseguenza, il poggiapolsi rimane sempre fresco, mentre la tastiera si aggira intorno ai 31 °C, il che non risulta fastidioso.
(+) La temperatura massima sul lato superiore è di 38.9 °C / 102 F, rispetto alla media di 35.9 °C / 97 F, che varia da 21.4 a 59 °C per questa classe Subnotebook.
(±) Il lato inferiore si riscalda fino ad un massimo di 43.4 °C / 110 F, rispetto alla media di 39.2 °C / 103 F
(+) In idle, la temperatura media del lato superiore è di 31.1 °C / 88 F, rispetto alla media deld ispositivo di 30.8 °C / 87 F.
(±) Riproducendo The Witcher 3, la temperatura media per il lato superiore e' di 32.7 °C / 91 F, rispetto alla media del dispositivo di 30.8 °C / 87 F.
(+) I poggiapolsi e il touchpad raggiungono la temperatura massima della pelle (33.9 °C / 93 F) e quindi non sono caldi.
(-) La temperatura media della zona del palmo della mano di dispositivi simili e'stata di 28.2 °C / 82.8 F (-5.7 °C / -10.2 F).
| Asus ZenBook 14X UX3404VC Intel Core i9-13900H, Intel Iris Xe Graphics G7 96EUs | Apple MacBook Pro 13 2022 M2 Apple M2, Apple M2 10-Core GPU | Lenovo Slim Pro 7 14ARP8 AMD Ryzen 7 7735HS, NVIDIA GeForce RTX 3050 6GB Laptop GPU | LG Gram 14Z90Q Intel Core i5-1240P, Intel Iris Xe Graphics G7 80EUs | Dell Inspiron 14 Plus 7420 Intel Core i7-12700H, NVIDIA GeForce RTX 3050 4GB Laptop GPU | Asus ROG Flow Z13 GZ301V Intel Core i9-13900H, NVIDIA GeForce RTX 4060 Laptop GPU | |
|---|---|---|---|---|---|---|
| Heat | 10% | 9% | 6% | 12% | 5% | |
| Maximum Upper Side * (°C) | 38.9 | 45.1 -16% | 42.2 -8% | 43 -11% | 40 -3% | 42 -8% |
| Maximum Bottom * (°C) | 43.4 | 43 1% | 49 -13% | 45 -4% | 36.4 16% | 47 -8% |
| Idle Upper Side * (°C) | 33.5 | 25.2 25% | 24.4 27% | 27 19% | 27 19% | 27 19% |
| Idle Bottom * (°C) | 35.3 | 25.4 28% | 25.2 29% | 28 21% | 29.2 17% | 30 15% |
* ... Meglio usare valori piccoli
Stress Test - Frequenza di clock troppo bassa
All'inizio dello stress test (Prime95 e Furmark), la CPU ha un clock di 3,5 GHz e la iGPU di 1,3 GHz. Tuttavia, le frequenze di clock scendono subito dopo, in modo che la CPU si assesti a 1,9 GHz e la iGPU a 1,2 GHz. Lo stress test rappresenta uno scenario estremo in cui si verifica se il sistema può rimanere stabile sotto pieno carico.
Altoparlanti
Per essere un portatile Windows, gli altoparlanti si comportano bene: i bassi e le basse frequenze sono addirittura distinguibili. Gli altoparlanti sono posizionati sotto il poggiapolsi e sparano verso il basso, utilizzando la superficie come riflettore. Se il portatile viene appoggiato su un tessuto o su un tappetino per il mouse, ad esempio, la qualità del suono peggiora notevolmente.
Il microfono a doppio array funziona bene e registra le voci senza disturbi, quindi la qualità è sufficiente per videochiamate e conferenze. Il rumore della tastiera è udibile durante le registrazioni audio, ma non è fastidioso.
Asus ZenBook 14X UX3404VC analisi audio
(+) | gli altoparlanti sono relativamente potenti (86.4 dB)
Bassi 100 - 315 Hz
(-) | quasi nessun basso - in media 16.3% inferiori alla media
(-) | bassi non lineari (15.8% delta rispetto alla precedente frequenza)
Medi 400 - 2000 Hz
(+) | medi bilanciati - solo only 1.2% rispetto alla media
(+) | medi lineari (3.1% delta rispetto alla precedente frequenza)
Alti 2 - 16 kHz
(+) | Alti bilanciati - appena 4.1% dalla media
(+) | alti lineari (3.4% delta rispetto alla precedente frequenza)
Nel complesso 100 - 16.000 Hz
(+) | suono nel complesso lineare (11.3% differenza dalla media)
Rispetto alla stessa classe
» 12% di tutti i dispositivi testati in questa classe è stato migliore, 2% simile, 86% peggiore
» Il migliore ha avuto un delta di 5%, medio di 18%, peggiore di 53%
Rispetto a tutti i dispositivi testati
» 7% di tutti i dispositivi testati in questa classe è stato migliore, 2% similare, 91% peggiore
» Il migliore ha avuto un delta di 4%, medio di 23%, peggiore di 134%
Apple MacBook Pro 16 2021 M1 Pro analisi audio
(+) | gli altoparlanti sono relativamente potenti (84.7 dB)
Bassi 100 - 315 Hz
(+) | bassi buoni - solo 3.8% dalla media
(+) | bassi in lineaa (5.2% delta rispetto alla precedente frequenza)
Medi 400 - 2000 Hz
(+) | medi bilanciati - solo only 1.3% rispetto alla media
(+) | medi lineari (2.1% delta rispetto alla precedente frequenza)
Alti 2 - 16 kHz
(+) | Alti bilanciati - appena 1.9% dalla media
(+) | alti lineari (2.7% delta rispetto alla precedente frequenza)
Nel complesso 100 - 16.000 Hz
(+) | suono nel complesso lineare (4.6% differenza dalla media)
Rispetto alla stessa classe
» 0% di tutti i dispositivi testati in questa classe è stato migliore, 0% simile, 100% peggiore
» Il migliore ha avuto un delta di 5%, medio di 17%, peggiore di 45%
Rispetto a tutti i dispositivi testati
» 0% di tutti i dispositivi testati in questa classe è stato migliore, 0% similare, 100% peggiore
» Il migliore ha avuto un delta di 4%, medio di 23%, peggiore di 134%
Gestione dell'energia
Consumo di energia
Quando è al minimo, il nuovo modello è economico come il predecessore AMD; il consumo massimo di energia al minimo è di poco inferiore a 12 watt. Questo valore rientra nei limiti dei modelli con display OLED, ma il consumo di watt aumenta in presenza di immagini più luminose.
Sotto carico massimo di gioco con Witcher 3 Ultra, abbiamo misurato poco meno di 43 watt, 6 watt in meno rispetto all'analogo Dell XPS 13 Plus 9320 OLED con la stessa iGPU. Tuttavia, lo stress test di Prime95 e Furmark mostra che l'alimentatore da 90 watt è troppo stretto, dato che all'inizio abbiamo misurato brevemente 95 watt. Tuttavia, questa fase non dura a lungo e il consumo di energia si stabilizza a 65 watt e poi a 45 watt, quindi l'alimentatore più debole non dovrebbe essere un problema. Tuttavia, l'alimentatore da 100 watt del modello precedente sarebbe stata la scelta migliore.
| Off / Standby | |
| Idle | |
| Sotto carico |
|
Leggenda:
min: | |
| Asus ZenBook 14X UX3404VC i9-13900H, Iris Xe G7 96EUs, Micron 2450 1TB MTFDKBA1T0TFK, OLED, 2880x1800, 14.5" | Apple MacBook Pro 13 2022 M2 M2, M2 10-Core GPU, Apple SSD AP1024Z, IPS, 2560x1600, 13.3" | Lenovo Slim Pro 7 14ARP8 R7 7735HS, GeForce RTX 3050 6GB Laptop GPU, SK hynix PC801 HFS512GEJ9X115N, IPS, 2560x1600, 14.5" | Asus ROG Flow Z13 GZ301V i9-13900H, GeForce RTX 4060 Laptop GPU, WD PC SN740 SDDPTQD-1T00, IPS, 2560x1600, 13.4" | Dell XPS 13 Plus 9320 i7-1280P OLED i7-1280P, Iris Xe G7 96EUs, WDC PC SN810 512GB, OLED, 3456x2160, 13.4" | Dell Inspiron 14 Plus 7420 i7-12700H, GeForce RTX 3050 4GB Laptop GPU, SK Hynix BC711 512GB HFM512GD3GX013N, IPS, 2240x1400, 14" | LG Gram 14Z90Q i5-1240P, Iris Xe G7 80EUs, Samsung PM9A1 MZVL2512HCJQ, IPS, 1920x1200, 14" | Media Intel Iris Xe Graphics G7 96EUs | Media della classe Subnotebook | |
|---|---|---|---|---|---|---|---|---|---|
| Power Consumption | 33% | -56% | -65% | -7% | -72% | 20% | 3% | 23% | |
| Idle Minimum * (Watt) | 6 | 1.77 70% | 7.6 -27% | 8.5 -42% | 6.5 -8% | 6.3 -5% | 3 50% | 5.51 ? 8% | 3.71 ? 38% |
| Idle Average * (Watt) | 7 | 6.7 4% | 12.2 -74% | 12.4 -77% | 7.8 -11% | 10.3 -47% | 6 14% | 8.66 ? -24% | 6.54 ? 7% |
| Idle Maximum * (Watt) | 11.8 | 6.9 42% | 12.8 -8% | 13.3 -13% | 13 -10% | 20 -69% | 12 -2% | 10.9 ? 8% | 7.89 ? 33% |
| Load Average * (Watt) | 44 | 30.9 30% | 76.5 -74% | 93 -111% | 56.6 -29% | 106.2 -141% | 40 9% | 45.6 ? -4% | 42.1 ? 4% |
| Witcher 3 ultra * (Watt) | 42.6 | 38.9 9% | 89.5 -110% | 87.8 -106% | 49.2 -15% | 96.1 -126% | 36.5 14% | ||
| Load Maximum * (Watt) | 95 | 56 41% | 135.7 -43% | 135 -42% | 63 34% | 136.5 -44% | 63 34% | 67.8 ? 29% | 65.1 ? 31% |
* ... Meglio usare valori piccoli
Power consumption Witcher 3 / Stress test
Power consumption with an external monitor
Durata del viaggio
La durata della batteria dell'Asus ZenBook 14X è davvero notevole, considerando il processore Intel Core i9 di fascia alta. Nel nostro test WLAN, il 14 pollici ha raggiunto un'autonomia di esattamente 10 ore. Questo test utilizza uno script per misurare il carico durante l'accesso ai siti web
Il Apple MacBook Pro 13 2022 M2, il Lenovo Slim Pro 7 14ARP8 e il LG Gram 14Z90Q ottengono risultati migliori nella nostra tabella di benchmark, ma non hanno display OLED. Rispetto al Dell XPS 13 Plus 9320 con il suo display OLED, le ottime prestazioni della batteria dello ZenBook si notano chiaramente, dato che il modello Dell dura solo circa 5:30 ore.
| Asus ZenBook 14X UX3404VC i9-13900H, Iris Xe G7 96EUs, 70 Wh | Apple MacBook Pro 13 2022 M2 M2, M2 10-Core GPU, 58.2 Wh | Dell XPS 13 Plus 9320 i7-1280P OLED i7-1280P, Iris Xe G7 96EUs, 55 Wh | Lenovo Slim Pro 7 14ARP8 R7 7735HS, GeForce RTX 3050 6GB Laptop GPU, 73 Wh | LG Gram 14Z90Q i5-1240P, Iris Xe G7 80EUs, 72 Wh | Dell Inspiron 14 Plus 7420 i7-12700H, GeForce RTX 3050 4GB Laptop GPU, 64 Wh | Asus ROG Flow Z13 GZ301V i9-13900H, GeForce RTX 4060 Laptop GPU, 56 Wh | Media della classe Subnotebook | |
|---|---|---|---|---|---|---|---|---|
| Autonomia della batteria | 91% | -42% | 5% | 49% | -36% | -46% | 41% | |
| Reader / Idle (h) | 17.6 | 28.9 64% | 11.9 -32% | 28.6 ? 63% | ||||
| WiFi v1.3 (h) | 10 | 19.1 91% | 5.8 -42% | 10.5 5% | 11.9 19% | 7.2 -28% | 5 -50% | 14.1 ? 41% |
| Load (h) | 1.7 | 2.8 65% | 0.9 -47% | 1 -41% | 1.998 ? 18% | |||
| H.264 (h) | 19.2 | 4.7 | 15.3 ? | |||||
| Witcher 3 ultra (h) | 0.8 |
Pro
Contro
Verdetto - Il nuovo processore non è in grado di spiegare completamente le sue ali
Lo ZenBook 14X è un portatile complessivamente molto solido, rovinato solo dalle prestazioni un po' deludenti del processore. Avrebbe sicuramente beneficiato di una ventola aggiuntiva, come nel modello dello scorso anno modello dello scorso anno. D'altra parte, il display OLED a 120 Hz, i tempi di risposta rapidi e la durata della batteria superiore alla media sono punti molto positivi. Nonostante l'Intel Core i9-13900H installato, abbiamo misurato esattamente 10 ore nel nostro test WLAN. I valori DeltaE del display sono inferiori a 3 e quindi il subnotebook è adatto all'editing di foto e video.
Anche la qualità dello chassis in alluminio è eccellente e garantisce una stabilità superiore alla media, che si nota anche durante la digitazione. La varietà di porte è solida, ma inferiore al predecessore, poiché il lettore microSD è stato omesso. Anche il posizionamento delle porte non è proprio ideale.
Il nuovo ZenBook 14X di Asus è un robusto tuttofare con un'ottima durata della batteria, un eccezionale display OLED e solide prestazioni.
La rumorosità della ventola è moderata e il dispositivo rimane in gran parte impercettibile durante le normali attività d'ufficio grazie all'opzione della modalità silenziosa nell'app MyAsus.
Il prezzo della configurazione base è aumentato rispetto al predecessore sia nella versione AMD che in quella Intel. La nostra variante recensita, senza scheda grafica dedicata, costa EUR 1.699 (~US$1.850). Se invece volete la Nvidia GeForce RTX 3050, dovrete sborsare altri 400 euro (440 dollari).
Se il display OLED non gioca un ruolo importante nella scelta del notebook, ci sono due dispositivi da 14 pollici più economici, come il Lenovo Slim Pro 7 14ARP8 e il Dell Inspiron 14 Plus 7420, che offrono migliori prestazioni grafiche grazie alla AMD Radeon 680M nel Lenovo o alla RTX 3050 nel Dell.
Prezzo e disponibilità
Negli Stati Uniti, la configurazione base dell'Asus Zenbook 14X UX3404 ha un prezzo di $1.799,00 sul webstore di Asus.
Asus ZenBook 14X UX3404VC
- 06/01/2023 v7 (old)
Philip Macdonald
Transparency
La selezione dei dispositivi da recensire viene effettuata dalla nostra redazione. Il campione di prova è stato fornito all'autore come prestito dal produttore o dal rivenditore ai fini di questa recensione. L'istituto di credito non ha avuto alcuna influenza su questa recensione, né il produttore ne ha ricevuto una copia prima della pubblicazione. Non vi era alcun obbligo di pubblicare questa recensione. In quanto società mediatica indipendente, Notebookcheck non è soggetta all'autorità di produttori, rivenditori o editori.
Ecco come Notebookcheck esegue i test
Ogni anno, Notebookcheck esamina in modo indipendente centinaia di laptop e smartphone utilizzando procedure standardizzate per garantire che tutti i risultati siano comparabili. Da circa 20 anni sviluppiamo continuamente i nostri metodi di prova e nel frattempo stabiliamo gli standard di settore. Nei nostri laboratori di prova, tecnici ed editori esperti utilizzano apparecchiature di misurazione di alta qualità. Questi test comportano un processo di validazione in più fasi. Il nostro complesso sistema di valutazione si basa su centinaia di misurazioni e parametri di riferimento ben fondati, che mantengono l'obiettività.Price comparison

