Recensione breve della Workstation Lenovo ThinkPad P40 Yoga 20GQ-000EUS


| SD Card Reader | |
| average JPG Copy Test (av. of 3 runs) | |
| Dell Latitude 14 7000 Series E7470 | |
| Lenovo ThinkPad P40 Yoga 20GQ-000EUS | |
| Lenovo ThinkPad Yoga 460-20EM000QGE | |
| Apple MacBook Pro Retina 13 inch 2013-10 | |
| maximum AS SSD Seq Read Test (1GB) | |
| Dell Latitude 14 7000 Series E7470 | |
| Lenovo ThinkPad Yoga 460-20EM000QGE | |
| Lenovo ThinkPad P40 Yoga 20GQ-000EUS | |
| Networking | |
| iperf Server (receive) TCP 1 m | |
| Apple MacBook 12 (Early 2016) 1.1 GHz | |
| iperf Client (transmit) TCP 1 m | |
| Apple MacBook 12 (Early 2016) 1.1 GHz | |
| |||||||||||||||||||||||||
Distribuzione della luminosità: 85 %
Al centro con la batteria: 263.5 cd/m²
Contrasto: 647:1 (Nero: 0.407 cd/m²)
ΔE ColorChecker Calman: 5.98 | ∀{0.5-29.43 Ø4.71}
ΔE Greyscale Calman: 10.41 | ∀{0.09-98 Ø4.96}
91% sRGB (Argyll 1.6.3 3D)
59% AdobeRGB 1998 (Argyll 1.6.3 3D)
66.1% AdobeRGB 1998 (Argyll 3D)
91.3% sRGB (Argyll 3D)
65.3% Display P3 (Argyll 3D)
Gamma: 0.72
CCT: 6647 K
| Lenovo ThinkPad P40 Yoga 20GQ-000EUS IPS, 14.1", 2560x1440 | Lenovo ThinkPad P40 Yoga 20GQ-0004GE NV140FHM-N41, IPS, 14", 1920x1080 | Lenovo ThinkPad Yoga 460-20EM000QGE NV140FHM-N41, a-Si TFT-LCD, IPS, LED, 14", 1920x1080 | Lenovo ThinkPad T460s-20FA003GGE VVX14T058J02, IPS-Panel, 14", 2560x1440 | Dell Latitude 14 7000 Series E7470 AUO B140QAN Dell PN F0WXVV, IPS, 14", 2560x1440 | |
|---|---|---|---|---|---|
| Display | -34% | -34% | 6% | 4% | |
| Display P3 Coverage (%) | 65.3 | 41.82 -36% | 42.11 -36% | 68.7 5% | 67.2 3% |
| sRGB Coverage (%) | 91.3 | 62.7 -31% | 63.3 -31% | 98.1 7% | 95.9 5% |
| AdobeRGB 1998 Coverage (%) | 66.1 | 43.2 -35% | 43.51 -34% | 70.4 7% | 69.3 5% |
| Response Times | -38% | -8% | -8% | -24% | |
| Response Time Grey 50% / Grey 80% * (ms) | 30.8 ? | 55 ? -79% | 33.2 ? -8% | 35.6 ? -16% | 48 ? -56% |
| Response Time Black / White * (ms) | 29.6 ? | 28.8 ? 3% | 31.6 ? -7% | 29.2 ? 1% | 27 ? 9% |
| PWM Frequency (Hz) | 217 ? | 220 ? | 220 ? | ||
| Screen | 2% | 7% | 18% | 39% | |
| Brightness middle (cd/m²) | 263.5 | 229 -13% | 238 -10% | 257 -2% | 380 44% |
| Brightness (cd/m²) | 244 | 241 -1% | 243 0% | 248 2% | 354 45% |
| Brightness Distribution (%) | 85 | 89 5% | 88 4% | 94 11% | 81 -5% |
| Black Level * (cd/m²) | 0.407 | 0.24 41% | 0.28 31% | 0.26 36% | 0.26 36% |
| Contrast (:1) | 647 | 954 47% | 850 31% | 988 53% | 1462 126% |
| Colorchecker dE 2000 * | 5.98 | 6.3 -5% | 4.91 18% | 4.59 23% | 3.11 48% |
| Colorchecker dE 2000 max. * | 9.42 | 12.6 -34% | 10.28 -9% | 9.72 -3% | 6.73 29% |
| Greyscale dE 2000 * | 10.41 | 5.4 48% | 3.72 64% | 6.38 39% | 4.35 58% |
| Gamma | 0.72 306% | 2.22 99% | 2.54 87% | 2.51 88% | 2.37 93% |
| CCT | 6647 98% | 6592 99% | 7091 92% | 6238 104% | 6771 96% |
| Color Space (Percent of AdobeRGB 1998) (%) | 59 | 39.4 -33% | 39.81 -33% | 65 10% | 62 5% |
| Color Space (Percent of sRGB) (%) | 91 | 62 -32% | 62.85 -31% | 98 8% | 96 5% |
| Media totale (Programma / Settaggio) | -23% /
-10% | -12% /
-3% | 5% /
12% | 6% /
24% |
* ... Meglio usare valori piccoli
Tempi di risposta del Display
| ↔ Tempi di risposta dal Nero al Bianco | ||
|---|---|---|
| 29.6 ms ... aumenta ↗ e diminuisce ↘ combinato | ↗ 6.8 ms Incremento | 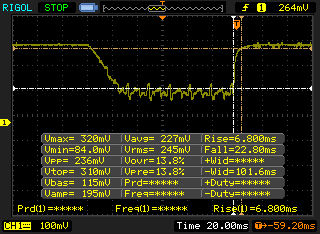 |
| ↘ 22.8 ms Calo | ||
| Lo schermo mostra tempi di risposta relativamente lenti nei nostri tests e potrebbe essere troppo lento per i gamers. In confronto, tutti i dispositivi di test variano da 0.1 (minimo) a 240 (massimo) ms. » 79 % di tutti i dispositivi è migliore. Questo significa che i tempi di risposta rilevati sono peggiori rispetto alla media di tutti i dispositivi testati (19.8 ms). | ||
| ↔ Tempo di risposta dal 50% Grigio all'80% Grigio | ||
| 30.8 ms ... aumenta ↗ e diminuisce ↘ combinato | ↗ 12.4 ms Incremento | 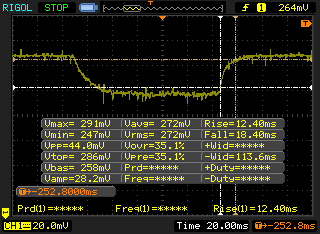 |
| ↘ 18.4 ms Calo | ||
| Lo schermo mostra tempi di risposta lenti nei nostri tests e sarà insoddisfacente per i gamers. In confronto, tutti i dispositivi di test variano da 0.165 (minimo) a 636 (massimo) ms. » 41 % di tutti i dispositivi è migliore. Questo significa che i tempi di risposta rilevati sono simili alla media di tutti i dispositivi testati (31 ms). | ||
Sfarfallio dello schermo / PWM (Pulse-Width Modulation)
| flickering dello schermo / PWM non rilevato | 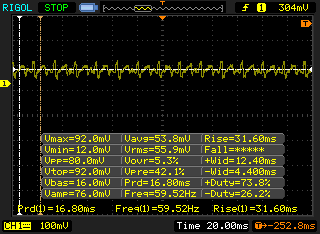 | ||
In confronto: 52 % di tutti i dispositivi testati non utilizza PWM per ridurre la luminosita' del display. Se è rilevato PWM, una media di 7754 (minimo: 5 - massimo: 343500) Hz è stata rilevata. | |||
| Cinebench R15 | |
| CPU Single 64Bit (ordina per valore) | |
| Lenovo ThinkPad P40 Yoga 20GQ-000EUS | |
| Asus Strix GL502VY-DS71 | |
| Lenovo ThinkPad Yoga 12 20DK002EPB | |
| Lenovo ThinkPad X240 | |
| Razer Blade Stealth UHD i7-6500U | |
| Dell Inspiron 13 7386 | |
| Lenovo ThinkPad X1 Carbon 20FB-005XUS | |
| CPU Multi 64Bit (ordina per valore) | |
| Lenovo ThinkPad P40 Yoga 20GQ-000EUS | |
| Asus Strix GL502VY-DS71 | |
| Lenovo ThinkPad Yoga 12 20DK002EPB | |
| Lenovo ThinkPad X240 | |
| Razer Blade Stealth UHD i7-6500U | |
| Dell Inspiron 13 7386 | |
| Lenovo ThinkPad X1 Carbon 20FB-005XUS | |
| Cinebench R11.5 | |
| CPU Single 64Bit (ordina per valore) | |
| Lenovo ThinkPad P40 Yoga 20GQ-000EUS | |
| Asus Strix GL502VY-DS71 | |
| Lenovo ThinkPad Yoga 12 20DK002EPB | |
| Lenovo ThinkPad X240 | |
| Razer Blade Stealth UHD i7-6500U | |
| Dell Inspiron 13 7386 | |
| Lenovo ThinkPad X1 Carbon 20FB-005XUS | |
| CPU Multi 64Bit (ordina per valore) | |
| Lenovo ThinkPad P40 Yoga 20GQ-000EUS | |
| Asus Strix GL502VY-DS71 | |
| Lenovo ThinkPad Yoga 12 20DK002EPB | |
| Lenovo ThinkPad X240 | |
| Razer Blade Stealth UHD i7-6500U | |
| Dell Inspiron 13 7386 | |
| Lenovo ThinkPad X1 Carbon 20FB-005XUS | |
| Cinebench R10 | |
| Rendering Multiple CPUs 32Bit (ordina per valore) | |
| Lenovo ThinkPad P40 Yoga 20GQ-000EUS | |
| Asus Strix GL502VY-DS71 | |
| Lenovo ThinkPad Yoga 12 20DK002EPB | |
| Lenovo ThinkPad X240 | |
| Razer Blade Stealth UHD i7-6500U | |
| Dell Inspiron 13 7386 | |
| Lenovo ThinkPad X1 Carbon 20FB-005XUS | |
| Rendering Single 32Bit (ordina per valore) | |
| Lenovo ThinkPad P40 Yoga 20GQ-000EUS | |
| Asus Strix GL502VY-DS71 | |
| Lenovo ThinkPad Yoga 12 20DK002EPB | |
| Lenovo ThinkPad X240 | |
| Razer Blade Stealth UHD i7-6500U | |
| Dell Inspiron 13 7386 | |
| Lenovo ThinkPad X1 Carbon 20FB-005XUS | |
| wPrime 2.10 - 1024m (ordina per valore) | |
| Lenovo ThinkPad P40 Yoga 20GQ-000EUS | |
| Asus Strix GL502VY-DS71 | |
| Lenovo ThinkPad Yoga 12 20DK002EPB | |
| Lenovo ThinkPad X240 | |
| Razer Blade Stealth UHD i7-6500U | |
| Dell Inspiron 13 7386 | |
| Lenovo ThinkPad X1 Carbon 20FB-005XUS | |
| Super Pi Mod 1.5 XS 32M - 32M (ordina per valore) | |
| Lenovo ThinkPad P40 Yoga 20GQ-000EUS | |
| Asus Strix GL502VY-DS71 | |
| Lenovo ThinkPad Yoga 12 20DK002EPB | |
| Lenovo ThinkPad X240 | |
| Razer Blade Stealth UHD i7-6500U | |
| Dell Inspiron 13 7386 | |
| Lenovo ThinkPad X1 Carbon 20FB-005XUS | |
* ... Meglio usare valori piccoli
| PCMark 8 Home Score Accelerated v2 | 2320 punti | |
| PCMark 8 Creative Score Accelerated v2 | 2666 punti | |
| PCMark 8 Work Score Accelerated v2 | 3703 punti | |
Aiuto | ||
| Lenovo ThinkPad P40 Yoga 20GQ-000EUS Samsung SSD PM871 MZ7LN512HCHP | HP EliteBook Folio 1040 G3 Samsung SM951 MZVPV256HDGL m.2 PCI-e | Lenovo ThinkPad Yoga 460-20EM000QGE Liteonit LCH-256V2S | Toshiba Satellite Radius 14 L40W-C-10Z HGST Travelstar 5K1000 HTS541010A9E680 | Dell Latitude 14 7000 Series E7470 Samsung SSD PM851 M.2 2280 256GB | |
|---|---|---|---|---|---|
| CrystalDiskMark 3.0 | 137% | -19% | -92% | -5% | |
| Read Seq (MB/s) | 497.7 | 1649 231% | 499.1 0% | 97.1 -80% | 518 4% |
| Write Seq (MB/s) | 446.6 | 1265 183% | 287.9 -36% | 94.9 -79% | 300.7 -33% |
| Read 512 (MB/s) | 387.7 | 1252 223% | 283.9 -27% | 32.3 -92% | 470.8 21% |
| Write 512 (MB/s) | 375 | 1244 232% | 287.3 -23% | 37.5 -90% | 214 -43% |
| Read 4k (MB/s) | 34.53 | 53.3 54% | 26.38 -24% | 0.39 -99% | 36.32 5% |
| Write 4k (MB/s) | 96.4 | 159.9 66% | 78.6 -18% | 0.958 -99% | 110.9 15% |
| Read 4k QD32 (MB/s) | 322.5 | 559 73% | 301 -7% | 0.796 -100% | 400.9 24% |
| Write 4k QD32 (MB/s) | 289.4 | 376.7 30% | 250 -14% | 0.952 -100% | 191.7 -34% |

| 3DMark 11 | |
| 1280x720 Performance GPU (ordina per valore) | |
| Lenovo ThinkPad P40 Yoga 20GQ-000EUS | |
| Lenovo ThinkPad P50 | |
| HP ZBook Studio G3 | |
| Dell XPS 13 2016 9350 (FHD, i7-6560U) | |
| Schenker W505 | |
| Fujitsu Lifebook E746 VFY:E7460M85ABPL | |
| 1280x720 Performance Combined (ordina per valore) | |
| Lenovo ThinkPad P40 Yoga 20GQ-000EUS | |
| Lenovo ThinkPad P50 | |
| HP ZBook Studio G3 | |
| Dell XPS 13 2016 9350 (FHD, i7-6560U) | |
| Schenker W505 | |
| Fujitsu Lifebook E746 VFY:E7460M85ABPL | |
| 3DMark | |
| 1280x720 Cloud Gate Standard Graphics (ordina per valore) | |
| Lenovo ThinkPad P40 Yoga 20GQ-000EUS | |
| Lenovo ThinkPad P50 | |
| HP ZBook Studio G3 | |
| Dell XPS 13 2016 9350 (FHD, i7-6560U) | |
| Schenker W505 | |
| Fujitsu Lifebook E746 VFY:E7460M85ABPL | |
| 1920x1080 Fire Strike Graphics (ordina per valore) | |
| Lenovo ThinkPad P40 Yoga 20GQ-000EUS | |
| Lenovo ThinkPad P50 | |
| HP ZBook Studio G3 | |
| Dell XPS 13 2016 9350 (FHD, i7-6560U) | |
| Schenker W505 | |
| Fujitsu Lifebook E746 VFY:E7460M85ABPL | |
| 1920x1080 Ice Storm Extreme Graphics (ordina per valore) | |
| Lenovo ThinkPad P40 Yoga 20GQ-000EUS | |
| 3DMark 11 Performance | 2478 punti | |
| 3DMark Ice Storm Standard Score | 36178 punti | |
| 3DMark Cloud Gate Standard Score | 5986 punti | |
| 3DMark Fire Strike Score | 1387 punti | |
| 3DMark Fire Strike Extreme Score | 695 punti | |
Aiuto | ||
| basso | medio | alto | ultra | |
|---|---|---|---|---|
| StarCraft II: Heart of the Swarm (2013) | 217.5 | 93.6 | 48.7 | 24.2 |
| Overwatch (2016) | 49.1 | 28.3 | 22.2 |
Rumorosità
| Idle |
| 28.7 / 28.7 / 28.7 dB(A) |
| Sotto carico |
| 30.8 / 35 dB(A) |
 | ||
30 dB silenzioso 40 dB(A) udibile 50 dB(A) rumoroso |
||
min: | ||
| Lenovo ThinkPad P40 Yoga 20GQ-000EUS Quadro M500M, 6600U, Samsung SSD PM871 MZ7LN512HCHP | Lenovo ThinkPad P40 Yoga 20GQ0004PB Quadro M500M, 6500U, Samsung SSD 850 PRO 512GB | HP EliteBook Folio 1040 G3 HD Graphics 520, 6300U, Samsung SM951 MZVPV256HDGL m.2 PCI-e | Lenovo ThinkPad Yoga 460-20EM000QGE HD Graphics 520, 6200U, Liteonit LCH-256V2S | Dell Latitude 14 7000 Series E7470 HD Graphics 520, 6600U, Samsung SSD PM851 M.2 2280 256GB | |
|---|---|---|---|---|---|
| Noise | -6% | -3% | 0% | -5% | |
| off /ambiente * (dB) | 28.7 | 29.1 -1% | 28.9 -1% | 31.2 -9% | |
| Idle Minimum * (dB) | 28.7 | 30 -5% | 29.1 -1% | 28.9 -1% | 31.2 -9% |
| Idle Average * (dB) | 28.7 | 30 -5% | 29.1 -1% | 28.9 -1% | 31.2 -9% |
| Idle Maximum * (dB) | 28.7 | 30 -5% | 29.1 -1% | 28.9 -1% | 31.2 -9% |
| Load Average * (dB) | 30.8 | 35.5 -15% | 32.6 -6% | 31.1 -1% | 31.9 -4% |
| Load Maximum * (dB) | 35 | 35.5 -1% | 37.8 -8% | 32.5 7% | 31.9 9% |
* ... Meglio usare valori piccoli
(-) La temperatura massima sul lato superiore è di 46.4 °C / 116 F, rispetto alla media di 38.2 °C / 101 F, che varia da 22.2 a 69.8 °C per questa classe Workstation.
(-) Il lato inferiore si riscalda fino ad un massimo di 58.8 °C / 138 F, rispetto alla media di 41.1 °C / 106 F
(+) In idle, la temperatura media del lato superiore è di 25.2 °C / 77 F, rispetto alla media deld ispositivo di 32 °C / 90 F.
(+) I poggiapolsi e il touchpad raggiungono la temperatura massima della pelle (32.4 °C / 90.3 F) e quindi non sono caldi.
(-) La temperatura media della zona del palmo della mano di dispositivi simili e'stata di 27.8 °C / 82 F (-4.6 °C / -8.3 F).
| Off / Standby | |
| Idle | |
| Sotto carico |
|
Leggenda:
min: | |
| Lenovo ThinkPad P40 Yoga 20GQ-000EUS 6600U, Quadro M500M, Samsung SSD PM871 MZ7LN512HCHP, IPS, 2560x1440, 14.1" | Lenovo ThinkPad P40 Yoga 20GQ0004PB 6500U, Quadro M500M, Samsung SSD 850 PRO 512GB, IPS, 1920x1080, 14" | HP EliteBook Folio 1040 G3 6300U, HD Graphics 520, Samsung SM951 MZVPV256HDGL m.2 PCI-e, IPS, 2560x1440, 14" | Lenovo ThinkPad Yoga 460-20EM000QGE 6200U, HD Graphics 520, Liteonit LCH-256V2S, a-Si TFT-LCD, IPS, LED, 1920x1080, 14" | Dell Latitude 14 7000 Series E7470 6600U, HD Graphics 520, Samsung SSD PM851 M.2 2280 256GB, IPS, 2560x1440, 14" | |
|---|---|---|---|---|---|
| Power Consumption | -15% | -12% | 21% | 2% | |
| Idle Minimum * (Watt) | 5 | 3.4 32% | 6.3 -26% | 3.6 28% | 5.1 -2% |
| Idle Average * (Watt) | 8 | 8.2 -2% | 9.4 -18% | 6.9 14% | 8.5 -6% |
| Idle Maximum * (Watt) | 8.4 | 18.3 -118% | 10.1 -20% | 7.6 10% | 10.1 -20% |
| Load Average * (Watt) | 34.4 | 37.7 -10% | 33.3 3% | 28 19% | 35.2 -2% |
| Load Maximum * (Watt) | 50 | 39.5 21% | 49.5 1% | 34.2 32% | 31 38% |
* ... Meglio usare valori piccoli
| Lenovo ThinkPad P40 Yoga 20GQ-000EUS 6600U, Quadro M500M, 53 Wh | Lenovo ThinkPad P40 Yoga 20GQ-0004GE 6500U, Quadro M500M, 53 Wh | HP EliteBook Folio 1040 G3 6300U, HD Graphics 520, 45.6 Wh | Lenovo ThinkPad Yoga 460-20EM000QGE 6200U, HD Graphics 520, 53 Wh | Dell Latitude 14 7000 Series E7470 6600U, HD Graphics 520, 55 Wh | |
|---|---|---|---|---|---|
| Autonomia della batteria | 9% | 4% | 29% | 17% | |
| Reader / Idle (h) | 12.7 | 12.1 -5% | 8.8 -31% | 11.2 -12% | |
| WiFi v1.3 (h) | 6 | 5.3 -12% | 5.2 -13% | 7.6 27% | 5.8 -3% |
| Load (h) | 1.4 | 2 43% | 2.2 57% | 2.4 71% | 1.9 36% |
Pro
Contro
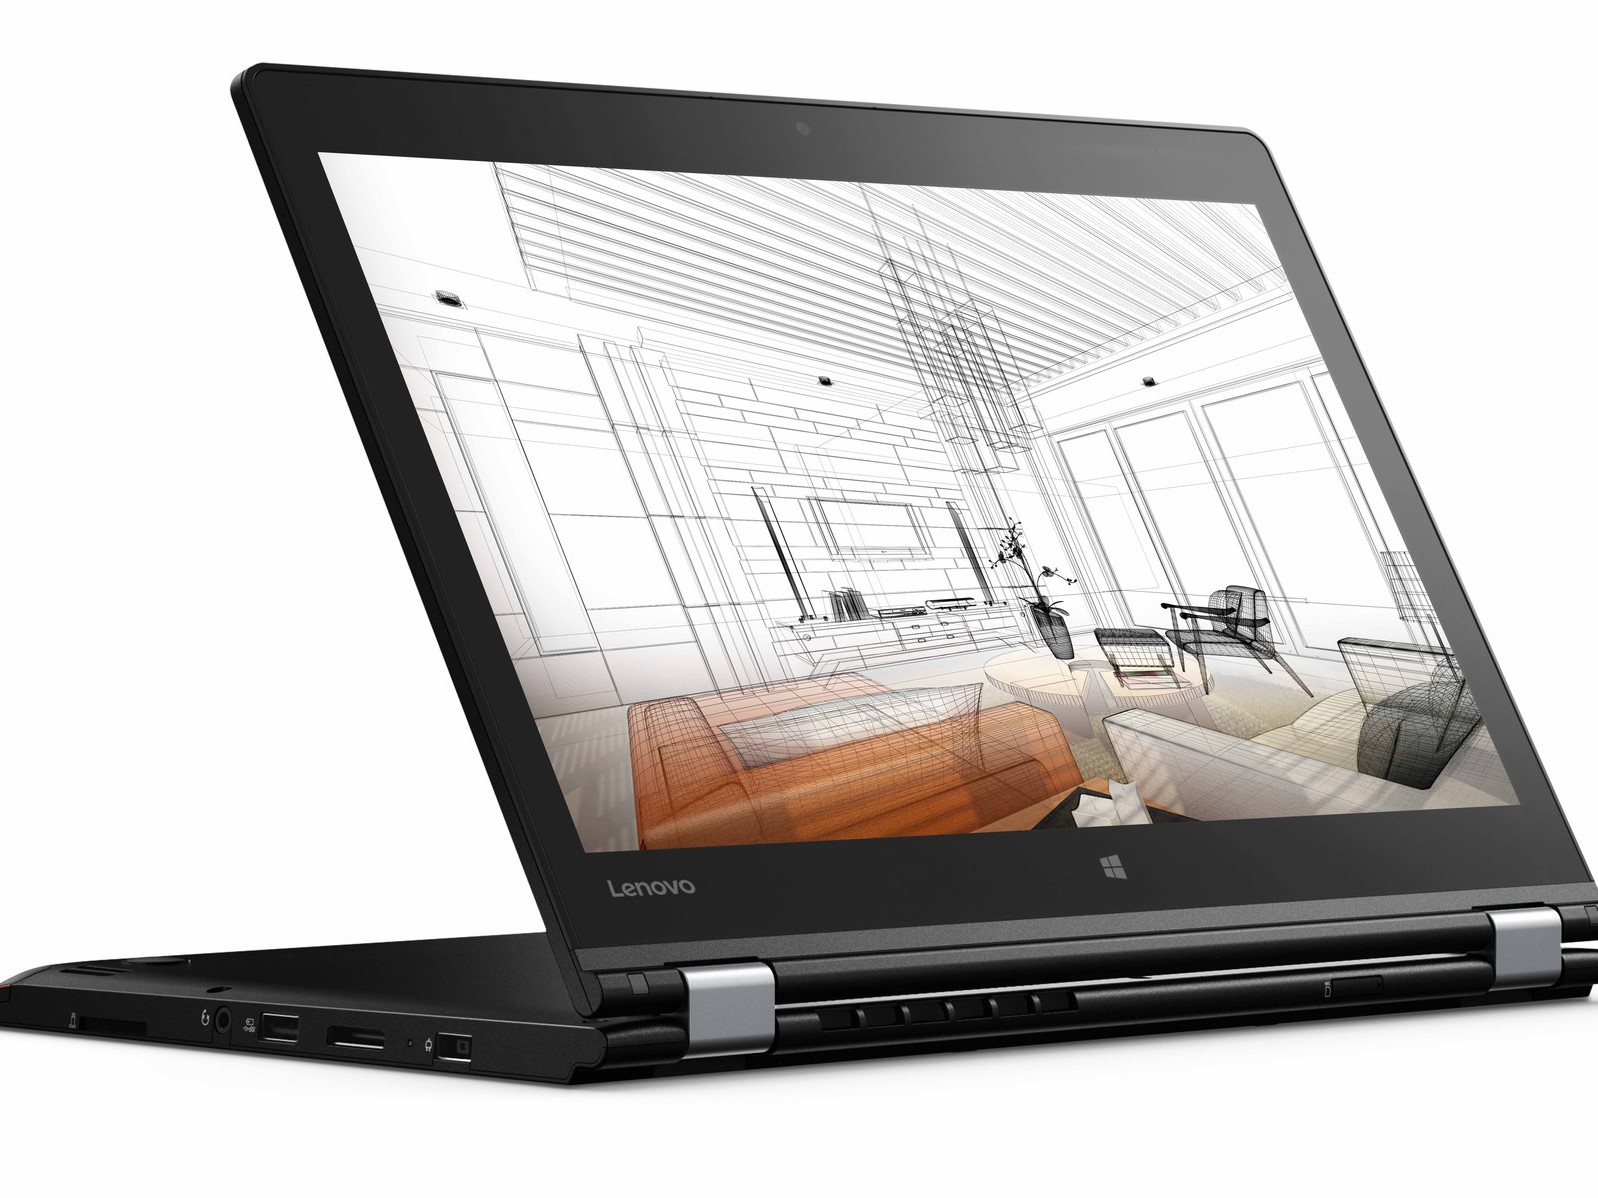
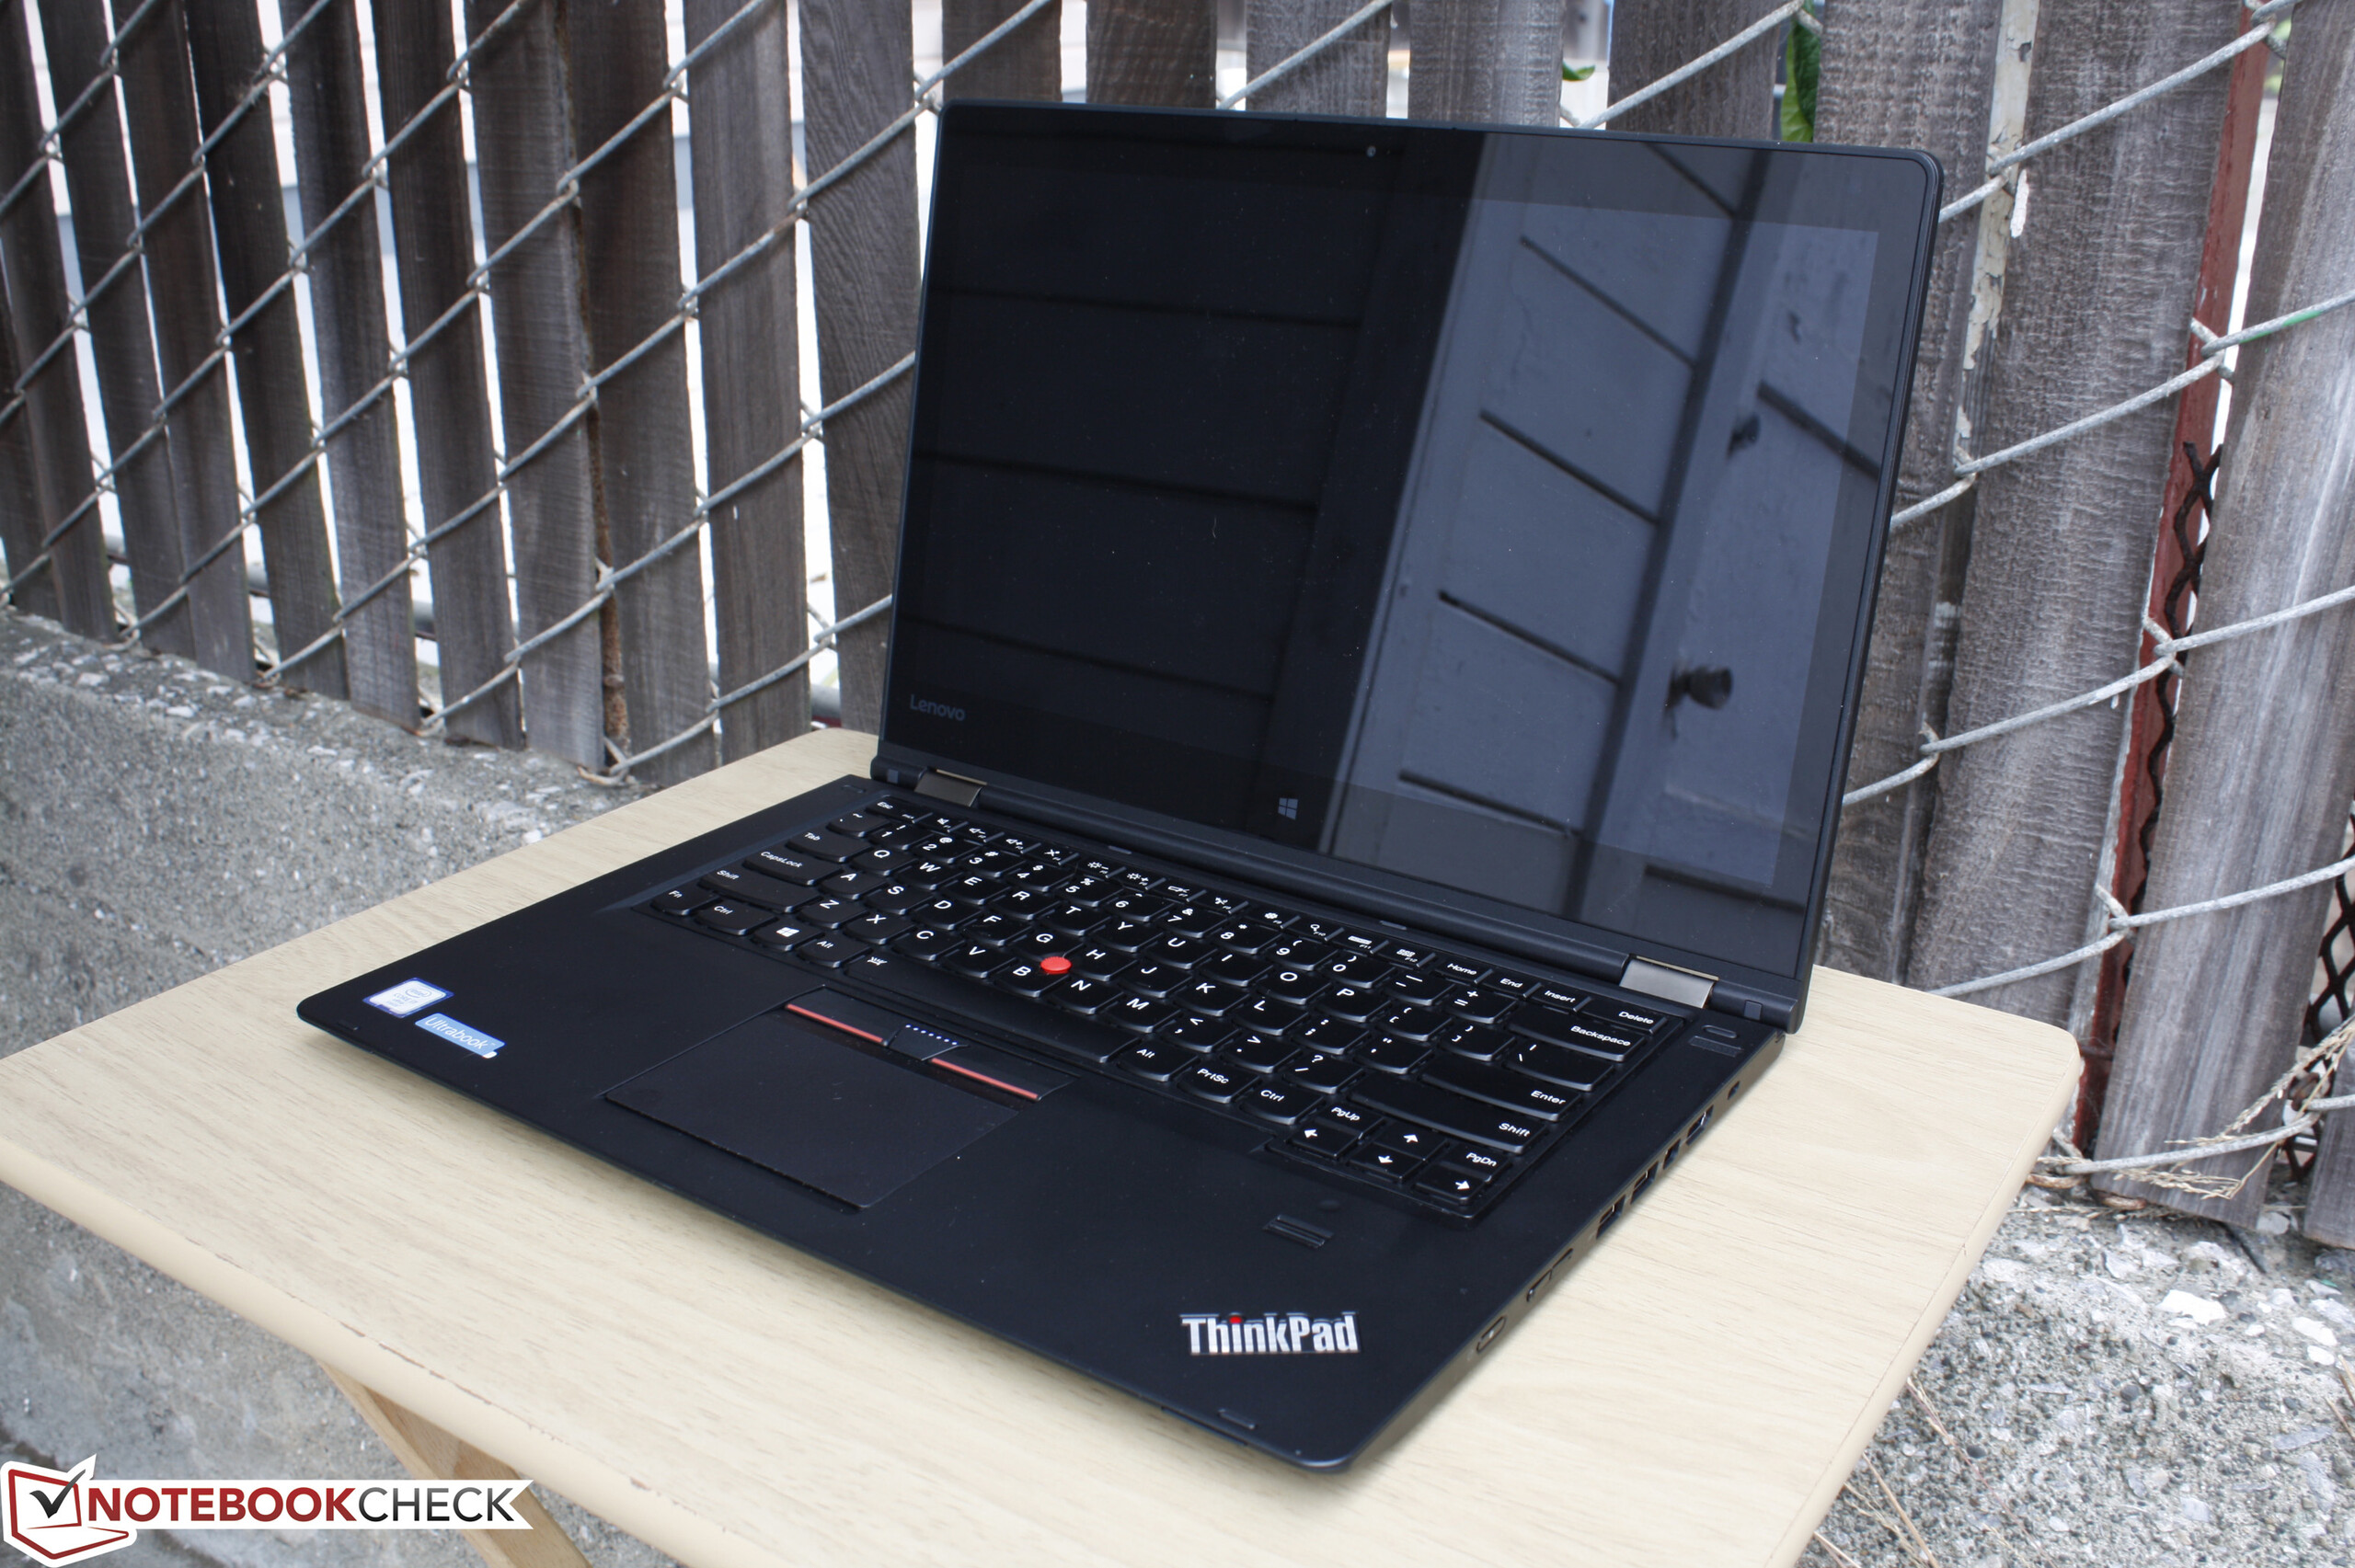
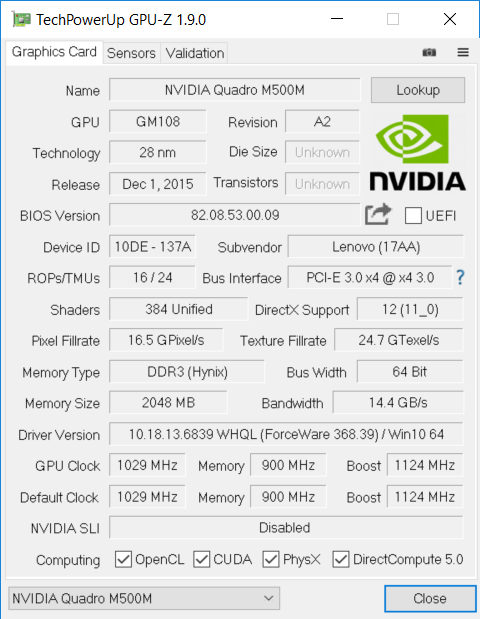
Come spiegato nella nostra prima recensione del ThinkPad P40 Yoga, il sistema punta a un piccolo audience di utenti di workstation leggere e artisti digitali che vogliono anche un touchscreen 2-in-1. Il sistema si colloca tra due categorie quindi: mancano elementi chiave di una workstation il che può deludere gli utenti professionisti mentre la sua versatilità come convertibile è limitata a causa del peso e della luminosità della retroilluminazione media dello schermo. Sarebbe stato un vantaggio poter usare il P40 Yoga all'aperto e quando siete in giro per distinguerlo da una tradizionale workstations, ma lo schermo lucido e l'assenza di qualsiasi opzione WWAN lo rendono impossibile. A meno che non troviate particolarmente attrenti la penna integraa e la entry-level Quadro M500M, allora un "vero" Ultrabook o una workstation mobile forse sono l'opzione migliore.
Lenovo pubblicizza il ThinkPad P40 Yoga come la "prima workstation mobile multi-mode", ma questo convertibile ha ancora tanta strada da fare prima che possa affermarsi in questo arduo doppio ruolo.
Nota: si tratta di una recensione breve, con alcune sezioni non tradotte, per la versione integrale in inglese guardate qui.
Lenovo ThinkPad P40 Yoga 20GQ-000EUS
- 07/21/2016 v5.1 (old)
Allen Ngo
Price comparison
