Recensione breve del Portatile Huawei MateBook D (i7-7500U, GeForce 940MX)
| |||||||||||||||||||||||||
Distribuzione della luminosità: 92 %
Al centro con la batteria: 268 cd/m²
Contrasto: 570:1 (Nero: 0.47 cd/m²)
ΔE ColorChecker Calman: 5.7 | ∀{0.5-29.43 Ø4.73}
ΔE Greyscale Calman: 4.2 | ∀{0.09-98 Ø4.97}
61.5% sRGB (Argyll 1.6.3 3D)
43.2% AdobeRGB 1998 (Argyll 1.6.3 3D)
43.17% AdobeRGB 1998 (Argyll 3D)
61.5% sRGB (Argyll 3D)
41.79% Display P3 (Argyll 3D)
Gamma: 2.3
CCT: 6820 K
| Huawei MateBook D 15, i7-7500U 940MX BOE070C, IPS, 15.6", 1920x1080 | Asus VivoBook S15 S510UA ID: LGD0573, Name: LG Display LP156WF9-SPK2, IPS, 15.6", 1920x1080 | HP Envy 15-as133cl Chi Mei CMN15D8, IPS, 15.6", 1920x1080 | Dell XPS 15 9560 (i7-7700HQ, UHD) IGZO IPS, 15.6", 3840x2160 | Lenovo ThinkPad T570-20H90002GE N156HCA-EAA, IPS, 15.6", 1920x1080 | |
|---|---|---|---|---|---|
| Display | -4% | 4% | 103% | 6% | |
| Display P3 Coverage (%) | 41.79 | 39.9 -5% | 42.95 3% | 89.7 115% | 44.08 5% |
| sRGB Coverage (%) | 61.5 | 59.5 -3% | 64.3 5% | 100 63% | 65.6 7% |
| AdobeRGB 1998 Coverage (%) | 43.17 | 41.11 -5% | 44.41 3% | 100 132% | 45.66 6% |
| Response Times | 23% | 11% | -15% | 27% | |
| Response Time Grey 50% / Grey 80% * (ms) | 46.4 ? | 38.4 ? 17% | 44.4 ? 4% | 57.2 ? -23% | 41.6 ? 10% |
| Response Time Black / White * (ms) | 36.8 ? | 26.4 ? 28% | 30 ? 18% | 39.2 ? -7% | 20.8 ? 43% |
| PWM Frequency (Hz) | 21190 | 1000 ? | 962 | 26040 ? | |
| Screen | 13% | 16% | 39% | 22% | |
| Brightness middle (cd/m²) | 268 | 277.5 4% | 262.3 -2% | 370.1 38% | 262 -2% |
| Brightness (cd/m²) | 258 | 265 3% | 240 -7% | 356 38% | 245 -5% |
| Brightness Distribution (%) | 92 | 89 -3% | 83 -10% | 87 -5% | 89 -3% |
| Black Level * (cd/m²) | 0.47 | 0.35 26% | 0.24 49% | 0.37 21% | 0.24 49% |
| Contrast (:1) | 570 | 793 39% | 1093 92% | 1000 75% | 1092 92% |
| Colorchecker dE 2000 * | 5.7 | 4.8 16% | 5 12% | 5.3 7% | 4.5 21% |
| Colorchecker dE 2000 max. * | 21.7 | 17.8 18% | 20.6 5% | 9.9 54% | 10.5 52% |
| Greyscale dE 2000 * | 4.2 | 3 29% | 3.2 24% | 4.6 -10% | 3.5 17% |
| Gamma | 2.3 96% | 2.39 92% | 2.45 90% | 2.31 95% | 2.32 95% |
| CCT | 6820 95% | 6854 95% | 6817 95% | 6284 103% | 6524 100% |
| Color Space (Percent of AdobeRGB 1998) (%) | 43.2 | 37.7 -13% | 40.5 -6% | 88.3 104% | 42.04 -3% |
| Color Space (Percent of sRGB) (%) | 61.5 | 69.3 13% | 63.5 3% | 100 63% | 65.4 6% |
| Media totale (Programma / Settaggio) | 11% /
11% | 10% /
13% | 42% /
44% | 18% /
20% |
* ... Meglio usare valori piccoli
Tempi di risposta del Display
| ↔ Tempi di risposta dal Nero al Bianco | ||
|---|---|---|
| 36.8 ms ... aumenta ↗ e diminuisce ↘ combinato | ↗ 22.4 ms Incremento | 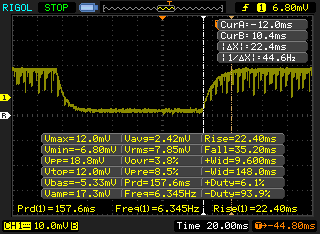 |
| ↘ 14.4 ms Calo | ||
| Lo schermo mostra tempi di risposta lenti nei nostri tests e sarà insoddisfacente per i gamers. In confronto, tutti i dispositivi di test variano da 0.1 (minimo) a 240 (massimo) ms. » 95 % di tutti i dispositivi è migliore. Questo significa che i tempi di risposta rilevati sono peggiori rispetto alla media di tutti i dispositivi testati (19.9 ms). | ||
| ↔ Tempo di risposta dal 50% Grigio all'80% Grigio | ||
| 46.4 ms ... aumenta ↗ e diminuisce ↘ combinato | ↗ 23.2 ms Incremento | 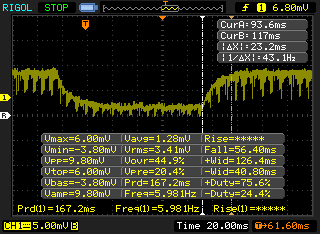 |
| ↘ 23.2 ms Calo | ||
| Lo schermo mostra tempi di risposta lenti nei nostri tests e sarà insoddisfacente per i gamers. In confronto, tutti i dispositivi di test variano da 0.165 (minimo) a 636 (massimo) ms. » 80 % di tutti i dispositivi è migliore. Questo significa che i tempi di risposta rilevati sono peggiori rispetto alla media di tutti i dispositivi testati (31.1 ms). | ||
Sfarfallio dello schermo / PWM (Pulse-Width Modulation)
| flickering dello schermo / PWM rilevato | 21190 Hz | 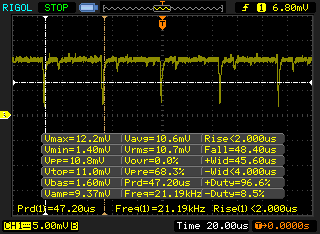 | |
Il display sfarfalla a 21190 Hz (Probabilmente a causa dell'uso di PWM) . La frequenza di 21190 Hz è abbastanza alta, quindi la maggioranza degli utenti sensibili al PWM non dovrebbero notare alcun flickering. In confronto: 52 % di tutti i dispositivi testati non utilizza PWM per ridurre la luminosita' del display. Se è rilevato PWM, una media di 7794 (minimo: 5 - massimo: 343500) Hz è stata rilevata. | |||
| wPrime 2.10 - 1024m | |
| Huawei MateBook D 15, i7-7500U 940MX | |
| Asus VivoBook S15 S510UA | |
| HP Envy 15-as133cl | |
| Dell XPS 15 9560 (i7-7700HQ, UHD) | |
* ... Meglio usare valori piccoli
| PCMark 8 Home Score Accelerated v2 | 3721 punti | |
| PCMark 8 Creative Score Accelerated v2 | 4615 punti | |
| PCMark 8 Work Score Accelerated v2 | 4860 punti | |
| PCMark 10 Score | 3081 punti | |
Aiuto | ||
| Huawei MateBook D 15, i7-7500U 940MX SanDisk SD8SN8U128G1027 | Asus VivoBook S15 S510UA Toshiba HG6 THNSNJ128G8NY | HP Envy 15-as133cl HGST Travelstar 5K1000 HTS541010A7E630 | Dell XPS 15 9560 (i7-7700HQ, UHD) Lite-On CX2-8B512-Q11 | Lenovo ThinkPad T570-20H90002GE Samsung PM961 MZVLW256HEHP | Acer TravelMate P658-G2-MG-7327 Liteonit CV3-8D512 | |
|---|---|---|---|---|---|---|
| CrystalDiskMark 3.0 | 3% | -88% | 195% | 175% | 6% | |
| Write 4k QD32 (MB/s) | 123.2 | 94.3 -23% | 1.015 -99% | 398.1 223% | 426.4 246% | 248.8 102% |
| Read 4k QD32 (MB/s) | 368.5 | 250.3 -32% | 0.828 -100% | 509 38% | 510 38% | 354.8 -4% |
| Write 4k (MB/s) | 82.7 | 64.6 -22% | 1.008 -99% | 134.1 62% | 130.6 58% | 68.8 -17% |
| Read 4k (MB/s) | 36.84 | 19.48 -47% | 0.366 -99% | 45.14 23% | 56.6 54% | 25.74 -30% |
| Write 512 (MB/s) | 181.4 | 342 89% | 46.3 -74% | 1119 517% | 860 374% | 246.3 36% |
| Read 512 (MB/s) | 331.2 | 417.7 26% | 31.46 -91% | 977 195% | 933 182% | 227.1 -31% |
| Write Seq (MB/s) | 314.9 | 396 26% | 102.6 -67% | 1106 251% | 1166 270% | 256.9 -18% |
| Read Seq (MB/s) | 478.4 | 503 5% | 103.2 -78% | 1684 252% | 1318 176% | 526 10% |

| 3DMark 11 Performance | 3072 punti | |
| 3DMark Cloud Gate Standard Score | 8715 punti | |
| 3DMark Fire Strike Score | 2189 punti | |
Aiuto | ||
| Rise of the Tomb Raider | |
| 1920x1080 Very High Preset AA:FX AF:16x (ordina per valore) | |
| Huawei MateBook D 15, i7-7500U 940MX | |
| Dell XPS 15 9560 (i7-7700HQ, UHD) | |
| HP Spectre x360 15-bl002xx | |
| 1920x1080 High Preset AA:FX AF:4x (ordina per valore) | |
| Huawei MateBook D 15, i7-7500U 940MX | |
| Dell XPS 15 9560 (i7-7700HQ, UHD) | |
| HP Spectre x360 15-bl002xx | |
| 1366x768 Medium Preset AF:2x (ordina per valore) | |
| Huawei MateBook D 15, i7-7500U 940MX | |
| HP Envy 15-as133cl | |
| Dell XPS 15 9560 (i7-7700HQ, UHD) | |
| HP Spectre x360 15-bl002xx | |
| 1024x768 Lowest Preset (ordina per valore) | |
| Huawei MateBook D 15, i7-7500U 940MX | |
| HP Envy 15-as133cl | |
| Lenovo ThinkPad T570-20H90002GE | |
| HP Spectre x360 15-bl002xx | |
| basso | medio | alto | ultra | |
|---|---|---|---|---|
| Hitman: Absolution (2012) | 53 | 42 | 27.2 | 12.5 |
| BioShock Infinite (2013) | 101.6 | 64.5 | 54.4 | 23.4 |
| The Witcher 3 (2015) | 35.3 | 23.6 | 14 | 7.1 |
| Rise of the Tomb Raider (2016) | 29 | 26 | 13.9 | 11.6 |
Rumorosità
| Idle |
| 30 / 30.2 / 30.2 dB(A) |
| Sotto carico |
| 39 / 39 dB(A) |
 | ||
30 dB silenzioso 40 dB(A) udibile 50 dB(A) rumoroso |
||
min: | ||
| Huawei MateBook D 15, i7-7500U 940MX GeForce 940MX, i7-7500U, SanDisk SD8SN8U128G1027 | Asus VivoBook S15 S510UA HD Graphics 620, i5-7200U, Toshiba HG6 THNSNJ128G8NY | HP Envy 15-as133cl HD Graphics 620, i7-7500U, HGST Travelstar 5K1000 HTS541010A7E630 | Lenovo ThinkPad T570-20H90002GE HD Graphics 620, i5-7200U, Samsung PM961 MZVLW256HEHP | Acer TravelMate P658-G2-MG-7327 GeForce 940MX, i7-7500U, Liteonit CV3-8D512 | HP Spectre x360 15-bl002xx GeForce 940MX, i7-7500U, Toshiba XG4 NVMe (THNSN5512GPUK) | |
|---|---|---|---|---|---|---|
| Noise | 2% | -2% | 2% | 1% | -4% | |
| off /ambiente * (dB) | 28.8 | 28.2 2% | 30 -4% | 29.3 -2% | 30 -4% | 28.5 1% |
| Idle Minimum * (dB) | 30 | 30.2 -1% | 32.5 -8% | 29.3 2% | 30 -0% | 28.5 5% |
| Idle Average * (dB) | 30.2 | 30.2 -0% | 32.5 -8% | 29.3 3% | 30 1% | 28.5 6% |
| Idle Maximum * (dB) | 30.2 | 30.2 -0% | 32.5 -8% | 31.2 -3% | 30 1% | 36.3 -20% |
| Load Average * (dB) | 39 | 36.9 5% | 38.7 1% | 35.1 10% | 37.3 4% | 42.7 -9% |
| Witcher 3 ultra * (dB) | 38.7 | |||||
| Load Maximum * (dB) | 39 | 37 5% | 32.5 17% | 38.7 1% | 38 3% | 42.7 -9% |
* ... Meglio usare valori piccoli
(±) La temperatura massima sul lato superiore è di 44.8 °C / 113 F, rispetto alla media di 34.3 °C / 94 F, che varia da 21.2 a 62.5 °C per questa classe Office.
(-) Il lato inferiore si riscalda fino ad un massimo di 50.4 °C / 123 F, rispetto alla media di 36.8 °C / 98 F
(+) In idle, la temperatura media del lato superiore è di 28 °C / 82 F, rispetto alla media deld ispositivo di 29.5 °C / 85 F.
(±) Riproducendo The Witcher 3, la temperatura media per il lato superiore e' di 35.2 °C / 95 F, rispetto alla media del dispositivo di 29.5 °C / 85 F.
(+) I poggiapolsi e il touchpad raggiungono la temperatura massima della pelle (34 °C / 93.2 F) e quindi non sono caldi.
(-) La temperatura media della zona del palmo della mano di dispositivi simili e'stata di 27.5 °C / 81.5 F (-6.5 °C / -11.7 F).
Huawei MateBook D 15, i7-7500U 940MX analisi audio
(±) | potenza degli altiparlanti media ma buona (76.3 dB)
Bassi 100 - 315 Hz
(±) | bassi ridotti - in media 11.9% inferiori alla media
(±) | la linearità dei bassi è media (14.9% delta rispetto alla precedente frequenza)
Medi 400 - 2000 Hz
(±) | medi elevati - circa 8.9% superiore alla media
(±) | linearità dei medi adeguata (10.8% delta rispetto alla precedente frequenza)
Alti 2 - 16 kHz
(+) | Alti bilanciati - appena 1.3% dalla media
(+) | alti lineari (4.1% delta rispetto alla precedente frequenza)
Nel complesso 100 - 16.000 Hz
(±) | la linearità complessiva del suono è media (25.5% di differenza rispetto alla media
Rispetto alla stessa classe
» 78% di tutti i dispositivi testati in questa classe è stato migliore, 6% simile, 16% peggiore
» Il migliore ha avuto un delta di 7%, medio di 21%, peggiore di 53%
Rispetto a tutti i dispositivi testati
» 78% di tutti i dispositivi testati in questa classe è stato migliore, 4% similare, 17% peggiore
» Il migliore ha avuto un delta di 4%, medio di 24%, peggiore di 134%
Apple MacBook 12 (Early 2016) 1.1 GHz analisi audio
(+) | gli altoparlanti sono relativamente potenti (83.6 dB)
Bassi 100 - 315 Hz
(±) | bassi ridotti - in media 11.3% inferiori alla media
(±) | la linearità dei bassi è media (14.2% delta rispetto alla precedente frequenza)
Medi 400 - 2000 Hz
(+) | medi bilanciati - solo only 2.4% rispetto alla media
(+) | medi lineari (5.5% delta rispetto alla precedente frequenza)
Alti 2 - 16 kHz
(+) | Alti bilanciati - appena 2% dalla media
(+) | alti lineari (4.5% delta rispetto alla precedente frequenza)
Nel complesso 100 - 16.000 Hz
(+) | suono nel complesso lineare (10.2% differenza dalla media)
Rispetto alla stessa classe
» 7% di tutti i dispositivi testati in questa classe è stato migliore, 2% simile, 91% peggiore
» Il migliore ha avuto un delta di 5%, medio di 18%, peggiore di 53%
Rispetto a tutti i dispositivi testati
» 5% di tutti i dispositivi testati in questa classe è stato migliore, 1% similare, 94% peggiore
» Il migliore ha avuto un delta di 4%, medio di 24%, peggiore di 134%
| Off / Standby | |
| Idle | |
| Sotto carico |
|
Leggenda:
min: | |
| Huawei MateBook D 15, i7-7500U 940MX i7-7500U, GeForce 940MX, SanDisk SD8SN8U128G1027, IPS, 1920x1080, 15.6" | Asus VivoBook S15 S510UA i5-7200U, HD Graphics 620, Toshiba HG6 THNSNJ128G8NY, IPS, 1920x1080, 15.6" | HP Envy 15-as133cl i7-7500U, HD Graphics 620, HGST Travelstar 5K1000 HTS541010A7E630, IPS, 1920x1080, 15.6" | Lenovo ThinkPad T570-20H90002GE i5-7200U, HD Graphics 620, Samsung PM961 MZVLW256HEHP, IPS, 1920x1080, 15.6" | Acer TravelMate P658-G2-MG-7327 i7-7500U, GeForce 940MX, Liteonit CV3-8D512, IPS, 1920x1080, 15.6" | HP Spectre x360 15-bl002xx i7-7500U, GeForce 940MX, Toshiba XG4 NVMe (THNSN5512GPUK), IPS, 3840x2160, 15.6" | |
|---|---|---|---|---|---|---|
| Power Consumption | 17% | 25% | 17% | -6% | -37% | |
| Idle Minimum * (Watt) | 5.14 | 4.6 11% | 4.6 11% | 3.6 30% | 3.9 24% | 8.14 -58% |
| Idle Average * (Watt) | 9.07 | 7.6 16% | 7.7 15% | 7.7 15% | 7.9 13% | 10.91 -20% |
| Idle Maximum * (Watt) | 9.33 | 7.7 17% | 7.8 16% | 8.2 12% | 11.3 -21% | 12.26 -31% |
| Load Average * (Watt) | 46.76 | 35.1 25% | 30.5 35% | 30.8 34% | 47 -1% | 45.67 2% |
| Witcher 3 ultra * (Watt) | 40.18 | |||||
| Load Maximum * (Watt) | 42.59 | 36.2 15% | 22.7 47% | 46.1 -8% | 62 -46% | 74.94 -76% |
* ... Meglio usare valori piccoli
| Huawei MateBook D 15, i7-7500U 940MX i7-7500U, GeForce 940MX, 43.3 Wh | Asus VivoBook S15 S510UA i5-7200U, HD Graphics 620, 42 Wh | HP Envy 15-as133cl i7-7500U, HD Graphics 620, 52 Wh | Dell XPS 15 9560 (i7-7700HQ, UHD) i7-7700HQ, GeForce GTX 1050 Mobile, 97 Wh | Lenovo ThinkPad T570-20H90002GE i5-7200U, HD Graphics 620, 56 Wh | Acer TravelMate P658-G2-MG-7327 i7-7500U, GeForce 940MX, 55 Wh | HP Spectre x360 15-bl002xx i7-7500U, GeForce 940MX, 79.2 Wh | |
|---|---|---|---|---|---|---|---|
| Autonomia della batteria | -34% | -24% | -3% | 46% | 14% | 22% | |
| Reader / Idle (h) | 15.9 | 10.2 -36% | 9.6 -40% | 13.9 -13% | 19.5 23% | 14.4 -9% | |
| WiFi v1.3 (h) | 7.4 | 4.3 -42% | 6.8 -8% | 7.2 -3% | 7.6 3% | 8.4 14% | 8.9 20% |
| Load (h) | 1.6 | 1.2 -25% | 1.2 -25% | 1.7 6% | 3.4 113% | 2.5 56% |
Pro
Contro
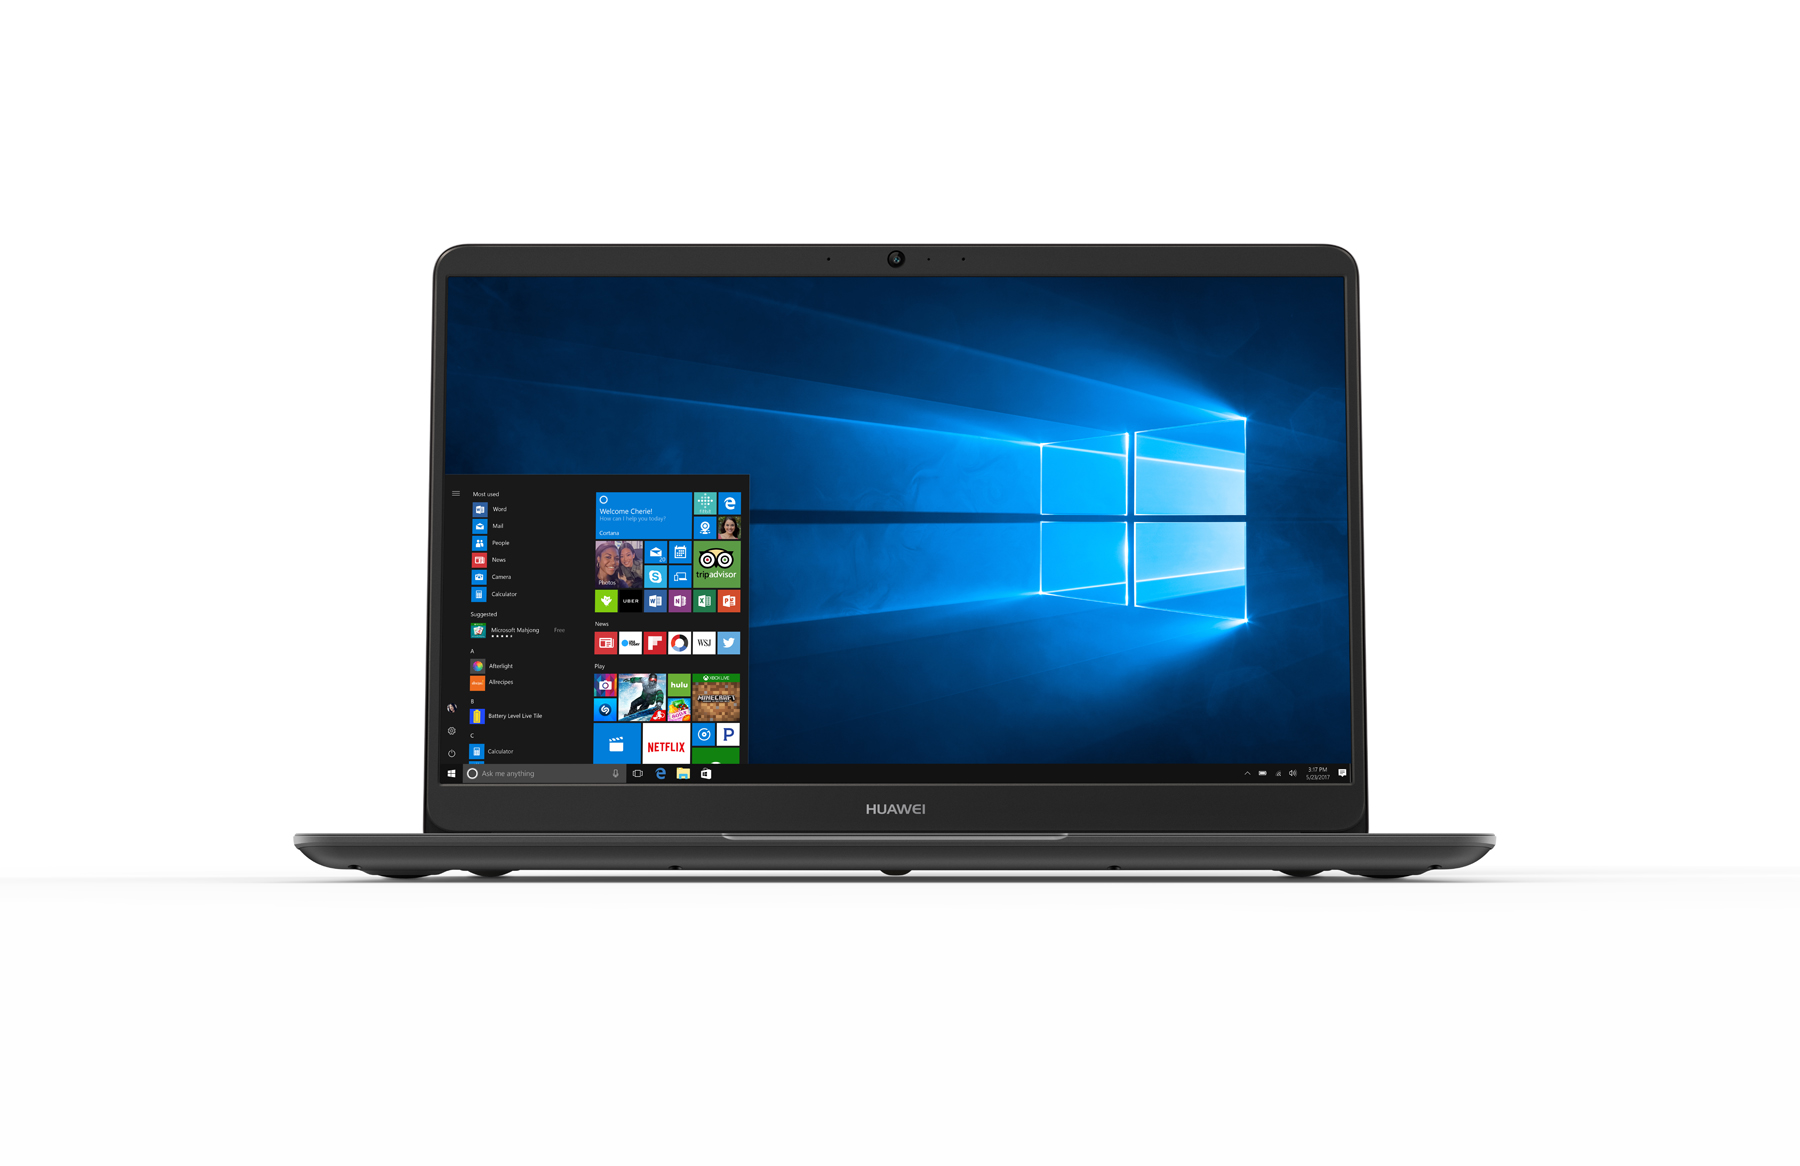
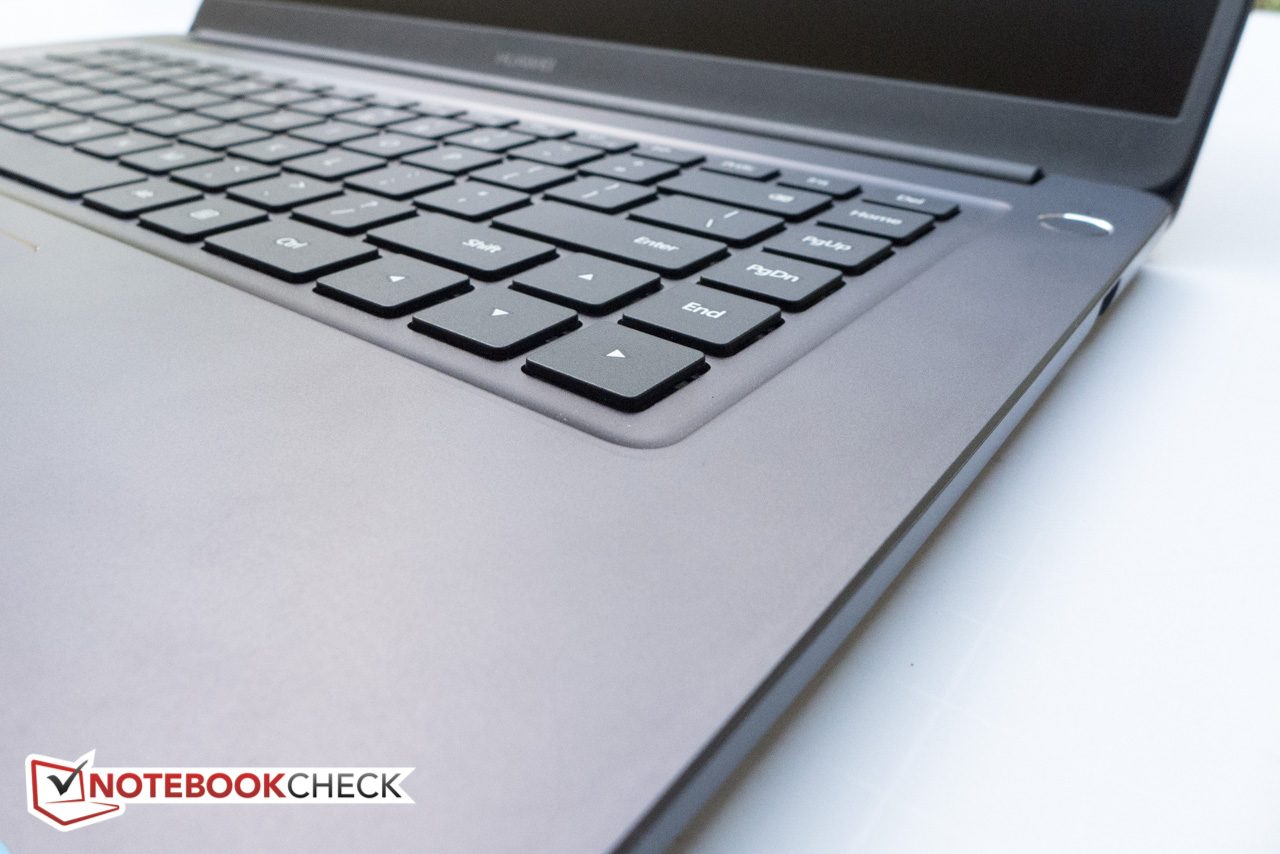
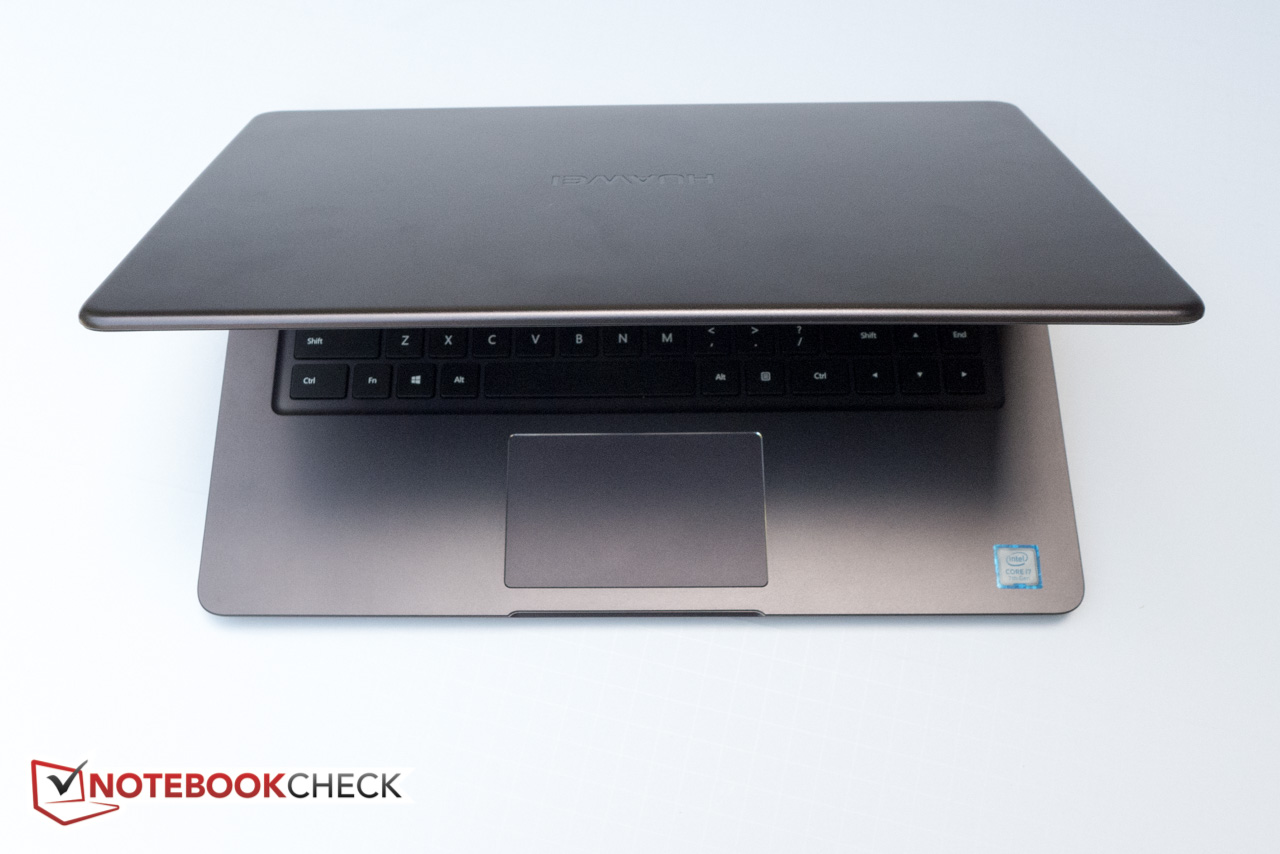
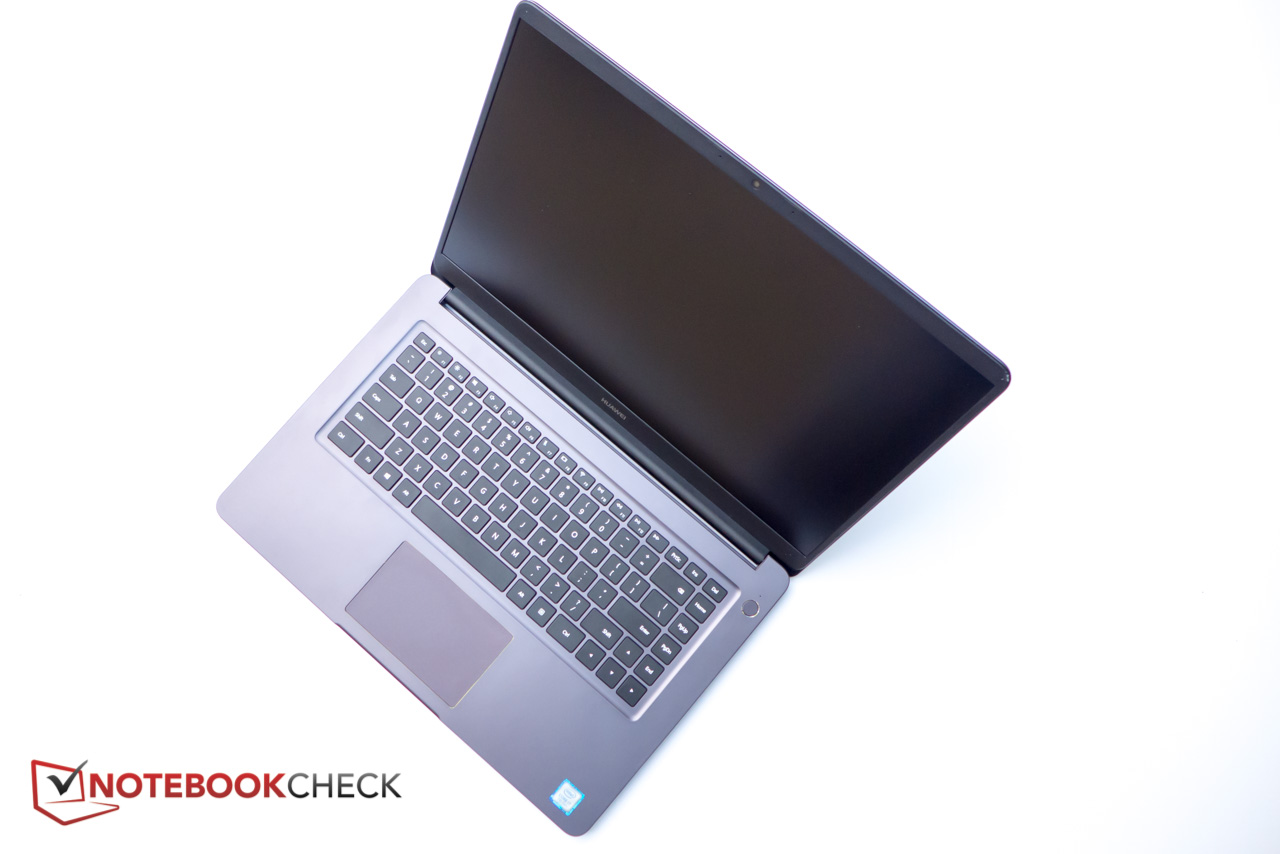
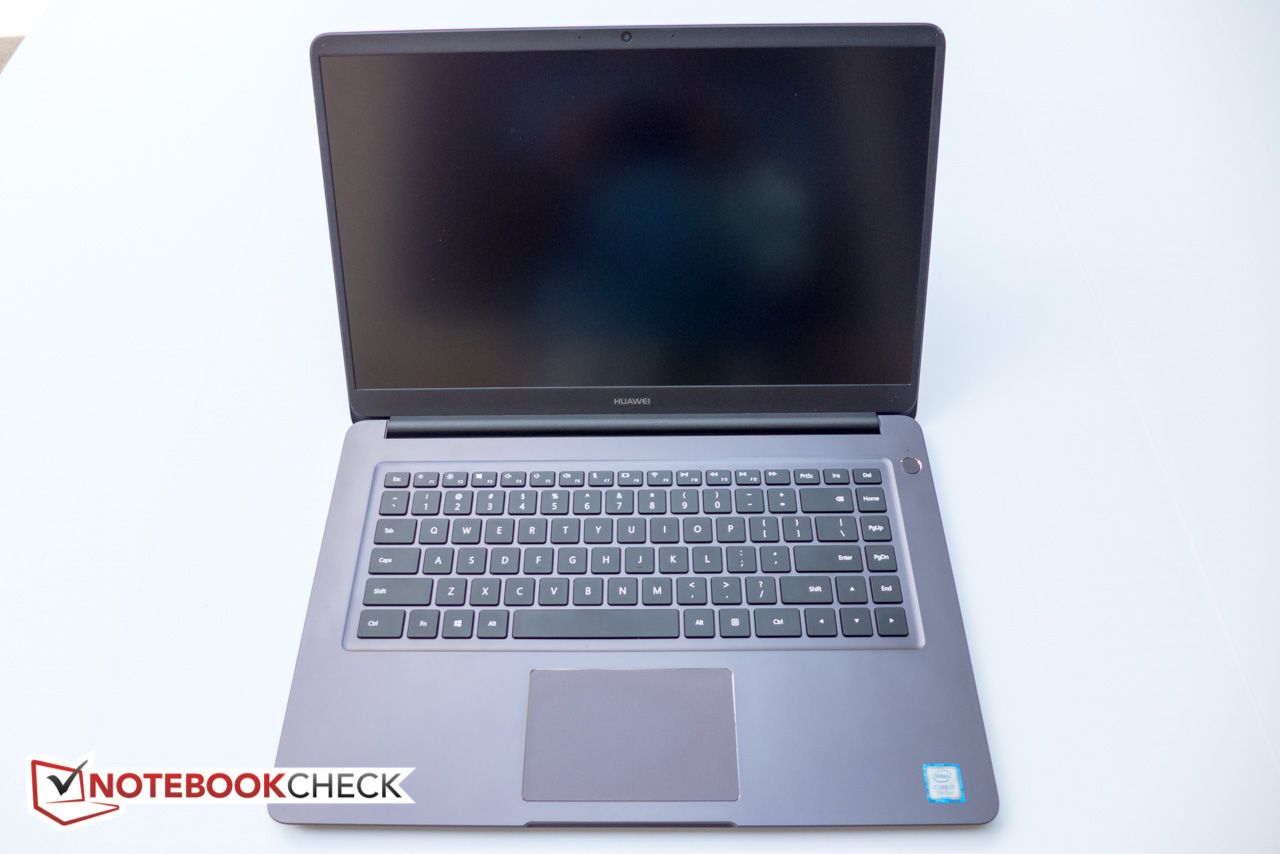
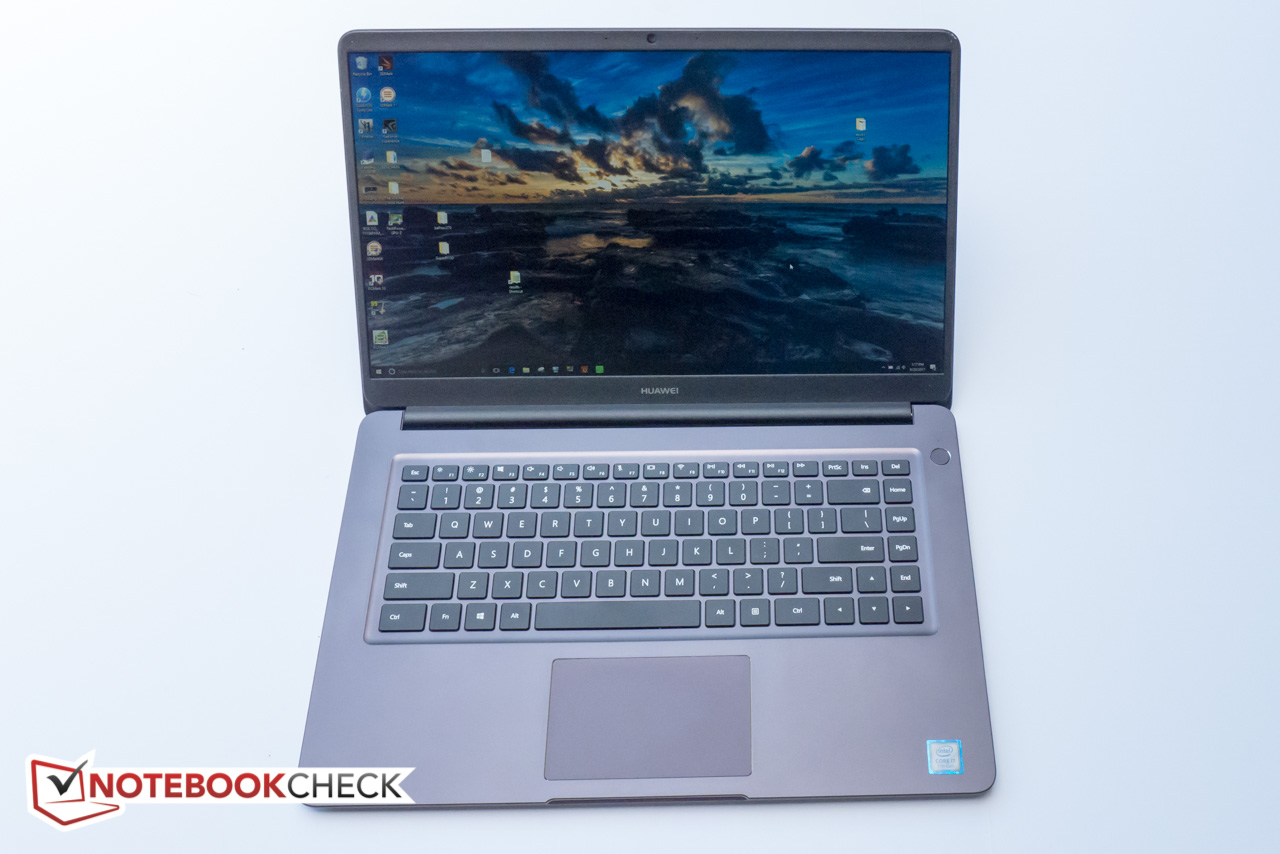
Il MateBook D un un portatile a conchiglia convenzionale con display da 15,6" non-touch che punta sia agli utenti privati che - stando allo slogan Huawei - al settore businesses. Con la base sottile, il design in alluminio ha una dimensione molto piccola e funzionale, è robusto e piacevole. Le prestazioni pratiche sono abbastanza buone grazie alla CPU i7, all'SSD ed alla scheda grafica dedicata sebbene non particolarmente potente. L'autonomia è decente e il display non lucido è abbastanza luminoso per consentire all'utente l'utilizzo all'aperto, almeno occasionalmente.
Il notebook ha due pecche principali: con carichi di lavoro prolungati si evidenzia un throttling della GPU - e le temperature di superficie salgono a livello preoccupante. Huawei deve rivedere le cose o modificare il controllo del sistema di raffreddamento e della ventola. Al momento coloro che vogliono potenza saranno delusi dalle caratteristiche di prestazioni e temperature del MateBook D. L'Huawei MateBook D non ha doti particolari come l'ammiraglia MateBook X.
Poiché il mercato dei tuttofare da 15,6" è molto saturo, potrebbe essere una scelta decente, ma non riesce a dare agli utenti una potenza di calcolo soddisfacente.
Nota: si tratta di una recensione breve, con alcune sezioni non tradotte, per la versione integrale in inglese guardate qui.
Huawei MateBook D 15, i7-7500U 940MX
- 09/26/2017 v6 (old)
Bernie Pechlaner
Price comparison
