Recensione breve del Portatile Dell Vostro 15 5568 (i7-7500U, 940MX)
| SD Card Reader | |
| average JPG Copy Test (av. of 3 runs) | |
| HP Spectre x360 15-bl002xx (Toshiba Exceria Pro SDXC 64 GB UHS-II) | |
| Acer TravelMate P658-G2-MG-7327 (Toshiba Exceria Pro SDXC 64 GB UHS-II) | |
| Lenovo ThinkPad T570-20HAS01E00 (Toshiba Exceria Pro SDXC 64 GB UHS-II) | |
| Dell Vostro 15-5568 (Toshiba Exceria Pro SDXC 64 GB UHS-II) | |
| Dell Vostro 15-5568 (Toshiba Exceria Pro SDXC 64 GB UHS-II) | |
| maximum AS SSD Seq Read Test (1GB) | |
| HP Spectre x360 15-bl002xx (Toshiba Exceria Pro SDXC 64 GB UHS-II) | |
| Lenovo ThinkPad T570-20HAS01E00 (Toshiba Exceria Pro SDXC 64 GB UHS-II) | |
| Acer TravelMate P658-G2-MG-7327 (Toshiba Exceria Pro SDXC 64 GB UHS-II) | |
| Dell Vostro 15-5568 (Toshiba Exceria Pro SDXC 64 GB UHS-II) | |
| Dell Vostro 15-5568 (Toshiba Exceria Pro SDXC 64 GB UHS-II) | |
| |||||||||||||||||||||||||
Distribuzione della luminosità: 86 %
Al centro con la batteria: 242 cd/m²
Contrasto: 556:1 (Nero: 0.43 cd/m²)
ΔE ColorChecker Calman: 10.11 | ∀{0.5-29.43 Ø4.71}
ΔE Greyscale Calman: 10.88 | ∀{0.09-98 Ø4.96}
60% sRGB (Argyll 1.6.3 3D)
38% AdobeRGB 1998 (Argyll 1.6.3 3D)
41.5% AdobeRGB 1998 (Argyll 3D)
60% sRGB (Argyll 3D)
40.14% Display P3 (Argyll 3D)
Gamma: 2.33
CCT: 11924 K
| Dell Vostro 15-5568 Chi Mei CMN15C4, , 1920x1080, 15.6" | HP Spectre x360 15-bl002xx UHD UWVA eDP BrightView WLED-backlit , , 3840x2160, 15.6" | Acer TravelMate P658-G2-MG-7327 LG Philips LP156WF6-SPP1, , 1920x1080, 15.6" | Huawei MateBook D 15, i7-7500U 940MX BOE070C, , 1920x1080, 15.6" | Lenovo ThinkPad T570-20HAS01E00 BOE NV156QUM-N44, , 3840x2160, 15.6" | Dell Vostro 15-5568 Chi Mei CMN154C-8KV42 , , 1920x1080, 15.6" | |
|---|---|---|---|---|---|---|
| Display | 57% | 52% | 3% | 62% | ||
| Display P3 Coverage (%) | 40.14 | 67.9 69% | 64.9 62% | 41.79 4% | 70 74% | |
| sRGB Coverage (%) | 60 | 88.2 47% | 85.9 43% | 61.5 2% | 91.1 52% | |
| AdobeRGB 1998 Coverage (%) | 41.5 | 64.4 55% | 62.8 51% | 43.17 4% | 66.7 61% | |
| Response Times | -83% | -40% | -79% | -1% | -49% | |
| Response Time Grey 50% / Grey 80% * (ms) | 41 ? | 44 ? -7% | 38 ? 7% | 46.4 ? -13% | 41.6 ? -1% | 47.6 ? -16% |
| Response Time Black / White * (ms) | 15 ? | 38.8 ? -159% | 28 ? -87% | 36.8 ? -145% | 15.2 ? -1% | 27.2 ? -81% |
| PWM Frequency (Hz) | 26000 ? | 1000 ? | 21000 ? | 21190 | 926 ? | |
| Screen | 63% | 40% | 13% | 45% | -6% | |
| Brightness middle (cd/m²) | 239 | 351.5 47% | 284 19% | 268 12% | 339 42% | 229 -4% |
| Brightness (cd/m²) | 219 | 336 53% | 276 26% | 258 18% | 314 43% | 222 1% |
| Brightness Distribution (%) | 86 | 83 -3% | 82 -5% | 92 7% | 89 3% | 82 -5% |
| Black Level * (cd/m²) | 0.43 | 0.24 44% | 0.295 31% | 0.47 -9% | 0.36 16% | 0.56 -30% |
| Contrast (:1) | 556 | 1465 163% | 963 73% | 570 3% | 942 69% | 409 -26% |
| Colorchecker dE 2000 * | 10.11 | 3.3 67% | 4.07 60% | 5.7 44% | 4.2 58% | 10.36 -2% |
| Colorchecker dE 2000 max. * | 17.33 | 7.3 58% | 10.52 39% | 21.7 -25% | 7.8 55% | 14.95 14% |
| Greyscale dE 2000 * | 10.88 | 1.9 83% | 3.13 71% | 4.2 61% | 5.1 53% | 10.9 -0% |
| Gamma | 2.33 94% | 2.09 105% | 2.41 91% | 2.3 96% | 2.16 102% | 2.21 100% |
| CCT | 11924 55% | 6784 96% | 7082 92% | 6820 95% | 6569 99% | 10084 64% |
| Color Space (Percent of AdobeRGB 1998) (%) | 38 | 64.4 69% | 56 47% | 43.2 14% | 59.4 56% | 37.69 -1% |
| Color Space (Percent of sRGB) (%) | 60 | 88.2 47% | 86 43% | 61.5 2% | 91 52% | 57.92 -3% |
| Media totale (Programma / Settaggio) | 12% /
42% | 17% /
32% | -21% /
-1% | 35% /
42% | -28% /
-13% |
* ... Meglio usare valori piccoli
Tempi di risposta del Display
| ↔ Tempi di risposta dal Nero al Bianco | ||
|---|---|---|
| 15 ms ... aumenta ↗ e diminuisce ↘ combinato | ↗ 11 ms Incremento | 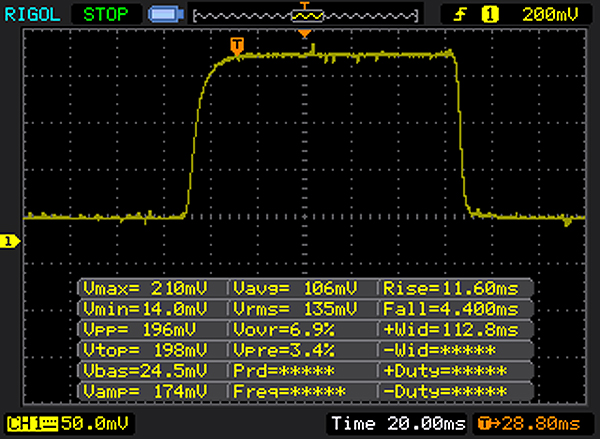 |
| ↘ 4 ms Calo | ||
| Lo schermo mostra buoni tempi di risposta durante i nostri tests, ma potrebbe essere troppo lento per i gamers competitivi. In confronto, tutti i dispositivi di test variano da 0.1 (minimo) a 240 (massimo) ms. » 36 % di tutti i dispositivi è migliore. Questo significa che i tempi di risposta rilevati sono migliori rispettto alla media di tutti i dispositivi testati (19.8 ms). | ||
| ↔ Tempo di risposta dal 50% Grigio all'80% Grigio | ||
| 41 ms ... aumenta ↗ e diminuisce ↘ combinato | ↗ 24 ms Incremento | 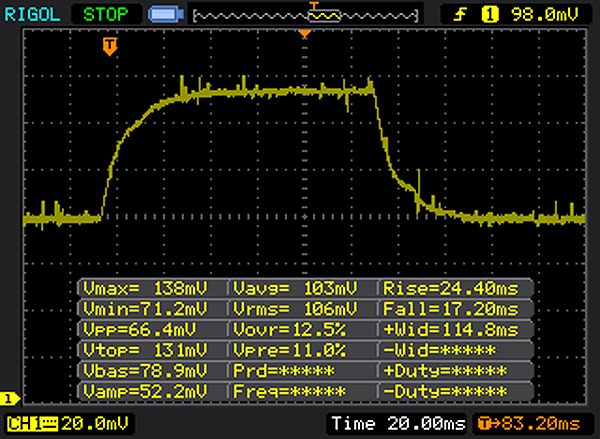 |
| ↘ 17 ms Calo | ||
| Lo schermo mostra tempi di risposta lenti nei nostri tests e sarà insoddisfacente per i gamers. In confronto, tutti i dispositivi di test variano da 0.165 (minimo) a 636 (massimo) ms. » 65 % di tutti i dispositivi è migliore. Questo significa che i tempi di risposta rilevati sono peggiori rispetto alla media di tutti i dispositivi testati (31 ms). | ||
Sfarfallio dello schermo / PWM (Pulse-Width Modulation)
| flickering dello schermo / PWM rilevato | 26000 Hz | ≤ 20 % settaggio luminosita' | 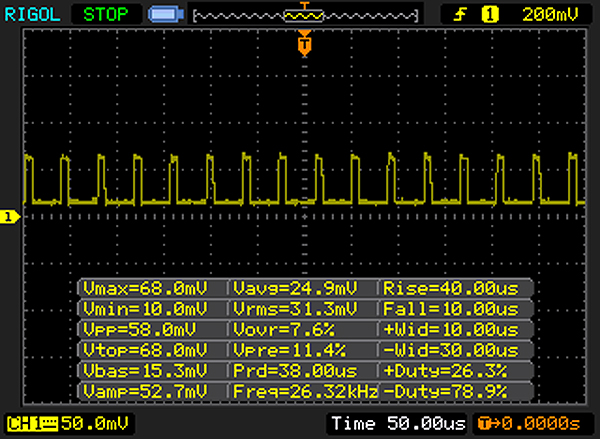 |
Il display sfarfalla a 26000 Hz (Probabilmente a causa dell'uso di PWM) Flickering rilevato ad una luminosita' di 20 % o inferiore. Non dovrebbe verificarsi flickering o PWM sopra questo valore di luminosita'. La frequenza di 26000 Hz è abbastanza alta, quindi la maggioranza degli utenti sensibili al PWM non dovrebbero notare alcun flickering. In confronto: 52 % di tutti i dispositivi testati non utilizza PWM per ridurre la luminosita' del display. Se è rilevato PWM, una media di 7754 (minimo: 5 - massimo: 343500) Hz è stata rilevata. | |||
| PCMark 8 Home Score Accelerated v2 | 3672 punti | |
| PCMark 8 Work Score Accelerated v2 | 4821 punti | |
Aiuto | ||
| Dell Vostro 15-5568 Micron SSD 1100 (MTFDDAV256TBN) | HP Spectre x360 15-bl002xx Toshiba XG4 NVMe (THNSN5512GPUK) | Acer TravelMate P658-G2-MG-7327 Liteonit CV3-8D512 | Huawei MateBook D 15, i7-7500U 940MX SanDisk SD8SN8U128G1027 | Lenovo ThinkPad T570-20HAS01E00 Samsung PM961 NVMe MZVLW512HMJP | Dell Vostro 15-5568 SanDisk X400 256GB, SATA (SD8SB8U-256G) | |
|---|---|---|---|---|---|---|
| CrystalDiskMark 3.0 | 184% | 24% | 24% | 222% | 44% | |
| Read Seq (MB/s) | 476.2 | 1266 166% | 526 10% | 478.4 0% | 1210 154% | 497.8 5% |
| Write Seq (MB/s) | 238.7 | 982 311% | 256.9 8% | 314.9 32% | 1134 375% | 466.8 96% |
| Read 512 (MB/s) | 312.9 | 834 167% | 227.1 -27% | 331.2 6% | 789 152% | 363.4 16% |
| Write 512 (MB/s) | 161.7 | 714 342% | 246.3 52% | 181.4 12% | 903 458% | 368.5 128% |
| Read 4k (MB/s) | 21.87 | 40.72 86% | 25.74 18% | 36.84 68% | 58.4 167% | 29.02 33% |
| Write 4k (MB/s) | 93.6 | 139.4 49% | 68.8 -26% | 82.7 -12% | 144.1 54% | 56 -40% |
| Read 4k QD32 (MB/s) | 172.8 | 527 205% | 354.8 105% | 368.5 113% | 559 223% | 296 71% |
| Write 4k QD32 (MB/s) | 161.2 | 395.2 145% | 248.8 54% | 123.2 -24% | 474.4 194% | 229.4 42% |

| 3DMark 11 - 1280x720 Performance GPU | |
| Huawei MateBook D 15, i7-7500U 940MX | |
| Lenovo ThinkPad T570-20HAS01E00 | |
| Dell Vostro 15-5568 | |
| HP Spectre x360 15-bl002xx | |
| Acer TravelMate P658-G2-MG-7327 | |
| Dell Vostro 15-5568 | |
| 3DMark | |
| 1280x720 Cloud Gate Standard Graphics | |
| Huawei MateBook D 15, i7-7500U 940MX | |
| Lenovo ThinkPad T570-20HAS01E00 | |
| HP Spectre x360 15-bl002xx | |
| Dell Vostro 15-5568 | |
| Dell Vostro 15-5568 | |
| 1920x1080 Fire Strike Graphics | |
| Huawei MateBook D 15, i7-7500U 940MX | |
| Lenovo ThinkPad T570-20HAS01E00 | |
| HP Spectre x360 15-bl002xx | |
| Dell Vostro 15-5568 | |
| Dell Vostro 15-5568 | |
| 3DMark 11 Performance | 2769 punti | |
| 3DMark Cloud Gate Standard Score | 8208 punti | |
| 3DMark Fire Strike Score | 1905 punti | |
Aiuto | ||
| basso | medio | alto | ultra | |
|---|---|---|---|---|
| BioShock Infinite (2013) | 112.1 | 61.9 | 52.4 | 20.29 |
| Thief (2014) | 43.3 | 24.3 | 17.2 | 12.5 |
| Dragon Age: Inquisition (2014) | 61.8 | 42.1 | 9.6 |
Rumorosità
| Idle |
| 30.2 / 30.2 / 30.2 dB(A) |
| Sotto carico |
| 40.4 / 40.6 dB(A) |
 | ||
30 dB silenzioso 40 dB(A) udibile 50 dB(A) rumoroso |
||
min: | ||
(±) La temperatura massima sul lato superiore è di 43.5 °C / 110 F, rispetto alla media di 34.3 °C / 94 F, che varia da 21.2 a 62.5 °C per questa classe Office.
(-) Il lato inferiore si riscalda fino ad un massimo di 56.2 °C / 133 F, rispetto alla media di 36.8 °C / 98 F
(+) In idle, la temperatura media del lato superiore è di 25.2 °C / 77 F, rispetto alla media deld ispositivo di 29.5 °C / 85 F.
(+) I poggiapolsi e il touchpad sono piu' freddi della temperatura della pelle con un massimo di 28.4 °C / 83.1 F e sono quindi freddi al tatto.
(±) La temperatura media della zona del palmo della mano di dispositivi simili e'stata di 27.5 °C / 81.5 F (-0.9 °C / -1.6 F).
Dell Vostro 15-5568 analisi audio
(-) | altoparlanti non molto potenti (67.5 dB)
Bassi 100 - 315 Hz
(-) | quasi nessun basso - in media 19.3% inferiori alla media
(±) | la linearità dei bassi è media (12.6% delta rispetto alla precedente frequenza)
Medi 400 - 2000 Hz
(±) | medi elevati - circa 7.9% superiore alla media
(±) | linearità dei medi adeguata (8% delta rispetto alla precedente frequenza)
Alti 2 - 16 kHz
(+) | Alti bilanciati - appena 2.2% dalla media
(±) | la linearità degli alti è media (7.5% delta rispetto alla precedente frequenza)
Nel complesso 100 - 16.000 Hz
(±) | la linearità complessiva del suono è media (26.8% di differenza rispetto alla media
Rispetto alla stessa classe
» 82% di tutti i dispositivi testati in questa classe è stato migliore, 6% simile, 11% peggiore
» Il migliore ha avuto un delta di 7%, medio di 21%, peggiore di 53%
Rispetto a tutti i dispositivi testati
» 82% di tutti i dispositivi testati in questa classe è stato migliore, 4% similare, 14% peggiore
» Il migliore ha avuto un delta di 4%, medio di 23%, peggiore di 134%
Apple MacBook 12 (Early 2016) 1.1 GHz analisi audio
(+) | gli altoparlanti sono relativamente potenti (83.6 dB)
Bassi 100 - 315 Hz
(±) | bassi ridotti - in media 11.3% inferiori alla media
(±) | la linearità dei bassi è media (14.2% delta rispetto alla precedente frequenza)
Medi 400 - 2000 Hz
(+) | medi bilanciati - solo only 2.4% rispetto alla media
(+) | medi lineari (5.5% delta rispetto alla precedente frequenza)
Alti 2 - 16 kHz
(+) | Alti bilanciati - appena 2% dalla media
(+) | alti lineari (4.5% delta rispetto alla precedente frequenza)
Nel complesso 100 - 16.000 Hz
(+) | suono nel complesso lineare (10.2% differenza dalla media)
Rispetto alla stessa classe
» 7% di tutti i dispositivi testati in questa classe è stato migliore, 2% simile, 90% peggiore
» Il migliore ha avuto un delta di 5%, medio di 18%, peggiore di 53%
Rispetto a tutti i dispositivi testati
» 5% di tutti i dispositivi testati in questa classe è stato migliore, 1% similare, 94% peggiore
» Il migliore ha avuto un delta di 4%, medio di 23%, peggiore di 134%
| Off / Standby | |
| Idle | |
| Sotto carico |
|
Leggenda:
min: | |
| Dell Vostro 15-5568 i7-7500U, GeForce 940MX, Micron SSD 1100 (MTFDDAV256TBN), TN LED, 1920x1080, 15.6" | HP Spectre x360 15-bl002xx i7-7500U, GeForce 940MX, Toshiba XG4 NVMe (THNSN5512GPUK), IPS, 3840x2160, 15.6" | Acer TravelMate P658-G2-MG-7327 i7-7500U, GeForce 940MX, Liteonit CV3-8D512, IPS, 1920x1080, 15.6" | Huawei MateBook D 15, i7-7500U 940MX i7-7500U, GeForce 940MX, SanDisk SD8SN8U128G1027, IPS, 1920x1080, 15.6" | Lenovo ThinkPad T570-20HAS01E00 i7-7500U, GeForce 940MX, Samsung PM961 NVMe MZVLW512HMJP, IPS, 3840x2160, 15.6" | Dell Vostro 15-5568 i5-7200U, HD Graphics 620, SanDisk X400 256GB, SATA (SD8SB8U-256G), TN LED, 1920x1080, 15.6" | |
|---|---|---|---|---|---|---|
| Power Consumption | -73% | -28% | -27% | -48% | 5% | |
| Idle Minimum * (Watt) | 3.1 | 8.14 -163% | 3.9 -26% | 5.14 -66% | 4.7 -52% | 3.3 -6% |
| Idle Average * (Watt) | 6.3 | 10.91 -73% | 7.9 -25% | 9.07 -44% | 9.9 -57% | 6.8 -8% |
| Idle Maximum * (Watt) | 6.5 | 12.26 -89% | 11.3 -74% | 9.33 -44% | 10.9 -68% | 7.7 -18% |
| Load Average * (Watt) | 46 | 45.67 1% | 47 -2% | 46.76 -2% | 56.1 -22% | 30.9 33% |
| Load Maximum * (Watt) | 54 | 74.94 -39% | 62 -15% | 42.59 21% | 75 -39% | 40.3 25% |
| Witcher 3 ultra * (Watt) | 40.18 |
* ... Meglio usare valori piccoli
| Dell Vostro 15-5568 i7-7500U, GeForce 940MX, 42 Wh | HP Spectre x360 15-bl002xx i7-7500U, GeForce 940MX, 79.2 Wh | Acer TravelMate P658-G2-MG-7327 i7-7500U, GeForce 940MX, 55 Wh | Huawei MateBook D 15, i7-7500U 940MX i7-7500U, GeForce 940MX, 43.3 Wh | Lenovo ThinkPad T570-20HAS01E00 i7-7500U, GeForce 940MX, 56 Wh | Dell Vostro 15-5568 i5-7200U, HD Graphics 620, 42 Wh | |
|---|---|---|---|---|---|---|
| Autonomia della batteria | 69% | 95% | 38% | 61% | 35% | |
| Reader / Idle (h) | 13.3 | 14.4 8% | 15.9 20% | 13.3 0% | 16.9 27% | |
| WiFi v1.3 (h) | 4.3 | 8.9 107% | 8.4 95% | 7.4 72% | 6.9 60% | 6 40% |
| Load (h) | 1.3 | 2.5 92% | 1.6 23% | 2.9 123% | 1.8 38% | |
| H.264 (h) | 8.1 | 8.5 |
Pro
Contro
Il Vostro 15 5568 è un portatile business economico. Le performance offerte sono adeguate al suo prezzo. Le scarse prestazioni WLAN e la tastiera mediocre possono scoraggiare gli acquirenti. Mentre la features di sicurezza minimalistiche dovrebbero essere considerate da ogni singolo acquirente in base alle proprie esigenze.
Con il Vostro 15 5568, Dell offre un portatile business economico e carino. WLAN e funzioni di sicurezza sono deludenti, tuttavia.
Per coloro che cercano un portatile business economico, il Vostro 15 5568 è sicuramente adatto. Il dispositivo gestisce bene le applicazioni standard da ufficio (presentazioni, fogli di calcolo, emails) senza problemi. Tuttavia, il display scarso deve essere considerato, soprattutto per le applicazioni 3D che richiedono una scheda grafica dedicata. Considerando la stabilità degli angoli di visuale e la copertura del colore entrambe sufficienti, questo portatile rappresenta una buona opzione.
Nota: si tratta di una recensione breve, con alcune sezioni non tradotte, per la versione integrale in inglese guardate qui.
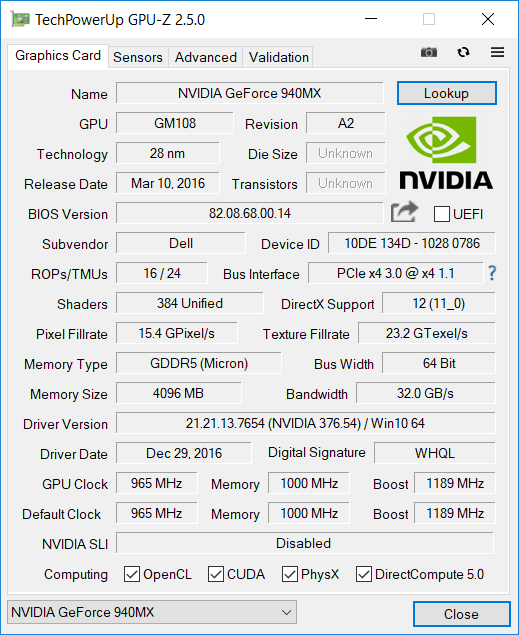
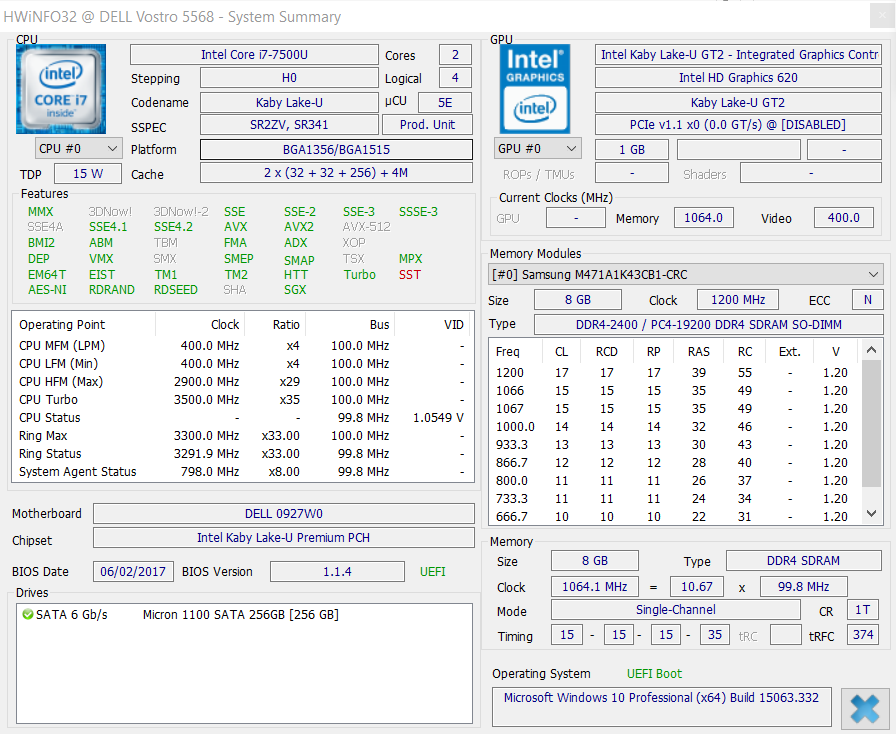
Dell Vostro 15-5568
- 12/04/2017 v6 (old)
Mike Wobker