Verdetto - XMG Focus 17 offre prestazioni elevate con alcuni compromessi
Con la nuova Focus 17 M25, XMG punta chiaramente a offrire le massime prestazioni possibili al prezzo più basso possibile. Per raggiungere questo obiettivo, la nuova GeForce GPU RTX 5070 Ti per computer portatili (12 GB di VRAM) nella variante più veloce da 140 watt è combinata con il più vecchio Core i9-13900HX. Tuttavia, le sue prestazioni sono ancora sufficienti, soprattutto nei giochi. In questo modo è possibile giocare senza problemi alla risoluzione QHD nativa. Quando si utilizza la massima potenza, le ventole diventano molto rumorose, ma non sono diverse da quelle della concorrenza. Tuttavia, l'unità di raffreddamento rimane molto silenziosa nell'uso quotidiano e gli ampi profili energetici consentono di configurare un sistema silenzioso senza un impatto negativo sulle prestazioni.
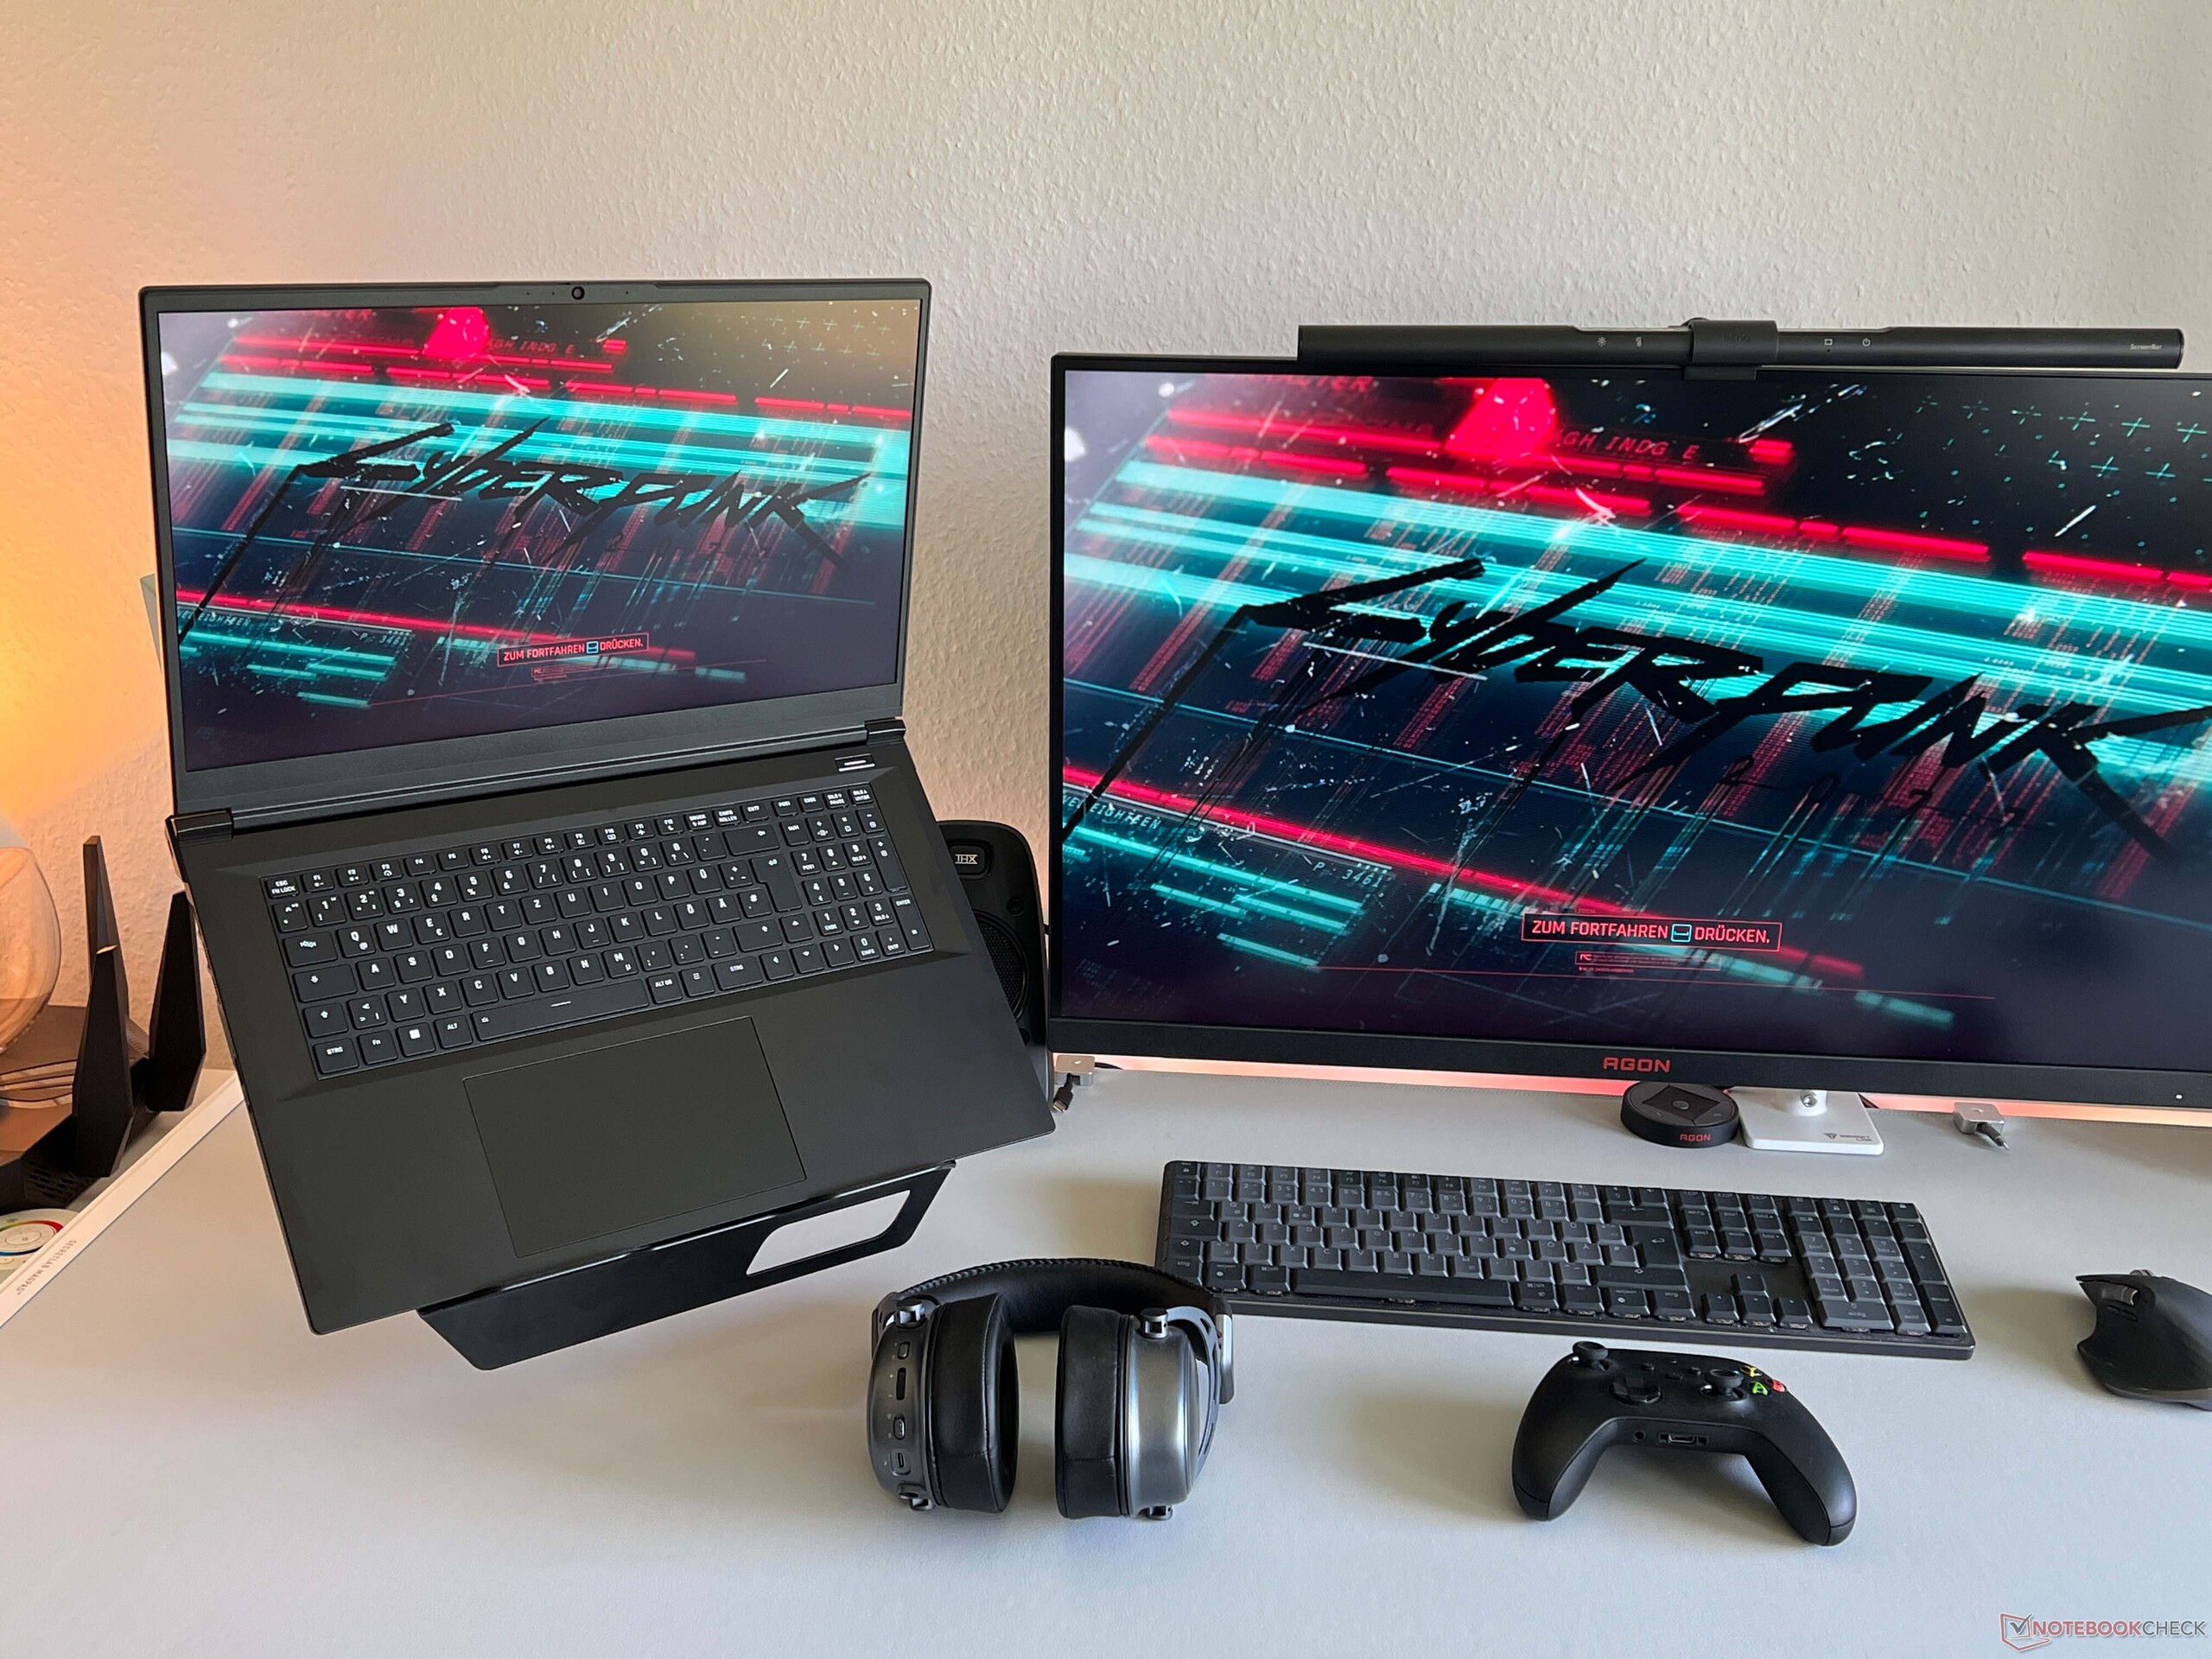
Il display IPS opaco da 240 Hz è adatto anche ai giochi. Purtroppo, si tratta ancora di uno schermo 16:9 che fatica ad eguagliare la luminosità dei suoi concorrenti. Altri compromessi includono la mancanza di Thunderbolt/USB 4.0 e di Advanced Optimus, ma sono gestibili. Anche gli altoparlanti sono piuttosto deboli e l'alimentatore da 230 watt è al limite del dimensionamento.
Nel complesso, si ottiene una macchina da gioco veloce a un prezzo eccellente e, con 12 GB di VRAM, la GPU è anche più a prova di futuro rispetto, ad esempio, alla GPU RTX 5070 standard per laptop.
Pro
Contro
Prezzo e disponibilità
Il nuovo XMG Focus 17 M25 può essere ordinato da Bestware a partire da 1.849 dollari - circa 2.100 dollari al tasso di cambio al momento della recensione.
Sommario
- Verdetto - XMG Focus 17 offre prestazioni elevate con alcuni compromessi
- Specifiche
- Custodia e caratteristiche
- Dispositivi di ingresso
- Display - A 240 Hz IPS
- Prestazioni - Una GPU 5070 Ti per laptop con un massimo di 96 GB di RAM
- Emissioni ed energia
- Valutazione complessiva di Notebookcheck
- Possibili alternative a confronto
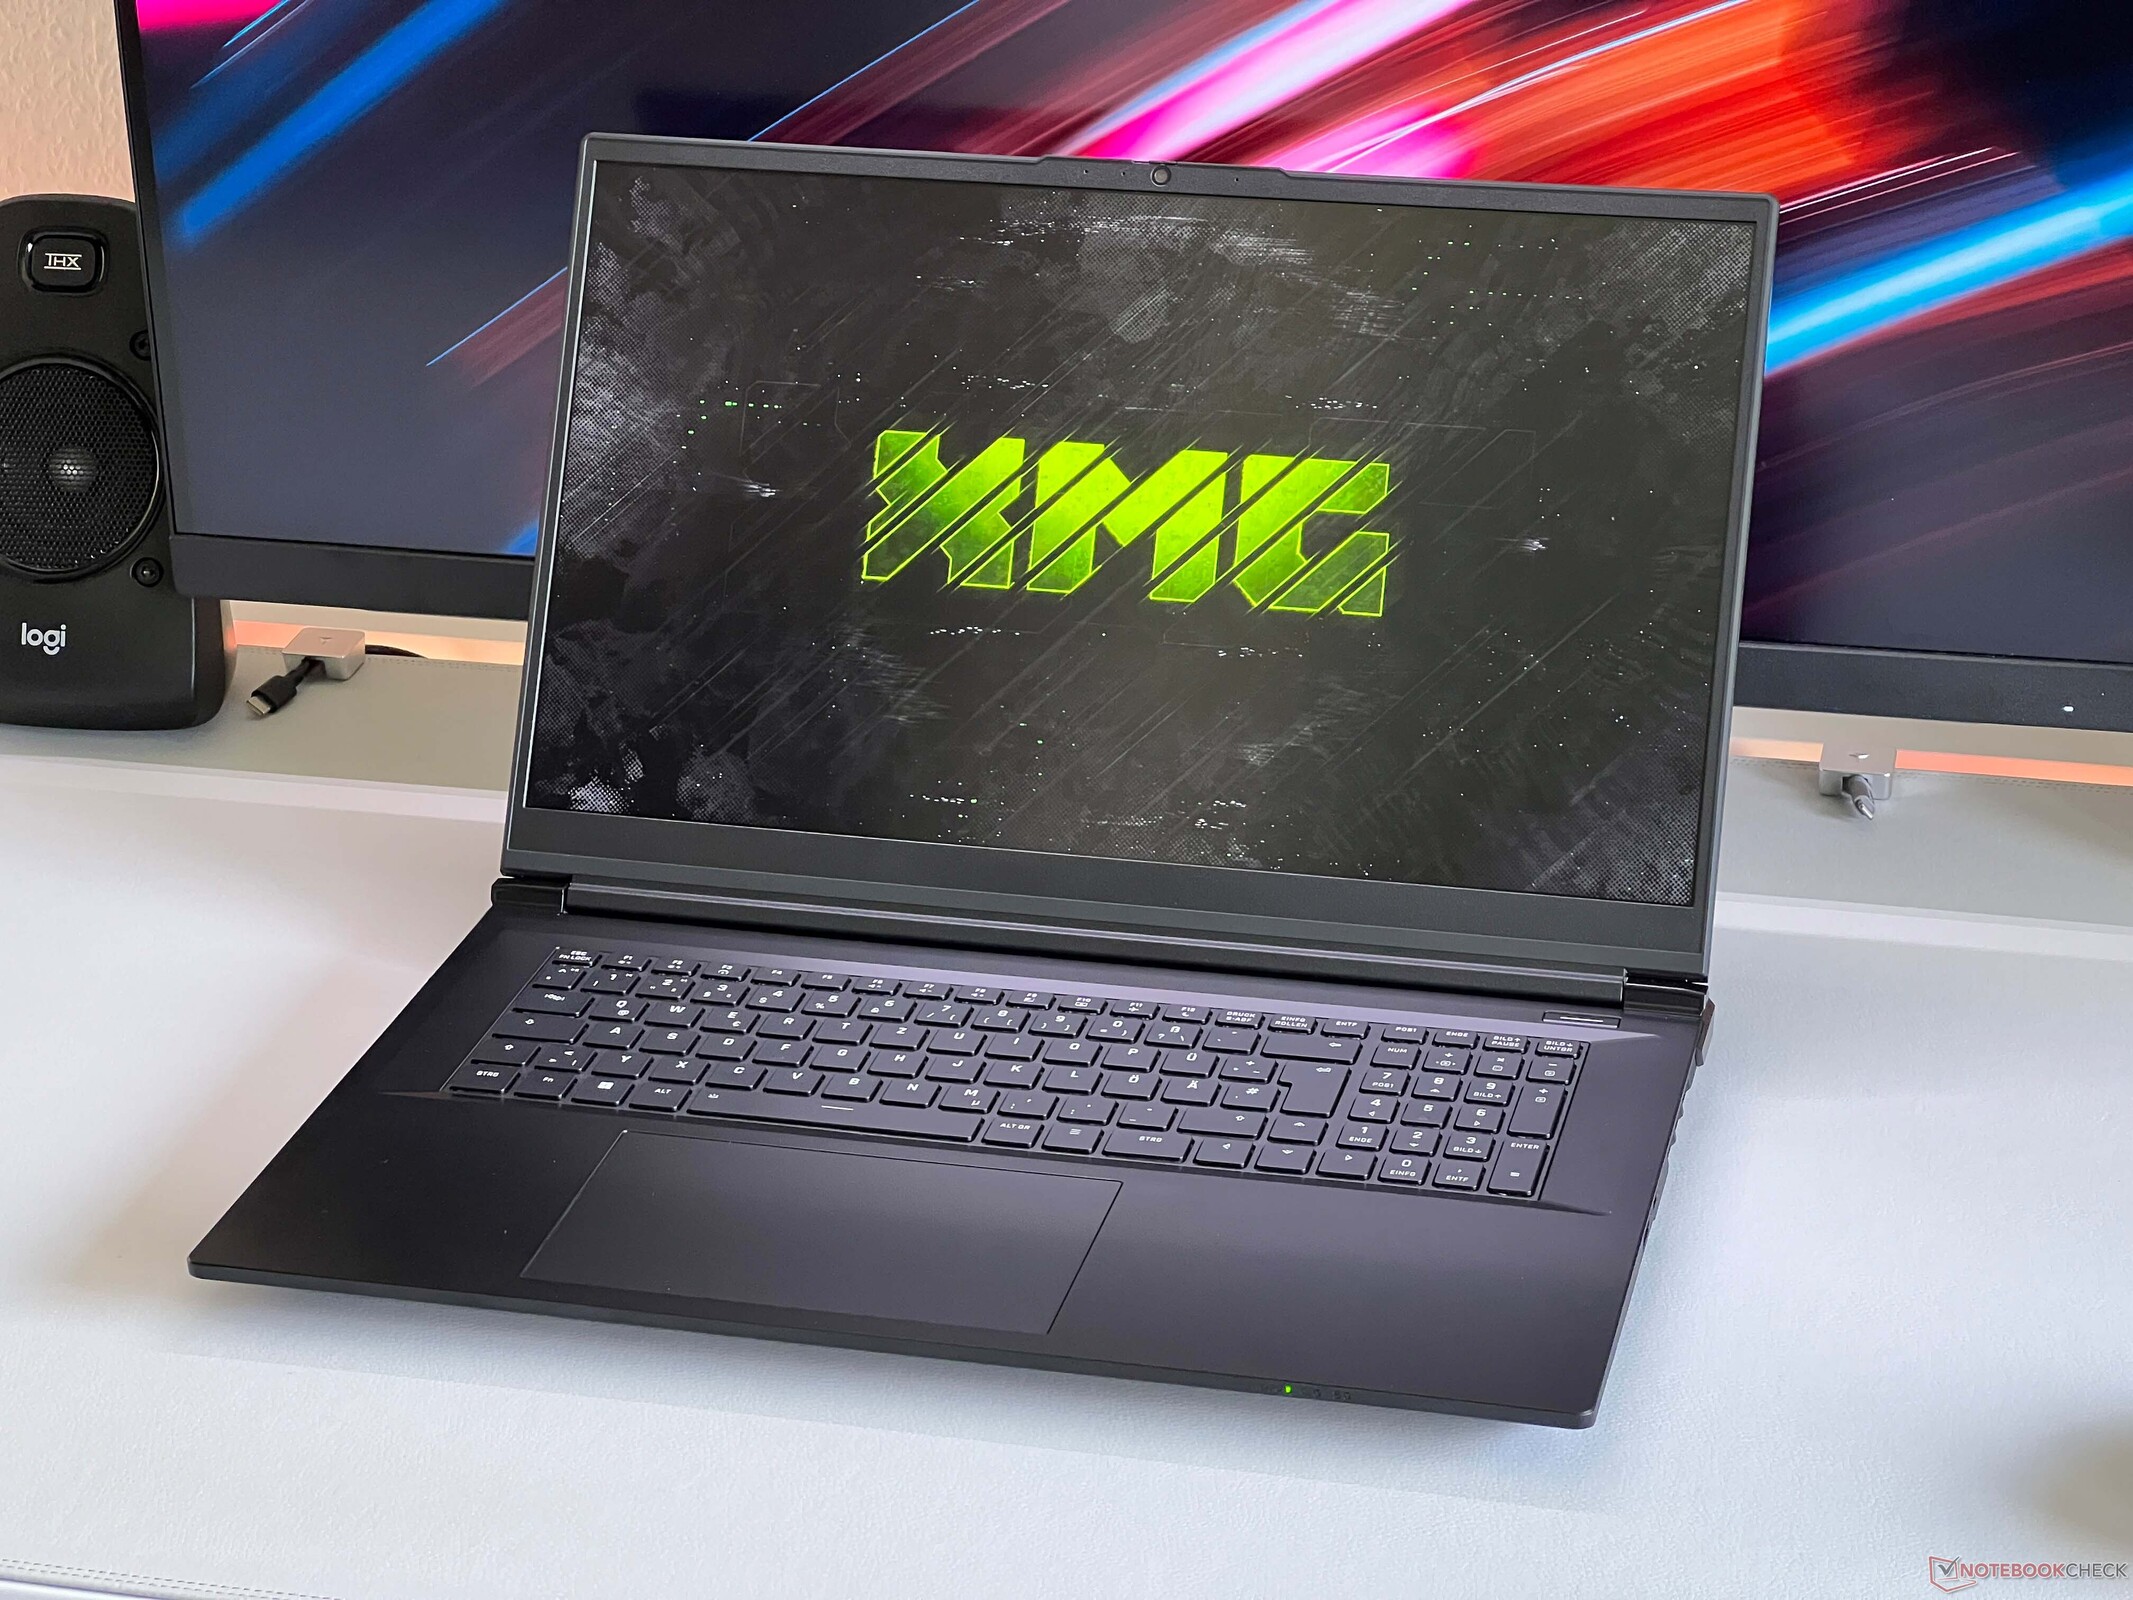
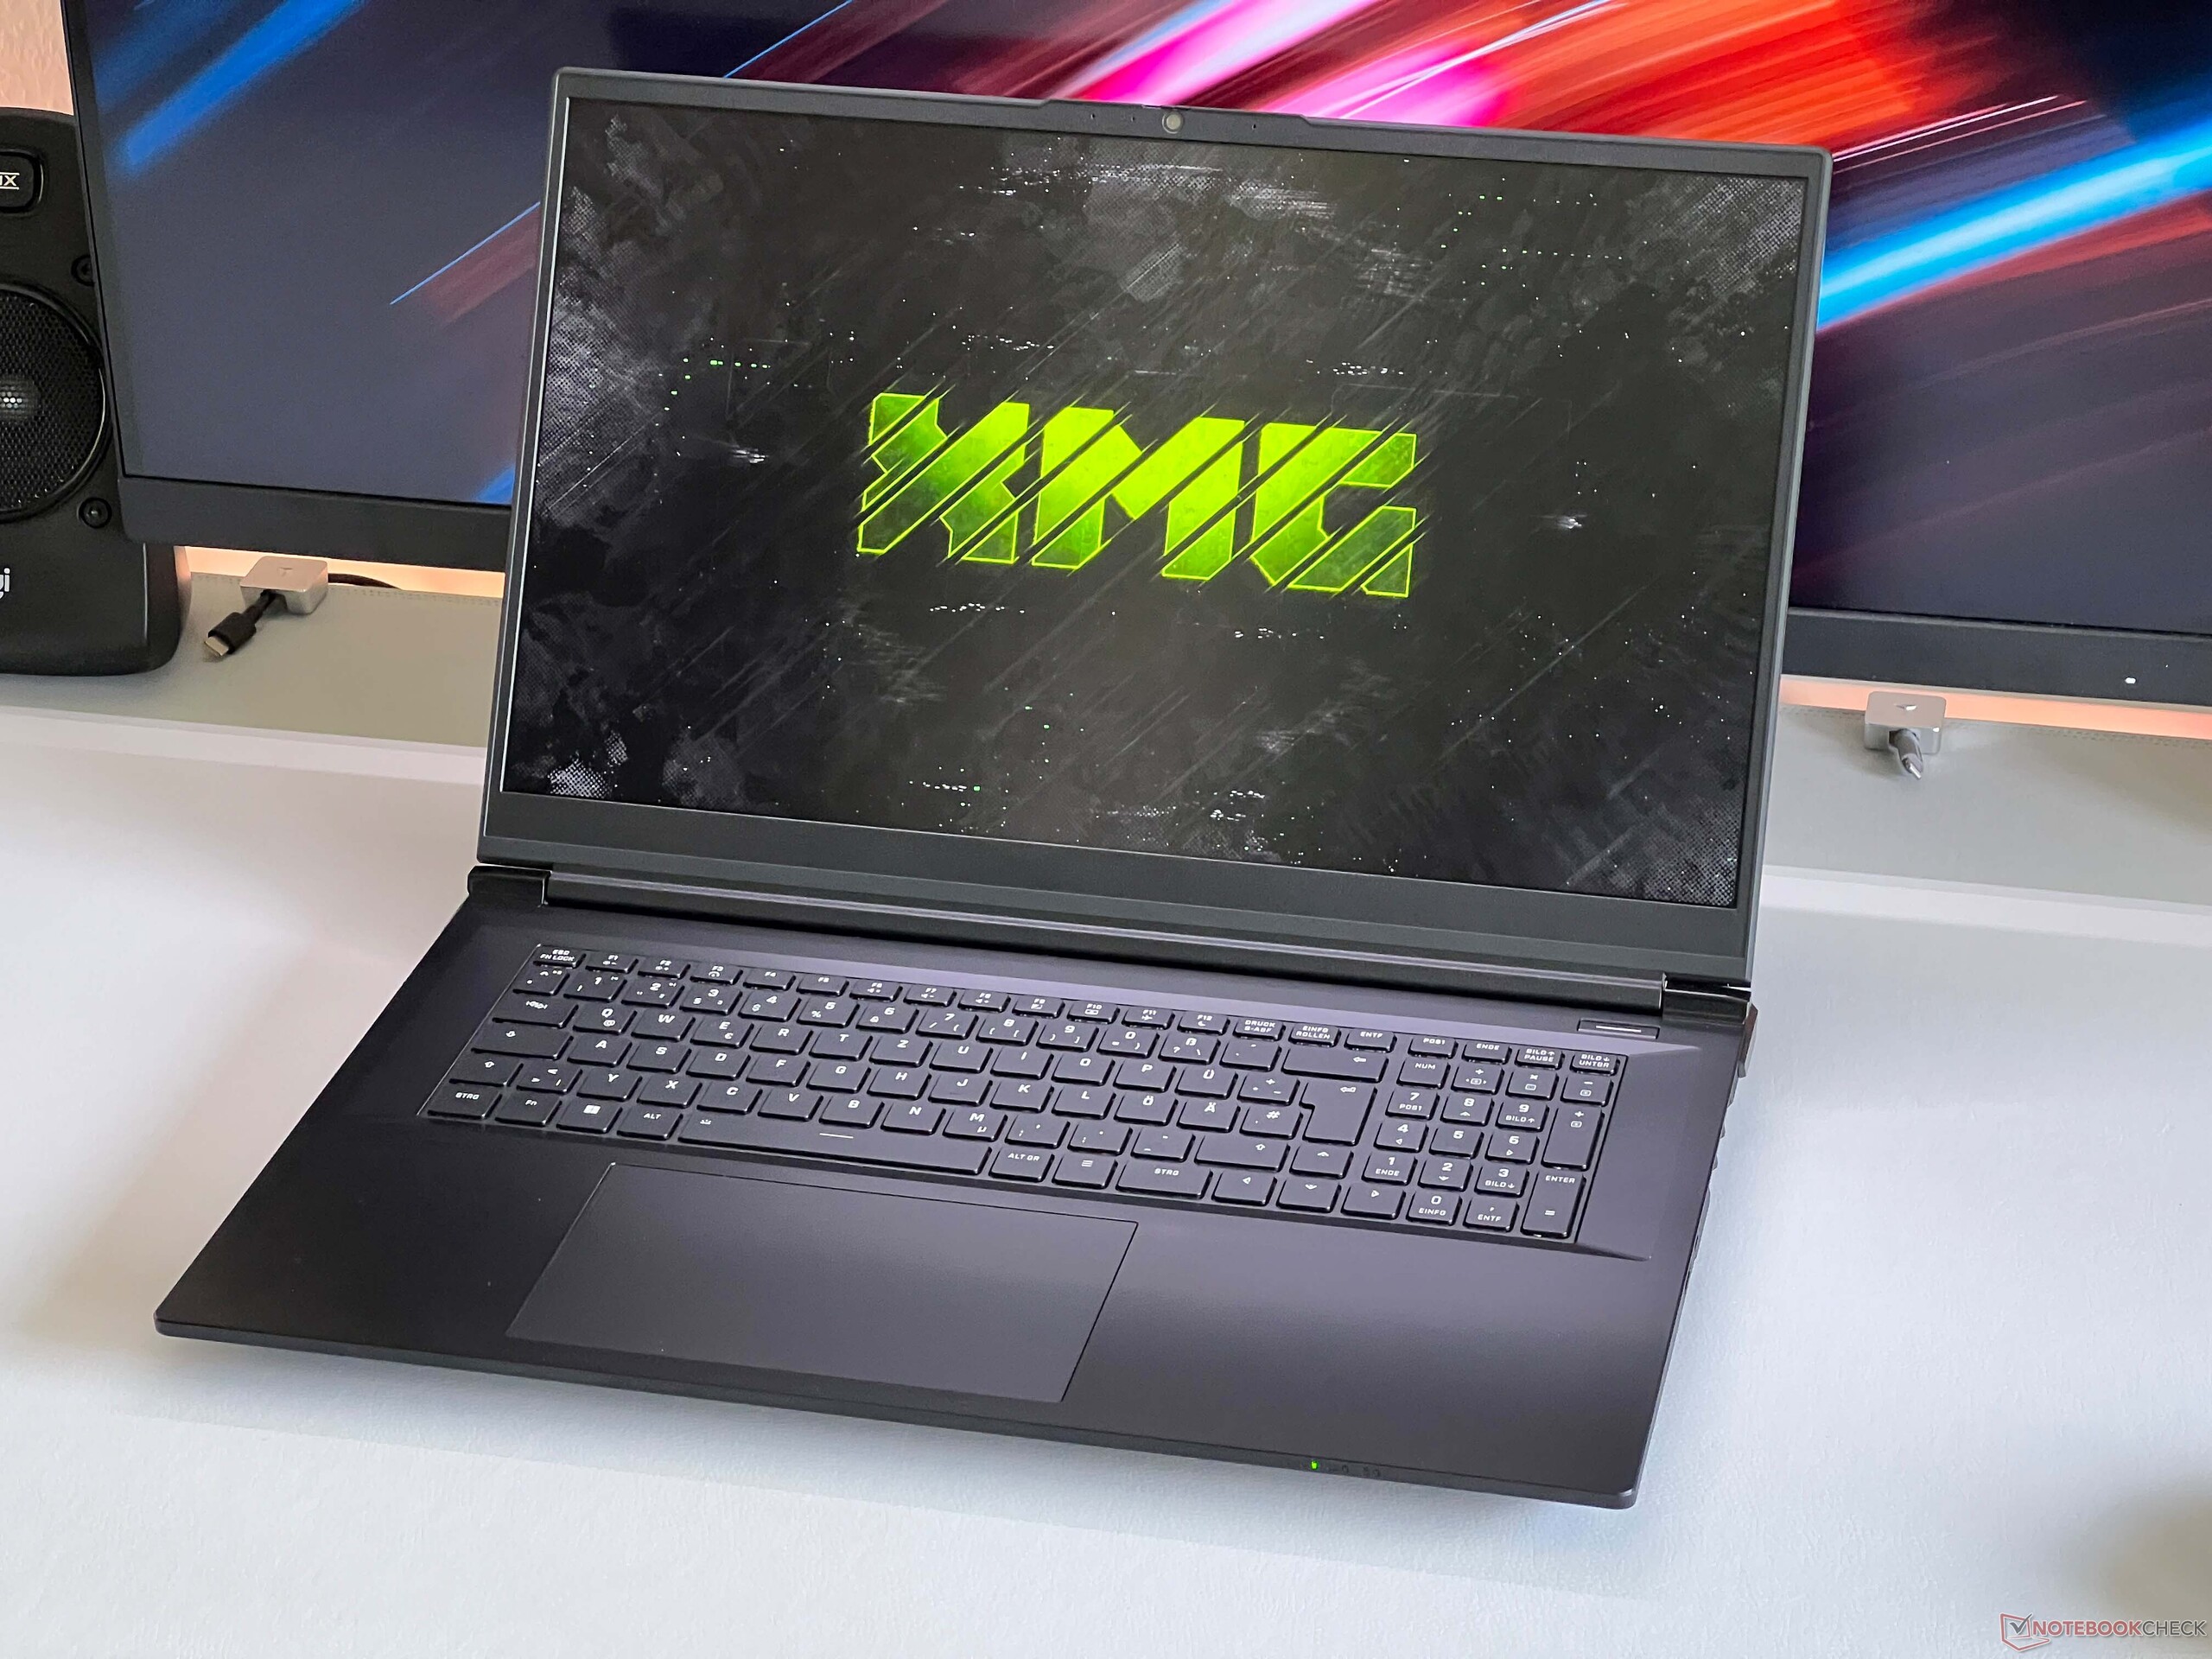
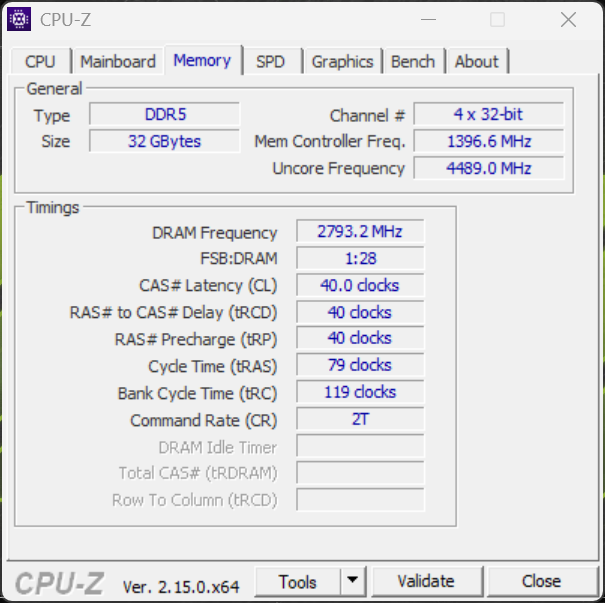
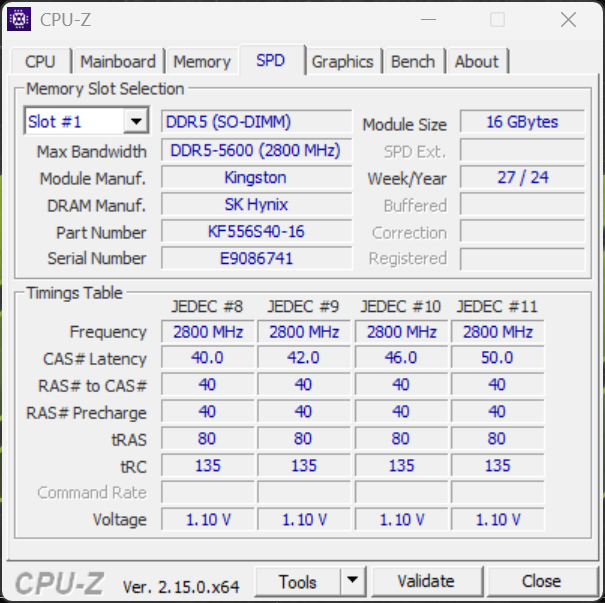
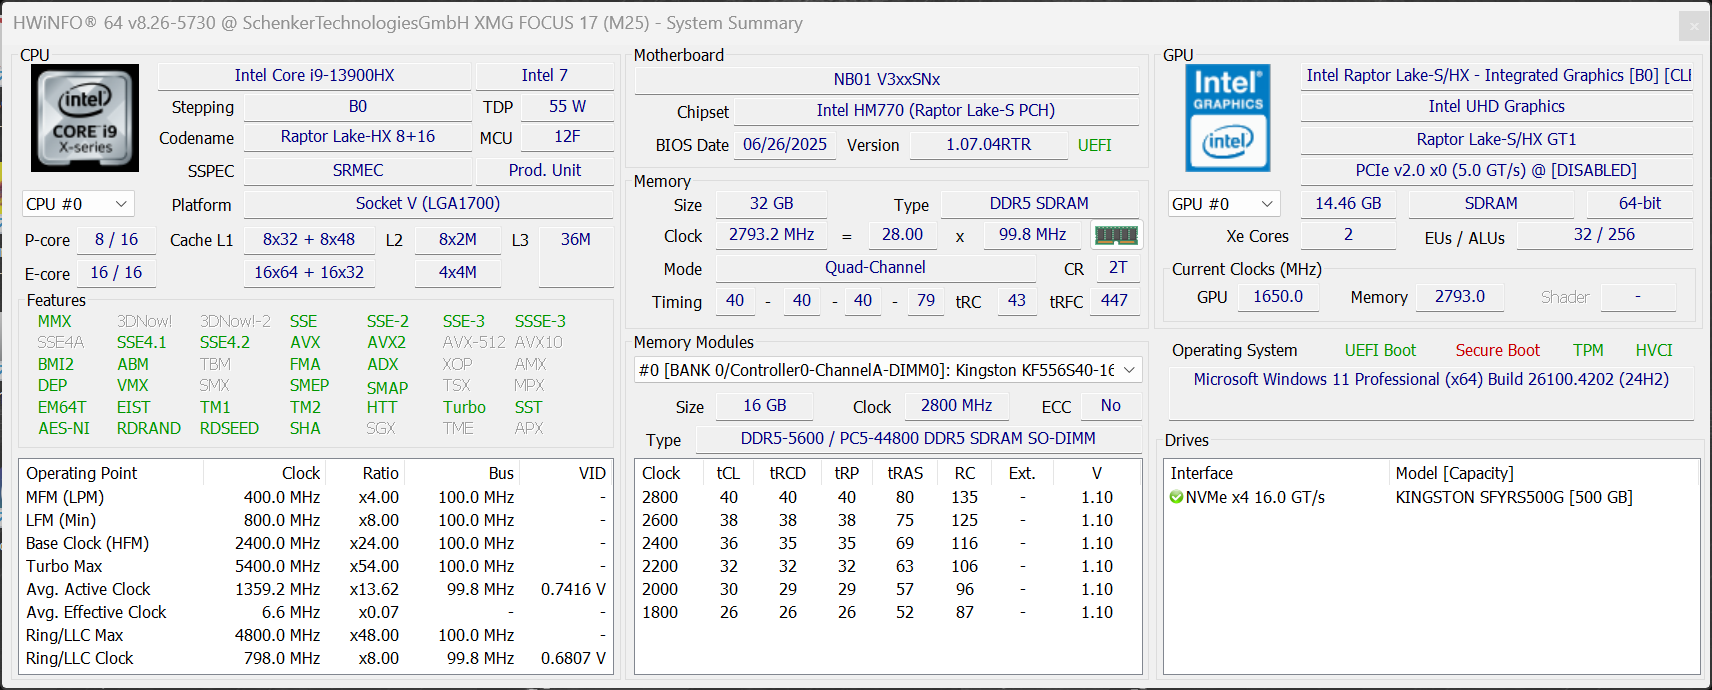
Con il nuovo Focus 17 M25, XMG offre un laptop da gioco da 17 pollici che mira a fornire le massime prestazioni a un prezzo contenuto. Il prezzo di partenza per il Core i9-13900HX, 16 GB di RAM, un SSD da 1 TB e la nuova GPU per laptop GeForce GPU RTX 5070 Ti (140 watt) è di 1.849 euro (2.100 dollari), mentre la nostra configurazione da 32 GB di RAM, Wi-Fi 7 e Windows 11 Home ha un prezzo di 1.990 euro (2.300 dollari).
Non ci sono praticamente concorrenti da 17 pollici, perché il modello MSI Vector 17 HX con RTX 5070 Ti è attualmente disponibile a circa 3.100 euro (3.600 dollari). Ci sono diversi dispositivi comparabili nel segmento dei 16 pollici, ma anche in questo caso il Focus 17 gode di un vantaggio di prezzo.
Specifiche
Custodia e caratteristiche
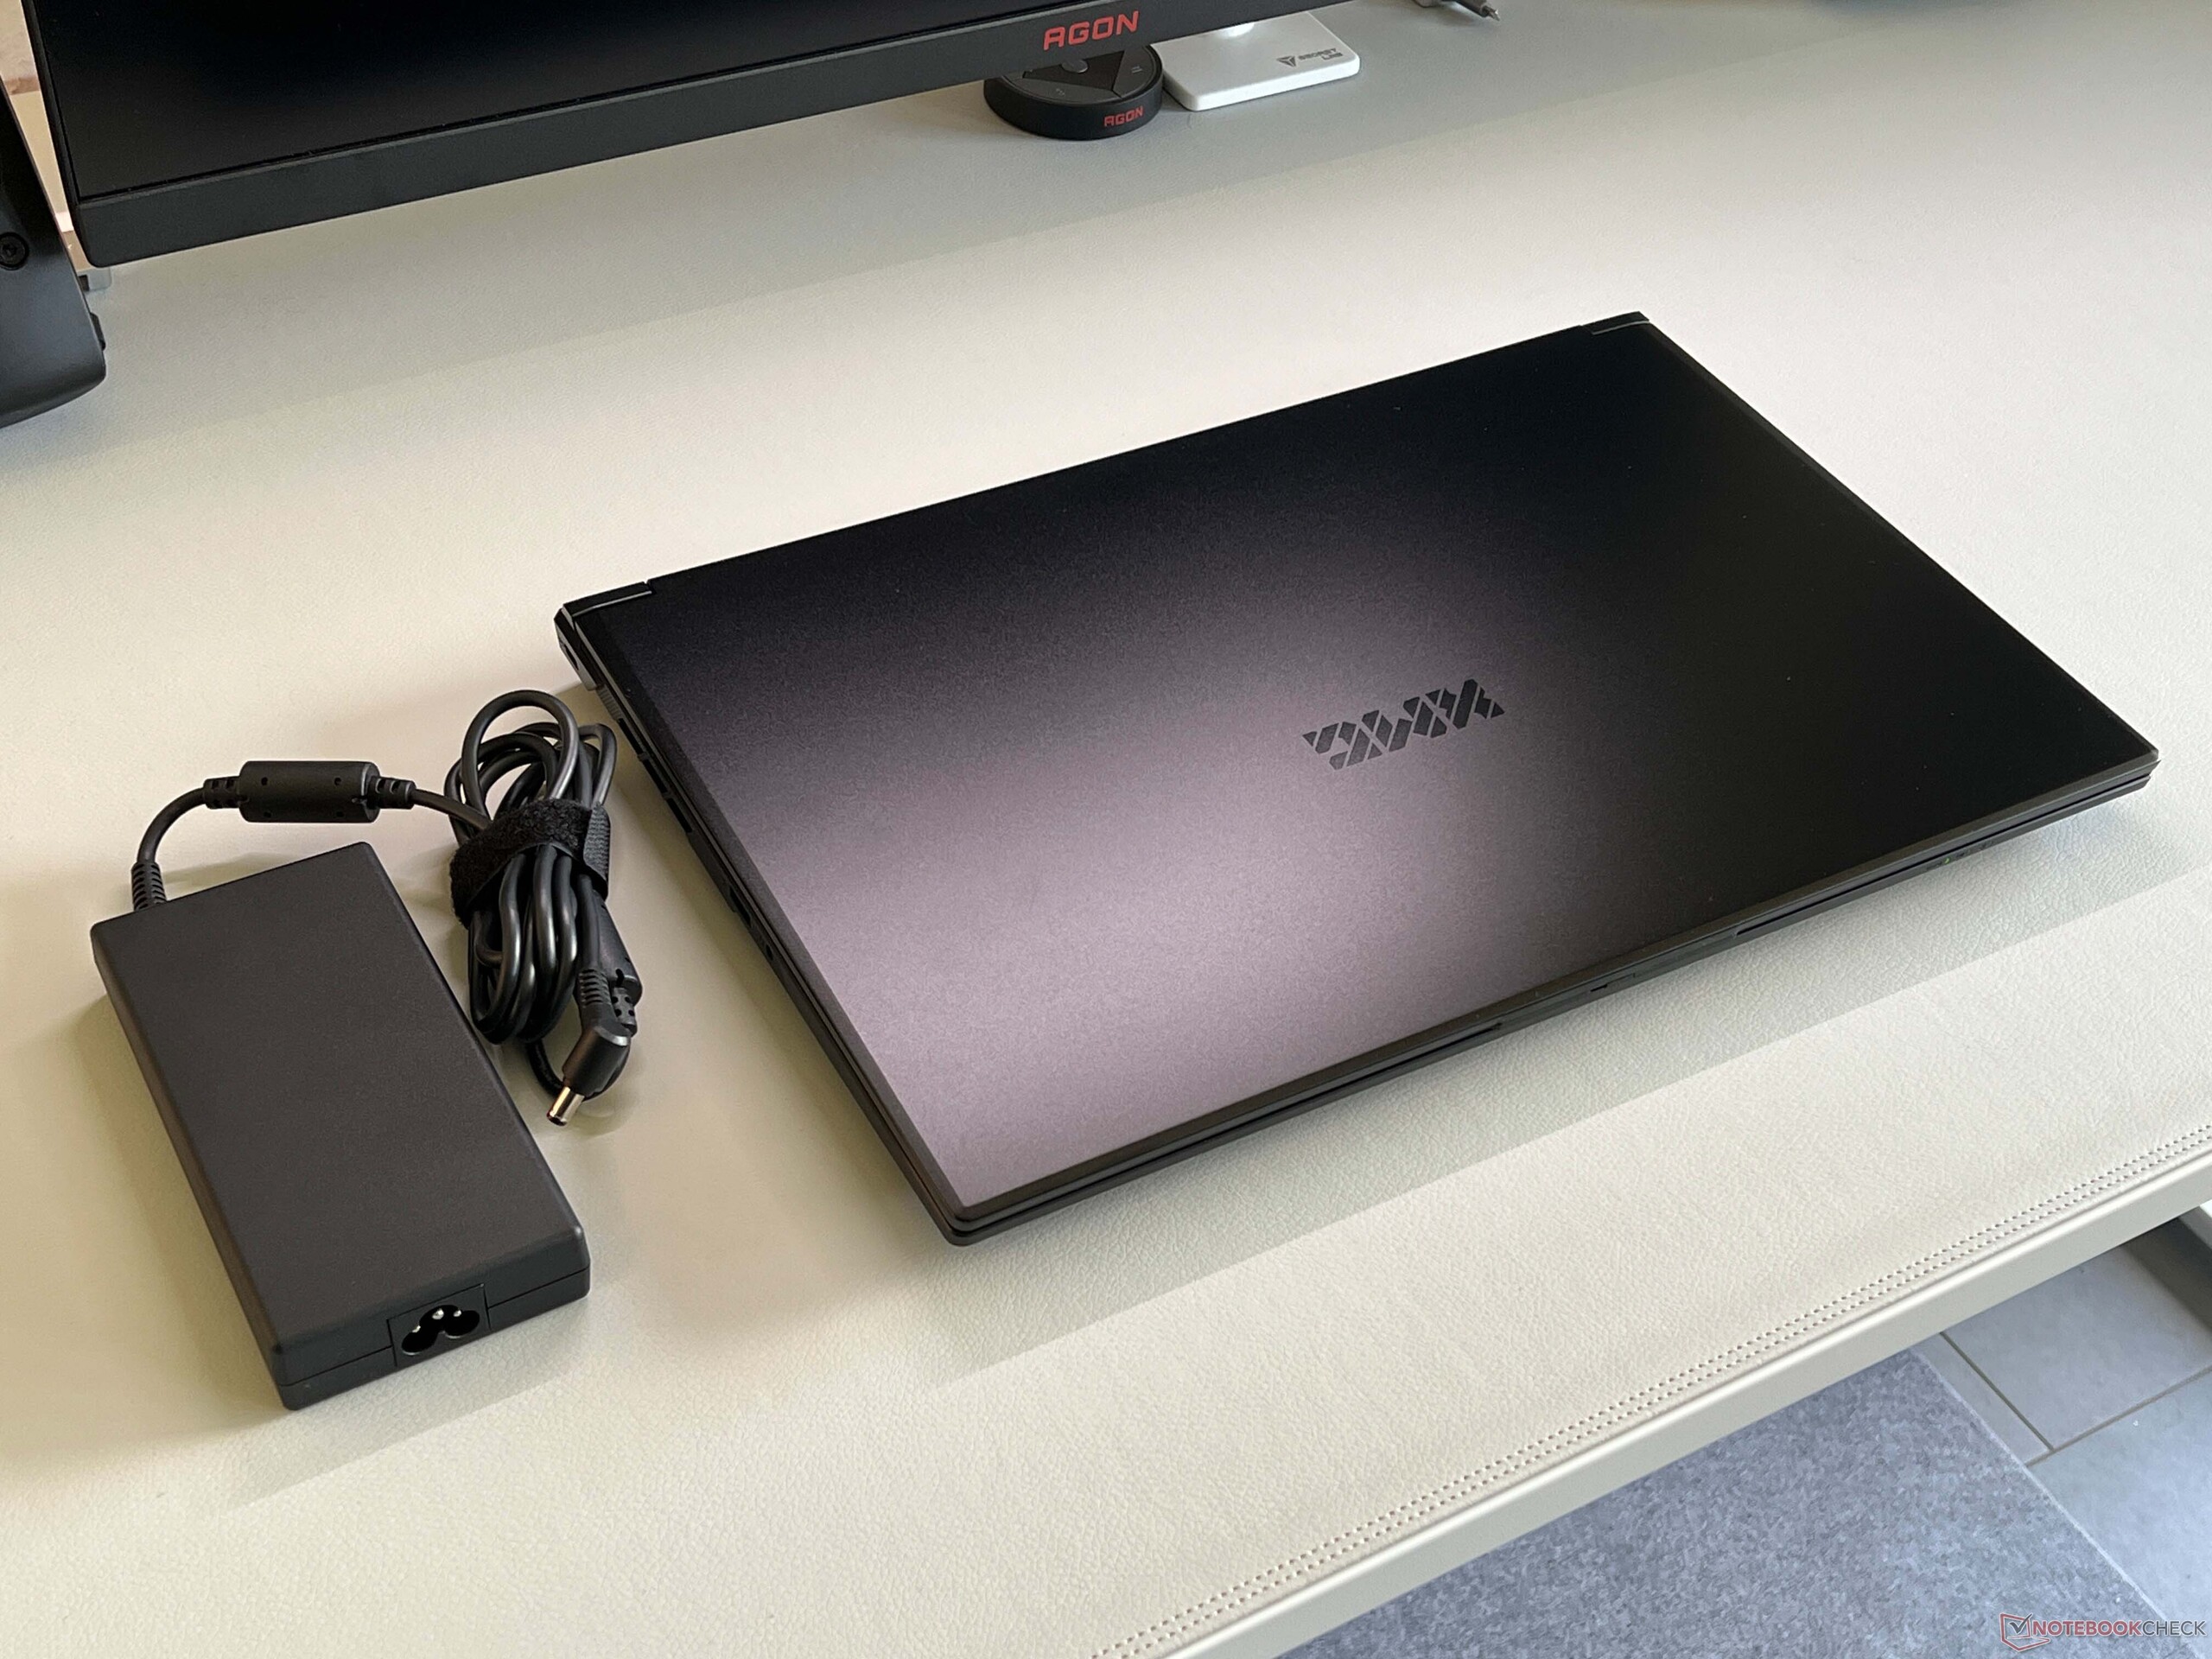
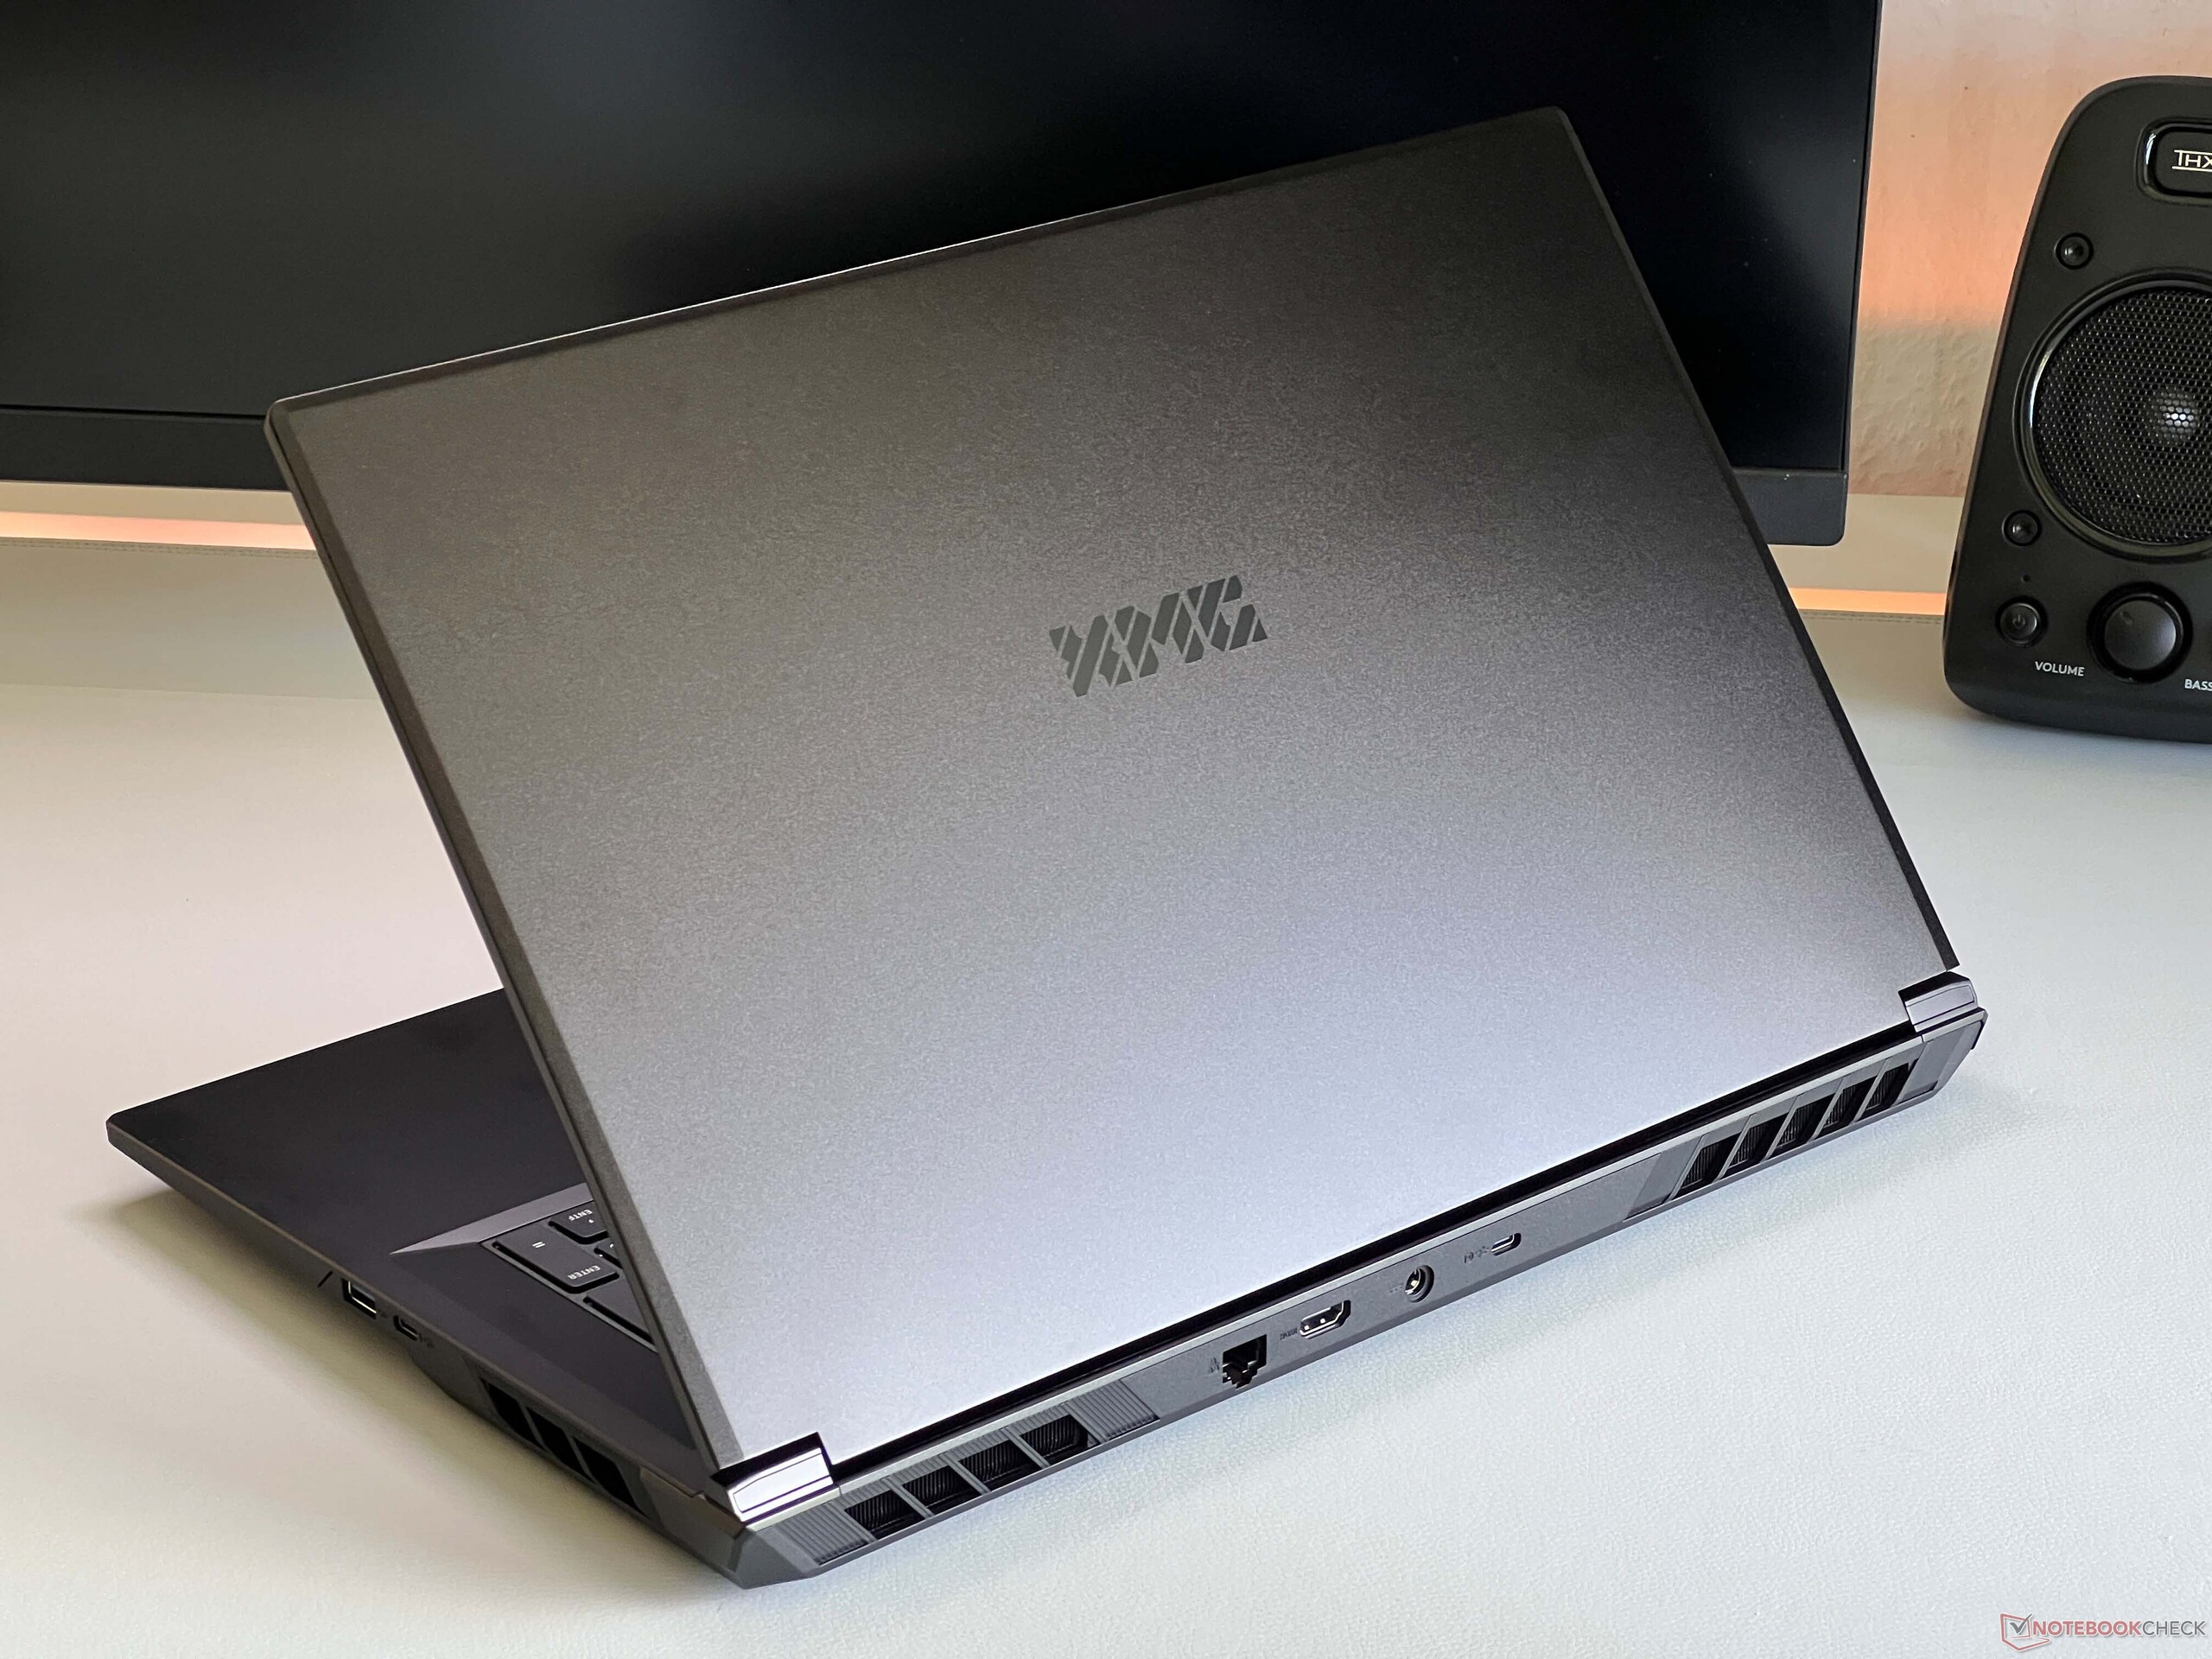
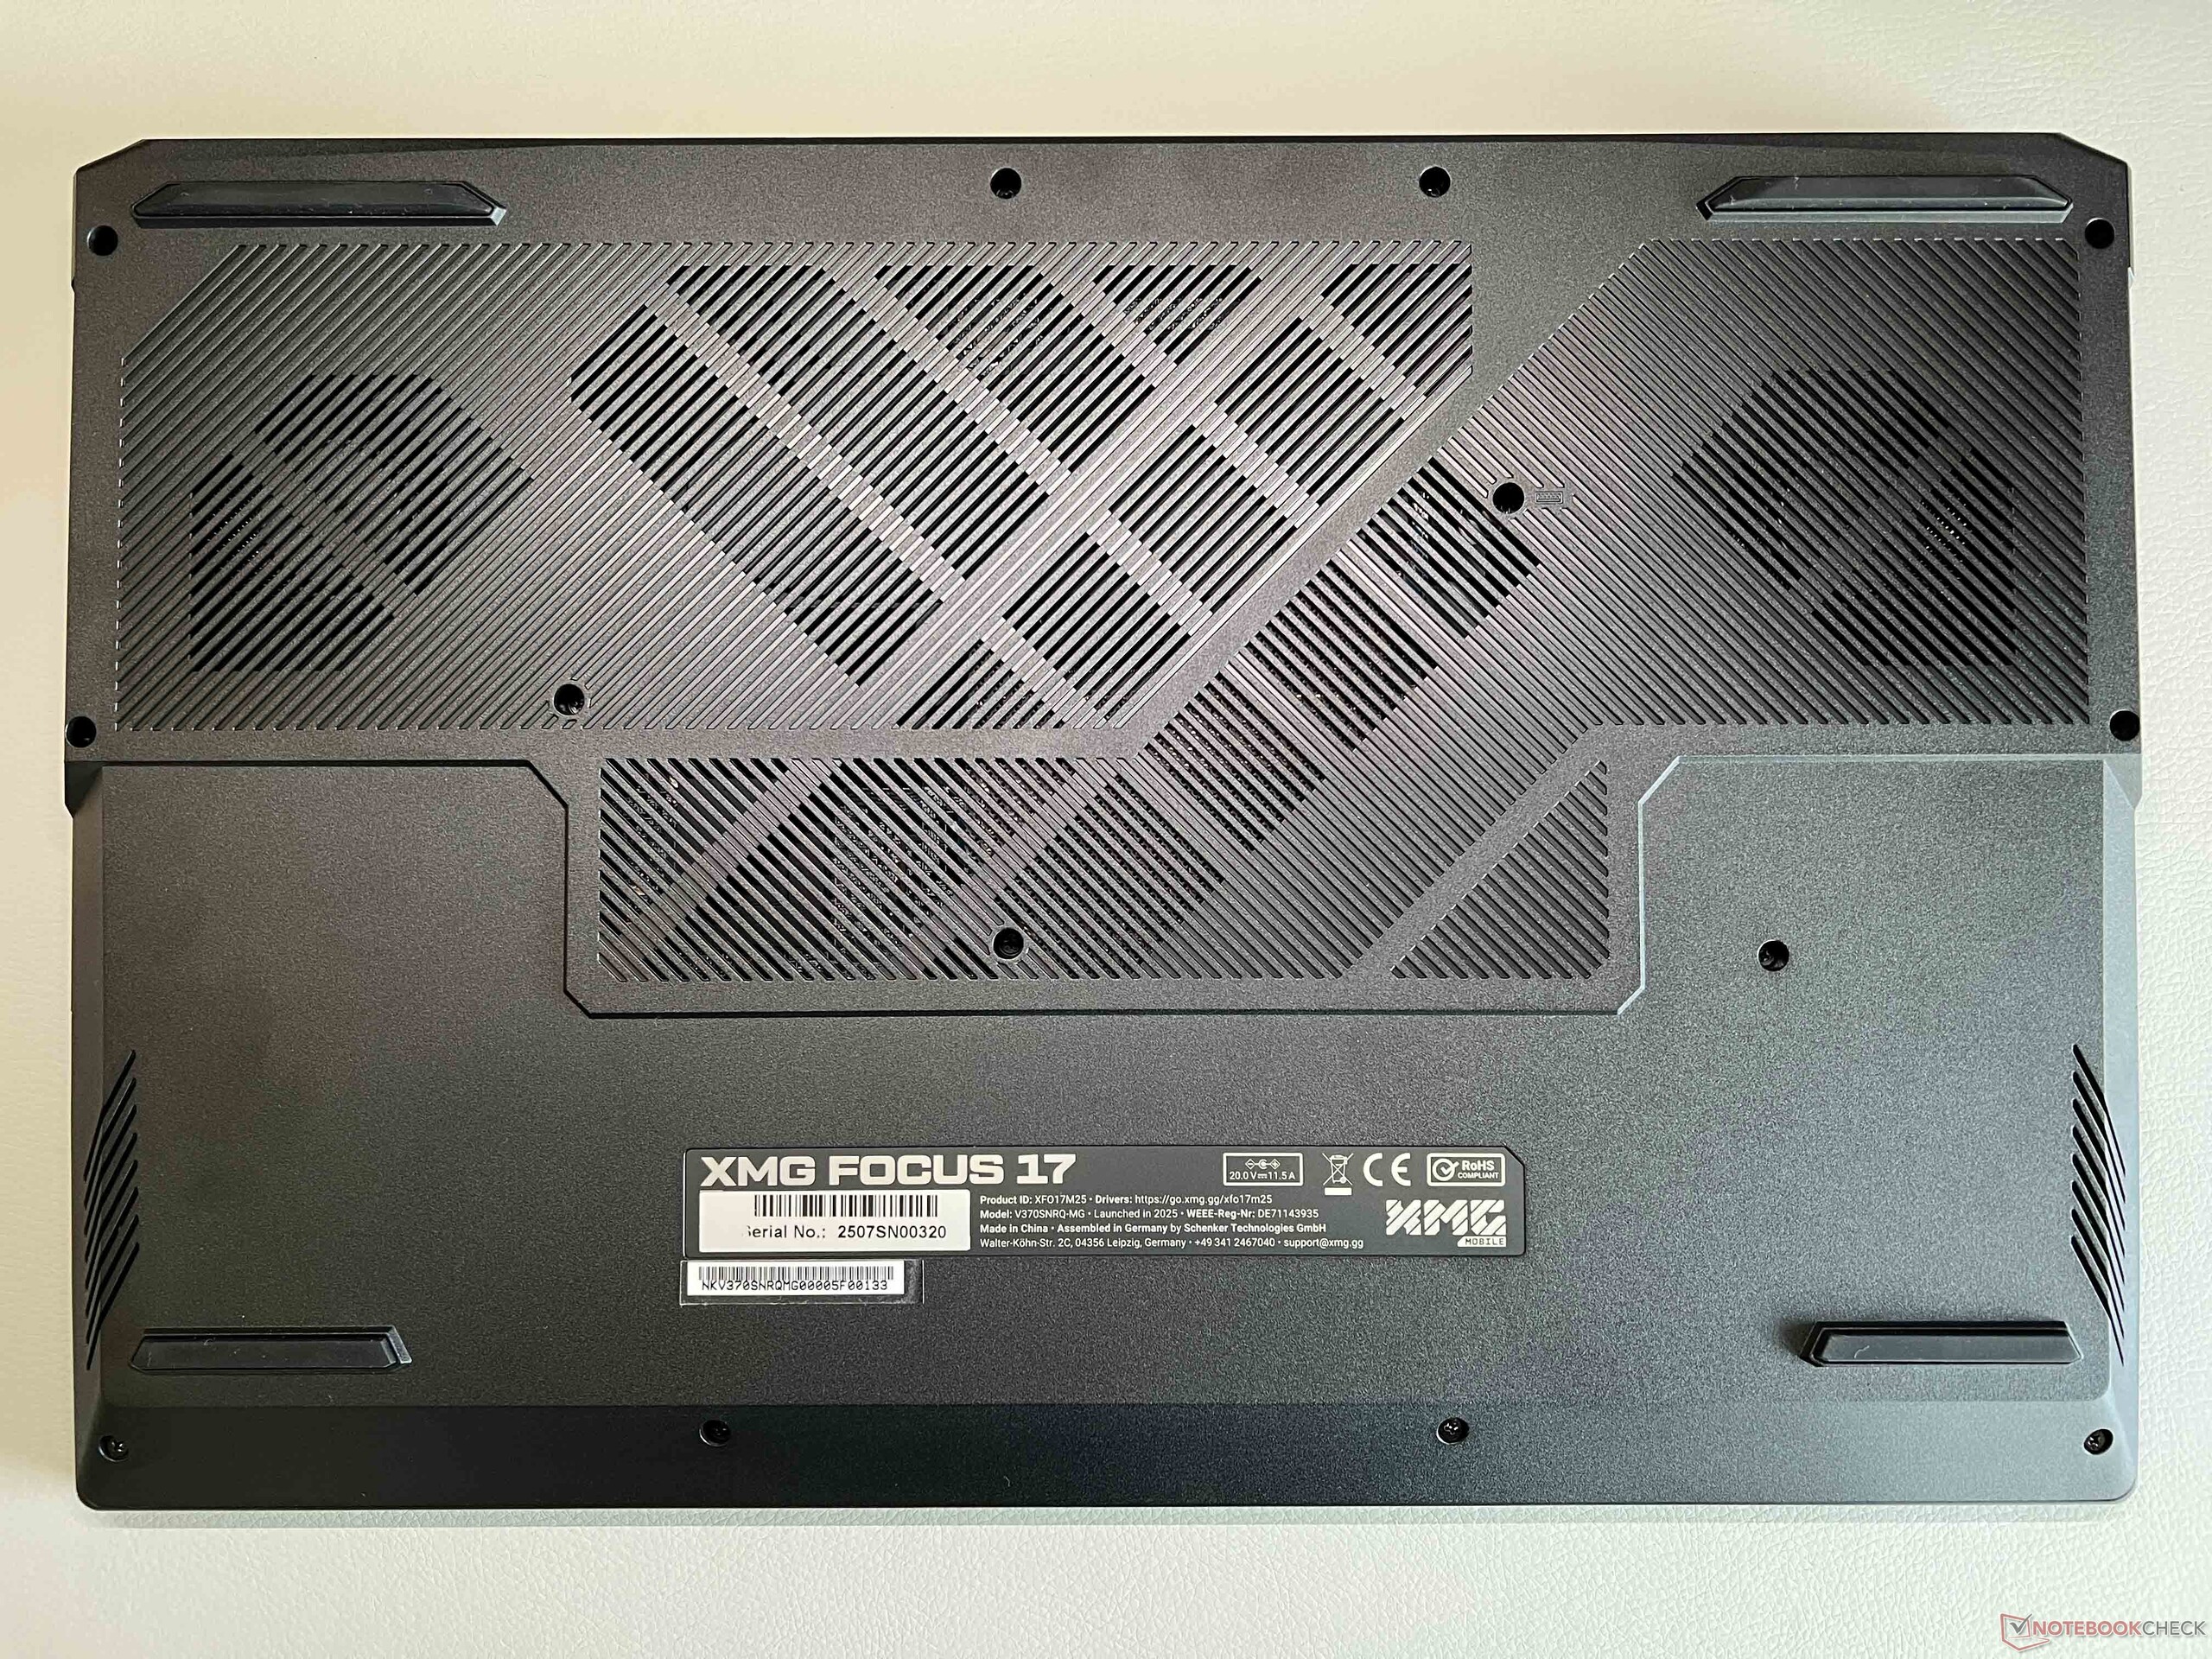
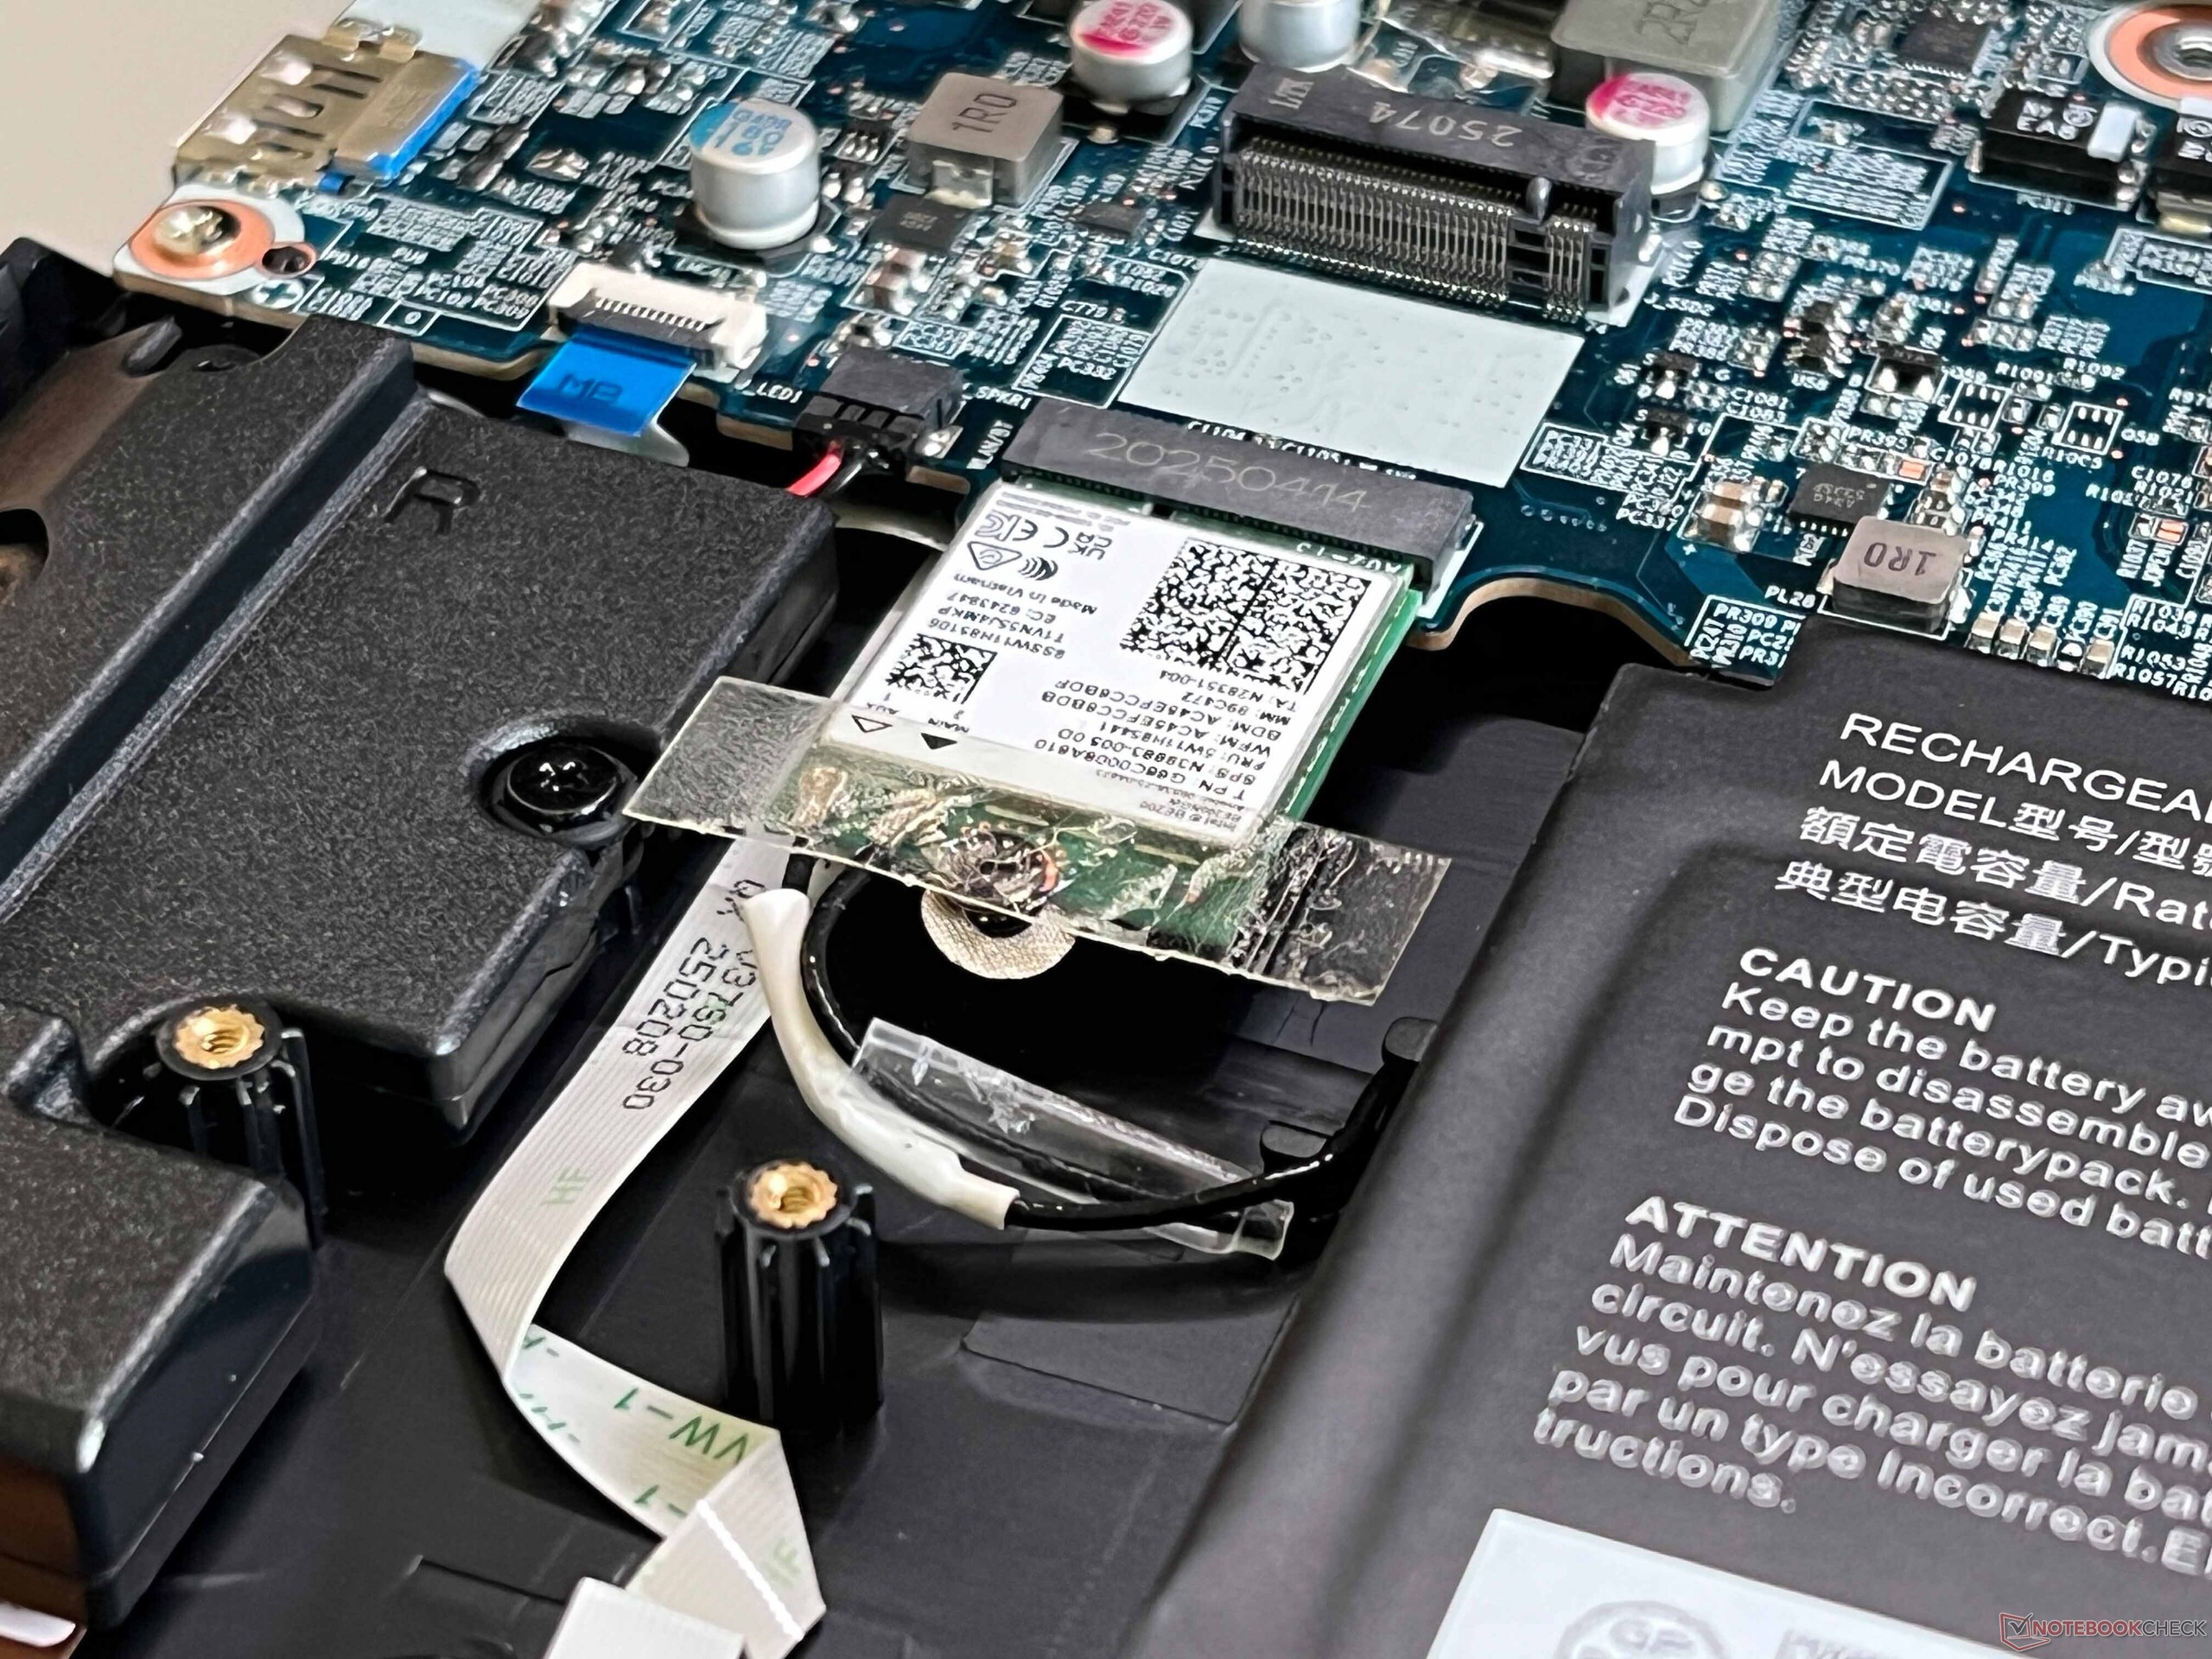
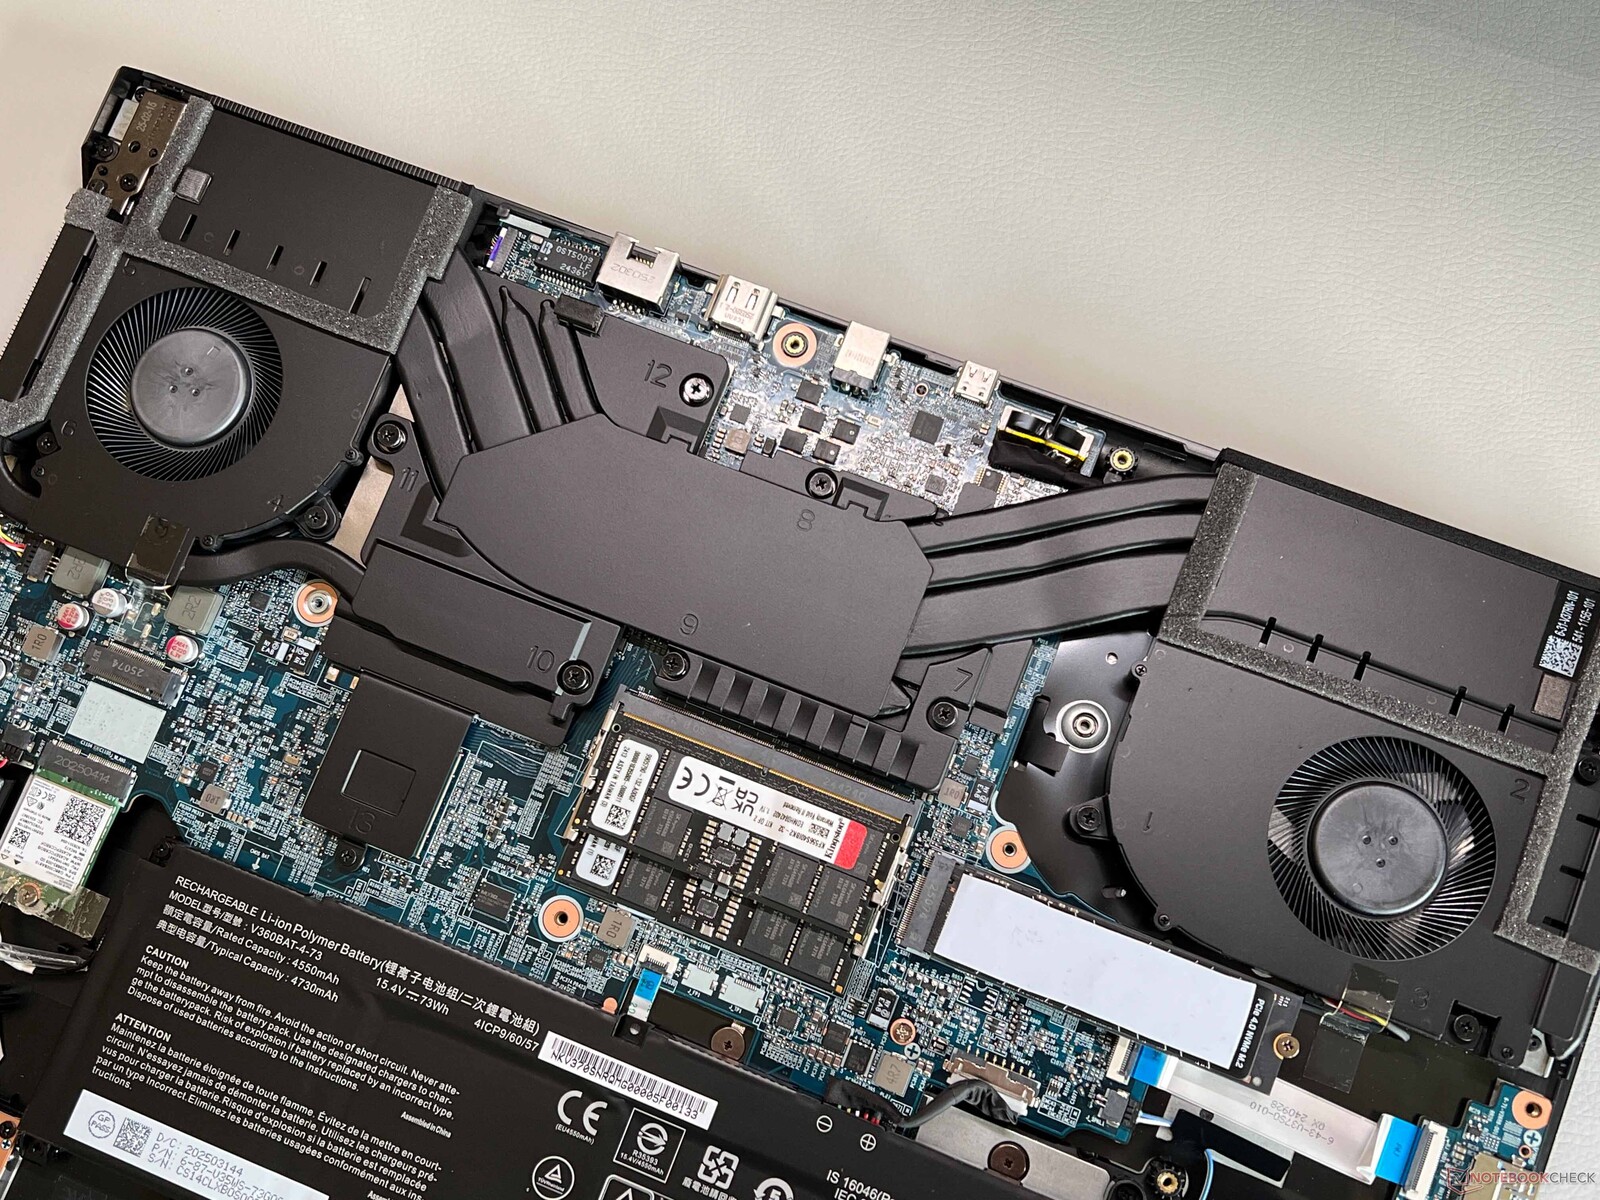
Con le sue superfici nere, il design del case è molto lineare e non ci sono elementi di illuminazione a parte la tastiera. Il coperchio è in alluminio, ma il resto del case è in plastica e le superfici sono generalmente molto sensibili allo sporco. Né la qualità costruttiva né la stabilità presentano problemi di rilievo, anche se l'unità base emette leggeri scricchiolii quando si esercita una pressione. L'angolo di apertura massima del display è di 130 gradi, ma le cerniere oscillano leggermente. Le opzioni di manutenzione sono generalmente molto buone, poiché ci sono due slot ciascuno per RAM e SSD, il modulo Wi-Fi e la batteria possono essere sostituiti se necessario, e anche le ventole sono facili da pulire.
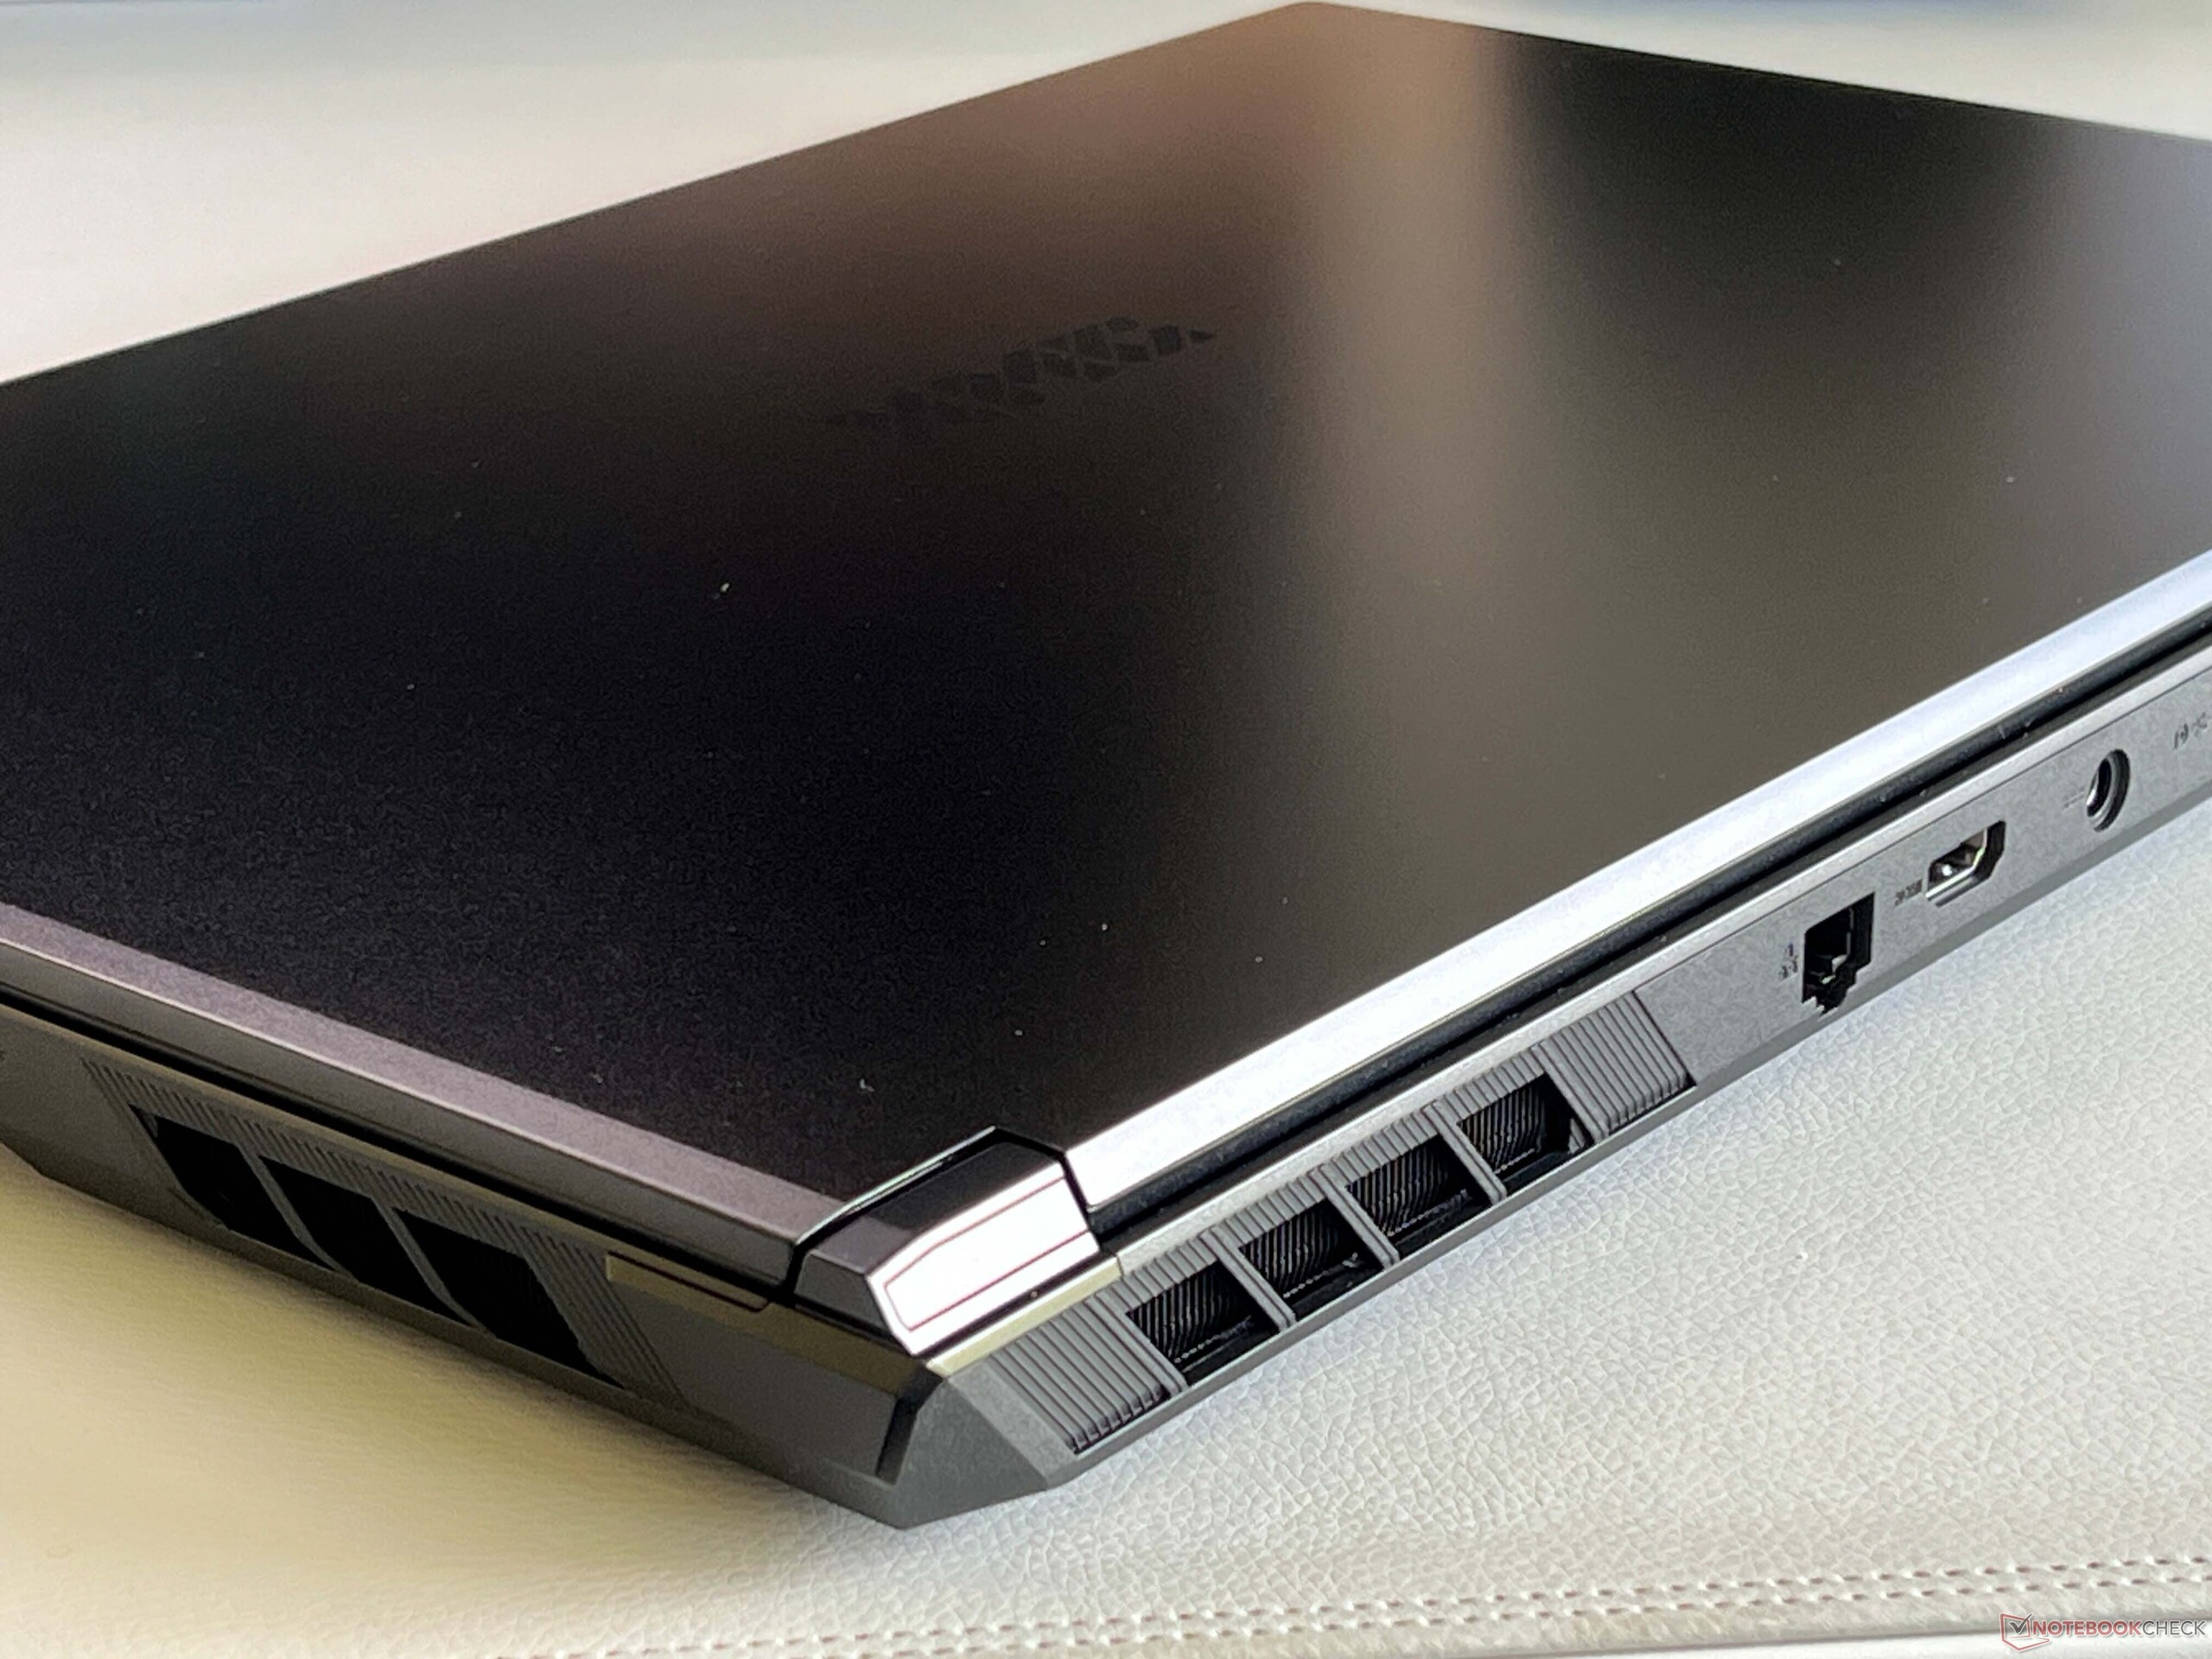
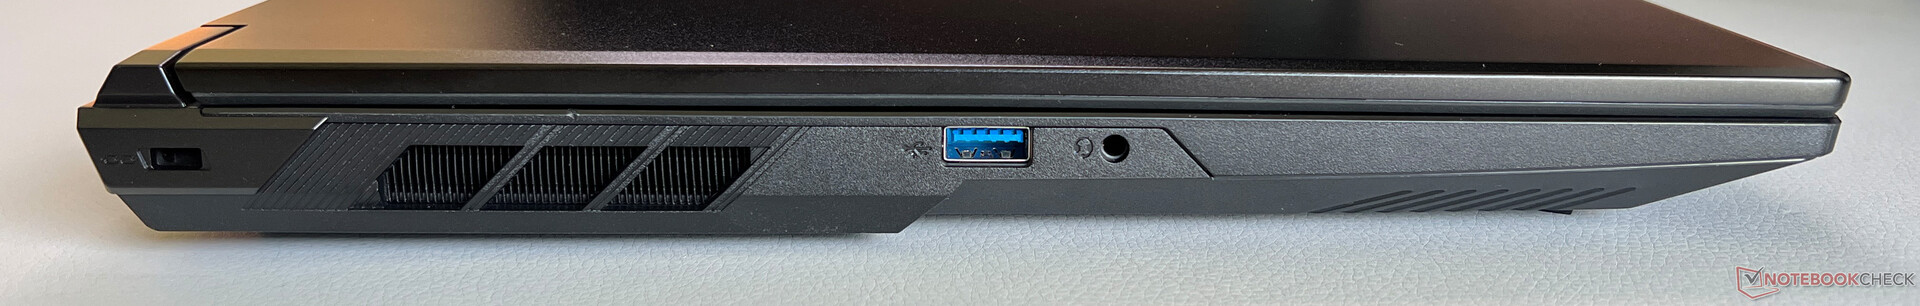
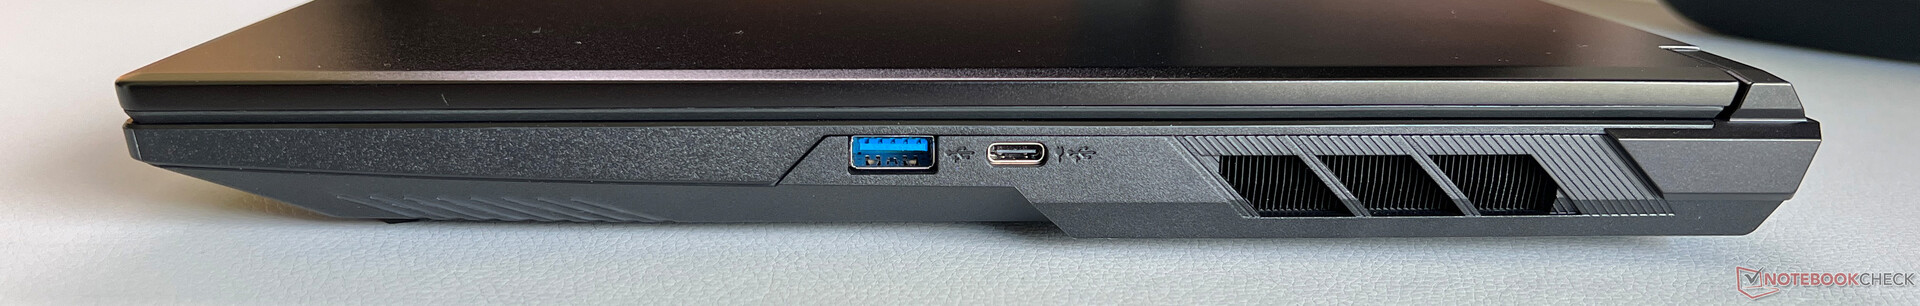
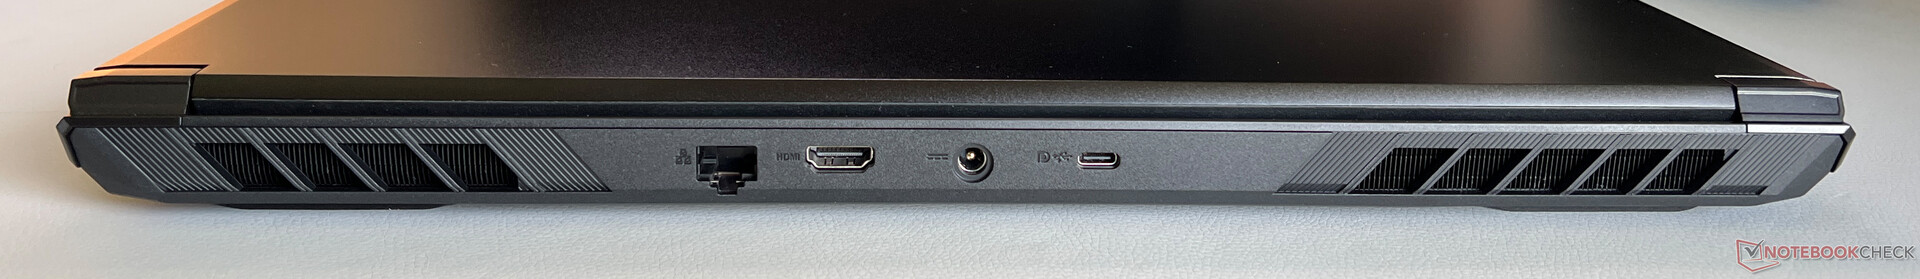
Thunderbolt è assente, ma ci sono sufficienti porte USB e un modulo Intel Wi-Fi 7, che convince per le buone e stabili velocità di trasferimento. La webcam da 1080p (che include un otturatore meccanico) scatta solo foto medie, e non c'è un modulo IR.


| Networking | |
| Schenker XMG Focus 17 M25 | |
| iperf3 transmit AXE11000 | |
| iperf3 receive AXE11000 | |
| MSI Vector 17 HX AI A2XWIG | |
| iperf3 transmit AXE11000 | |
| iperf3 receive AXE11000 | |
| iperf3 transmit AXE11000 6GHz | |
| iperf3 receive AXE11000 6GHz | |
| Lenovo Legion 5 Pro 16IAX10H | |
| iperf3 transmit AXE11000 | |
| iperf3 receive AXE11000 | |
| MSI Vector 16 HX AI A2XWHG | |
| iperf3 transmit AXE11000 | |
| iperf3 receive AXE11000 | |
| Schenker XMG Pro 16 (E25) | |
| iperf3 transmit AXE11000 | |
| iperf3 receive AXE11000 | |


Sostenibilità
Il produttore non ha rilasciato dichiarazioni sulla sostenibilità. La confezione è completamente riciclabile.
Dispositivi di ingresso
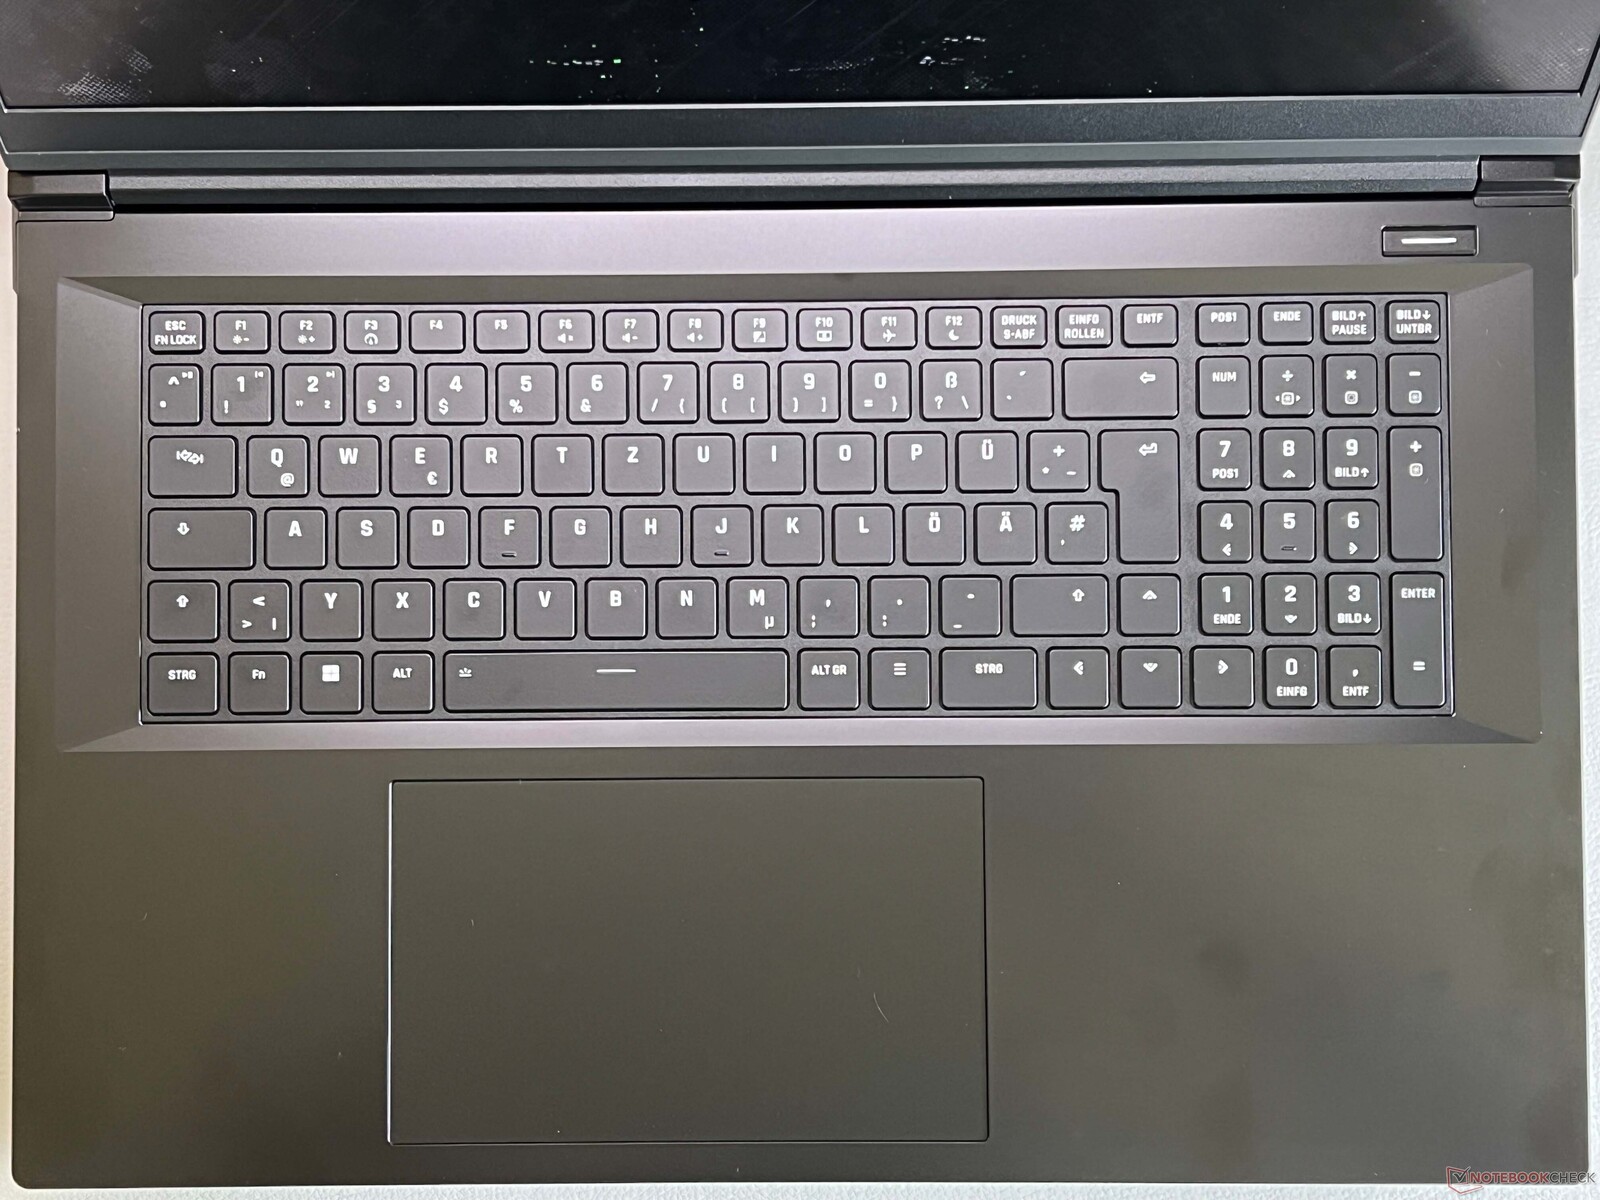
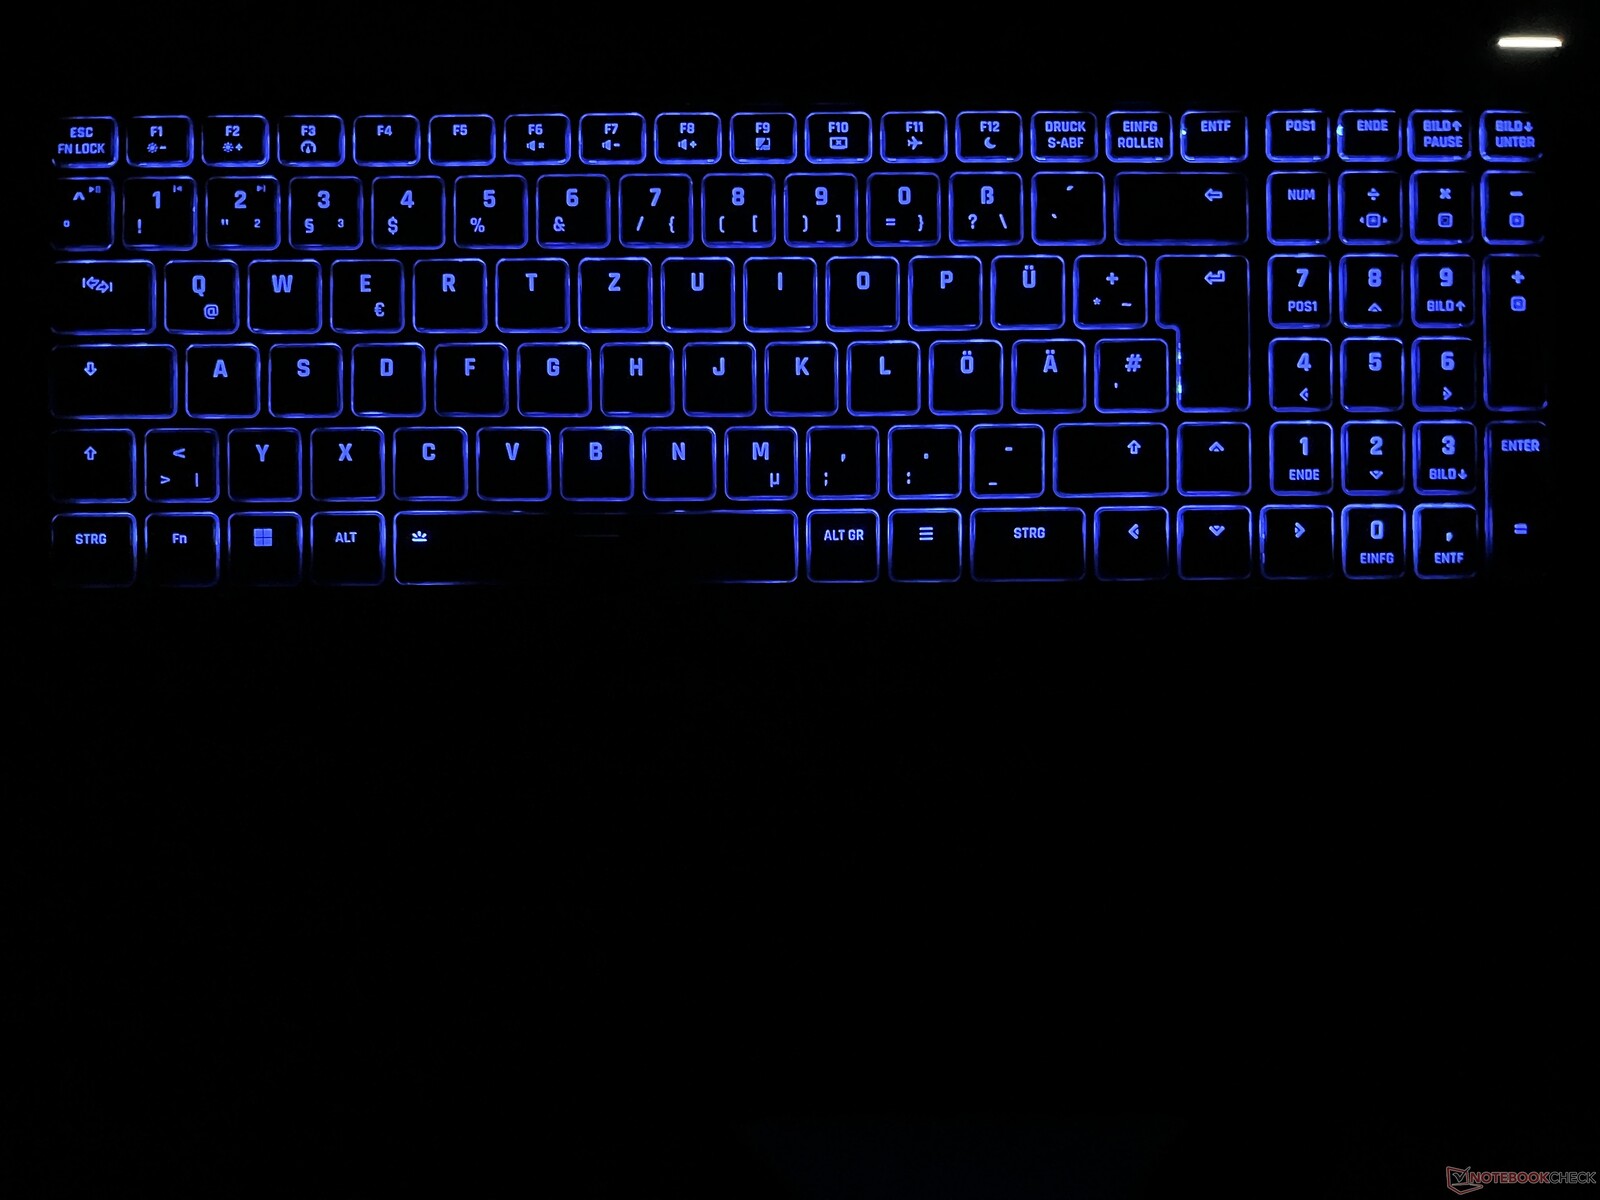
XMG ha dotato la tastiera di un tastierino numerico dedicato e di un'illuminazione RGB a zona singola. La digitazione è confortevole, con una corsa dei tasti sufficiente e un feedback preciso. Inoltre, i tasti non sono troppo rumorosi. Il grande clickpad è relativamente morbido al tatto. È sufficientemente grande (15 x 9 cm) e molto ben imbottito (nessun rumore). Solo i clic meccanici nell'area inferiore sono molto rumorosi.
Display - A 240 Hz IPS

Il Focus utilizza un pannello IPS da 17,3 pollici con un rapporto di aspetto 16:9 e una risoluzione QHD di 2.560 x 1.440 pixel. La qualità dell'immagine del pannello opaco è buona, con le aree luminose che appaiono solo minimamente sgranate, anche se questo è difficilmente percepibile nell'uso quotidiano. I colori sono vivaci e il movimento è fluido grazie alla frequenza di aggiornamento di 240 Hz. Anche i tempi di risposta sono rapidi e non c'è sfarfallio PWM.
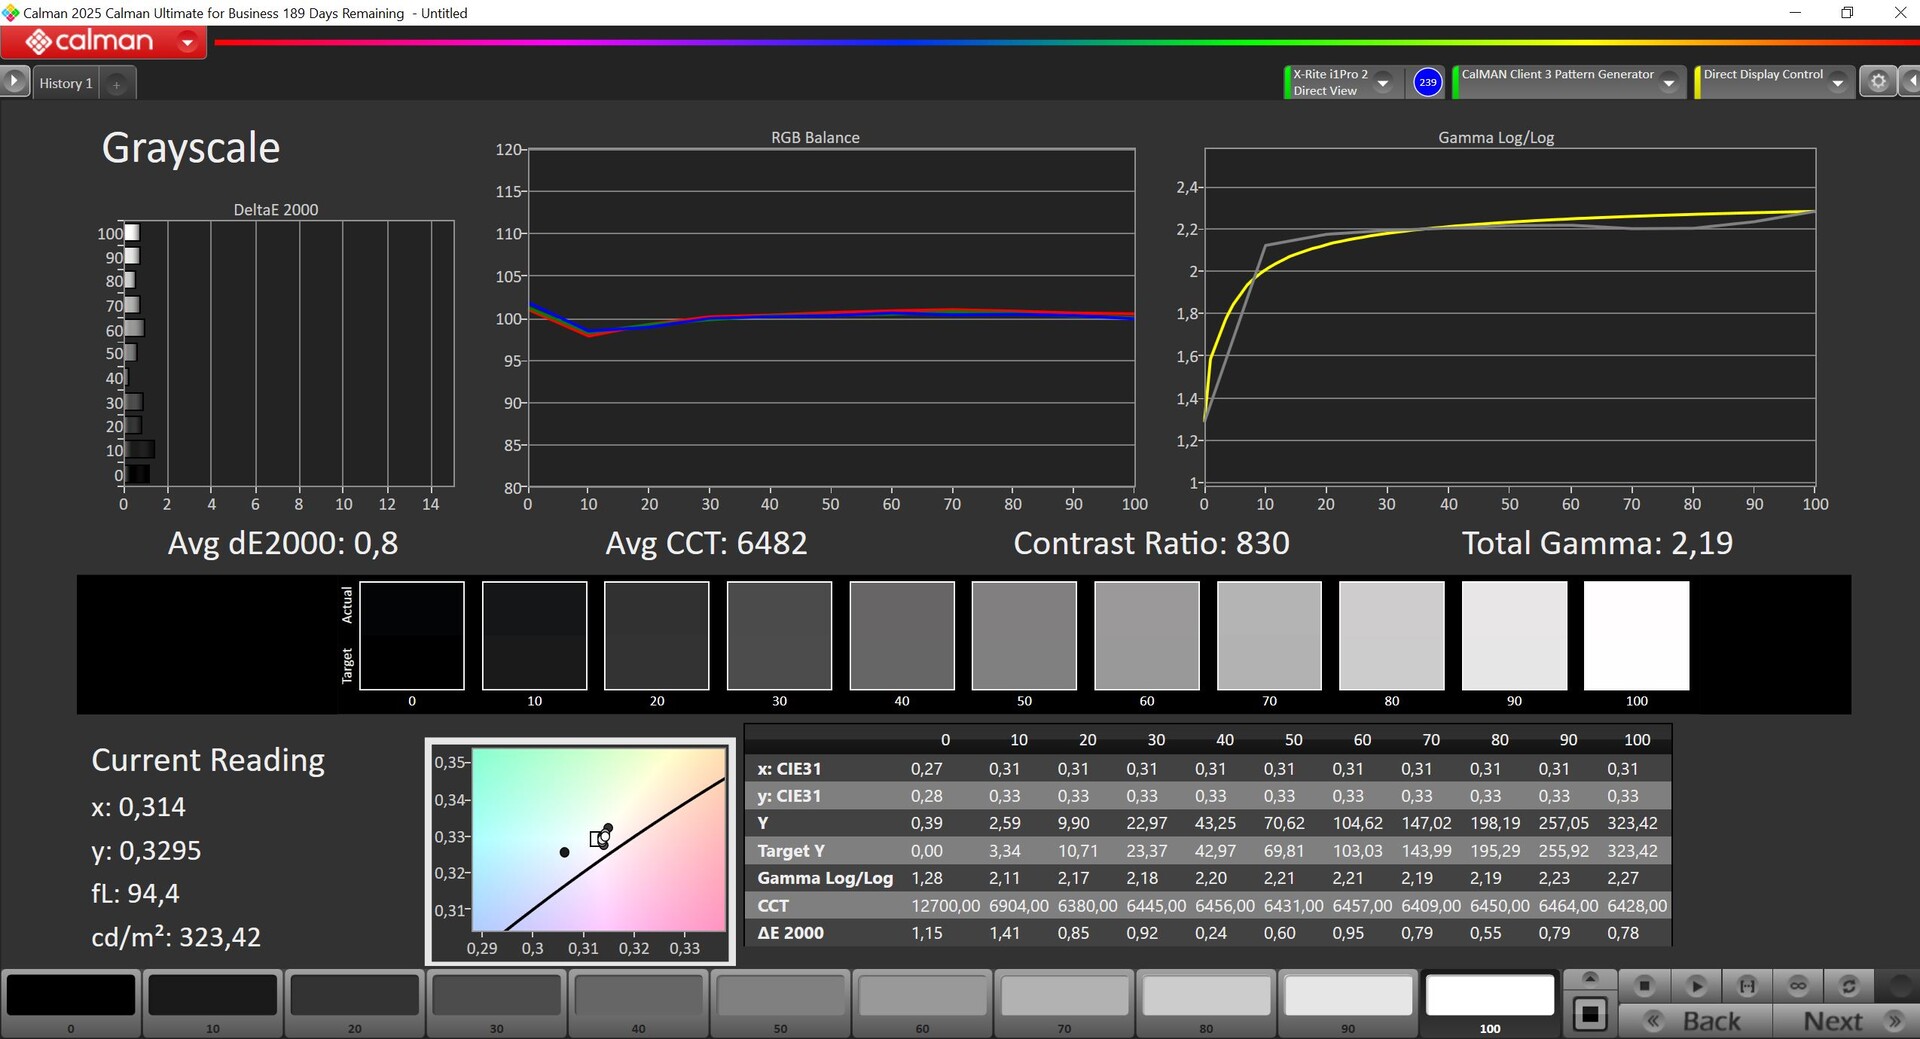
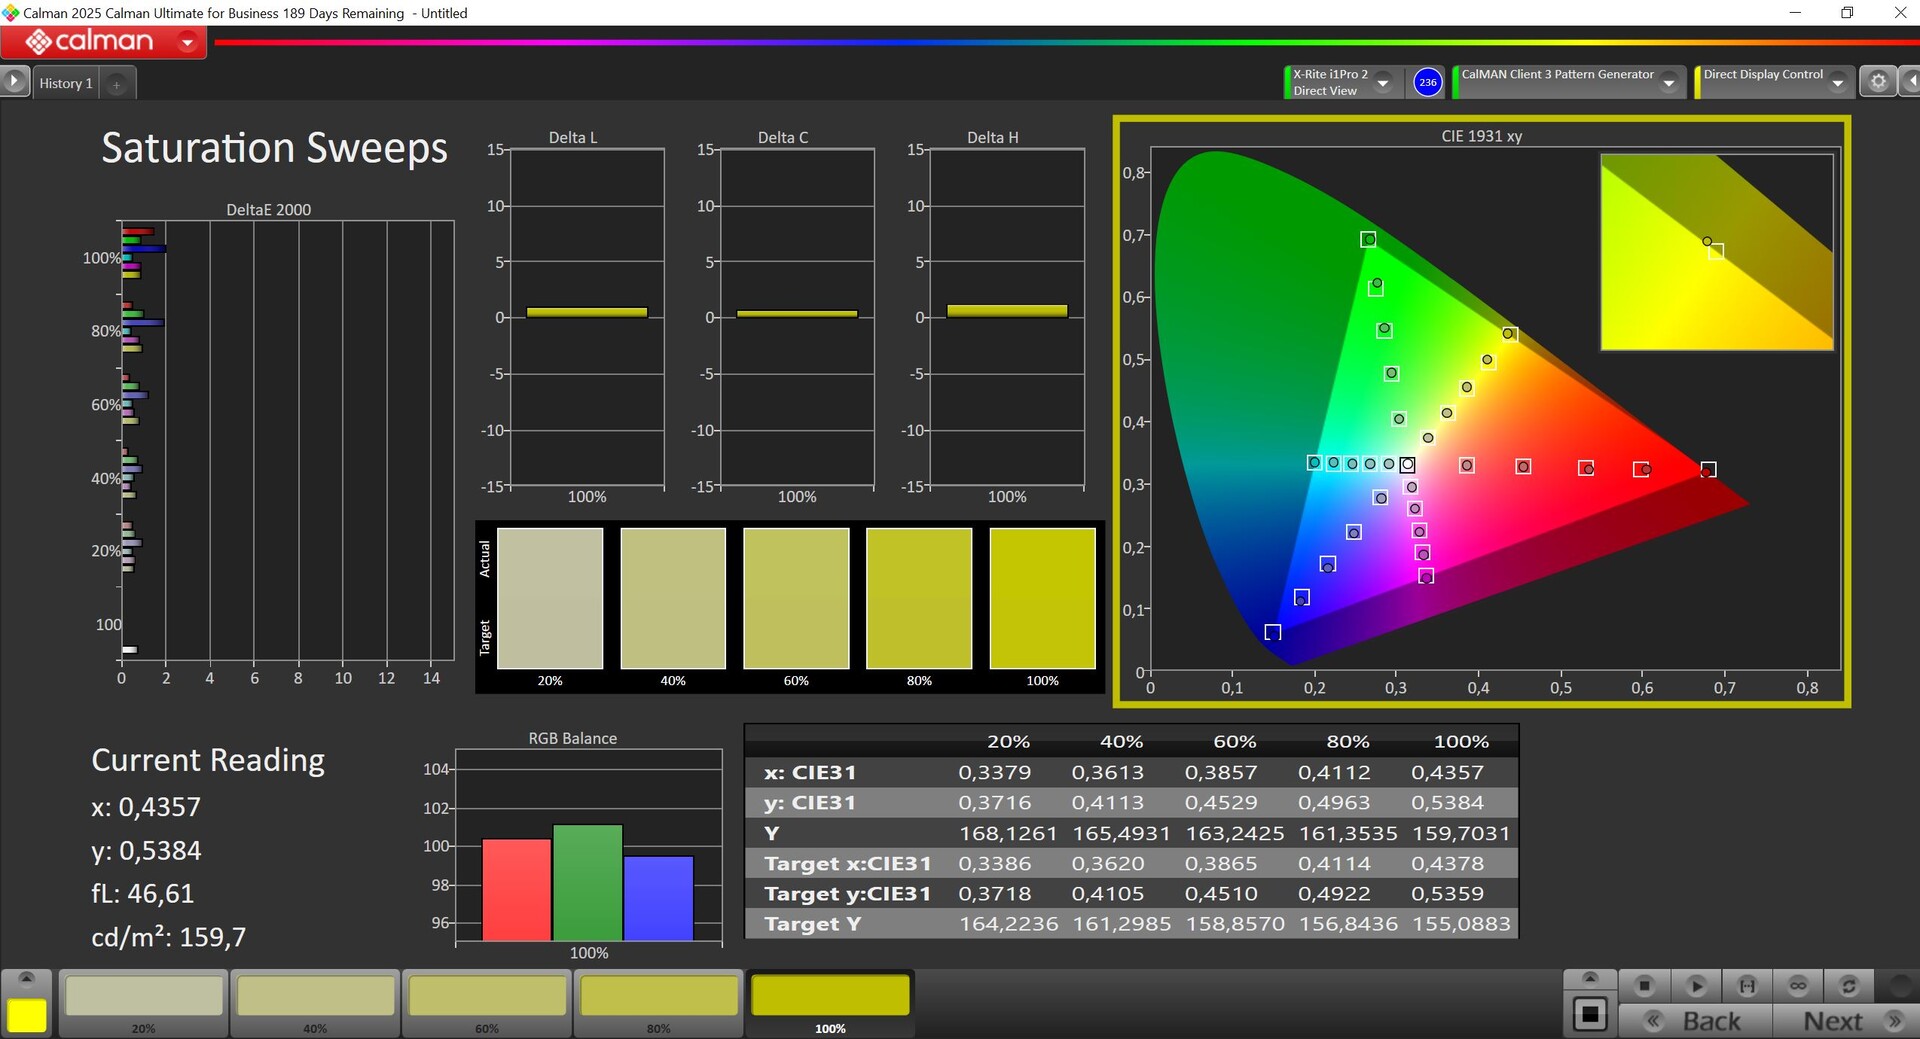
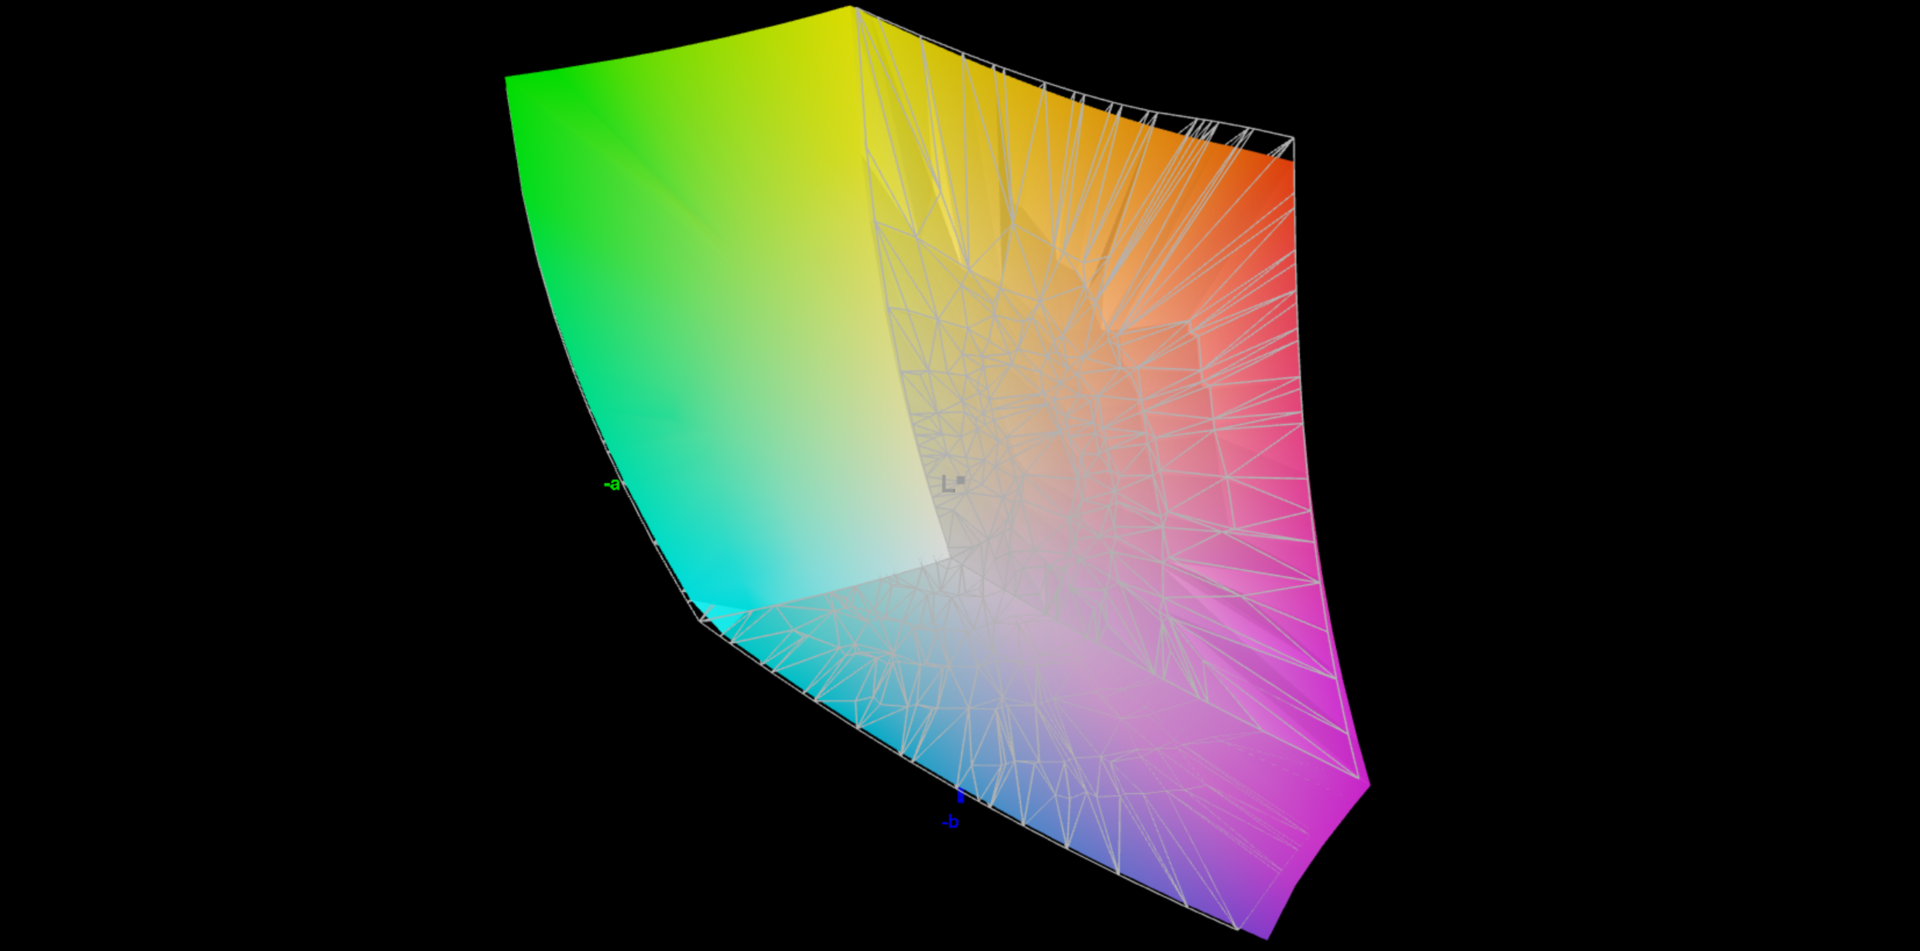
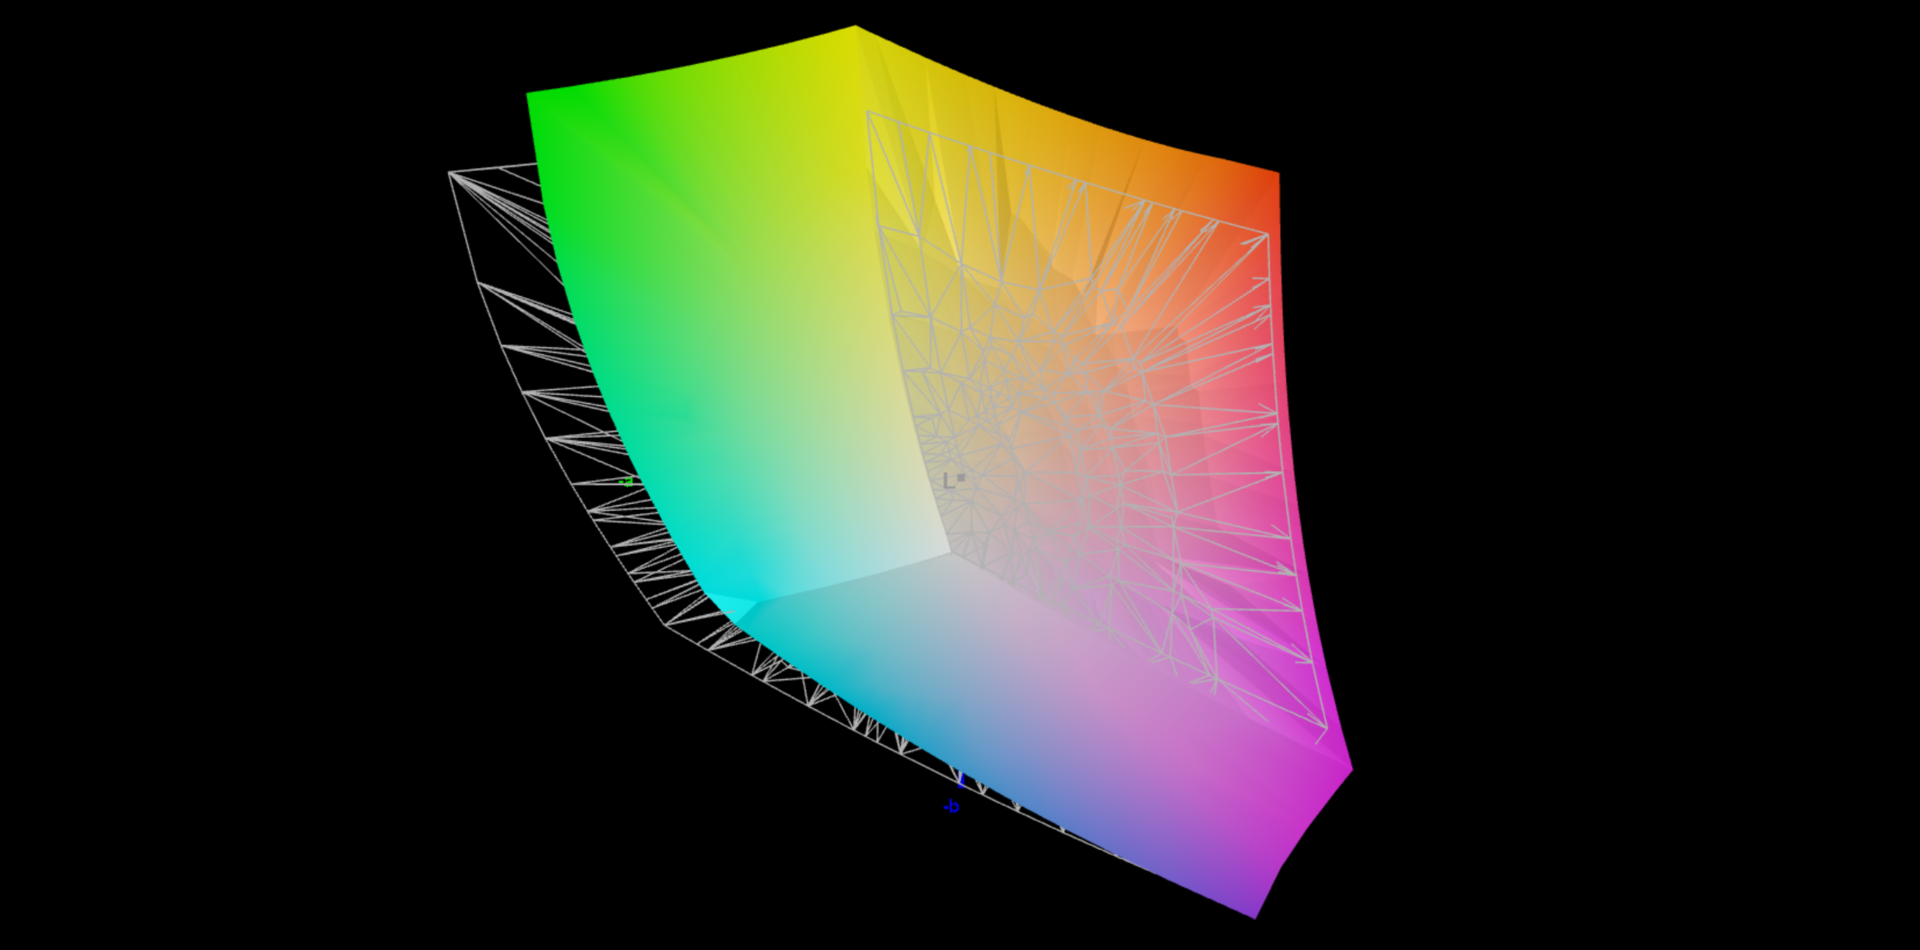
XMG ha specificato una luminosità di 300 cd/m², che il nostro modello di prova riesce a superare con un massimo di 347 cd/m² (media 325 cd/m²). Il rapporto di contrasto è buono, con un massimo di 1.335:1, ma la nostra analisi con il software professionale CalMAN evidenzia una netta tinta blu nelle impostazioni di fabbrica, unita a una temperatura di colore troppo fredda. Oltre a questo, ci sono anche deviazioni cromatiche significative. Con la nostra calibrazione (il profilo è disponibile per il download gratuito nel riquadro a destra), siamo riusciti a migliorare in modo significativo le immagini visualizzate. Entrambi gli spazi colore P3 e sRGB sono completamente coperti, ma non esiste un profilo sRGB. Nel complesso, il pannello è adatto ai giochi, ma la concorrenza è superiore, soprattutto in termini di luminosità.
| |||||||||||||||||||||||||
Distribuzione della luminosità: 84 %
Al centro con la batteria: 347 cd/m²
Contrasto: 1335:1 (Nero: 0.26 cd/m²)
ΔE ColorChecker Calman: 3.3 | ∀{0.5-29.43 Ø4.74}
calibrated: 0.9
ΔE Greyscale Calman: 4.5 | ∀{0.09-98 Ø4.99}
86% AdobeRGB 1998 (Argyll 3D)
99.9% sRGB (Argyll 3D)
98.3% Display P3 (Argyll 3D)
Gamma: 2.05
CCT: 7365 K
| Schenker XMG Focus 17 M25 NE173QHM-NZ1, IPS, 2560x1440, 17.3", 240 Hz | MSI Vector 17 HX AI A2XWIG B170QAN01.2 (AUO84A6), IPS, 2560x1600, 17", 240 Hz | Lenovo Legion 5 Pro 16IAX10H ATNA60HS01-0 (Samsung SDC420A), OLED, 2560x1600, 16", 165 Hz | MSI Vector 16 HX AI A2XWHG B160QAN02.3 (AUO7DB2), IPS, 2560x1600, 16", 240 Hz | Schenker XMG Pro 16 (E25) NE160QDM-NZL, IPS, 2560x1600, 16", 300 Hz | |
|---|---|---|---|---|---|
| Display | 1% | 4% | -1% | -12% | |
| Display P3 Coverage (%) | 98.3 | 99.6 1% | 99.9 2% | 96.6 -2% | 74.7 -24% |
| sRGB Coverage (%) | 99.9 | 100 0% | 100 0% | 99.8 0% | 99.8 0% |
| AdobeRGB 1998 Coverage (%) | 86 | 87.4 2% | 94.1 9% | 84.4 -2% | 75.4 -12% |
| Response Times | 56% | 84% | 45% | 26% | |
| Response Time Grey 50% / Grey 80% * (ms) | 13.7 ? | 3.6 ? 74% | 2 ? 85% | 4.3 ? 69% | 10.5 ? 23% |
| Response Time Black / White * (ms) | 7.6 ? | 4.8 ? 37% | 1.4 ? 82% | 6 ? 21% | 5.4 ? 29% |
| PWM Frequency (Hz) | 1300 | ||||
| PWM Amplitude * (%) | 16.7 | ||||
| Screen | 4% | 12% | -2% | 19% | |
| Brightness middle (cd/m²) | 347 | 488 41% | 518 49% | 473 36% | 538 55% |
| Brightness (cd/m²) | 325 | 473 46% | 522 61% | 426 31% | 508 56% |
| Brightness Distribution (%) | 84 | 91 8% | 97 15% | 85 1% | 88 5% |
| Black Level * (cd/m²) | 0.26 | 0.74 -185% | 0.42 -62% | 0.47 -81% | |
| Contrast (:1) | 1335 | 659 -51% | 1126 -16% | 1145 -14% | |
| Colorchecker dE 2000 * | 3.3 | 1.67 49% | 2.49 25% | 3.47 -5% | 1.9 42% |
| Colorchecker dE 2000 max. * | 8.4 | 3.43 59% | 5.25 37% | 7.24 14% | 4 52% |
| Colorchecker dE 2000 calibrated * | 0.9 | 0.8 11% | 2.15 -139% | 1.36 -51% | |
| Greyscale dE 2000 * | 4.5 | 2.08 54% | 3.02 33% | 3.1 31% | 2.7 40% |
| Gamma | 2.05 107% | 2.55 86% | 2.37 93% | 2.486 88% | 2.24 98% |
| CCT | 7365 88% | 6240 104% | 6426 101% | 6832 95% | 7027 93% |
| Media totale (Programma / Settaggio) | 20% /
10% | 33% /
22% | 14% /
5% | 11% /
13% |
* ... Meglio usare valori piccoli


Tempi di risposta del Display
| ↔ Tempi di risposta dal Nero al Bianco | ||
|---|---|---|
| 7.6 ms ... aumenta ↗ e diminuisce ↘ combinato | ↗ 3.1 ms Incremento | 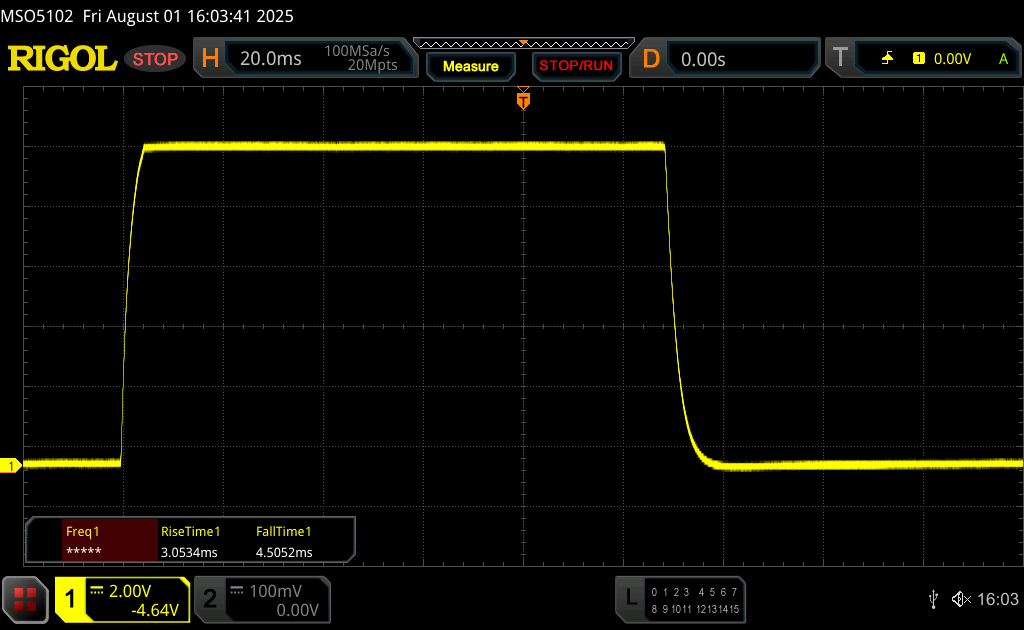 |
| ↘ 4.5 ms Calo | ||
| Lo schermo ha mostrato valori di risposta molto veloci nei nostri tests ed è molto adatto per i gaming veloce. In confronto, tutti i dispositivi di test variano da 0.1 (minimo) a 240 (massimo) ms. » 21 % di tutti i dispositivi è migliore. Questo significa che i tempi di risposta rilevati sono migliori rispettto alla media di tutti i dispositivi testati (20 ms). | ||
| ↔ Tempo di risposta dal 50% Grigio all'80% Grigio | ||
| 13.7 ms ... aumenta ↗ e diminuisce ↘ combinato | ↗ 6.5 ms Incremento | 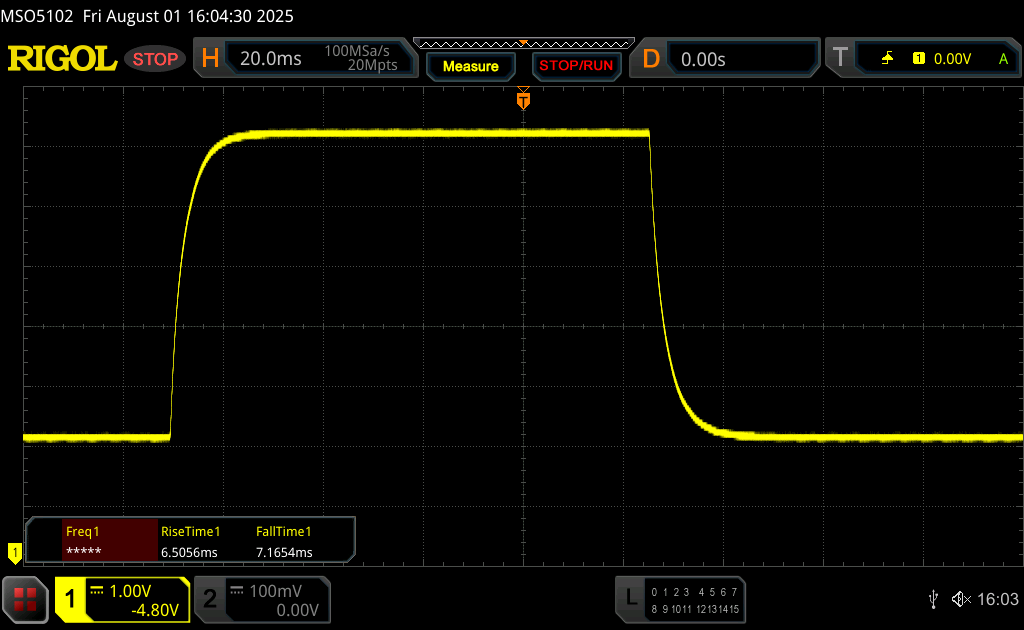 |
| ↘ 7.2 ms Calo | ||
| Lo schermo mostra buoni tempi di risposta durante i nostri tests, ma potrebbe essere troppo lento per i gamers competitivi. In confronto, tutti i dispositivi di test variano da 0.165 (minimo) a 636 (massimo) ms. » 27 % di tutti i dispositivi è migliore. Questo significa che i tempi di risposta rilevati sono migliori rispettto alla media di tutti i dispositivi testati (31.3 ms). | ||
Sfarfallio dello schermo / PWM (Pulse-Width Modulation)
| flickering dello schermo / PWM non rilevato |  | ||
In confronto: 53 % di tutti i dispositivi testati non utilizza PWM per ridurre la luminosita' del display. Se è rilevato PWM, una media di 7920 (minimo: 5 - massimo: 343500) Hz è stata rilevata. | |||


Prestazioni - Una GPU 5070 Ti per laptop con un massimo di 96 GB di RAM
Condizioni del test
Nel Centro di controllo sono disponibili diversi profili di alimentazione, ognuno dei quali offre dei sottoprofili. Le massime prestazioni di gioco sono disponibili solo in modalità Prestazioni/Turbo. Sebbene le prestazioni massime della GPU siano generalmente disponibili in modalità Prestazioni/Auto, le prestazioni differiscono quando gioca con il carico simultaneo della CPU (TGP massimo quindi 100 watt).
| Profilo energetico | TDP della CPU | CB24 Multi | GPU TGP | Time Spy Grafica | CP2077 QHD Ultra | volume massimo della ventola |
|---|---|---|---|---|---|---|
| Silenzioso | 30/28 watt | 591 punti | 100 watt | 14.202 punti | 61,2fps | 37 dB(A) |
| Intrattenimento | 115/45 watt | 1.013 punti | 100 watt | 14.463 punti | 68,1fps | 46,6 dB(A) |
| Prestazioni (Auto) | 150/120 watt | 1.624 punti | 140/100 watt | 14.833 punti | 69,8fps | 51,9 dB(A) |
| Prestazioni (Turbo) | 150/135 watt | 1.675 punti | 140 watt | 17.211 punti | 81fps | 56,2 dB(A) |
| Batteria | 30 watt | 619 punti | 35 watt | 3.423 punti | 17,9fps | 33,6 dB(A) |
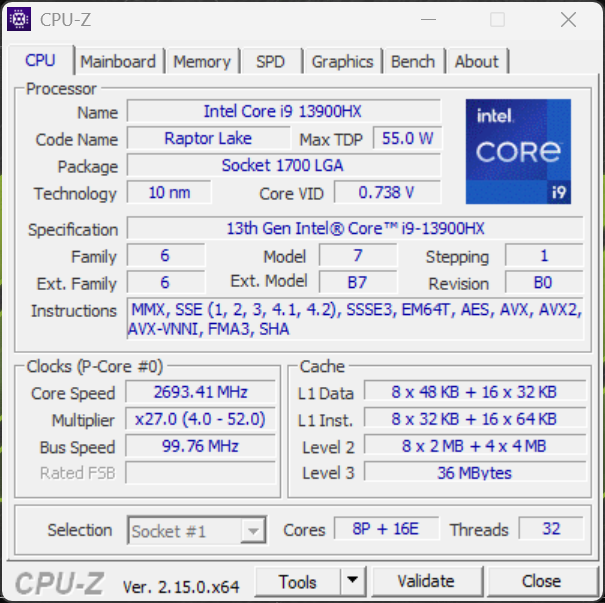
Processore - Core i9-13900HX
Come standard, il Focus 17 M25 è dotato del vecchio Core i9-13900HX. Tuttavia, è disponibile come opzione anche il Core i9-14900HX. Le prestazioni della CPU continuano ad essere buone, ma, come ci si aspettava, il Raptor Lake è inferiore al Core Ultra 9 275HX. Tuttavia, il più costoso Vector 17 con il 275HX è solo minimamente più veloce a causa dei limiti di potenza inferiori.
Cinebench R15 Multi Sustained Test
Cinebench 2024: CPU Multi Core | CPU Single Core
Cinebench R23: Multi Core | Single Core
Cinebench R20: CPU (Multi Core) | CPU (Single Core)
Cinebench R15: CPU Multi 64Bit | CPU Single 64Bit
Blender: v2.79 BMW27 CPU
7-Zip 18.03: 7z b 4 | 7z b 4 -mmt1
Geekbench 6.6: Multi-Core | Single-Core
Geekbench 5.5: Multi-Core | Single-Core
HWBOT x265 Benchmark v2.2: 4k Preset
LibreOffice : 20 Documents To PDF
R Benchmark 2.5: Overall mean
| CPU Performance rating | |
| Schenker XMG Pro 16 (E25) | |
| Lenovo Legion 5 Pro 16IAX10H -2! | |
| MSI Vector 17 HX AI A2XWIG -2! | |
| Schenker XMG Focus 17 M25 | |
| Media Intel Core i9-13900HX | |
| MSI Vector 16 HX AI A2XWHG | |
| Media della classe Gaming | |
| Cinebench 2024 / CPU Multi Core | |
| Schenker XMG Pro 16 (E25) | |
| Schenker XMG Focus 17 M25 | |
| Media Intel Core i9-13900HX (n=1) | |
| MSI Vector 16 HX AI A2XWHG | |
| Media della classe Gaming (486 - 2298, n=94, ultimi 2 anni) | |
| Cinebench 2024 / CPU Single Core | |
| Schenker XMG Pro 16 (E25) | |
| MSI Vector 16 HX AI A2XWHG | |
| Schenker XMG Focus 17 M25 | |
| Media Intel Core i9-13900HX (n=1) | |
| Media della classe Gaming (95 - 138.2, n=94, ultimi 2 anni) | |
| Cinebench R23 / Multi Core | |
| Lenovo Legion 5 Pro 16IAX10H | |
| Schenker XMG Pro 16 (E25) | |
| MSI Vector 17 HX AI A2XWIG | |
| Schenker XMG Focus 17 M25 | |
| Media Intel Core i9-13900HX (24270 - 32623, n=23) | |
| MSI Vector 16 HX AI A2XWHG | |
| Media della classe Gaming (10488 - 40970, n=126, ultimi 2 anni) | |
| Cinebench R23 / Single Core | |
| Lenovo Legion 5 Pro 16IAX10H | |
| Schenker XMG Pro 16 (E25) | |
| MSI Vector 17 HX AI A2XWIG | |
| MSI Vector 16 HX AI A2XWHG | |
| Schenker XMG Focus 17 M25 | |
| Media Intel Core i9-13900HX (1867 - 2105, n=20) | |
| Media della classe Gaming (1166 - 2267, n=126, ultimi 2 anni) | |
| Cinebench R20 / CPU (Multi Core) | |
| Lenovo Legion 5 Pro 16IAX10H | |
| Schenker XMG Pro 16 (E25) | |
| MSI Vector 17 HX AI A2XWIG | |
| Schenker XMG Focus 17 M25 | |
| Media Intel Core i9-13900HX (9152 - 12541, n=21) | |
| MSI Vector 16 HX AI A2XWHG | |
| Media della classe Gaming (4029 - 16108, n=125, ultimi 2 anni) | |
| Cinebench R20 / CPU (Single Core) | |
| Lenovo Legion 5 Pro 16IAX10H | |
| Schenker XMG Pro 16 (E25) | |
| MSI Vector 17 HX AI A2XWIG | |
| MSI Vector 16 HX AI A2XWHG | |
| Schenker XMG Focus 17 M25 | |
| Media Intel Core i9-13900HX (722 - 810, n=21) | |
| Media della classe Gaming (442 - 870, n=125, ultimi 2 anni) | |
| Cinebench R15 / CPU Multi 64Bit | |
| Lenovo Legion 5 Pro 16IAX10H | |
| Schenker XMG Pro 16 (E25) | |
| MSI Vector 17 HX AI A2XWIG | |
| Media Intel Core i9-13900HX (3913 - 4970, n=22) | |
| Schenker XMG Focus 17 M25 | |
| MSI Vector 16 HX AI A2XWHG | |
| Media della classe Gaming (1578 - 6271, n=126, ultimi 2 anni) | |
| Cinebench R15 / CPU Single 64Bit | |
| MSI Vector 17 HX AI A2XWIG | |
| MSI Vector 17 HX AI A2XWIG | |
| Schenker XMG Pro 16 (E25) | |
| Lenovo Legion 5 Pro 16IAX10H | |
| MSI Vector 16 HX AI A2XWHG | |
| Schenker XMG Focus 17 M25 | |
| Media Intel Core i9-13900HX (247 - 304, n=22) | |
| Media della classe Gaming (188.8 - 343, n=125, ultimi 2 anni) | |
| Blender / v2.79 BMW27 CPU | |
| Media della classe Gaming (80 - 330, n=122, ultimi 2 anni) | |
| MSI Vector 16 HX AI A2XWHG | |
| Media Intel Core i9-13900HX (101 - 153, n=22) | |
| MSI Vector 17 HX AI A2XWIG | |
| Schenker XMG Focus 17 M25 | |
| Lenovo Legion 5 Pro 16IAX10H | |
| Schenker XMG Pro 16 (E25) | |
| 7-Zip 18.03 / 7z b 4 | |
| Schenker XMG Focus 17 M25 | |
| Schenker XMG Pro 16 (E25) | |
| Lenovo Legion 5 Pro 16IAX10H | |
| Media Intel Core i9-13900HX (90675 - 127283, n=21) | |
| MSI Vector 17 HX AI A2XWIG | |
| Media della classe Gaming (33491 - 148086, n=123, ultimi 2 anni) | |
| MSI Vector 16 HX AI A2XWHG | |
| 7-Zip 18.03 / 7z b 4 -mmt1 | |
| Schenker XMG Focus 17 M25 | |
| Schenker XMG Pro 16 (E25) | |
| Media Intel Core i9-13900HX (6340 - 7177, n=21) | |
| Lenovo Legion 5 Pro 16IAX10H | |
| MSI Vector 17 HX AI A2XWIG | |
| MSI Vector 16 HX AI A2XWHG | |
| Media della classe Gaming (4199 - 7508, n=123, ultimi 2 anni) | |
| Geekbench 6.6 / Multi-Core | |
| Schenker XMG Pro 16 (E25) | |
| Lenovo Legion 5 Pro 16IAX10H | |
| MSI Vector 17 HX AI A2XWIG | |
| MSI Vector 16 HX AI A2XWHG | |
| Schenker XMG Focus 17 M25 | |
| Media Intel Core i9-13900HX (15031 - 18014, n=3) | |
| Media della classe Gaming (6625 - 22104, n=124, ultimi 2 anni) | |
| Geekbench 6.6 / Single-Core | |
| Schenker XMG Pro 16 (E25) | |
| MSI Vector 17 HX AI A2XWIG | |
| Lenovo Legion 5 Pro 16IAX10H | |
| MSI Vector 16 HX AI A2XWHG | |
| Schenker XMG Focus 17 M25 | |
| Media della classe Gaming (1490 - 3259, n=124, ultimi 2 anni) | |
| Media Intel Core i9-13900HX (2548 - 2892, n=3) | |
| Geekbench 5.5 / Multi-Core | |
| Schenker XMG Pro 16 (E25) | |
| Lenovo Legion 5 Pro 16IAX10H | |
| MSI Vector 17 HX AI A2XWIG | |
| Schenker XMG Focus 17 M25 | |
| Media Intel Core i9-13900HX (17614 - 21075, n=22) | |
| MSI Vector 16 HX AI A2XWHG | |
| Media della classe Gaming (6460 - 27010, n=123, ultimi 2 anni) | |
| Geekbench 5.5 / Single-Core | |
| Schenker XMG Pro 16 (E25) | |
| Lenovo Legion 5 Pro 16IAX10H | |
| MSI Vector 17 HX AI A2XWIG | |
| MSI Vector 16 HX AI A2XWHG | |
| Schenker XMG Focus 17 M25 | |
| Media della classe Gaming (986 - 2474, n=123, ultimi 2 anni) | |
| Media Intel Core i9-13900HX (1345 - 2093, n=22) | |
| HWBOT x265 Benchmark v2.2 / 4k Preset | |
| Schenker XMG Pro 16 (E25) | |
| Lenovo Legion 5 Pro 16IAX10H | |
| MSI Vector 17 HX AI A2XWIG | |
| MSI Vector 16 HX AI A2XWHG | |
| Schenker XMG Focus 17 M25 | |
| Media Intel Core i9-13900HX (23.5 - 34.4, n=22) | |
| Media della classe Gaming (11.5 - 44.3, n=123, ultimi 2 anni) | |
| LibreOffice / 20 Documents To PDF | |
| Schenker XMG Pro 16 (E25) | |
| Schenker XMG Focus 17 M25 | |
| Media della classe Gaming (19 - 88.8, n=123, ultimi 2 anni) | |
| Media Intel Core i9-13900HX (32.8 - 51.1, n=21) | |
| MSI Vector 16 HX AI A2XWHG | |
| MSI Vector 17 HX AI A2XWIG | |
| Lenovo Legion 5 Pro 16IAX10H | |
| R Benchmark 2.5 / Overall mean | |
| Media della classe Gaming (0.3439 - 0.759, n=124, ultimi 2 anni) | |
| MSI Vector 16 HX AI A2XWHG | |
| MSI Vector 17 HX AI A2XWIG | |
| Lenovo Legion 5 Pro 16IAX10H | |
| Schenker XMG Pro 16 (E25) | |
| Schenker XMG Focus 17 M25 | |
| Media Intel Core i9-13900HX (0.375 - 0.4564, n=22) | |
* ... Meglio usare valori piccoli
AIDA64: FP32 Ray-Trace | FPU Julia | CPU SHA3 | CPU Queen | FPU SinJulia | FPU Mandel | CPU AES | CPU ZLib | FP64 Ray-Trace | CPU PhotoWorxx
| Performance rating | |
| Lenovo Legion 5 Pro 16IAX10H | |
| Schenker XMG Pro 16 (E25) | |
| Schenker XMG Focus 17 M25 | |
| MSI Vector 17 HX AI A2XWIG | |
| Media Intel Core i9-13900HX | |
| Media della classe Gaming | |
| MSI Vector 16 HX AI A2XWHG | |
| AIDA64 / FP32 Ray-Trace | |
| Lenovo Legion 5 Pro 16IAX10H | |
| Schenker XMG Pro 16 (E25) | |
| Media della classe Gaming (10227 - 85542, n=123, ultimi 2 anni) | |
| MSI Vector 17 HX AI A2XWIG | |
| MSI Vector 16 HX AI A2XWHG | |
| Schenker XMG Focus 17 M25 | |
| Media Intel Core i9-13900HX (17589 - 27615, n=22) | |
| AIDA64 / FPU Julia | |
| Lenovo Legion 5 Pro 16IAX10H | |
| Schenker XMG Pro 16 (E25) | |
| MSI Vector 17 HX AI A2XWIG | |
| MSI Vector 16 HX AI A2XWHG | |
| Media della classe Gaming (51376 - 238426, n=123, ultimi 2 anni) | |
| Schenker XMG Focus 17 M25 | |
| Media Intel Core i9-13900HX (88686 - 137015, n=22) | |
| AIDA64 / CPU SHA3 | |
| Schenker XMG Pro 16 (E25) | |
| Lenovo Legion 5 Pro 16IAX10H | |
| MSI Vector 17 HX AI A2XWIG | |
| Schenker XMG Focus 17 M25 | |
| MSI Vector 16 HX AI A2XWHG | |
| Media Intel Core i9-13900HX (4362 - 7029, n=22) | |
| Media della classe Gaming (2180 - 9817, n=123, ultimi 2 anni) | |
| AIDA64 / CPU Queen | |
| Lenovo Legion 5 Pro 16IAX10H | |
| Schenker XMG Focus 17 M25 | |
| Media Intel Core i9-13900HX (125644 - 141385, n=22) | |
| Schenker XMG Pro 16 (E25) | |
| MSI Vector 17 HX AI A2XWIG | |
| Media della classe Gaming (49785 - 173351, n=120, ultimi 2 anni) | |
| MSI Vector 16 HX AI A2XWHG | |
| AIDA64 / FPU SinJulia | |
| Schenker XMG Focus 17 M25 | |
| Media Intel Core i9-13900HX (12334 - 17179, n=22) | |
| Media della classe Gaming (4424 - 33636, n=123, ultimi 2 anni) | |
| Schenker XMG Pro 16 (E25) | |
| Lenovo Legion 5 Pro 16IAX10H | |
| MSI Vector 17 HX AI A2XWIG | |
| MSI Vector 16 HX AI A2XWHG | |
| AIDA64 / FPU Mandel | |
| Schenker XMG Pro 16 (E25) | |
| Lenovo Legion 5 Pro 16IAX10H | |
| MSI Vector 17 HX AI A2XWIG | |
| MSI Vector 16 HX AI A2XWHG | |
| Media della classe Gaming (25115 - 128721, n=123, ultimi 2 anni) | |
| Schenker XMG Focus 17 M25 | |
| Media Intel Core i9-13900HX (43850 - 69202, n=22) | |
| AIDA64 / CPU AES | |
| Media Intel Core i9-13900HX (89413 - 237881, n=22) | |
| Lenovo Legion 5 Pro 16IAX10H | |
| Schenker XMG Pro 16 (E25) | |
| Schenker XMG Focus 17 M25 | |
| Media della classe Gaming (39258 - 247074, n=123, ultimi 2 anni) | |
| MSI Vector 17 HX AI A2XWIG | |
| MSI Vector 16 HX AI A2XWHG | |
| AIDA64 / CPU ZLib | |
| Lenovo Legion 5 Pro 16IAX10H | |
| Schenker XMG Pro 16 (E25) | |
| Schenker XMG Focus 17 M25 | |
| Media Intel Core i9-13900HX (1284 - 1958, n=22) | |
| MSI Vector 17 HX AI A2XWIG | |
| Media della classe Gaming (574 - 2531, n=123, ultimi 2 anni) | |
| MSI Vector 16 HX AI A2XWHG | |
| AIDA64 / FP64 Ray-Trace | |
| Lenovo Legion 5 Pro 16IAX10H | |
| Schenker XMG Pro 16 (E25) | |
| Media della classe Gaming (5509 - 45446, n=123, ultimi 2 anni) | |
| MSI Vector 16 HX AI A2XWHG | |
| MSI Vector 17 HX AI A2XWIG | |
| Schenker XMG Focus 17 M25 | |
| Media Intel Core i9-13900HX (9481 - 15279, n=22) | |
| AIDA64 / CPU PhotoWorxx | |
| Schenker XMG Pro 16 (E25) | |
| Lenovo Legion 5 Pro 16IAX10H | |
| MSI Vector 17 HX AI A2XWIG | |
| Schenker XMG Focus 17 M25 | |
| Media Intel Core i9-13900HX (42994 - 51994, n=22) | |
| Media della classe Gaming (12271 - 62916, n=123, ultimi 2 anni) | |
| MSI Vector 16 HX AI A2XWHG | |
Prestazioni del sistema
Il Focus 17 è un compagno molto veloce nelle situazioni quotidiane, e anche i risultati dei benchmark sono buoni. Non abbiamo riscontrato alcun problema di stabilità del sistema durante i test.
PCMark 10: Score | Essentials | Productivity | Digital Content Creation
CrossMark: Overall | Productivity | Creativity | Responsiveness
WebXPRT 3: Overall
WebXPRT 4: Overall
Mozilla Kraken 1.1: Total
| Performance rating | |
| Lenovo Legion 5 Pro 16IAX10H | |
| Schenker XMG Pro 16 (E25) | |
| MSI Vector 17 HX AI A2XWIG | |
| Schenker XMG Focus 17 M25 | |
| Media Intel Core i9-13900HX, NVIDIA GeForce RTX 5070 Ti Laptop | |
| Media della classe Gaming | |
| MSI Vector 16 HX AI A2XWHG | |
| PCMark 10 / Score | |
| Schenker XMG Pro 16 (E25) | |
| MSI Vector 17 HX AI A2XWIG | |
| Lenovo Legion 5 Pro 16IAX10H | |
| Media della classe Gaming (5828 - 10060, n=105, ultimi 2 anni) | |
| MSI Vector 16 HX AI A2XWHG | |
| Schenker XMG Focus 17 M25 | |
| Media Intel Core i9-13900HX, NVIDIA GeForce RTX 5070 Ti Laptop (n=1) | |
| PCMark 10 / Essentials | |
| Schenker XMG Pro 16 (E25) | |
| Schenker XMG Focus 17 M25 | |
| Media Intel Core i9-13900HX, NVIDIA GeForce RTX 5070 Ti Laptop (n=1) | |
| MSI Vector 17 HX AI A2XWIG | |
| Lenovo Legion 5 Pro 16IAX10H | |
| MSI Vector 16 HX AI A2XWHG | |
| Media della classe Gaming (8810 - 12600, n=109, ultimi 2 anni) | |
| PCMark 10 / Productivity | |
| Media della classe Gaming (6662 - 16716, n=107, ultimi 2 anni) | |
| Lenovo Legion 5 Pro 16IAX10H | |
| Schenker XMG Pro 16 (E25) | |
| MSI Vector 16 HX AI A2XWHG | |
| MSI Vector 17 HX AI A2XWIG | |
| Schenker XMG Focus 17 M25 | |
| Media Intel Core i9-13900HX, NVIDIA GeForce RTX 5070 Ti Laptop (n=1) | |
| PCMark 10 / Digital Content Creation | |
| MSI Vector 17 HX AI A2XWIG | |
| Schenker XMG Pro 16 (E25) | |
| Lenovo Legion 5 Pro 16IAX10H | |
| Media della classe Gaming (7602 - 19351, n=107, ultimi 2 anni) | |
| Schenker XMG Focus 17 M25 | |
| Media Intel Core i9-13900HX, NVIDIA GeForce RTX 5070 Ti Laptop (n=1) | |
| MSI Vector 16 HX AI A2XWHG | |
| CrossMark / Overall | |
| Schenker XMG Focus 17 M25 | |
| Media Intel Core i9-13900HX, NVIDIA GeForce RTX 5070 Ti Laptop (n=1) | |
| MSI Vector 17 HX AI A2XWIG | |
| Schenker XMG Pro 16 (E25) | |
| Lenovo Legion 5 Pro 16IAX10H | |
| Media della classe Gaming (1366 - 2344, n=107, ultimi 2 anni) | |
| MSI Vector 16 HX AI A2XWHG | |
| CrossMark / Productivity | |
| MSI Vector 17 HX AI A2XWIG | |
| Lenovo Legion 5 Pro 16IAX10H | |
| Schenker XMG Focus 17 M25 | |
| Media Intel Core i9-13900HX, NVIDIA GeForce RTX 5070 Ti Laptop (n=1) | |
| Schenker XMG Pro 16 (E25) | |
| MSI Vector 16 HX AI A2XWHG | |
| Media della classe Gaming (1386 - 2211, n=107, ultimi 2 anni) | |
| CrossMark / Creativity | |
| Schenker XMG Pro 16 (E25) | |
| Schenker XMG Focus 17 M25 | |
| Media Intel Core i9-13900HX, NVIDIA GeForce RTX 5070 Ti Laptop (n=1) | |
| Lenovo Legion 5 Pro 16IAX10H | |
| MSI Vector 17 HX AI A2XWIG | |
| MSI Vector 16 HX AI A2XWHG | |
| Media della classe Gaming (1343 - 2729, n=107, ultimi 2 anni) | |
| CrossMark / Responsiveness | |
| Schenker XMG Focus 17 M25 | |
| Media Intel Core i9-13900HX, NVIDIA GeForce RTX 5070 Ti Laptop (n=1) | |
| MSI Vector 17 HX AI A2XWIG | |
| Lenovo Legion 5 Pro 16IAX10H | |
| Schenker XMG Pro 16 (E25) | |
| Media della classe Gaming (1226 - 2330, n=107, ultimi 2 anni) | |
| MSI Vector 16 HX AI A2XWHG | |
| WebXPRT 3 / Overall | |
| Lenovo Legion 5 Pro 16IAX10H | |
| Schenker XMG Pro 16 (E25) | |
| MSI Vector 17 HX AI A2XWIG | |
| MSI Vector 16 HX AI A2XWHG | |
| Media della classe Gaming (237 - 532, n=110, ultimi 2 anni) | |
| Media Intel Core i9-13900HX, NVIDIA GeForce RTX 5070 Ti Laptop (n=1) | |
| Schenker XMG Focus 17 M25 | |
| WebXPRT 4 / Overall | |
| Schenker XMG Pro 16 (E25) | |
| MSI Vector 17 HX AI A2XWIG | |
| Lenovo Legion 5 Pro 16IAX10H | |
| MSI Vector 16 HX AI A2XWHG | |
| Schenker XMG Focus 17 M25 | |
| Media Intel Core i9-13900HX, NVIDIA GeForce RTX 5070 Ti Laptop (n=1) | |
| Media della classe Gaming (176.4 - 345, n=108, ultimi 2 anni) | |
| Mozilla Kraken 1.1 / Total | |
| Media della classe Gaming (397 - 594, n=116, ultimi 2 anni) | |
| Schenker XMG Focus 17 M25 | |
| Media Intel Core i9-13900HX, NVIDIA GeForce RTX 5070 Ti Laptop (n=1) | |
| MSI Vector 16 HX AI A2XWHG | |
| MSI Vector 17 HX AI A2XWIG | |
| Lenovo Legion 5 Pro 16IAX10H | |
| Schenker XMG Pro 16 (E25) | |
* ... Meglio usare valori piccoli
| PCMark 10 Score | 7560 punti | |
Aiuto | ||
| AIDA64 / Memory Copy | |
| Schenker XMG Pro 16 (E25) | |
| Schenker XMG Focus 17 M25 | |
| Lenovo Legion 5 Pro 16IAX10H | |
| MSI Vector 17 HX AI A2XWIG | |
| Media Intel Core i9-13900HX (67716 - 79193, n=22) | |
| Media della classe Gaming (21750 - 108104, n=123, ultimi 2 anni) | |
| MSI Vector 16 HX AI A2XWHG | |
| AIDA64 / Memory Read | |
| Schenker XMG Pro 16 (E25) | |
| Schenker XMG Focus 17 M25 | |
| Lenovo Legion 5 Pro 16IAX10H | |
| MSI Vector 17 HX AI A2XWIG | |
| Media Intel Core i9-13900HX (73998 - 88462, n=22) | |
| MSI Vector 16 HX AI A2XWHG | |
| Media della classe Gaming (22956 - 104349, n=123, ultimi 2 anni) | |
| AIDA64 / Memory Write | |
| Schenker XMG Pro 16 (E25) | |
| Lenovo Legion 5 Pro 16IAX10H | |
| MSI Vector 17 HX AI A2XWIG | |
| Media della classe Gaming (22297 - 133486, n=123, ultimi 2 anni) | |
| Schenker XMG Focus 17 M25 | |
| Media Intel Core i9-13900HX (65472 - 77045, n=22) | |
| MSI Vector 16 HX AI A2XWHG | |
| AIDA64 / Memory Latency | |
| MSI Vector 17 HX AI A2XWIG | |
| Lenovo Legion 5 Pro 16IAX10H | |
| MSI Vector 16 HX AI A2XWHG | |
| Schenker XMG Pro 16 (E25) | |
| Media della classe Gaming (75.3 - 259, n=123, ultimi 2 anni) | |
| Media Intel Core i9-13900HX (75.3 - 91.1, n=22) | |
| Schenker XMG Focus 17 M25 | |
* ... Meglio usare valori piccoli
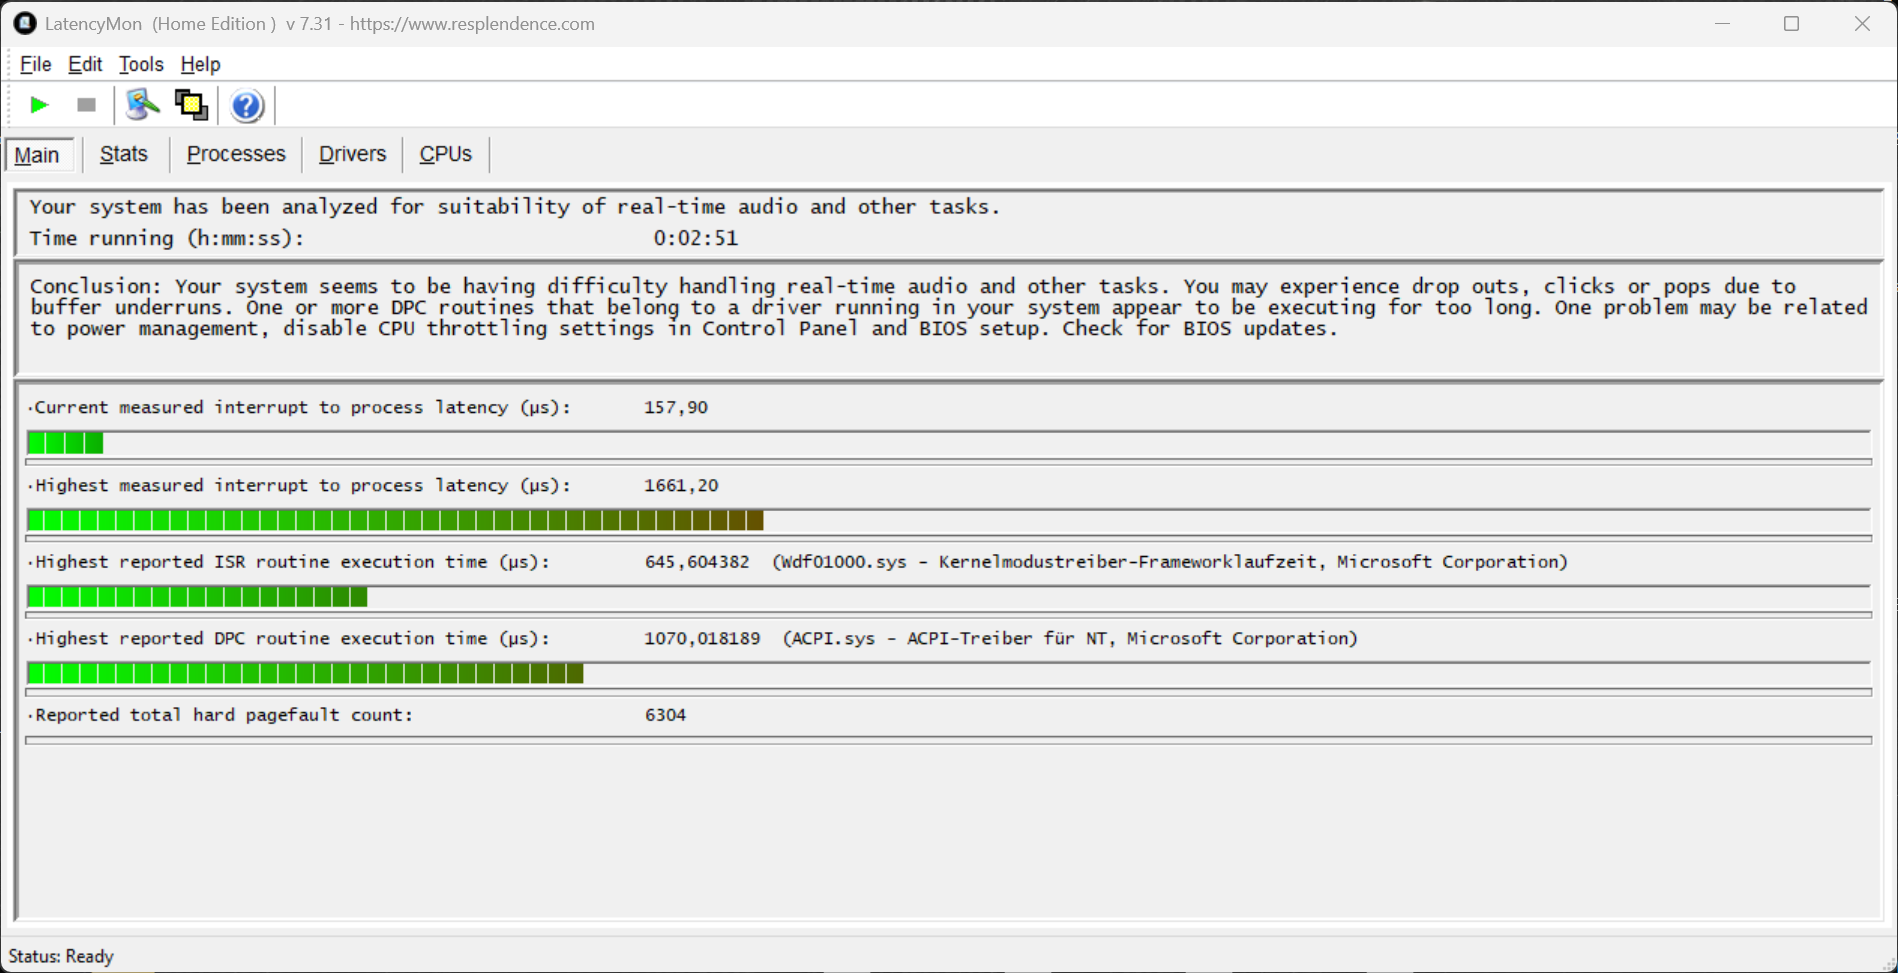
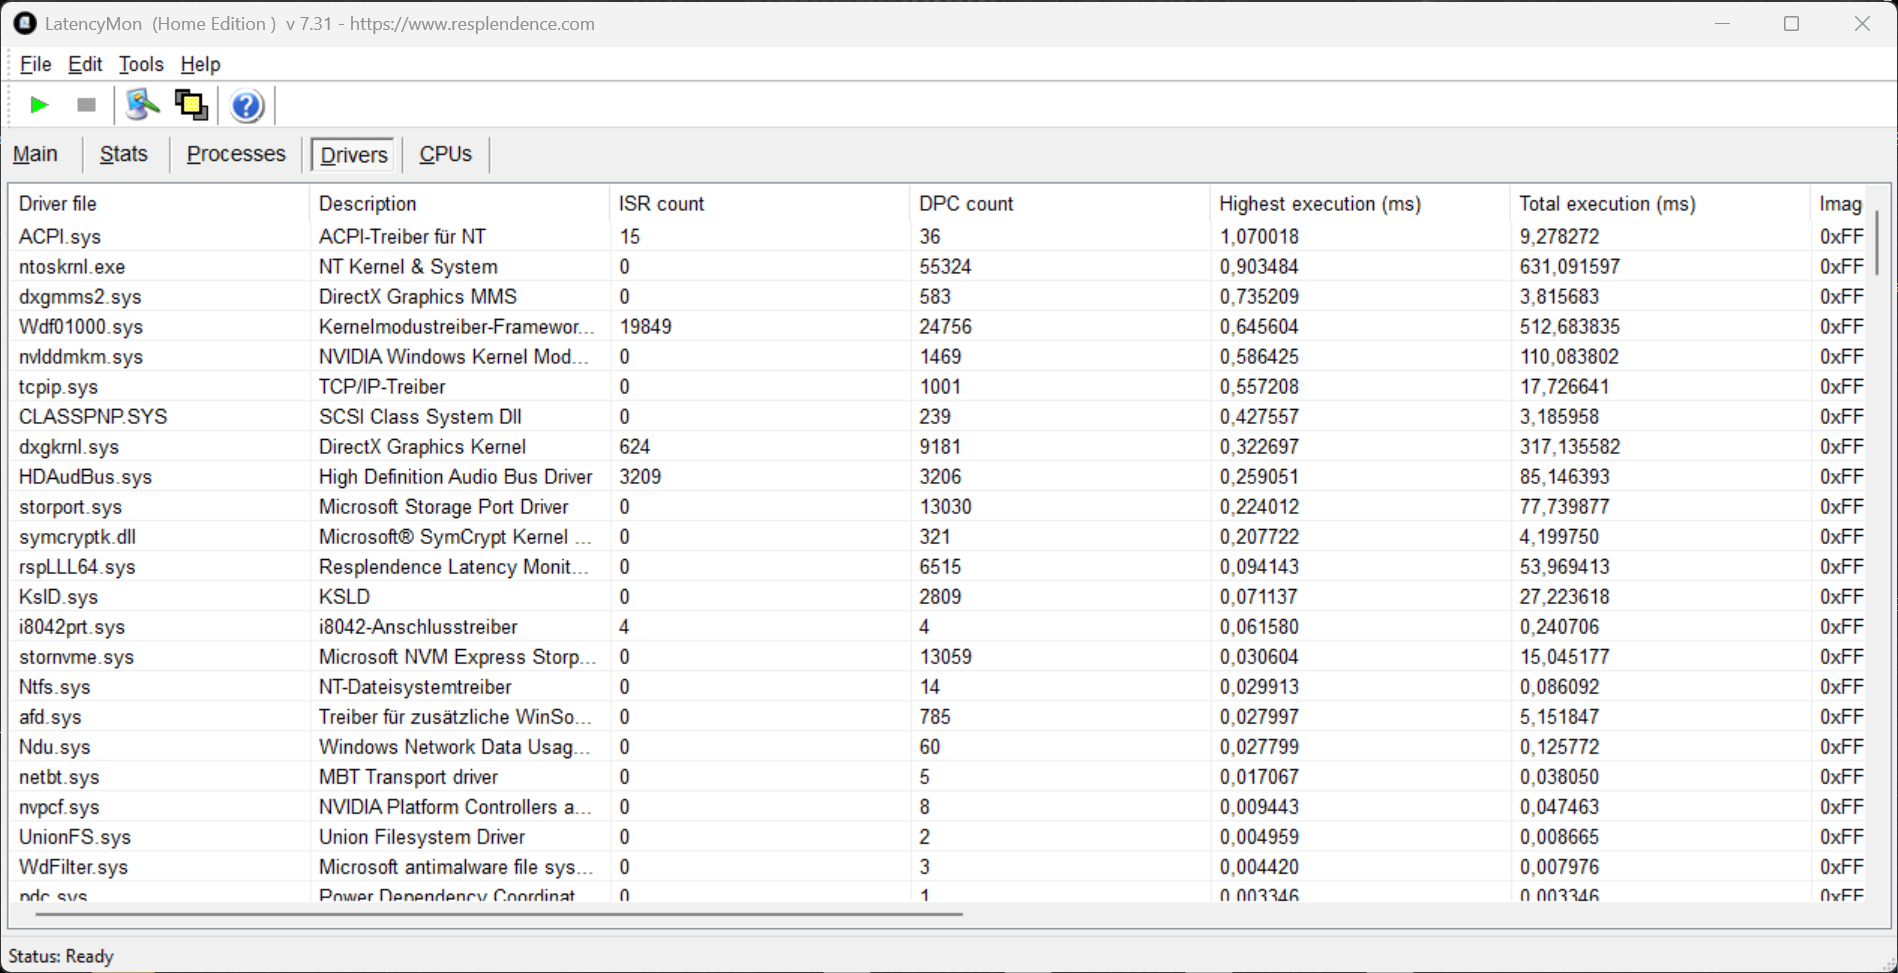
Latenze DPC
Nel nostro test di latenza standardizzato (navigazione web, riproduzione di YouTube 4K, carico della CPU), il dispositivo recensito (con la versione attuale del BIOS) ha mostrato lievi limitazioni quando si utilizzavano applicazioni audio in tempo reale.
| DPC Latencies / LatencyMon - interrupt to process latency (max), Web, Youtube, Prime95 | |
| MSI Vector 16 HX AI A2XWHG | |
| Schenker XMG Pro 16 (E25) | |
| Schenker XMG Focus 17 M25 | |
| MSI Vector 17 HX AI A2XWIG | |
| Lenovo Legion 5 Pro 16IAX10H | |
* ... Meglio usare valori piccoli
Memoria di massa
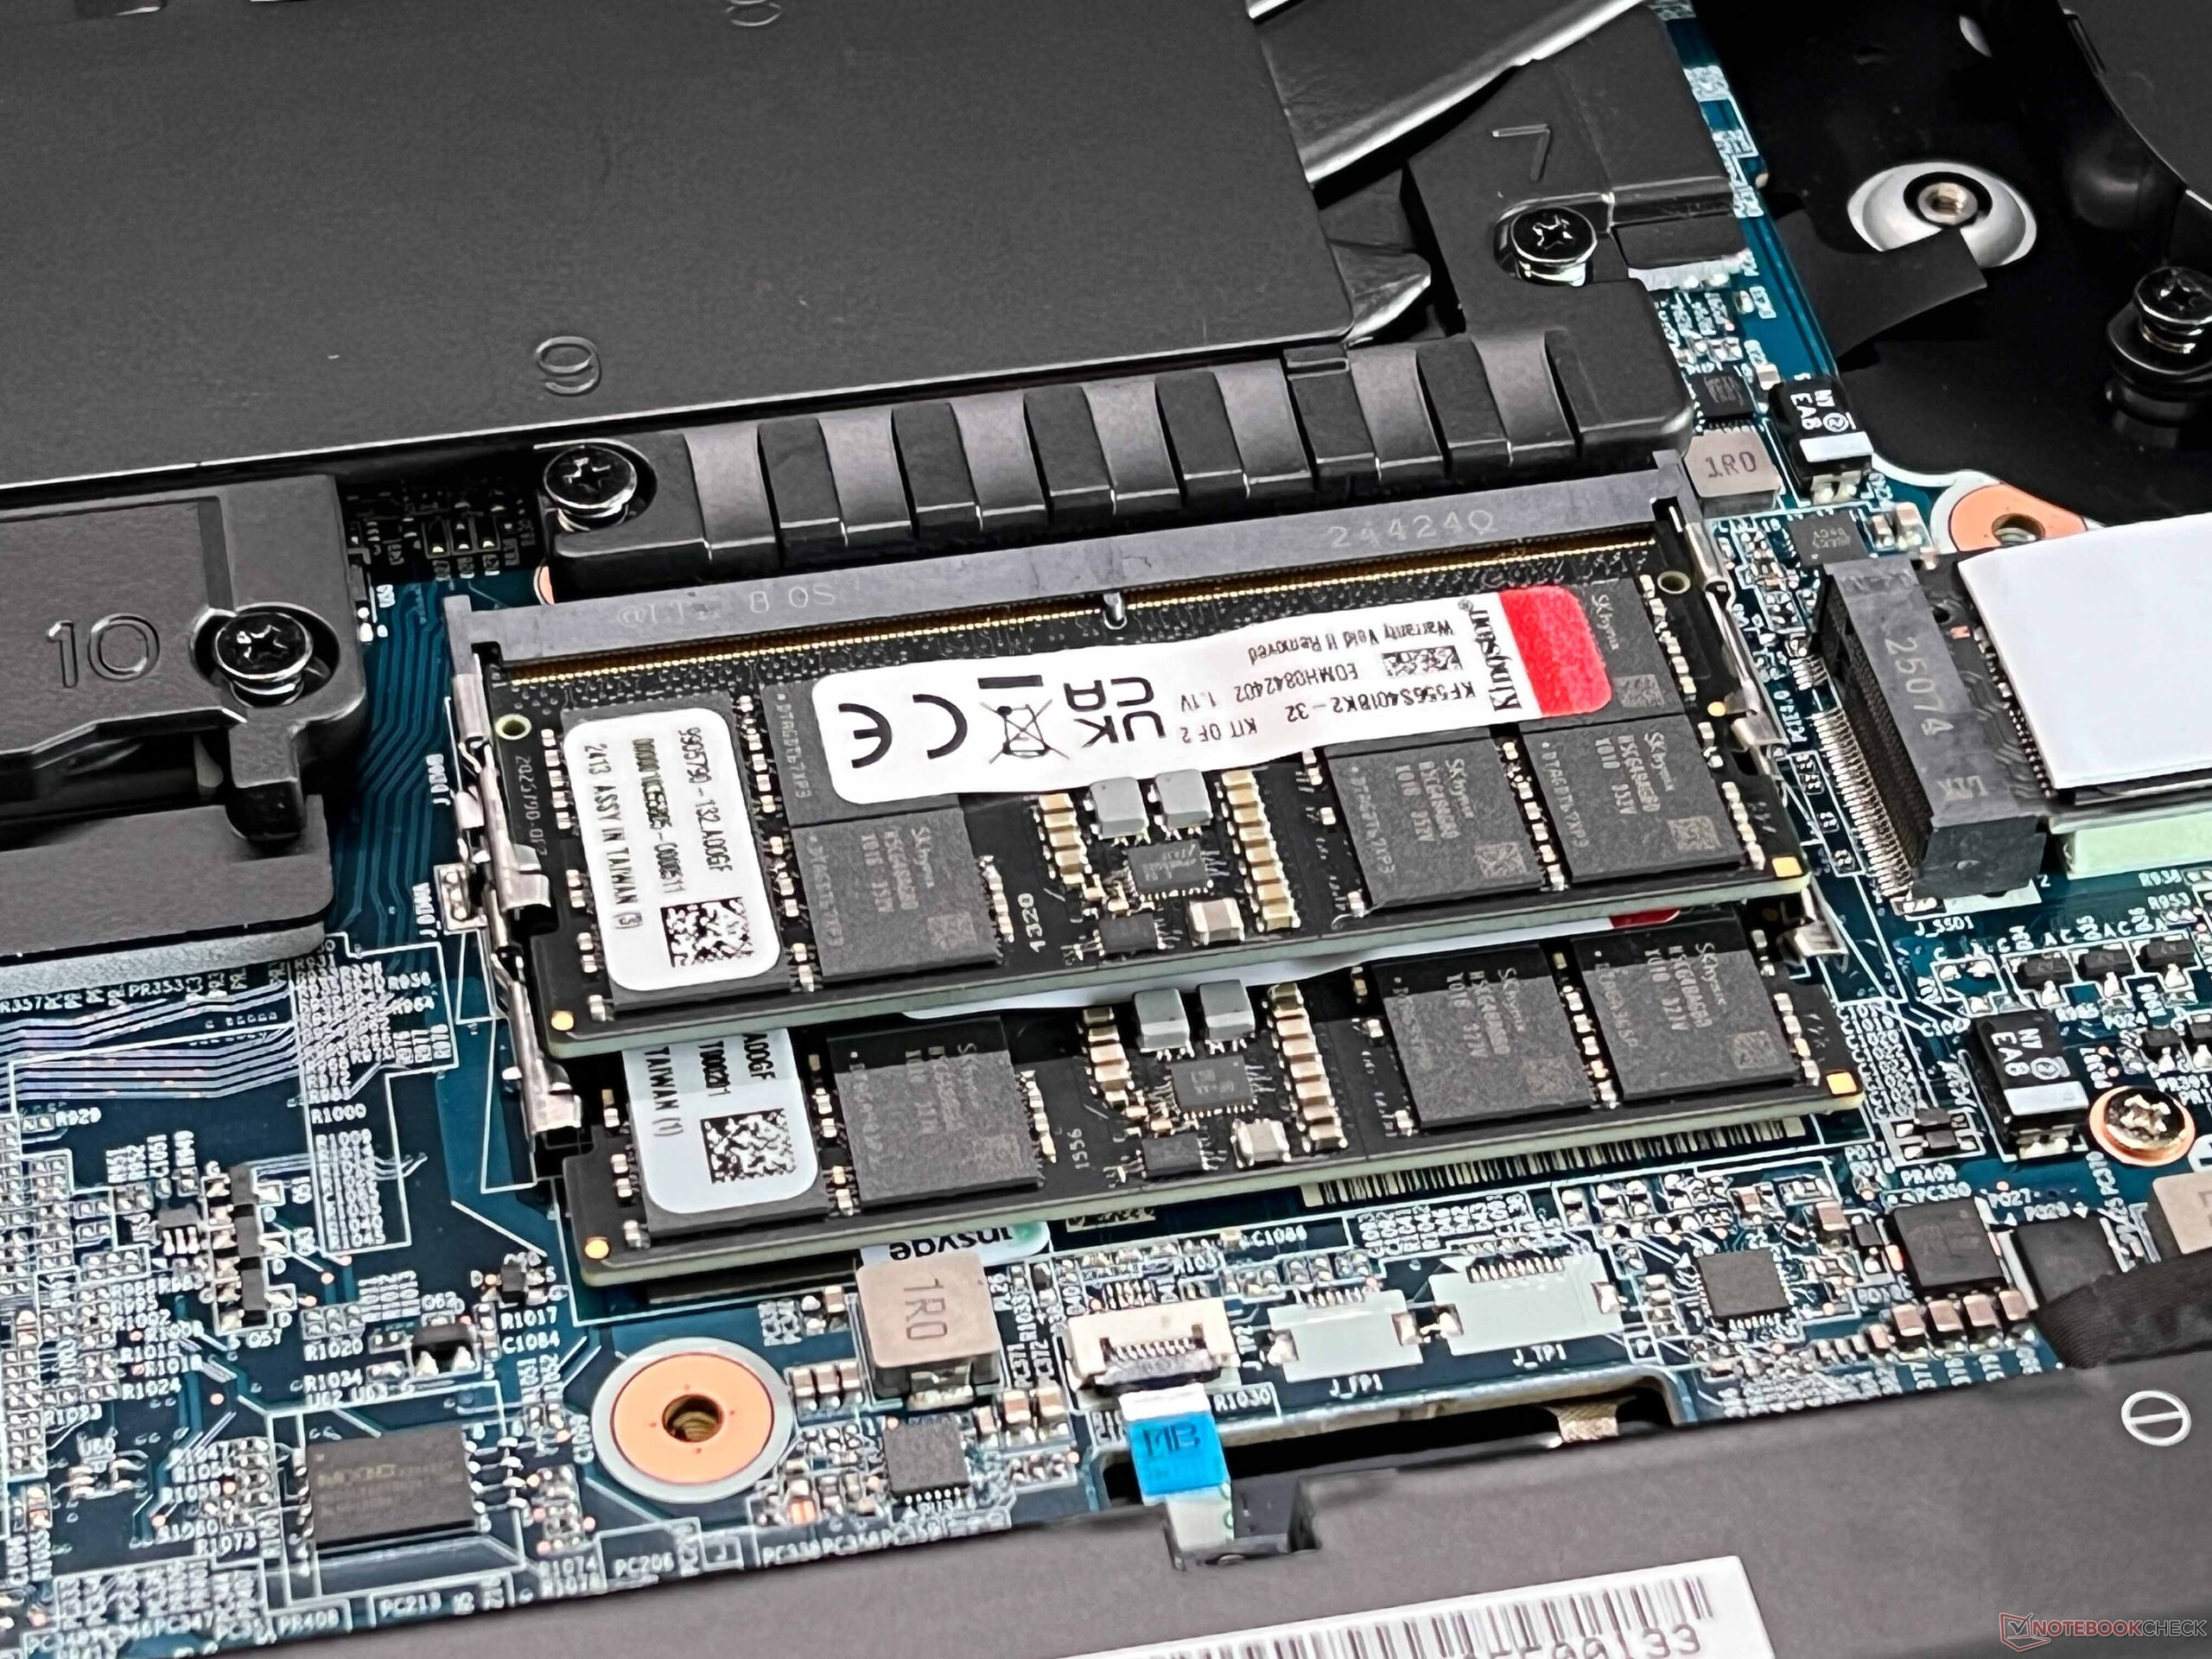
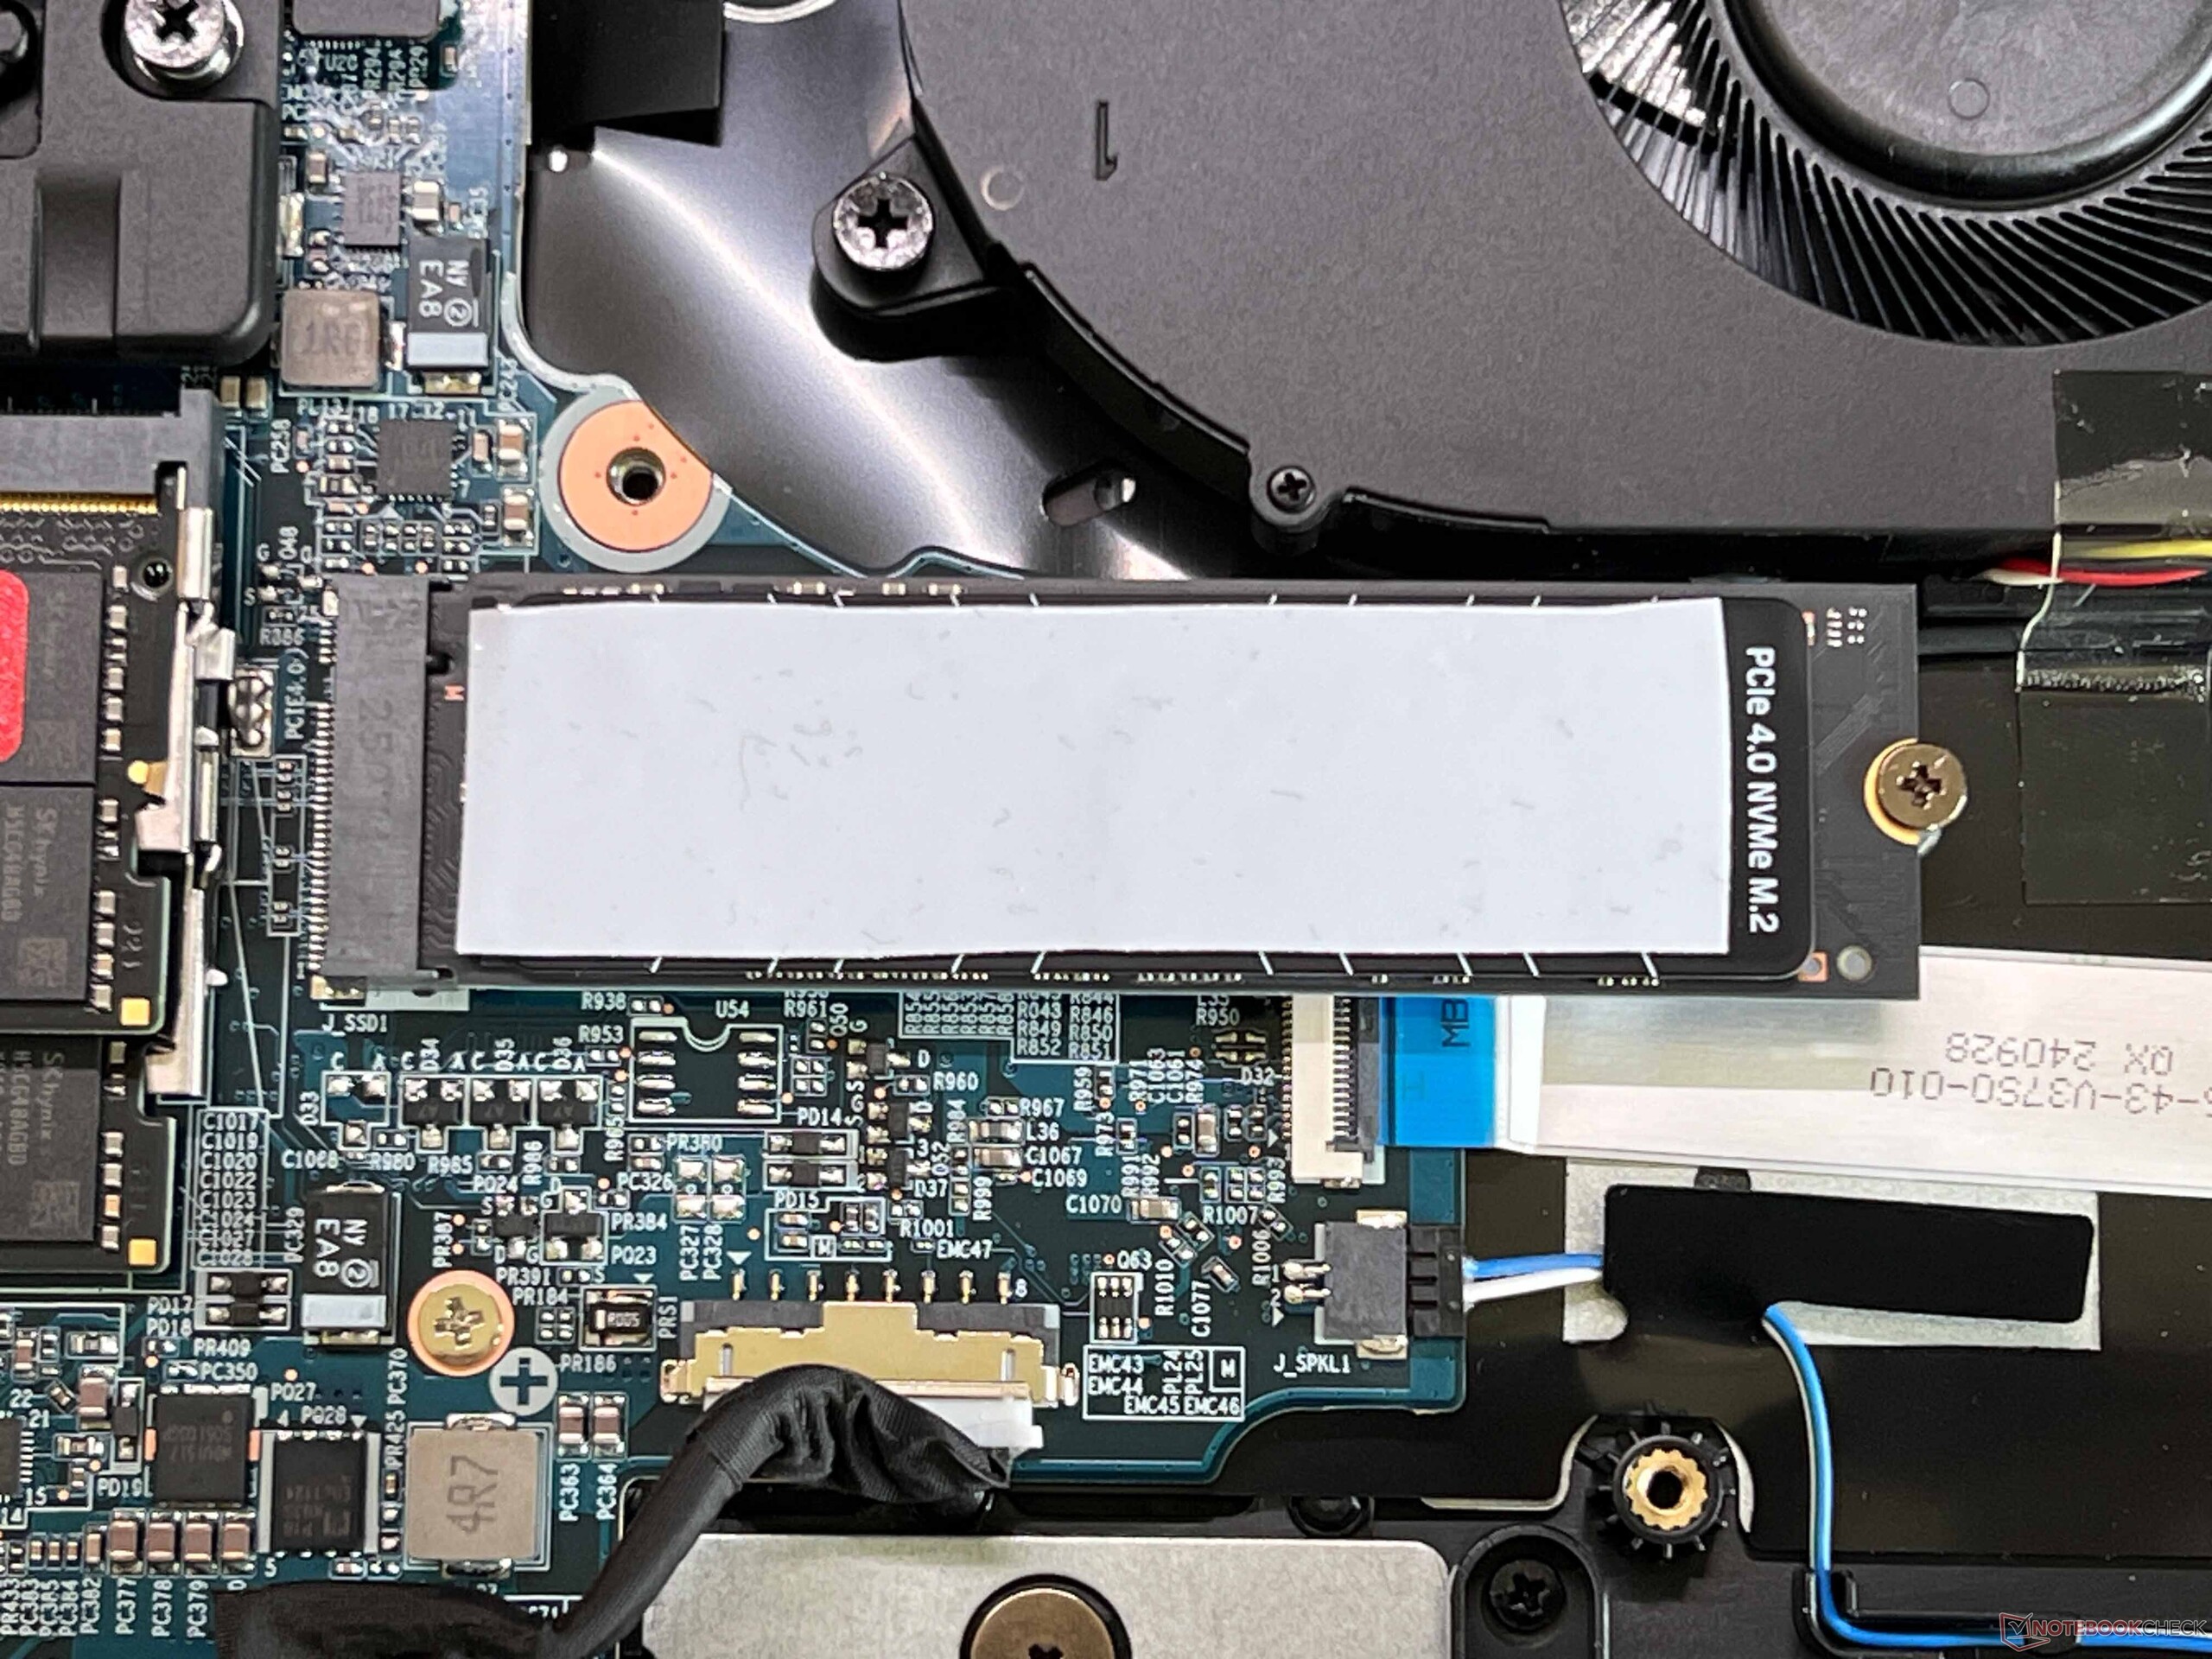
Il Focus offre due slot per SSD M.2 2280 (PCIe 4.0) e la nostra unità di recensione è dotata di un drive Kingston da 500 GB (399 GB liberi). Le velocità di trasferimento sono molto buone e rimangono stabili anche sotto carico prolungato.

* ... Meglio usare valori piccoli
Sustained Performance Read: DiskSpd Read Loop, Queue Depth 8
Prestazioni della GPU
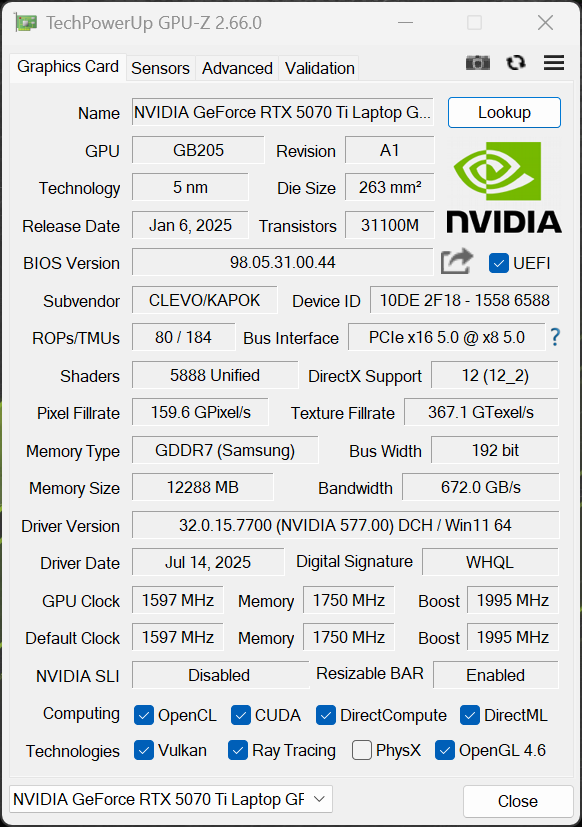
Das Focus 17 è equipaggiato esclusivamente con la nuova GeForce GPU RTX 5070 Ti per computer portatili (TGP 140 watt, 12 GB di VRAM). La commutazione della grafica è gestita tramite la tecnologia Optimus ed è integrato uno switch multi-thread. Le prestazioni grafiche nei benchmark sintetici sono state eccellenti. Inoltre, le prestazioni della GPU sono rimaste stabili sotto carico prolungato.
Anche le prestazioni di gioco sono molto buone, con tutti i titoli che funzionano senza problemi alla risoluzione QHD. Tuttavia, le prestazioni non erano del tutto stabili, in quanto le prestazioni della CPU calavano leggermente dopo alcuni minuti. Ci saranno leggere differenze a seconda del titolo. Nel nostro test con Cyberpunk 2077, ad esempio, le prestazioni sono calate di circa il 5% dopo circa 5 minuti.
| 3DMark 11 Performance | 43731 punti | |
| 3DMark Fire Strike Score | 33824 punti | |
| 3DMark Time Spy Score | 17276 punti | |
| 3DMark Steel Nomad Score | 3932 punti | |
| 3DMark Steel Nomad Light Score | 17797 punti | |
| 3DMark Steel Nomad Light Unlimited Score | 18318 punti | |
Aiuto | ||
| Blender / v3.3 Classroom OPTIX/RTX | |
| Media della classe Gaming (9 - 32, n=123, ultimi 2 anni) | |
| MSI Vector 16 HX AI A2XWHG | |
| Media NVIDIA GeForce RTX 5070 Ti Laptop (13 - 19, n=12) | |
| Lenovo Legion 5 Pro 16IAX10H | |
| Schenker XMG Pro 16 (E25) | |
| MSI Vector 17 HX AI A2XWIG | |
| Schenker XMG Focus 17 M25 | |
| Blender / v3.3 Classroom CUDA | |
| Media della classe Gaming (15 - 228, n=123, ultimi 2 anni) | |
| Schenker XMG Focus 17 M25 | |
| Media NVIDIA GeForce RTX 5070 Ti Laptop (24 - 33, n=12) | |
| Schenker XMG Pro 16 (E25) | |
| MSI Vector 16 HX AI A2XWHG | |
| Lenovo Legion 5 Pro 16IAX10H | |
| MSI Vector 17 HX AI A2XWIG | |
| Blender / v3.3 Classroom CPU | |
| Media della classe Gaming (122 - 565, n=120, ultimi 2 anni) | |
| MSI Vector 16 HX AI A2XWHG | |
| Media NVIDIA GeForce RTX 5070 Ti Laptop (122 - 361, n=12) | |
| Schenker XMG Focus 17 M25 | |
| MSI Vector 17 HX AI A2XWIG | |
| Lenovo Legion 5 Pro 16IAX10H | |
| Schenker XMG Pro 16 (E25) | |
* ... Meglio usare valori piccoli
| Performance rating - Percent | |
| MSI Vector 17 HX AI A2XWIG | |
| Lenovo Legion 5 Pro 16IAX10H | |
| Schenker XMG Focus 17 M25 | |
| MSI Vector 16 HX AI A2XWHG -1! | |
| Schenker XMG Pro 16 (E25) | |
| Media della classe Gaming | |
| Cyberpunk 2077 - 1920x1080 Ultra Preset (FSR off) | |
| MSI Vector 17 HX AI A2XWIG | |
| Lenovo Legion 5 Pro 16IAX10H | |
| Schenker XMG Pro 16 (E25) | |
| MSI Vector 16 HX AI A2XWHG | |
| Schenker XMG Focus 17 M25 | |
| Media della classe Gaming (17.7 - 169.9, n=132, ultimi 2 anni) | |
| Baldur's Gate 3 - 1920x1080 Ultra Preset AA:T | |
| MSI Vector 17 HX AI A2XWIG | |
| Schenker XMG Pro 16 (E25) | |
| Schenker XMG Focus 17 M25 | |
| MSI Vector 16 HX AI A2XWHG | |
| Lenovo Legion 5 Pro 16IAX10H | |
| Media della classe Gaming (59.4 - 246, n=113, ultimi 2 anni) | |
| GTA V - 1920x1080 Highest AA:4xMSAA + FX AF:16x | |
| Schenker XMG Pro 16 (E25) | |
| MSI Vector 17 HX AI A2XWIG | |
| Schenker XMG Focus 17 M25 | |
| Lenovo Legion 5 Pro 16IAX10H | |
| MSI Vector 16 HX AI A2XWHG | |
| Media della classe Gaming (48.3 - 186.9, n=113, ultimi 2 anni) | |
| Final Fantasy XV Benchmark - 1920x1080 High Quality | |
| MSI Vector 17 HX AI A2XWIG | |
| Lenovo Legion 5 Pro 16IAX10H | |
| MSI Vector 16 HX AI A2XWHG | |
| Schenker XMG Focus 17 M25 | |
| Schenker XMG Pro 16 (E25) | |
| Media della classe Gaming (41 - 215, n=117, ultimi 2 anni) | |
| Strange Brigade - 1920x1080 ultra AA:ultra AF:16 | |
| MSI Vector 17 HX AI A2XWIG | |
| Lenovo Legion 5 Pro 16IAX10H | |
| Schenker XMG Focus 17 M25 | |
| Media della classe Gaming (76.3 - 456, n=107, ultimi 2 anni) | |
| Schenker XMG Pro 16 (E25) | |
| Dota 2 Reborn - 1920x1080 ultra (3/3) best looking | |
| Schenker XMG Pro 16 (E25) | |
| Lenovo Legion 5 Pro 16IAX10H | |
| MSI Vector 17 HX AI A2XWIG | |
| Schenker XMG Focus 17 M25 | |
| MSI Vector 16 HX AI A2XWHG | |
| Media della classe Gaming (84.8 - 248, n=125, ultimi 2 anni) | |
| F1 24 - 2560x1440 Ultra High Preset AA:T AF:16x | |
| Schenker XMG Pro 16 (E25) | |
| Media della classe Gaming (29.8 - 106.9, n=58, ultimi 2 anni) | |
| Media NVIDIA GeForce RTX 5070 Ti Laptop (53.2 - 72.1, n=8) | |
| Schenker XMG Focus 17 M25 | |
| F1 25 - 2560x1440 Ultra Max Preset AA:T AF:16x | |
| Media NVIDIA GeForce RTX 5070 Ti Laptop (18 - 26, n=6) | |
| Media della classe Gaming (5 - 37.5, n=22, ultimi 2 anni) | |
| Lenovo Legion 5 Pro 16IAX10H | |
| Assassin's Creed Shadows - 2560x1440 Ultra High | |
| Schenker XMG Focus 17 M25 | |
| Media della classe Gaming (22 - 64, n=42, ultimi 2 anni) | |
| Lenovo Legion 5 Pro 16IAX10H | |
| Media NVIDIA GeForce RTX 5070 Ti Laptop (40 - 48, n=7) | |
Cyberpunk 2077 ultra FPS diagram
| basso | medio | alto | ultra | QHD DLSS | QHD | |
|---|---|---|---|---|---|---|
| GTA V (2015) | 152.9 | 139.1 | ||||
| Dota 2 Reborn (2015) | 223 | 192.9 | 178.8 | 165.4 | ||
| Final Fantasy XV Benchmark (2018) | 223 | 197.6 | 156.8 | 129.5 | ||
| X-Plane 11.11 (2018) | 165 | 142.2 | 124.6 | |||
| Strange Brigade (2018) | 438 | 362 | 328 | 303 | 229 | |
| Baldur's Gate 3 (2023) | 202.6 | 172.8 | 154.2 | 153.9 | 108.6 | |
| Cyberpunk 2077 (2023) | 149.4 | 139.8 | 126.4 | 115.7 | 93.9 | 81 |
| F1 24 (2024) | 247 | 236 | 232 | 98.7 | 98.4 | 66.4 |
| Assassin's Creed Shadows (2025) | 90 | 84 | 72 | 55 | 47 |
Emissioni ed energia
Emissioni di rumore
Nell'uso quotidiano, le due ventole rimangono generalmente molto silenziose, anche utilizzando il profilo di alimentazione veloce, e la velocità della ventola si riduce molto rapidamente dopo la fine della fase di carico. Con 56,2 dB(A), la situazione diventa molto rumorosa quando gioca nella modalità più veloce, e si consiglia di usare le cuffie. La modalità silenziosa, invece, è molto silenziosa con un massimo di 37 dB(A), e le prestazioni di gioco sono ancora accettabili. Non sono stati rilevati altri rumori elettronici nell'unità di recensione.
Rumorosità
| Idle |
| 24.8 / 24.8 / 27.7 dB(A) |
| Sotto carico |
| 51 / 56.2 dB(A) |
 | ||
30 dB silenzioso 40 dB(A) udibile 50 dB(A) rumoroso |
||
min: | ||
| Schenker XMG Focus 17 M25 GeForce RTX 5070 Ti Laptop, i9-13900HX, Kingston Fury Renegade SFYRS500G | MSI Vector 17 HX AI A2XWIG GeForce RTX 5080 Laptop, Ultra 9 275HX, Western Digital PC SN5000S SDEPNSJ-2T00-1032 | Lenovo Legion 5 Pro 16IAX10H GeForce RTX 5070 Ti Laptop, Ultra 9 275HX, Western Digital PC SN8000S SDEPNRK-1T00 | MSI Vector 16 HX AI A2XWHG GeForce RTX 5070 Ti Laptop, Ultra 7 255HX, Micron 2400 MTFDKBA512QFM | Schenker XMG Pro 16 (E25) GeForce RTX 5070 Ti Laptop, Ultra 9 275HX, Samsung 9100 Pro 1 TB | |
|---|---|---|---|---|---|
| Noise | -0% | -2% | -10% | 5% | |
| off /ambiente * (dB) | 24.8 | 24 3% | 24 3% | 25 -1% | 23.3 6% |
| Idle Minimum * (dB) | 24.8 | 24 3% | 24 3% | 33 -33% | 25 -1% |
| Idle Average * (dB) | 24.8 | 30.82 -24% | 24 3% | 34 -37% | 25 -1% |
| Idle Maximum * (dB) | 27.7 | 31.31 -13% | 30.9 -12% | 38 -37% | 25 10% |
| Load Average * (dB) | 51 | 31.12 39% | 55.9 -10% | 46 10% | 45.5 11% |
| Cyberpunk 2077 ultra * (dB) | 56.2 | 59.24 -5% | 56.72 -1% | 47 16% | 53.3 5% |
| Load Maximum * (dB) | 56.2 | 59.24 -5% | 56.72 -1% | 49 13% | 53.3 5% |
* ... Meglio usare valori piccoli
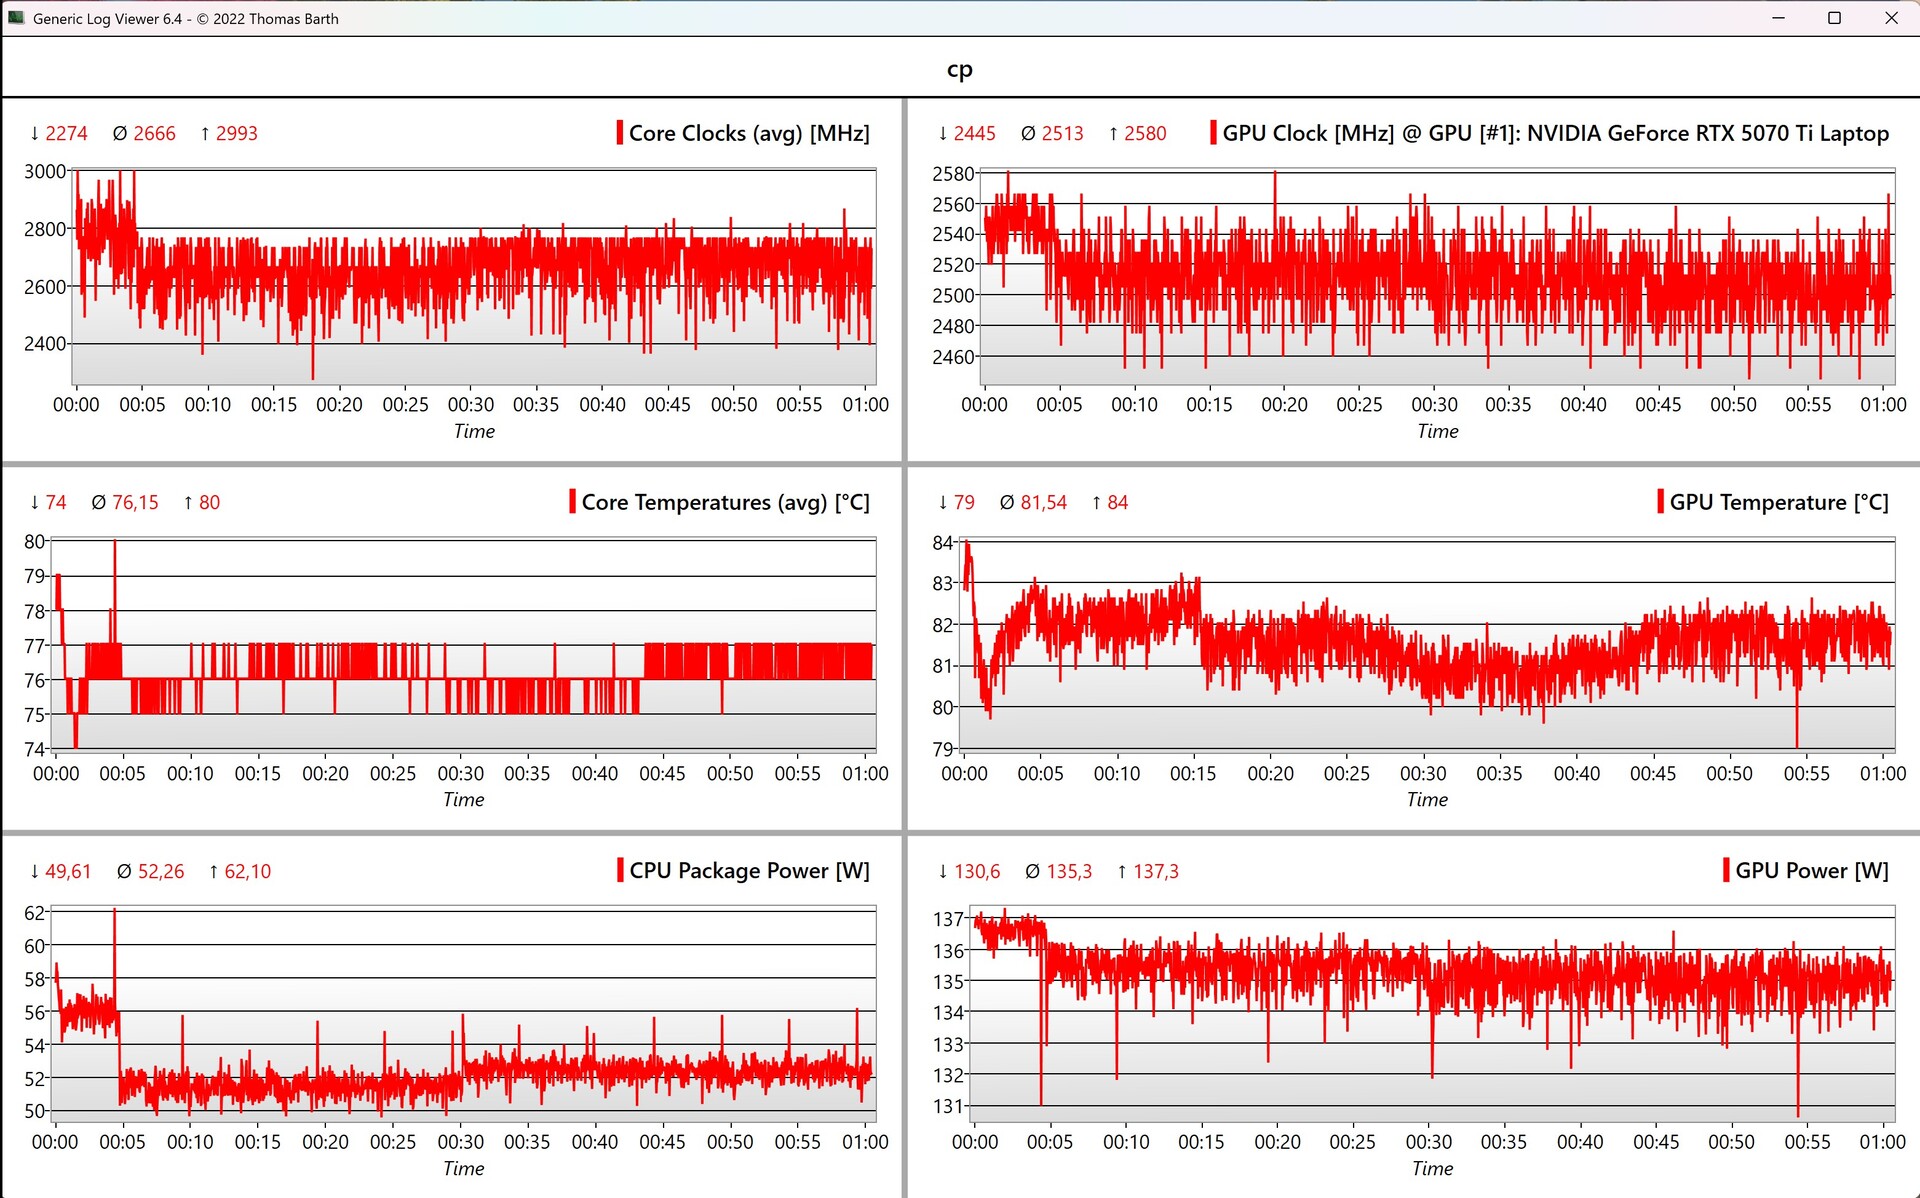
Temperatura
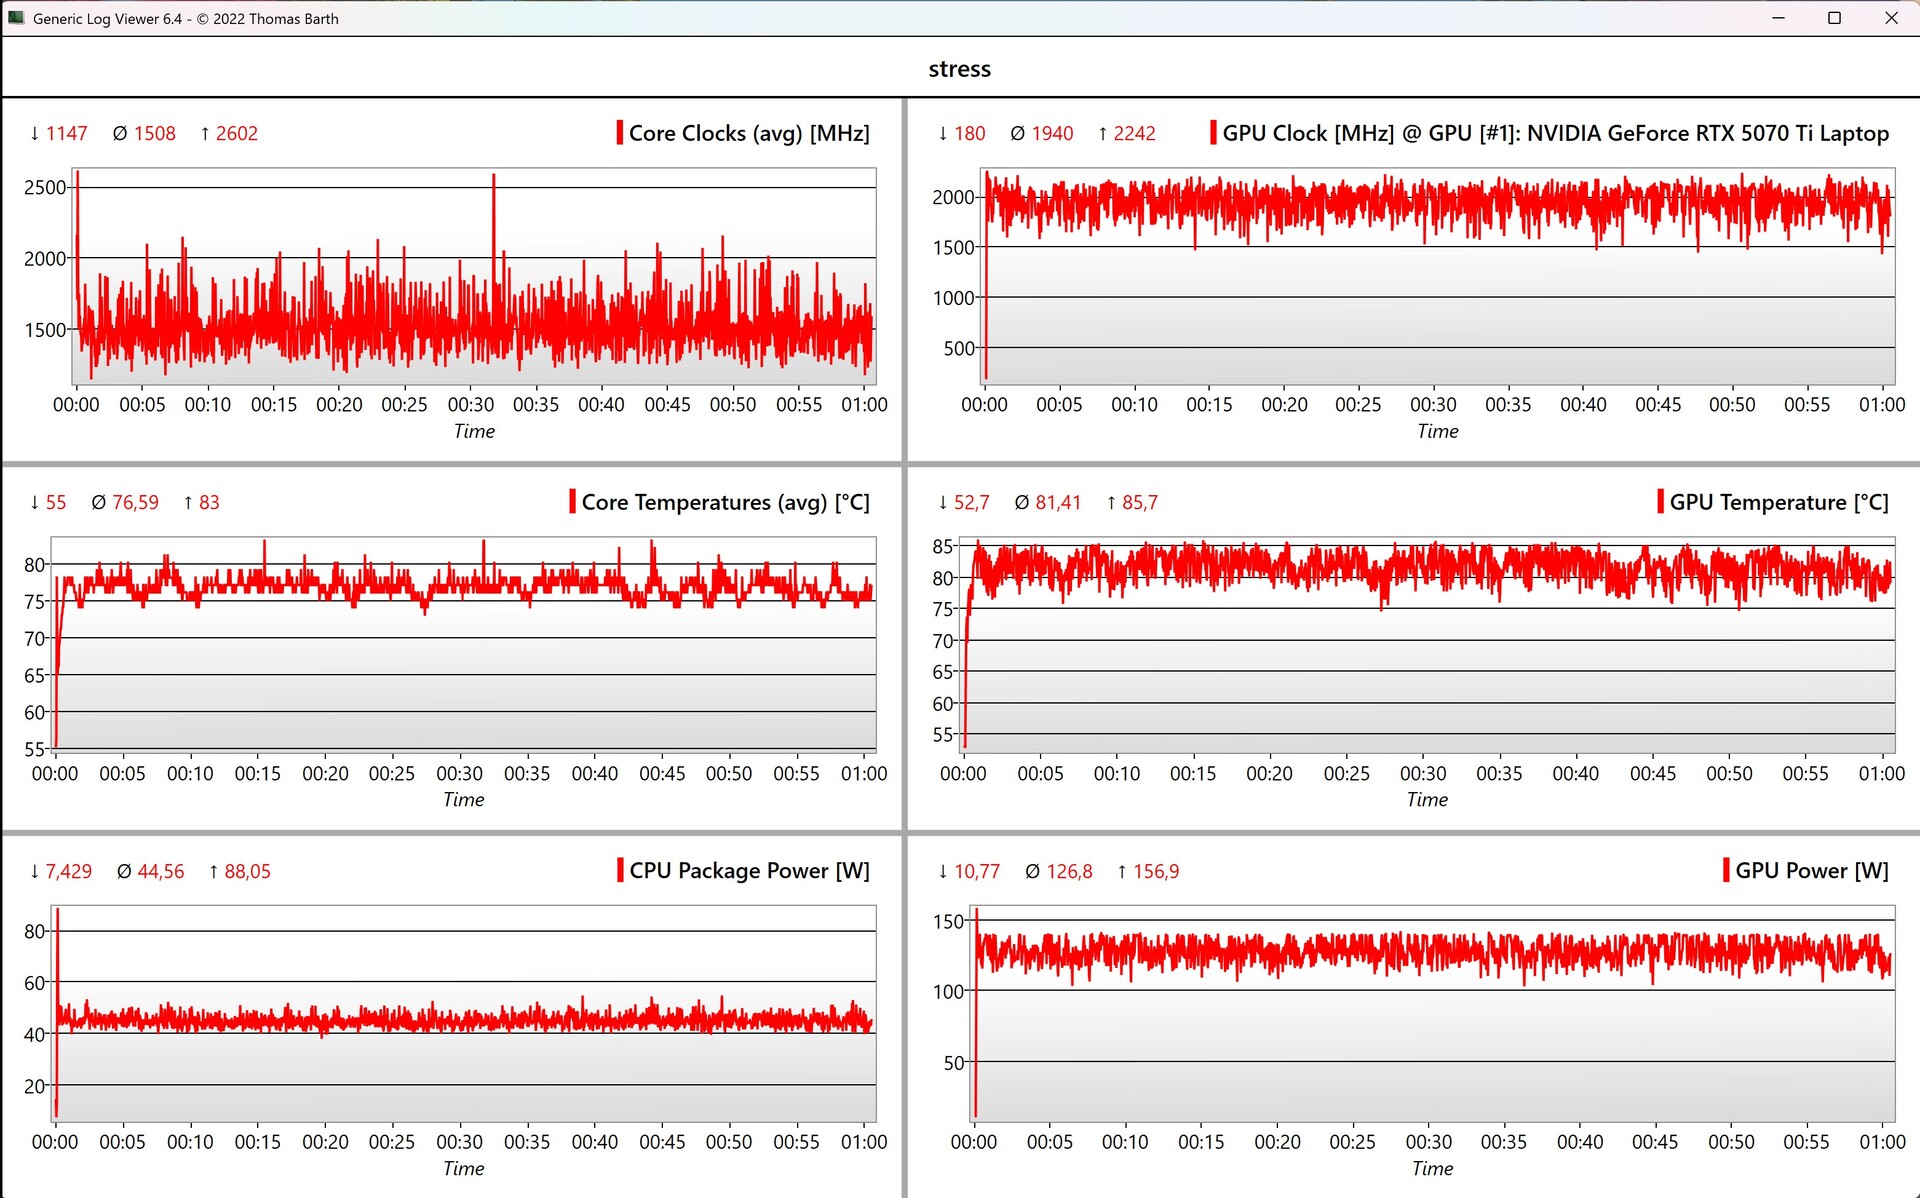
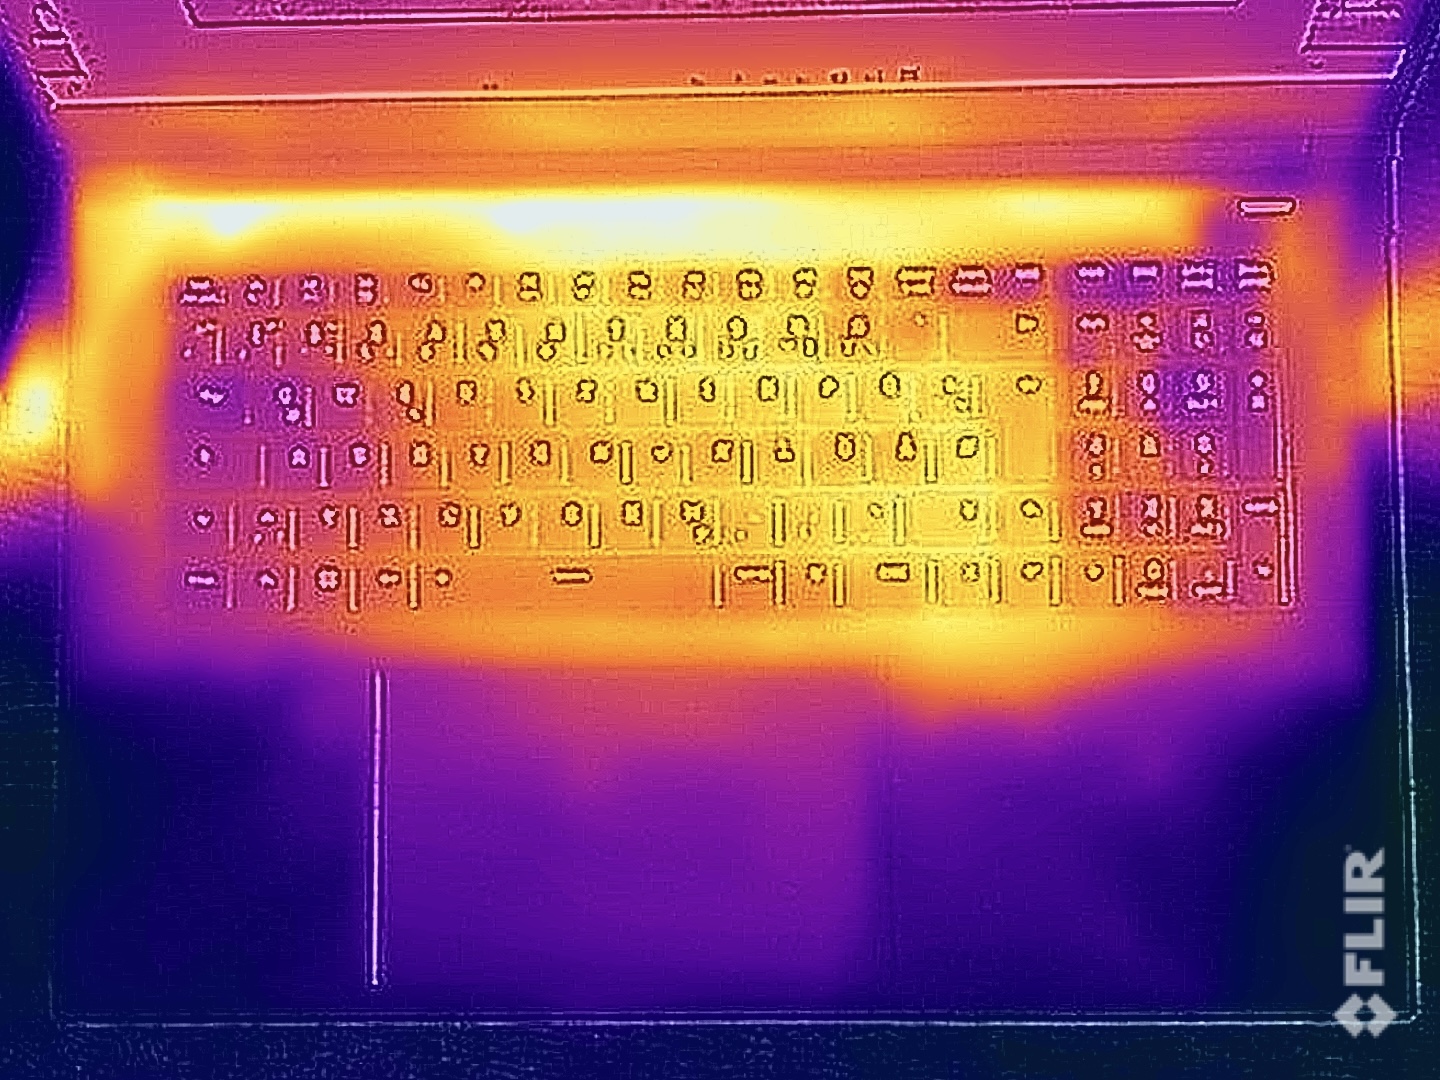
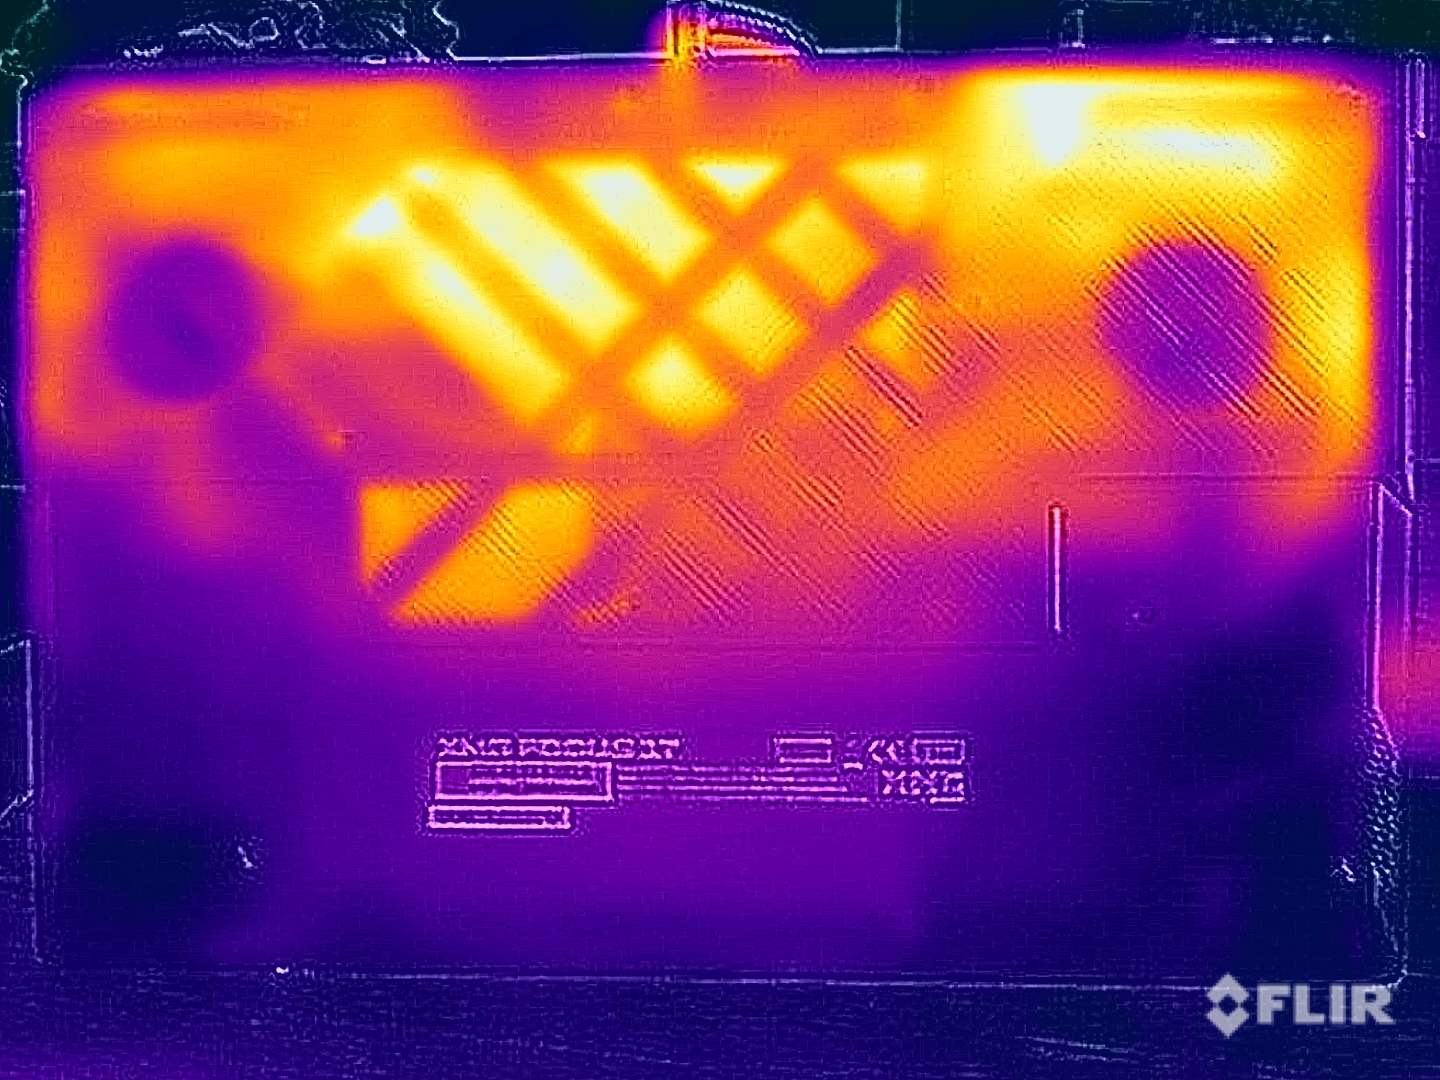
Le temperature superficiali non sono problematiche e, in particolare, la tastiera non si scalda troppo nemmeno durante il gioco. Mentre il pannello inferiore raggiunge un massimo di 48°C, date le sue dimensioni, probabilmente non appoggerà comunque il Focus 17 sulle ginocchia. Nel test di stress, la GPU ha funzionato a circa 130 watt (81°C) e la CPU a 45 watt (77°C).
(±) La temperatura massima sul lato superiore è di 41.2 °C / 106 F, rispetto alla media di 40.4 °C / 105 F, che varia da 21.2 a 68.8 °C per questa classe Gaming.
(-) Il lato inferiore si riscalda fino ad un massimo di 48.8 °C / 120 F, rispetto alla media di 43.3 °C / 110 F
(+) In idle, la temperatura media del lato superiore è di 26.6 °C / 80 F, rispetto alla media deld ispositivo di 33.9 °C / 93 F.
(±) 3: The average temperature for the upper side is 35.6 °C / 96 F, compared to the average of 33.9 °C / 93 F for the class Gaming.
(+) I poggiapolsi e il touchpad sono piu' freddi della temperatura della pelle con un massimo di 28 °C / 82.4 F e sono quindi freddi al tatto.
(±) La temperatura media della zona del palmo della mano di dispositivi simili e'stata di 28.8 °C / 83.8 F (+0.8 °C / 1.4 F).
| Schenker XMG Focus 17 M25 Intel Core i9-13900HX, NVIDIA GeForce RTX 5070 Ti Laptop | MSI Vector 17 HX AI A2XWIG Intel Core Ultra 9 275HX, NVIDIA GeForce RTX 5080 Laptop | Lenovo Legion 5 Pro 16IAX10H Intel Core Ultra 9 275HX, NVIDIA GeForce RTX 5070 Ti Laptop | MSI Vector 16 HX AI A2XWHG Intel Core Ultra 7 255HX, NVIDIA GeForce RTX 5070 Ti Laptop | Schenker XMG Pro 16 (E25) Intel Core Ultra 9 275HX, NVIDIA GeForce RTX 5070 Ti Laptop | |
|---|---|---|---|---|---|
| Heat | -24% | -24% | -13% | -194% | |
| Maximum Upper Side * (°C) | 41.2 | 53 -29% | 48 -17% | 53 -29% | 43.2 -5% |
| Maximum Bottom * (°C) | 48.8 | 54 -11% | 50 -2% | 52 -7% | 46 6% |
| Idle Upper Side * (°C) | 27.6 | 39 -41% | 38 -38% | 33 -20% | 27.7 -0% |
| Idle Bottom * (°C) | 30.1 | 34 -13% | 42 -40% | 29 4% | 264 -777% |
* ... Meglio usare valori piccoli
Altoparlanti
I due altoparlanti stereo non impressionano, con un suono che appare molto sottile e un volume massimo basso.
Schenker XMG Focus 17 M25 analisi audio
(±) | potenza degli altiparlanti media ma buona (78.5 dB)
Bassi 100 - 315 Hz
(-) | quasi nessun basso - in media 21.9% inferiori alla media
(±) | la linearità dei bassi è media (13.4% delta rispetto alla precedente frequenza)
Medi 400 - 2000 Hz
(+) | medi bilanciati - solo only 2.8% rispetto alla media
(±) | linearità dei medi adeguata (7.3% delta rispetto alla precedente frequenza)
Alti 2 - 16 kHz
(+) | Alti bilanciati - appena 3.9% dalla media
(+) | alti lineari (5.8% delta rispetto alla precedente frequenza)
Nel complesso 100 - 16.000 Hz
(±) | la linearità complessiva del suono è media (18.8% di differenza rispetto alla media
Rispetto alla stessa classe
» 62% di tutti i dispositivi testati in questa classe è stato migliore, 8% simile, 30% peggiore
» Il migliore ha avuto un delta di 6%, medio di 18%, peggiore di 132%
Rispetto a tutti i dispositivi testati
» 43% di tutti i dispositivi testati in questa classe è stato migliore, 8% similare, 49% peggiore
» Il migliore ha avuto un delta di 4%, medio di 24%, peggiore di 134%
MSI Vector 17 HX AI A2XWIG analisi audio
(±) | potenza degli altiparlanti media ma buona (80.39 dB)
Bassi 100 - 315 Hz
(±) | bassi ridotti - in media 10.4% inferiori alla media
(±) | la linearità dei bassi è media (7.4% delta rispetto alla precedente frequenza)
Medi 400 - 2000 Hz
(±) | medi elevati - circa 6.2% superiore alla media
(+) | medi lineari (4.7% delta rispetto alla precedente frequenza)
Alti 2 - 16 kHz
(+) | Alti bilanciati - appena 4.3% dalla media
(±) | la linearità degli alti è media (8.7% delta rispetto alla precedente frequenza)
Nel complesso 100 - 16.000 Hz
(±) | la linearità complessiva del suono è media (15.6% di differenza rispetto alla media
Rispetto alla stessa classe
» 35% di tutti i dispositivi testati in questa classe è stato migliore, 6% simile, 58% peggiore
» Il migliore ha avuto un delta di 6%, medio di 18%, peggiore di 132%
Rispetto a tutti i dispositivi testati
» 23% di tutti i dispositivi testati in questa classe è stato migliore, 5% similare, 72% peggiore
» Il migliore ha avuto un delta di 4%, medio di 24%, peggiore di 134%
Lenovo Legion 5 Pro 16IAX10H analisi audio
(±) | potenza degli altiparlanti media ma buona (78.2 dB)
Bassi 100 - 315 Hz
(-) | quasi nessun basso - in media 21.1% inferiori alla media
(±) | la linearità dei bassi è media (8% delta rispetto alla precedente frequenza)
Medi 400 - 2000 Hz
(±) | medi elevati - circa 6.3% superiore alla media
(+) | medi lineari (6.5% delta rispetto alla precedente frequenza)
Alti 2 - 16 kHz
(+) | Alti bilanciati - appena 1.6% dalla media
(+) | alti lineari (4.9% delta rispetto alla precedente frequenza)
Nel complesso 100 - 16.000 Hz
(±) | la linearità complessiva del suono è media (18.3% di differenza rispetto alla media
Rispetto alla stessa classe
» 58% di tutti i dispositivi testati in questa classe è stato migliore, 9% simile, 34% peggiore
» Il migliore ha avuto un delta di 6%, medio di 18%, peggiore di 132%
Rispetto a tutti i dispositivi testati
» 40% di tutti i dispositivi testati in questa classe è stato migliore, 8% similare, 53% peggiore
» Il migliore ha avuto un delta di 4%, medio di 24%, peggiore di 134%
MSI Vector 16 HX AI A2XWHG analisi audio
(+) | gli altoparlanti sono relativamente potenti (86 dB)
Bassi 100 - 315 Hz
(±) | bassi ridotti - in media 12.3% inferiori alla media
(±) | la linearità dei bassi è media (8.5% delta rispetto alla precedente frequenza)
Medi 400 - 2000 Hz
(±) | medi elevati - circa 9.9% superiore alla media
(+) | medi lineari (6.8% delta rispetto alla precedente frequenza)
Alti 2 - 16 kHz
(+) | Alti bilanciati - appena 1.8% dalla media
(+) | alti lineari (2.9% delta rispetto alla precedente frequenza)
Nel complesso 100 - 16.000 Hz
(±) | la linearità complessiva del suono è media (15.8% di differenza rispetto alla media
Rispetto alla stessa classe
» 36% di tutti i dispositivi testati in questa classe è stato migliore, 7% simile, 57% peggiore
» Il migliore ha avuto un delta di 6%, medio di 18%, peggiore di 132%
Rispetto a tutti i dispositivi testati
» 24% di tutti i dispositivi testati in questa classe è stato migliore, 5% similare, 71% peggiore
» Il migliore ha avuto un delta di 4%, medio di 24%, peggiore di 134%
Schenker XMG Pro 16 (E25) analisi audio
(±) | potenza degli altiparlanti media ma buona (79.2 dB)
Bassi 100 - 315 Hz
(±) | bassi ridotti - in media 14.2% inferiori alla media
(±) | la linearità dei bassi è media (10.6% delta rispetto alla precedente frequenza)
Medi 400 - 2000 Hz
(±) | medi elevati - circa 8.2% superiore alla media
(±) | linearità dei medi adeguata (9.9% delta rispetto alla precedente frequenza)
Alti 2 - 16 kHz
(+) | Alti bilanciati - appena 3.8% dalla media
(+) | alti lineari (5.9% delta rispetto alla precedente frequenza)
Nel complesso 100 - 16.000 Hz
(±) | la linearità complessiva del suono è media (18.5% di differenza rispetto alla media
Rispetto alla stessa classe
» 60% di tutti i dispositivi testati in questa classe è stato migliore, 8% simile, 32% peggiore
» Il migliore ha avuto un delta di 6%, medio di 18%, peggiore di 132%
Rispetto a tutti i dispositivi testati
» 41% di tutti i dispositivi testati in questa classe è stato migliore, 8% similare, 51% peggiore
» Il migliore ha avuto un delta di 4%, medio di 24%, peggiore di 134%
Consumo di energia
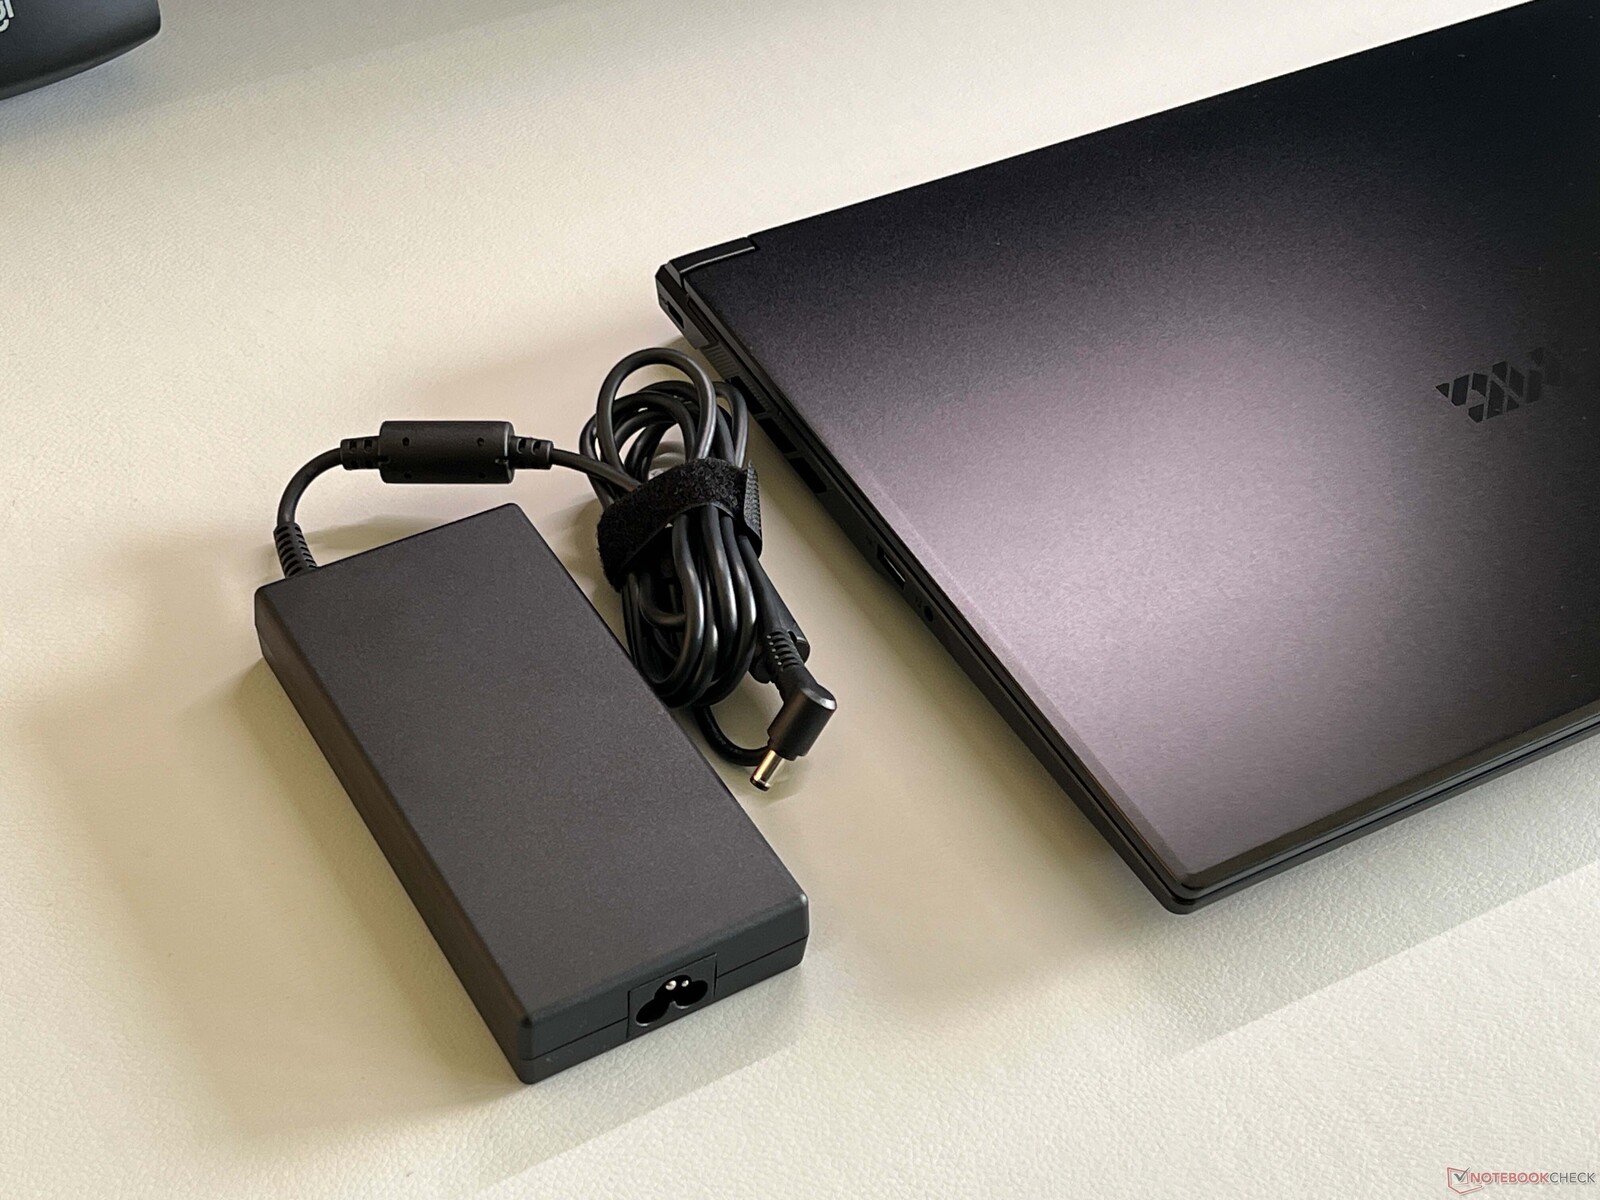
Con il funzionamento al minimo, la Focus è rimasta abbastanza economica, con un massimo di 18 watt. Tuttavia, a pieno carico, abbiamo misurato fino a 290 watt, che poi si sono assestati a circa 245 watt. Durante il gioco, ha raggiunto addirittura i 255 watt. Questo è un po' problematico, perché la confezione include solo un alimentatore da 230 watt. Sebbene la batteria non si scarichi sotto carico, un alimentatore da 280 watt sarebbe stato comunque una scelta migliore.
| Off / Standby | |
| Idle | |
| Sotto carico |
|
Leggenda:
min: | |
| Schenker XMG Focus 17 M25 GeForce RTX 5070 Ti Laptop, i9-13900HX, Kingston Fury Renegade SFYRS500G | MSI Vector 17 HX AI A2XWIG GeForce RTX 5080 Laptop, Ultra 9 275HX, Western Digital PC SN5000S SDEPNSJ-2T00-1032 | Lenovo Legion 5 Pro 16IAX10H GeForce RTX 5070 Ti Laptop, Ultra 9 275HX, Western Digital PC SN8000S SDEPNRK-1T00 | MSI Vector 16 HX AI A2XWHG GeForce RTX 5070 Ti Laptop, Ultra 7 255HX, Micron 2400 MTFDKBA512QFM | Schenker XMG Pro 16 (E25) GeForce RTX 5070 Ti Laptop, Ultra 9 275HX, Samsung 9100 Pro 1 TB | |
|---|---|---|---|---|---|
| Power Consumption | -0% | -9% | -1% | 2% | |
| Idle Minimum * (Watt) | 12 | 10 17% | 14 -17% | 7.1 41% | 11.7 2% |
| Idle Average * (Watt) | 17.5 | 15.4 12% | 14.3 18% | 15.9 9% | 16.6 5% |
| Idle Maximum * (Watt) | 18.1 | 18.7 -3% | 20.1 -11% | 29.5 -63% | 17.1 6% |
| Load Average * (Watt) | 121.1 | 89.7 26% | 177 -46% | 124 -2% | 122.4 -1% |
| Cyberpunk 2077 ultra * (Watt) | 255 | 308 -21% | 255 -0% | 222 13% | 245 4% |
| Cyberpunk 2077 ultra external monitor * (Watt) | 244 | 300 -23% | 255 -5% | 217 11% | 241 1% |
| Load Maximum * (Watt) | 292.1 | 321 -10% | 294 -1% | 336 -15% | 291.5 -0% |
* ... Meglio usare valori piccoli
Power consumption Cyberpunk / stress test
Power consumption with an external monitor
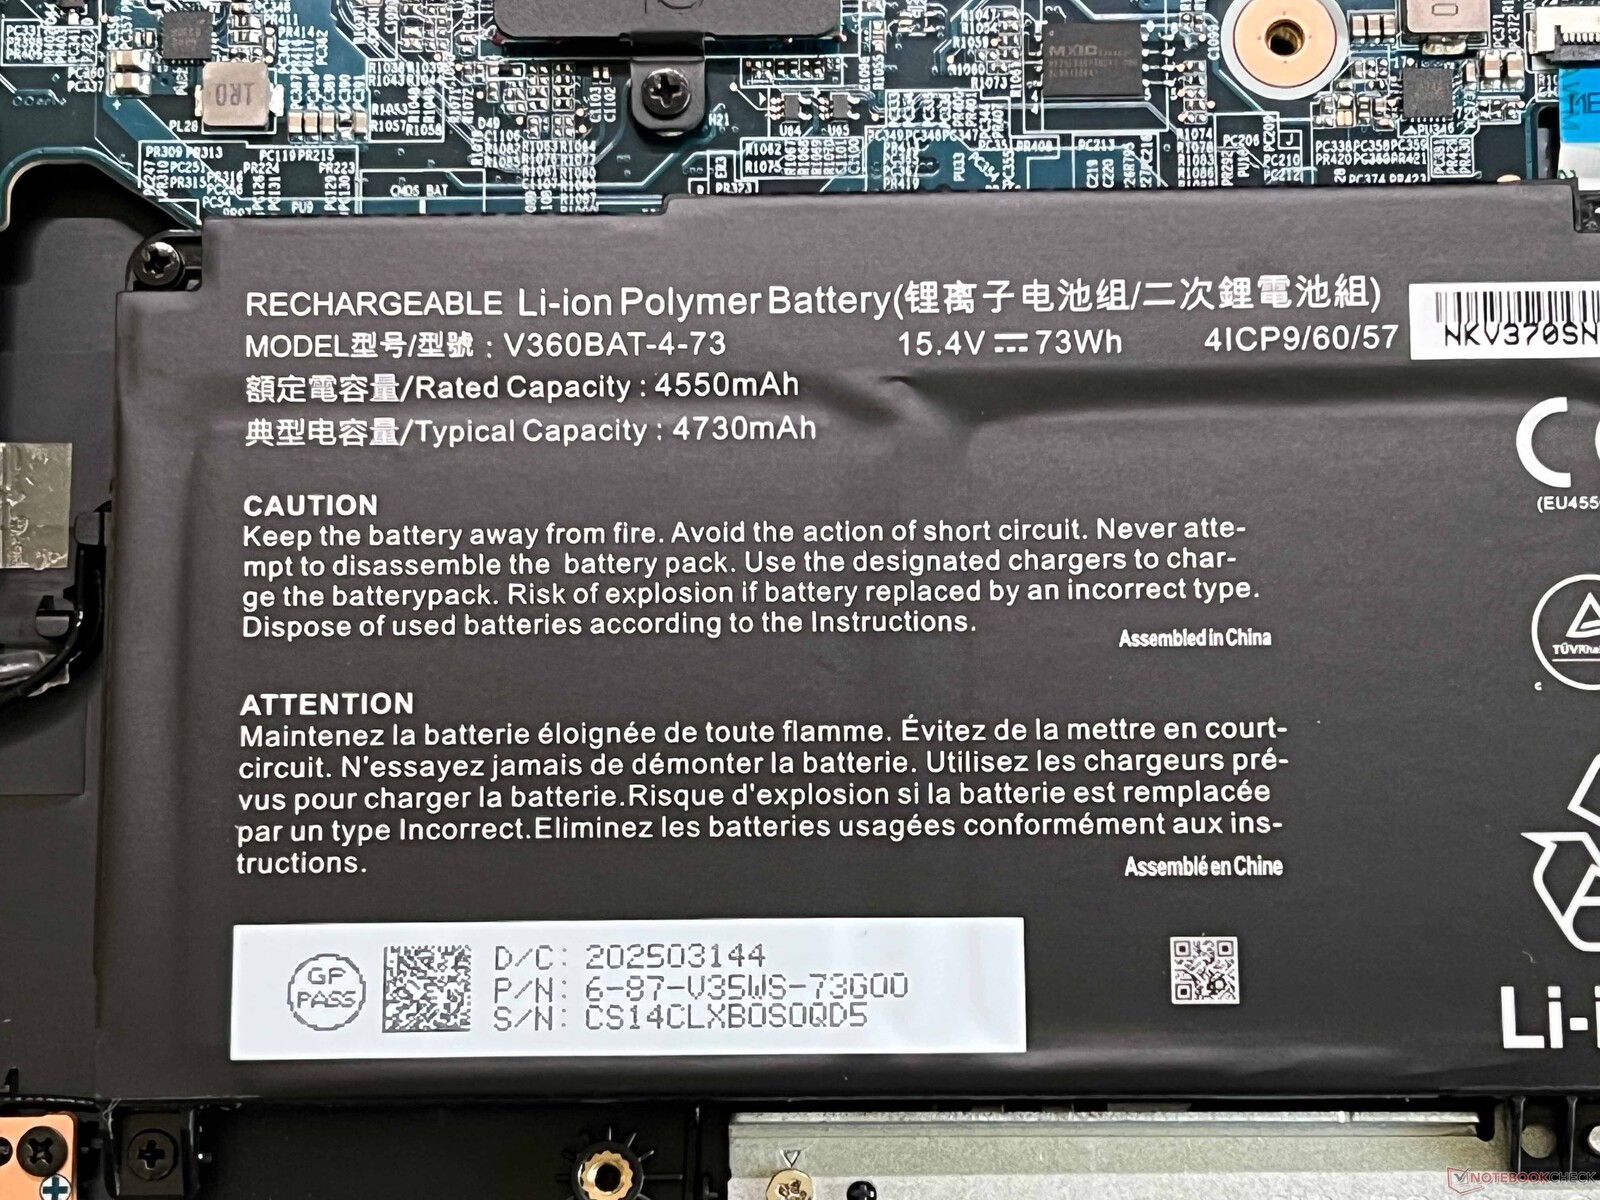
Durata della batteria
La durata della batteria da 73 Wh può essere descritta solo come media. Nel nostro test Wi-Fi a 150 cd/m² (35% della luminosità massima), abbiamo misurato poco meno di 6 ore, e alla massima luminosità, abbiamo misurato 4,5 ore.
Valutazione complessiva di Notebookcheck
Schenker XMG Focus 17 M25
- 08/04/2025 v8
Andreas Osthoff
 Total Sustainability Score:
 Possibili alternative a confronto
Transparency
La selezione dei dispositivi da recensire viene effettuata dalla nostra redazione. Il campione di prova è stato fornito all'autore come prestito dal produttore o dal rivenditore ai fini di questa recensione. L'istituto di credito non ha avuto alcuna influenza su questa recensione, né il produttore ne ha ricevuto una copia prima della pubblicazione. Non vi era alcun obbligo di pubblicare questa recensione. In quanto società mediatica indipendente, Notebookcheck non è soggetta all'autorità di produttori, rivenditori o editori.
Ecco come Notebookcheck esegue i test
Ogni anno, Notebookcheck esamina in modo indipendente centinaia di laptop e smartphone utilizzando procedure standardizzate per garantire che tutti i risultati siano comparabili. Da circa 20 anni sviluppiamo continuamente i nostri metodi di prova e nel frattempo stabiliamo gli standard di settore. Nei nostri laboratori di prova, tecnici ed editori esperti utilizzano apparecchiature di misurazione di alta qualità. Questi test comportano un processo di validazione in più fasi. Il nostro complesso sistema di valutazione si basa su centinaia di misurazioni e parametri di riferimento ben fondati, che mantengono l'obiettività.
