Recensione del laptop Schenker Work 17: Grande schermo e una tastiera colorata

Un hardware potente che viene fornito con molte caratteristiche personalizzabili è probabilmente il concetto centrale dietro i portatili Schenker. Il produttore tedesco offre computer portatili che soddisfano ogni esigenza. Il Work 17 è un portatile da ufficio che viene fornito con molte opzioni per la memoria e lo stoccaggio. Ci sono anche vari layout di tastiera disponibili, e il periodo di garanzia può essere impostato a due o tre anni.
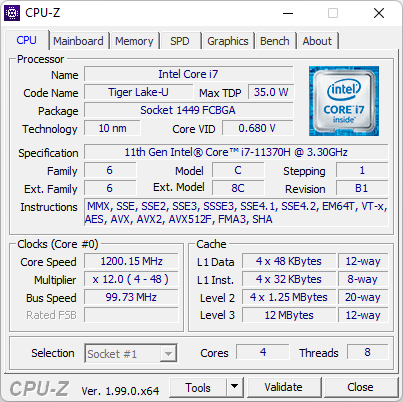
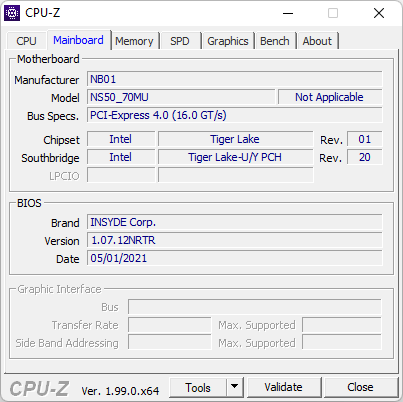
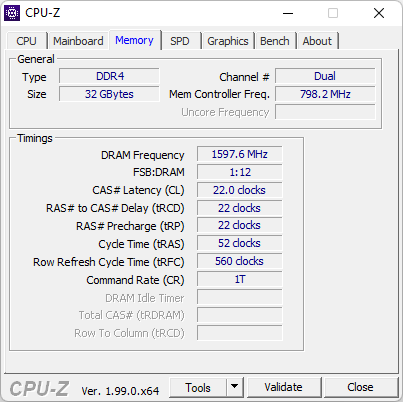
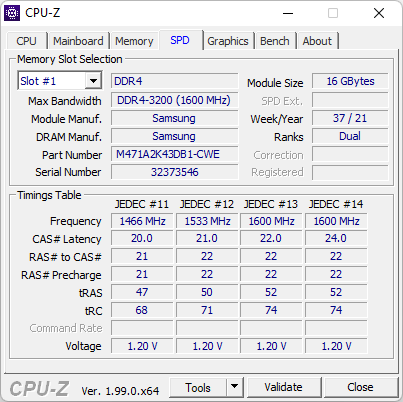
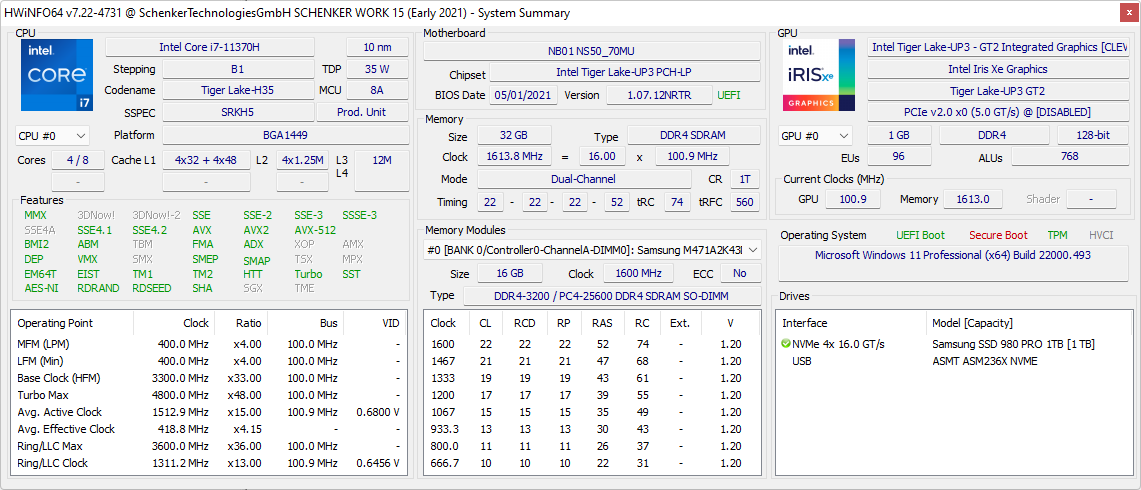
Il nostro campione di recensione è equipaggiato con 32 GB di RAM, Intel Core i7-11370H e 1 TB NVMe SSD. Senza licenza Windows, questa configurazione si aggira intorno ai 1.470 euro. La configurazione più conveniente attualmente disponibile è intorno ai 1.180 Euro (~$1.273)
I portatili da ufficio di grande formato sono rari al giorno d'oggi, così ilLG Gram 17e l Acer Aspire 5 sono tra i contendenti. Se preferisci qualcosa di più piccolo, ilSchenker Work 15 potrebbe essere un'alternativa.
Aggiornamento 17.04.: Abbiamo ripetuto il test della batteria in modalità Performance con il nuovo BIOS. Tutti i dettagli sono disponibili nella sezione relativa alla durata della batteria.
Potenziali concorrenti a confronto
Punteggio | Data | Modello | Peso | Altezza | Dimensione | Risoluzione | Prezzo |
|---|---|---|---|---|---|---|---|
| 84.3 % v7 (old) | 04/2022 | Schenker Work 17 Tiger Lake-H i7-11370H, Iris Xe G7 96EUs | 2.3 kg | 19.8 mm | 17.30" | 1920x1080 | |
| 86.7 % v7 (old) | 09/2021 | LG Gram 17Z90P-G.AA56G i5-1135G7, Iris Xe G7 80EUs | 1.4 kg | 17.8 mm | 17.00" | 2560x1600 | |
| 82.7 % v7 (old) | 03/2021 | Acer Aspire 5 A517-52G-79Z5 i7-1165G7, GeForce MX350 | 2.2 kg | 19.9 mm | 17.30" | 1920x1080 | |
| 76.4 % v7 (old) | 09/2020 | Acer Aspire 3 A317-51G-72MD i7-10510U, GeForce MX250 | 2.8 kg | 24.65 mm | 17.30" | 1920x1080 | |
| 75.9 % v7 (old) | 04/2022 | Dell Inspiron 15 3505-PXHPW R5 3450U, Vega 8 | 2 kg | 19.89 mm | 15.60" | 1920x1080 | |
| 84.3 % v7 (old) | 02/2022 | Schenker Work 15 Tiger Lake-H i7-11370H, Iris Xe G7 96EUs | 1.7 kg | 19.9 mm | 15.60" | 1920x1080 |
Case e connettività - Alluminio robusto e molte porte
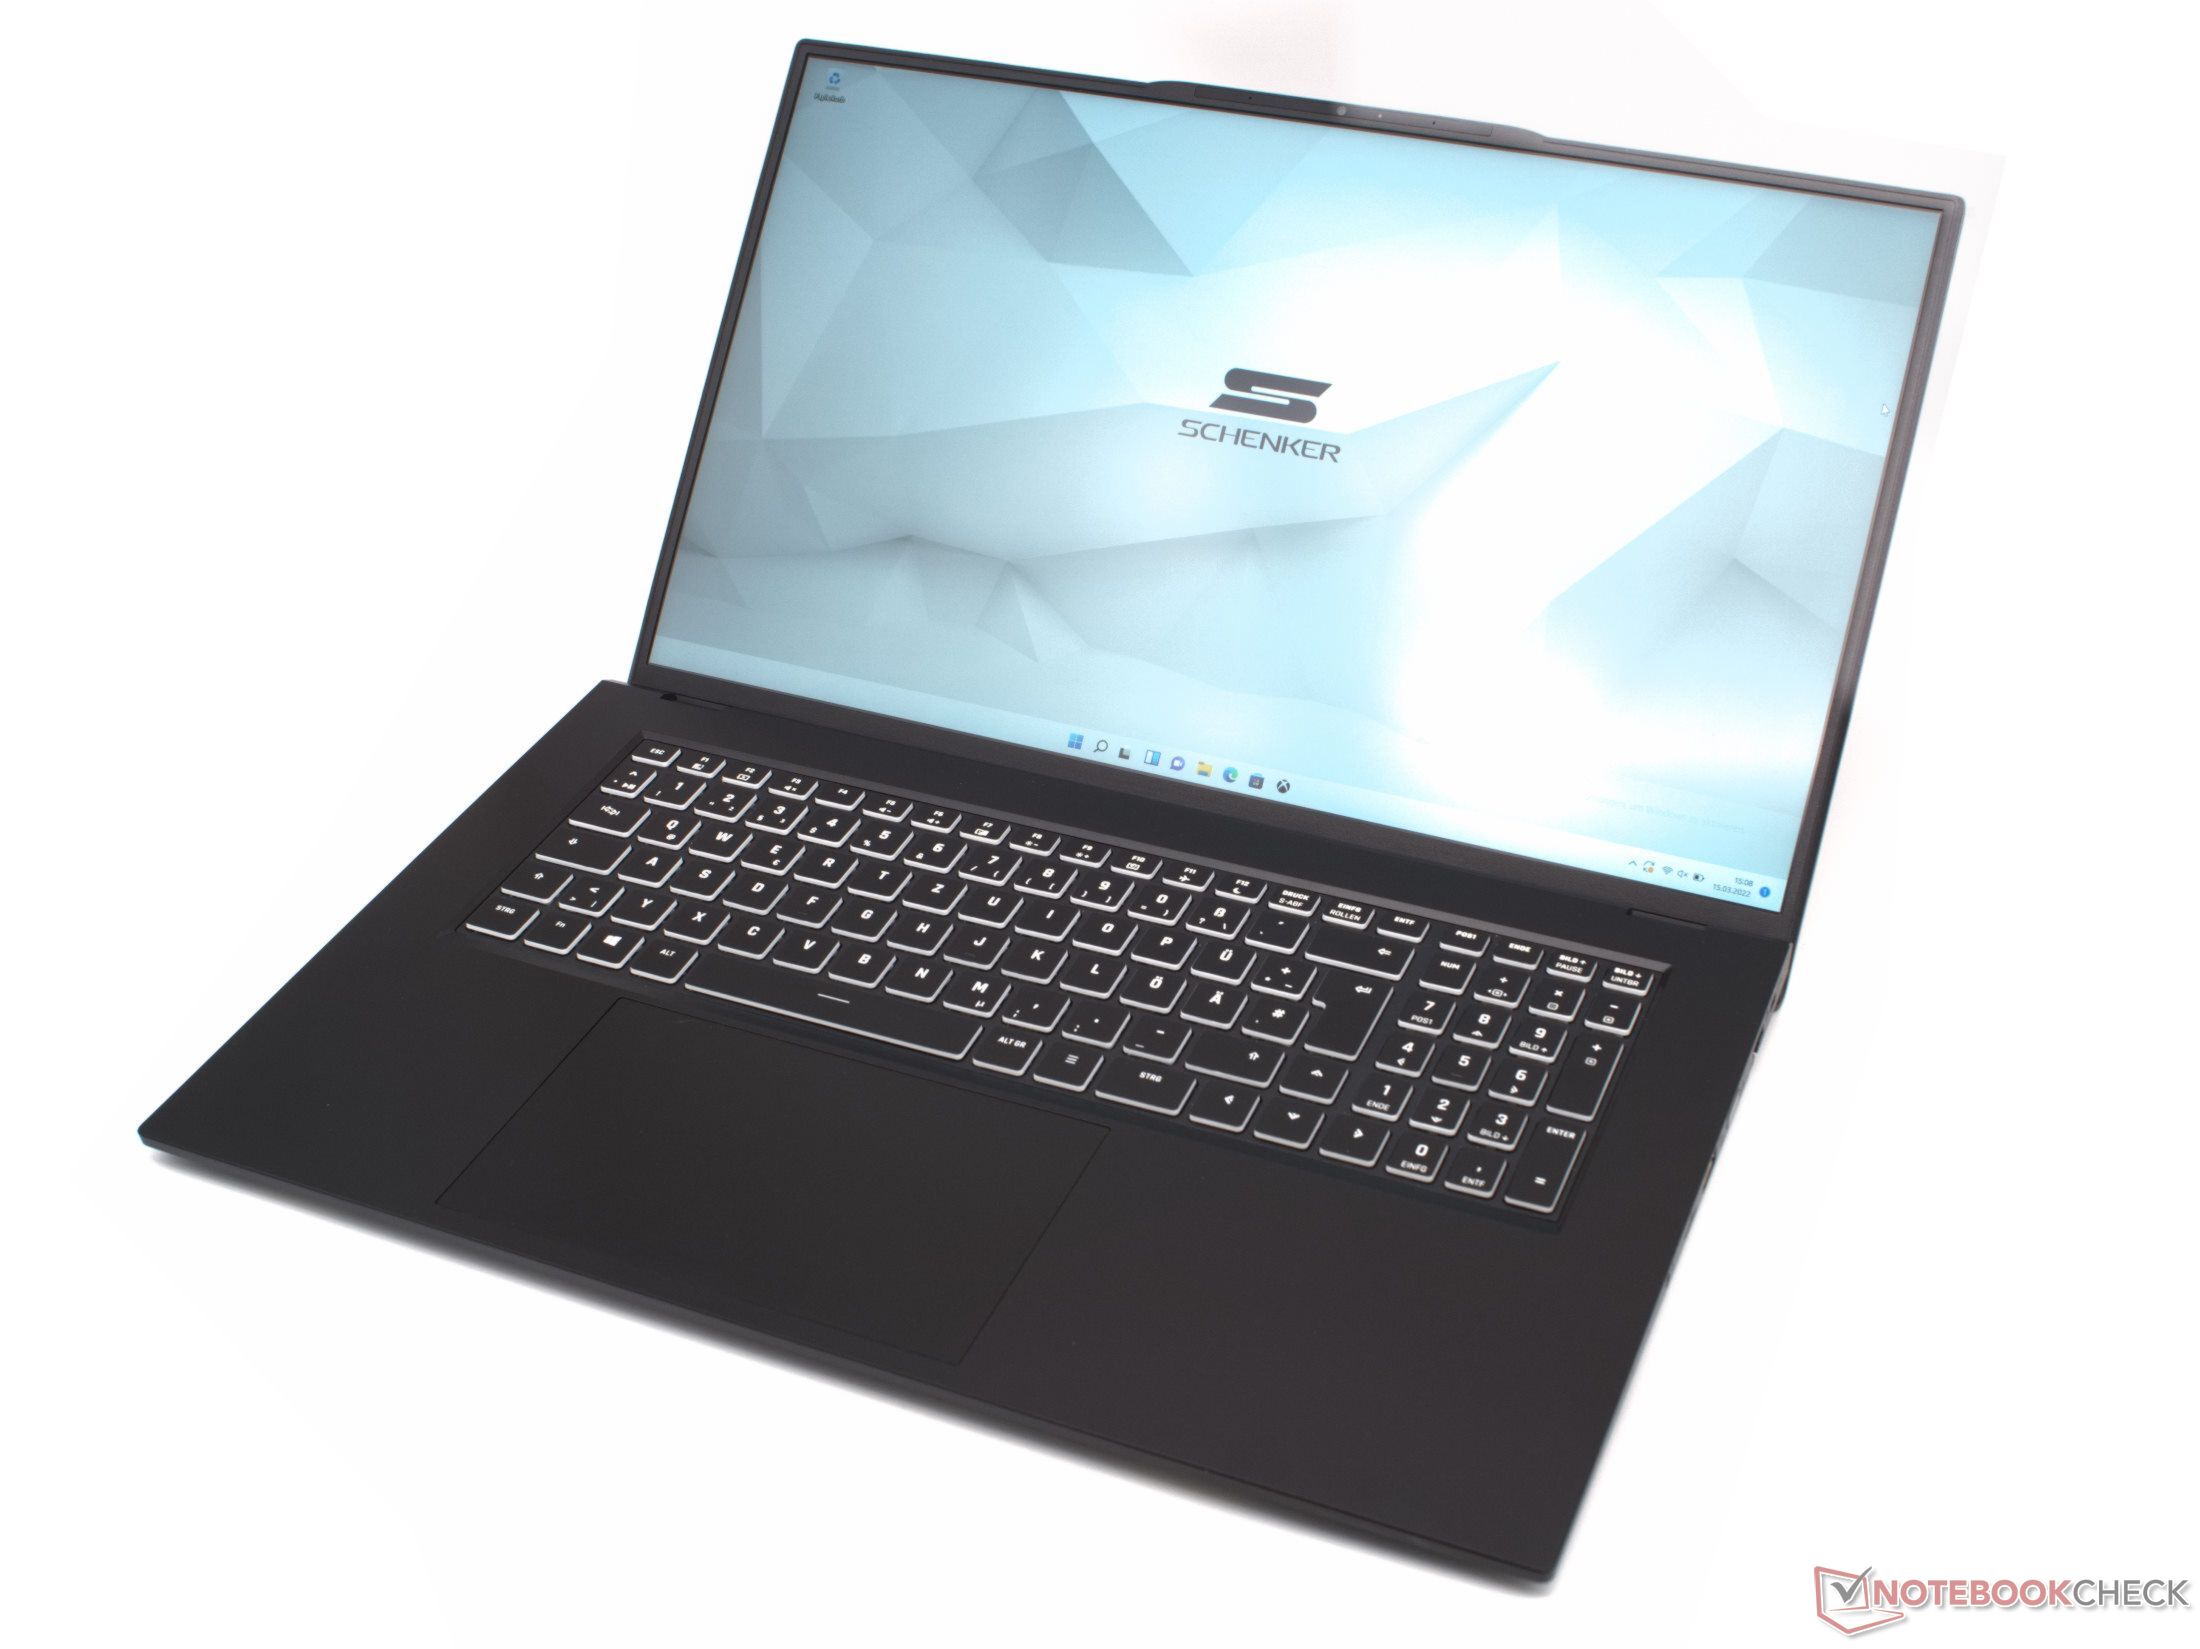
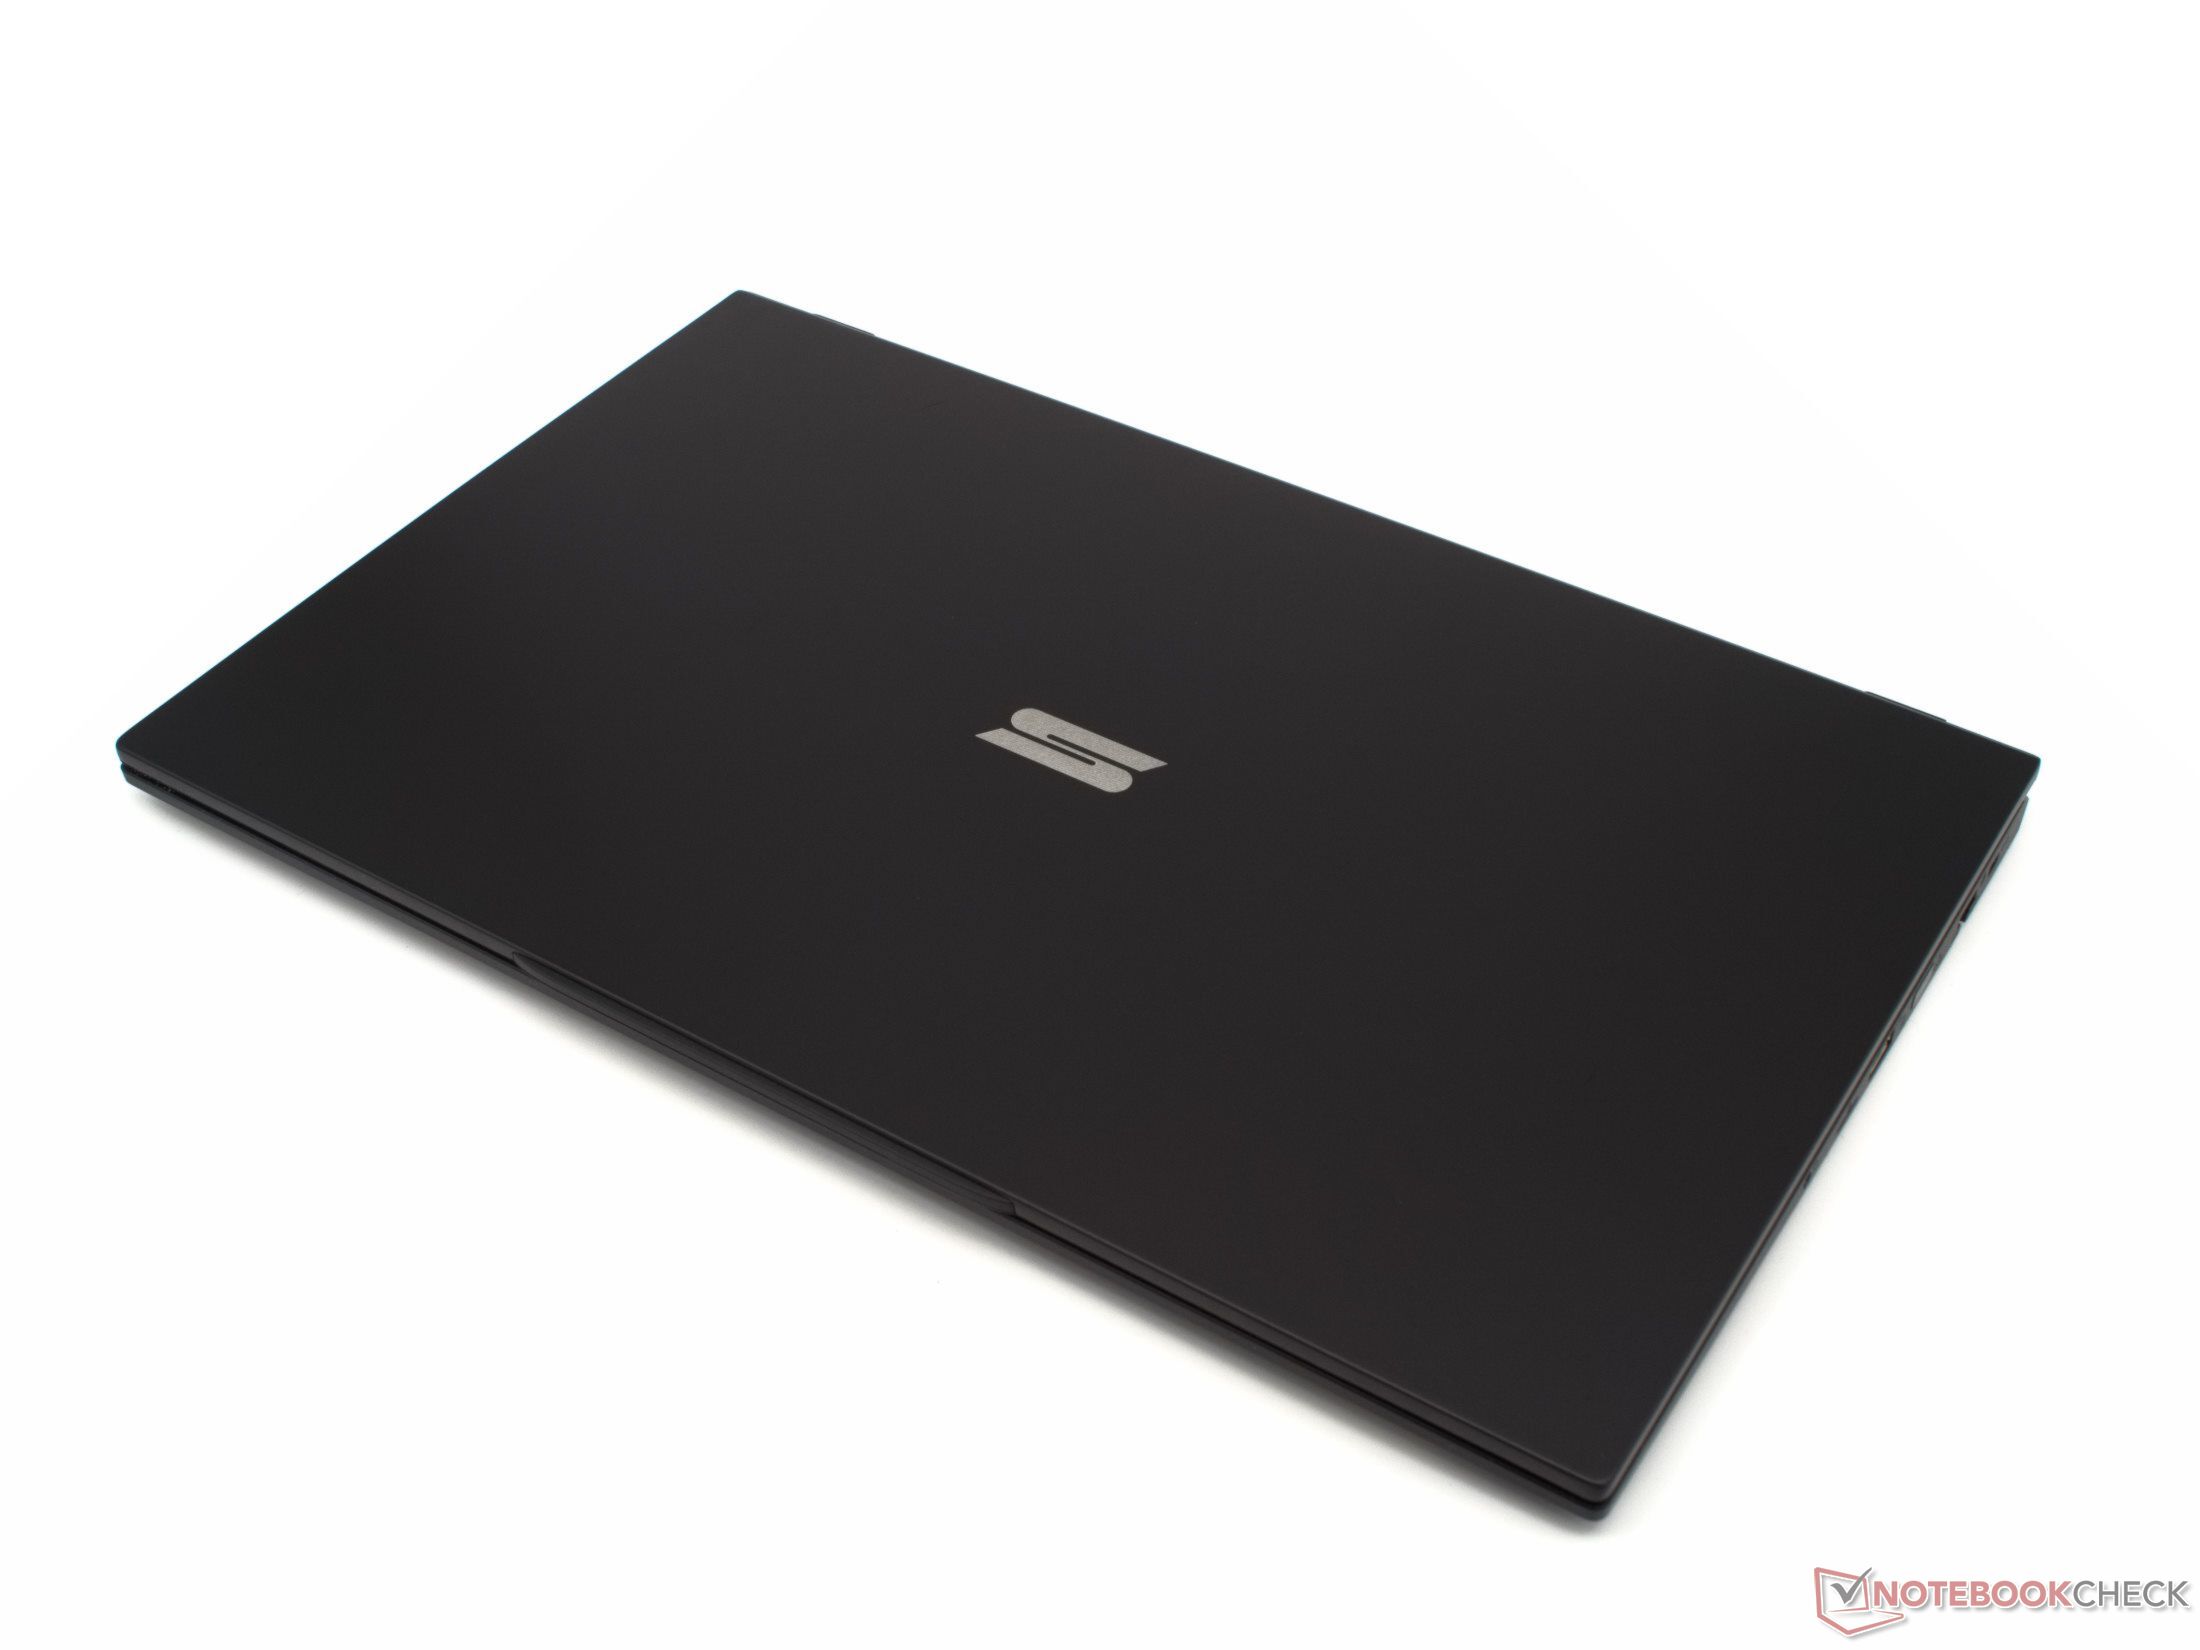
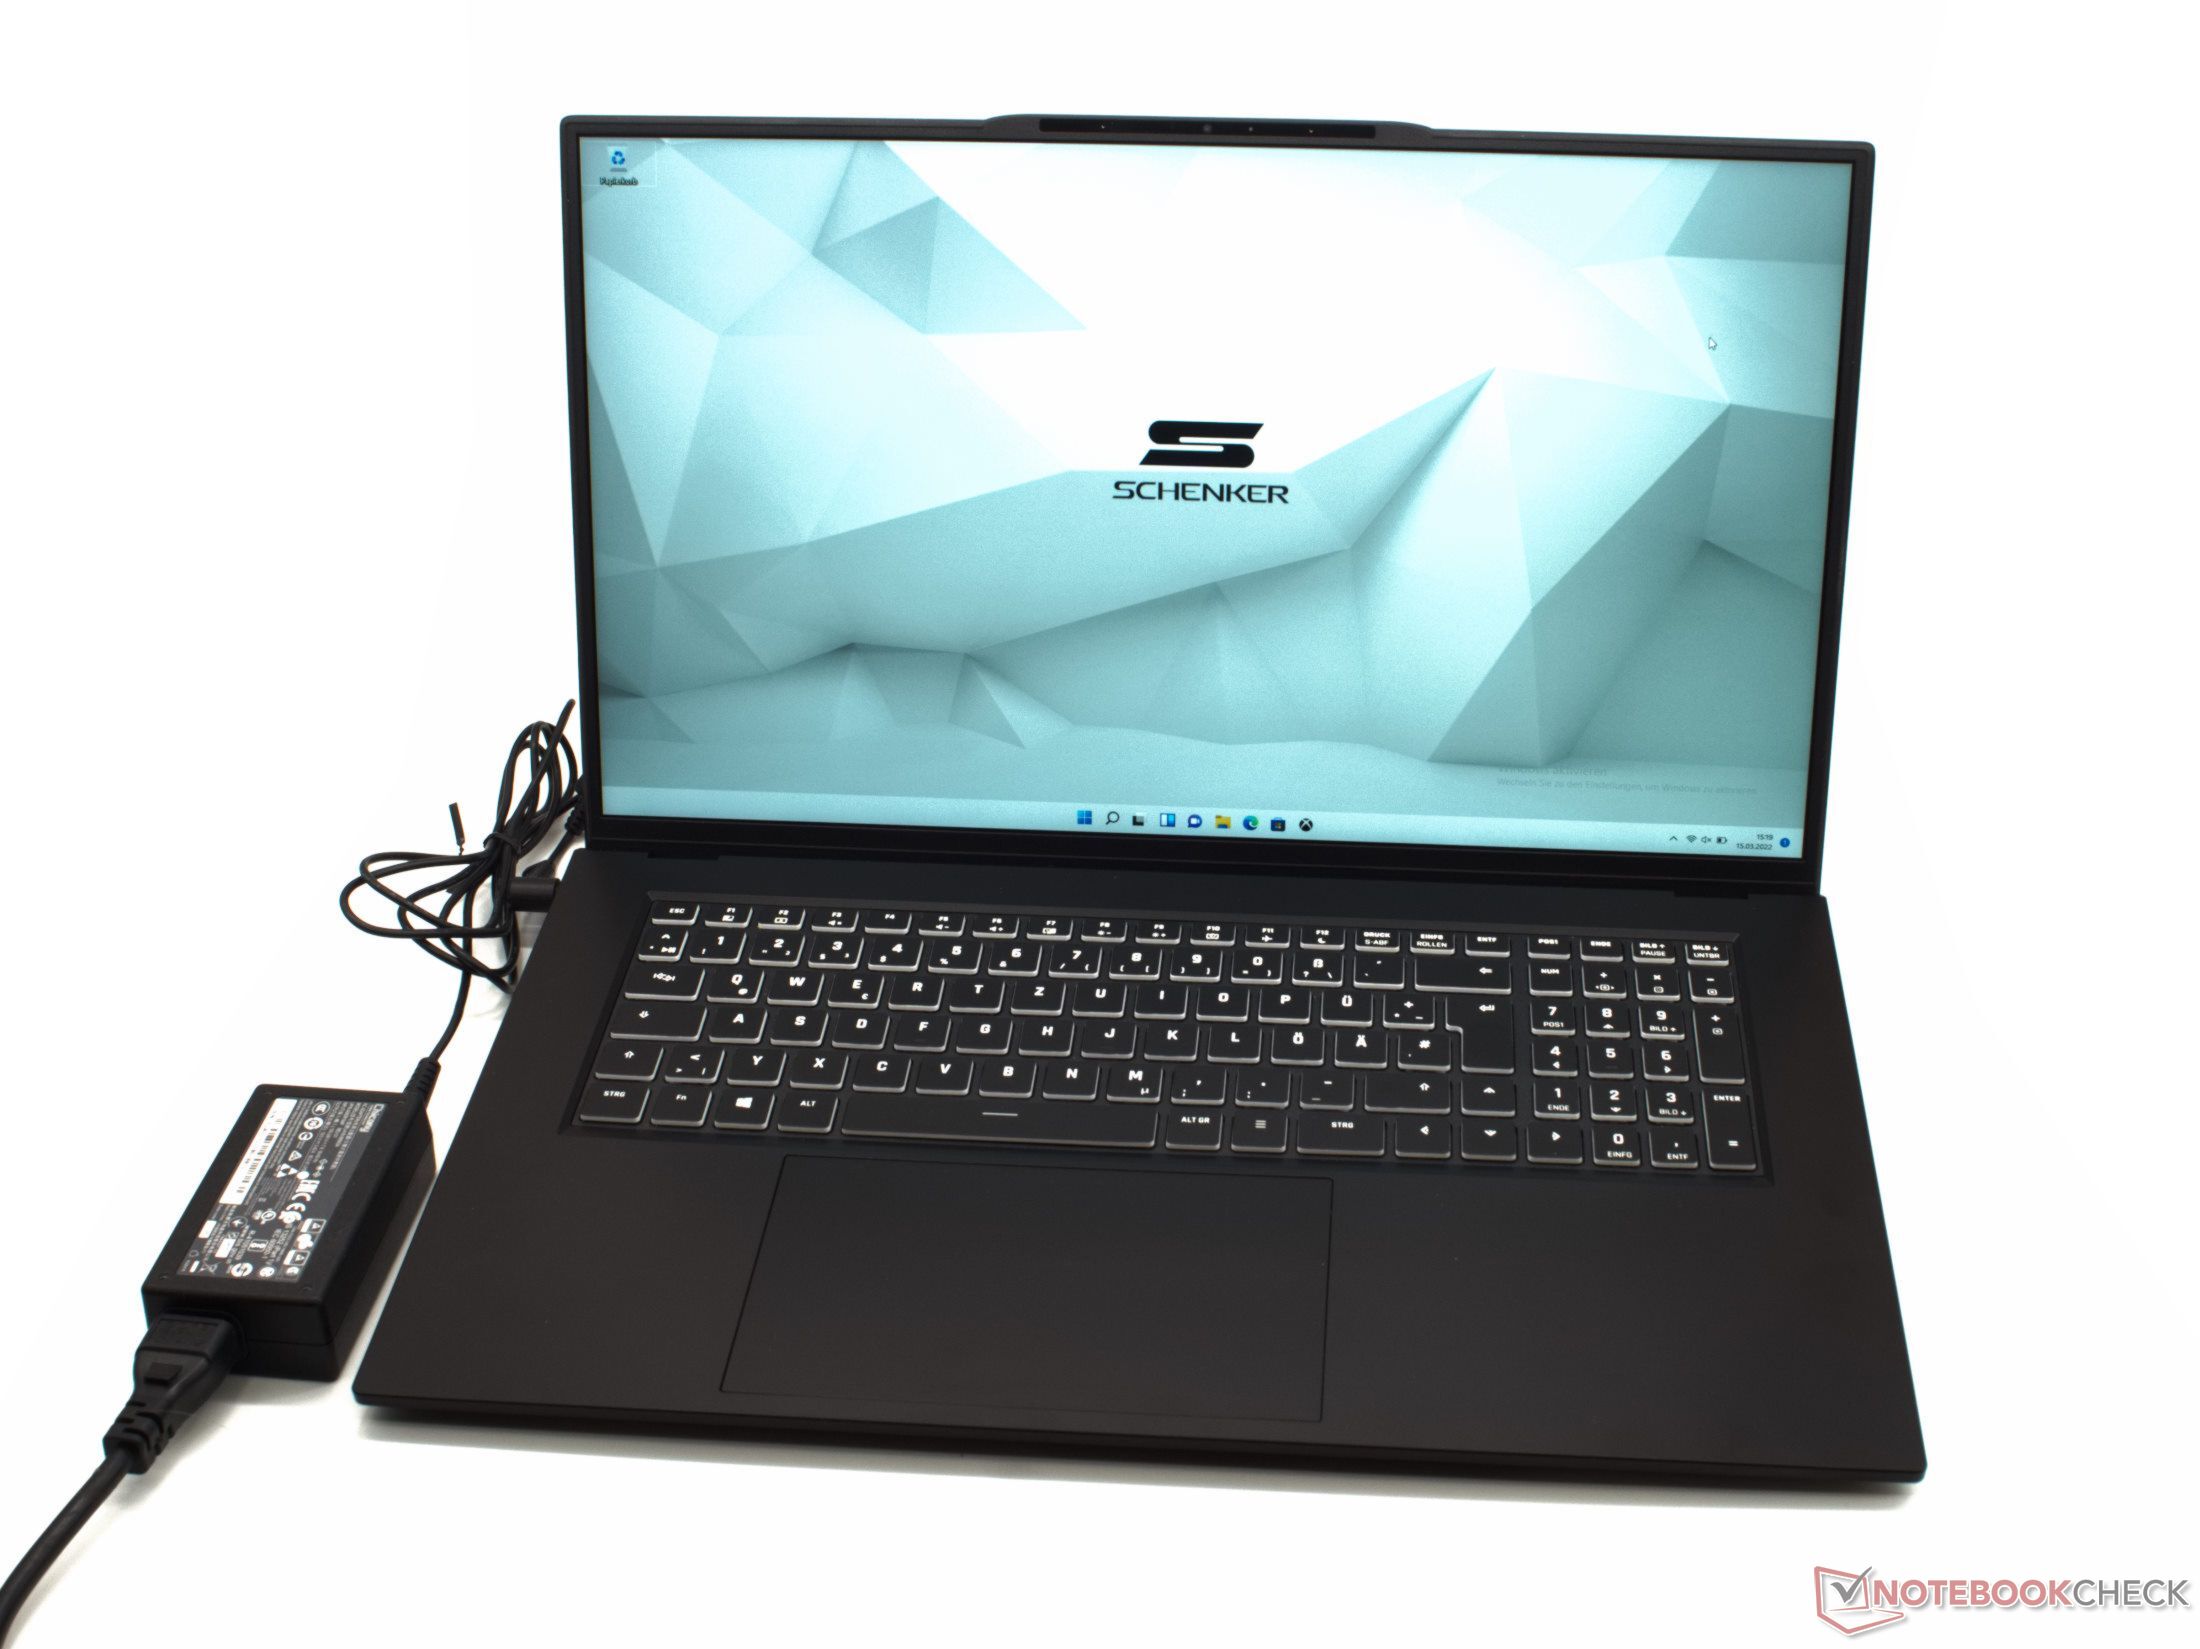
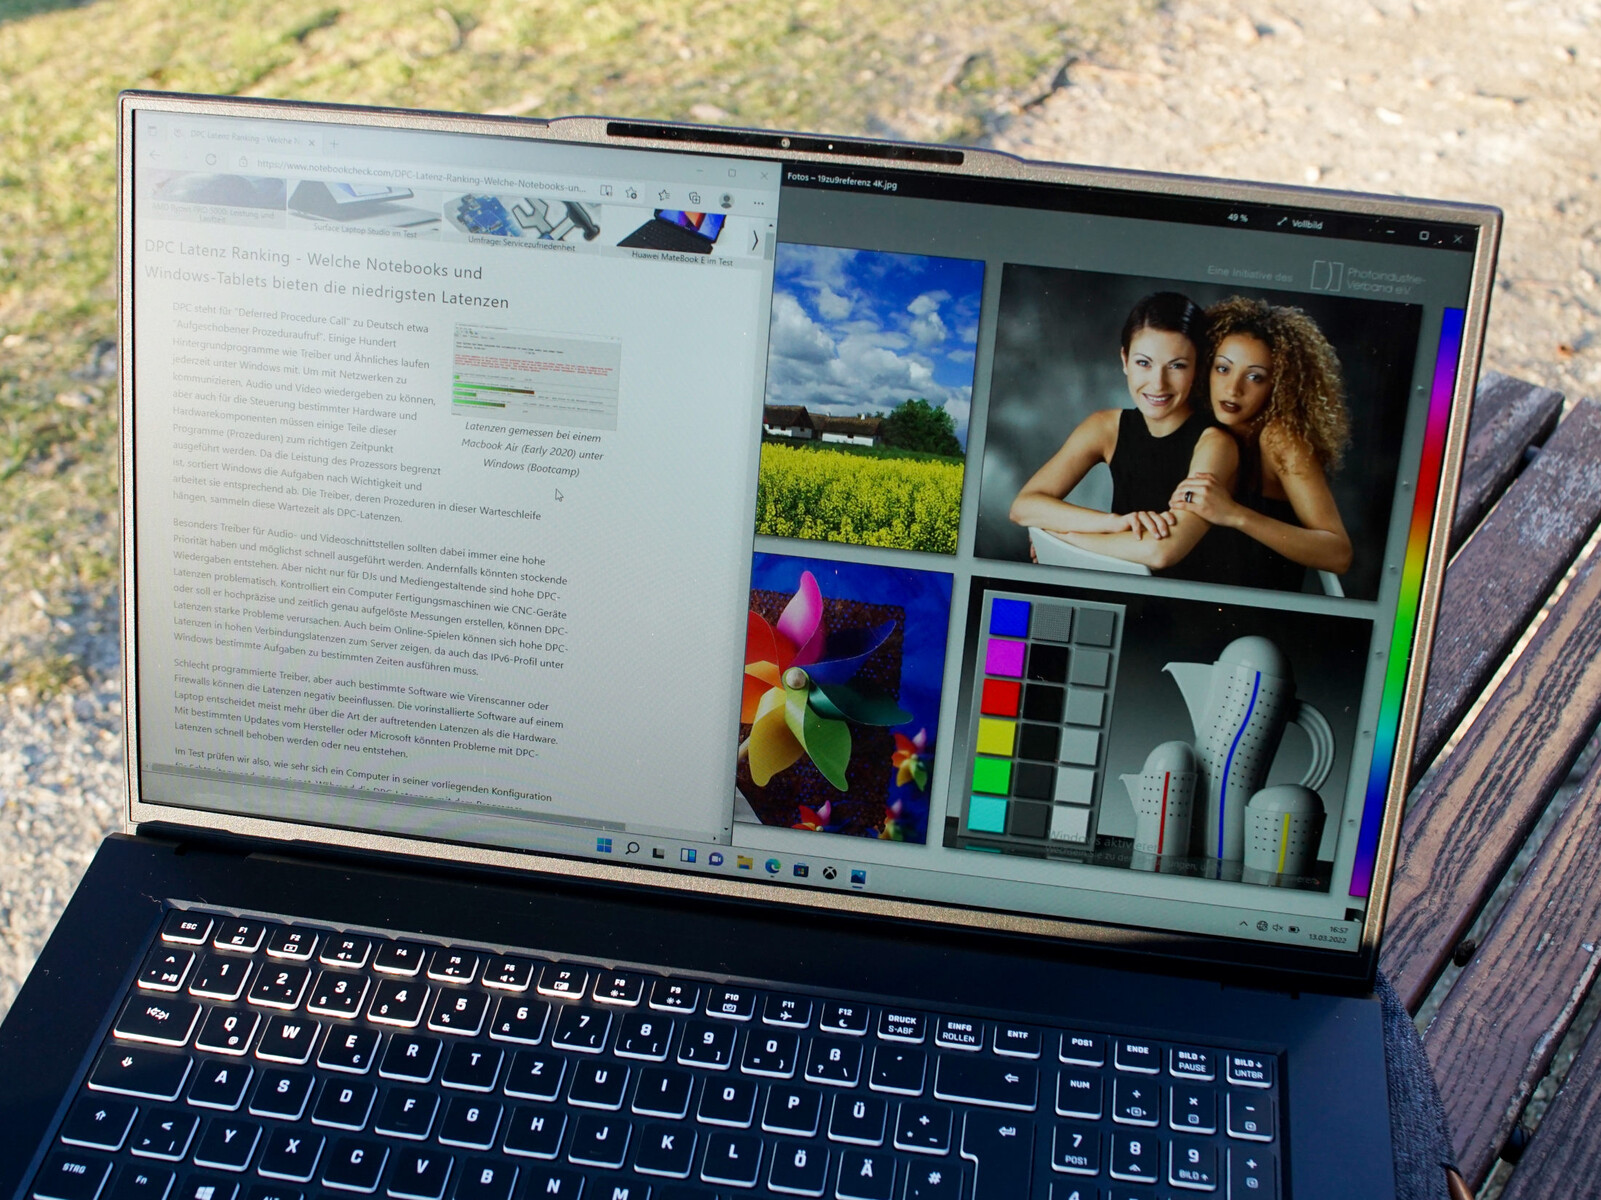
Con l'alluminio nero per il coperchio del display e la copertura inferiore, così come la plastica nera per la parte superiore dell'unità base, compresa la tastiera e il touchpad, lo Schenker Work 17 è visivamente abbastanza discreto. Tuttavia, uno sguardo allo schermo rivela la cornice estremamente stretta del display. È larga solo 6 mm.
A parte l'aspetto un po' modesto, il portatile ha una costruzione di alta qualità, ed è molto robusto in tutte le aree. Nonostante le sue dimensioni, lo schermo difficilmente si può torcere, e lo stesso vale per l'unità base.
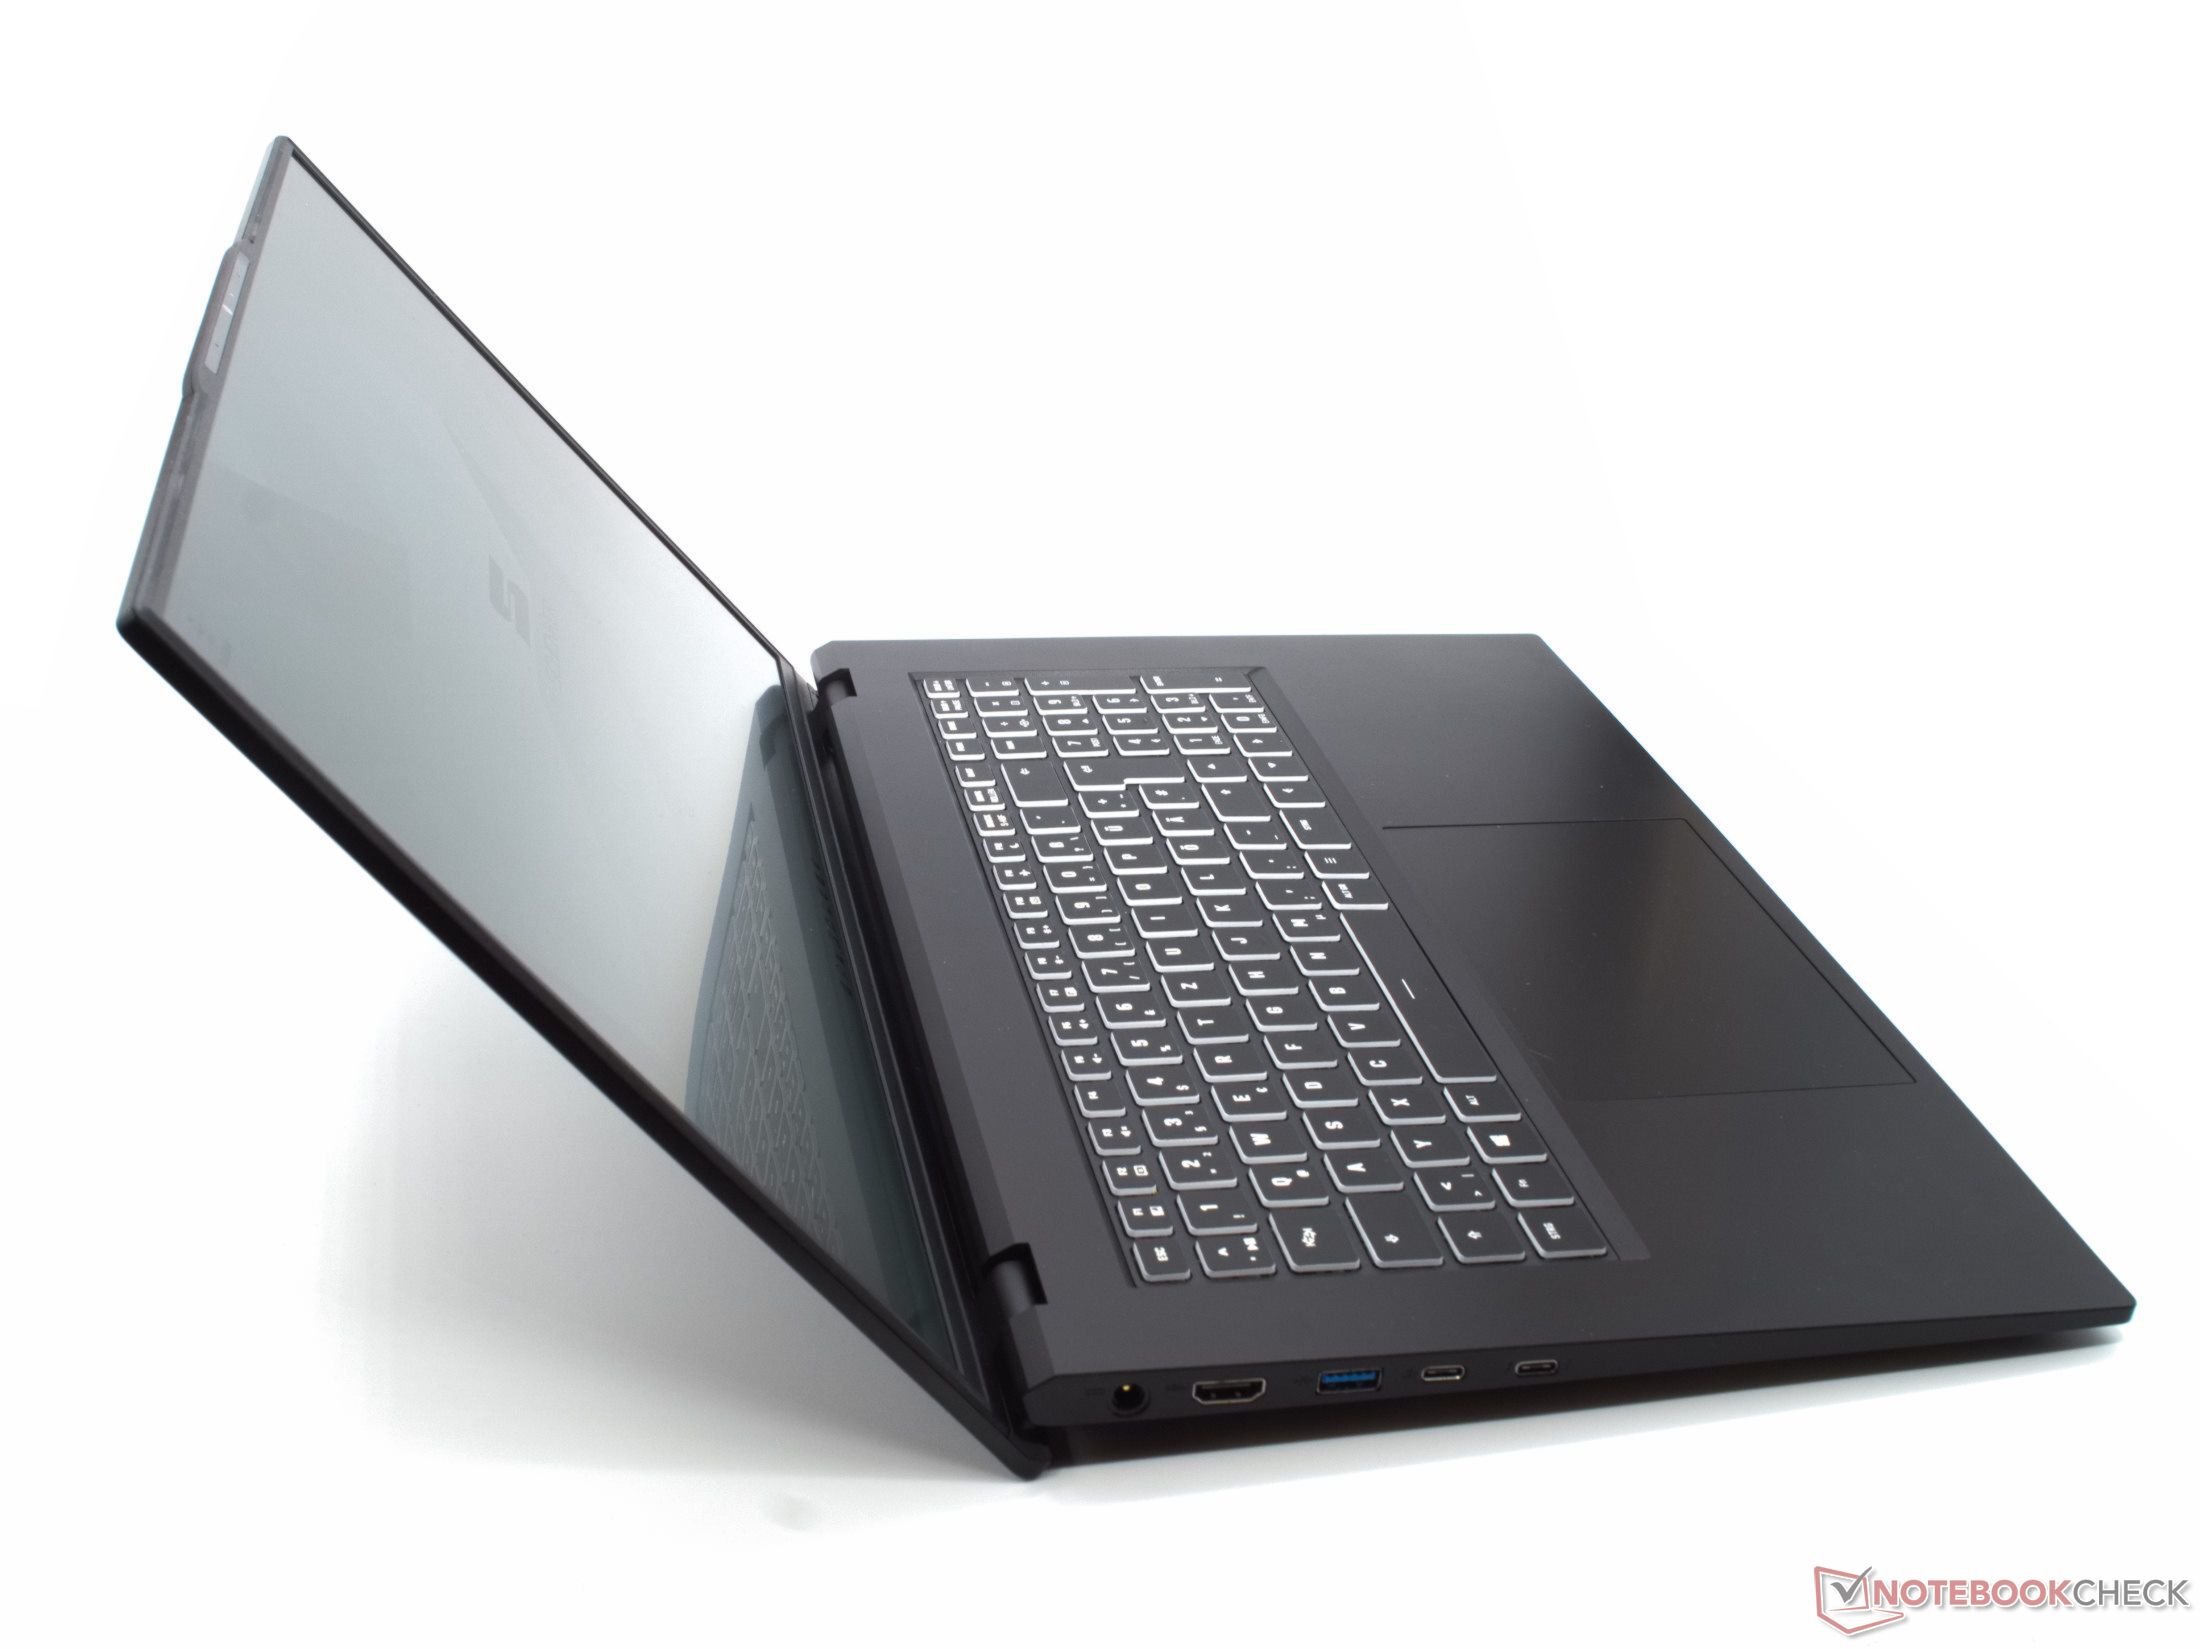
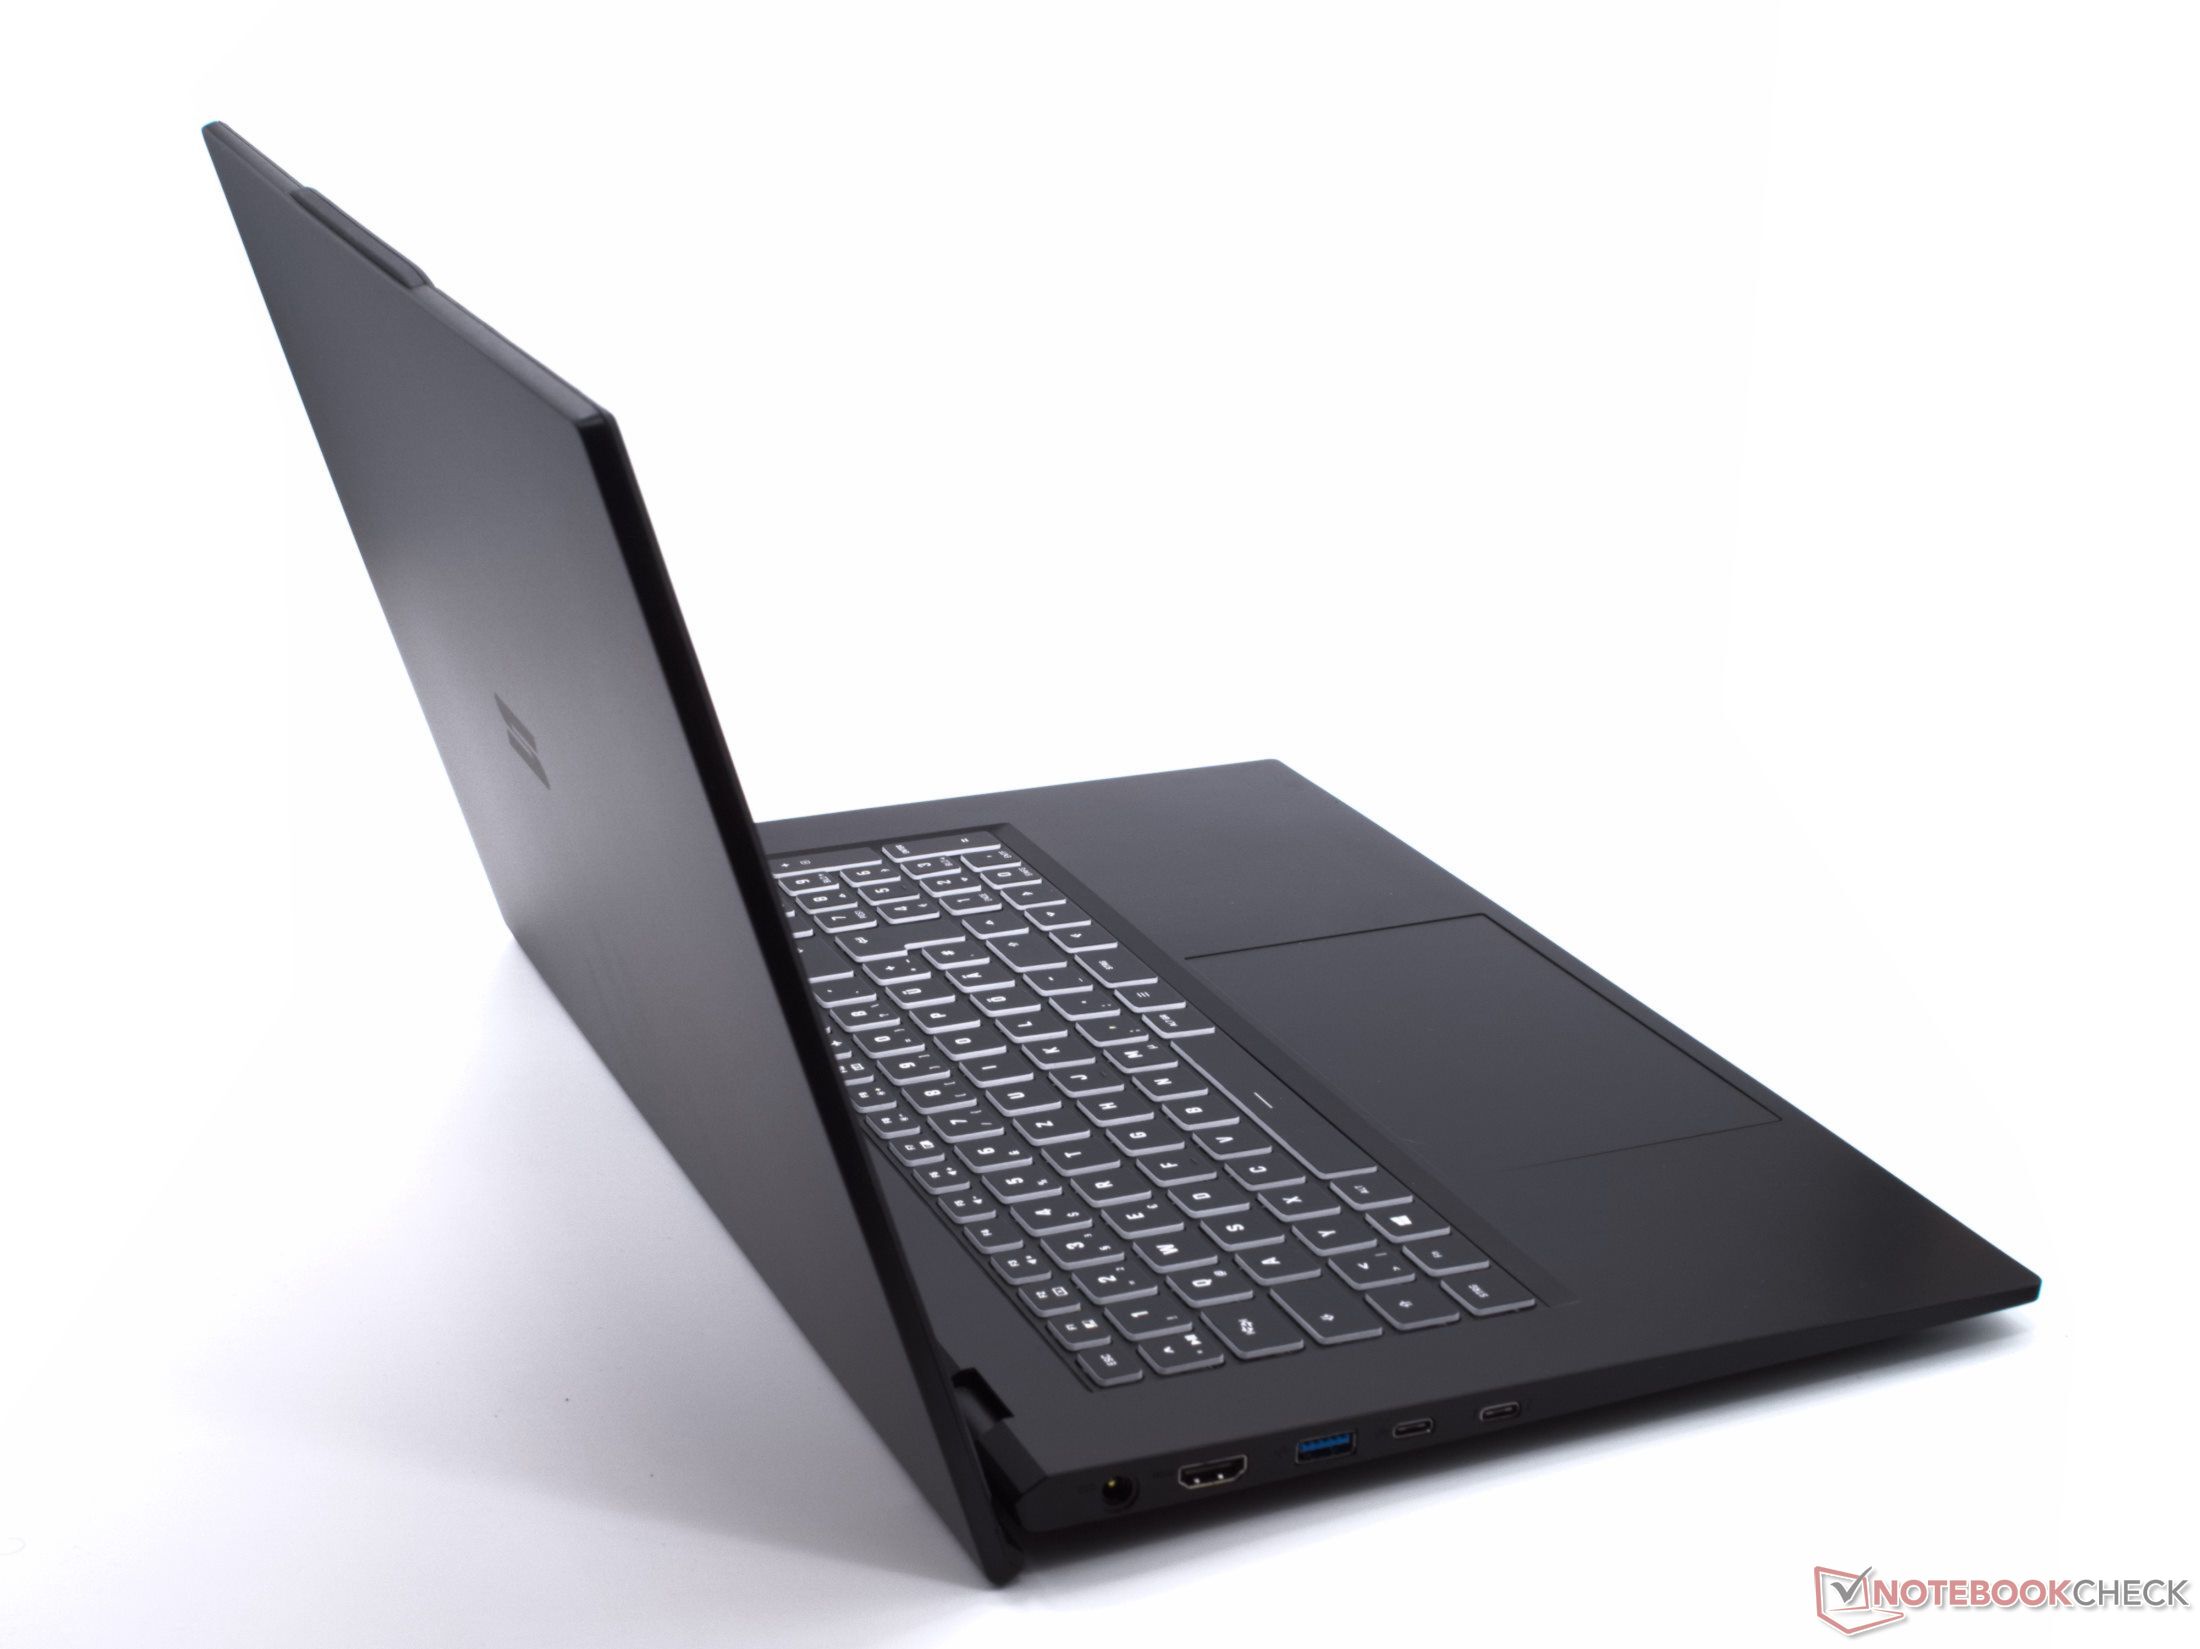
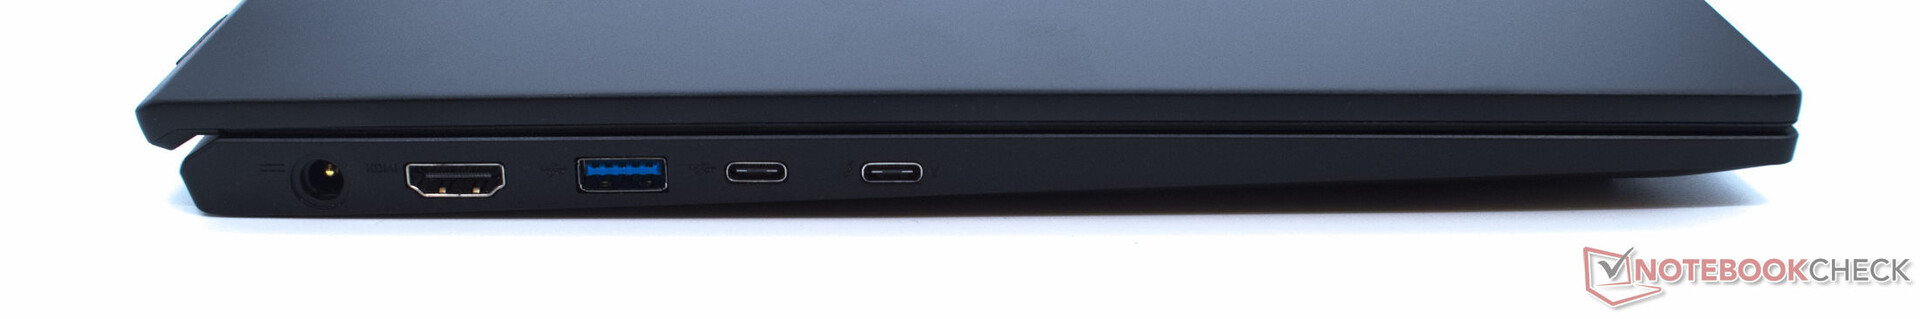
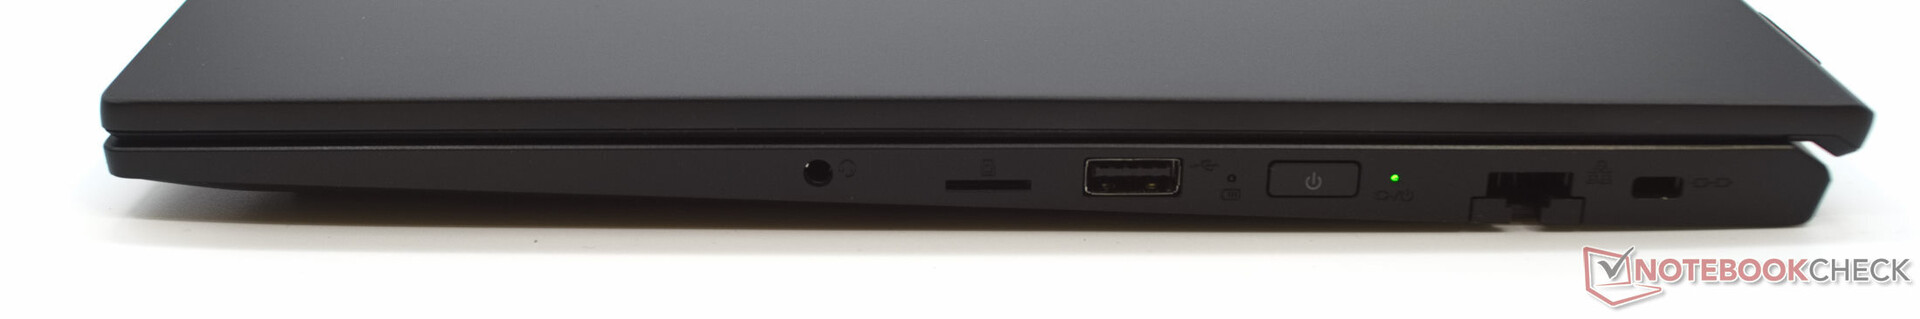
Grazie a Thunderbolt 4, HDMI, LAN e un lettore di schede microSD, lo Schenker Work 17 è quasi completamente equipaggiato in termini di connettività. Sia l'Intel Wi-Fi AX 201 che il lettore di schede microSD lavorano ad alta velocità.
La webcam è della tipica bassa qualità che si trova nelle webcam dei portatili. Oltre allo slot per il lucchetto Kensington, ci sono anche le caratteristiche di sicurezza dell'Intel Core i7-11370H.
| SD Card Reader | |
| average JPG Copy Test (av. of 3 runs) | |
| LG Gram 17Z90P-G.AA56G (Toshiba Exceria Pro M501 microSDXC 64GB) | |
| Schenker Work 15 Tiger Lake-H (Angelbird AV Pro V60) | |
| Schenker Work 17 Tiger Lake-H (Angelbird AV Pro V60) | |
| Media della classe Office (22.4 - 198.5, n=22, ultimi 2 anni) | |
| Dell Inspiron 15 3505-PXHPW | |
| maximum AS SSD Seq Read Test (1GB) | |
| LG Gram 17Z90P-G.AA56G (Toshiba Exceria Pro M501 microSDXC 64GB) | |
| Media della classe Office (27.4 - 249, n=20, ultimi 2 anni) | |
| Schenker Work 17 Tiger Lake-H (Angelbird AV Pro V60) | |
| Schenker Work 15 Tiger Lake-H (Angelbird AV Pro V60) | |
| Dell Inspiron 15 3505-PXHPW | |


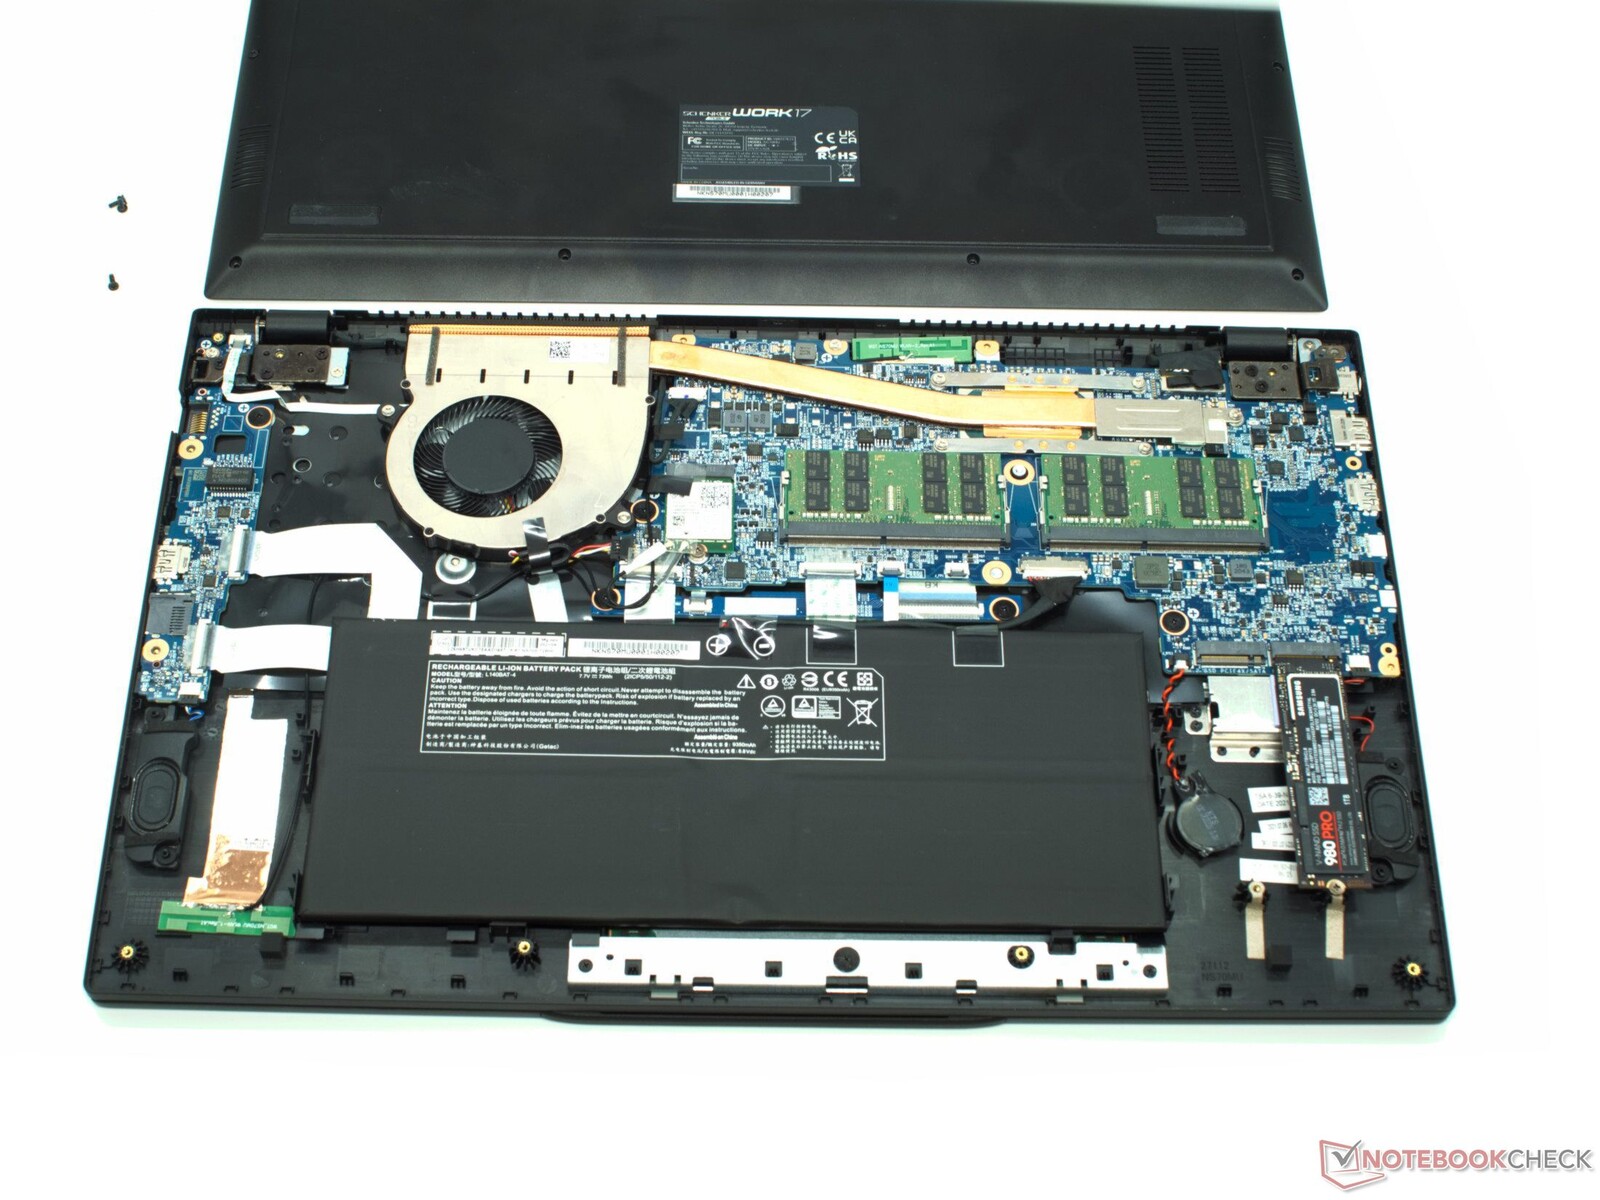
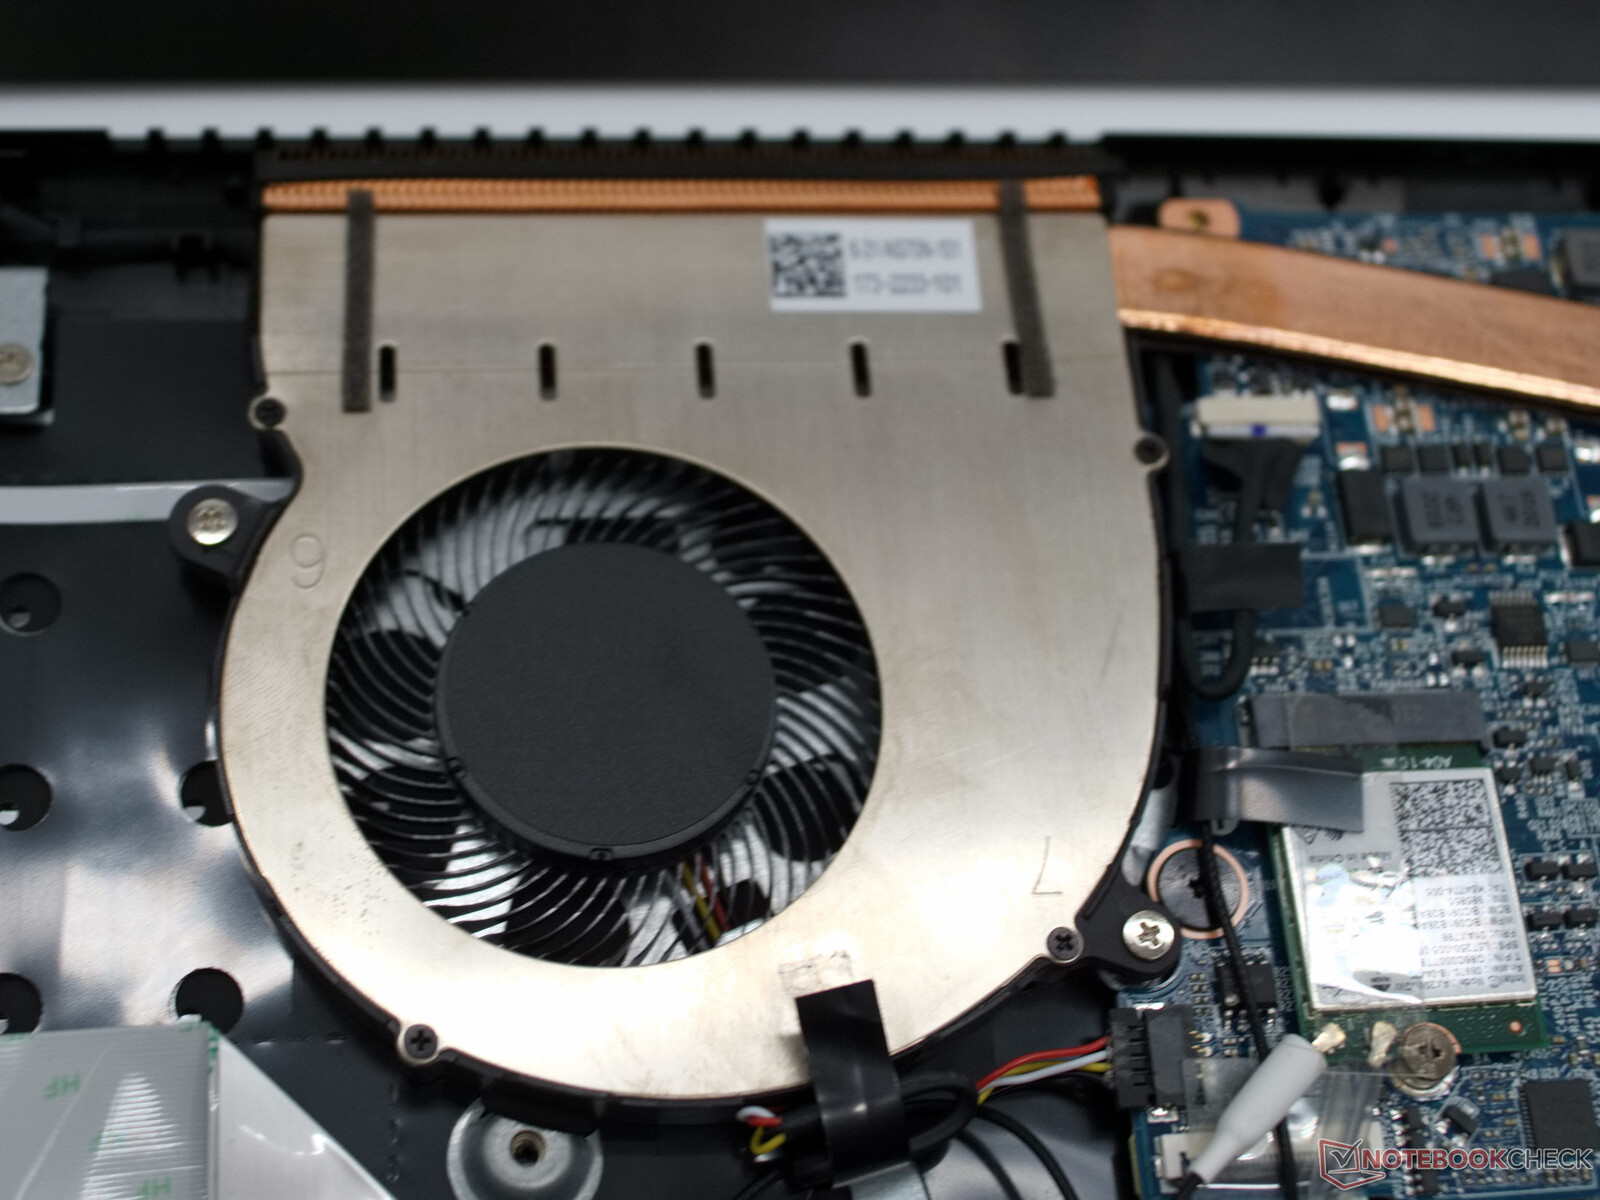
Il coperchio inferiore può essere facilmente sollevato rimuovendo le viti. Questo rivela la RAM aggiornabile, uno slot SSD M.2 libero, e un modulo WLAN sostituibile. Molte cose sono modulari nello Schenker Work 17. Questo dovrebbe rendere facili le piccole riparazioni e le attività di manutenzione
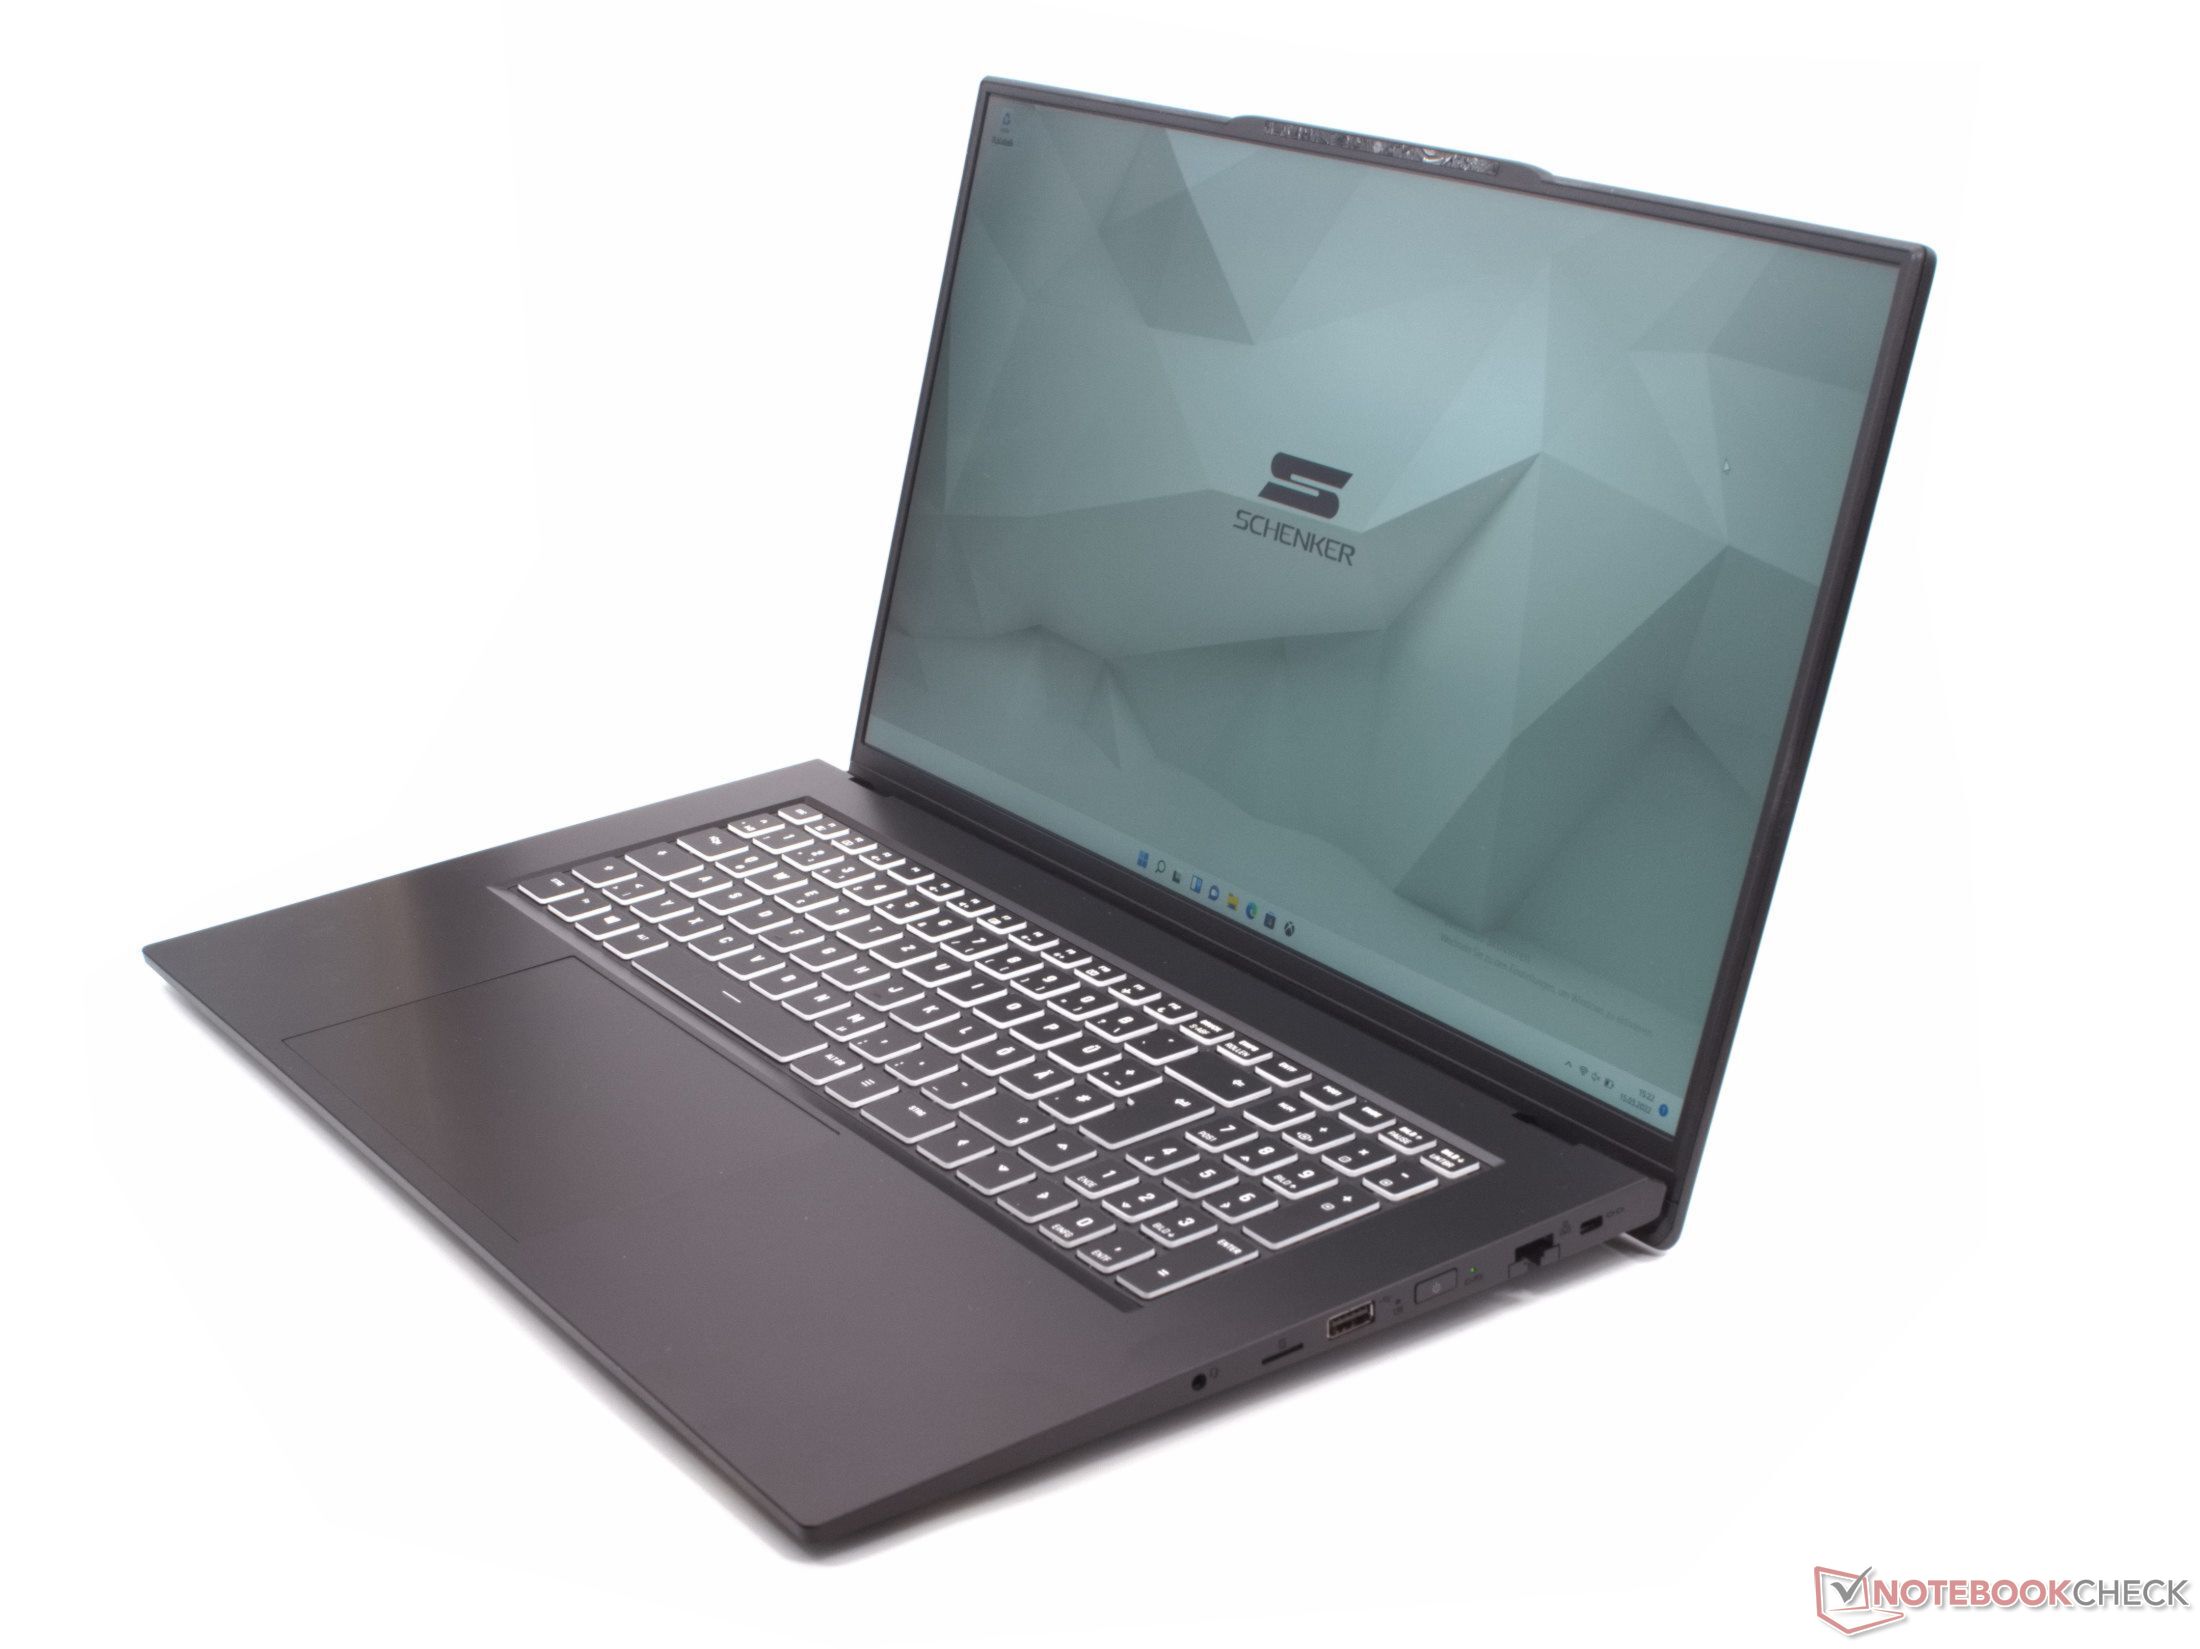
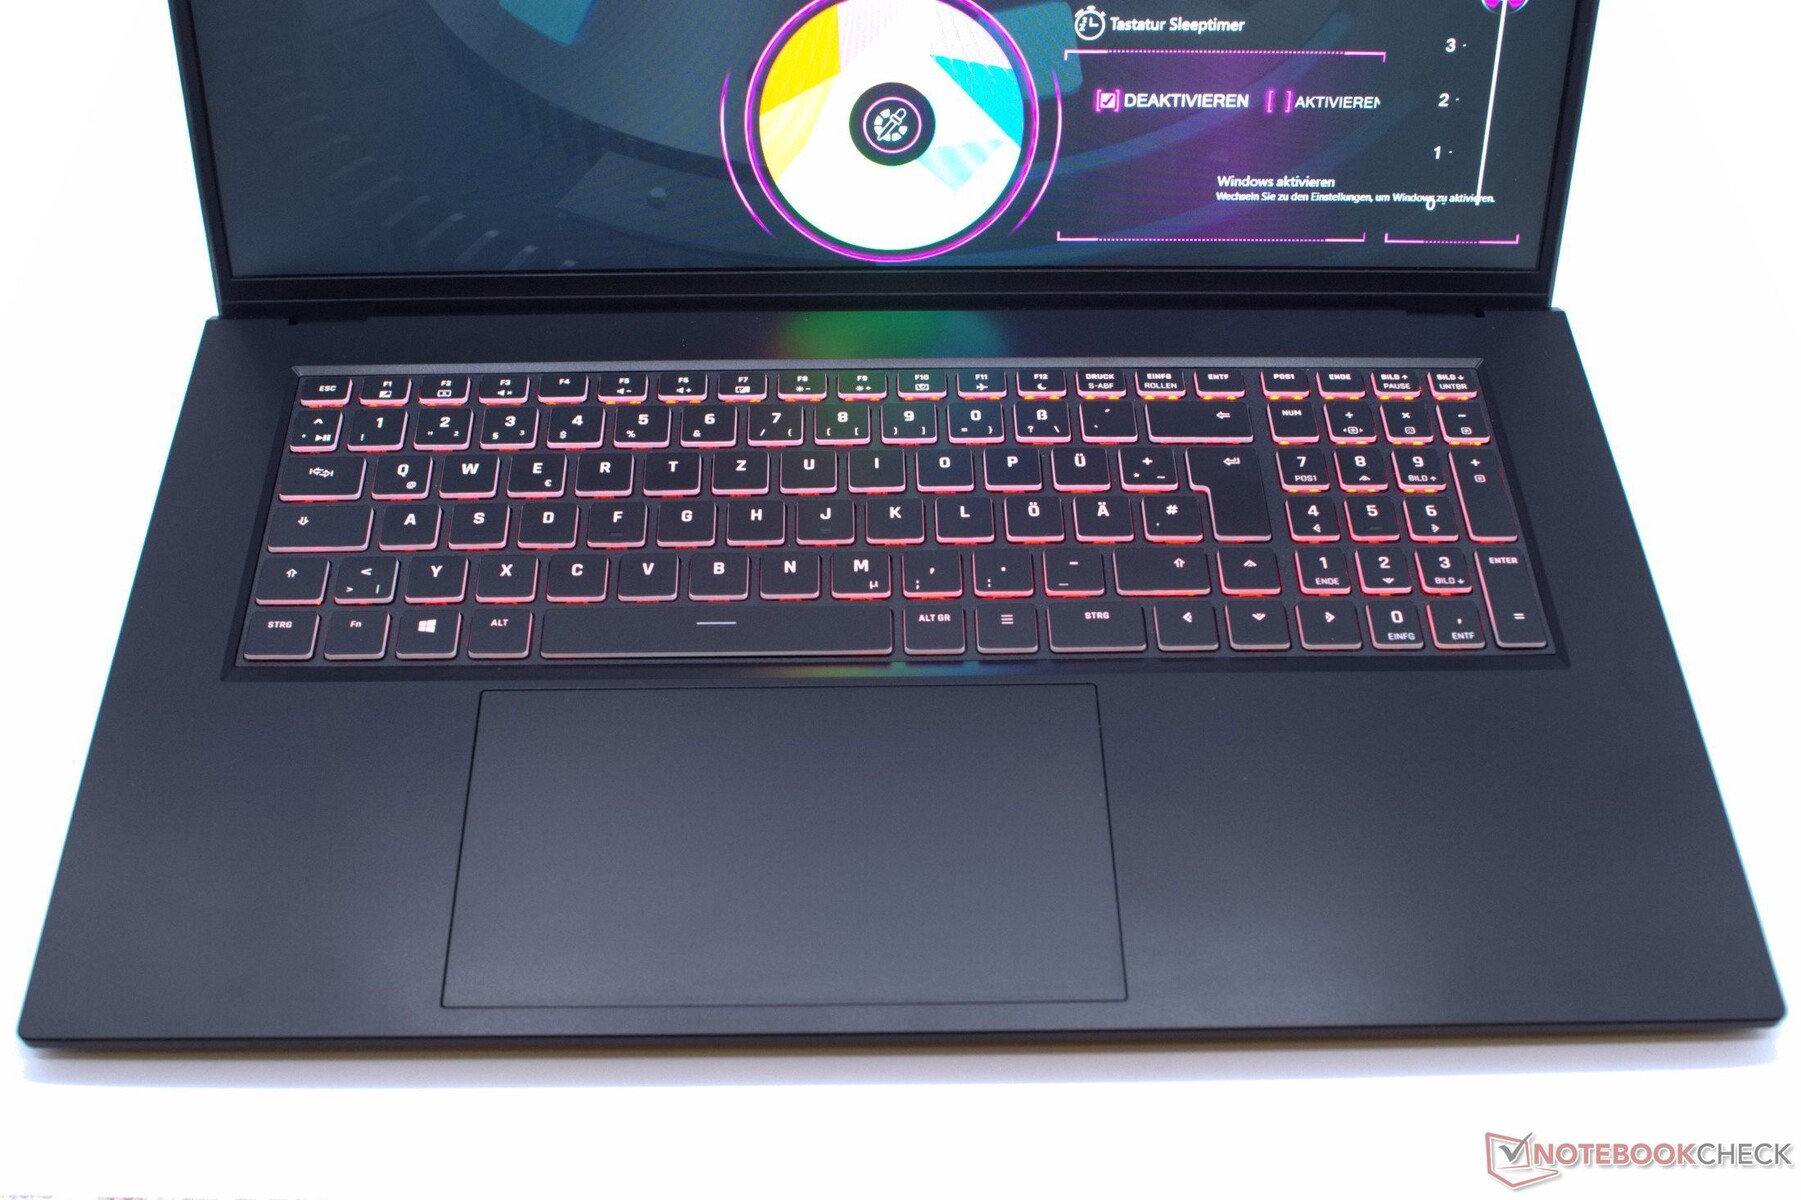
Dispositivi di input - la tastiera RBG incontra un enorme ClickPad
La tastiera dello Schenker Work 17 fornisce un forte feedback aptico. Inoltre, la corsa dei tasti di quasi 2 mm rende la tastiera piacevole. Il touchpad è grande, 15 cm x 9 cm, e la sua superficie è uniforme e liscia.
L'illuminazione RGB della tastiera potrebbe sembrare un po' insolita all'inizio. Ma si scopre che la selezione dei colori permette un uso confortevole e senza riflessi, senza luce blu, il che è particolarmente utile di notte.
Display - Fa anche una bella figura all'aperto
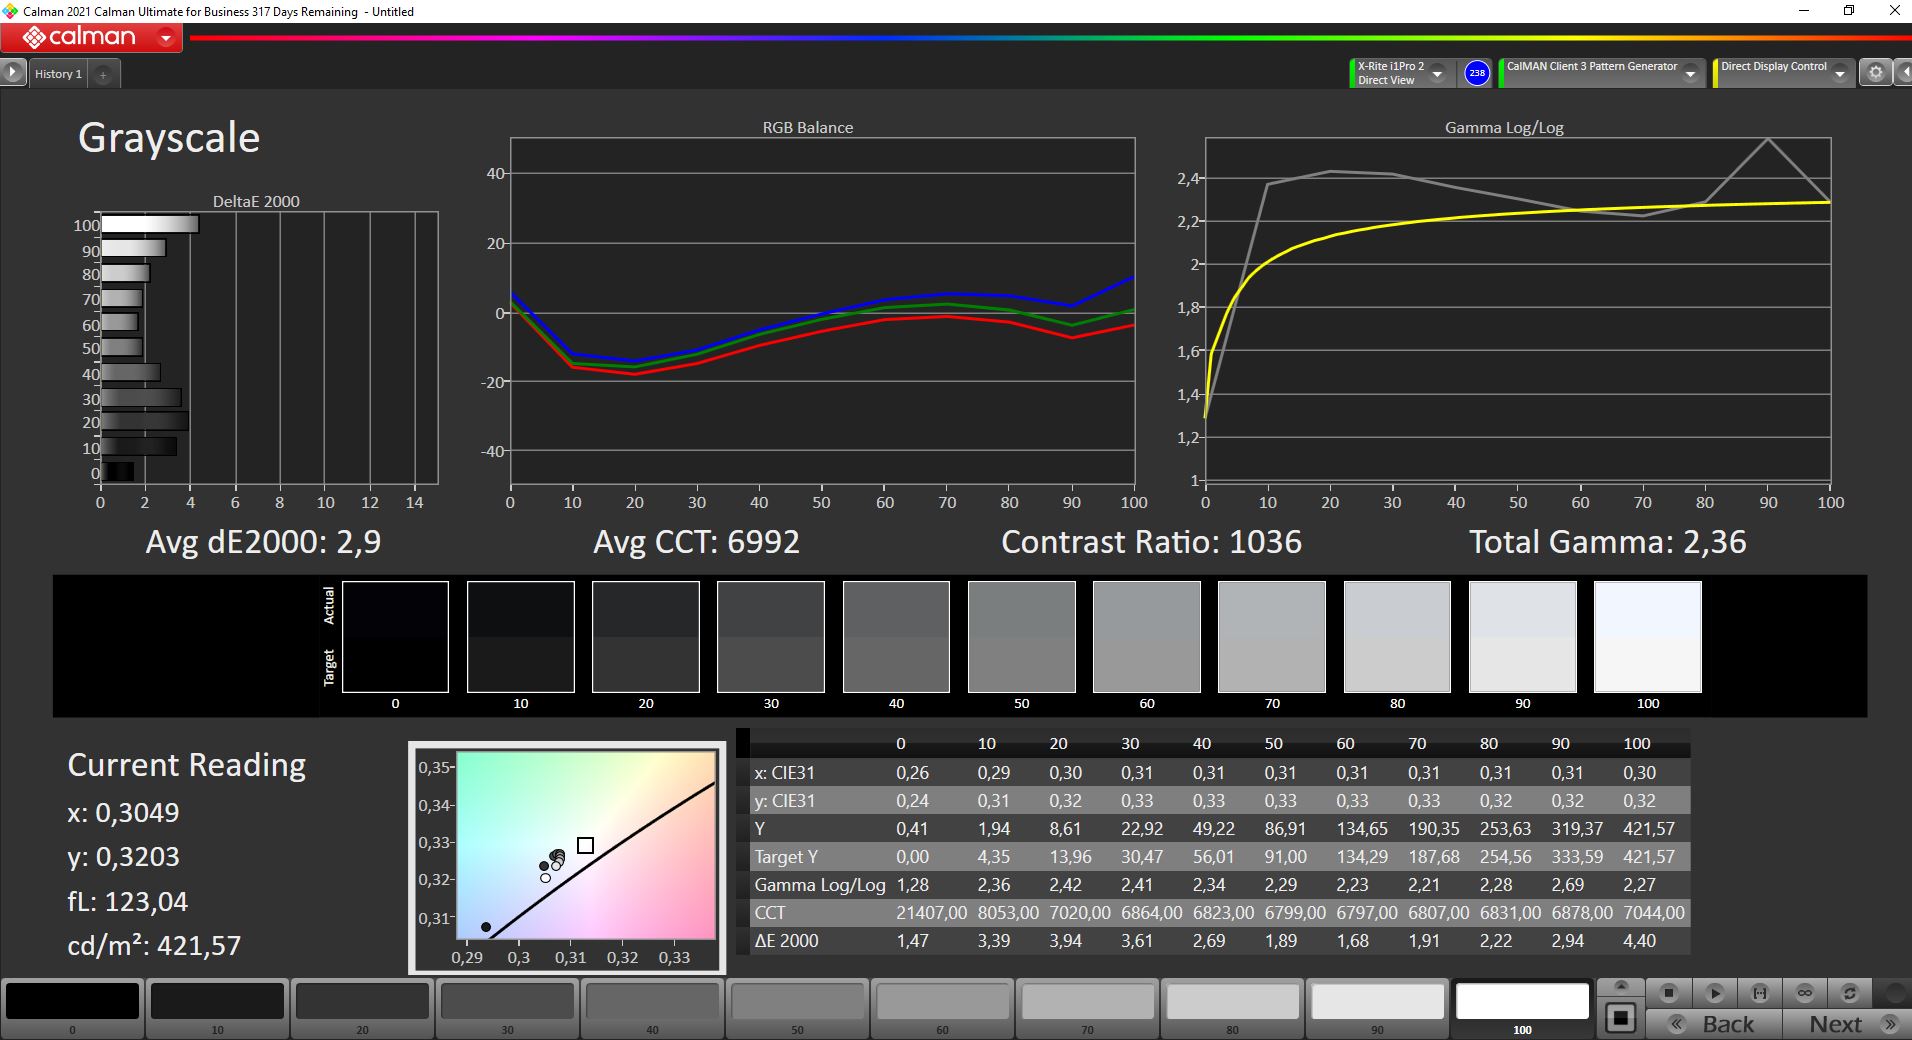
Il luminoso display IPS dello Schenker Work 17 non è perfetto in termini di copertura dello spazio colore e rapporto di contrasto, ma è buono. Una copertura dello spazio colore RGB del 93,9% è più che sufficiente per un portatile da ufficio. La luminosità del display di 390,3 cd/m² in media è anche abbastanza alta, il che permette una buona leggibilità per la maggior parte del tempo, nonostante il fatto che la distribuzione della luminosità non sia particolarmente uniforme. A volte, i punti luminosi in tutti e quattro gli angoli possono essere visti ad occhio nudo, nonostante il buon rapporto di contrasto di 1.029:1
| |||||||||||||||||||||||||
Distribuzione della luminosità: 89 %
Al centro con la batteria: 421 cd/m²
Contrasto: 1029:1 (Nero: 0.41 cd/m²)
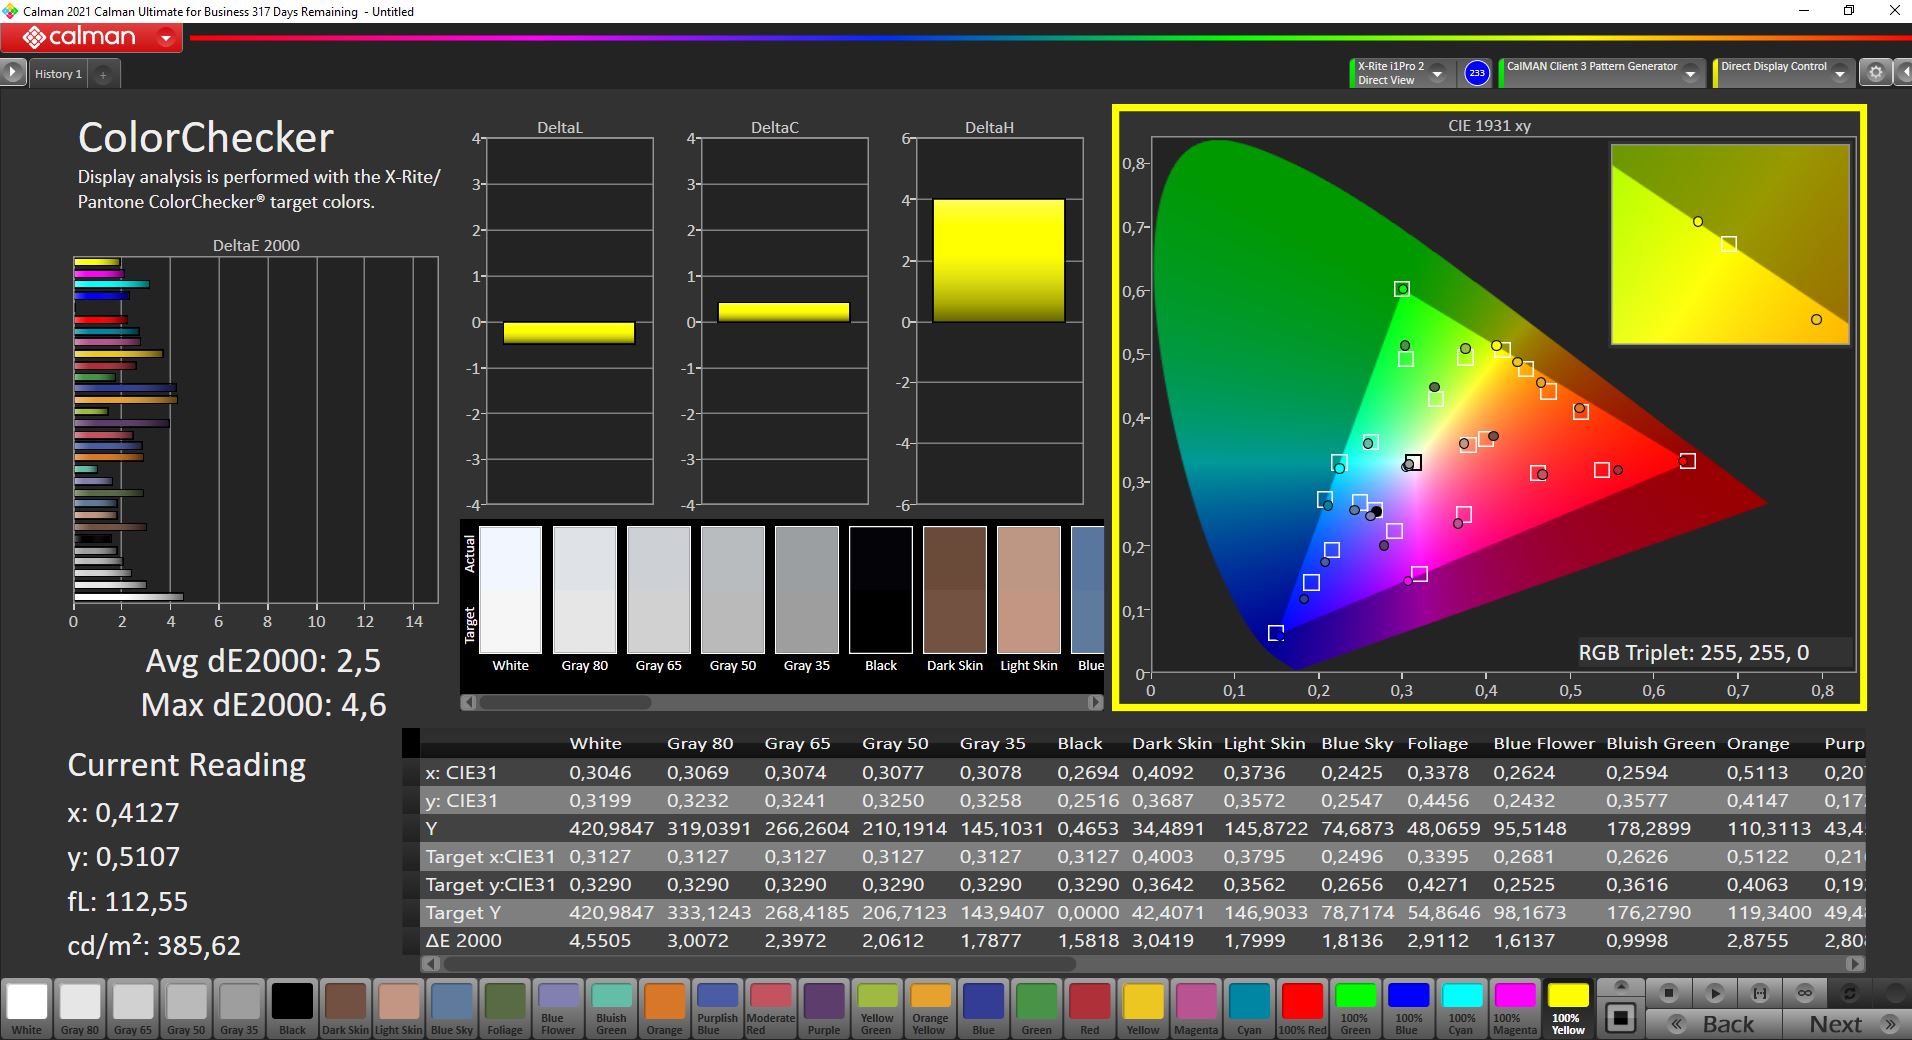
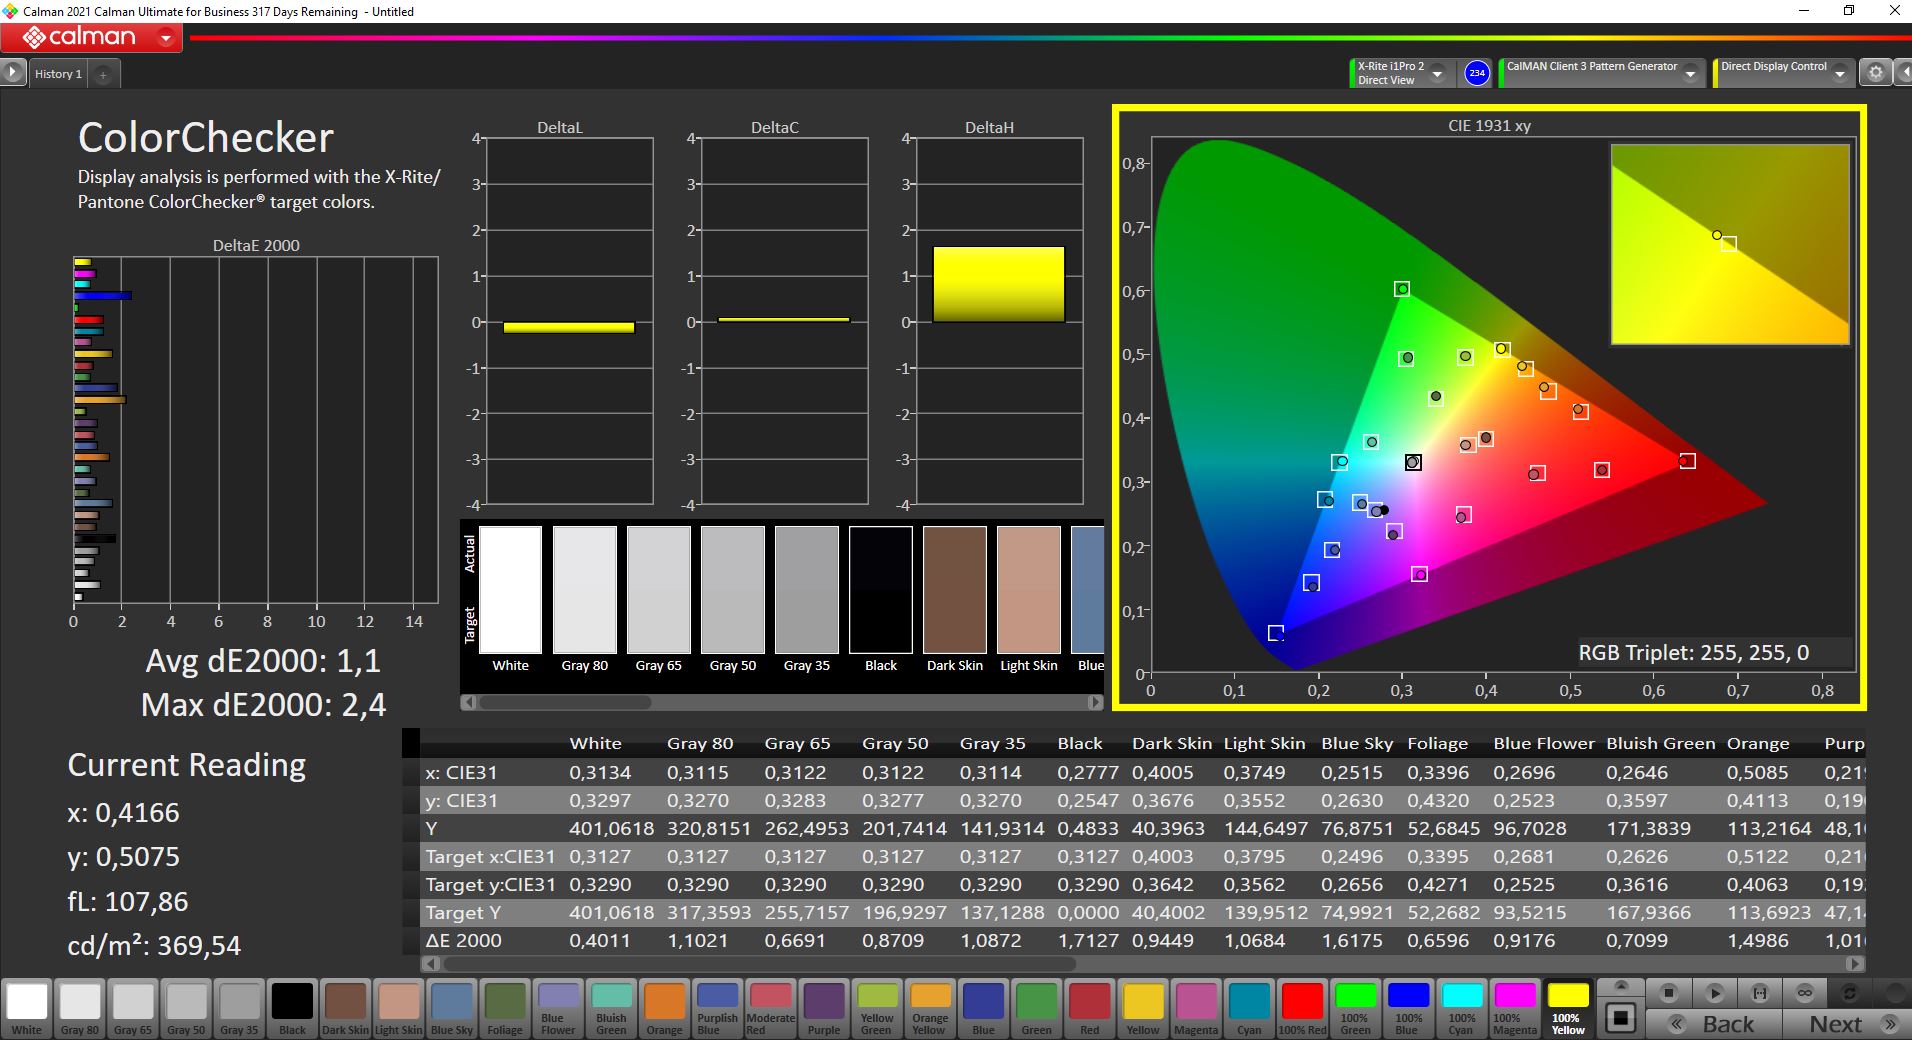
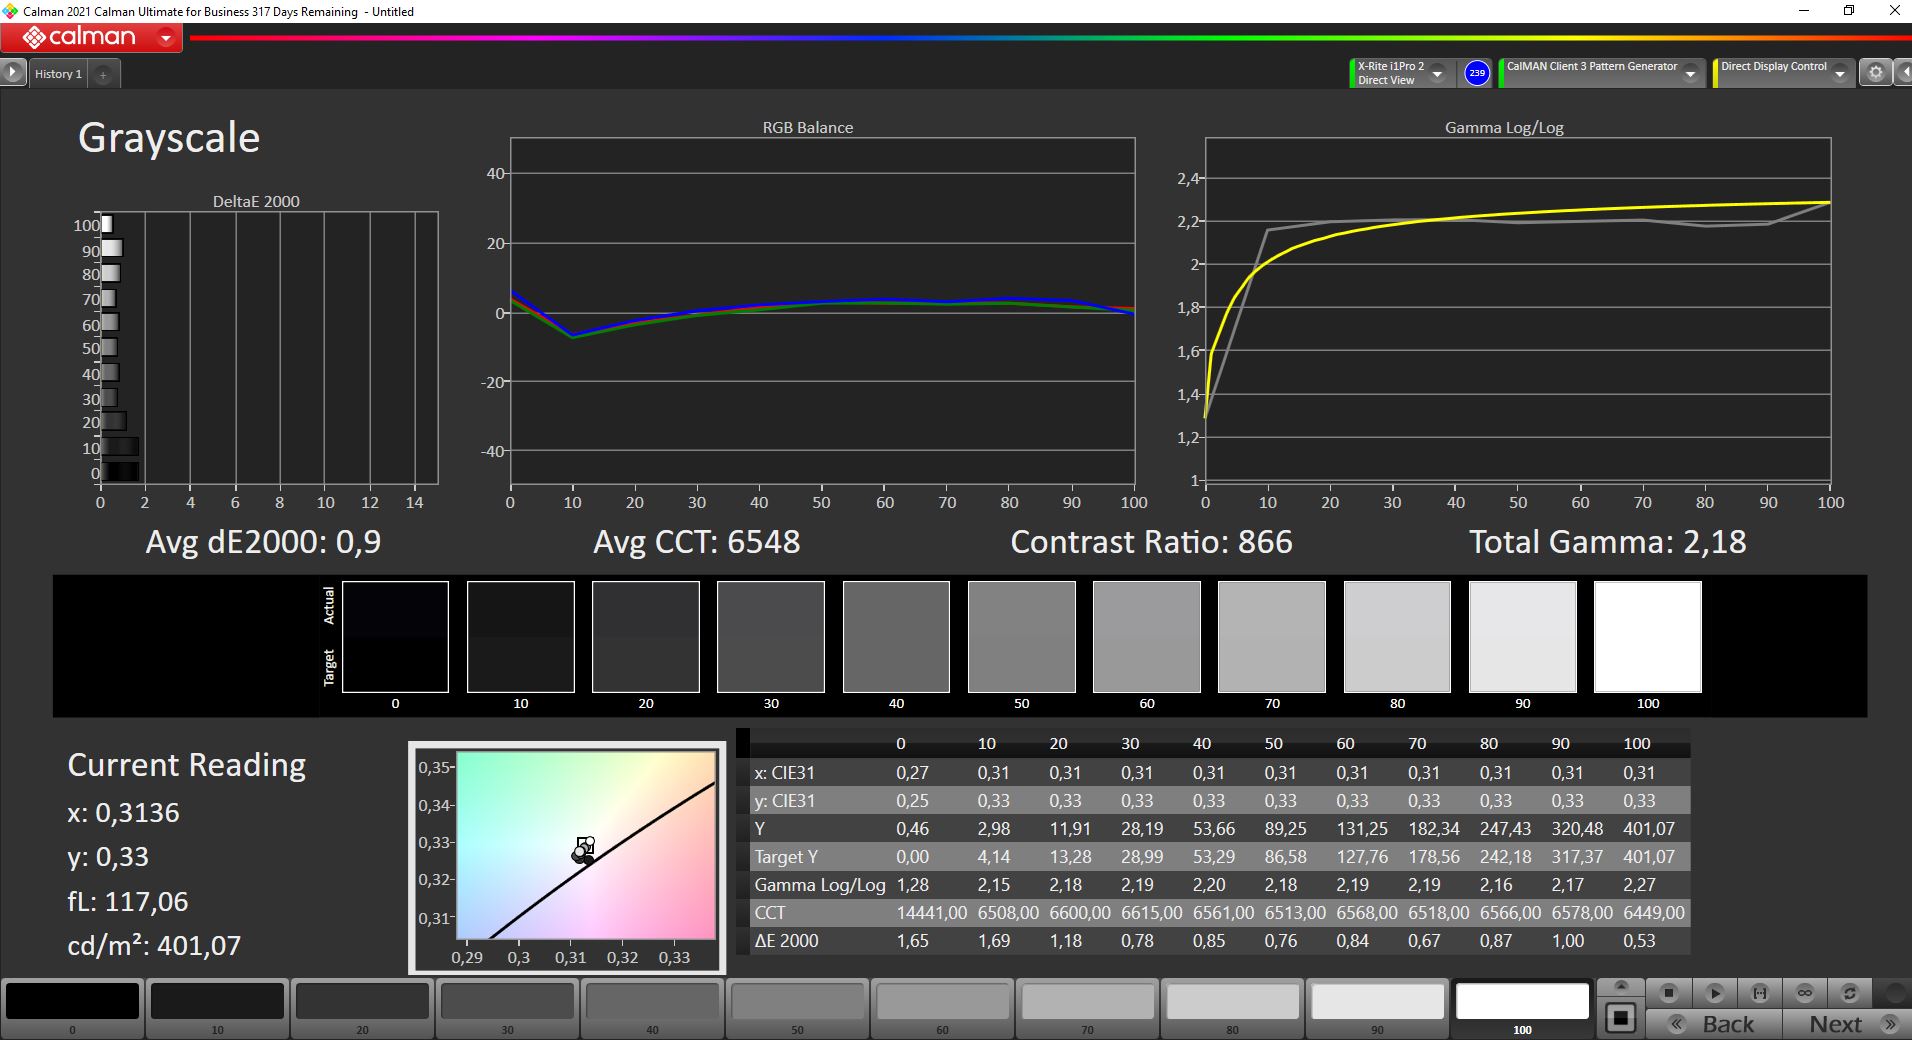
ΔE ColorChecker Calman: 2.5 | ∀{0.5-29.43 Ø4.73}
calibrated: 1.1
ΔE Greyscale Calman: 2.9 | ∀{0.09-98 Ø4.97}
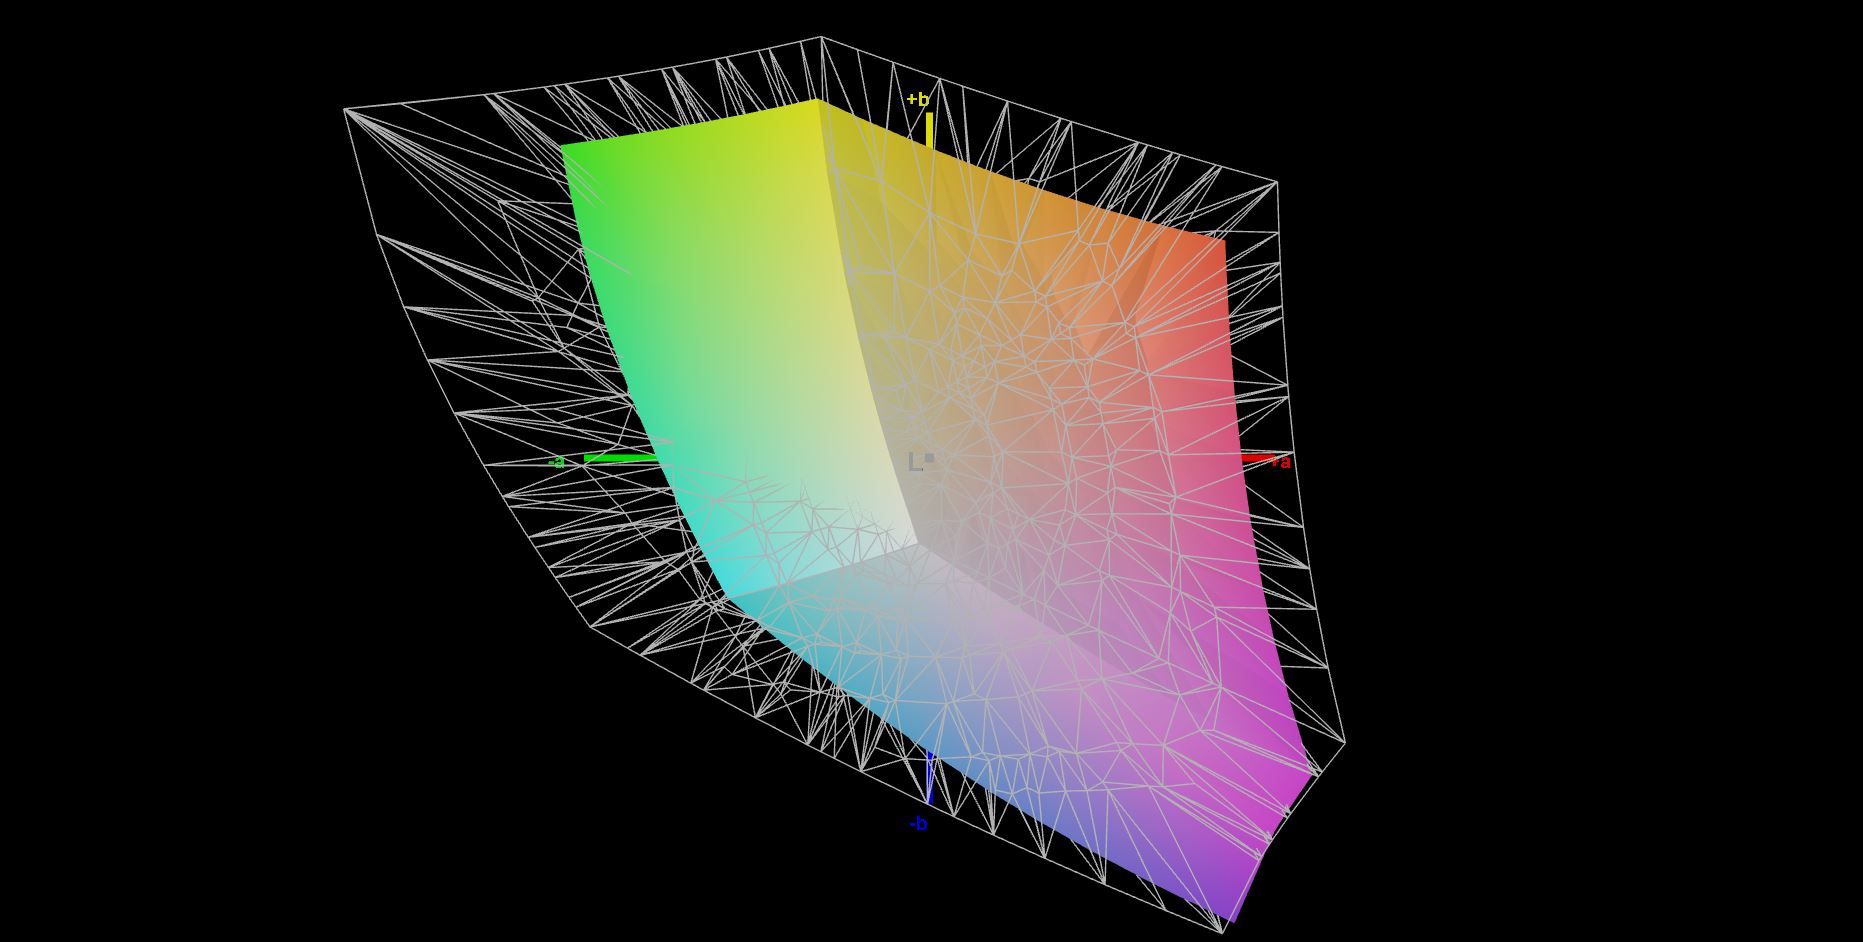
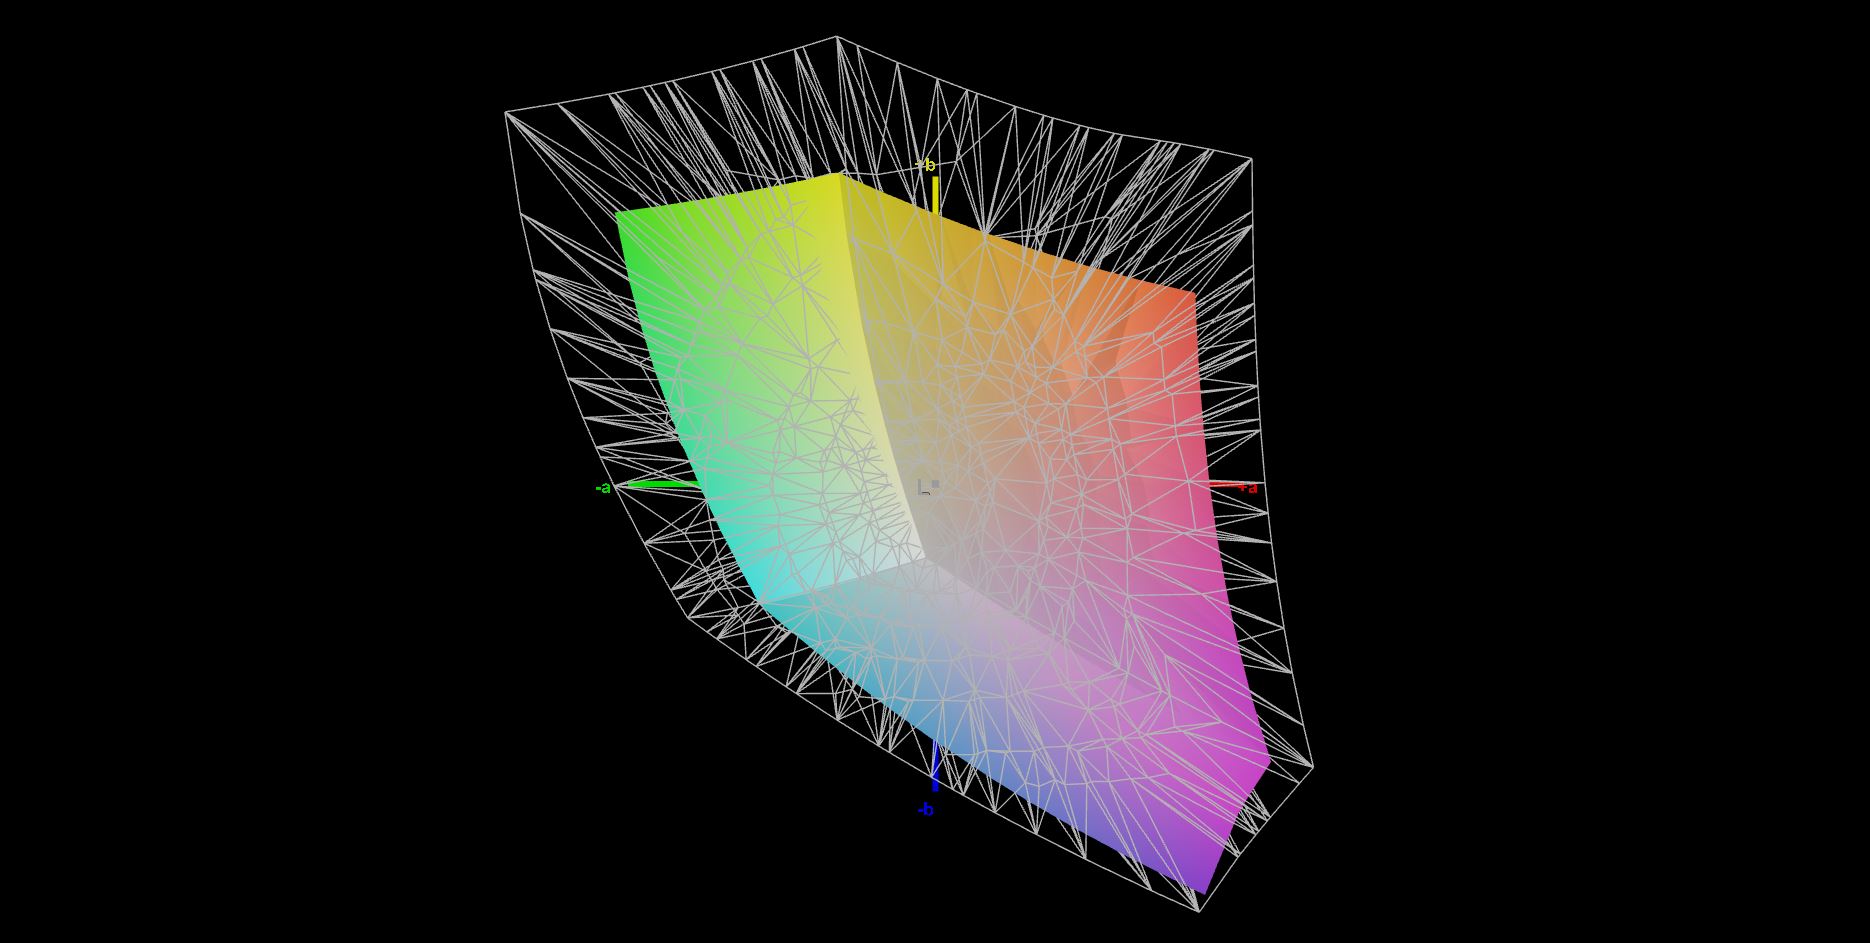
64.4% AdobeRGB 1998 (Argyll 3D)
93.9% sRGB (Argyll 3D)
62.6% Display P3 (Argyll 3D)
Gamma: 2.36
CCT: 6992 K
| Schenker Work 17 Tiger Lake-H LGD0621, IPS, 1920x1080, 17.3" | LG Gram 17Z90P-G.AA56G IPS, 2560x1600, 17" | Acer Aspire 5 A517-52G-79Z5 BOE084E, IPS, 1920x1080, 17.3" | Acer Aspire 3 A317-51G-72MD BOE CQ NV173FHM-N41, IPS, 1920x1080, 17.3" | Dell Inspiron 15 3505-PXHPW AU Optronics B156HAN, IPS, 1920x1080, 15.6" | Schenker Work 15 Tiger Lake-H BOE07D8, IPS, 1920x1080, 15.6" | |
|---|---|---|---|---|---|---|
| Display | 28% | -36% | -3% | -36% | -2% | |
| Display P3 Coverage (%) | 62.6 | 93 49% | 39.98 -36% | 63.4 1% | 40.3 -36% | 64.5 3% |
| sRGB Coverage (%) | 93.9 | 98.8 5% | 59.3 -37% | 86.9 -7% | 60.4 -36% | 86.2 -8% |
| AdobeRGB 1998 Coverage (%) | 64.4 | 83.9 30% | 41.3 -36% | 63.2 -2% | 41.7 -35% | 62.9 -2% |
| Response Times | 7% | 69% | 36% | 5% | -36% | |
| Response Time Grey 50% / Grey 80% * (ms) | 42.4 ? | 47 ? -11% | 14 ? 67% | 29 ? 32% | 36 ? 15% | 58.4 ? -38% |
| Response Time Black / White * (ms) | 26.4 ? | 20 ? 24% | 8 ? 70% | 16 ? 39% | 28 ? -6% | 35.2 ? -33% |
| PWM Frequency (Hz) | 2500 ? | |||||
| Screen | -14% | -21% | -28% | -54% | -49% | |
| Brightness middle (cd/m²) | 422 | 404 -4% | 321 -24% | 261 -38% | 235 -44% | 329 -22% |
| Brightness (cd/m²) | 390 | 323 -17% | 282 -28% | 258 -34% | 231 -41% | 316 -19% |
| Brightness Distribution (%) | 89 | 73 -18% | 81 -9% | 81 -9% | 84 -6% | 92 3% |
| Black Level * (cd/m²) | 0.41 | 0.425 -4% | 0.36 12% | 0.17 59% | 0.25 39% | 0.3 27% |
| Contrast (:1) | 1029 | 951 -8% | 892 -13% | 1535 49% | 940 -9% | 1097 7% |
| Colorchecker dE 2000 * | 2.5 | 3.46 -38% | 4.3 -72% | 4.25 -70% | 4.11 -64% | 5.4 -116% |
| Colorchecker dE 2000 max. * | 4.6 | 5.23 -14% | 7.1 -54% | 7.39 -61% | 6.72 -46% | 10.1 -120% |
| Colorchecker dE 2000 calibrated * | 1.1 | 2.1 -91% | 4.56 -315% | 2.5 -127% | ||
| Greyscale dE 2000 * | 2.9 | 3.12 -8% | 2.26 22% | 4.48 -54% | 2.79 4% | 5.1 -76% |
| Gamma | 2.36 93% | 2.46 89% | 2.36 93% | 2.5 88% | 2.53 87% | 2.1 105% |
| CCT | 6992 93% | 7114 91% | 6650 98% | 7264 89% | 6666 98% | 7609 85% |
| Color Space (Percent of AdobeRGB 1998) (%) | 38 | 56.8 | ||||
| Color Space (Percent of sRGB) (%) | 59 | 86.7 | ||||
| Media totale (Programma / Settaggio) | 7% /
-1% | 4% /
-11% | 2% /
-13% | -28% /
-41% | -29% /
-37% |
* ... Meglio usare valori piccoli
Secondo il CalMan ColorChecker, lo Schenker Work 17 viene fornito con una riproduzione dei colori relativamente accurata fuori dalla scatola, compreso un basso ΔΕ medio di solo 2,5. Usando il profilo ICC che abbiamo creato (scaricabile nel box informazioni), sia le deviazioni di colore assolute che medie scendono a un livello che è appena percettibile. Qui non ci sono colori che deviano in modo evidente. Dopotutto, sono solo leggeri spostamenti nei valori dei colori solidi RGB a causare la non copertura del 100% dello spazio colore sRGB
Tempi di risposta del Display
| ↔ Tempi di risposta dal Nero al Bianco | ||
|---|---|---|
| 26.4 ms ... aumenta ↗ e diminuisce ↘ combinato | ↗ 10.8 ms Incremento | 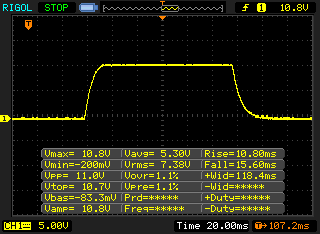 |
| ↘ 15.6 ms Calo | ||
| Lo schermo mostra tempi di risposta relativamente lenti nei nostri tests e potrebbe essere troppo lento per i gamers. In confronto, tutti i dispositivi di test variano da 0.1 (minimo) a 240 (massimo) ms. » 66 % di tutti i dispositivi è migliore. Questo significa che i tempi di risposta rilevati sono peggiori rispetto alla media di tutti i dispositivi testati (19.9 ms). | ||
| ↔ Tempo di risposta dal 50% Grigio all'80% Grigio | ||
| 42.4 ms ... aumenta ↗ e diminuisce ↘ combinato | ↗ 22.8 ms Incremento | 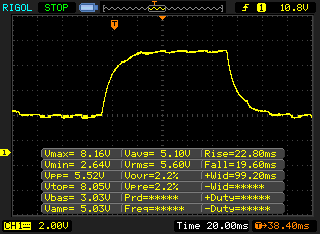 |
| ↘ 19.6 ms Calo | ||
| Lo schermo mostra tempi di risposta lenti nei nostri tests e sarà insoddisfacente per i gamers. In confronto, tutti i dispositivi di test variano da 0.165 (minimo) a 636 (massimo) ms. » 70 % di tutti i dispositivi è migliore. Questo significa che i tempi di risposta rilevati sono peggiori rispetto alla media di tutti i dispositivi testati (31.1 ms). | ||
Sfarfallio dello schermo / PWM (Pulse-Width Modulation)
| flickering dello schermo / PWM non rilevato | 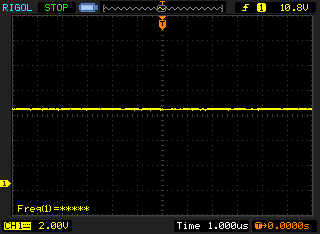 | ||
In confronto: 52 % di tutti i dispositivi testati non utilizza PWM per ridurre la luminosita' del display. Se è rilevato PWM, una media di 7798 (minimo: 5 - massimo: 343500) Hz è stata rilevata. | |||
Il display opaco rivela un altro punto di forza anche nell'uso all'aperto. Finché il sole non si riflette direttamente sul pannello, lo schermo luminoso può sempre essere letto bene. Non ci sono quasi differenze, tranne che per la luminosità, quando lo si guarda da tutte le angolazioni possibili.

Prestazioni - Hardware robusto per il lavoro d'ufficio
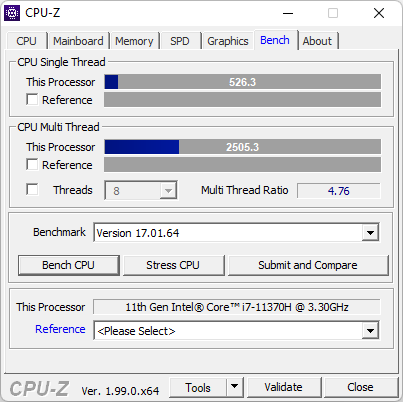
Con un Intel Core i7-11370H, 32 GB di RAM e un veloce Samsung 980 Pro con 1 TB di storage, il nostro esemplare in prova rappresenta quasi la migliore configurazione possibile di Schenker. Le varie altre configurazioni qui permettono tra 8 e 64 GB di RAM e fino a 8 TB di storage su disco rigido
Condizioni di prova
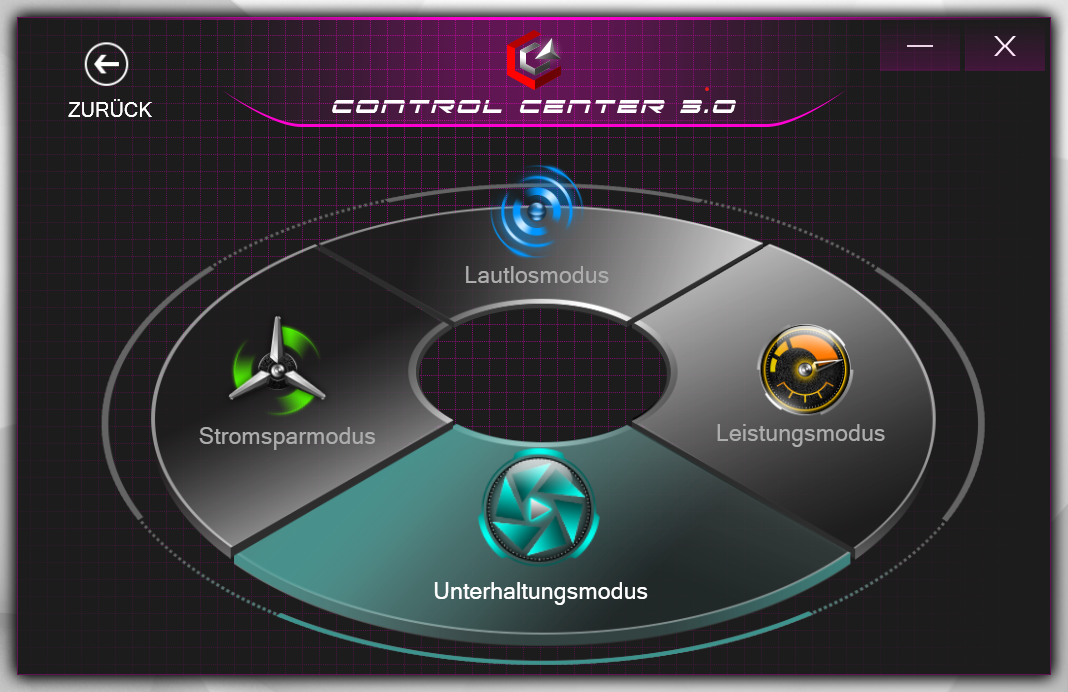
Il Control Center di Schenker offre molte impostazioni per regolare le prestazioni. I benchmark sono stati eseguiti nella modalità Entertainment, che offre un buon equilibrio tra volume della ventola, efficienza energetica e prestazioni. Come risultato, un PL2 di 42 watt e un PL1 di circa 22 watt sono disponibili per l'Intel Core i7. A seconda dell'applicazione e della posizione, i valori PL1 in modalità intrattenimento sono talvolta significativamente regolati verso l'alto o verso il basso. Nello stress test, sono stati osservati anche valori di soli 16 watts.
In modalità Performance, il PL1 è aumentato fino a 35 watts, ma questo aumenta anche drasticamente le temperature del core. Nella maggior parte dei benchmark in cui il processore non è sotto carico prolungato, non c'è quasi nessuna differenza tra la modalità Performance e quella Entertainment. Le prestazioni Boost del processore sono altrettanto buone in entrambe.
Abbiamo già confrontato la Performance Mode e la Entertainment Mode nella recensione dello Schenker Work 15. Dato che entrambi i portatili difficilmente differiscono l'uno dall'altro in termini di hardware, i risultati dovrebbero essere abbastanza simili.
Processore
Con un'alta performance di boost e una buona efficienza della temperatura, ilIntel Core i7-11370H è particolarmente adatto ai portatili sottili con esigenze di prestazioni elevate con i suoi quattro core. A seconda della modalità di prestazione, il processore a volte mostra una prestazione di calcolo sotto la media nei test più lunghi, ma può segnare punti durante brevi picchi di carico in particolare e nel funzionamento single-core. In modalità Performance, il PL1 è a 35 watts costanti, mentre oscilla tra 22 watts e 16 watts in modalità Entertainment.
Con l'alimentazione a batteria, le prestazioni del processore sono limitate in una certa misura. Di nuovo, il controllo delle prestazioni del portatile ha valori diversi a seconda del piano di risparmio energetico. In modalità Performance, l'analisi del log mostra che il PL1 è regolato a 35 watt, mentre il processore è alimentato solo con 25 watt in realtà.
Cinebench R15 Multi endurance test
Cinebench R23: Multi Core | Single Core
Cinebench R20: CPU (Multi Core) | CPU (Single Core)
Cinebench R15: CPU Multi 64Bit | CPU Single 64Bit
Blender: v2.79 BMW27 CPU
7-Zip 18.03: 7z b 4 | 7z b 4 -mmt1
Geekbench 5.5: Multi-Core | Single-Core
HWBOT x265 Benchmark v2.2: 4k Preset
LibreOffice : 20 Documents To PDF
R Benchmark 2.5: Overall mean
| CPU Performance rating | |
| Media della classe Office | |
| Media Intel Core i7-11370H | |
| Acer Aspire 5 A517-52G-79Z5 | |
| Schenker Work 15 Tiger Lake-H | |
| Schenker Work 17 Tiger Lake-H | |
| LG Gram 17Z90P-G.AA56G | |
| Acer Aspire 3 A317-51G-72MD -2! | |
| Dell Inspiron 15 3505-PXHPW | |
| Cinebench R23 / Multi Core | |
| Media della classe Office (1673 - 22808, n=73, ultimi 2 anni) | |
| Media Intel Core i7-11370H (3696 - 6646, n=12) | |
| Acer Aspire 5 A517-52G-79Z5 | |
| Schenker Work 15 Tiger Lake-H | |
| Schenker Work 17 Tiger Lake-H | |
| LG Gram 17Z90P-G.AA56G | |
| Dell Inspiron 15 3505-PXHPW | |
| Cinebench R23 / Single Core | |
| Media della classe Office (708 - 2130, n=73, ultimi 2 anni) | |
| Acer Aspire 5 A517-52G-79Z5 | |
| Media Intel Core i7-11370H (1081 - 1556, n=11) | |
| Schenker Work 15 Tiger Lake-H | |
| LG Gram 17Z90P-G.AA56G | |
| Schenker Work 17 Tiger Lake-H | |
| Dell Inspiron 15 3505-PXHPW | |
| Cinebench R20 / CPU (Multi Core) | |
| Media della classe Office (648 - 8840, n=72, ultimi 2 anni) | |
| Media Intel Core i7-11370H (1438 - 2578, n=11) | |
| Acer Aspire 5 A517-52G-79Z5 | |
| Schenker Work 15 Tiger Lake-H | |
| Schenker Work 17 Tiger Lake-H | |
| LG Gram 17Z90P-G.AA56G | |
| Acer Aspire 3 A317-51G-72MD | |
| Dell Inspiron 15 3505-PXHPW | |
| Cinebench R20 / CPU (Single Core) | |
| Media della classe Office (345 - 816, n=72, ultimi 2 anni) | |
| Acer Aspire 5 A517-52G-79Z5 | |
| Media Intel Core i7-11370H (475 - 601, n=11) | |
| Schenker Work 15 Tiger Lake-H | |
| LG Gram 17Z90P-G.AA56G | |
| Schenker Work 17 Tiger Lake-H | |
| Acer Aspire 3 A317-51G-72MD | |
| Dell Inspiron 15 3505-PXHPW | |
| Cinebench R15 / CPU Multi 64Bit | |
| Media della classe Office (250 - 3380, n=74, ultimi 2 anni) | |
| Media Intel Core i7-11370H (606 - 1086, n=17) | |
| Schenker Work 15 Tiger Lake-H | |
| Schenker Work 15 Tiger Lake-H | |
| Schenker Work 15 Tiger Lake-H | |
| Schenker Work 17 Tiger Lake-H | |
| Schenker Work 17 Tiger Lake-H | |
| Acer Aspire 5 A517-52G-79Z5 | |
| LG Gram 17Z90P-G.AA56G | |
| Dell Inspiron 15 3505-PXHPW | |
| Acer Aspire 3 A317-51G-72MD | |
| Cinebench R15 / CPU Single 64Bit | |
| Media della classe Office (99.5 - 312, n=74, ultimi 2 anni) | |
| Acer Aspire 5 A517-52G-79Z5 | |
| Media Intel Core i7-11370H (162.9 - 233, n=15) | |
| Schenker Work 15 Tiger Lake-H | |
| Schenker Work 15 Tiger Lake-H | |
| Schenker Work 17 Tiger Lake-H | |
| Schenker Work 17 Tiger Lake-H | |
| LG Gram 17Z90P-G.AA56G | |
| Acer Aspire 3 A317-51G-72MD | |
| Dell Inspiron 15 3505-PXHPW | |
| Blender / v2.79 BMW27 CPU | |
| Dell Inspiron 15 3505-PXHPW | |
| Acer Aspire 3 A317-51G-72MD | |
| LG Gram 17Z90P-G.AA56G | |
| Schenker Work 17 Tiger Lake-H | |
| Schenker Work 15 Tiger Lake-H | |
| Acer Aspire 5 A517-52G-79Z5 | |
| Media Intel Core i7-11370H (432 - 762, n=11) | |
| Media della classe Office (158 - 1940, n=73, ultimi 2 anni) | |
| 7-Zip 18.03 / 7z b 4 | |
| Media della classe Office (7098 - 76886, n=75, ultimi 2 anni) | |
| Media Intel Core i7-11370H (18961 - 28520, n=11) | |
| Acer Aspire 5 A517-52G-79Z5 | |
| Schenker Work 15 Tiger Lake-H | |
| Schenker Work 17 Tiger Lake-H | |
| LG Gram 17Z90P-G.AA56G | |
| Acer Aspire 3 A317-51G-72MD | |
| Dell Inspiron 15 3505-PXHPW | |
| 7-Zip 18.03 / 7z b 4 -mmt1 | |
| Acer Aspire 5 A517-52G-79Z5 | |
| Media della classe Office (3387 - 6469, n=74, ultimi 2 anni) | |
| Media Intel Core i7-11370H (5074 - 5550, n=11) | |
| Schenker Work 15 Tiger Lake-H | |
| Schenker Work 17 Tiger Lake-H | |
| Acer Aspire 3 A317-51G-72MD | |
| LG Gram 17Z90P-G.AA56G | |
| Dell Inspiron 15 3505-PXHPW | |
| Geekbench 5.5 / Multi-Core | |
| Media della classe Office (1483 - 16999, n=71, ultimi 2 anni) | |
| Schenker Work 15 Tiger Lake-H | |
| Media Intel Core i7-11370H (3828 - 6115, n=10) | |
| Acer Aspire 5 A517-52G-79Z5 | |
| LG Gram 17Z90P-G.AA56G | |
| Schenker Work 17 Tiger Lake-H | |
| Acer Aspire 3 A317-51G-72MD | |
| Dell Inspiron 15 3505-PXHPW | |
| Geekbench 5.5 / Single-Core | |
| Media della classe Office (811 - 2128, n=71, ultimi 2 anni) | |
| Acer Aspire 5 A517-52G-79Z5 | |
| Schenker Work 15 Tiger Lake-H | |
| Media Intel Core i7-11370H (1376 - 1607, n=10) | |
| Schenker Work 17 Tiger Lake-H | |
| LG Gram 17Z90P-G.AA56G | |
| Acer Aspire 3 A317-51G-72MD | |
| Dell Inspiron 15 3505-PXHPW | |
| HWBOT x265 Benchmark v2.2 / 4k Preset | |
| Media della classe Office (2.21 - 26, n=73, ultimi 2 anni) | |
| Media Intel Core i7-11370H (4.98 - 8.82, n=11) | |
| Acer Aspire 5 A517-52G-79Z5 | |
| Schenker Work 15 Tiger Lake-H | |
| Schenker Work 17 Tiger Lake-H | |
| LG Gram 17Z90P-G.AA56G | |
| Acer Aspire 3 A317-51G-72MD | |
| Dell Inspiron 15 3505-PXHPW | |
| LibreOffice / 20 Documents To PDF | |
| Dell Inspiron 15 3505-PXHPW | |
| Acer Aspire 3 A317-51G-72MD | |
| Media della classe Office (41.5 - 102.3, n=73, ultimi 2 anni) | |
| Acer Aspire 5 A517-52G-79Z5 | |
| LG Gram 17Z90P-G.AA56G | |
| Media Intel Core i7-11370H (23.6 - 56.5, n=11) | |
| Schenker Work 15 Tiger Lake-H | |
| Schenker Work 17 Tiger Lake-H | |
| R Benchmark 2.5 / Overall mean | |
| Dell Inspiron 15 3505-PXHPW | |
| LG Gram 17Z90P-G.AA56G | |
| Acer Aspire 3 A317-51G-72MD | |
| Schenker Work 17 Tiger Lake-H | |
| Schenker Work 15 Tiger Lake-H | |
| Acer Aspire 5 A517-52G-79Z5 | |
| Media Intel Core i7-11370H (0.544 - 0.596, n=11) | |
| Media della classe Office (0.4098 - 0.888, n=73, ultimi 2 anni) | |
* ... Meglio usare valori piccoli
AIDA64: FP32 Ray-Trace | FPU Julia | CPU SHA3 | CPU Queen | FPU SinJulia | FPU Mandel | CPU AES | CPU ZLib | FP64 Ray-Trace | CPU PhotoWorxx
| Performance rating | |
| Media della classe Office | |
| Schenker Work 15 Tiger Lake-H | |
| Media Intel Core i7-11370H | |
| Schenker Work 17 Tiger Lake-H | |
| LG Gram 17Z90P-G.AA56G | |
| Acer Aspire 3 A317-51G-72MD | |
| Dell Inspiron 15 3505-PXHPW | |
| AIDA64 / FP32 Ray-Trace | |
| Media della classe Office (2083 - 31245, n=79, ultimi 2 anni) | |
| Media Intel Core i7-11370H (5204 - 8413, n=10) | |
| Schenker Work 15 Tiger Lake-H | |
| LG Gram 17Z90P-G.AA56G | |
| Schenker Work 17 Tiger Lake-H | |
| Acer Aspire 3 A317-51G-72MD | |
| Dell Inspiron 15 3505-PXHPW | |
| AIDA64 / FPU Julia | |
| Media della classe Office (8191 - 125394, n=79, ultimi 2 anni) | |
| Media Intel Core i7-11370H (23958 - 34020, n=10) | |
| Schenker Work 15 Tiger Lake-H | |
| Schenker Work 17 Tiger Lake-H | |
| LG Gram 17Z90P-G.AA56G | |
| Acer Aspire 3 A317-51G-72MD | |
| Dell Inspiron 15 3505-PXHPW | |
| AIDA64 / CPU SHA3 | |
| Media della classe Office (433 - 5755, n=79, ultimi 2 anni) | |
| Media Intel Core i7-11370H (1656 - 2297, n=10) | |
| Schenker Work 15 Tiger Lake-H | |
| Schenker Work 17 Tiger Lake-H | |
| LG Gram 17Z90P-G.AA56G | |
| Acer Aspire 3 A317-51G-72MD | |
| Dell Inspiron 15 3505-PXHPW | |
| AIDA64 / CPU Queen | |
| Media della classe Office (22784 - 115197, n=69, ultimi 2 anni) | |
| Schenker Work 15 Tiger Lake-H | |
| Media Intel Core i7-11370H (42086 - 52930, n=10) | |
| Acer Aspire 3 A317-51G-72MD | |
| Schenker Work 17 Tiger Lake-H | |
| LG Gram 17Z90P-G.AA56G | |
| Dell Inspiron 15 3505-PXHPW | |
| AIDA64 / FPU SinJulia | |
| Media della classe Office (1378 - 18321, n=79, ultimi 2 anni) | |
| Schenker Work 15 Tiger Lake-H | |
| Dell Inspiron 15 3505-PXHPW | |
| Media Intel Core i7-11370H (3755 - 5027, n=10) | |
| Schenker Work 17 Tiger Lake-H | |
| LG Gram 17Z90P-G.AA56G | |
| Acer Aspire 3 A317-51G-72MD | |
| AIDA64 / FPU Mandel | |
| Media della classe Office (4601 - 66922, n=79, ultimi 2 anni) | |
| Media Intel Core i7-11370H (14433 - 20417, n=10) | |
| Schenker Work 15 Tiger Lake-H | |
| Schenker Work 17 Tiger Lake-H | |
| LG Gram 17Z90P-G.AA56G | |
| Acer Aspire 3 A317-51G-72MD | |
| Dell Inspiron 15 3505-PXHPW | |
| AIDA64 / CPU AES | |
| Schenker Work 15 Tiger Lake-H | |
| Media Intel Core i7-11370H (44267 - 76866, n=10) | |
| Schenker Work 17 Tiger Lake-H | |
| LG Gram 17Z90P-G.AA56G | |
| Media della classe Office (4854 - 155900, n=79, ultimi 2 anni) | |
| Dell Inspiron 15 3505-PXHPW | |
| Acer Aspire 3 A317-51G-72MD | |
| AIDA64 / CPU ZLib | |
| Media della classe Office (114.6 - 1366, n=79, ultimi 2 anni) | |
| Schenker Work 15 Tiger Lake-H | |
| Media Intel Core i7-11370H (289 - 422, n=10) | |
| Dell Inspiron 15 3505-PXHPW | |
| Schenker Work 17 Tiger Lake-H | |
| LG Gram 17Z90P-G.AA56G | |
| Acer Aspire 3 A317-51G-72MD | |
| AIDA64 / FP64 Ray-Trace | |
| Media della classe Office (1109 - 17834, n=79, ultimi 2 anni) | |
| Media Intel Core i7-11370H (2756 - 4551, n=10) | |
| Schenker Work 15 Tiger Lake-H | |
| Schenker Work 17 Tiger Lake-H | |
| LG Gram 17Z90P-G.AA56G | |
| Acer Aspire 3 A317-51G-72MD | |
| Dell Inspiron 15 3505-PXHPW | |
| AIDA64 / CPU PhotoWorxx | |
| LG Gram 17Z90P-G.AA56G | |
| Media della classe Office (11090 - 65229, n=79, ultimi 2 anni) | |
| Schenker Work 17 Tiger Lake-H | |
| Schenker Work 15 Tiger Lake-H | |
| Media Intel Core i7-11370H (15892 - 40069, n=10) | |
| Acer Aspire 3 A317-51G-72MD | |
| Dell Inspiron 15 3505-PXHPW | |
Prestazioni del sistema
Grazie alle alte prestazioni Boost, alla RAM ampia e veloce, così come al veloce SSD Samsung, le prestazioni di sistema dello Schenker Work 17 sono ad un livello molto alto. Questo è confermato dai risultati PCMark10 sopra la media per un portatile da ufficio. Inoltre, non si possono trovare punti critici nell'uso quotidiano. Tuttavia, lo Schenker Work 17 è indietro rispetto alloSchenker Work 15 in quasi tutti i benchmark nonostante abbia lo stesso hardware.
CrossMark: Overall | Productivity | Creativity | Responsiveness
| PCMark 10 / Score | |
| Media della classe Office (2601 - 9298, n=63, ultimi 2 anni) | |
| Schenker Work 15 Tiger Lake-H | |
| Media Intel Core i7-11370H, Intel Iris Xe Graphics G7 96EUs (5199 - 5459, n=6) | |
| Schenker Work 17 Tiger Lake-H | |
| Acer Aspire 5 A517-52G-79Z5 | |
| LG Gram 17Z90P-G.AA56G | |
| Acer Aspire 3 A317-51G-72MD | |
| Dell Inspiron 15 3505-PXHPW | |
| PCMark 10 / Essentials | |
| Schenker Work 17 Tiger Lake-H | |
| Schenker Work 15 Tiger Lake-H | |
| Media Intel Core i7-11370H, Intel Iris Xe Graphics G7 96EUs (9996 - 10650, n=6) | |
| Media della classe Office (3245 - 11594, n=63, ultimi 2 anni) | |
| LG Gram 17Z90P-G.AA56G | |
| Acer Aspire 5 A517-52G-79Z5 | |
| Acer Aspire 3 A317-51G-72MD | |
| Dell Inspiron 15 3505-PXHPW | |
| PCMark 10 / Productivity | |
| Media della classe Office (5336 - 17243, n=63, ultimi 2 anni) | |
| Acer Aspire 5 A517-52G-79Z5 | |
| Acer Aspire 3 A317-51G-72MD | |
| Media Intel Core i7-11370H, Intel Iris Xe Graphics G7 96EUs (6911 - 7388, n=6) | |
| Schenker Work 15 Tiger Lake-H | |
| Schenker Work 17 Tiger Lake-H | |
| LG Gram 17Z90P-G.AA56G | |
| Dell Inspiron 15 3505-PXHPW | |
| PCMark 10 / Digital Content Creation | |
| Media della classe Office (2049 - 13541, n=63, ultimi 2 anni) | |
| Schenker Work 15 Tiger Lake-H | |
| Media Intel Core i7-11370H, Intel Iris Xe Graphics G7 96EUs (5483 - 5838, n=6) | |
| Schenker Work 17 Tiger Lake-H | |
| Acer Aspire 5 A517-52G-79Z5 | |
| LG Gram 17Z90P-G.AA56G | |
| Acer Aspire 3 A317-51G-72MD | |
| Dell Inspiron 15 3505-PXHPW | |
| CrossMark / Overall | |
| Media della classe Office (381 - 2010, n=74, ultimi 2 anni) | |
| Media Intel Core i7-11370H, Intel Iris Xe Graphics G7 96EUs (n=1) | |
| Dell Inspiron 15 3505-PXHPW | |
| CrossMark / Productivity | |
| Media Intel Core i7-11370H, Intel Iris Xe Graphics G7 96EUs (n=1) | |
| Media della classe Office (464 - 1880, n=74, ultimi 2 anni) | |
| Dell Inspiron 15 3505-PXHPW | |
| CrossMark / Creativity | |
| Media della classe Office (319 - 2361, n=74, ultimi 2 anni) | |
| Media Intel Core i7-11370H, Intel Iris Xe Graphics G7 96EUs (n=1) | |
| Dell Inspiron 15 3505-PXHPW | |
| CrossMark / Responsiveness | |
| Media della classe Office (360 - 1690, n=74, ultimi 2 anni) | |
| Media Intel Core i7-11370H, Intel Iris Xe Graphics G7 96EUs (n=1) | |
| Dell Inspiron 15 3505-PXHPW | |
| PCMark 10 Score | 5317 punti | |
Aiuto | ||
| AIDA64 / Memory Copy | |
| LG Gram 17Z90P-G.AA56G | |
| Media della classe Office (20075 - 110930, n=76, ultimi 2 anni) | |
| Schenker Work 15 Tiger Lake-H | |
| Schenker Work 17 Tiger Lake-H | |
| Media Intel Core i7-11370H (32035 - 64524, n=10) | |
| Acer Aspire 3 A317-51G-72MD | |
| Dell Inspiron 15 3505-PXHPW | |
| AIDA64 / Memory Read | |
| Media della classe Office (10084 - 128030, n=77, ultimi 2 anni) | |
| LG Gram 17Z90P-G.AA56G | |
| Schenker Work 17 Tiger Lake-H | |
| Schenker Work 15 Tiger Lake-H | |
| Media Intel Core i7-11370H (37216 - 62417, n=10) | |
| Acer Aspire 3 A317-51G-72MD | |
| Dell Inspiron 15 3505-PXHPW | |
| AIDA64 / Memory Write | |
| Media della classe Office (20073 - 119858, n=77, ultimi 2 anni) | |
| LG Gram 17Z90P-G.AA56G | |
| Media Intel Core i7-11370H (36920 - 65610, n=10) | |
| Schenker Work 17 Tiger Lake-H | |
| Schenker Work 15 Tiger Lake-H | |
| Acer Aspire 3 A317-51G-72MD | |
| Dell Inspiron 15 3505-PXHPW | |
| AIDA64 / Memory Latency | |
| Media della classe Office (7.6 - 162.9, n=72, ultimi 2 anni) | |
| Dell Inspiron 15 3505-PXHPW | |
| Schenker Work 17 Tiger Lake-H | |
| Media Intel Core i7-11370H (73.4 - 103, n=10) | |
| LG Gram 17Z90P-G.AA56G | |
| Schenker Work 15 Tiger Lake-H | |
| Acer Aspire 3 A317-51G-72MD | |
* ... Meglio usare valori piccoli
Latenze DPC
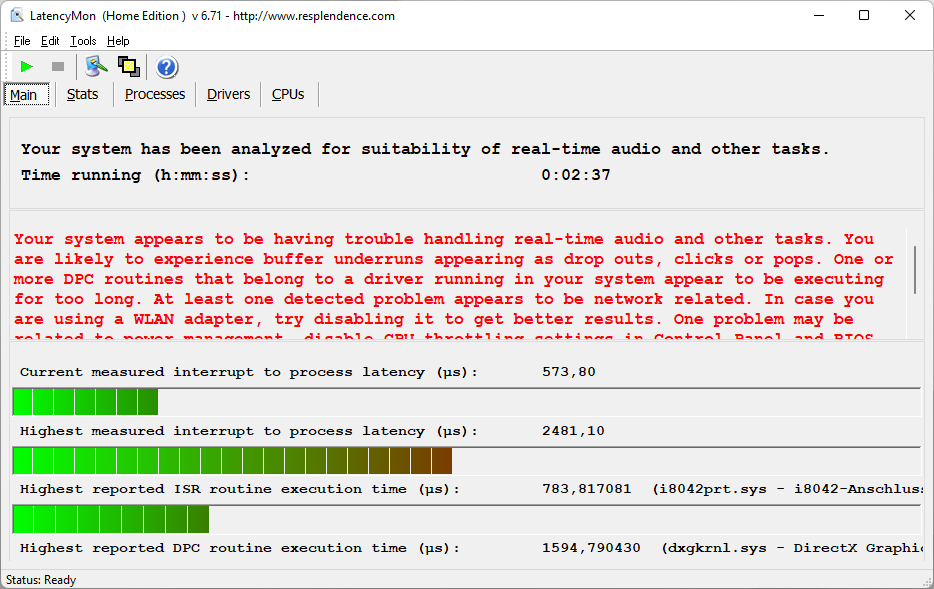
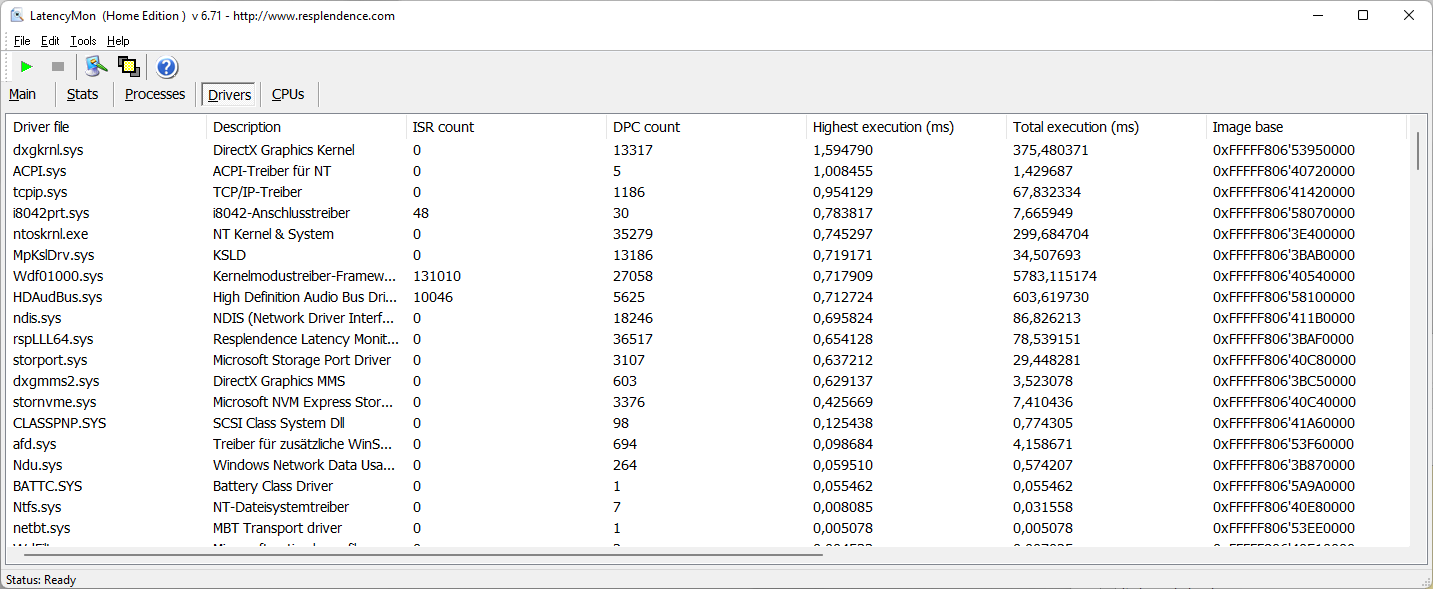
Con latenze DPC fino a 2,48 ms, il portatile da ufficio non è adatto alle applicazioni in tempo reale, ma gli aggiornamenti dei driver potrebbero rimediare rapidamente. Tuttavia, lo Schenker Work 17 gestisce il video 4K del test di YouTube senza far cadere i fotogrammi
| DPC Latencies / LatencyMon - interrupt to process latency (max), Web, Youtube, Prime95 | |
| Schenker Work 17 Tiger Lake-H | |
| Dell Inspiron 15 3505-PXHPW | |
| Acer Aspire 5 A517-52G-79Z5 | |
| Acer Aspire 3 A317-51G-72MD | |
| Schenker Work 15 Tiger Lake-H | |
| LG Gram 17Z90P-G.AA56G | |
* ... Meglio usare valori piccoli
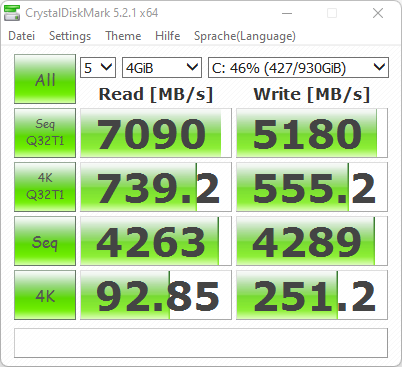
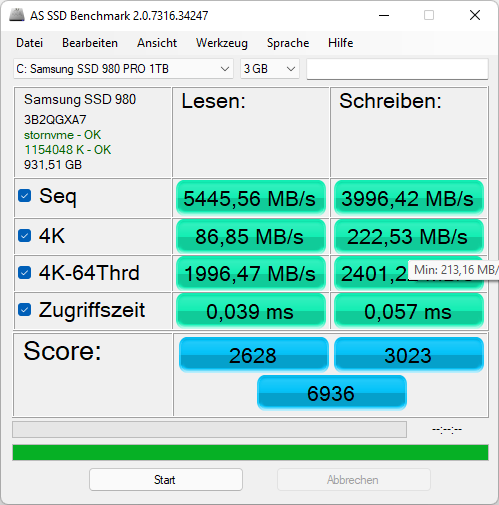
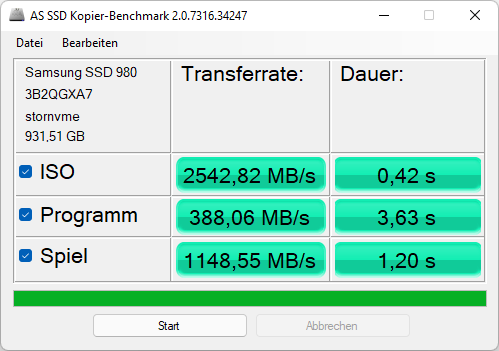
Stoccaggio
Secondo il nostro Articolo sui benchmark HDD/SDDil Samsung Pro 980 con 1 TB di memoria è una delle unità a stato solido più veloci. L'SSD NVMe funziona anche alla sua alta velocità prevista nello Schenker Work 17.

* ... Meglio usare valori piccoli
Continuous load read: DiskSpd Read Loop, Queue Depth 8
Scheda grafica
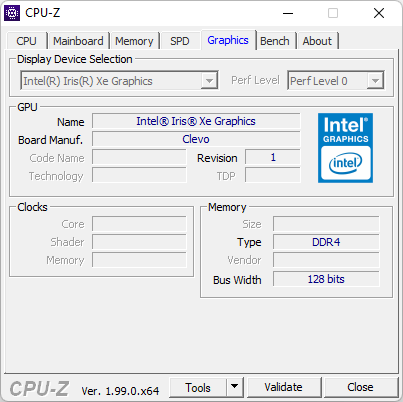
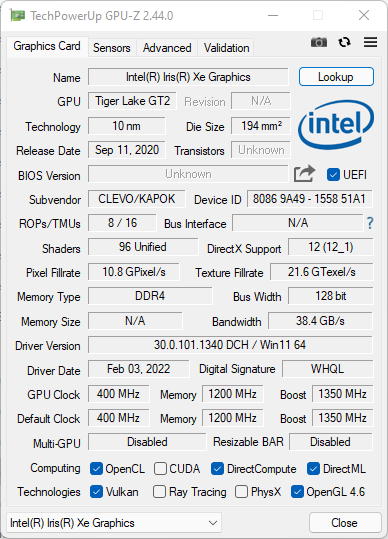
IlIntel Xe Graphics G7 con 96 EU integrata nell'Intel Core i7 non è una scheda grafica per i giocatori, ma può comunque portare molti giochi senza problemi sullo schermo, a patto di mantenere le impostazioni di qualità basse. I benchmark con 3DMark mostrano anche qui un risultato soddisfacente
Soprattutto perché l'iGPU ha un sacco di memoria a sua disposizione, è in grado di mostrare ciò di cui è veramente capace. Tuttavia, gli utenti che vogliono migliorare le prestazioni grafiche del portatile possono anche utilizzare una scheda grafica esterna via Thunderbolt 4.
| 3DMark Performance rating - Percent | |
| Media della classe Office | |
| Schenker Work 17 Tiger Lake-H -1! | |
| Schenker Work 15 Tiger Lake-H -2! | |
| Media Intel Iris Xe Graphics G7 96EUs | |
| Acer Aspire 5 A517-52G-79Z5 -1! | |
| LG Gram 17Z90P-G.AA56G -2! | |
| Acer Aspire 3 A317-51G-72MD | |
| Dell Inspiron 15 3505-PXHPW | |
| 3DMark 11 Performance | 7137 punti | |
| 3DMark Fire Strike Score | 4666 punti | |
| 3DMark Time Spy Score | 1596 punti | |
Aiuto | ||
| F1 2021 | |
| 1920x1080 High Preset AA:T AF:16x | |
| Schenker Work 17 Tiger Lake-H | |
| Schenker Work 15 Tiger Lake-H | |
| Media Intel Iris Xe Graphics G7 96EUs (24 - 50.8, n=45) | |
| Dell Inspiron 15 3505-PXHPW | |
| 1920x1080 Medium Preset AA:T AF:16x | |
| Schenker Work 17 Tiger Lake-H | |
| Schenker Work 15 Tiger Lake-H | |
| Media Intel Iris Xe Graphics G7 96EUs (29.4 - 64.9, n=45) | |
| Dell Inspiron 15 3505-PXHPW | |
The Witcher 3 FPS diagram
| basso | medio | alto | ultra | |
|---|---|---|---|---|
| GTA V (2015) | 97.8 | 82.5 | 25.2 | 9.72 |
| The Witcher 3 (2015) | 90.3 | 74.1 | 24 | 13 |
| Dota 2 Reborn (2015) | 114 | 101 | 64 | 55.4 |
| Final Fantasy XV Benchmark (2018) | 40.7 | 20.1 | 14.5 | |
| X-Plane 11.11 (2018) | 29.6 | 35 | 32.2 | |
| Strange Brigade (2018) | 88.4 | 37.7 | 30.4 | 24.8 |
| F1 2021 (2021) | 101 | 48.9 | 38.8 | 27.2 |
Emissioni ed energia - Il Control Center permette la regolazione del rumore
Emissioni di rumore
Anche in modalità intrattenimento, lo Schenker Work 17 è relativamente silenzioso con circa 44 dB(A) a pieno carico. Utilizzando le corrispondenti modalità di prestazione, si può anche far funzionare il portatile in modo completamente silenzioso. Anche quando le ventole girano a piena velocità, le loro caratteristiche di rumore sono molto accettabili, poiché non ci sono frequenze sgradevolmente alte da notare
Rumorosità
| Idle |
| 24.6 / 24.6 / 27.7 dB(A) |
| Sotto carico |
| 43.6 / 43.6 dB(A) |
 | ||
30 dB silenzioso 40 dB(A) udibile 50 dB(A) rumoroso |
||
min: | ||
| Schenker Work 17 Tiger Lake-H Iris Xe G7 96EUs, i7-11370H, Samsung SSD 980 Pro 1TB MZ-V8P1T0BW | LG Gram 17Z90P-G.AA56G Iris Xe G7 80EUs, i5-1135G7, Samsung SSD PM981a MZVLB512HBJQ | Acer Aspire 5 A517-52G-79Z5 GeForce MX350, i7-1165G7, WDC PC SN530 SDBPNPZ-1T00 | Acer Aspire 3 A317-51G-72MD GeForce MX250, i7-10510U, Intel SSD 660p 1TB SSDPEKNW010T8 | Dell Inspiron 15 3505-PXHPW Vega 8, R5 3450U, KDI OM3PDP3-AD NVMe KDI 256GB | Schenker Work 15 Tiger Lake-H Iris Xe G7 96EUs, i7-11370H, Samsung SSD 980 Pro 1TB MZ-V8P1T0BW | |
|---|---|---|---|---|---|---|
| Noise | 11% | -1% | -1% | 8% | 1% | |
| off /ambiente * (dB) | 24.6 | 25 -2% | 24.9 -1% | 26.7 -9% | 25 -2% | 24.4 1% |
| Idle Minimum * (dB) | 24.6 | 25 -2% | 24.9 -1% | 26.9 -9% | 25 -2% | 24.4 1% |
| Idle Average * (dB) | 24.6 | 25 -2% | 24.9 -1% | 26.9 -9% | 25 -2% | 24.4 1% |
| Idle Maximum * (dB) | 27.7 | 26 6% | 27 3% | 26.9 3% | 25 10% | 26.7 4% |
| Load Average * (dB) | 43.6 | 27.7 36% | 44.1 -1% | 40.9 6% | 33.6 23% | 43.8 -0% |
| Witcher 3 ultra * (dB) | 43.6 | 40.1 8% | 43.8 -0% | |||
| Load Maximum * (dB) | 43.6 | 30.5 30% | 44.8 -3% | 43.7 -0% | 34.5 21% | 44.8 -3% |
* ... Meglio usare valori piccoli
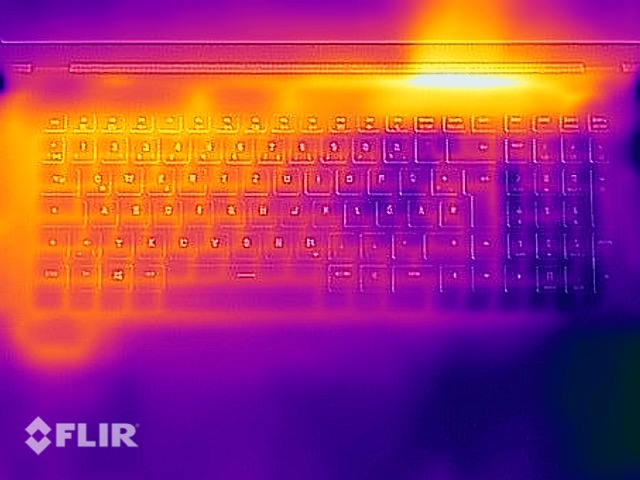
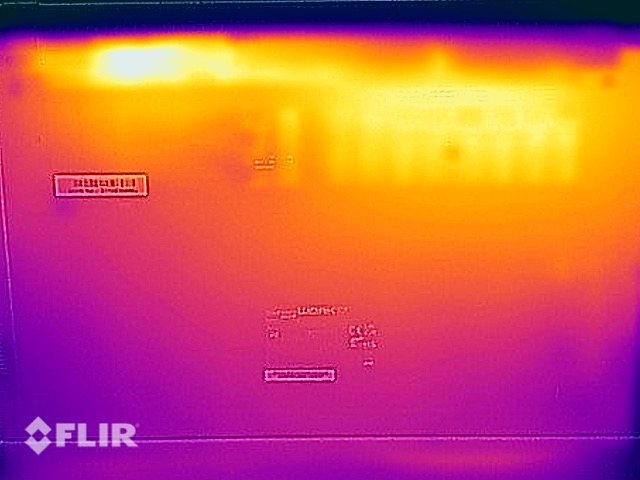
Temperatura
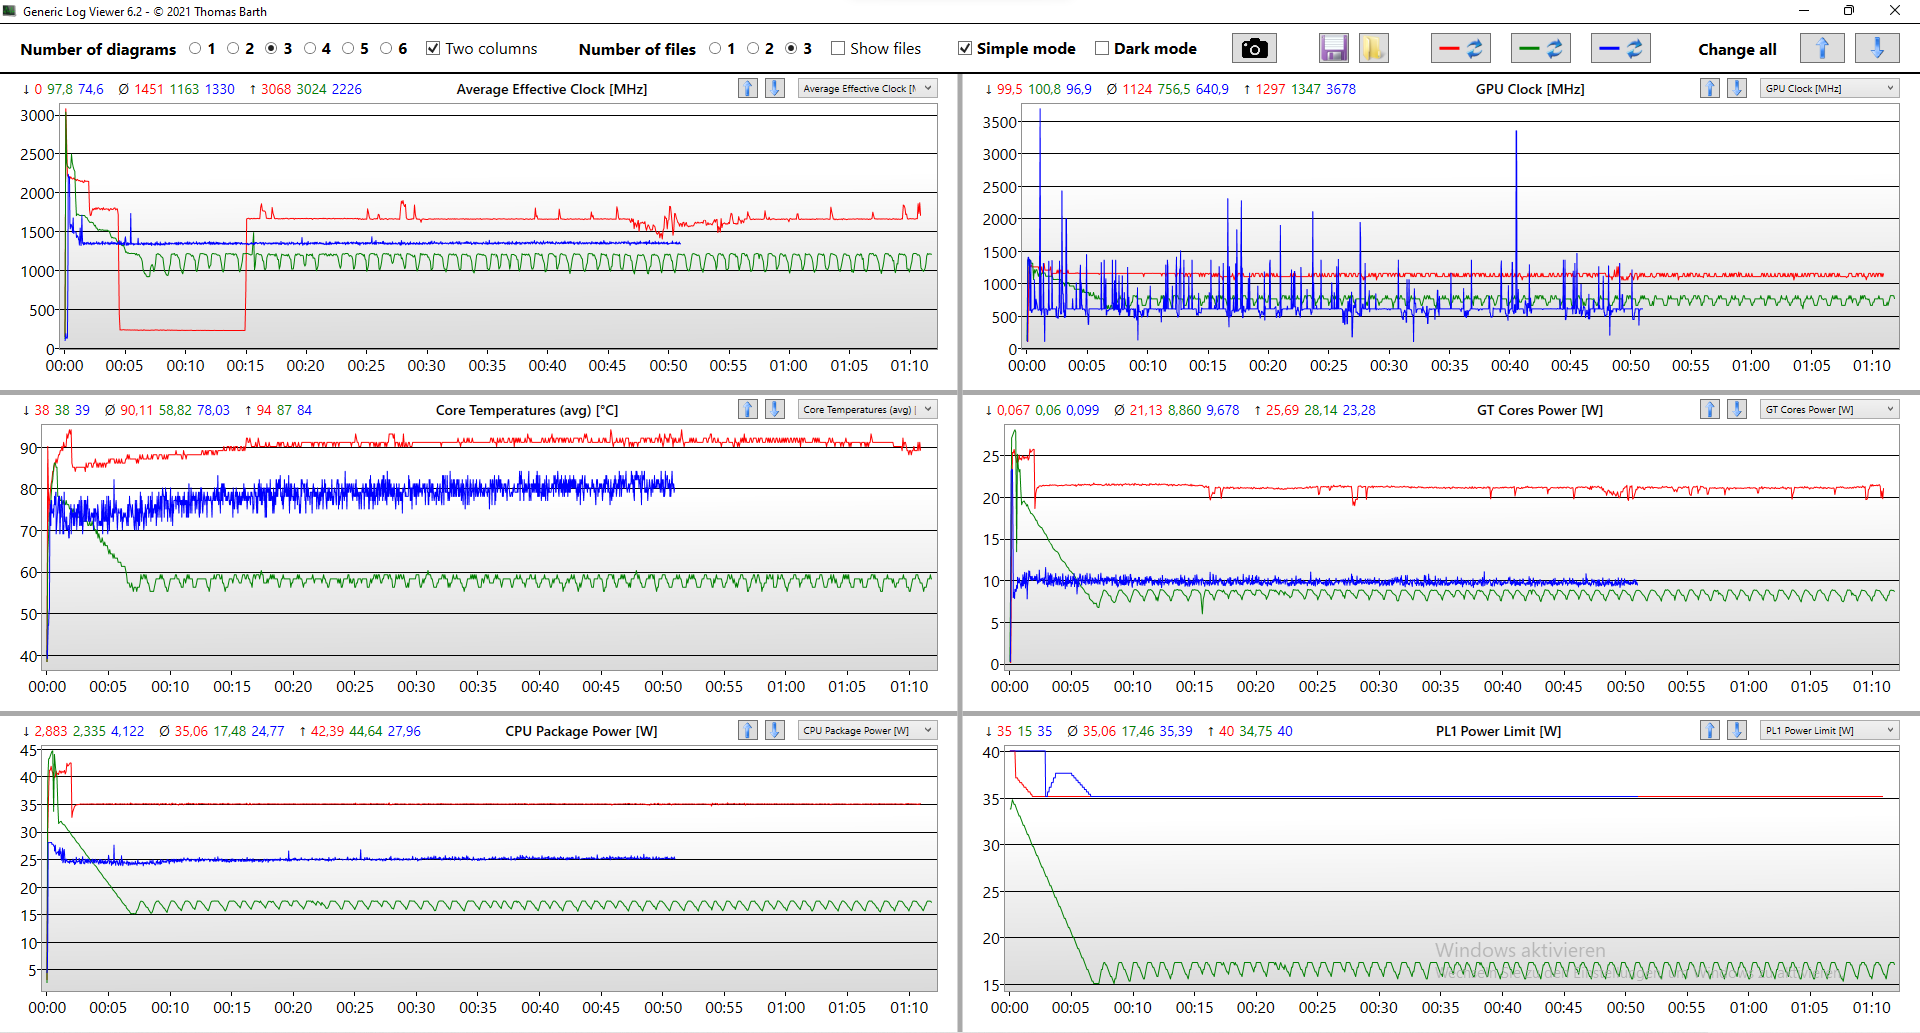
Lo Schenker Work 17 non si scalda particolarmente nella parte superiore, comprese le zone della tastiera e del ClickPad. Il calore disperso dall'hardware di calcolo è più evidente nelle prese d'aria sul fondo e intorno al processore. Ciononostante, il portatile da ufficio è in grado di gestire facilmente lo stress test, senza grandi cali di prestazioni da segnalare
(+) La temperatura massima sul lato superiore è di 36.5 °C / 98 F, rispetto alla media di 34.3 °C / 94 F, che varia da 21.2 a 62.5 °C per questa classe Office.
(±) Il lato inferiore si riscalda fino ad un massimo di 43.1 °C / 110 F, rispetto alla media di 36.8 °C / 98 F
(+) In idle, la temperatura media del lato superiore è di 23.6 °C / 74 F, rispetto alla media deld ispositivo di 29.5 °C / 85 F.
(+) Riproducendo The Witcher 3, la temperatura media per il lato superiore e' di 31.2 °C / 88 F, rispetto alla media del dispositivo di 29.5 °C / 85 F.
(+) I poggiapolsi e il touchpad sono piu' freddi della temperatura della pelle con un massimo di 27.4 °C / 81.3 F e sono quindi freddi al tatto.
(±) La temperatura media della zona del palmo della mano di dispositivi simili e'stata di 27.5 °C / 81.5 F (+0.1 °C / 0.2 F).
| Schenker Work 17 Tiger Lake-H Intel Core i7-11370H, Intel Iris Xe Graphics G7 96EUs | LG Gram 17Z90P-G.AA56G Intel Core i5-1135G7, Intel Iris Xe Graphics G7 80EUs | Acer Aspire 5 A517-52G-79Z5 Intel Core i7-1165G7, NVIDIA GeForce MX350 | Acer Aspire 3 A317-51G-72MD Intel Core i7-10510U, NVIDIA GeForce MX250 | Dell Inspiron 15 3505-PXHPW AMD Ryzen 5 3450U, AMD Radeon RX Vega 8 (Ryzen 2000/3000) | Schenker Work 15 Tiger Lake-H Intel Core i7-11370H, Intel Iris Xe Graphics G7 96EUs | |
|---|---|---|---|---|---|---|
| Heat | -7% | 2% | -14% | -26% | -2% | |
| Maximum Upper Side * (°C) | 36.5 | 43.6 -19% | 35 4% | 44.2 -21% | 40.4 -11% | 39.1 -7% |
| Maximum Bottom * (°C) | 43.1 | 41.4 4% | 40 7% | 53 -23% | 41.1 5% | 43.4 -1% |
| Idle Upper Side * (°C) | 24.4 | 26.4 -8% | 25.6 -5% | 26.4 -8% | 34.6 -42% | 24.3 -0% |
| Idle Bottom * (°C) | 25.6 | 27 -5% | 25.3 1% | 26.9 -5% | 40 -56% | 25.1 2% |
* ... Meglio usare valori piccoli
Altoparlanti
Gli altoparlanti dello Schenker Work 17 sono adatti per l'uso in ufficio, ma non per molto altro. Offrono una qualità sonora sufficiente per le videochiamate, mentre mancano chiaramente di gamma dinamica per la musica e i film. La riproduzione è debole sia per i toni alti che per quelli bassi
Schenker Work 17 Tiger Lake-H analisi audio
(±) | potenza degli altiparlanti media ma buona (79.4 dB)
Bassi 100 - 315 Hz
(-) | quasi nessun basso - in media 26.6% inferiori alla media
(±) | la linearità dei bassi è media (7% delta rispetto alla precedente frequenza)
Medi 400 - 2000 Hz
(±) | medi elevati - circa 8.2% superiore alla media
(±) | linearità dei medi adeguata (14.3% delta rispetto alla precedente frequenza)
Alti 2 - 16 kHz
(+) | Alti bilanciati - appena 4% dalla media
(+) | alti lineari (5.6% delta rispetto alla precedente frequenza)
Nel complesso 100 - 16.000 Hz
(±) | la linearità complessiva del suono è media (27.6% di differenza rispetto alla media
Rispetto alla stessa classe
» 86% di tutti i dispositivi testati in questa classe è stato migliore, 4% simile, 10% peggiore
» Il migliore ha avuto un delta di 7%, medio di 21%, peggiore di 53%
Rispetto a tutti i dispositivi testati
» 84% di tutti i dispositivi testati in questa classe è stato migliore, 3% similare, 13% peggiore
» Il migliore ha avuto un delta di 4%, medio di 24%, peggiore di 134%
LG Gram 17Z90P-G.AA56G analisi audio
(±) | potenza degli altiparlanti media ma buona (79 dB)
Bassi 100 - 315 Hz
(-) | quasi nessun basso - in media 18.7% inferiori alla media
(±) | la linearità dei bassi è media (13.1% delta rispetto alla precedente frequenza)
Medi 400 - 2000 Hz
(+) | medi bilanciati - solo only 2.3% rispetto alla media
(+) | medi lineari (4.6% delta rispetto alla precedente frequenza)
Alti 2 - 16 kHz
(+) | Alti bilanciati - appena 2.8% dalla media
(+) | alti lineari (4.5% delta rispetto alla precedente frequenza)
Nel complesso 100 - 16.000 Hz
(+) | suono nel complesso lineare (13.5% differenza dalla media)
Rispetto alla stessa classe
» 7% di tutti i dispositivi testati in questa classe è stato migliore, 4% simile, 89% peggiore
» Il migliore ha avuto un delta di 7%, medio di 21%, peggiore di 53%
Rispetto a tutti i dispositivi testati
» 14% di tutti i dispositivi testati in questa classe è stato migliore, 4% similare, 82% peggiore
» Il migliore ha avuto un delta di 4%, medio di 24%, peggiore di 134%
Consumo di energia
Nell'uso inattivo, lo Schenker Work 17 richiede solo una piccola quantità di energia di soli 9 watt nonostante il grande display. Una richiesta di energia di 71,5 watts può essere misurata per un breve periodo. Se si ignora l'efficienza dell'alimentatore, il consumo energetico del portatile è brevemente al di sopra delle specifiche dell'adattatore incluso. Tuttavia, dato che il consumo scende rapidamente nel corso dello stress test, si ritiene che l'adattatore di alimentazione abbia ancora una capacità sufficiente
| Off / Standby | |
| Idle | |
| Sotto carico |
|
Leggenda:
min: | |
Energy consumption during The Witcher 3 / stress test
Energy consumption with an external monitor
Durata della batteria
La durata della batteria del portatile da ufficio è generalmente buona con poco meno di 10 ore nel nostro test Wi-Fi a 150 cd/m². La batteria da 73 Wh dura ancora per circa 7 ore a piena luminosità nel test Wi-Fi.
Per quanto riguarda la batteria, abbiamo notato che il portatile si spegne dopo circa un'ora in modalità Performance sotto carico massimo. Un'analisi dei file di log ha rivelato che questo è dovuto ad uno spegnimento protettivo causato da temperature eccessive. Dopo aver contattato Schenker, una nuova versione del BIOS è in fase di creazione, che ridurrà la temperatura target in Performance Mode dagli attuali 98 °C (~208 °F) a 95 °C (~203 °F). Questo dovrebbe mettere il problema nel passato. Il problema non esiste in Entertainment Mode, e il tempo di esecuzione nello stress test è poco più di 2 ore.
Aggiornamento 17.04.: Schenker ci ha fornito il nuovo BIOS versione 1.07.15 RTR2, e abbiamo ripetuto il test. Come detto in precedenza, la temperatura massima della CPU in modalità Performance è ora più bassa, e il test si svolge senza problemi per tutto il tempo. In questo caso, il tempo di esecuzione registrato è di circa 1:30 ore. Pertanto, raccomandiamo a tutti gli utenti di aggiornare di conseguenza.
| Schenker Work 17 Tiger Lake-H i7-11370H, Iris Xe G7 96EUs, 73 Wh | LG Gram 17Z90P-G.AA56G i5-1135G7, Iris Xe G7 80EUs, 80 Wh | Acer Aspire 5 A517-52G-79Z5 i7-1165G7, GeForce MX350, 50.2 Wh | Acer Aspire 3 A317-51G-72MD i7-10510U, GeForce MX250, 36.7 Wh | Dell Inspiron 15 3505-PXHPW R5 3450U, Vega 8, 42 Wh | Schenker Work 15 Tiger Lake-H i7-11370H, Iris Xe G7 96EUs, 73 Wh | Media della classe Office | |
|---|---|---|---|---|---|---|---|
| Autonomia della batteria | 31% | -22% | -47% | -55% | 3% | 5% | |
| Reader / Idle (h) | 22.3 | 33.6 51% | 13.8 -38% | 24.5 10% | 23.7 ? 6% | ||
| WiFi v1.3 (h) | 9.9 | 12.7 28% | 7.4 -25% | 5.2 -47% | 4.5 -55% | 10.2 3% | 12.9 ? 30% |
| Load (h) | 2.3 | 2.6 13% | 2.2 -4% | 2.2 -4% | 1.807 ? -21% | ||
| H.264 (h) | 4.9 | 9.6 | 15 ? | ||||
| Witcher 3 ultra (h) | 1.3 |
Pro
Contro
Verdetto - Ampia scelta per prestazioni personalizzate

Lo Schenker Work 17 è principalmente un dispositivo robusto, e la sua lavorazione è di alta qualità. Di solito è in grado di fornire prestazioni di calcolo convincenti, anche se rimane indietro rispetto al Schenker Work 15 schenker Work 15 a volte. Questo fatto non può essere davvero spiegato, però, dal momento che l'hardware di entrambe le unità da recensire dovrebbe essere quasi identico. Questo è probabilmente il risultato di fattori che rientrano nelle tolleranze di fabbricazione dell'elettronica moderna
Tuttavia, la maggior parte delle applicazioni non rappresentano una grande sfida per l'APU Intel. Office, programmi di editing delle immagini, simulazioni MATLAB e applicazioni Internet sono facilmente gestite dal portatile. Anche le applicazioni 3D e i giochi funzionano senza problemi se si fanno alcune restrizioni in termini di impostazioni di qualità
Le molte opzioni di configurazione, una tastiera RGB e, ultimo ma non meno importante, il formato da 17 pollici rendono lo Schenker Work 17 un esemplare esotico tra i portatili da ufficio. Il portatile riesce a impressionare con la sua lavorazione e le sue prestazioni.
Anche se l'alto prezzo d'acquisto non sembra un affare, è giustificato perché la lavorazione e la potenza di elaborazione sono molto buone. Inoltre, le opzioni di configurazione che Schenker offre permettono ancora di risparmiare qualche soldo.
Prezzo e disponibilità
Lo Schenker Work 17 è disponibile in varie configurazioni a partire da 1.179 euro (~$1.272) nel negozio online del produttore
Schenker Work 17 Tiger Lake-H
- 04/02/2022 v7 (old)
Marc Herter
Price comparison

