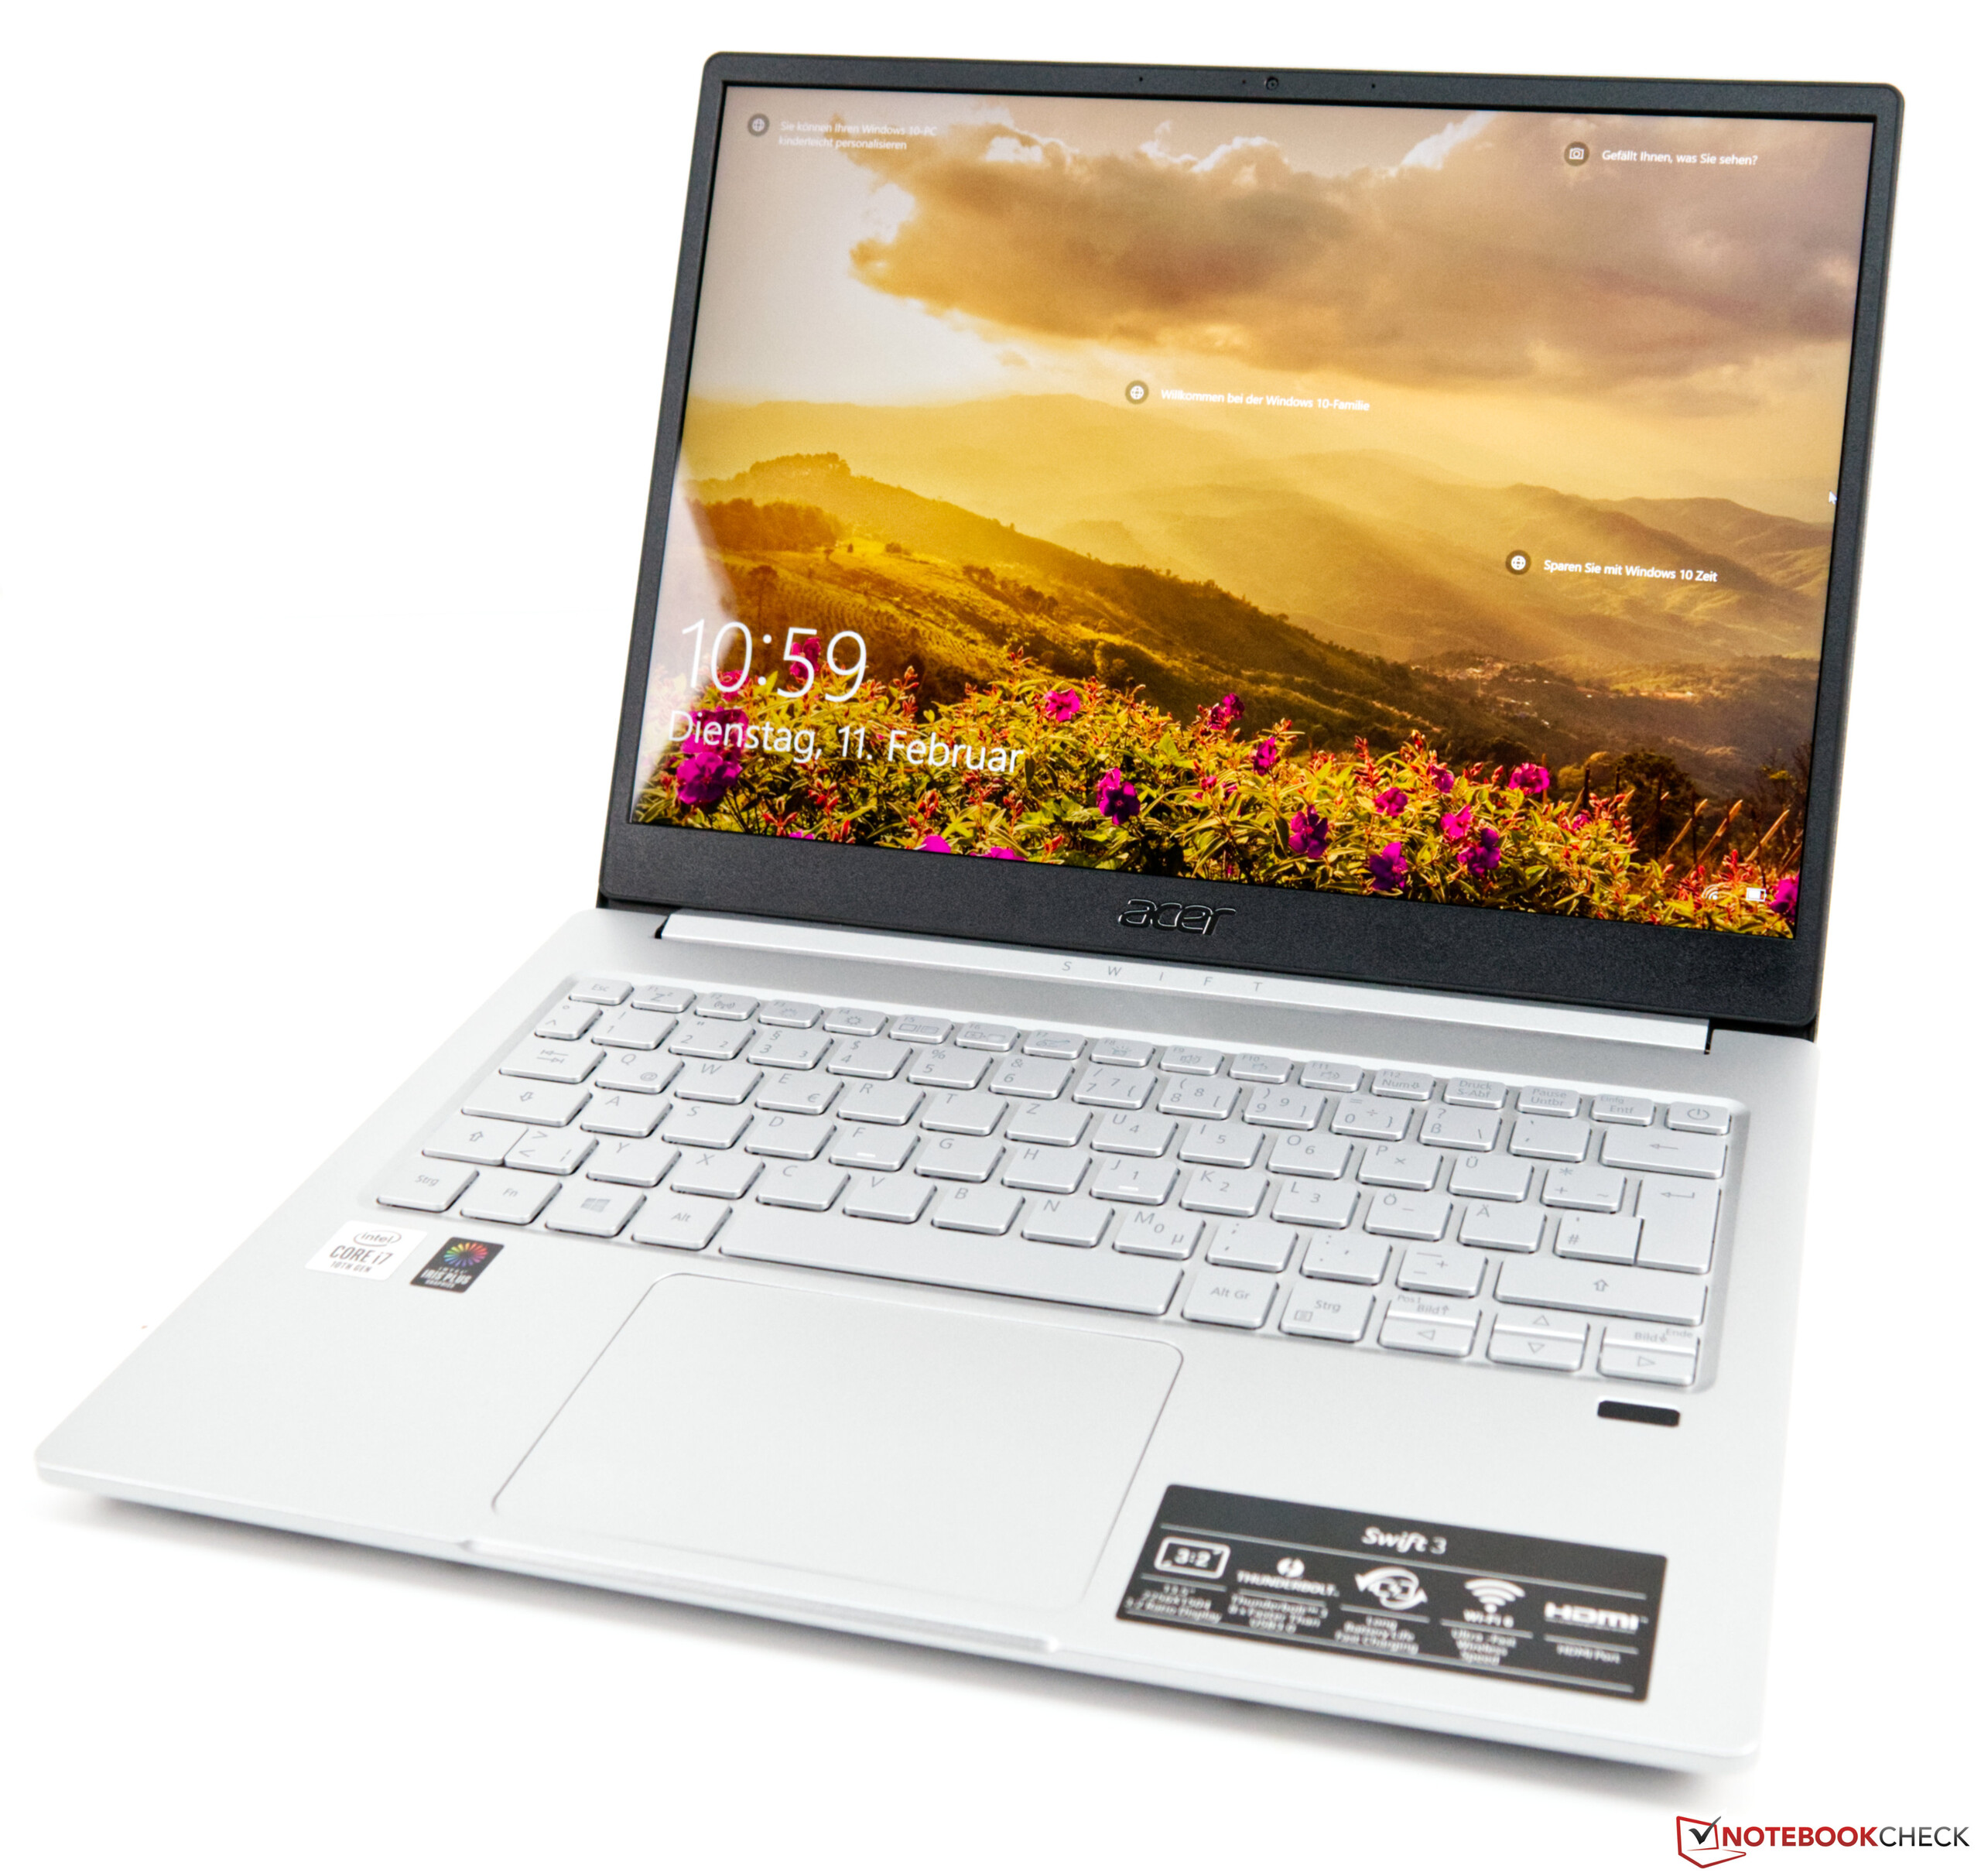
Recensione del Laptop Acer Swift 3 SF313: un buon subnotebook anche con i5
Punteggio | Data | Modello | Peso | Altezza | Dimensione | Risoluzione | Prezzo |
|---|---|---|---|---|---|---|---|
| 85.9 % v7 (old) | 06/2020 | Acer Swift 3 SF313-52-52AS i5-1035G4, Iris Plus Graphics G4 (Ice Lake 48 EU) | 1.2 kg | 16.6 mm | 13.50" | 2256x1504 | |
| 87 % v7 (old) | 02/2020 | Acer Swift 3 SF313-52-71Y7 i7-1065G7, Iris Plus Graphics G7 (Ice Lake 64 EU) | 1.2 kg | 16.6 mm | 13.50" | 2256x1504 | |
| 84.5 % v7 (old) | 05/2020 | HP ProBook 430 G7-8VU53EA i7-10510U, UHD Graphics 620 | 1.4 kg | 18 mm | 13.30" | 1920x1080 | |
| 84.9 % v7 (old) | 12/2019 | Lenovo IdeaPad S540-13API R5 3550H, Vega 8 | 1.3 kg | 16 mm | 13.30" | 2560x1600 | |
| 84 % v7 (old) | 02/2020 | Microsoft Surface Laptop 3 13 Core i5-1035G7 i5-1035G7, Iris Plus Graphics G7 (Ice Lake 64 EU) | 1.3 kg | 14.5 mm | 13.50" | 2256x1504 |
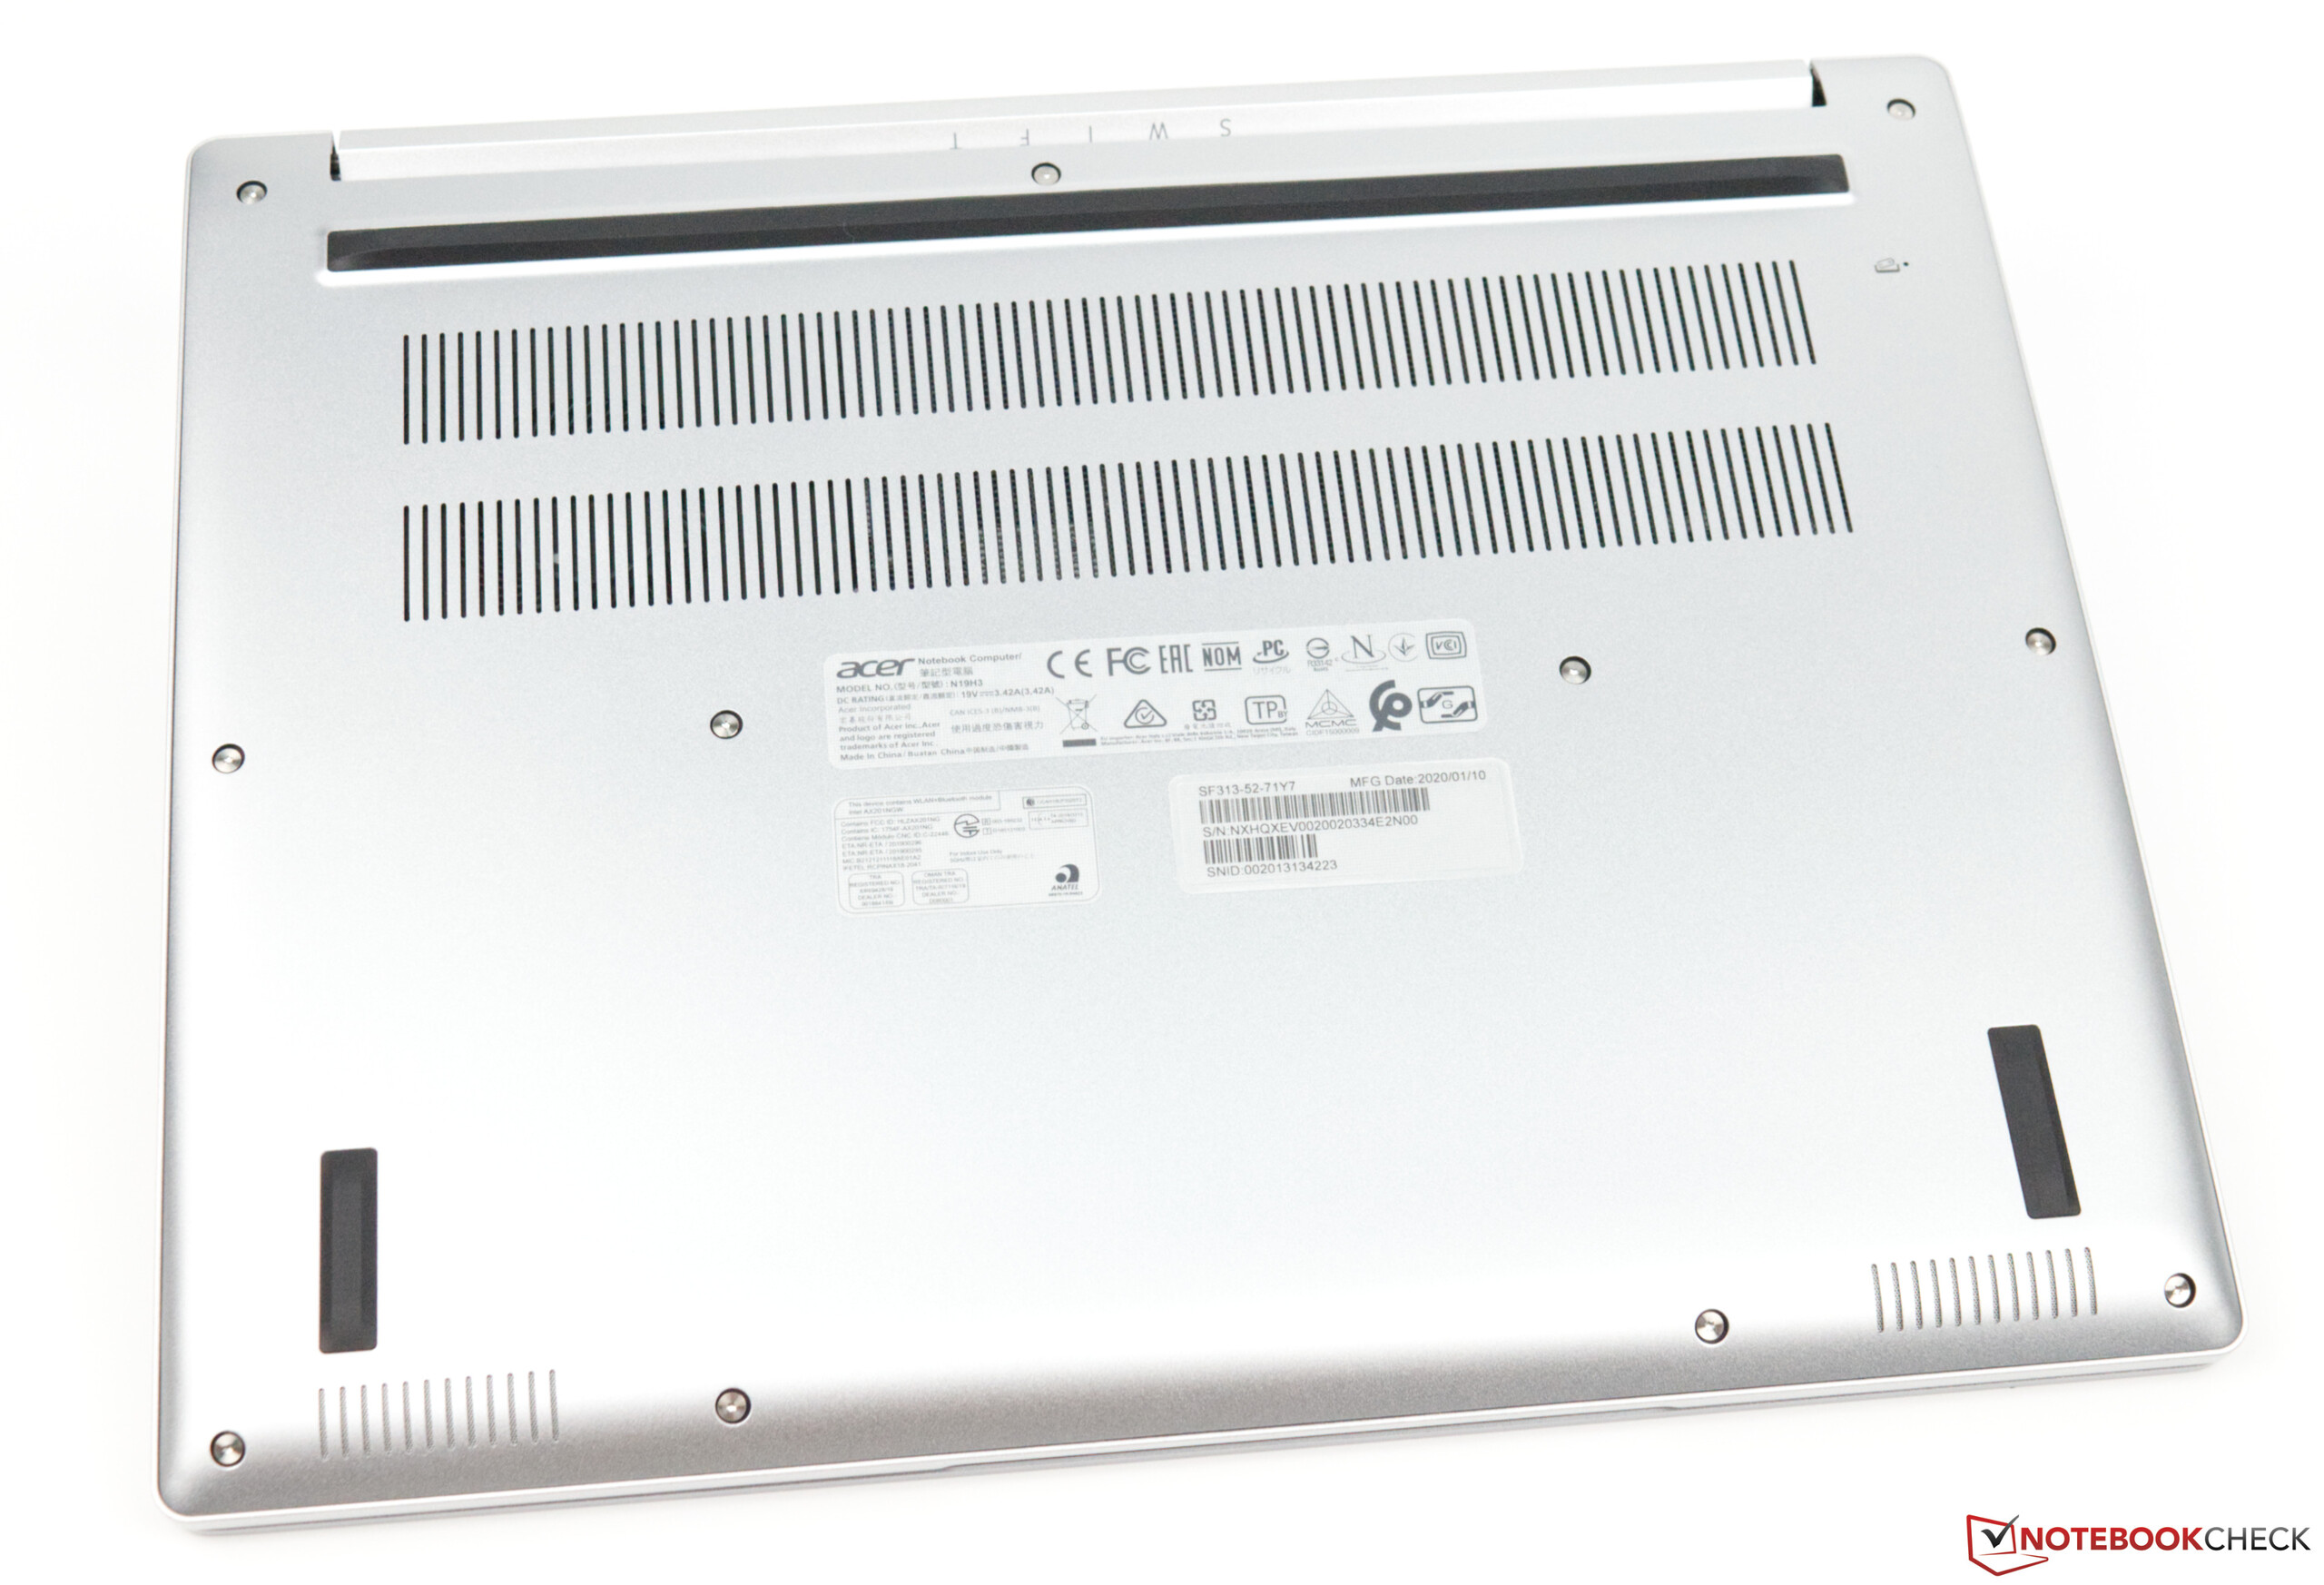
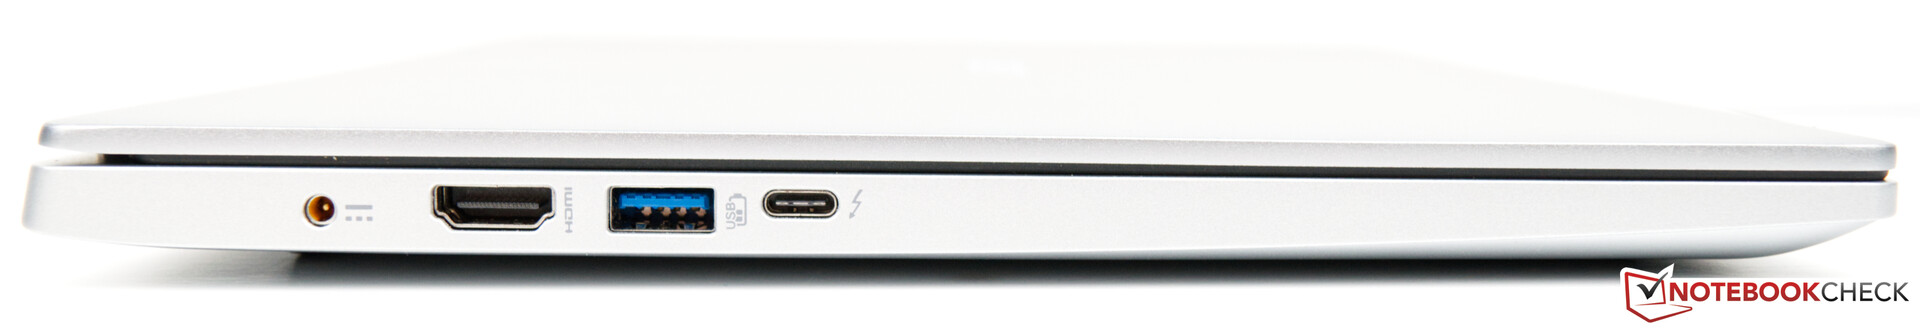
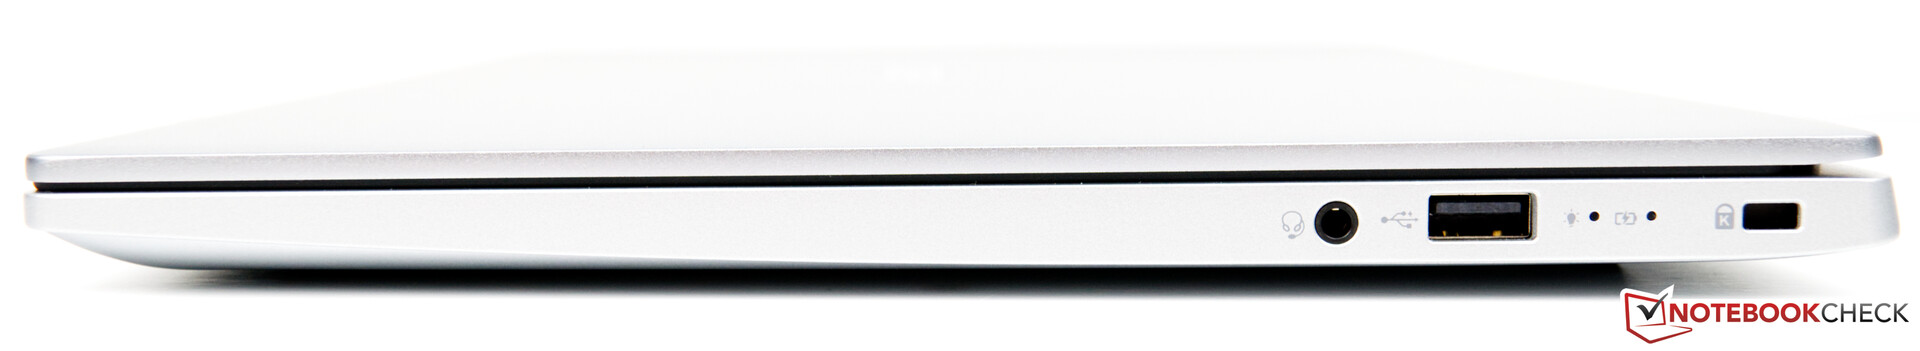
Configurazione Porte

, i5-1035G4, SK Hynix BC501 HFM512GDJTNG")
, i5-1035G4, SK Hynix BC501 HFM512GDJTNG")
| |||||||||||||||||||||||||
Distribuzione della luminosità: 88 %
Al centro con la batteria: 436 cd/m²
Contrasto: 1425:1 (Nero: 0.32 cd/m²)
ΔE ColorChecker Calman: 3.49 | ∀{0.5-29.43 Ø4.72}
calibrated: 0.72
ΔE Greyscale Calman: 5.53 | ∀{0.09-98 Ø4.97}
100% sRGB (Argyll 1.6.3 3D)
65% AdobeRGB 1998 (Argyll 1.6.3 3D)
71.3% AdobeRGB 1998 (Argyll 3D)
99.8% sRGB (Argyll 3D)
70.3% Display P3 (Argyll 3D)
Gamma: 2.41
CCT: 6675 K
| Acer Swift 3 SF313-52-52AS BOE08BC, IPS, 2256x1504, 13.5" | Acer Swift 3 SF313-52-71Y7 BOE, NE135FBM-N41, IPS, 2256x1504, 13.5" | HP ProBook 430 G7-8VU53EA BOE08A6, IPS LED, 1920x1080, 13.3" | Lenovo IdeaPad S540-13API CSOT T3 MND307DA1-2, IPS, 2560x1600, 13.3" | Microsoft Surface Laptop 3 13 Core i5-1035G7 Sharp LQ135P1JX51, IPS, 2256x1504, 13.5" | |
|---|---|---|---|---|---|
| Display | 0% | -38% | 2% | -4% | |
| Display P3 Coverage (%) | 70.3 | 70.1 0% | 42.79 -39% | 73.4 4% | 65.7 -7% |
| sRGB Coverage (%) | 99.8 | 99.8 0% | 62.8 -37% | 98.6 -1% | 98.6 -1% |
| AdobeRGB 1998 Coverage (%) | 71.3 | 71.2 0% | 44.21 -38% | 72.6 2% | 67.8 -5% |
| Response Times | -5% | -1% | 5% | -26% | |
| Response Time Grey 50% / Grey 80% * (ms) | 50 ? | 55 ? -10% | 48.8 ? 2% | 45.6 ? 9% | 59.2 ? -18% |
| Response Time Black / White * (ms) | 31 ? | 31 ? -0% | 32 ? -3% | 30.8 ? 1% | 41.6 ? -34% |
| PWM Frequency (Hz) | 192 ? | 208 ? | 1000 ? | 21740 ? | |
| Screen | -15% | -78% | -5% | 12% | |
| Brightness middle (cd/m²) | 456 | 474 4% | 300 -34% | 321 -30% | 403.4 -12% |
| Brightness (cd/m²) | 432 | 426 -1% | 285 -34% | 314 -27% | 397 -8% |
| Brightness Distribution (%) | 88 | 82 -7% | 90 2% | 94 7% | 89 1% |
| Black Level * (cd/m²) | 0.32 | 0.29 9% | 0.25 22% | 0.19 41% | 0.34 -6% |
| Contrast (:1) | 1425 | 1634 15% | 1200 -16% | 1689 19% | 1186 -17% |
| Colorchecker dE 2000 * | 3.49 | 2.38 32% | 5.9 -69% | 3.3 5% | 0.94 73% |
| Colorchecker dE 2000 max. * | 8.4 | 5.88 30% | 20 -138% | 6 29% | 2.92 65% |
| Colorchecker dE 2000 calibrated * | 0.72 | 2.69 -274% | 4.6 -539% | 1.7 -136% | 0.99 -38% |
| Greyscale dE 2000 * | 5.53 | 3.75 32% | 4 28% | 3.5 37% | 0.9 84% |
| Gamma | 2.41 91% | 2.37 93% | 2.23 99% | 2.08 106% | 2.13 103% |
| CCT | 6675 97% | 6466 101% | 7154 91% | 7245 90% | 6620 98% |
| Color Space (Percent of AdobeRGB 1998) (%) | 65 | 65 0% | 40.4 -38% | 64.5 -1% | 62.3 -4% |
| Color Space (Percent of sRGB) (%) | 100 | 100 0% | 62.4 -38% | 98.4 -2% | 98.7 -1% |
| Media totale (Programma / Settaggio) | -7% /
-11% | -39% /
-61% | 1% /
-3% | -6% /
5% |
* ... Meglio usare valori piccoli
Tempi di risposta del Display
| ↔ Tempi di risposta dal Nero al Bianco | ||
|---|---|---|
| 31 ms ... aumenta ↗ e diminuisce ↘ combinato | ↗ 18 ms Incremento | 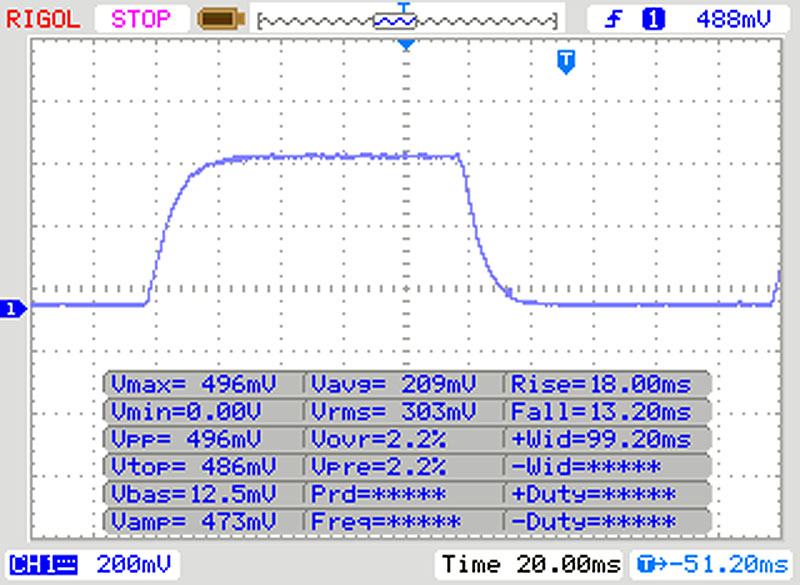 |
| ↘ 13 ms Calo | ||
| Lo schermo mostra tempi di risposta lenti nei nostri tests e sarà insoddisfacente per i gamers. In confronto, tutti i dispositivi di test variano da 0.1 (minimo) a 240 (massimo) ms. » 84 % di tutti i dispositivi è migliore. Questo significa che i tempi di risposta rilevati sono peggiori rispetto alla media di tutti i dispositivi testati (19.8 ms). | ||
| ↔ Tempo di risposta dal 50% Grigio all'80% Grigio | ||
| 50 ms ... aumenta ↗ e diminuisce ↘ combinato | ↗ 24 ms Incremento | 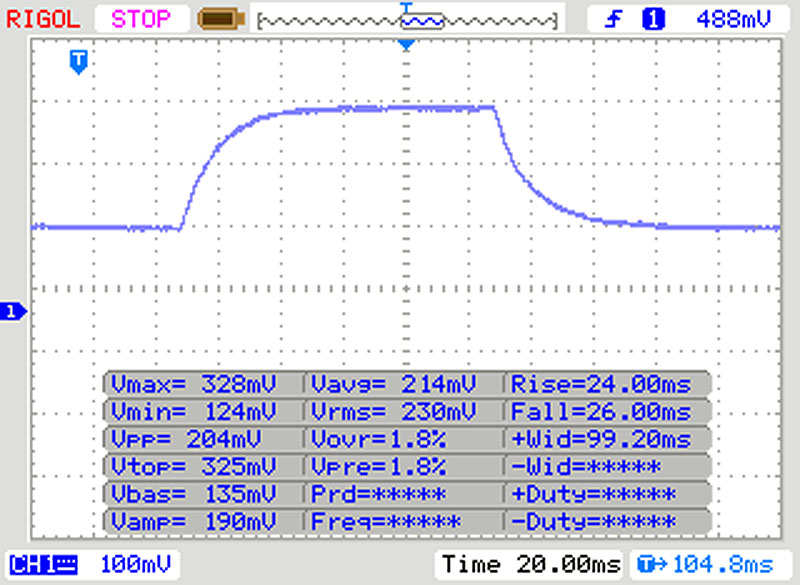 |
| ↘ 26 ms Calo | ||
| Lo schermo mostra tempi di risposta lenti nei nostri tests e sarà insoddisfacente per i gamers. In confronto, tutti i dispositivi di test variano da 0.165 (minimo) a 636 (massimo) ms. » 86 % di tutti i dispositivi è migliore. Questo significa che i tempi di risposta rilevati sono peggiori rispetto alla media di tutti i dispositivi testati (31 ms). | ||
Sfarfallio dello schermo / PWM (Pulse-Width Modulation)
| flickering dello schermo / PWM rilevato | 192 Hz | ≤ 90 % settaggio luminosita' | 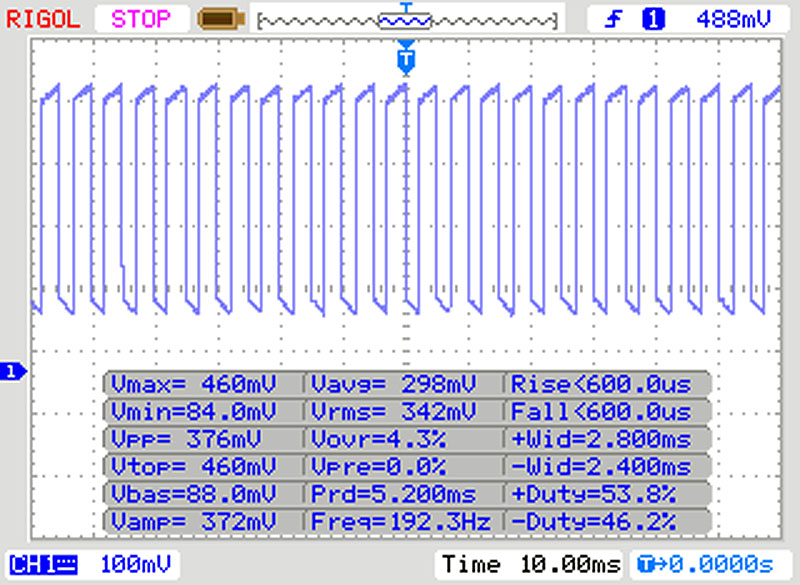 |
Il display sfarfalla a 192 Hz (Probabilmente a causa dell'uso di PWM) Flickering rilevato ad una luminosita' di 90 % o inferiore. Non dovrebbe verificarsi flickering o PWM sopra questo valore di luminosita'. La frequenza di 192 Hz è relativamente bassa, quindi gli utenti sensibili potrebbero notare il flickering ed accusare stanchezza agli occhi a questo livello di luminosità e a livelli inferiori. In confronto: 52 % di tutti i dispositivi testati non utilizza PWM per ridurre la luminosita' del display. Se è rilevato PWM, una media di 7769 (minimo: 5 - massimo: 343500) Hz è stata rilevata. | |||
Cinebench R15: CPU Single 64Bit | CPU Multi 64Bit
Blender: v2.79 BMW27 CPU
7-Zip 18.03: 7z b 4 -mmt1 | 7z b 4
Geekbench 5.5: Single-Core | Multi-Core
HWBOT x265 Benchmark v2.2: 4k Preset
LibreOffice : 20 Documents To PDF
R Benchmark 2.5: Overall mean
| Cinebench R20 / CPU (Single Core) | |
| Media della classe Subnotebook (128 - 832, n=57, ultimi 2 anni) | |
| Acer Swift 3 SF313-52-71Y7 | |
| HP ProBook 430 G7-8VU53EA | |
| HP ProBook 430 G7-8VU53EA | |
| Microsoft Surface Laptop 3 13 Core i5-1035G7 | |
| Media Intel Core i5-1035G4 (357 - 441, n=6) | |
| Lenovo IdeaPad S540-13API | |
| Acer Swift 3 SF313-52-52AS | |
| Acer Swift 3 SF313-52-52AS | |
| Cinebench R20 / CPU (Multi Core) | |
| Media della classe Subnotebook (579 - 8541, n=57, ultimi 2 anni) | |
| Microsoft Surface Laptop 3 13 Core i5-1035G7 | |
| Lenovo IdeaPad S540-13API | |
| Acer Swift 3 SF313-52-71Y7 | |
| HP ProBook 430 G7-8VU53EA | |
| HP ProBook 430 G7-8VU53EA | |
| Media Intel Core i5-1035G4 (892 - 1648, n=6) | |
| Acer Swift 3 SF313-52-52AS | |
| Acer Swift 3 SF313-52-52AS | |
| Cinebench R15 / CPU Single 64Bit | |
| Media della classe Subnotebook (72.4 - 322, n=57, ultimi 2 anni) | |
| HP ProBook 430 G7-8VU53EA | |
| Acer Swift 3 SF313-52-71Y7 | |
| Microsoft Surface Laptop 3 13 Core i5-1035G7 | |
| Media Intel Core i5-1035G4 (146.4 - 172, n=5) | |
| Acer Swift 3 SF313-52-52AS | |
| Lenovo IdeaPad S540-13API | |
| Cinebench R15 / CPU Multi 64Bit | |
| Media della classe Subnotebook (327 - 3345, n=57, ultimi 2 anni) | |
| Microsoft Surface Laptop 3 13 Core i5-1035G7 | |
| Lenovo IdeaPad S540-13API | |
| Acer Swift 3 SF313-52-71Y7 | |
| HP ProBook 430 G7-8VU53EA | |
| Media Intel Core i5-1035G4 (490 - 676, n=6) | |
| Acer Swift 3 SF313-52-52AS | |
| Blender / v2.79 BMW27 CPU | |
| Acer Swift 3 SF313-52-52AS | |
| Acer Swift 3 SF313-52-52AS | |
| Media Intel Core i5-1035G4 (703 - 1075, n=6) | |
| HP ProBook 430 G7-8VU53EA | |
| HP ProBook 430 G7-8VU53EA | |
| Acer Swift 3 SF313-52-71Y7 | |
| Microsoft Surface Laptop 3 13 Core i5-1035G7 | |
| Lenovo IdeaPad S540-13API | |
| Media della classe Subnotebook (159 - 2271, n=58, ultimi 2 anni) | |
| 7-Zip 18.03 / 7z b 4 -mmt1 | |
| Media della classe Subnotebook (2643 - 6699, n=59, ultimi 2 anni) | |
| HP ProBook 430 G7-8VU53EA | |
| HP ProBook 430 G7-8VU53EA | |
| Acer Swift 3 SF313-52-71Y7 | |
| Microsoft Surface Laptop 3 13 Core i5-1035G7 | |
| Acer Swift 3 SF313-52-52AS | |
| Acer Swift 3 SF313-52-52AS | |
| Media Intel Core i5-1035G4 (1307 - 4190, n=6) | |
| Lenovo IdeaPad S540-13API | |
| 7-Zip 18.03 / 7z b 4 | |
| Media della classe Subnotebook (11668 - 77867, n=57, ultimi 2 anni) | |
| Microsoft Surface Laptop 3 13 Core i5-1035G7 | |
| HP ProBook 430 G7-8VU53EA | |
| HP ProBook 430 G7-8VU53EA | |
| Acer Swift 3 SF313-52-71Y7 | |
| Lenovo IdeaPad S540-13API | |
| Media Intel Core i5-1035G4 (11030 - 19548, n=6) | |
| Acer Swift 3 SF313-52-52AS | |
| Acer Swift 3 SF313-52-52AS | |
| Geekbench 5.5 / Single-Core | |
| Media della classe Subnotebook (726 - 2224, n=48, ultimi 2 anni) | |
| Acer Swift 3 SF313-52-71Y7 | |
| HP ProBook 430 G7-8VU53EA | |
| HP ProBook 430 G7-8VU53EA | |
| HP ProBook 430 G7-8VU53EA | |
| Media Intel Core i5-1035G4 (1081 - 1277, n=5) | |
| Acer Swift 3 SF313-52-52AS | |
| Acer Swift 3 SF313-52-52AS | |
| Geekbench 5.5 / Multi-Core | |
| Media della classe Subnotebook (2557 - 17218, n=48, ultimi 2 anni) | |
| Acer Swift 3 SF313-52-71Y7 | |
| Media Intel Core i5-1035G4 (3261 - 4315, n=5) | |
| Acer Swift 3 SF313-52-52AS | |
| Acer Swift 3 SF313-52-52AS | |
| HP ProBook 430 G7-8VU53EA | |
| HP ProBook 430 G7-8VU53EA | |
| HP ProBook 430 G7-8VU53EA | |
| HWBOT x265 Benchmark v2.2 / 4k Preset | |
| Media della classe Subnotebook (0.97 - 25.1, n=57, ultimi 2 anni) | |
| Acer Swift 3 SF313-52-71Y7 | |
| Microsoft Surface Laptop 3 13 Core i5-1035G7 | |
| HP ProBook 430 G7-8VU53EA | |
| HP ProBook 430 G7-8VU53EA | |
| Media Intel Core i5-1035G4 (3.37 - 5.61, n=6) | |
| Lenovo IdeaPad S540-13API | |
| Acer Swift 3 SF313-52-52AS | |
| Acer Swift 3 SF313-52-52AS | |
| LibreOffice / 20 Documents To PDF | |
| Acer Swift 3 SF313-52-52AS | |
| Acer Swift 3 SF313-52-52AS | |
| HP ProBook 430 G7-8VU53EA | |
| HP ProBook 430 G7-8VU53EA | |
| Media Intel Core i5-1035G4 (58.4 - 78.3, n=5) | |
| Media della classe Subnotebook (39.9 - 220, n=56, ultimi 2 anni) | |
| R Benchmark 2.5 / Overall mean | |
| Acer Swift 3 SF313-52-52AS | |
| Acer Swift 3 SF313-52-52AS | |
| Media Intel Core i5-1035G4 (0.701 - 0.825, n=5) | |
| Acer Swift 3 SF313-52-71Y7 | |
| HP ProBook 430 G7-8VU53EA | |
| HP ProBook 430 G7-8VU53EA | |
| Media della classe Subnotebook (0.4024 - 1.456, n=58, ultimi 2 anni) | |
* ... Meglio usare valori piccoli
| PCMark 10 Score | 3790 punti | |
Aiuto | ||
| DPC Latencies / LatencyMon - interrupt to process latency (max), Web, Youtube, Prime95 | |
| HP ProBook 430 G7-8VU53EA | |
| Acer Swift 3 SF313-52-52AS | |
* ... Meglio usare valori piccoli
| Acer Swift 3 SF313-52-52AS SK Hynix BC501 HFM512GDJTNG | Acer Swift 3 SF313-52-71Y7 Intel SSD 660p 1TB SSDPEKNW010T8 | HP ProBook 430 G7-8VU53EA Toshiba KBG30ZMV256G | Lenovo IdeaPad S540-13API Samsung SSD PM981 MZVLB512HAJQ | Microsoft Surface Laptop 3 13 Core i5-1035G7 SK hynix BC501 HFM256GDGTNG | Media SK Hynix BC501 HFM512GDJTNG | Media della classe Subnotebook | |
|---|---|---|---|---|---|---|---|
| CrystalDiskMark 5.2 / 6 | 41% | -11% | 60% | -13% | -18% | 123% | |
| Write 4K (MB/s) | 120.6 | 187.4 55% | 124.7 3% | 133.9 11% | 112.3 -7% | 95.5 ? -21% | 155.4 ? 29% |
| Read 4K (MB/s) | 46.88 | 63.8 36% | 48.17 3% | 44.98 -4% | 42.13 -10% | 38.3 ? -18% | 64.3 ? 37% |
| Write Seq (MB/s) | 1044 | 1776 70% | 694 -34% | 2730 161% | 630 -40% | 759 ? -27% | 2846 ? 173% |
| Read Seq (MB/s) | 1147 | 1693 48% | 757 -34% | 2403 110% | 1023 -11% | 1022 ? -11% | 3299 ? 188% |
| Write 4K Q32T1 (MB/s) | 332.4 | 492.3 48% | 311 -6% | 252.2 -24% | 336.6 1% | 303 ? -9% | 431 ? 30% |
| Read 4K Q32T1 (MB/s) | 443.3 | 539 22% | 495.5 12% | 335.6 -24% | 399.6 -10% | 317 ? -28% | 504 ? 14% |
| Write Seq Q32T1 (MB/s) | 1052 | 1770 68% | 1017 -3% | 2983 184% | 821 -22% | 885 ? -16% | 4671 ? 344% |
| Read Seq Q32T1 (MB/s) | 2171 | 1715 -21% | 1530 -30% | 3535 63% | 2030 -6% | 1803 ? -17% | 5833 ? 169% |
| Write 4K Q8T8 (MB/s) | 899 | 306 ? | 899 ? | ||||
| Read 4K Q8T8 (MB/s) | 630 | 698 ? | 1277 ? | ||||
| AS SSD | 9% | -58% | 58% | -43% | -12% | 84% | |
| Seq Read (MB/s) | 1370 | 1703 24% | 1342 -2% | 2792 104% | 1387 1% | 1323 ? -3% | 4499 ? 228% |
| Seq Write (MB/s) | 1019 | 1373 35% | 768 -25% | 2564 152% | 504 -51% | 697 ? -32% | 2974 ? 192% |
| 4K Read (MB/s) | 50.8 | 56.8 12% | 48.56 -4% | 47.14 -7% | 42.35 -17% | 40.4 ? -20% | 59.5 ? 17% |
| 4K Write (MB/s) | 111.2 | 164.4 48% | 127.7 15% | 89.5 -20% | 120 8% | 100.8 ? -9% | 168.1 ? 51% |
| 4K-64 Read (MB/s) | 770 | 584 -24% | 644 -16% | 1159 51% | 497.4 -35% | 686 ? -11% | 862 ? 12% |
| 4K-64 Write (MB/s) | 713 | 783 10% | 317.3 -55% | 1468 106% | 354.9 -50% | 660 ? -7% | 1701 ? 139% |
| Access Time Read * (ms) | 0.044 | 0.417 | 0.069 | 0.055 | 0.06071 ? | 0.06605 ? | |
| Access Time Write * (ms) | 0.034 | 0.038 -12% | 0.174 -412% | 0.043 -26% | 0.093 -174% | 0.037 ? -9% | 0.05162 ? -52% |
| Score Read (Points) | 958 | 811 -15% | 827 -14% | 1486 55% | 678 -29% | 858 ? -10% | 1370 ? 43% |
| Score Write (Points) | 926 | 1085 17% | 522 -44% | 1814 96% | 525 -43% | 830 ? -10% | 2166 ? 134% |
| Score Total (Points) | 2370 | 2313 -2% | 1757 -26% | 4054 71% | 1520 -36% | 2107 ? -11% | 4175 ? 76% |
| Media totale (Programma / Settaggio) | 25% /
23% | -35% /
-37% | 59% /
59% | -28% /
-30% | -15% /
-15% | 104% /
101% |
* ... Meglio usare valori piccoli

Continuous load read: DiskSpd Read Loop, Queue Depth 8
| 3DMark 11 Performance | 3001 punti | |
| 3DMark Fire Strike Score | 1820 punti | |
Aiuto | ||
| basso | medio | alto | ultra | |
|---|---|---|---|---|
| Dota 2 Reborn (2015) | 69.3 | 41.6 | 19.6 | |
| X-Plane 11.11 (2018) | 26.3 | 14.2 | 13.2 |
Rumorosità
| Idle |
| 31.2 / 31.2 / 31.2 dB(A) |
| Sotto carico |
| 33.2 / 34.9 dB(A) |
 | ||
30 dB silenzioso 40 dB(A) udibile 50 dB(A) rumoroso |
||
min: | ||
(+) La temperatura massima sul lato superiore è di 34.7 °C / 94 F, rispetto alla media di 35.9 °C / 97 F, che varia da 21.4 a 59 °C per questa classe Subnotebook.
(+) Il lato inferiore si riscalda fino ad un massimo di 36.4 °C / 98 F, rispetto alla media di 39.2 °C / 103 F
(+) In idle, la temperatura media del lato superiore è di 25.9 °C / 79 F, rispetto alla media deld ispositivo di 30.8 °C / 87 F.
(+) I poggiapolsi e il touchpad sono piu' freddi della temperatura della pelle con un massimo di 29.2 °C / 84.6 F e sono quindi freddi al tatto.
(±) La temperatura media della zona del palmo della mano di dispositivi simili e'stata di 28.2 °C / 82.8 F (-1 °C / -1.8 F).
Acer Swift 3 SF313-52-52AS analisi audio
(±) | potenza degli altiparlanti media ma buona (77.1 dB)
Bassi 100 - 315 Hz
(-) | quasi nessun basso - in media 26.7% inferiori alla media
(±) | la linearità dei bassi è media (7.8% delta rispetto alla precedente frequenza)
Medi 400 - 2000 Hz
(±) | medi ridotti - circa 6.1% inferiori alla media
(±) | linearità dei medi adeguata (10.8% delta rispetto alla precedente frequenza)
Alti 2 - 16 kHz
(±) | alti elevati - circa 11% superiori alla media
(+) | alti lineari (3.9% delta rispetto alla precedente frequenza)
Nel complesso 100 - 16.000 Hz
(-) | suono nel complesso non lineare (32.2% di differenza rispetto alla media
Rispetto alla stessa classe
» 94% di tutti i dispositivi testati in questa classe è stato migliore, 2% simile, 4% peggiore
» Il migliore ha avuto un delta di 5%, medio di 18%, peggiore di 53%
Rispetto a tutti i dispositivi testati
» 91% di tutti i dispositivi testati in questa classe è stato migliore, 2% similare, 7% peggiore
» Il migliore ha avuto un delta di 4%, medio di 24%, peggiore di 134%
Apple MacBook 12 (Early 2016) 1.1 GHz analisi audio
(+) | gli altoparlanti sono relativamente potenti (83.6 dB)
Bassi 100 - 315 Hz
(±) | bassi ridotti - in media 11.3% inferiori alla media
(±) | la linearità dei bassi è media (14.2% delta rispetto alla precedente frequenza)
Medi 400 - 2000 Hz
(+) | medi bilanciati - solo only 2.4% rispetto alla media
(+) | medi lineari (5.5% delta rispetto alla precedente frequenza)
Alti 2 - 16 kHz
(+) | Alti bilanciati - appena 2% dalla media
(+) | alti lineari (4.5% delta rispetto alla precedente frequenza)
Nel complesso 100 - 16.000 Hz
(+) | suono nel complesso lineare (10.2% differenza dalla media)
Rispetto alla stessa classe
» 7% di tutti i dispositivi testati in questa classe è stato migliore, 2% simile, 91% peggiore
» Il migliore ha avuto un delta di 5%, medio di 18%, peggiore di 53%
Rispetto a tutti i dispositivi testati
» 5% di tutti i dispositivi testati in questa classe è stato migliore, 1% similare, 94% peggiore
» Il migliore ha avuto un delta di 4%, medio di 24%, peggiore di 134%
| Off / Standby | |
| Idle | |
| Sotto carico |
|
Leggenda:
min: | |
Pro
Contro
Giudizio Complessivo - Buon computer portatile Acer con qualche piccolo punto debole
Dopo il test, l'Acer Swift 3 SF313 con l'Intel Core i5 lascia un'impressione simile all'Acer Swift 3 SF313 versione completa versione completa che abbiamo esaminato prima. Le prestazioni sono buone, e anche il display e la costruzione del case sono convincenti. Ci piace molto anche l'aumento delle prestazioni WLAN, dato che le prestazioni del modello più potente erano ancora molto indietro rispetto alle capacità dell'hardware. Anche la durata della batteria merita una menzione, in quanto aumenta di circa mezz'ora con il Core i5.
Gli acquirenti dell'Acer Swift 3 SF313-52-52AS devono convivere con prestazioni un po' più basse, ma pagano meno in cambio e ottengono una maggiore durata della batteria.
Tuttavia, rimane la sensazione che ci sarebbe dovuto essere di più all'interno. Il display nel formato 3:2 fa certamente appello ad alcuni potenziali acquirenti con la sua alta risoluzione, ma avrebbe anche fornito valori altrettanto buoni con una superficie opaca. Anche le prestazioni della CPU rimangono un po' al di sotto delle aspettative, ma possono garantire un funzionamento regolare del sistema in combinazione con gli altri componenti. Gli utenti che stanno considerando un acquisto e non dipendono dalle prestazioni del Core i7 otterranno quindi anche un buon portatile con l'Acer Swift 3 SF313-52-52AS, ma ad un prezzo significativamente più basso.
Acer Swift 3 SF313-52-52AS
- 06/01/2020 v7 (old)
Mike Wobker
Price comparison
