Recensione breve del Portatile Lenovo X62


| SD Card Reader | |
| average JPG Copy Test (av. of 3 runs) | |
| Dell Latitude 7280 | |
| Lenovo ThinkPad X270-20HMS00T00 | |
| Lenovo ThinkPad 13-20J2S00G00 | |
| Lenovo ThinkPad X62 | |
| maximum AS SSD Seq Read Test (1GB) | |
| Dell Latitude 7280 | |
| Lenovo ThinkPad X270-20HMS00T00 | |
| Lenovo ThinkPad 13-20J2S00G00 | |
| Lenovo ThinkPad X62 | |
| Networking | |
| iperf3 transmit AX12 | |
| Dell Latitude 7280 | |
| Lenovo ThinkPad X270-20HMS00T00 | |
| Lenovo ThinkPad X62 | |
| Lenovo ThinkPad 13-20J2S00G00 | |
| iperf3 receive AX12 | |
| Lenovo ThinkPad X270-20HMS00T00 | |
| Lenovo ThinkPad 13-20J2S00G00 | |
| Dell Latitude 7280 | |
| Lenovo ThinkPad X62 | |
| |||||||||||||||||||||||||
Distribuzione della luminosità: 88 %
Contrasto: 306:1 (Nero: 0.55 cd/m²)
ΔE ColorChecker Calman: 6.1 | ∀{0.5-29.43 Ø4.71}
ΔE Greyscale Calman: 0.7 | ∀{0.09-98 Ø4.96}
54.2% sRGB (Argyll 1.6.3 3D)
35% AdobeRGB 1998 (Argyll 1.6.3 3D)
37.95% AdobeRGB 1998 (Argyll 3D)
54.3% sRGB (Argyll 3D)
36.63% Display P3 (Argyll 3D)
Gamma: 2.19
| Lenovo ThinkPad X62 IPS Flexview HV121P01-100, , 12.1", 1400x1050 | Dell XPS 13-9343 SHP1421, IPS, 13.3", 3200x1800 | Lenovo ThinkPad X270-20HMS00T00 Innolux N125HCE-GN1, IPS LED, 12.5", 1920x1080 | Dell Latitude 7280 AUO236D , IPS, 12.5", 1920x1080 | Lenovo ThinkPad 13-20J2S00G00 LP133WF2-SPL78, IPS, LED, 13.3", 1920x1080 | Apple MacBook 12 (Early 2016) 1.1 GHz APPA027, IPS, 12", 2304x1440 | |
|---|---|---|---|---|---|---|
| Display | 88% | 22% | 21% | 10% | 79% | |
| Display P3 Coverage (%) | 36.63 | 72 97% | 44.6 22% 44.6 22% | 44.41 21% | 40.16 10% | 66.8 82% |
| sRGB Coverage (%) | 54.3 | 96 77% | 65.9 21% 65.9 21% | 65.4 20% | 60 10% | 95.4 76% |
| AdobeRGB 1998 Coverage (%) | 37.95 | 71.6 89% | 46.11 22% 46.11 22% | 45.9 21% | 41.54 9% | 68 79% |
| Response Times | 19% | 24% | 24% | 18% | ||
| Response Time Grey 50% / Grey 80% * (ms) | 59.6 ? | 40.8 ? 32% | 32.4 ? 46% | 43.6 ? 27% | 41.2 ? 31% | |
| Response Time Black / White * (ms) | 32 ? | 30.4 ? 5% | 31.2 ? 2% | 25.2 ? 21% | 30.4 ? 5% | |
| PWM Frequency (Hz) | 26040 ? | 30860 ? | ||||
| Screen | 51% | -19% | -12% | 3% | 69% | |
| Brightness middle (cd/m²) | 168.3 | 367.3 118% | 283 68% | 310.4 84% | 306 82% | 387 130% |
| Brightness (cd/m²) | 157 | 372 137% | 281 79% | 301 92% | 307 96% | 358 128% |
| Brightness Distribution (%) | 88 | 77 -12% | 94 7% | 88 0% | 89 1% | 88 0% |
| Black Level * (cd/m²) | 0.55 | 0.178 68% | 0.25 55% | 0.32 42% | 0.36 35% | 0.47 15% |
| Contrast (:1) | 306 | 2063 574% | 1132 270% | 970 217% | 850 178% | 823 169% |
| Colorchecker dE 2000 * | 6.1 | 5.92 3% | 6.1 -0% | 5.9 3% | 5.1 16% | 1.6 74% |
| Colorchecker dE 2000 max. * | 30.5 | 15.4 50% | 21 31% | 13.3 56% | 4 87% | |
| Greyscale dE 2000 * | 0.7 | 4.79 -584% | 6 -757% | 5.1 -629% | 3.9 -457% | 1 -43% |
| Gamma | 2.19 100% | 2.42 91% | 2.05 107% | 2.33 94% | 2.17 101% | 2.26 97% |
| Color Space (Percent of AdobeRGB 1998) (%) | 35 | 63 80% | 42.26 21% | 42 20% | 38.24 9% | 61.6 76% |
| Color Space (Percent of sRGB) (%) | 54.2 | 96.4 78% | 65.43 21% | 65 20% | 59.75 10% | 82.2 52% |
| CCT | 7013 93% | 6832 95% | 6816 95% | 6829 95% | 6680 97% | |
| Media totale (Programma / Settaggio) | 70% /
60% | 7% /
-1% | 11% /
-1% | 12% /
7% | 55% /
64% |
* ... Meglio usare valori piccoli
Tempi di risposta del Display
| ↔ Tempi di risposta dal Nero al Bianco | ||
|---|---|---|
| 32 ms ... aumenta ↗ e diminuisce ↘ combinato | ↗ 18 ms Incremento | 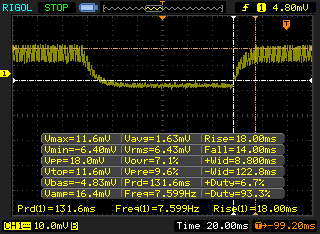 |
| ↘ 14 ms Calo | ||
| Lo schermo mostra tempi di risposta lenti nei nostri tests e sarà insoddisfacente per i gamers. In confronto, tutti i dispositivi di test variano da 0.1 (minimo) a 240 (massimo) ms. » 86 % di tutti i dispositivi è migliore. Questo significa che i tempi di risposta rilevati sono peggiori rispetto alla media di tutti i dispositivi testati (19.8 ms). | ||
| ↔ Tempo di risposta dal 50% Grigio all'80% Grigio | ||
| 59.6 ms ... aumenta ↗ e diminuisce ↘ combinato | ↗ 16.8 ms Incremento | 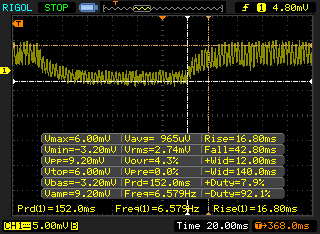 |
| ↘ 42.8 ms Calo | ||
| Lo schermo mostra tempi di risposta lenti nei nostri tests e sarà insoddisfacente per i gamers. In confronto, tutti i dispositivi di test variano da 0.165 (minimo) a 636 (massimo) ms. » 96 % di tutti i dispositivi è migliore. Questo significa che i tempi di risposta rilevati sono peggiori rispetto alla media di tutti i dispositivi testati (31 ms). | ||
Sfarfallio dello schermo / PWM (Pulse-Width Modulation)
| flickering dello schermo / PWM non rilevato | ≤ 100 % settaggio luminosita' | 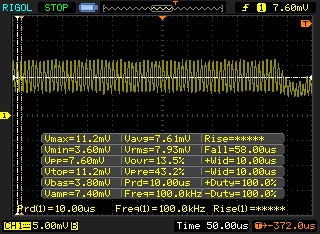 | |
| ≤ 168.3 luminosita' cd/m² | |||
In confronto: 52 % di tutti i dispositivi testati non utilizza PWM per ridurre la luminosita' del display. Se è rilevato PWM, una media di 7757 (minimo: 5 - massimo: 343500) Hz è stata rilevata. | |||
| Cinebench R10 | |
| Rendering Multiple CPUs 32Bit | |
| Lenovo ThinkPad 13-20J2S00G00 | |
| Lenovo ThinkPad X62 | |
| Apple MacBook 12 (Early 2016) 1.1 GHz | |
| Dell XPS 13-9343 | |
| Rendering Single 32Bit | |
| Lenovo ThinkPad 13-20J2S00G00 | |
| Lenovo ThinkPad X62 | |
| Apple MacBook 12 (Early 2016) 1.1 GHz | |
| Dell XPS 13-9343 | |
| wPrime 2.10 - 1024m | |
| Apple MacBook 12 (Early 2016) 1.1 GHz | |
| Dell XPS 13-9343 | |
| Dell Latitude 7280 | |
* ... Meglio usare valori piccoli
| PCMark 7 Score | 4729 punti | |
| PCMark 8 Home Score Accelerated v2 | 2928 punti | |
| PCMark 8 Creative Score Accelerated v2 | 3349 punti | |
| PCMark 8 Work Score Accelerated v2 | 3748 punti | |
Aiuto | ||
| Lenovo ThinkPad X62 | Dell XPS 13-9343 Lite-On IT L8T-256L9G | Apple MacBook 12 (Early 2016) 1.3 GHz Apple SSD AP0256 | Lenovo ThinkPad X270-20HMS00T00 Toshiba NVMe THNSF5512GPUK | Dell Latitude 7280 SanDisk X400 M.2 2280 256GB | Lenovo ThinkPad 13-20J2S00G00 Toshiba NVMe THNSF5512GPUK | |
|---|---|---|---|---|---|---|
| CrystalDiskMark 3.0 | 129% | 134% | 258% | 100% | 236% | |
| Read Seq (MB/s) | 512 | 489.6 -4% | 821 60% | 1190 132% | 470.8 -8% | 1143 123% |
| Write Seq (MB/s) | 154.4 | 424.2 175% | 660 327% | 985 538% | 477.4 209% | 653 323% |
| Read 512 (MB/s) | 462.1 | 371.9 -20% | 672 45% | 858 86% | 370.1 -20% | 629 36% |
| Write 512 (MB/s) | 144.6 | 395.5 174% | 737 410% | 528 265% | 323.2 124% | 518 258% |
| Read 4k (MB/s) | 11.43 | 34.76 204% | 16.28 42% | 35.27 209% | 30.23 164% | 31.96 180% |
| Write 4k (MB/s) | 34.1 | 79.3 133% | 24.87 -27% | 124.5 265% | 59.5 74% | 138.5 306% |
| Read 4k QD32 (MB/s) | 107.1 | 354 231% | 271.9 154% | 495.3 362% | 344.4 222% | 578 440% |
| Write 4k QD32 (MB/s) | 137.7 | 326.3 137% | 223.9 63% | 418.3 204% | 183 33% | 443.1 222% |

| 3DMark | |
| 1280x720 Cloud Gate Standard Graphics | |
| Dell Latitude 7280 | |
| Lenovo ThinkPad X62 | |
| Apple MacBook 12 (Early 2016) 1.3 GHz | |
| Lenovo ThinkPad X270-20HMS00T00 | |
| 1920x1080 Fire Strike Graphics | |
| Dell Latitude 7280 | |
| Apple MacBook 12 (Early 2016) 1.3 GHz | |
| Lenovo ThinkPad X270-20HMS00T00 | |
| Lenovo ThinkPad X62 | |
| 3DMark 06 Standard Score | 7382 punti | |
| 3DMark 11 Performance | 1220 punti | |
| 3DMark Cloud Gate Standard Score | 4912 punti | |
| 3DMark Fire Strike Score | 729 punti | |
Aiuto | ||
Rumorosità
| Idle |
| 31.8 / 31.8 / 31.8 dB(A) |
| Sotto carico |
| 34.1 / 40.8 dB(A) |
 | ||
30 dB silenzioso 40 dB(A) udibile 50 dB(A) rumoroso |
||
min: | ||
| Lenovo ThinkPad X62 HD Graphics 5500, 5200U | Dell XPS 13-9343 HD Graphics 5500, 5200U, Lite-On IT L8T-256L9G | Lenovo ThinkPad X270-20HMS00T00 HD Graphics 620, i5-7200U, Toshiba NVMe THNSF5512GPUK | Dell Latitude 7280 HD Graphics 620, i7-7600U, SanDisk X400 M.2 2280 256GB | Lenovo ThinkPad 13-20J2S00G00 HD Graphics 620, i7-7500U, Toshiba NVMe THNSF5512GPUK | |
|---|---|---|---|---|---|
| Noise | -1% | 5% | 8% | 9% | |
| off /ambiente * (dB) | 28.8 | 29 -1% | 29.4 -2% | 29.1 -1% | |
| Idle Minimum * (dB) | 31.8 | 30.2 5% | 29 9% | 29.4 8% | 29.1 8% |
| Idle Average * (dB) | 31.8 | 30.3 5% | 29 9% | 29.4 8% | 29.1 8% |
| Idle Maximum * (dB) | 31.8 | 30.4 4% | 30.4 4% | 30 6% | 29.1 8% |
| Load Average * (dB) | 34.1 | 34.4 -1% | 34.1 -0% | 30.6 10% | 31.9 6% |
| Witcher 3 ultra * (dB) | 37.45 | ||||
| Load Maximum * (dB) | 40.8 | 48 -18% | 37.6 8% | 32.7 20% | 31.9 22% |
* ... Meglio usare valori piccoli
(+) La temperatura massima sul lato superiore è di 39.4 °C / 103 F, rispetto alla media di 37.5 °C / 100 F, che varia da 24.7 a 57 °C per questa classe .
(±) Il lato inferiore si riscalda fino ad un massimo di 44.2 °C / 112 F, rispetto alla media di 48.1 °C / 119 F
(+) In idle, la temperatura media del lato superiore è di 29.5 °C / 85 F, rispetto alla media deld ispositivo di 31.9 °C / 89 F.
(±) I poggiapolsi e il touchpad possono diventare molto caldi al tatto con un massimo di 39.4 °C / 102.9 F.
(-) La temperatura media della zona del palmo della mano di dispositivi simili e'stata di 29.5 °C / 85.1 F (-9.9 °C / -17.8 F).
Lenovo ThinkPad X62 analisi audio
(-) | altoparlanti non molto potenti (52 dB)
Bassi 100 - 315 Hz
(-) | quasi nessun basso - in media 26.8% inferiori alla media
(+) | bassi in lineaa (4.3% delta rispetto alla precedente frequenza)
Medi 400 - 2000 Hz
(±) | medi elevati - circa 7.9% superiore alla media
(-) | medi non in linea (16% delta rispetto alla precedente frequenza)
Alti 2 - 16 kHz
(±) | alti elevati - circa 9.5% superiori alla media
(+) | alti lineari (6.2% delta rispetto alla precedente frequenza)
Nel complesso 100 - 16.000 Hz
(-) | suono nel complesso non lineare (39.9% di differenza rispetto alla media
Rispetto alla stessa classe
» 95% di tutti i dispositivi testati in questa classe è stato migliore, 0% simile, 5% peggiore
» Il migliore ha avuto un delta di 4%, medio di 23%, peggiore di 134%
Rispetto a tutti i dispositivi testati
» 95% di tutti i dispositivi testati in questa classe è stato migliore, 0% similare, 5% peggiore
» Il migliore ha avuto un delta di 4%, medio di 23%, peggiore di 134%
Lenovo ThinkPad X270-20HMS00T00 analisi audio
(-) | altoparlanti non molto potenti (66.8 dB)
Bassi 100 - 315 Hz
(-) | quasi nessun basso - in media 18.8% inferiori alla media
(±) | la linearità dei bassi è media (11.1% delta rispetto alla precedente frequenza)
Medi 400 - 2000 Hz
(+) | medi bilanciati - solo only 1.5% rispetto alla media
(+) | medi lineari (5.4% delta rispetto alla precedente frequenza)
Alti 2 - 16 kHz
(+) | Alti bilanciati - appena 3.1% dalla media
(+) | alti lineari (6.4% delta rispetto alla precedente frequenza)
Nel complesso 100 - 16.000 Hz
(±) | la linearità complessiva del suono è media (22.3% di differenza rispetto alla media
Rispetto alla stessa classe
» 59% di tutti i dispositivi testati in questa classe è stato migliore, 9% simile, 32% peggiore
» Il migliore ha avuto un delta di 7%, medio di 21%, peggiore di 53%
Rispetto a tutti i dispositivi testati
» 65% di tutti i dispositivi testati in questa classe è stato migliore, 6% similare, 29% peggiore
» Il migliore ha avuto un delta di 4%, medio di 23%, peggiore di 134%
| Off / Standby | |
| Idle | |
| Sotto carico |
|
Leggenda:
min: | |
| Lenovo ThinkPad X62 5200U, HD Graphics 5500, , , 1400x1050, 12.1" | Lenovo ThinkPad 13-20J2S00G00 i7-7500U, HD Graphics 620, Toshiba NVMe THNSF5512GPUK, IPS, LED, 1920x1080, 13.3" | Lenovo ThinkPad X220T 4298-2YG 2620M, HD Graphics 3000, Seagate Momentus Thin ST320LT000-9VL142, , 1366x768, 12.5" | |
|---|---|---|---|
| Power Consumption | 32% | -32% | |
| Idle Minimum * (Watt) | 9.09 | 3.16 65% | 7.4 19% |
| Idle Average * (Watt) | 13.9 | 5.9 58% | 12.2 12% |
| Idle Maximum * (Watt) | 13.99 | 6.5 54% | 13.2 6% |
| Load Average * (Watt) | 23.8 | 30.6 -29% | 53.1 -123% |
| Load Maximum * (Watt) | 39.7 | 35.8 10% | 68.3 -72% |
* ... Meglio usare valori piccoli
| Lenovo ThinkPad X62 5200U, HD Graphics 5500, Wh | Dell XPS 13-9343 5200U, HD Graphics 5500, 52 Wh | Apple MacBook 12 (Early 2016) 1.3 GHz 6Y75, HD Graphics 515, 41.4 Wh | Lenovo ThinkPad X270-20HMS00T00 i5-7200U, HD Graphics 620, 46 Wh | Dell Latitude 7280 i7-7600U, HD Graphics 620, 60 Wh | Lenovo ThinkPad 13-20J2S00G00 i7-7500U, HD Graphics 620, 42 Wh | |
|---|---|---|---|---|---|---|
| Autonomia della batteria | 393% | 289% | 445% | 732% | 376% | |
| Reader / Idle (h) | 1.9 | 15.2 700% | 17.1 800% | 25.9 1263% | 15.1 695% | |
| WiFi (h) | 2.3 | 9.7 322% | ||||
| Load (h) | 0.9 | 2.3 156% | 3.5 289% | 1.7 89% | 2.7 200% | 1.4 56% |
| WiFi v1.3 (h) | 9.2 | 5.4 | 11.4 | 7.9 |
Pro
Contro
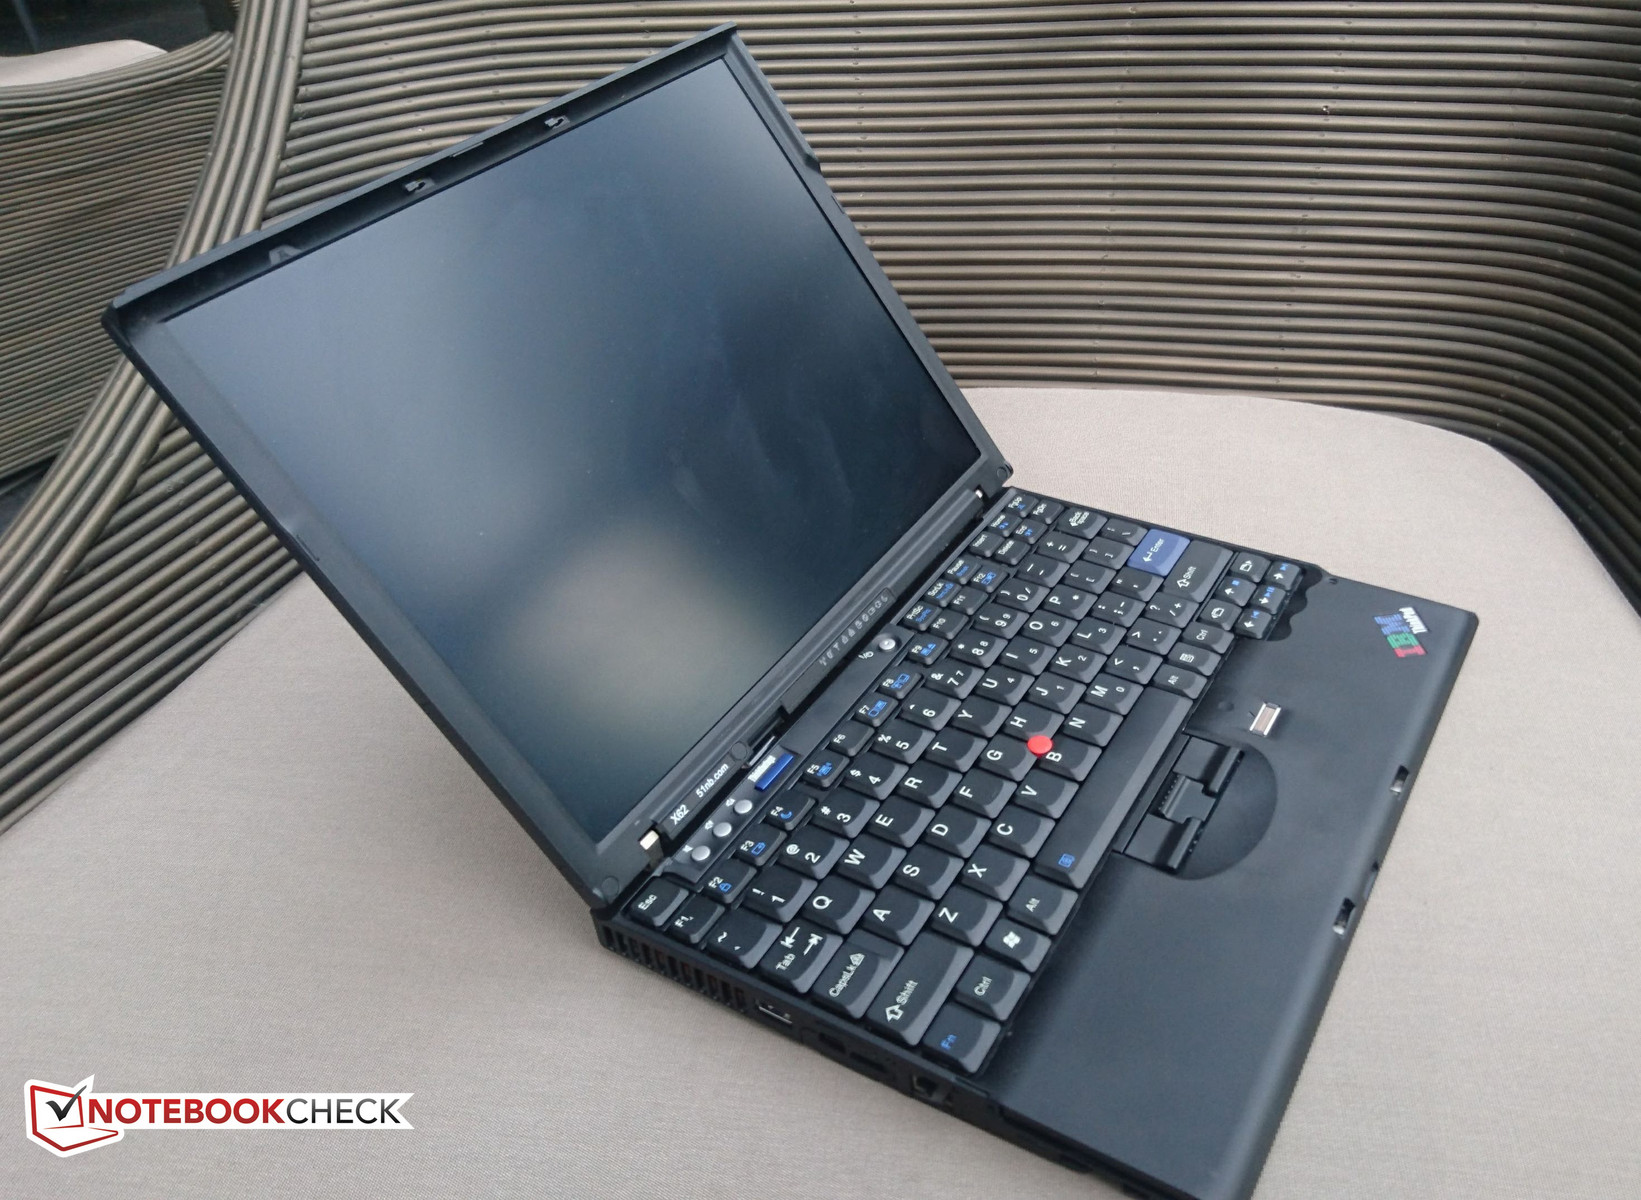
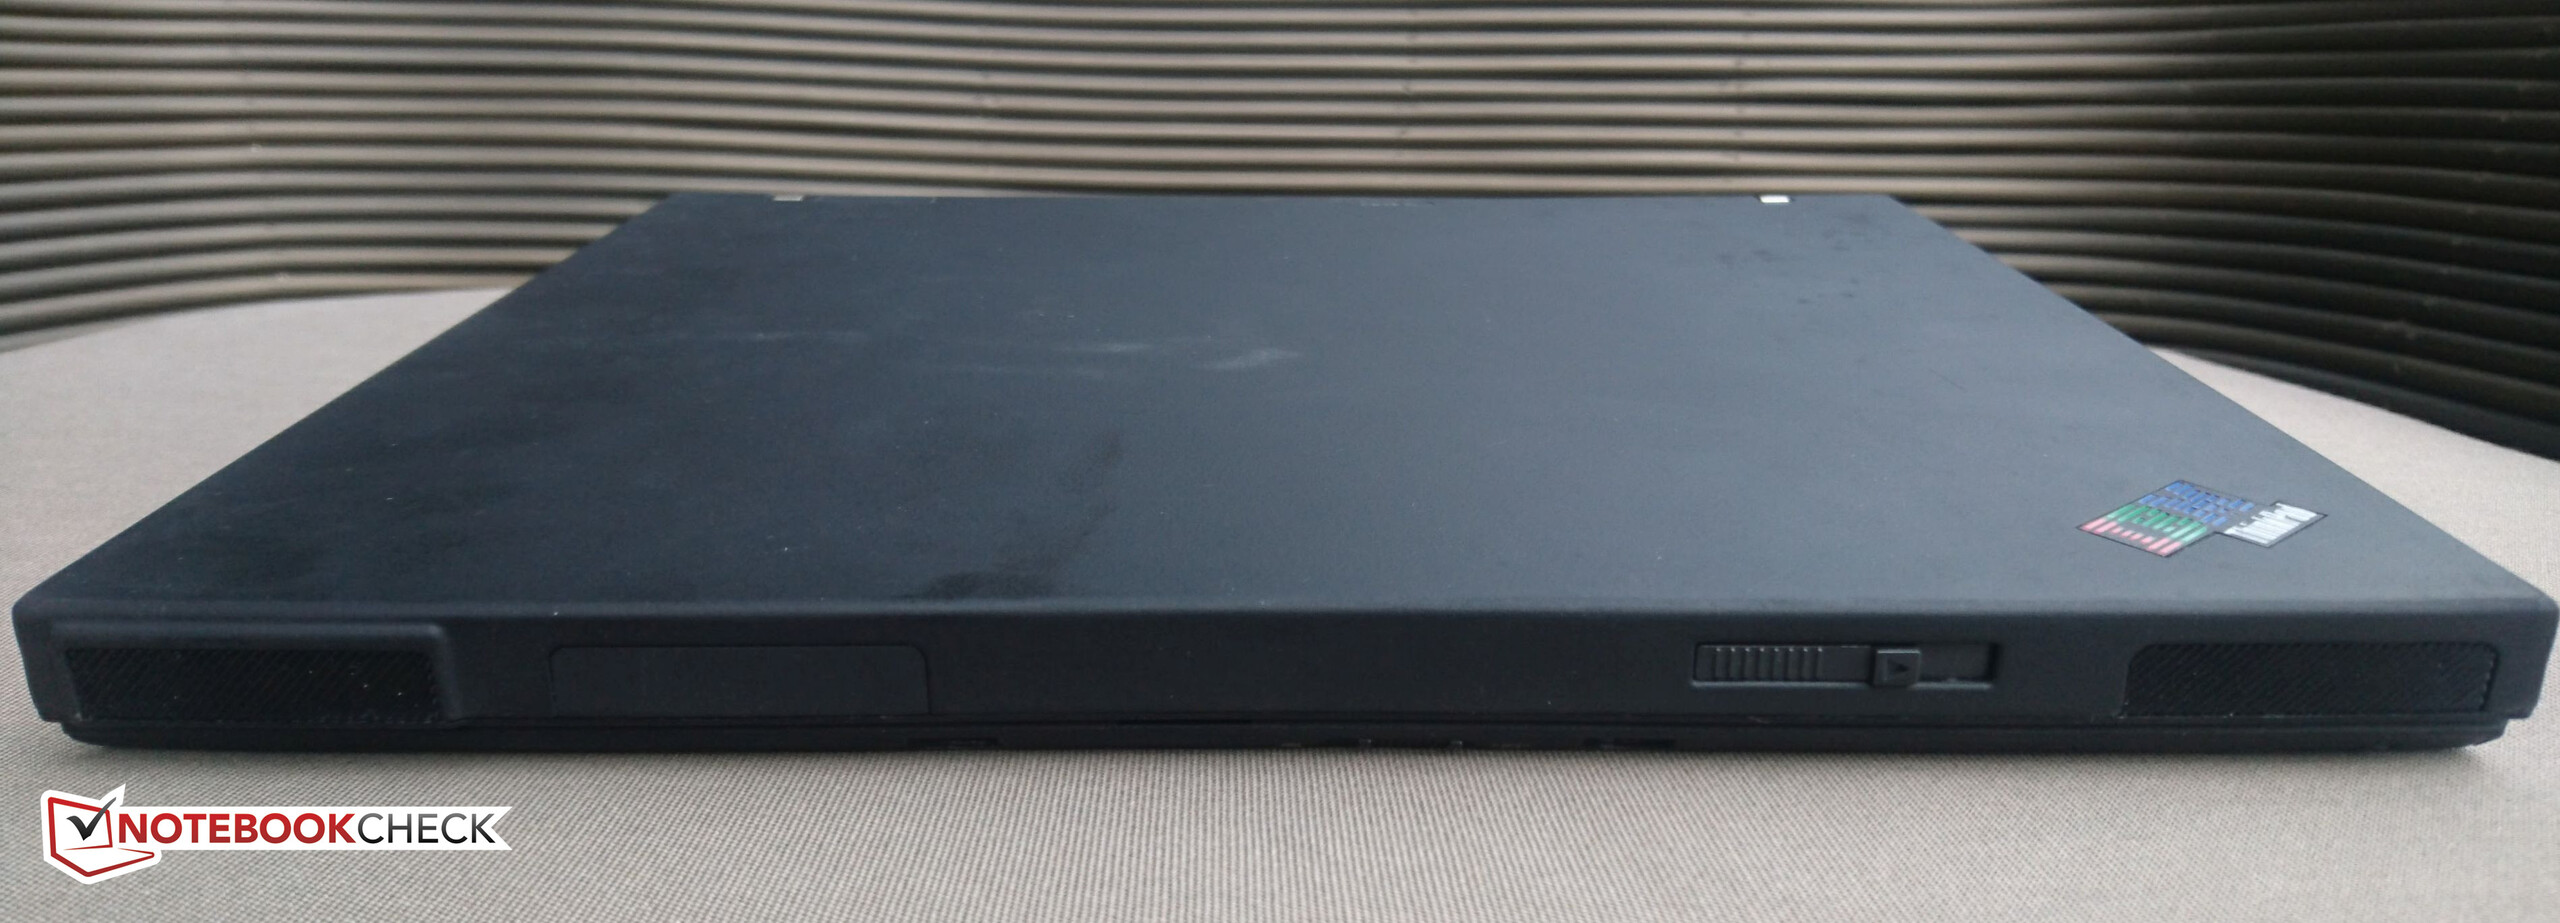
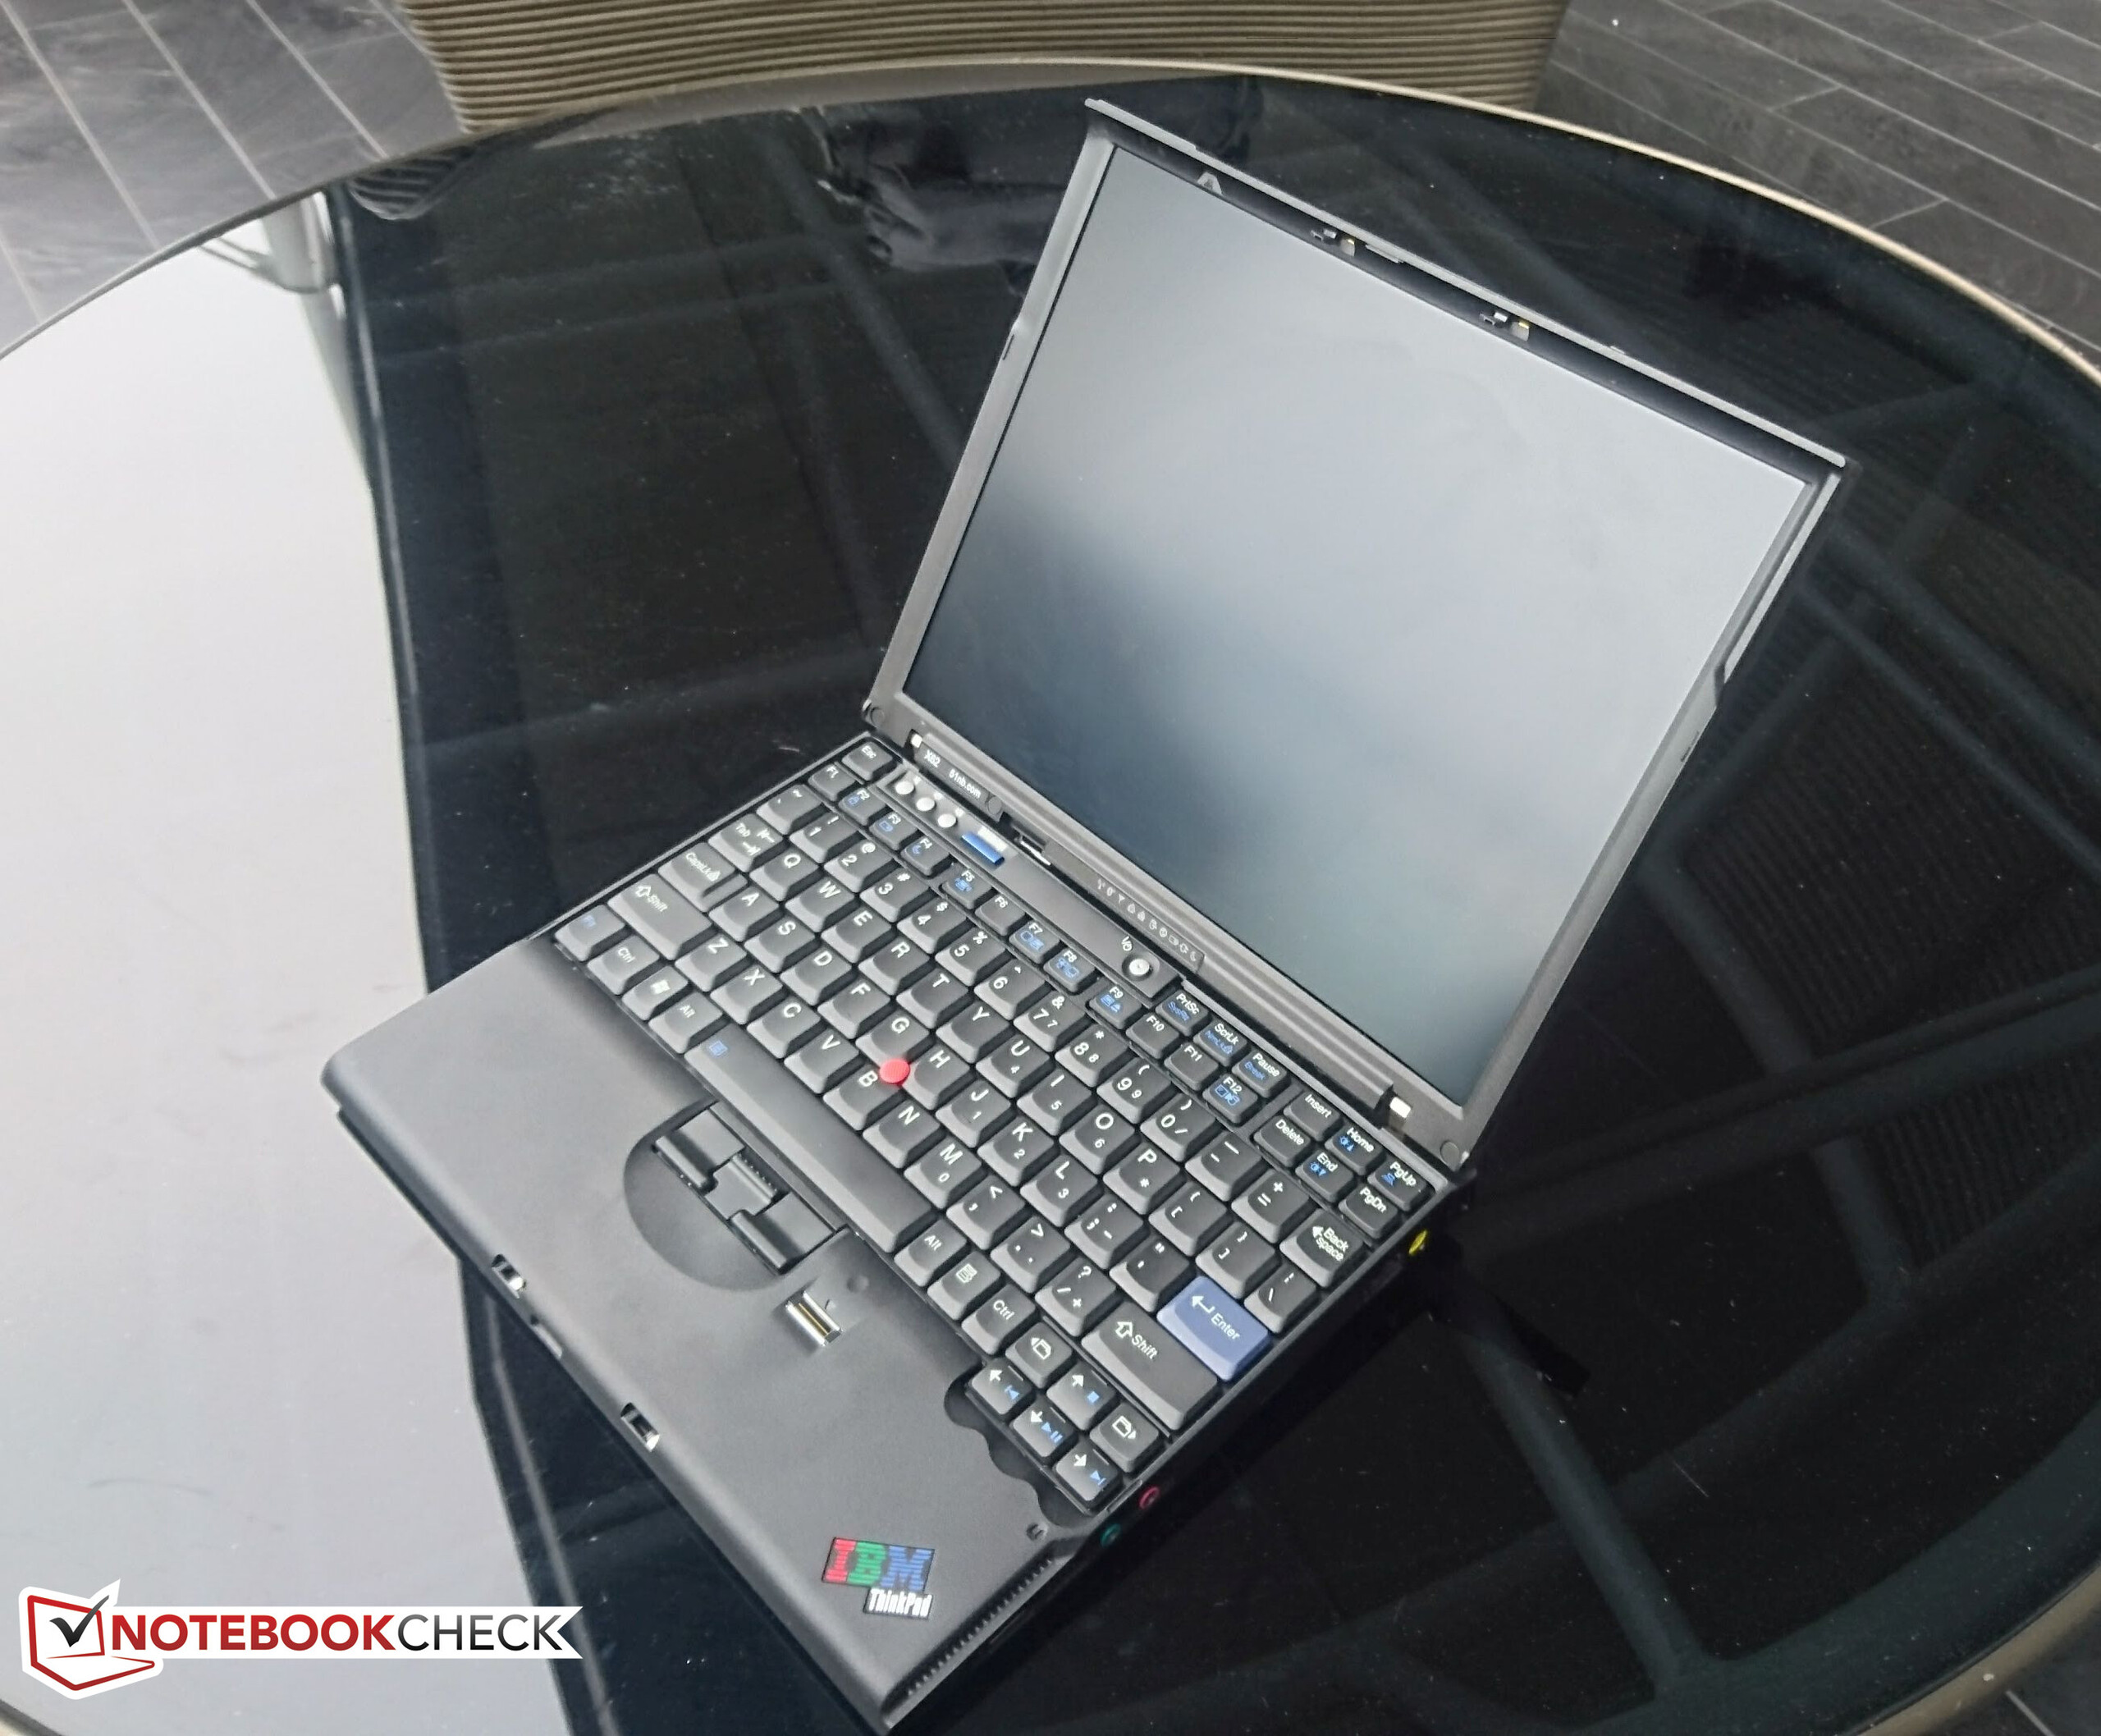
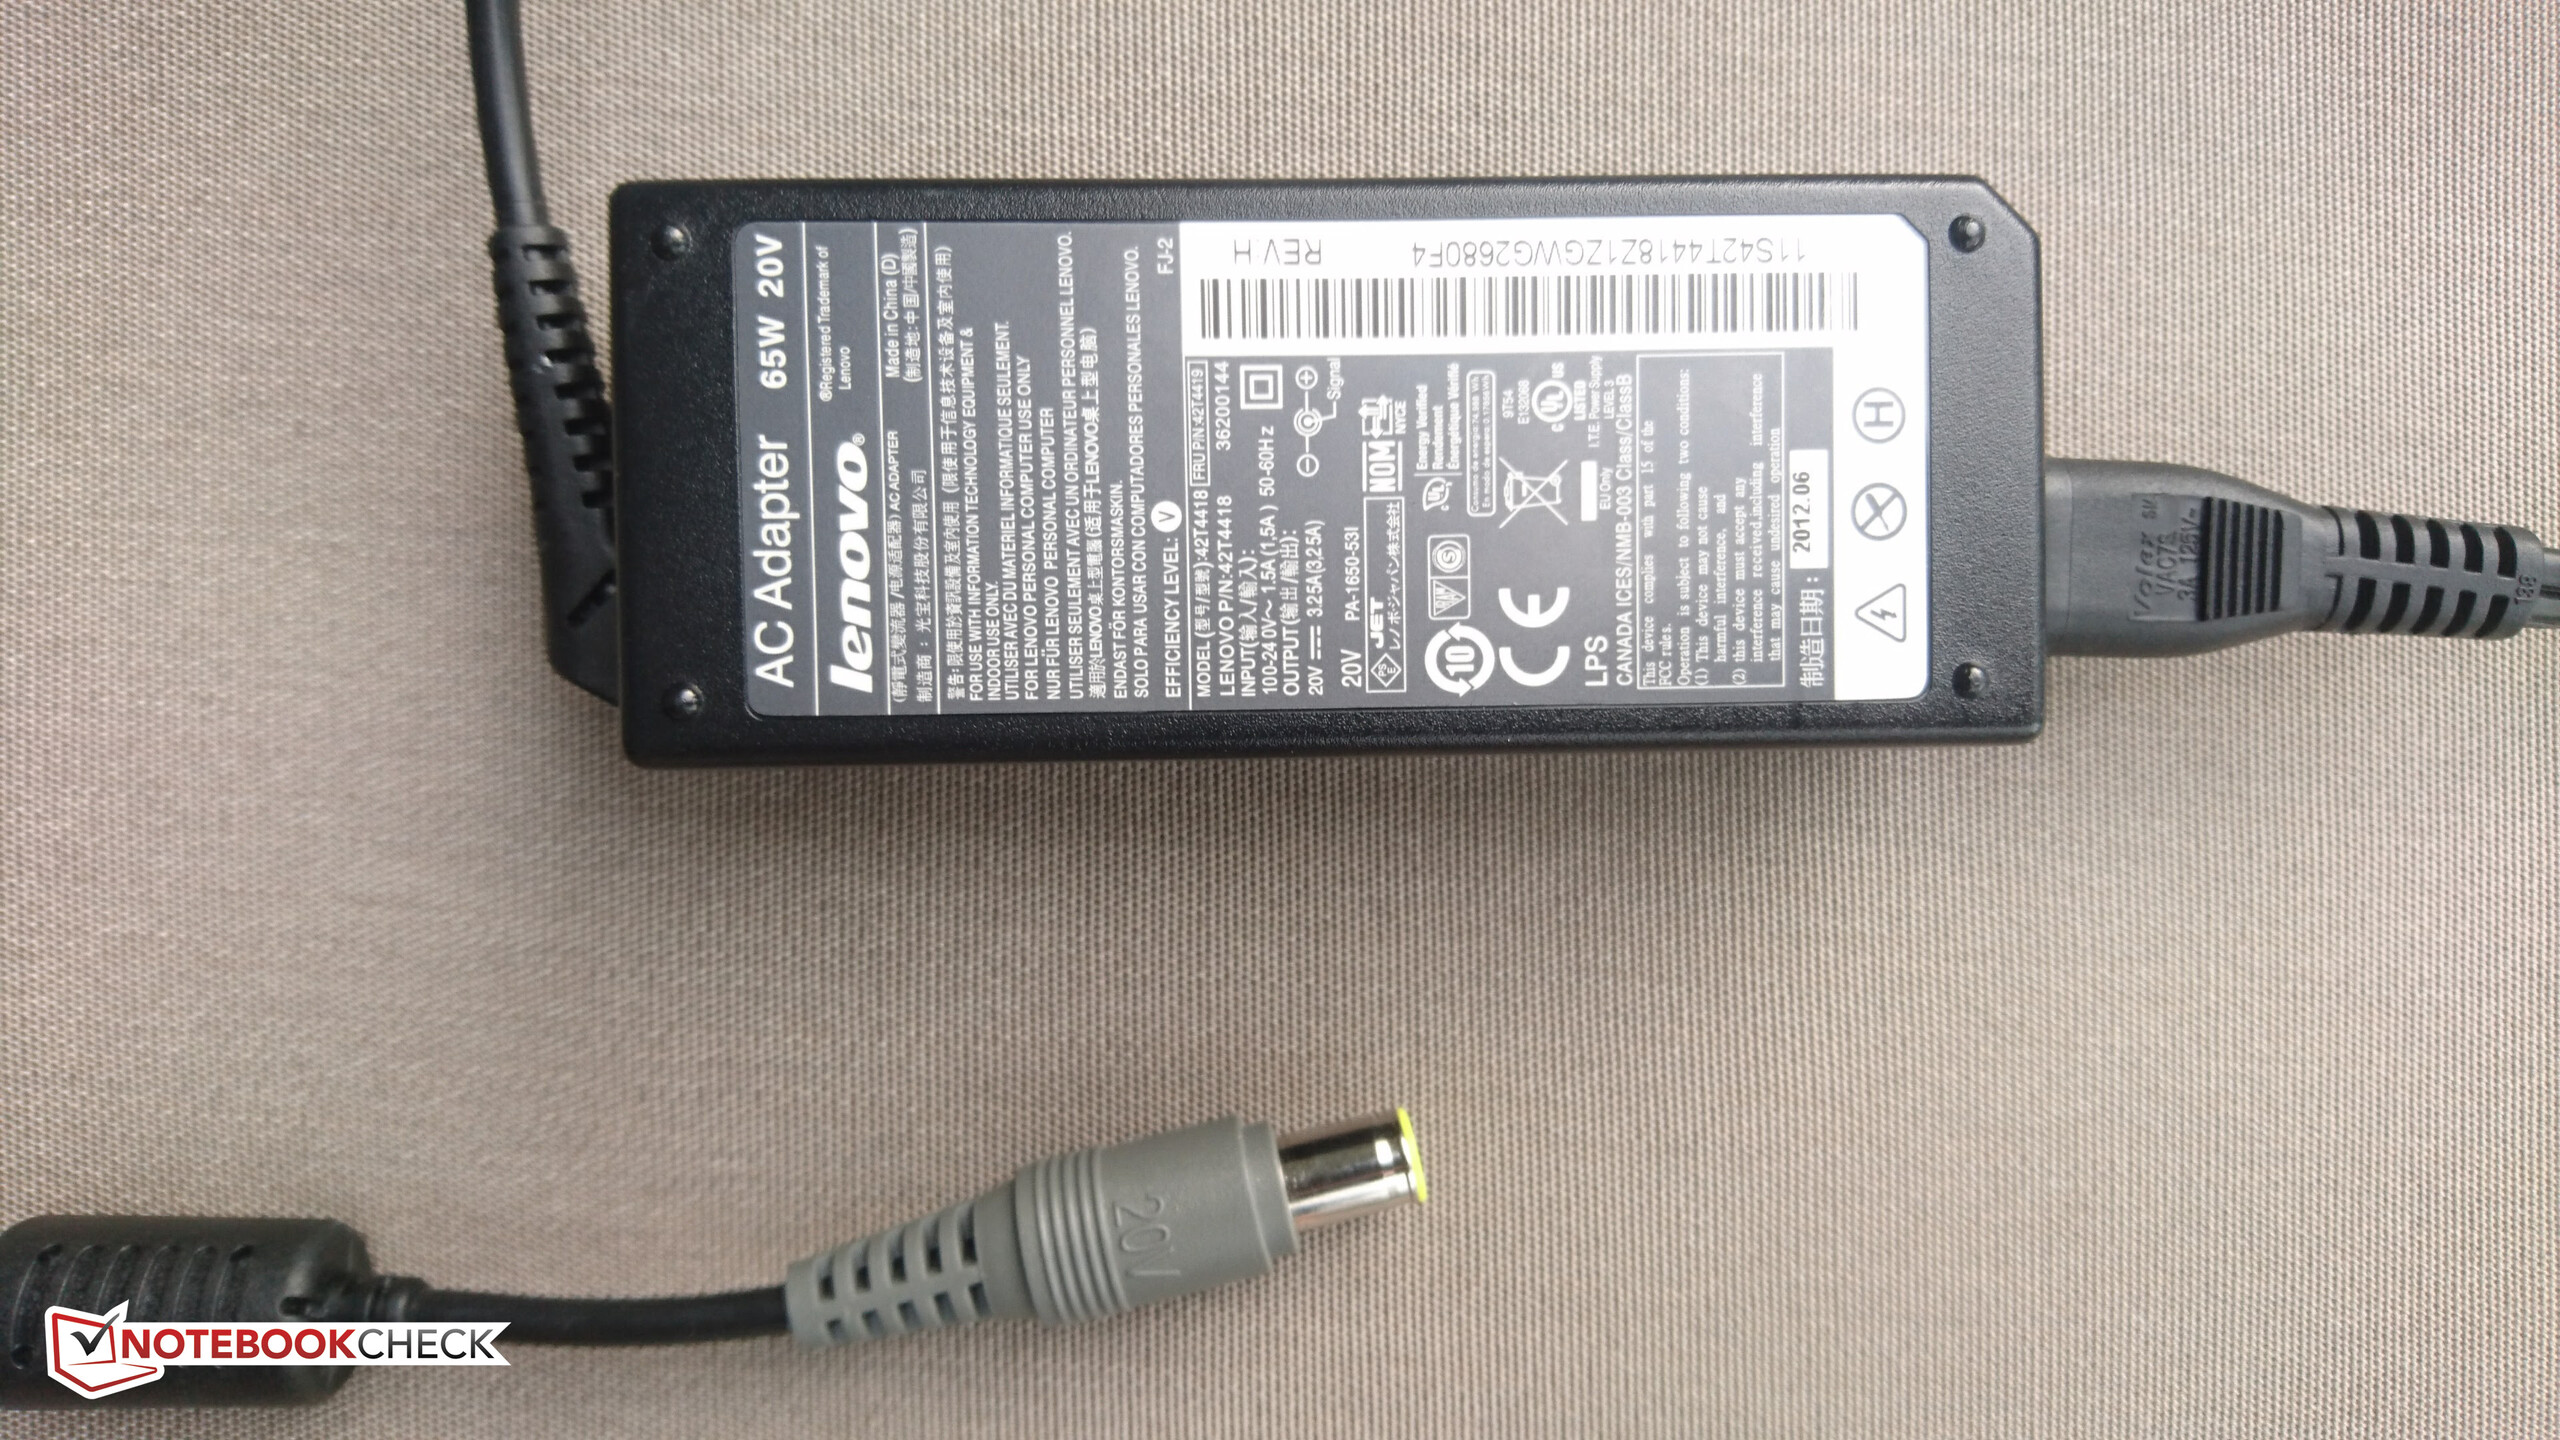
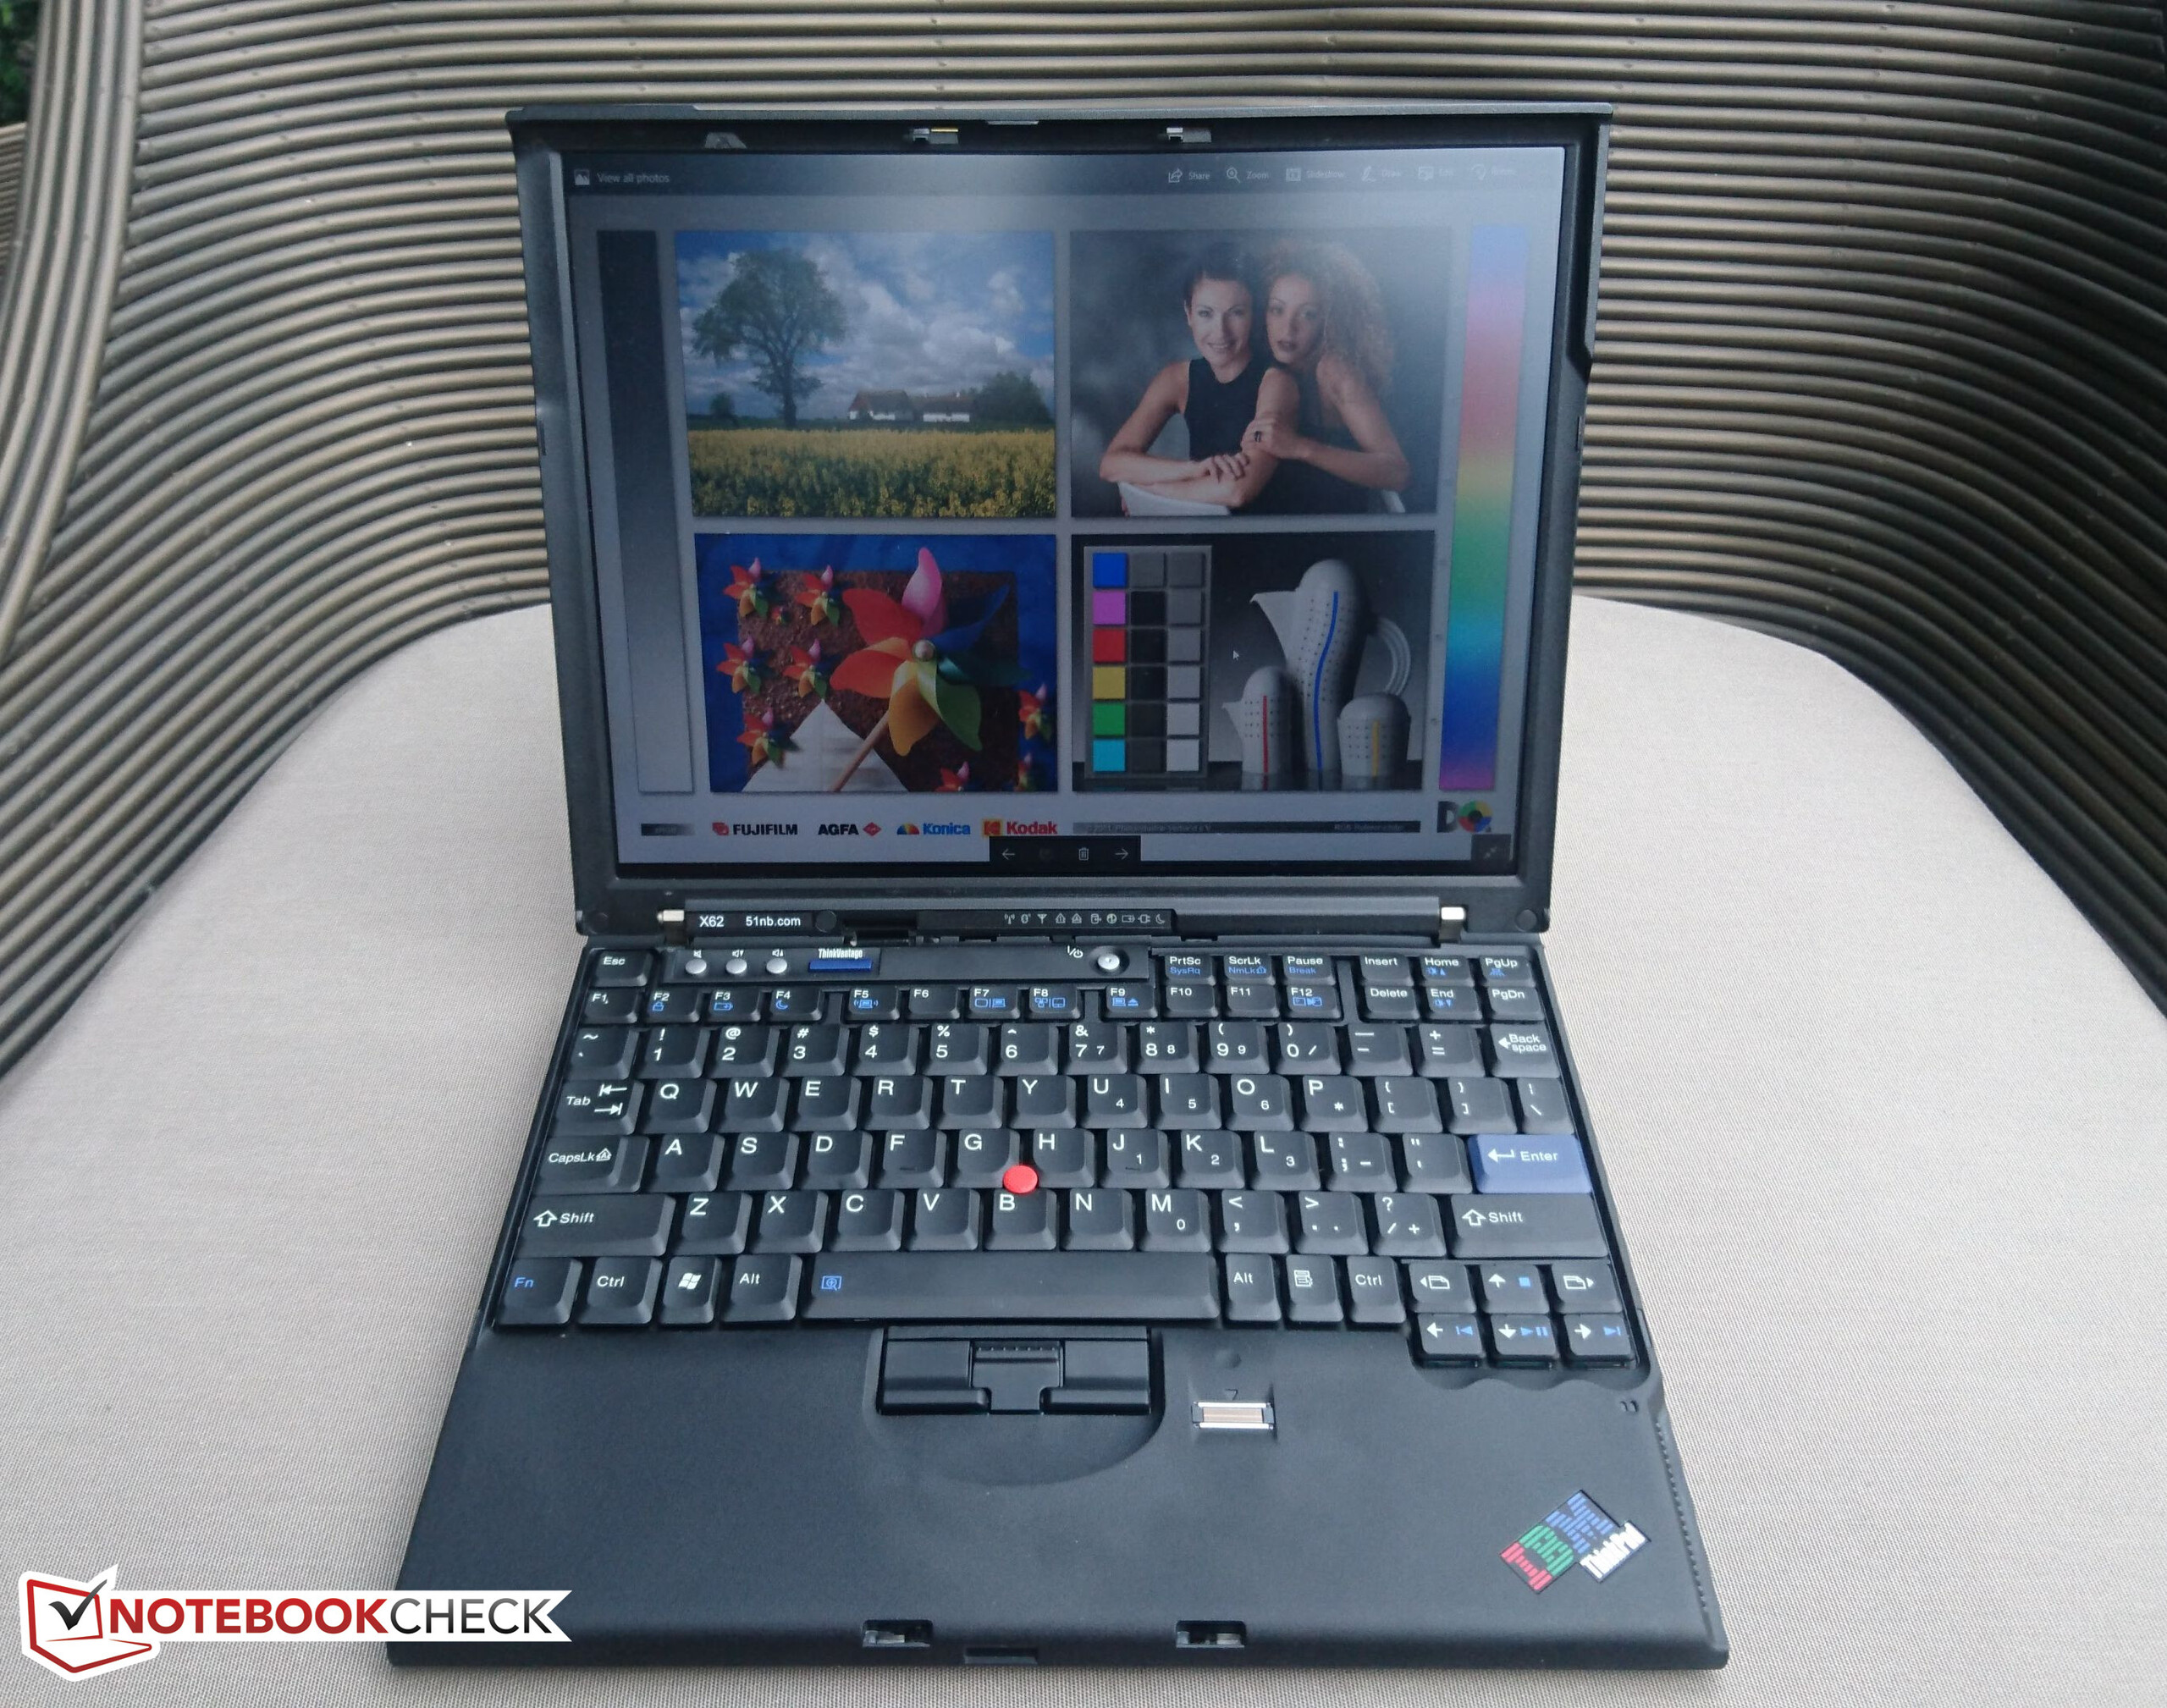
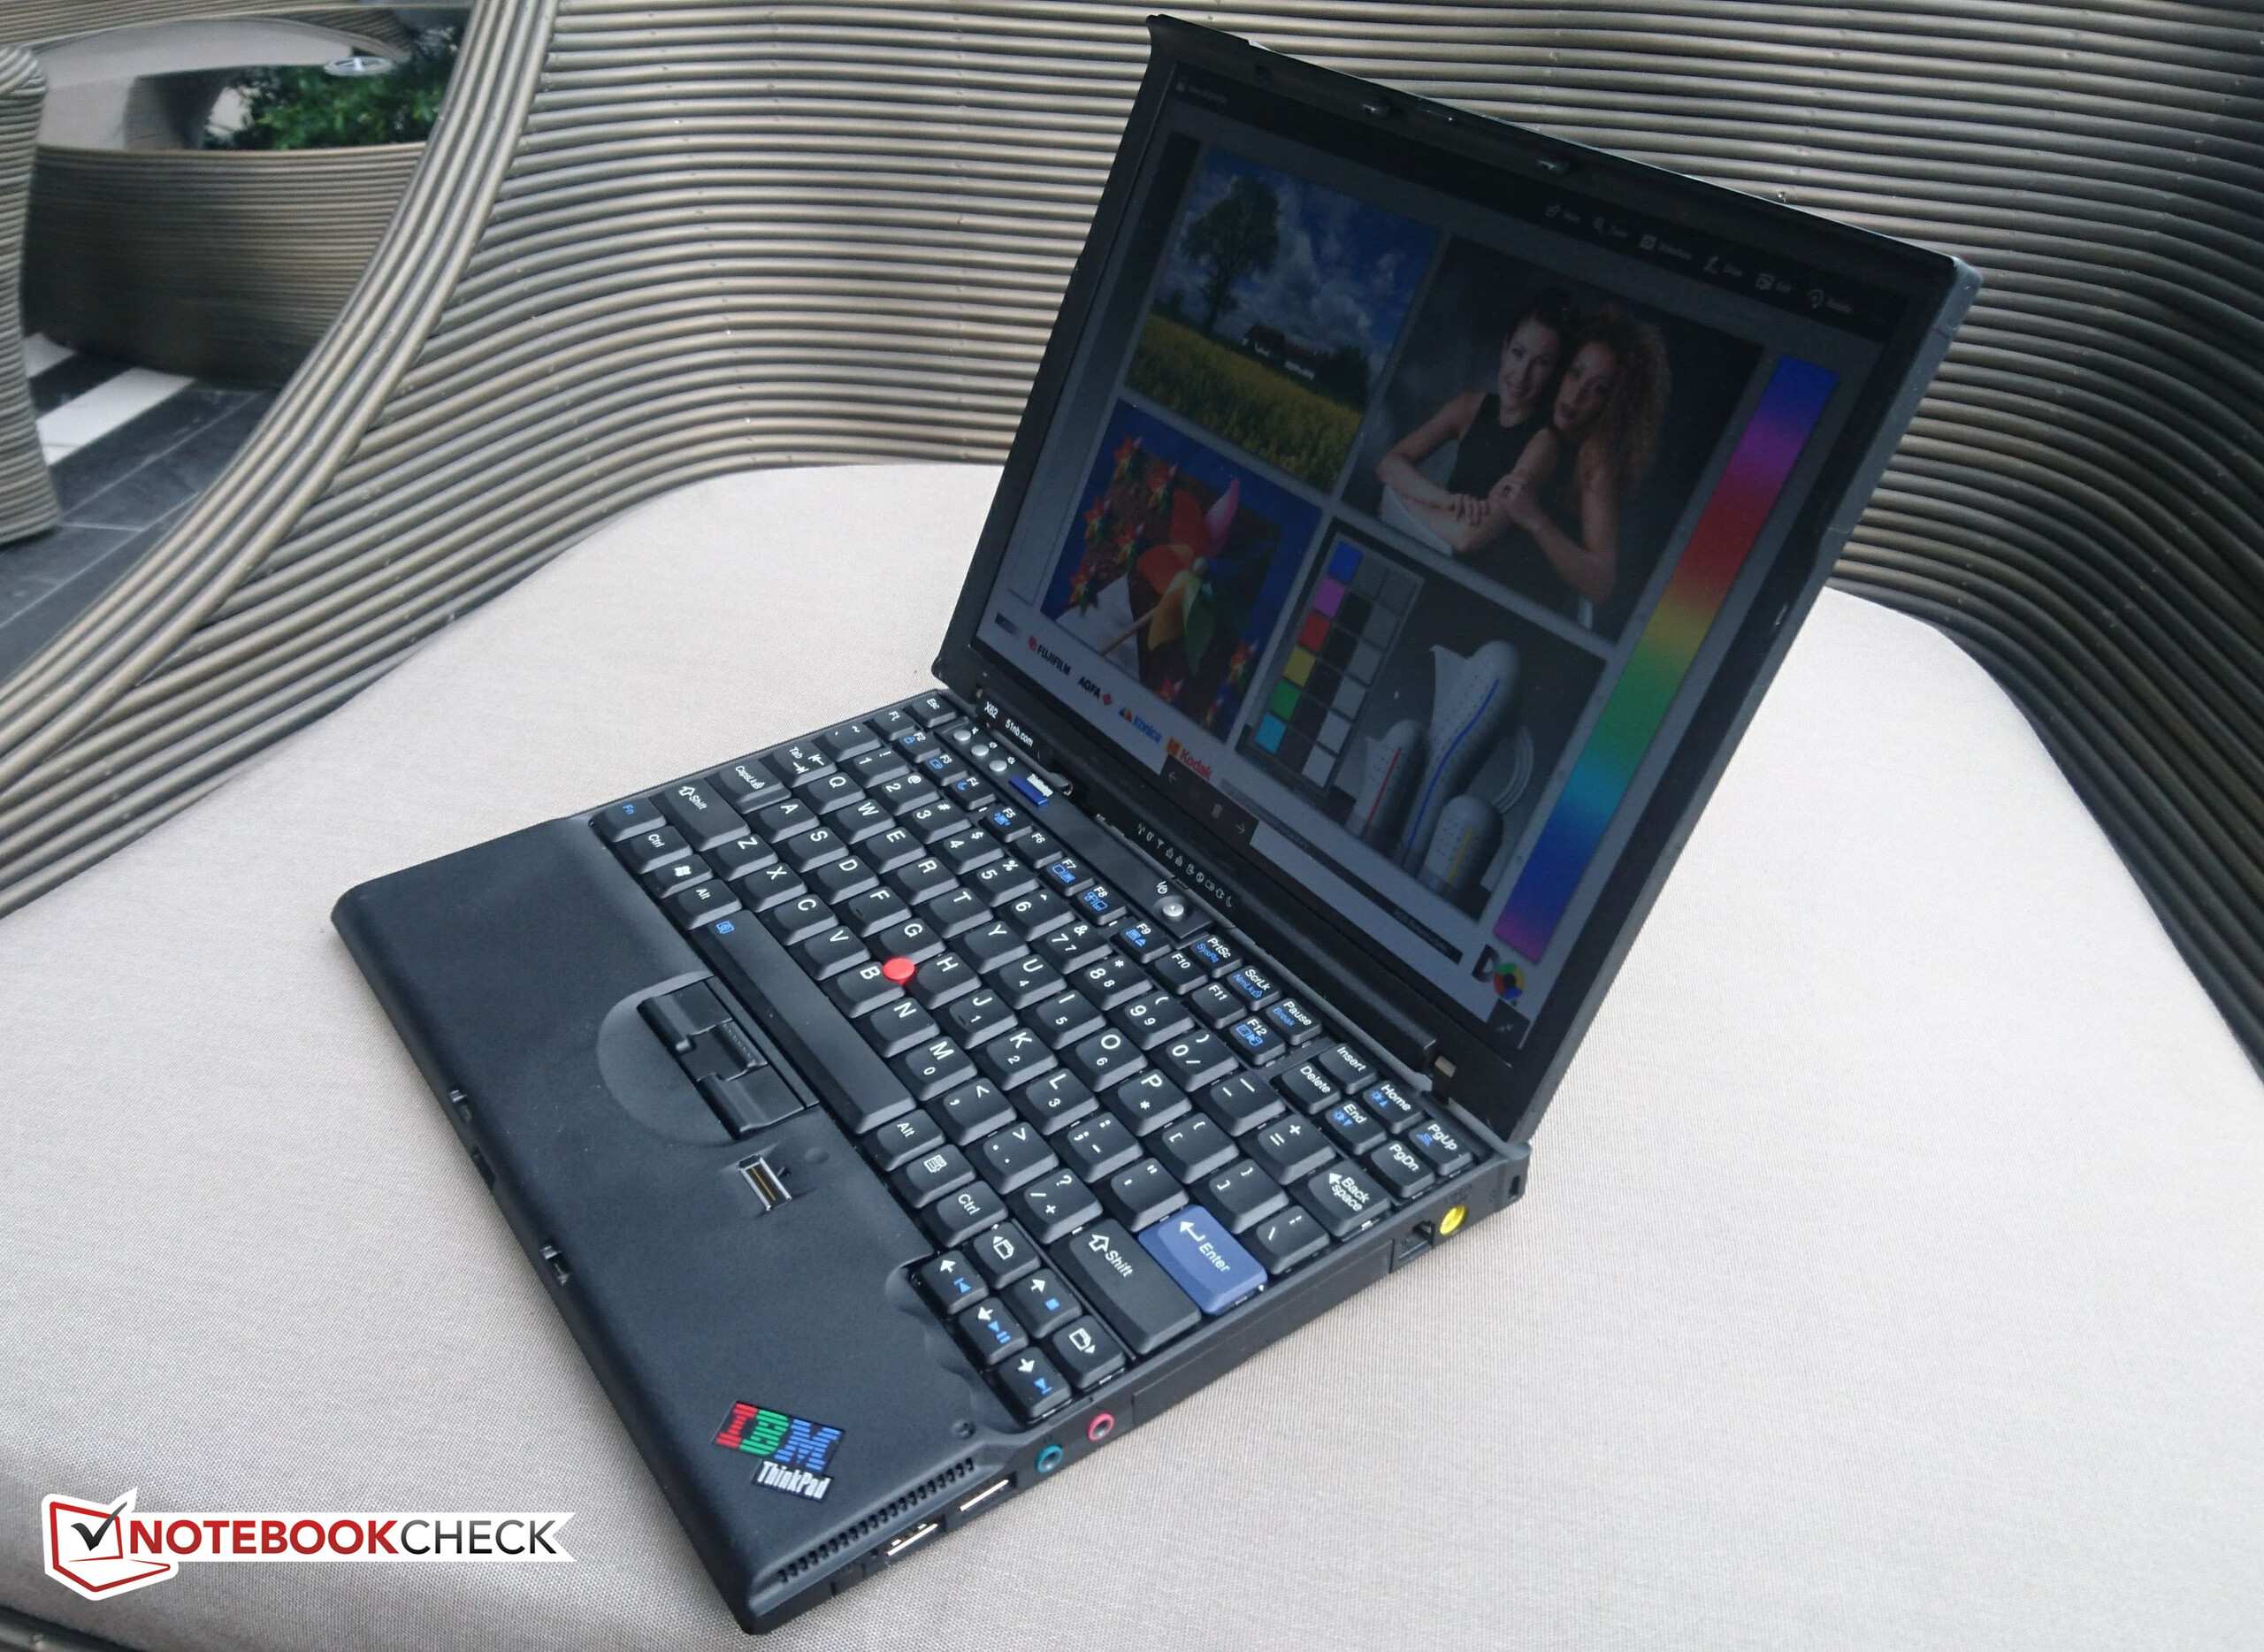
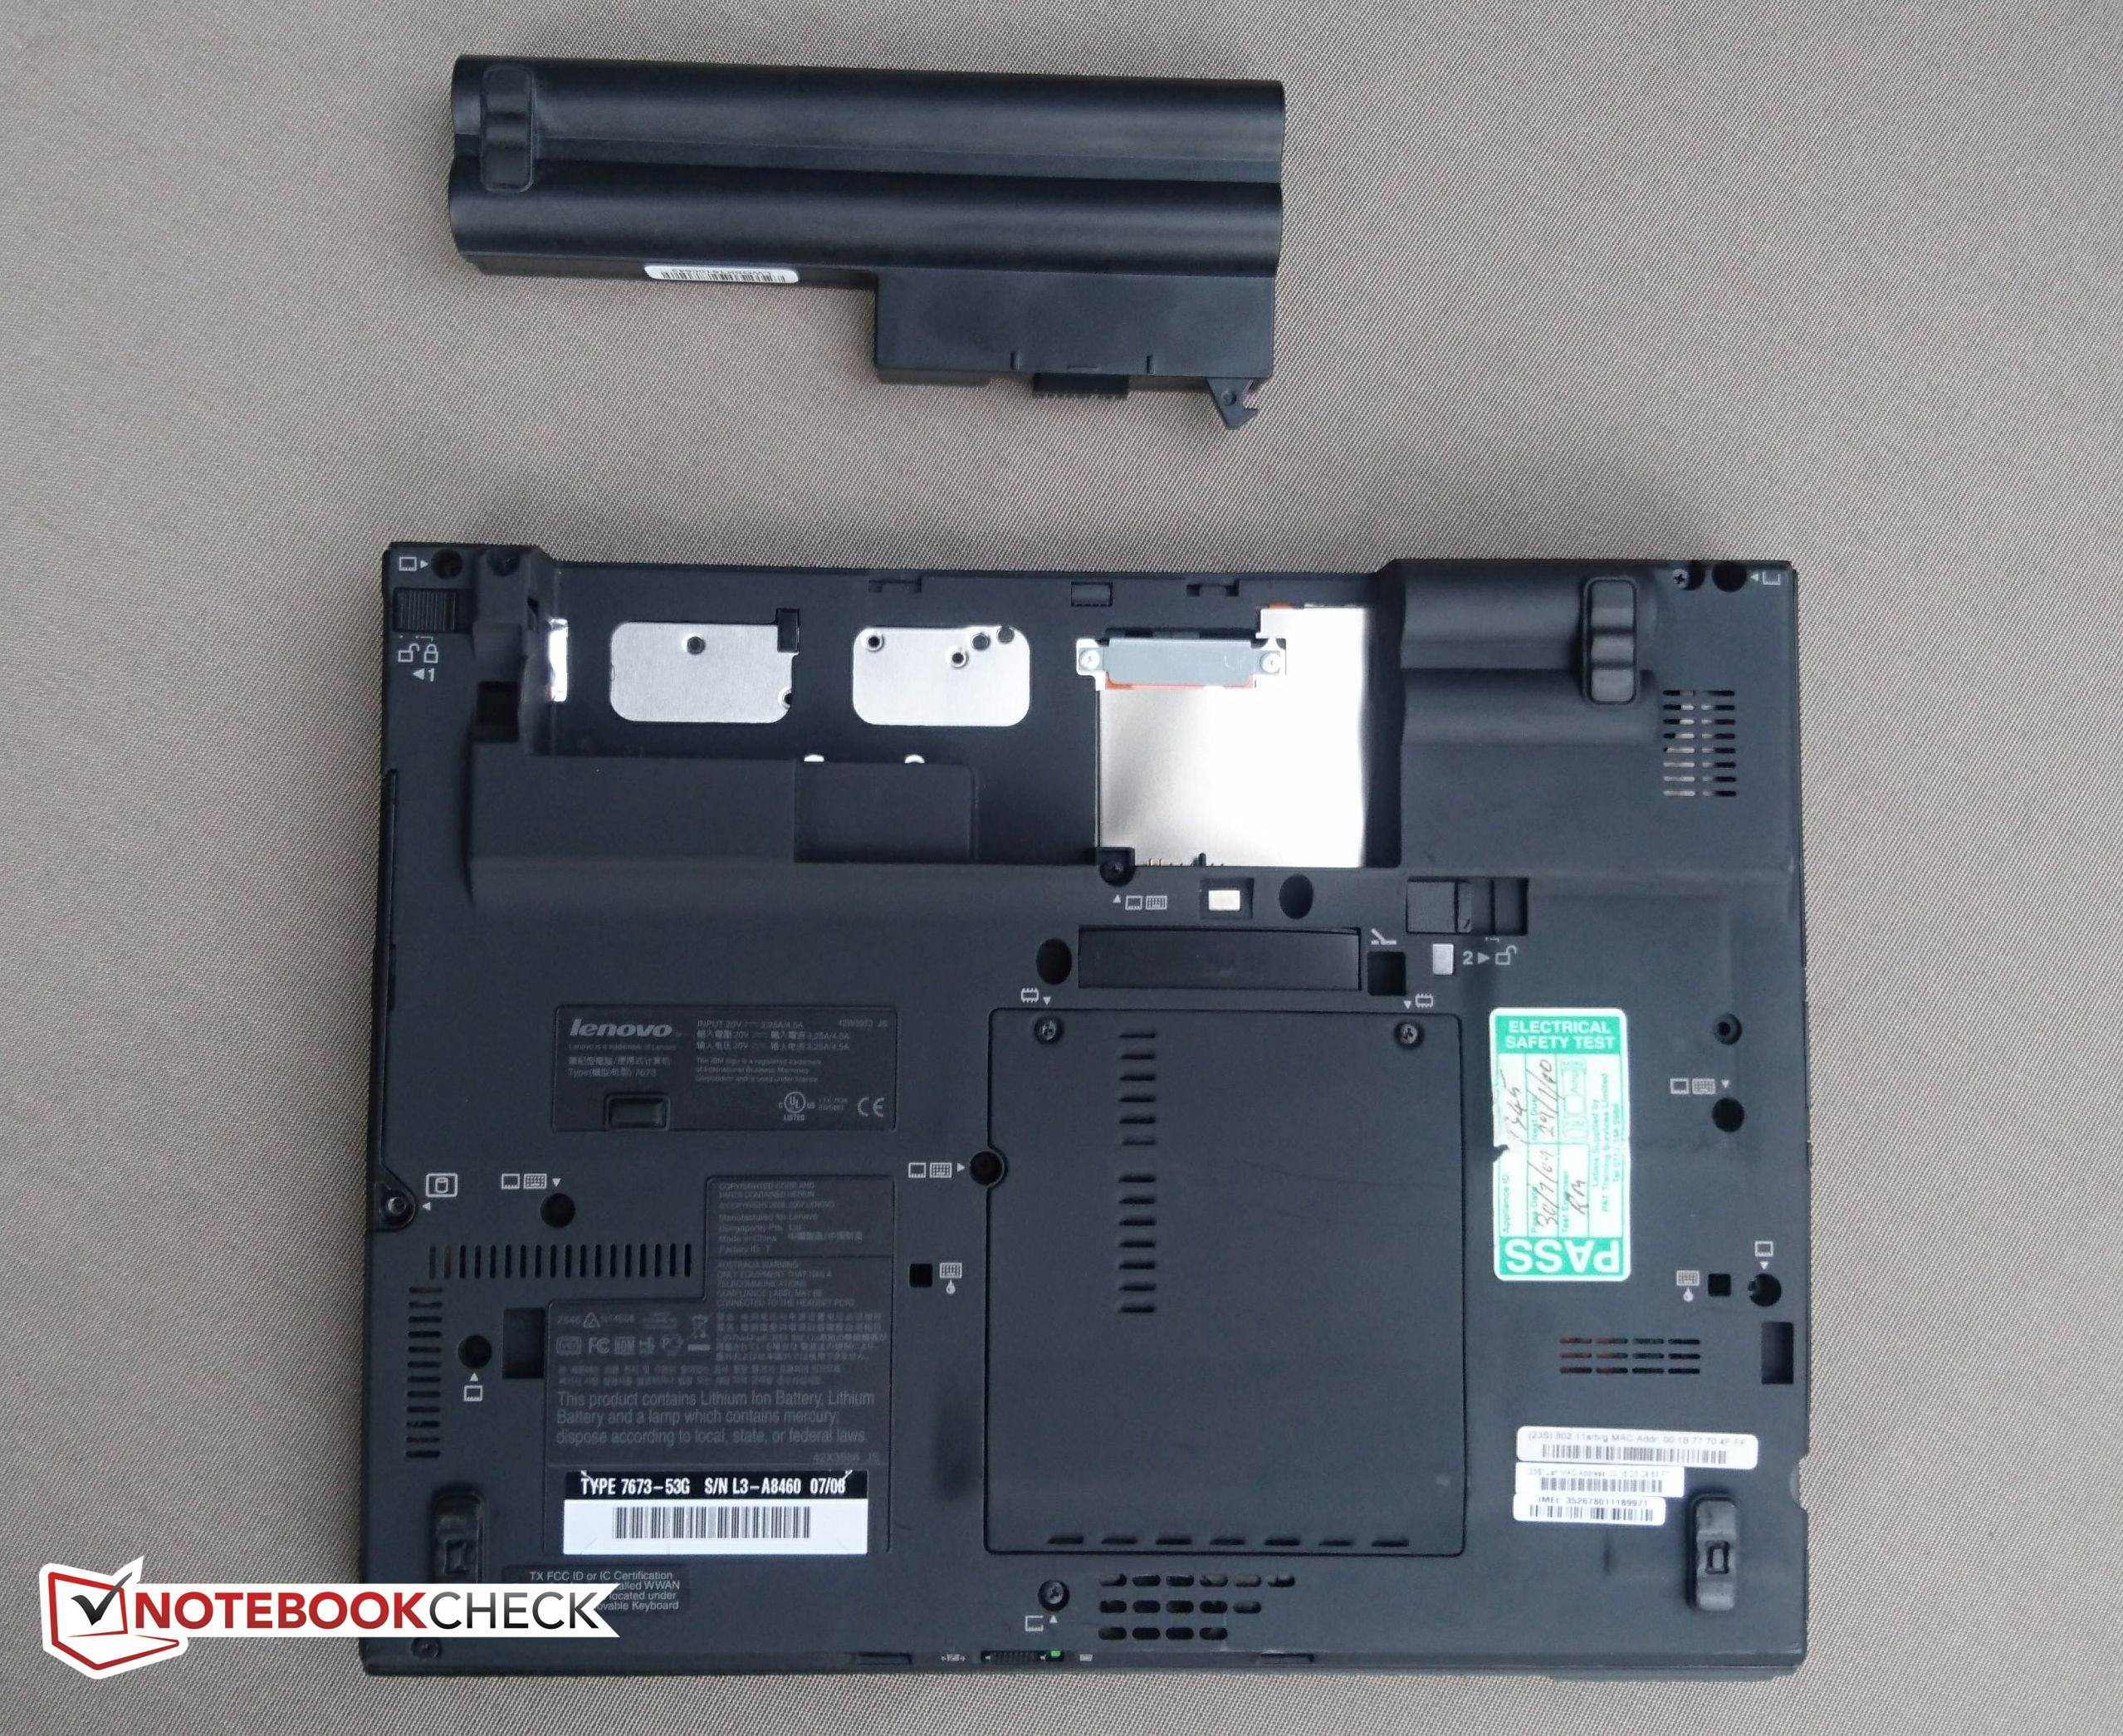
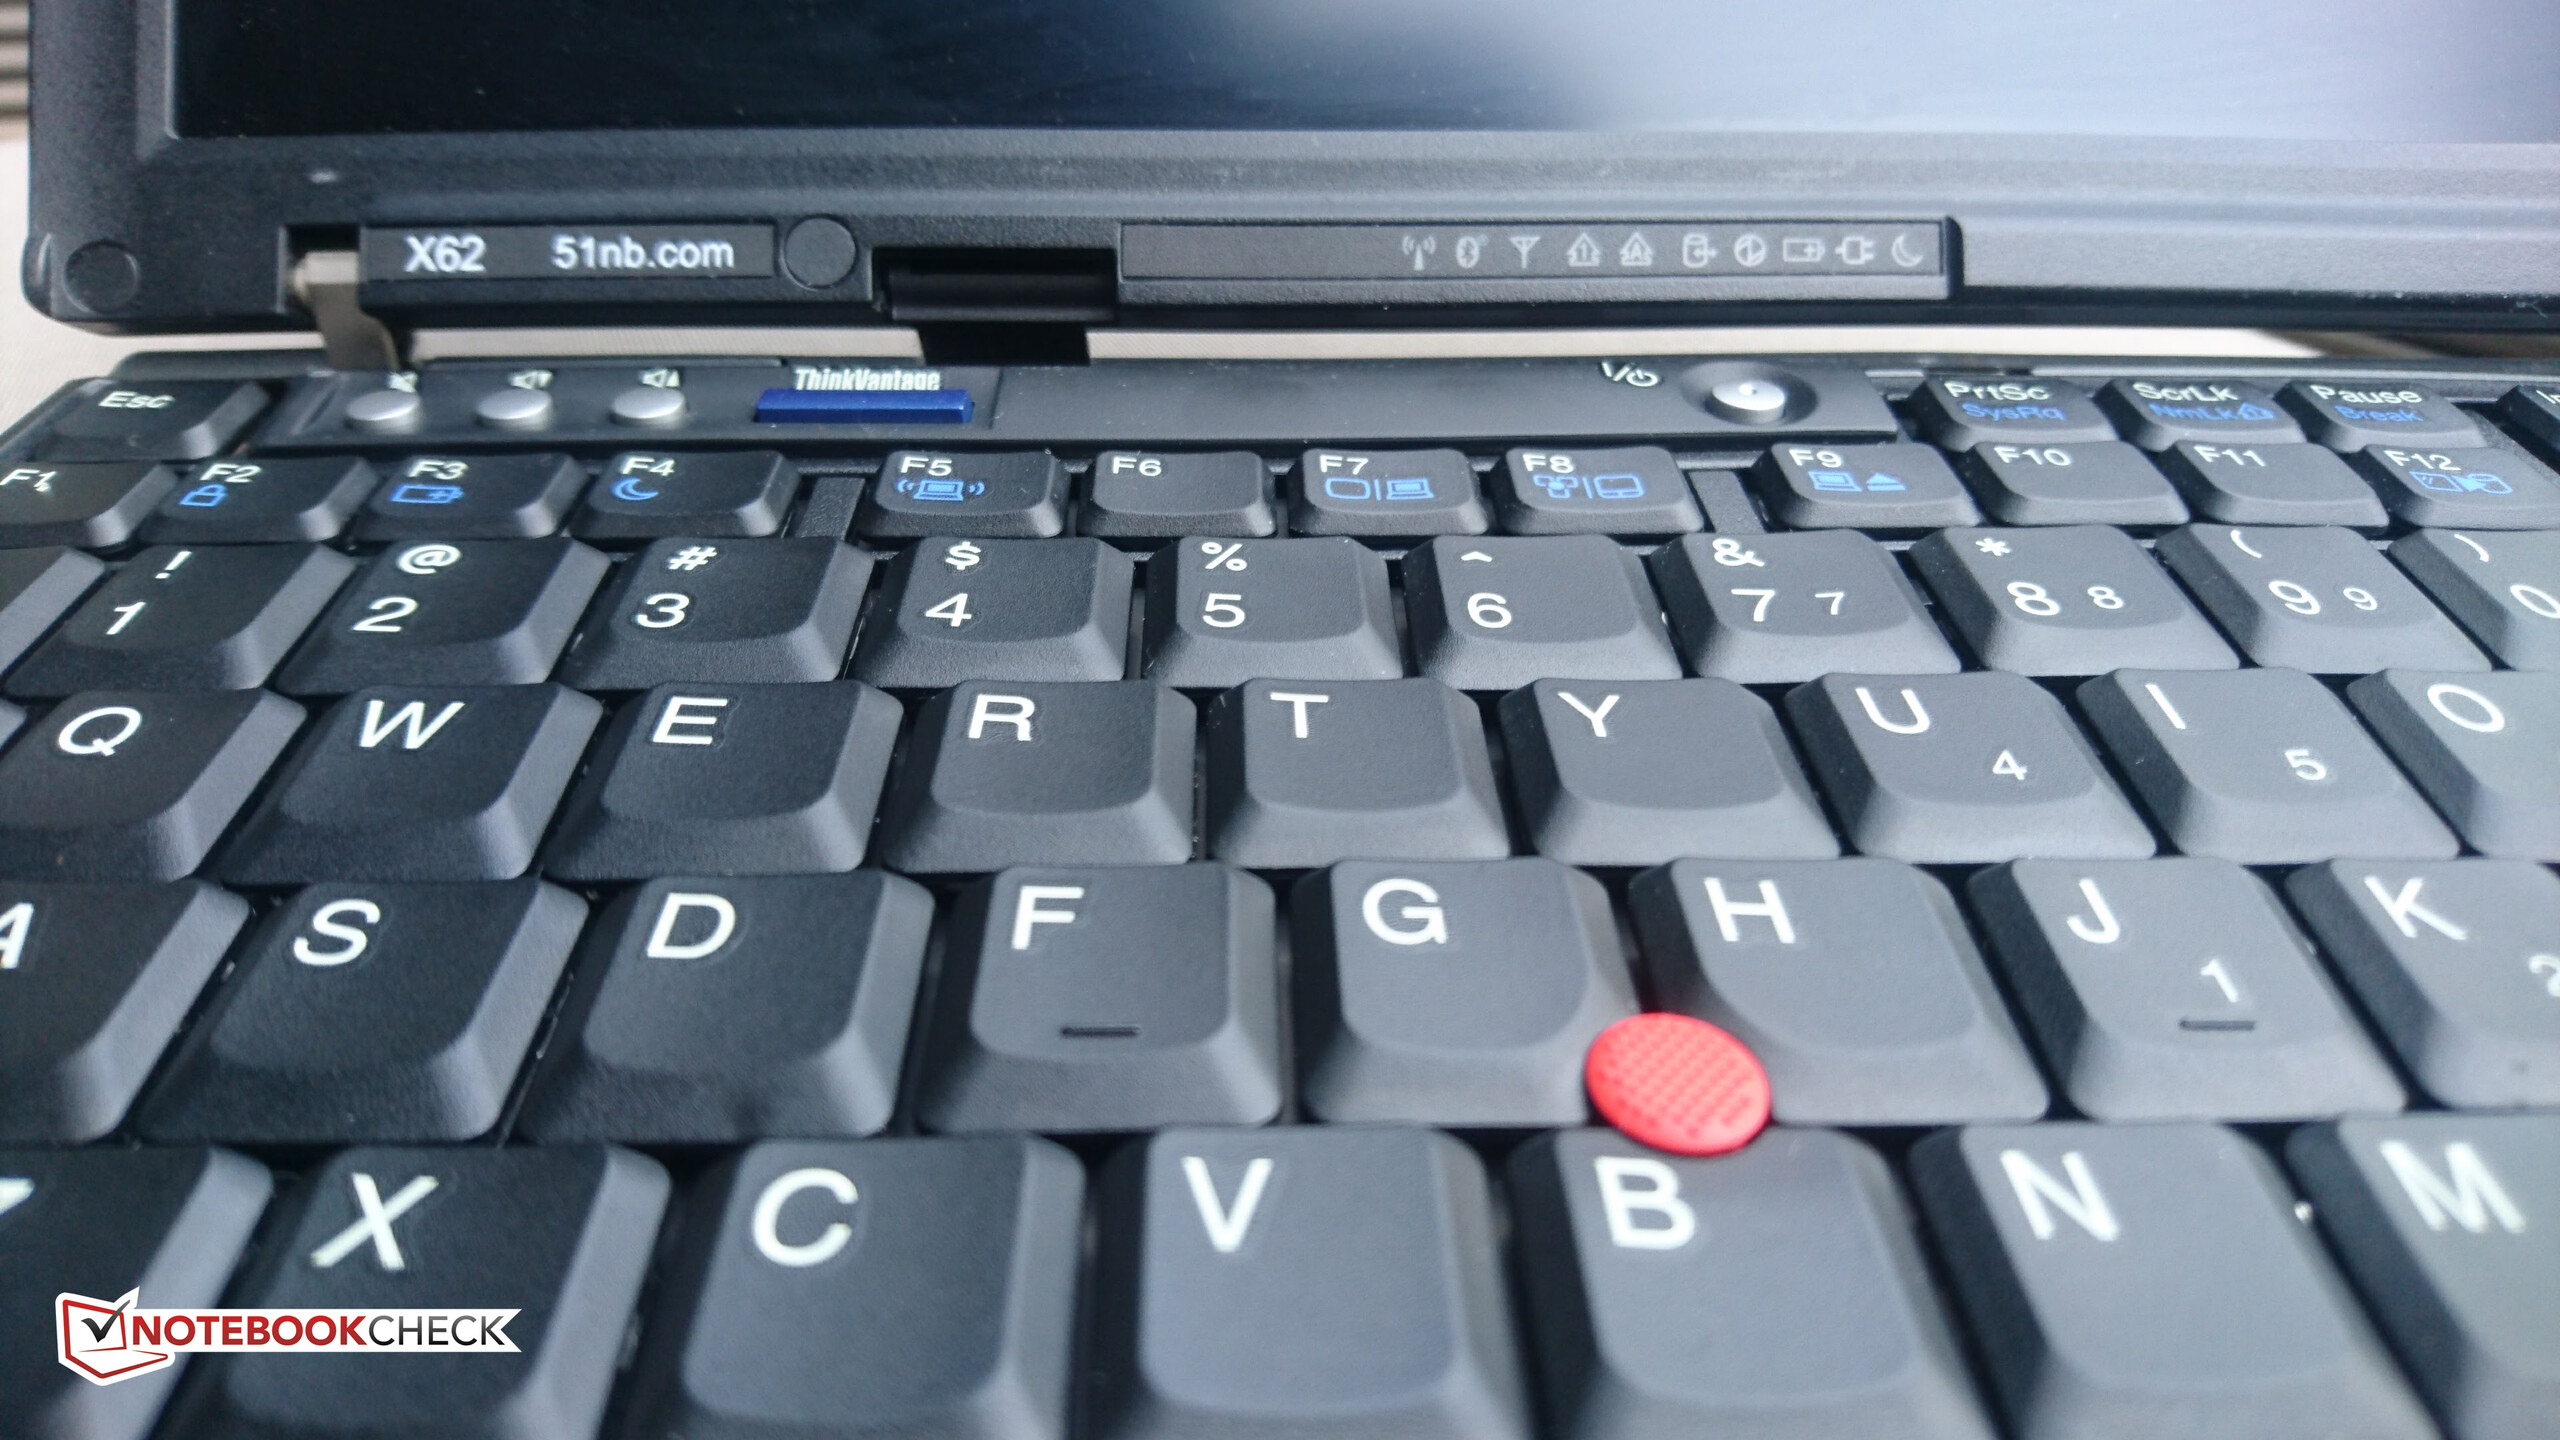
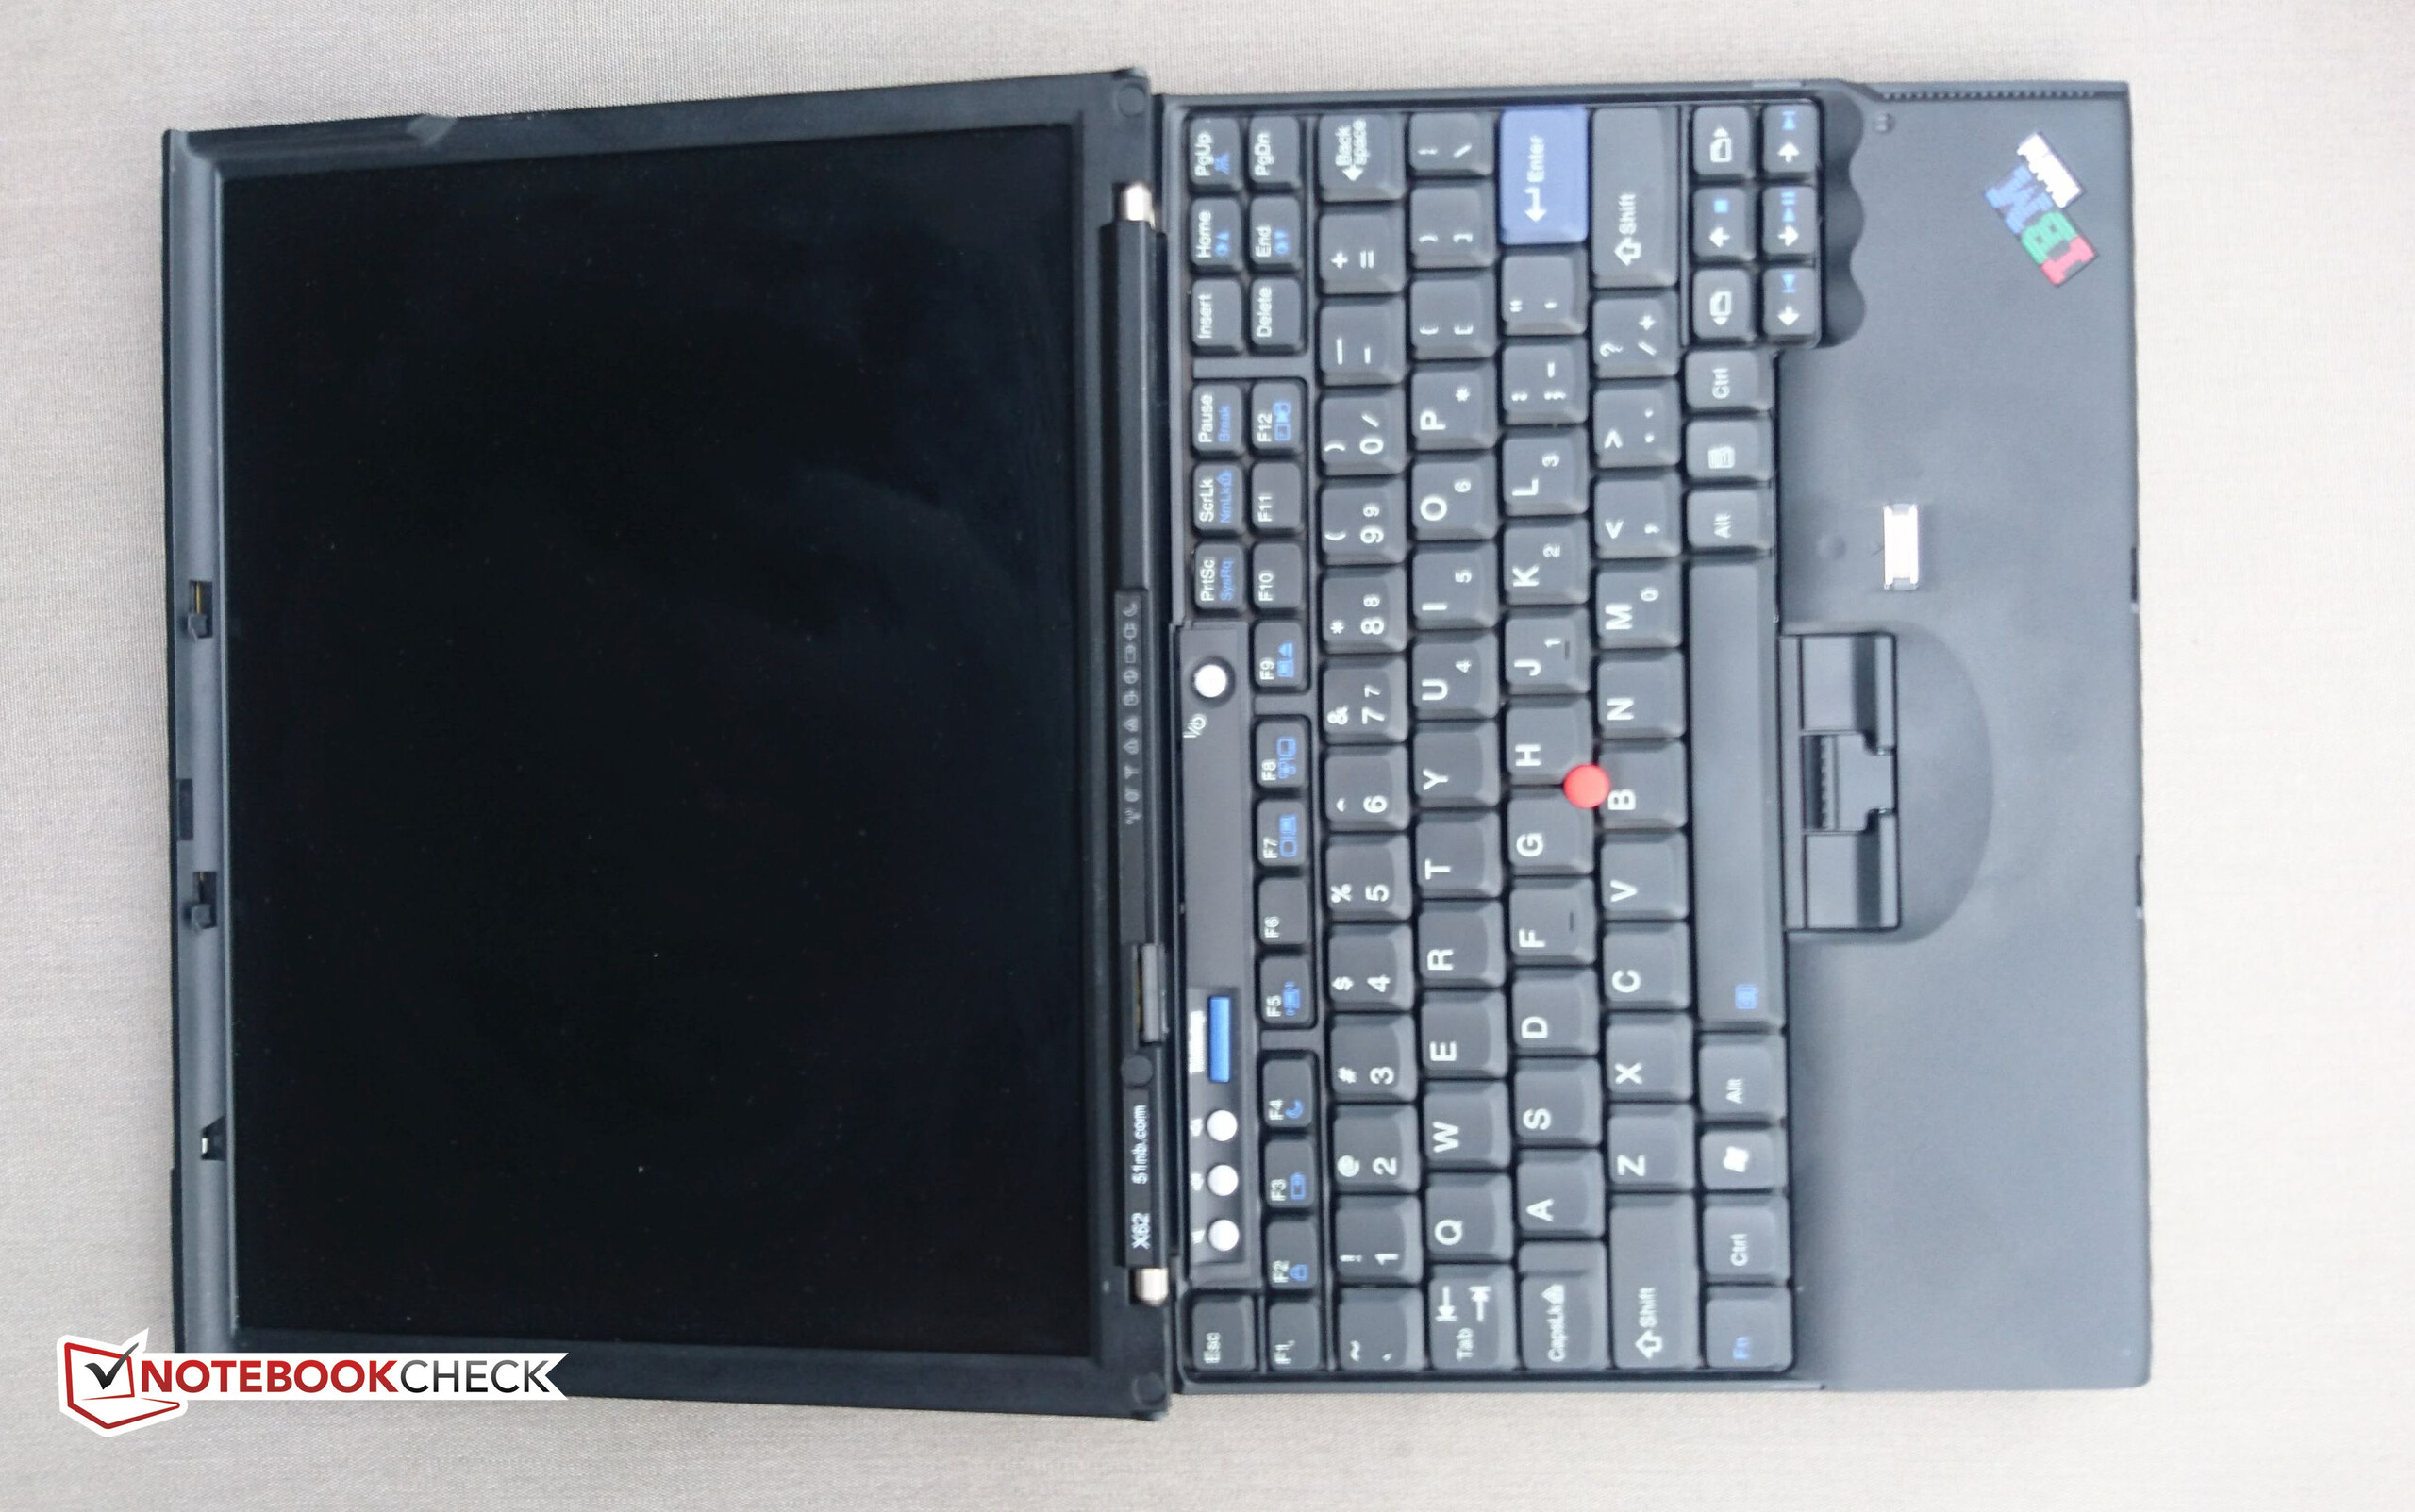
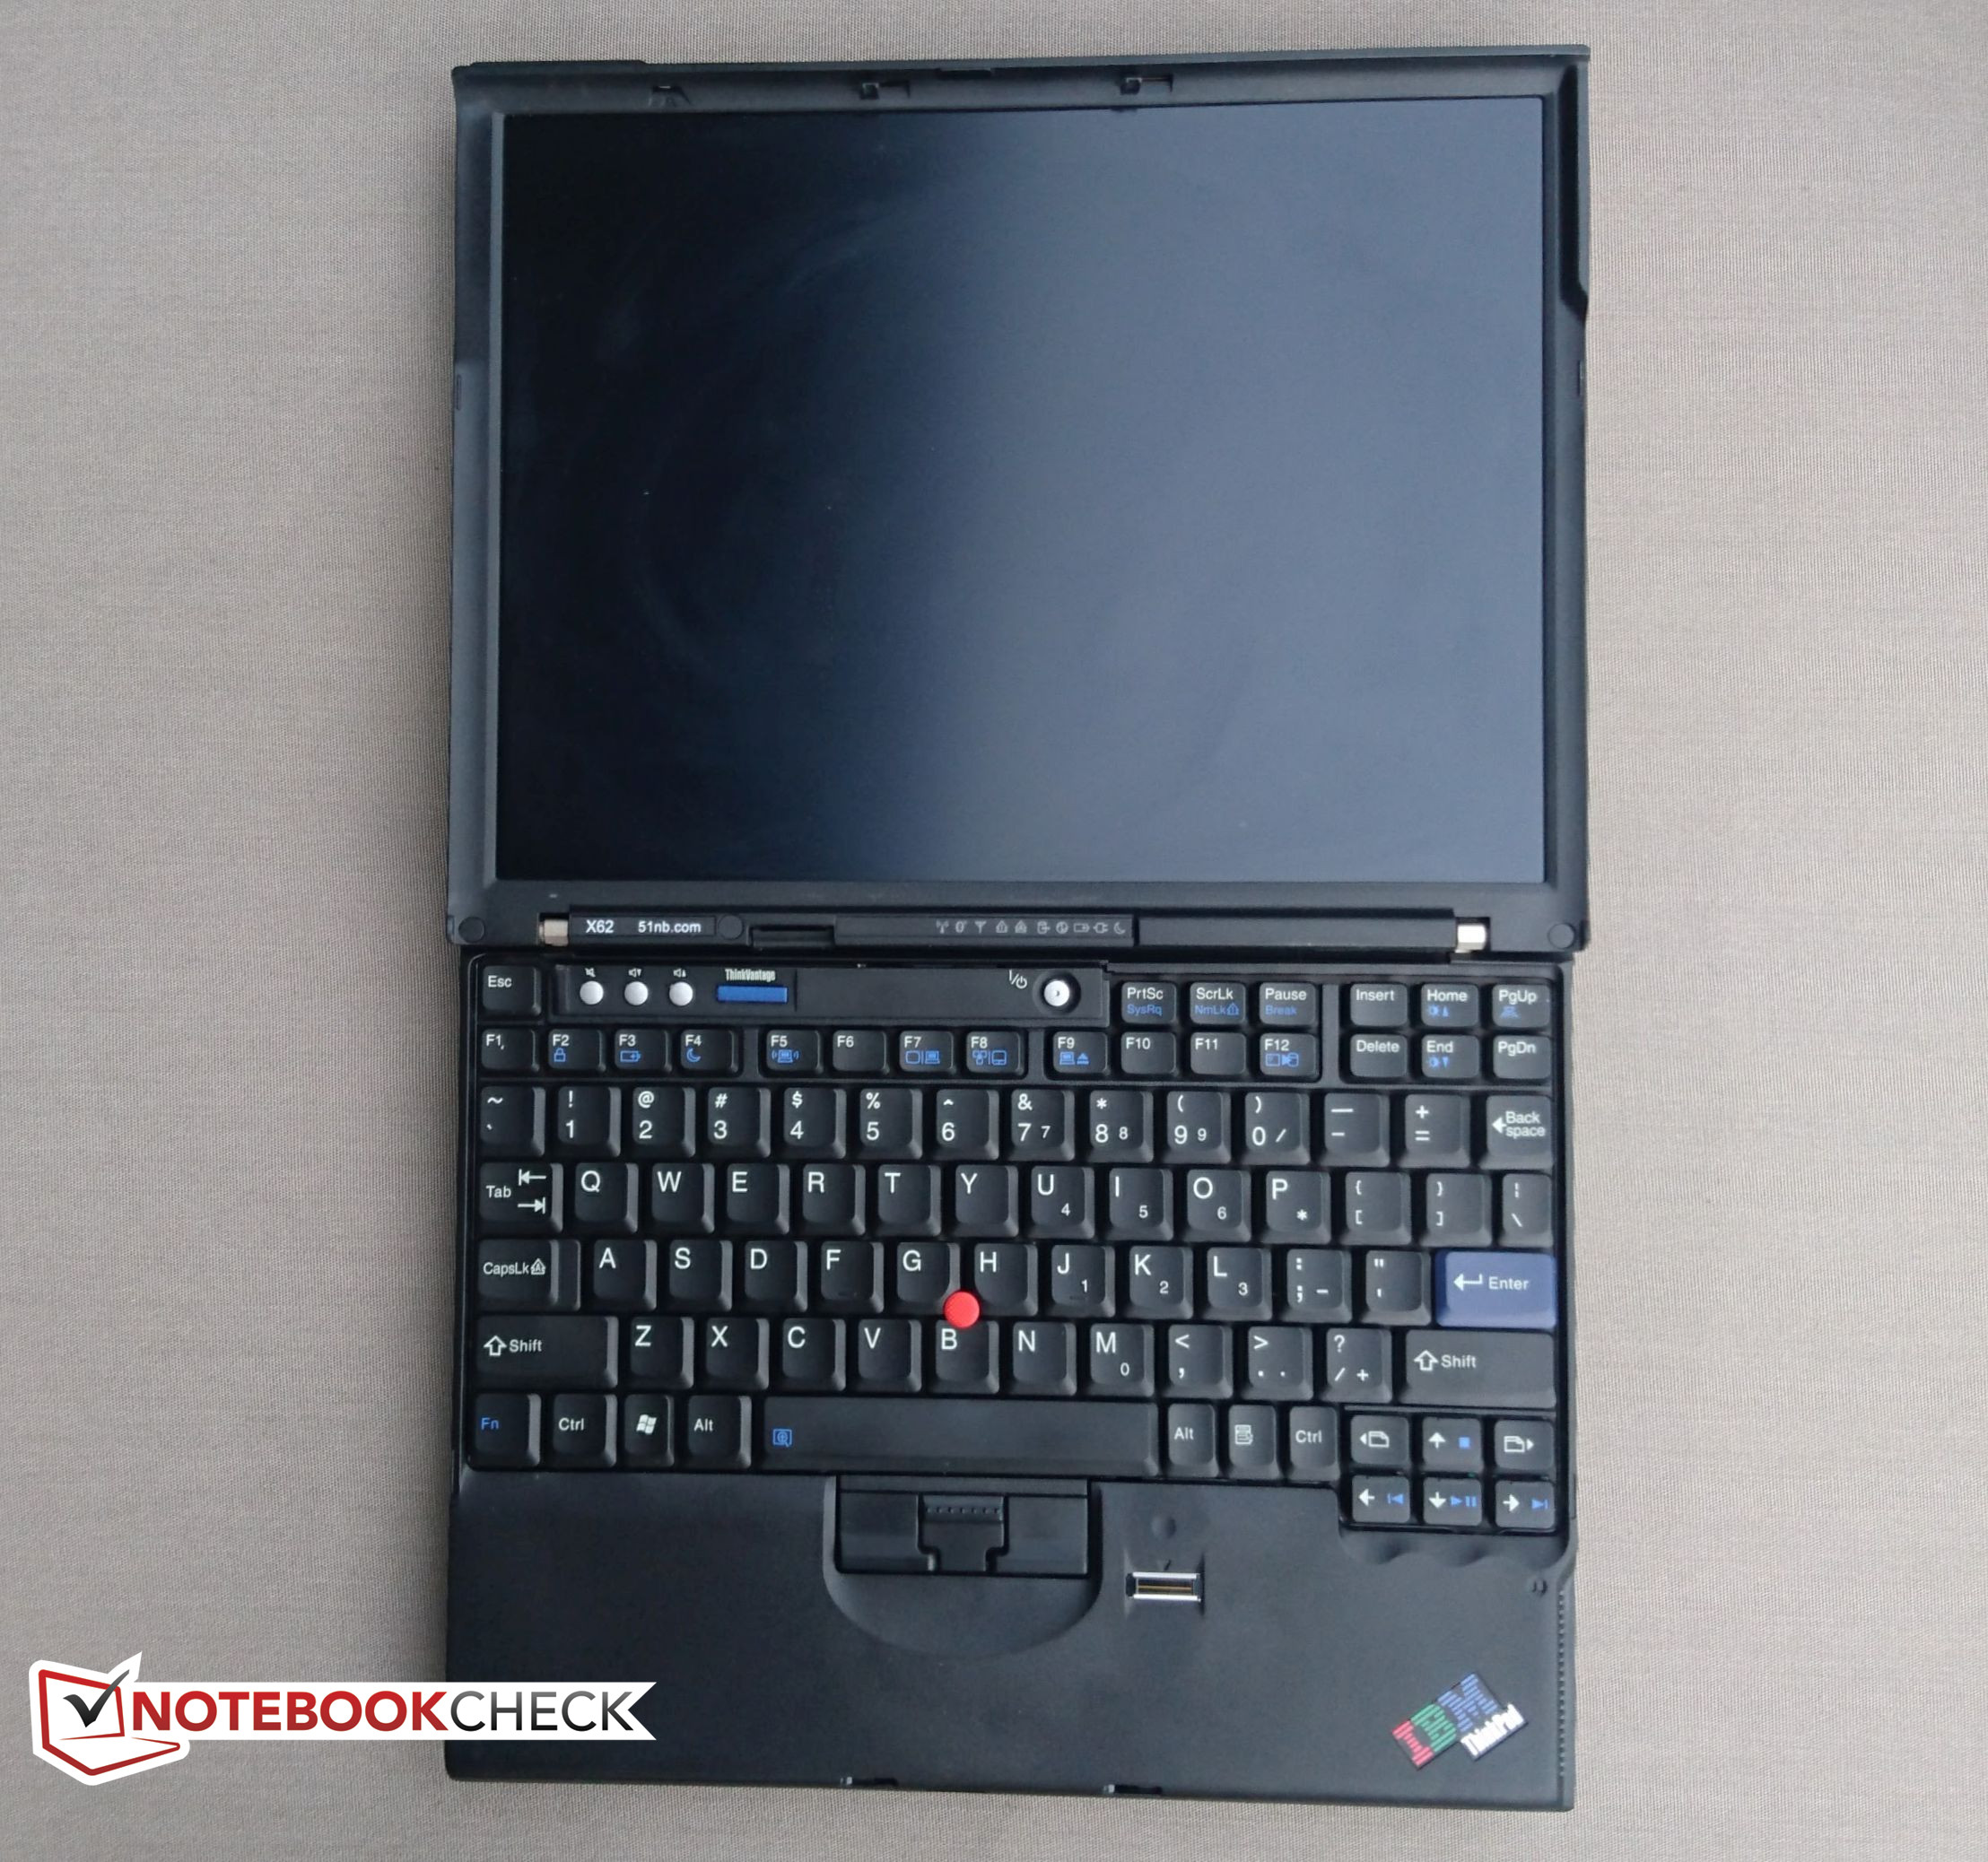
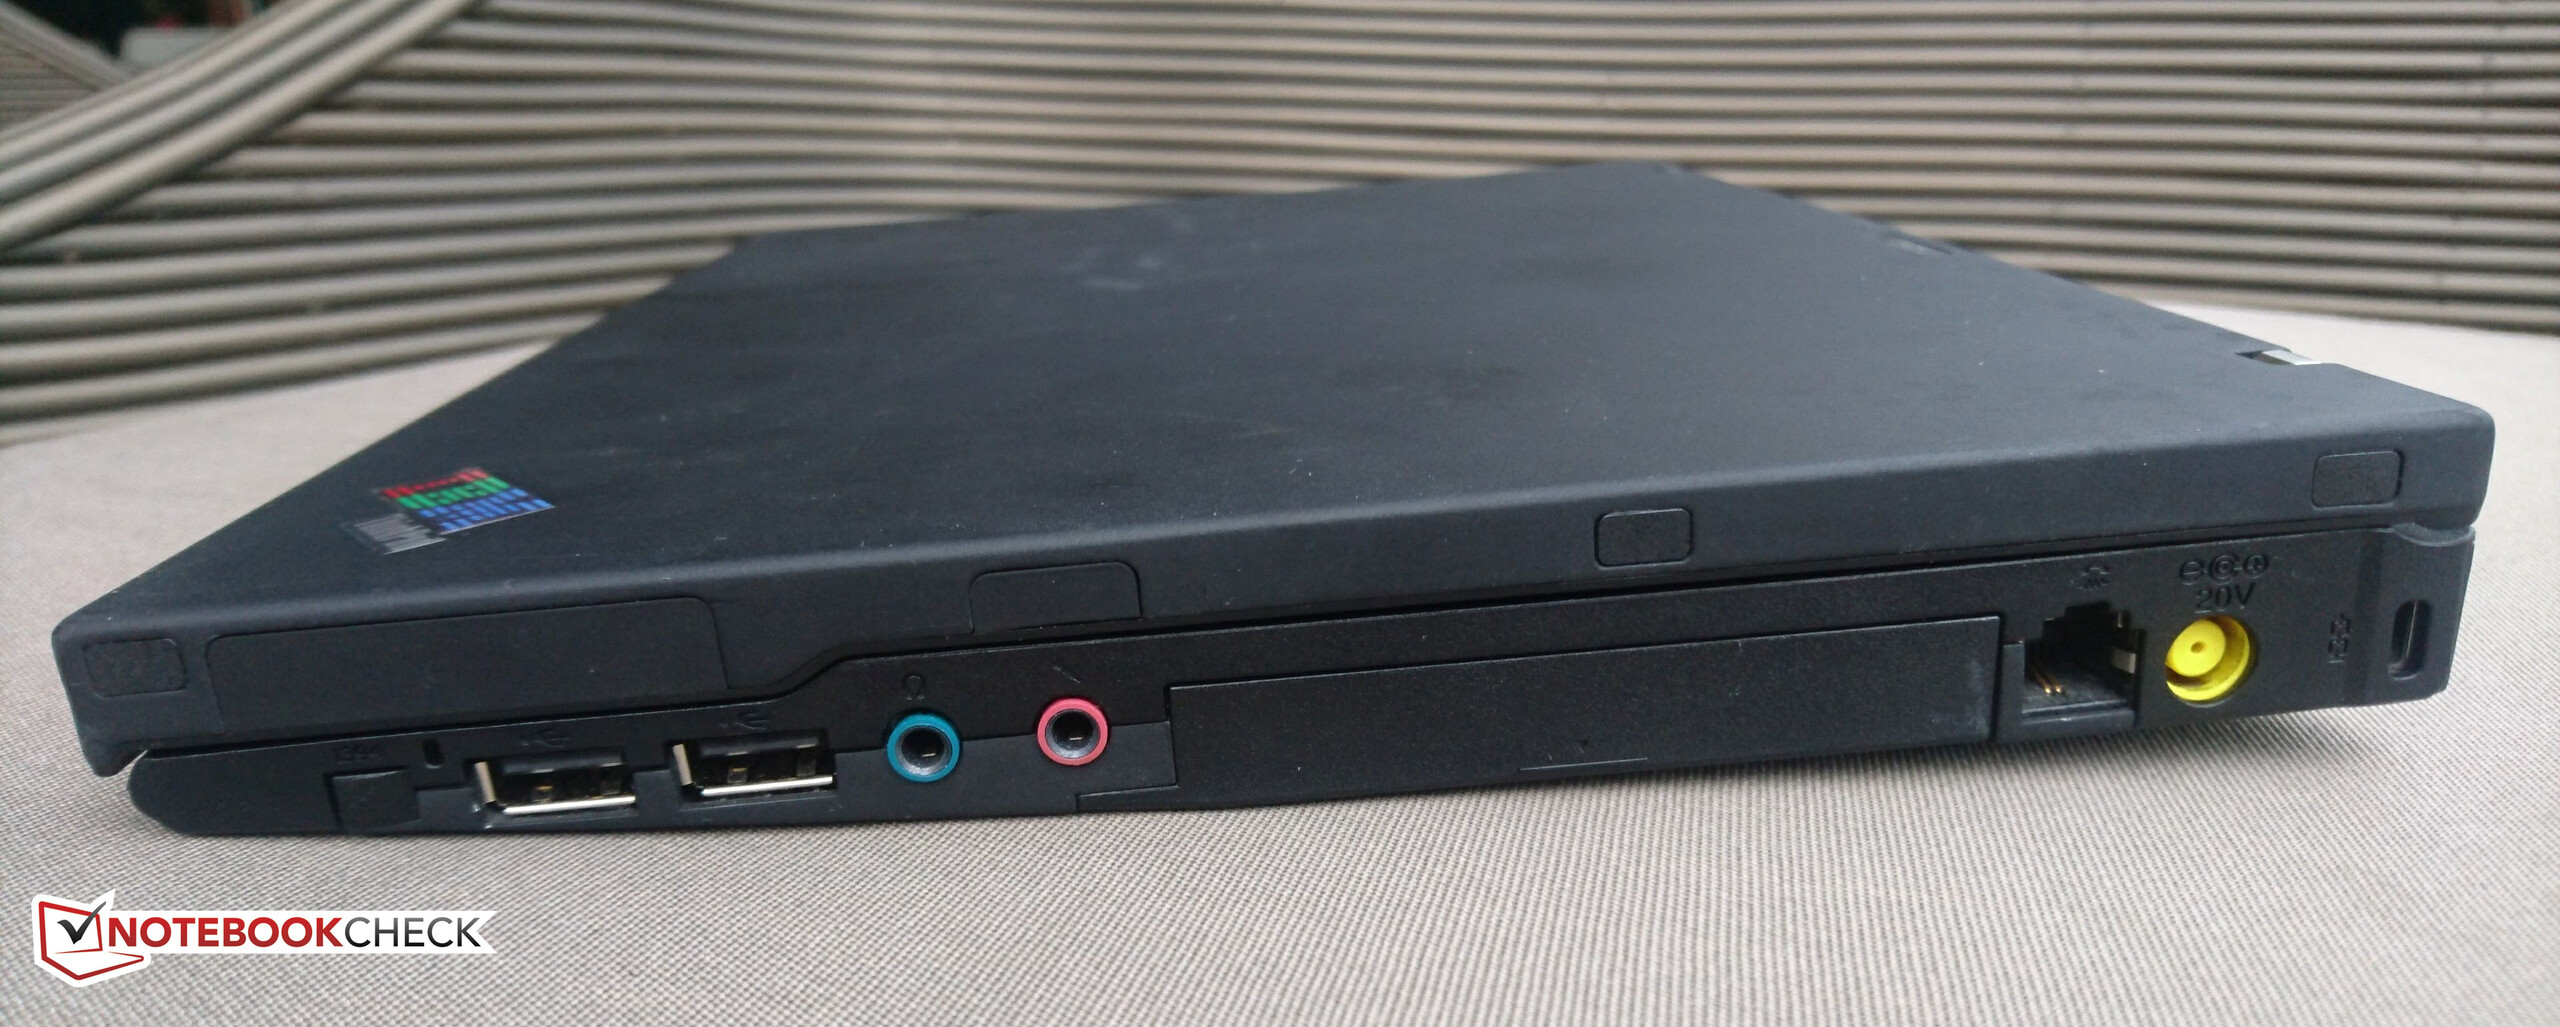
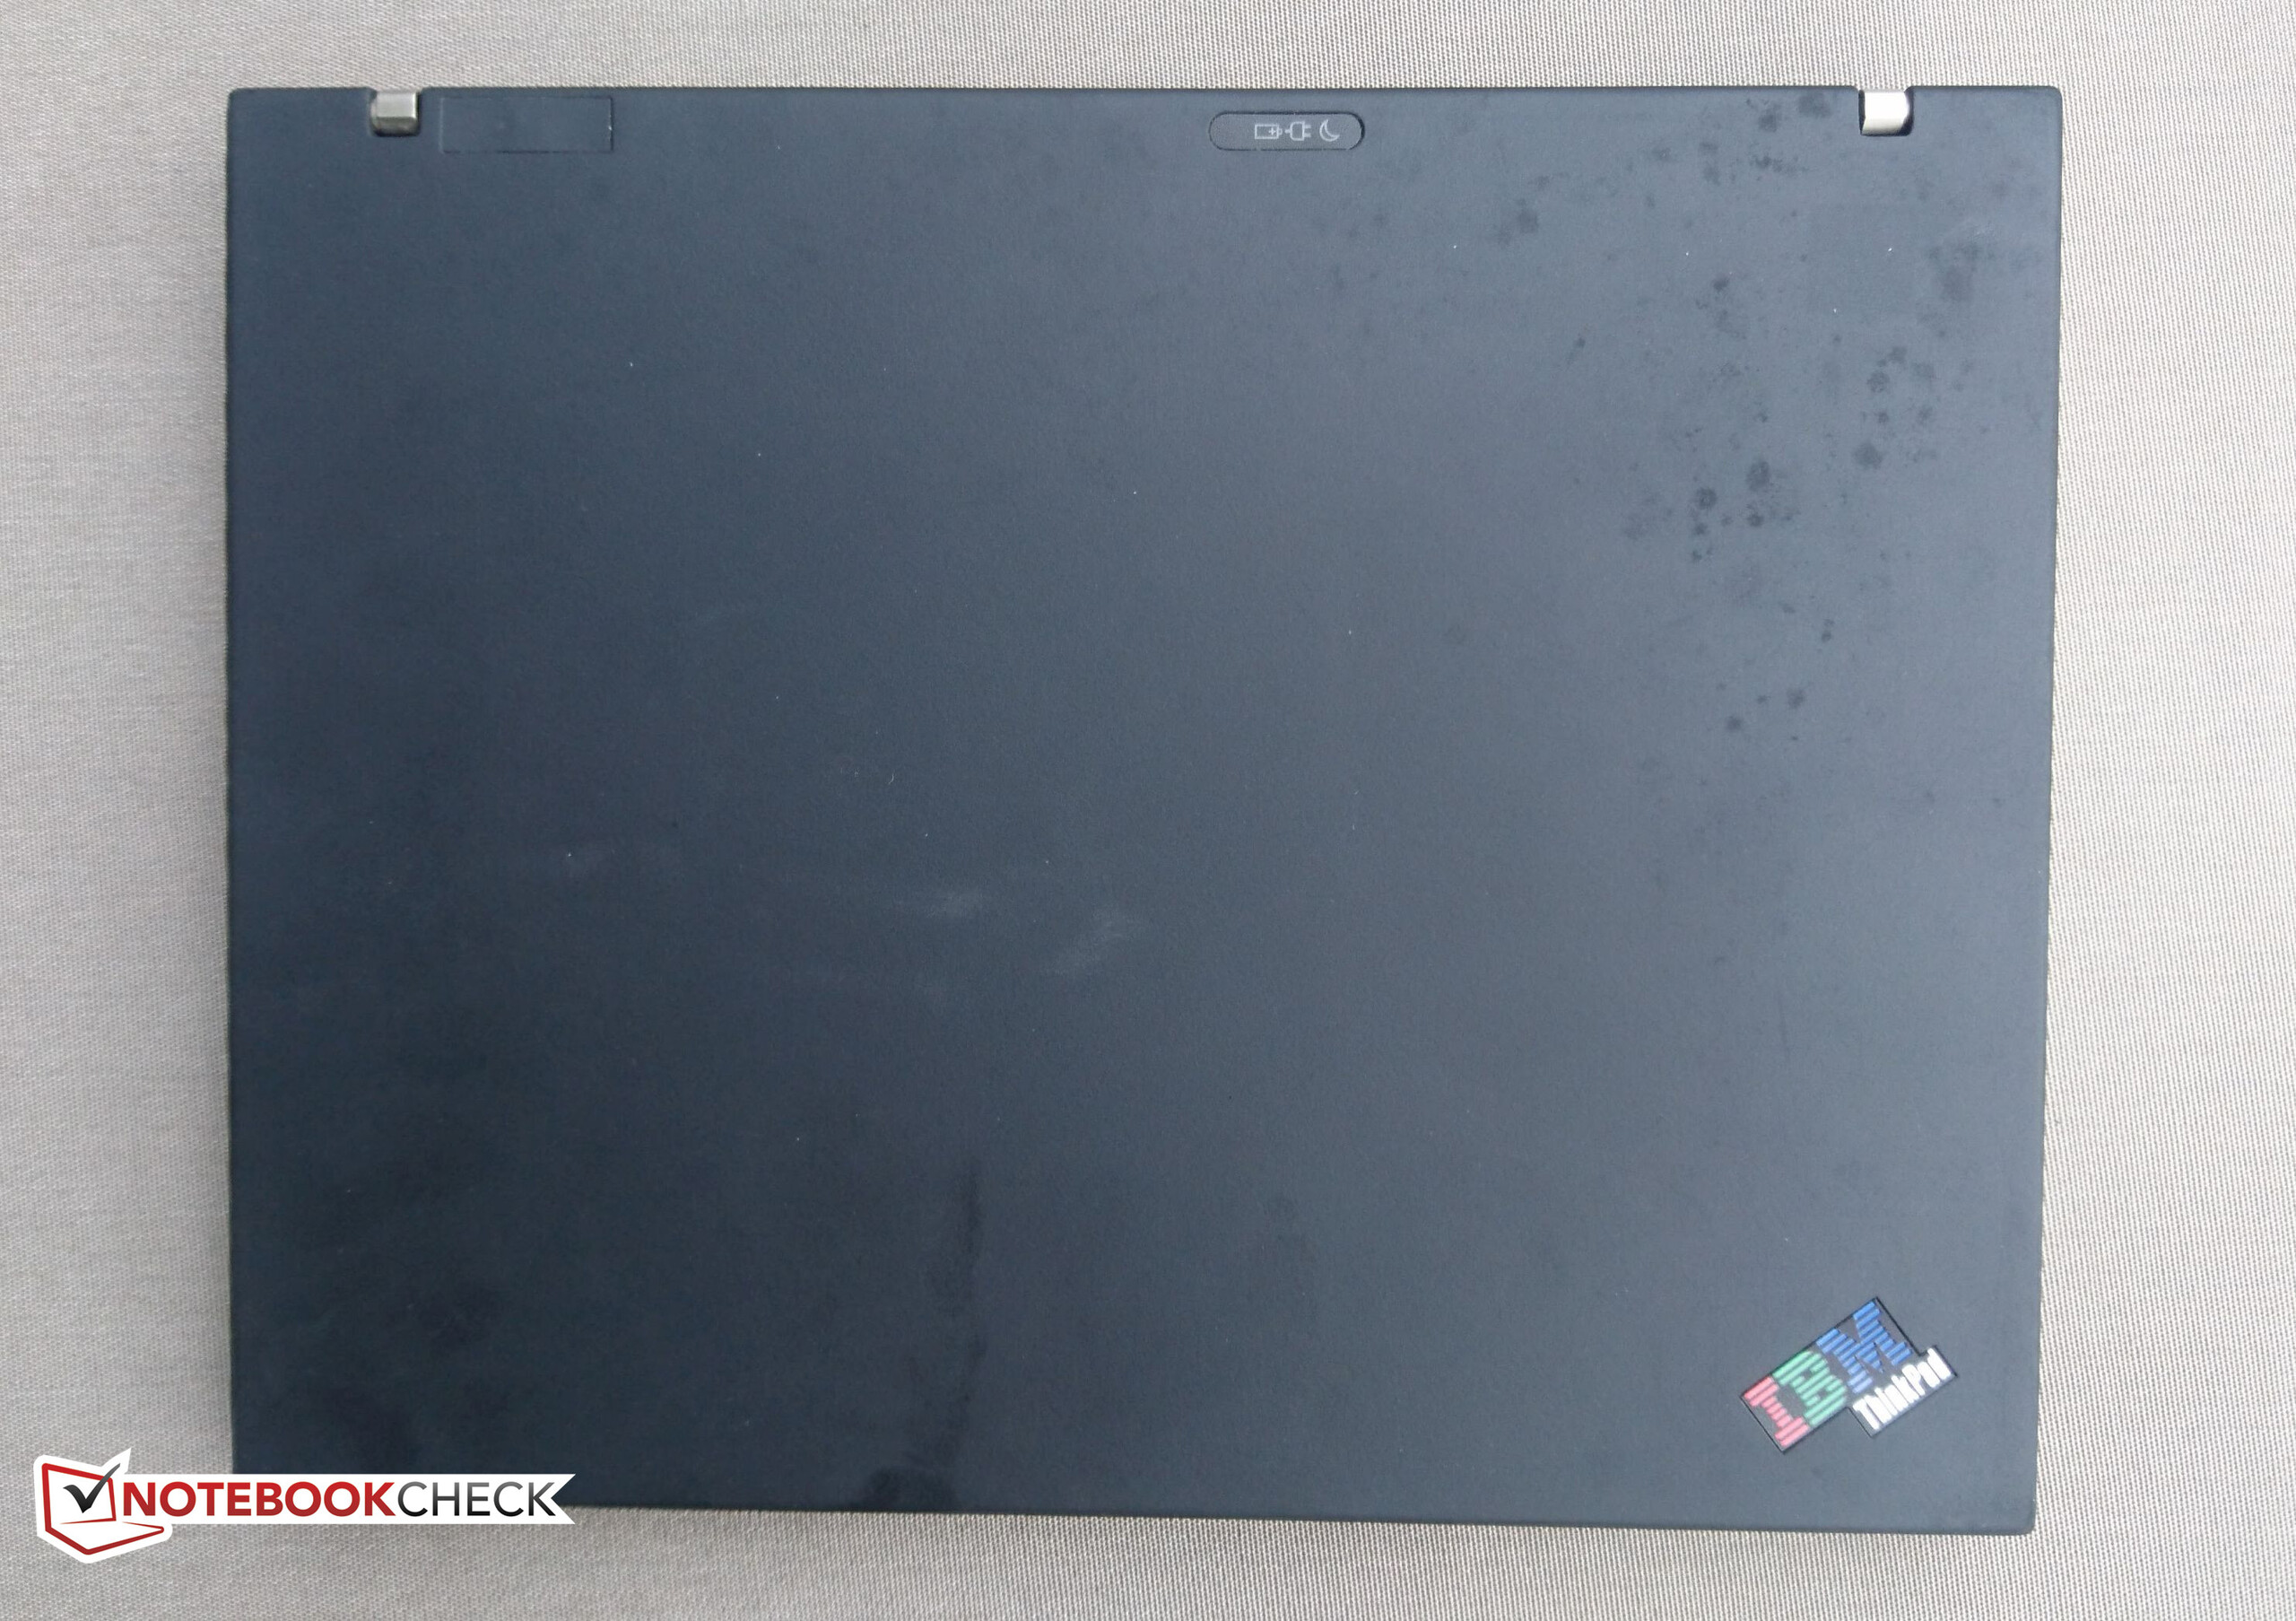
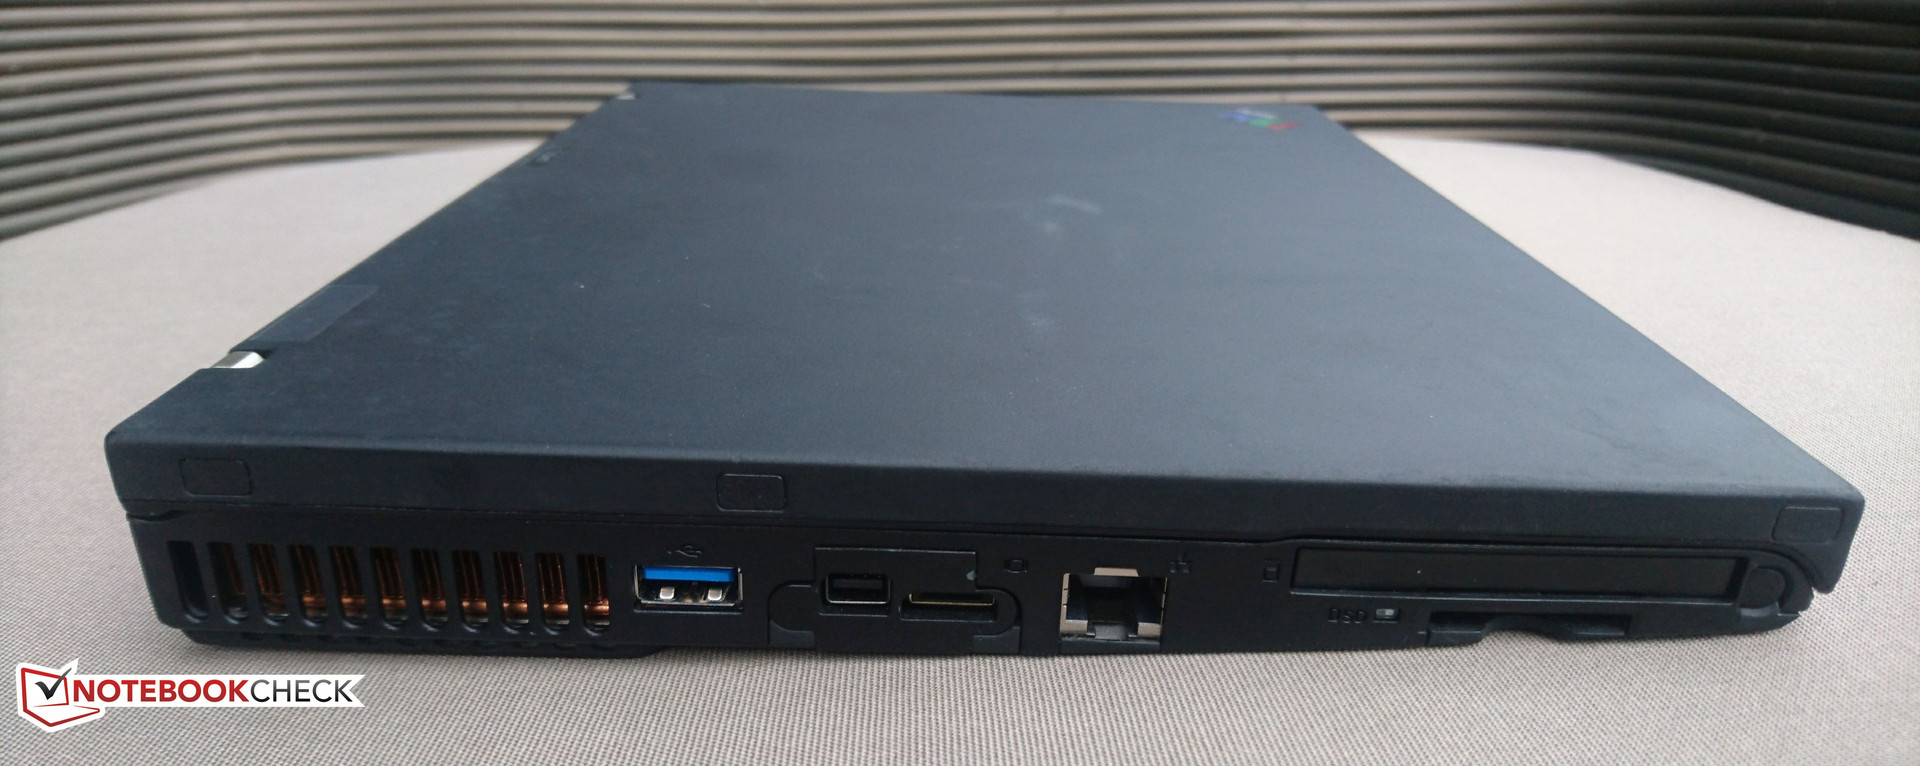
L'X62 usa il solido e compatto chassis del 2007 X61 e prova a modernizzarsi per le attività di lavoro quotidiane. Per la maggior parte, possiamo dire che l'X62 ci rimanda al 51nb per gli aspetti positivi: lo chassis è un classico ThinkPad, la tastiera non si flette ed è piacevole da usare, e le prestazioni della CPU di quinta generazione Broadwell ULV sono alla pari con portatili simili. Tuttavia, il display—sebbene con eccellente risoluzione 1400 x 1050 per un 12.1"—è scuro anche per gli standards ThinkPad. Potete comprare un kit upgrade retroilluminazione LED opzionale, ma cosa US$50. Il fatto che il display debba essere sempre a luminosità massima impatta sull'autonomia, e quindi una ampia batteria da 8-celle 75WHr diventa una necessità.
L'X62 è assolutamente unico e si colloca in un posto tutto suo. Non è un portatile per tutti, e per raggiungere il potenziale massimo bisogna aggiungere il kit di upgrade retroilluminazione LED.
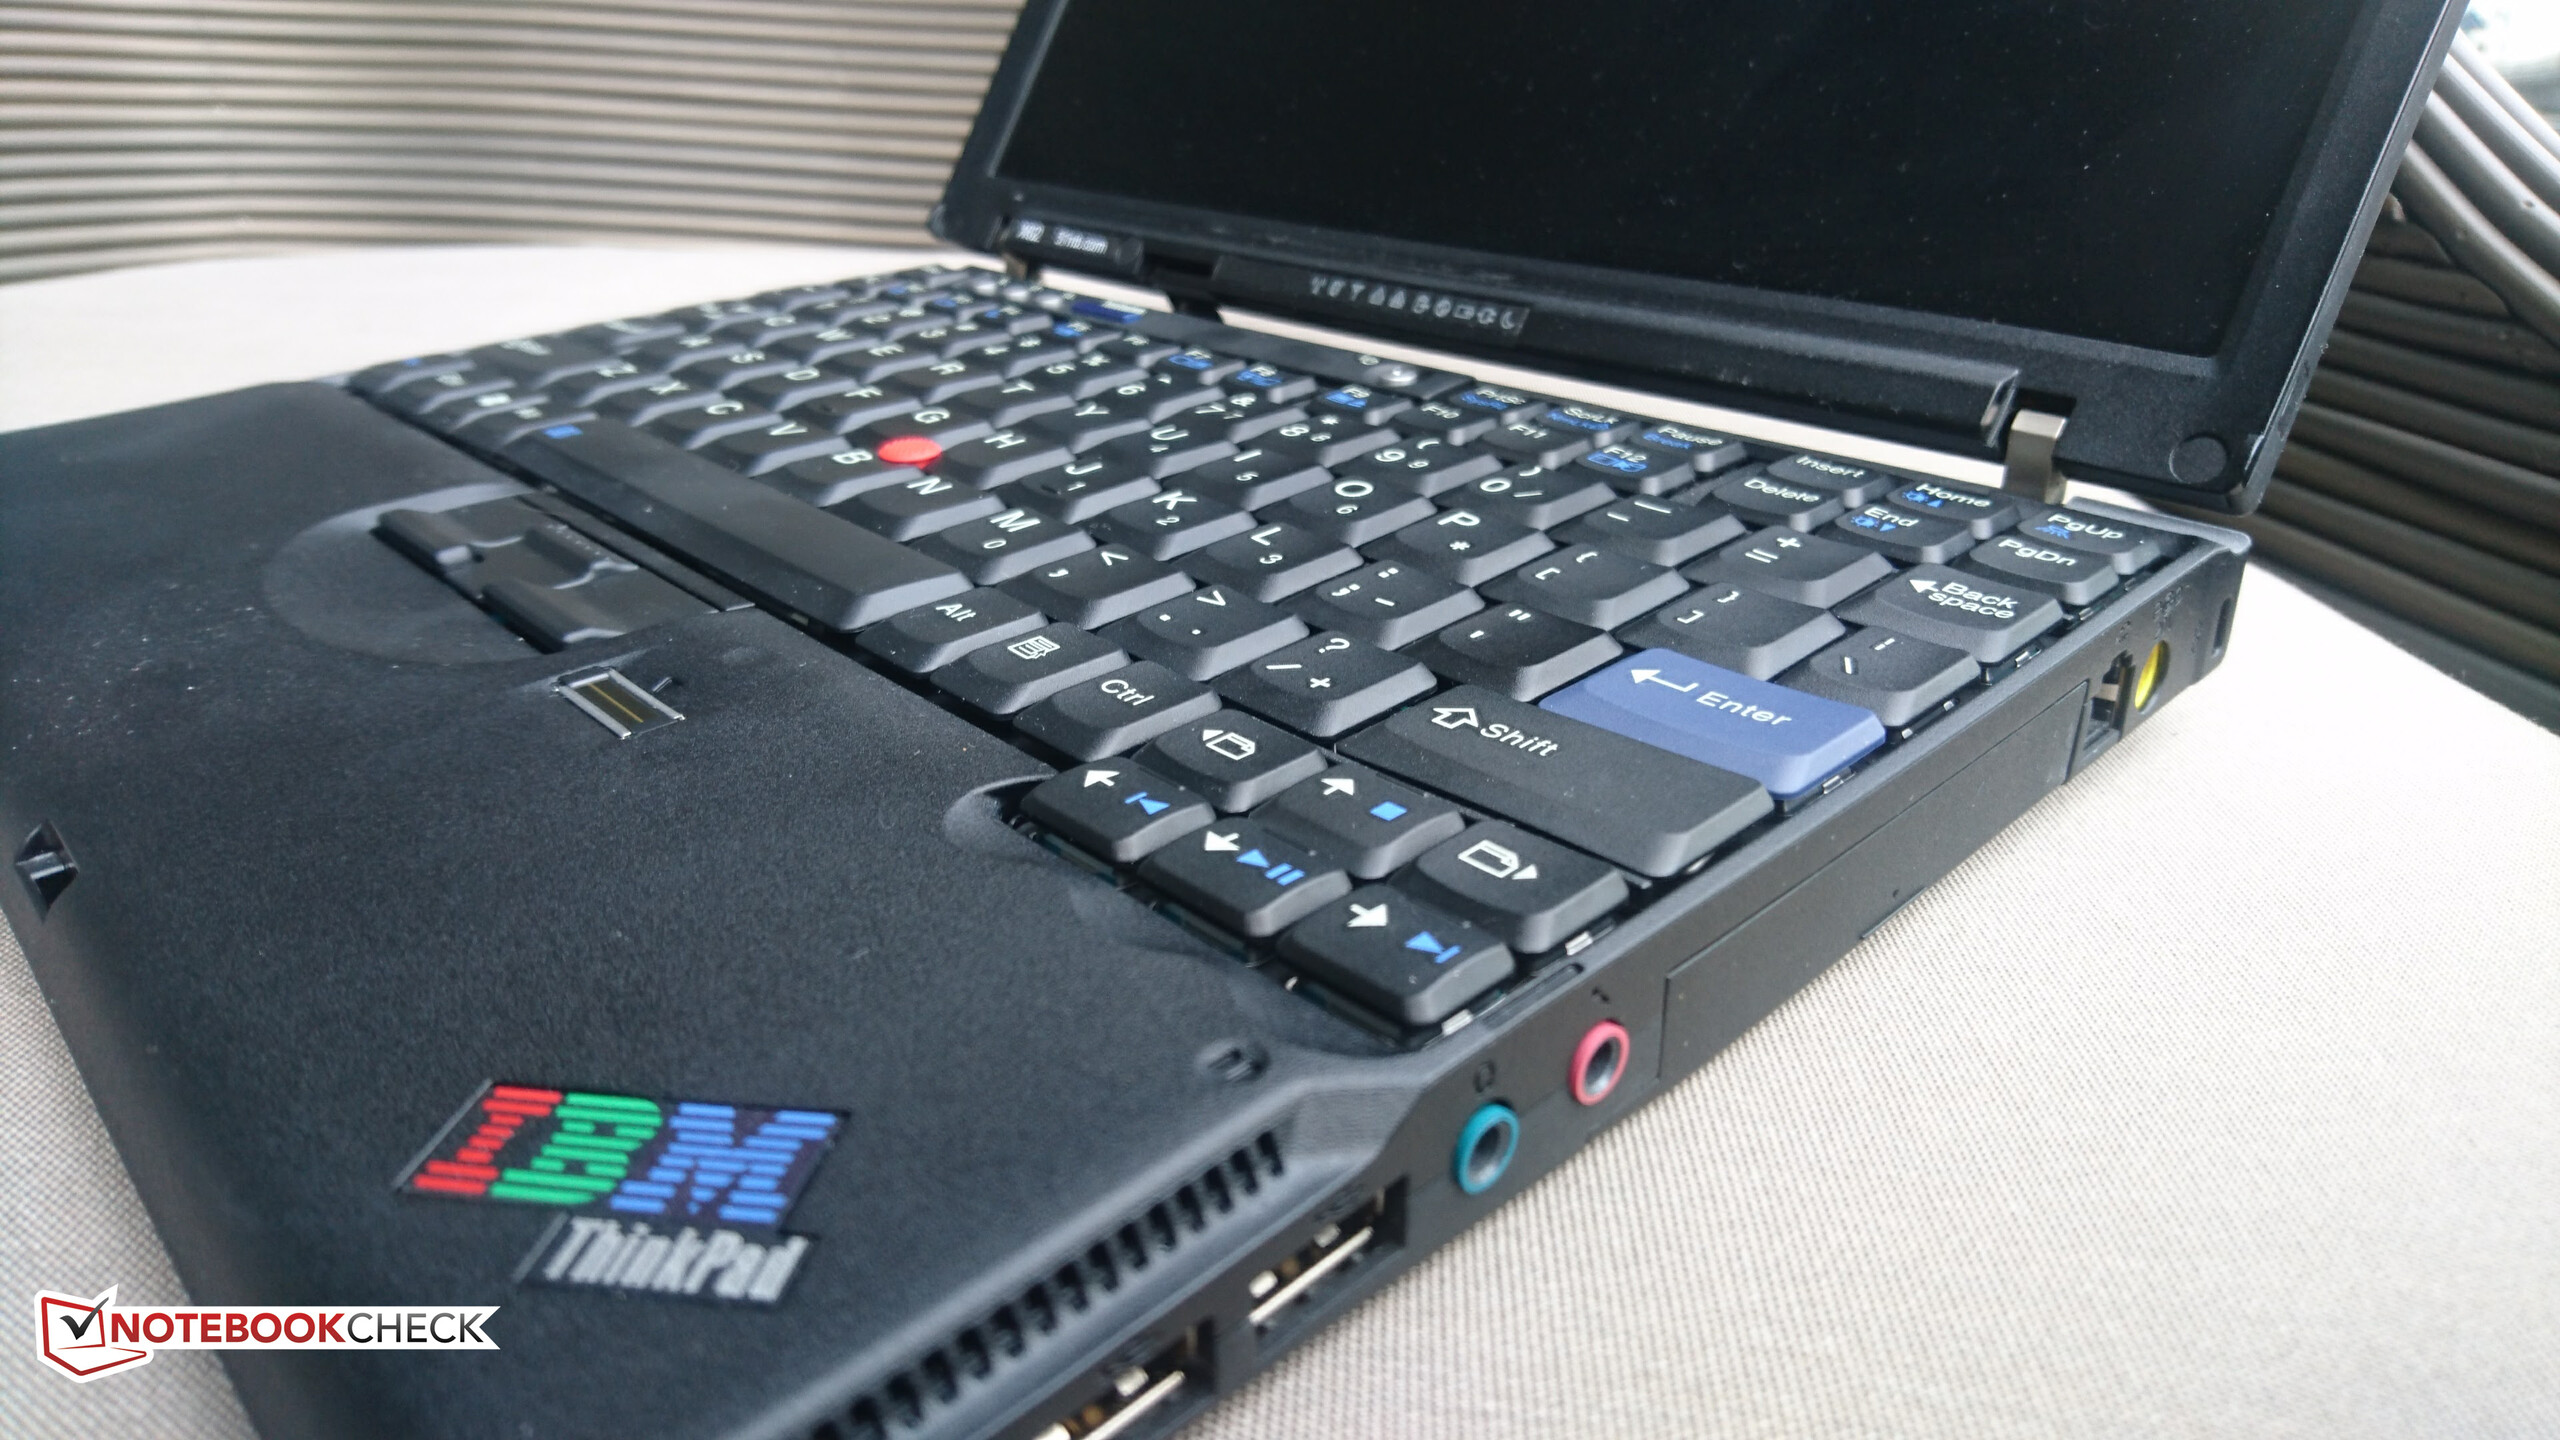
L'X62 è una dichiarazione d'amore ai classici ThinkPads, ThinkLights, e display 4:3. La necessità del kit lo rende adatto agli hobbisti e colodo che sono appassionati. Tuttavia, pensiamo che vada bene, in quanto potrebbe diventare un dispositivo per collezionisti. L'X62 (senza RAM, HDD, batteria o adattatore) costa ben US$750 per il modello i5. In futuro vedremo se l'X62, adotterà una retroilluminazione LED come standard e unità batteria ed adattatore.
Se siete interesati all'X62 o altre creazioni 51nb, potete vedere il loro sito inglese per contattarli.
Nota: si tratta di una recensione breve, con alcune sezioni non tradotte, per la versione integrale in inglese guardate qui.
Price comparison
