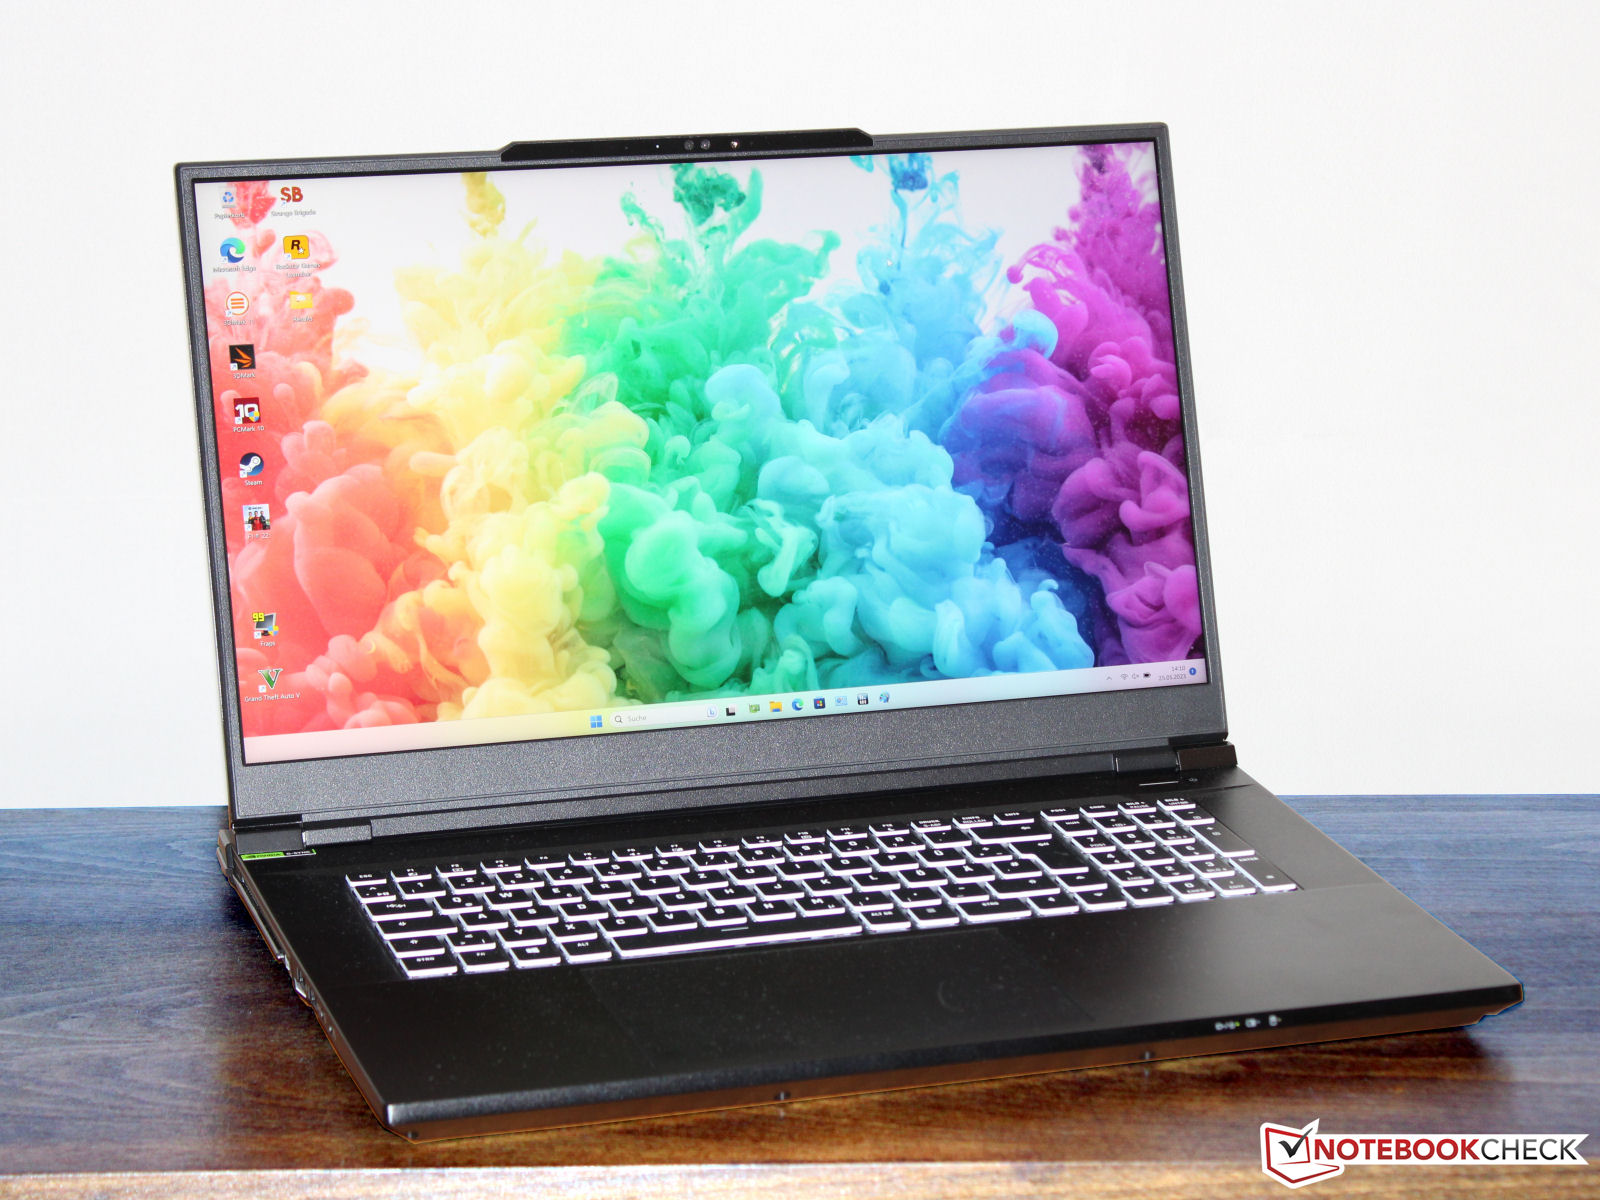
Recensione dello Schenker Key 17 Pro (Early 23): gaming notebook 4k con Core i9 e RTX 4090
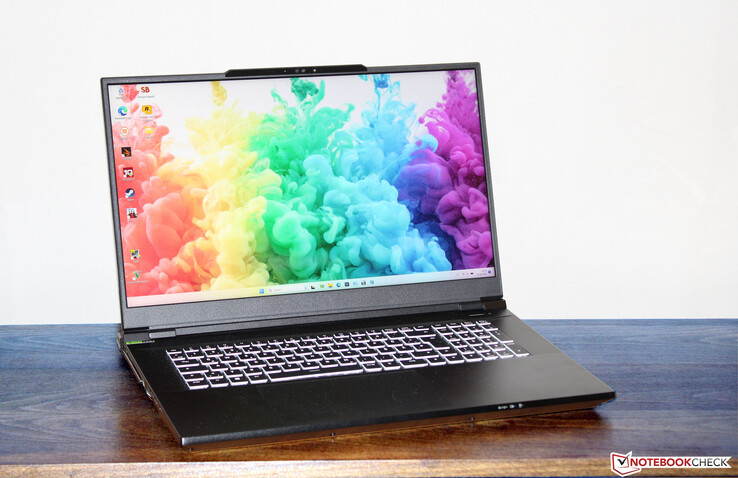
Il potente Key 17 Pro è destinato a creativi e giocatori. Raptor Lake e Ada Lovelace forniscono la potenza di calcolo necessaria al portatile, che dispone di un processore Core i9-13900HX e unaGeForce RTX 4090ed è basato su un barebone Clevo (X370SNW-G). È in competizione con dispositivi come MSI Stealth 17 Studio A13VH, il Asus ROG Strix Scar 17 G733PY, il Aorus 17X AZF e il Medion Erazer Beast X40.
Potenziali concorrenti a confronto
Punteggio | Data | Modello | Peso | Altezza | Dimensione | Risoluzione | Prezzo |
|---|---|---|---|---|---|---|---|
| 85.5 % v7 (old) | 06/2023 | Schenker Key 17 Pro (Early 23) i9-13900HX, GeForce RTX 4090 Laptop GPU | 3.4 kg | 24.9 mm | 17.30" | 3840x2160 | |
| 89.2 % v7 (old) | 04/2023 | MSI Stealth 17 Studio A13VH-014 i9-13900H, GeForce RTX 4080 Laptop GPU | 3 kg | 21.3 mm | 17.30" | 3840x2160 | |
| 88.3 % v7 (old) | 04/2023 | Asus ROG Strix Scar 17 G733PY-XS96 R9 7945HX, GeForce RTX 4090 Laptop GPU | 2.9 kg | 28.3 mm | 17.30" | 2560x1440 | |
| 86 % v7 (old) | 04/2023 | Aorus 17X AZF i9-13900HX, GeForce RTX 4090 Laptop GPU | 2.9 kg | 21.8 mm | 17.30" | 2560x1440 | |
| 88.4 % v7 (old) | 03/2023 | Medion Erazer Beast X40 i9-13900HX, GeForce RTX 4090 Laptop GPU | 2.9 kg | 33 mm | 17.00" | 2560x1600 |
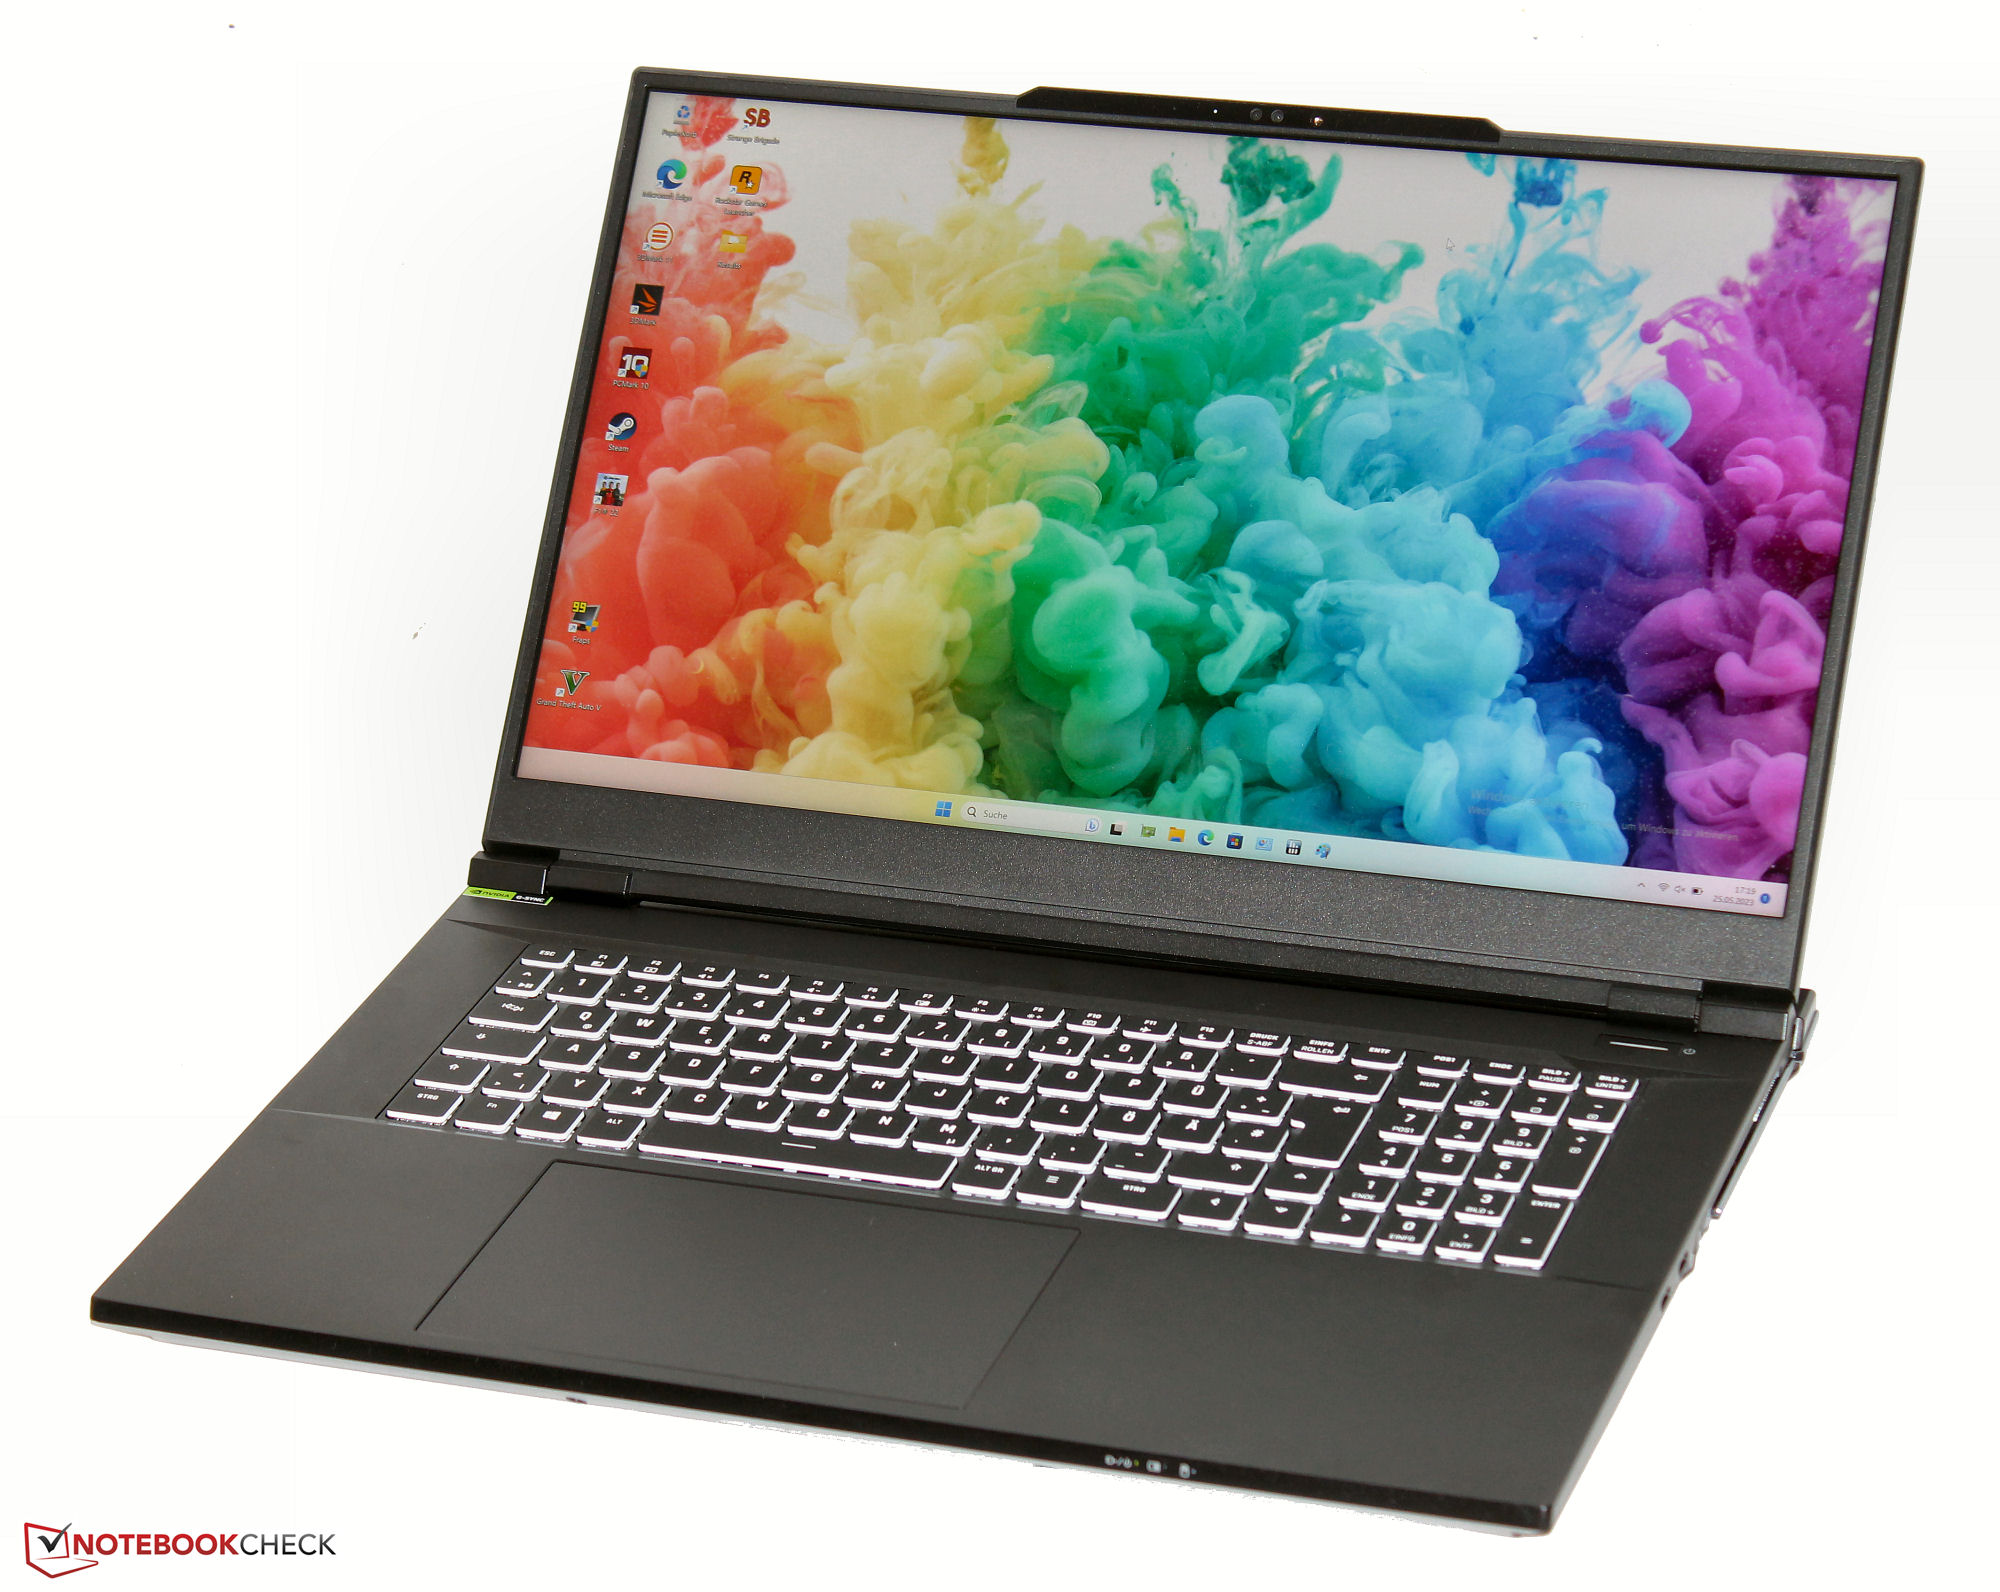
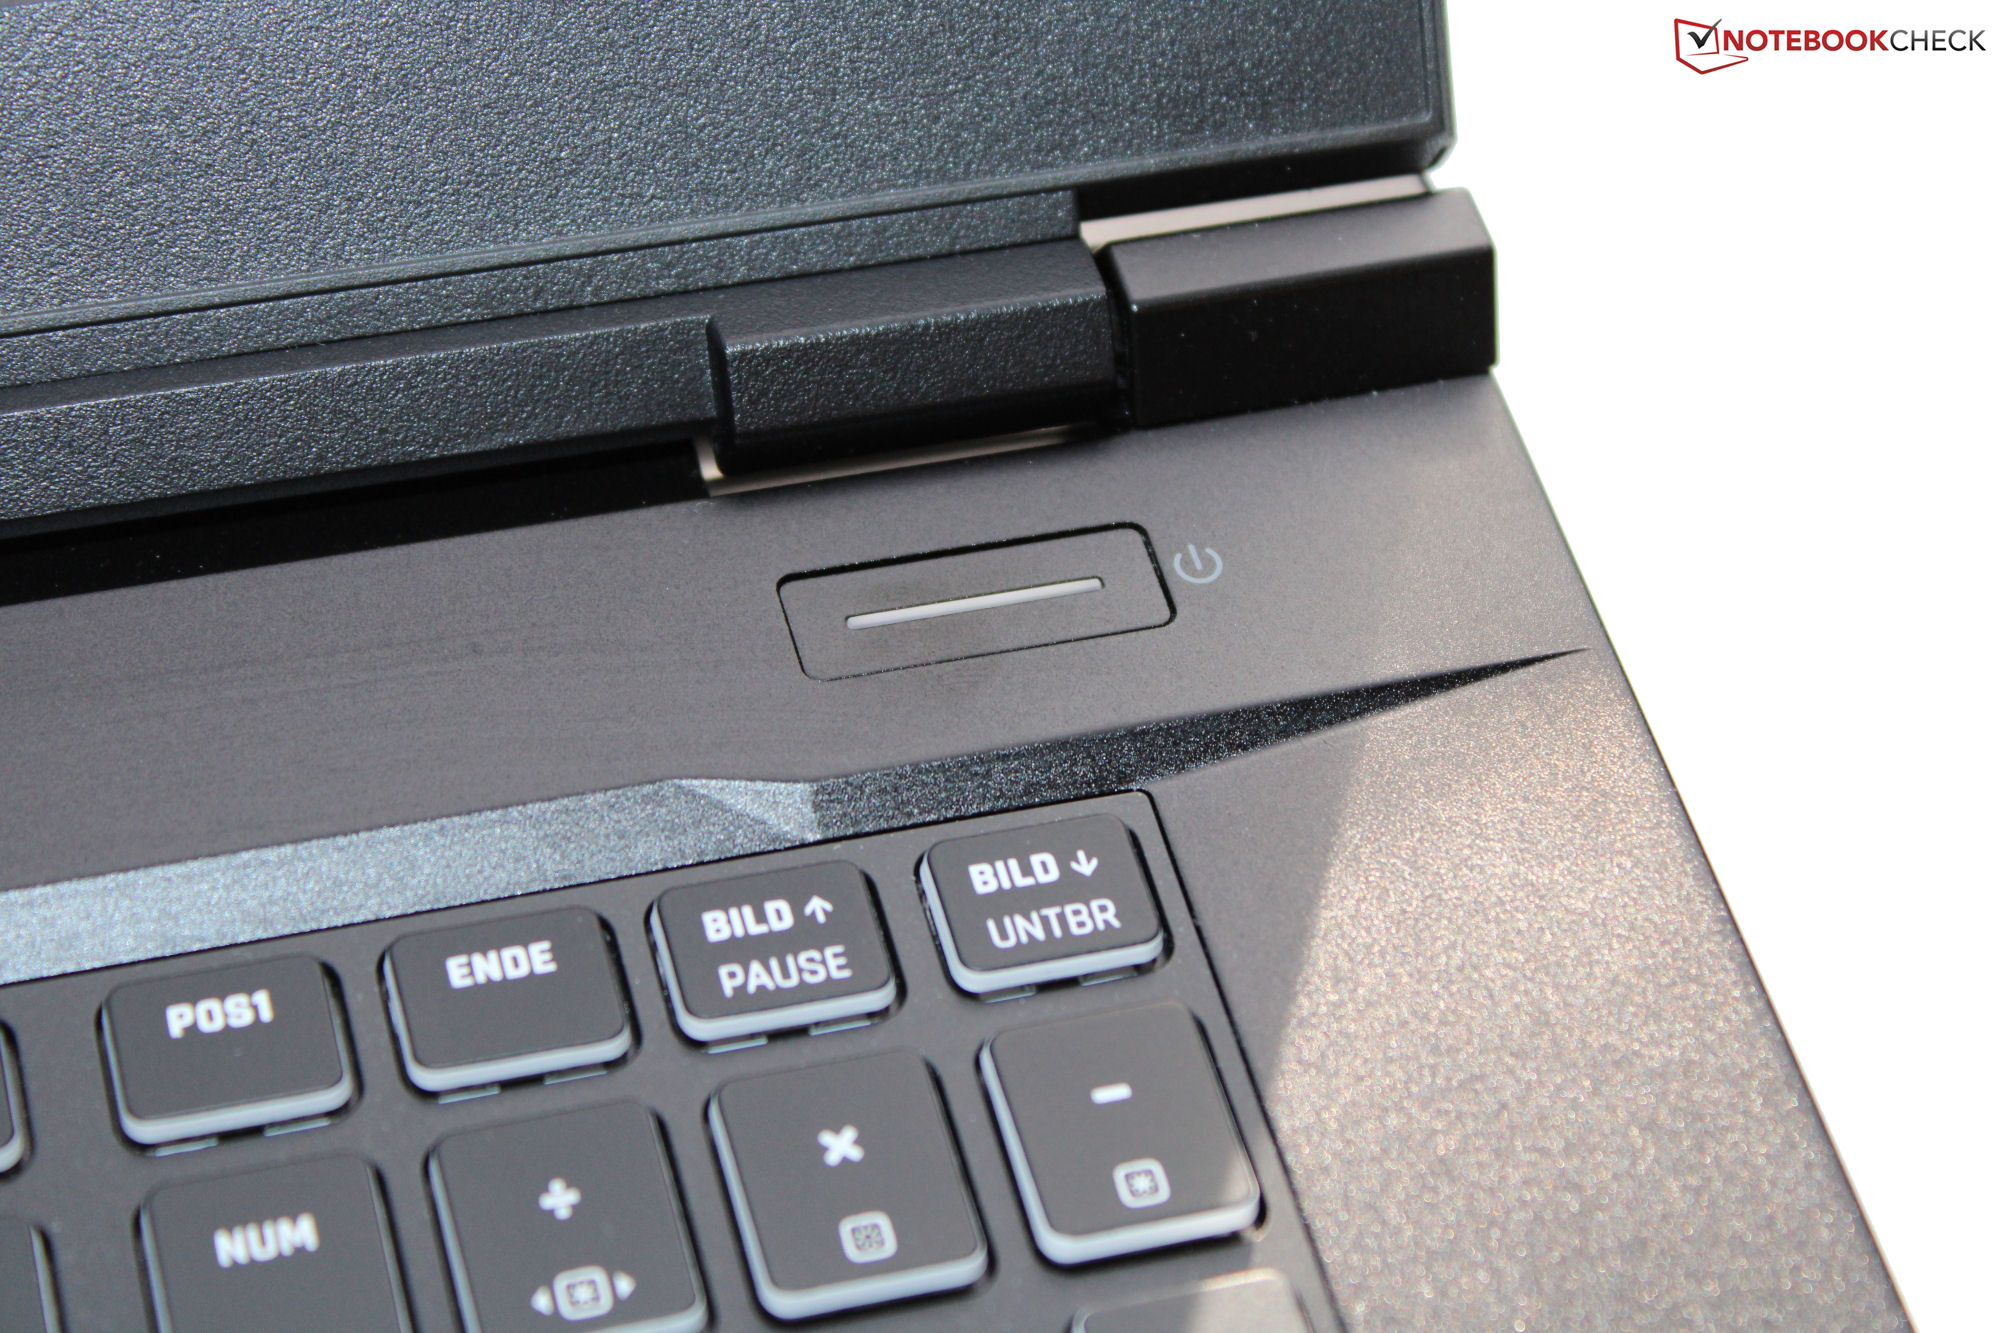
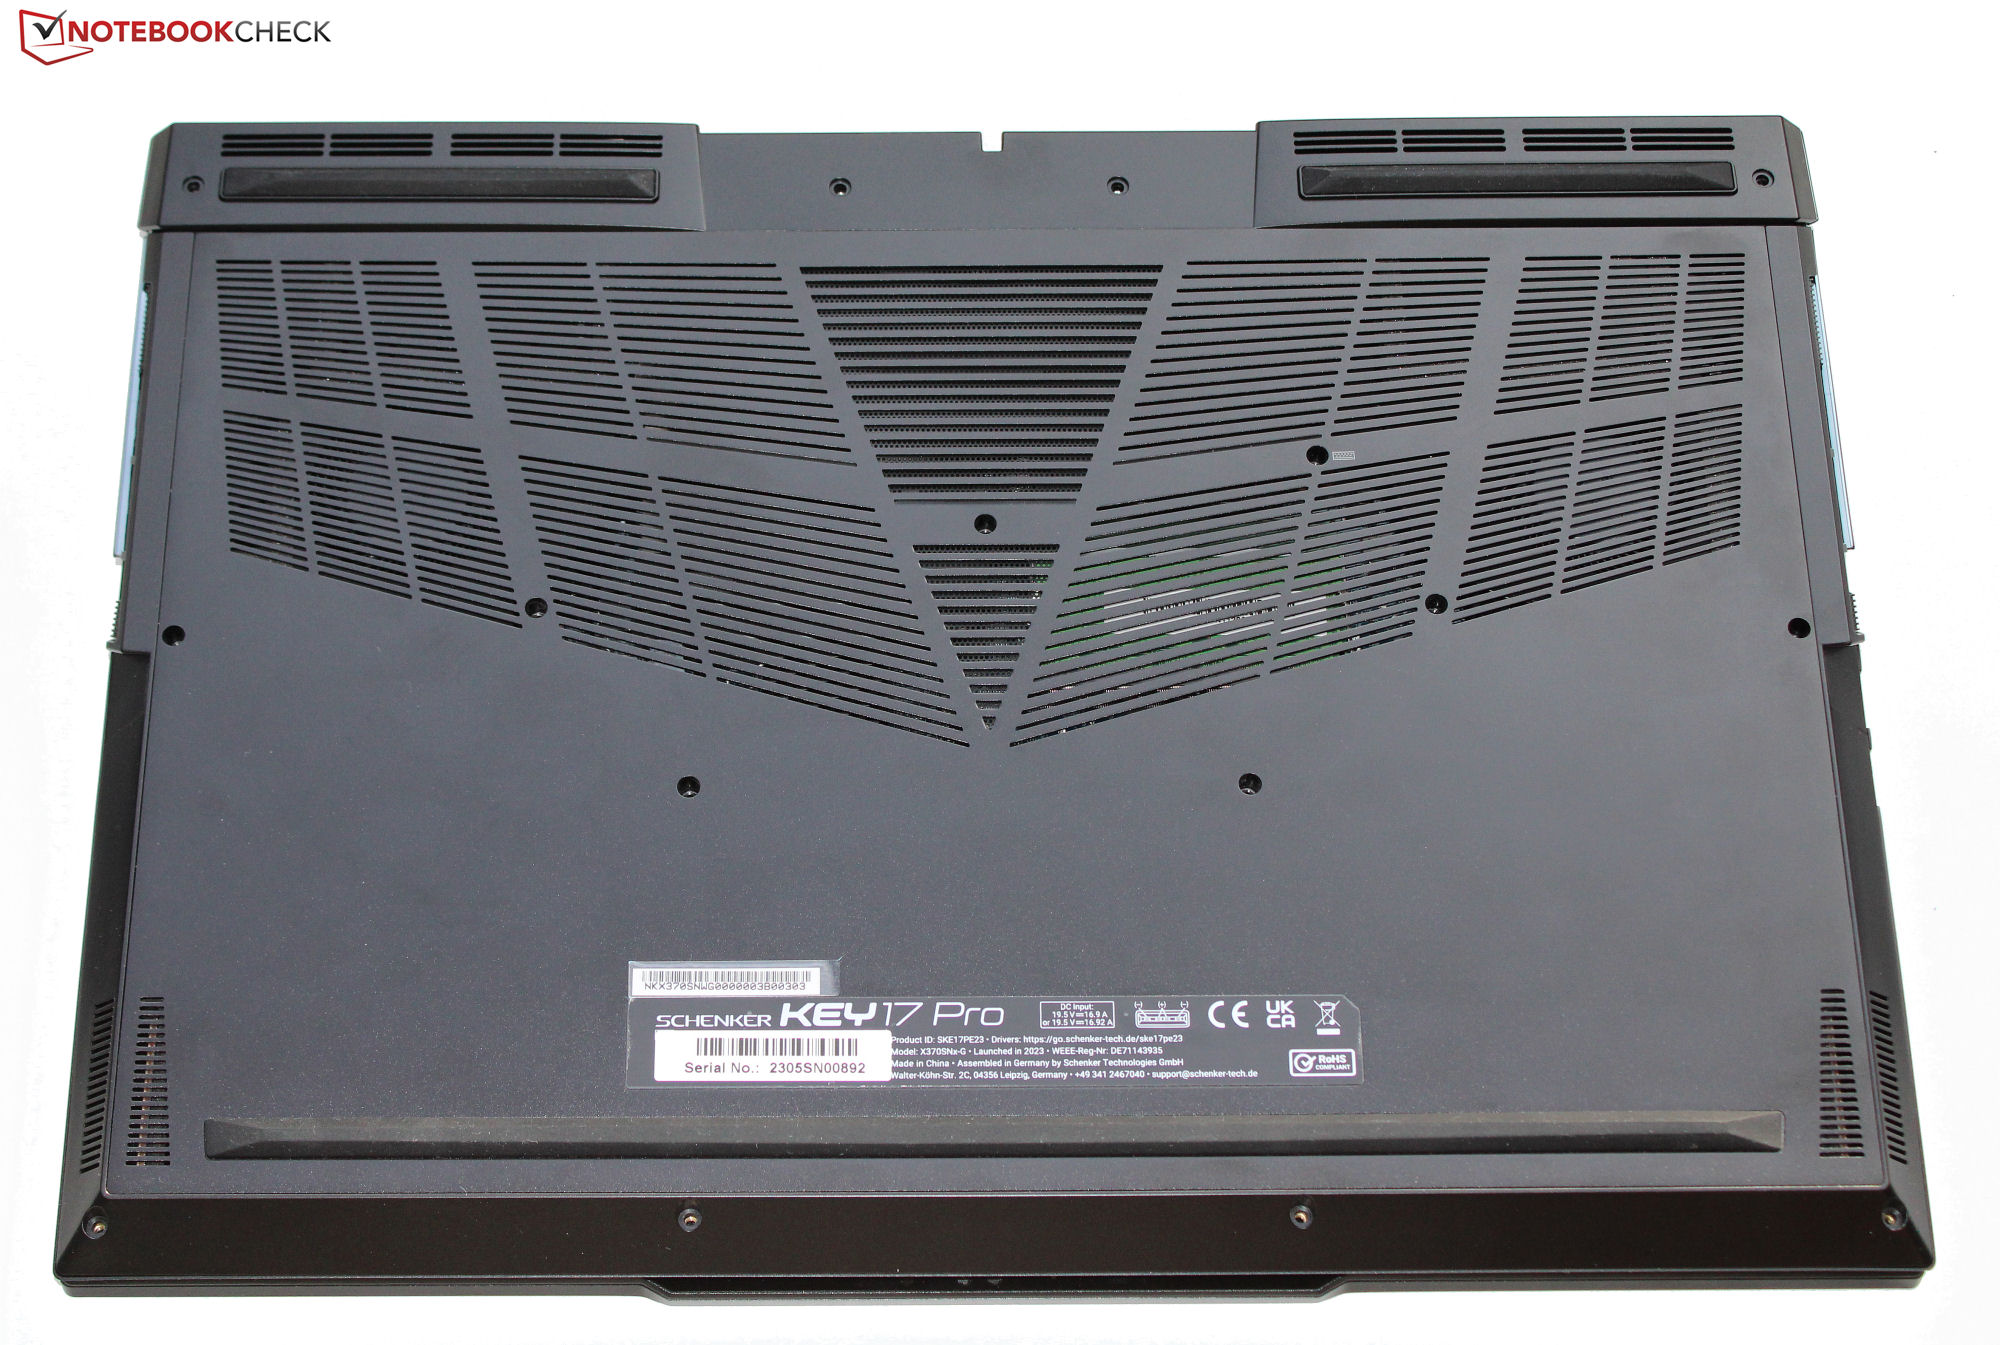
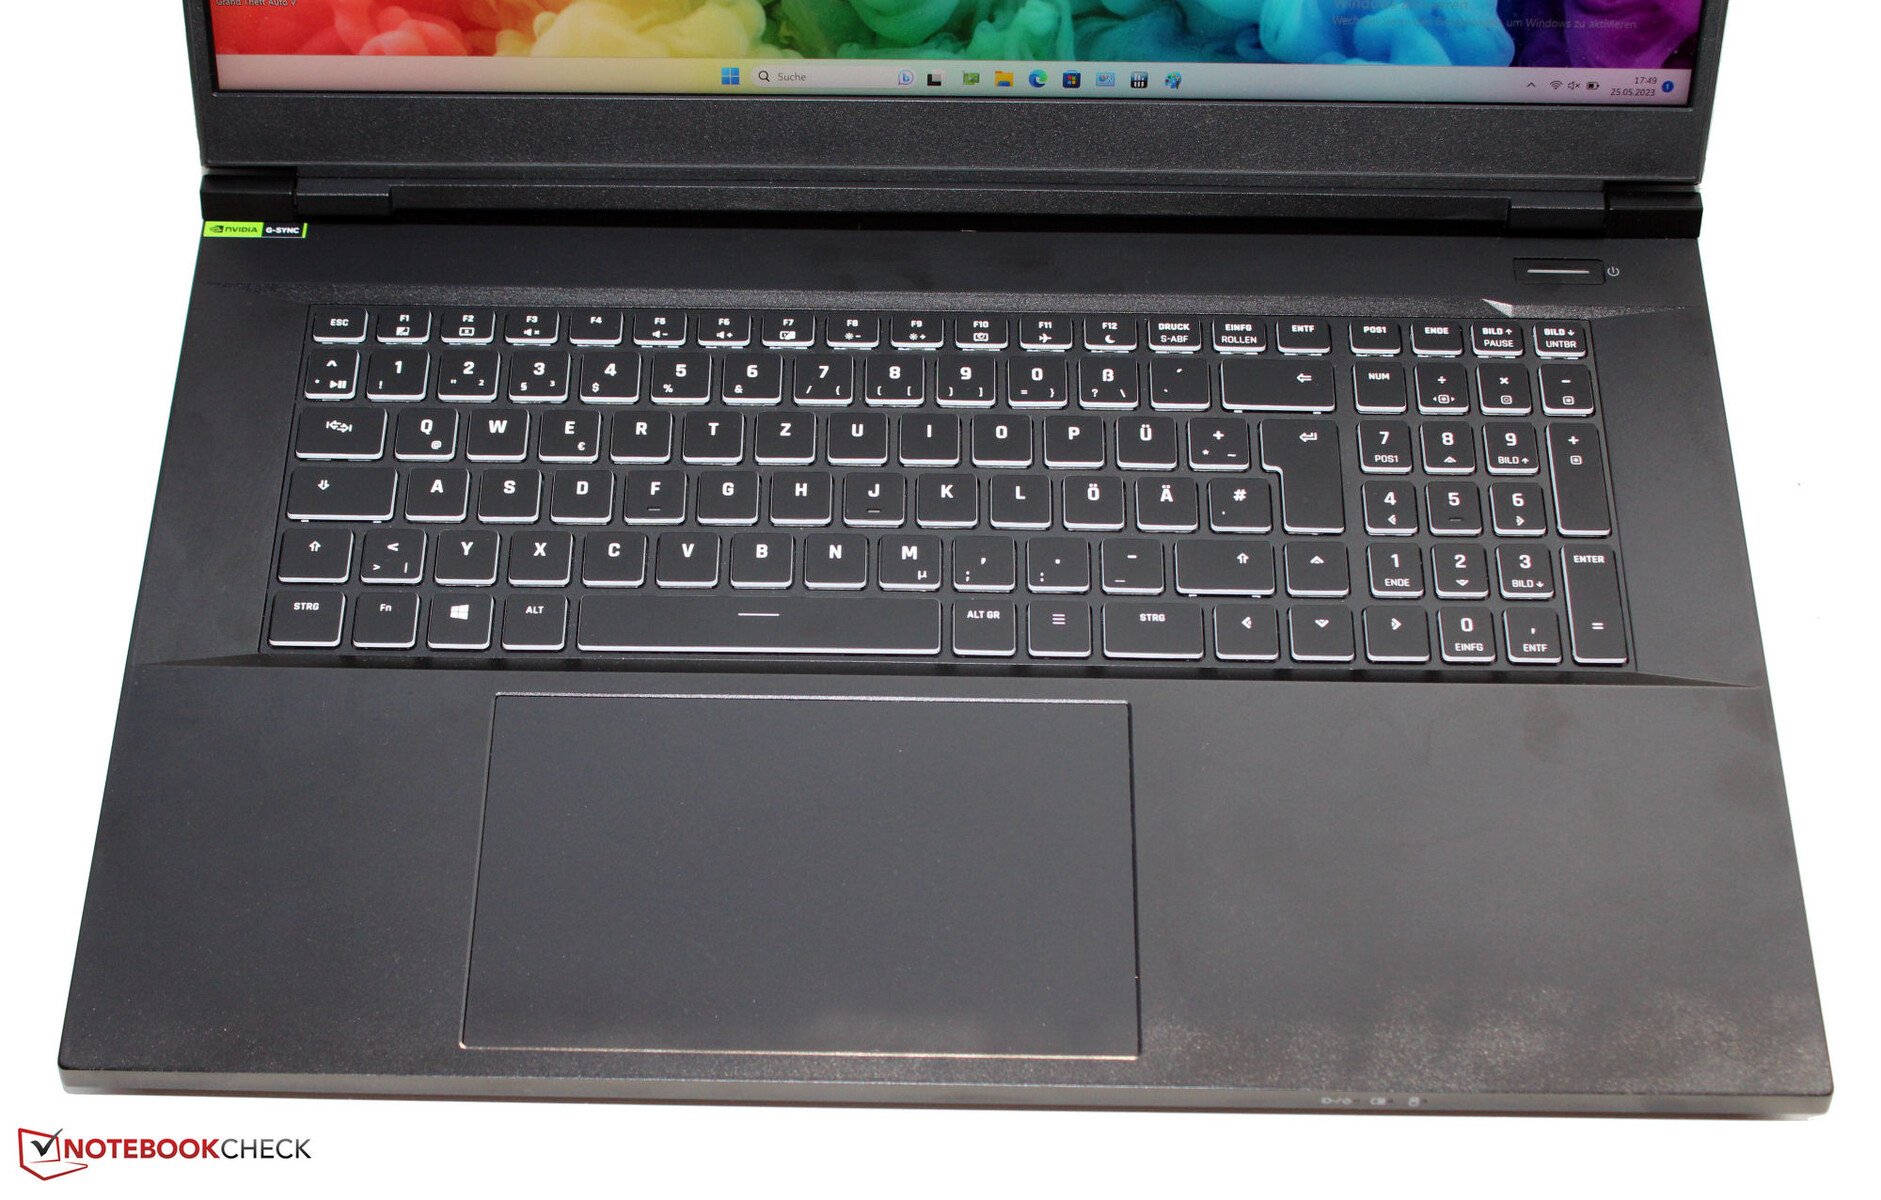
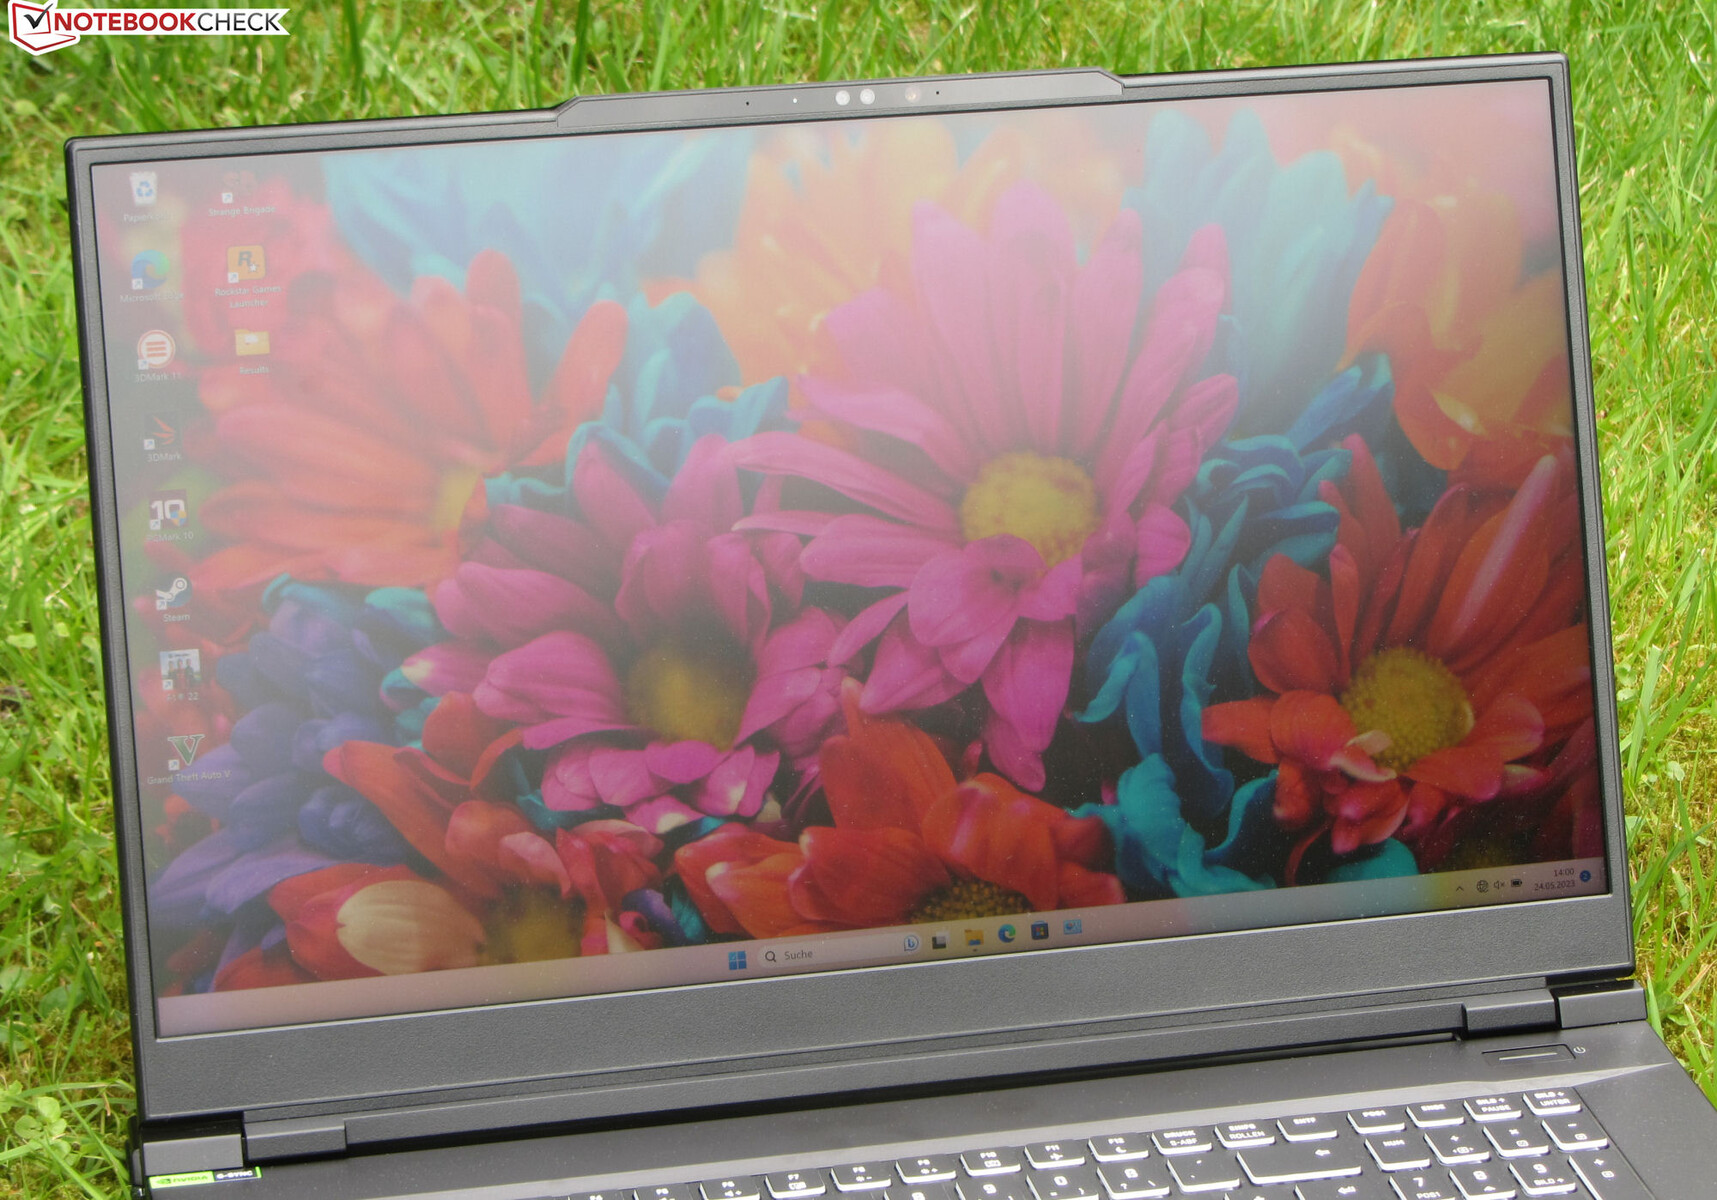
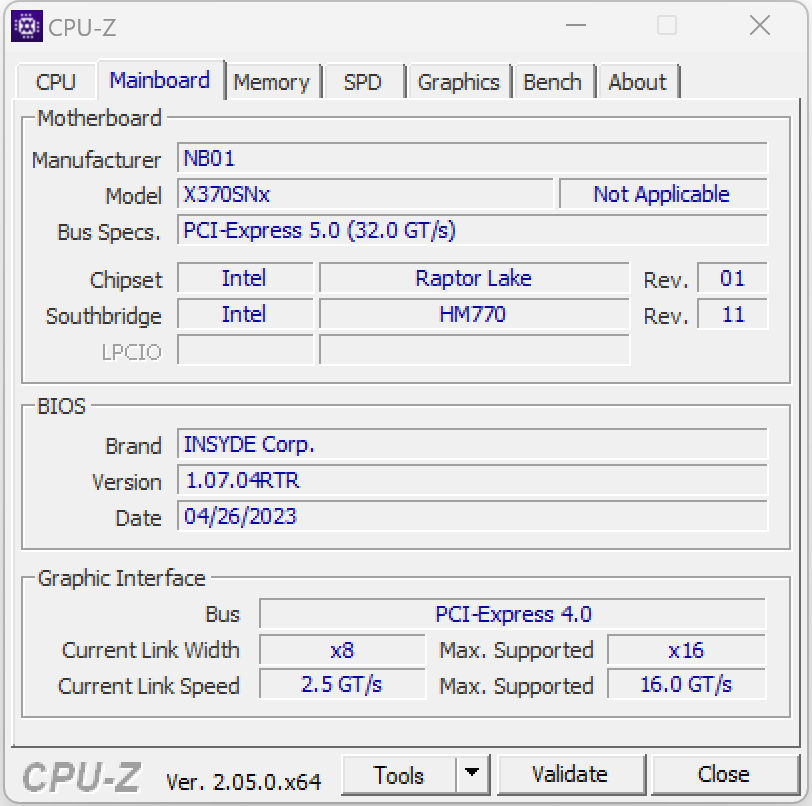
Case e specifiche - Clevo barebone che offre Thunderbolt 4
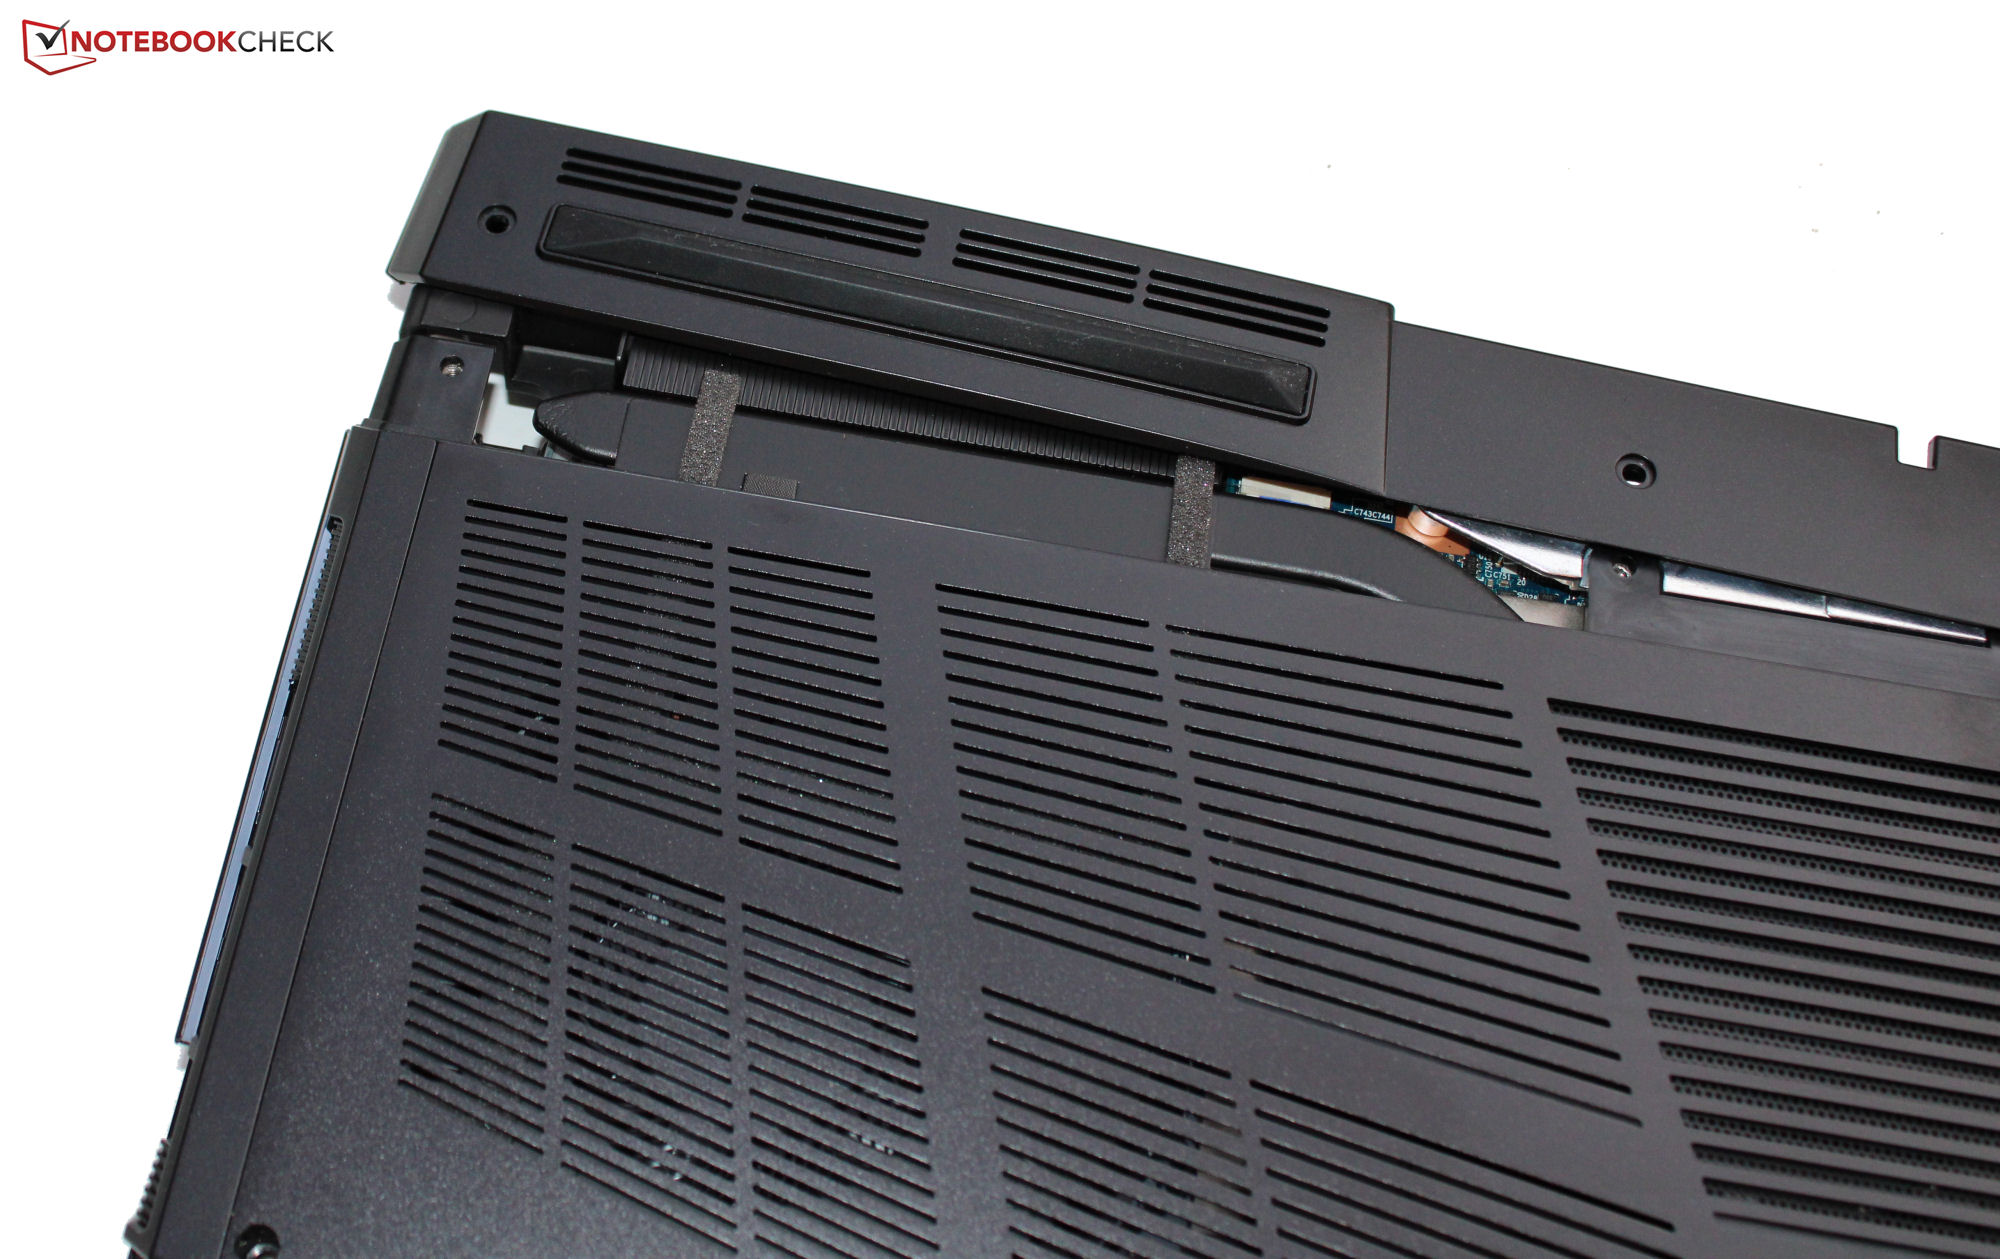
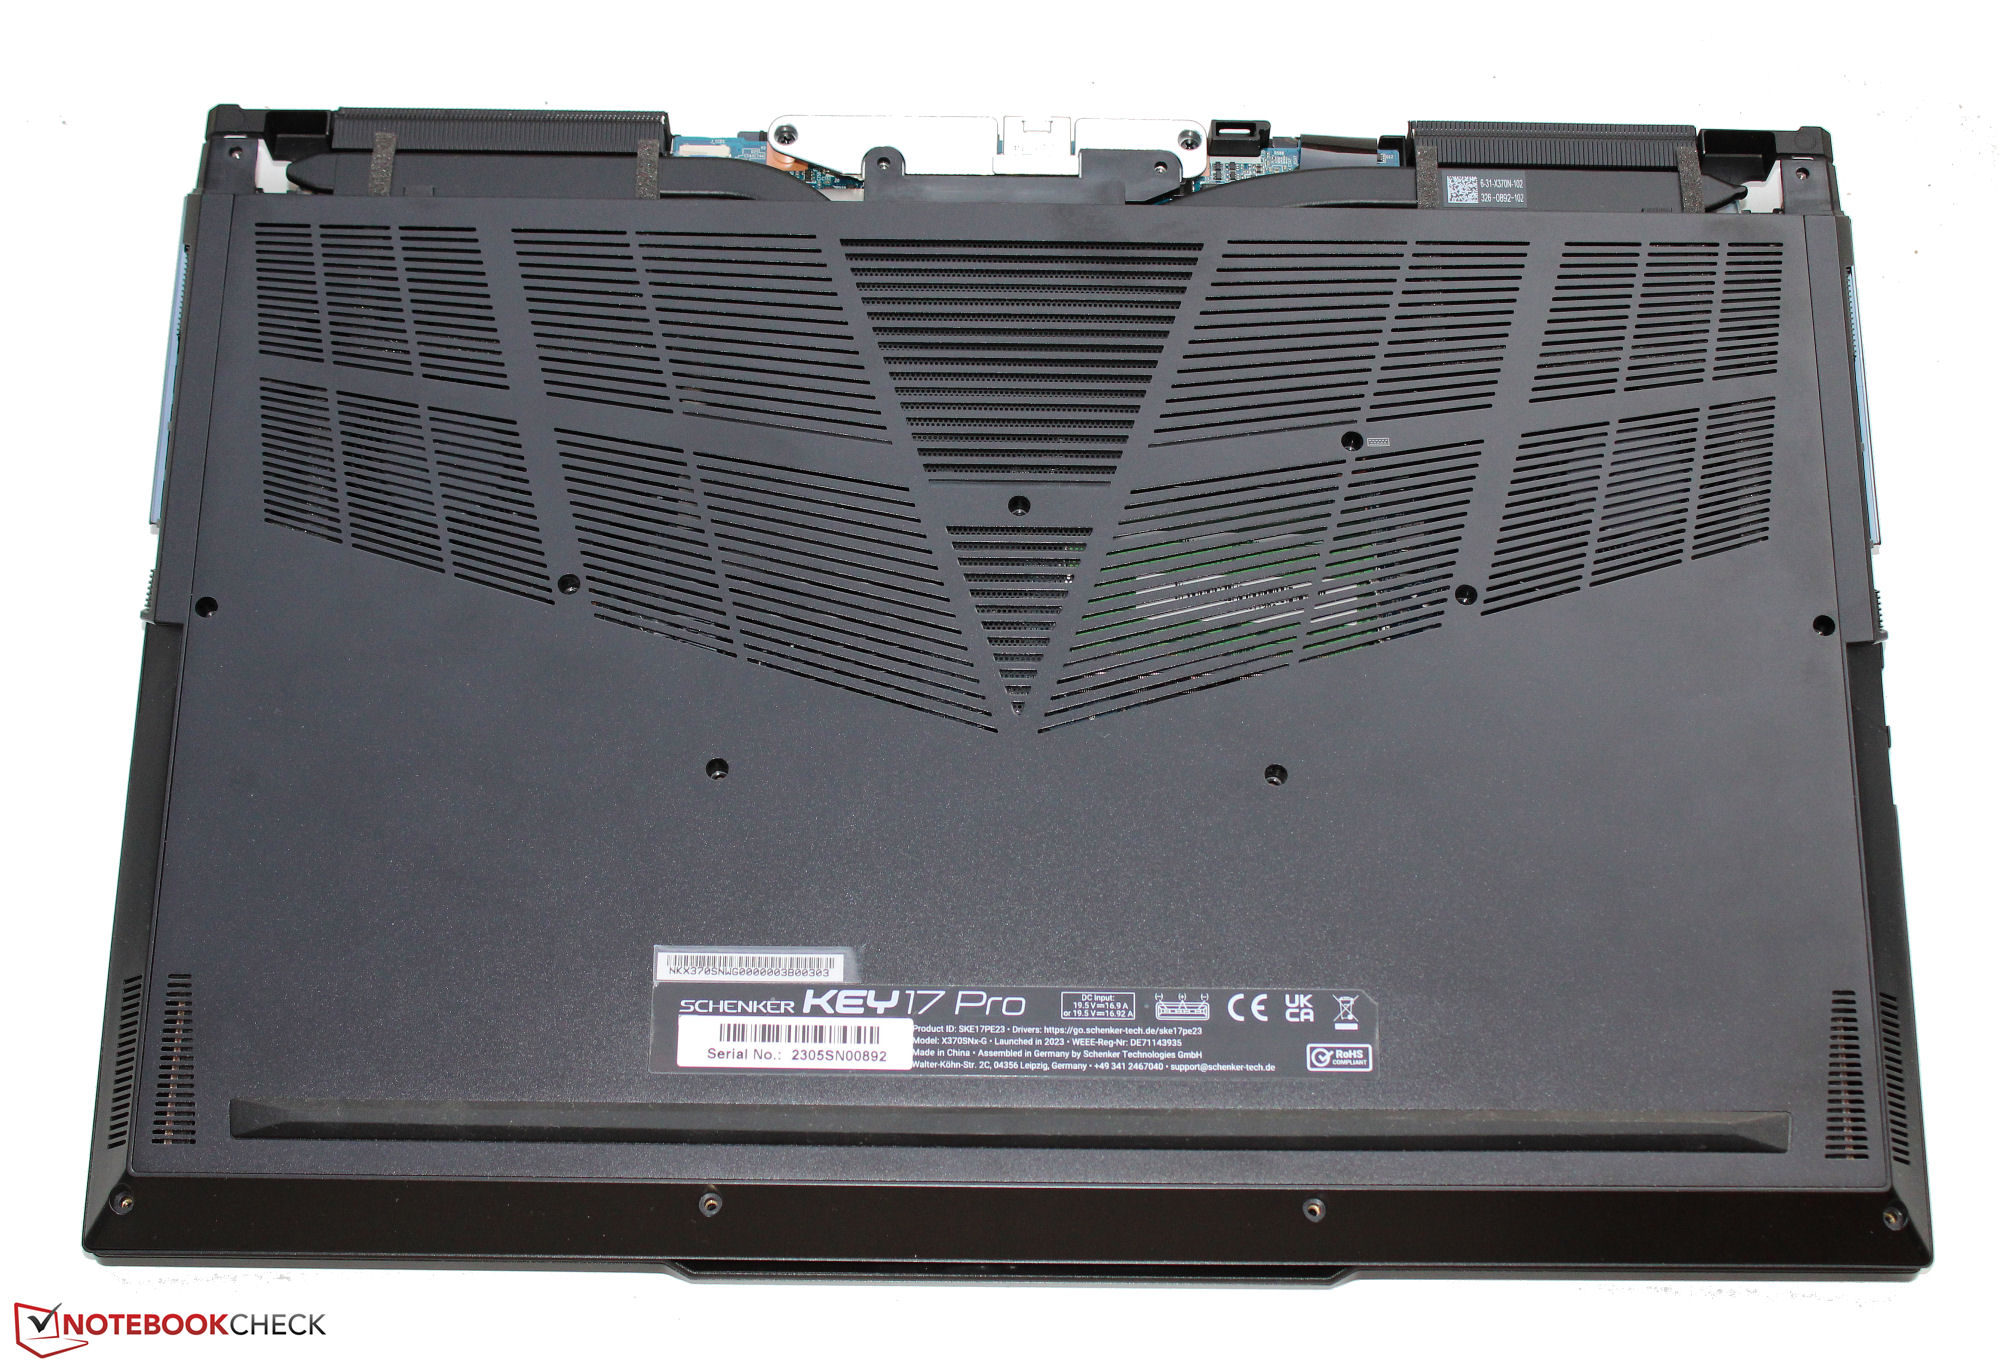
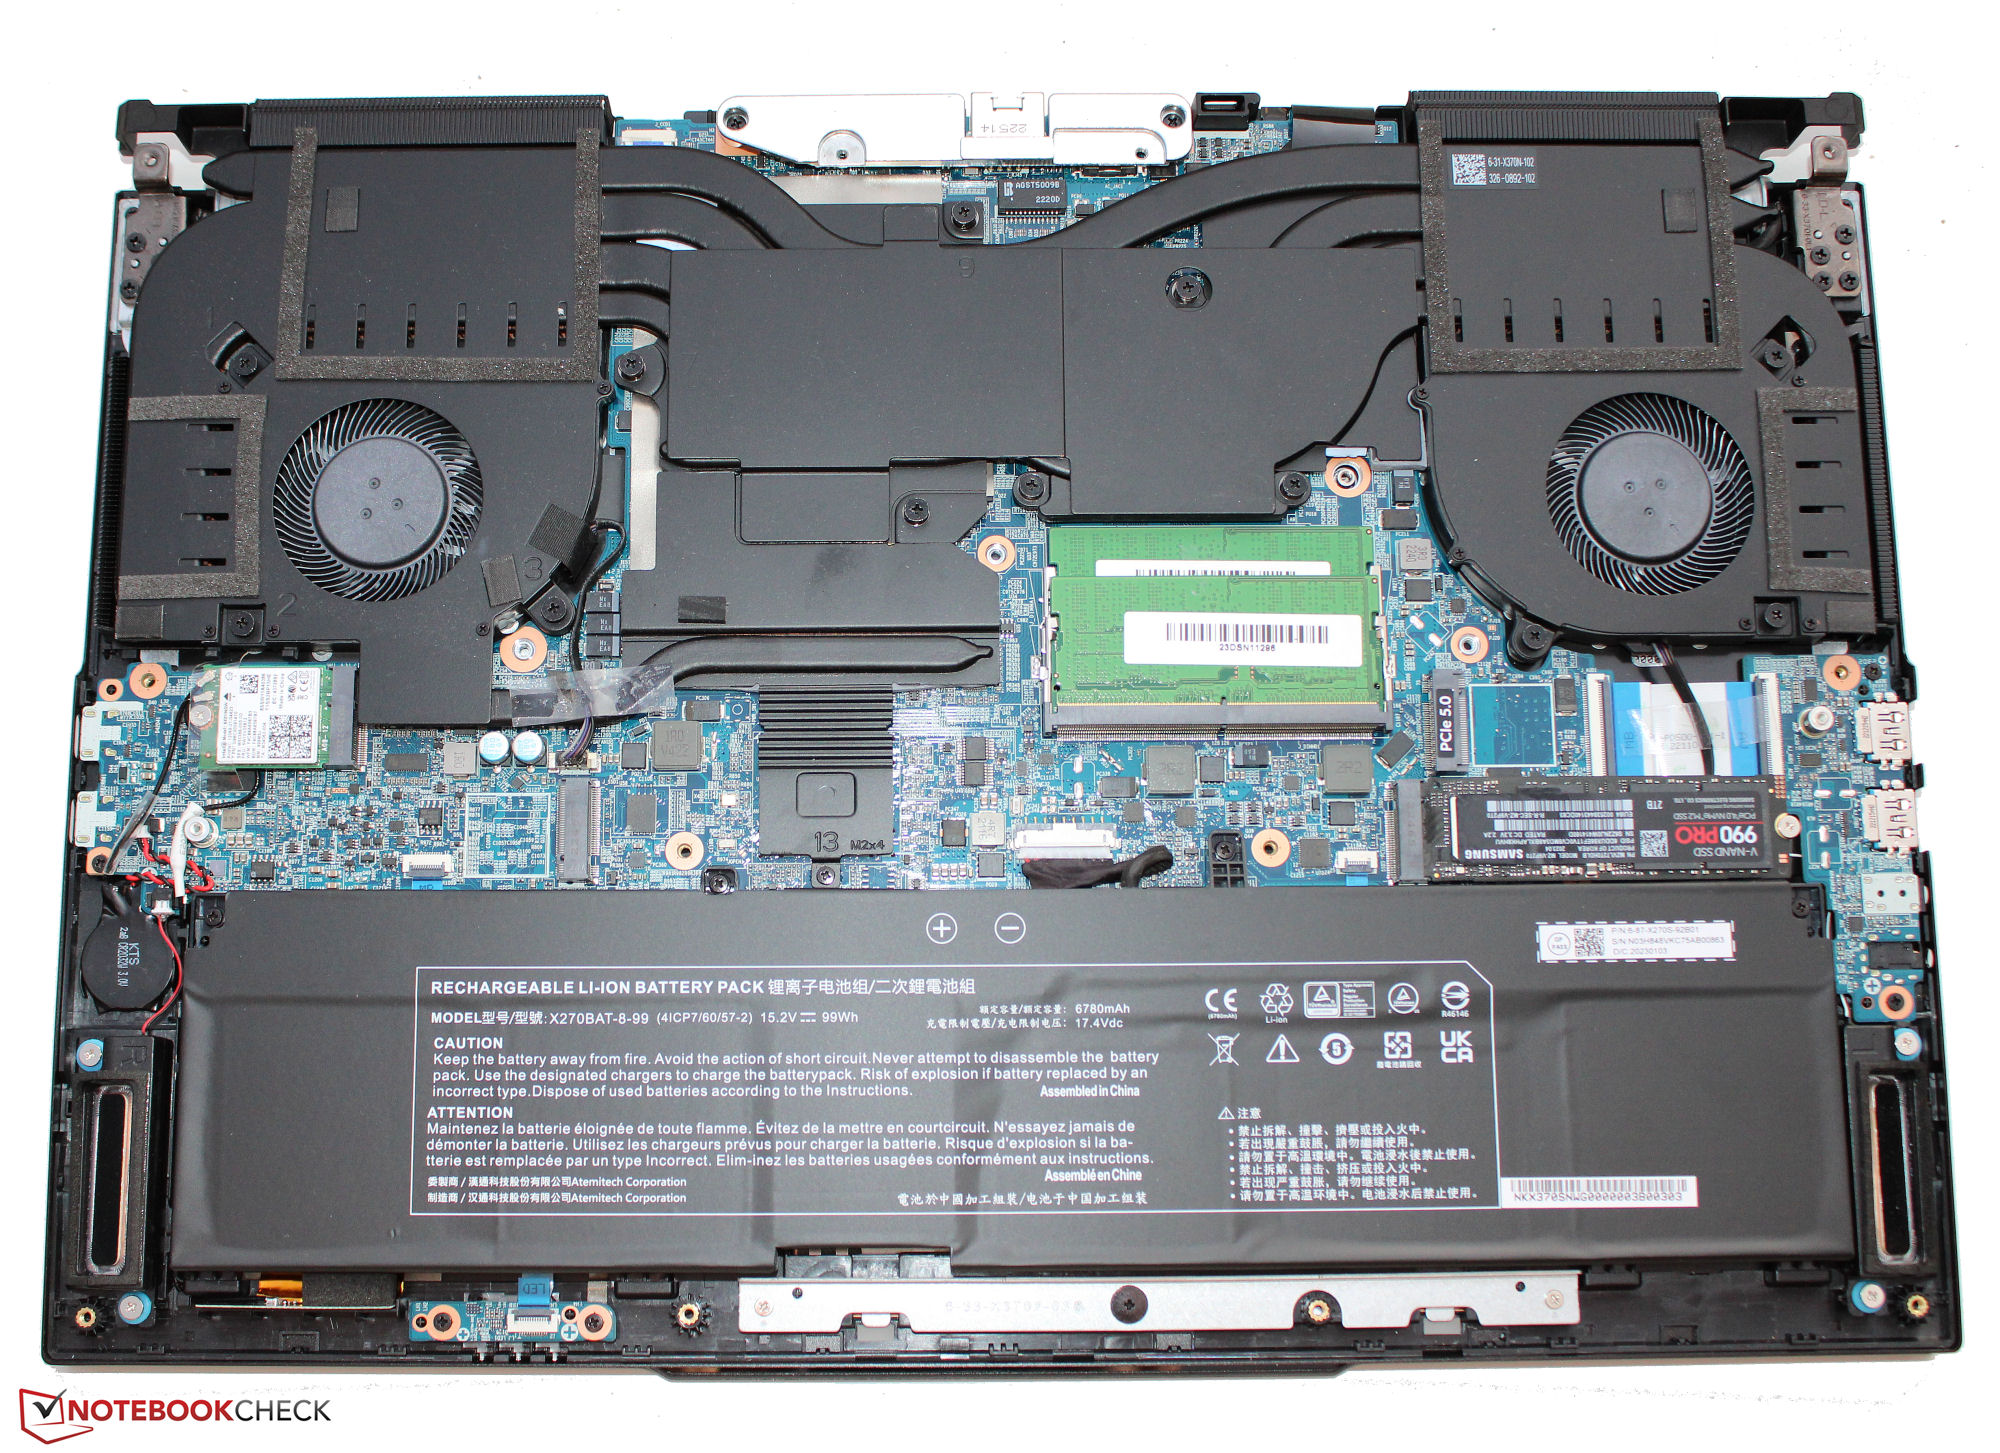
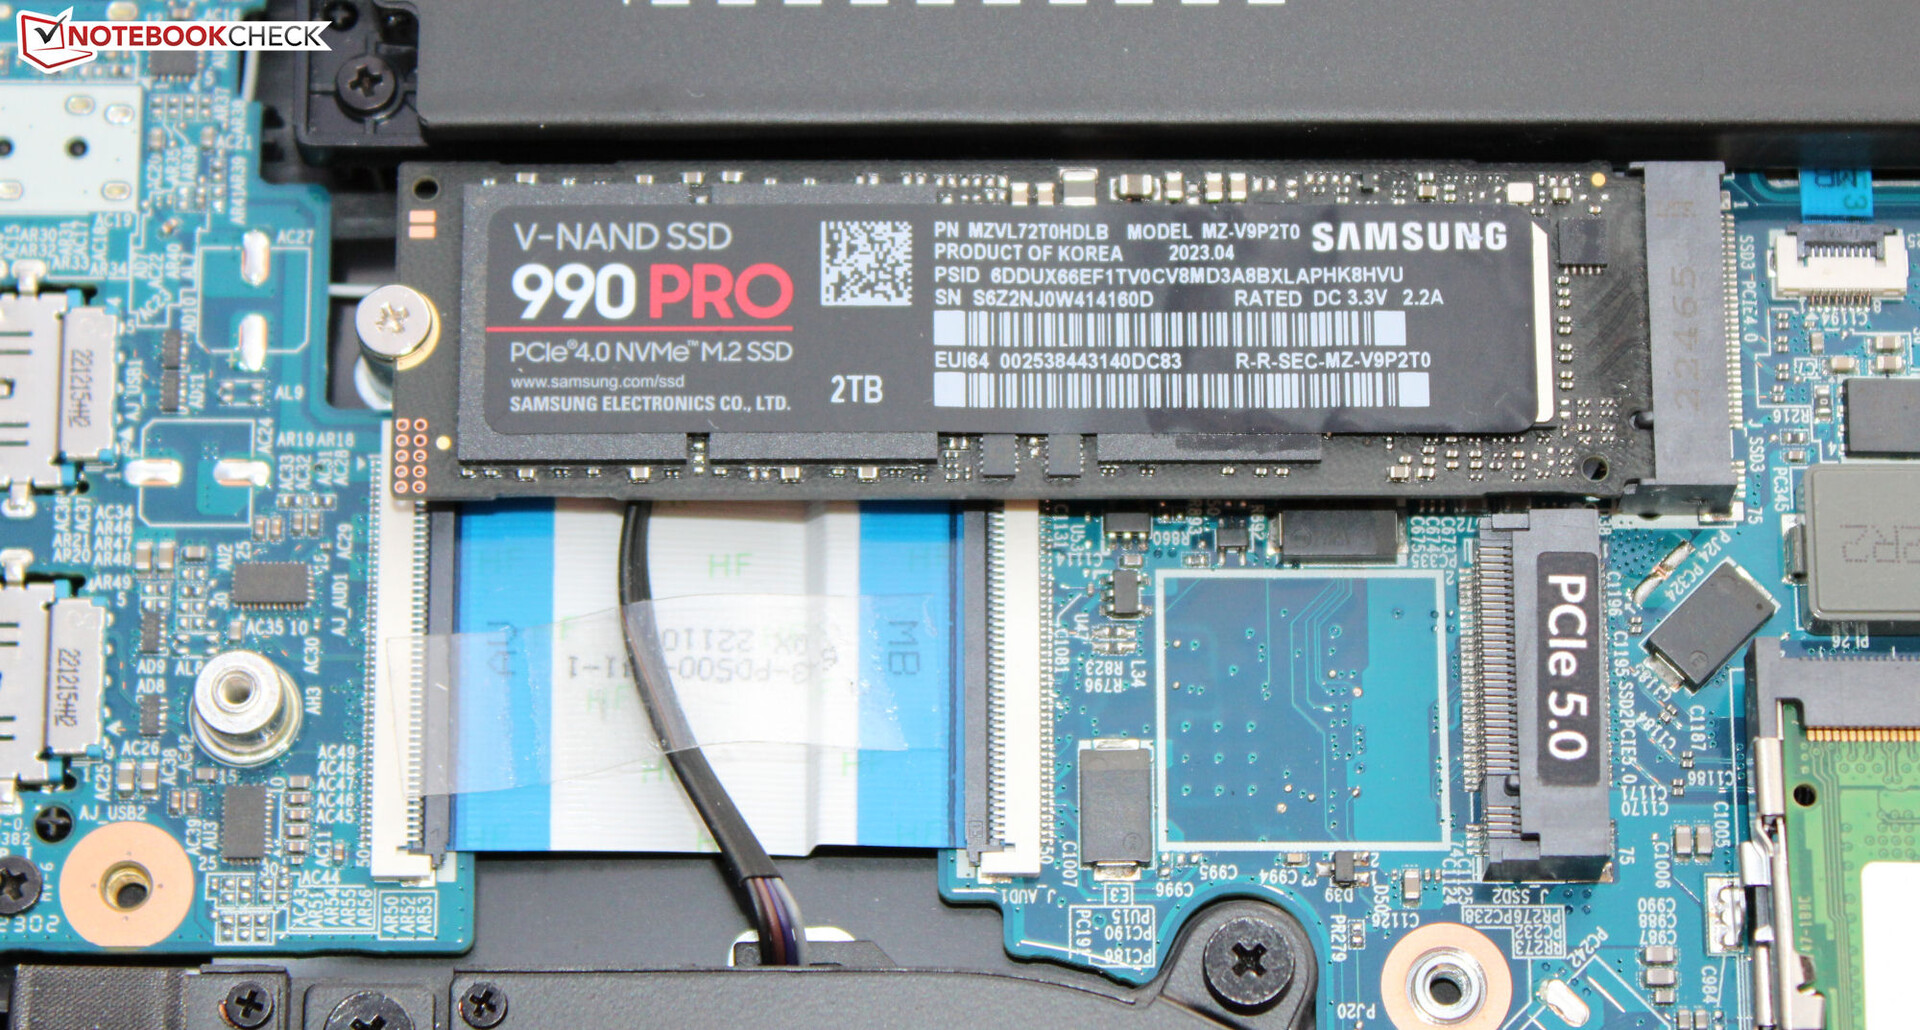
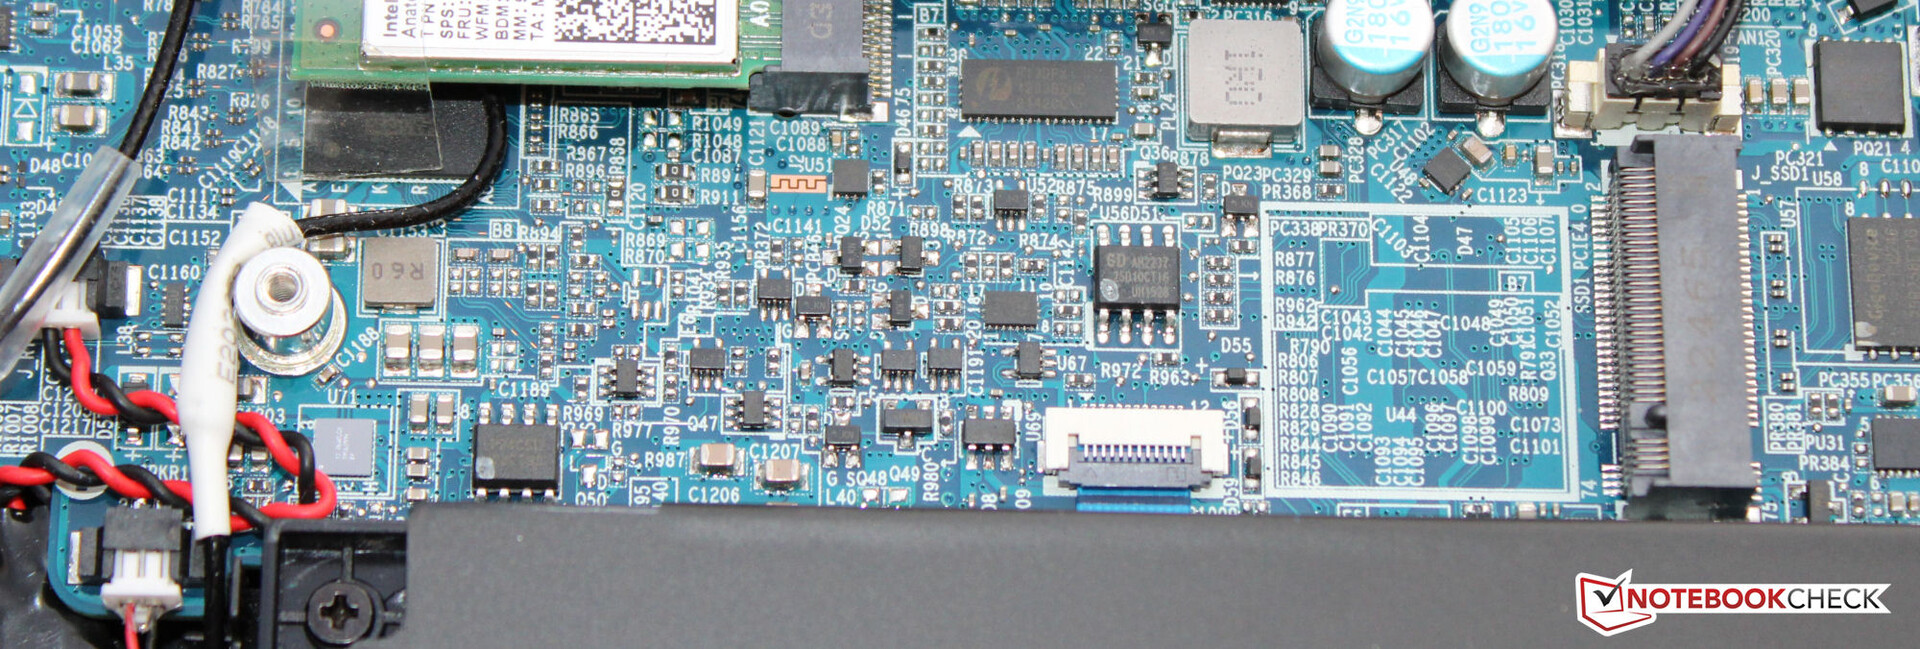
Il sottile chassis in metallo nero opaco dell'unità in prova non presenta alcun problema di lavorazione. La base non si flette quasi per niente e il coperchio ha una piccola ma accettabile flessibilità. La batteria del portatile (avvitata, non incollata) e gli altri componenti interni sono accessibili una volta rimosso il coperchio inferiore in due pezzi.
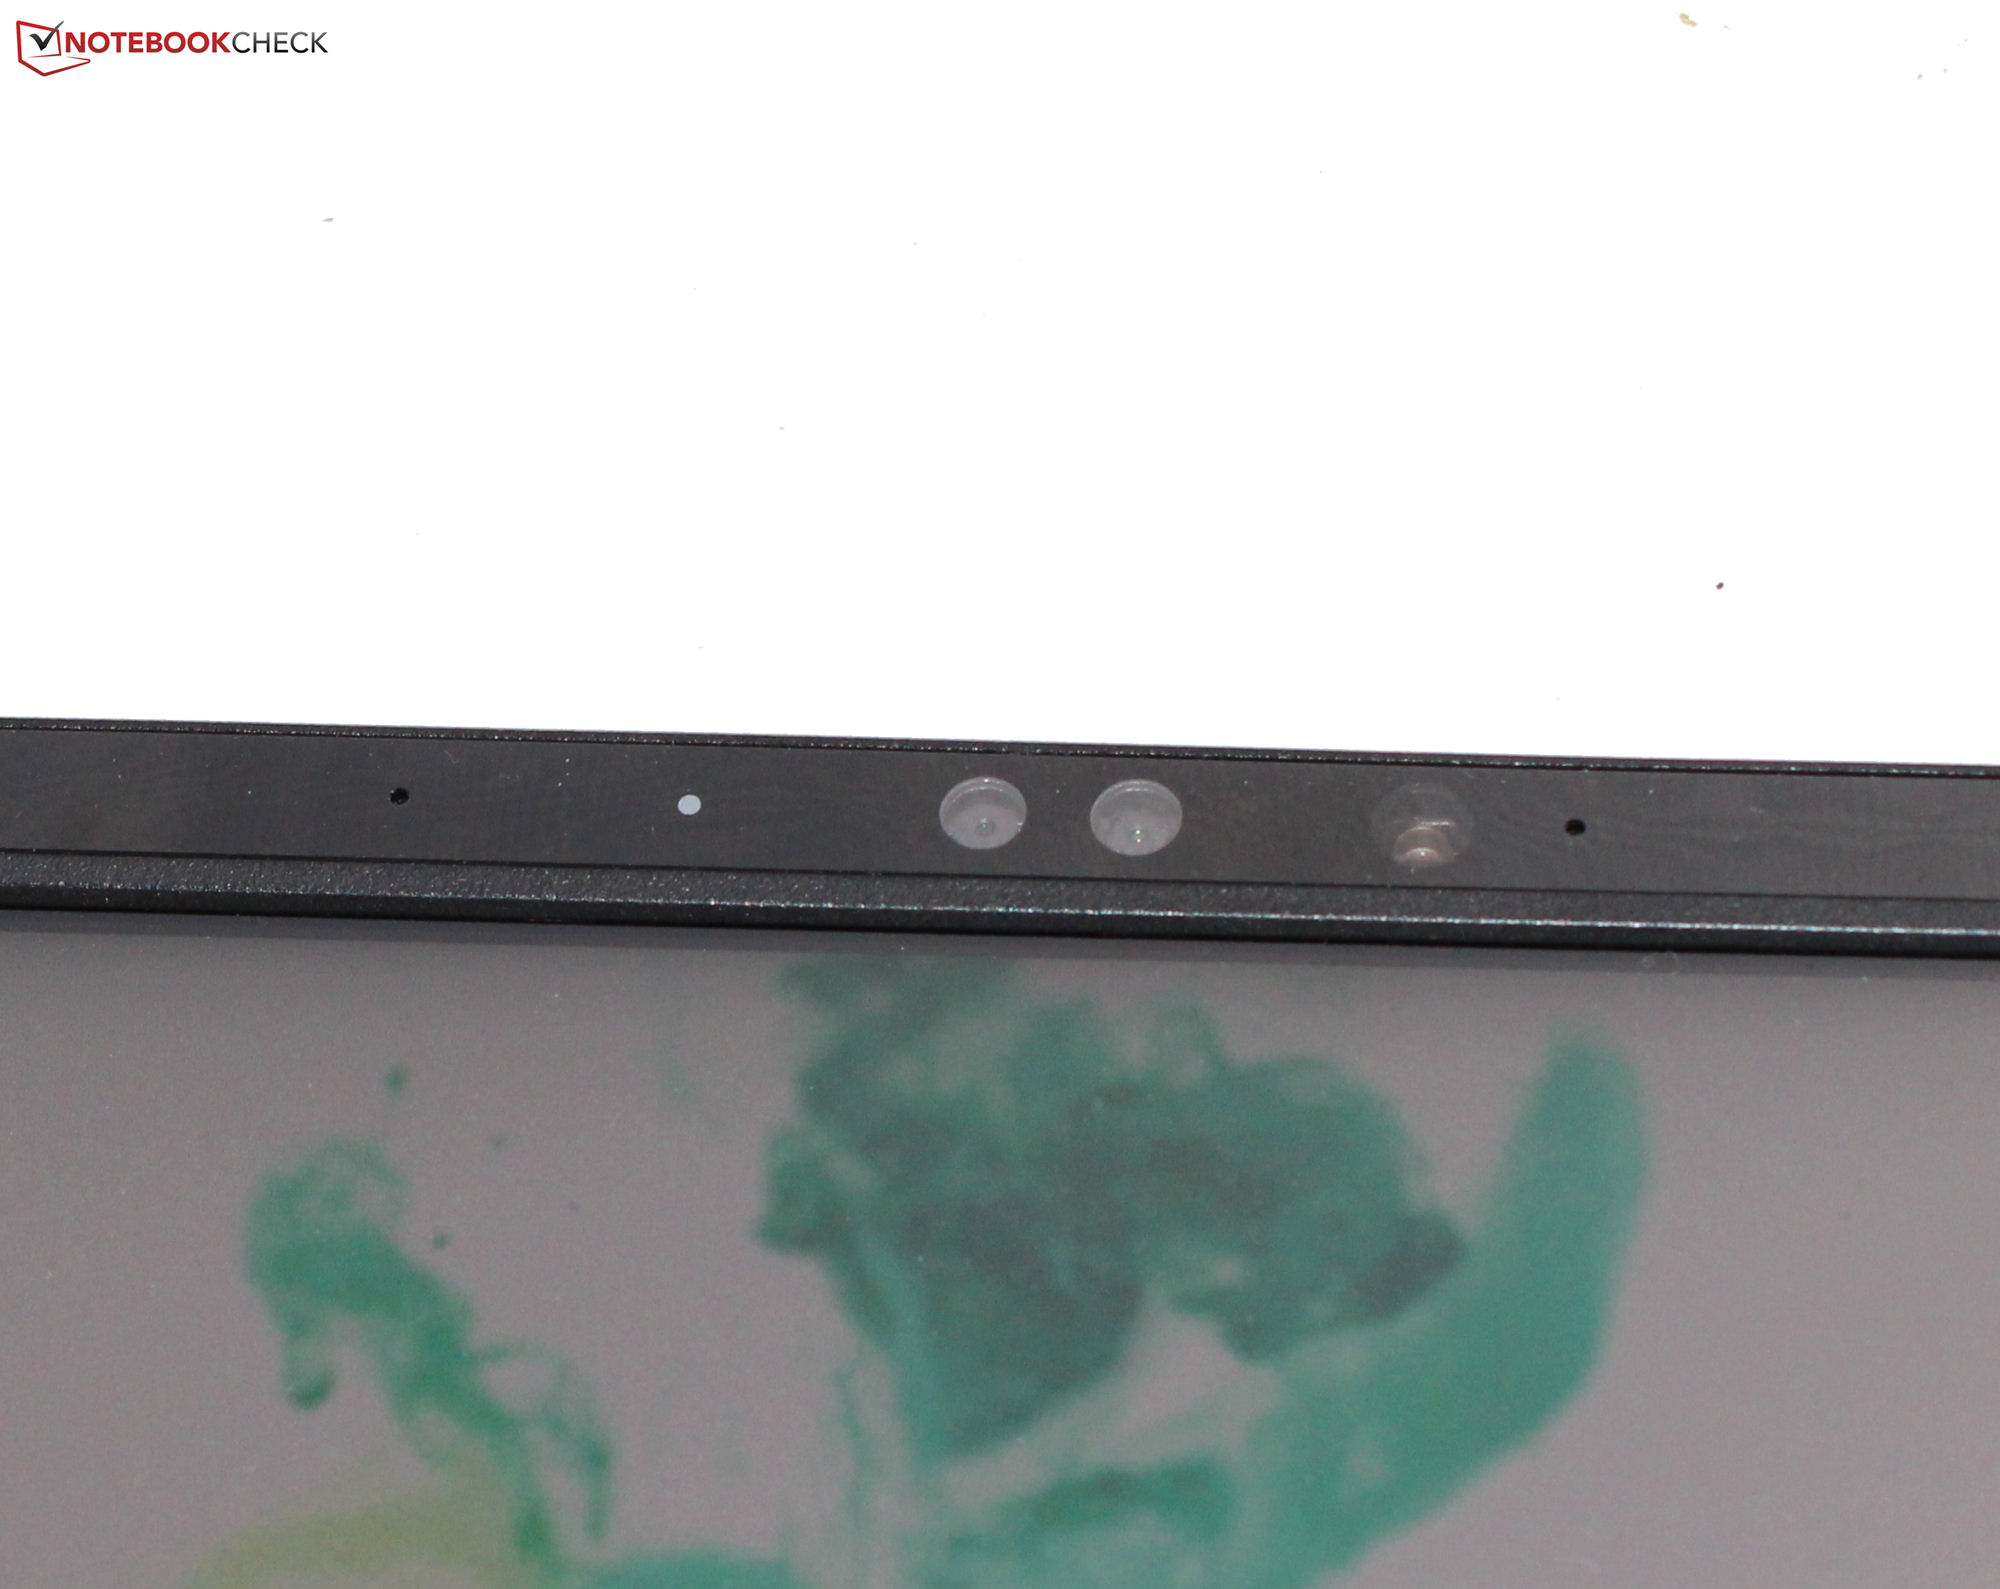
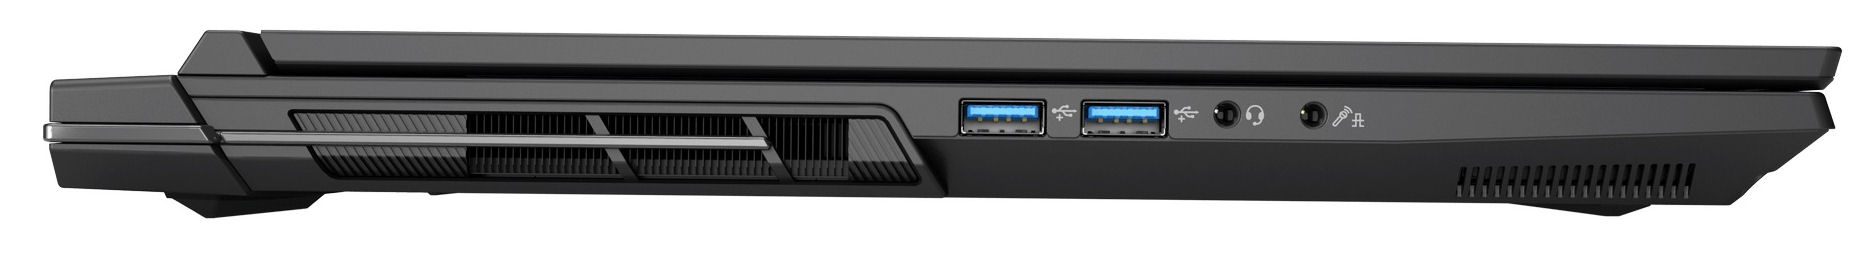
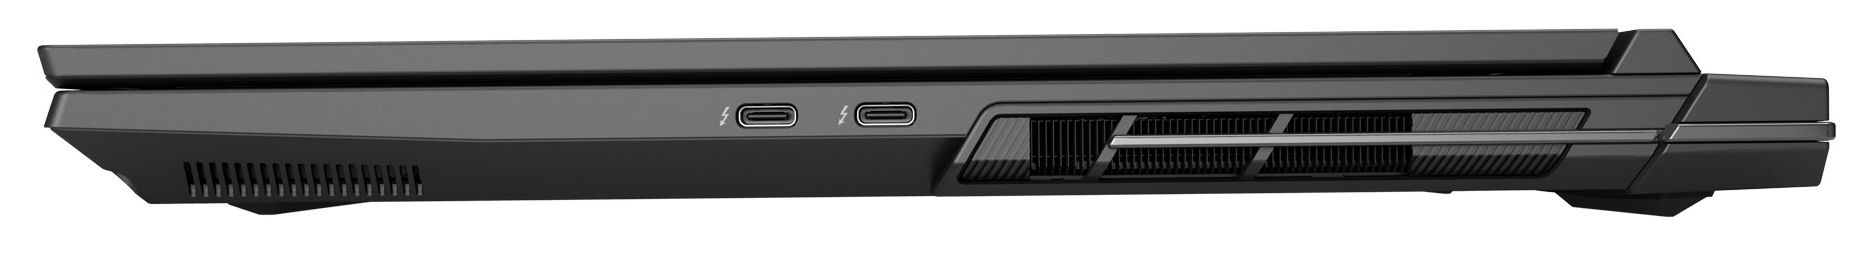
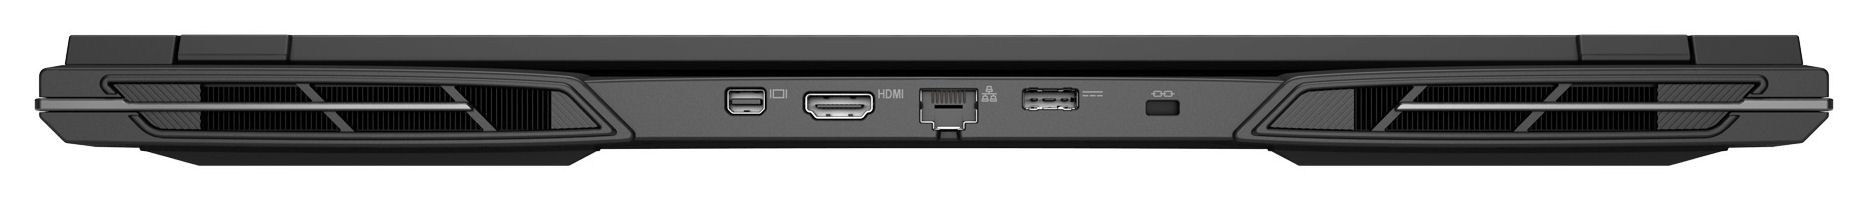
La chiavetta ha due porte USB-A (USB 3.2 Gen 2) e due USB-C (Thunderbolt 4). Solo una delle porte Thunderbolt 4 supporta Power Delivery, ma entrambe sono in grado di emettere un segnale DisplayPort. Il portatile offre un totale di quattro uscite video (1x HDMI, 3x DP). Sfortunatamente, il dispositivo non è dotato di un lettore di schede e la webcam (2,1 MP, risoluzione massima di 1.920 x 1.080, senza otturatore privacy) non è niente di eccezionale.
Grazie alla scheda Wi-Fi 6E (Intel AX211), il Key 17 Pro è in grado di raggiungere un'eccellente velocità di trasmissione dati Wi-Fi in condizioni ideali (cioè nessun altro dispositivo Wi-Fi nelle vicinanze, breve distanza tra il portatile e il PC server). Le connessioni cablate sono gestite da un controller Killer E3100X (2,5 Gbit/s).

 GeForce RTX 4090 Laptop GPU, i9-13900HX, Samsung 990 Pro 2 TB MZVL72T0HDLB")
 GeForce RTX 4090 Laptop GPU, i9-13900HX, Samsung 990 Pro 2 TB MZVL72T0HDLB")
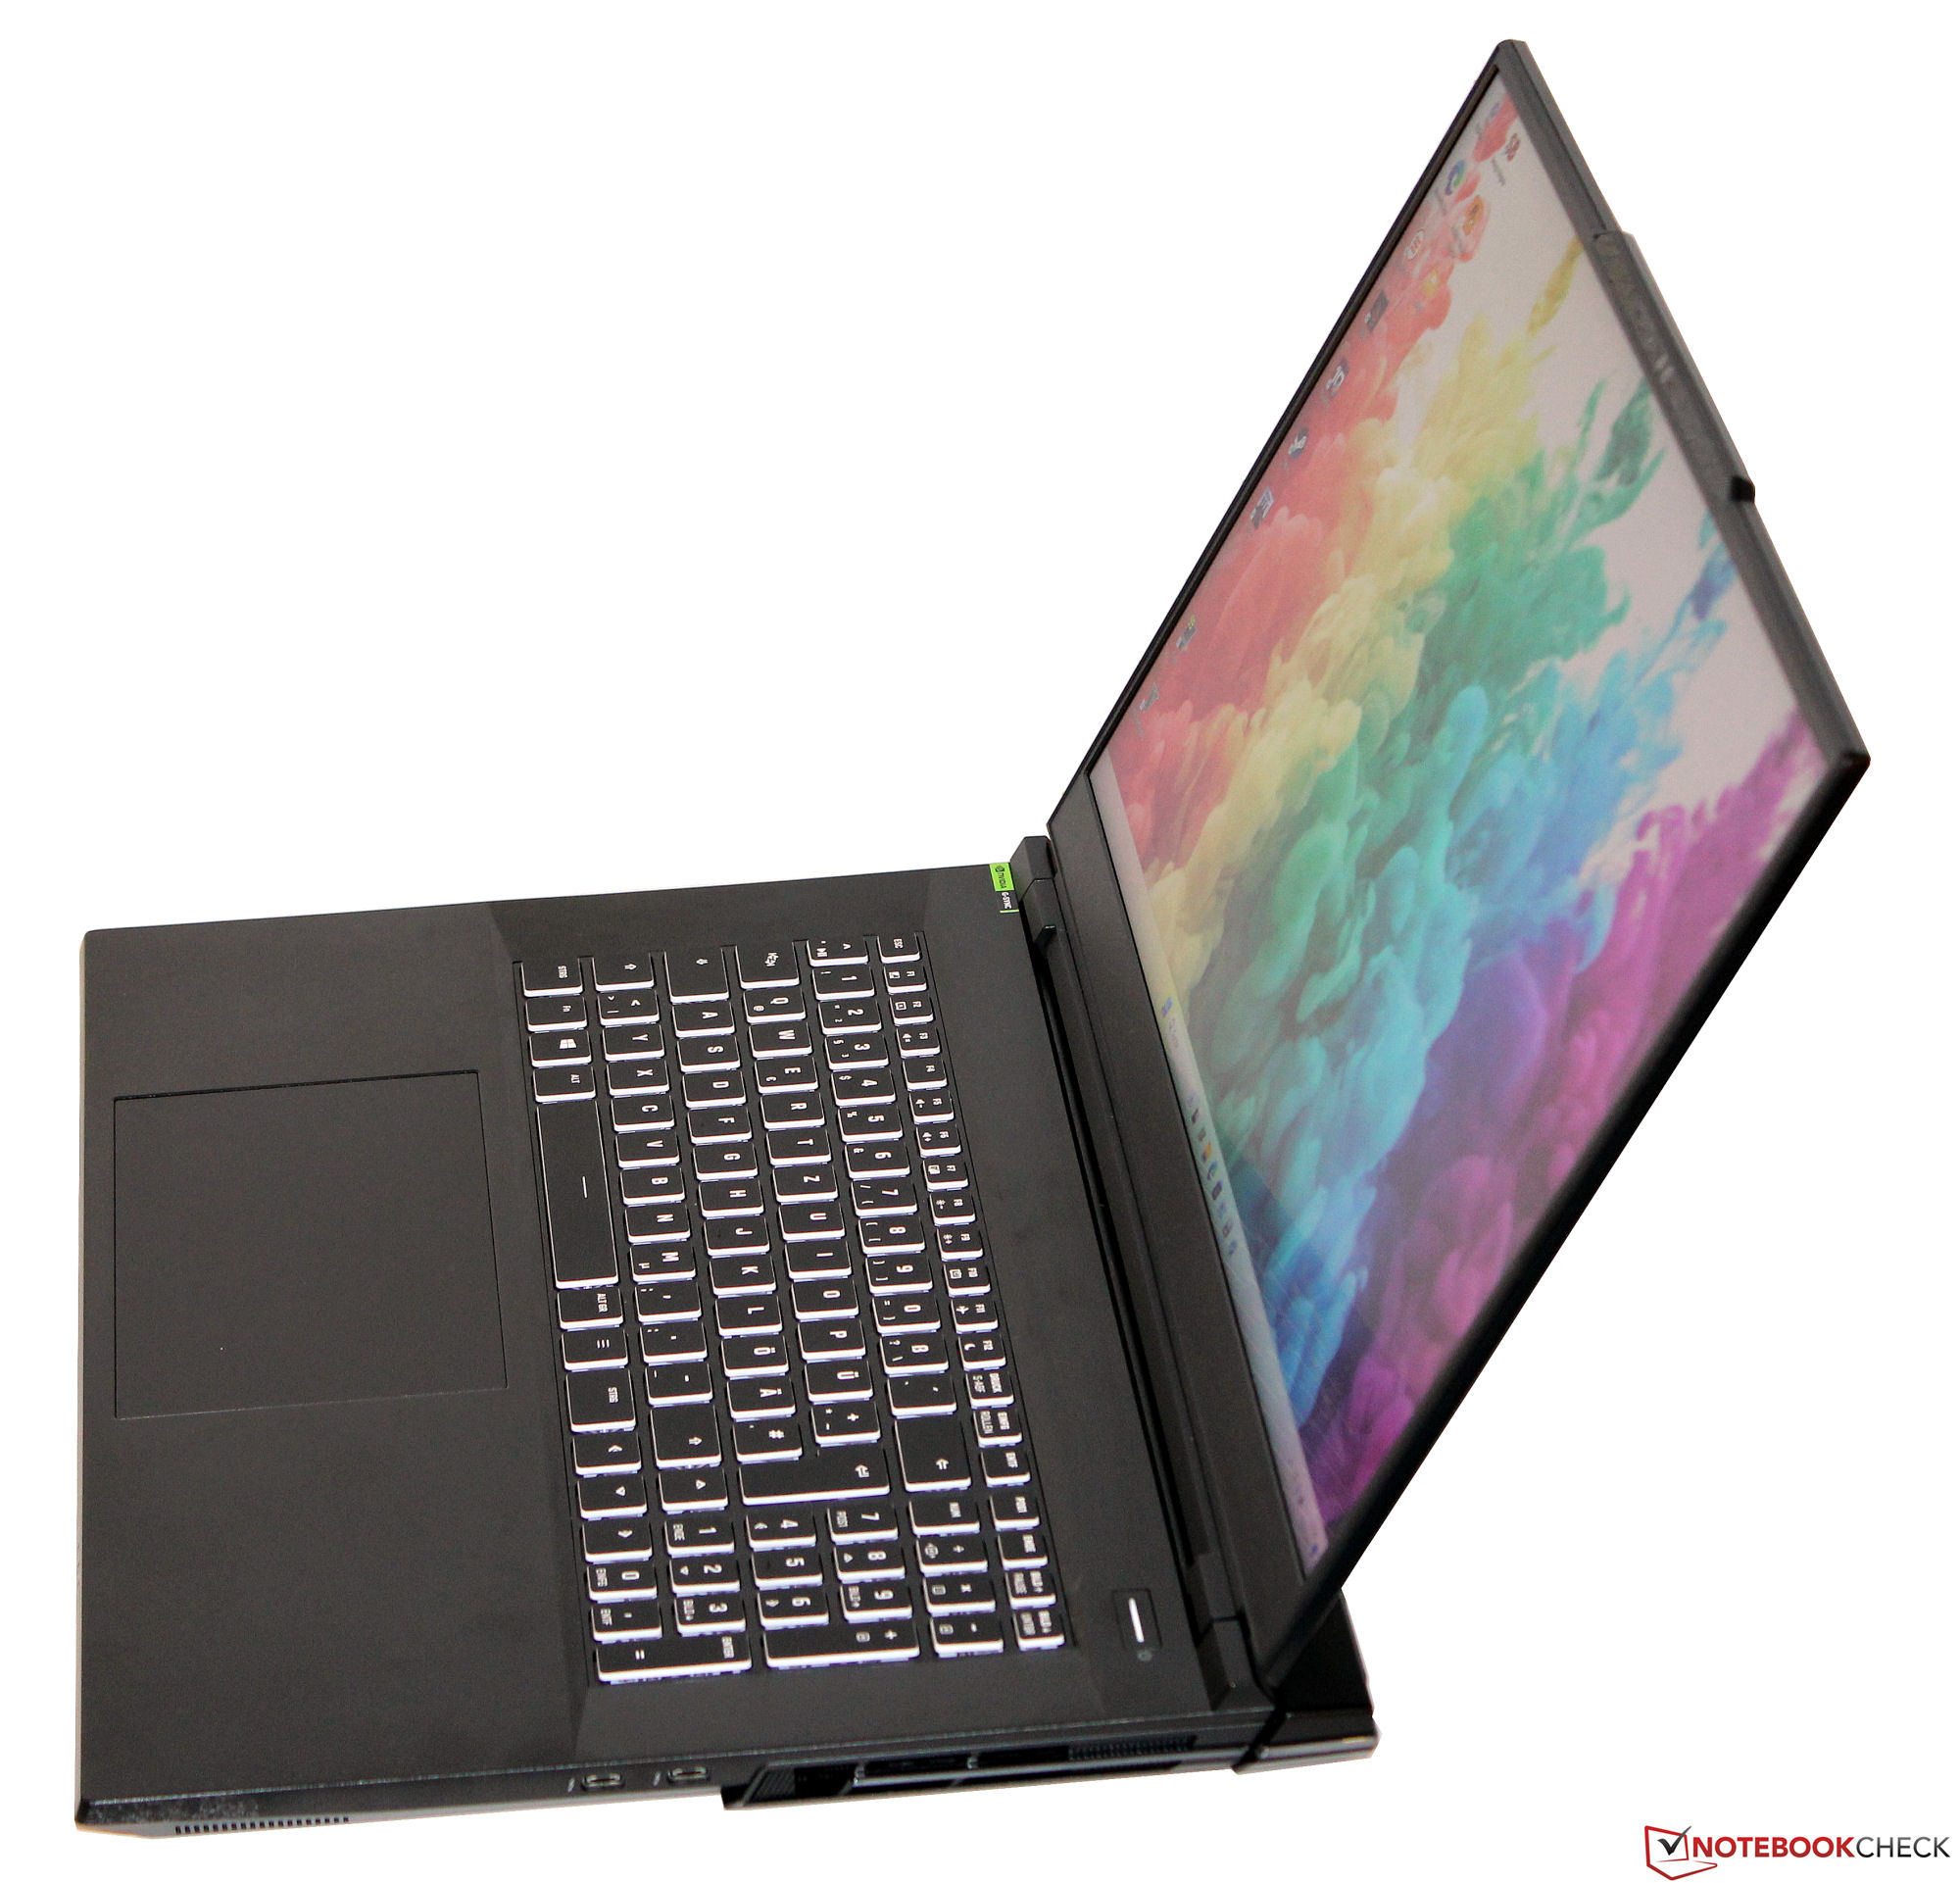
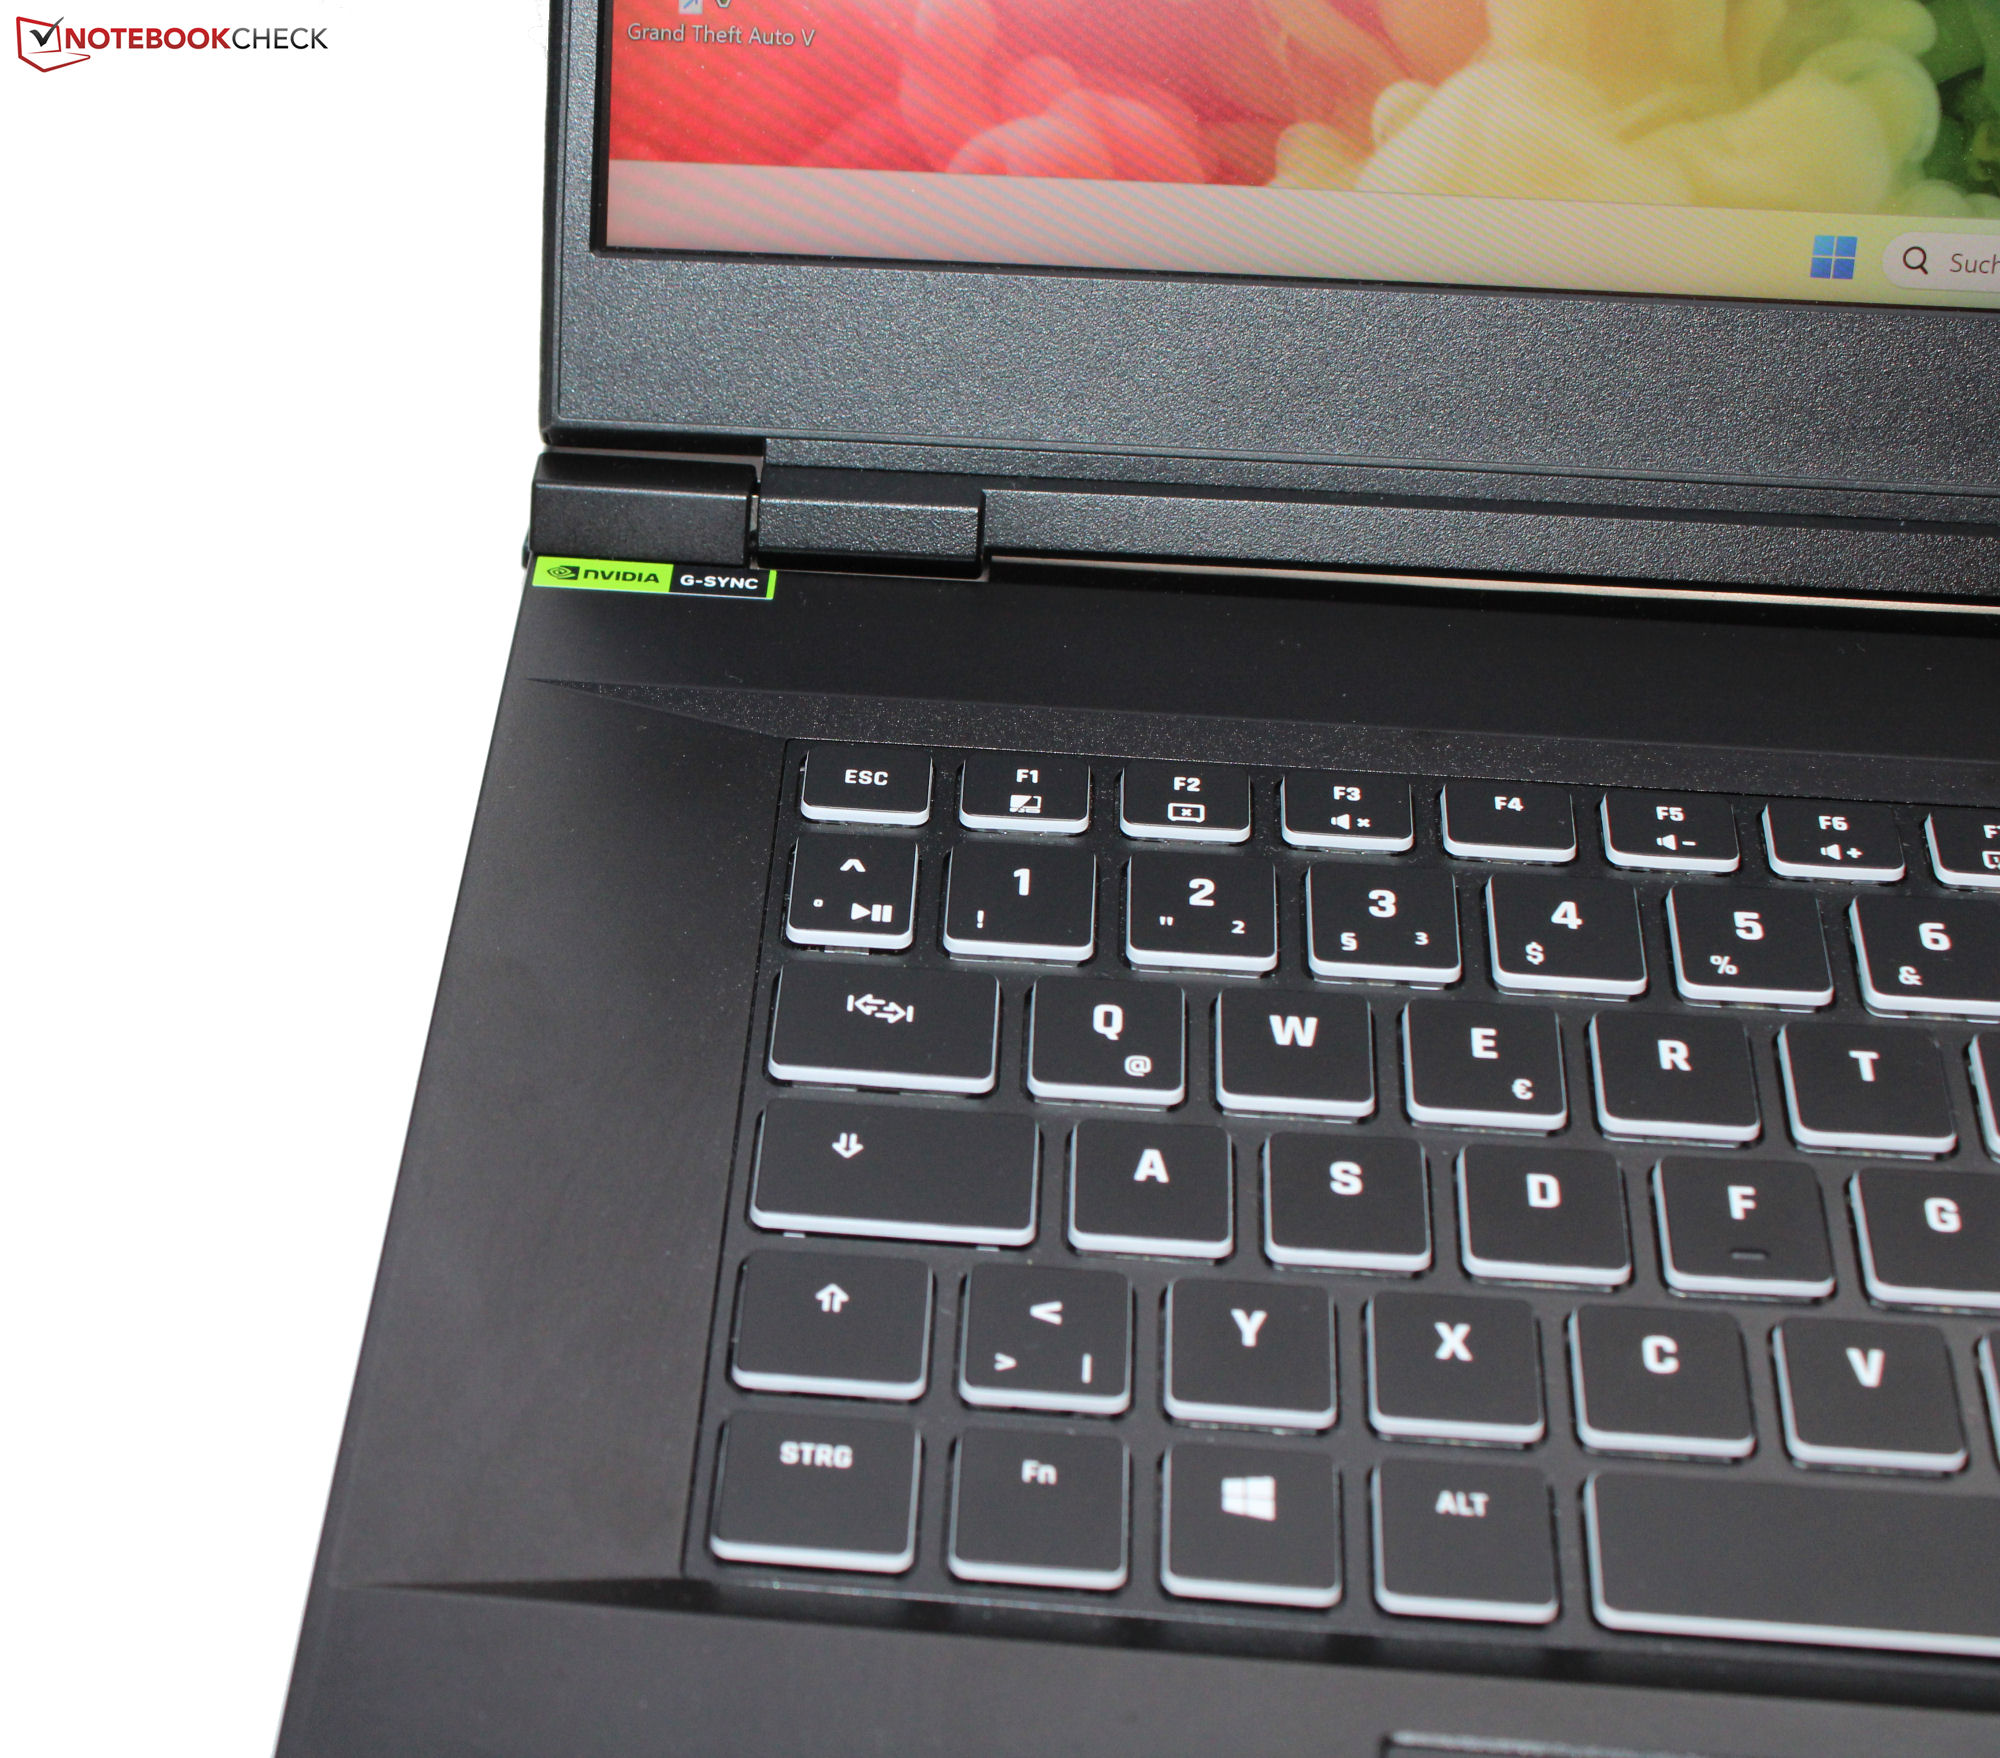
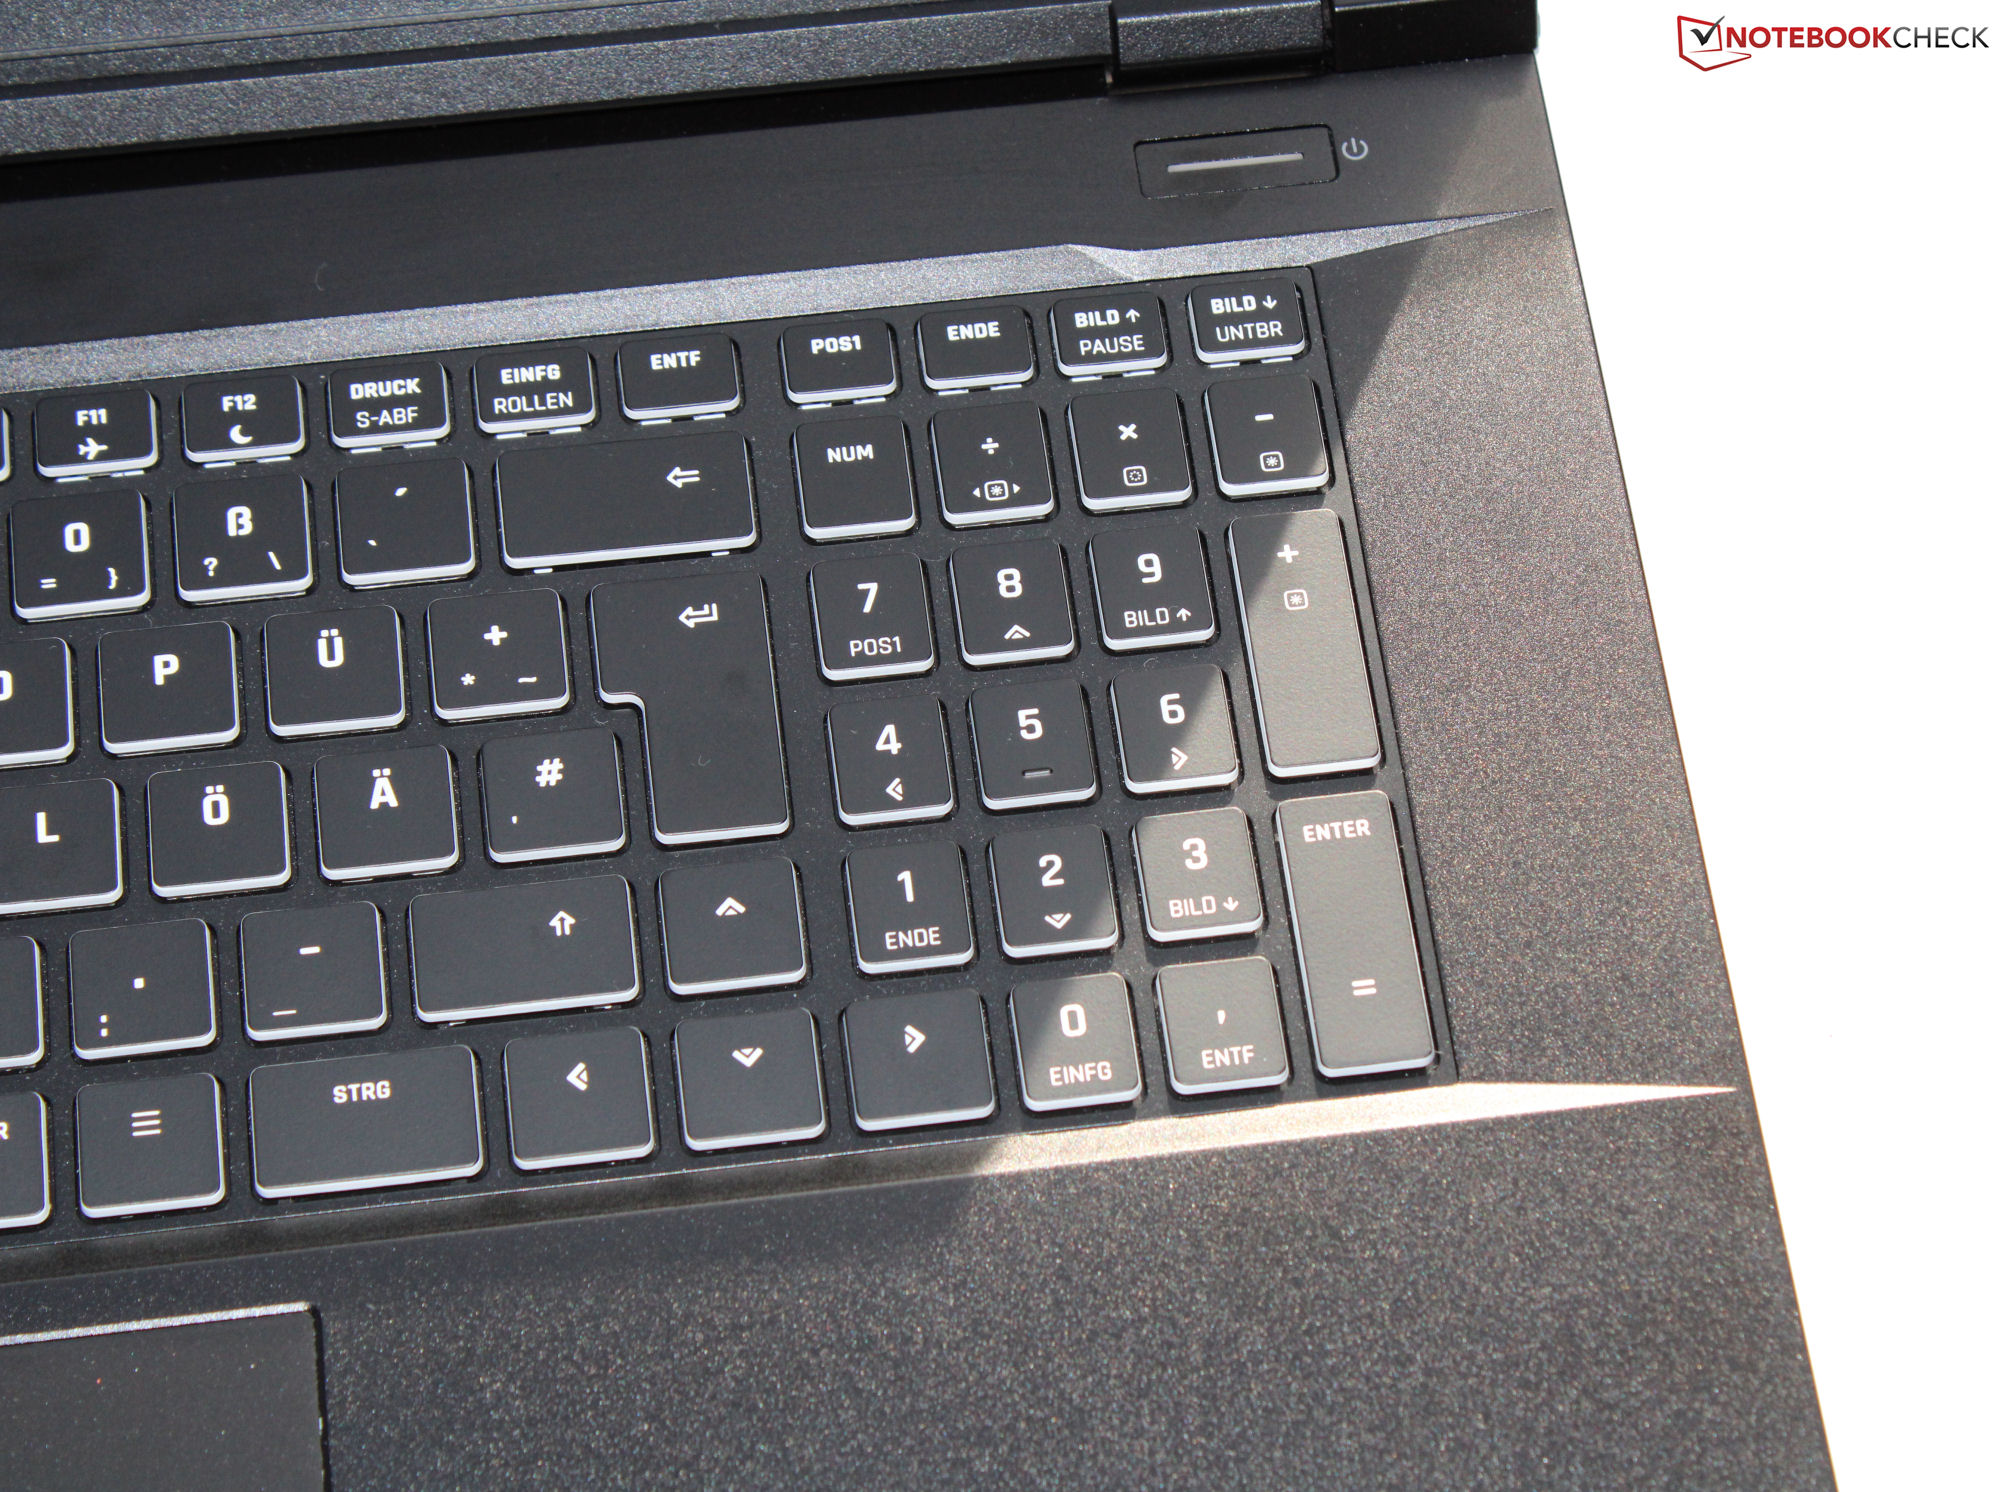
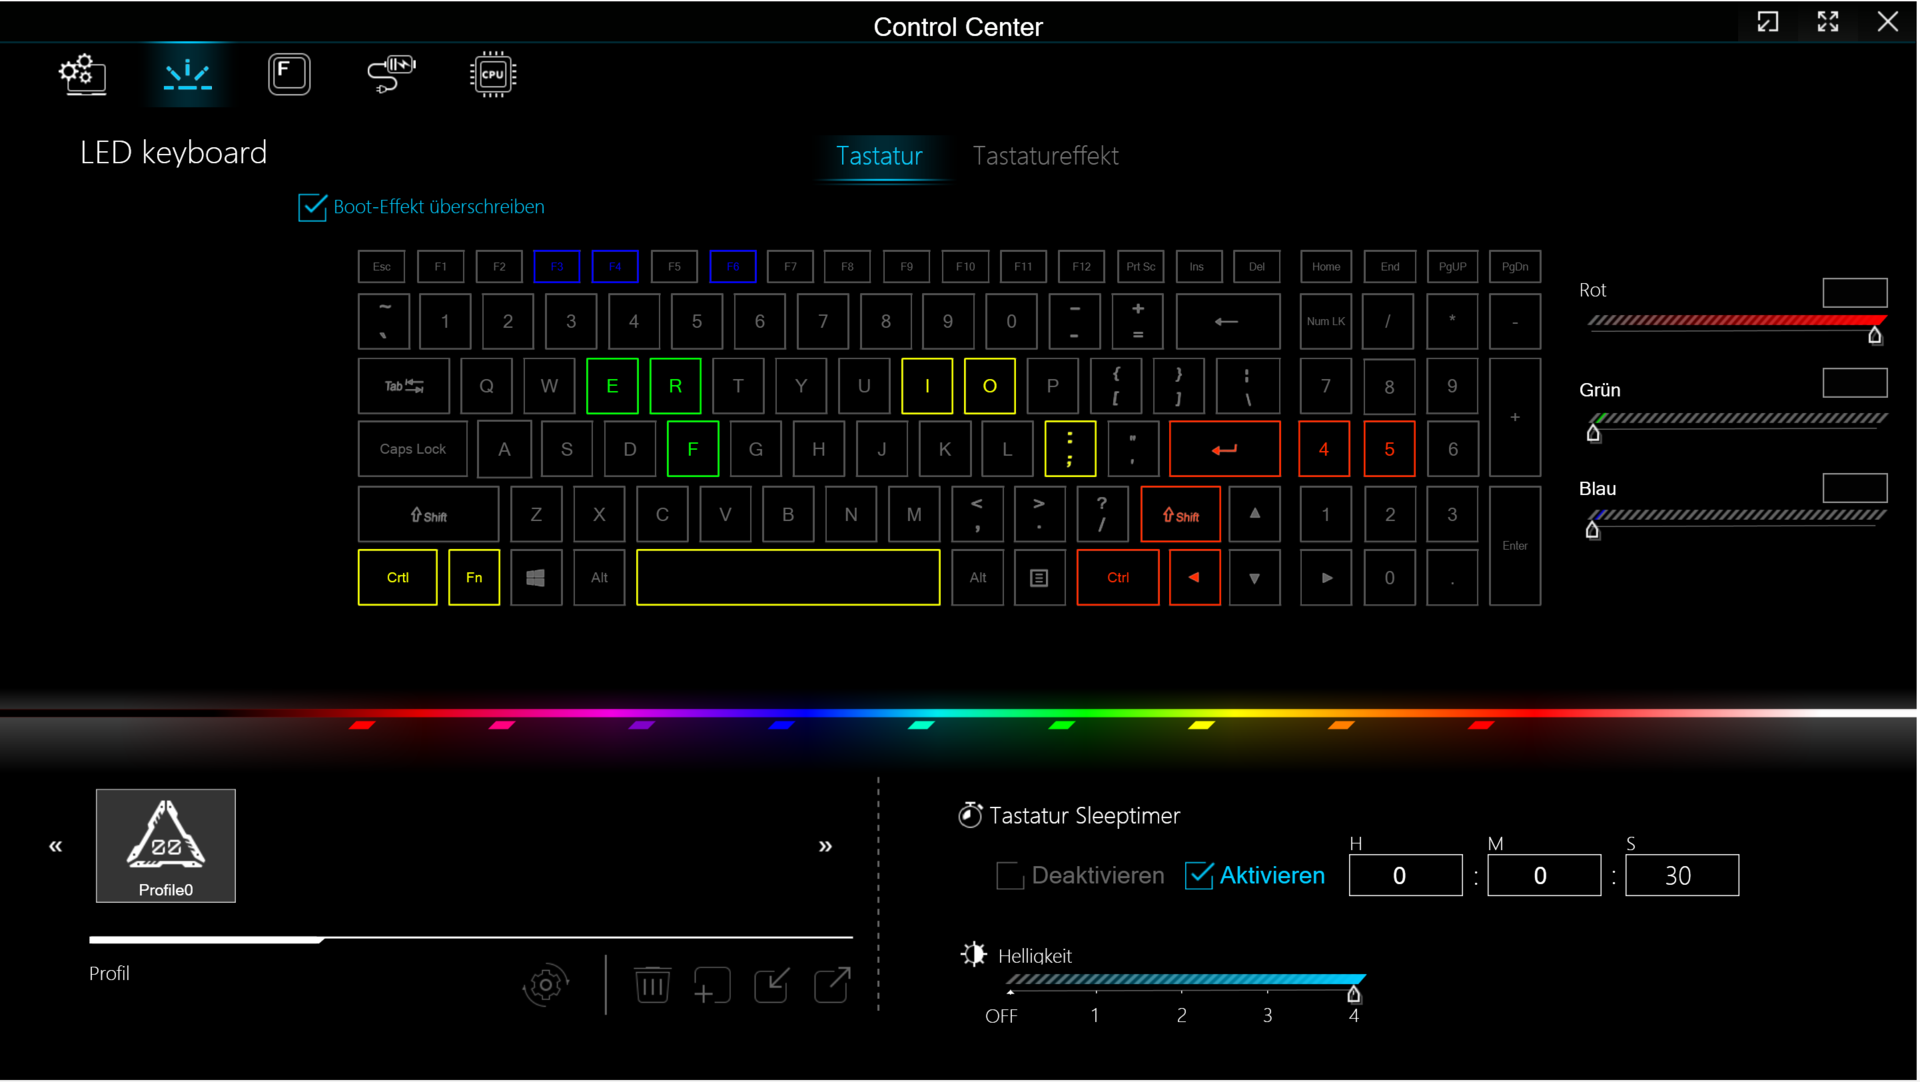
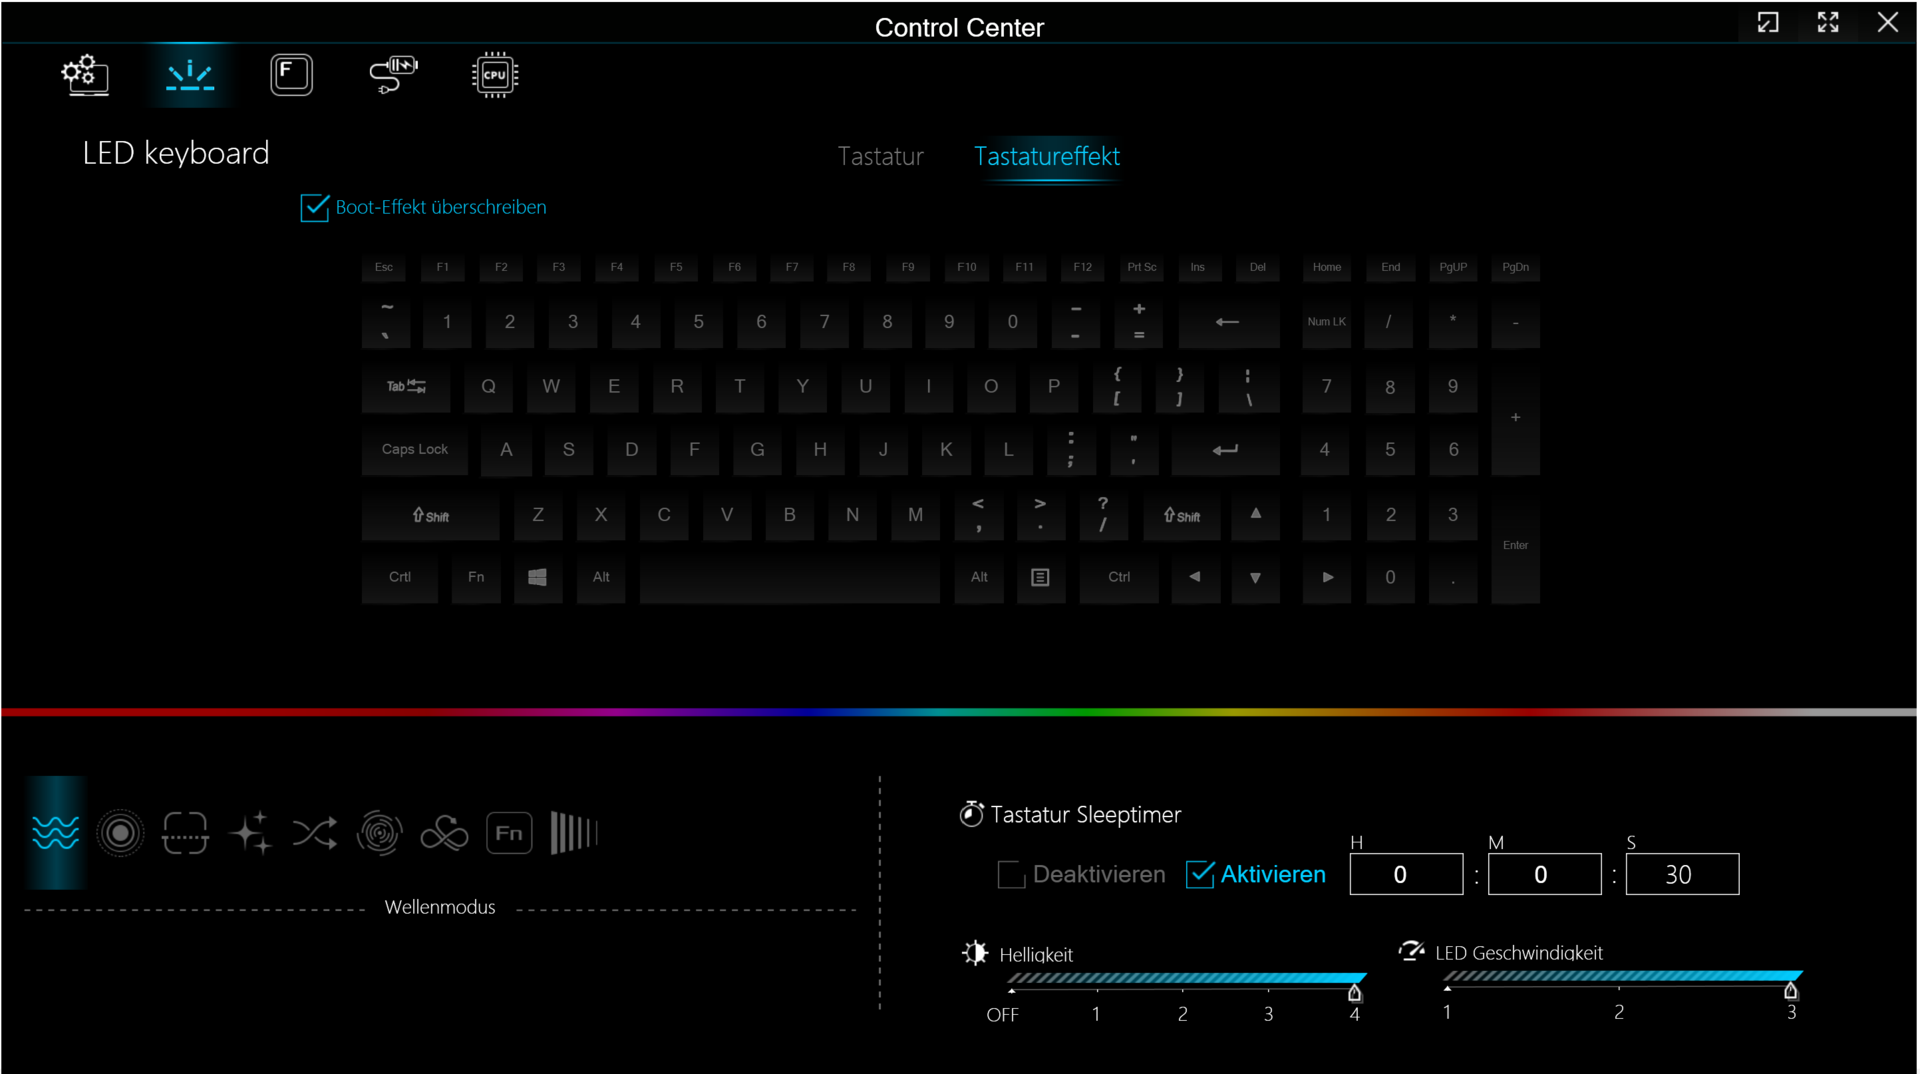
Dispositivi di input - laptop Schenker con RGB per tasto
I tasti piatti e lisci della tastiera chiclet (con illuminazione RGB per ogni tasto) hanno una corsa moderata e un punto di attuazione caratteristico. Tuttavia, a nostro avviso, la resistenza dei tasti potrebbe essere più nitida. Il piano della tastiera si flette un po' durante la digitazione, ma nel complesso Schenker ha fornito una tastiera adeguata per l'uso quotidiano. Il Key 17 Pro è dotato anche di un touchpad (che misura circa 15 x 9,1 cm, ovvero 5,9 x 3,6") con una corsa breve e un punto di clic chiaro.
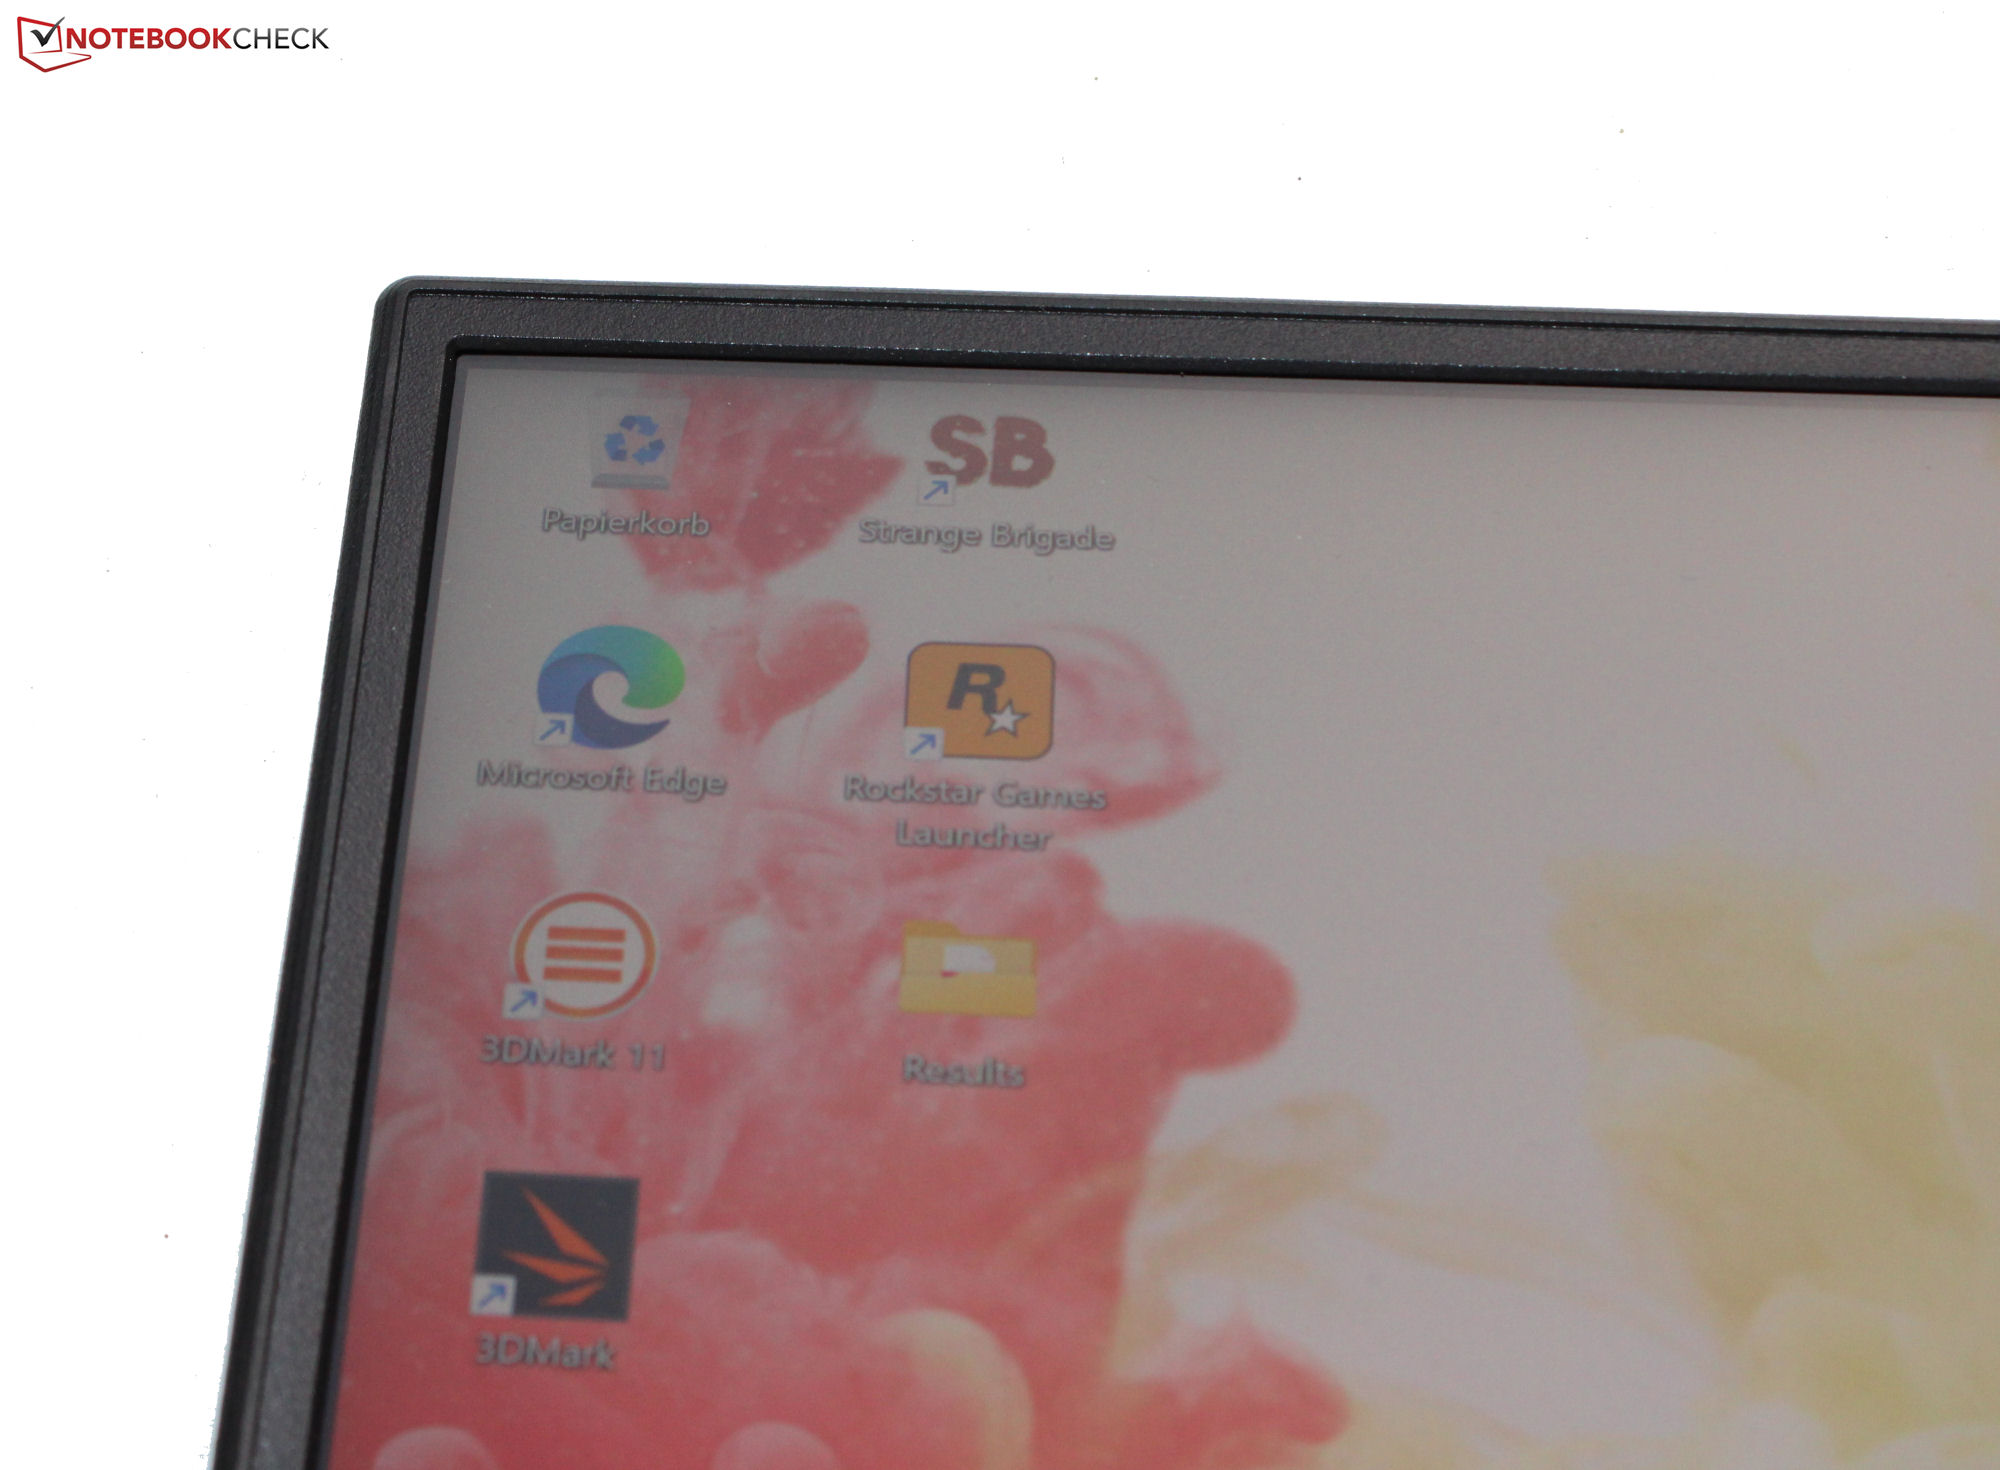
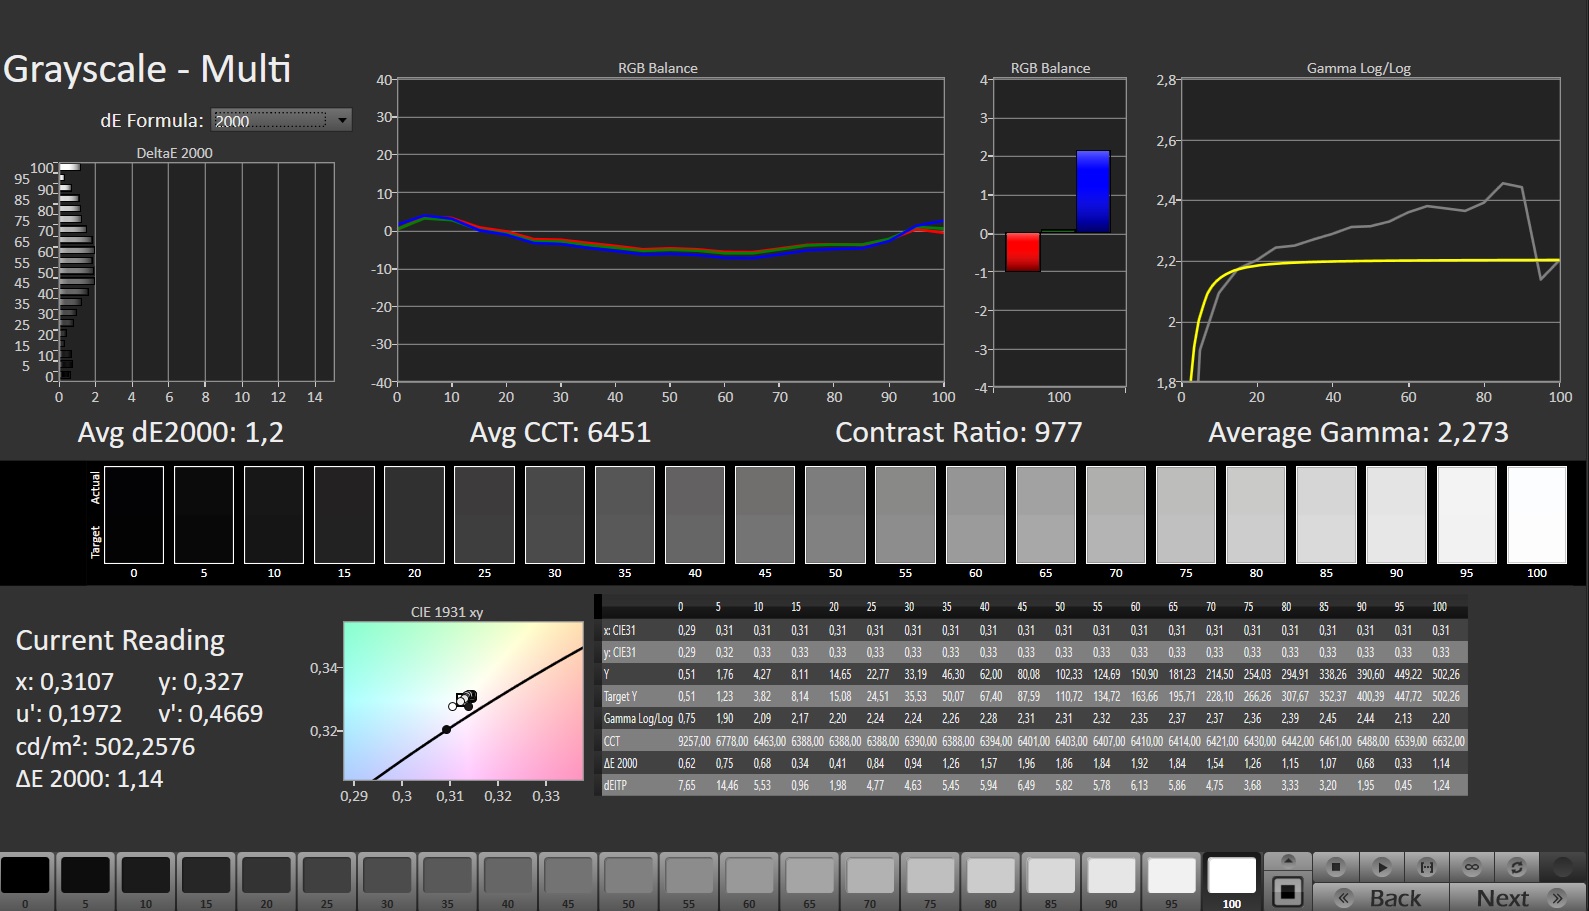
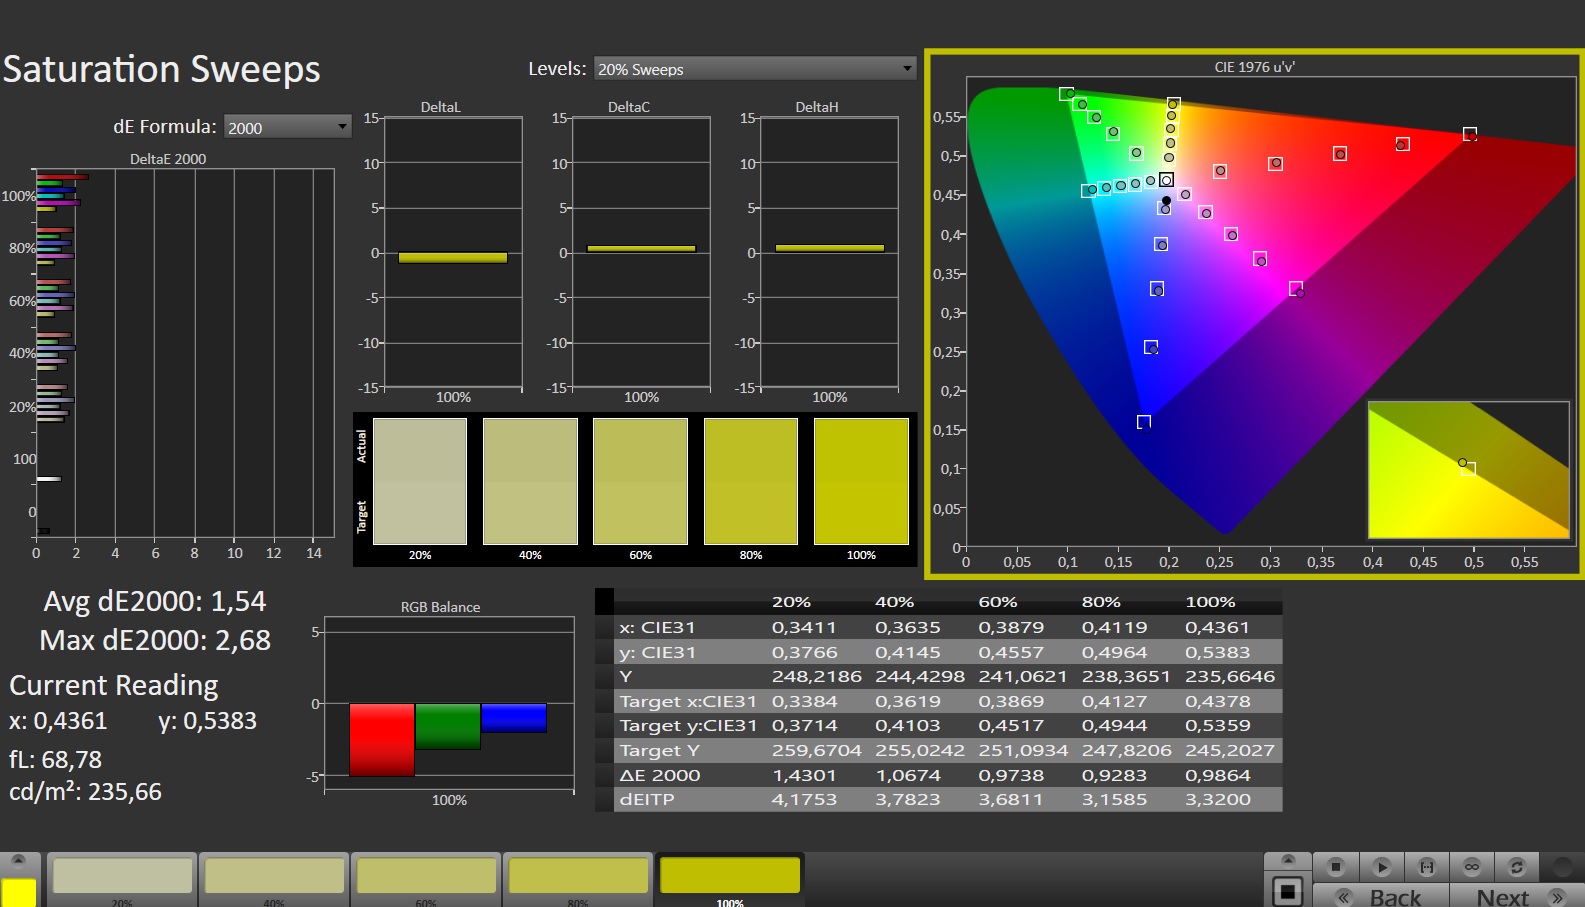
Display - Pannello UHD con copertura DCI-P3
Oltre al display IPS 4K (3.840 x 2.150 pixel, 144Hz) dell'unità in prova, Schenker offre anche il Key 17 Pro con un pannello IPS QHD (2.560 x 1.440 pixel, 240Hz) - entrambi gli schermi da 17,3 pollici supportano G-Sync.
Il pannello 4K è caratterizzato da un'elevata luminosità e dall'assenza di sfarfallio PWM, oltre a offrire un'elevata frequenza di aggiornamento (144Hz) e tempi di risposta rapidi. Tuttavia, non è all'altezza (> 1.000:1) per quanto riguarda il rapporto di contrasto.
| |||||||||||||||||||||||||
Distribuzione della luminosità: 87 %
Al centro con la batteria: 487 cd/m²
Contrasto: 955:1 (Nero: 0.51 cd/m²)
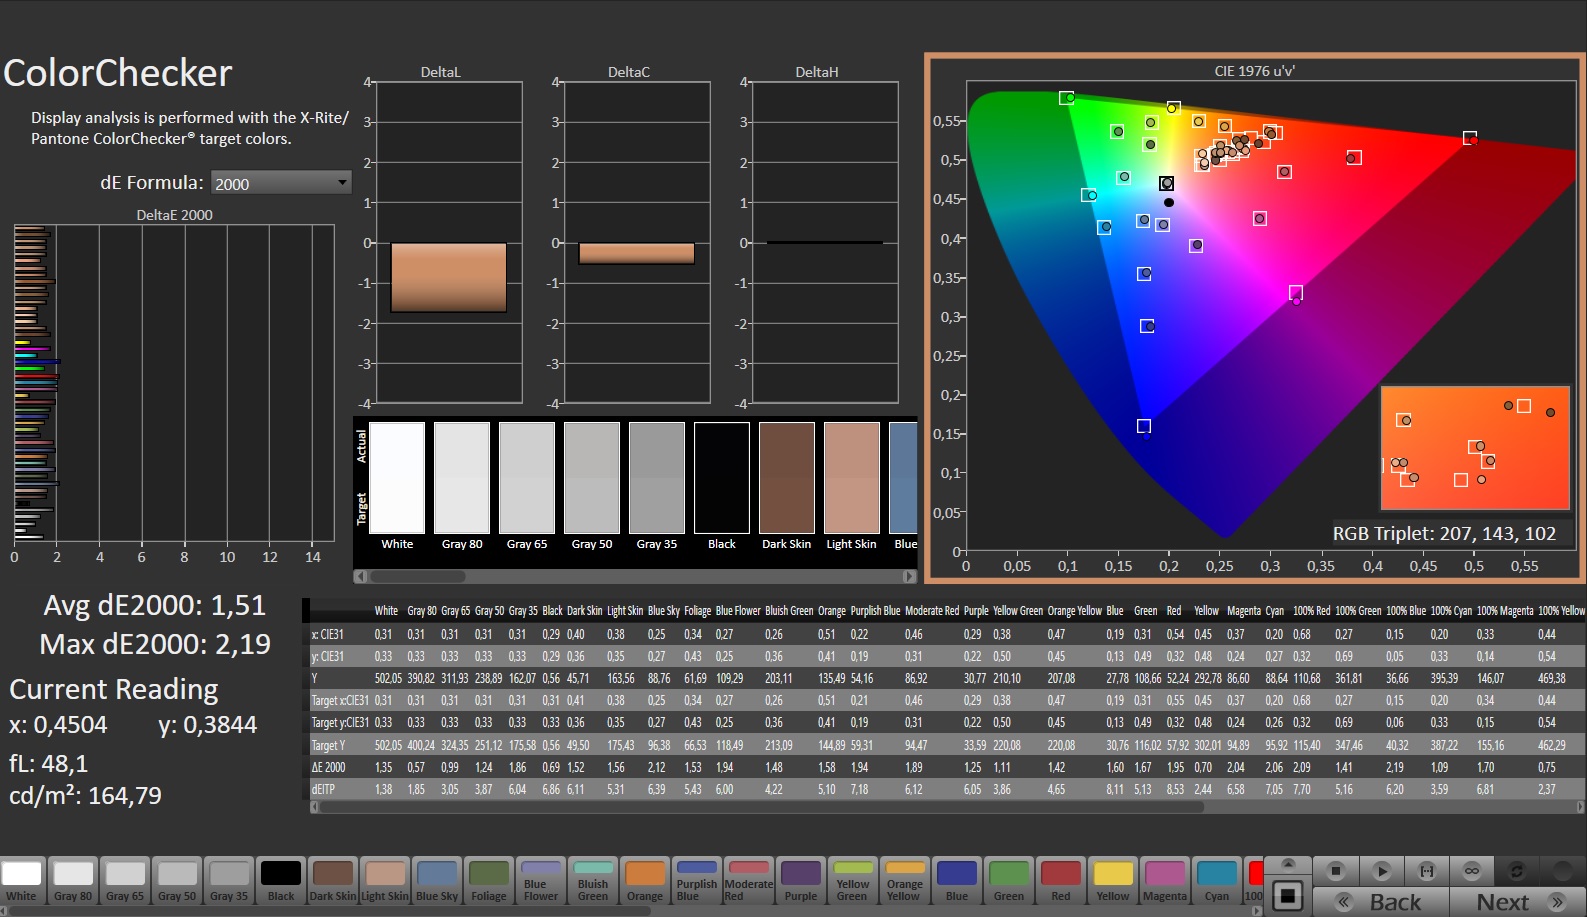
ΔE ColorChecker Calman: 1.51 | ∀{0.5-29.43 Ø4.72}
ΔE Greyscale Calman: 1.2 | ∀{0.09-98 Ø4.97}
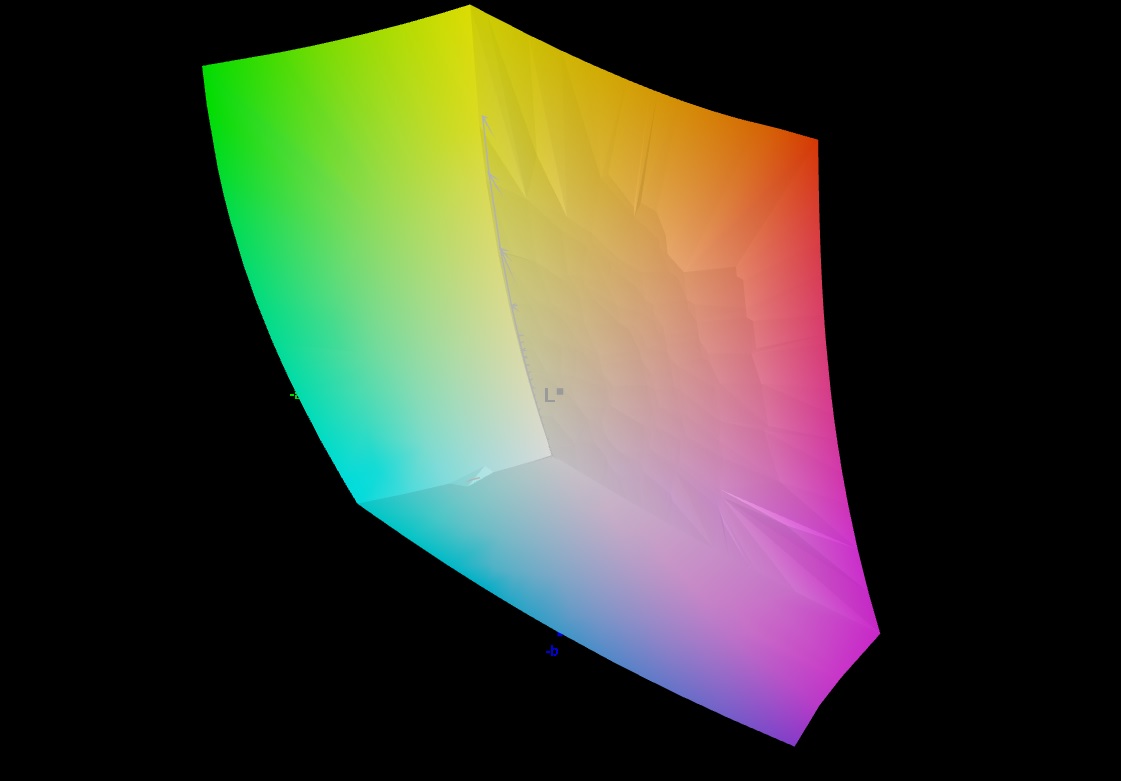
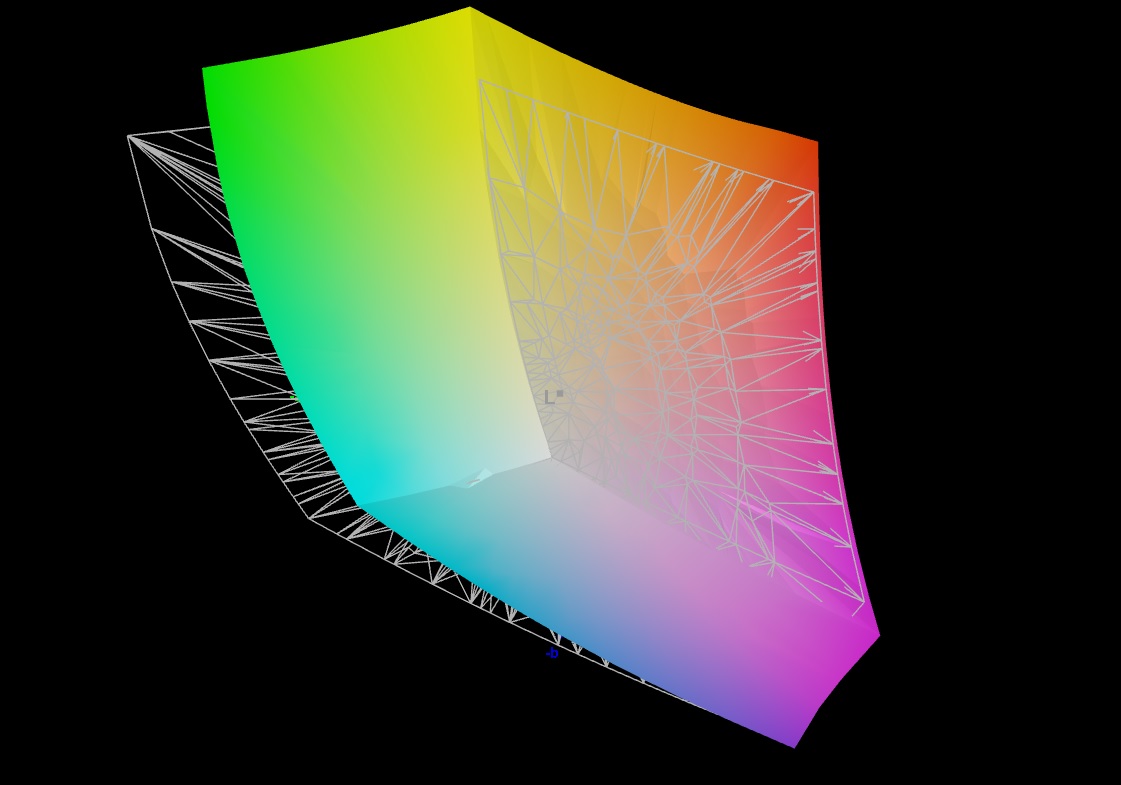
84.3% AdobeRGB 1998 (Argyll 3D)
99.9% sRGB (Argyll 3D)
96.4% Display P3 (Argyll 3D)
Gamma: 2.273
CCT: 6451 K
| Schenker Key 17 Pro (Early 23) BOE CQ NE173QUM-NY1, IPS, 3840x2160, 17.3" | MSI Stealth 17 Studio A13VH-014 AUO41A2 B173ZAN06.C, Mini LED, 3840x2160, 17.3" | Asus ROG Strix Scar 17 G733PY-XS96 NE173QHM-NZ2, IPS, 2560x1440, 17.3" | Aorus 17X AZF BOE09F9, IPS, 2560x1440, 17.3" | Medion Erazer Beast X40 BOE NE170QDM-NZ1, IPS, 2560x1600, 17" | |
|---|---|---|---|---|---|
| Display | 2% | 1% | 0% | -16% | |
| Display P3 Coverage (%) | 96.4 | 92 -5% | 98 2% | 96.7 0% | 68.6 -29% |
| sRGB Coverage (%) | 99.9 | 99.1 -1% | 100 0% | 99.9 0% | 99.8 0% |
| AdobeRGB 1998 Coverage (%) | 84.3 | 94.07 12% | 85.6 2% | 84.5 0% | 69.4 -18% |
| Response Times | -62% | 0% | -18% | 10% | |
| Response Time Grey 50% / Grey 80% * (ms) | 14.8 ? | 46.4 ? -214% | 6.2 ? 58% | 14 ? 5% | 11.3 ? 24% |
| Response Time Black / White * (ms) | 7.2 ? | 0.62 ? 91% | 11.4 ? -58% | 10.1 ? -40% | 7.5 ? -4% |
| PWM Frequency (Hz) | 2400 | ||||
| Screen | 221% | -8% | -57% | -29% | |
| Brightness middle (cd/m²) | 487 | 397.29 -18% | 322.5 -34% | 294 -40% | 384 -21% |
| Brightness (cd/m²) | 485 | 392 -19% | 317 -35% | 276 -43% | 377 -22% |
| Brightness Distribution (%) | 87 | 93 7% | 86 -1% | 90 3% | 90 3% |
| Black Level * (cd/m²) | 0.51 | 0.02 96% | 0.29 43% | 0.28 45% | 0.45 12% |
| Contrast (:1) | 955 | 19865 1980% | 1112 16% | 1050 10% | 853 -11% |
| Colorchecker dE 2000 * | 1.51 | 2.52 -67% | 1.15 24% | 2.81 -86% | 2.05 -36% |
| Colorchecker dE 2000 max. * | 2.19 | 3.91 -79% | 3.03 -38% | 5.7 -160% | 3.64 -66% |
| Greyscale dE 2000 * | 1.2 | 2.78 -132% | 1.7 -42% | 3.4 -183% | 2.3 -92% |
| Gamma | 2.273 97% | 2.63 84% | 2.27 97% | 2.301 96% | 2.017 109% |
| CCT | 6451 101% | 6412 101% | 6299 103% | 7389 88% | 6546 99% |
| Colorchecker dE 2000 calibrated * | 2.52 | 0.56 | 0.86 | 0.74 | |
| Media totale (Programma / Settaggio) | 54% /
127% | -2% /
-5% | -25% /
-38% | -12% /
-20% |
* ... Meglio usare valori piccoli
Il display aveva già un'eccellente riproduzione dei colori fin dall'inizio. Con un valore di circa 1,5, la sua differenza cromatica media rientra certamente in ciò che consideriamo buono (Delta E < 3). L'accuratezza del colore è un dato di fatto: il pannello ha una copertura sRGB completa e può coprire quasi l'intero spazio DCI-P3; è anche in grado di riprodurre fino all'84% del gamut AdobeRGB.

Tempi di risposta del Display
| ↔ Tempi di risposta dal Nero al Bianco | ||
|---|---|---|
| 7.2 ms ... aumenta ↗ e diminuisce ↘ combinato | ↗ 2.2 ms Incremento | 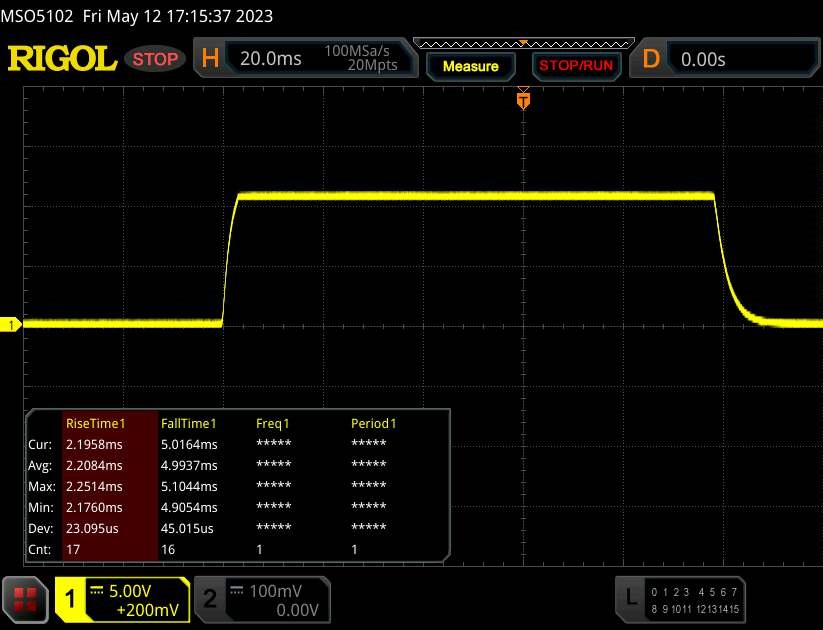 |
| ↘ 5 ms Calo | ||
| Lo schermo ha mostrato valori di risposta molto veloci nei nostri tests ed è molto adatto per i gaming veloce. In confronto, tutti i dispositivi di test variano da 0.1 (minimo) a 240 (massimo) ms. » 21 % di tutti i dispositivi è migliore. Questo significa che i tempi di risposta rilevati sono migliori rispettto alla media di tutti i dispositivi testati (19.8 ms). | ||
| ↔ Tempo di risposta dal 50% Grigio all'80% Grigio | ||
| 14.8 ms ... aumenta ↗ e diminuisce ↘ combinato | ↗ 7.2 ms Incremento | 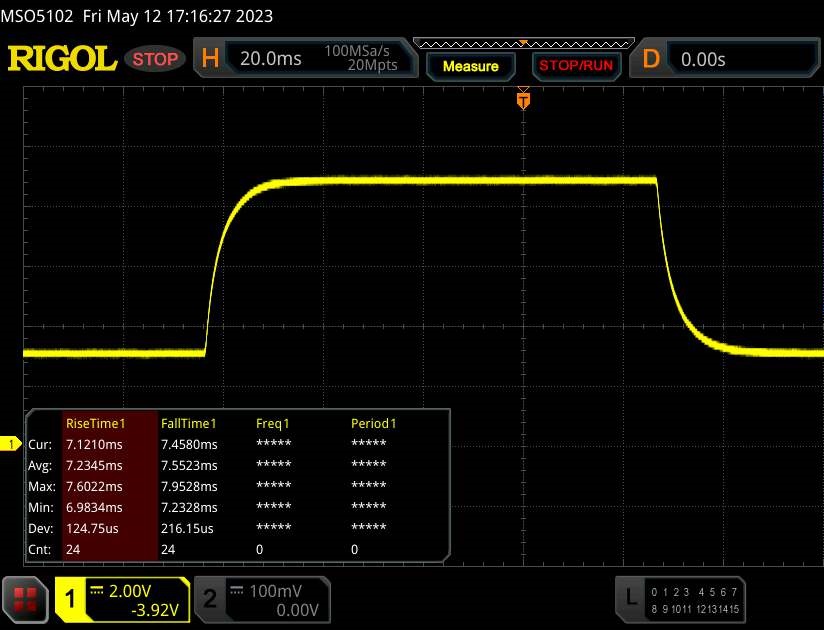 |
| ↘ 7.6 ms Calo | ||
| Lo schermo mostra buoni tempi di risposta durante i nostri tests, ma potrebbe essere troppo lento per i gamers competitivi. In confronto, tutti i dispositivi di test variano da 0.165 (minimo) a 636 (massimo) ms. » 29 % di tutti i dispositivi è migliore. Questo significa che i tempi di risposta rilevati sono migliori rispettto alla media di tutti i dispositivi testati (31 ms). | ||
Sfarfallio dello schermo / PWM (Pulse-Width Modulation)
| flickering dello schermo / PWM non rilevato |  | ||
In confronto: 52 % di tutti i dispositivi testati non utilizza PWM per ridurre la luminosita' del display. Se è rilevato PWM, una media di 7753 (minimo: 5 - massimo: 343500) Hz è stata rilevata. | |||
Il display IPS è leggibile da qualsiasi posizione grazie all'ampio angolo di visione. È possibile distinguere i contenuti sullo schermo anche all'aperto, a condizione che il sole non sia troppo forte.
Prestazioni - Il Key 17 è dotato di hardware di fascia alta
Lo Schenker Key 17 Pro è un portatile di fascia alta da 17,3 pollici che sfrutta la potenza di Raptor Lake e Ada Lovelace. È possibile configurare il portatile in base alle proprie esigenze nel negozio online di Schenker. La nostra unità in prova costa circa 4.500 euro (4.820 dollari). I prezzi partono da 3.200 euro (3.427 dollari).
Condizioni di prova
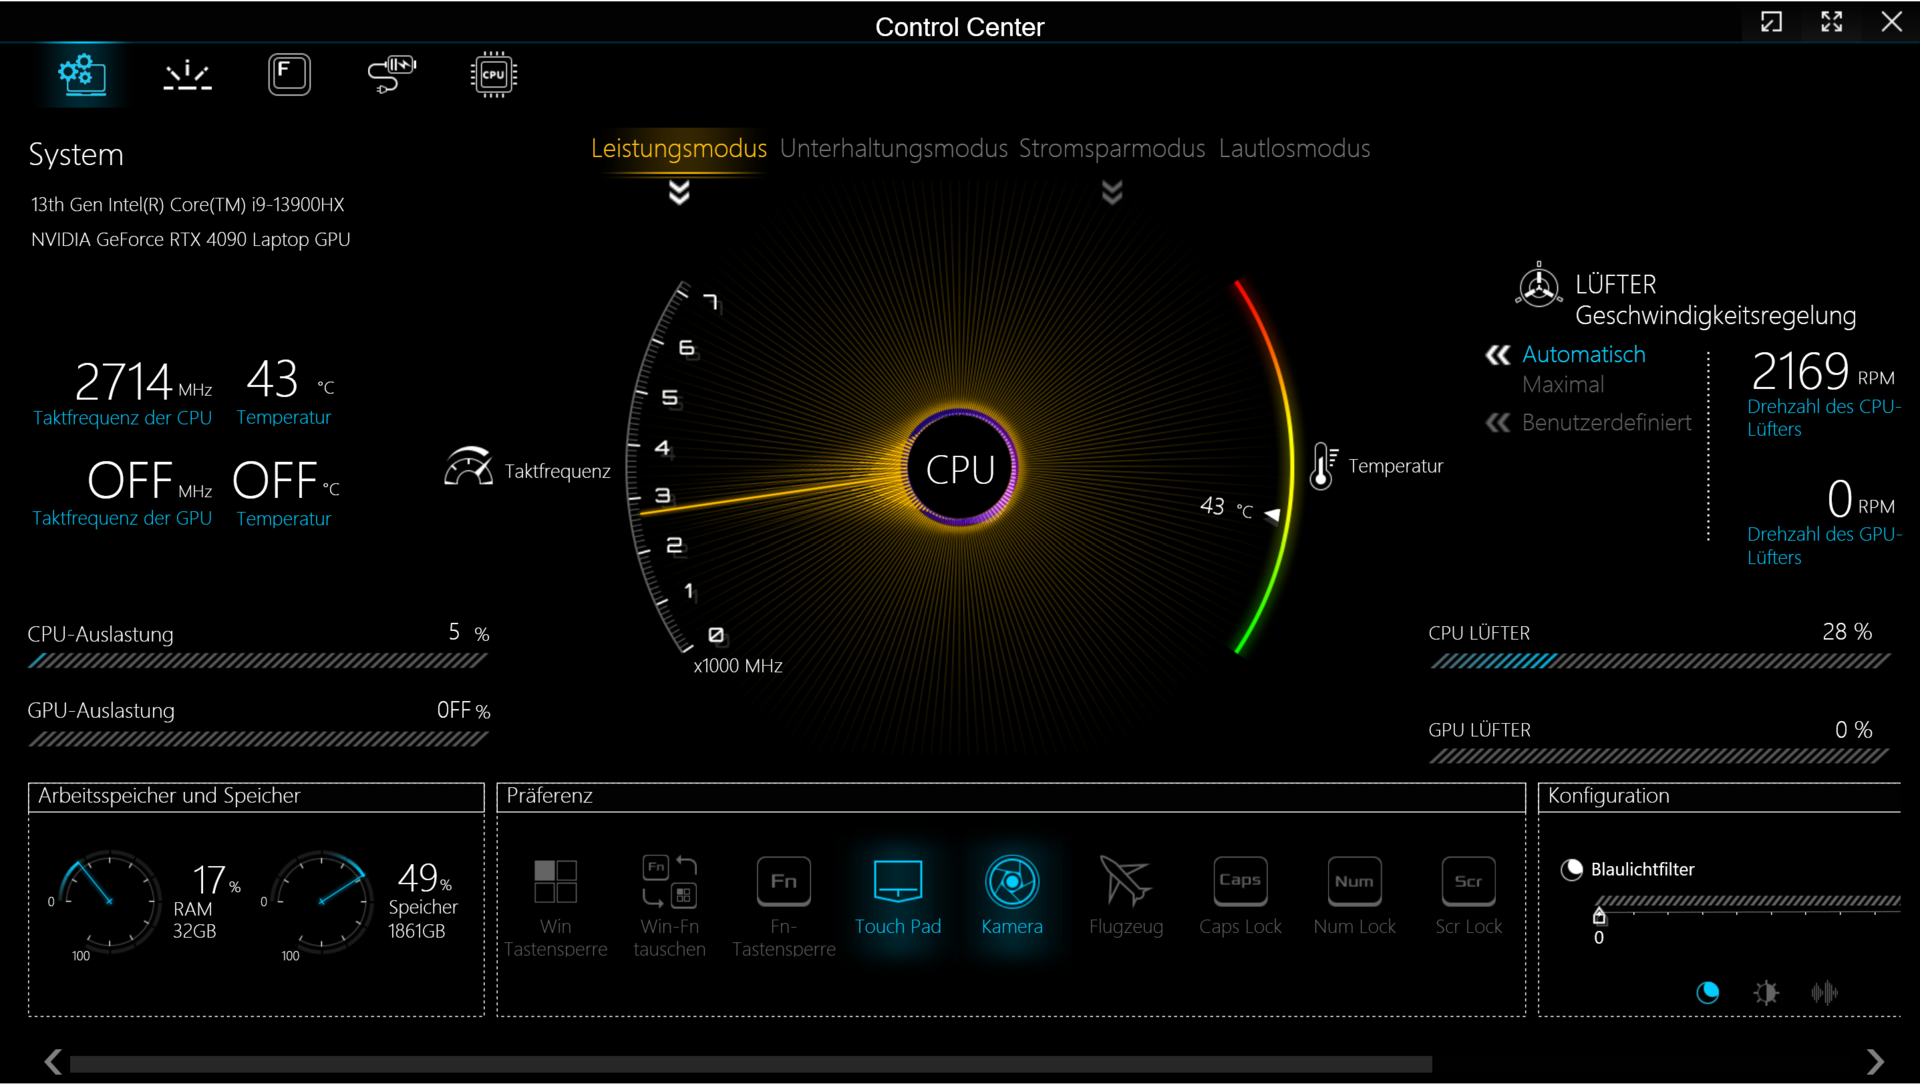
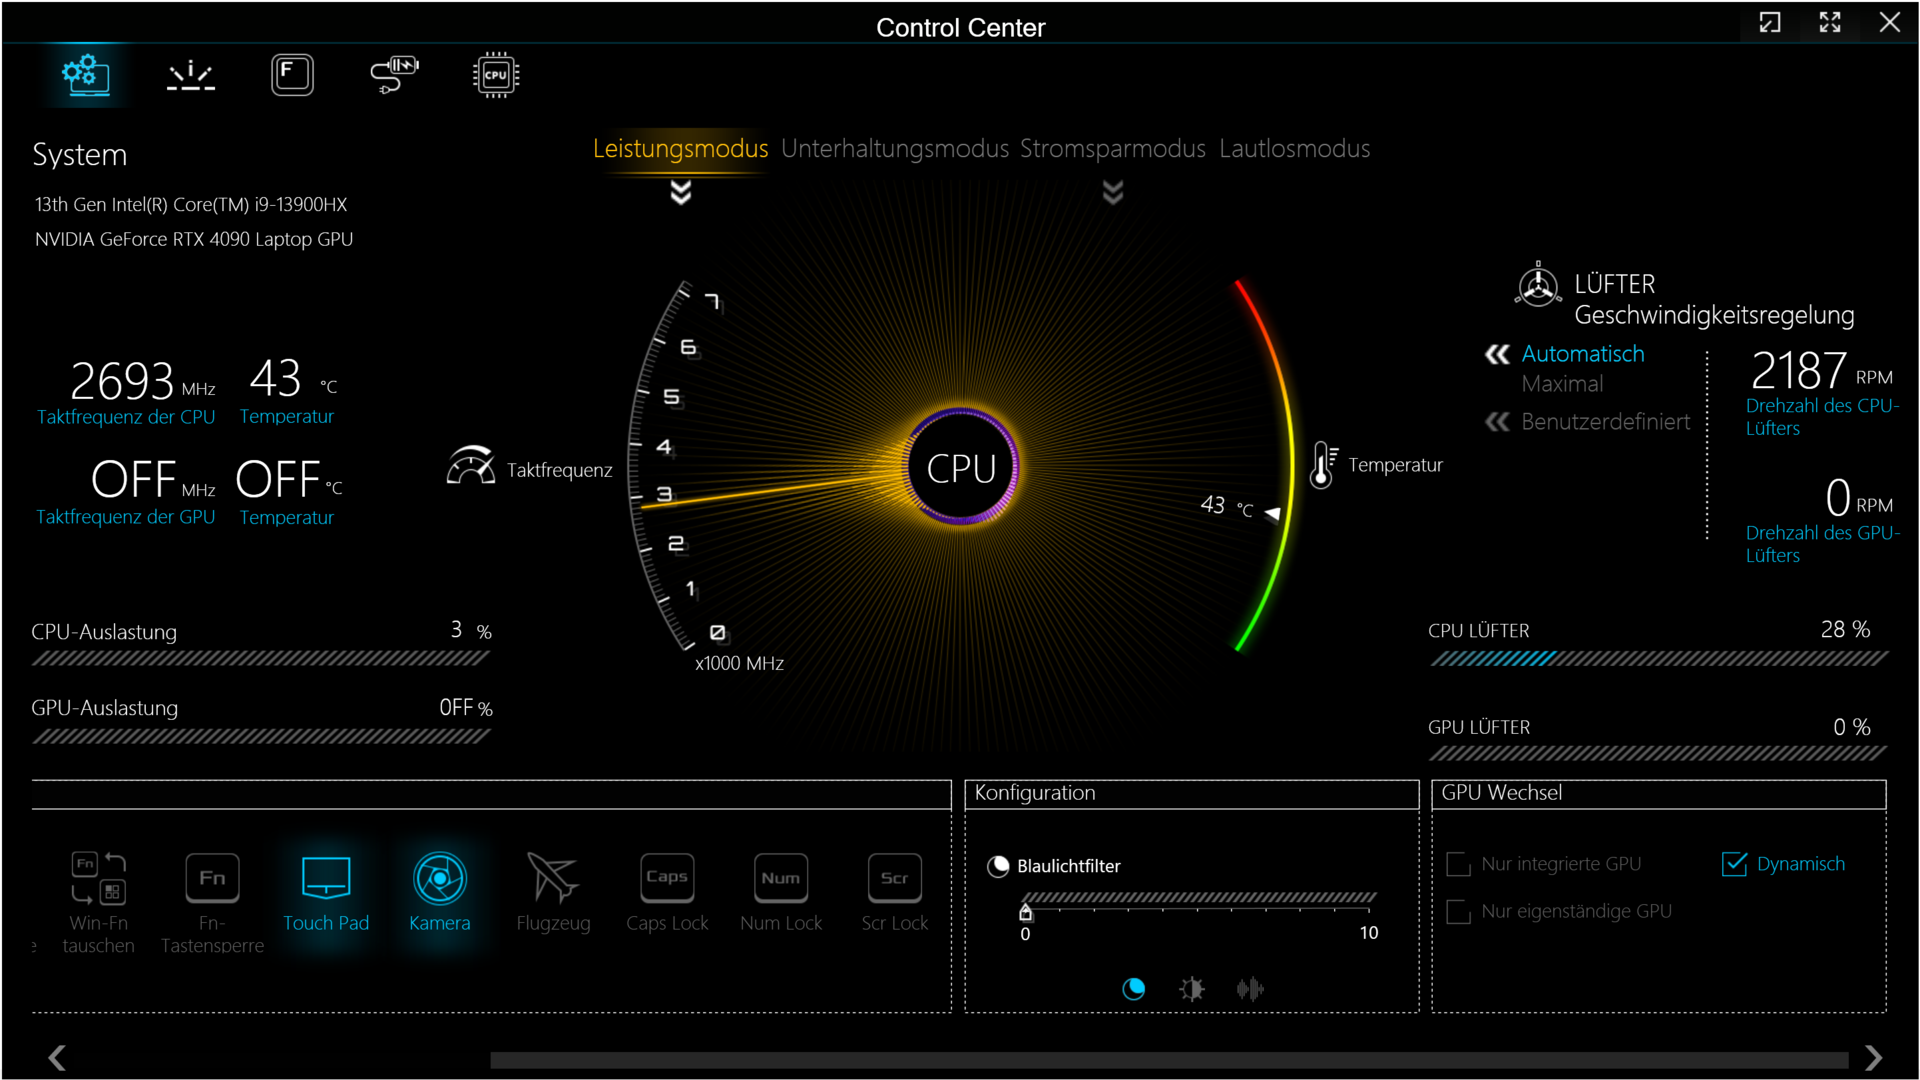
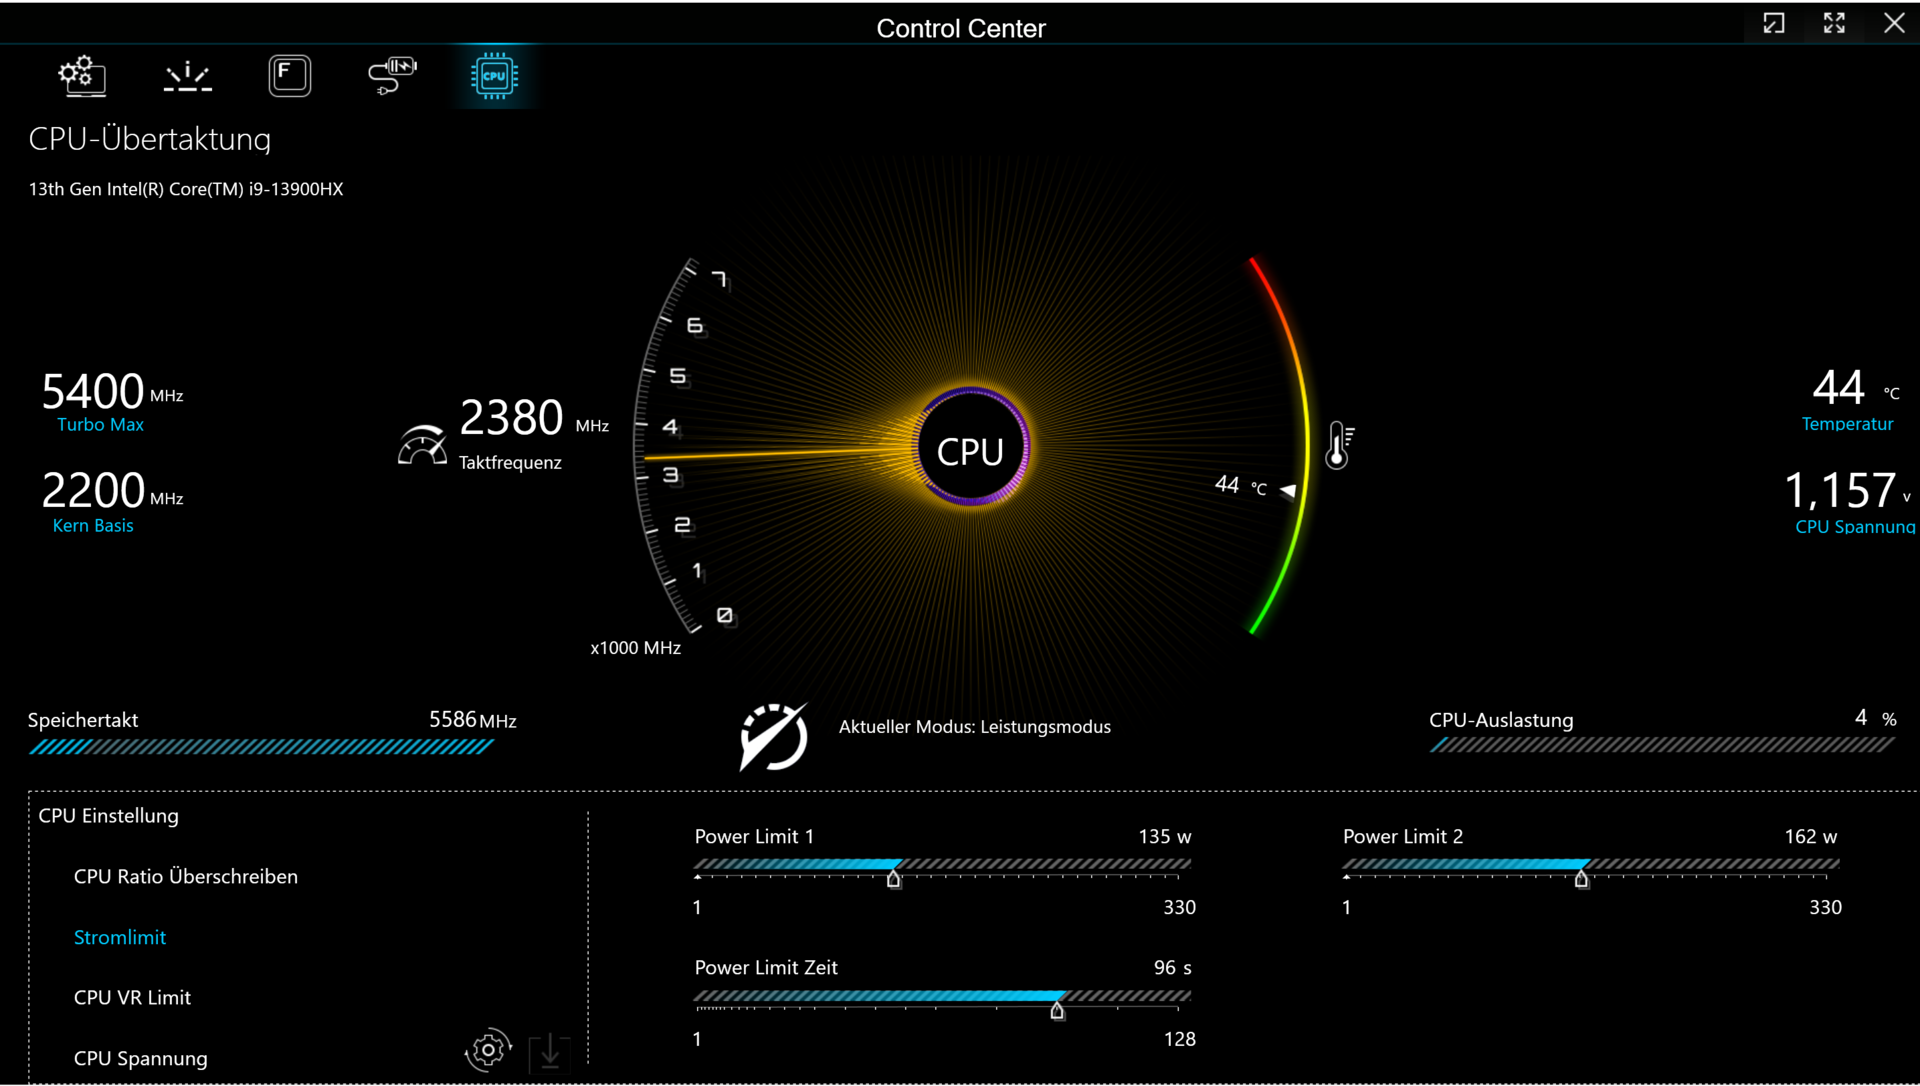
Il Key 17 Pro offre quattro modalità di alimentazione specificate dal produttore (vedi tabella). È possibile passare da una all'altra utilizzando il software Control Center installato sul portatile. Abbiamo eseguito i nostri benchmark in "Modalità prestazioni" e il test di durata della batteria in "Modalità risparmio energetico" (con la RTX 4090 disattivata. Optimus era abilitato durante i nostri test.
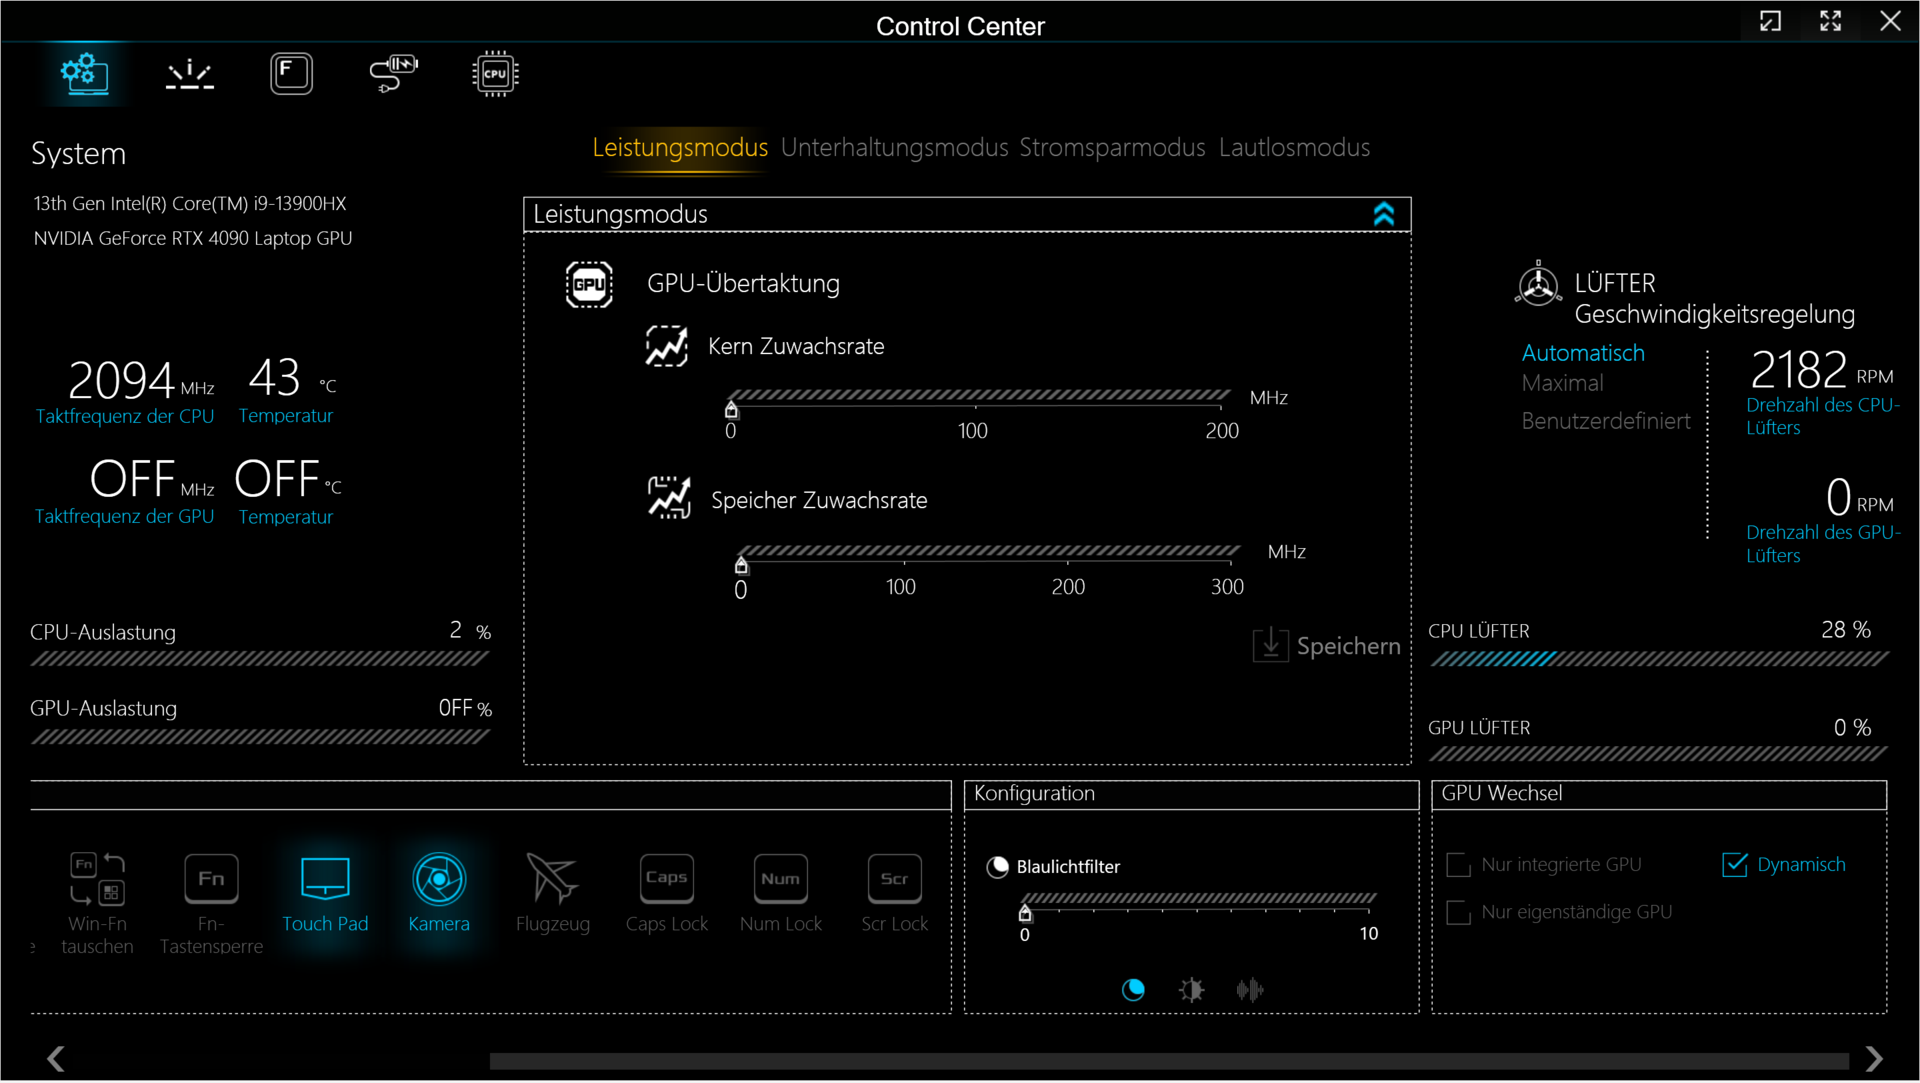
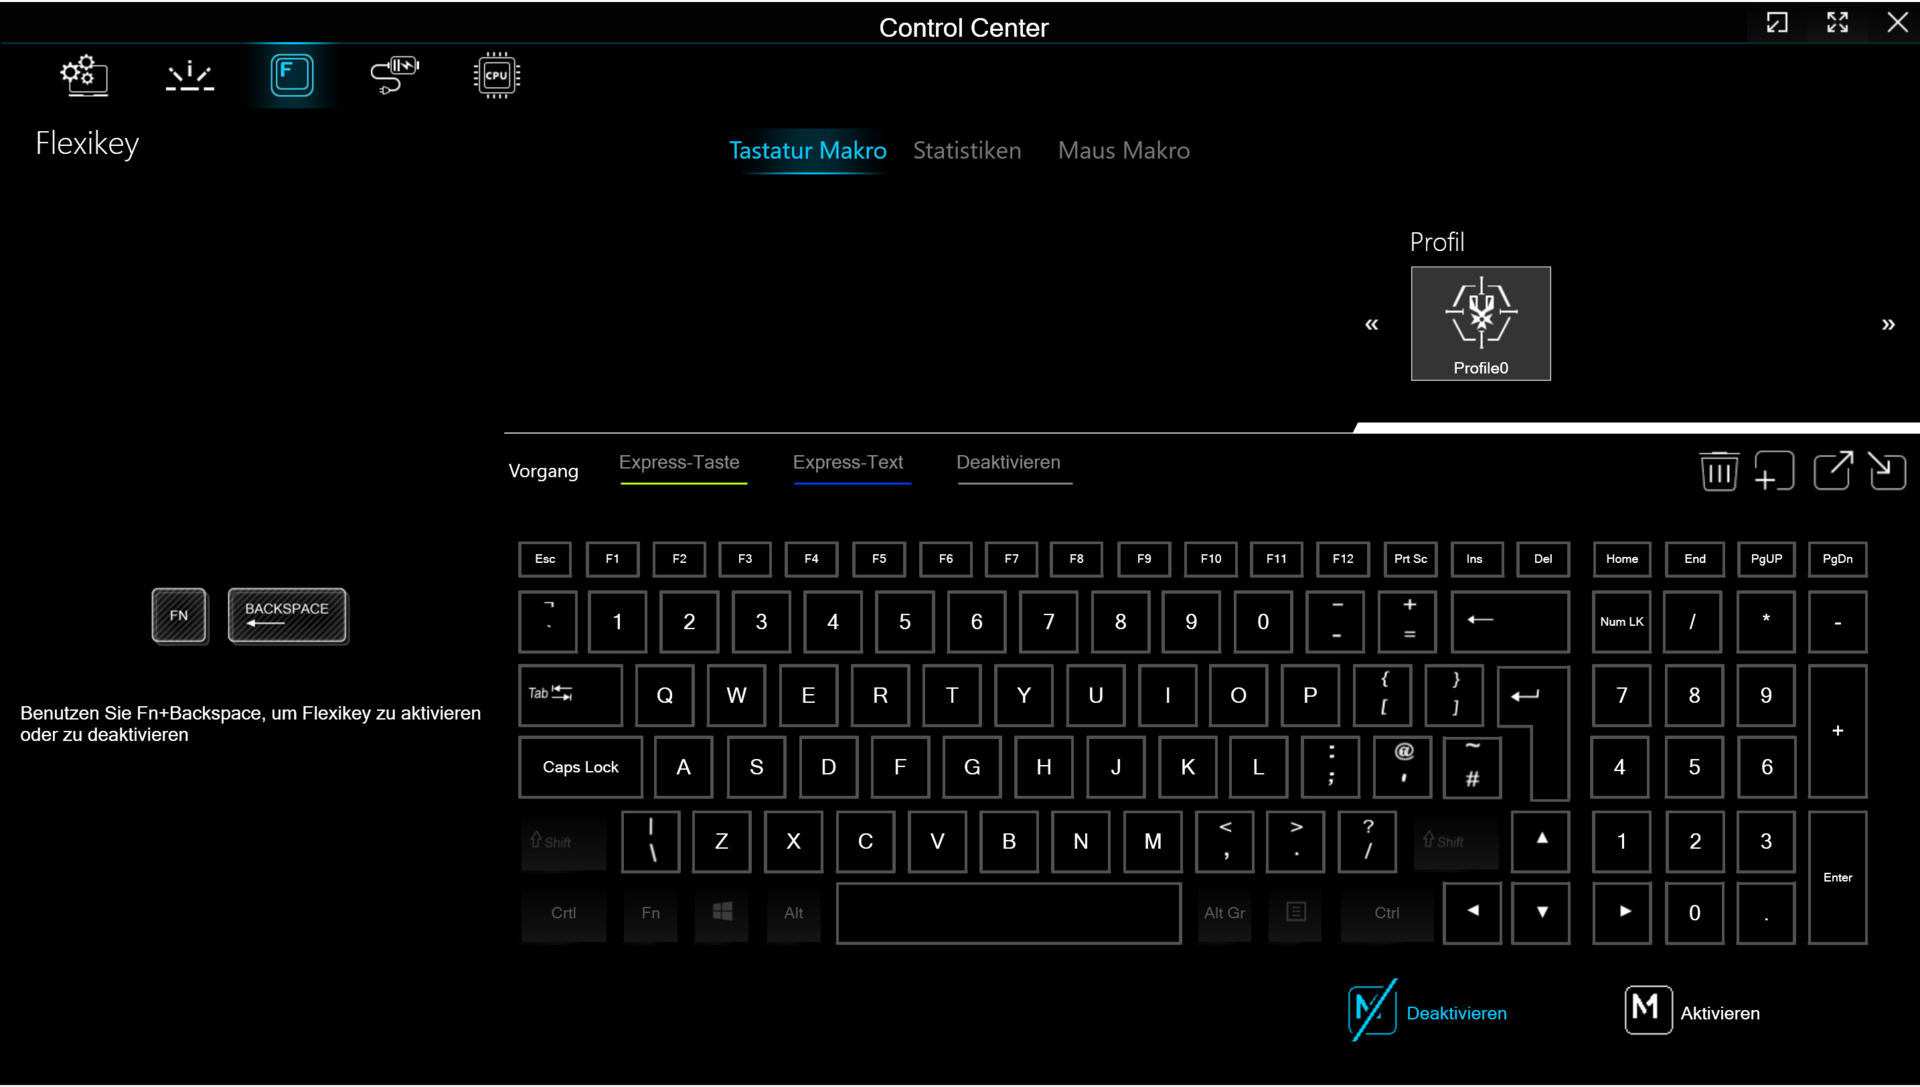
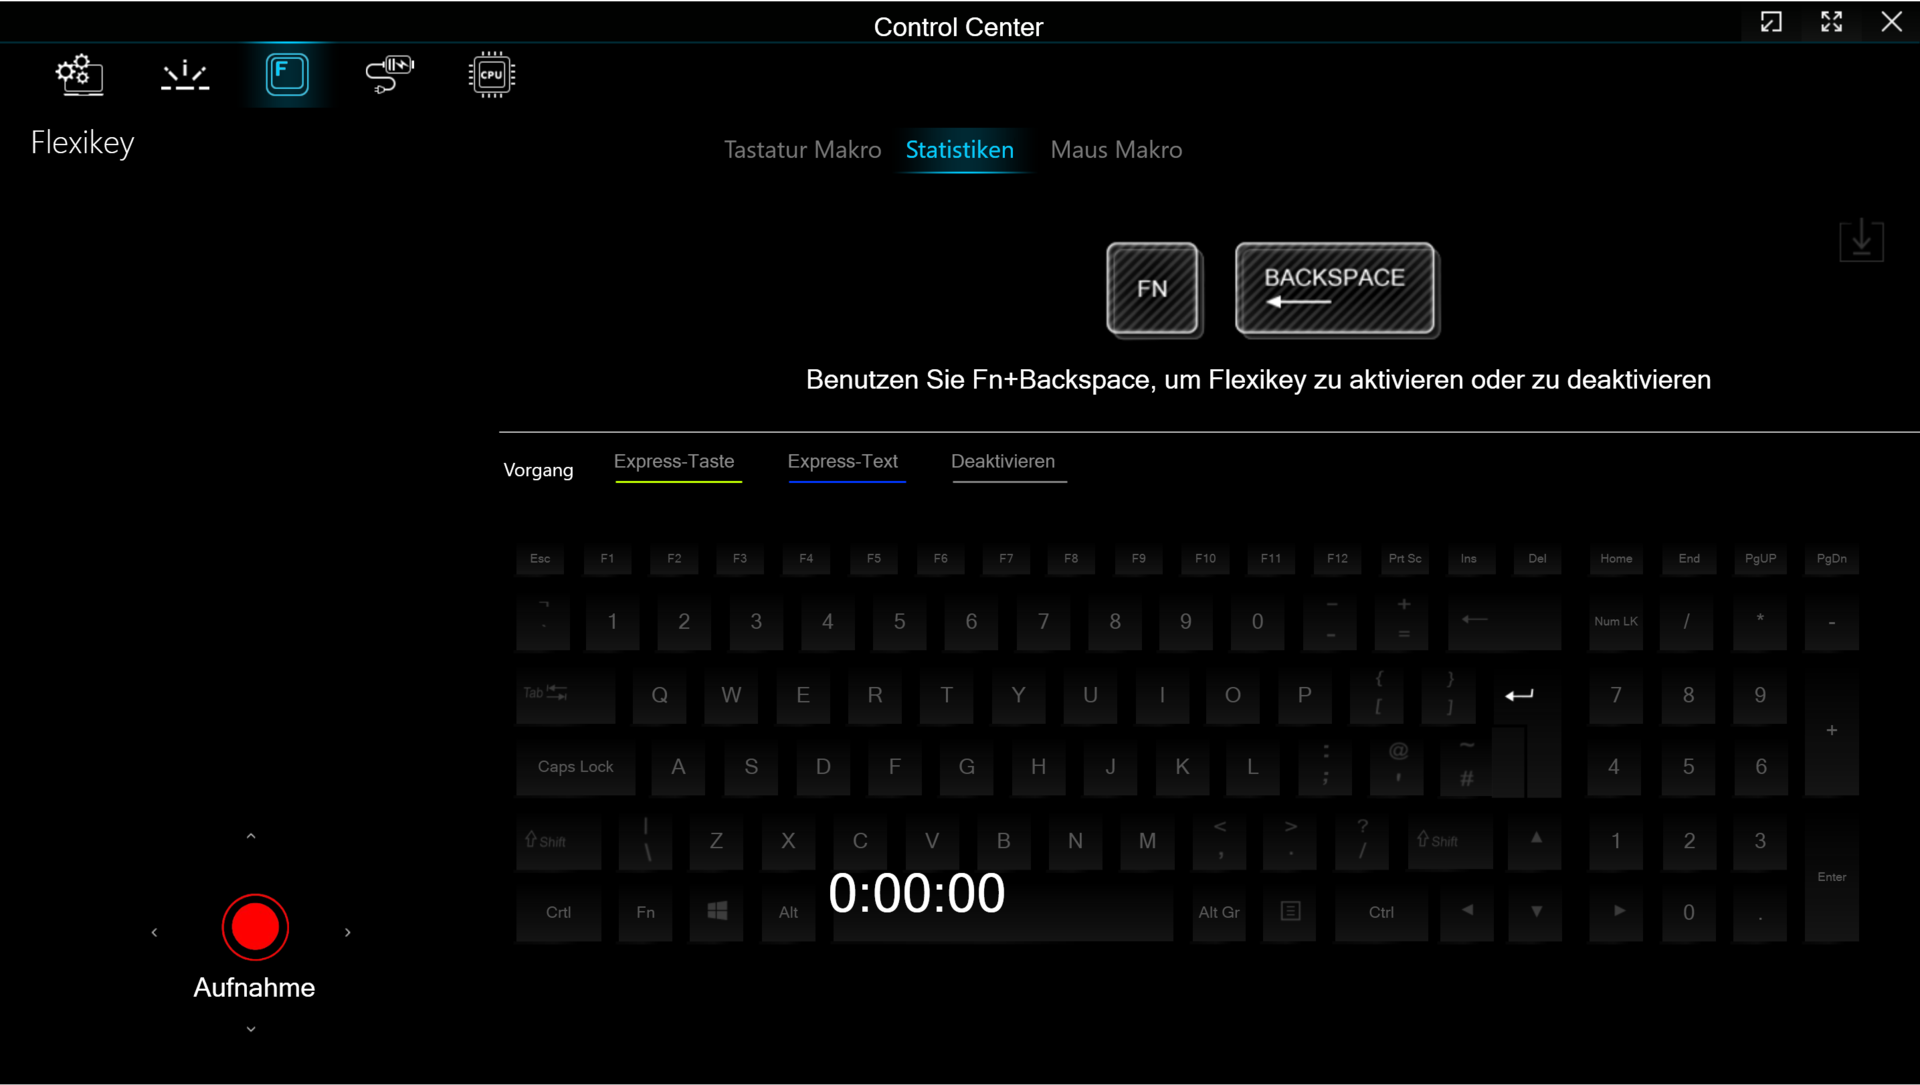
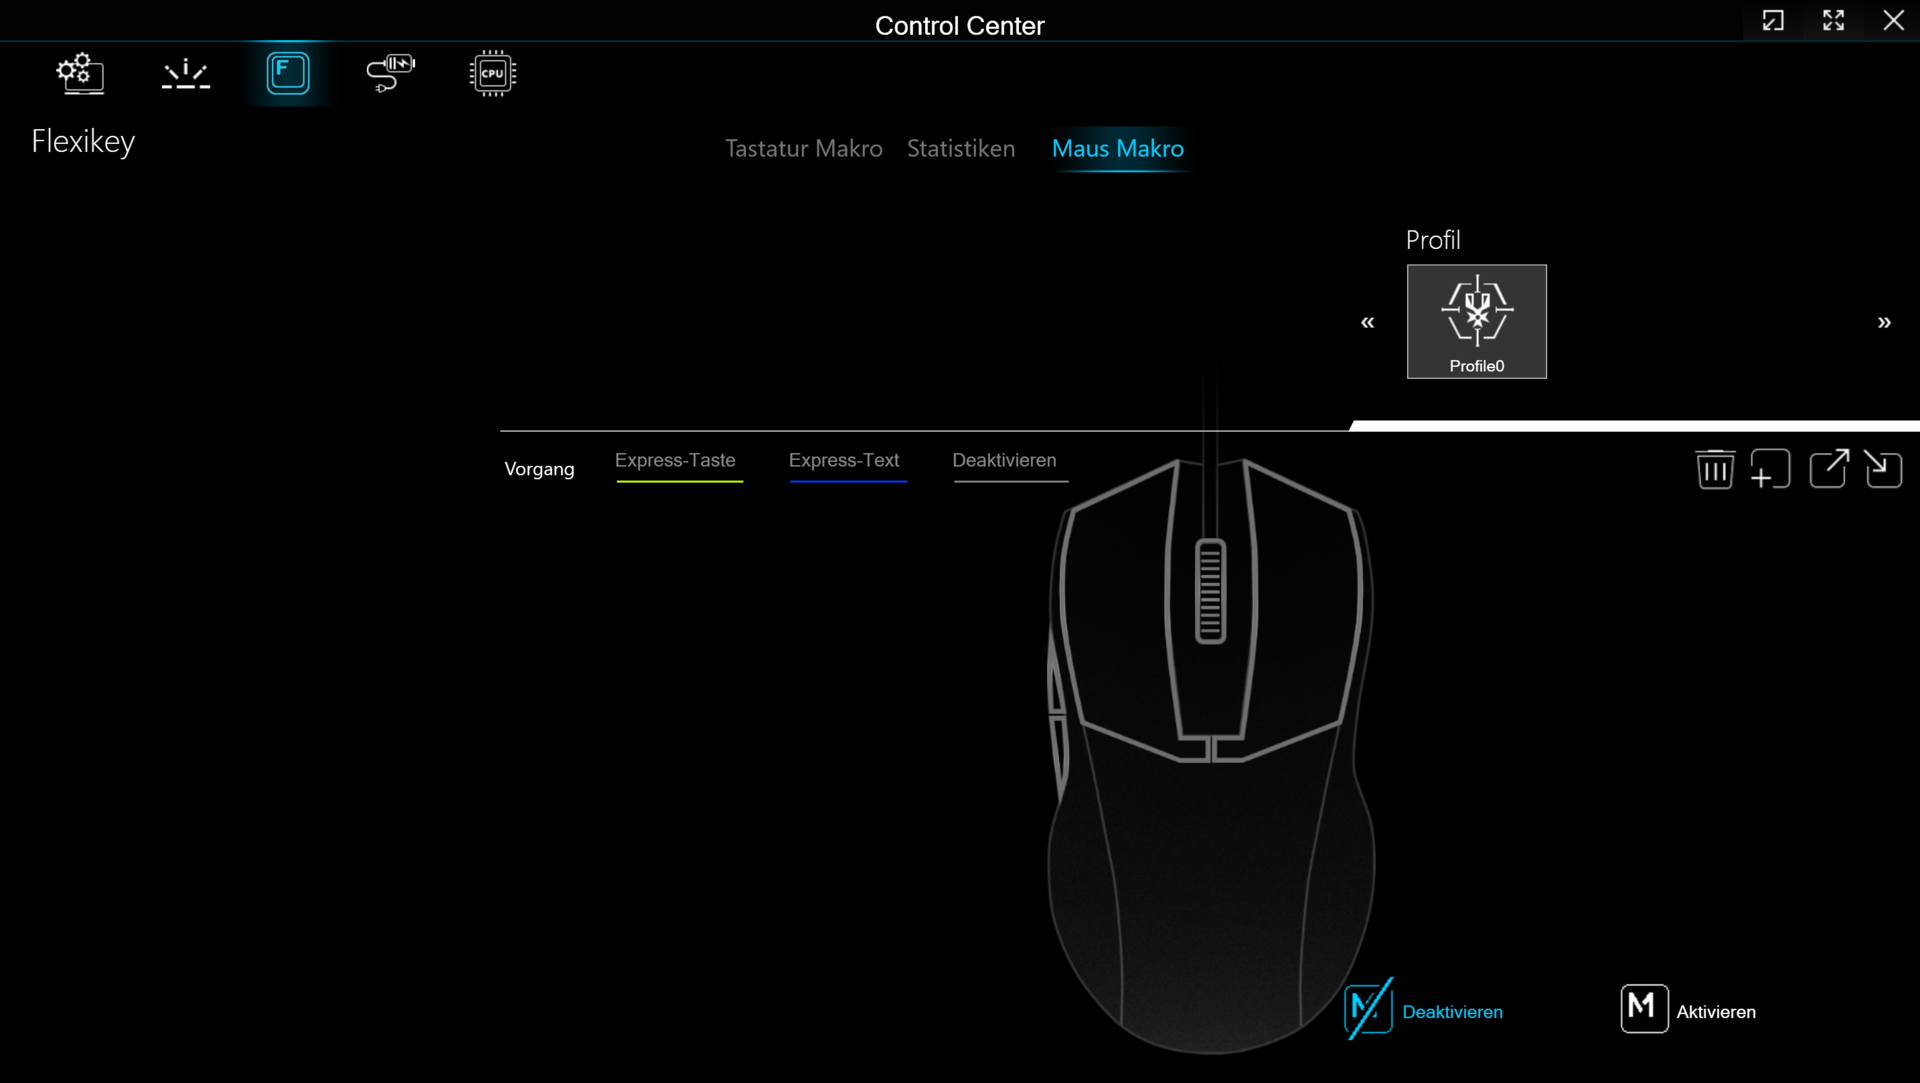
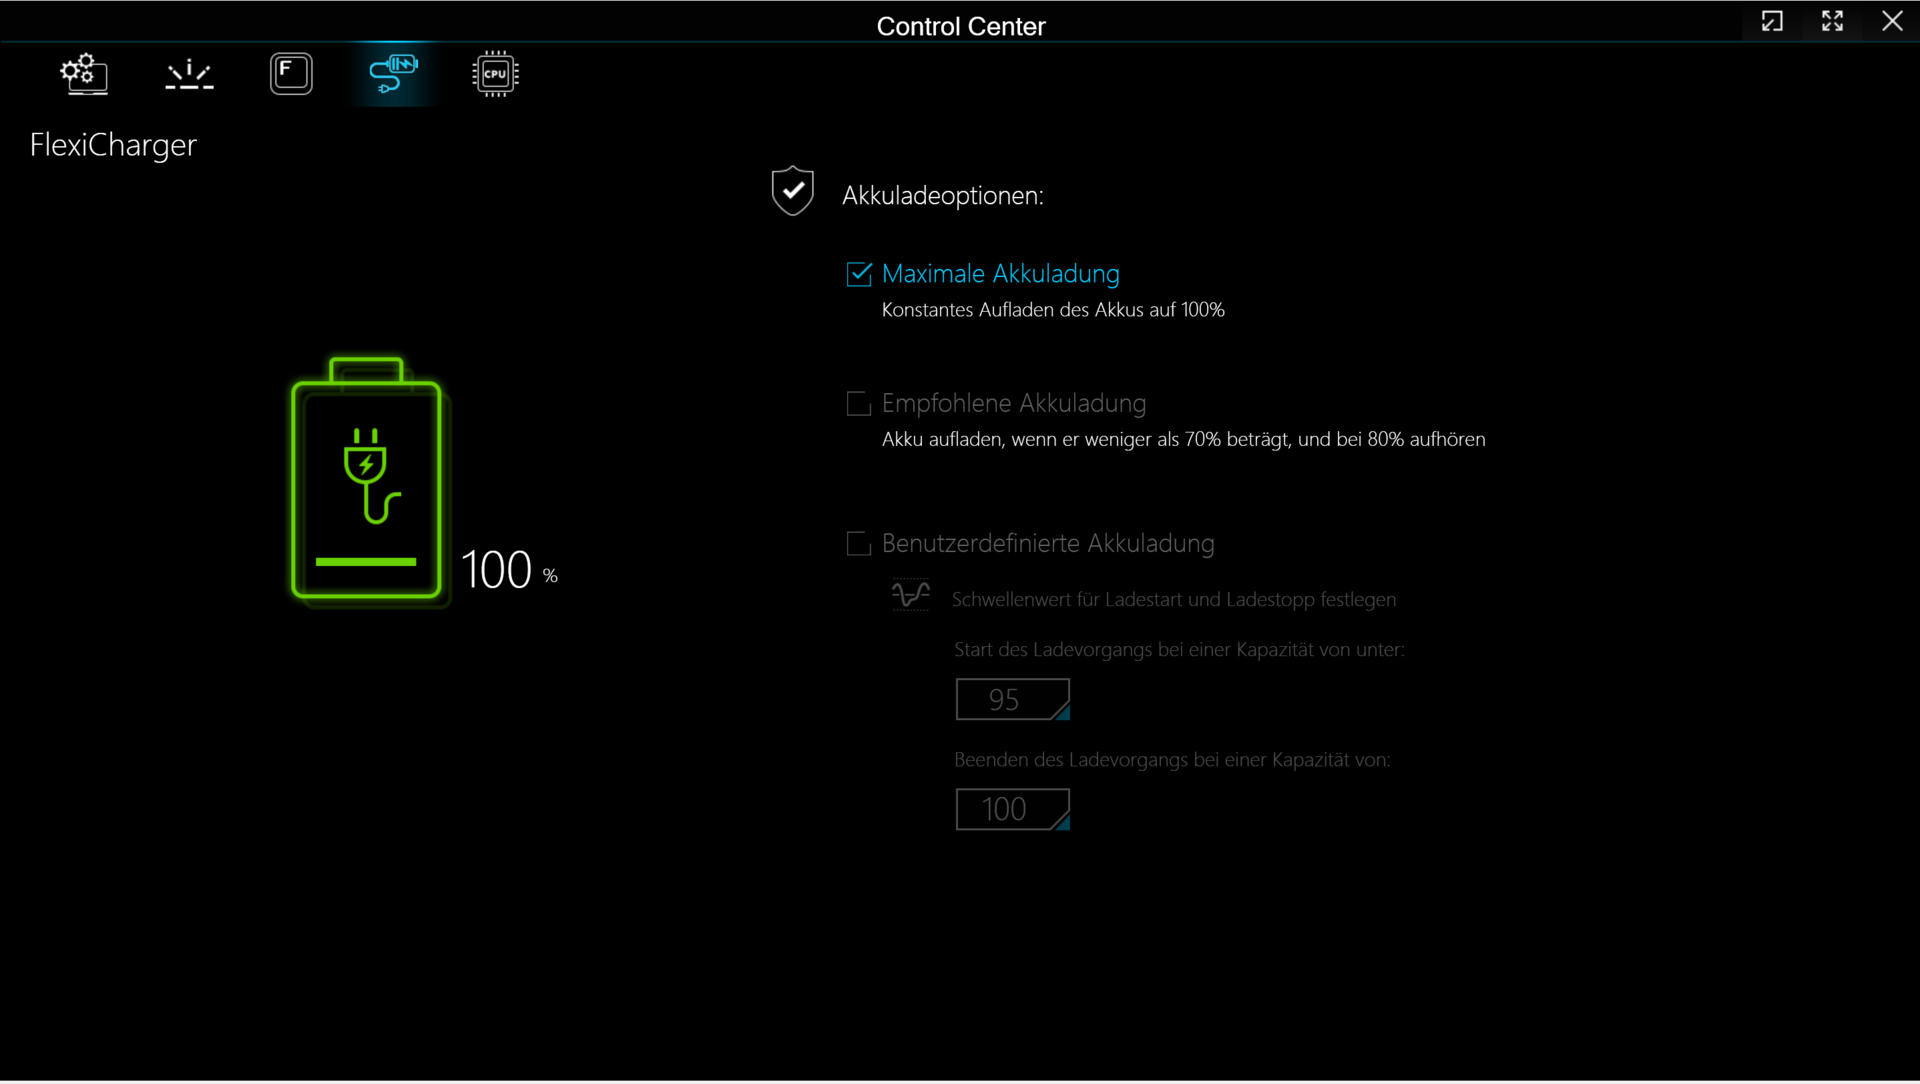
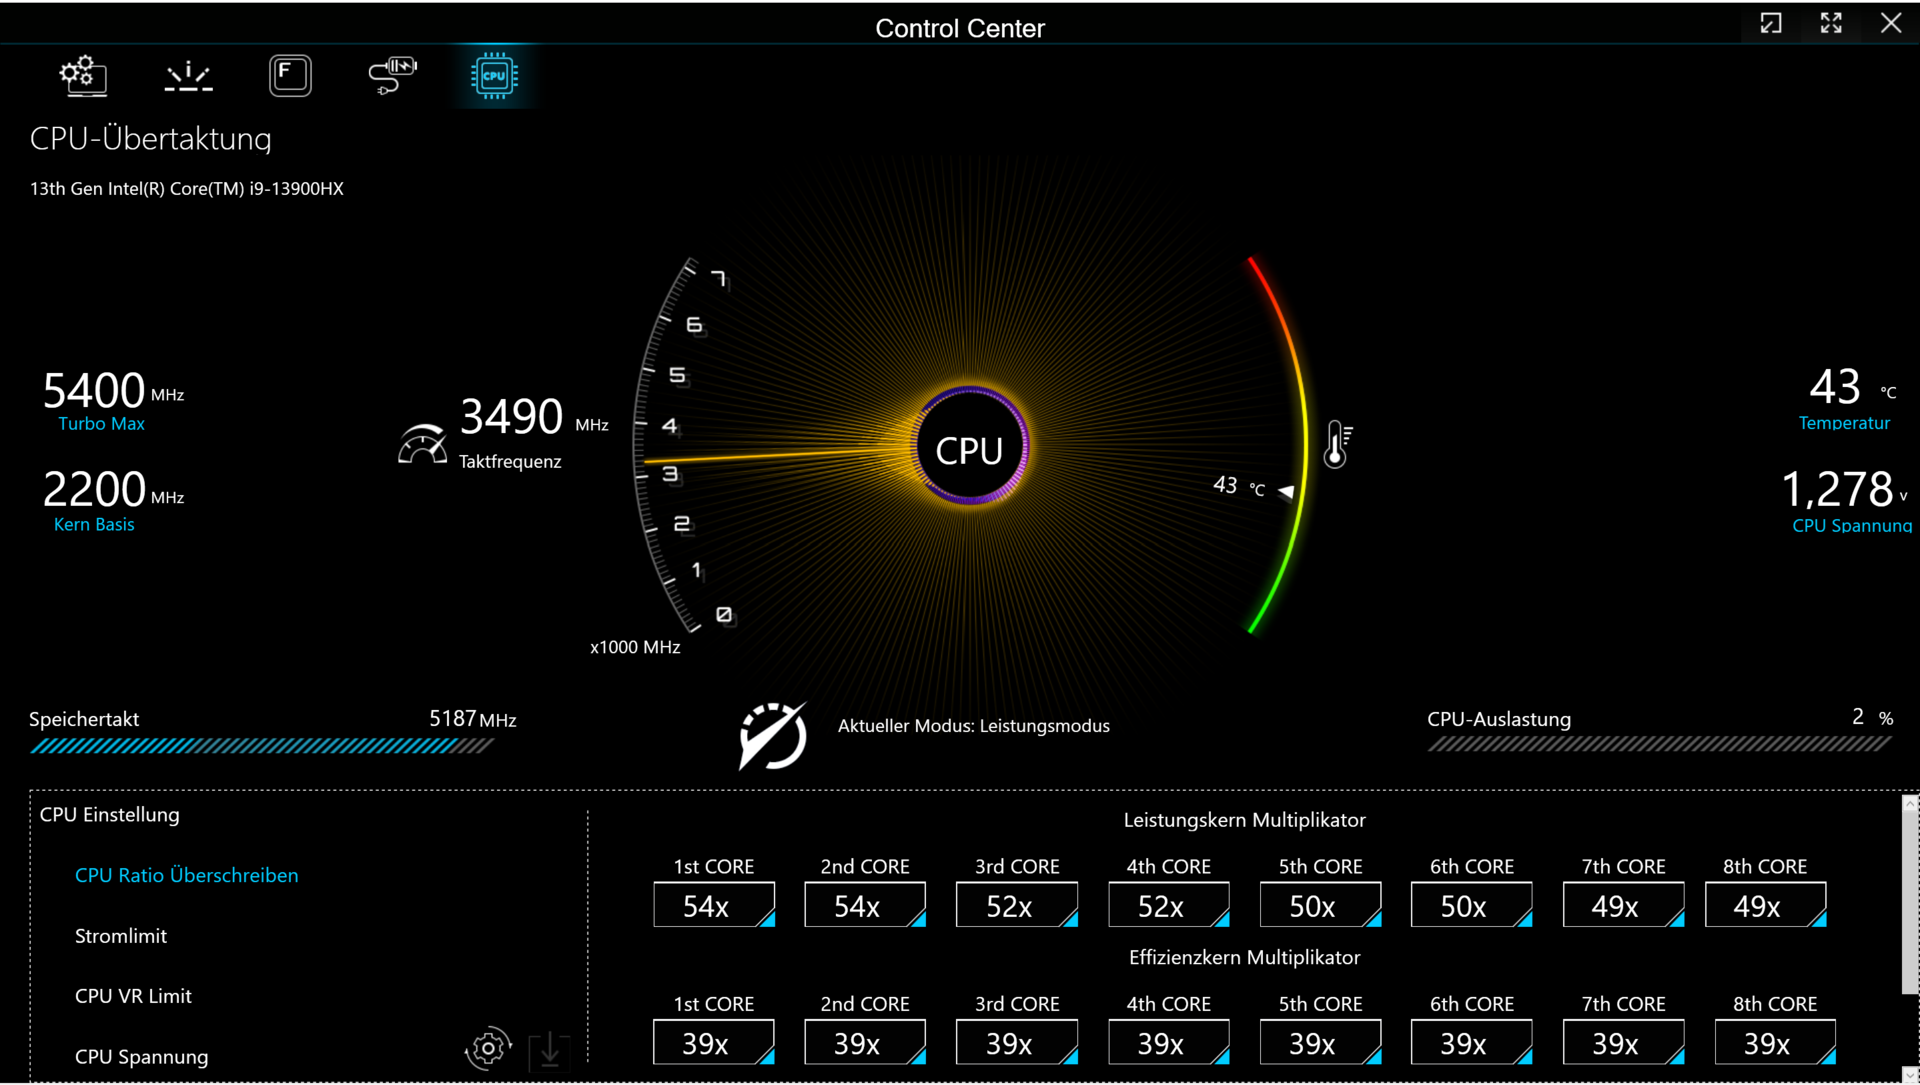
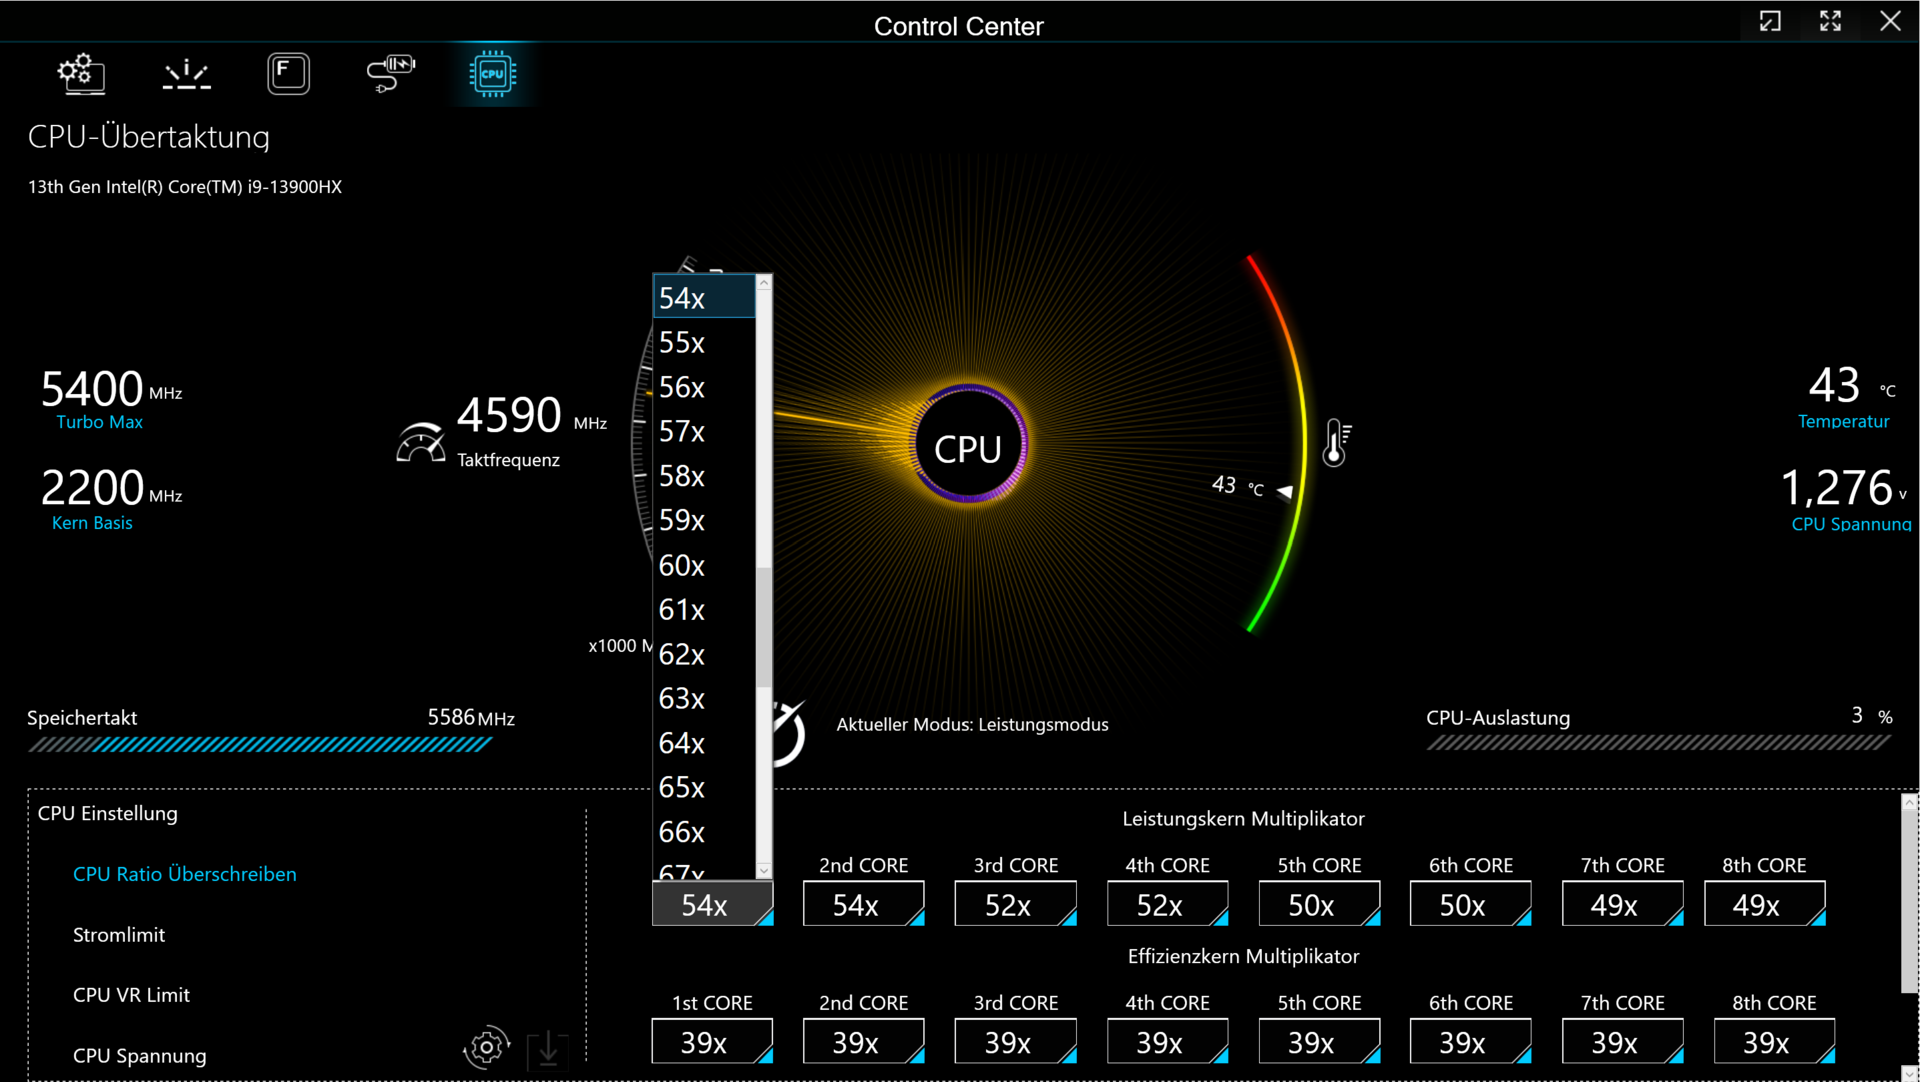
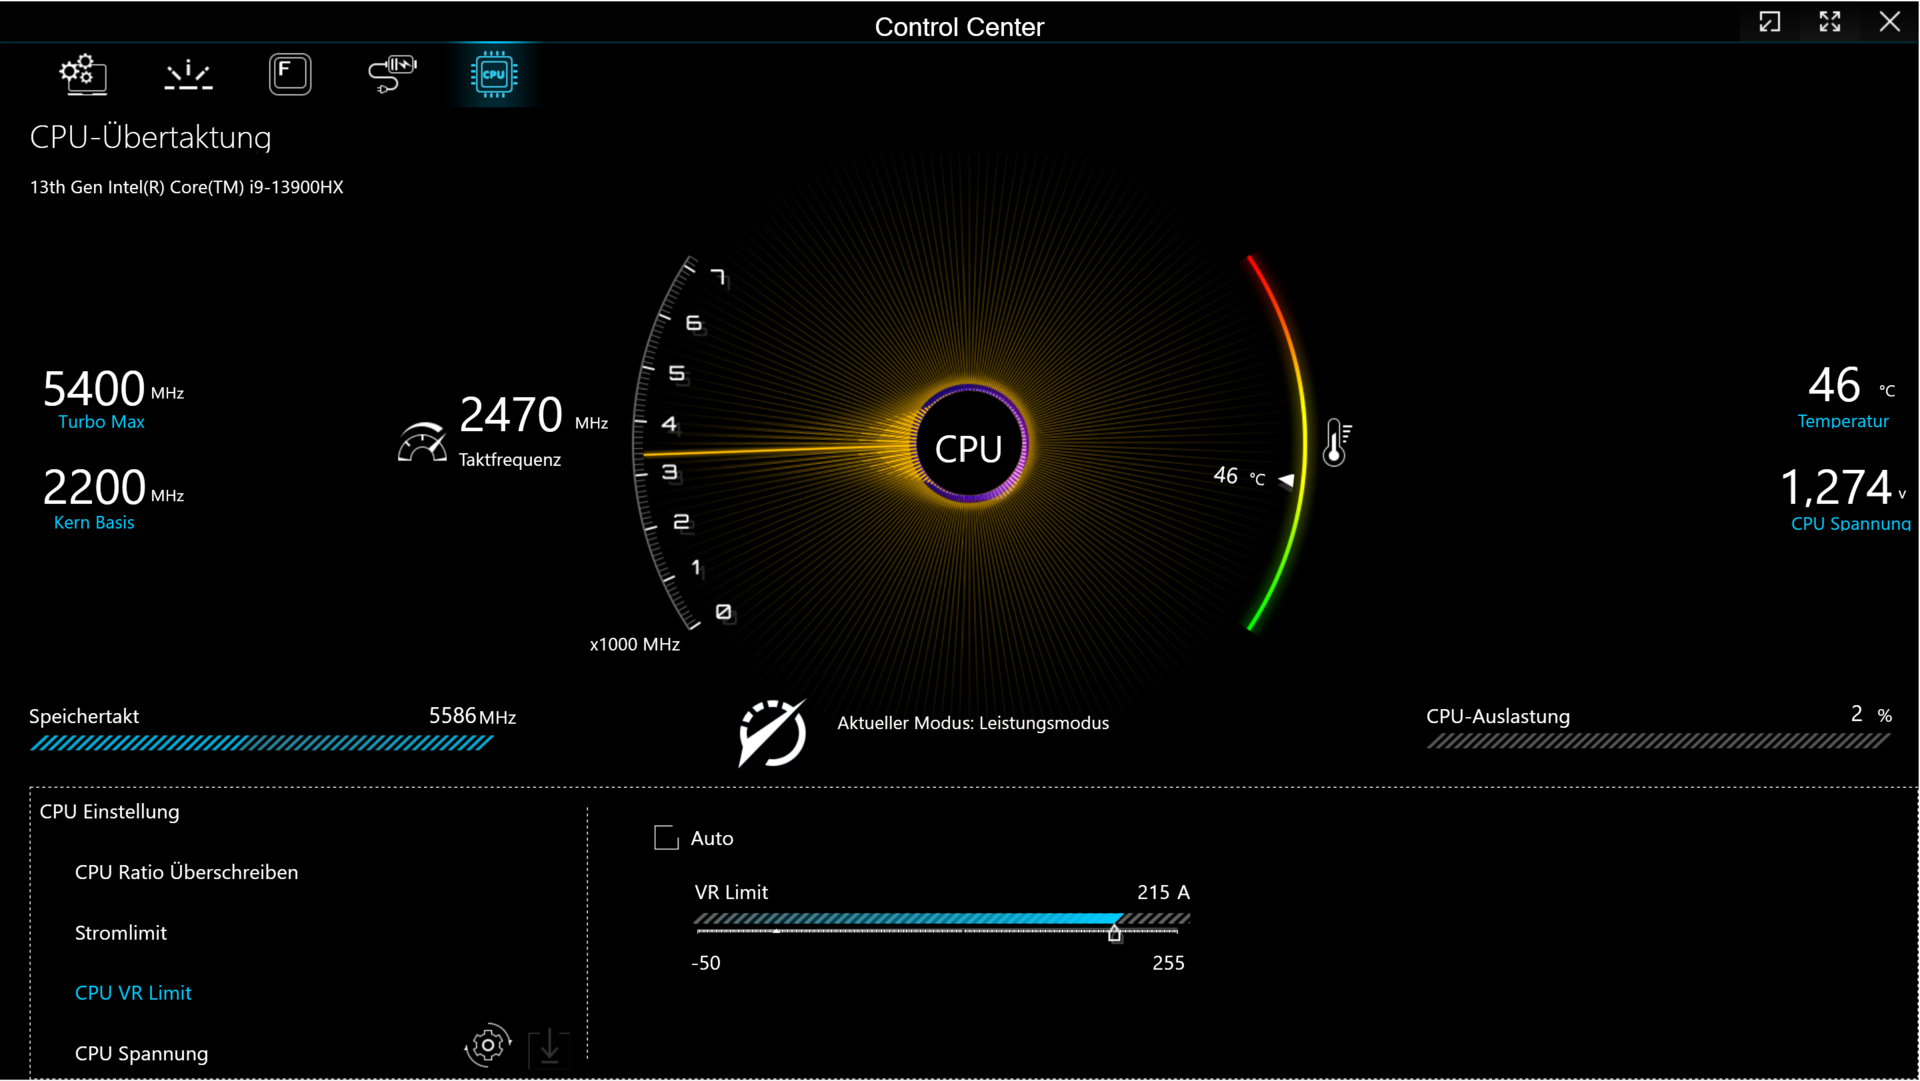
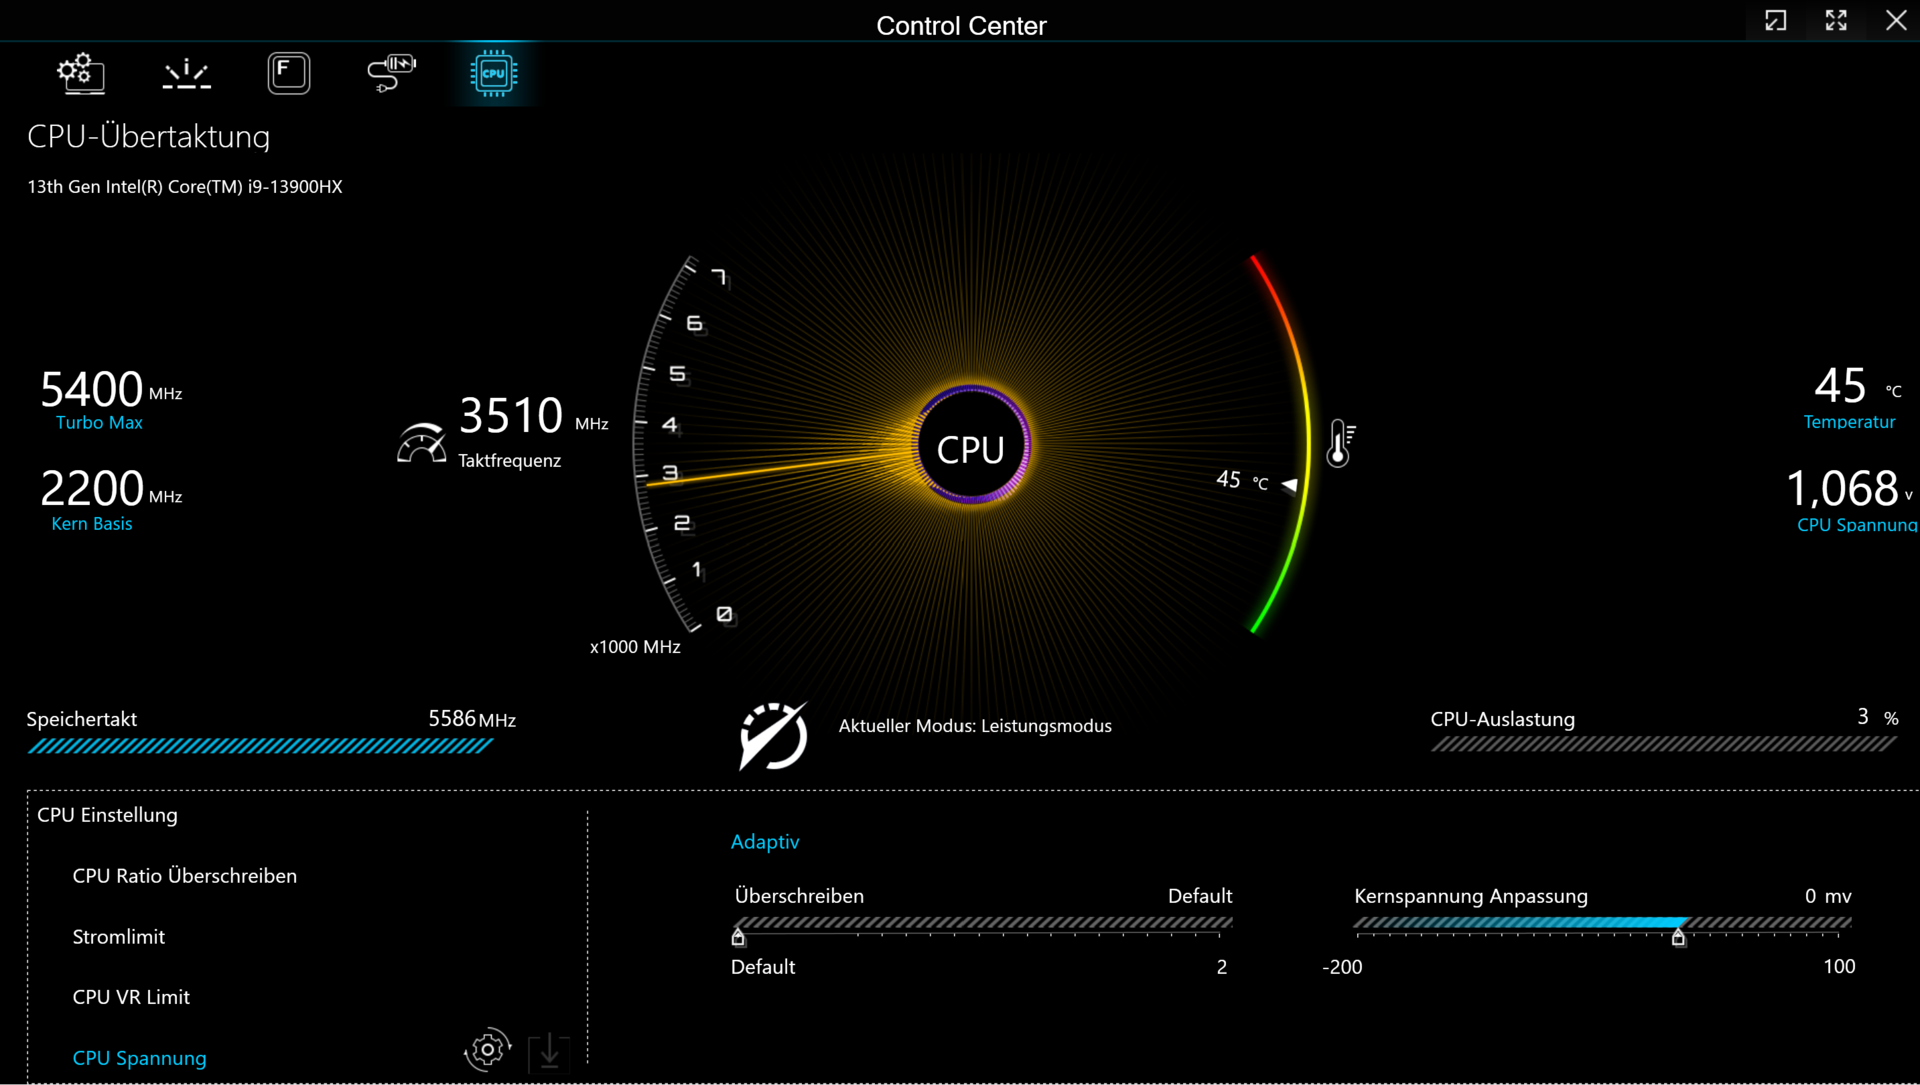
la modalità "Prestazioni" consente agli utenti di overcloccare la GPU e la VRAM nel Control Center. Facendo clic sulle due frecce verso il basso si aprirà il menu corrispondente (figura 3). È necessario abilitare l'overclock della CPU nel BIOS prima che venga visualizzata una nuova scheda in Control Center (vedere le figure da 12 a 16). Ma attenzione: l'overclock dell'hardware è a vostro rischio e pericolo e siete responsabili di eventuali danni.
| Modalità Performance | Modalità Entertainment | Modalità Power Saver | Modalità Silent | |
|---|---|---|---|---|
| CPU PL1 (HWInfo) | 135 Watt | 75 Watt | 15 Watt | 15 Watt |
| CPU PL2 (HWInfo) | 162 Watt | 130 Watt | 30 Watt | 30 Watt |
| Rumore (Witcher 3) | 62 dB(A) | 54 dB(A) | - | 42 dB(A) |
| Prestazioni (Witcher 3) | ~204 fps | ~188 fps | - | 50 bis 60 fps |
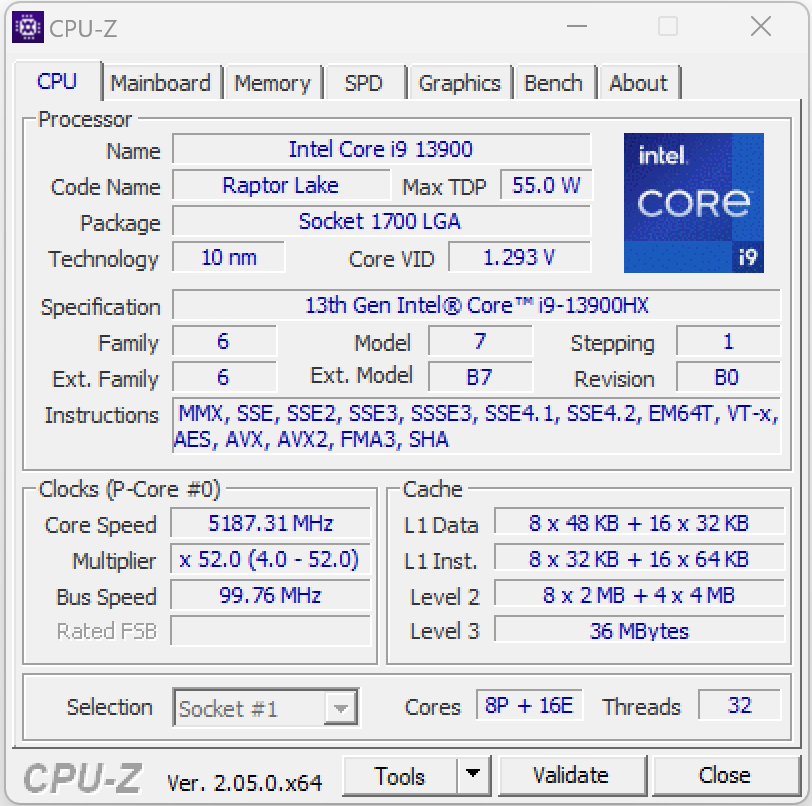
Processore
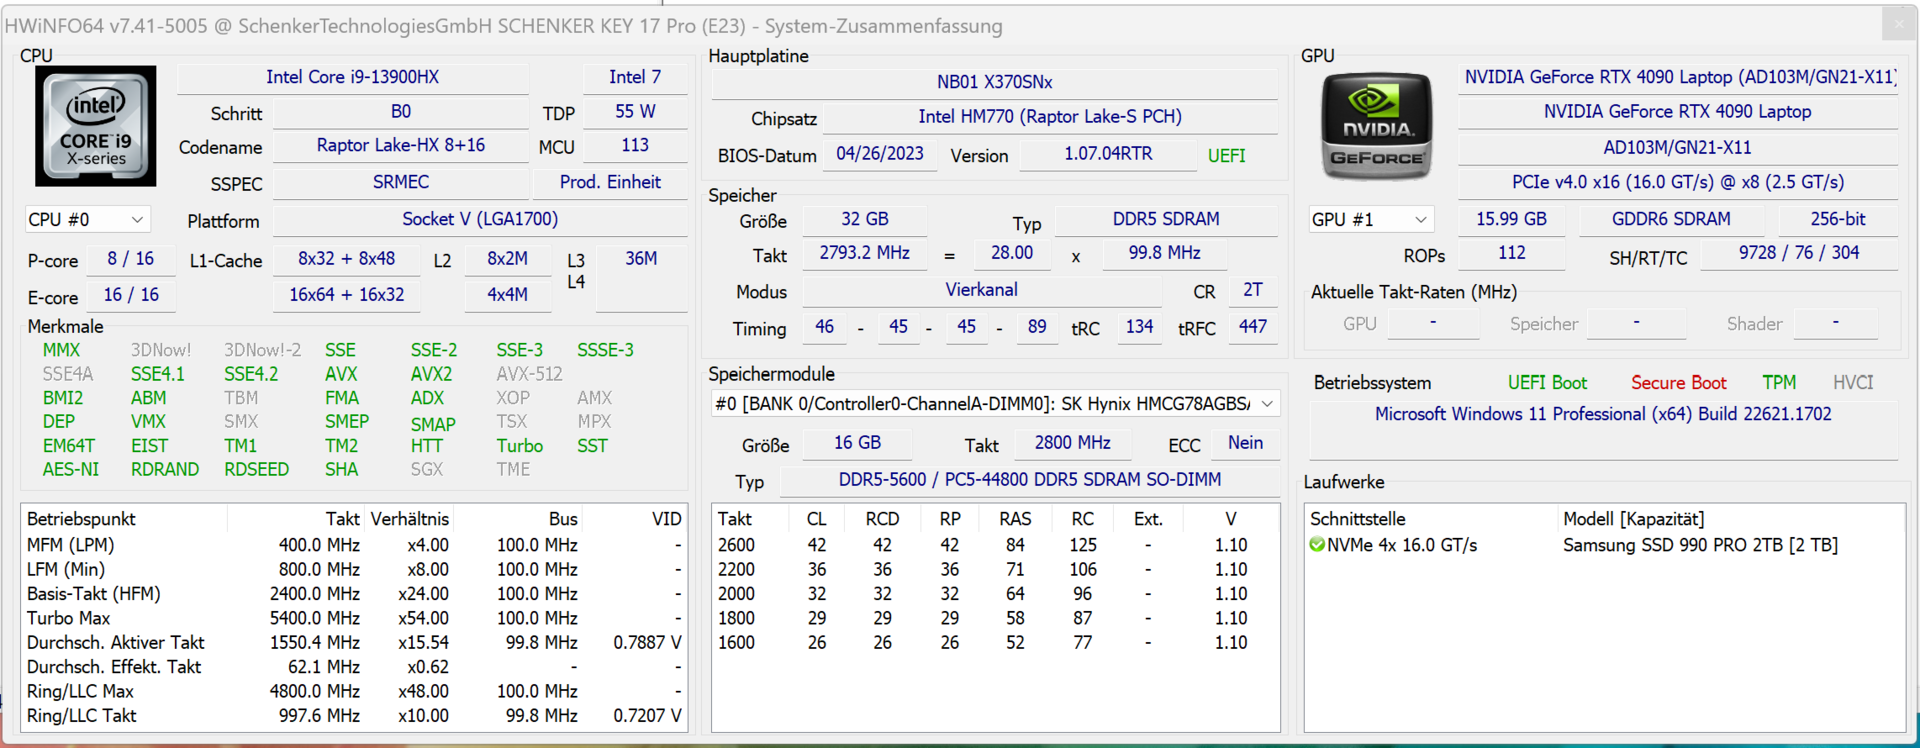
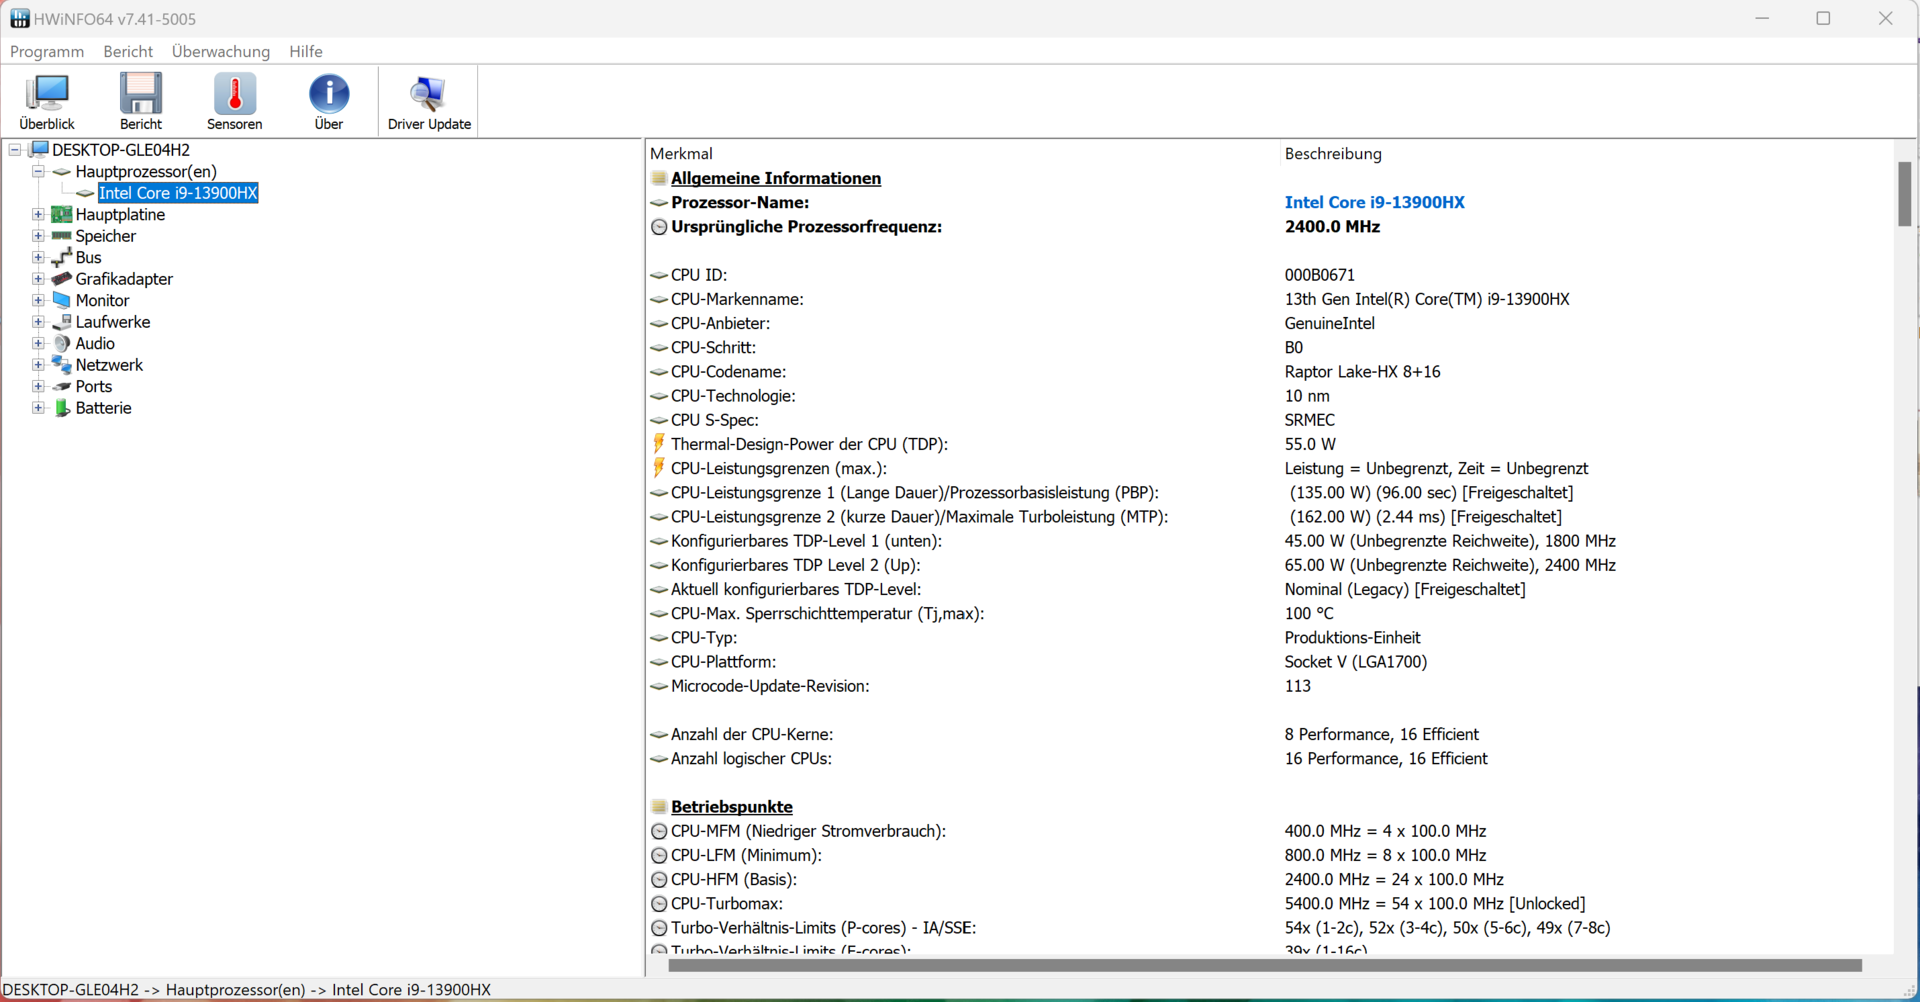
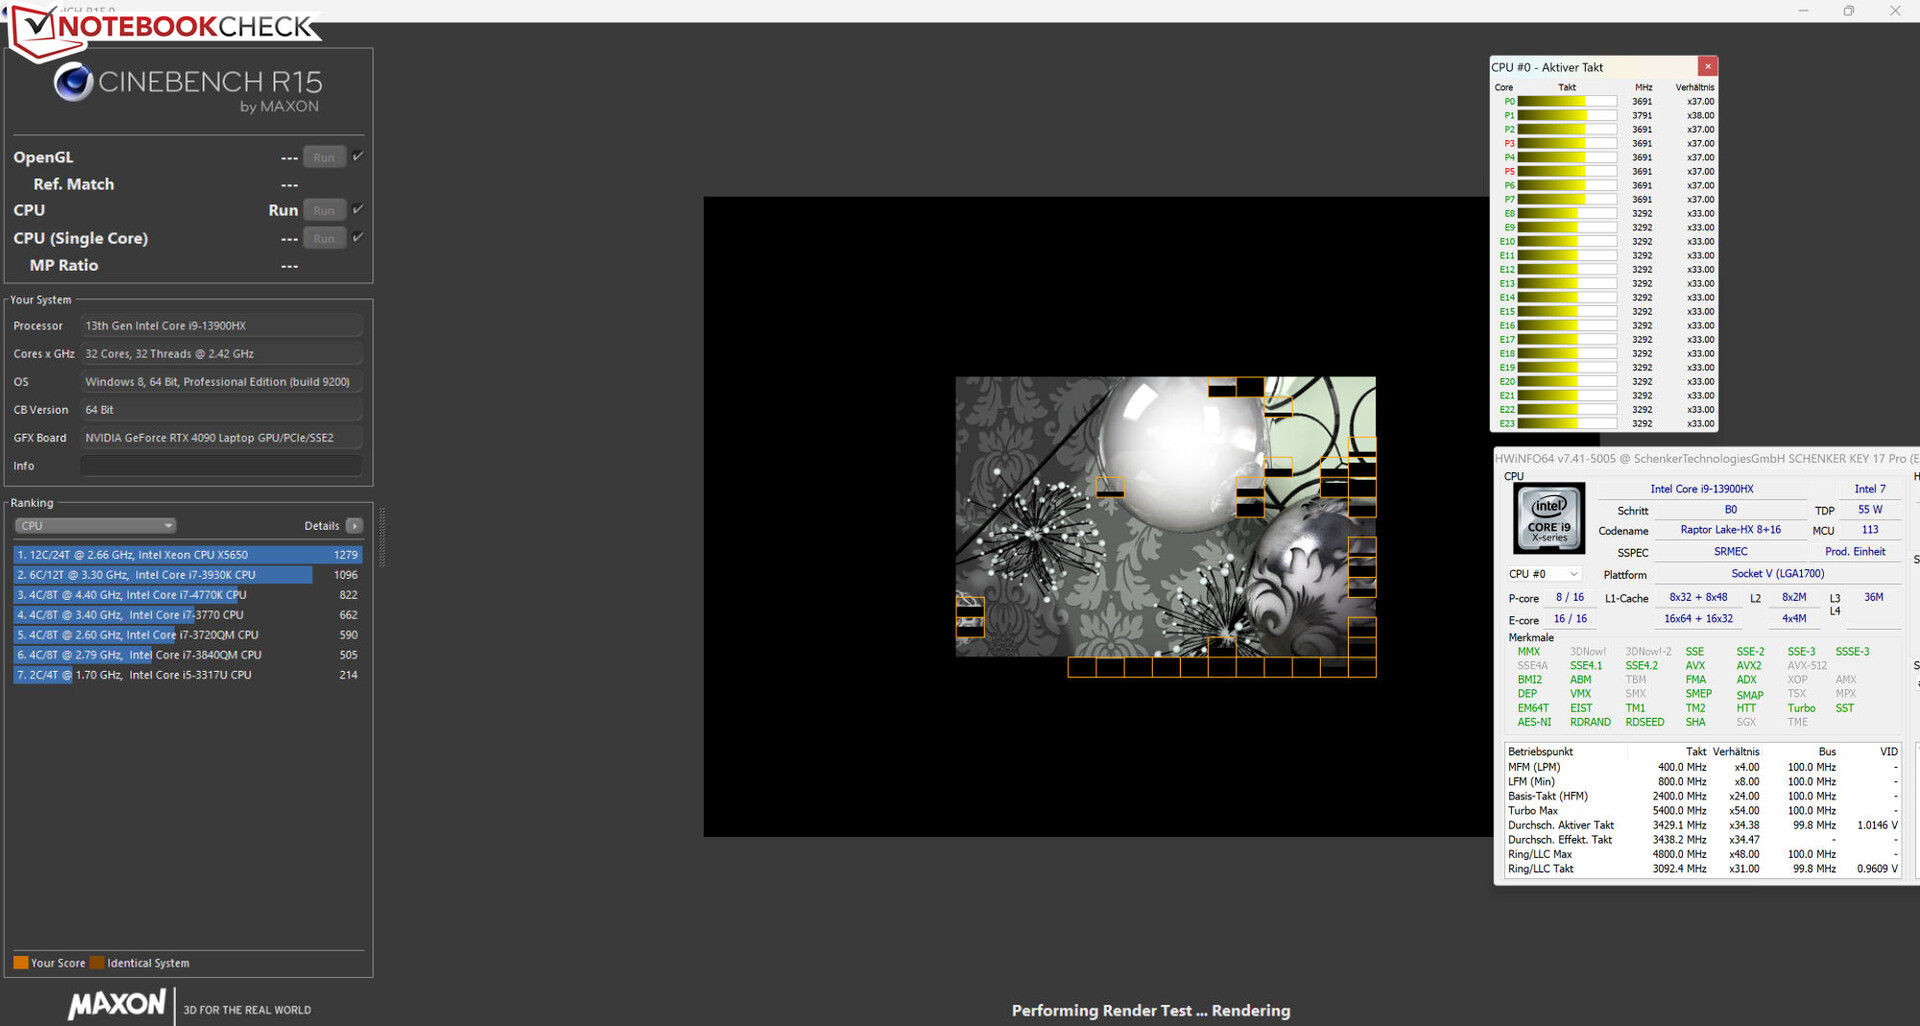
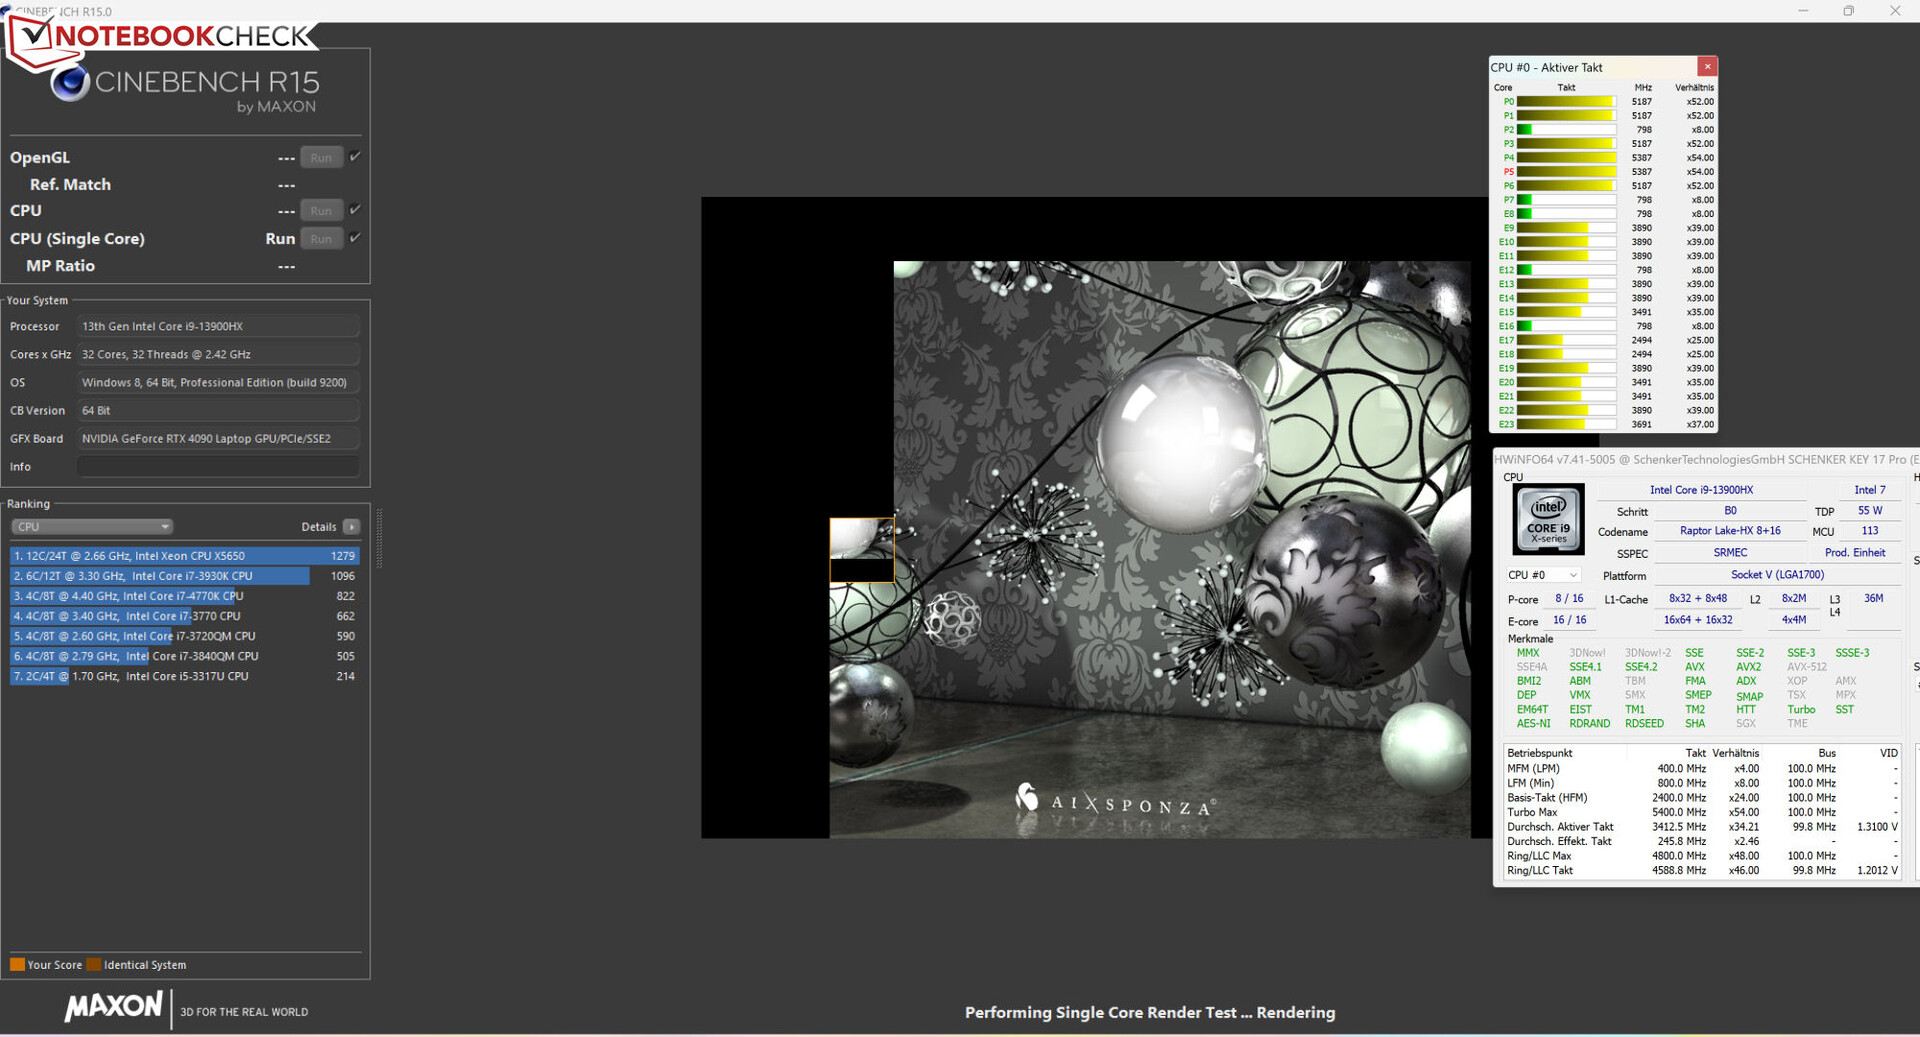
Il processore Core i9-13900HX Raptor Lake è composto da otto core per le prestazioni (Hyperthreading, da 2,2 a 5,4GHz) e sedici core per l'efficienza (senza Hyperthreading, da 1,6 a 3,9GHz), per un totale di 32 core logici della CPU.
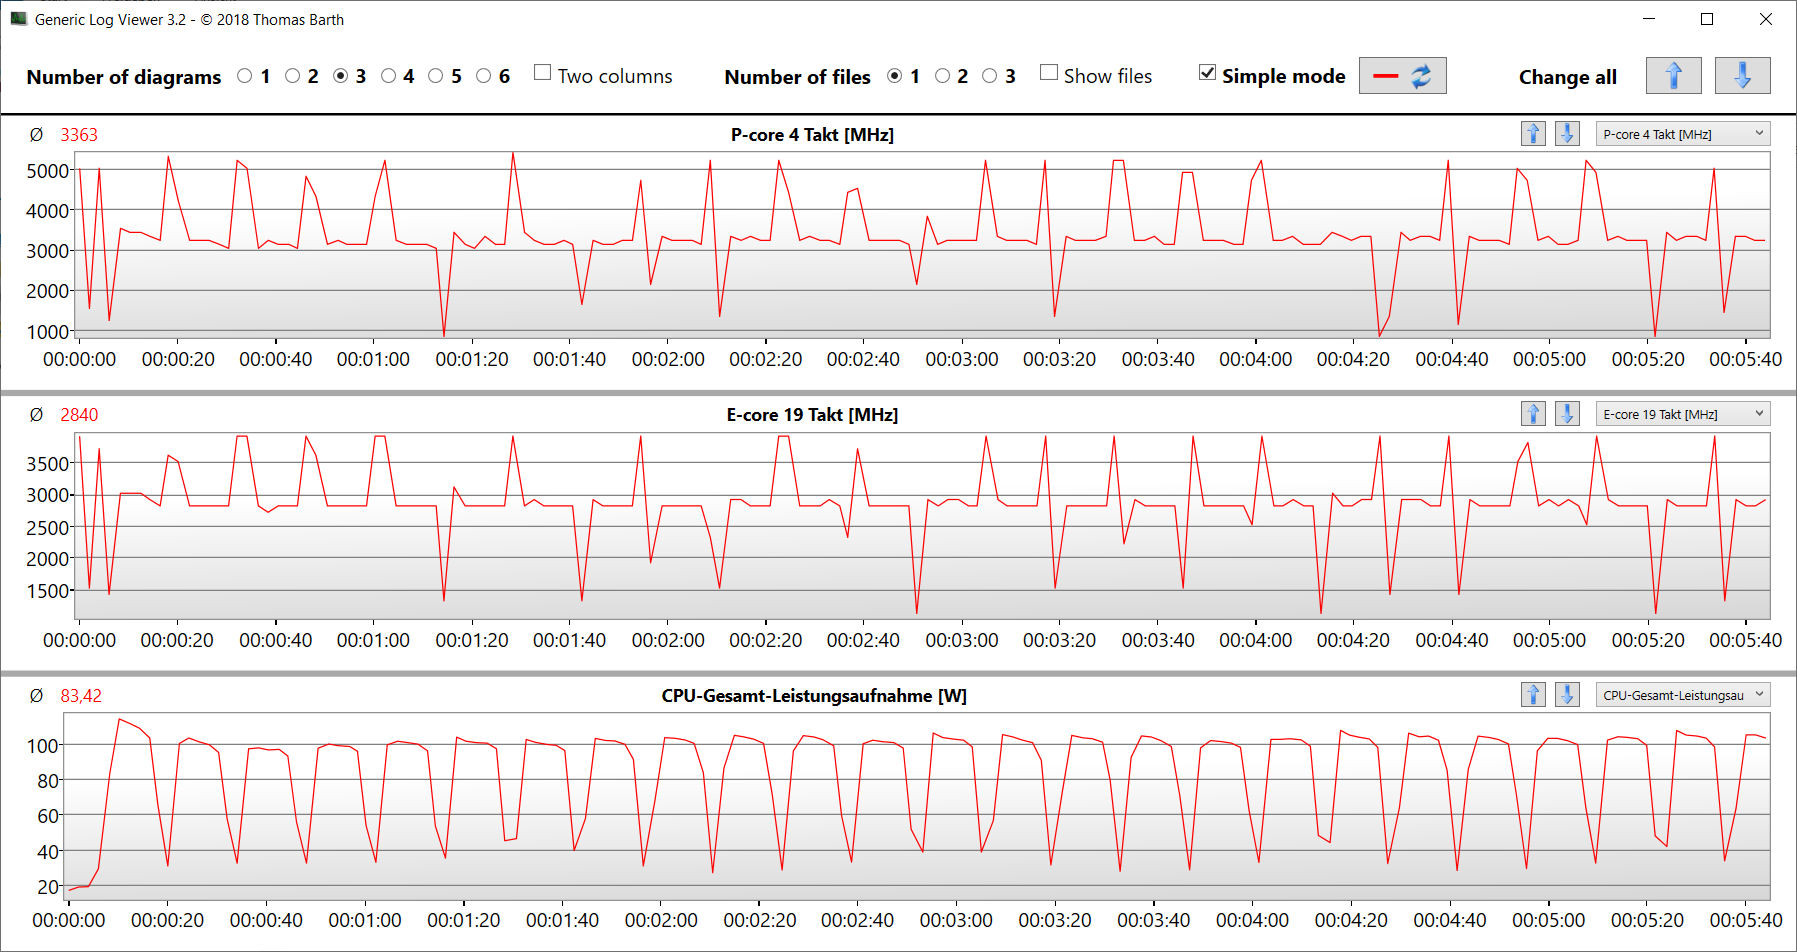
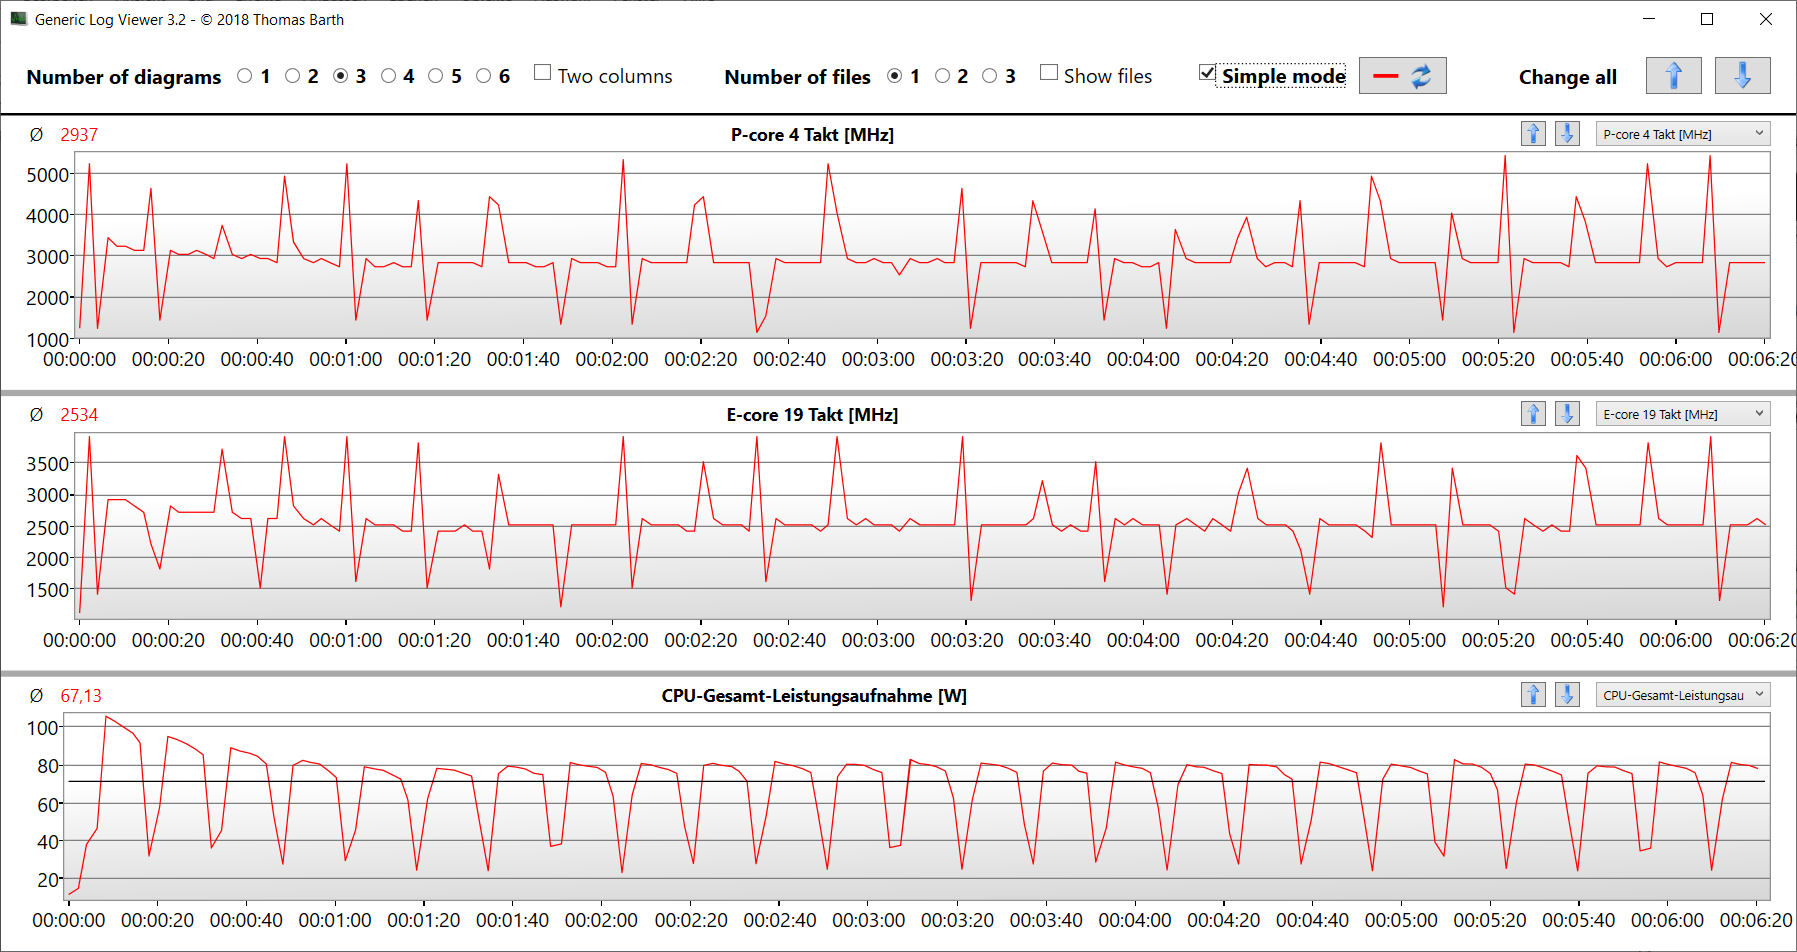
I risultati dei benchmark ottenuti dal Key 17 Pro sono all'incirca in linea con quanto abbiamo visto in media con questa CPU. Durante il nostro test Cinebench 15, il carico multi-thread sostenuto ha fatto sì che la velocità di clock del turbo della CPU scendesse leggermente nei primi due cicli prima di stabilizzarsi a un livello costante.
Cinebench R15 Multi sustained load
* ... Meglio usare valori piccoli
AIDA64: FP32 Ray-Trace | FPU Julia | CPU SHA3 | CPU Queen | FPU SinJulia | FPU Mandel | CPU AES | CPU ZLib | FP64 Ray-Trace | CPU PhotoWorxx
| Performance rating | |
| Asus ROG Strix Scar 17 G733PY-XS96 | |
| Schenker Key 17 Pro (Early 23) | |
| Medion Erazer Beast X40 | |
| Media della classe Gaming | |
| Media Intel Core i9-13900HX | |
| Aorus 17X AZF | |
| MSI Stealth 17 Studio A13VH-014 | |
| AIDA64 / FP32 Ray-Trace | |
| Asus ROG Strix Scar 17 G733PY-XS96 | |
| Media della classe Gaming (10227 - 85542, n=103, ultimi 2 anni) | |
| Medion Erazer Beast X40 | |
| Media Intel Core i9-13900HX (17589 - 27615, n=22) | |
| Schenker Key 17 Pro (Early 23) | |
| MSI Stealth 17 Studio A13VH-014 | |
| Aorus 17X AZF | |
| AIDA64 / FPU Julia | |
| Asus ROG Strix Scar 17 G733PY-XS96 | |
| Media della classe Gaming (51376 - 238426, n=103, ultimi 2 anni) | |
| Medion Erazer Beast X40 | |
| Media Intel Core i9-13900HX (88686 - 137015, n=22) | |
| Schenker Key 17 Pro (Early 23) | |
| MSI Stealth 17 Studio A13VH-014 | |
| Aorus 17X AZF | |
| AIDA64 / CPU SHA3 | |
| Asus ROG Strix Scar 17 G733PY-XS96 | |
| Medion Erazer Beast X40 | |
| Media della classe Gaming (2180 - 9817, n=103, ultimi 2 anni) | |
| Media Intel Core i9-13900HX (4362 - 7029, n=22) | |
| Schenker Key 17 Pro (Early 23) | |
| Aorus 17X AZF | |
| MSI Stealth 17 Studio A13VH-014 | |
| AIDA64 / CPU Queen | |
| Asus ROG Strix Scar 17 G733PY-XS96 | |
| Schenker Key 17 Pro (Early 23) | |
| Media Intel Core i9-13900HX (125644 - 141385, n=22) | |
| Medion Erazer Beast X40 | |
| Aorus 17X AZF | |
| Media della classe Gaming (49785 - 173351, n=90, ultimi 2 anni) | |
| MSI Stealth 17 Studio A13VH-014 | |
| AIDA64 / FPU SinJulia | |
| Asus ROG Strix Scar 17 G733PY-XS96 | |
| Medion Erazer Beast X40 | |
| Media Intel Core i9-13900HX (12334 - 17179, n=22) | |
| Schenker Key 17 Pro (Early 23) | |
| Media della classe Gaming (4424 - 33636, n=103, ultimi 2 anni) | |
| Aorus 17X AZF | |
| MSI Stealth 17 Studio A13VH-014 | |
| AIDA64 / FPU Mandel | |
| Asus ROG Strix Scar 17 G733PY-XS96 | |
| Media della classe Gaming (25115 - 128721, n=103, ultimi 2 anni) | |
| Medion Erazer Beast X40 | |
| Media Intel Core i9-13900HX (43850 - 69202, n=22) | |
| Schenker Key 17 Pro (Early 23) | |
| MSI Stealth 17 Studio A13VH-014 | |
| Aorus 17X AZF | |
| AIDA64 / CPU AES | |
| Schenker Key 17 Pro (Early 23) | |
| Asus ROG Strix Scar 17 G733PY-XS96 | |
| Aorus 17X AZF | |
| Media Intel Core i9-13900HX (89413 - 237881, n=22) | |
| Medion Erazer Beast X40 | |
| Media della classe Gaming (39258 - 247074, n=103, ultimi 2 anni) | |
| MSI Stealth 17 Studio A13VH-014 | |
| AIDA64 / CPU ZLib | |
| Asus ROG Strix Scar 17 G733PY-XS96 | |
| Medion Erazer Beast X40 | |
| Media Intel Core i9-13900HX (1284 - 1958, n=22) | |
| Schenker Key 17 Pro (Early 23) | |
| Media della classe Gaming (574 - 2531, n=103, ultimi 2 anni) | |
| Aorus 17X AZF | |
| MSI Stealth 17 Studio A13VH-014 | |
| AIDA64 / FP64 Ray-Trace | |
| Asus ROG Strix Scar 17 G733PY-XS96 | |
| Media della classe Gaming (5509 - 45446, n=103, ultimi 2 anni) | |
| Medion Erazer Beast X40 | |
| Media Intel Core i9-13900HX (9481 - 15279, n=22) | |
| Schenker Key 17 Pro (Early 23) | |
| MSI Stealth 17 Studio A13VH-014 | |
| Aorus 17X AZF | |
| AIDA64 / CPU PhotoWorxx | |
| Schenker Key 17 Pro (Early 23) | |
| MSI Stealth 17 Studio A13VH-014 | |
| Aorus 17X AZF | |
| Media Intel Core i9-13900HX (42994 - 51994, n=22) | |
| Media della classe Gaming (12271 - 89891, n=103, ultimi 2 anni) | |
| Medion Erazer Beast X40 | |
| Asus ROG Strix Scar 17 G733PY-XS96 | |
Prestazioni del sistema
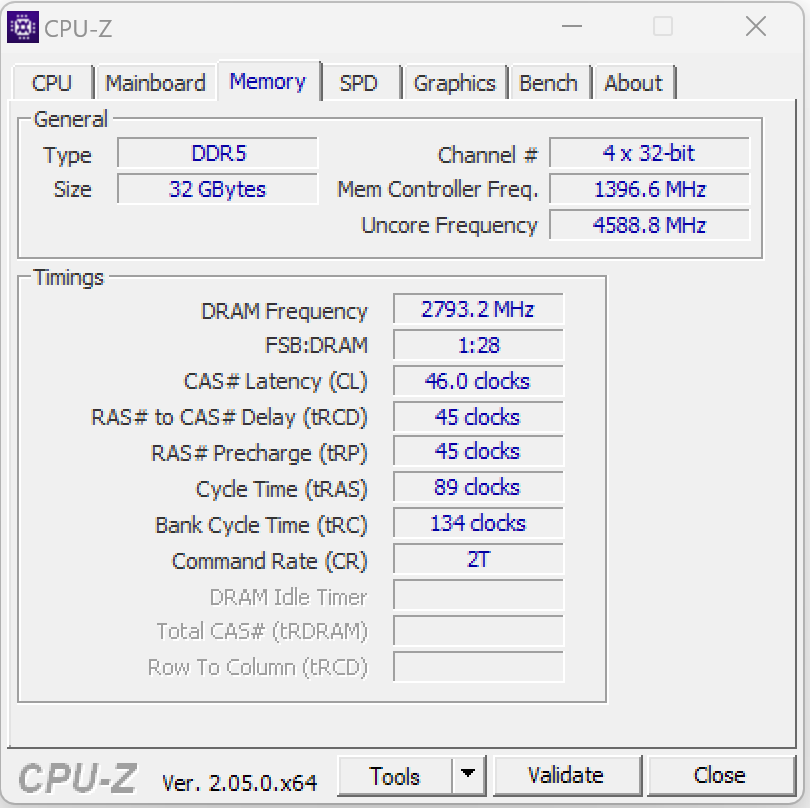
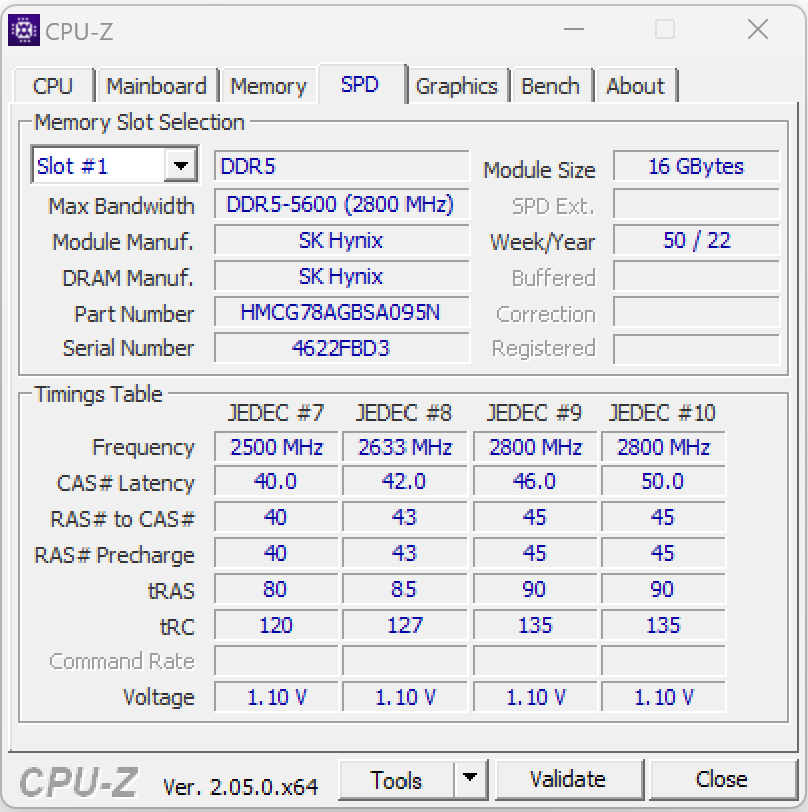
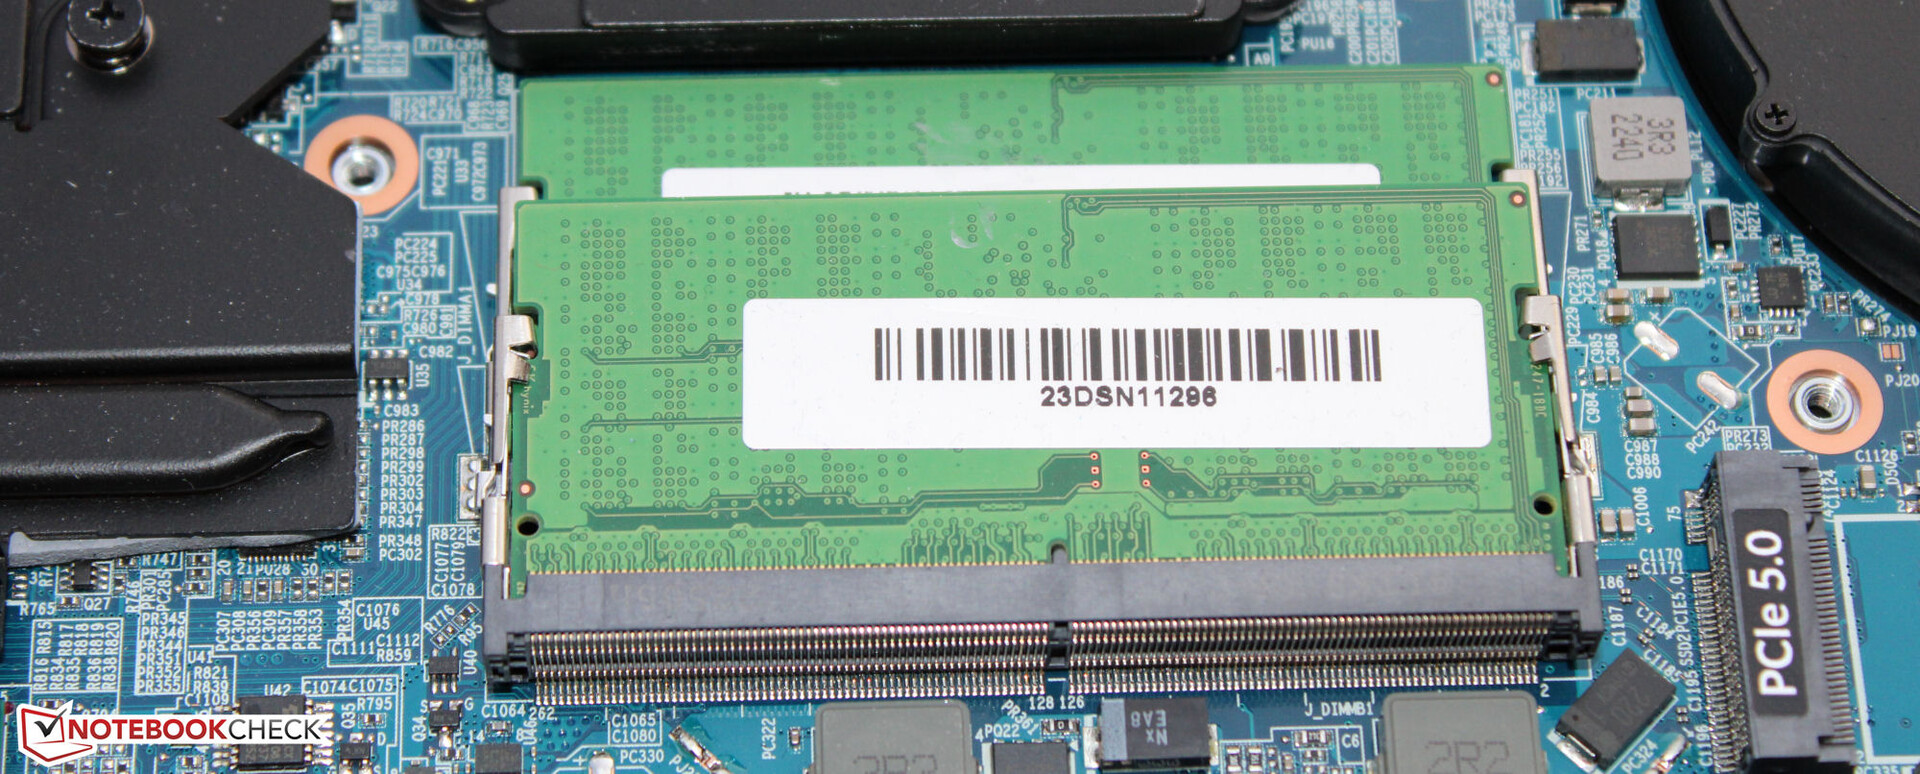
Il sistema funziona senza problemi e ha abbastanza potenza di calcolo per gestire comodamente rendering, editing video e giochi. Le velocità di trasferimento della RAM sono abbastanza standard per la memoria DDR5-5600.
CrossMark: Overall | Productivity | Creativity | Responsiveness
| PCMark 10 / Score | |
| Schenker Key 17 Pro (Early 23) | |
| Asus ROG Strix Scar 17 G733PY-XS96 | |
| Media Intel Core i9-13900HX, NVIDIA GeForce RTX 4090 Laptop GPU (7690 - 9331, n=8) | |
| Media della classe Gaming (5828 - 11574, n=92, ultimi 2 anni) | |
| Medion Erazer Beast X40 | |
| Aorus 17X AZF | |
| MSI Stealth 17 Studio A13VH-014 | |
| PCMark 10 / Essentials | |
| Schenker Key 17 Pro (Early 23) | |
| Media Intel Core i9-13900HX, NVIDIA GeForce RTX 4090 Laptop GPU (10972 - 11983, n=8) | |
| Medion Erazer Beast X40 | |
| Aorus 17X AZF | |
| Asus ROG Strix Scar 17 G733PY-XS96 | |
| Media della classe Gaming (8810 - 11935, n=96, ultimi 2 anni) | |
| MSI Stealth 17 Studio A13VH-014 | |
| PCMark 10 / Productivity | |
| Medion Erazer Beast X40 | |
| Schenker Key 17 Pro (Early 23) | |
| Media della classe Gaming (6845 - 21327, n=94, ultimi 2 anni) | |
| Media Intel Core i9-13900HX, NVIDIA GeForce RTX 4090 Laptop GPU (9038 - 11680, n=8) | |
| Aorus 17X AZF | |
| Asus ROG Strix Scar 17 G733PY-XS96 | |
| MSI Stealth 17 Studio A13VH-014 | |
| PCMark 10 / Digital Content Creation | |
| Asus ROG Strix Scar 17 G733PY-XS96 | |
| Schenker Key 17 Pro (Early 23) | |
| Media Intel Core i9-13900HX, NVIDIA GeForce RTX 4090 Laptop GPU (10605 - 16395, n=8) | |
| Media della classe Gaming (7602 - 19657, n=94, ultimi 2 anni) | |
| MSI Stealth 17 Studio A13VH-014 | |
| Medion Erazer Beast X40 | |
| Aorus 17X AZF | |
| CrossMark / Overall | |
| Schenker Key 17 Pro (Early 23) | |
| Aorus 17X AZF | |
| Medion Erazer Beast X40 | |
| Media Intel Core i9-13900HX, NVIDIA GeForce RTX 4090 Laptop GPU (1825 - 2295, n=8) | |
| Asus ROG Strix Scar 17 G733PY-XS96 | |
| Media della classe Gaming (1366 - 2409, n=93, ultimi 2 anni) | |
| MSI Stealth 17 Studio A13VH-014 | |
| CrossMark / Productivity | |
| Schenker Key 17 Pro (Early 23) | |
| Aorus 17X AZF | |
| Medion Erazer Beast X40 | |
| Media Intel Core i9-13900HX, NVIDIA GeForce RTX 4090 Laptop GPU (1666 - 2166, n=8) | |
| Media della classe Gaming (1386 - 2254, n=93, ultimi 2 anni) | |
| Asus ROG Strix Scar 17 G733PY-XS96 | |
| MSI Stealth 17 Studio A13VH-014 | |
| CrossMark / Creativity | |
| Schenker Key 17 Pro (Early 23) | |
| Medion Erazer Beast X40 | |
| Media Intel Core i9-13900HX, NVIDIA GeForce RTX 4090 Laptop GPU (2162 - 2514, n=8) | |
| Asus ROG Strix Scar 17 G733PY-XS96 | |
| Aorus 17X AZF | |
| Media della classe Gaming (1343 - 2729, n=93, ultimi 2 anni) | |
| MSI Stealth 17 Studio A13VH-014 | |
| CrossMark / Responsiveness | |
| Schenker Key 17 Pro (Early 23) | |
| Aorus 17X AZF | |
| Medion Erazer Beast X40 | |
| Media Intel Core i9-13900HX, NVIDIA GeForce RTX 4090 Laptop GPU (1441 - 2275, n=8) | |
| Media della classe Gaming (1226 - 2334, n=93, ultimi 2 anni) | |
| Asus ROG Strix Scar 17 G733PY-XS96 | |
| MSI Stealth 17 Studio A13VH-014 | |
| PCMark 10 Score | 8913 punti | |
Aiuto | ||
| AIDA64 / Memory Copy | |
| Schenker Key 17 Pro (Early 23) | |
| Aorus 17X AZF | |
| Media Intel Core i9-13900HX (67716 - 79193, n=22) | |
| MSI Stealth 17 Studio A13VH-014 | |
| Media della classe Gaming (21750 - 129946, n=103, ultimi 2 anni) | |
| Medion Erazer Beast X40 | |
| Asus ROG Strix Scar 17 G733PY-XS96 | |
| AIDA64 / Memory Read | |
| Aorus 17X AZF | |
| Schenker Key 17 Pro (Early 23) | |
| Media Intel Core i9-13900HX (73998 - 88462, n=22) | |
| MSI Stealth 17 Studio A13VH-014 | |
| Medion Erazer Beast X40 | |
| Media della classe Gaming (22956 - 118858, n=103, ultimi 2 anni) | |
| Asus ROG Strix Scar 17 G733PY-XS96 | |
| AIDA64 / Memory Write | |
| Schenker Key 17 Pro (Early 23) | |
| Aorus 17X AZF | |
| Media della classe Gaming (22297 - 135096, n=103, ultimi 2 anni) | |
| MSI Stealth 17 Studio A13VH-014 | |
| Media Intel Core i9-13900HX (65472 - 77045, n=22) | |
| Medion Erazer Beast X40 | |
| Asus ROG Strix Scar 17 G733PY-XS96 | |
| AIDA64 / Memory Latency | |
| Media della classe Gaming (75.3 - 259, n=103, ultimi 2 anni) | |
| MSI Stealth 17 Studio A13VH-014 | |
| Schenker Key 17 Pro (Early 23) | |
| Medion Erazer Beast X40 | |
| Media Intel Core i9-13900HX (75.3 - 91.1, n=22) | |
| Asus ROG Strix Scar 17 G733PY-XS96 | |
| Aorus 17X AZF | |
* ... Meglio usare valori piccoli
Latenza DPC
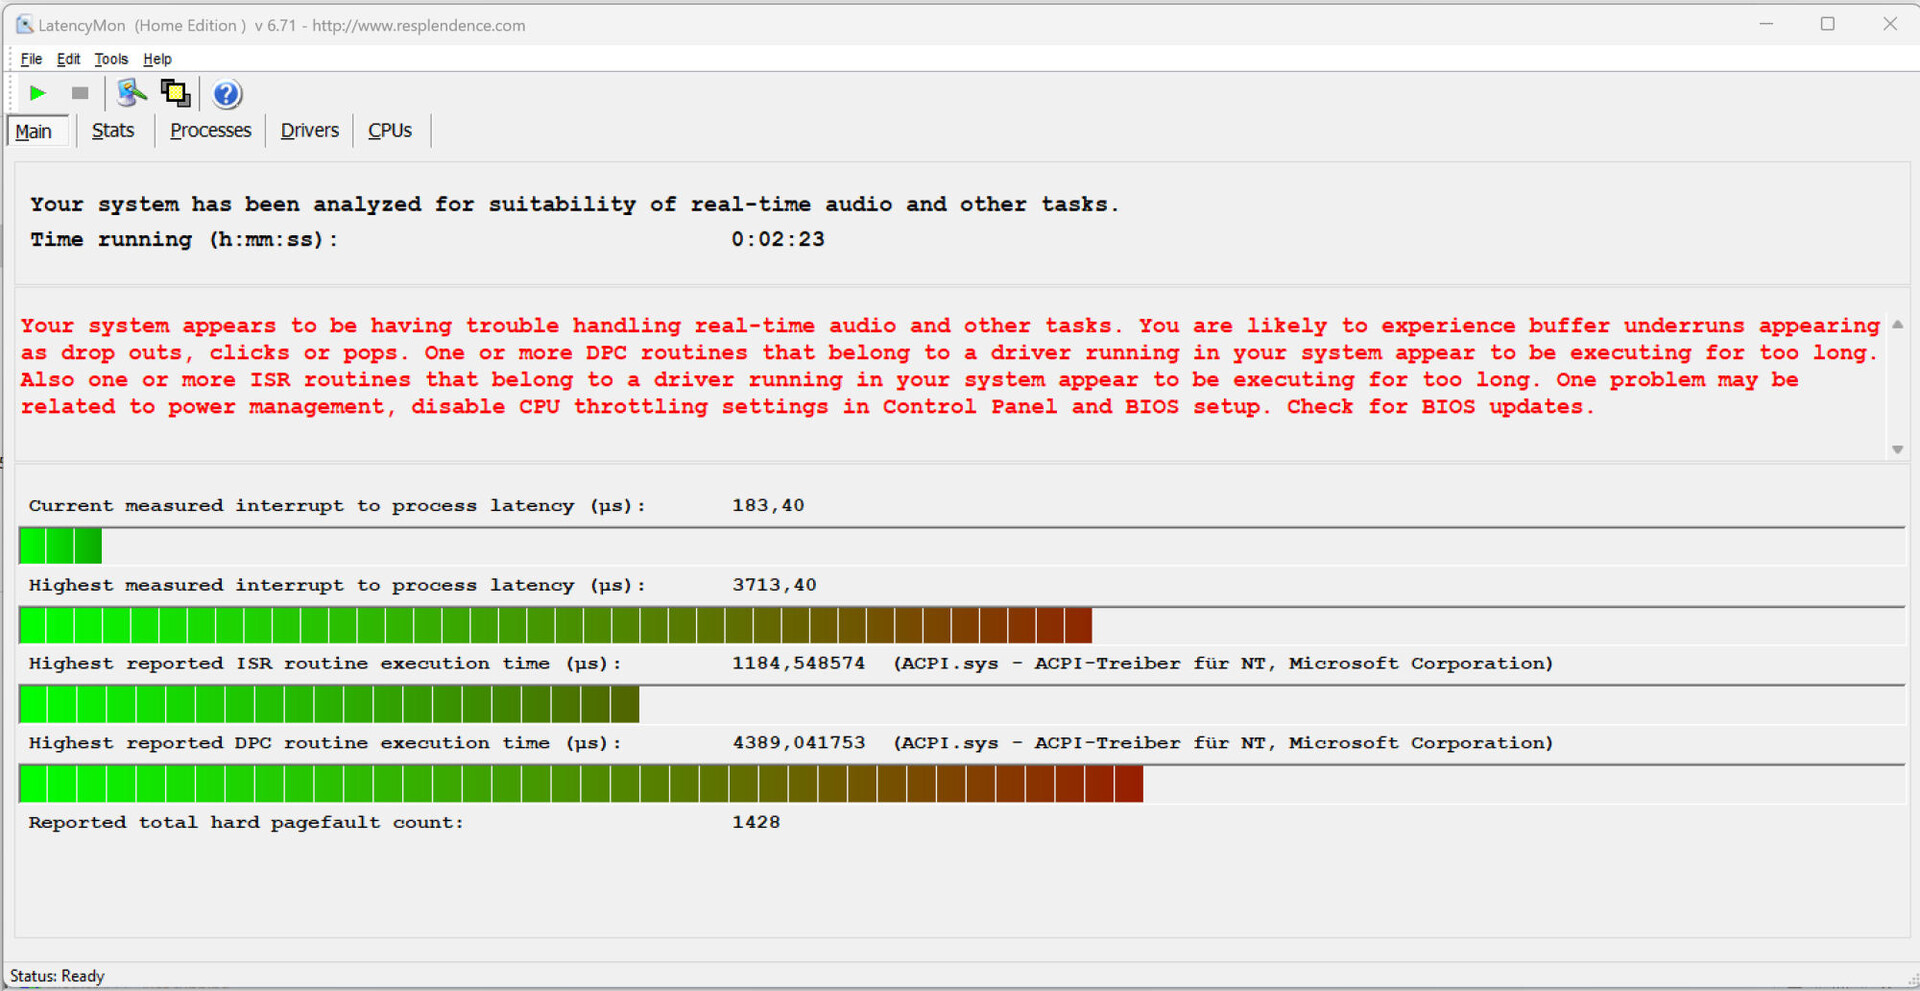
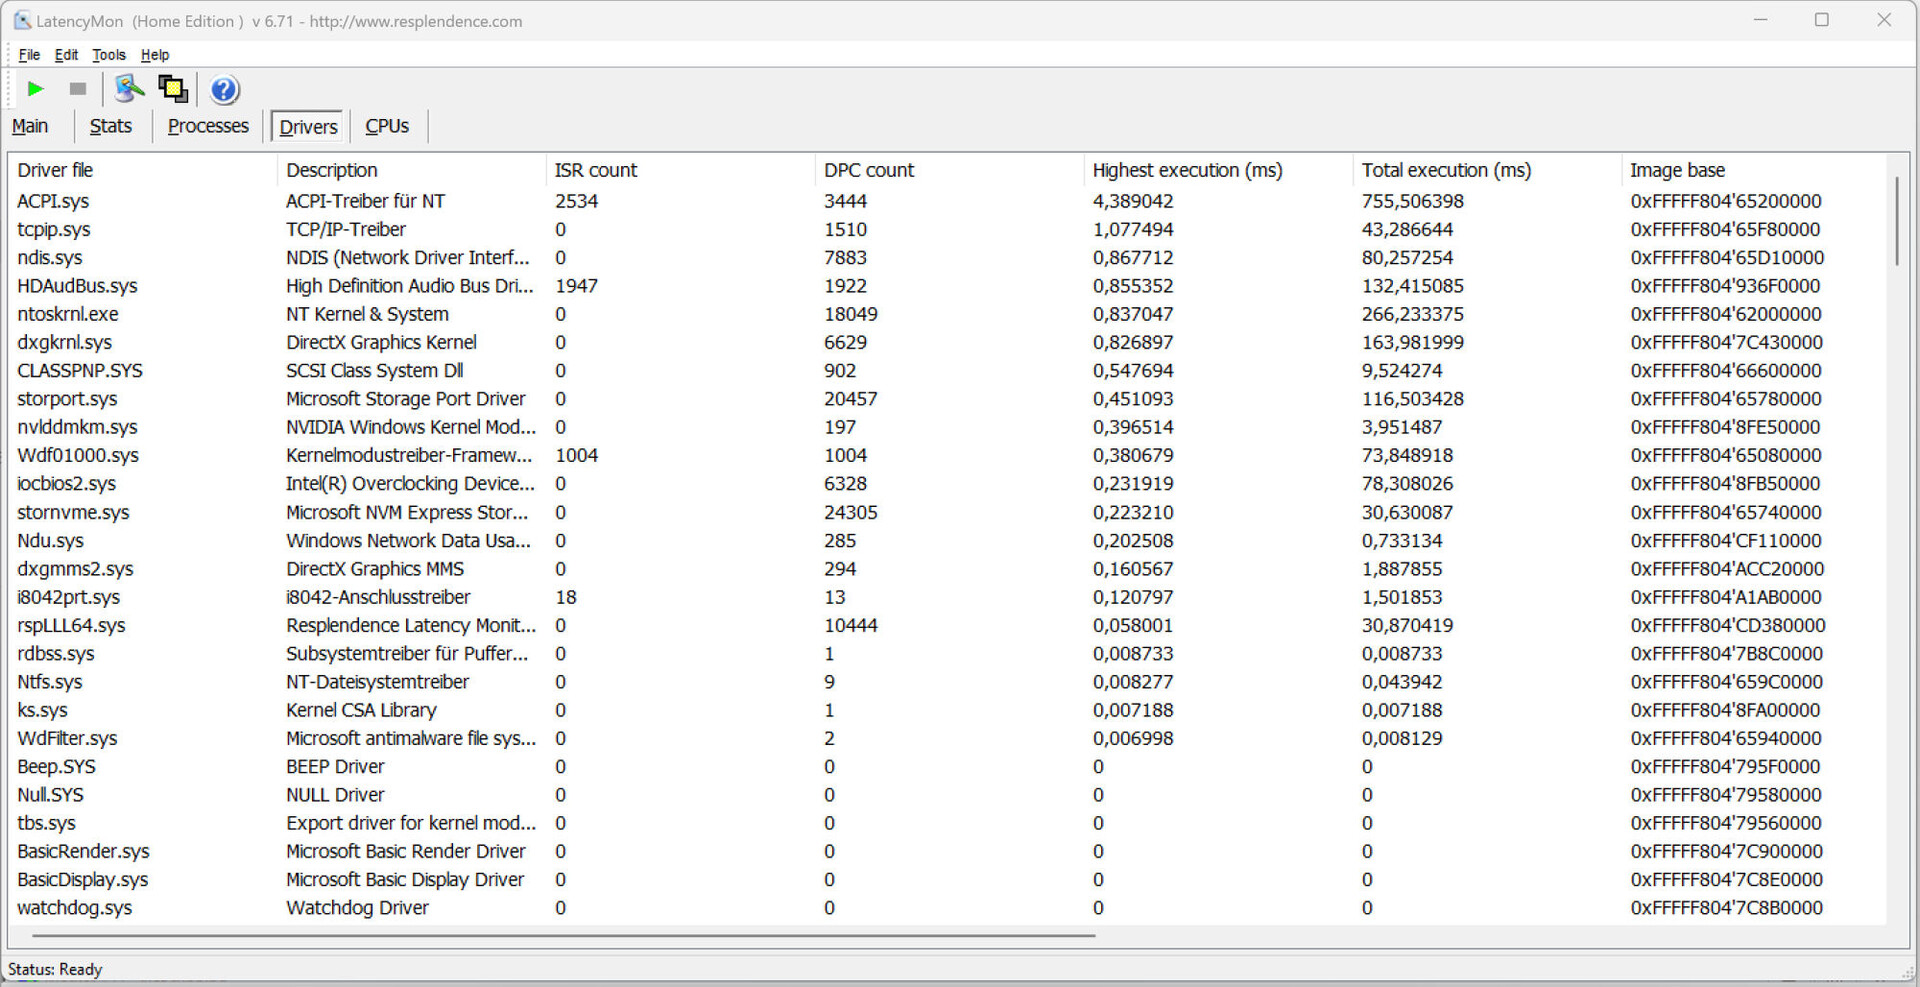
Il nostro test standardizzato di monitoraggio della latenza (navigazione in Internet, riproduzione di video 4K, Prime95 ad alto carico) ha rivelato alcuni problemi di latenza. Il sistema non sembra essere adatto a gestire attività video e audio in tempo reale. Speriamo che questi problemi vengano risolti con i futuri aggiornamenti del software.
| DPC Latencies / LatencyMon - interrupt to process latency (max), Web, Youtube, Prime95 | |
| Aorus 17X AZF | |
| Schenker Key 17 Pro (Early 23) | |
| MSI Stealth 17 Studio A13VH-014 | |
| Medion Erazer Beast X40 | |
| Asus ROG Strix Scar 17 G733PY-XS96 | |
* ... Meglio usare valori piccoli
Memoria di massa
Lo Schenker Key 17 Pro è in grado di ospitare fino a tre unità SSD M.2-2280 (2x PCIe 4.0, 1x PCIe 5.0). L'unità PCIe 4.0 Samsung preinstallata offre un'ampia capacità di archiviazione (2 TB) e garantisce una velocità di trasferimento fantastica. Non abbiamo notato cali di prestazioni causati dal thermal throttling.

* ... Meglio usare valori piccoli
Sustained load Read: DiskSpd Read Loop, Queue Depth 8
Scheda grafica
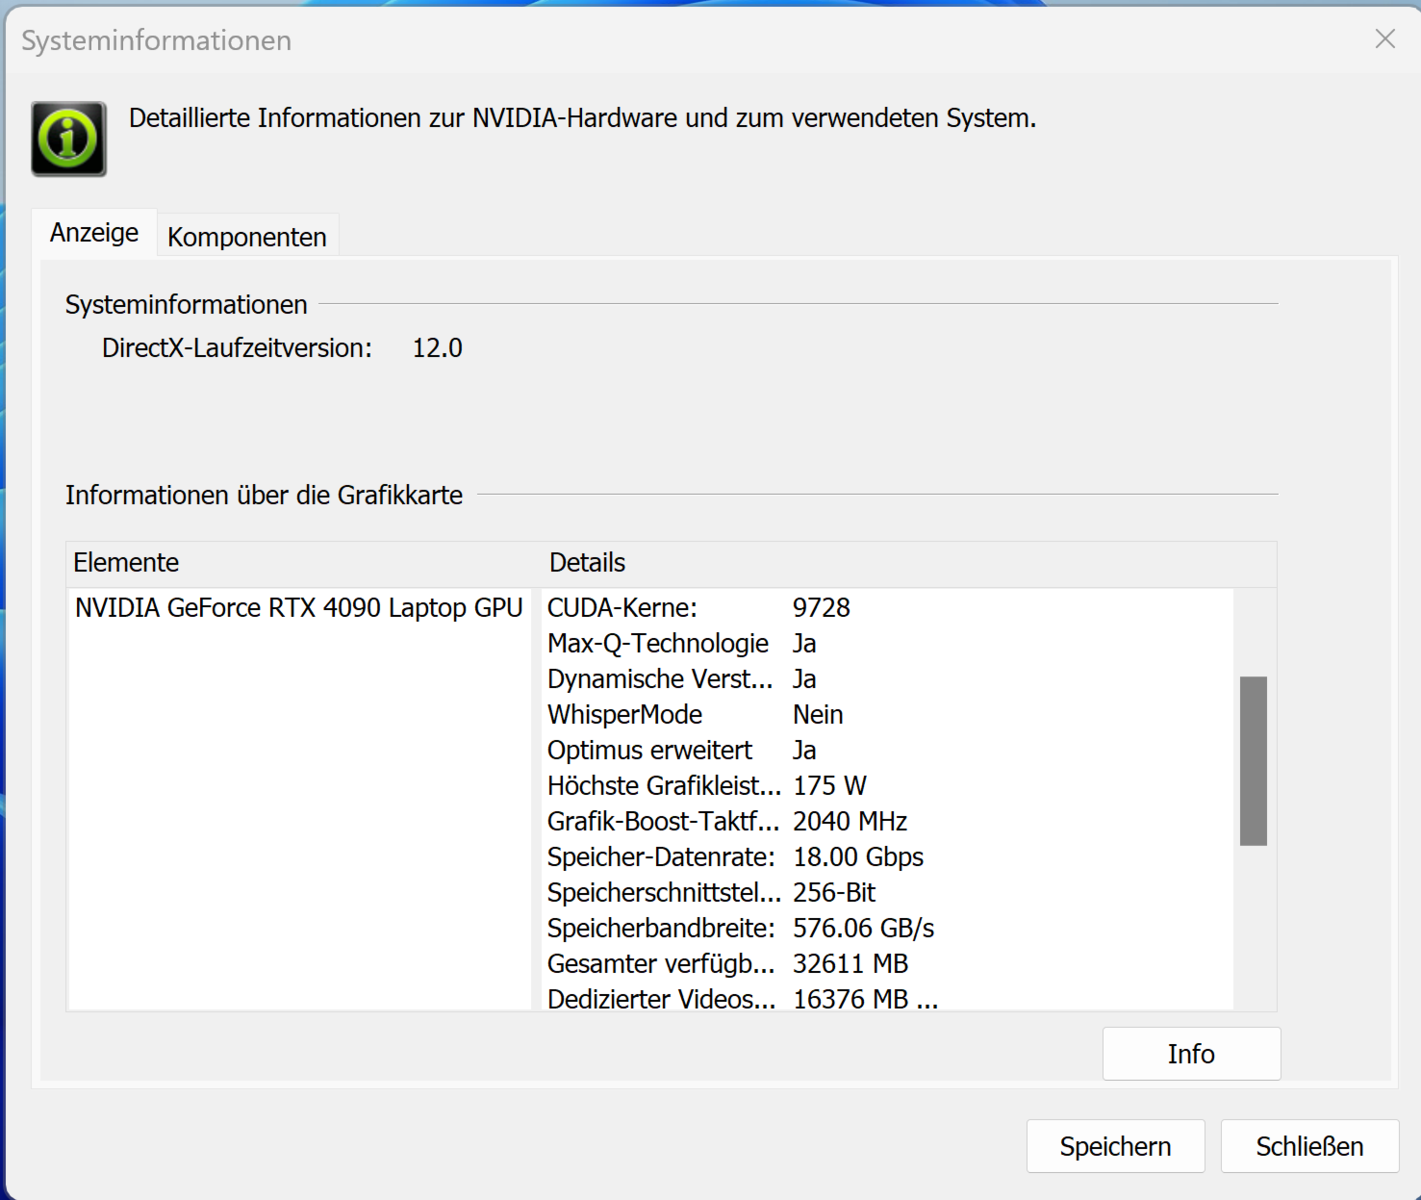
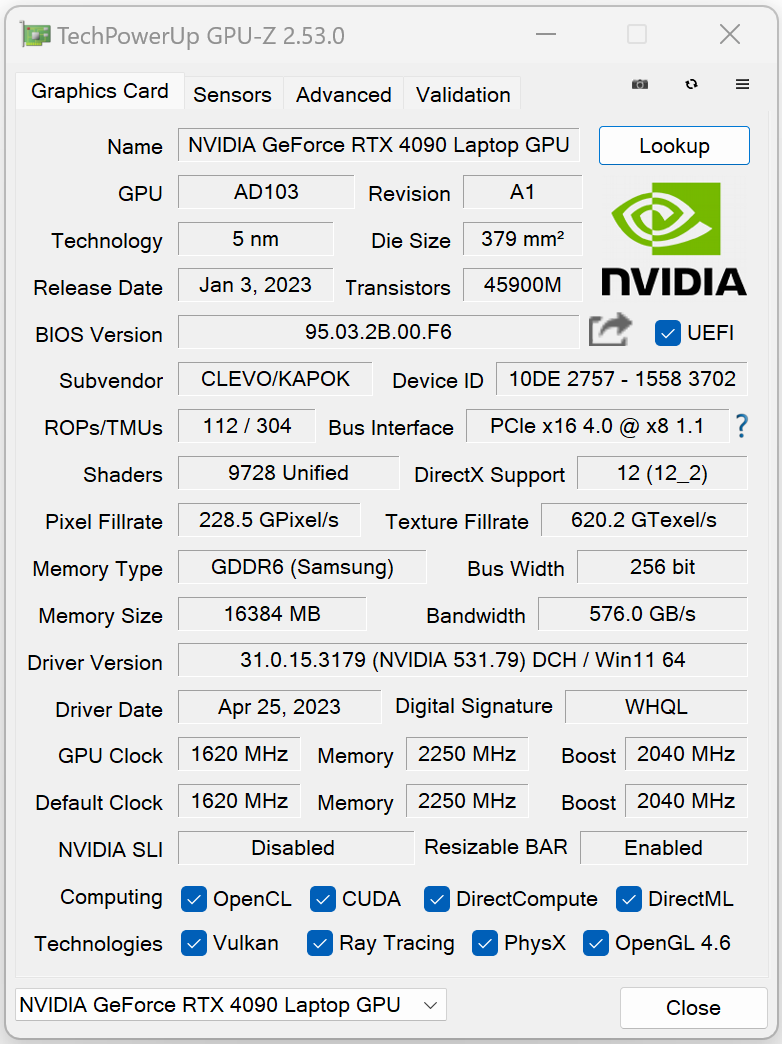
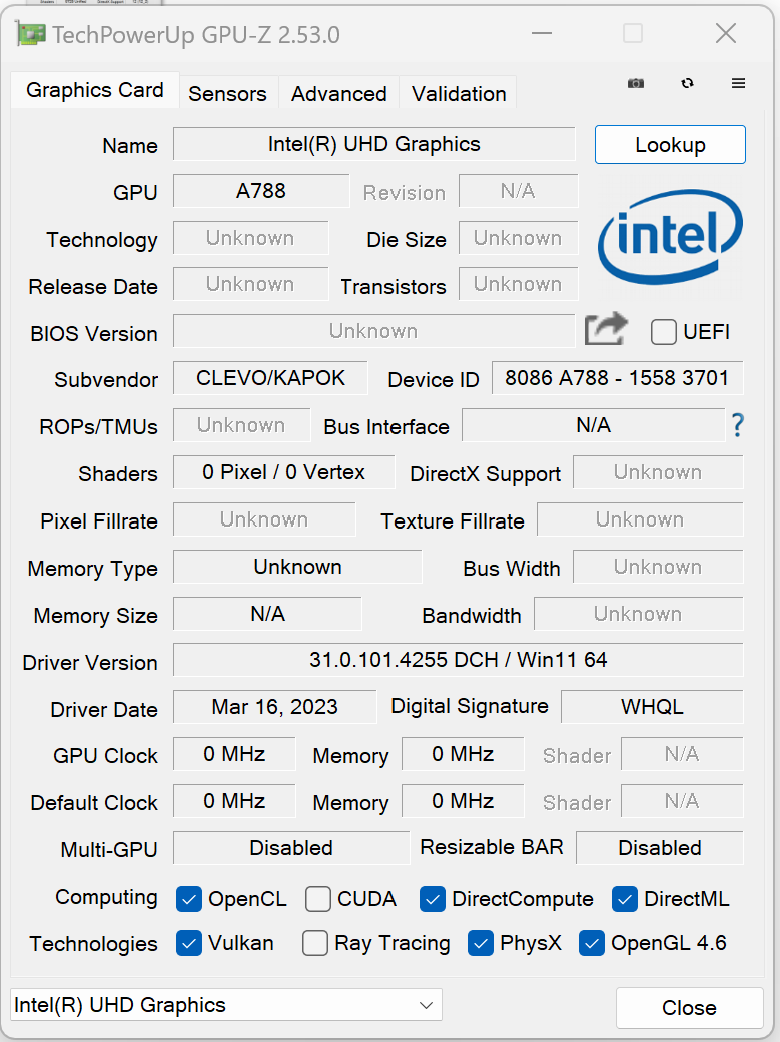
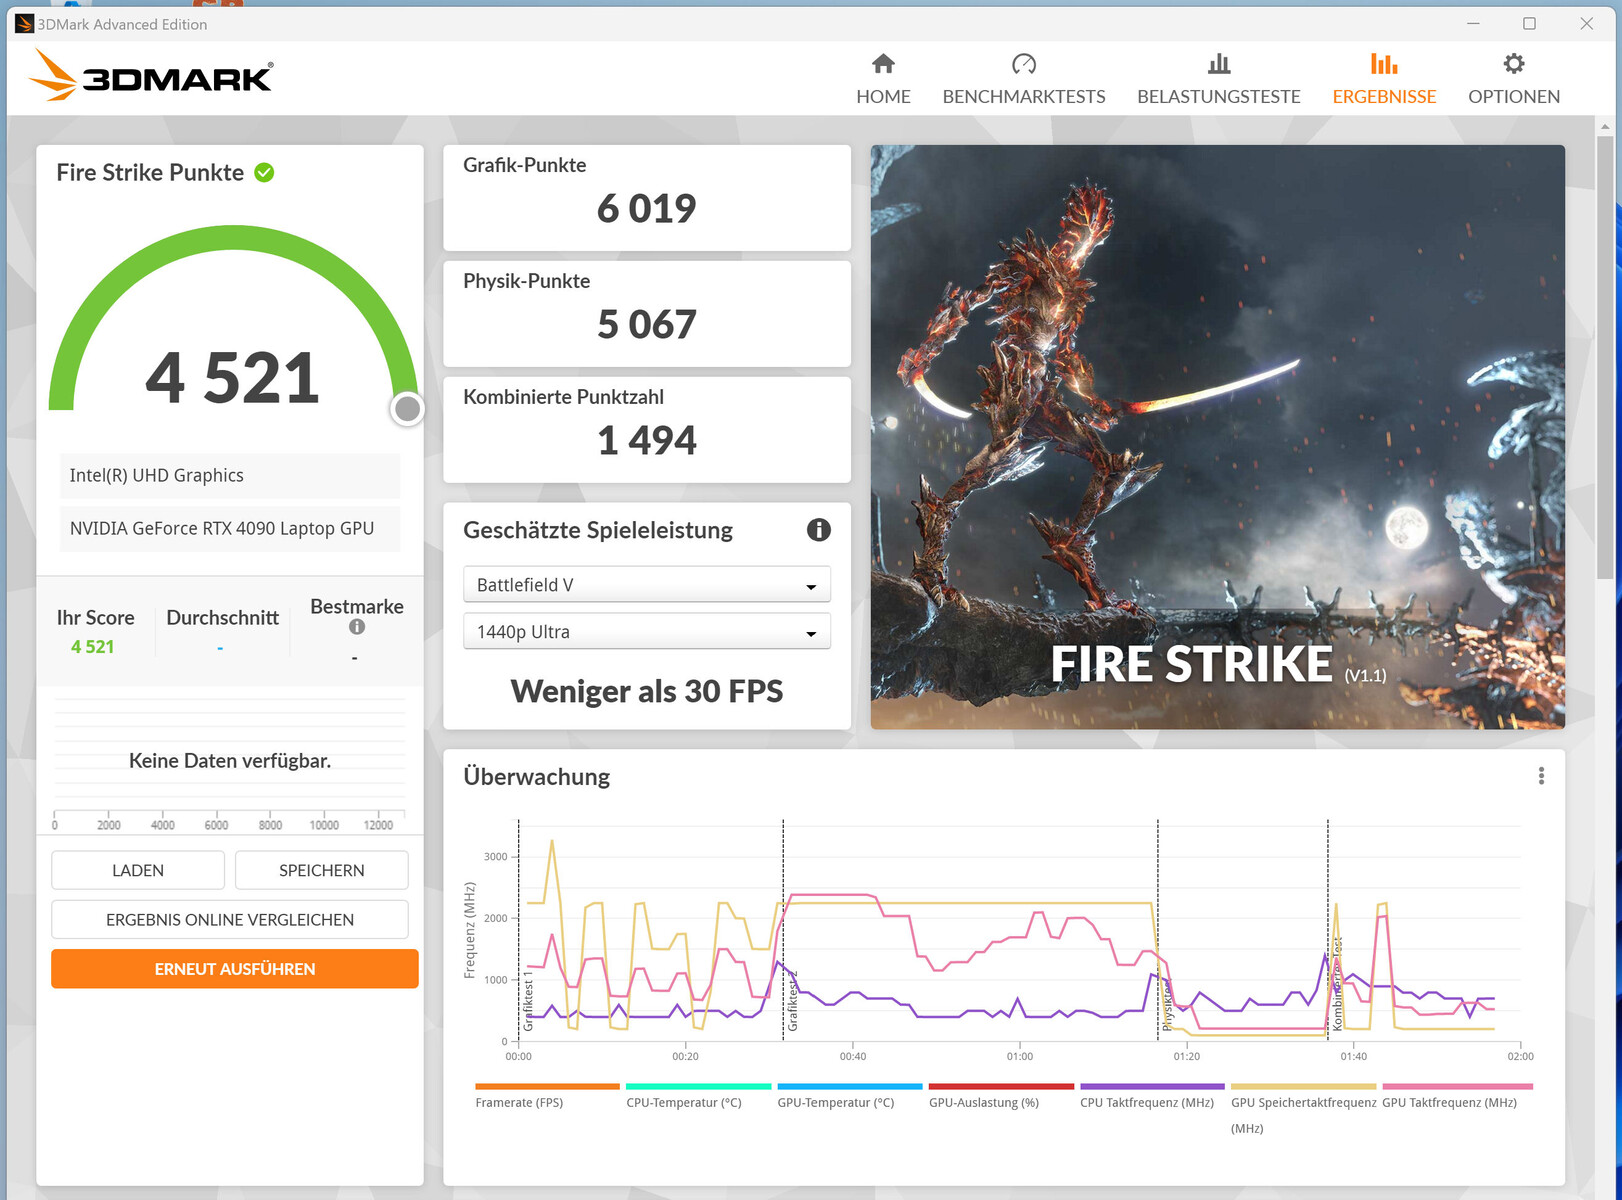
GeForce RTX 4090 Laptop è l'attuale GPU mobile top di gamma di Nvidia. È dotata di 9.728 unità shader, un bus di memoria a 256 bit e 16 GB di RAM GDDR6 ad alta velocità. La scheda grafica ha un TGP massimo di 175 watt (150 watt + 25 watt di Dynamic Boost), il massimo possibile. Il TGP non è stato utilizzato appieno durante il nostro test su Witcher 3.
Anche se la GPU ha fornito risultati inferiori alla media nei benchmark sintetici, le sue prestazioni nei giochi reali sono state superiori alla media. Anche il passaggio alla modalità dGPU (tramite il Control Center) ha fornito un incremento delle prestazioni. Con un hardware così potente, il portatile è sicuramente in grado di giocare in 4K con impostazioni elevate o massime.
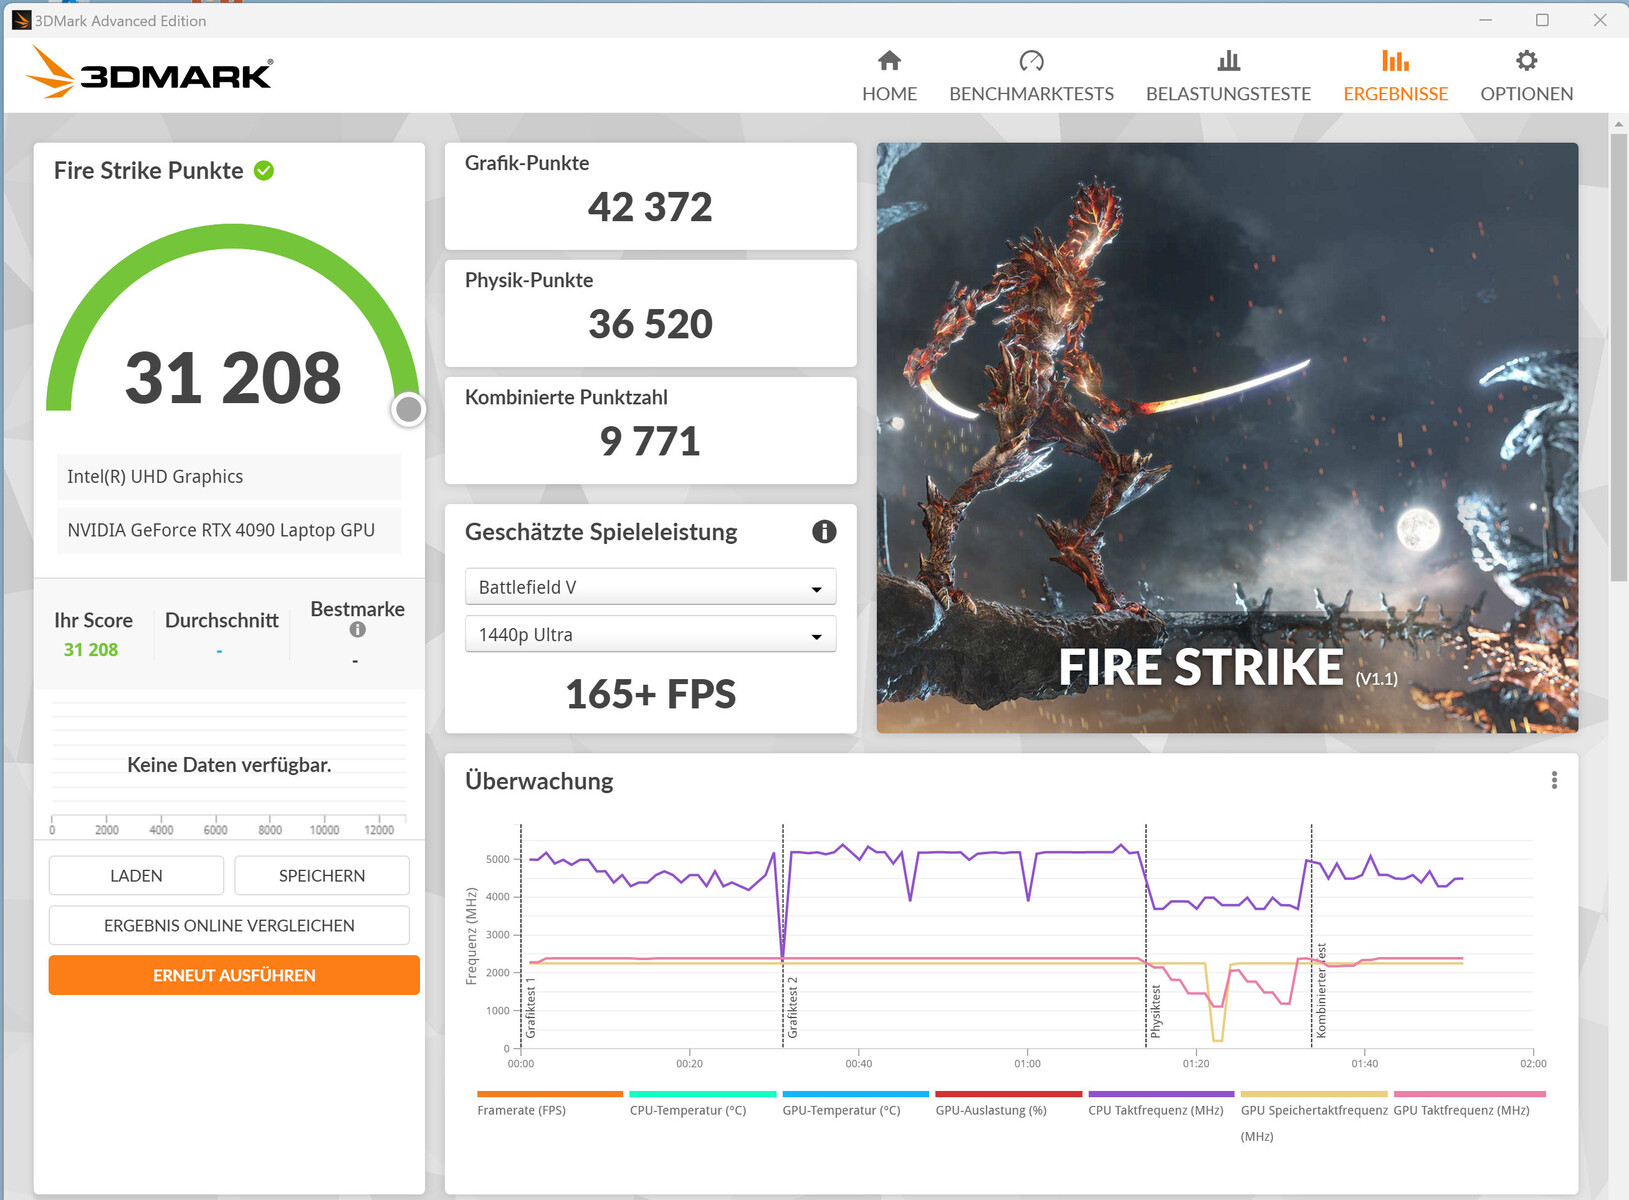


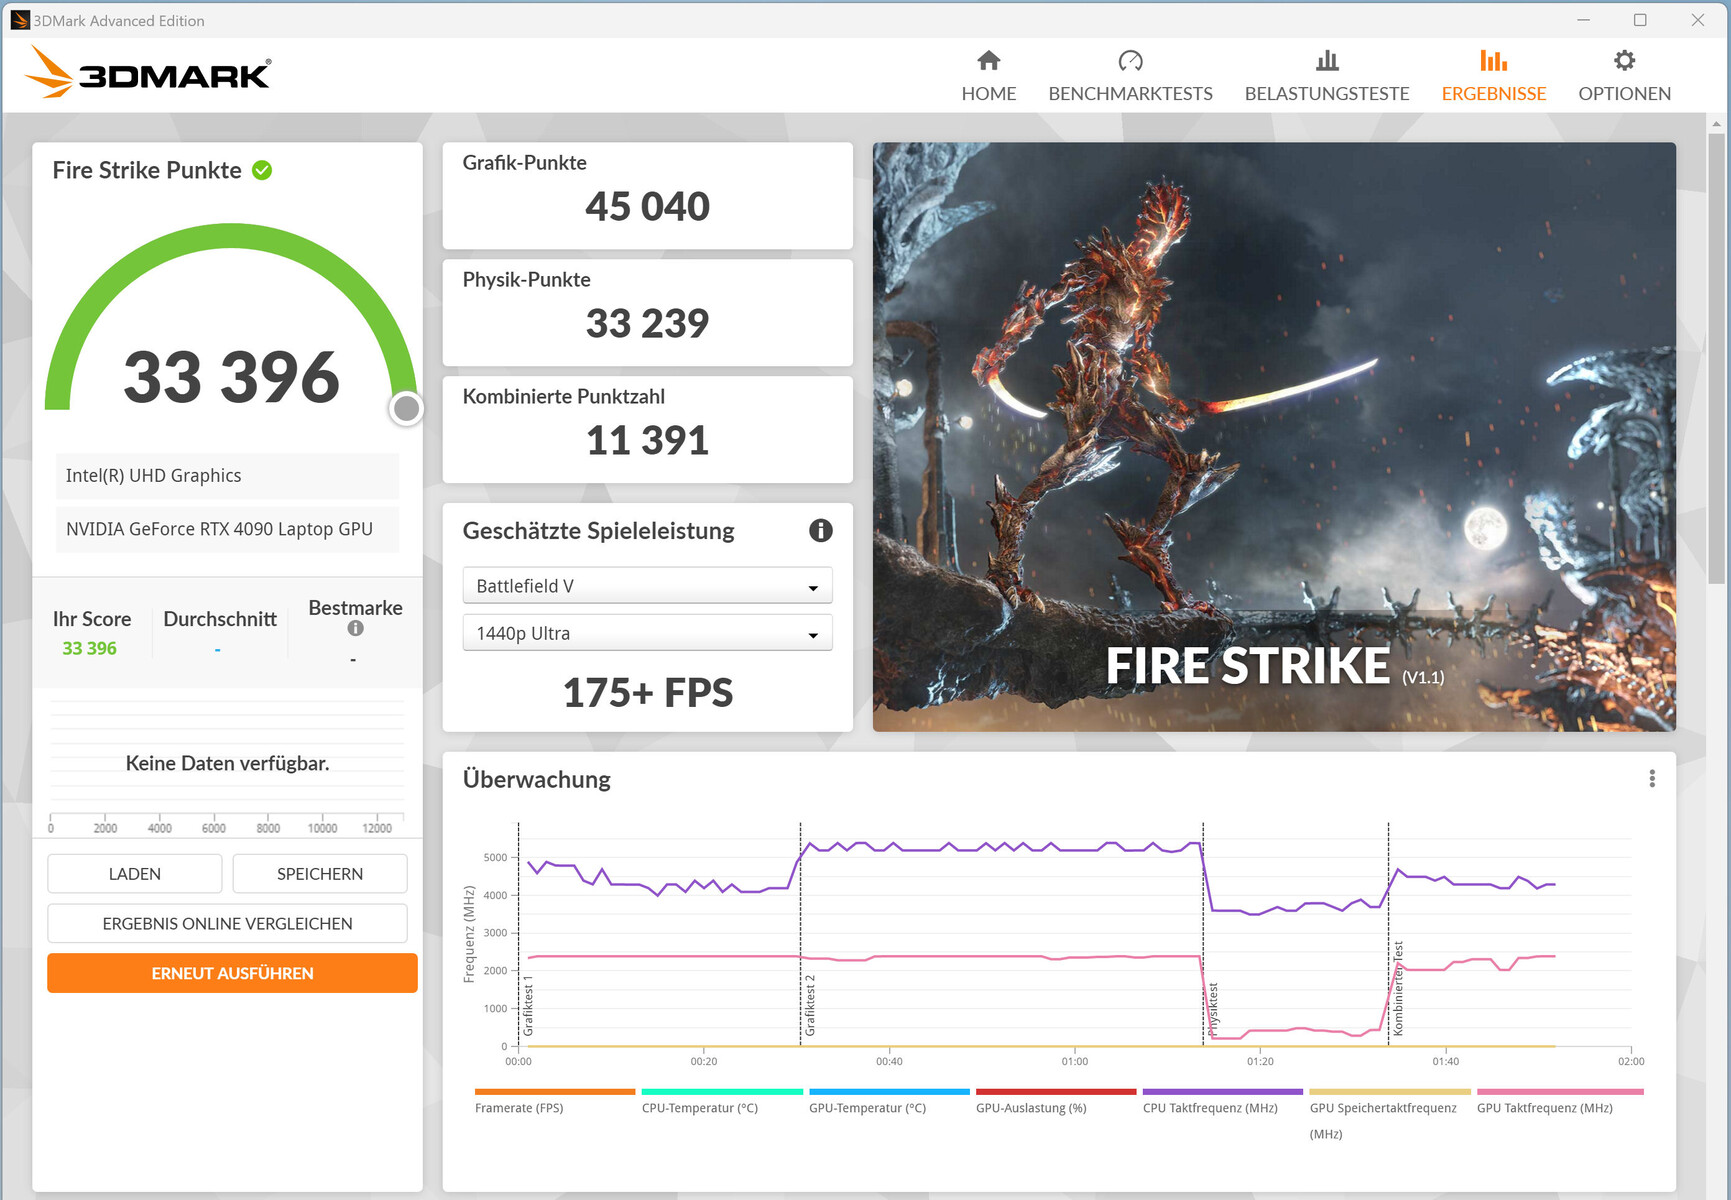
| 3DMark 11 Performance | 44742 punti | |
| 3DMark Cloud Gate Standard Score | 54257 punti | |
| 3DMark Fire Strike Score | 31208 punti | |
| 3DMark Time Spy Score | 19893 punti | |
Aiuto | ||
* ... Meglio usare valori piccoli
| The Witcher 3 - 1920x1080 Ultra Graphics & Postprocessing (HBAO+) | |
| Schenker Key 17 Pro (Early 23) | |
| Asus ROG Strix Scar 17 G733PY-XS96 | |
| Aorus 17X AZF | |
| Media NVIDIA GeForce RTX 4090 Laptop GPU (139.2 - 216, n=35) | |
| Medion Erazer Beast X40 | |
| Media della classe Gaming (104.7 - 240, n=6, ultimi 2 anni) | |
| MSI Stealth 17 Studio A13VH-014 | |
| Strange Brigade - 1920x1080 ultra AA:ultra AF:16 | |
| Aorus 17X AZF | |
| Schenker Key 17 Pro (Early 23) | |
| Medion Erazer Beast X40 | |
| Media NVIDIA GeForce RTX 4090 Laptop GPU (233 - 421, n=39) | |
| Media della classe Gaming (76.3 - 456, n=85, ultimi 2 anni) | |
| MSI Stealth 17 Studio A13VH-014 | |
| Sons of the Forest | |
| 1920x1080 Ultra Preset AA:T | |
| Schenker Key 17 Pro (Early 23) | |
| Media NVIDIA GeForce RTX 4090 Laptop GPU (85.7 - 93.9, n=2) | |
| Medion Erazer Beast X40 | |
| 3840x2160 Ultra Preset AA:T | |
| Schenker Key 17 Pro (Early 23) | |
| Media NVIDIA GeForce RTX 4090 Laptop GPU (n=1) | |
| Star Wars Jedi Survivor | |
| 1920x1080 Epic Preset | |
| Schenker Key 17 Pro (Early 23) | |
| Media NVIDIA GeForce RTX 4090 Laptop GPU (103 - 148, n=6) | |
| Asus ROG Strix Scar 17 G733PY-XS96 | |
| 3840x2160 Epic Preset | |
| Media NVIDIA GeForce RTX 4090 Laptop GPU (39 - 59, n=6) | |
| Asus ROG Strix Scar 17 G733PY-XS96 | |
| Schenker Key 17 Pro (Early 23) | |
| Resident Evil 4 Remake | |
| 1920x1080 Max Preset | |
| Schenker Key 17 Pro (Early 23) | |
| Media NVIDIA GeForce RTX 4090 Laptop GPU (136.3 - 143.2, n=2) | |
| Aorus 17X AZF | |
| 3840x2160 Max Preset | |
| Schenker Key 17 Pro (Early 23) | |
| Media NVIDIA GeForce RTX 4090 Laptop GPU (63.4 - 64.9, n=2) | |
| Aorus 17X AZF | |
| Dead Island 2 | |
| 1920x1080 Ultra Preset AA:High T | |
| Media NVIDIA GeForce RTX 4090 Laptop GPU (181.7 - 206, n=2) | |
| Schenker Key 17 Pro (Early 23) | |
| 3840x2160 Ultra Preset AA:High T | |
| Media NVIDIA GeForce RTX 4090 Laptop GPU (94.8 - 101.2, n=2) | |
| Schenker Key 17 Pro (Early 23) | |
| The Callisto Protocol | |
| 1920x1080 Ultra Preset (without FSR Upscaling) | |
| Schenker Key 17 Pro (Early 23) | |
| Aorus 17X AZF | |
| Media NVIDIA GeForce RTX 4090 Laptop GPU (102.6 - 150.7, n=6) | |
| 3840x2160 Ultra Preset (without FSR Upscaling) | |
| Schenker Key 17 Pro (Early 23) | |
| Media NVIDIA GeForce RTX 4090 Laptop GPU (48.1 - 81.4, n=6) | |
| Aorus 17X AZF | |
Witcher 3 FPS chart
| basso | medio | alto | ultra | QHD | 4K | |
|---|---|---|---|---|---|---|
| GTA V (2015) | 187.7 | 186.4 | 184.8 | 142.3 | 141.5 | 167.9 |
| The Witcher 3 (2015) | 474.4 | 382.6 | 299.2 | 206 | 96.3 | |
| Dota 2 Reborn (2015) | 231 | 207 | 195.3 | 182.5 | 141.9 | |
| Final Fantasy XV Benchmark (2018) | 230 | 217 | 183.1 | 156.4 | 91.9 | |
| X-Plane 11.11 (2018) | 180.8 | 171.7 | 136.6 | 109.7 | ||
| Strange Brigade (2018) | 558 | 437 | 410 | 378 | 291 | 153.4 |
| The Callisto Protocol (2022) | 194.5 | 182.6 | 175.5 | 150.7 | 126.7 | 81.4 |
| Sons of the Forest (2023) | 103.2 | 97.5 | 93.9 | 93.9 | 89.6 | 72.5 |
| Resident Evil 4 Remake (2023) | 203 | 194.6 | 173.1 | 143.2 | 113.2 | 64.9 |
| Dead Island 2 (2023) | 226 | 212 | 190.3 | 181.7 | 178.5 | 94.8 |
| Star Wars Jedi Survivor (2023) | 131.2 | 127.6 | 122.1 | 117.4 | 84.4 | 41.8 |
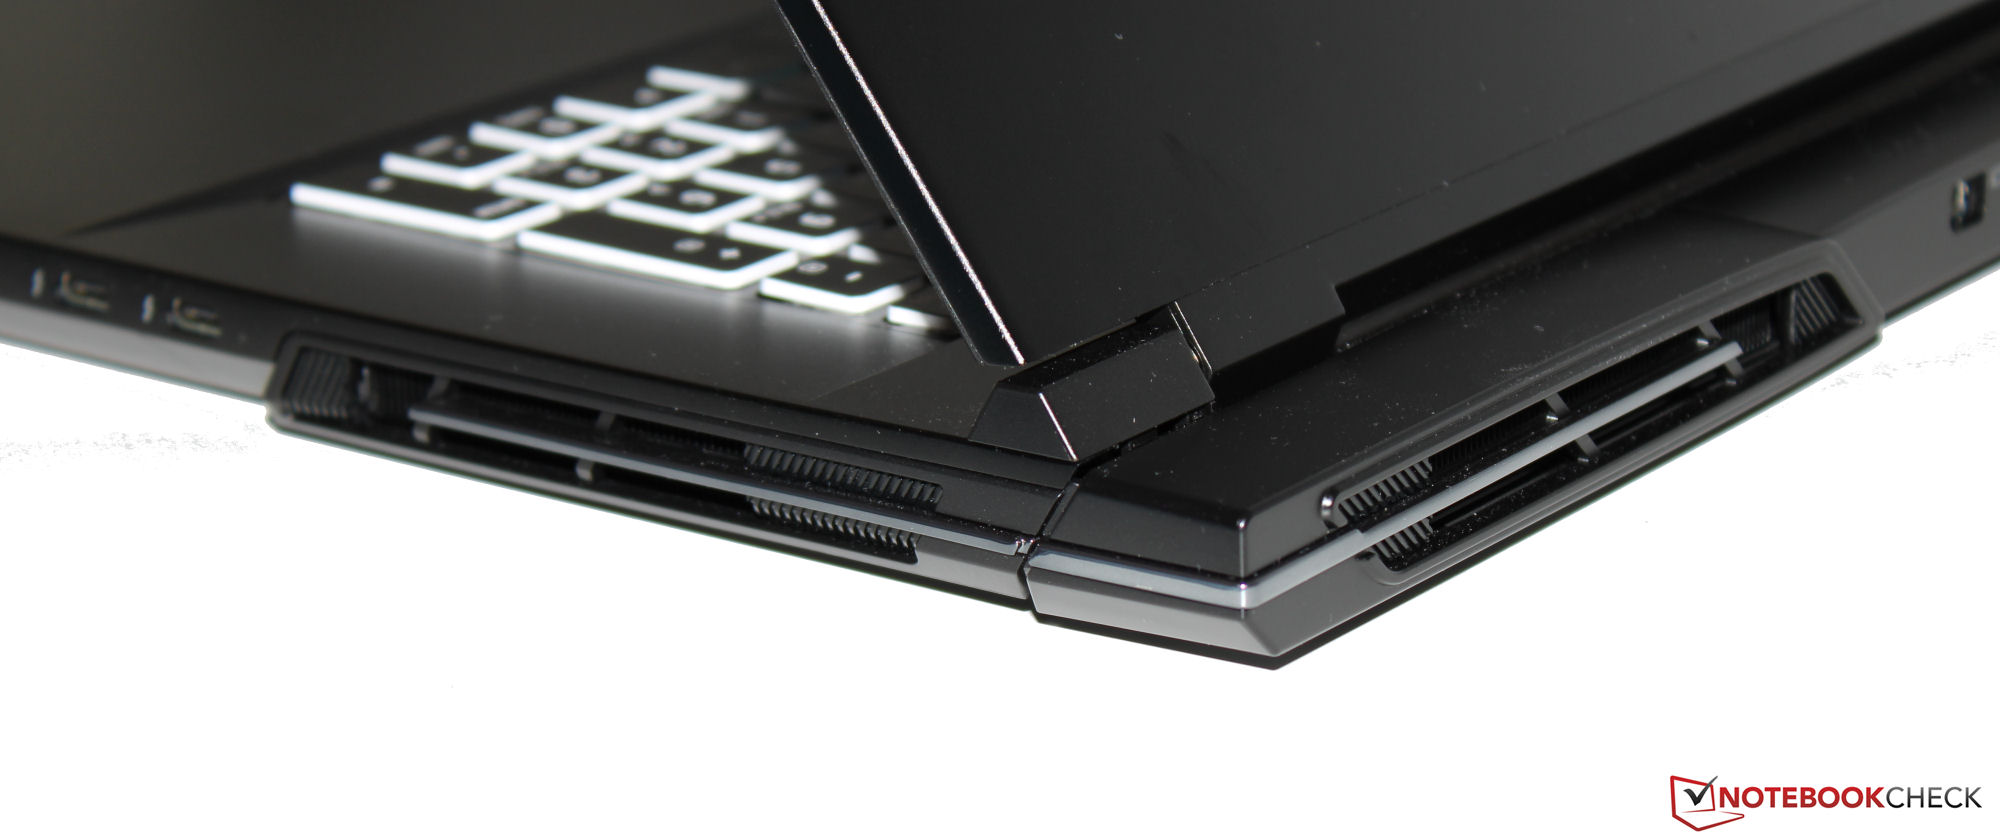
Emissioni e gestione dell'energia - Il portatile Schenker può essere piuttosto rumoroso
Emissioni acustiche
Un notebook potente come il Key 17 Pro può produrre un'enorme quantità di rumore sotto carico: il livello di rumore ha raggiunto i 62 dB(A) quando il portatile eseguiva giochi in "modalità Performance". Anche in modalità "Intrattenimento", il dispositivo è riuscito a raggiungere un livello estremamente elevato di 54 dB(A). Le altre due modalità di alimentazione consentono al Key 17 Pro di funzionare in modo silenzioso per la maggior parte del tempo, con prestazioni significativamente ridotte.
Il notebook è generalmente silenzioso, a volte addirittura silenzioso, al minimo o durante l'uso quotidiano (ad esempio, software per ufficio, navigazione in Internet). Tuttavia, di tanto in tanto le ventole si accendono senza motivo (un fenomeno che si verifica tipicamente con i barebone Clevo).
Rumorosità
| Idle |
| 26 / 33 / 46 dB(A) |
| Sotto carico |
| 56 / 64 dB(A) |
 | ||
30 dB silenzioso 40 dB(A) udibile 50 dB(A) rumoroso |
||
min: | ||
| Schenker Key 17 Pro (Early 23) i9-13900HX, GeForce RTX 4090 Laptop GPU | MSI Stealth 17 Studio A13VH-014 i9-13900H, GeForce RTX 4080 Laptop GPU | Asus ROG Strix Scar 17 G733PY-XS96 R9 7945HX, GeForce RTX 4090 Laptop GPU | Aorus 17X AZF i9-13900HX, GeForce RTX 4090 Laptop GPU | Medion Erazer Beast X40 i9-13900HX, GeForce RTX 4090 Laptop GPU | |
|---|---|---|---|---|---|
| Noise | 25% | 22% | 10% | 13% | |
| off /ambiente * (dB) | 26 | 24 8% | 22.7 13% | 25 4% | 24 8% |
| Idle Minimum * (dB) | 26 | 24 8% | 23.5 10% | 28 -8% | 25 4% |
| Idle Average * (dB) | 33 | 24 27% | 27.7 16% | 29 12% | 29 12% |
| Idle Maximum * (dB) | 46 | 24 48% | 27.7 40% | 34 26% | 35 24% |
| Load Average * (dB) | 56 | 34.49 38% | 30.5 46% | 51 9% | 51 9% |
| Witcher 3 ultra * (dB) | 62 | 48.29 22% | 51.4 17% | 57 8% | 51 18% |
| Load Maximum * (dB) | 64 | 49.66 22% | 54.1 15% | 54 16% | 53 17% |
* ... Meglio usare valori piccoli
Temperatura
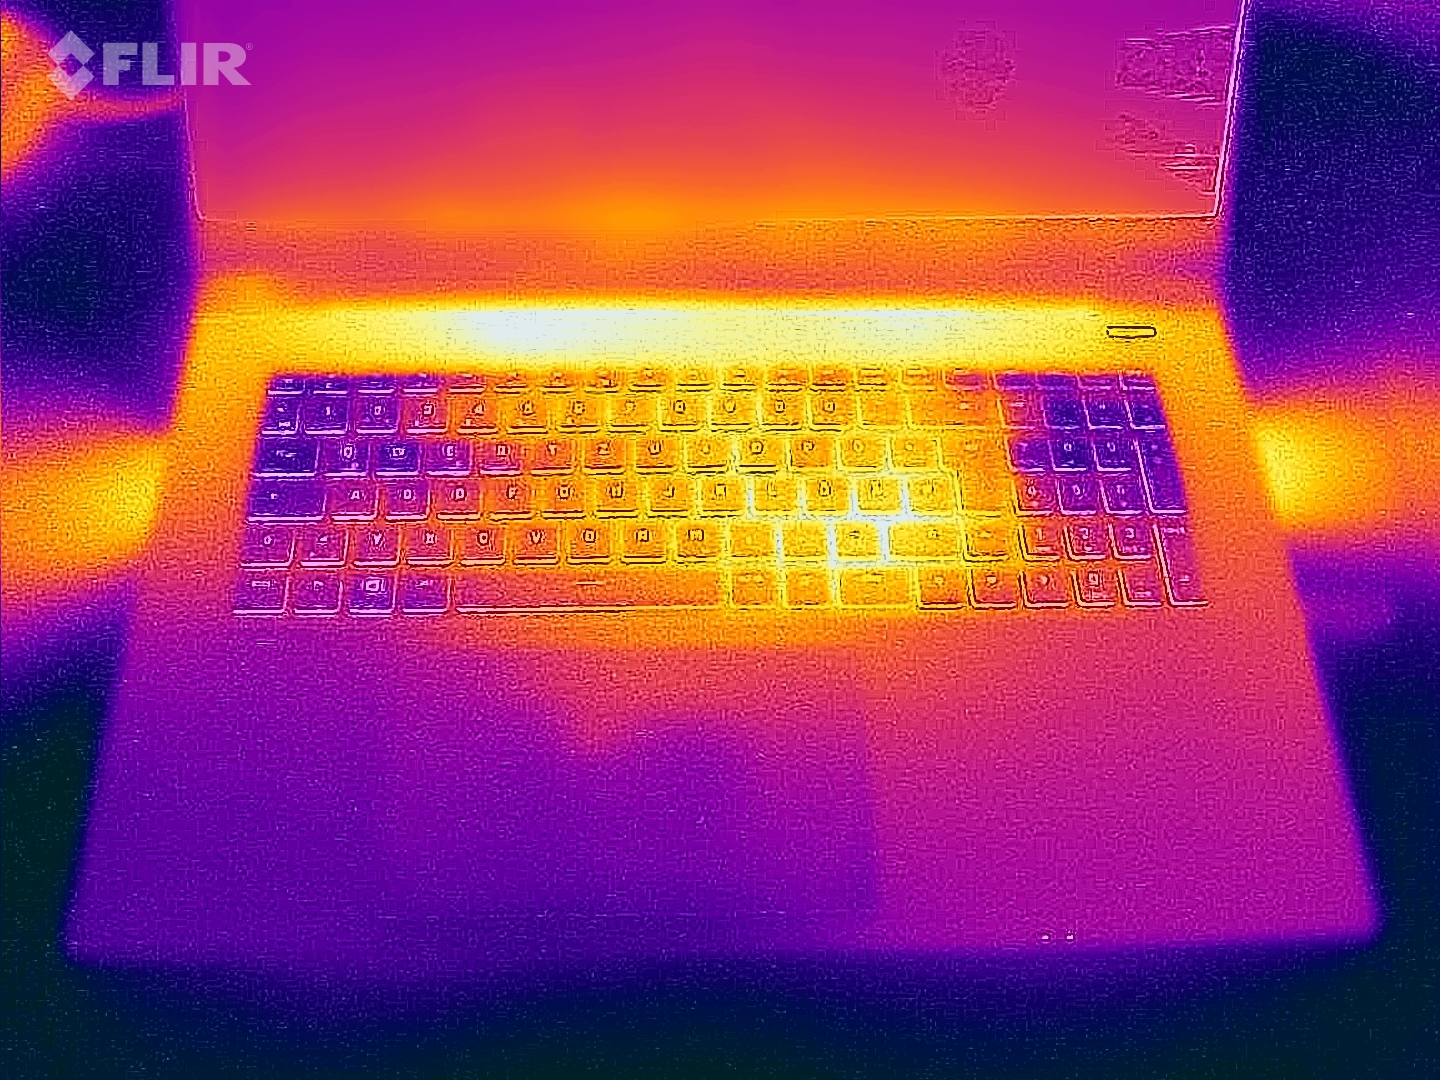
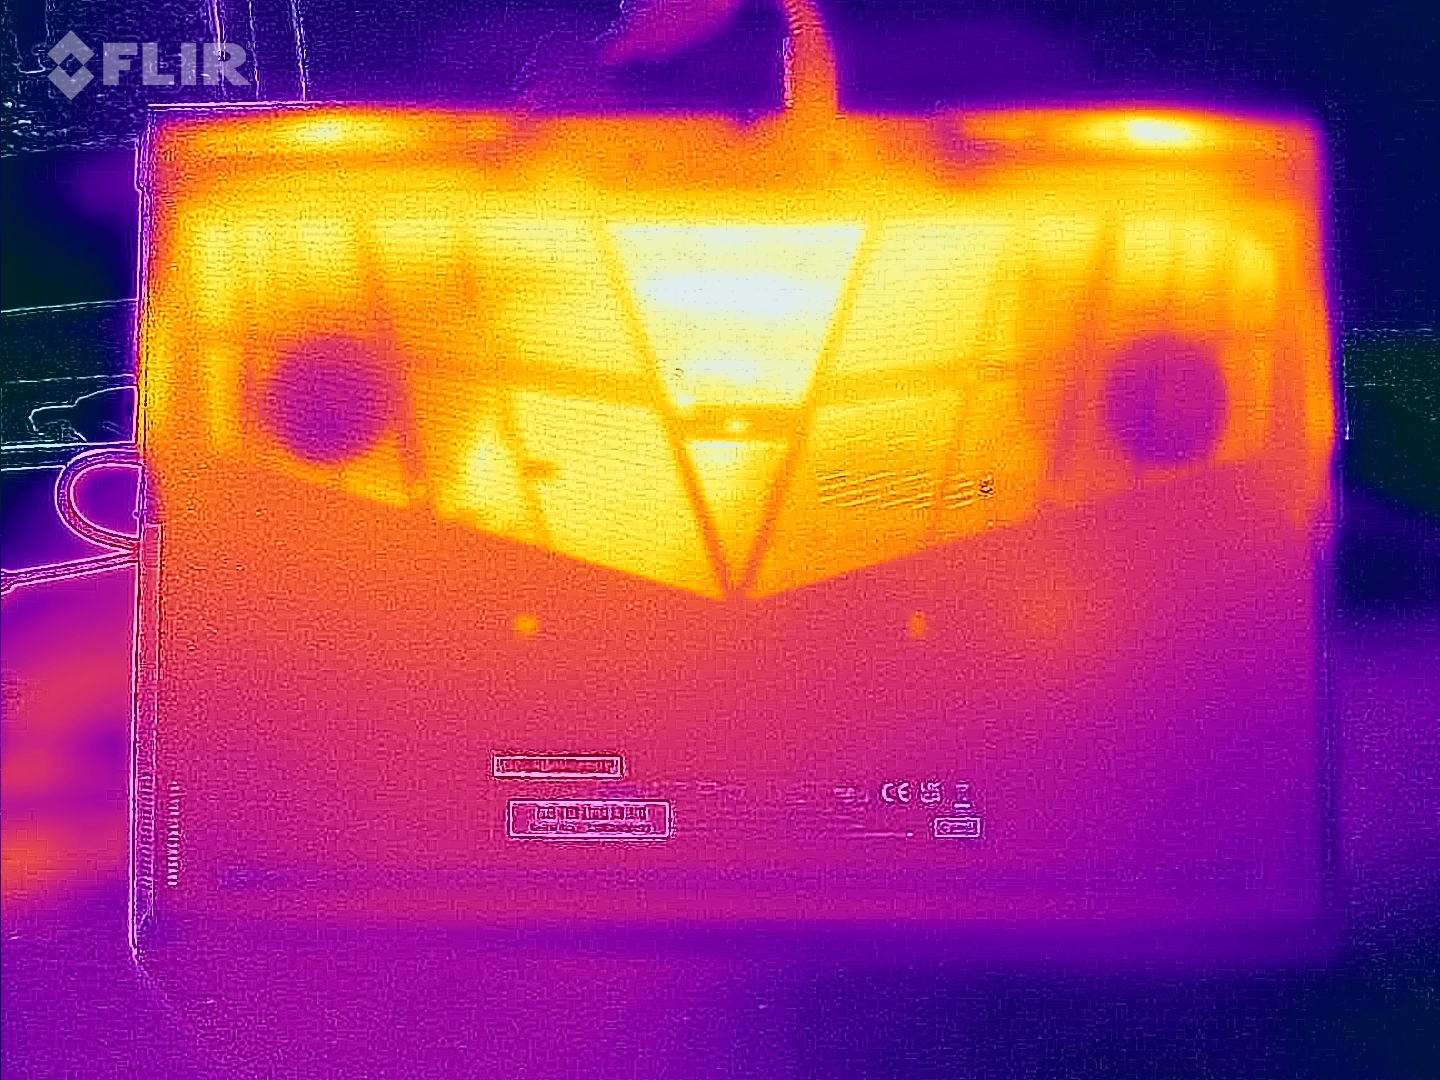
Il portatile diventa sensibilmente caldo sotto carico: abbiamo misurato temperature tra i 55 e i 60°C (131 e 140°F) in alcuni punti dello chassis. In condizioni d'uso normali, tuttavia, le temperature dello chassis sono rimaste entro un intervallo confortevole
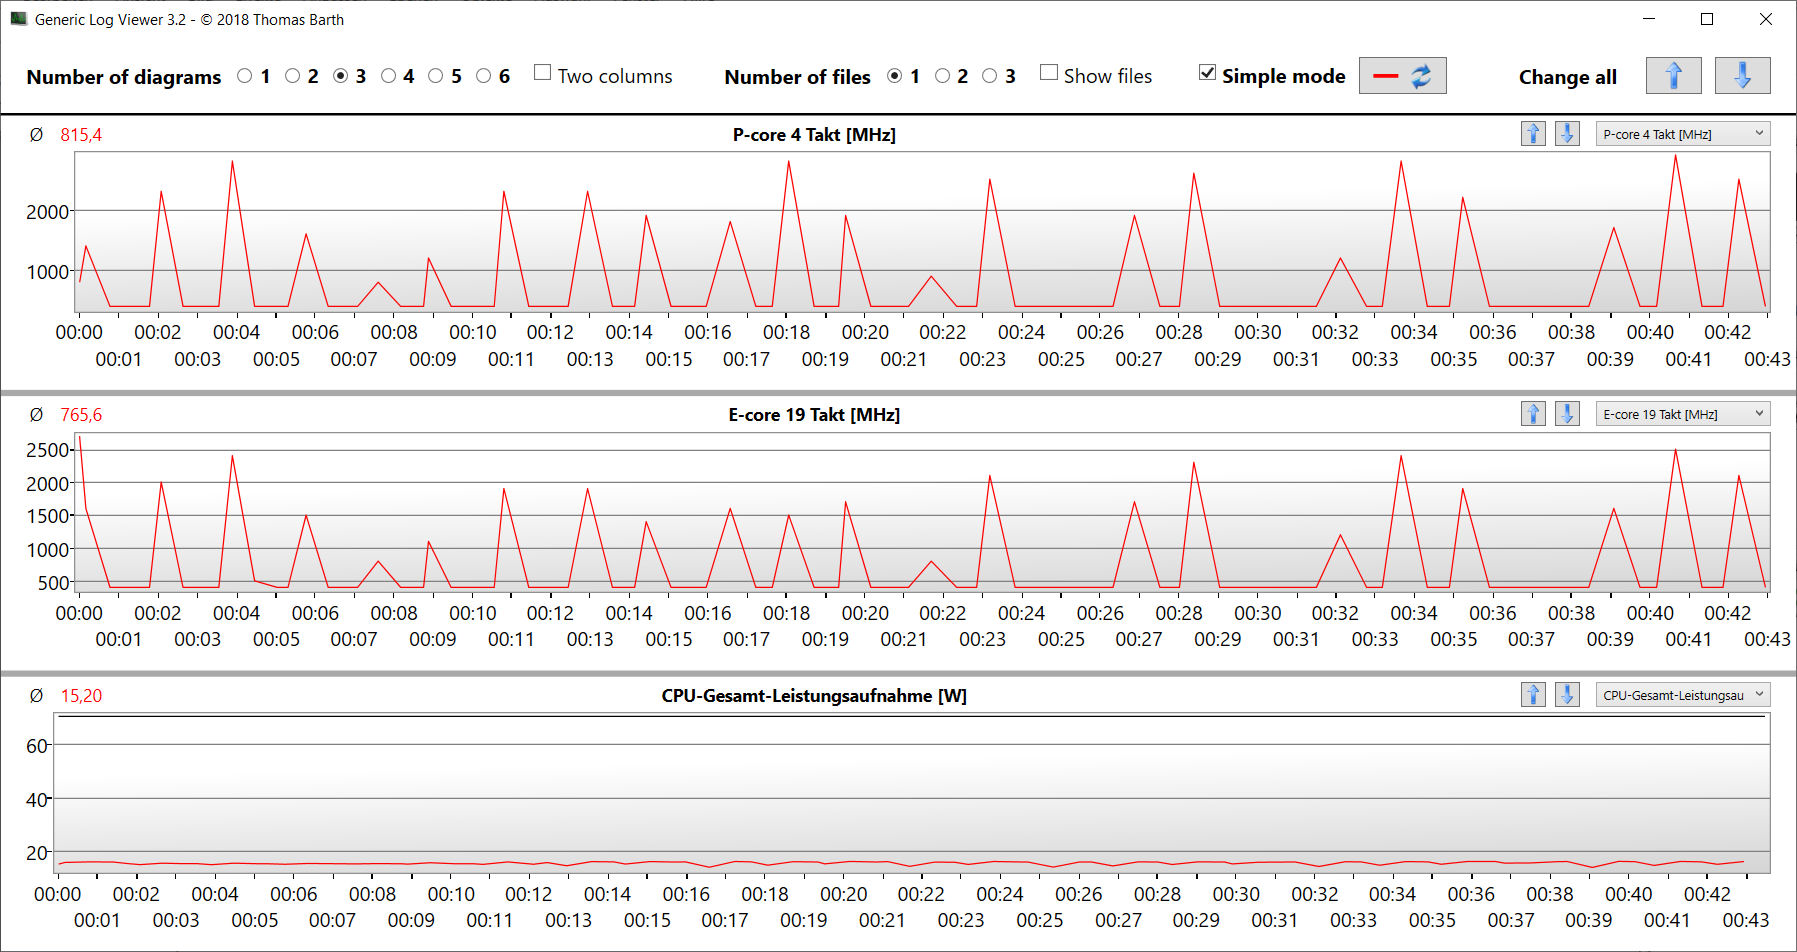
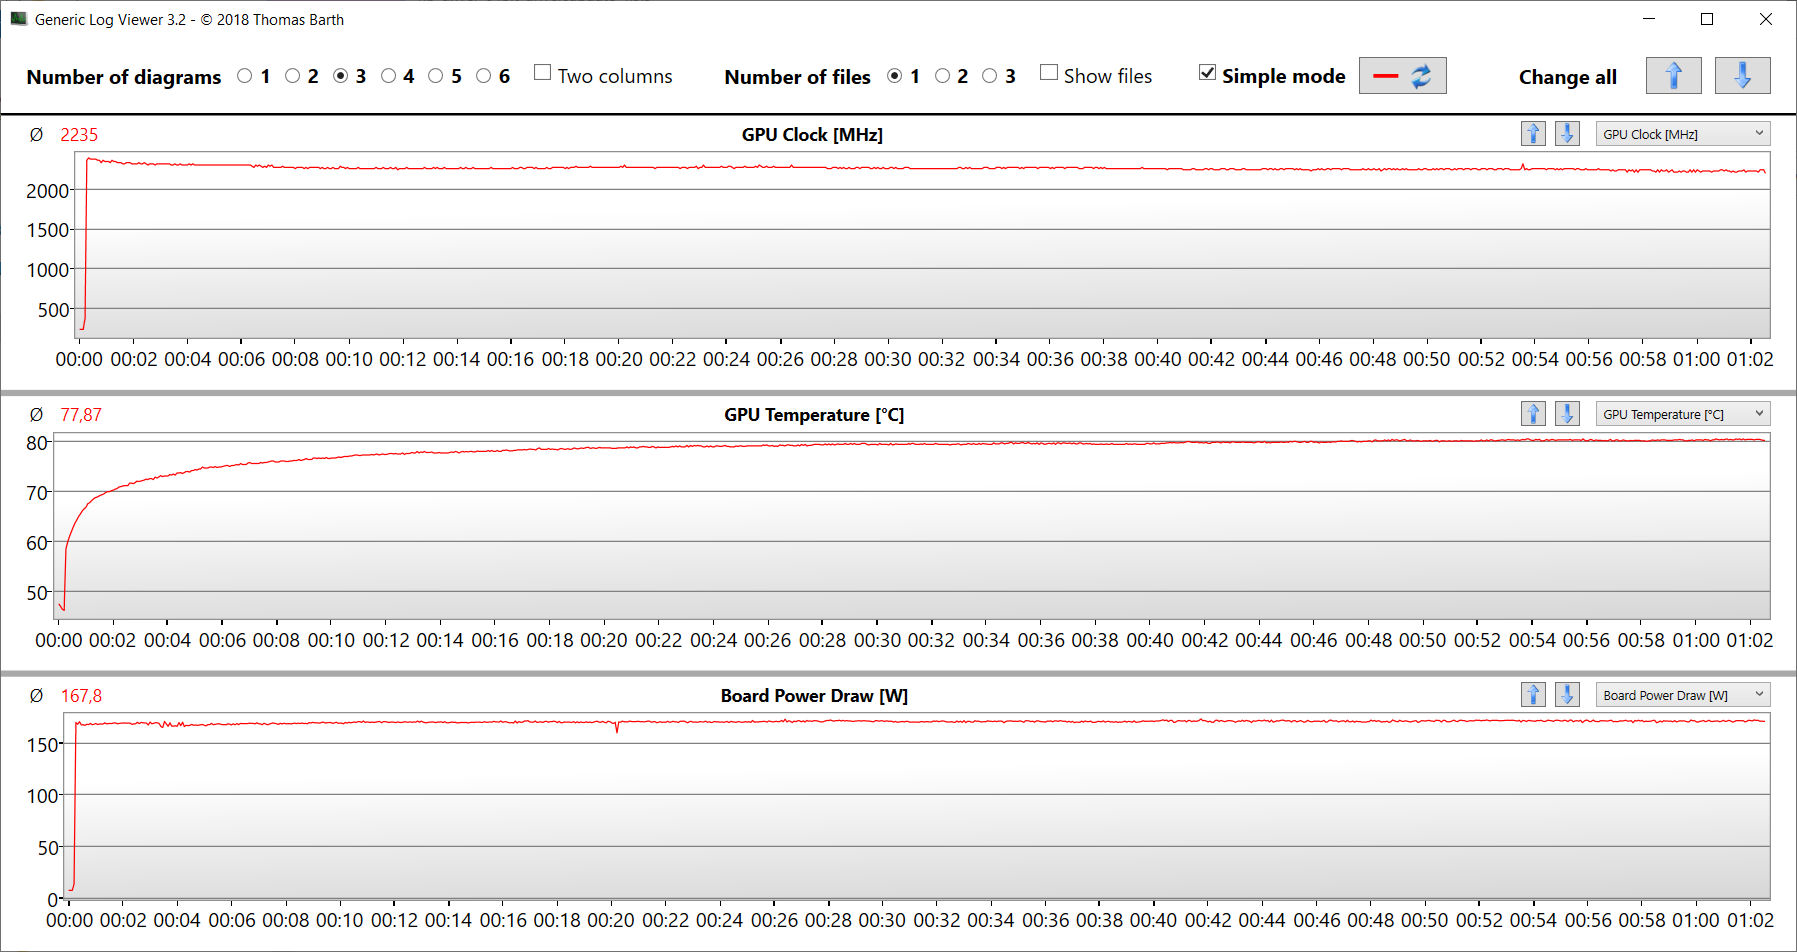
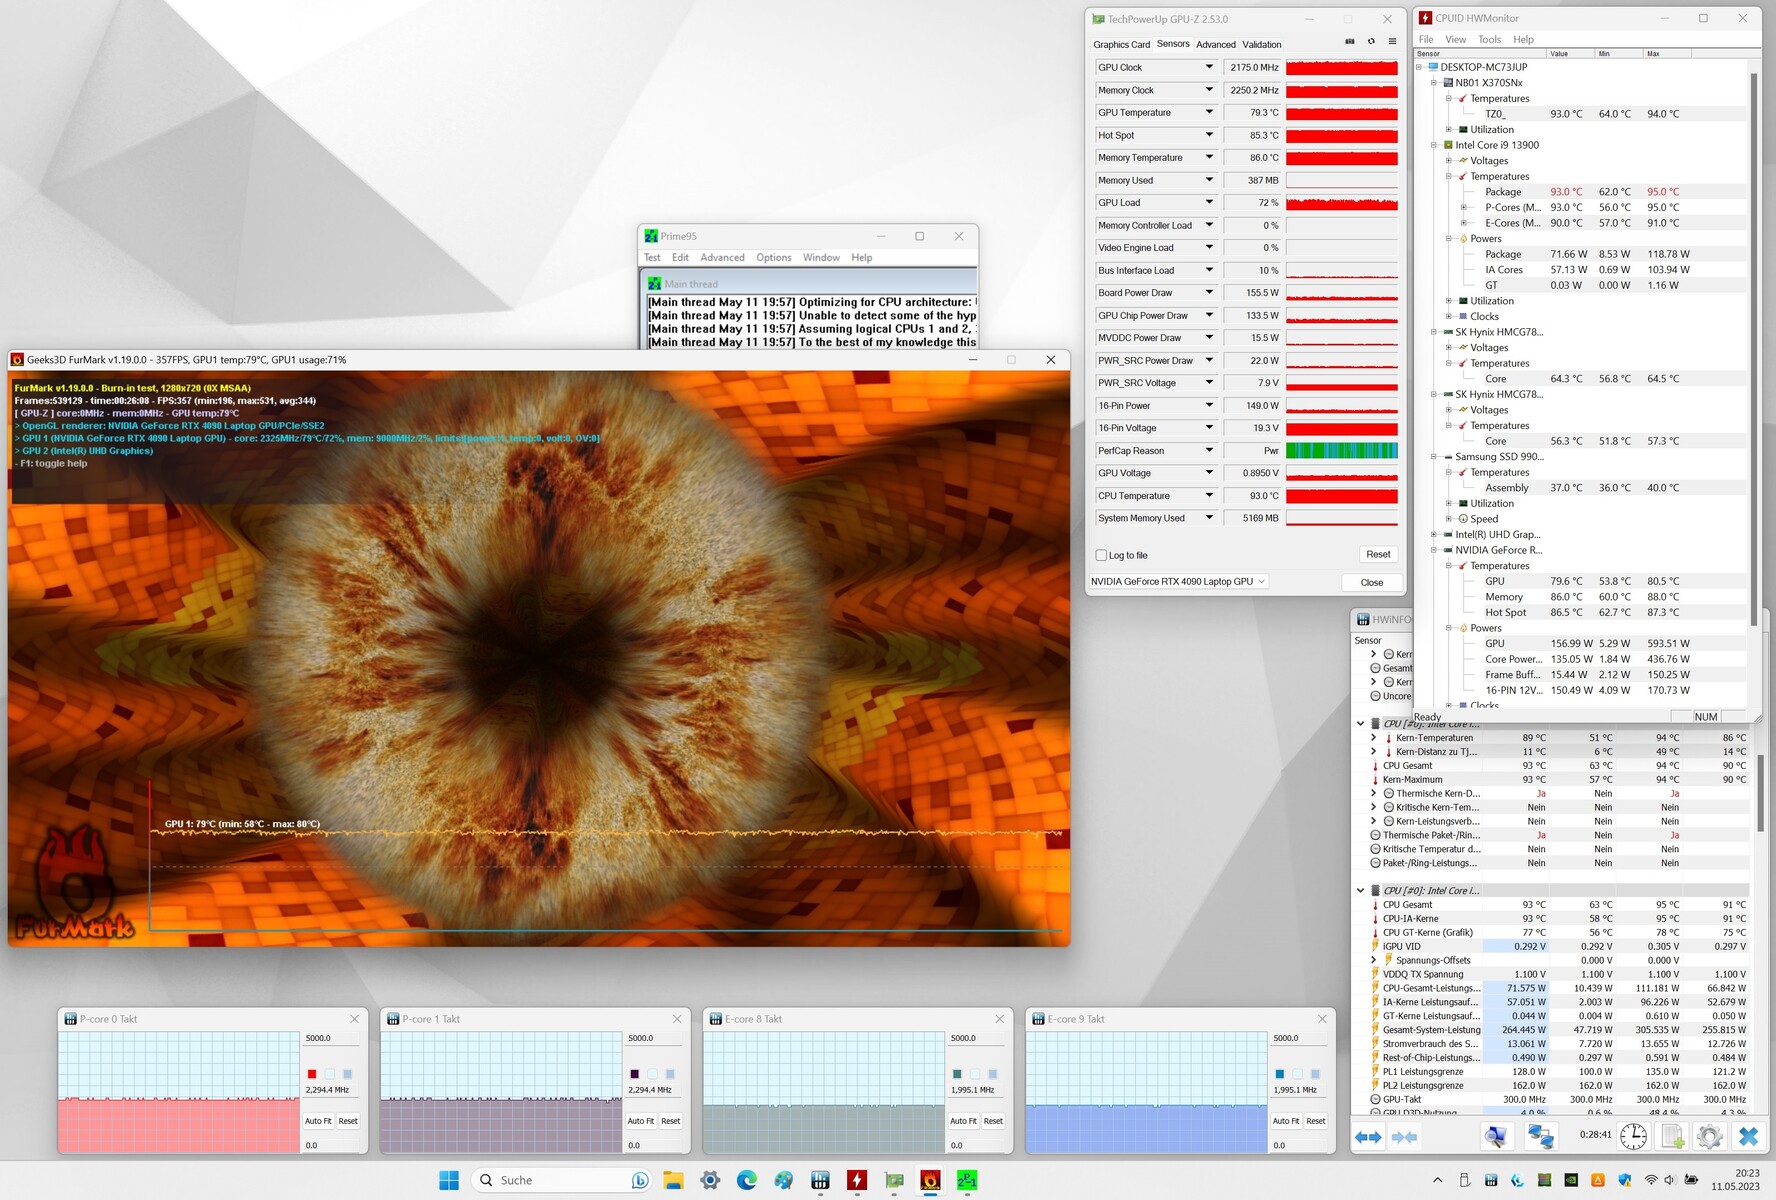
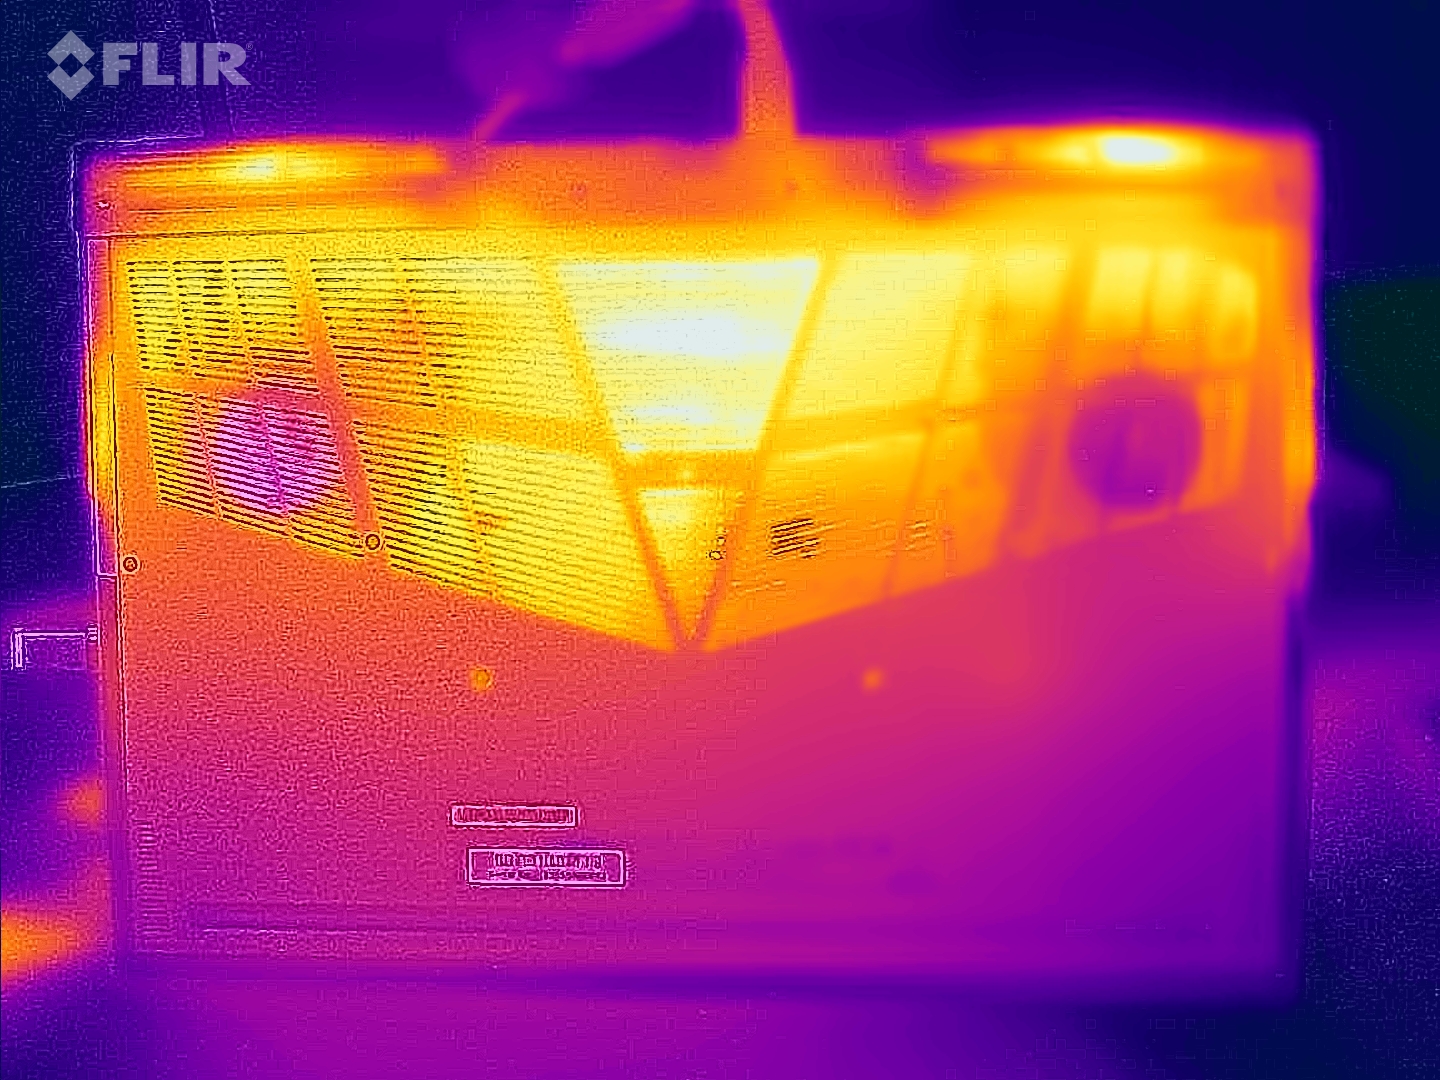
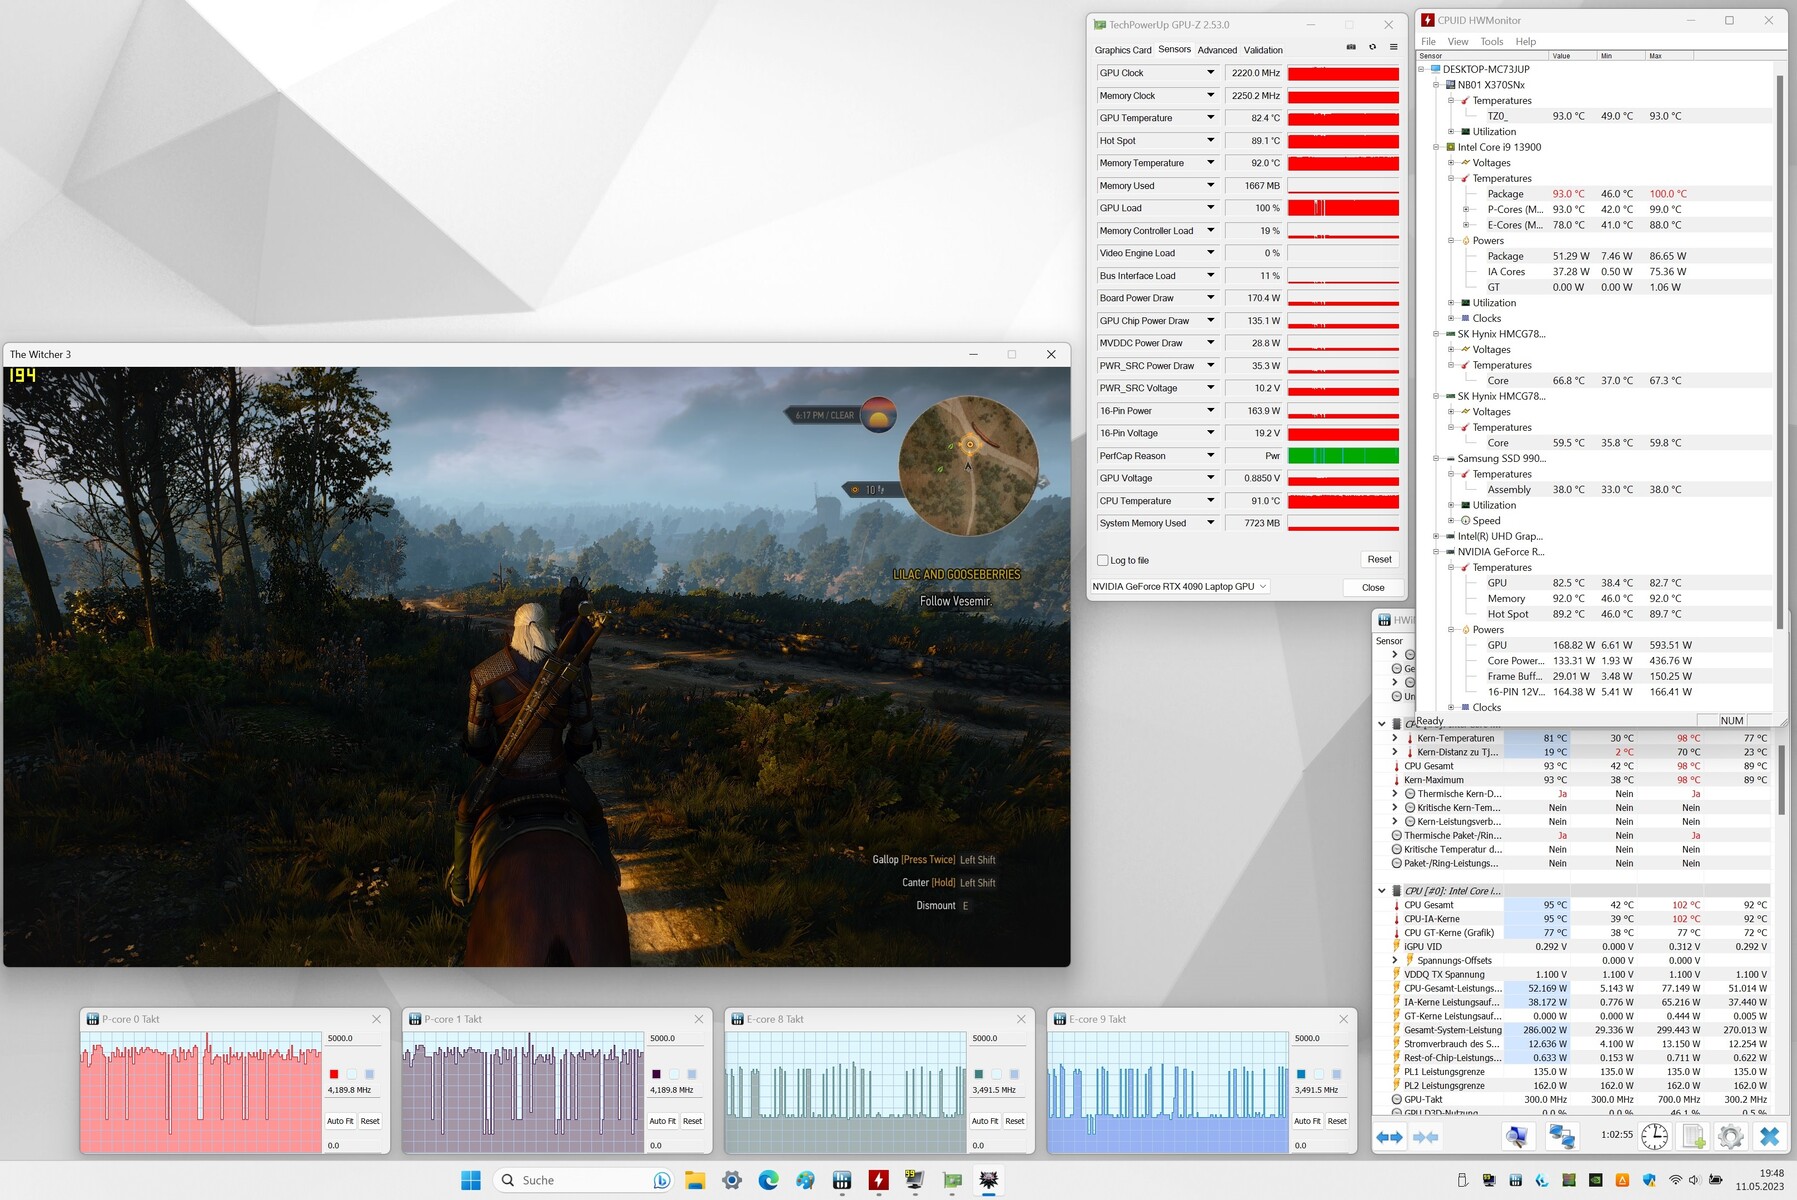
Il nostro stress test (esecuzione di Prime95 e FurMark per un periodo prolungato) rappresenta uno scenario estremo progettato per verificare la stabilità di un sistema a pieno carico. La CPU ha funzionato a velocità di clock elevate (core P: da 3,4 a 3,5GHz, core E: da 3,1 a 3,2GHz) fin dall'inizio, mentre la GPU ha spuntato da 1,0 a 1,6GHz. Successivamente, il clock della CPU è sceso relativamente rapidamente mentre quello della GPU è salito oltre i 2GHz.
(-) La temperatura massima sul lato superiore è di 57 °C / 135 F, rispetto alla media di 40.4 °C / 105 F, che varia da 21.2 a 68.8 °C per questa classe Gaming.
(-) Il lato inferiore si riscalda fino ad un massimo di 60 °C / 140 F, rispetto alla media di 43.2 °C / 110 F
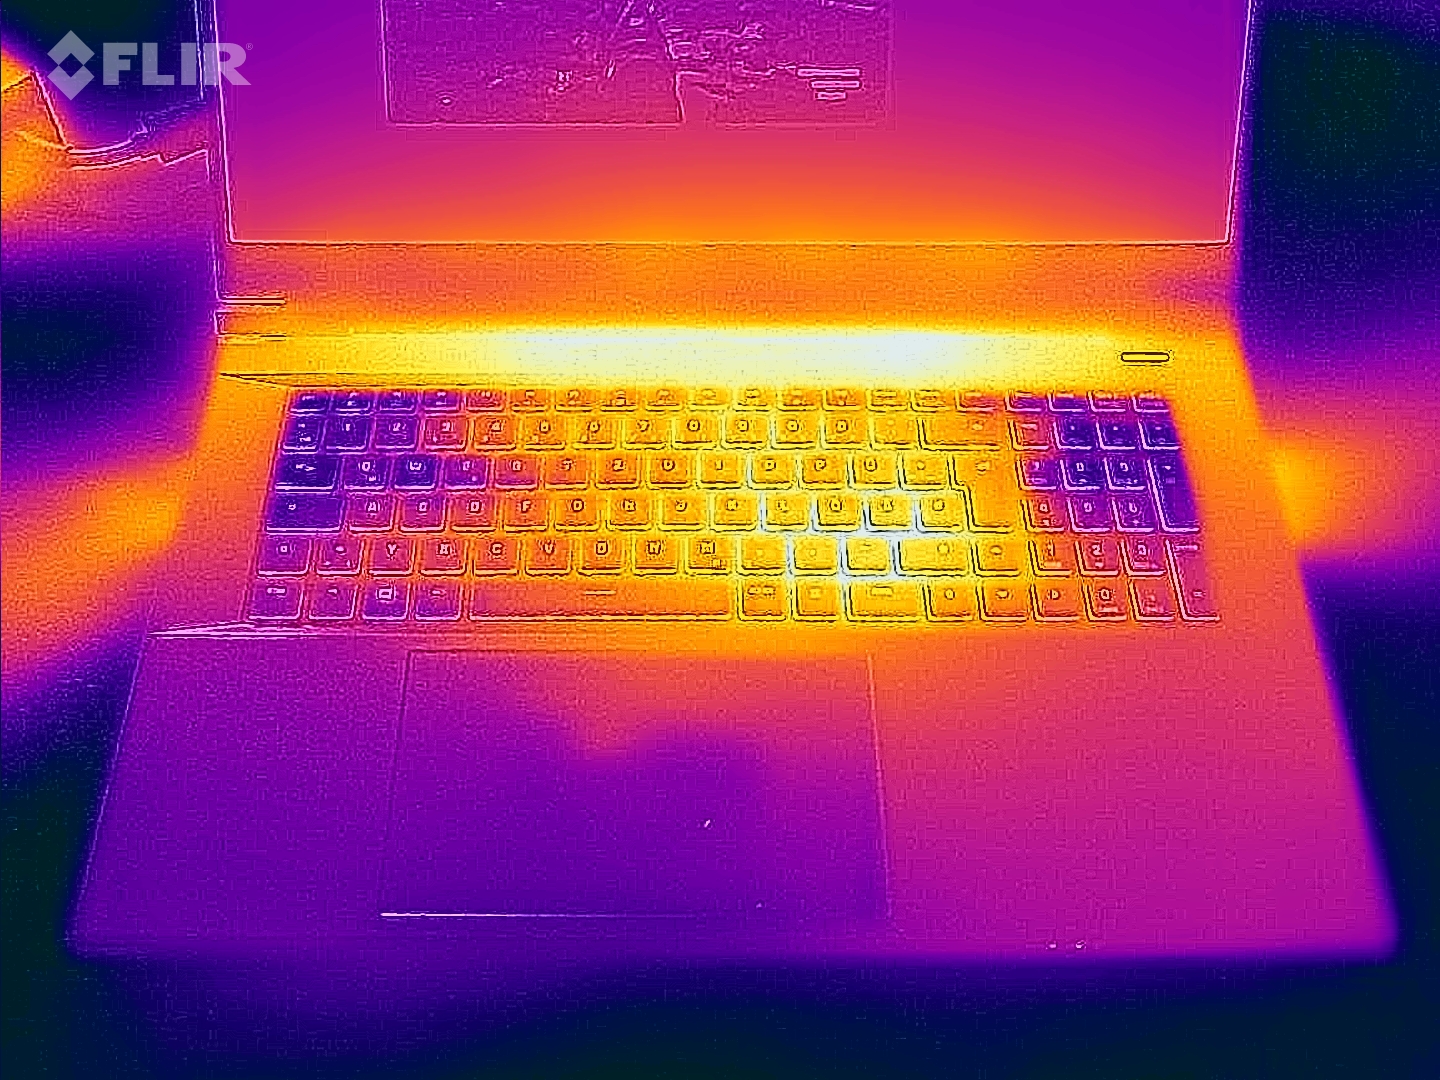
(+) In idle, la temperatura media del lato superiore è di 28.7 °C / 84 F, rispetto alla media deld ispositivo di 33.9 °C / 93 F.
(-) Riproducendo The Witcher 3, la temperatura media per il lato superiore e' di 47.3 °C / 117 F, rispetto alla media del dispositivo di 33.9 °C / 93 F.
(±) I poggiapolsi e il touchpad possono diventare molto caldi al tatto con un massimo di 38 °C / 100.4 F.
(-) La temperatura media della zona del palmo della mano di dispositivi simili e'stata di 28.8 °C / 83.8 F (-9.2 °C / -16.6 F).
| Schenker Key 17 Pro (Early 23) Intel Core i9-13900HX, NVIDIA GeForce RTX 4090 Laptop GPU | MSI Stealth 17 Studio A13VH-014 Intel Core i9-13900H, NVIDIA GeForce RTX 4080 Laptop GPU | Asus ROG Strix Scar 17 G733PY-XS96 AMD Ryzen 9 7945HX, NVIDIA GeForce RTX 4090 Laptop GPU | Aorus 17X AZF Intel Core i9-13900HX, NVIDIA GeForce RTX 4090 Laptop GPU | Medion Erazer Beast X40 Intel Core i9-13900HX, NVIDIA GeForce RTX 4090 Laptop GPU | |
|---|---|---|---|---|---|
| Heat | 10% | 27% | 12% | 11% | |
| Maximum Upper Side * (°C) | 57 | 47 18% | 34.6 39% | 47 18% | 48 16% |
| Maximum Bottom * (°C) | 60 | 54 10% | 35.6 41% | 51 15% | 52 13% |
| Idle Upper Side * (°C) | 32 | 30 6% | 27.2 15% | 30 6% | 30 6% |
| Idle Bottom * (°C) | 34 | 32 6% | 30 12% | 31 9% | 31 9% |
* ... Meglio usare valori piccoli
Altoparlanti
Gli altoparlanti stereo hanno un suono complessivamente decente.
Schenker Key 17 Pro (Early 23) analisi audio
(±) | potenza degli altiparlanti media ma buona (78 dB)
Bassi 100 - 315 Hz
(±) | bassi ridotti - in media 11.7% inferiori alla media
(±) | la linearità dei bassi è media (7.1% delta rispetto alla precedente frequenza)
Medi 400 - 2000 Hz
(+) | medi bilanciati - solo only 2.1% rispetto alla media
(+) | medi lineari (3.5% delta rispetto alla precedente frequenza)
Alti 2 - 16 kHz
(+) | Alti bilanciati - appena 1.8% dalla media
(+) | alti lineari (6.4% delta rispetto alla precedente frequenza)
Nel complesso 100 - 16.000 Hz
(+) | suono nel complesso lineare (11.9% differenza dalla media)
Rispetto alla stessa classe
» 12% di tutti i dispositivi testati in questa classe è stato migliore, 4% simile, 85% peggiore
» Il migliore ha avuto un delta di 6%, medio di 18%, peggiore di 132%
Rispetto a tutti i dispositivi testati
» 9% di tutti i dispositivi testati in questa classe è stato migliore, 2% similare, 89% peggiore
» Il migliore ha avuto un delta di 4%, medio di 23%, peggiore di 134%
MSI Stealth 17 Studio A13VH-014 analisi audio
(+) | gli altoparlanti sono relativamente potenti (82.44 dB)
Bassi 100 - 315 Hz
(±) | bassi ridotti - in media 8% inferiori alla media
(±) | la linearità dei bassi è media (8.8% delta rispetto alla precedente frequenza)
Medi 400 - 2000 Hz
(±) | medi elevati - circa 8.2% superiore alla media
(+) | medi lineari (6.8% delta rispetto alla precedente frequenza)
Alti 2 - 16 kHz
(+) | Alti bilanciati - appena 1% dalla media
(+) | alti lineari (4% delta rispetto alla precedente frequenza)
Nel complesso 100 - 16.000 Hz
(+) | suono nel complesso lineare (11.6% differenza dalla media)
Rispetto alla stessa classe
» 10% di tutti i dispositivi testati in questa classe è stato migliore, 3% simile, 87% peggiore
» Il migliore ha avuto un delta di 6%, medio di 18%, peggiore di 132%
Rispetto a tutti i dispositivi testati
» 8% di tutti i dispositivi testati in questa classe è stato migliore, 2% similare, 90% peggiore
» Il migliore ha avuto un delta di 4%, medio di 23%, peggiore di 134%
Consumo di energia
Il Key 17 Pro non ha mostrato alcun problema di consumo energetico. Ha mantenuto un consumo energetico costante durante lo stress test e il test Witcher 3. L'adattatore in dotazione (330 watt) è sufficientemente potente per il dispositivo.
| Off / Standby | |
| Idle | |
| Sotto carico |
|
Leggenda:
min: | |
Power consumption Witcher 3 / Stresstest
Power consumption with external monitor
Durata della batteria
Il nostro test Wi-Fi è stato progettato per simulare l'uso nella vita reale e prevede l'accesso a vari siti web utilizzando uno script. Il portatile da 17,3 pollici è riuscito a resistere per 6 ore e 51 minuti durante il test: un risultato di tutto rispetto per un notebook 4K così potente.
Pro
Contro
Verdetto - Un concentrato di potenza personalizzabile
Il Key 17 Pro è stato progettato per scenari di utilizzo che richiedono una grande potenza di calcolo, come l'editing video, i giochi e il rendering. Il GeForce Laptop RTX 4090 e Core i9-13900HX all'interno forniscono la forza necessaria per gestire questi compiti: entrambi i componenti sono in grado di funzionare costantemente ad alta velocità. Il portatile genera una quantità di calore e rumore normale per questa classe di dispositivi.
Con il Key 17 Pro (Early 23), Schenker ha realizzato un potente notebook di fascia alta.
Il Key 17 Pro è dotato di tre slot per SSD (1x PCIe 5.0, 2x PCIe 4.0; M.2-2280), che consentono di aggiungere rapidamente altre unità in caso di esaurimento dello spazio di archiviazione. I due slot PCIe 4.0 supportano il RAID 0/1. L'installazione di ulteriori unità SSD non è eccessivamente complicata. Il pannello inferiore può essere rimosso senza l'uso di attrezzi dopo aver svitato tutte le viti.
Le due porte USB-C (Thunderbolt 4) consentono di integrare senza problemi il portatile in una configurazione da scrivania esistente e di aprire le opzioni di espansione (ad esempio, una GPU esterna). Una delle porte supporta anche Power Delivery. L'autonomia della batteria è molto buona. Il display opaco da 17,3 pollici (4K, IPS, 144Hz, G-Sync e DCI-P3) ha lasciato un'impressione per lo più positiva durante i nostri test, anche se avrebbe beneficiato di un contrasto più elevato.
Un'alternativa al Key 17 Pro è il MSI Stealth 17 Studio. È dotato di uno schermo mini-LED e produce molto meno rumore a pieno regime. Al momento di questa recensione, l'Aorus 17X AZF, con specifiche quasi identiche, è un prodotto di fascia alta Aorus 17X AZF (anche se con un pannello QHD anziché 4K) può essere acquistato a un prezzo notevolmente inferiore a quello del Key e rappresenta quindi un'opzione più conveniente.
Prezzo e disponibilità
Lo Schenker Key 17 Pro (Early 23), come da specifiche di questa recensione, costa circa 4.479 euro (4.820 dollari). In alternativa, è possibile configurare il dispositivo in base alle proprie esigenze nel negozio online di Schenker. I prezzi partono da 3.199 euro (3.445 dollari).
Schenker Key 17 Pro (Early 23)
- 05/30/2023 v7 (old)
Sascha Mölck
Transparency
La selezione dei dispositivi da recensire viene effettuata dalla nostra redazione. Il campione di prova è stato fornito all'autore come prestito dal produttore o dal rivenditore ai fini di questa recensione. L'istituto di credito non ha avuto alcuna influenza su questa recensione, né il produttore ne ha ricevuto una copia prima della pubblicazione. Non vi era alcun obbligo di pubblicare questa recensione. In quanto società mediatica indipendente, Notebookcheck non è soggetta all'autorità di produttori, rivenditori o editori.
Ecco come Notebookcheck esegue i test
Ogni anno, Notebookcheck esamina in modo indipendente centinaia di laptop e smartphone utilizzando procedure standardizzate per garantire che tutti i risultati siano comparabili. Da circa 20 anni sviluppiamo continuamente i nostri metodi di prova e nel frattempo stabiliamo gli standard di settore. Nei nostri laboratori di prova, tecnici ed editori esperti utilizzano apparecchiature di misurazione di alta qualità. Questi test comportano un processo di validazione in più fasi. Il nostro complesso sistema di valutazione si basa su centinaia di misurazioni e parametri di riferimento ben fondati, che mantengono l'obiettività.Price comparison

