Recensione dello SCHENKER Key 17 Pro (M24) - doppi connettori Thunderbolt 5 ultraveloci e potenza i9-14900HX
Bogdan Solca, 👁 Bogdan Solca (traduzione a cura di DeepL / Ninh Duy) Pubblicato 🇺🇸 🇫🇷 ...
Il verdetto
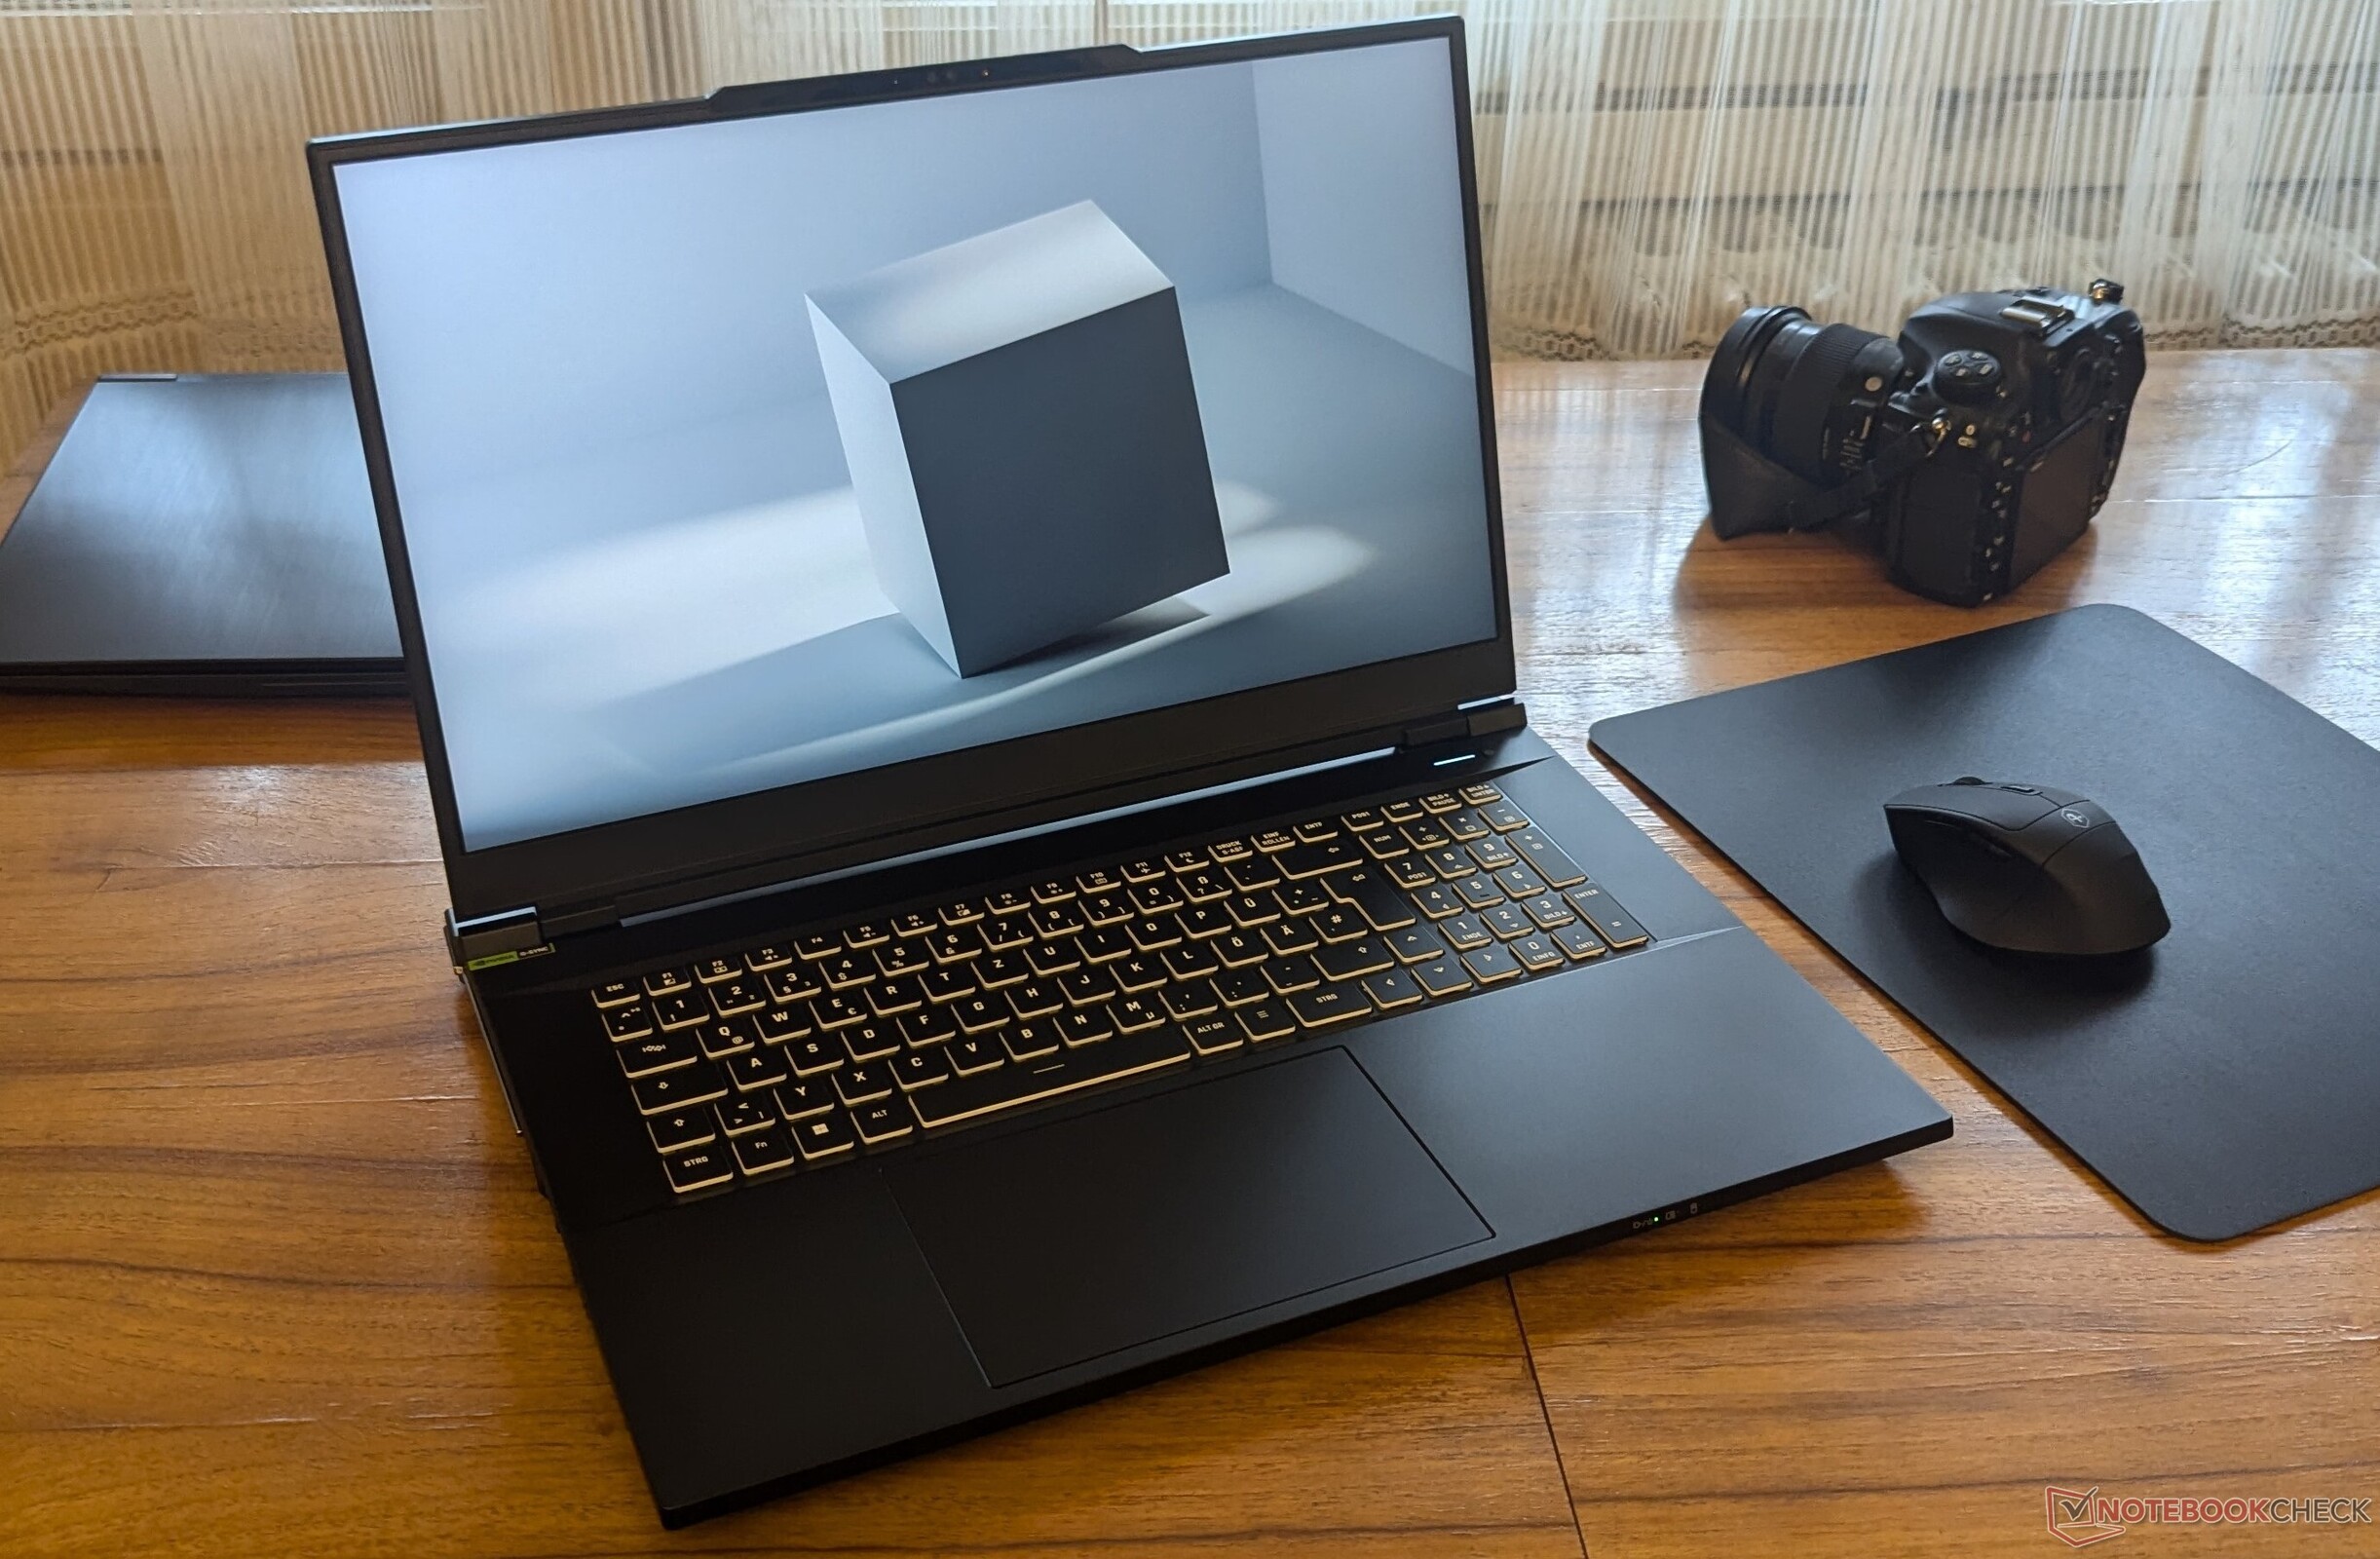
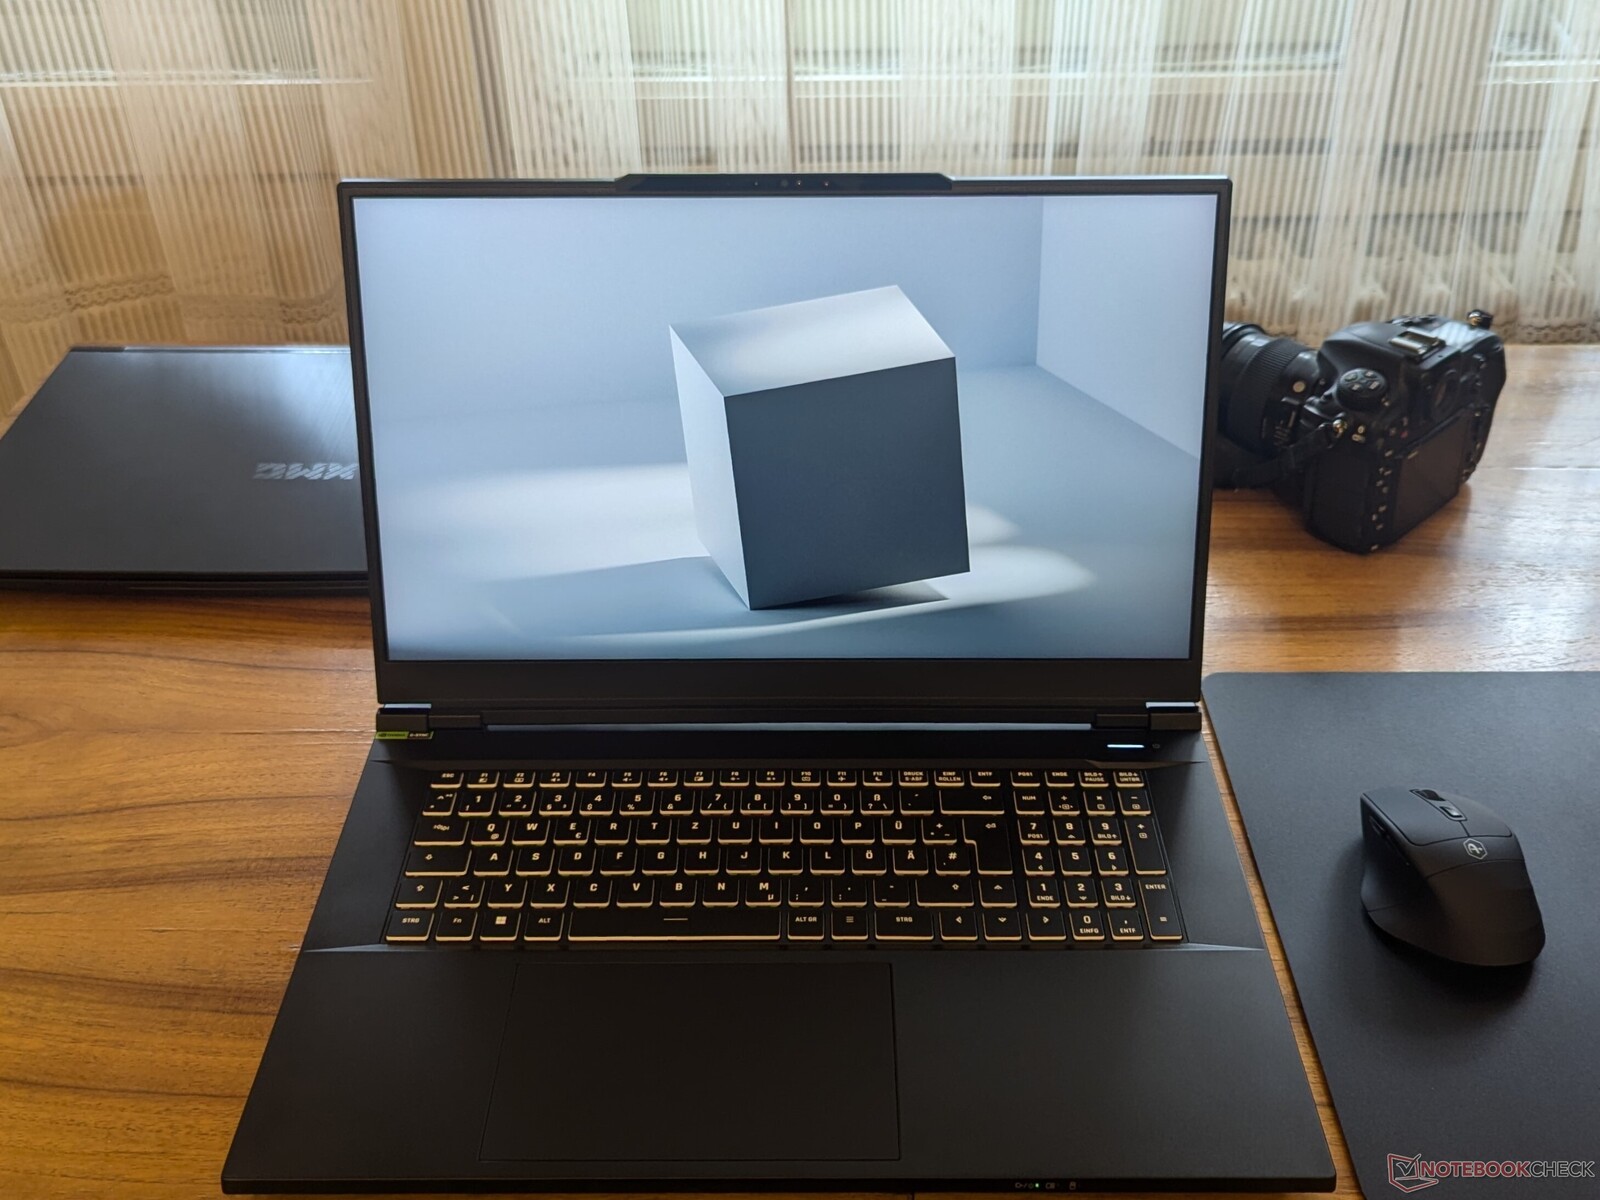
L'aggiornamento 2024 di Schenker per i computer portatili di classe workstation Key 17 Pro viene fornito con un aggiornamento della CPU e alcune aggiunte impressionanti. L'ultima iterazione della workstation mantiene lo stesso chassis Clevo del modello dell'anno scorso, ma sostituisce la CPU i9-13900HX con il più veloce i9-14900HXche attualmente rimane la soluzione mobile più veloce di Intel. Schenker ha anche aggiunto Wi-Fi 7 e due Thunderbolt 5 ciascuna con una larghezza di banda di 80 Gbps, e queste caratteristiche possono essere facilmente aggiunte ai professionisti.
Sebbene la RAM e lo spazio di archiviazione siano gli stessi della variante precedente, garantiscono comunque ottime prestazioni. La RTX 4090 è sempre una grande aggiunta, ma i nostri test rivelano che l'implementazione di Schenker non è la migliore in circolazione. Nel complesso, le prestazioni sono ottime.
Per quanto riguarda i lati negativi, Schenker non ha migliorato il sistema di raffreddamento, che rimane ancora rumoroso soprattutto nel profilo delle prestazioni, anche a medio carico. L'app del centro di controllo consente di personalizzare le curve della ventola, ma deve essere impostata per ogni applicazione. Un downgrade rispetto alla versione dello scorso anno è l'autonomia della batteria, che sembra ridursi notevolmente, anche se presenta la stessa capacità di 99 Wh. Per questo motivo, Key 17 Pro M24 può essere utilizzato come sostituto di un desktop o al massimo in flussi di lavoro ibridi. Lo schermo IPS 4K è abbastanza luminoso, ma il contrasto e il livello di nero sembrano bassi per questa fascia di prezzo, inoltre la webcam 1080p inclusa è piuttosto mediocre.
Pro
Contro
Prezzo e disponibilità
La configurazione testata può essere ordinata direttamente da Bestware a 4273 Euro.
Possibili alternative a confronto
Immagine | Modello | Geizhals | Peso | Altezza | Schermo |
|---|---|---|---|---|---|
1. 85.1%  | Schenker Key 17 Pro (M24) Intel Core i9-14900HX ⎘ NVIDIA GeForce RTX 4090 Laptop GPU ⎘ 32 GB Memoria, 1024 GB SSD | Listenpreis 4273€ | 3.4 kg | 24.9 mm | 17.30" 3840x2160 255 PPI IPS |
2. 87.2% v7 (old)  | Asus ROG Strix Scar 17 G733PYV-LL053X AMD Ryzen 9 7945HX3D ⎘ NVIDIA GeForce RTX 4090 Laptop GPU ⎘ 32 GB Memoria, 1024 GB SSD | Geizhals Suche | 2.9 kg | 28.3 mm | 17.30" 2560x1440 170 PPI IPS |
3. 85.2% v7 (old)  | Eurocom Raptor X17 Core i9-14900HX Intel Core i9-14900HX ⎘ NVIDIA GeForce RTX 4090 Laptop GPU ⎘ 32 GB Memoria, 2048 GB SSD | Listenpreis 4500 USD | 3.4 kg | 24.9 mm | 17.30" 3840x2160 255 PPI IPS |
4. 85.9%  | HP ZBook Fury 16 G11 Intel Core i9-14900HX ⎘ NVIDIA RTX 3500 Ada Generation Laptop ⎘ 64 GB Memoria, 1024 GB SSD | Listenpreis 3300 USD Geizhals Suche | 2.6 kg | 28.5 mm | 16.00" 3840x2400 283 PPI IPS |
5. 86% v7 (old)  | Aorus 17X AZF Intel Core i9-13900HX ⎘ NVIDIA GeForce RTX 4090 Laptop GPU ⎘ 32 GB Memoria, 1024 GB SSD | Listenpreis 3800 EUR Geizhals Suche | 2.9 kg | 21.8 mm | 17.30" 2560x1440 170 PPI IPS |
Schenker pubblicizza la Key 17 Pro (M24) come una workstation di fascia alta, quindi i nostri test rifletteranno questo aspetto. In precedenza, abbiamo recensito la versione Versione E23 come portatile da gioco, ma con l'aggiornamento alla CPU i9-14900HX, la variante M24 è ora consigliata come workstation. Tuttavia, non potevamo contrapporlo solo alle workstation, poiché il Key 17 Pro è alimentato dalla GPU RTX 4090 e non da una GPU professionale. Per questo motivo, i concorrenti scelti includono i laptop da gioco con RTX 4090 e CPU simili o uguali.
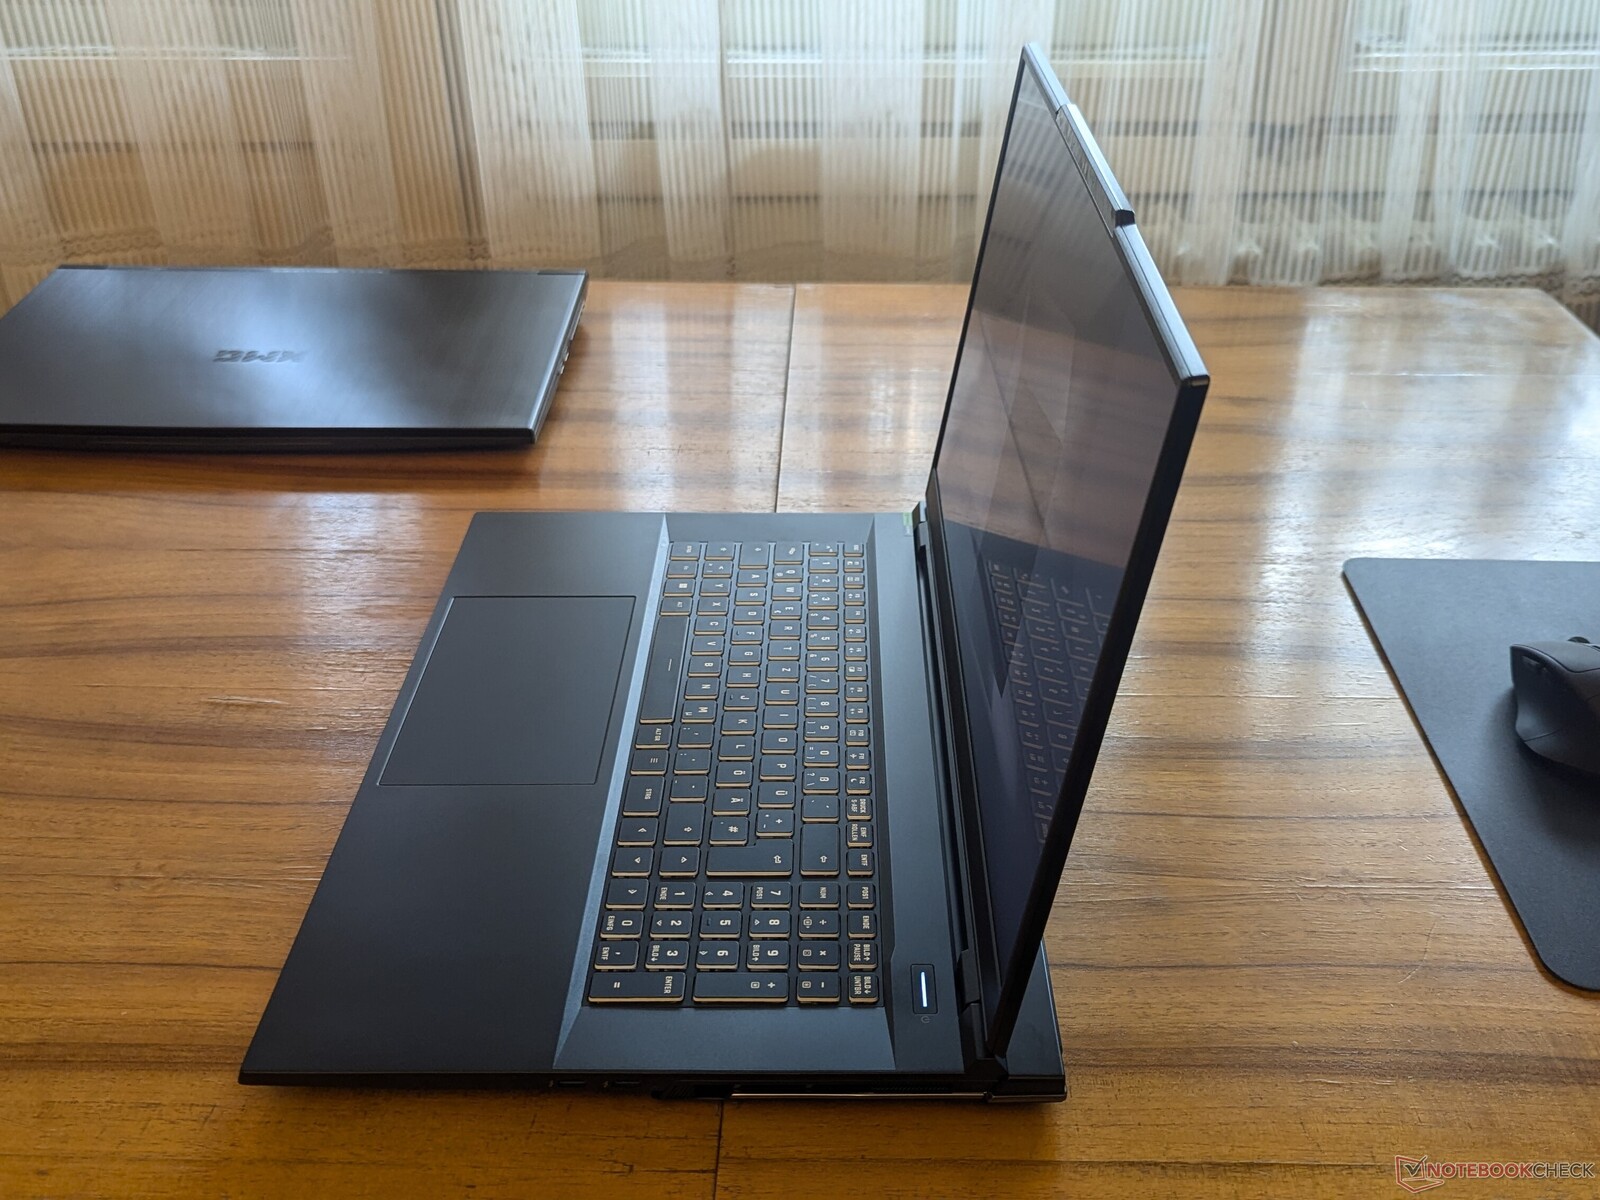
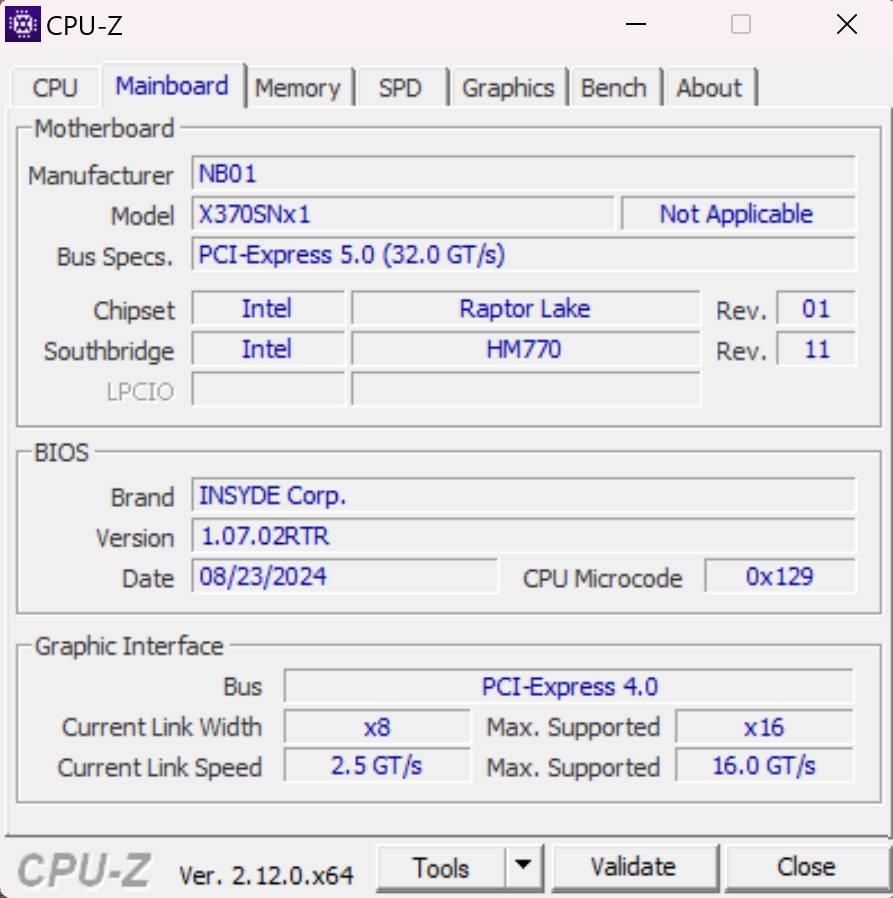
Il telaio sembra essere invariato rispetto alla precedente iterazione, con lo stesso barebone Clevo. Tuttavia, oltre alla CPU più potente, l'M24 introduce alcuni importanti aggiornamenti, come il Wi-Fi 7 e due connettori Thunderbolt 5. Con la CPU aggiornata e le nuove aggiunte, la batteria dell'M24 purtroppo subisce un colpo e non dura quanto quella dell'E23.
Specifiche
Custodia e connettività
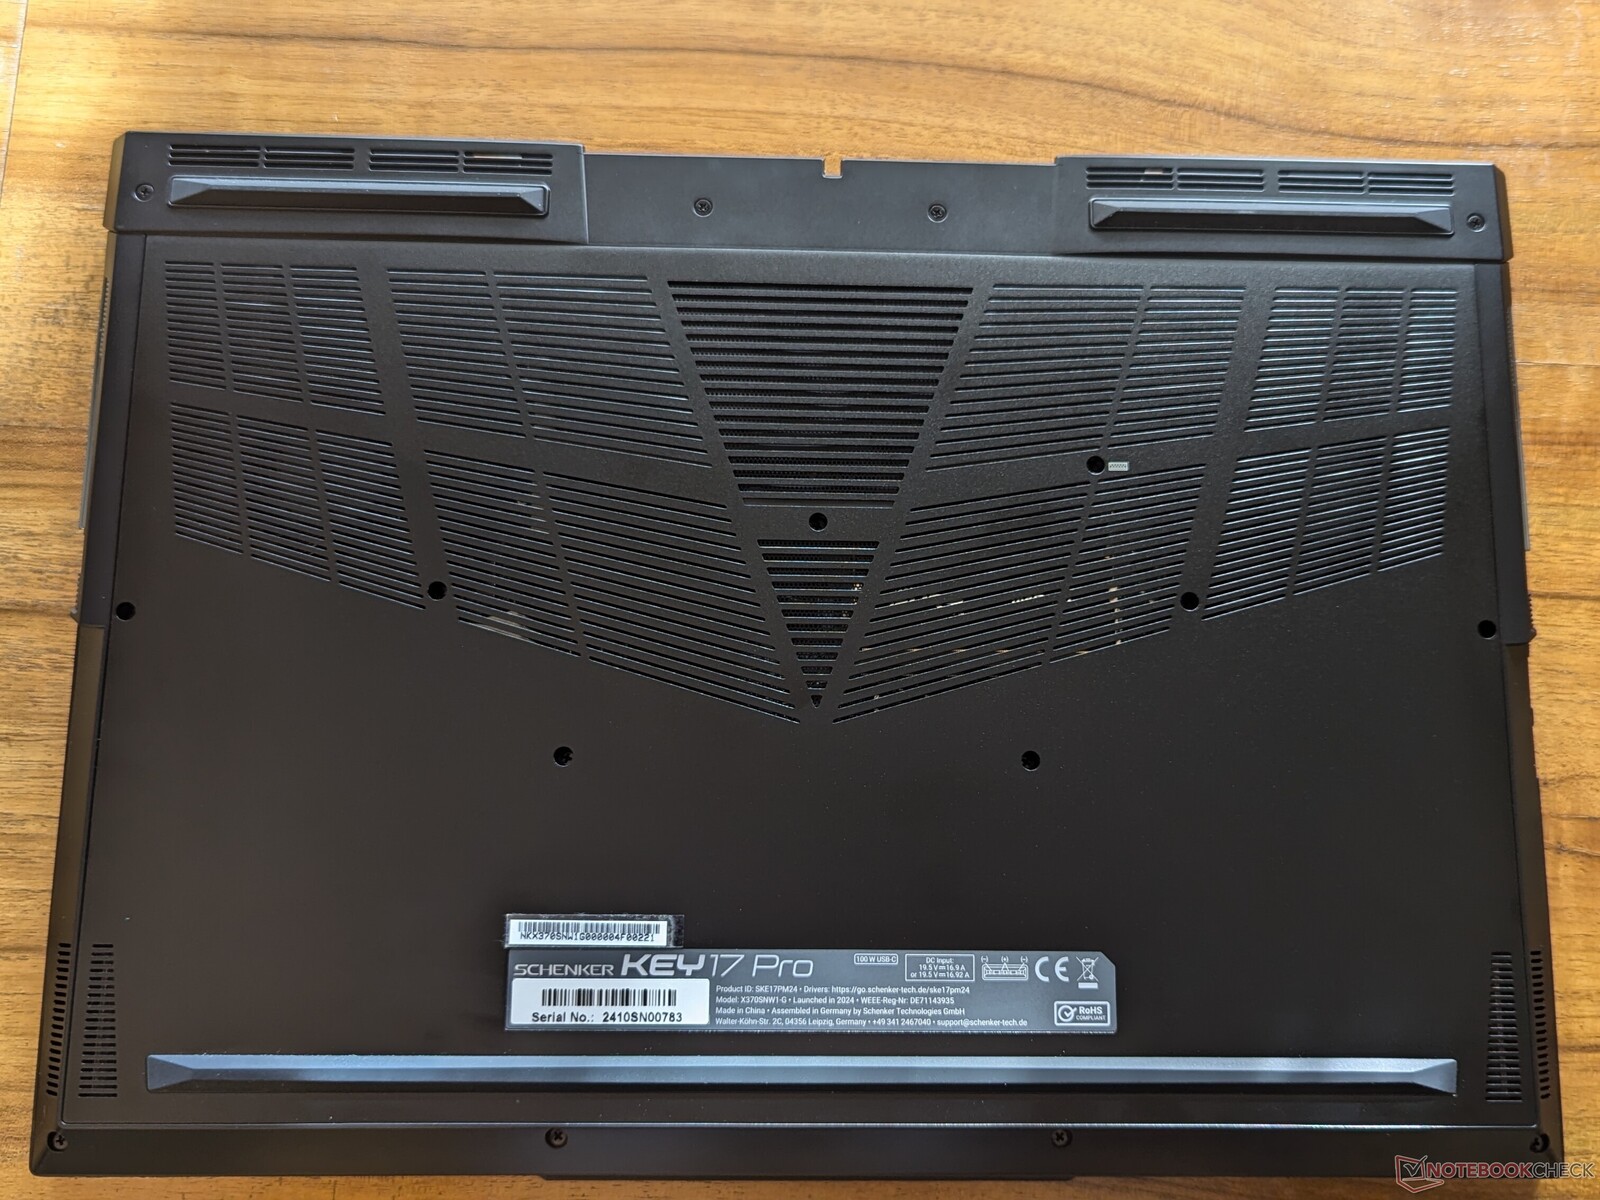
Il sistema è costruito su un barebone fornito da Clevo, che è stato utilizzato anche con il portatile Eurocom che abbiamo incluso per il confronto delle prestazioni. Grazie a una piastra posteriore facilmente rimovibile, la RAM e lo storage possono essere aggiornati quando necessario.
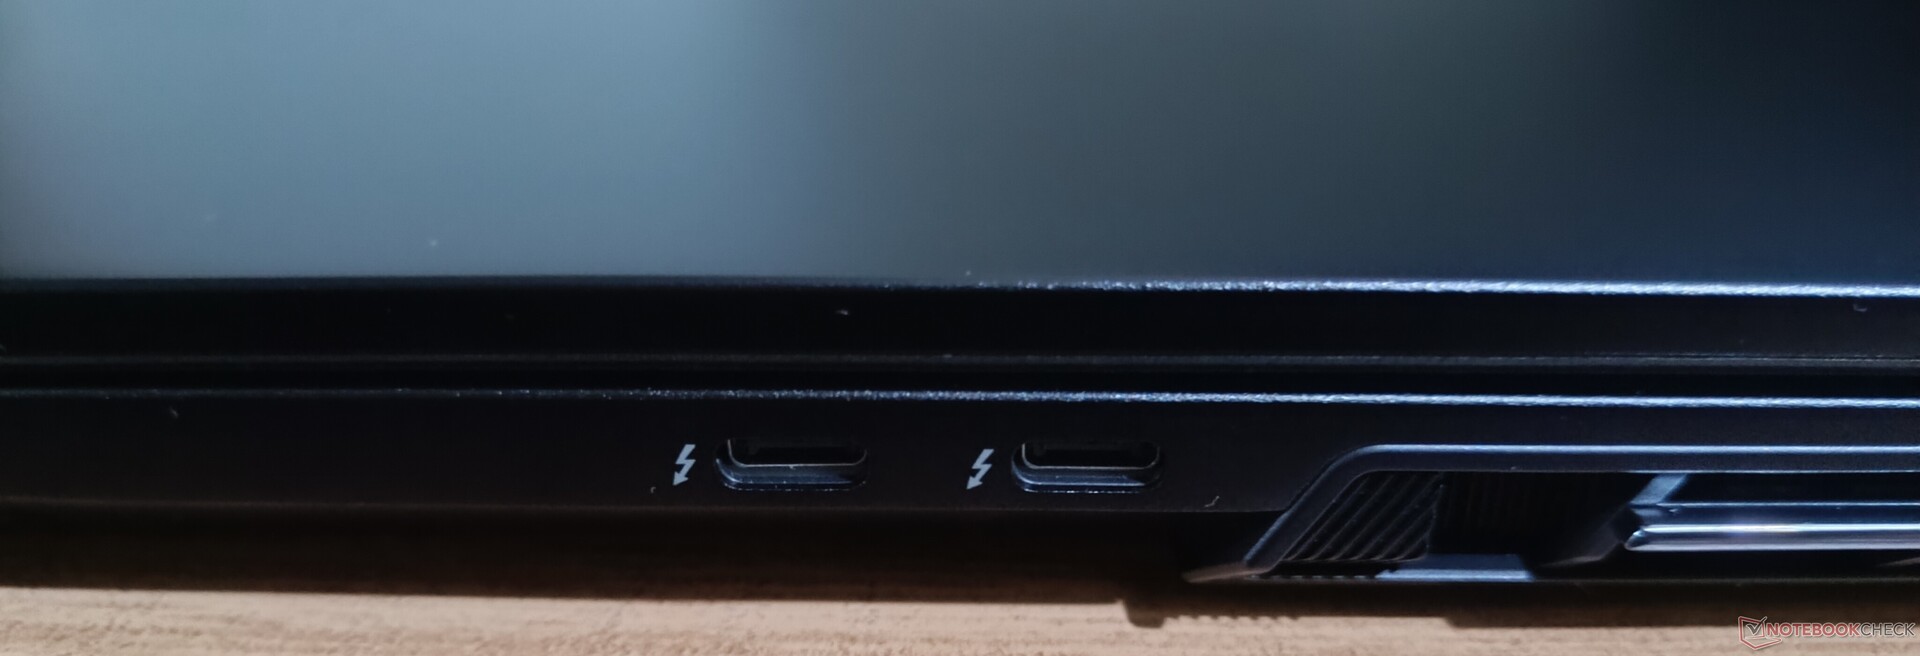
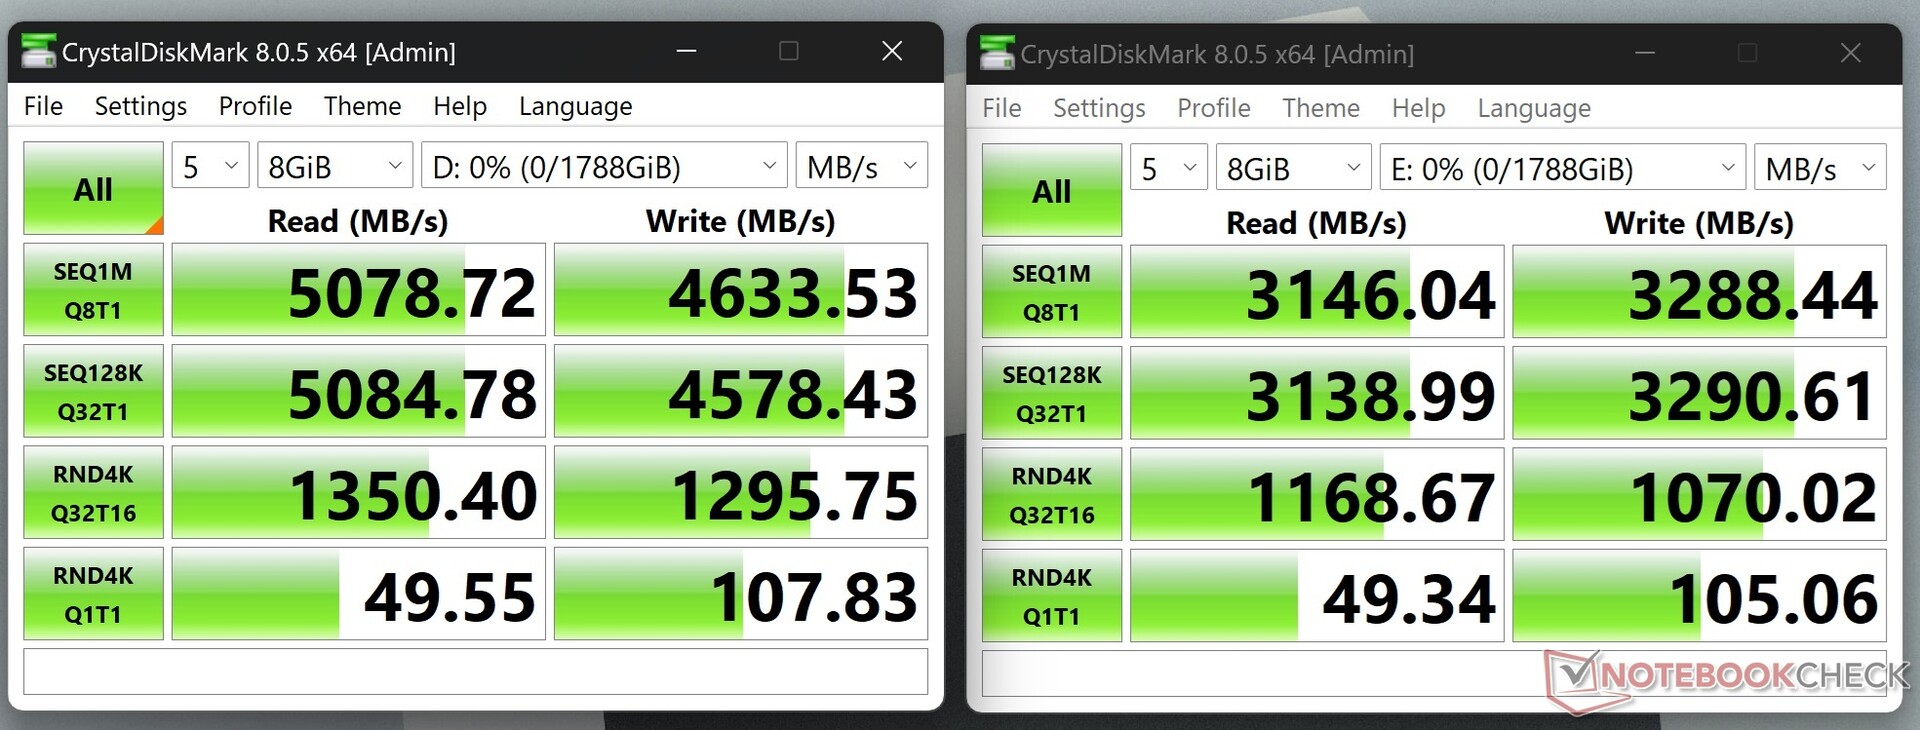
Per quanto riguarda la connettività, il Key 17 Pro convince con una solida selezione di porte a prova di futuro e velocità Internet aggiornate. Questo è uno dei pochi modelli selezionati che offre due connettori Thunderbolt 5 sul lato destro, ciascuno con una larghezza di banda di 80 Gbps. Sfortunatamente, l'opzione boost da 120 Gbps non è disponibile, perché la Nvidia RTX 4090 e l'iGPU di Intel sono limitate alle velocità DP 1.4 / HDMI 2.1. Inoltre, il controller Barlow Ridge Thunderbolt 5 è sempre limitato alle velocità PCIe 4.0 x4, quindi la larghezza di banda totale non può superare gli 8 GB/s, anche quando entrambe le porte vengono utilizzate contemporaneamente. Abbiamo effettuato un test con due SSD esterni OWC Envoy Ultra: un'unità è sempre risultata più veloce dell'altra, ma l'ampiezza di banda totale è rimasta intorno agli 8 GB/s. Sembra che la nuova piattaforma Lunar Lake non risolva questo problema.
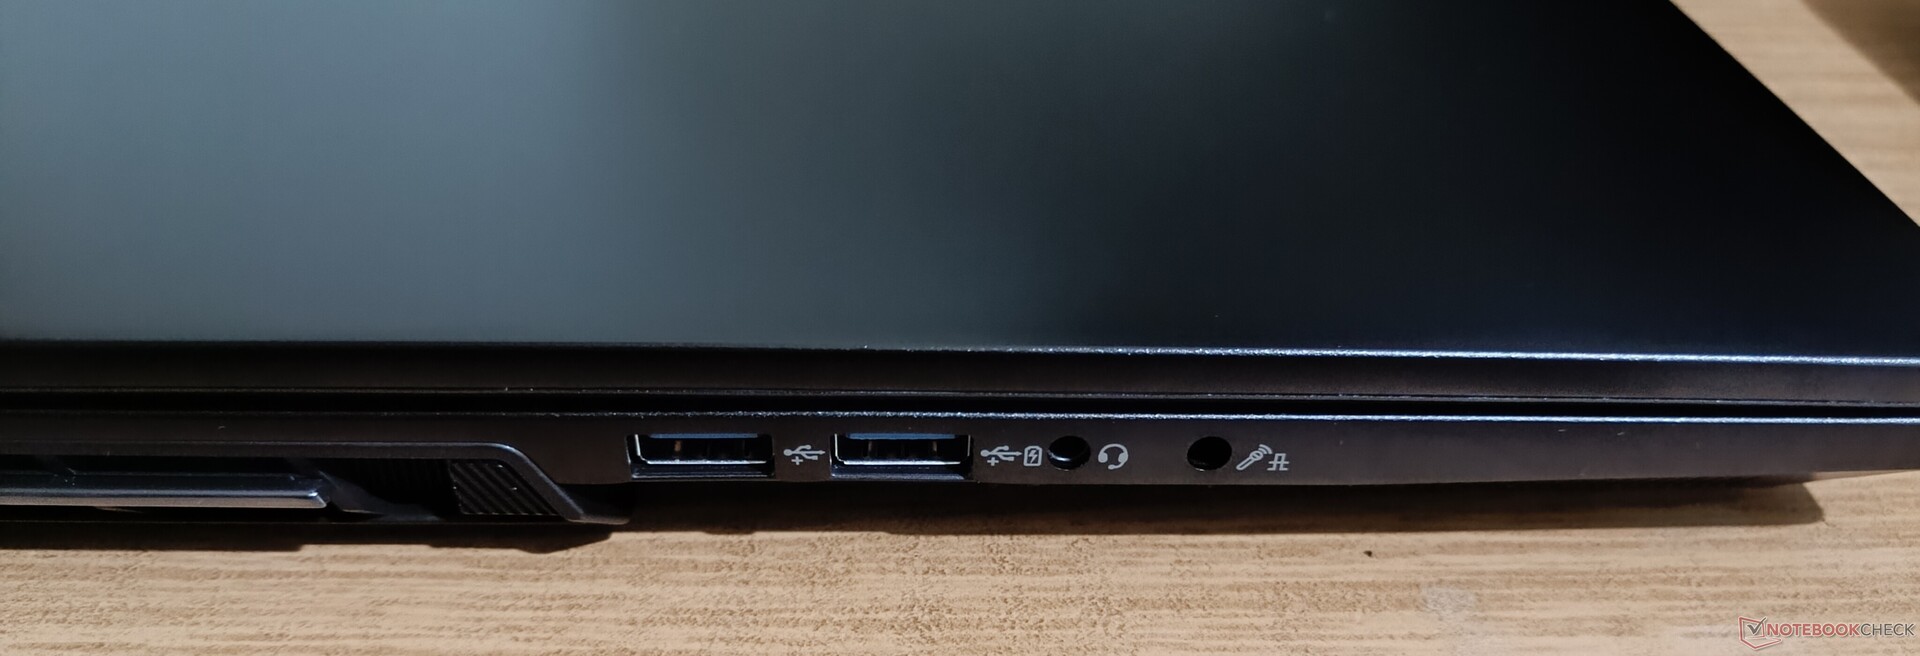
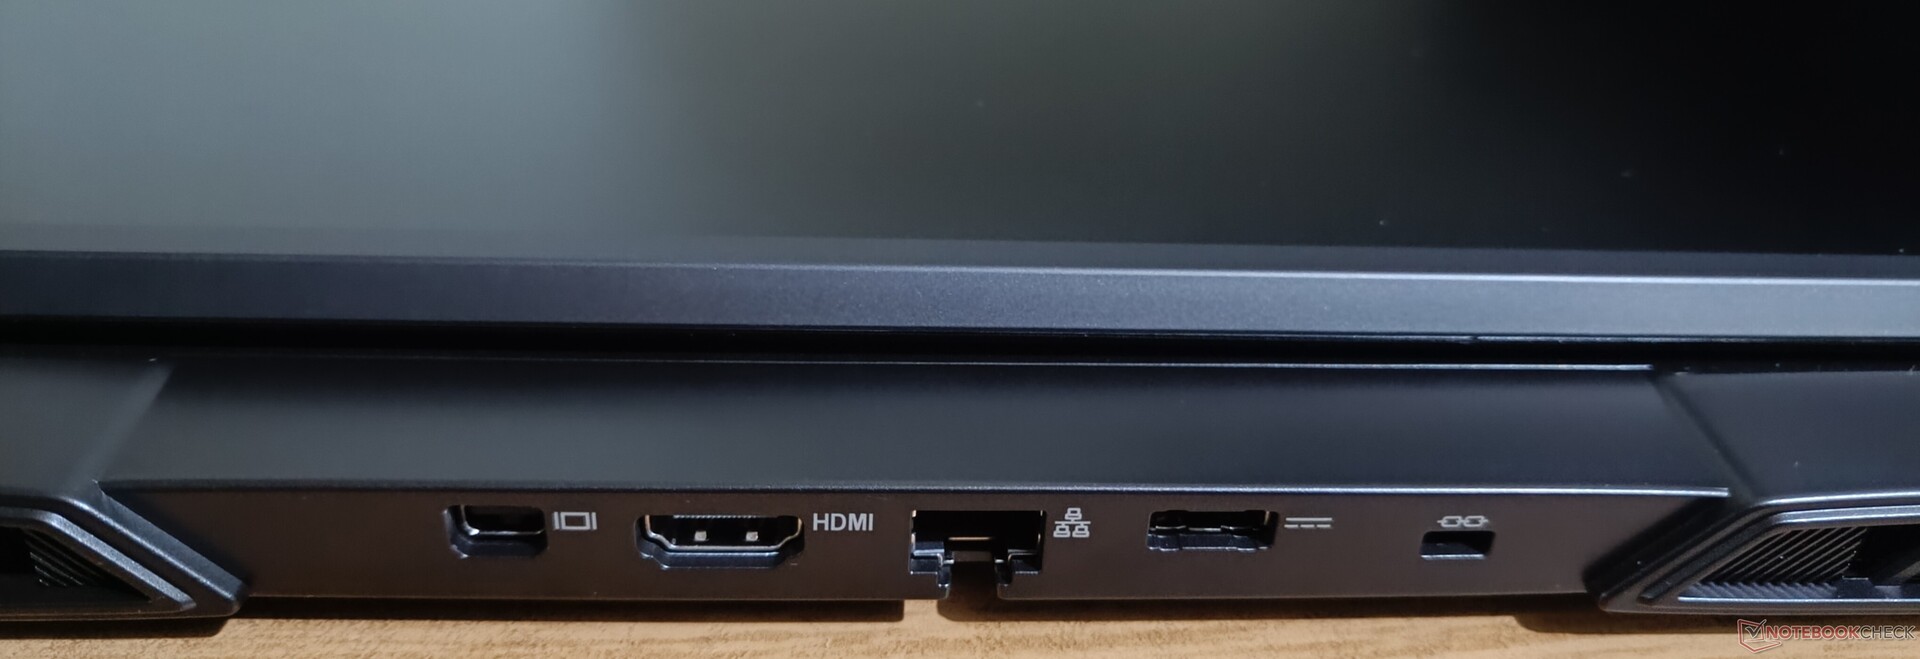
Tuttavia, la doppia larghezza di banda da 80 Gbps può essere sfruttata al meglio con le unità SSD esterne PCIe 5.0. Sul lato sinistro, ci sono due porte USB-A 3.2 Gen 2 (solo una con erogazione di energia), oltre a jack audio mic-in o S/PDIF ottico e uscita cuffie. La parte posteriore comprende un connettore di alimentazione, un jack LAN e un'uscita video HDMI 2.1 a larghezza di banda completa e mini DisplayPort 1.4a.
La connettività Internet è veloce, con la connessione 5G che raggiunge 900+ Mb/s, mentre le velocità 6G sono tra le più elevate che abbiamo testato, con un massimo di 1,7 Gb/s in modalità ricevitore.


 GeForce RTX 4090 Laptop GPU, i9-14900HX, Samsung 990 Pro 1 TB")
 GeForce RTX 4090 Laptop GPU, i9-14900HX, Samsung 990 Pro 1 TB")
Dispositivi di ingresso
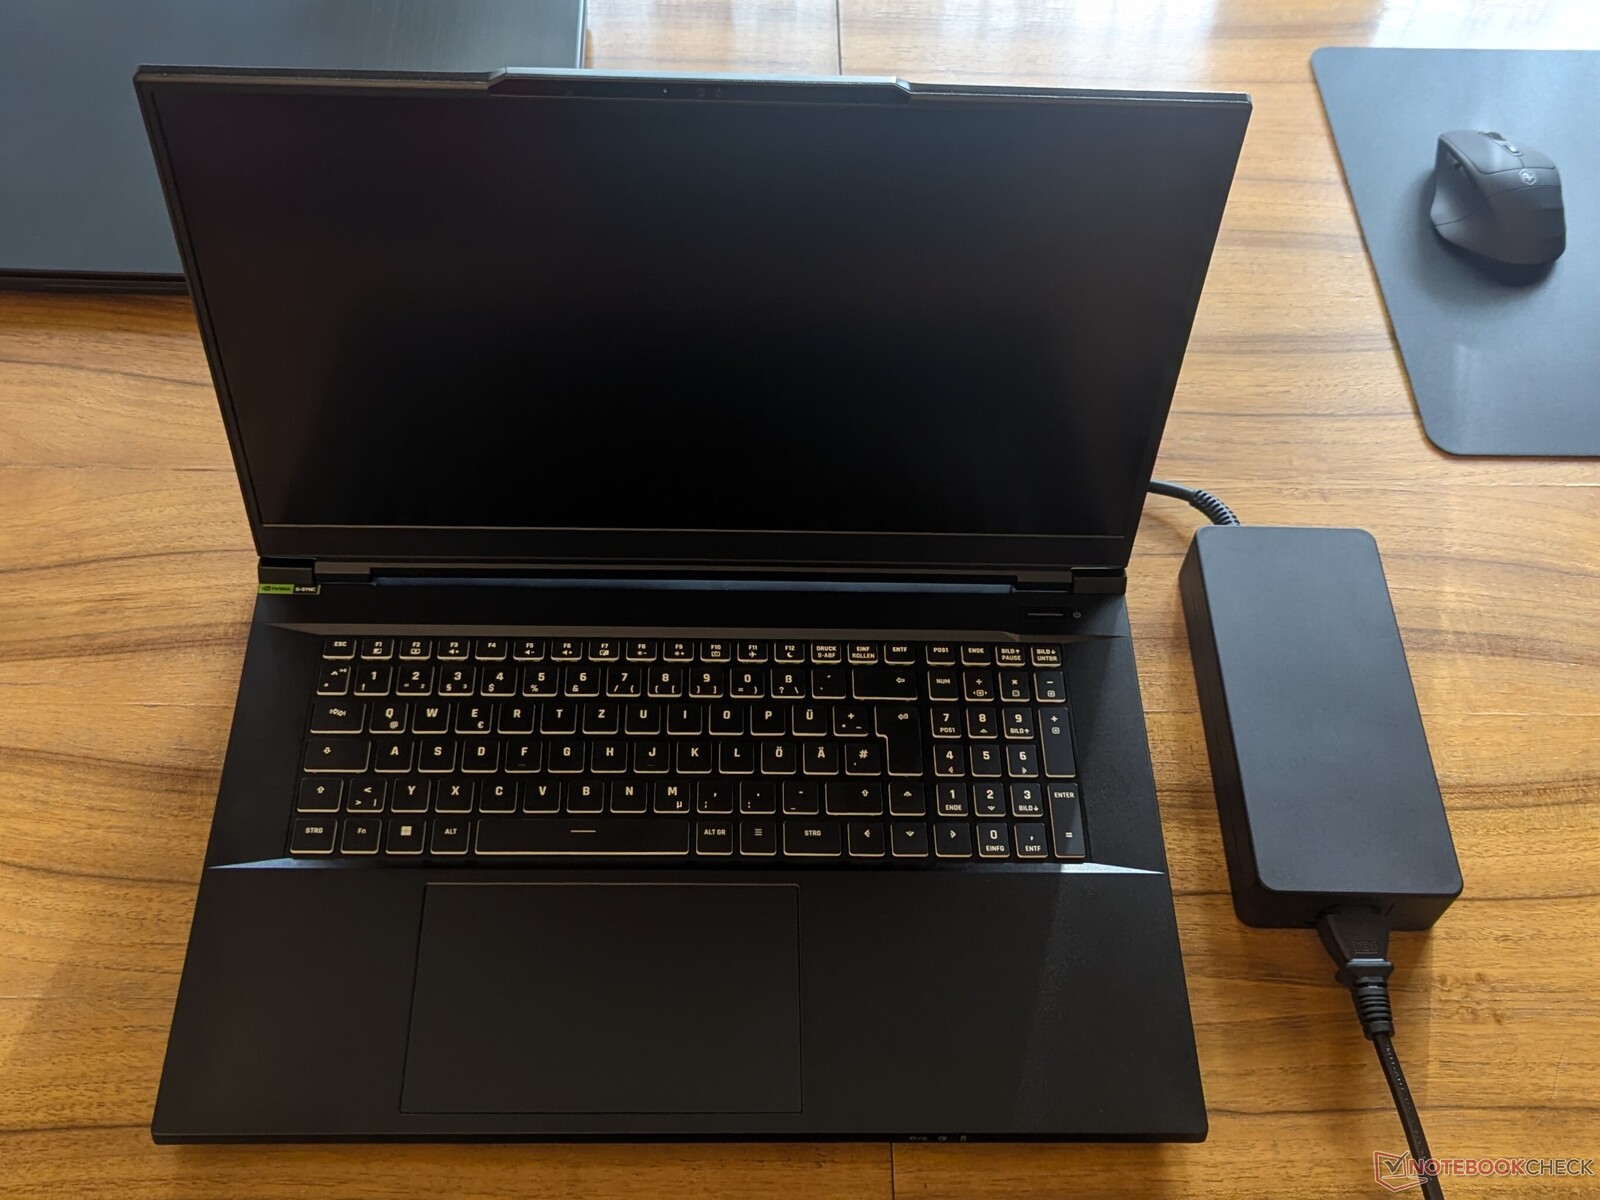
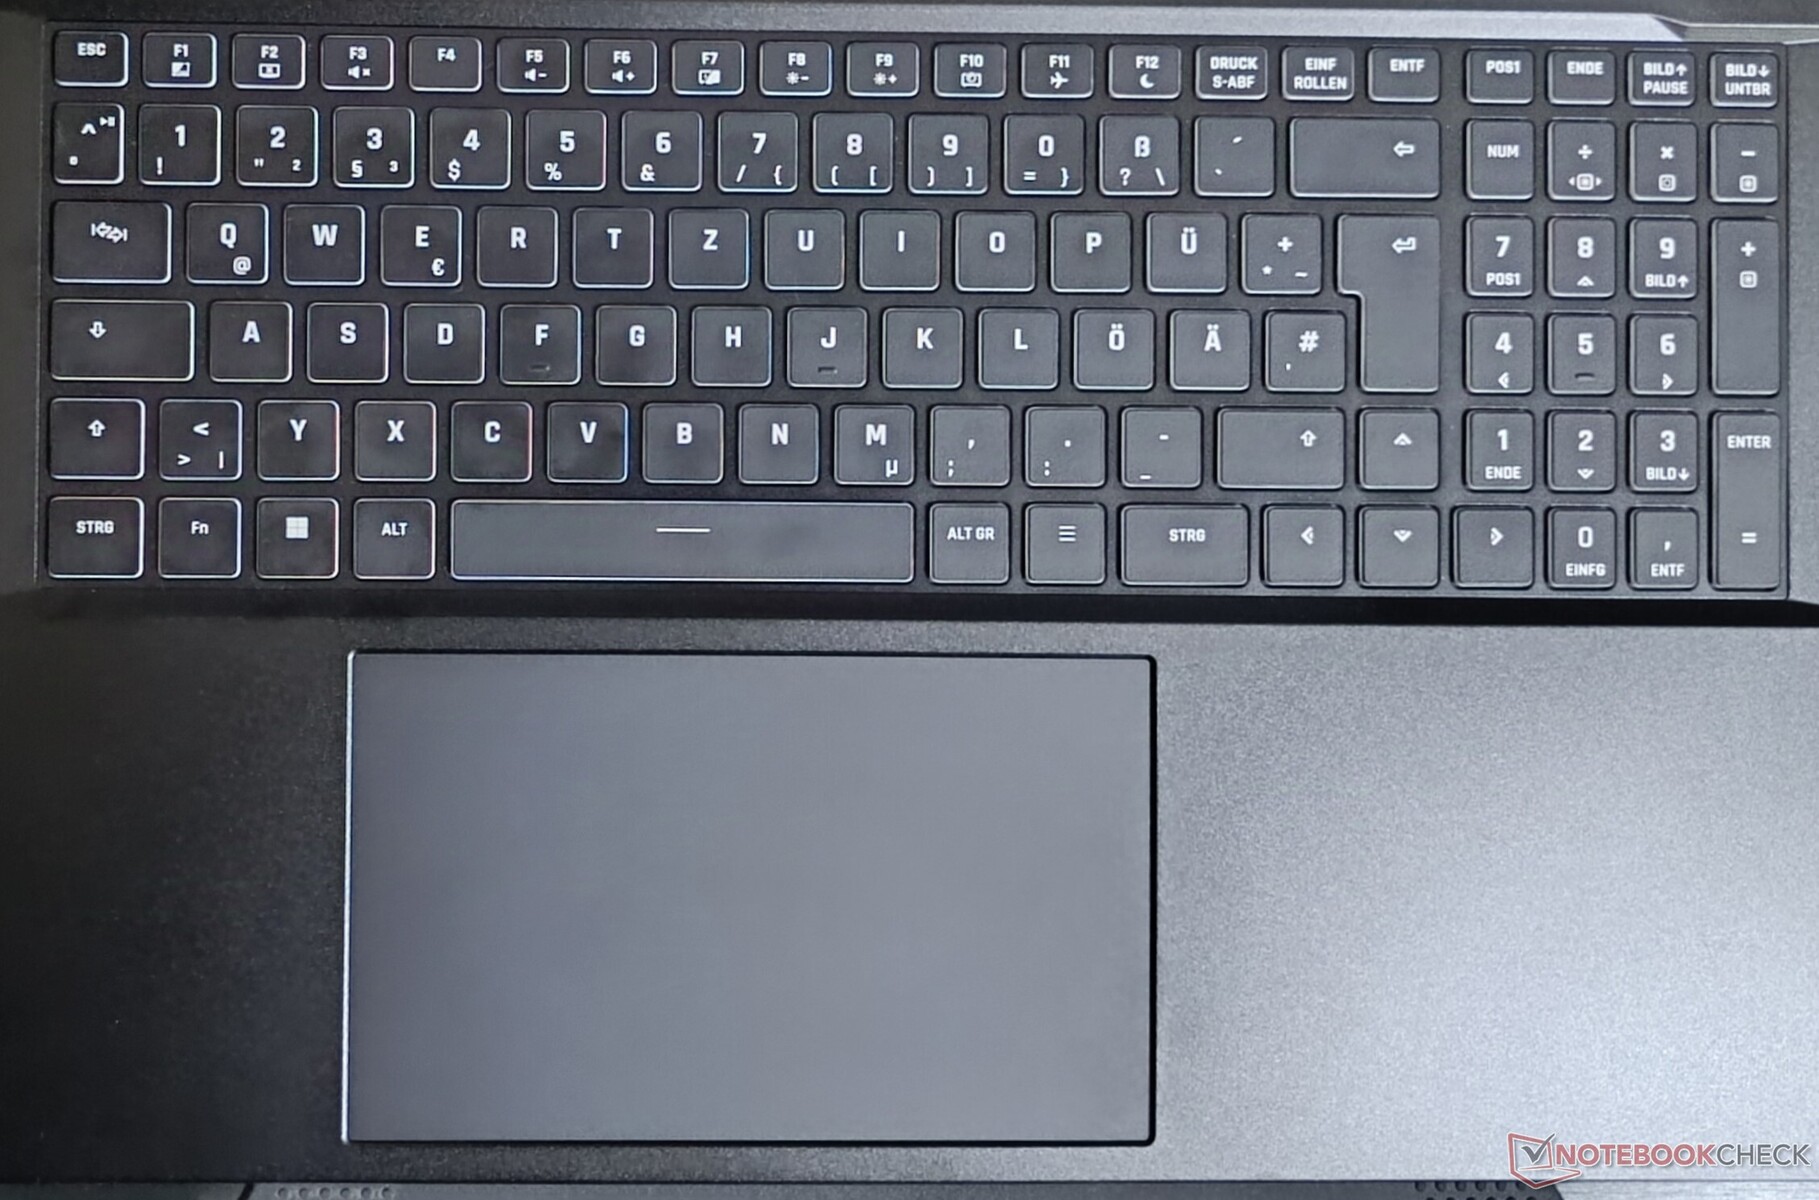
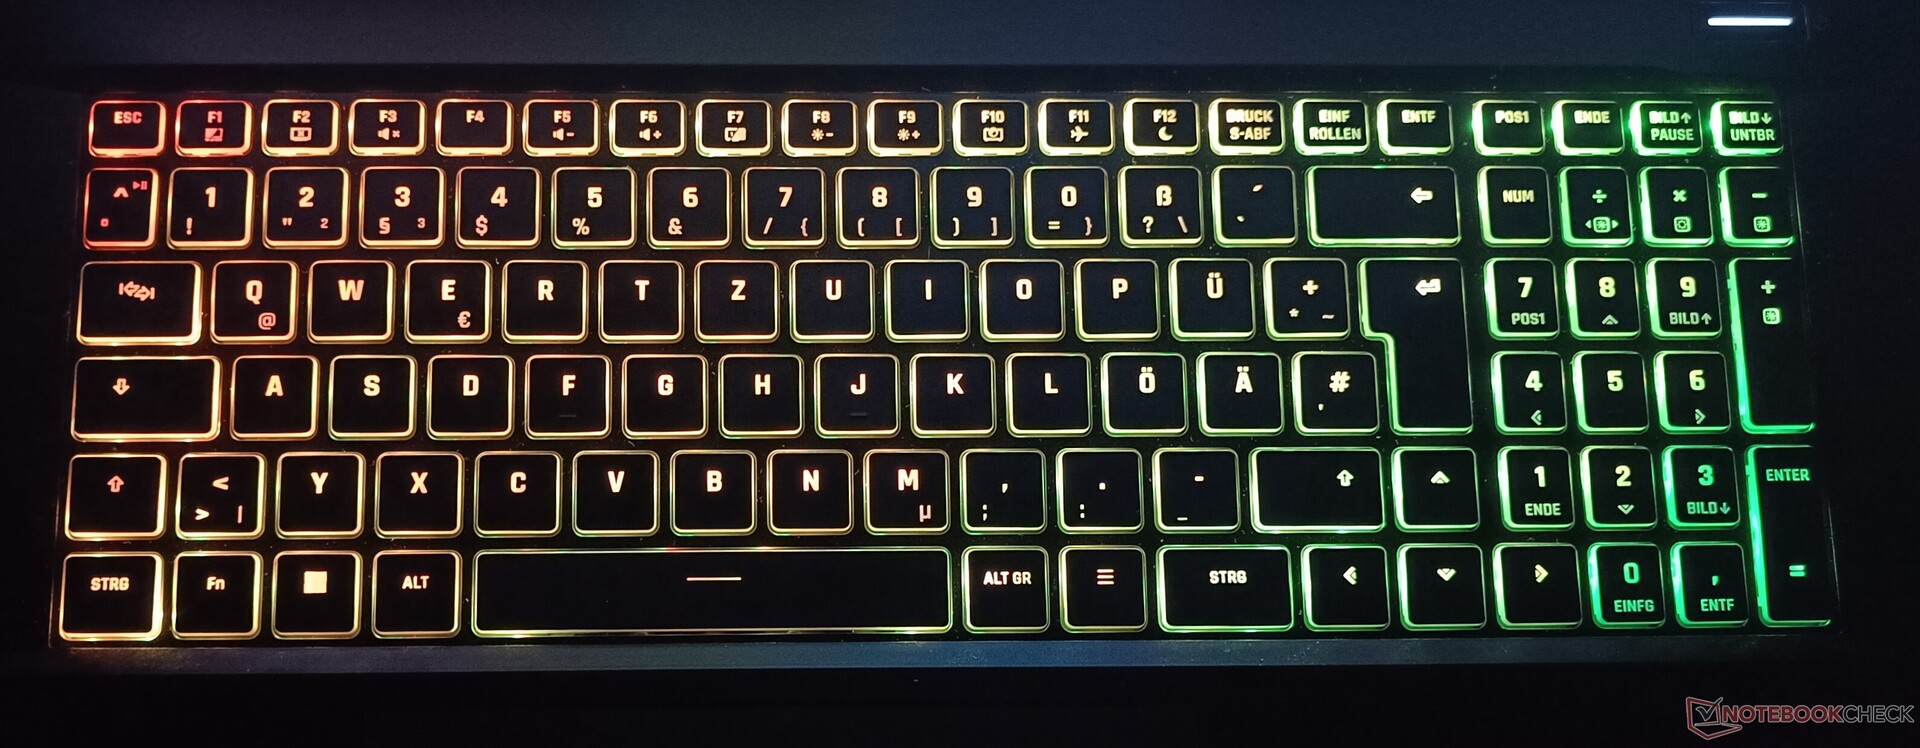
Trattandosi di un portatile da 17 pollici, include una tastiera full-size con tastierino numerico e tasti freccia. Il meccanismo chiclet consente una corsa media, che offre un'esperienza di digitazione abbastanza confortevole. Il modello testato è stato fornito con il layout tedesco, ma Schenker offre altri layout europei e quello statunitense IT predefinito. I tasti hanno un'illuminazione RGB per-pixel che può essere personalizzata nell'applicazione speciale Control Center.
Il touchpad è sufficientemente grande (150 x 90 mm) e si sente liscio come la seta grazie a una superficie innovativa che migliora lo scorrimento. Inoltre, è dotato di riconoscimento del palmo della mano che aiuta a prevenire gli input accidentali quando si appoggiano i lati inferiori dei palmi sul touchpad.
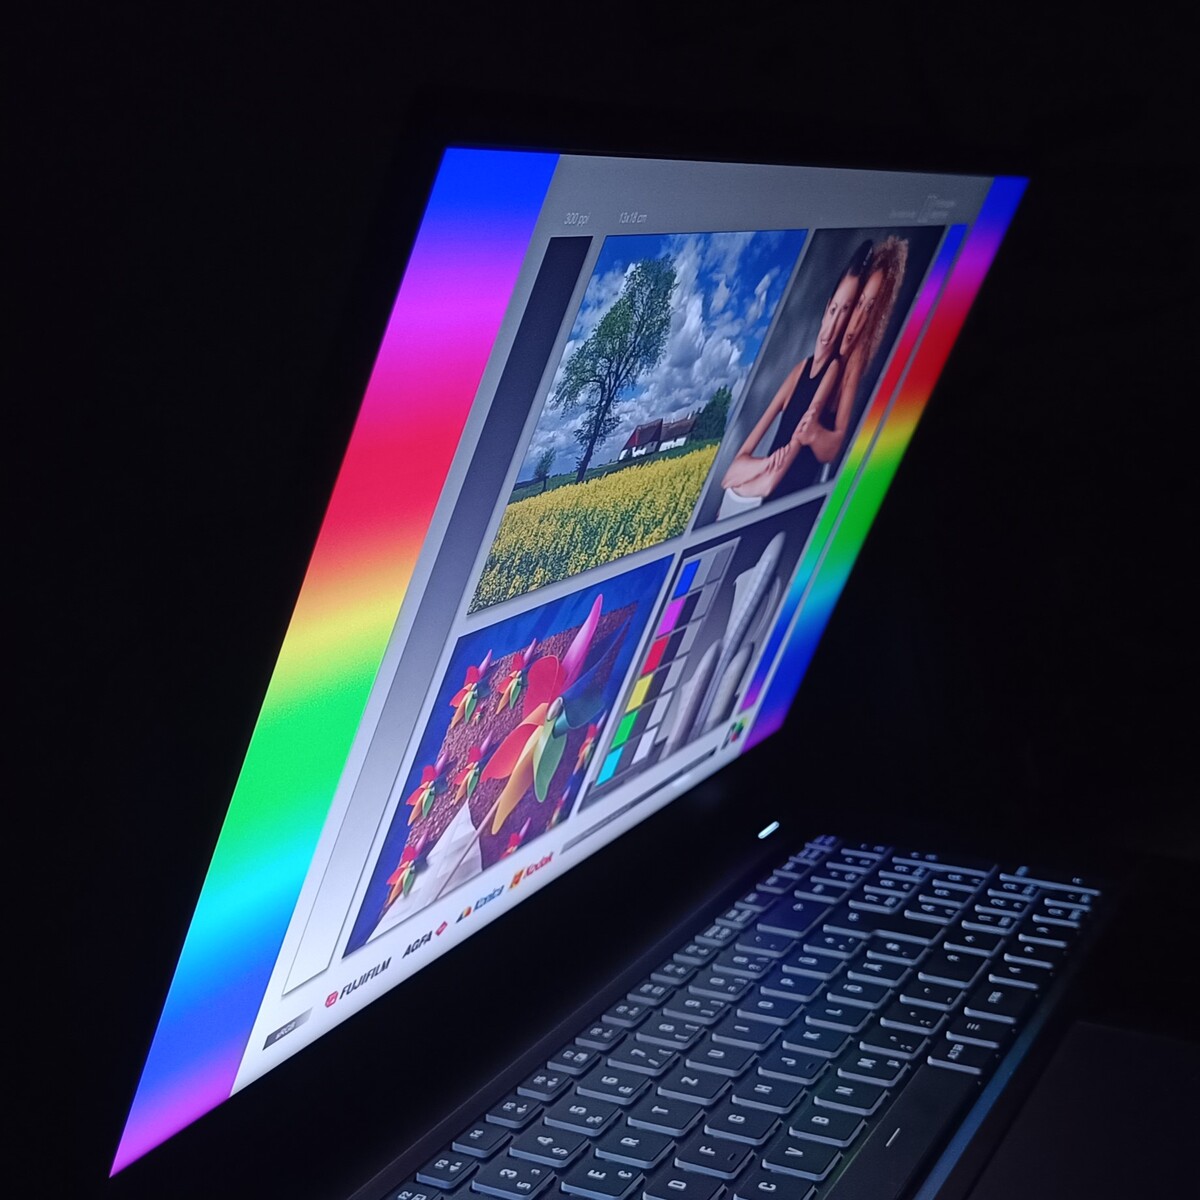
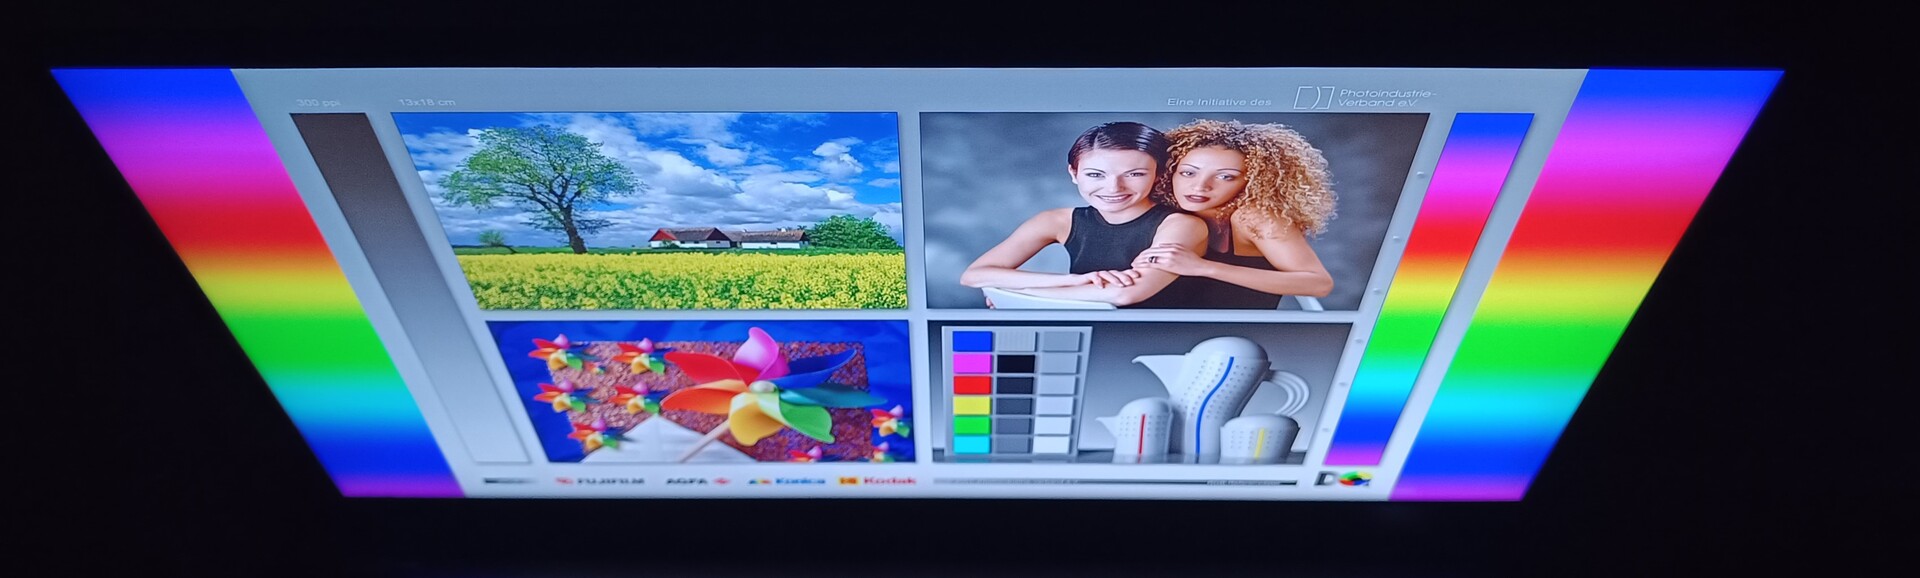
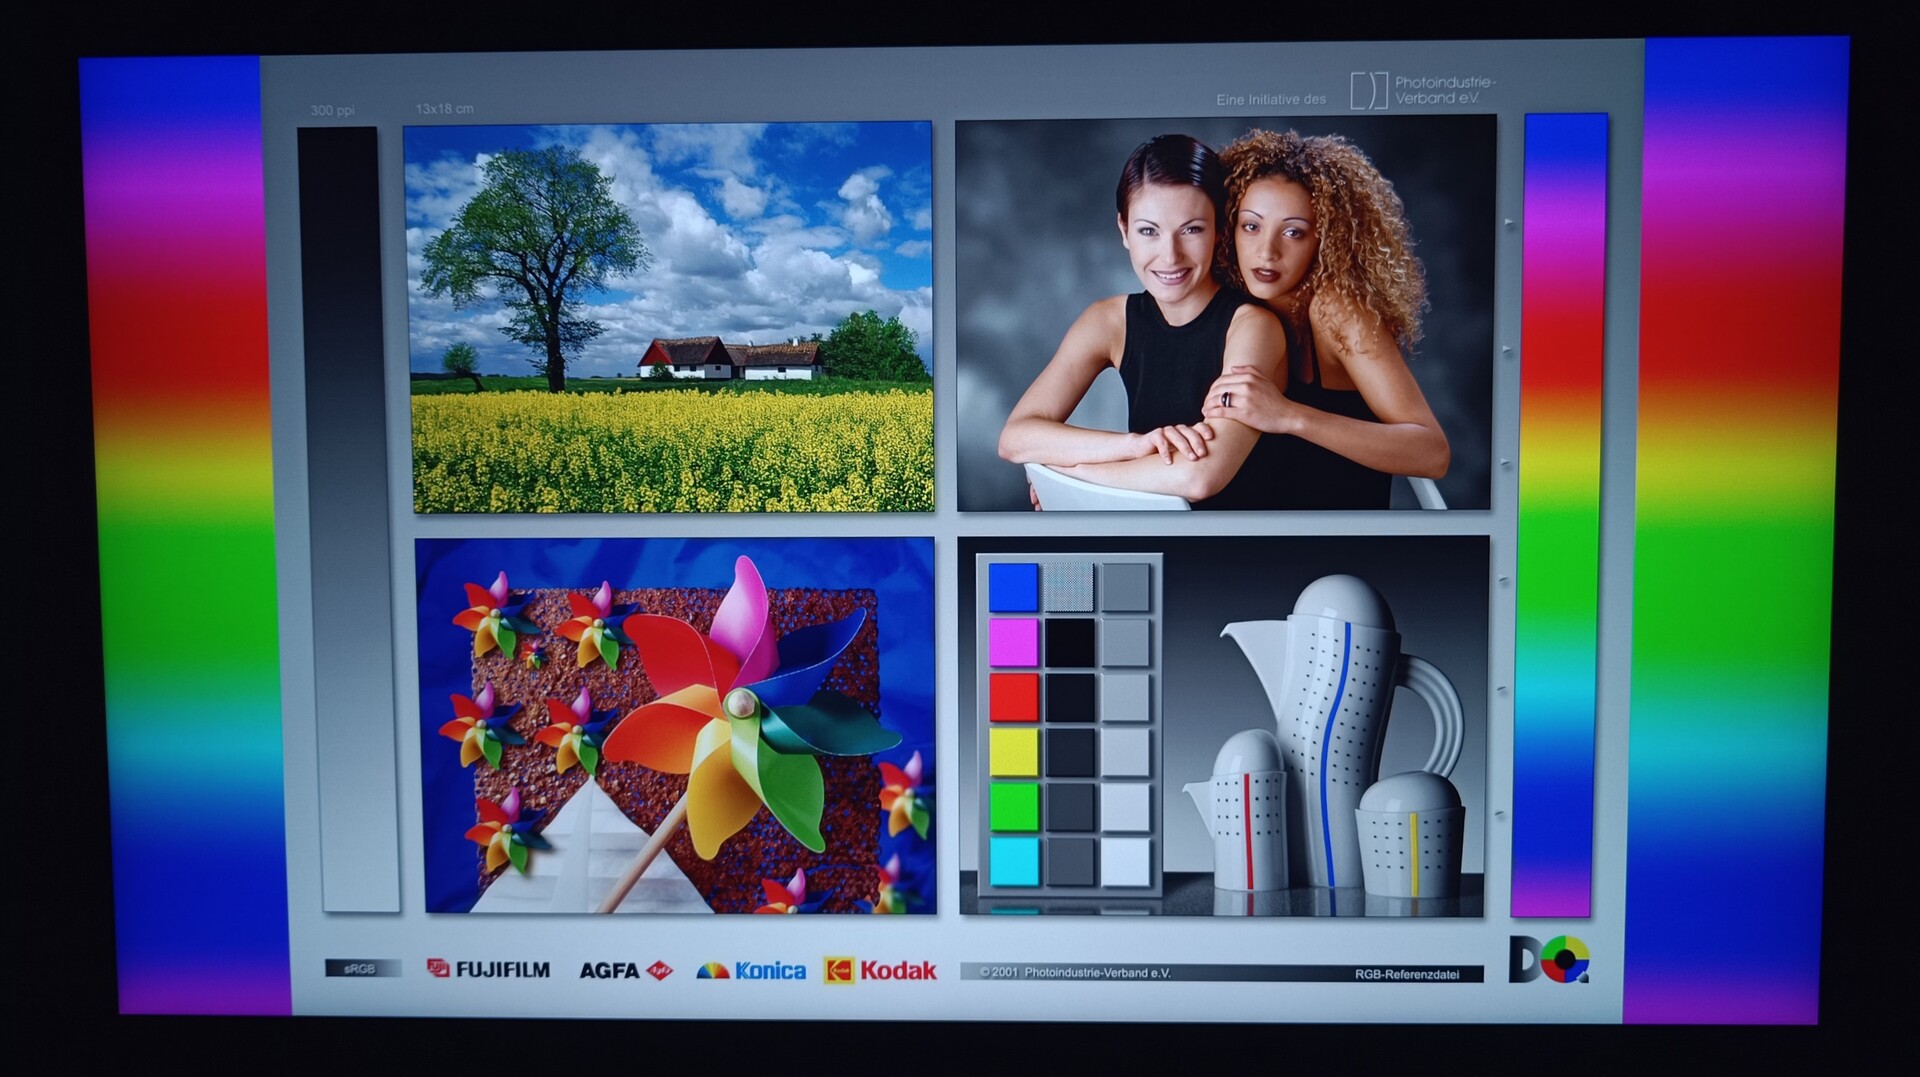
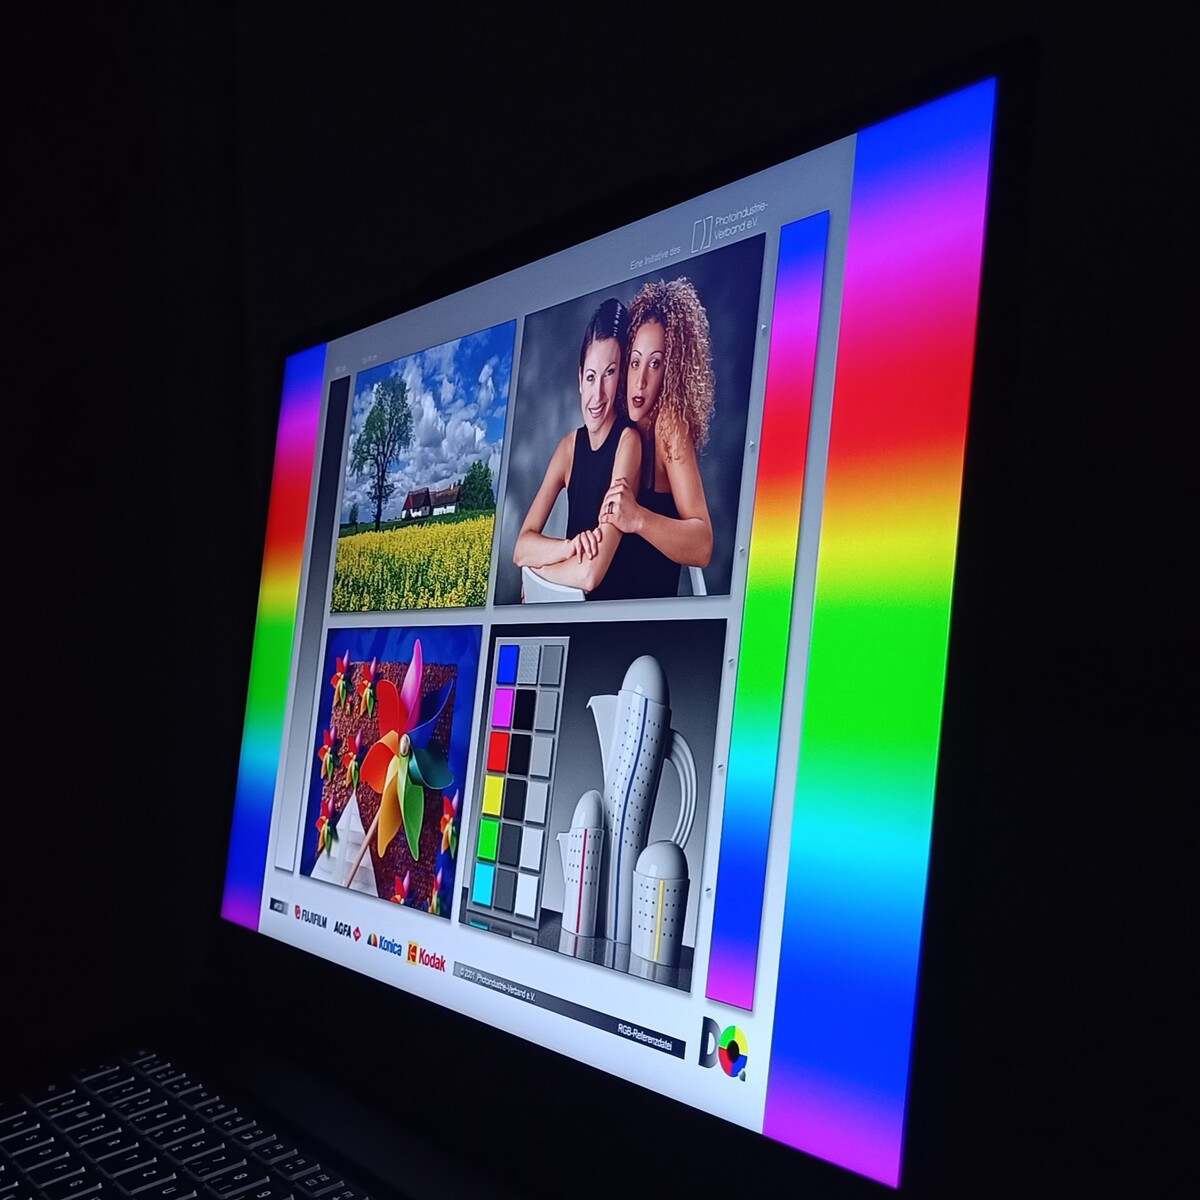
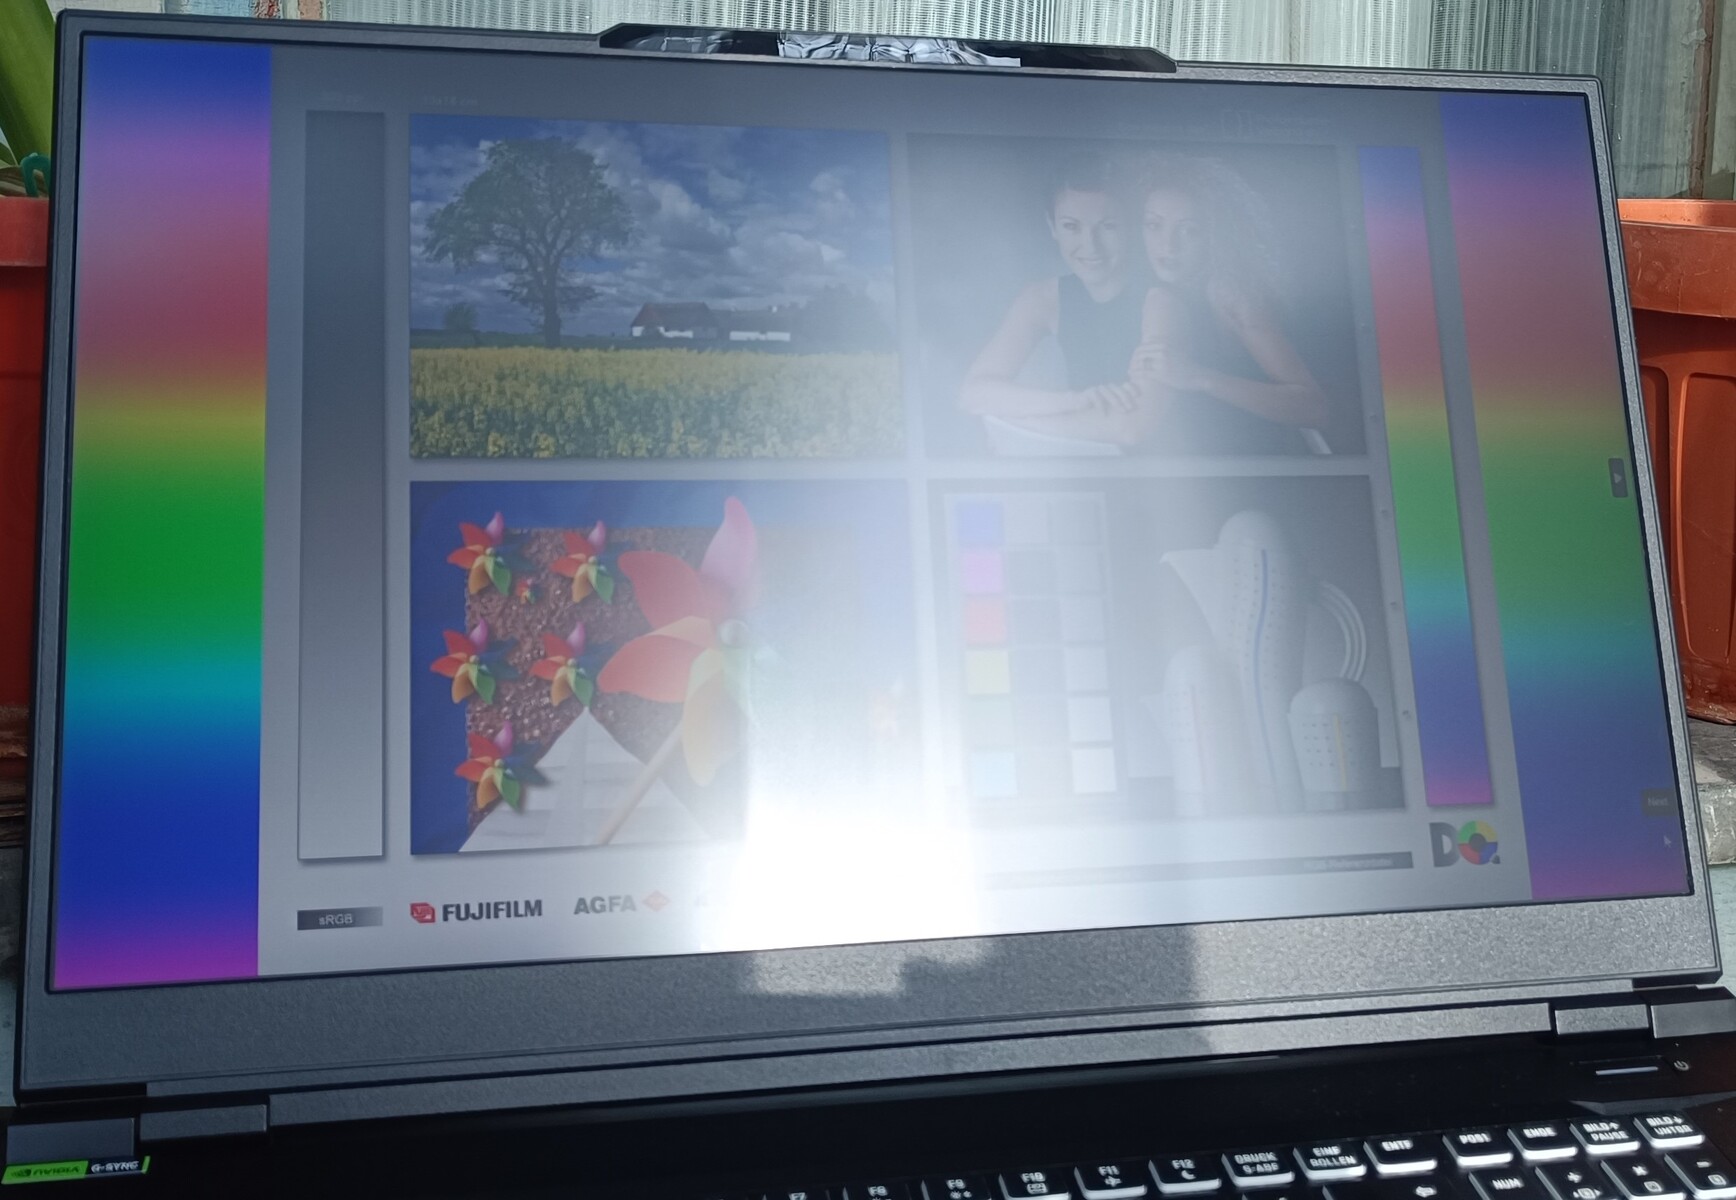
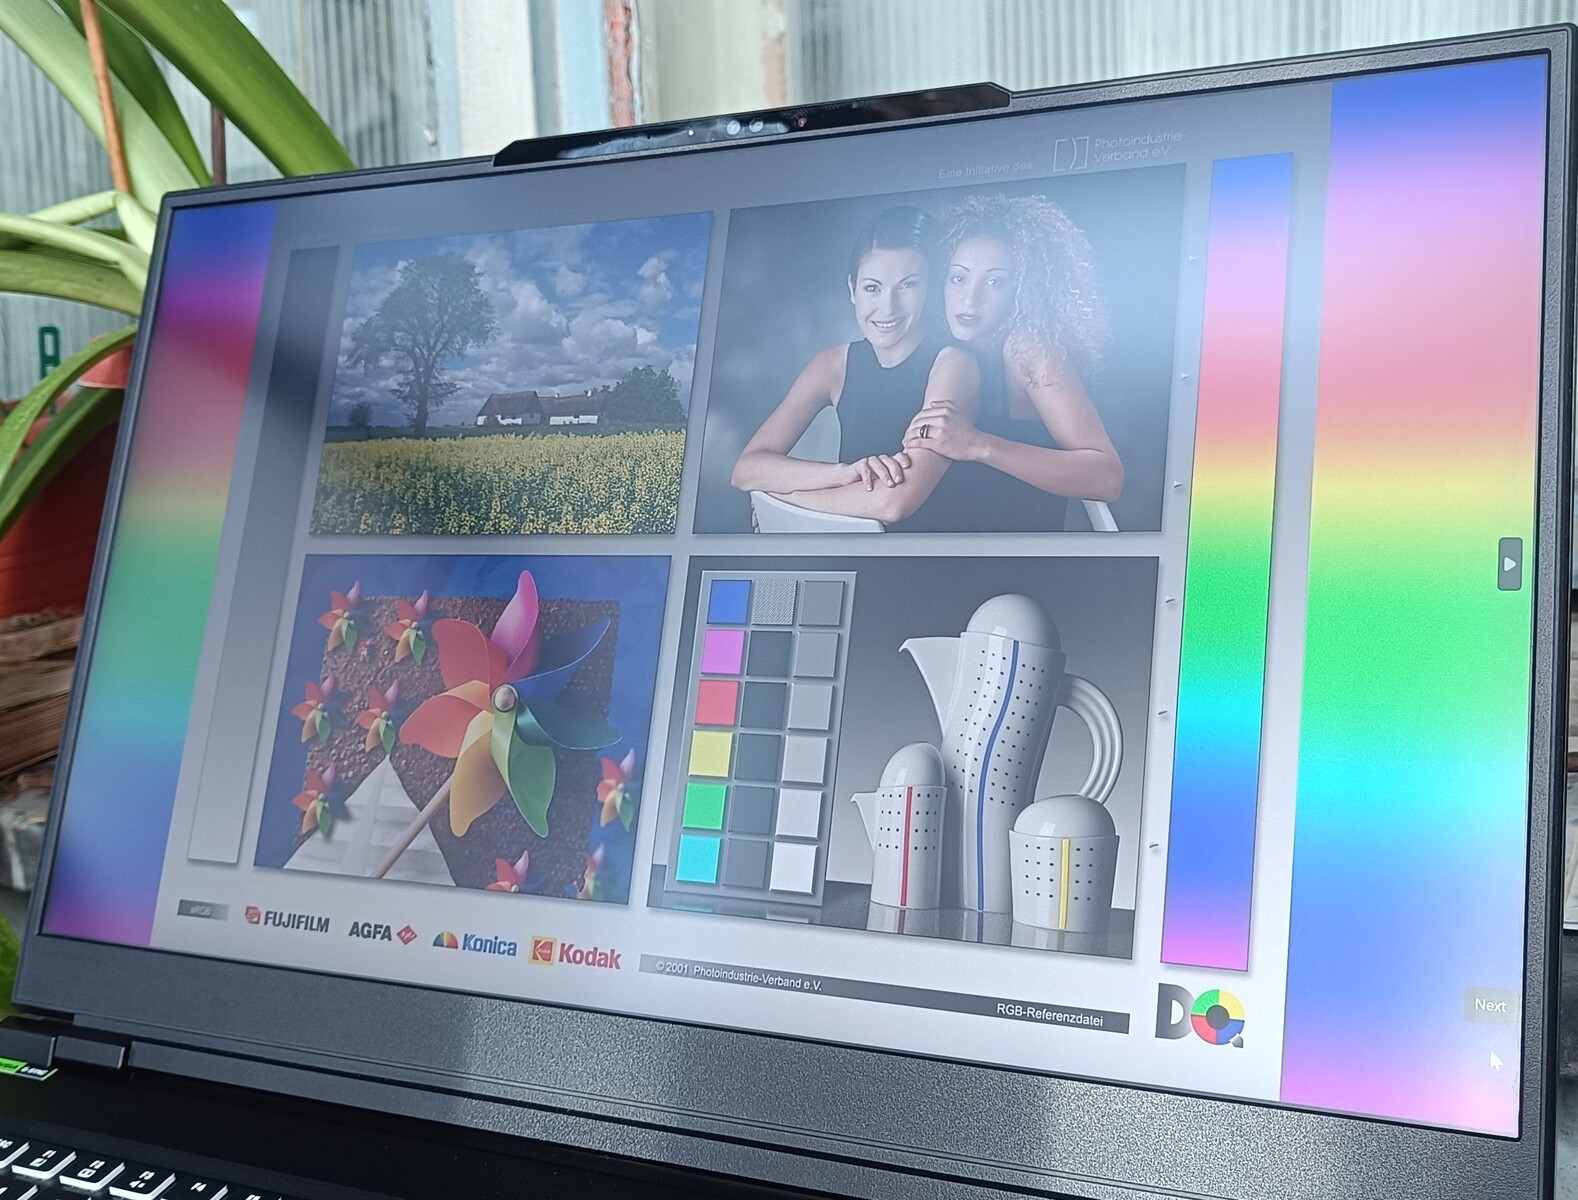
Display
L'unità testata è dotata di uno schermo LCD IPS 3840 X 2160 prodotto da BOE. Ha un aggiornamento massimo di 144 Hz e supporta G-SYNC. Esiste anche una variante 2560 X 1440 240 Hz 300 nit.
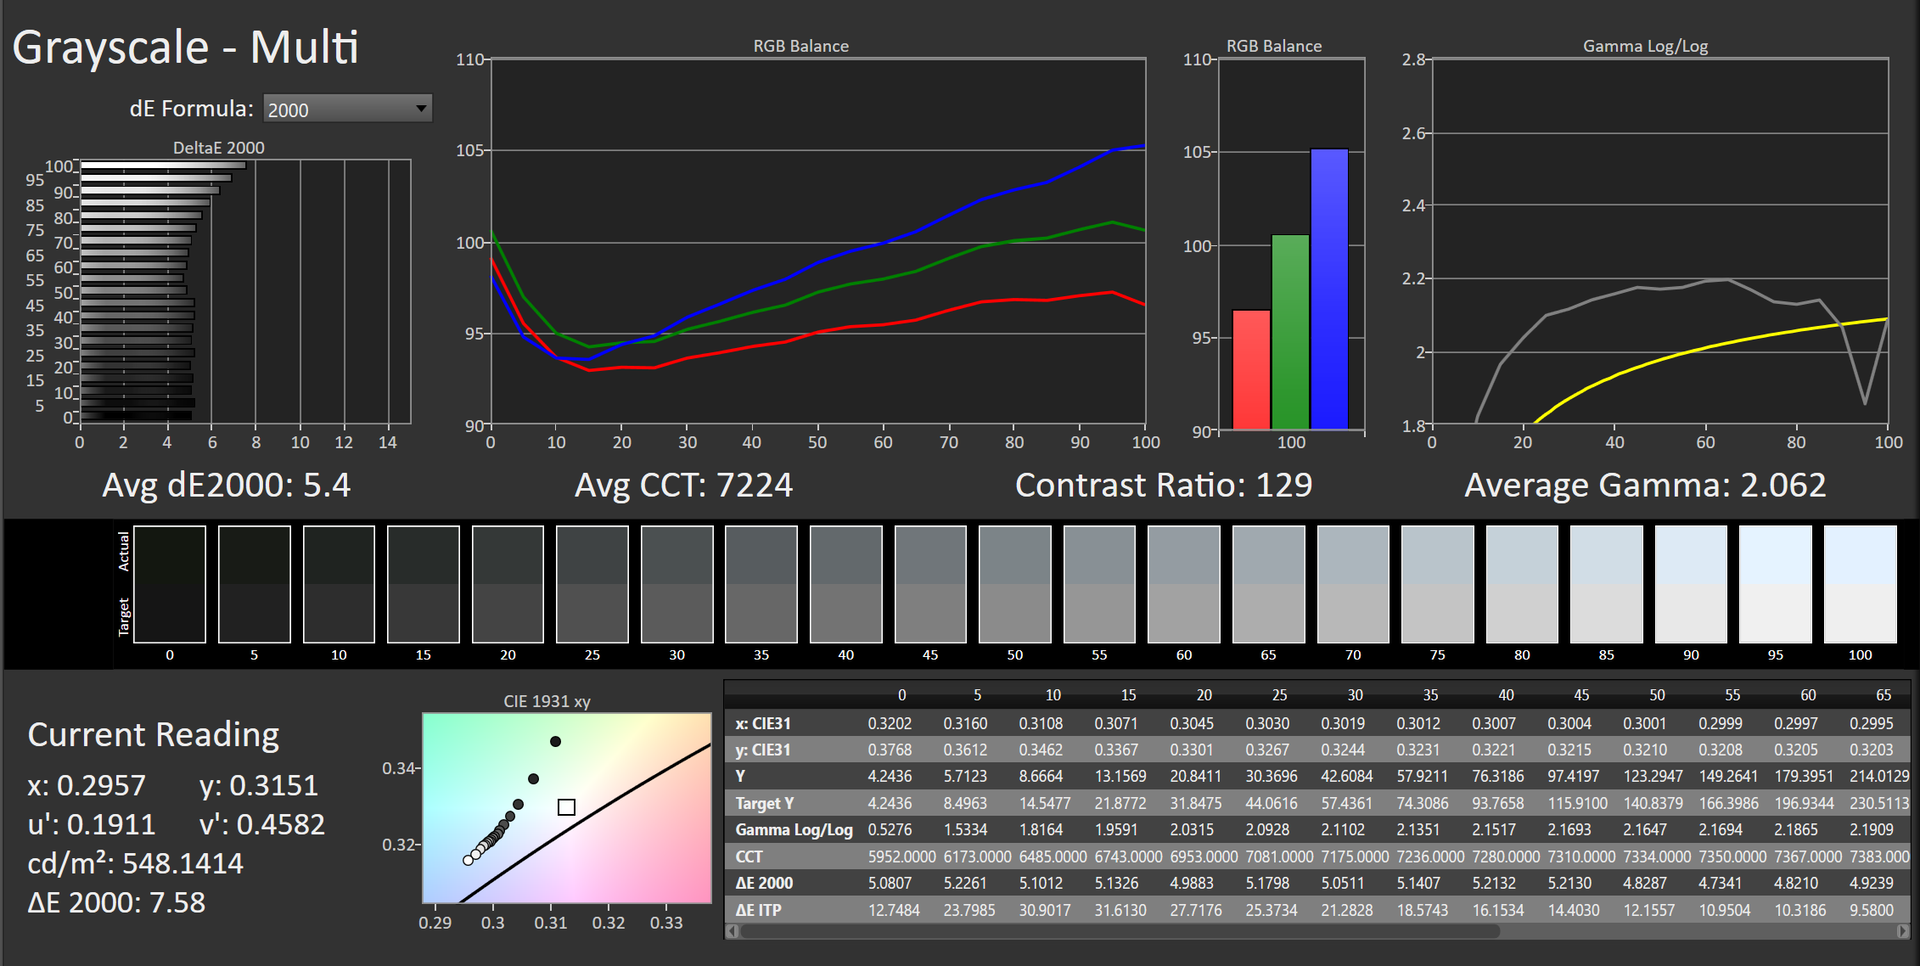
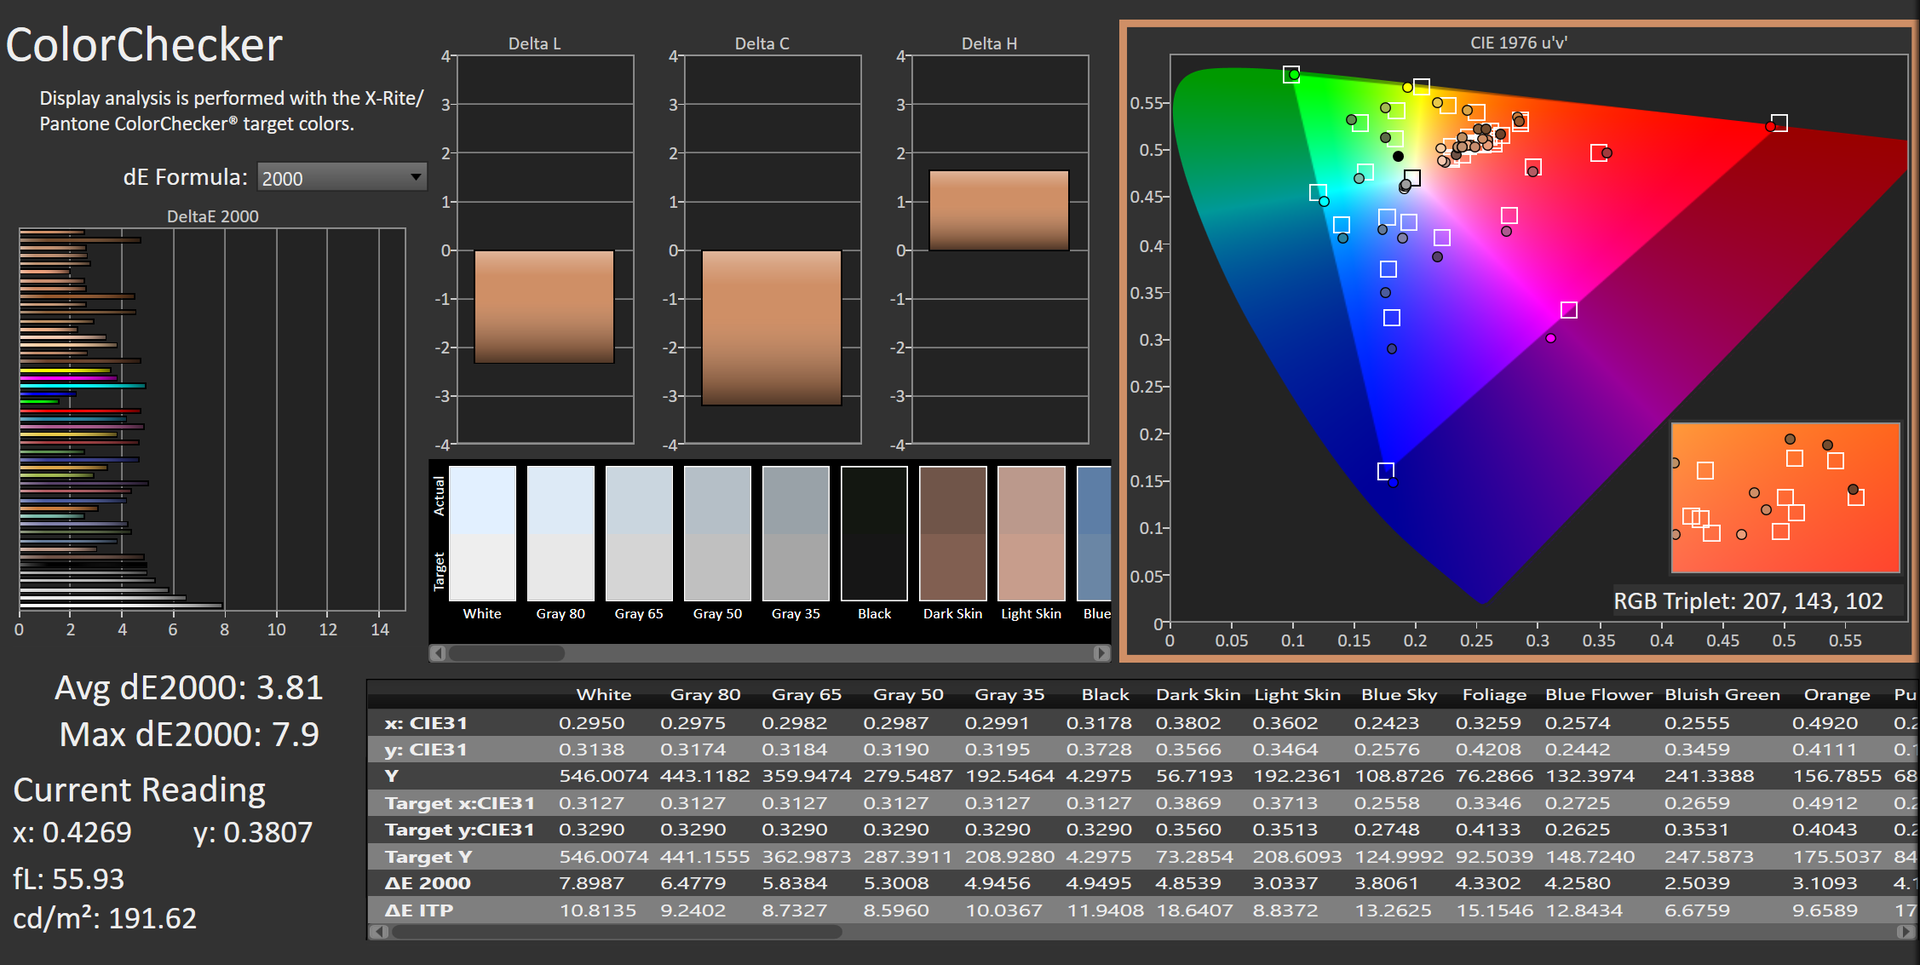
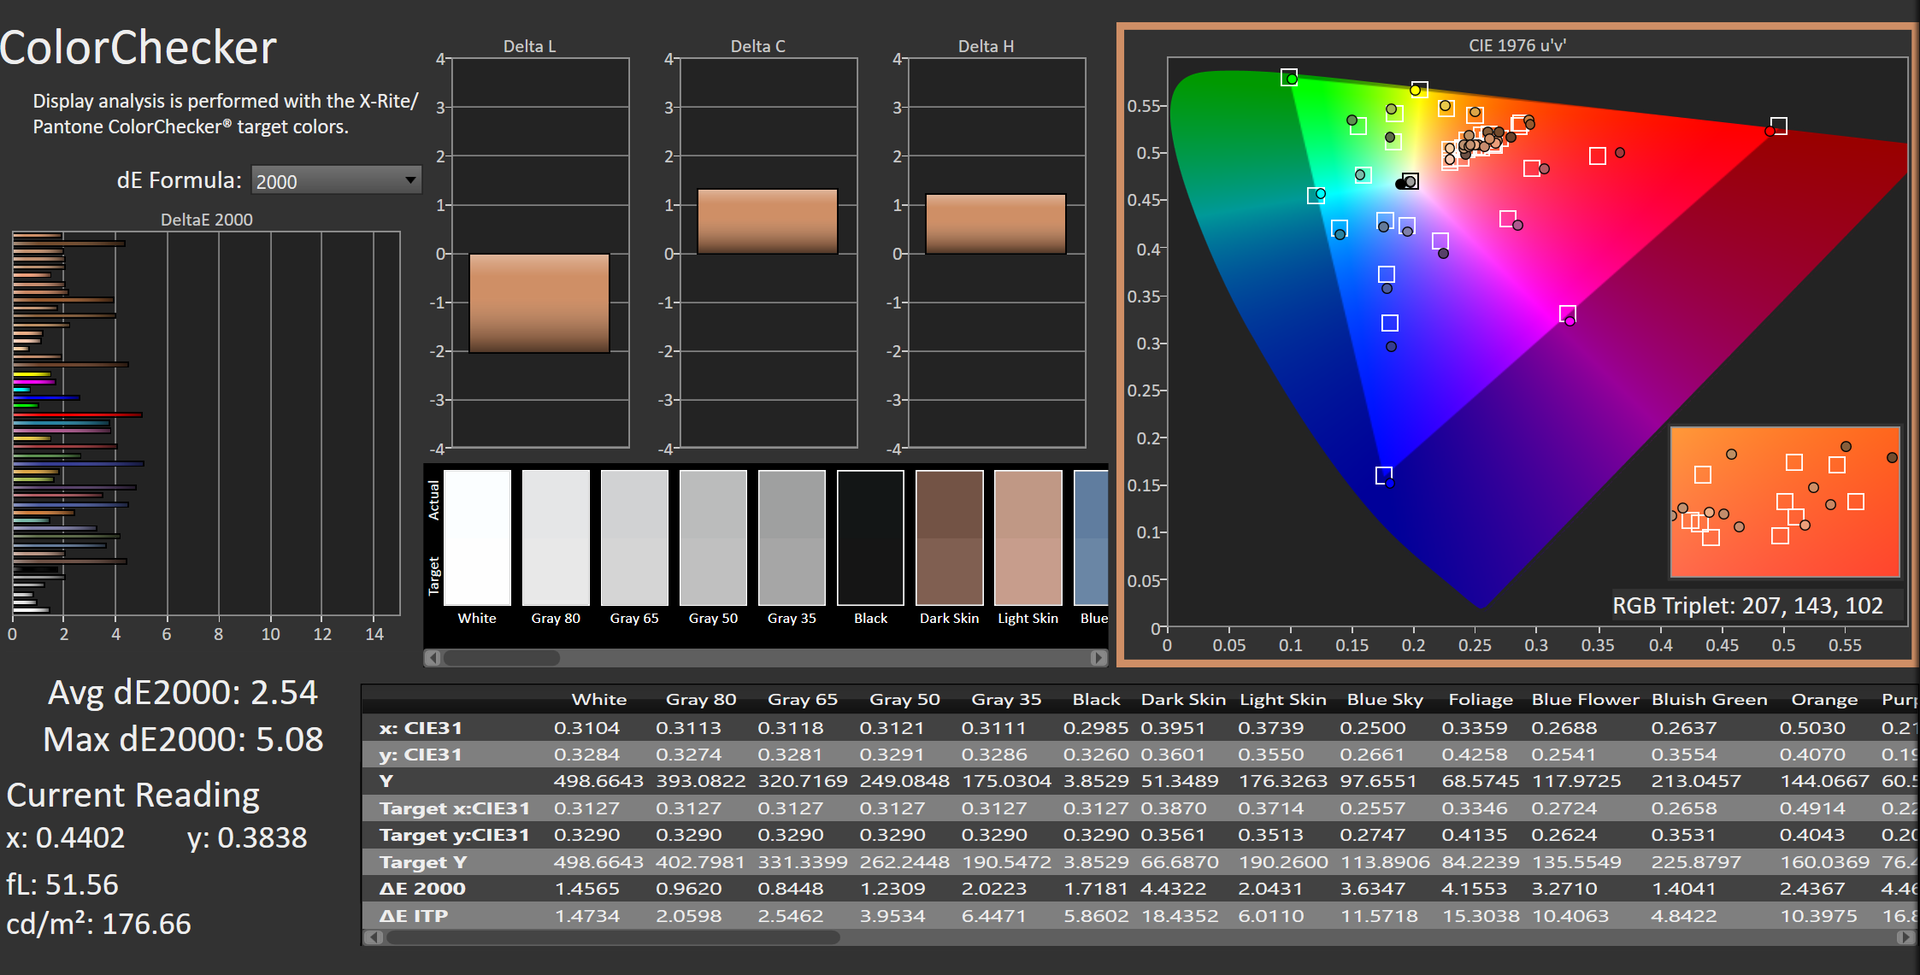
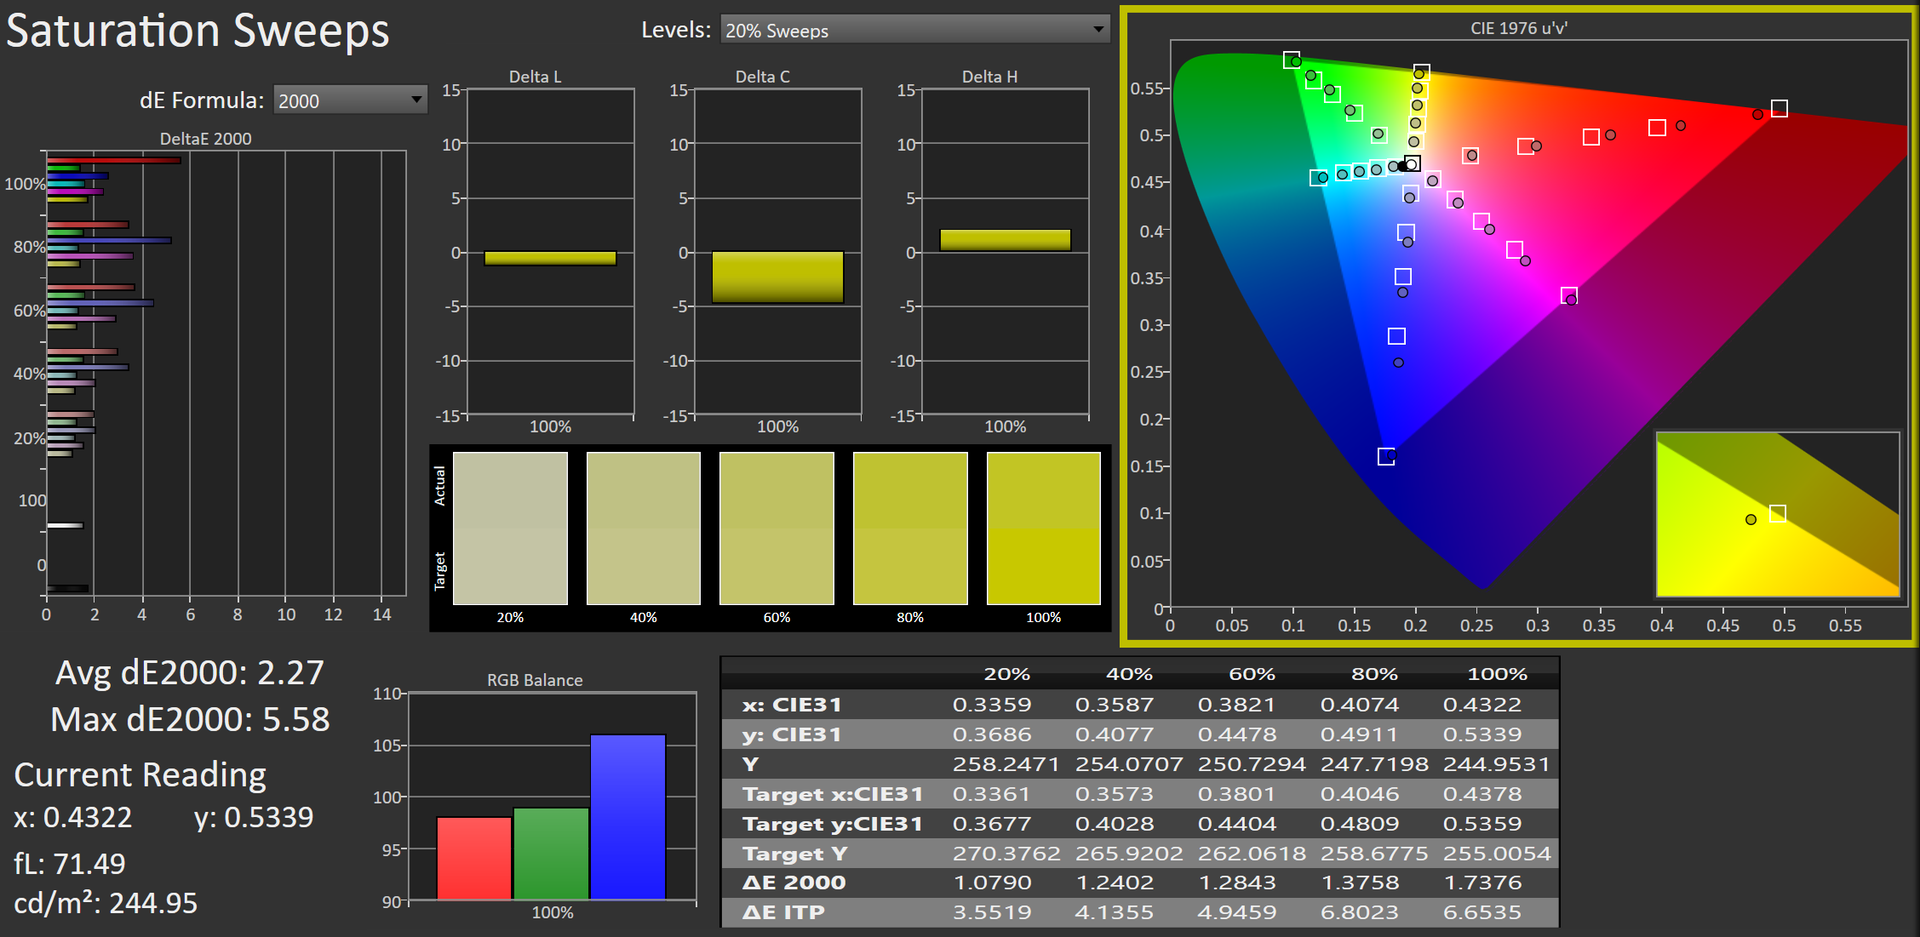
la riproduzione dei colori sRGB è effettivamente del 99% come pubblicizzato, ma il gamut DCI-P3 è del 93% invece del 99% pubblicizzato. A causa del rivestimento non lucido, il contrasto soffre un po', con livelli di nero leggermente elevati di 0,54 cd/m². Tuttavia, lo schermo più luminoso compensa il contrasto inferiore. L'accuratezza dei colori è un po' scarsa e siamo riusciti a ridurre il dE a 2,54 da 3,81 sul gamut DCI-P3.
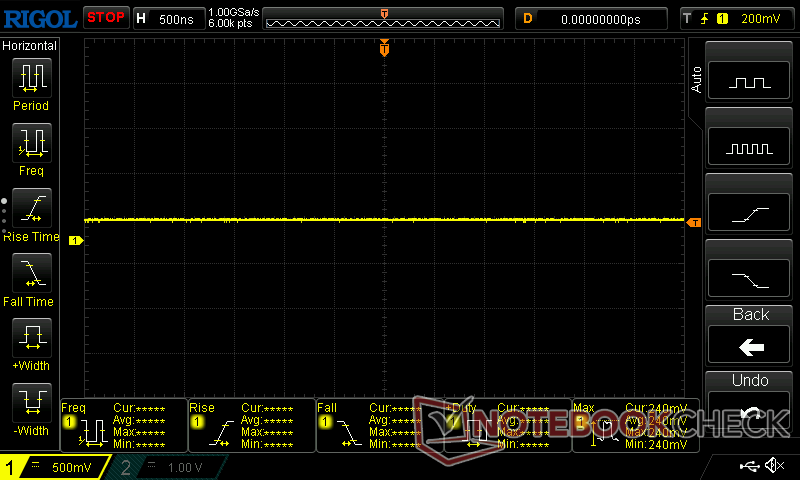
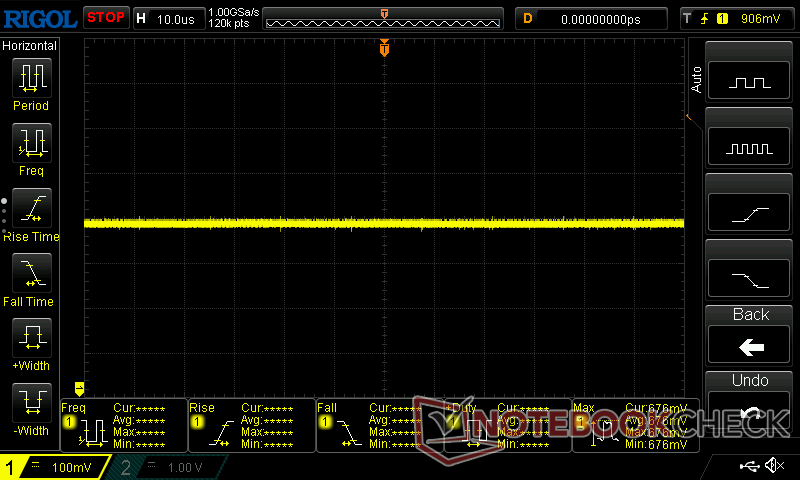
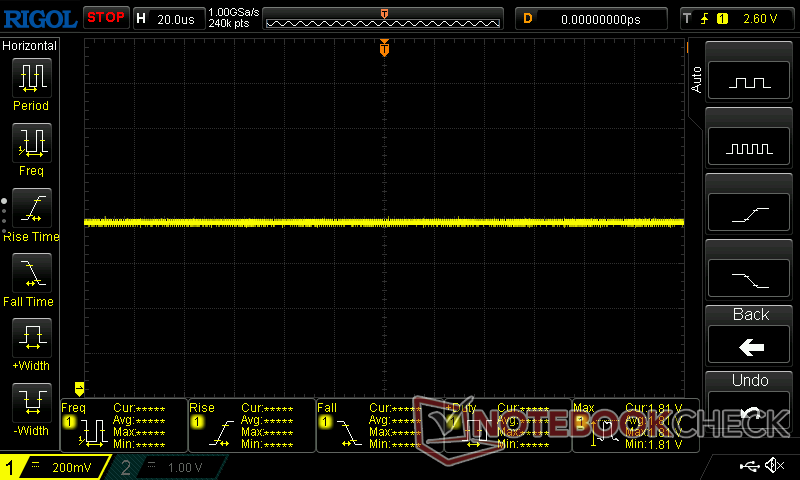
I tempi di risposta sono buoni per l'uso generale e la creazione di contenuti, ma potrebbero rivelarsi leggermente lenti per i giochi di tiro più veloci, con 11,6 ms. Non sono stati rilevati PWM o sfarfallio dello schermo.
| |||||||||||||||||||||||||
Distribuzione della luminosità: 86 %
Al centro con la batteria: 555 cd/m²
Contrasto: 1015:1 (Nero: 0.54 cd/m²)
ΔE ColorChecker Calman: 3.81 | ∀{0.5-29.43 Ø4.71}
calibrated: 2.54
ΔE Greyscale Calman: 5.4 | ∀{0.09-98 Ø4.96}
84.33% AdobeRGB 1998 (Argyll 3D)
99.86% sRGB (Argyll 3D)
93.51% Display P3 (Argyll 3D)
Gamma: 2.062
CCT: 7224 K
| Schenker Key 17 Pro (M24) BOE, IPS, 3840x2160, 17.3", 144 Hz | Eurocom Raptor X17 Core i9-14900HX BOE CQ NE173QUM-NY1, IPS, 3840x2160, 17.3", 144 Hz | HP ZBook Fury 16 G11 AUO87A8, IPS, 3840x2400, 16", 120 Hz | Aorus 17X AZF BOE09F9, IPS, 2560x1440, 17.3", 240 Hz | |
|---|---|---|---|---|
| Display | 1% | 2% | 1% | |
| Display P3 Coverage (%) | 93.51 | 95.9 3% | 98.4 5% | 96.7 3% |
| sRGB Coverage (%) | 99.86 | 99.8 0% | 99.9 0% | 99.9 0% |
| AdobeRGB 1998 Coverage (%) | 84.33 | 84.2 0% | 86 2% | 84.5 0% |
| Response Times | -59% | -19% | -45% | |
| Response Time Grey 50% / Grey 80% * (ms) | 11.593 ? | 14.8 ? -28% | 11.4 ? 2% | 14 ? -21% |
| Response Time Black / White * (ms) | 6 ? | 11.4 ? -90% | 8.4 ? -40% | 10.1 ? -68% |
| PWM Frequency (Hz) | ||||
| PWM Amplitude * (%) | ||||
| Screen | 12% | 18% | 14% | |
| Brightness middle (cd/m²) | 548 | 544.6 -1% | 457.6 -16% | 294 -46% |
| Brightness (cd/m²) | 505 | 507 0% | 466 -8% | 276 -45% |
| Brightness Distribution (%) | 86 | 77 -10% | 83 -3% | 90 5% |
| Black Level * (cd/m²) | 0.54 | 0.48 11% | 0.43 20% | 0.28 48% |
| Contrast (:1) | 1015 | 1135 12% | 1064 5% | 1050 3% |
| Colorchecker dE 2000 * | 3.81 | 3.38 11% | 2.78 27% | 2.81 26% |
| Colorchecker dE 2000 max. * | 7.9 | 7.13 10% | 5.53 30% | 5.7 28% |
| Colorchecker dE 2000 calibrated * | 2.54 | 1.03 59% | 1.37 46% | 0.86 66% |
| Greyscale dE 2000 * | 5.4 | 4.3 20% | 2 63% | 3.4 37% |
| Gamma | 2.062 107% | 2.42 91% | 2.28 96% | 2.301 96% |
| CCT | 7224 90% | 7356 88% | 6806 96% | 7389 88% |
| Media totale (Programma / Settaggio) | -15% /
-0% | 0% /
10% | -10% /
3% |
* ... Meglio usare valori piccoli
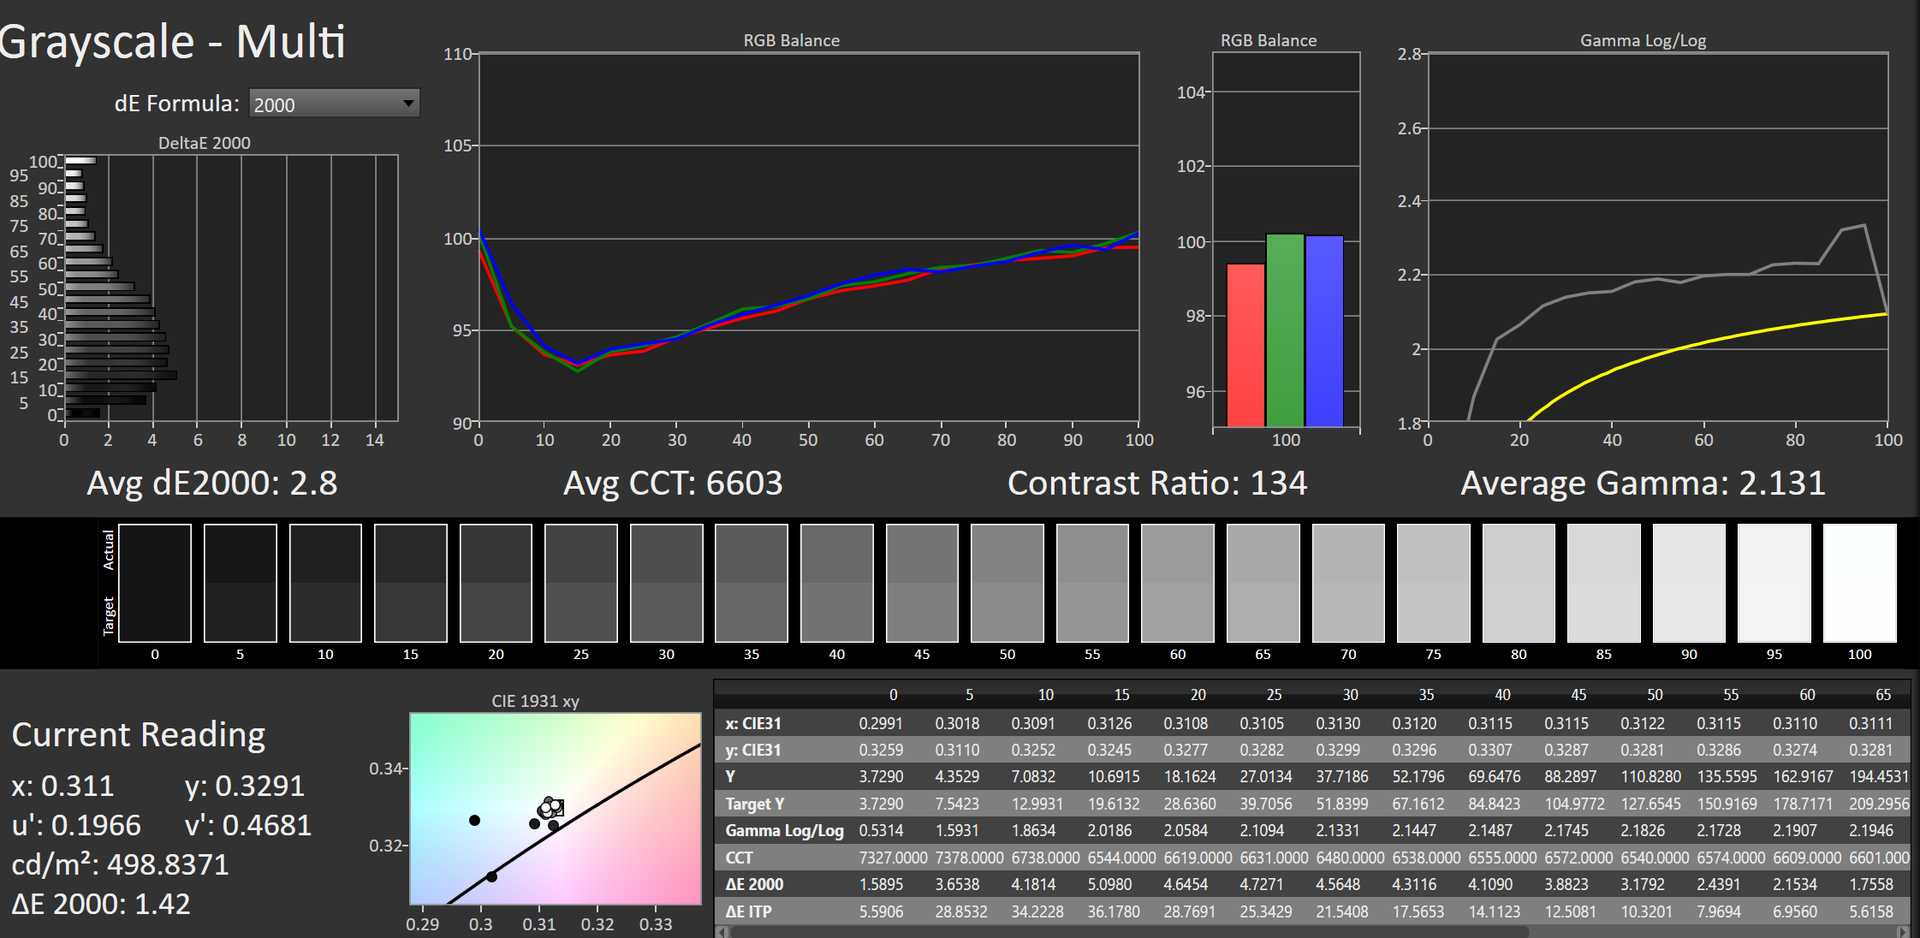
La scala di grigi predefinita è spostata verso il blu, il che spinge il deltaE medio a 5,4. La calibrazione per DCI-P3 con il colorimetro X-Rite i1Pro 3 ha abbassato il deltaE a 2,8, ma le tinte blu, rosse e, in misura minore, viola rimangono un po' spente, quindi il display potrebbe non essere consigliato per la creazione di contenuti che richiedono colori più precisi. Il profilo ICM calibrato risultante è disponibile per il download gratuito qui sopra.

Tempi di risposta del Display
| ↔ Tempi di risposta dal Nero al Bianco | ||
|---|---|---|
| 6 ms ... aumenta ↗ e diminuisce ↘ combinato | ↗ 1.5 ms Incremento | 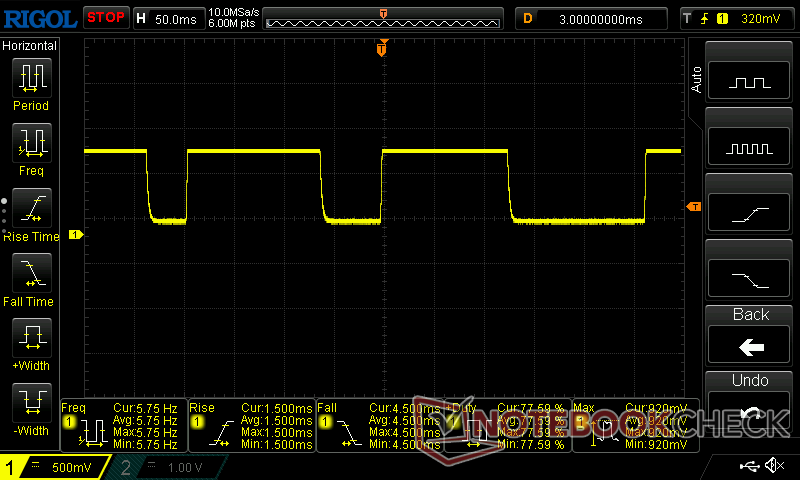 |
| ↘ 4.5 ms Calo | ||
| Lo schermo ha mostrato valori di risposta molto veloci nei nostri tests ed è molto adatto per i gaming veloce. In confronto, tutti i dispositivi di test variano da 0.1 (minimo) a 240 (massimo) ms. » 19 % di tutti i dispositivi è migliore. Questo significa che i tempi di risposta rilevati sono migliori rispettto alla media di tutti i dispositivi testati (19.8 ms). | ||
| ↔ Tempo di risposta dal 50% Grigio all'80% Grigio | ||
| 11.593 ms ... aumenta ↗ e diminuisce ↘ combinato | ↗ 5.307 ms Incremento | 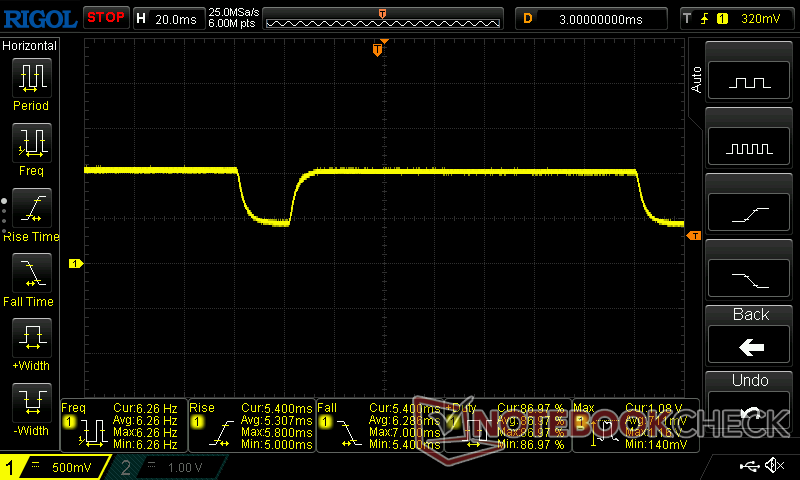 |
| ↘ 6.286 ms Calo | ||
| Lo schermo mostra buoni tempi di risposta durante i nostri tests, ma potrebbe essere troppo lento per i gamers competitivi. In confronto, tutti i dispositivi di test variano da 0.165 (minimo) a 636 (massimo) ms. » 25 % di tutti i dispositivi è migliore. Questo significa che i tempi di risposta rilevati sono migliori rispettto alla media di tutti i dispositivi testati (31 ms). | ||
Sfarfallio dello schermo / PWM (Pulse-Width Modulation)
| flickering dello schermo / PWM non rilevato | ||
In confronto: 52 % di tutti i dispositivi testati non utilizza PWM per ridurre la luminosita' del display. Se è rilevato PWM, una media di 7757 (minimo: 5 - massimo: 343500) Hz è stata rilevata. | ||
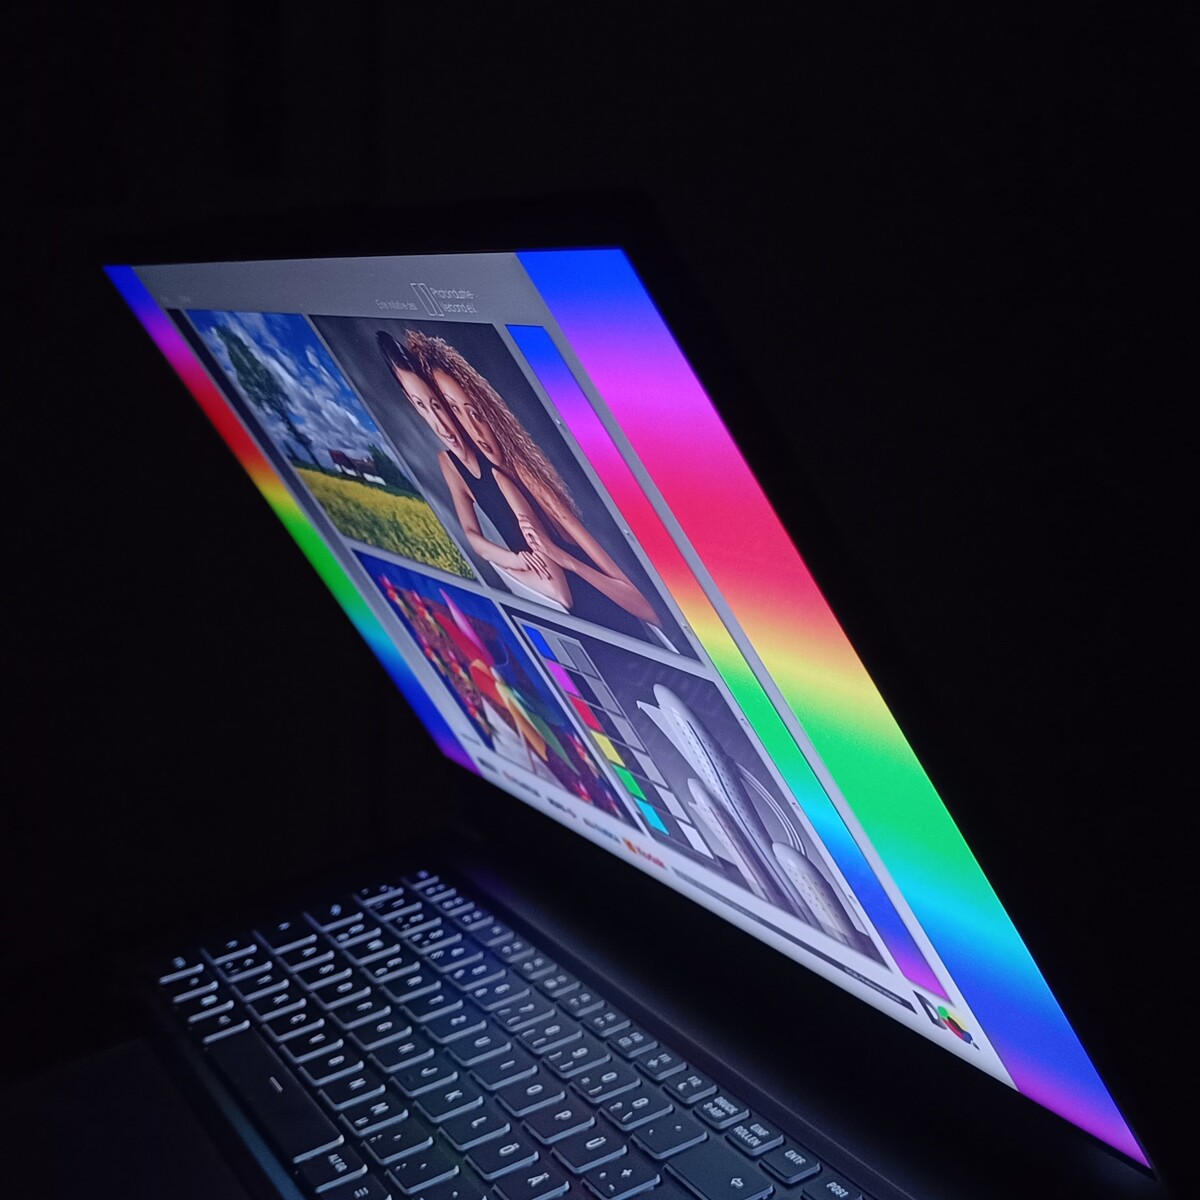
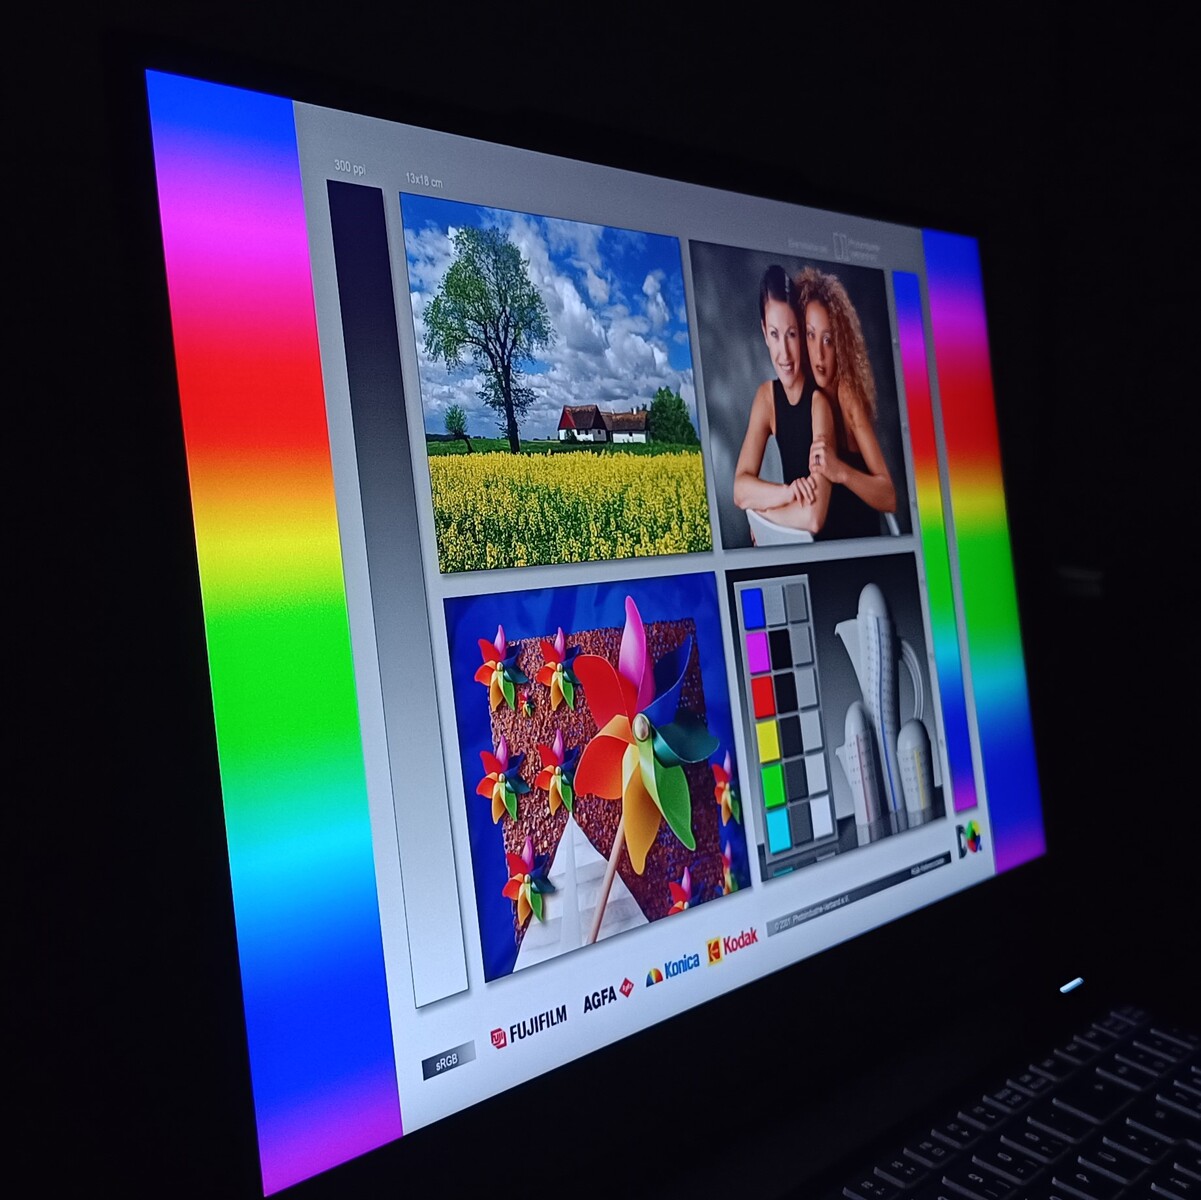
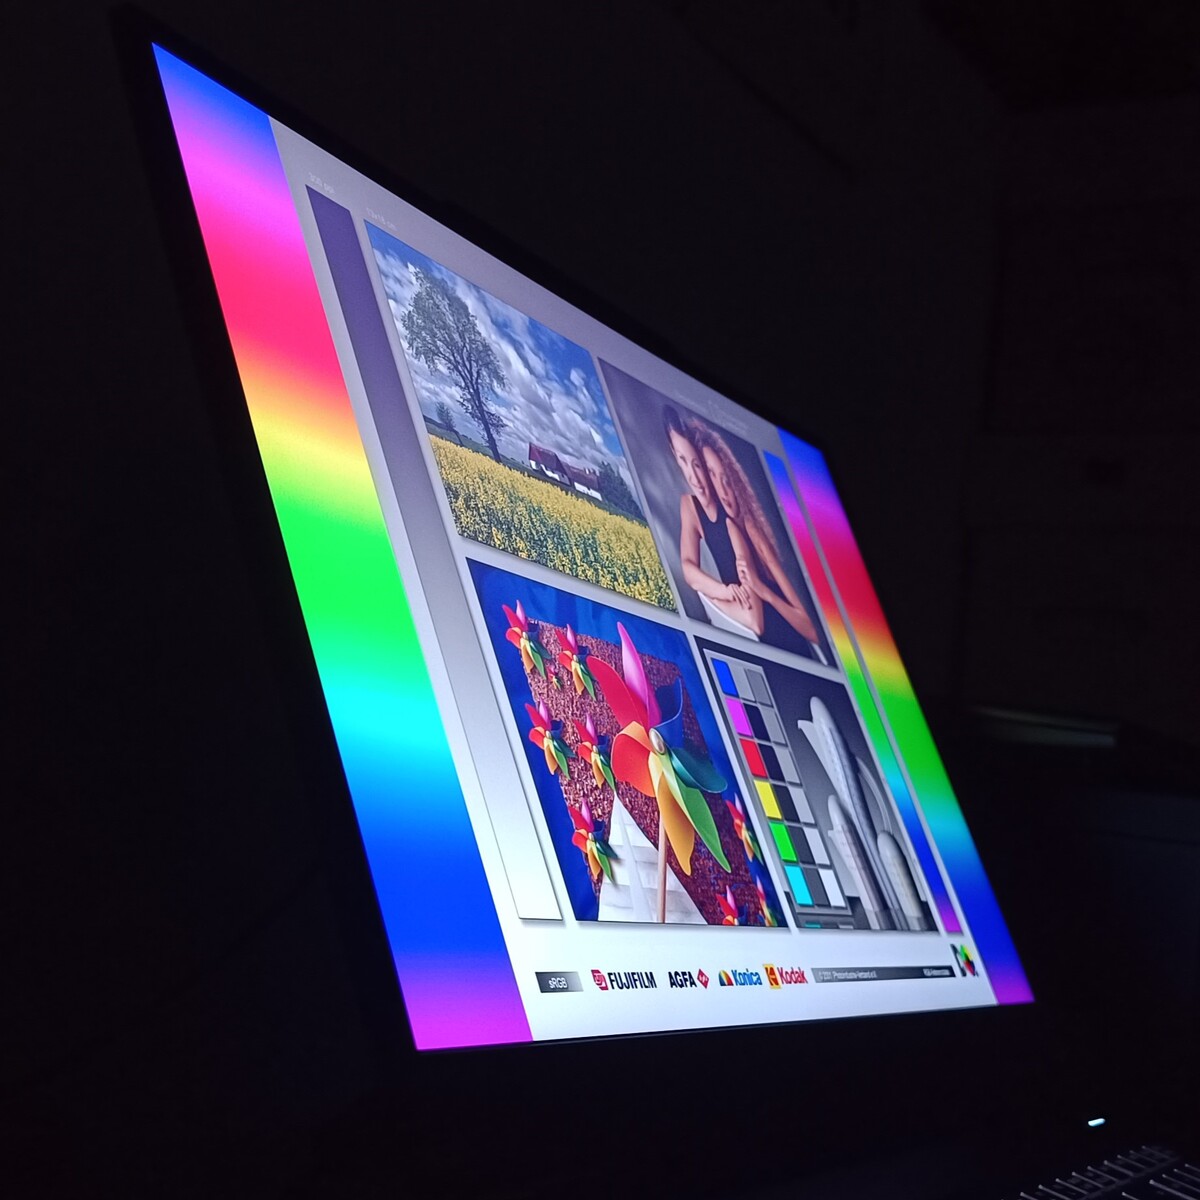
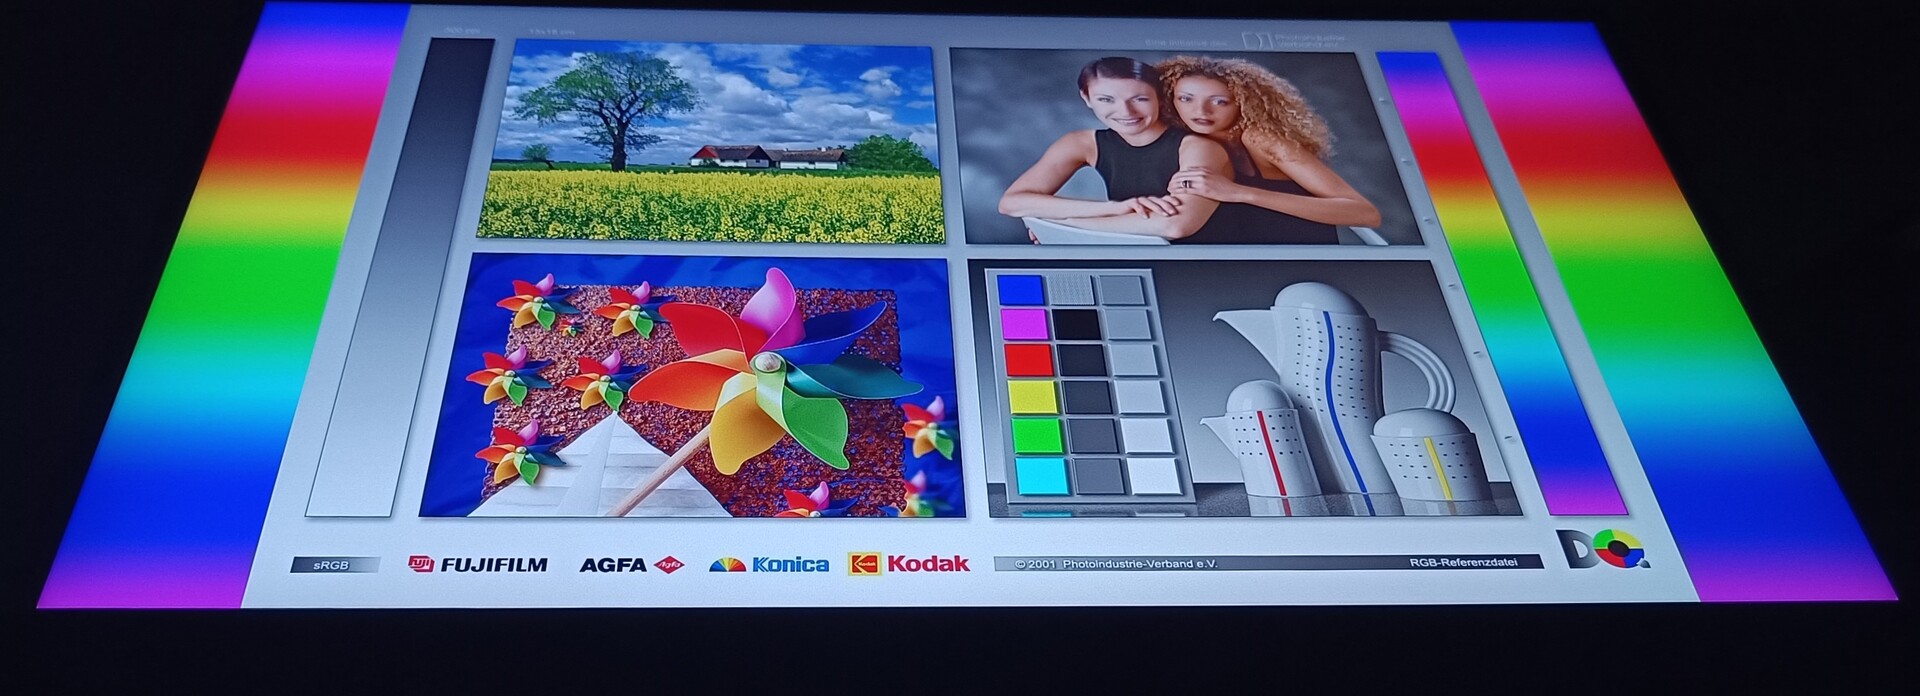
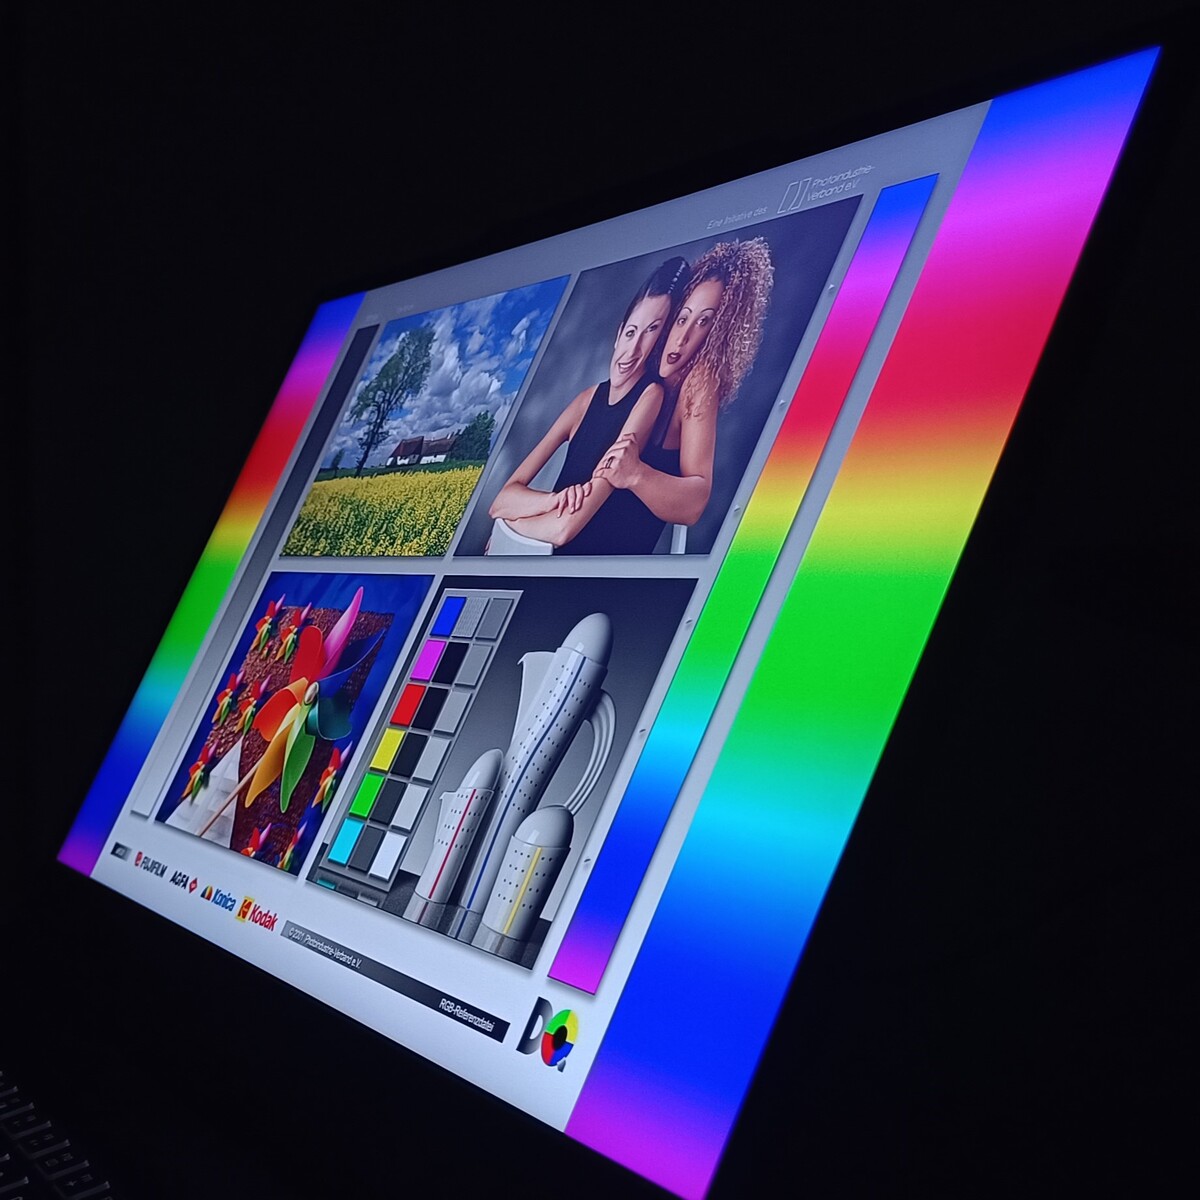
Gli angoli di visione sono in linea con altri schermi IPS, il che significa che il contrasto inizia a spostarsi fuori asse. Tuttavia, gli schermi IPS sono ancora migliori in questo senso rispetto ai pannelli TN e VA, che comunque non sono molto diffusi nei computer portatili di questi tempi.
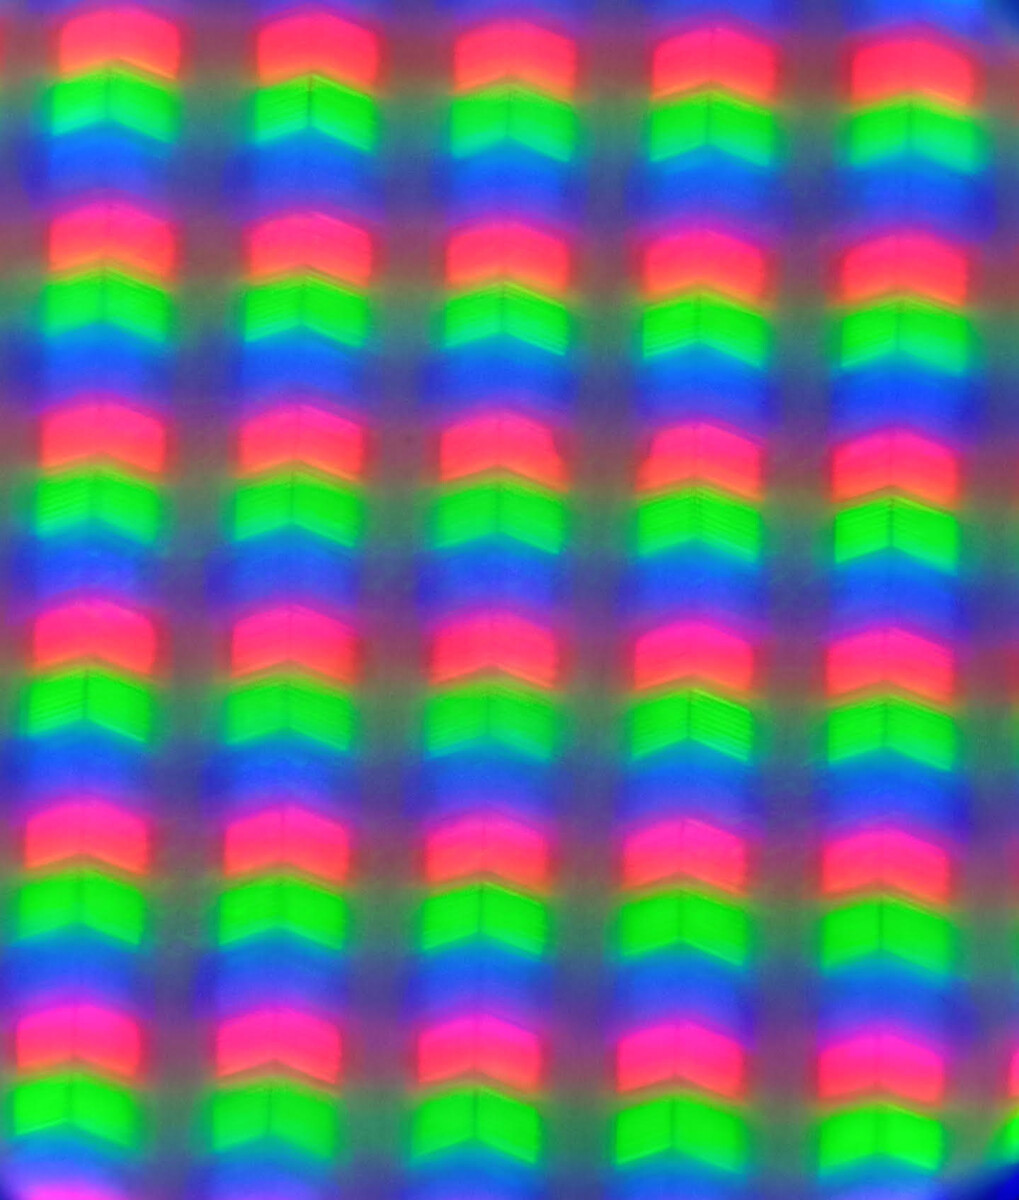
L'uniformità della retroilluminazione mostra un moderato sanguinamento negli angoli superiori. Purtroppo, la finitura opaca non aiuta molto nell'uso all'aperto, poiché diffonde in modo significativo la luce diretta o indiretta. Tuttavia, la luminosità massima di 500+ nit aiuta in caso di luce solare indiretta.

Prestazioni
Condizioni del test
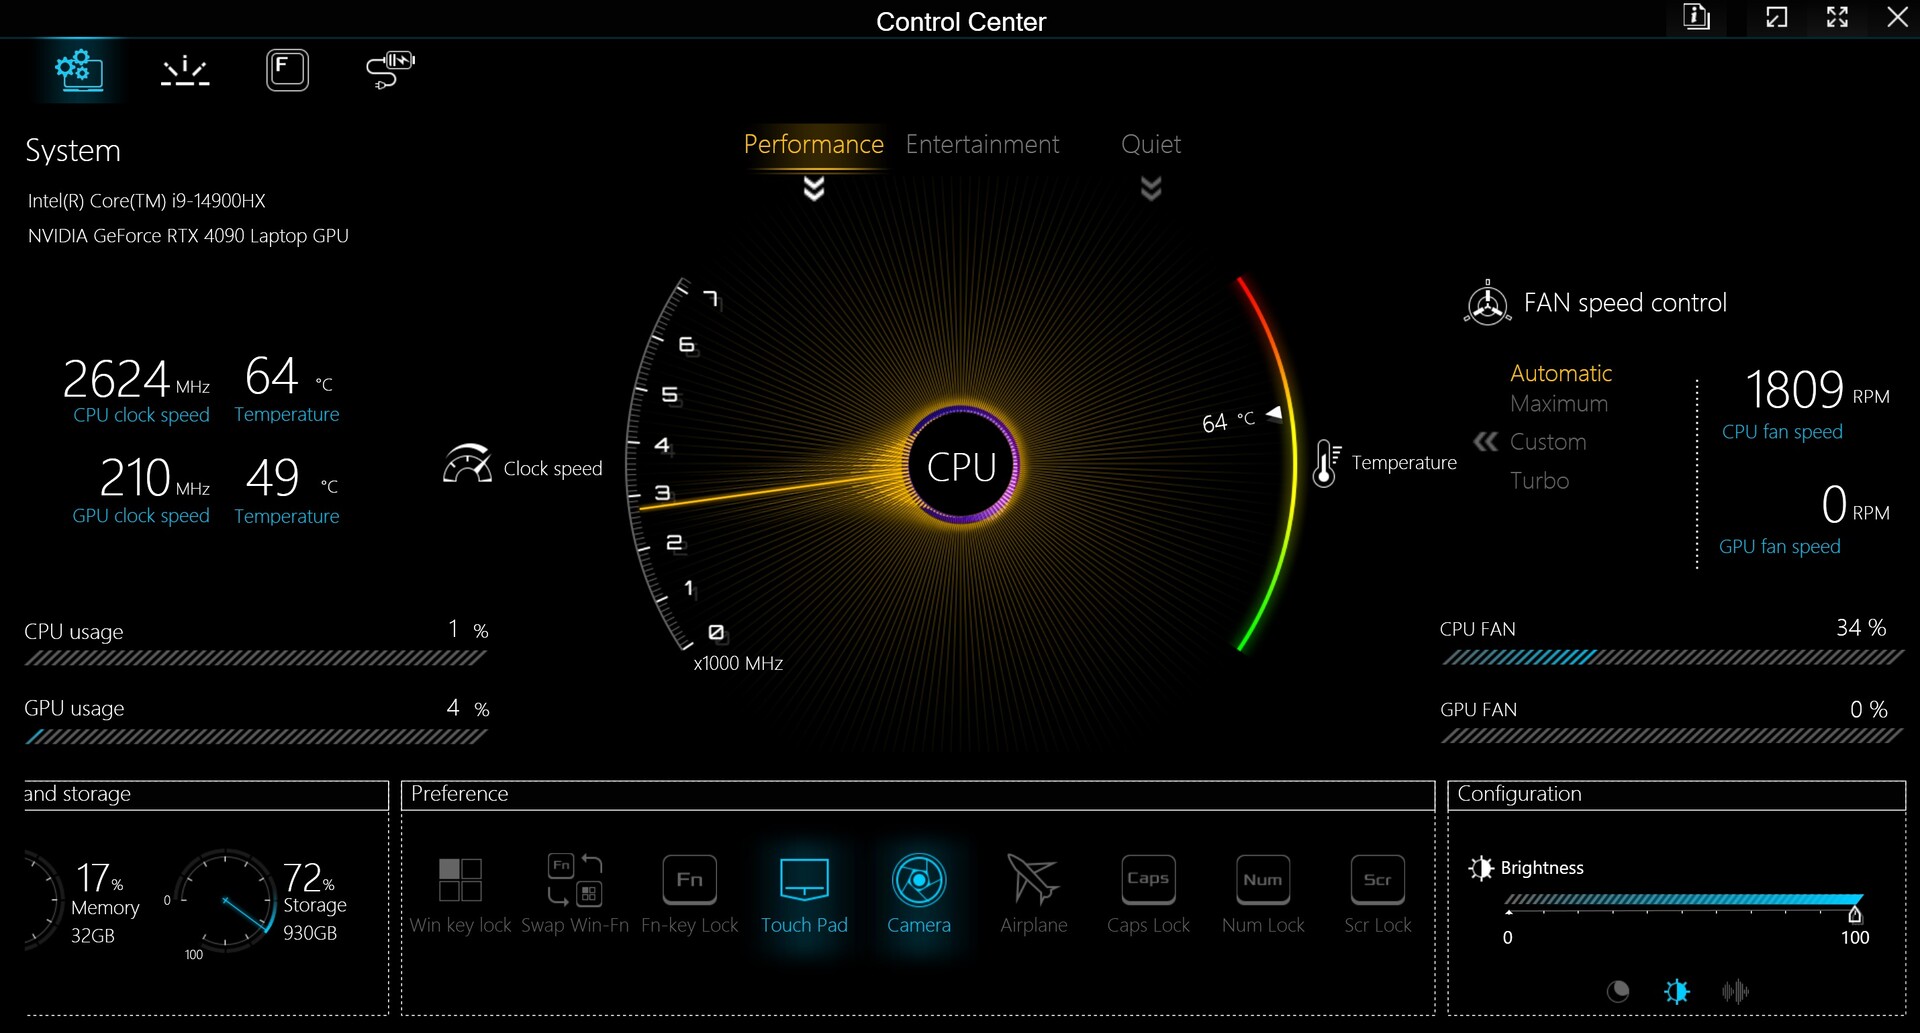
I test sulle prestazioni sono stati eseguiti utilizzando il profilo "performance" attivato nell'applicazione speciale del centro di controllo. Questo profilo utilizza il TDP massimo, i clock di boost e le velocità delle ventole.
Processore
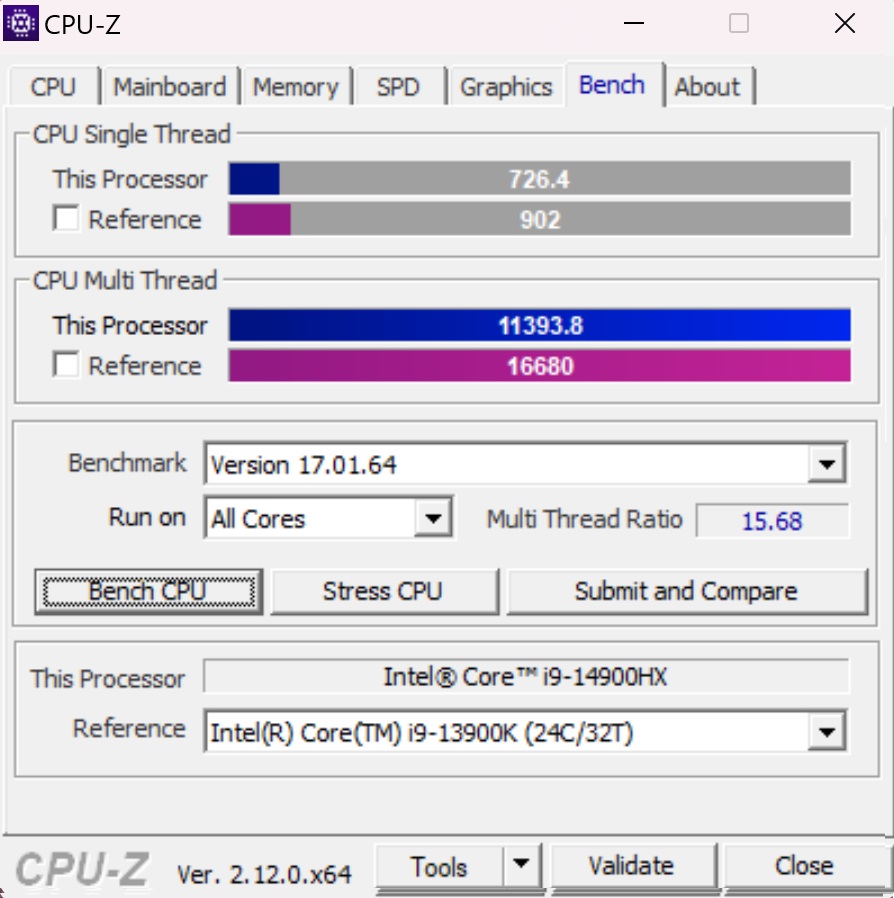
La nostra valutazione combinata delle prestazioni della CPU rivela che l'implementazione i9-14900HX di Schenker è la seconda più veloce tra i modelli Intel testati, dietro all'Eurocom del 4% e davanti all'Aorus del 2%. Come previsto, il AMD Ryzen 9 7945HX3D è notevolmente superiore al gruppo Intel di almeno il 10%, anche se le prestazioni single core sono per lo più inferiori a tutte le CPU Intel. Nel ciclo di throttling di Cinebench R15, l'i9-14900HX di Schenker inizia all'incirca allo stesso livello dell'implementazione di Eurocom, ma scende nei due cicli successivi del 15% e poi è l'unico modello a presentare variazioni crescenti e decrescenti per il resto del ciclo, indicando che la modalità turbo non è regolata troppo bene per l'efficienza.
Le prestazioni della CPU sulla batteria si riducono di almeno il 66% nel test Cinebench R23 e questo vale anche per le prestazioni della GPU.
Cinebench R15 Multi Loop
Cinebench R23: Multi Core | Single Core
Cinebench R20: CPU (Multi Core) | CPU (Single Core)
Cinebench R15: CPU Multi 64Bit | CPU Single 64Bit
Blender: v2.79 BMW27 CPU
7-Zip 18.03: 7z b 4 | 7z b 4 -mmt1
Geekbench 6.7: Multi-Core | Single-Core
Geekbench 5.5: Multi-Core | Single-Core
HWBOT x265 Benchmark v2.2: 4k Preset
LibreOffice : 20 Documents To PDF
R Benchmark 2.5: Overall mean
| CPU Performance rating | |
| Asus ROG Strix Scar 17 G733PYV-LL053X | |
| Media Intel Core i9-14900HX | |
| Eurocom Raptor X17 Core i9-14900HX | |
| HP ZBook Fury 16 G11 | |
| Schenker Key 17 Pro (M24) | |
| Aorus 17X AZF -2! | |
| Media della classe Workstation | |
| Cinebench R23 / Multi Core | |
| Asus ROG Strix Scar 17 G733PYV-LL053X | |
| Eurocom Raptor X17 Core i9-14900HX | |
| Media Intel Core i9-14900HX (17078 - 36249, n=37) | |
| Aorus 17X AZF | |
| Schenker Key 17 Pro (M24) | |
| HP ZBook Fury 16 G11 | |
| Media della classe Workstation (14621 - 38520, n=23, ultimi 2 anni) | |
| Cinebench R23 / Single Core | |
| HP ZBook Fury 16 G11 | |
| Media Intel Core i9-14900HX (1720 - 2245, n=37) | |
| Eurocom Raptor X17 Core i9-14900HX | |
| Aorus 17X AZF | |
| Schenker Key 17 Pro (M24) | |
| Media della classe Workstation (1712 - 2228, n=23, ultimi 2 anni) | |
| Asus ROG Strix Scar 17 G733PYV-LL053X | |
| Cinebench R20 / CPU (Multi Core) | |
| Asus ROG Strix Scar 17 G733PYV-LL053X | |
| Eurocom Raptor X17 Core i9-14900HX | |
| Media Intel Core i9-14900HX (6579 - 13832, n=37) | |
| Aorus 17X AZF | |
| Schenker Key 17 Pro (M24) | |
| HP ZBook Fury 16 G11 | |
| Media della classe Workstation (5760 - 15043, n=23, ultimi 2 anni) | |
| Cinebench R20 / CPU (Single Core) | |
| HP ZBook Fury 16 G11 | |
| Media Intel Core i9-14900HX (657 - 859, n=37) | |
| Aorus 17X AZF | |
| Eurocom Raptor X17 Core i9-14900HX | |
| Media della classe Workstation (671 - 857, n=23, ultimi 2 anni) | |
| Schenker Key 17 Pro (M24) | |
| Asus ROG Strix Scar 17 G733PYV-LL053X | |
| Cinebench R15 / CPU Multi 64Bit | |
| Asus ROG Strix Scar 17 G733PYV-LL053X | |
| Eurocom Raptor X17 Core i9-14900HX | |
| Aorus 17X AZF | |
| Media Intel Core i9-14900HX (3263 - 5589, n=38) | |
| Schenker Key 17 Pro (M24) | |
| HP ZBook Fury 16 G11 | |
| Media della classe Workstation (2489 - 5810, n=23, ultimi 2 anni) | |
| Cinebench R15 / CPU Single 64Bit | |
| Asus ROG Strix Scar 17 G733PYV-LL053X | |
| Media Intel Core i9-14900HX (247 - 323, n=37) | |
| Aorus 17X AZF | |
| Eurocom Raptor X17 Core i9-14900HX | |
| HP ZBook Fury 16 G11 | |
| Media della classe Workstation (191.4 - 328, n=23, ultimi 2 anni) | |
| Schenker Key 17 Pro (M24) | |
| Blender / v2.79 BMW27 CPU | |
| Media della classe Workstation (91 - 222, n=23, ultimi 2 anni) | |
| Aorus 17X AZF | |
| HP ZBook Fury 16 G11 | |
| Media Intel Core i9-14900HX (91 - 206, n=37) | |
| Schenker Key 17 Pro (M24) | |
| Eurocom Raptor X17 Core i9-14900HX | |
| Asus ROG Strix Scar 17 G733PYV-LL053X | |
| 7-Zip 18.03 / 7z b 4 | |
| Asus ROG Strix Scar 17 G733PYV-LL053X | |
| Eurocom Raptor X17 Core i9-14900HX | |
| Media Intel Core i9-14900HX (66769 - 136645, n=37) | |
| Schenker Key 17 Pro (M24) | |
| HP ZBook Fury 16 G11 | |
| Aorus 17X AZF | |
| Media della classe Workstation (60489 - 116969, n=23, ultimi 2 anni) | |
| 7-Zip 18.03 / 7z b 4 -mmt1 | |
| Asus ROG Strix Scar 17 G733PYV-LL053X | |
| Aorus 17X AZF | |
| Media Intel Core i9-14900HX (5452 - 7545, n=37) | |
| HP ZBook Fury 16 G11 | |
| Schenker Key 17 Pro (M24) | |
| Eurocom Raptor X17 Core i9-14900HX | |
| Media della classe Workstation (5126 - 6960, n=23, ultimi 2 anni) | |
| Geekbench 6.7 / Multi-Core | |
| Eurocom Raptor X17 Core i9-14900HX | |
| Media Intel Core i9-14900HX (13158 - 19665, n=37) | |
| Asus ROG Strix Scar 17 G733PYV-LL053X | |
| Schenker Key 17 Pro (M24) | |
| Media della classe Workstation (12721 - 20887, n=23, ultimi 2 anni) | |
| HP ZBook Fury 16 G11 | |
| Geekbench 6.7 / Single-Core | |
| Media Intel Core i9-14900HX (2419 - 3129, n=37) | |
| HP ZBook Fury 16 G11 | |
| Asus ROG Strix Scar 17 G733PYV-LL053X | |
| Eurocom Raptor X17 Core i9-14900HX | |
| Media della classe Workstation (2389 - 3065, n=23, ultimi 2 anni) | |
| Schenker Key 17 Pro (M24) | |
| Geekbench 5.5 / Multi-Core | |
| Asus ROG Strix Scar 17 G733PYV-LL053X | |
| Media Intel Core i9-14900HX (8618 - 23194, n=37) | |
| Schenker Key 17 Pro (M24) | |
| Aorus 17X AZF | |
| HP ZBook Fury 16 G11 | |
| Media della classe Workstation (11542 - 25554, n=23, ultimi 2 anni) | |
| Eurocom Raptor X17 Core i9-14900HX | |
| Geekbench 5.5 / Single-Core | |
| Asus ROG Strix Scar 17 G733PYV-LL053X | |
| Media Intel Core i9-14900HX (1669 - 2210, n=37) | |
| Aorus 17X AZF | |
| Media della classe Workstation (1783 - 2183, n=23, ultimi 2 anni) | |
| HP ZBook Fury 16 G11 | |
| Schenker Key 17 Pro (M24) | |
| Eurocom Raptor X17 Core i9-14900HX | |
| HWBOT x265 Benchmark v2.2 / 4k Preset | |
| Asus ROG Strix Scar 17 G733PYV-LL053X | |
| Eurocom Raptor X17 Core i9-14900HX | |
| Media Intel Core i9-14900HX (16.8 - 38.9, n=37) | |
| Media della classe Workstation (17.8 - 40.5, n=23, ultimi 2 anni) | |
| Schenker Key 17 Pro (M24) | |
| HP ZBook Fury 16 G11 | |
| Aorus 17X AZF | |
| LibreOffice / 20 Documents To PDF | |
| HP ZBook Fury 16 G11 | |
| Media della classe Workstation (37.1 - 74.7, n=23, ultimi 2 anni) | |
| Schenker Key 17 Pro (M24) | |
| Aorus 17X AZF | |
| Media Intel Core i9-14900HX (19 - 85.1, n=37) | |
| Asus ROG Strix Scar 17 G733PYV-LL053X | |
| Eurocom Raptor X17 Core i9-14900HX | |
| R Benchmark 2.5 / Overall mean | |
| Media della classe Workstation (0.3825 - 0.603, n=23, ultimi 2 anni) | |
| Schenker Key 17 Pro (M24) | |
| Asus ROG Strix Scar 17 G733PYV-LL053X | |
| Aorus 17X AZF | |
| Media Intel Core i9-14900HX (0.3604 - 0.4859, n=37) | |
| Eurocom Raptor X17 Core i9-14900HX | |
| HP ZBook Fury 16 G11 | |
* ... Meglio usare valori piccoli
AIDA64: FP32 Ray-Trace | FPU Julia | CPU SHA3 | CPU Queen | FPU SinJulia | FPU Mandel | CPU AES | CPU ZLib | FP64 Ray-Trace | CPU PhotoWorxx
| Performance rating | |
| Asus ROG Strix Scar 17 G733PYV-LL053X | |
| Eurocom Raptor X17 Core i9-14900HX | |
| Media Intel Core i9-14900HX | |
| Media della classe Workstation | |
| Schenker Key 17 Pro (M24) | |
| Aorus 17X AZF | |
| HP ZBook Fury 16 G11 | |
| AIDA64 / FP32 Ray-Trace | |
| Asus ROG Strix Scar 17 G733PYV-LL053X | |
| Media della classe Workstation (16730 - 61611, n=23, ultimi 2 anni) | |
| Eurocom Raptor X17 Core i9-14900HX | |
| Media Intel Core i9-14900HX (13098 - 33474, n=36) | |
| Schenker Key 17 Pro (M24) | |
| HP ZBook Fury 16 G11 | |
| Aorus 17X AZF | |
| AIDA64 / FPU Julia | |
| Asus ROG Strix Scar 17 G733PYV-LL053X | |
| Eurocom Raptor X17 Core i9-14900HX | |
| Media della classe Workstation (89597 - 186971, n=23, ultimi 2 anni) | |
| Media Intel Core i9-14900HX (67573 - 166040, n=36) | |
| Schenker Key 17 Pro (M24) | |
| HP ZBook Fury 16 G11 | |
| Aorus 17X AZF | |
| AIDA64 / CPU SHA3 | |
| Asus ROG Strix Scar 17 G733PYV-LL053X | |
| Eurocom Raptor X17 Core i9-14900HX | |
| Media della classe Workstation (4178 - 8975, n=23, ultimi 2 anni) | |
| Media Intel Core i9-14900HX (3589 - 7979, n=36) | |
| Schenker Key 17 Pro (M24) | |
| HP ZBook Fury 16 G11 | |
| Aorus 17X AZF | |
| AIDA64 / CPU Queen | |
| Asus ROG Strix Scar 17 G733PYV-LL053X | |
| Eurocom Raptor X17 Core i9-14900HX | |
| Schenker Key 17 Pro (M24) | |
| Media Intel Core i9-14900HX (118405 - 148966, n=36) | |
| HP ZBook Fury 16 G11 | |
| Aorus 17X AZF | |
| Media della classe Workstation (60778 - 144411, n=23, ultimi 2 anni) | |
| AIDA64 / FPU SinJulia | |
| Asus ROG Strix Scar 17 G733PYV-LL053X | |
| Eurocom Raptor X17 Core i9-14900HX | |
| Media Intel Core i9-14900HX (10475 - 18517, n=36) | |
| Schenker Key 17 Pro (M24) | |
| Media della classe Workstation (8165 - 29343, n=23, ultimi 2 anni) | |
| HP ZBook Fury 16 G11 | |
| Aorus 17X AZF | |
| AIDA64 / FPU Mandel | |
| Asus ROG Strix Scar 17 G733PYV-LL053X | |
| Media della classe Workstation (44497 - 98153, n=23, ultimi 2 anni) | |
| Eurocom Raptor X17 Core i9-14900HX | |
| Media Intel Core i9-14900HX (32543 - 83662, n=36) | |
| Schenker Key 17 Pro (M24) | |
| HP ZBook Fury 16 G11 | |
| Aorus 17X AZF | |
| AIDA64 / CPU AES | |
| Asus ROG Strix Scar 17 G733PYV-LL053X | |
| Eurocom Raptor X17 Core i9-14900HX | |
| Aorus 17X AZF | |
| Media Intel Core i9-14900HX (86964 - 241777, n=36) | |
| Media della classe Workstation (73133 - 187841, n=23, ultimi 2 anni) | |
| Schenker Key 17 Pro (M24) | |
| HP ZBook Fury 16 G11 | |
| AIDA64 / CPU ZLib | |
| Asus ROG Strix Scar 17 G733PYV-LL053X | |
| Eurocom Raptor X17 Core i9-14900HX | |
| Media Intel Core i9-14900HX (1054 - 2292, n=36) | |
| Schenker Key 17 Pro (M24) | |
| Media della classe Workstation (929 - 2148, n=23, ultimi 2 anni) | |
| HP ZBook Fury 16 G11 | |
| Aorus 17X AZF | |
| AIDA64 / FP64 Ray-Trace | |
| Asus ROG Strix Scar 17 G733PYV-LL053X | |
| Media della classe Workstation (8545 - 32891, n=23, ultimi 2 anni) | |
| Eurocom Raptor X17 Core i9-14900HX | |
| Media Intel Core i9-14900HX (6809 - 18349, n=36) | |
| Schenker Key 17 Pro (M24) | |
| HP ZBook Fury 16 G11 | |
| Aorus 17X AZF | |
| AIDA64 / CPU PhotoWorxx | |
| Media della classe Workstation (37151 - 93684, n=23, ultimi 2 anni) | |
| Eurocom Raptor X17 Core i9-14900HX | |
| Schenker Key 17 Pro (M24) | |
| Aorus 17X AZF | |
| Media Intel Core i9-14900HX (23903 - 54702, n=36) | |
| HP ZBook Fury 16 G11 | |
| Asus ROG Strix Scar 17 G733PYV-LL053X | |
Prestazioni del sistema
Rispetto agli altri due i9-14900HX, il Key 17 Pro sembra essere il modello Intel più veloce in PCMark 10, ma l'AMD Ryzen 9 7945HX3D sul portatile Asus è in vantaggio al massimo del 10%. Il vecchio i9-13900HX del modello Aorus è sorprendentemente più veloce di un piccolo margine rispetto allo Zbook Fury i9-14900HX.
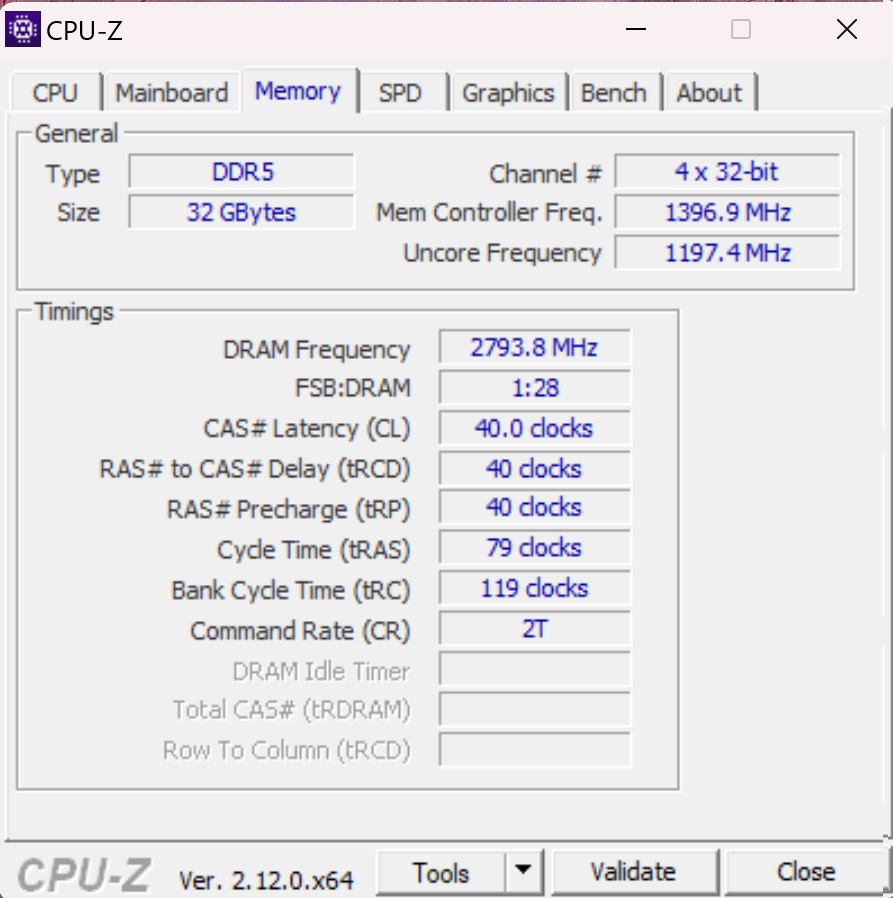
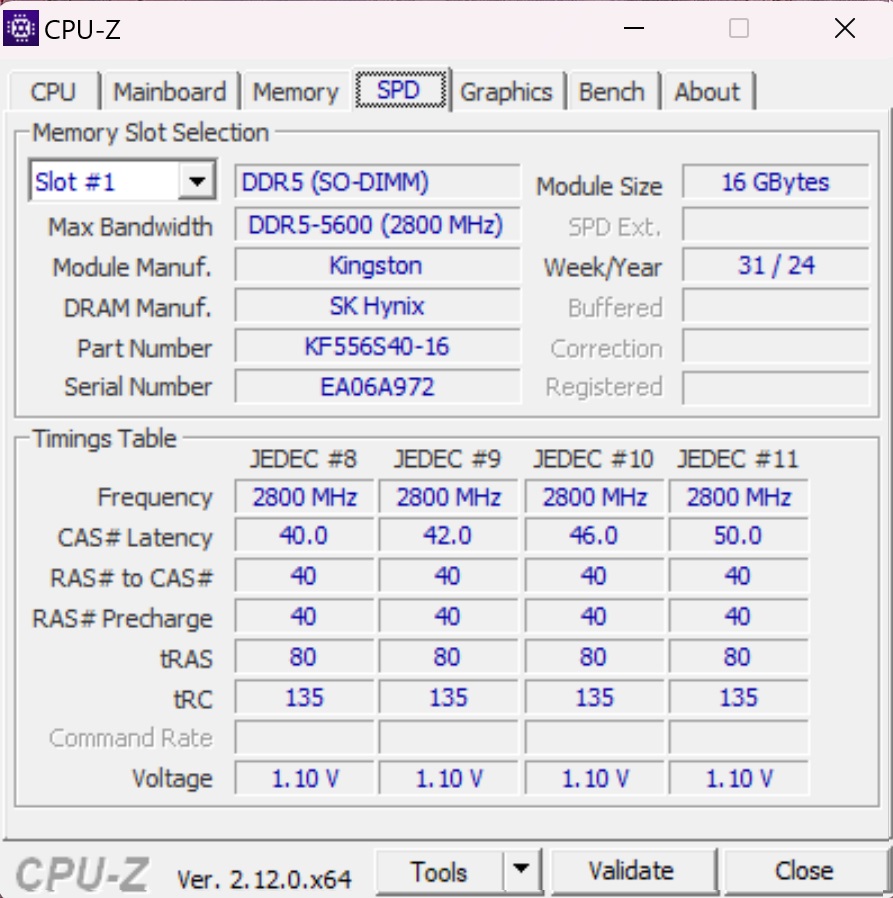
Tuttavia, la RAM Kingston DDR5-5600 equipaggiata sul modello Schenker si è dimostrata la media più veloce. Si aggiudica la prima posizione nei test AIDA64 Memory Copy e Memory Write, mentre si posiziona al secondo posto per Memory Read e al terzo per la latenza.
CrossMark: Overall | Productivity | Creativity | Responsiveness
WebXPRT 3: Overall
WebXPRT 4: Overall
Mozilla Kraken 1.1: Total
| PCMark 10 / Score | |
| Asus ROG Strix Scar 17 G733PYV-LL053X | |
| Media Intel Core i9-14900HX, NVIDIA GeForce RTX 4090 Laptop GPU (8230 - 9234, n=13) | |
| Schenker Key 17 Pro (M24) | |
| Media della classe Workstation (6563 - 10409, n=19, ultimi 2 anni) | |
| Aorus 17X AZF | |
| HP ZBook Fury 16 G11 | |
| PCMark 10 / Essentials | |
| Asus ROG Strix Scar 17 G733PYV-LL053X | |
| Aorus 17X AZF | |
| Media Intel Core i9-14900HX, NVIDIA GeForce RTX 4090 Laptop GPU (10778 - 11628, n=13) | |
| Schenker Key 17 Pro (M24) | |
| Media della classe Workstation (9622 - 11157, n=19, ultimi 2 anni) | |
| HP ZBook Fury 16 G11 | |
| PCMark 10 / Productivity | |
| Media della classe Workstation (8789 - 20616, n=19, ultimi 2 anni) | |
| Asus ROG Strix Scar 17 G733PYV-LL053X | |
| Media Intel Core i9-14900HX, NVIDIA GeForce RTX 4090 Laptop GPU (9458 - 11759, n=13) | |
| Aorus 17X AZF | |
| HP ZBook Fury 16 G11 | |
| Schenker Key 17 Pro (M24) | |
| PCMark 10 / Digital Content Creation | |
| Asus ROG Strix Scar 17 G733PYV-LL053X | |
| Schenker Key 17 Pro (M24) | |
| Media Intel Core i9-14900HX, NVIDIA GeForce RTX 4090 Laptop GPU (13219 - 16462, n=13) | |
| HP ZBook Fury 16 G11 | |
| Media della classe Workstation (8108 - 15631, n=19, ultimi 2 anni) | |
| Aorus 17X AZF | |
| CrossMark / Overall | |
| Eurocom Raptor X17 Core i9-14900HX | |
| Aorus 17X AZF | |
| Media Intel Core i9-14900HX, NVIDIA GeForce RTX 4090 Laptop GPU (1877 - 2344, n=10) | |
| Asus ROG Strix Scar 17 G733PYV-LL053X | |
| HP ZBook Fury 16 G11 | |
| Media della classe Workstation (1307 - 2267, n=22, ultimi 2 anni) | |
| CrossMark / Productivity | |
| Eurocom Raptor X17 Core i9-14900HX | |
| Aorus 17X AZF | |
| Media Intel Core i9-14900HX, NVIDIA GeForce RTX 4090 Laptop GPU (1738 - 2162, n=10) | |
| Asus ROG Strix Scar 17 G733PYV-LL053X | |
| HP ZBook Fury 16 G11 | |
| Media della classe Workstation (1130 - 2122, n=22, ultimi 2 anni) | |
| CrossMark / Creativity | |
| Asus ROG Strix Scar 17 G733PYV-LL053X | |
| Media Intel Core i9-14900HX, NVIDIA GeForce RTX 4090 Laptop GPU (2195 - 2660, n=10) | |
| Eurocom Raptor X17 Core i9-14900HX | |
| Aorus 17X AZF | |
| HP ZBook Fury 16 G11 | |
| Media della classe Workstation (1657 - 2725, n=22, ultimi 2 anni) | |
| CrossMark / Responsiveness | |
| Eurocom Raptor X17 Core i9-14900HX | |
| Aorus 17X AZF | |
| Media Intel Core i9-14900HX, NVIDIA GeForce RTX 4090 Laptop GPU (1478 - 2327, n=10) | |
| HP ZBook Fury 16 G11 | |
| Asus ROG Strix Scar 17 G733PYV-LL053X | |
| Media della classe Workstation (993 - 2096, n=22, ultimi 2 anni) | |
| WebXPRT 3 / Overall | |
| Asus ROG Strix Scar 17 G733PYV-LL053X | |
| Aorus 17X AZF | |
| Eurocom Raptor X17 Core i9-14900HX | |
| Media Intel Core i9-14900HX, NVIDIA GeForce RTX 4090 Laptop GPU (279 - 339, n=10) | |
| HP ZBook Fury 16 G11 | |
| Media della classe Workstation (260 - 360, n=23, ultimi 2 anni) | |
| Schenker Key 17 Pro (M24) | |
| WebXPRT 4 / Overall | |
| Asus ROG Strix Scar 17 G733PYV-LL053X | |
| Eurocom Raptor X17 Core i9-14900HX | |
| HP ZBook Fury 16 G11 | |
| Aorus 17X AZF | |
| Media Intel Core i9-14900HX, NVIDIA GeForce RTX 4090 Laptop GPU (246 - 309, n=8) | |
| Media della classe Workstation (189.2 - 326, n=23, ultimi 2 anni) | |
| Schenker Key 17 Pro (M24) | |
| Mozilla Kraken 1.1 / Total | |
| Schenker Key 17 Pro (M24) | |
| Aorus 17X AZF | |
| Eurocom Raptor X17 Core i9-14900HX | |
| Media della classe Workstation (411 - 538, n=23, ultimi 2 anni) | |
| Media Intel Core i9-14900HX, NVIDIA GeForce RTX 4090 Laptop GPU (428 - 535, n=11) | |
| HP ZBook Fury 16 G11 | |
| Asus ROG Strix Scar 17 G733PYV-LL053X | |
* ... Meglio usare valori piccoli
| PCMark 10 Score | 8277 punti | |
Aiuto | ||
| AIDA64 / Memory Copy | |
| Media della classe Workstation (56003 - 164795, n=23, ultimi 2 anni) | |
| Schenker Key 17 Pro (M24) | |
| Aorus 17X AZF | |
| Eurocom Raptor X17 Core i9-14900HX | |
| Media Intel Core i9-14900HX (38028 - 83392, n=36) | |
| HP ZBook Fury 16 G11 | |
| Asus ROG Strix Scar 17 G733PYV-LL053X | |
| AIDA64 / Memory Read | |
| Aorus 17X AZF | |
| Schenker Key 17 Pro (M24) | |
| Media Intel Core i9-14900HX (43306 - 87568, n=36) | |
| Eurocom Raptor X17 Core i9-14900HX | |
| Media della classe Workstation (55795 - 121563, n=23, ultimi 2 anni) | |
| Asus ROG Strix Scar 17 G733PYV-LL053X | |
| HP ZBook Fury 16 G11 | |
| AIDA64 / Memory Write | |
| Media della classe Workstation (55663 - 214520, n=23, ultimi 2 anni) | |
| Schenker Key 17 Pro (M24) | |
| Aorus 17X AZF | |
| Eurocom Raptor X17 Core i9-14900HX | |
| Media Intel Core i9-14900HX (37146 - 80589, n=36) | |
| Asus ROG Strix Scar 17 G733PYV-LL053X | |
| HP ZBook Fury 16 G11 | |
| AIDA64 / Memory Latency | |
| Media della classe Workstation (84.5 - 165.2, n=23, ultimi 2 anni) | |
| HP ZBook Fury 16 G11 | |
| Asus ROG Strix Scar 17 G733PYV-LL053X | |
| Eurocom Raptor X17 Core i9-14900HX | |
| Media Intel Core i9-14900HX (76.1 - 105, n=36) | |
| Schenker Key 17 Pro (M24) | |
| Aorus 17X AZF | |
* ... Meglio usare valori piccoli
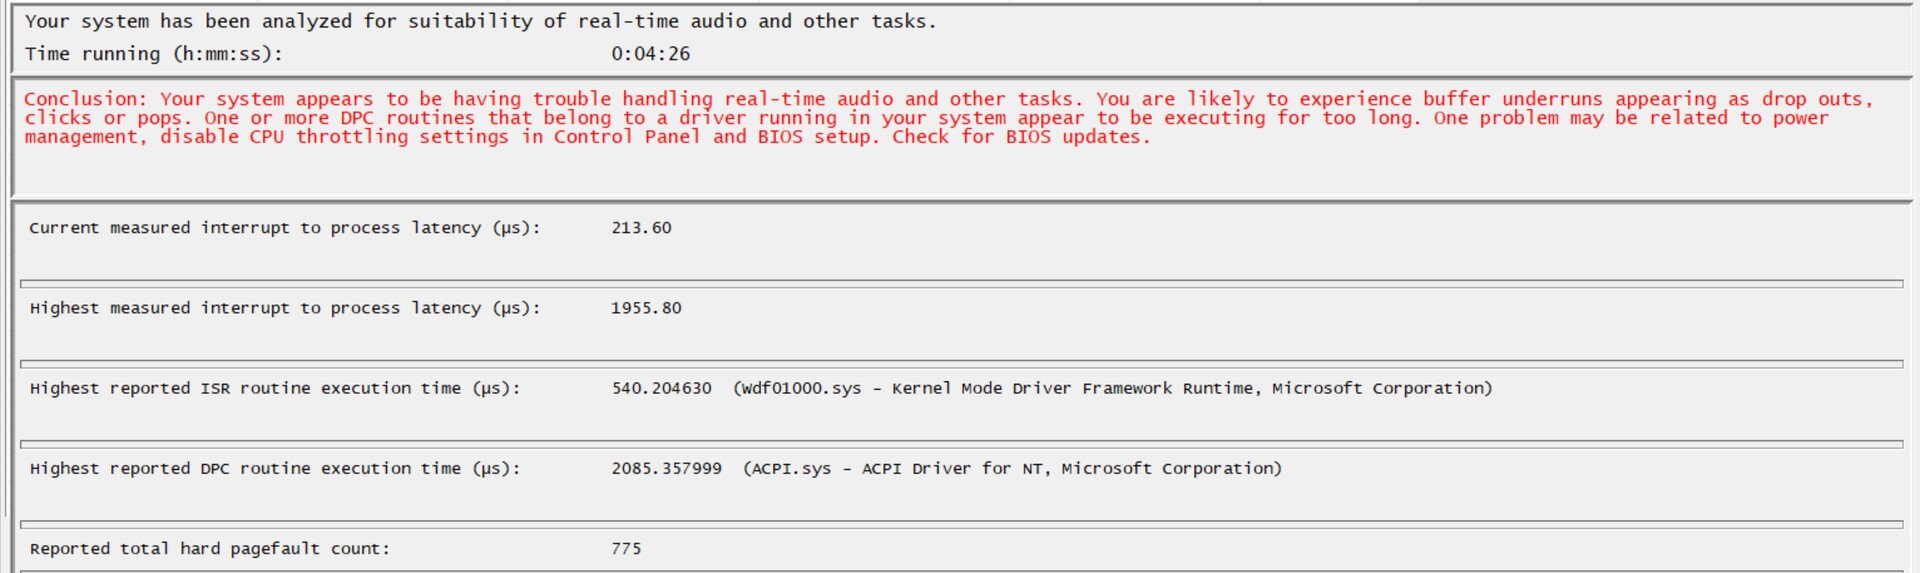
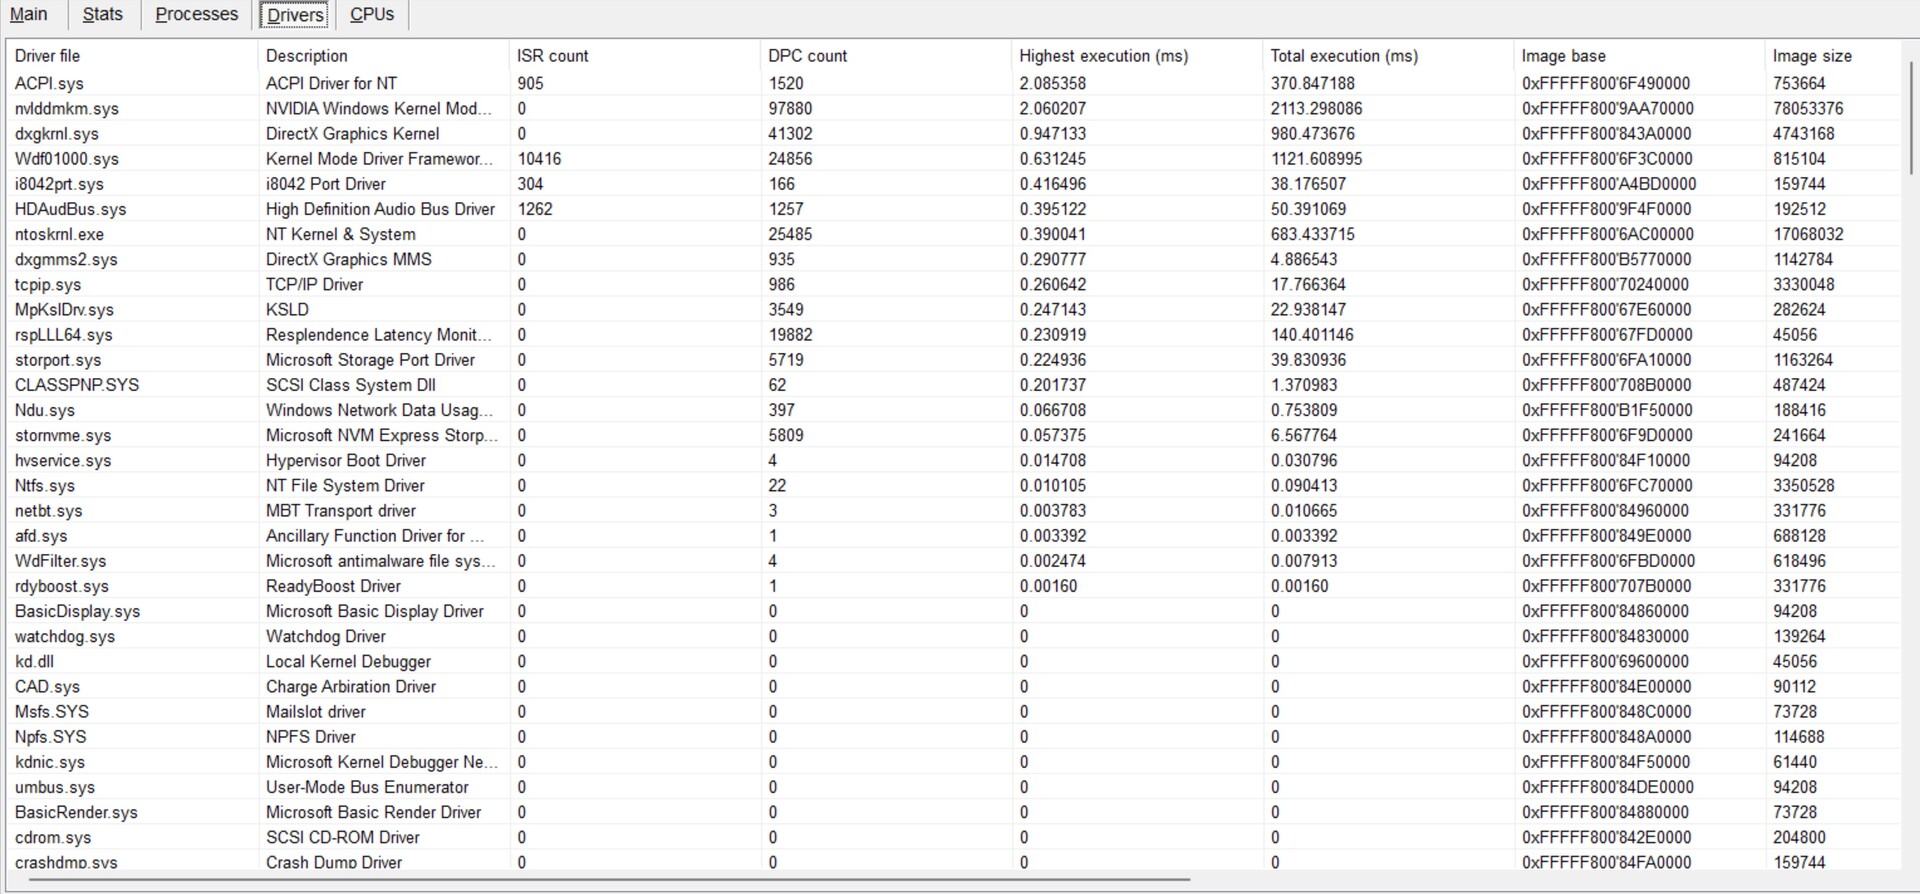
Latenza DPC
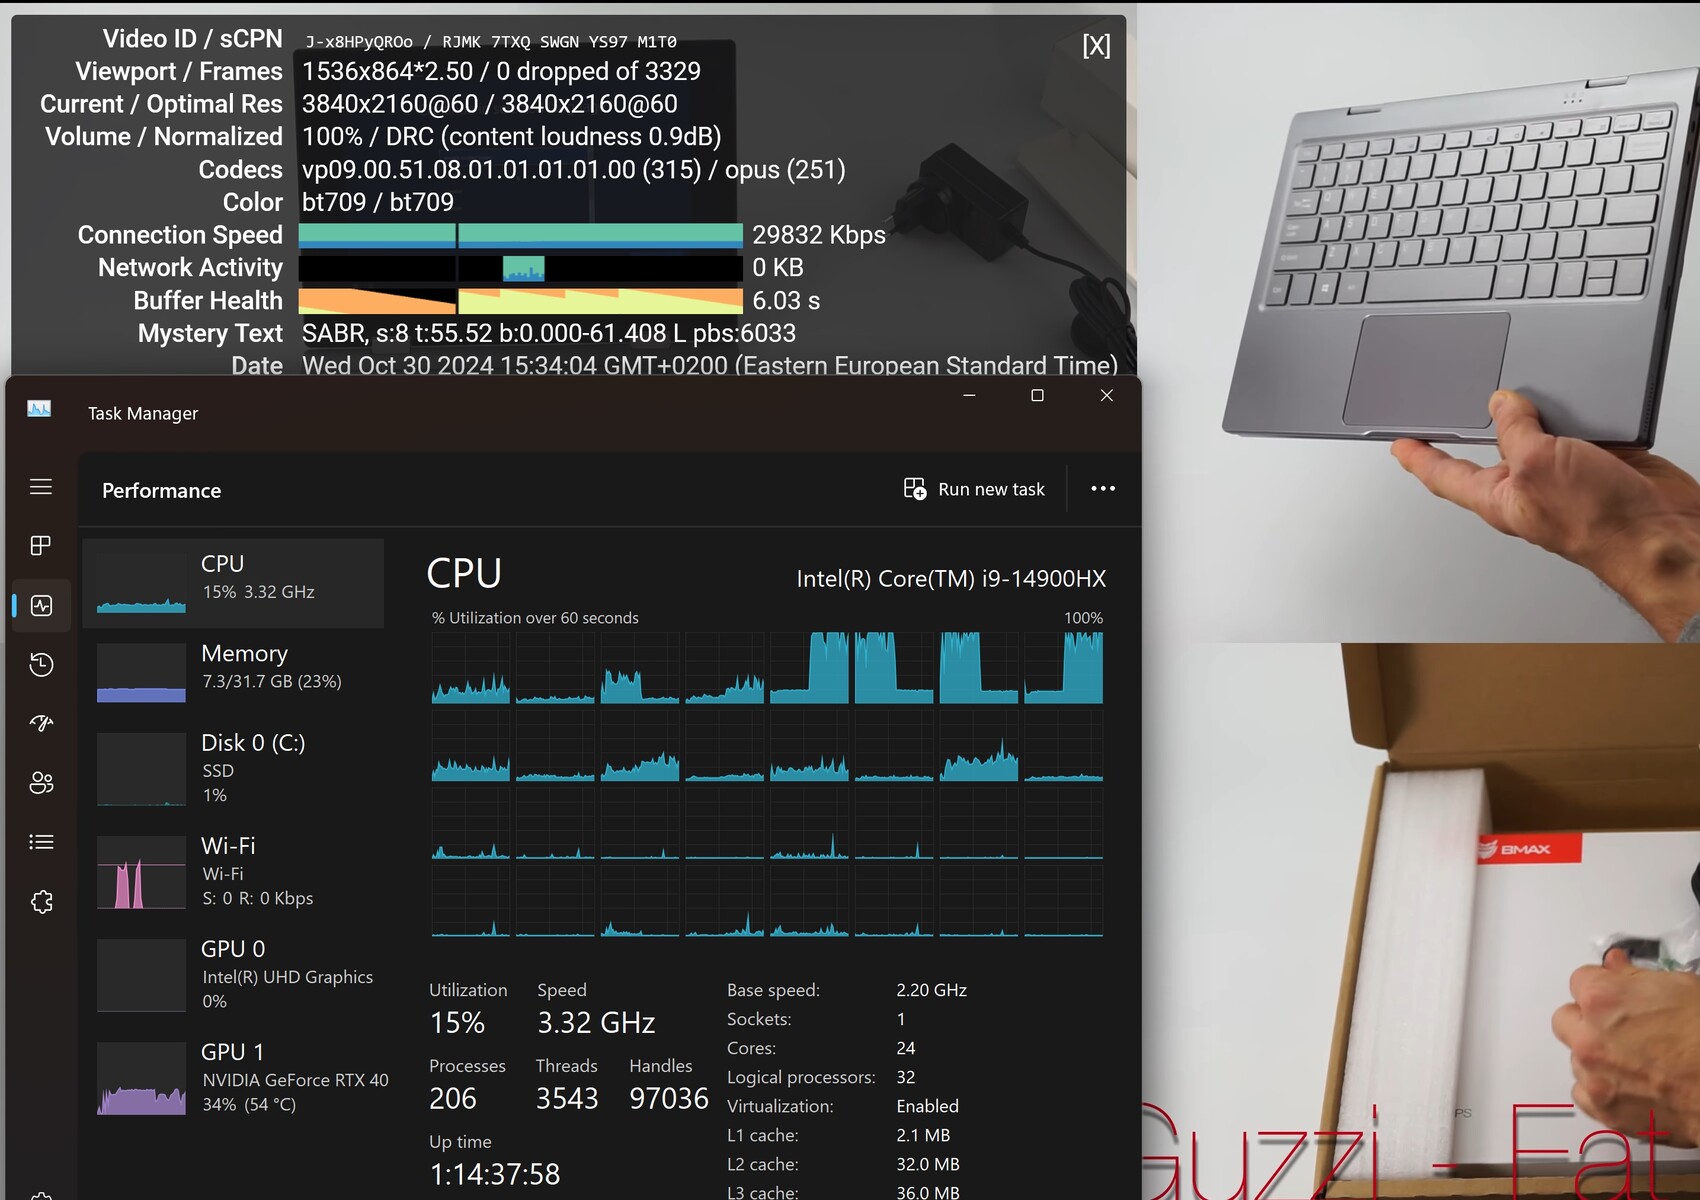
Il Key 17 Pro M24 di Schenker ha la seconda latenza più alta tra tutte le implementazioni i9-14900HX in questo confronto, anche se non è significativamente più alta, dato che le implementazioni migliori sono solo nella fascia dei 1000 microsecondi. L'i9-13900HX di Gigabyte e l'i9-14900HX dello Zbook Fury sembrano significativamente peggiori, con una latenza di 11000 - 12000+ microsecondi. Latencymon suggerisce che la latenza di 1,9K μs è troppo alta per l'audio in tempo reale combinato con altre attività, quindi questo potrebbe avere un impatto negativo sulla creazione di contenuti come l'editing video. Tuttavia, la riproduzione di video a 4K@60 fps da Youtube non mostra alcuna caduta di fotogrammi e un utilizzo della CPU relativamente basso.
| DPC Latencies / LatencyMon - interrupt to process latency (max), Web, Youtube, Prime95 | |
| Aorus 17X AZF | |
| HP ZBook Fury 16 G11 | |
| Schenker Key 17 Pro (M24) | |
| Eurocom Raptor X17 Core i9-14900HX | |
| Asus ROG Strix Scar 17 G733PYV-LL053X | |
* ... Meglio usare valori piccoli
Dispositivi di archiviazione
L'SSD 990 Pro L'SSD PCIe 4.0 da 1 TB di Samsung risulta mediamente più veloce rispetto a tutti gli altri modelli di SSD, ad eccezione di Corsair MP700 Corsair MP700che è un PCIe 5.0 soluzione PCIe 5.0. L'SSD Samsung è anche più veloce del 14% rispetto alla media registrata tra gli altri modelli di laptop che ne sono dotati. Nel ciclo di throttling, l'unità Samsung 990 Pro non mostra variazioni significative, a parte le prime corse, anche se la velocità massima sembra essere inferiore di qualche punto percentuale rispetto alle altre unità SSD PCIe 4.0.

* ... Meglio usare valori piccoli
Disk Throttling: DiskSpd Read Loop, Queue Depth 8
Prestazioni della GPU
Le prestazioni di gioco complessive collocano l'implementazione RTX 4090 di Schenker all'ultimo posto, anche se ancora una volta non ha un ritardo eccessivo (al massimo il 9%) rispetto ai concorrenti più veloci basati su Intel. Il laptop Asus basato su AMD è tuttavia più veloce del 16%.
Uno strano comportamento si registra nell'esecuzione di Cyberpunk 2077 1080p ultra di 30 minuti, dove l'RTX 4090 di Schenker scende a meno di 20 fps ogni 5 minuti circa, anche se la media dei fps rimane superiore a 100.
Inoltre, le prestazioni della GPU si riducono drasticamente in modalità batteria. Ad esempio, lo stress test Furmark registra solo 30 fps in media, mentre con l'alimentatore collegato, registra 581 fps. Allo stesso modo, Cyberpunk 2077 1080p ultra e Fire Strike funzionano a circa 30 fps a batteria. Le prestazioni della GPU si riducono anche di molto quando si limita l'alimentazione alla modalità bilanciata (intrattenimento) o a quella di risparmio energetico (silenziosa), come si evince dal benchmark Fire Strike.
| Profilo energetico | Punteggio grafico | Punteggio Fisica | Punteggio combinato |
| Modalità Prestazioni | 45600 | 30619 | 10857 |
| Modalità Intrattenimento | 34723 (-24%) | 19943 (-35%) | 6499 (-41%) |
| Modalità Tranquilla | 30603 (-33%) | 17142 (-44%) | 4452 (-59%) |
| Potenza della batteria | 6899 (-85%) | 9512 (-69%) | 3095 (-72%) |
| 3DMark Performance rating - Percent | |
| Asus ROG Strix Scar 17 G733PYV-LL053X -1! | |
| Media NVIDIA GeForce RTX 4090 Laptop GPU | |
| Eurocom Raptor X17 Core i9-14900HX -1! | |
| Aorus 17X AZF | |
| Schenker Key 17 Pro (M24) | |
| Media della classe Workstation | |
| HP ZBook Fury 16 G11 -1! | |
| 3DMark 11 Performance | 40366 punti | |
| 3DMark Cloud Gate Standard Score | 59382 punti | |
| 3DMark Fire Strike Score | 32725 punti | |
| 3DMark Time Spy Score | 18674 punti | |
Aiuto | ||
* ... Meglio usare valori piccoli
| Performance rating - Percent | |
| Asus ROG Strix Scar 17 G733PYV-LL053X -1! | |
| Eurocom Raptor X17 Core i9-14900HX -2! | |
| Aorus 17X AZF -3! | |
| Schenker Key 17 Pro (M24) | |
| HP ZBook Fury 16 G11 -1! | |
| Media della classe Workstation | |
| Cyberpunk 2077 - 1920x1080 Ultra Preset (FSR off) | |
| Asus ROG Strix Scar 17 G733PYV-LL053X | |
| Eurocom Raptor X17 Core i9-14900HX | |
| Schenker Key 17 Pro (M24) | |
| HP ZBook Fury 16 G11 | |
| Media della classe Workstation (21.5 - 152.4, n=23, ultimi 2 anni) | |
| The Witcher 3 v4 - 1920x1080 Ultra Preset / On AA:FX | |
| Schenker Key 17 Pro (M24) | |
| Media della classe Workstation (n=1ultimi 2 anni) | |
| Baldur's Gate 3 - 1920x1080 Ultra Preset AA:T | |
| Eurocom Raptor X17 Core i9-14900HX | |
| Asus ROG Strix Scar 17 G733PYV-LL053X | |
| Schenker Key 17 Pro (M24) | |
| HP ZBook Fury 16 G11 | |
| Media della classe Workstation (23.7 - 205, n=24, ultimi 2 anni) | |
| GTA V - 1920x1080 Highest AA:4xMSAA + FX AF:16x | |
| Asus ROG Strix Scar 17 G733PYV-LL053X | |
| Eurocom Raptor X17 Core i9-14900HX | |
| Aorus 17X AZF | |
| Schenker Key 17 Pro (M24) | |
| HP ZBook Fury 16 G11 | |
| Media della classe Workstation (18.1 - 156.1, n=23, ultimi 2 anni) | |
| Final Fantasy XV Benchmark - 1920x1080 High Quality | |
| Asus ROG Strix Scar 17 G733PYV-LL053X | |
| Aorus 17X AZF | |
| Schenker Key 17 Pro (M24) | |
| HP ZBook Fury 16 G11 | |
| Media della classe Workstation (26.4 - 197.6, n=23, ultimi 2 anni) | |
| Strange Brigade - 1920x1080 ultra AA:ultra AF:16 | |
| Asus ROG Strix Scar 17 G733PYV-LL053X | |
| Eurocom Raptor X17 Core i9-14900HX | |
| Aorus 17X AZF | |
| Schenker Key 17 Pro (M24) | |
| Media della classe Workstation (93.2 - 418, n=17, ultimi 2 anni) | |
| HP ZBook Fury 16 G11 | |
| Dota 2 Reborn - 1920x1080 ultra (3/3) best looking | |
| Asus ROG Strix Scar 17 G733PYV-LL053X | |
| Eurocom Raptor X17 Core i9-14900HX | |
| Schenker Key 17 Pro (M24) | |
| Aorus 17X AZF | |
| HP ZBook Fury 16 G11 | |
| Media della classe Workstation (50.7 - 178.4, n=23, ultimi 2 anni) | |