

Recensione del Medion Erazer Defender P40: gaming laptop QHD economico e con una RTX 4060
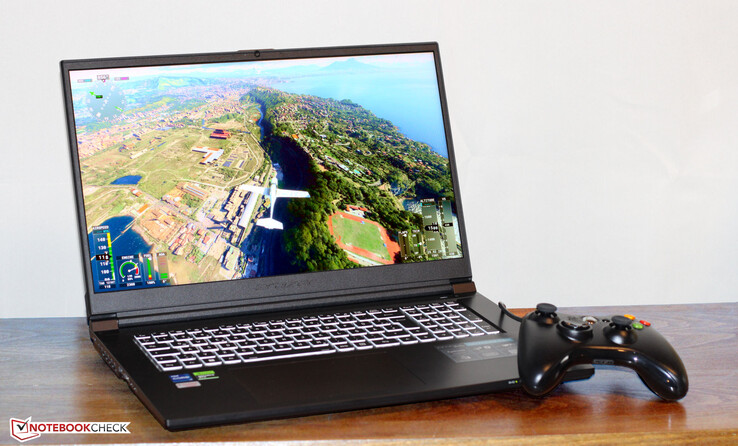
Medion ha presentato Erazer Defender P40, un computer portatile da gioco QHD di fascia media alimentato da un processore Core-i7-13700HXe da un processoreGeForce-RTX-4060gPU per computer portatili. È basato su un barebone (NP70SND) prodotto dall'azienda Clevo ed è disponibile a circa 1.900 dollari. I concorrenti includono dispositivi comeMSI Katana 17,Acer Predator Helios 300, Lenovo Legion Pro 5 16IRX8, Asus TUF Gaming A16 FA617e il Gigabyte G7 KE.
Potenziali concorrenti a confronto
Punteggio | Data | Modello | Peso | Altezza | Dimensione | Risoluzione | Prezzo |
|---|---|---|---|---|---|---|---|
| 84.6 % v7 (old) | 05/2023 | Medion Erazer Defender P40 i7-13700HX, NVIDIA GeForce RTX 4060 Laptop GPU | 2.9 kg | 33 mm | 17.30" | 2560x1440 | |
| 82.1 % v7 (old) | 02/2023 | MSI Katana 17 B13VFK i7-13620H, NVIDIA GeForce RTX 4060 Laptop GPU | 2.8 kg | 25.2 mm | 17.30" | 1920x1080 | |
| 86.5 % v7 (old) | 11/2022 | Acer Predator Helios 300 (i7-12700H, RTX 3070 Ti) i7-12700H, GeForce RTX 3070 Ti Laptop GPU | 3 kg | 27.65 mm | 17.30" | 2560x1440 | |
| 87.9 % v7 (old) | 05/2023 | Lenovo Legion Pro 5 16IRX8 i7-13700HX, NVIDIA GeForce RTX 4060 Laptop GPU | 2.5 kg | 26.8 mm | 16.00" | 2560x1600 | |
| 86.2 % v7 (old) | 02/2023 | Asus TUF Gaming A16 FA617 R7 7735HS, Radeon RX 7600S | 2.2 kg | 27 mm | 16.00" | 1920x1200 | |
| 83.3 % v7 (old) | 01/2023 | Gigabyte G7 KE i5-12500H, GeForce RTX 3060 Laptop GPU | 2.6 kg | 25 mm | 17.30" | 1920x1080 |
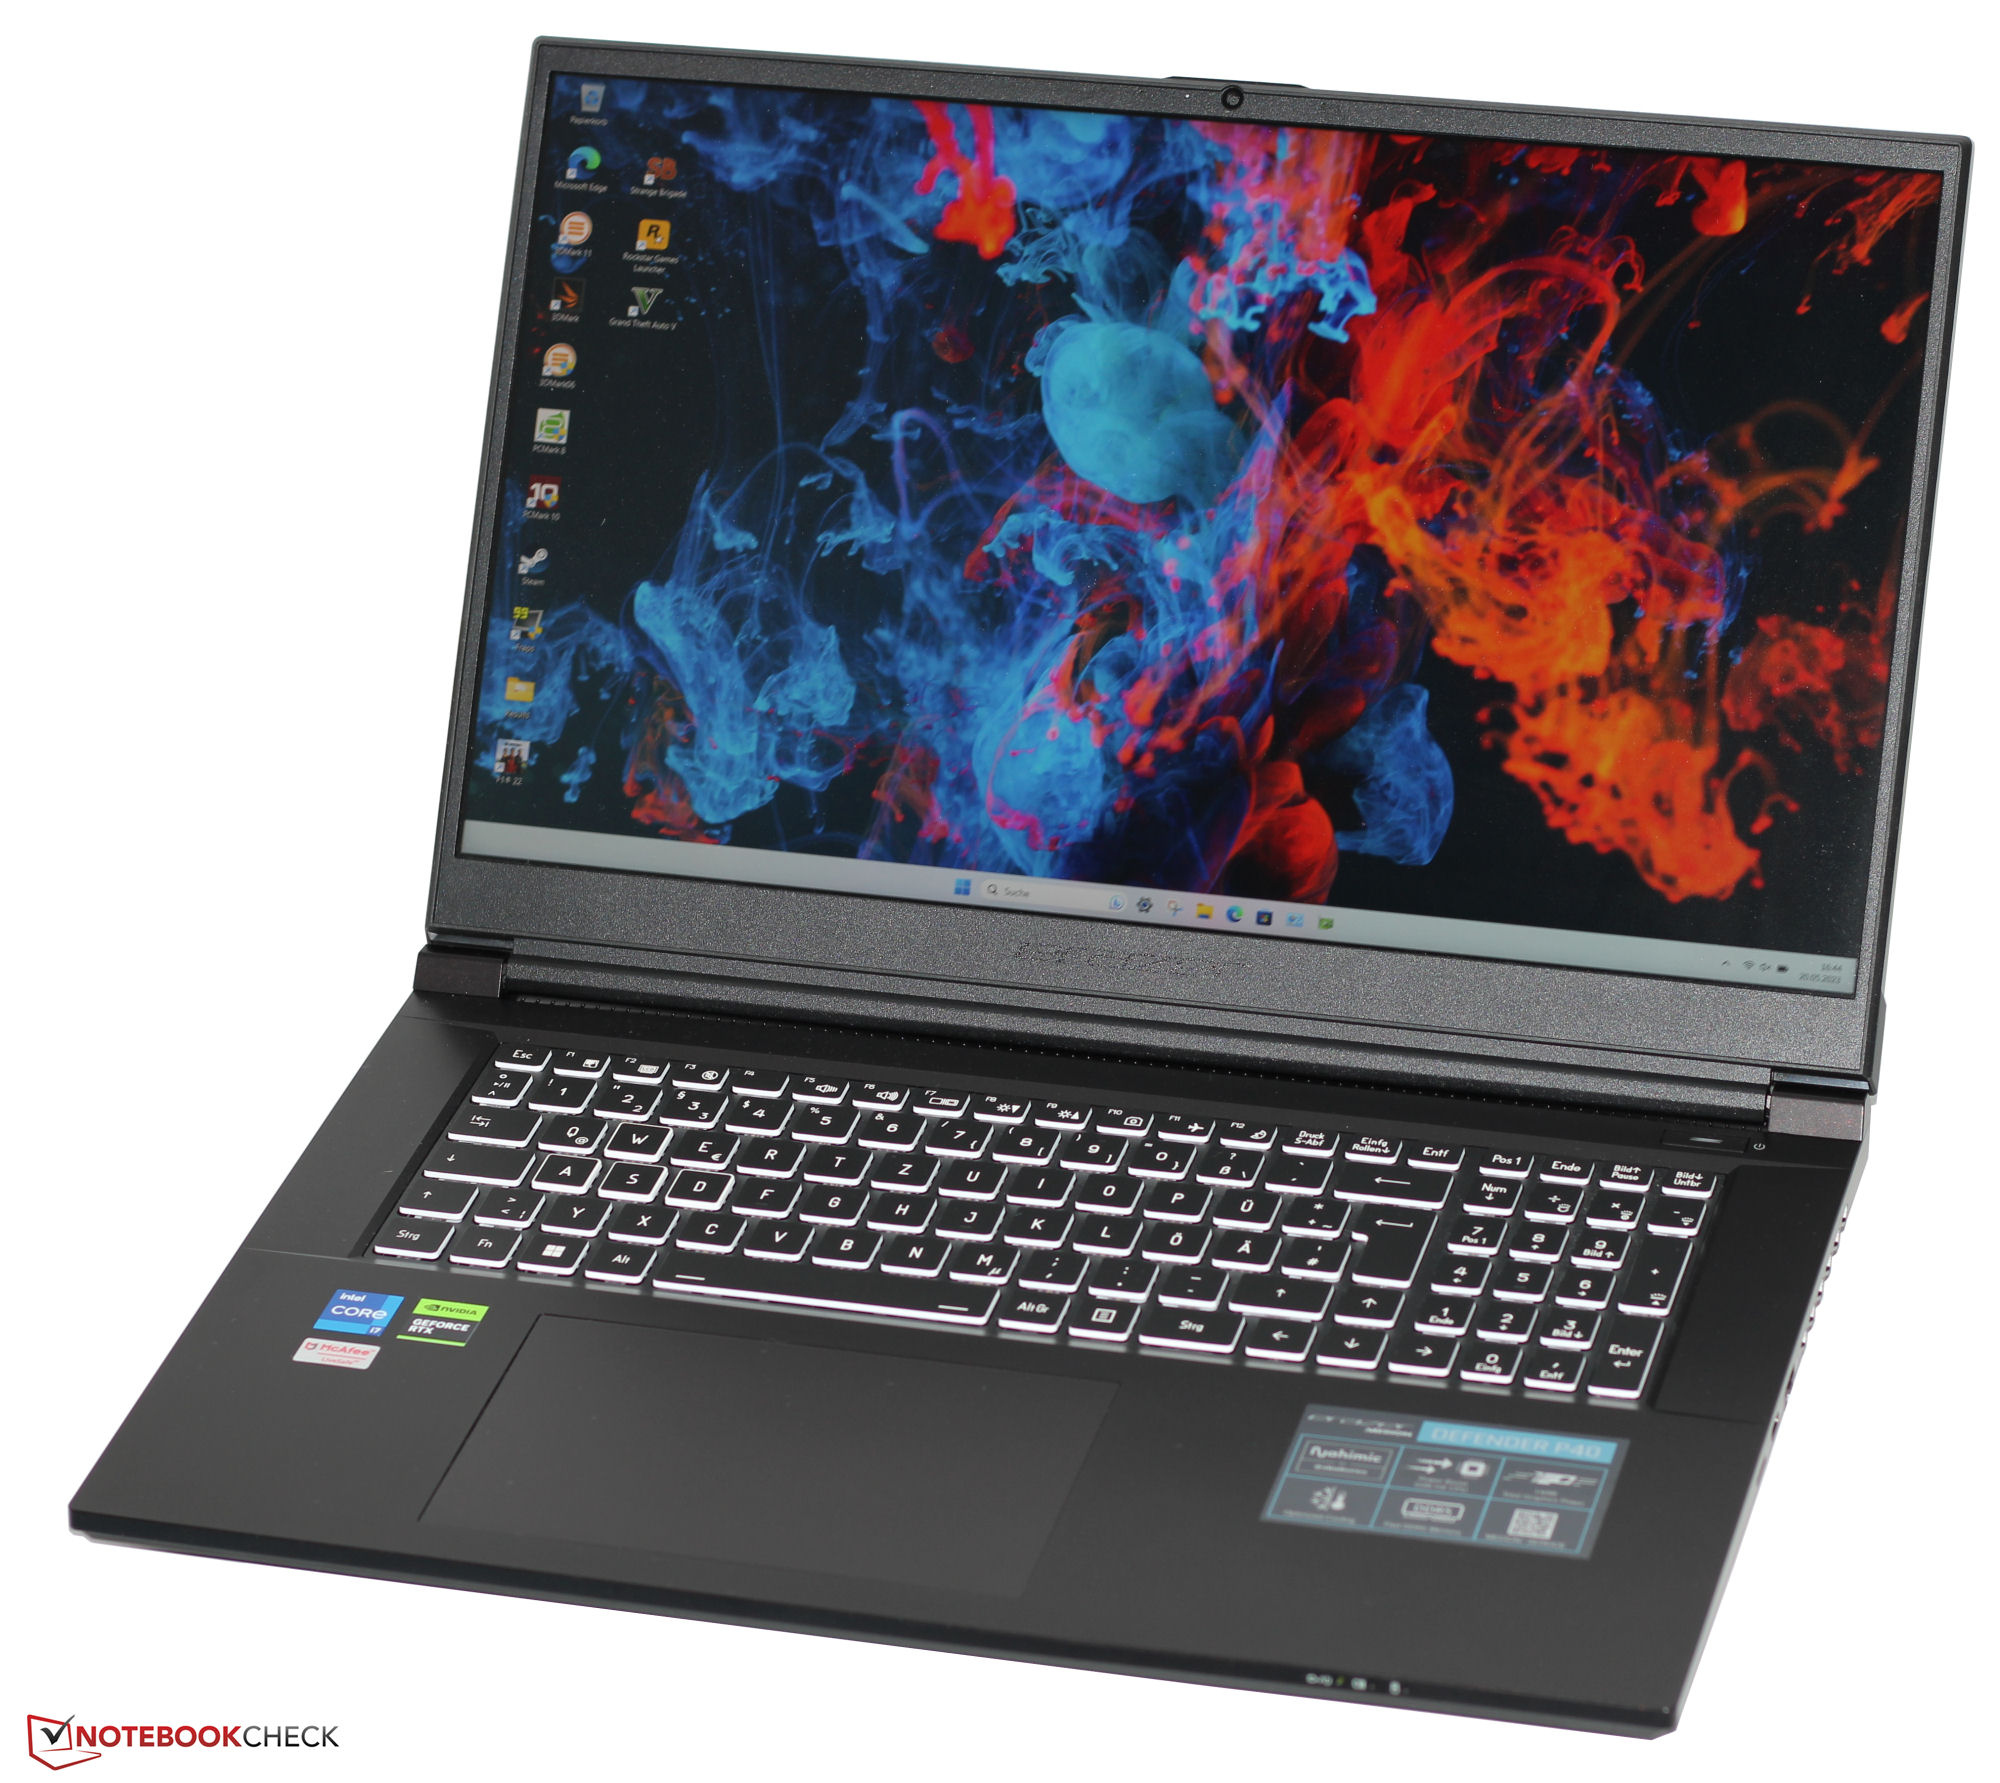
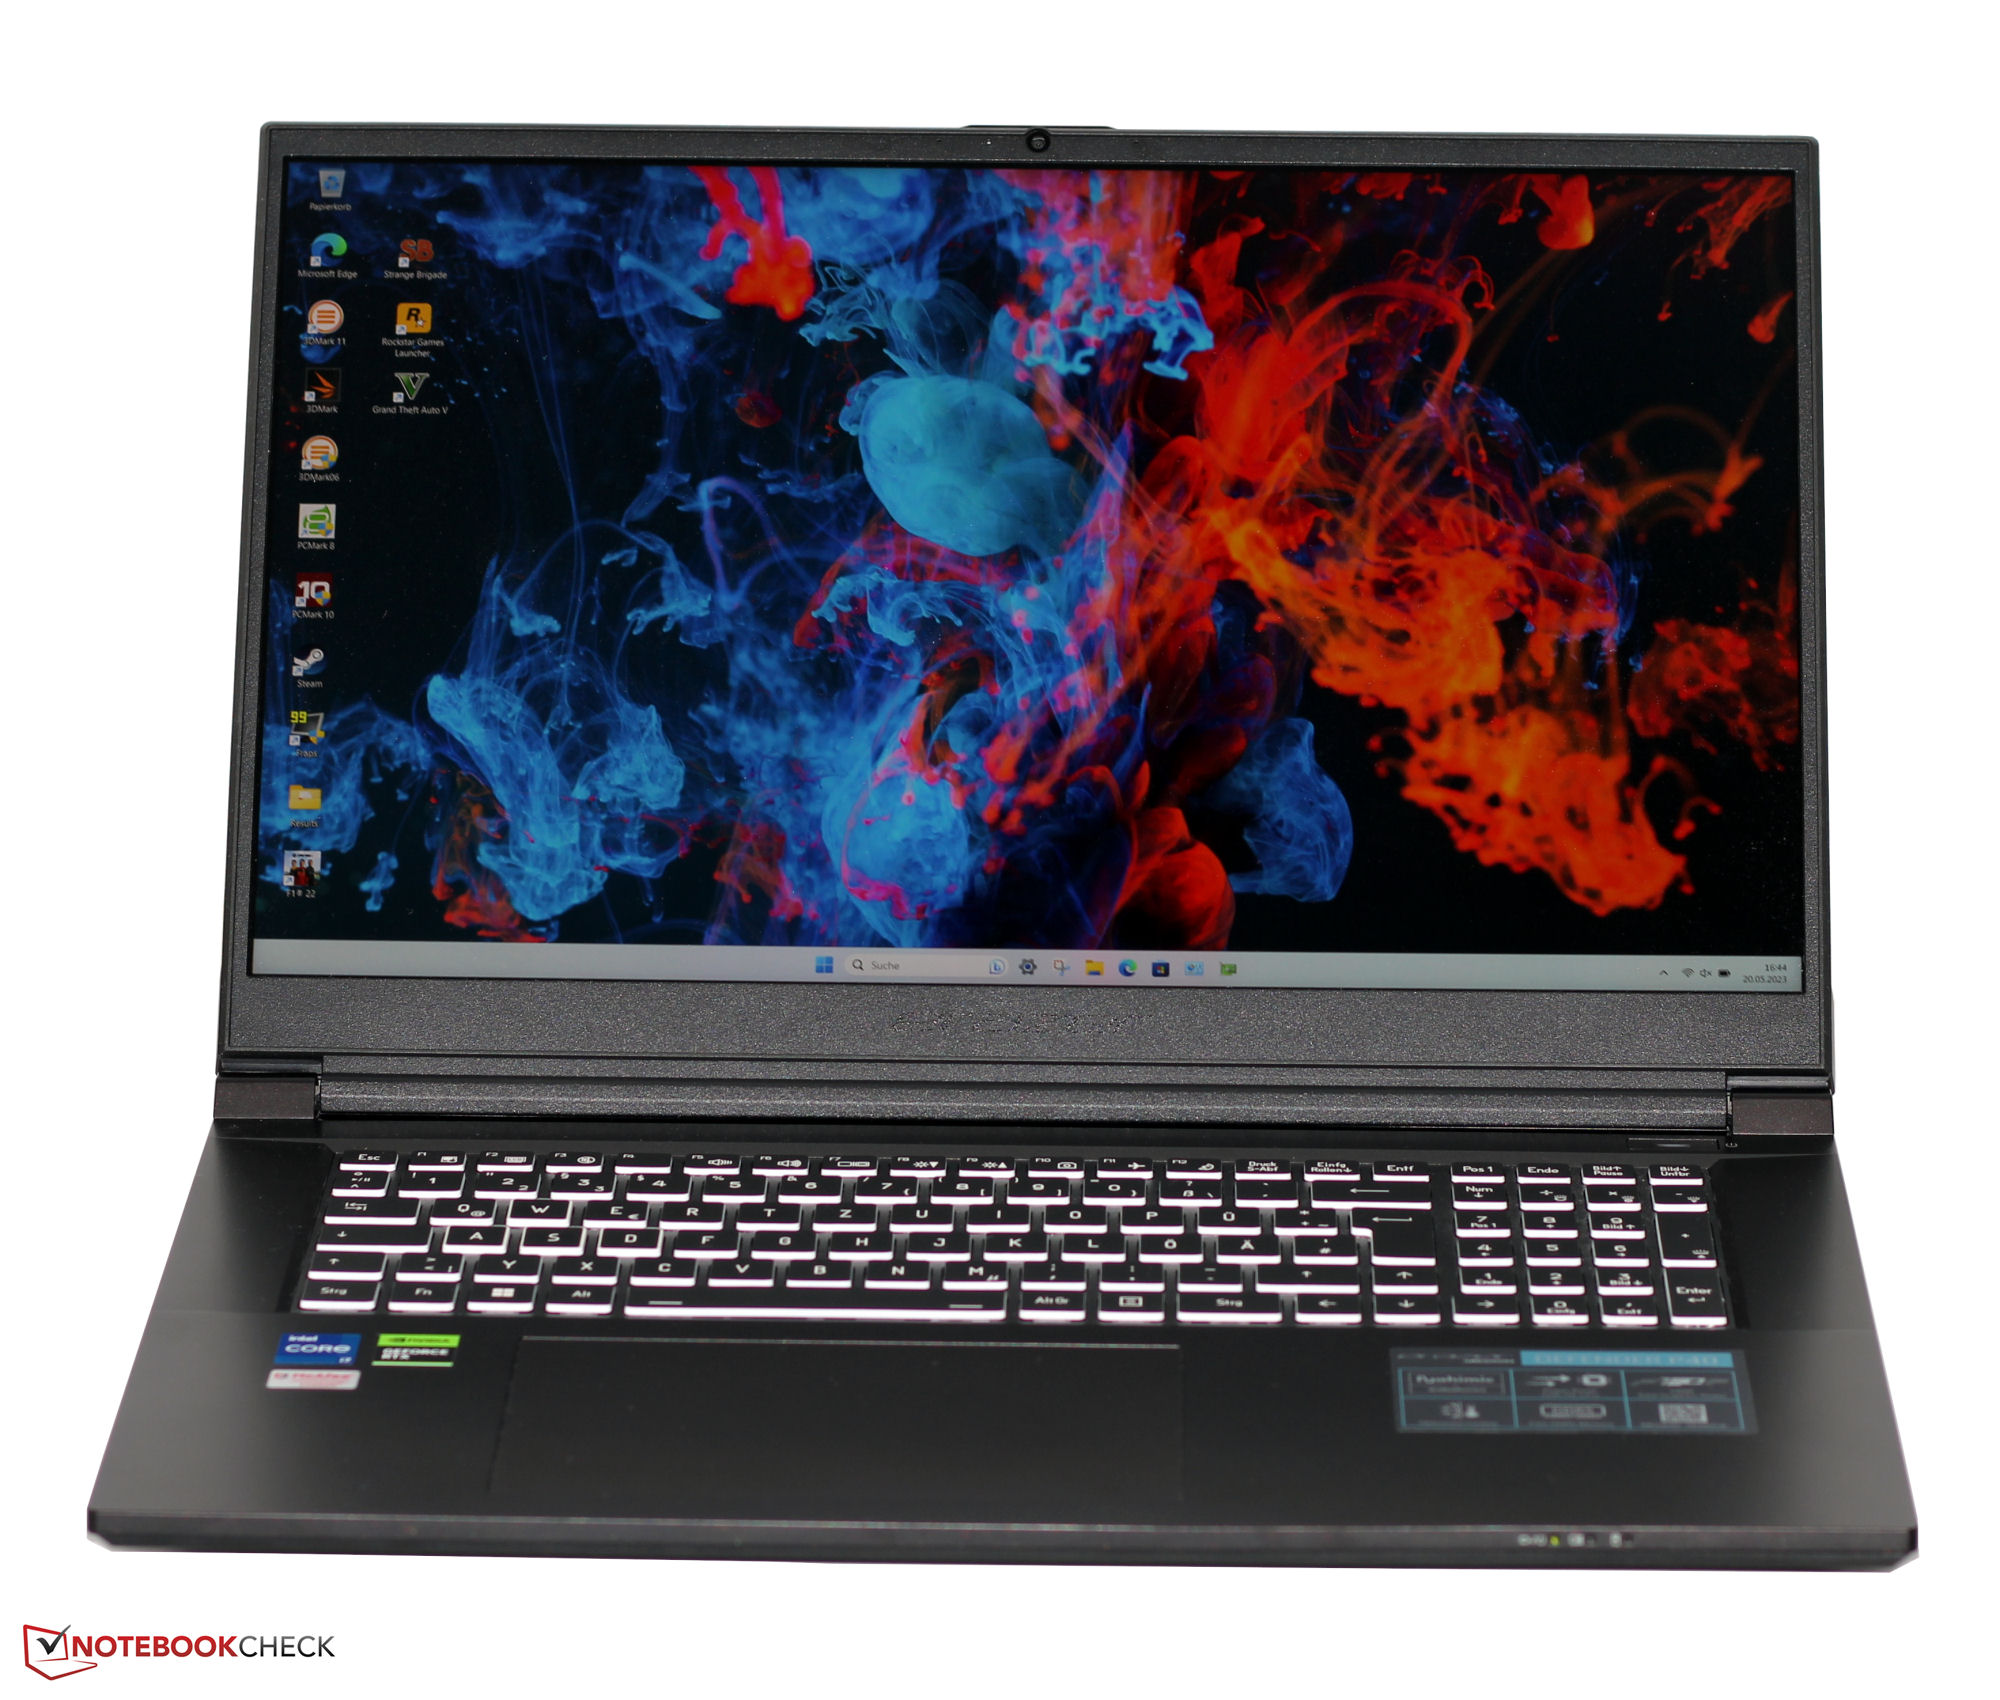
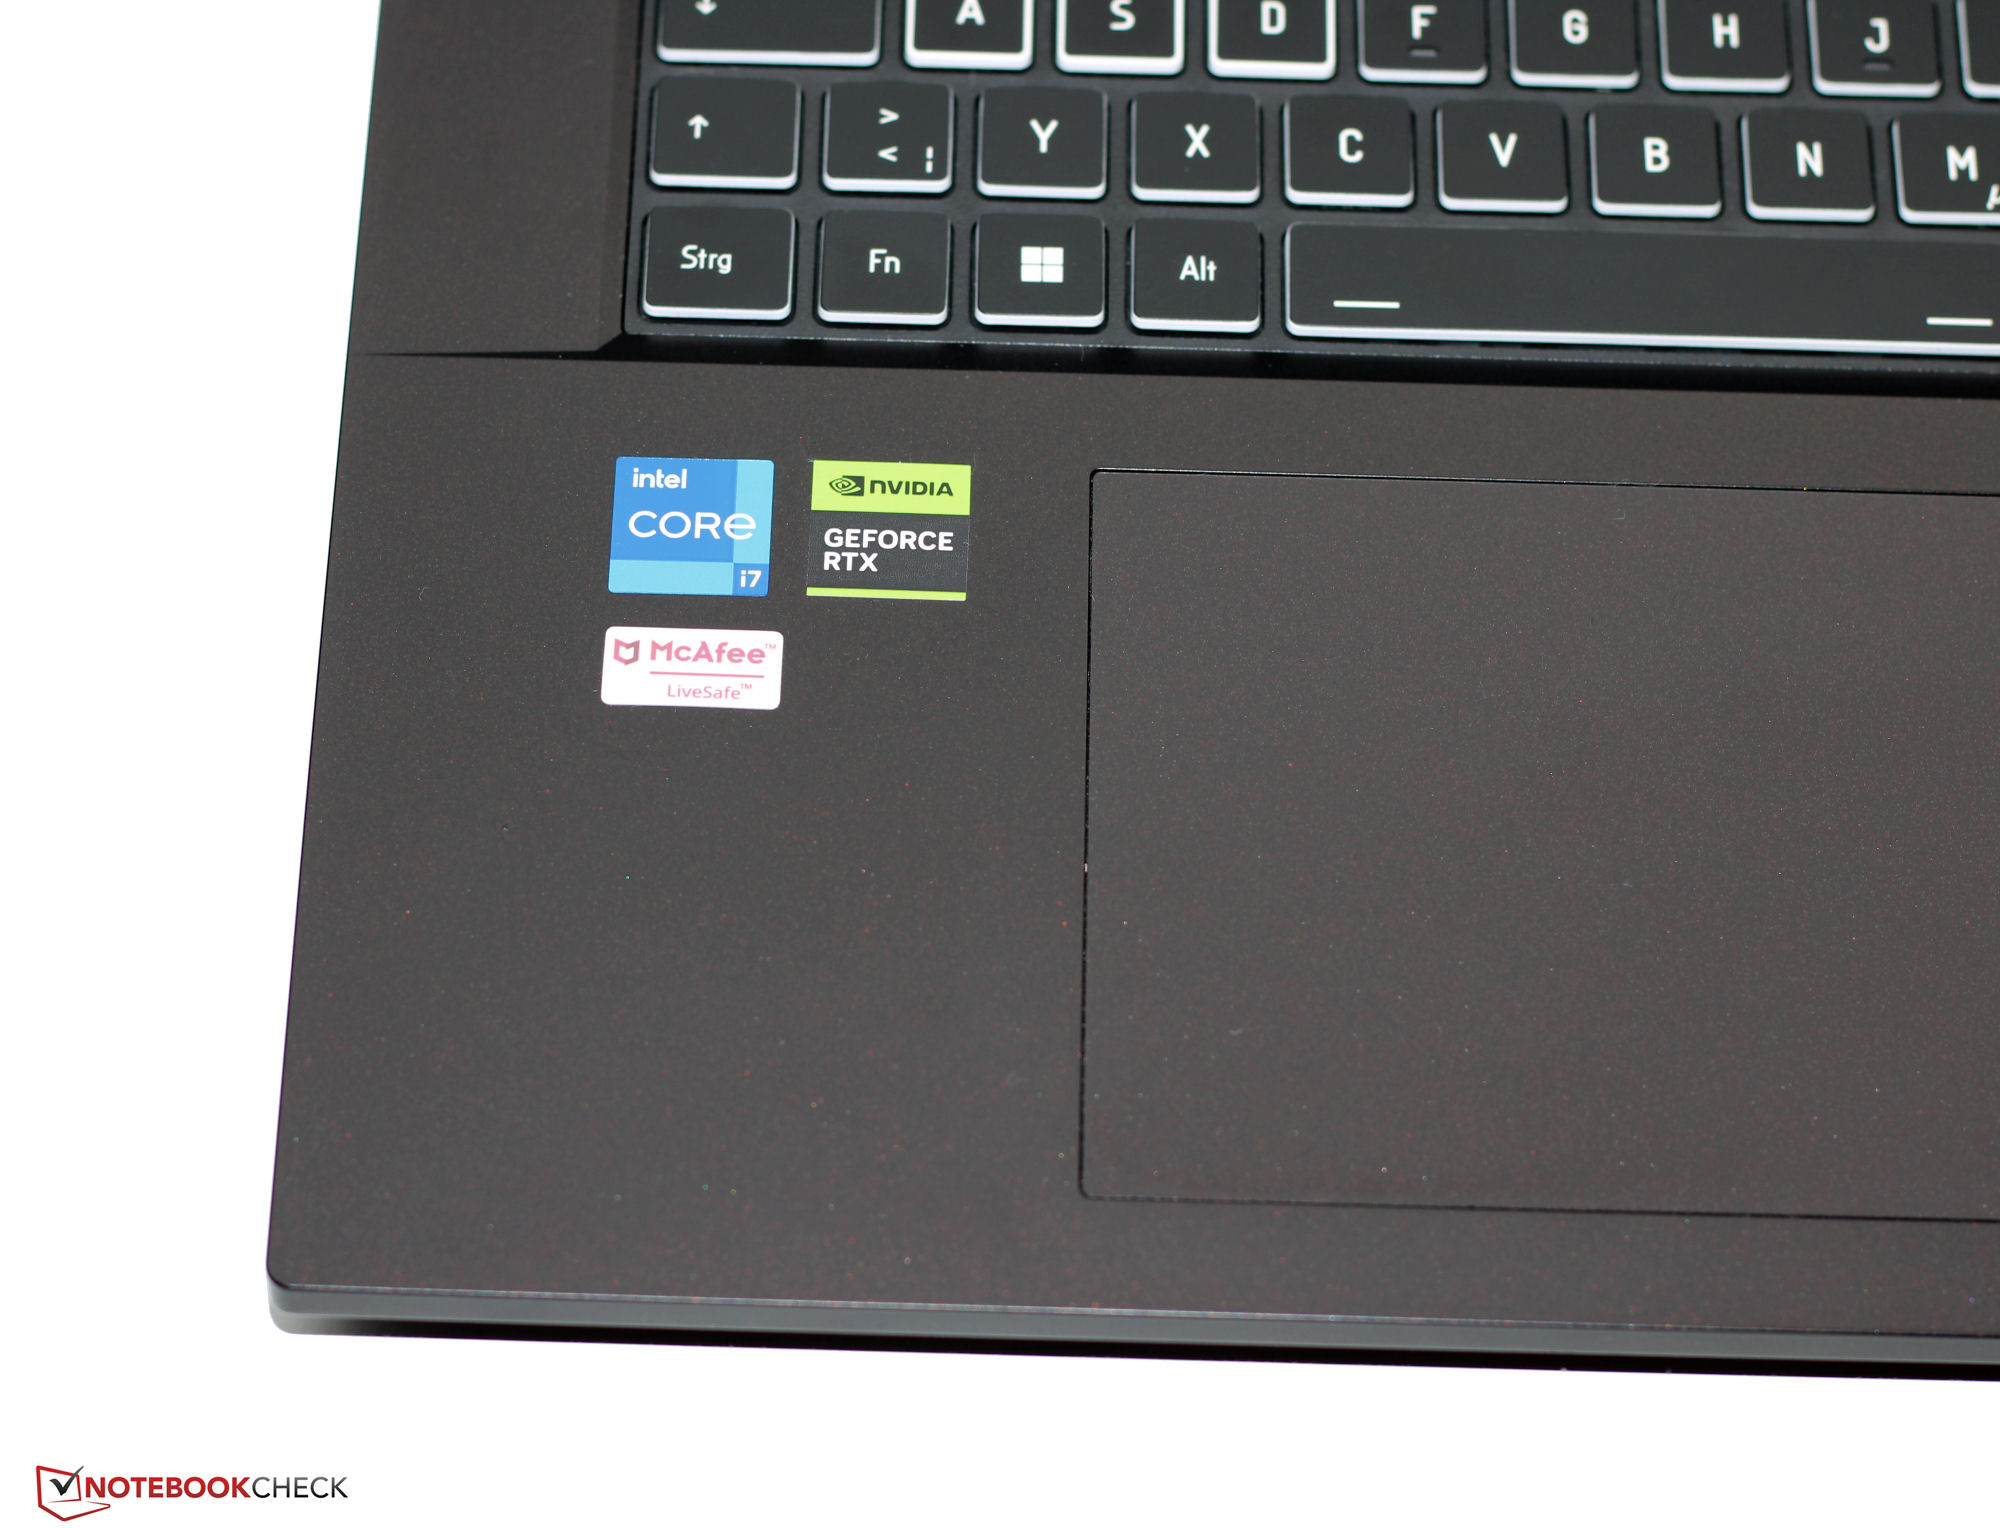
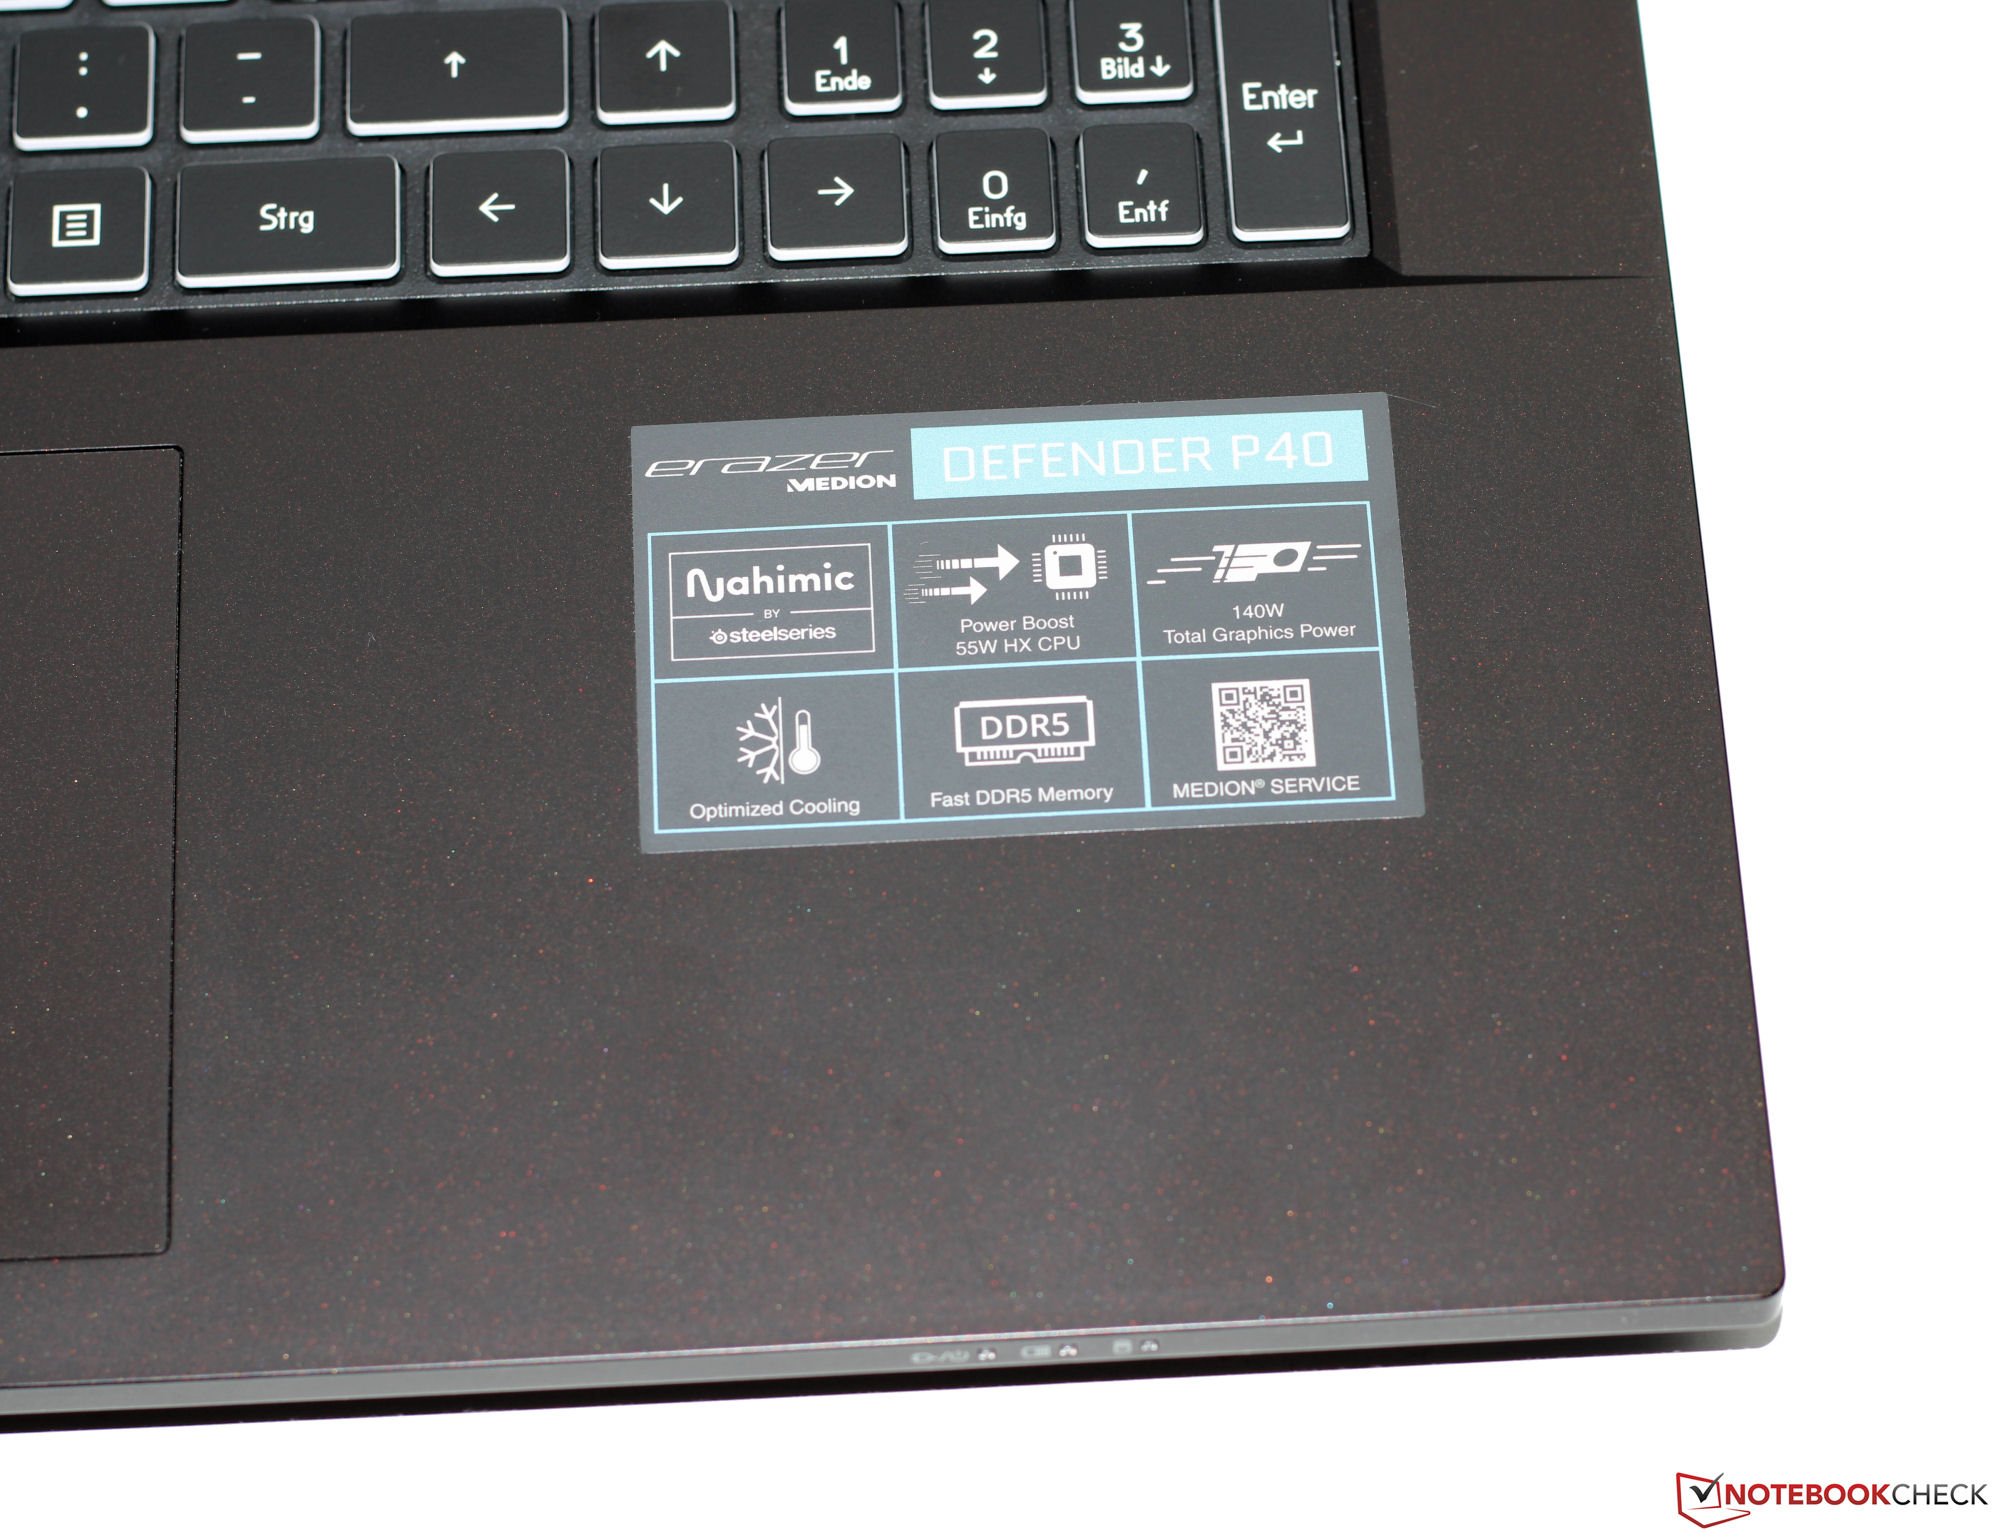
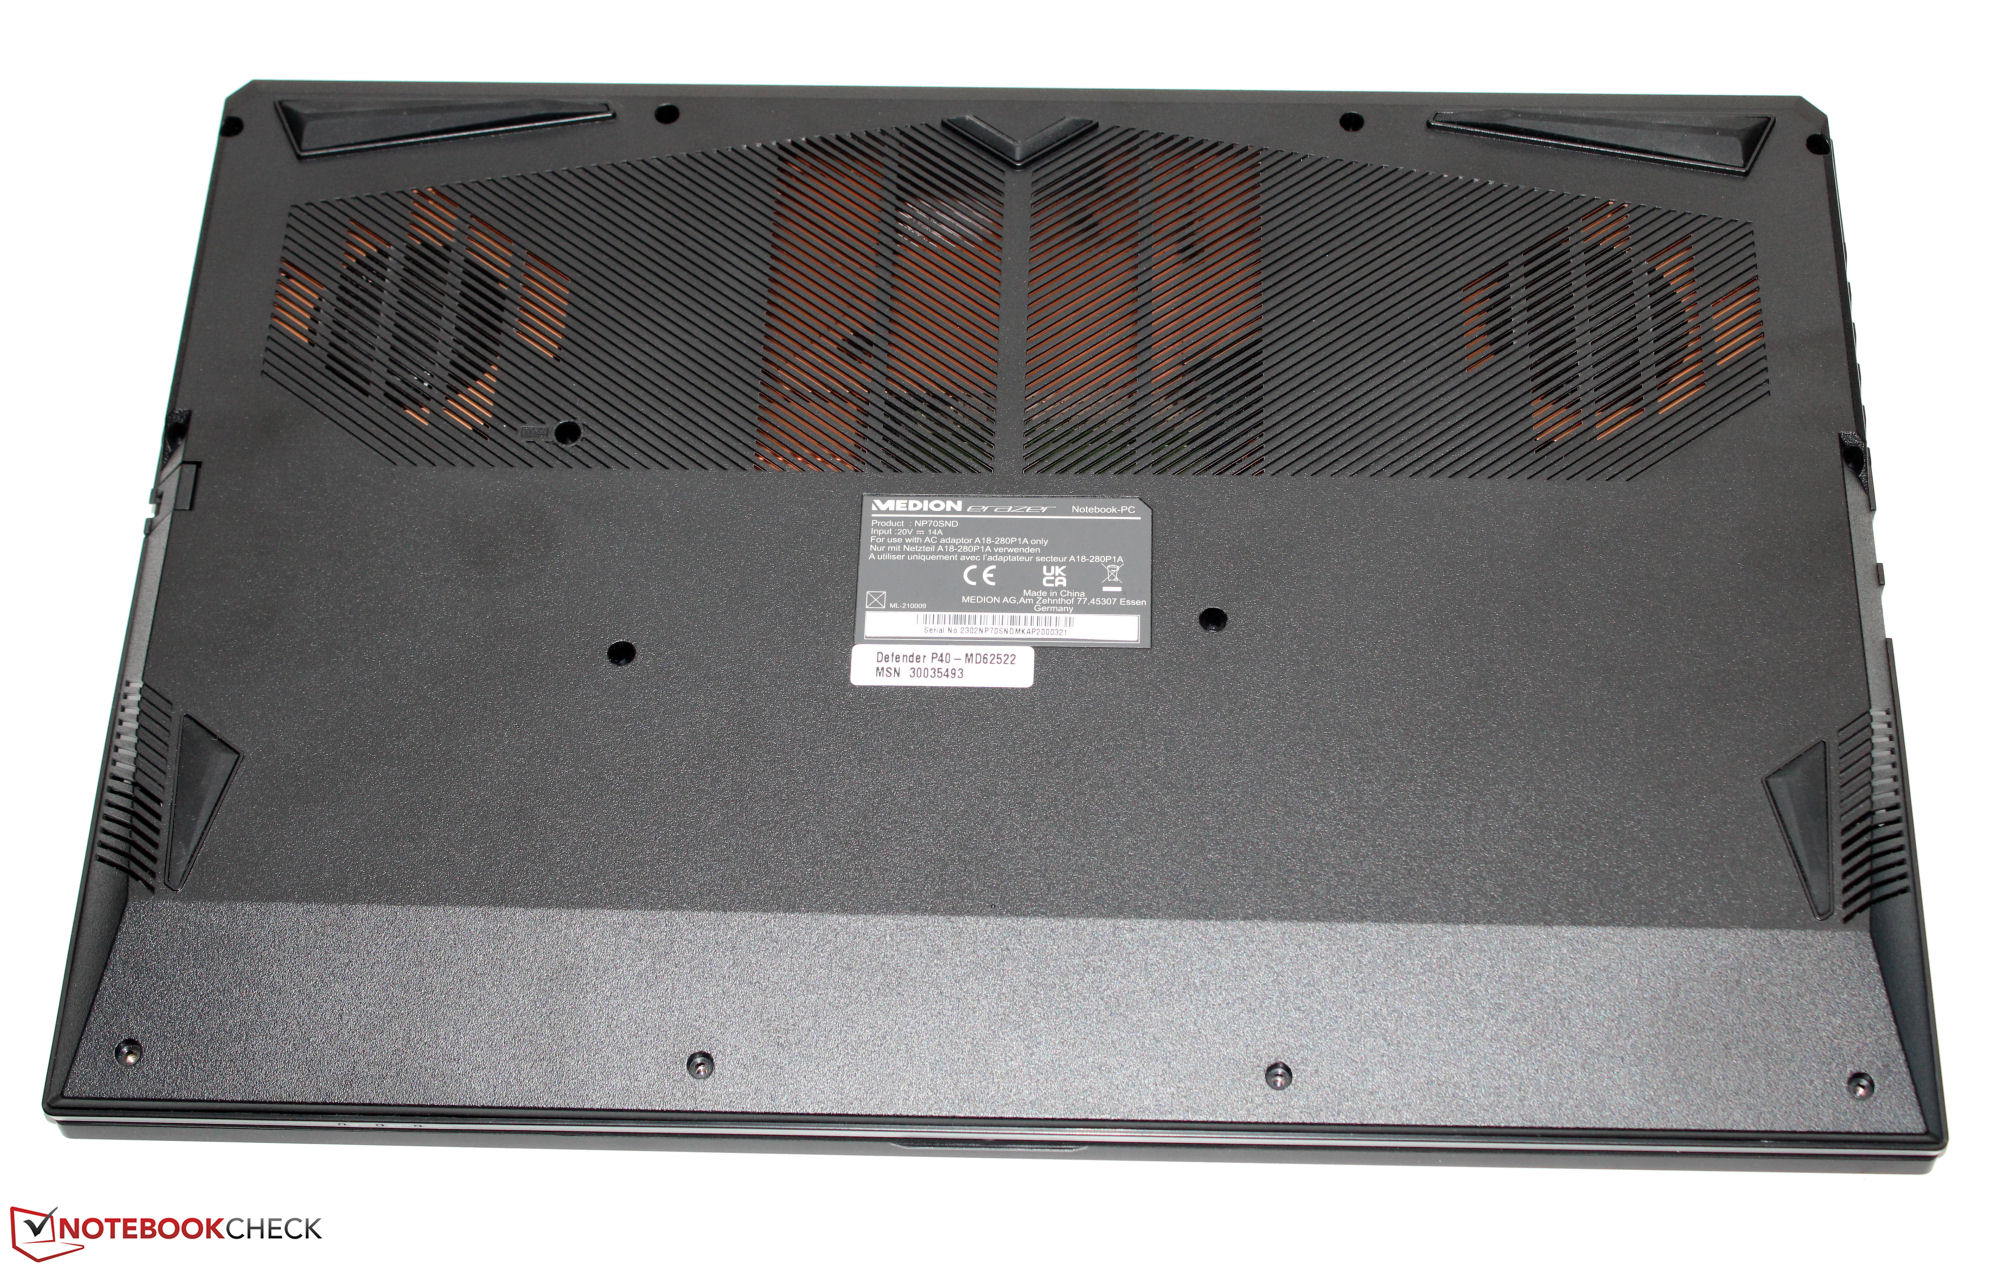
Custodia - Il P40 ha una custodia in plastica
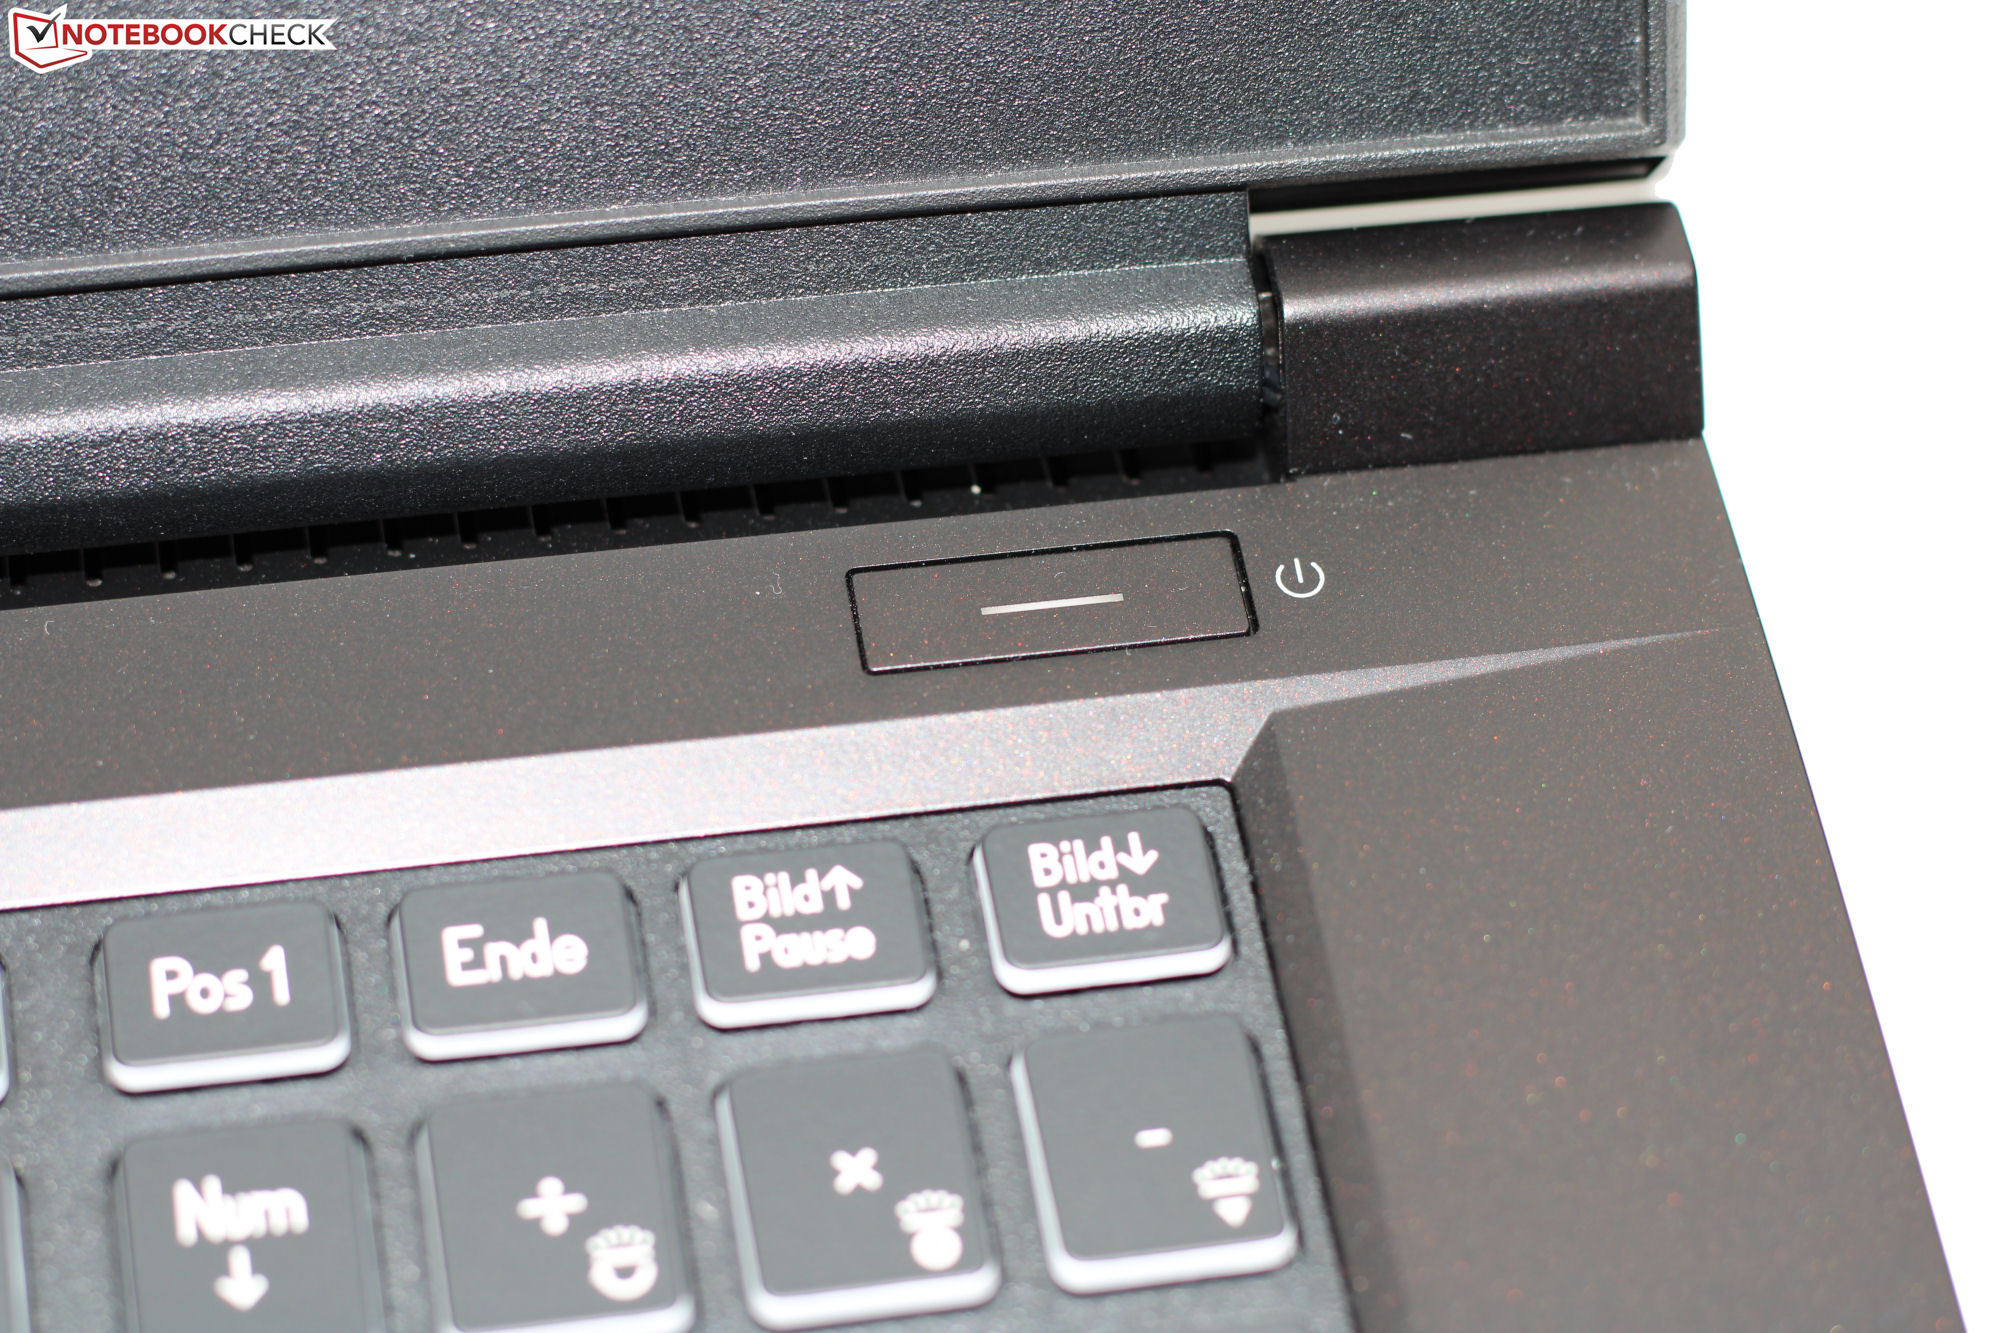
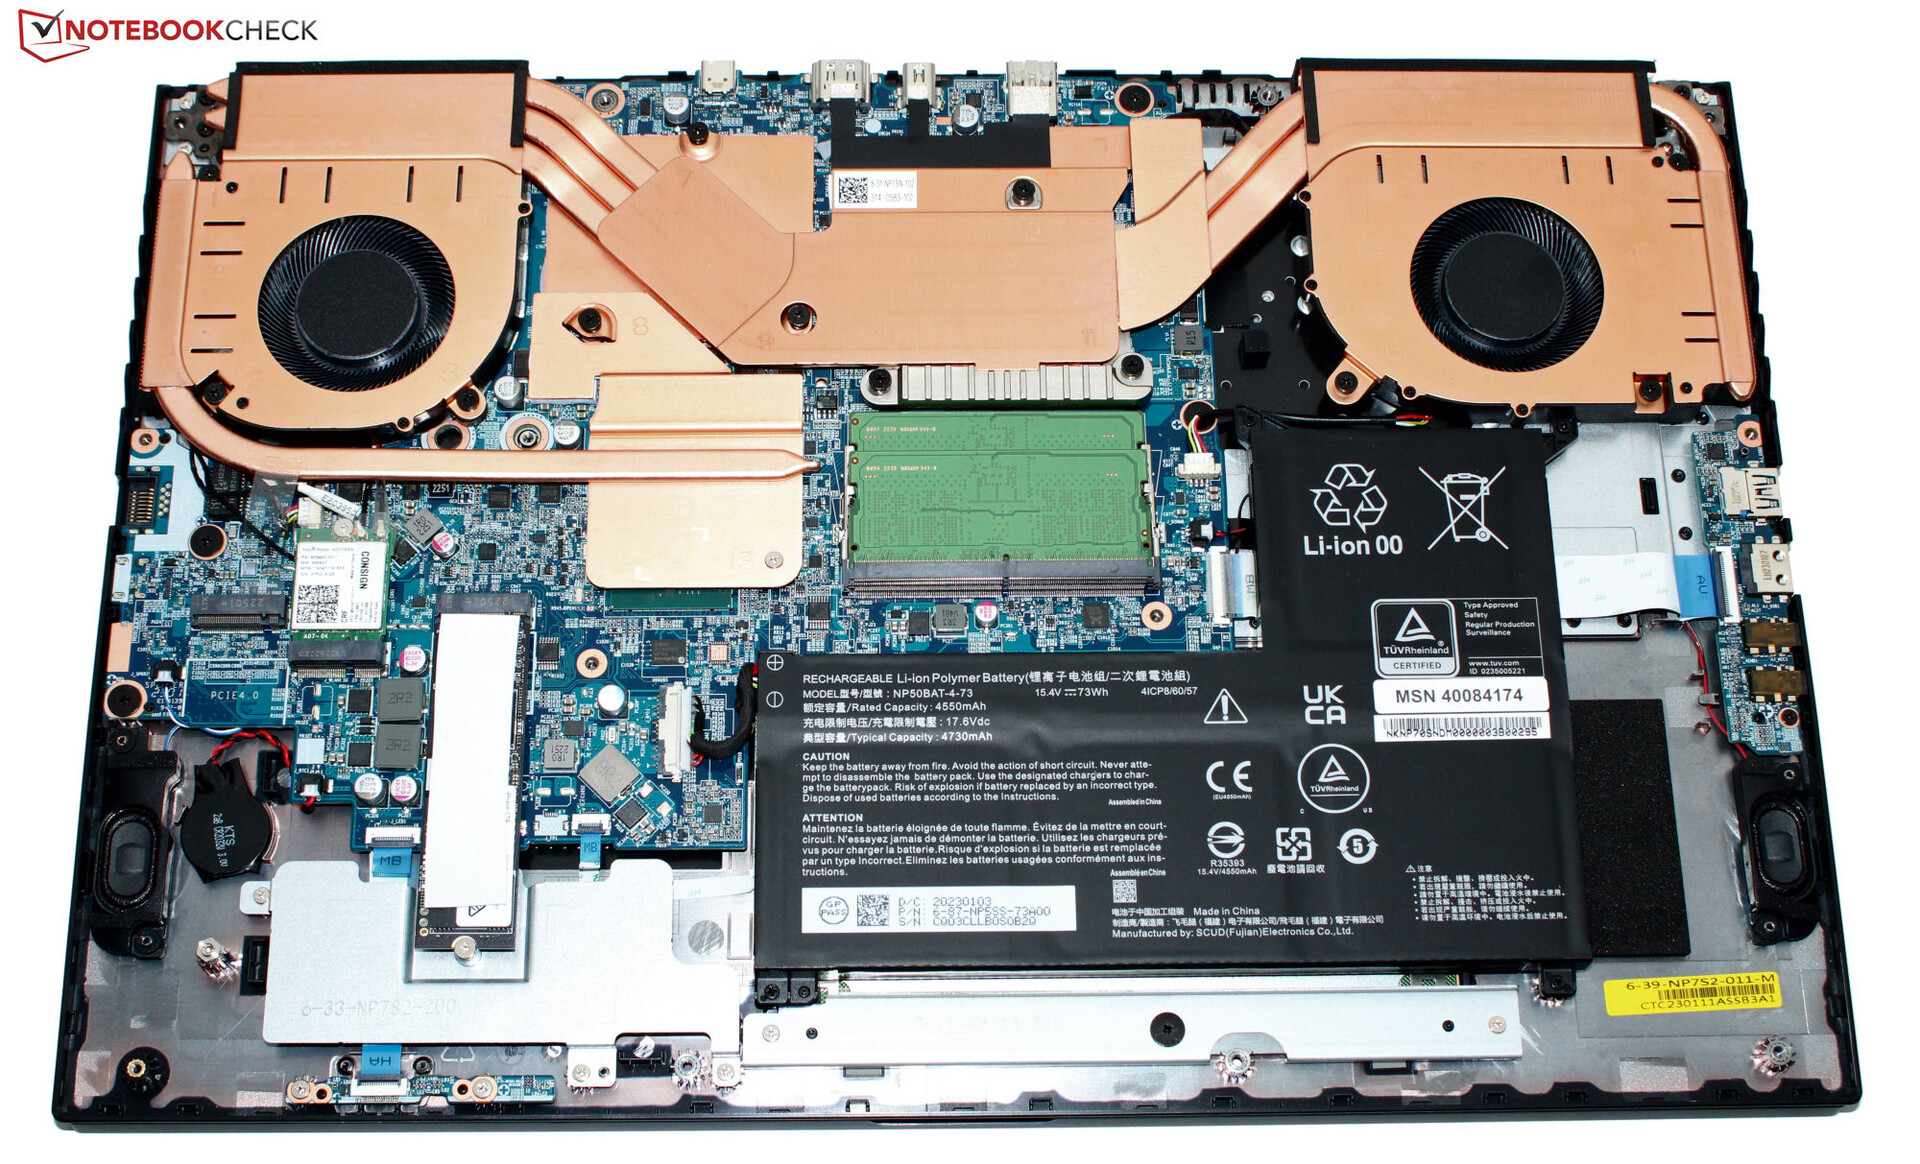
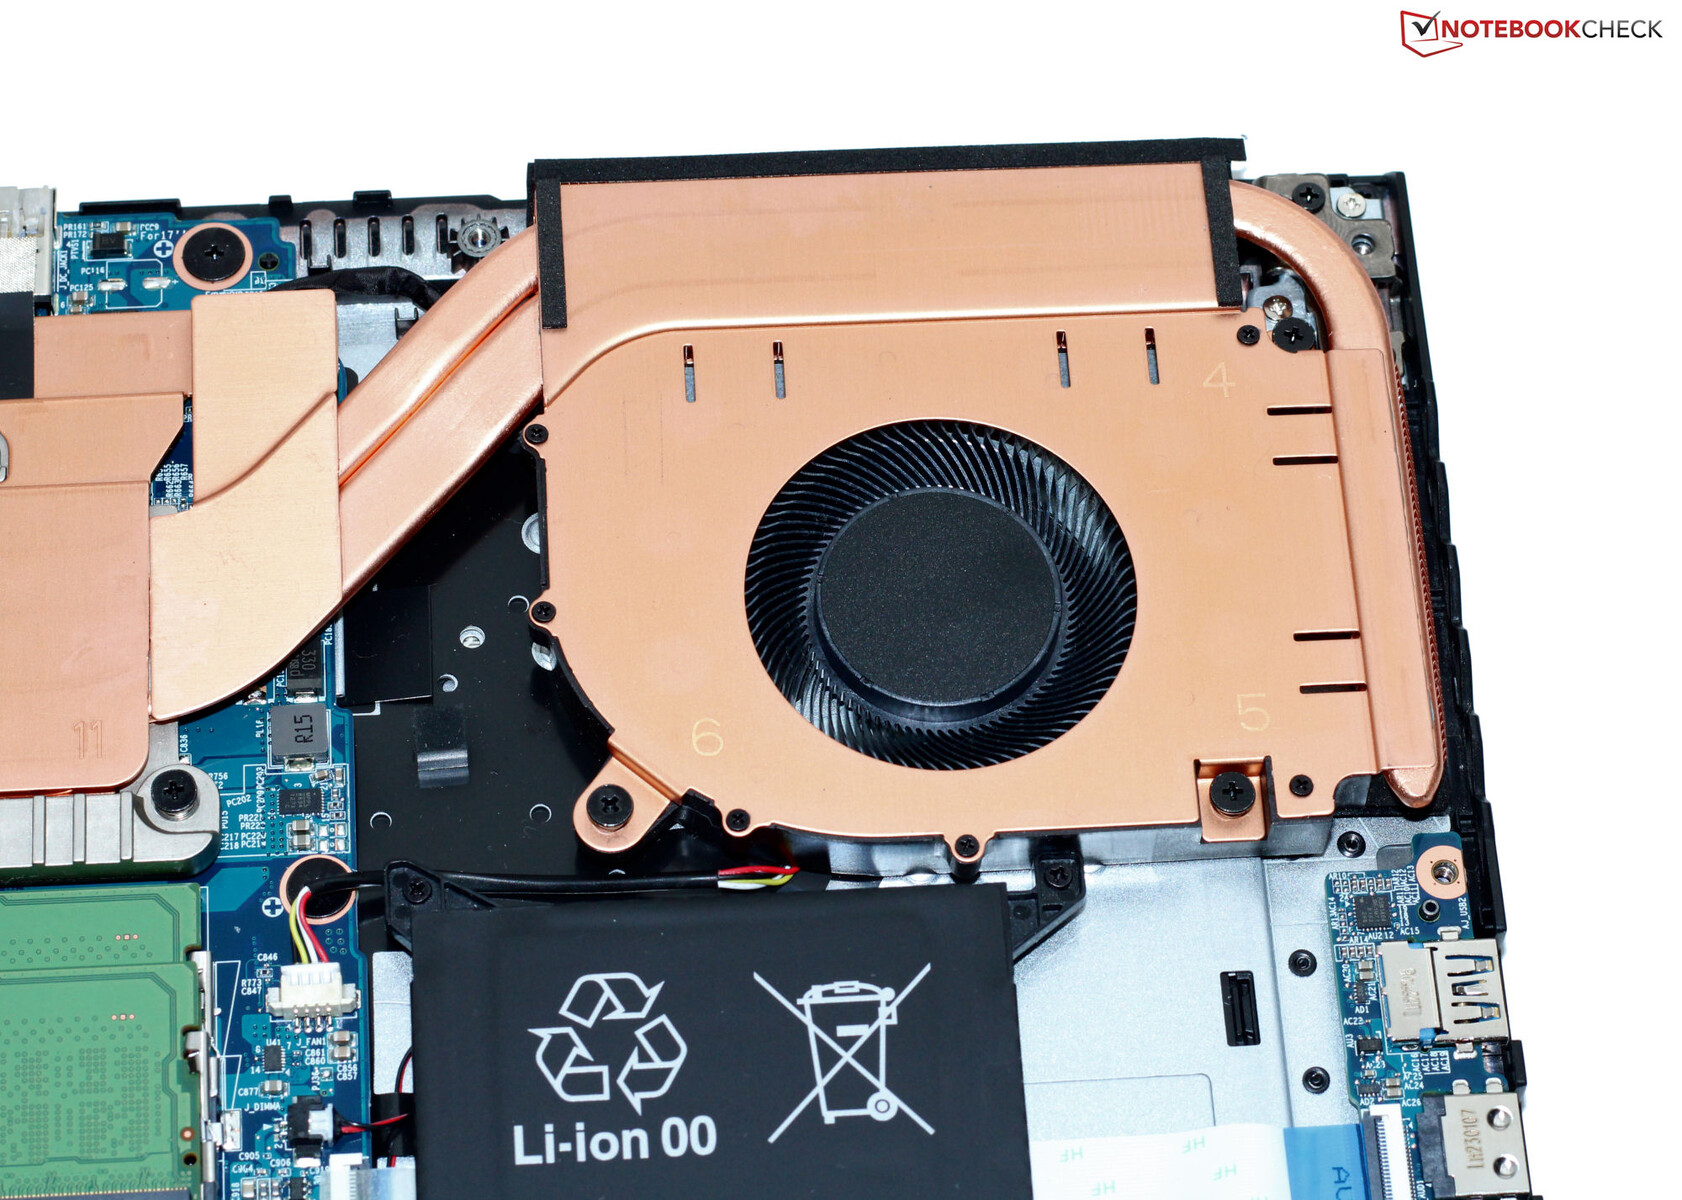
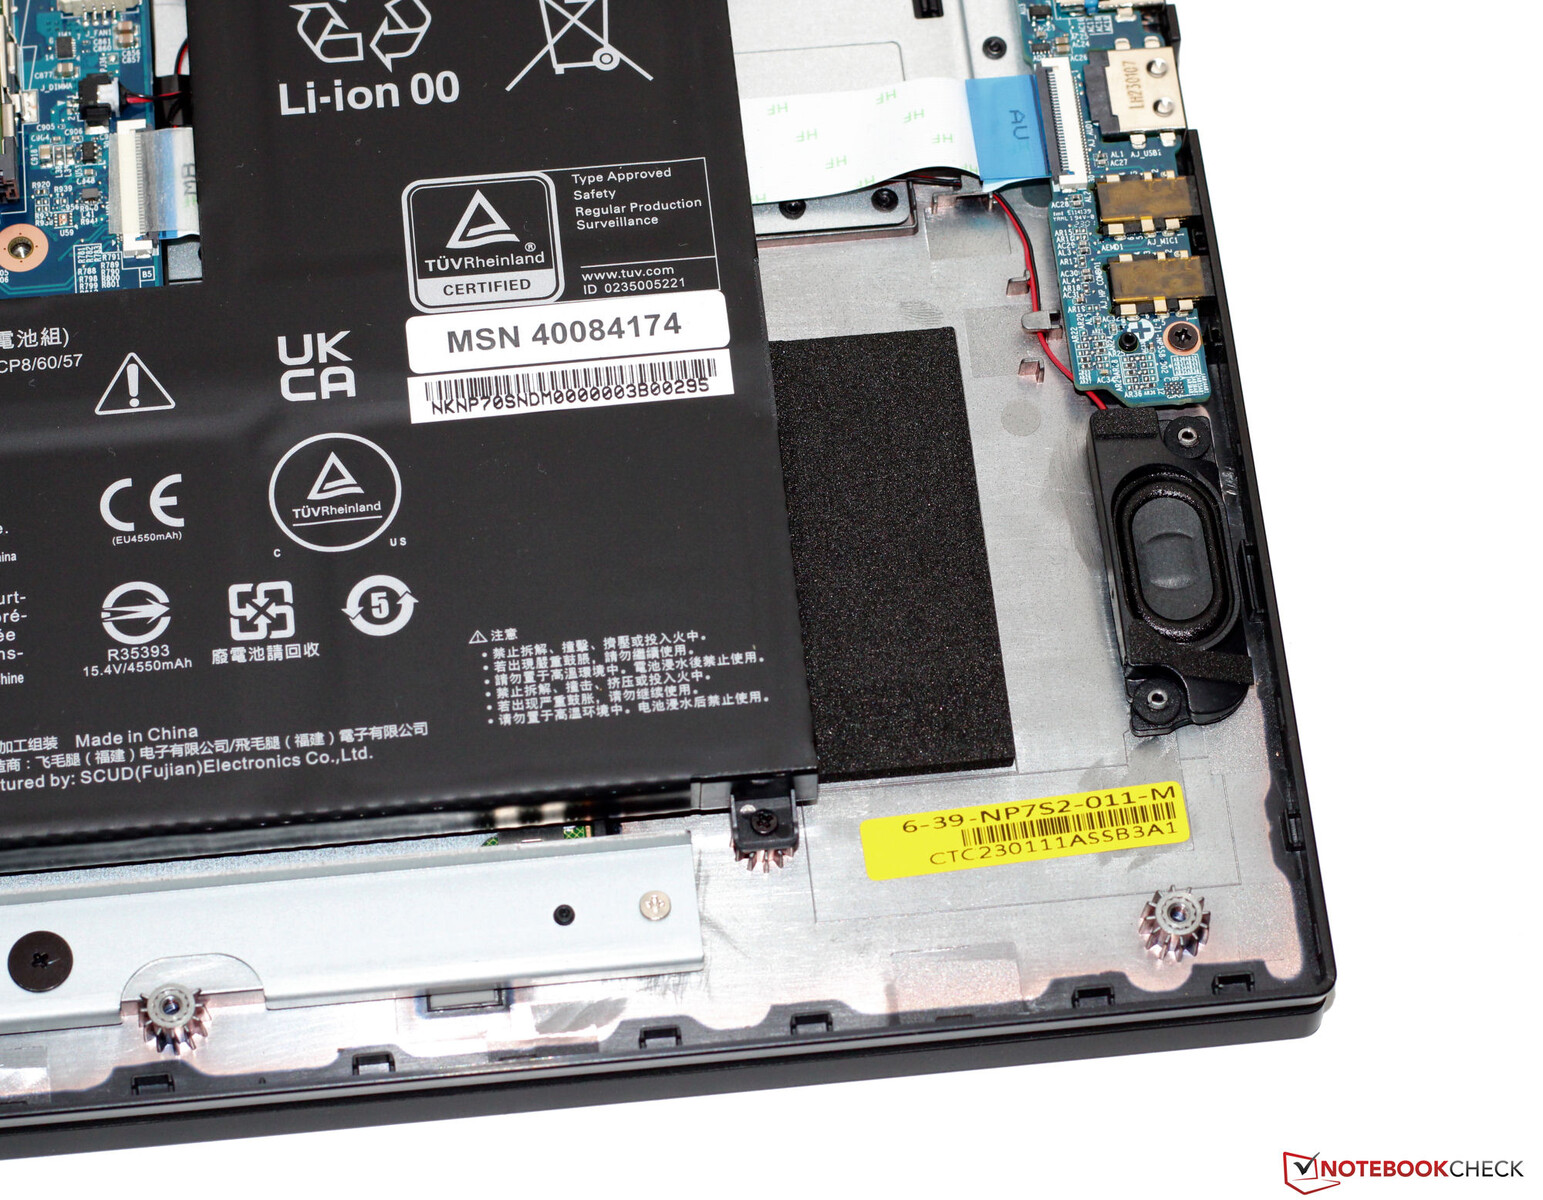
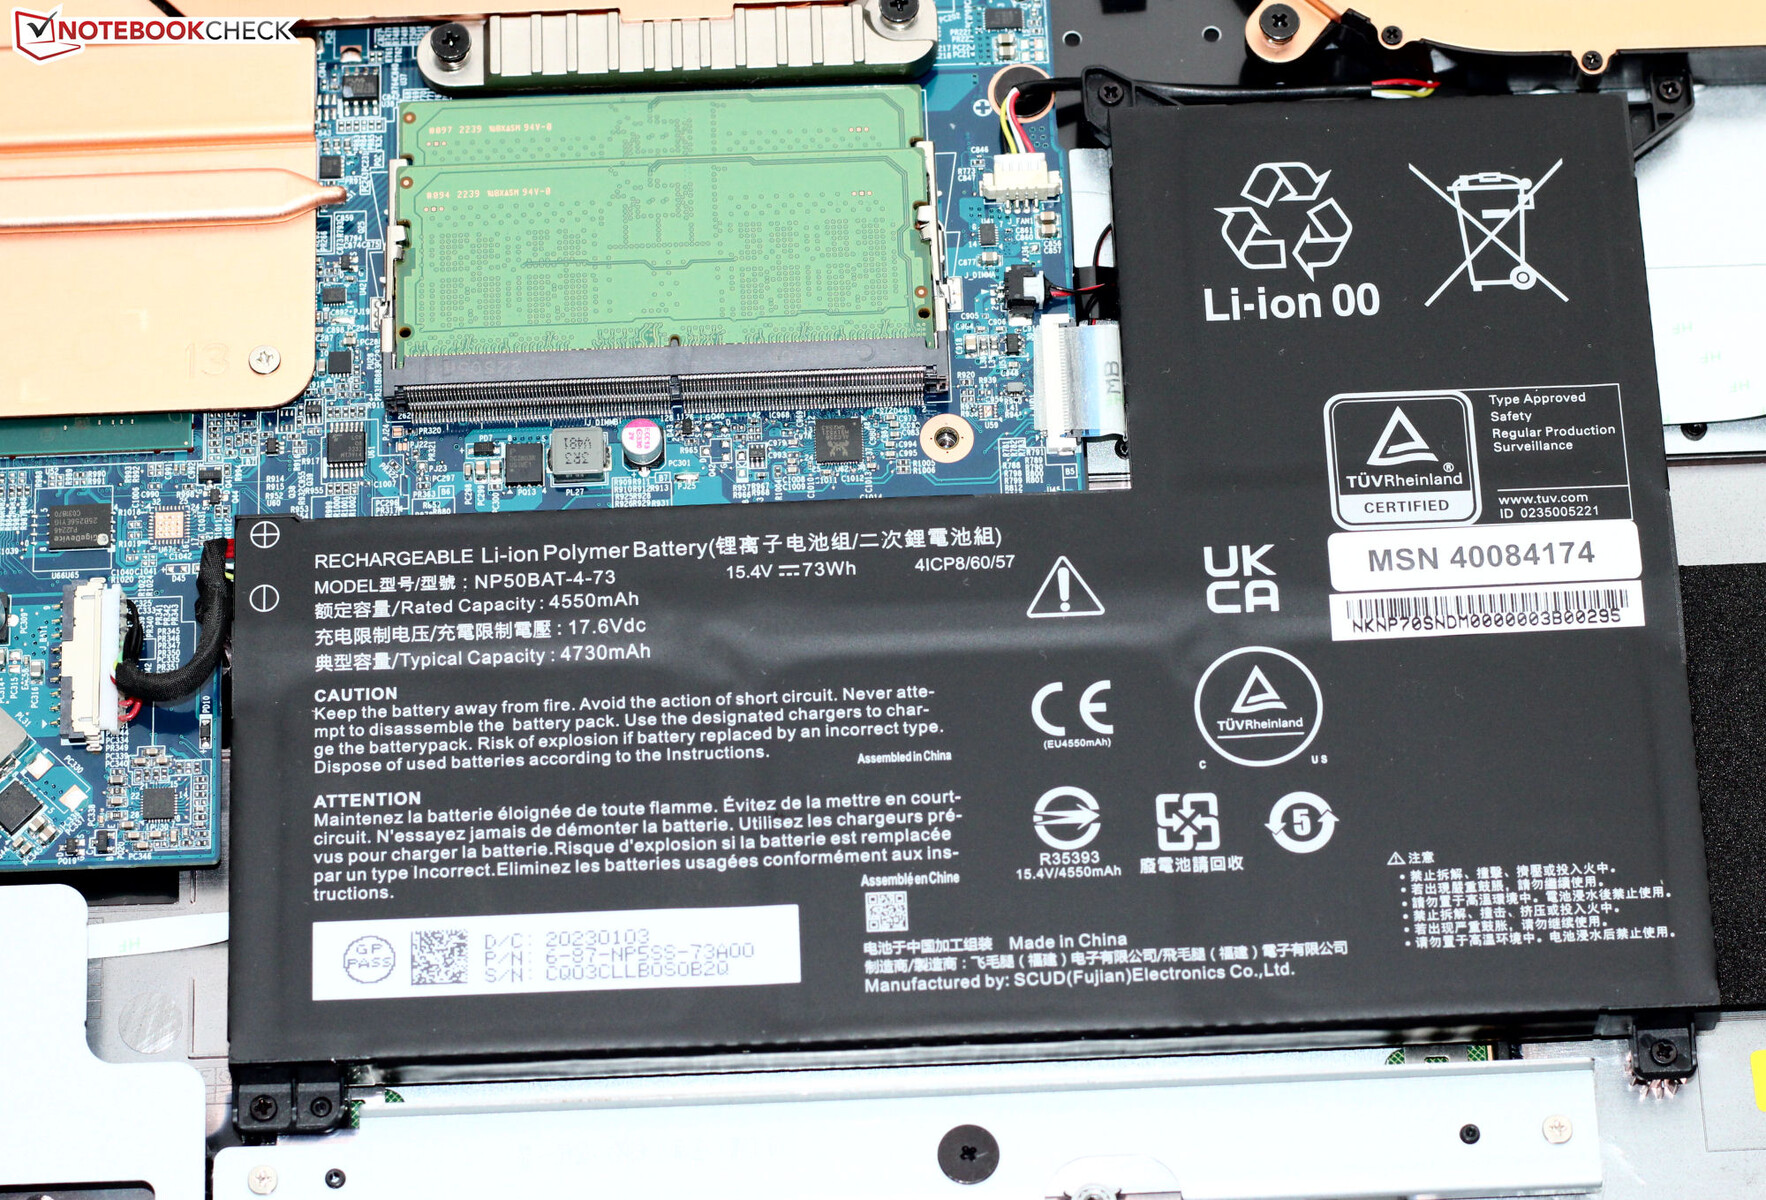
Medion ha scelto un case nero per il P40 con superfici lisce e opache. Il portatile, dall'aspetto elegante, non presenta caratteristiche di design stravaganti. A parte la tastiera illuminata, il portatile non presenta elementi a LED. La batteria (avvitata, non incollata) e il resto dei componenti interni del portatile sono facilmente accessibili dopo aver rimosso la parte inferiore del case.
Non ci sono problemi di costruzione: tutti gli spazi corrispondono e non ci sono spigoli vivi. L'unità base e il coperchio possono essere leggermente ruotati, ma non è nulla di eccezionale. Le cerniere tengono il coperchio del portatile saldamente in posizione e l'angolo di apertura massimo è di circa 135 gradi. Il portatile può essere aperto con una sola mano.
La P40 è un po' più compatta dellaKatana 17ma pesa circa 100 grammi in più. Entrambi i dispositivi sono battuti dalGigabyte G7 KEin queste categorie.
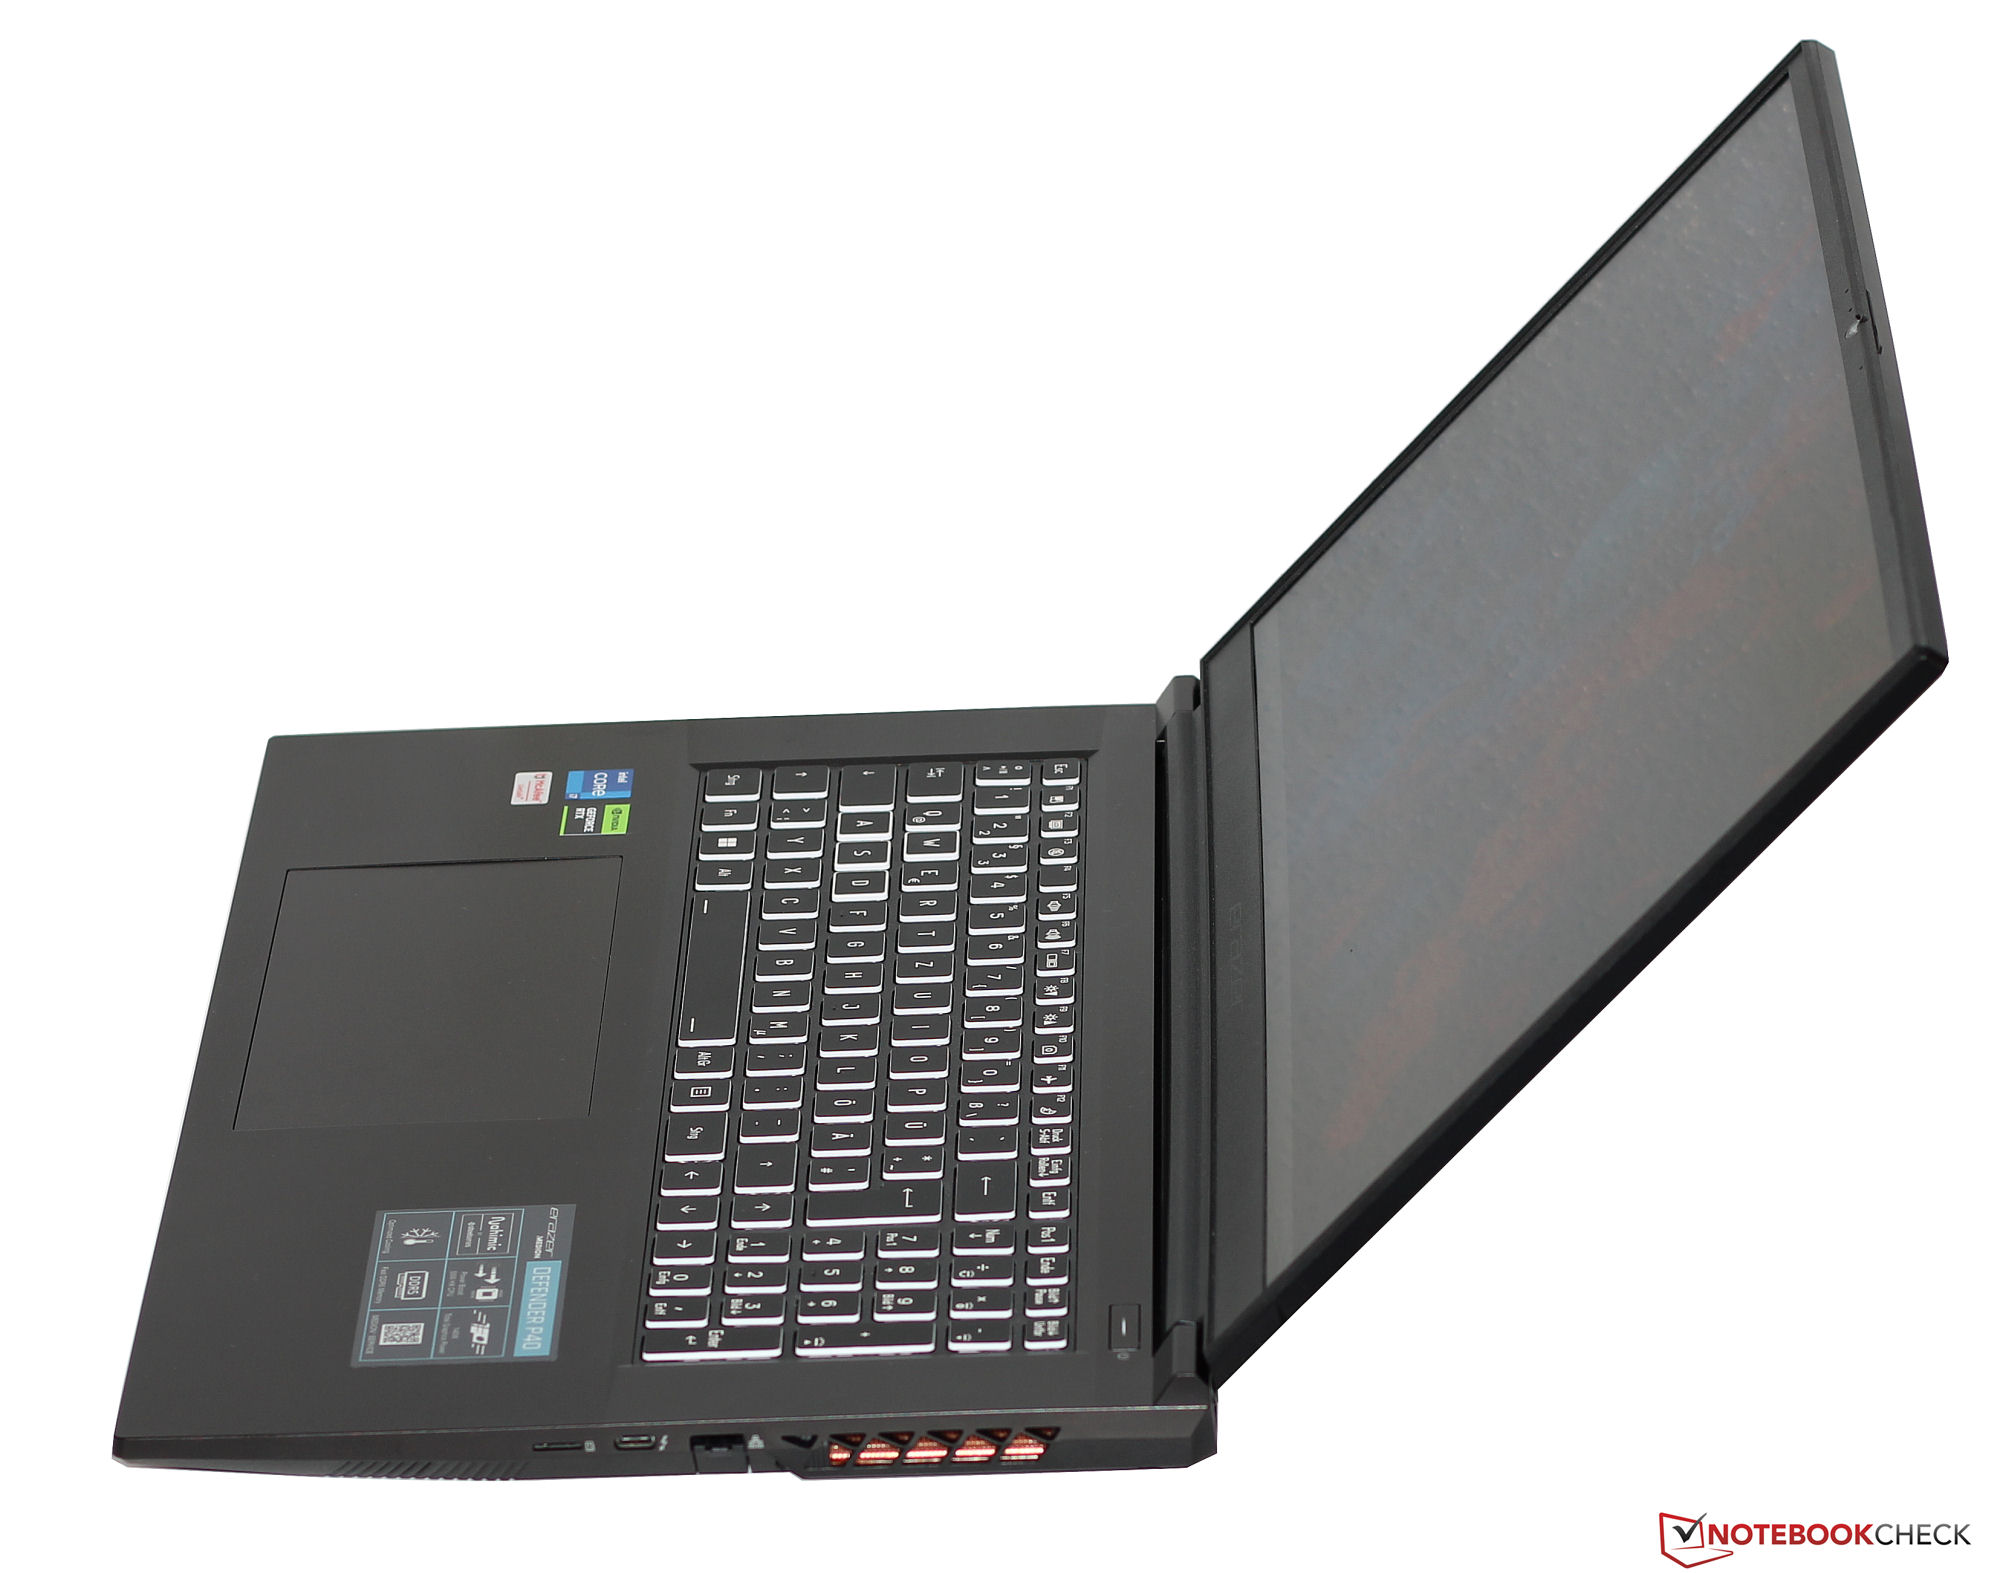
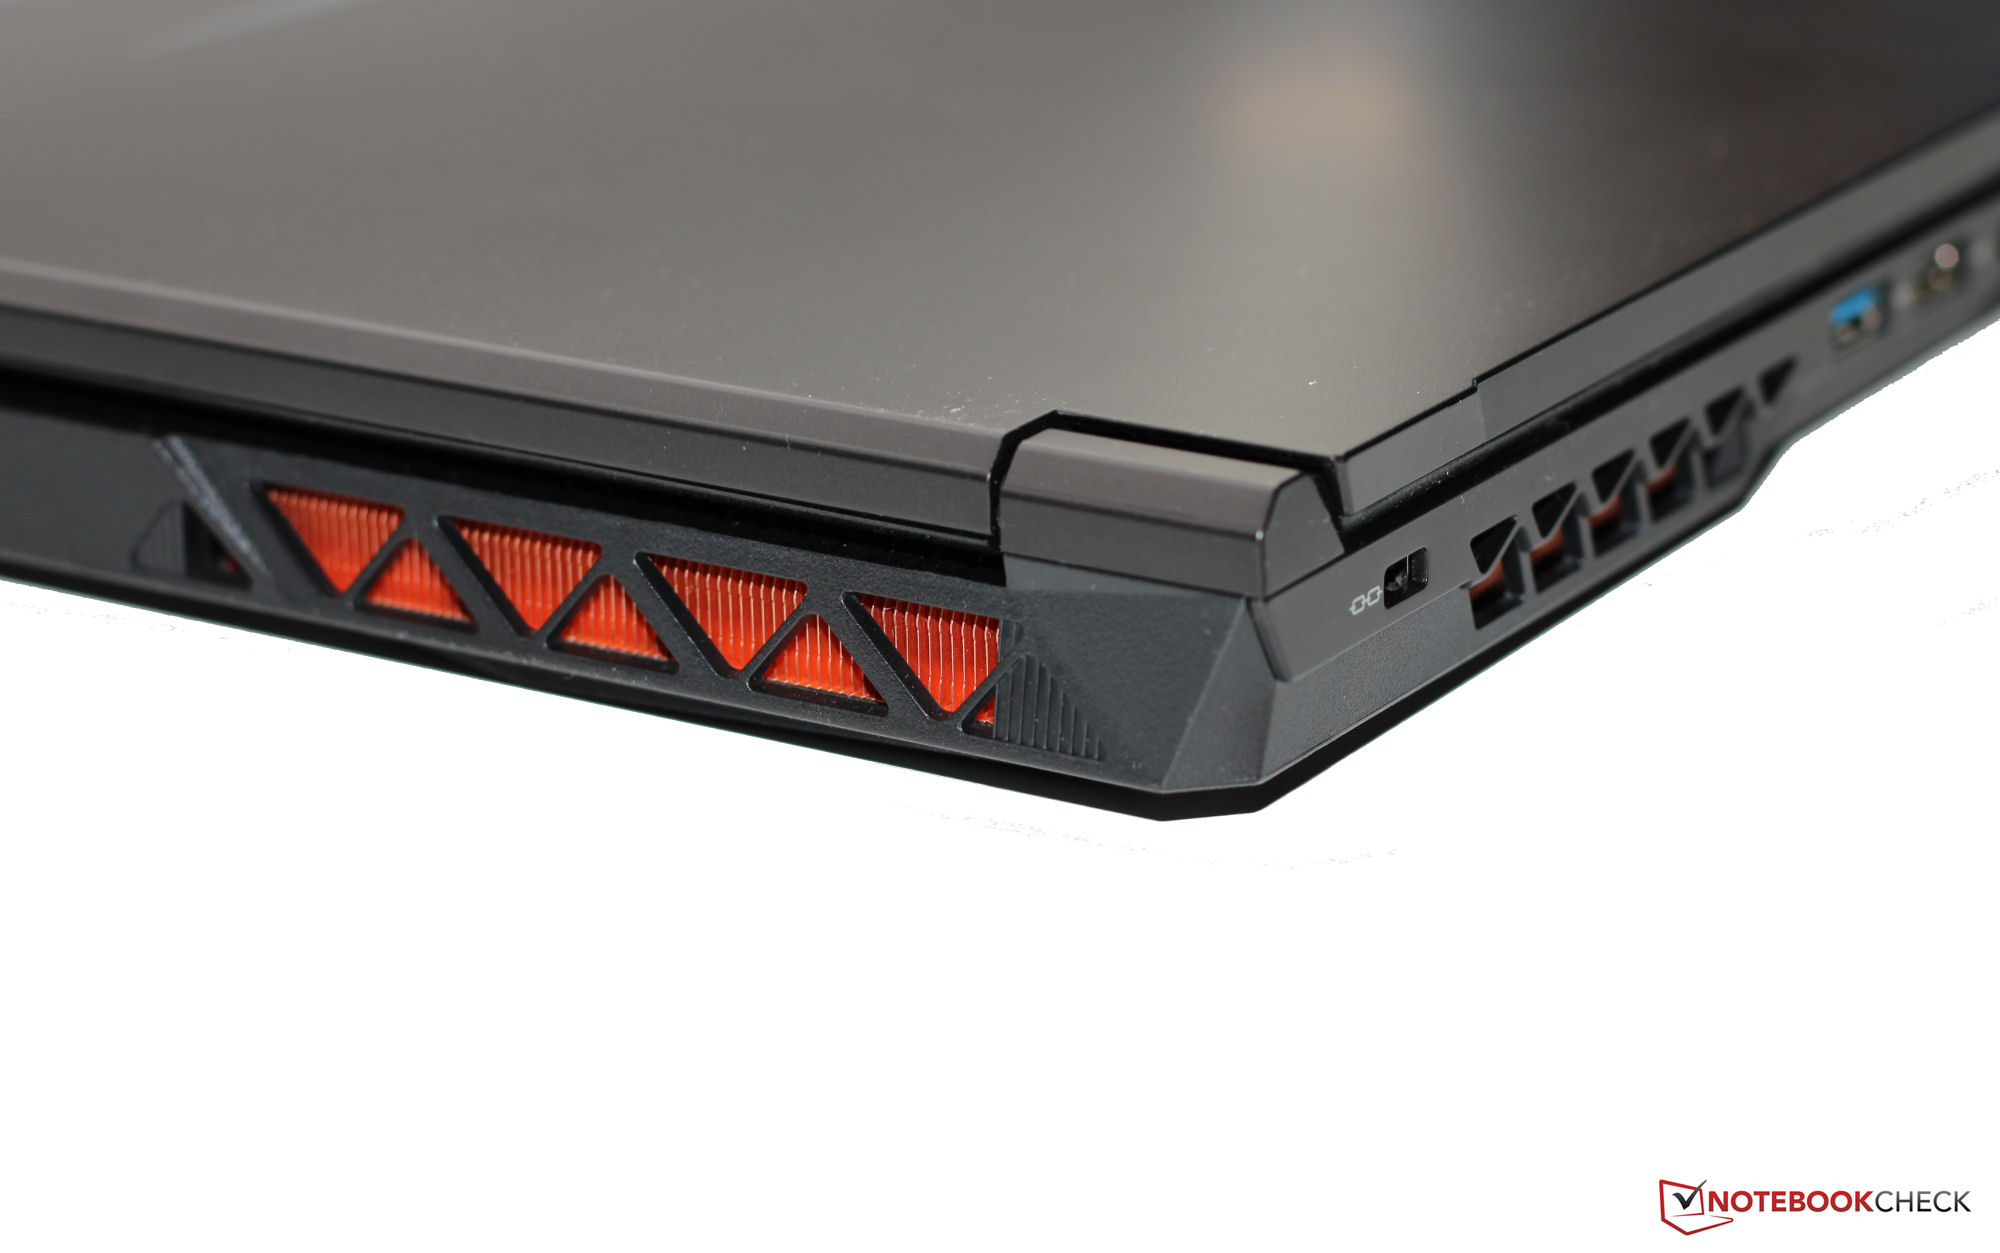
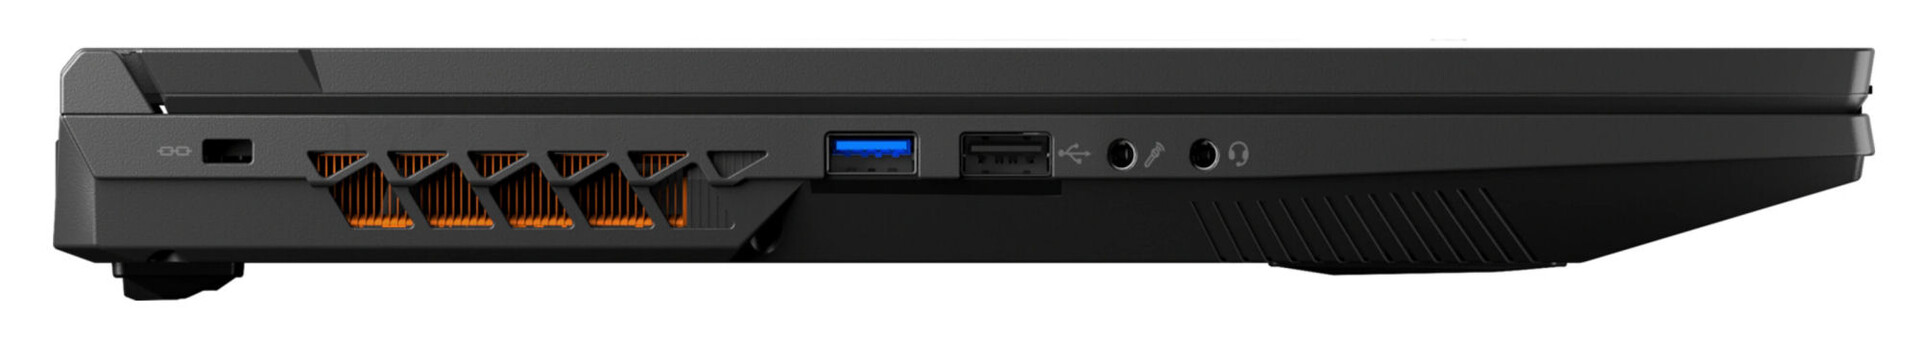
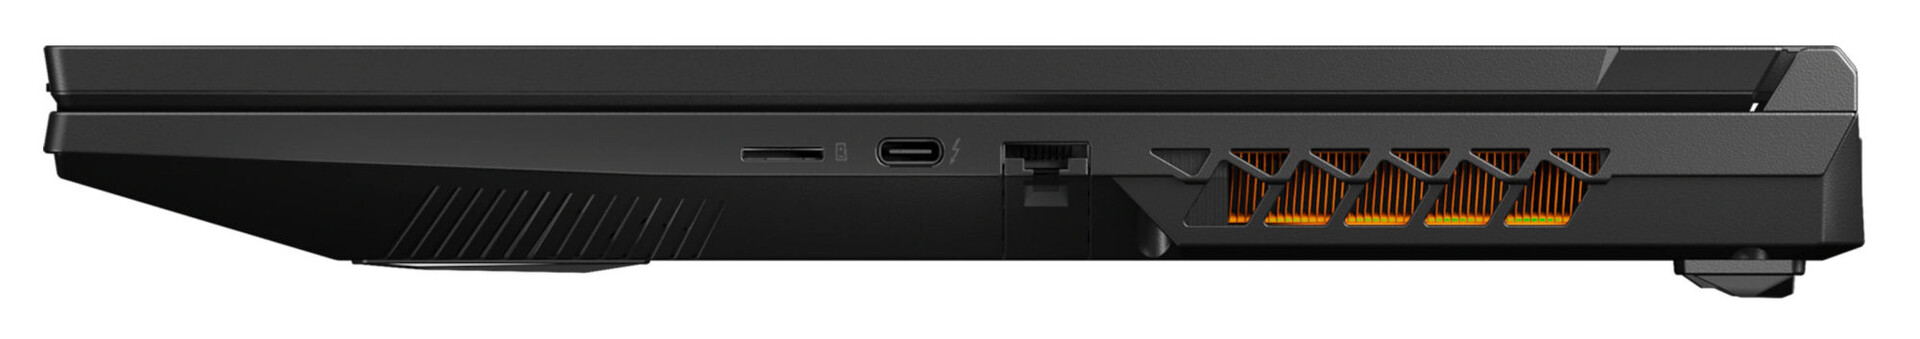
Connettività - Il Medion Defender è dotato di Thunderbolt, ma non di Power Delivery
Nonostante le dimensioni di 17,3 pollici, il portatile dispone solo di due connessioni USB-A (1x USB 3.2 Gen 1, 1x USB 2.0): una terza porta sul lato destro del portatile sarebbe davvero utile. Nessuna delle due porte USB-C (1x Thunderbolt 4, 1x USB 3.2 Gen 2) supporta Power Delivery, ma la porta TB4 può emettere un segnale DisplayPort. In totale, il dispositivo dispone di tre uscite video (2x DP, 1x HDMI), due porte audio e una porta Gigabit Ethernet.
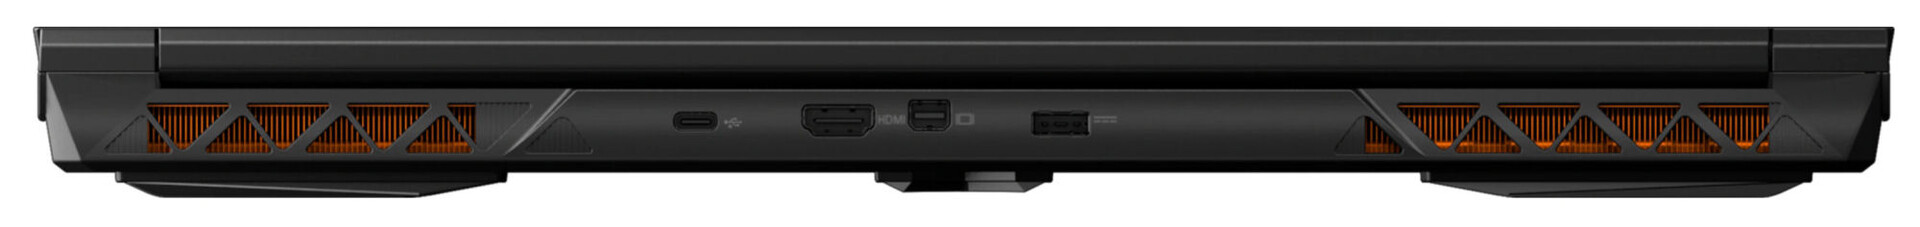
Due uscite video e la connessione di alimentazione si trovano sul retro del portatile. I cavi corrispondenti si allontanano dalla parte posteriore del dispositivo, il che significa che non saranno d'intralcio. Purtroppo, lo stesso non si può dire per il cavo Ethernet, se utilizzato.
Lettore di schede SD
Il lettore di schede SD (scheda di riferimento: AV PRO microSD 128 GB V60) ha velocità di trasferimento massime di 86 MB/s (trasferimento di 250 immagini jpg - circa 5 MB ciascuna) e 91 MB/s (copia di grandi blocchi di dati) - il che lo rende un modello con velocità medie.
| SD Card Reader | |
| average JPG Copy Test (av. of 3 runs) | |
| HP Omen 17-ck1075ng (AV Pro SD microSD 128 GB V60) | |
| Media della classe Gaming (19 - 204, n=66, ultimi 2 anni) | |
| Medion Erazer Defender P40 (AV PRO microSD 128 GB V60) | |
| MSI GE78HX 13VH-070US (Angelibird AV Pro V60) | |
| maximum AS SSD Seq Read Test (1GB) | |
| Media della classe Gaming (25.8 - 261, n=65, ultimi 2 anni) | |
| HP Omen 17-ck1075ng (AV Pro SD microSD 128 GB V60) | |
| Medion Erazer Defender P40 (AV PRO microSD 128 GB V60) | |
| Gigabyte G7 KE (AV PRO microSD 128 GB V60) | |
| MSI GE78HX 13VH-070US (Angelibird AV Pro V60) | |
Comunicazione
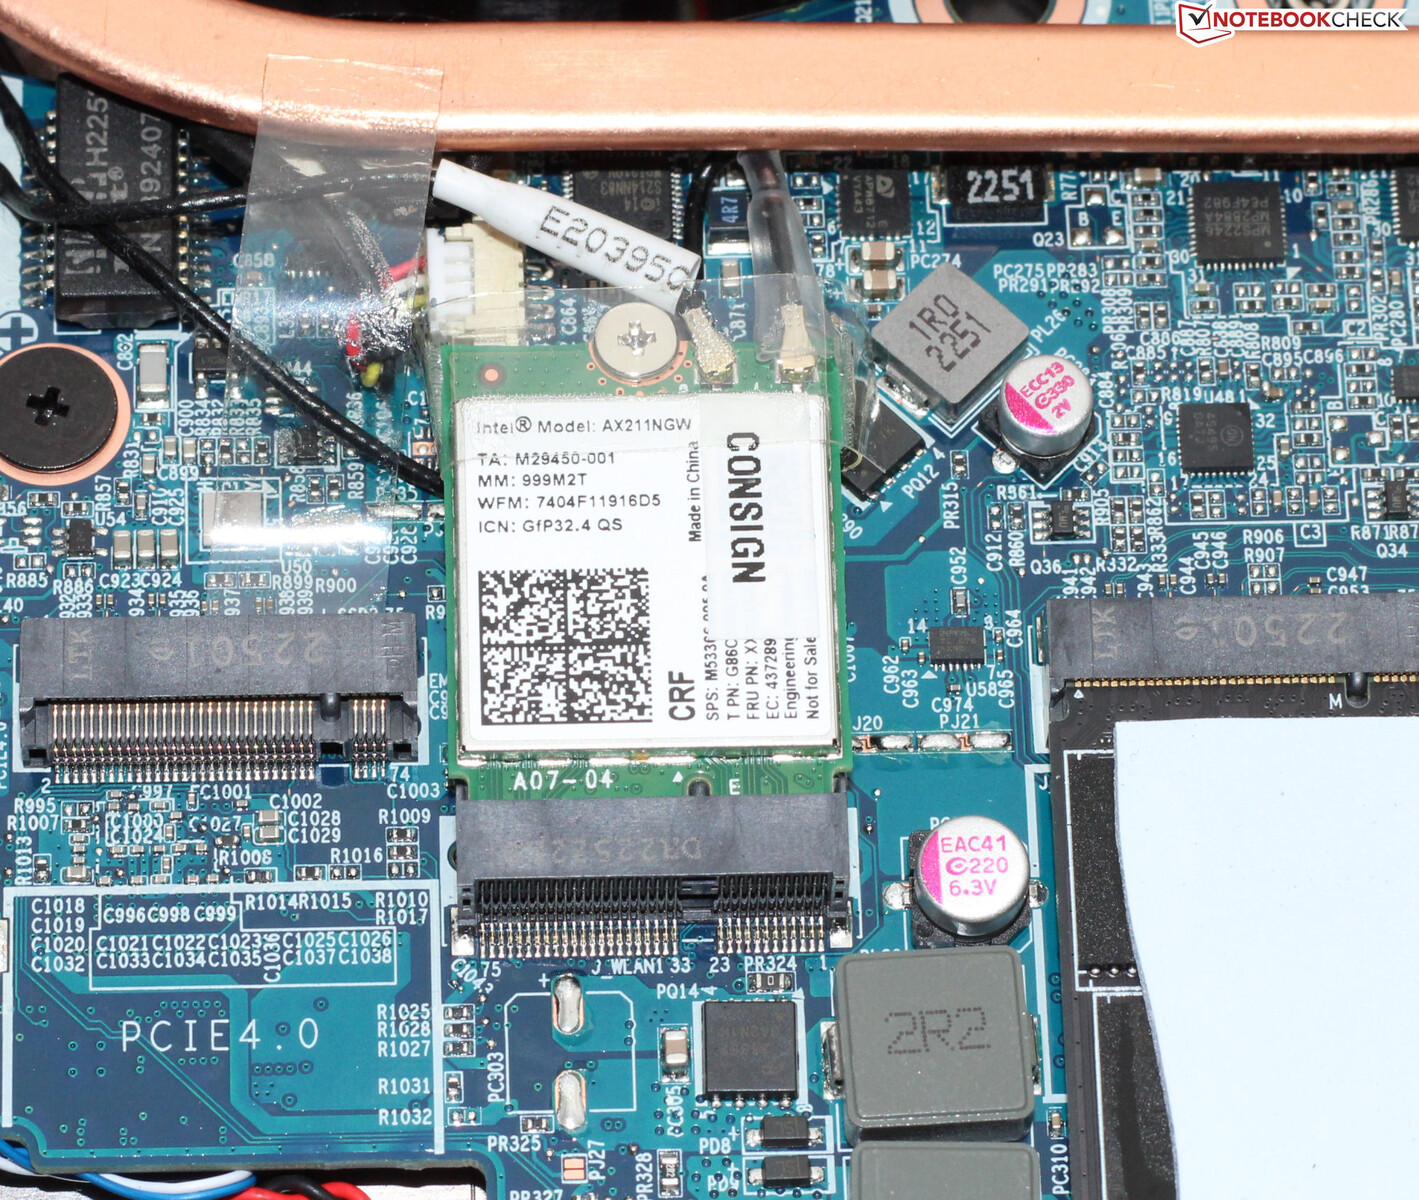
In condizioni ottimali (nessun dispositivo WLAN nelle vicinanze, breve distanza tra il portatile e il PC server), il portatile è stato in grado di raggiungere velocità di trasmissione dati WiFi impressionanti. Il portatile Medion utilizza un chip WiFi 6E (Intel AX211). Anche le connessioni via cavo sono gestite da un chip Intel (I219-V; 1 GBit/s).
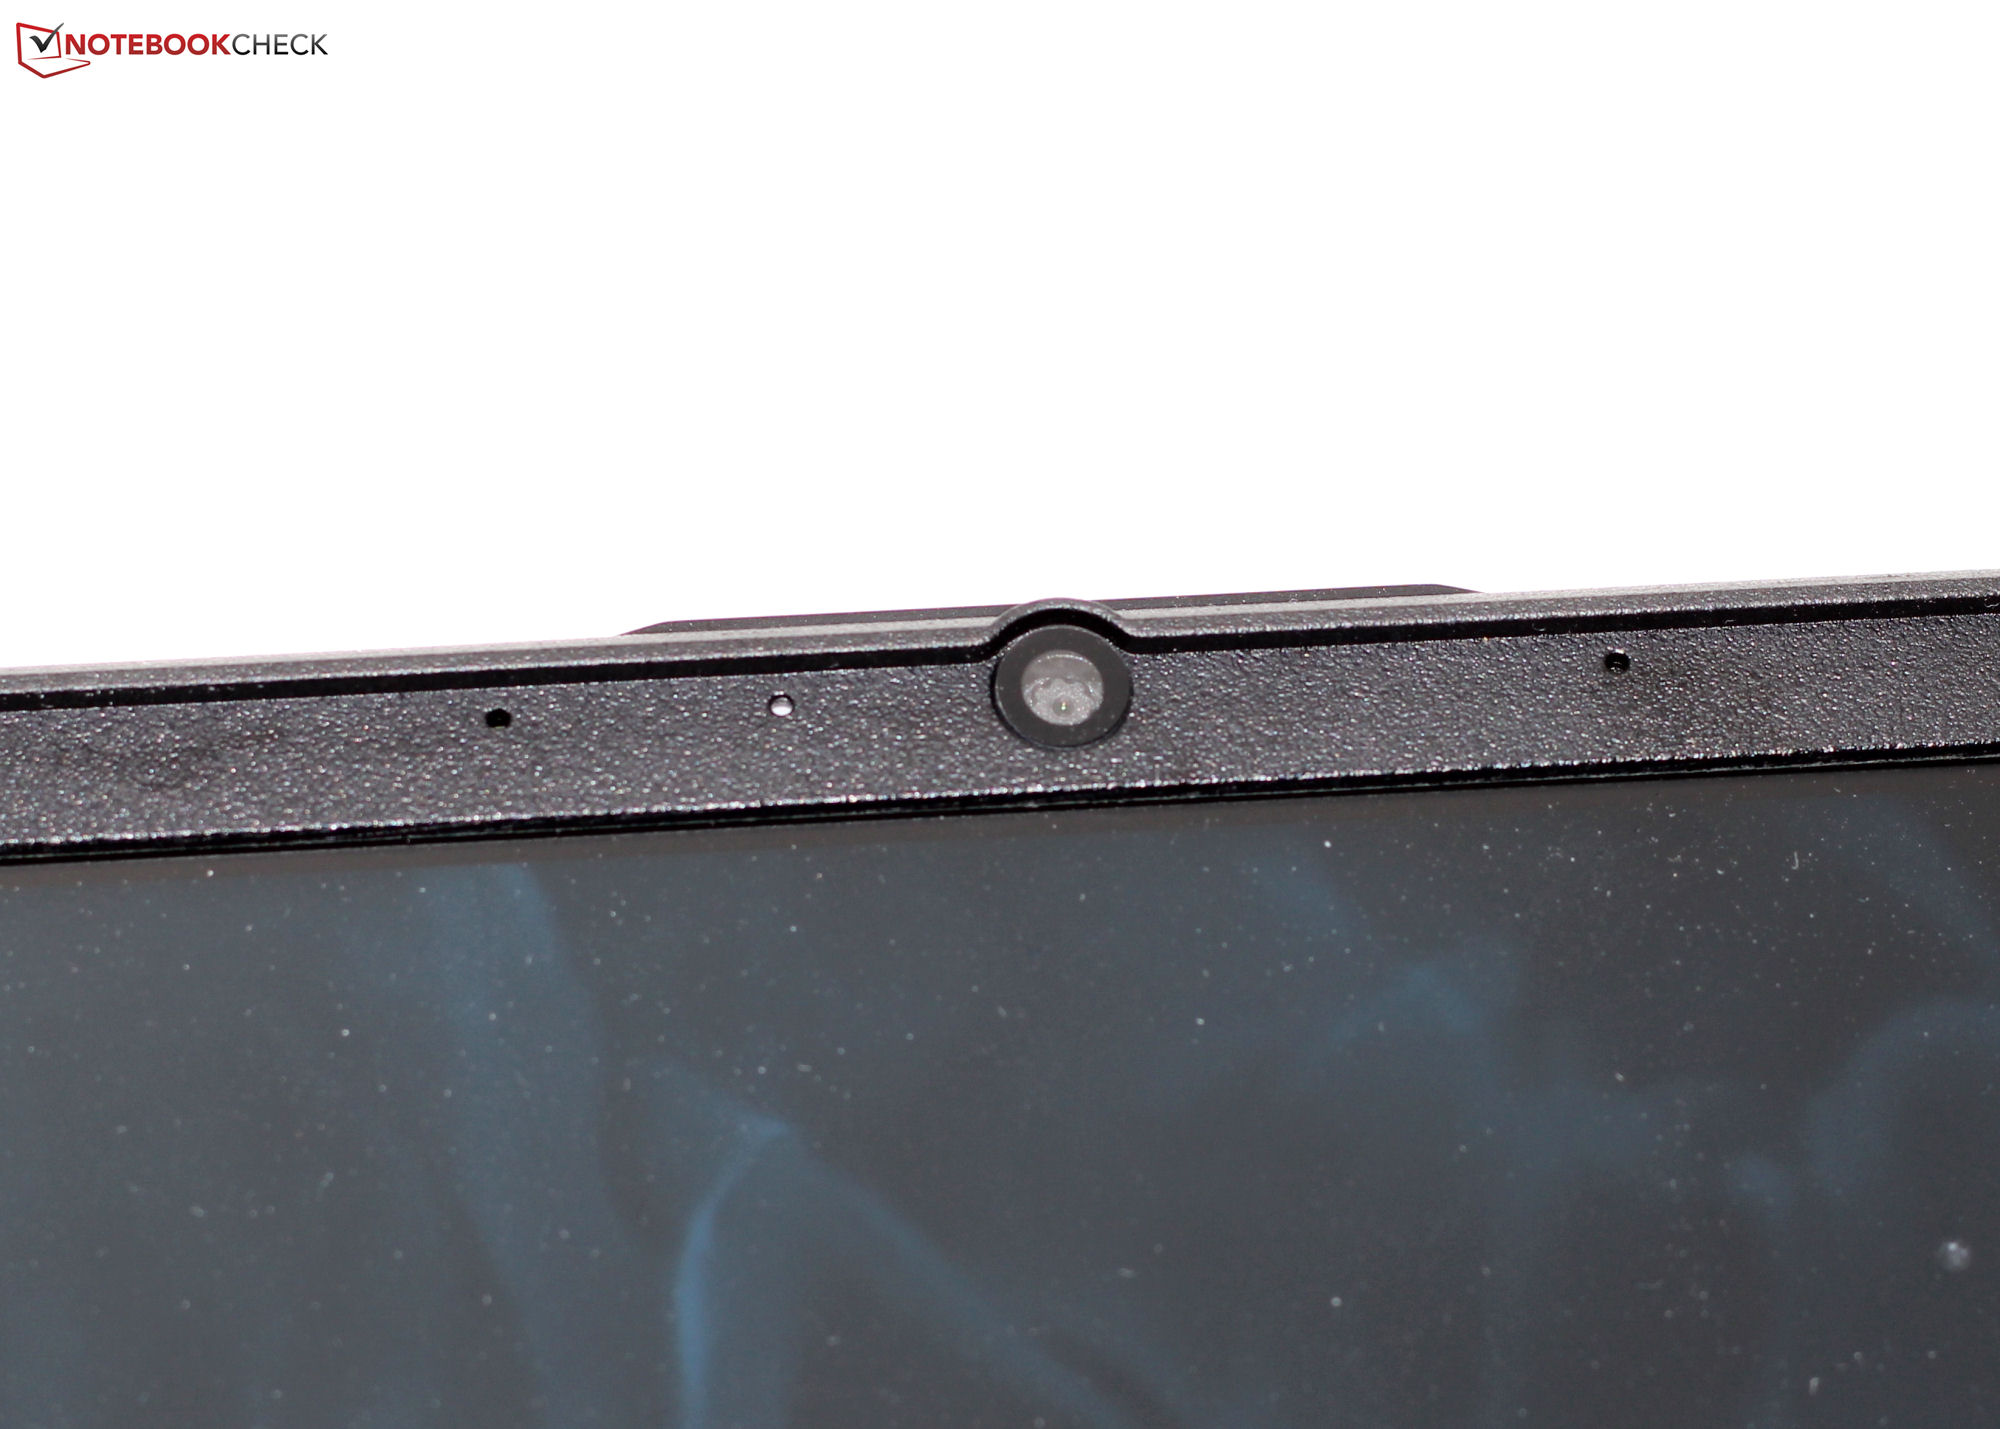
Webcam
La webcam (0,9 MP, max. 1.280 x 720 pixel) non ha una copertura meccanica. La sua qualità, purtroppo, non è delle migliori - tuttavia, in confronto, la deviazione dei colori è minima.


Accessori
A parte i soliti documenti (guida rapida e informazioni sulla garanzia), il portatile non viene fornito con alcun accessorio aggiuntivo.
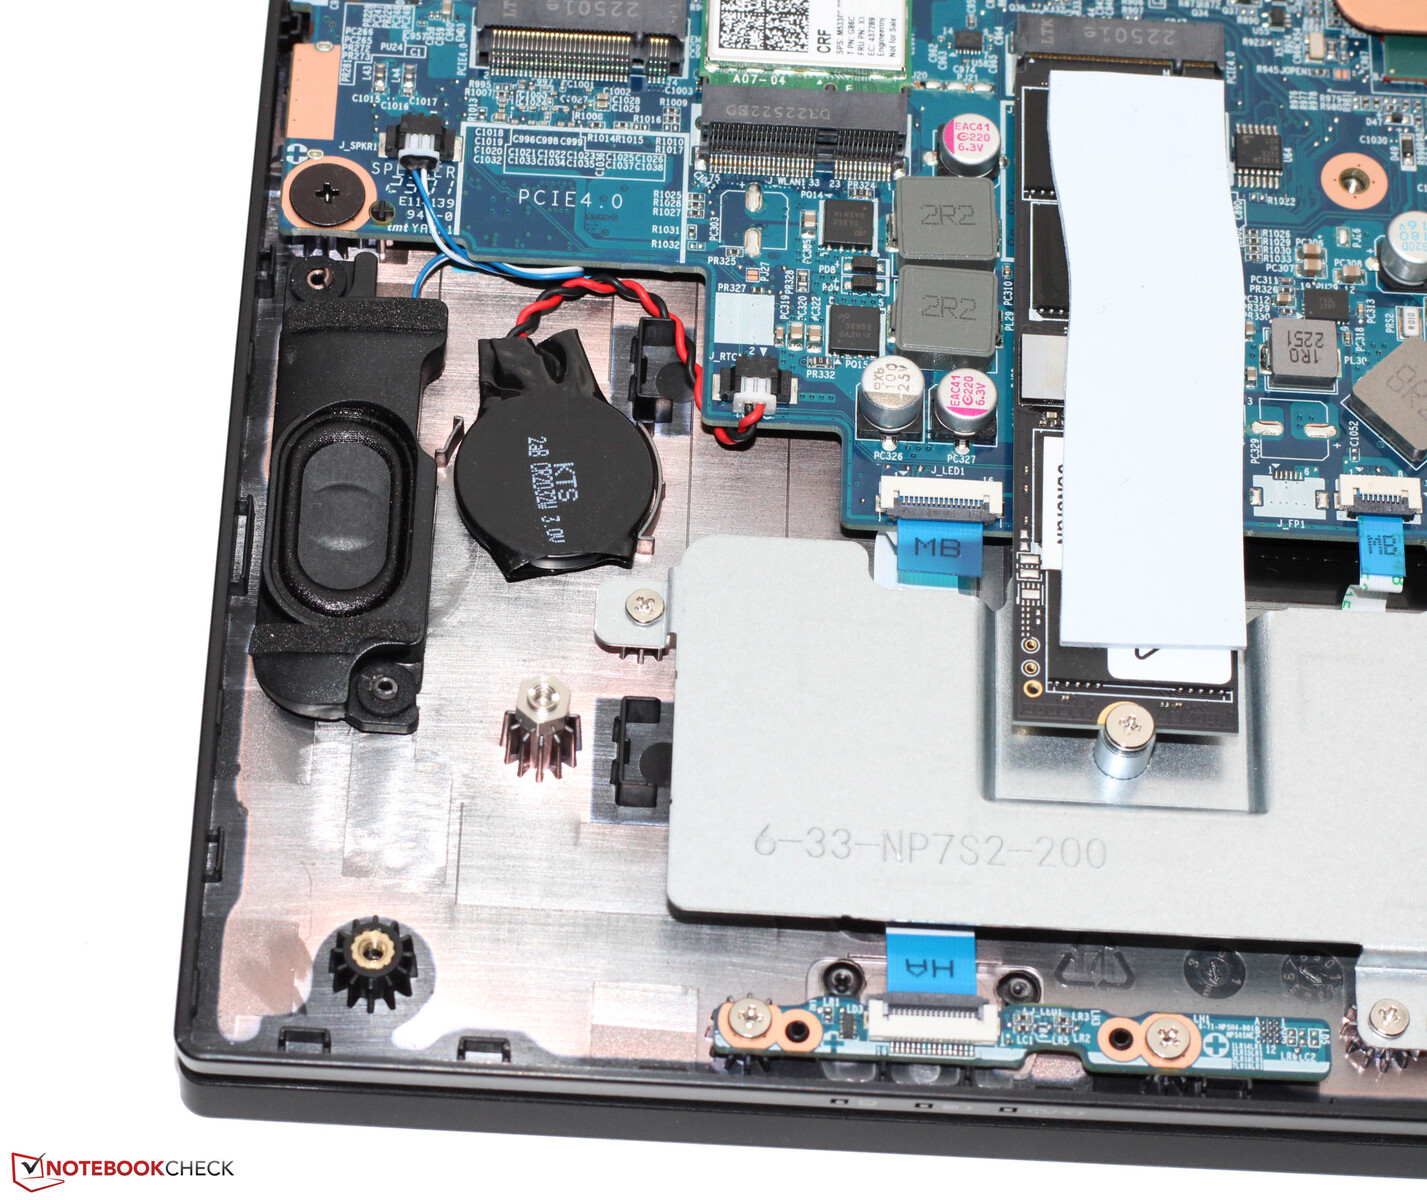
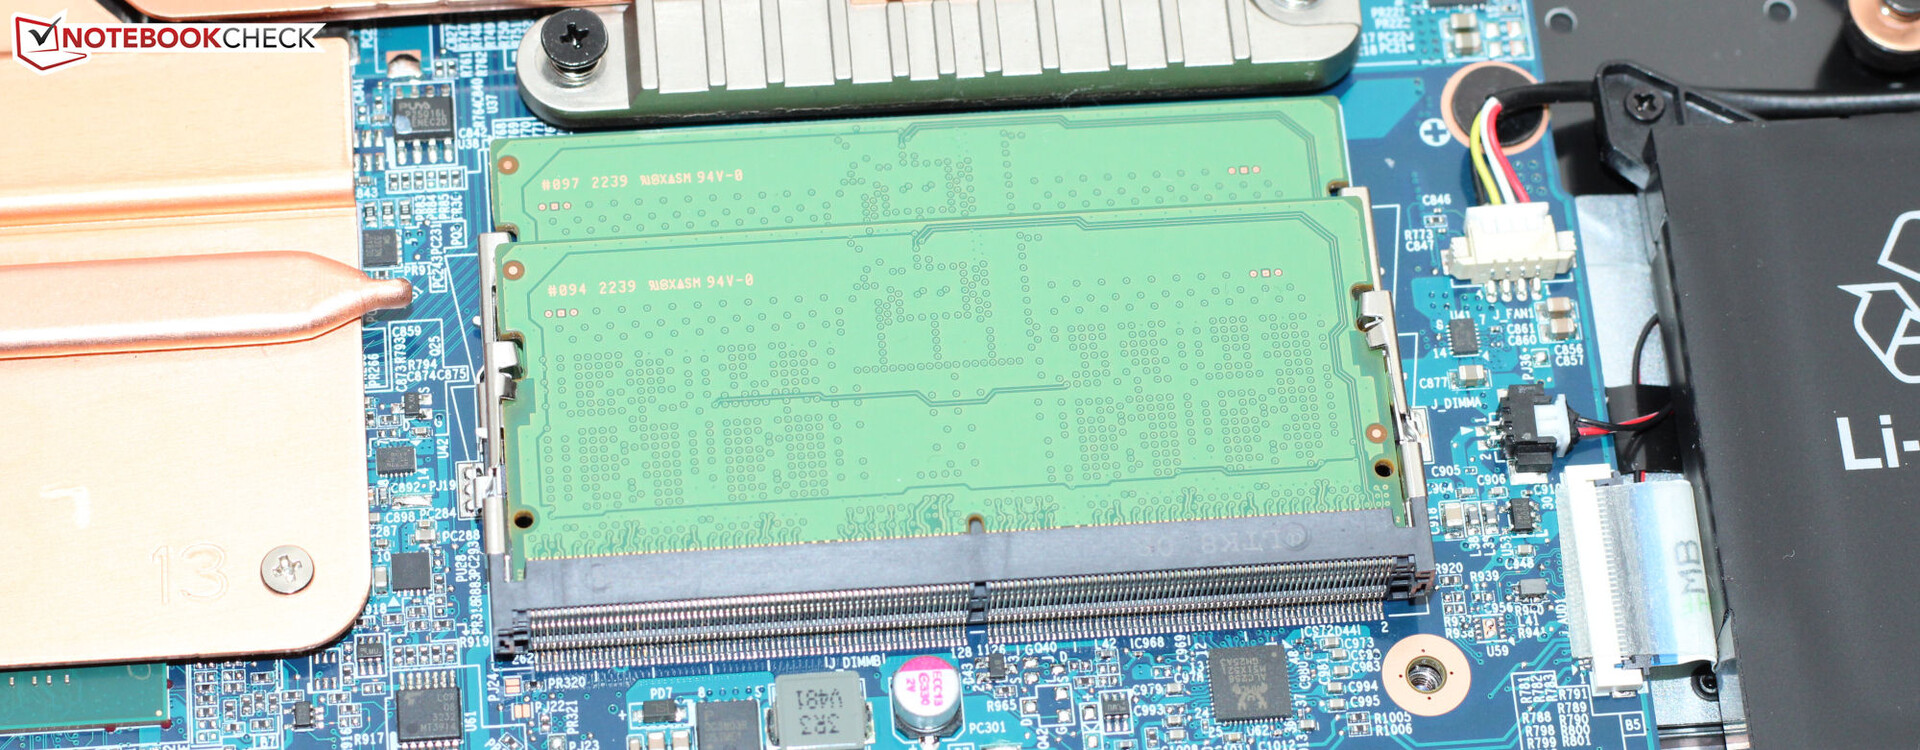
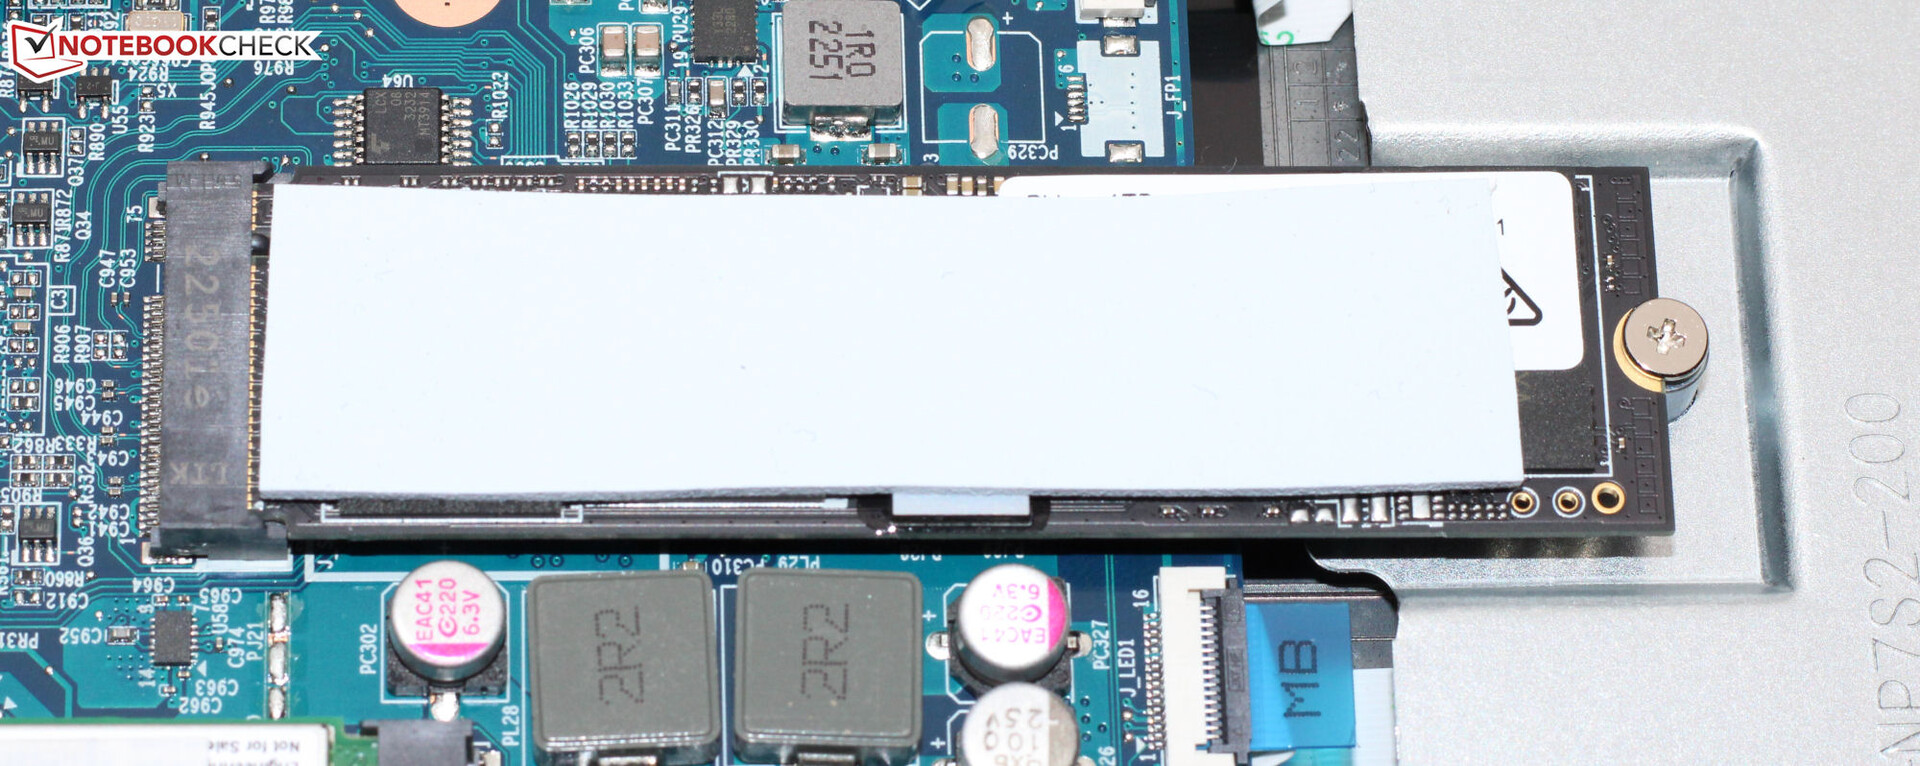
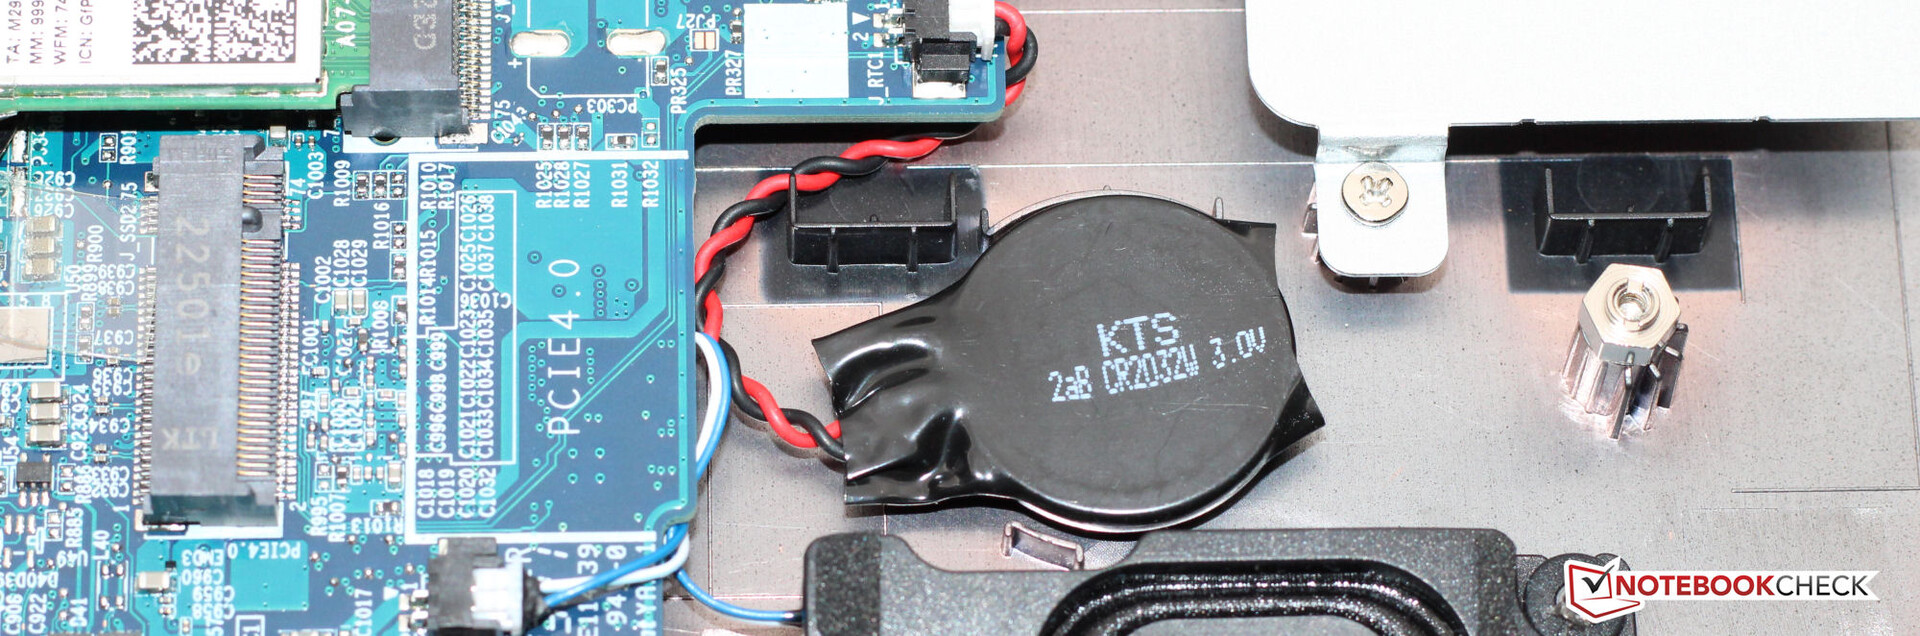
Manutenzione
Dopo aver rimosso tutte le viti sul fondo del dispositivo, è possibile rimuovere la piastra inferiore utilizzando una spatola piatta o un plettro. È quindi possibile accedere a entrambi i banchi di memoria (in uso), al secondo slot SSD (PCIe 4, M.2-2280), al modulo WLAN, alla batteria del BIOS, alle ventole e alla batteria.
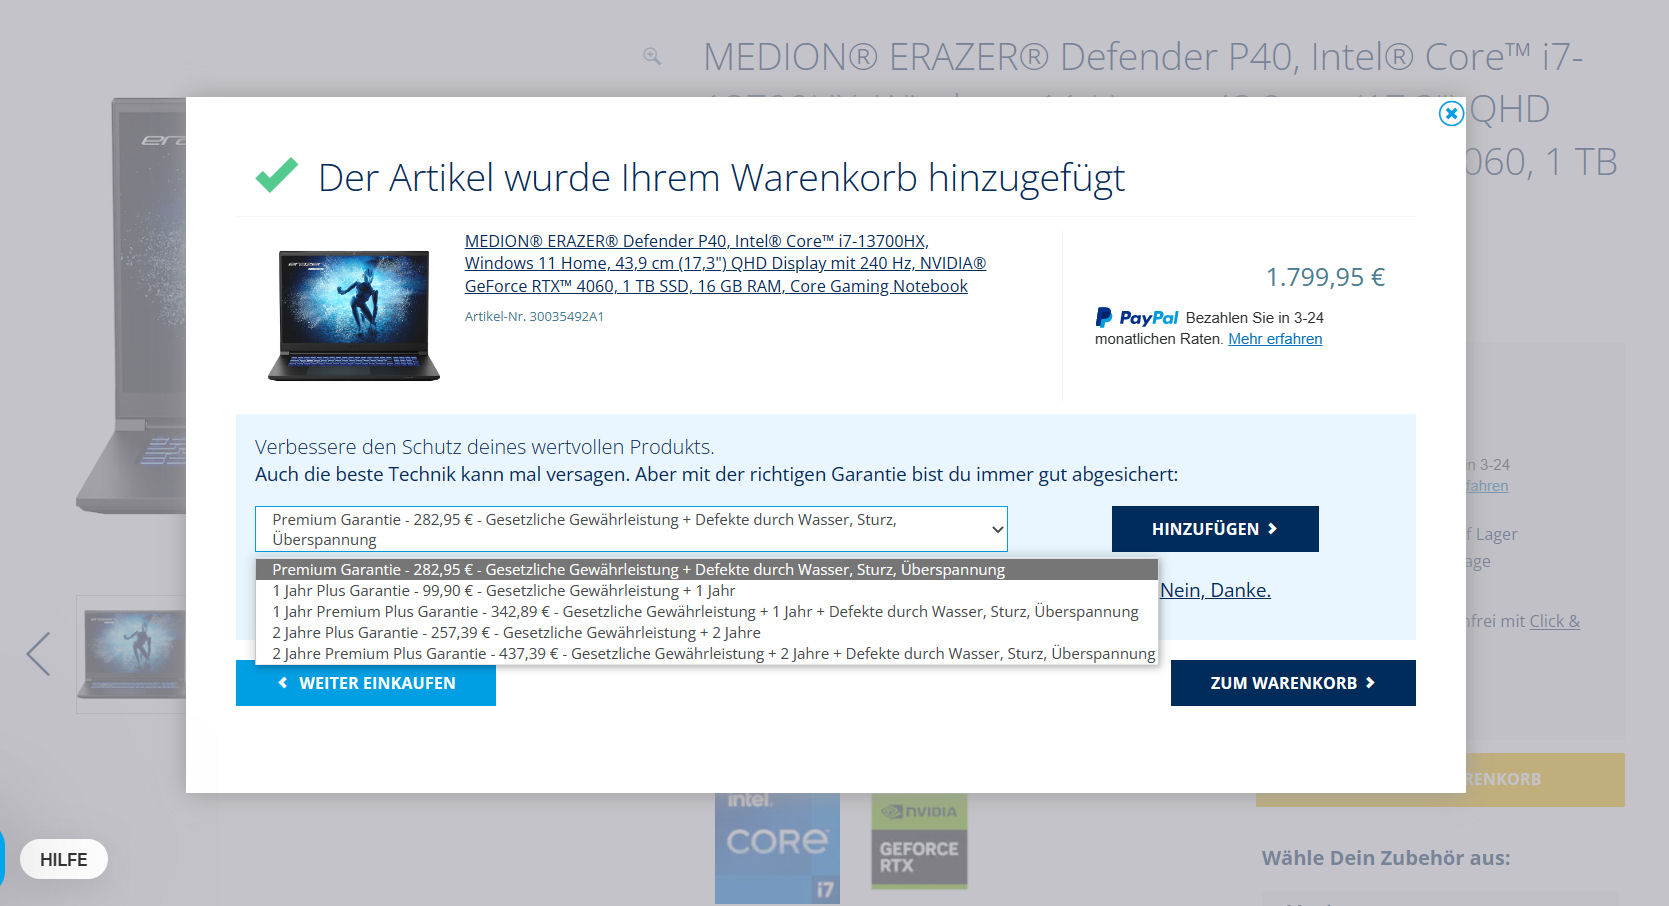
Garanzia
L'Erazer di Medion ha una garanzia di due anni. Sono disponibili estensioni della garanzia, che tuttavia devono essere acquistate insieme al portatile presso il negozio online di Medion; non è possibile acquistare un'estensione retroattivamente.
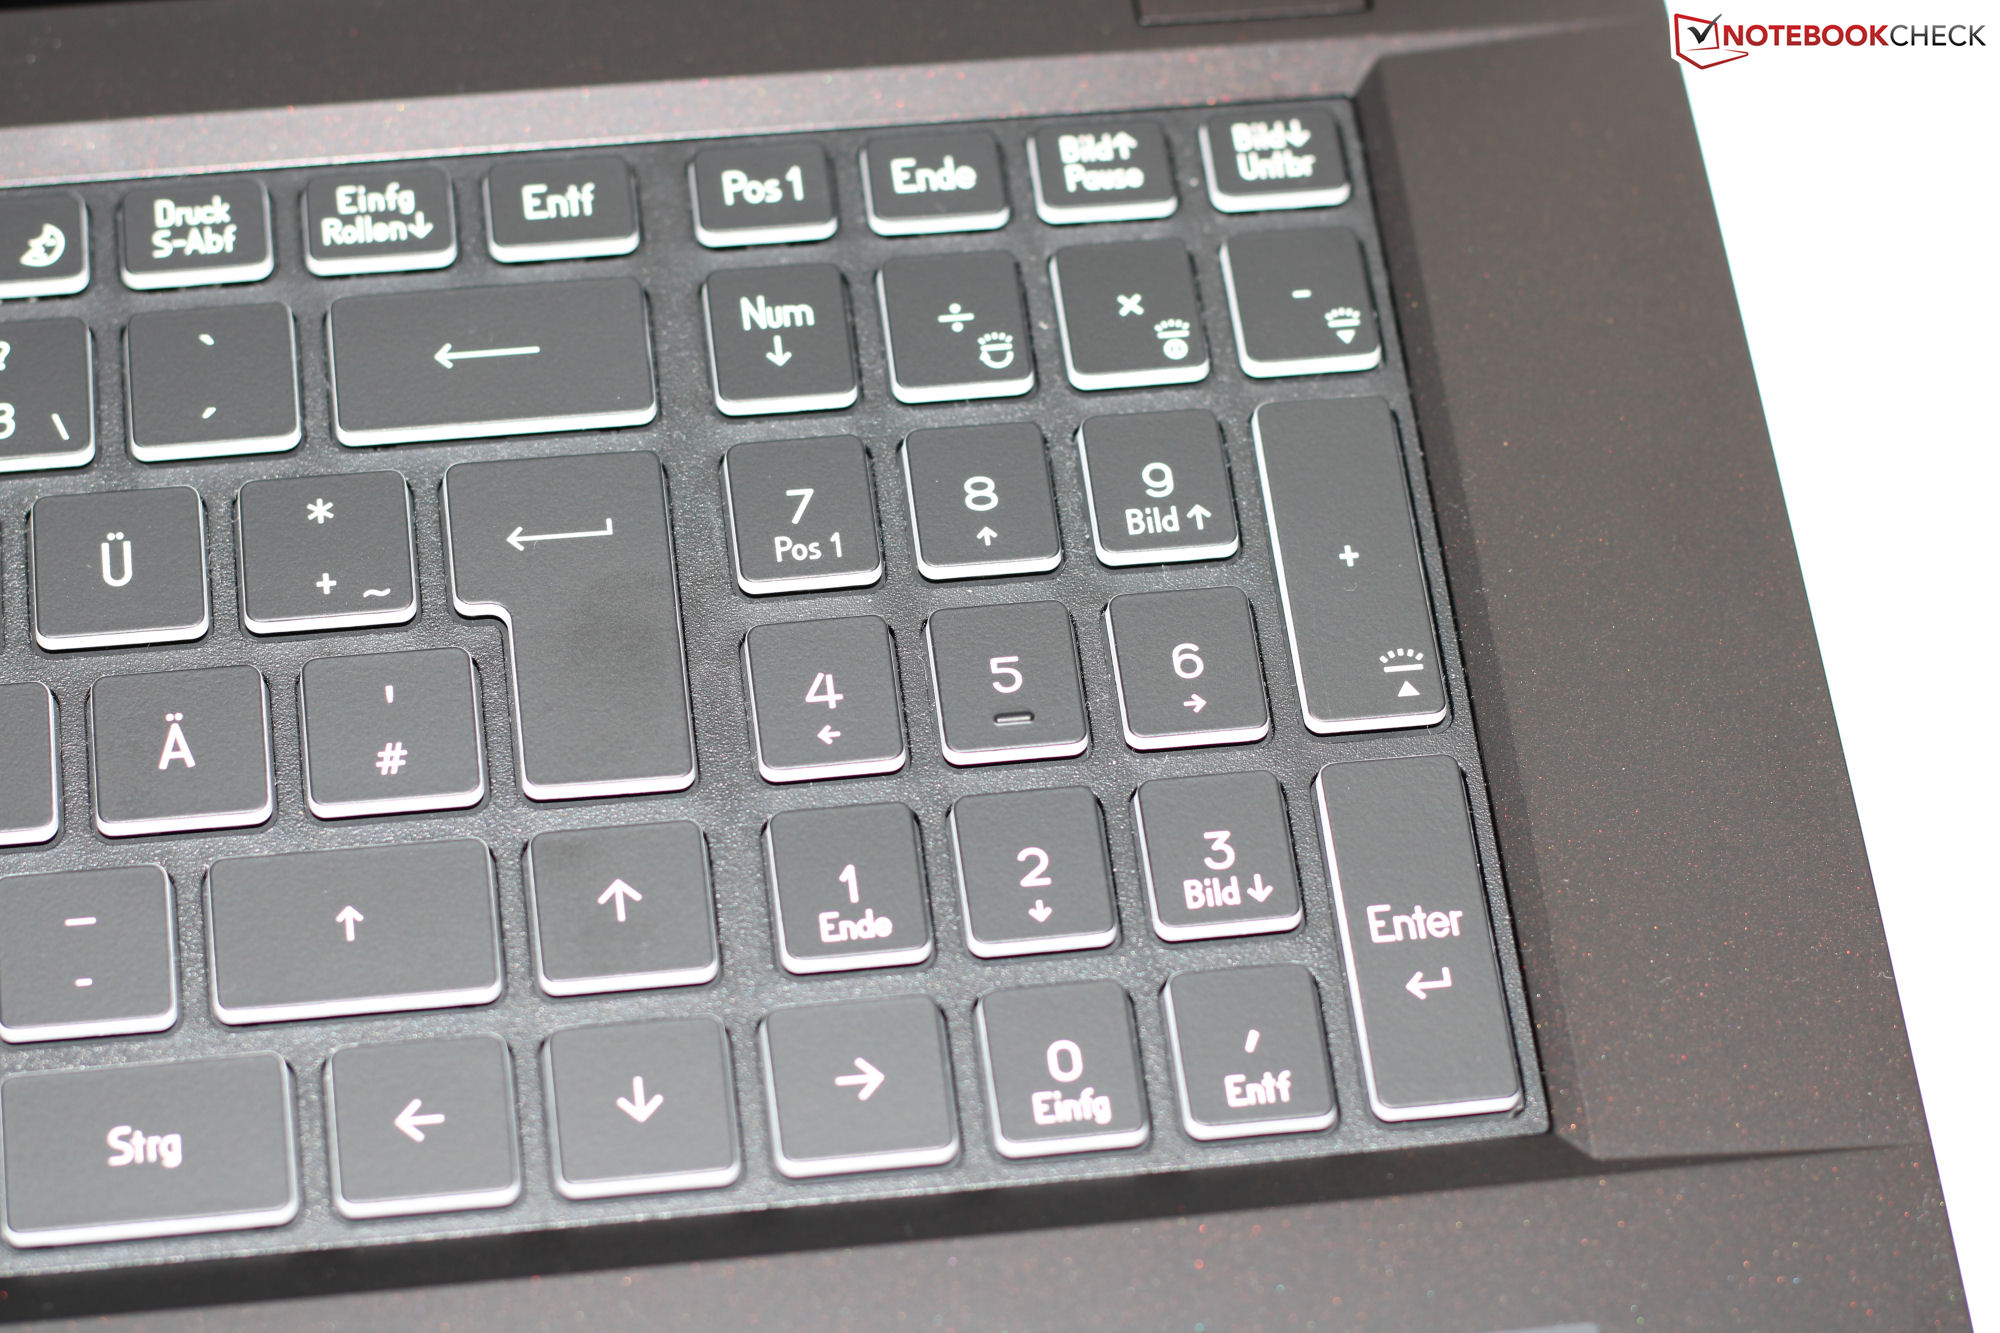
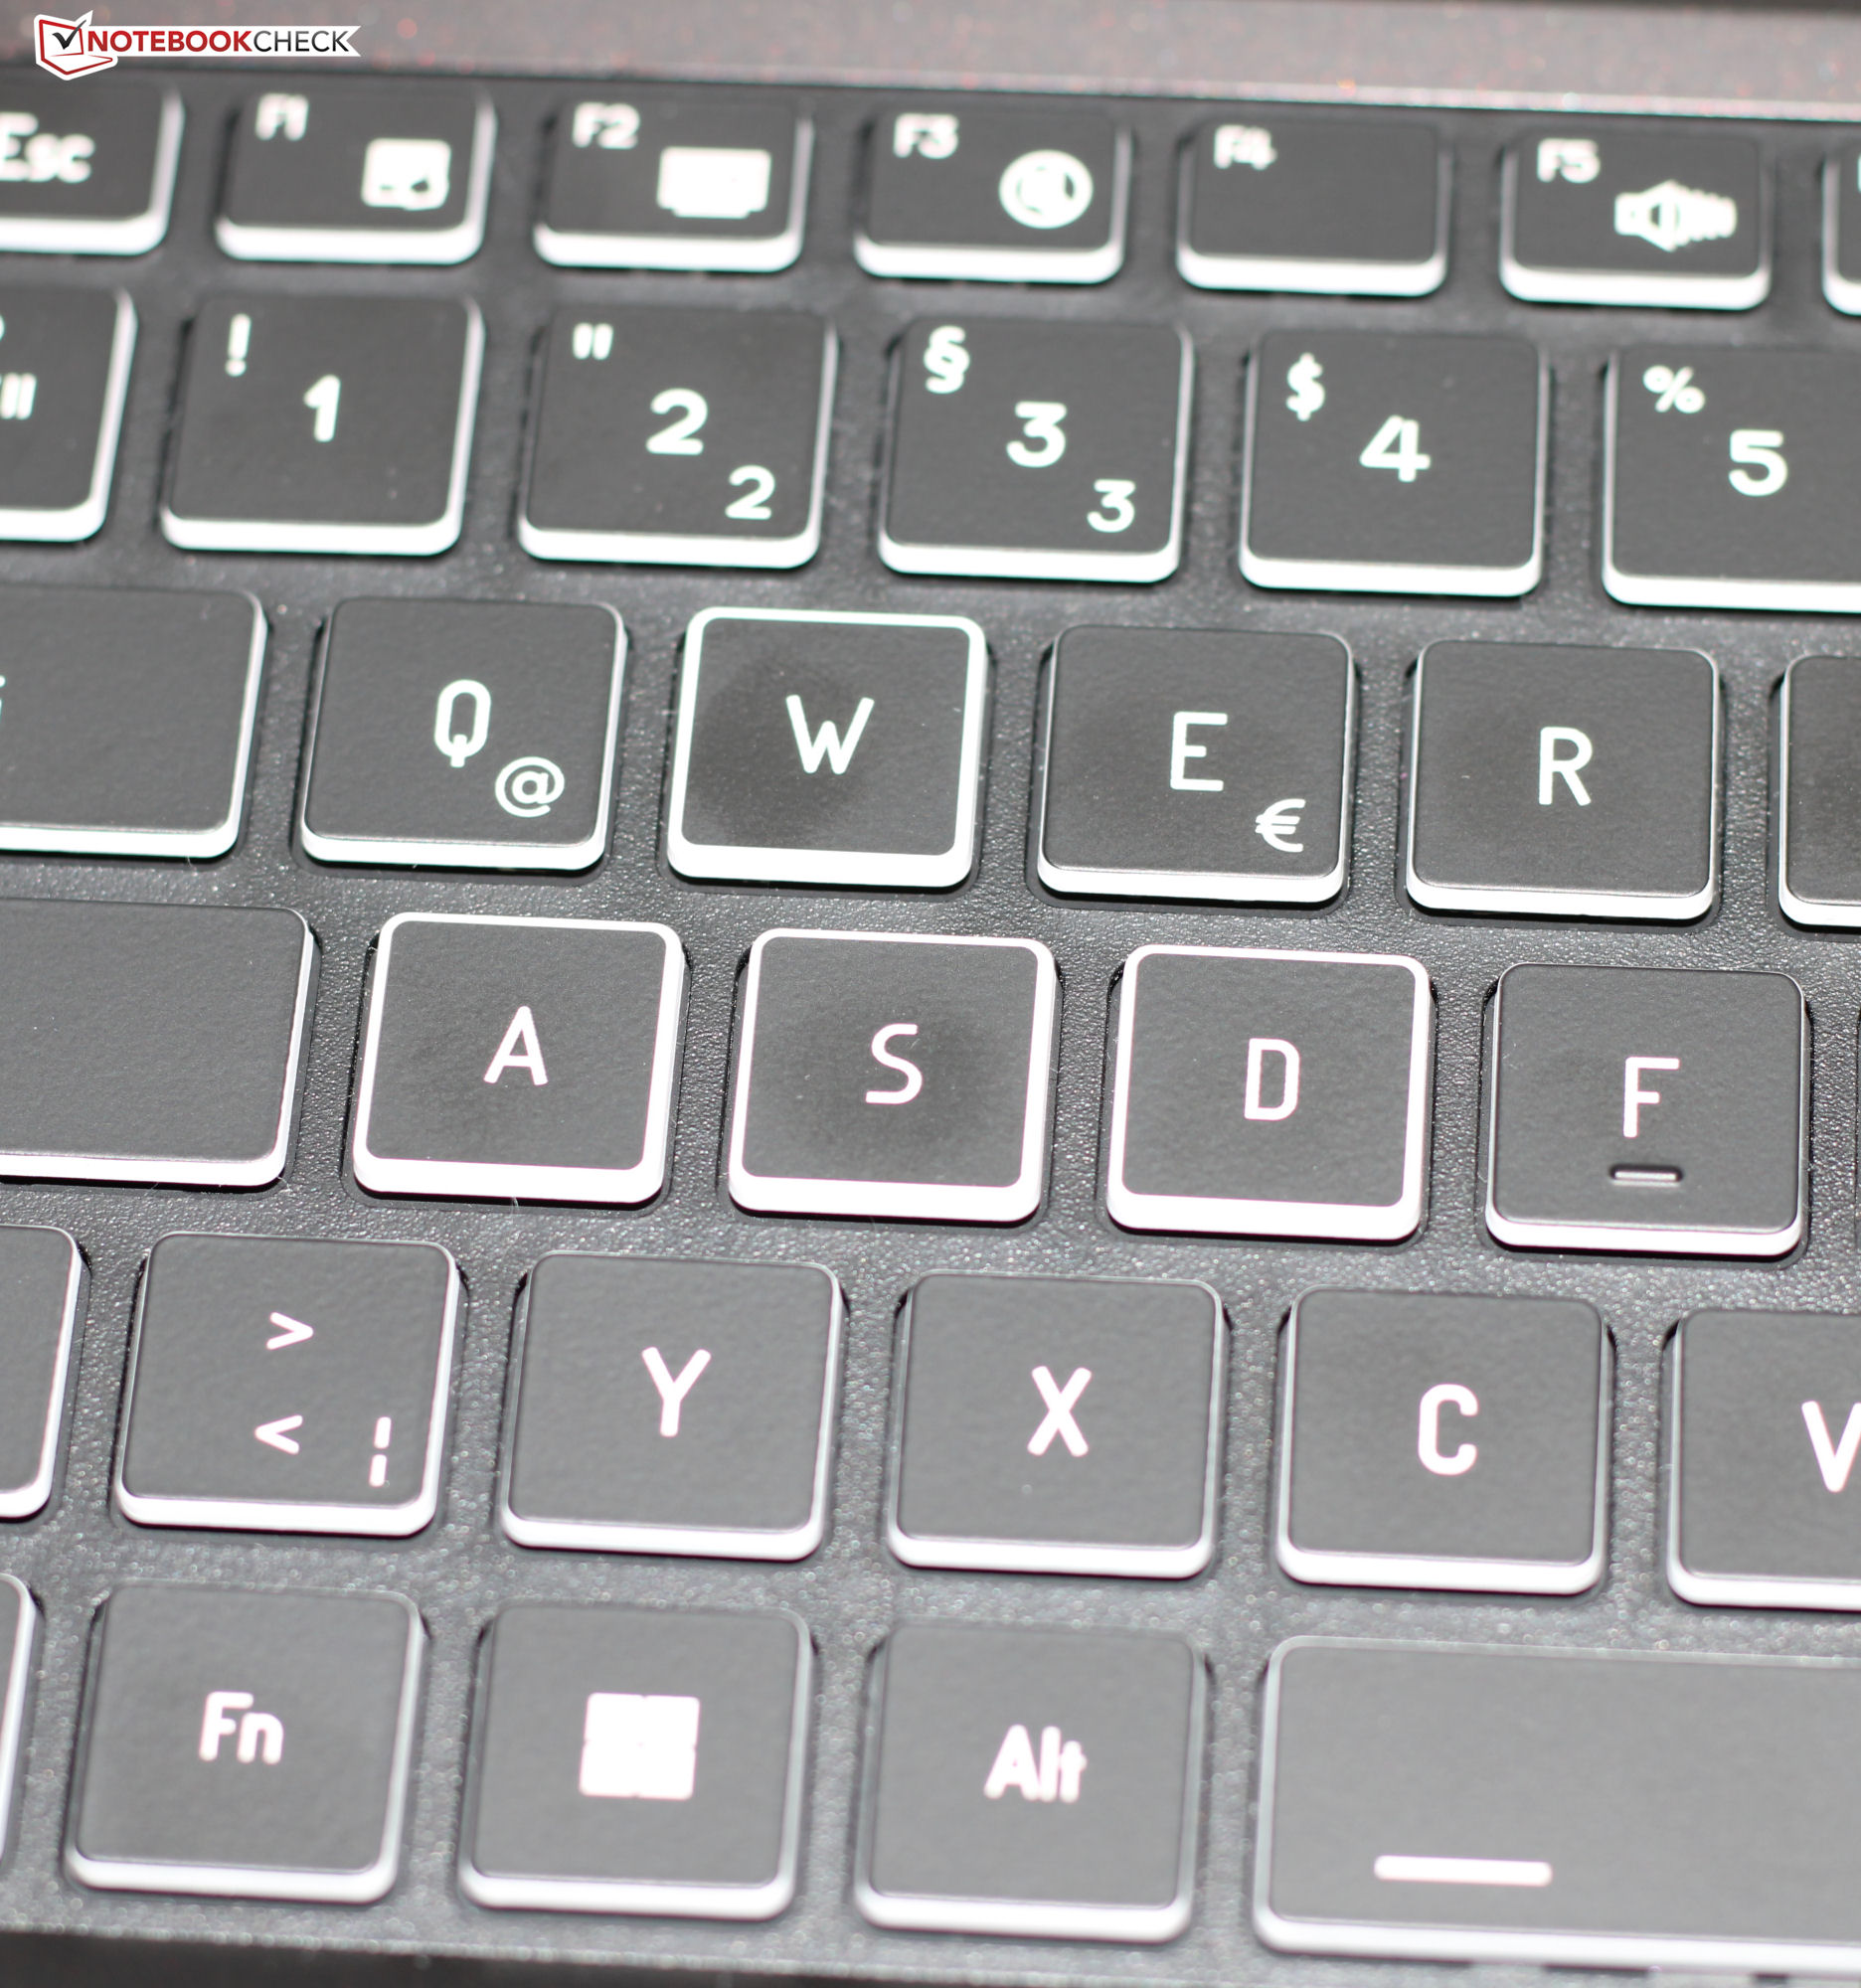
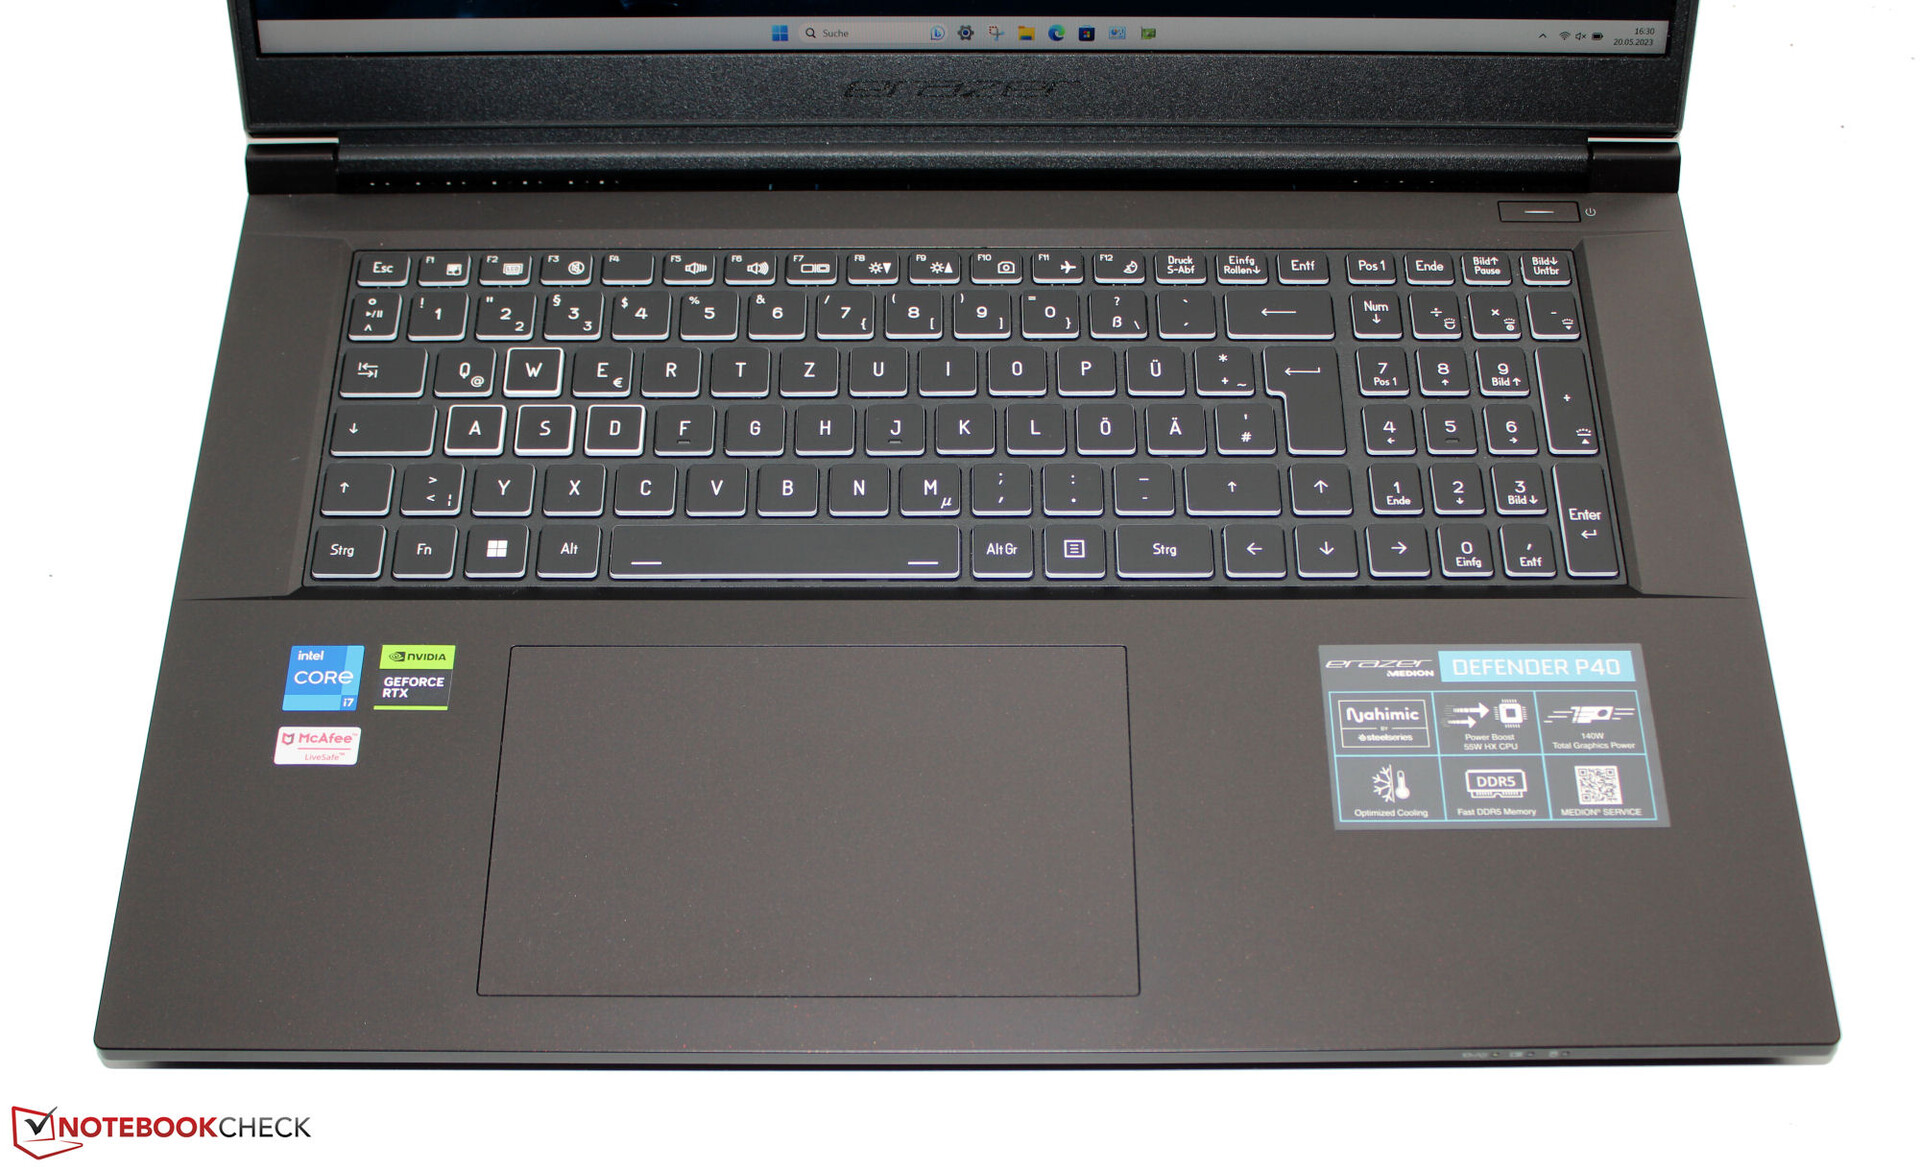
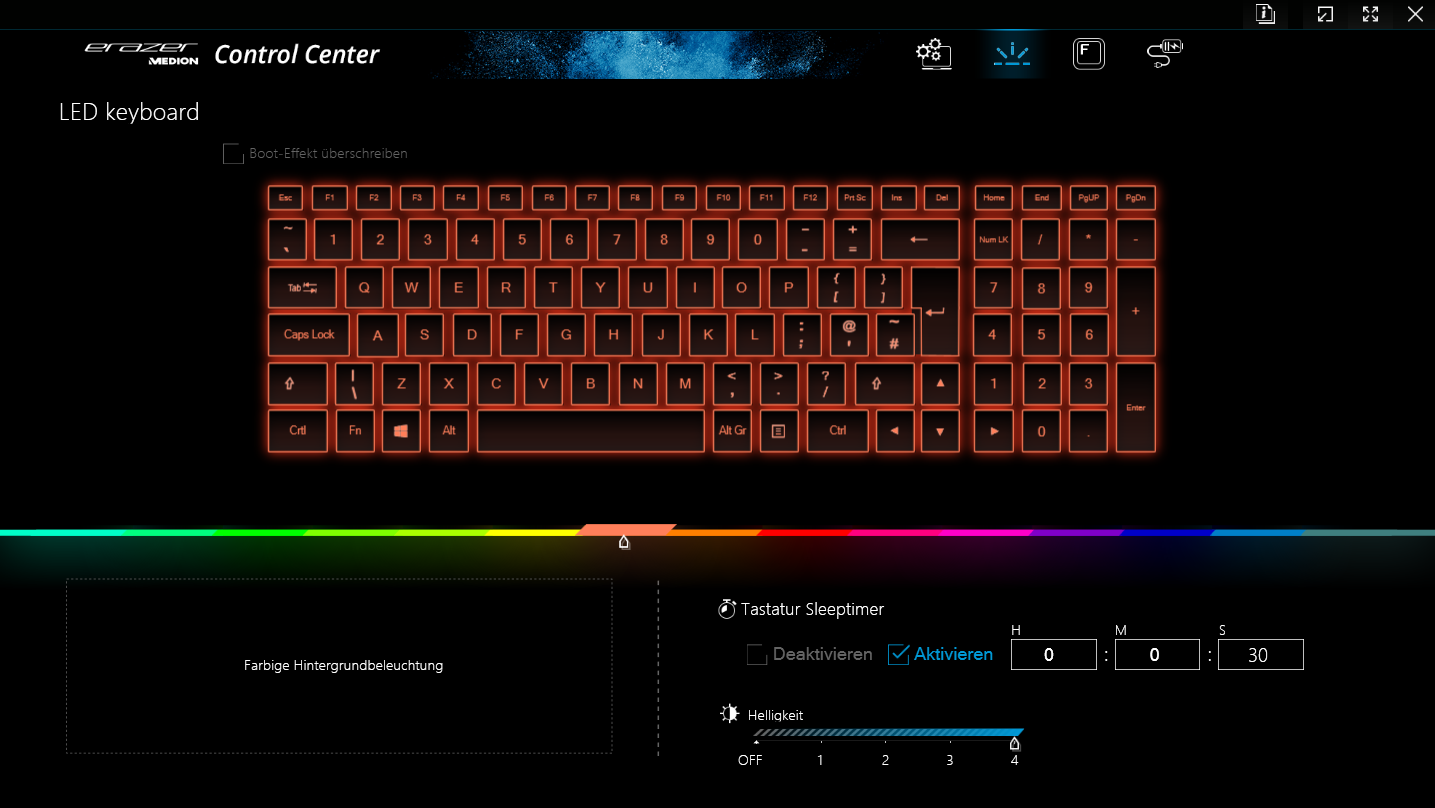
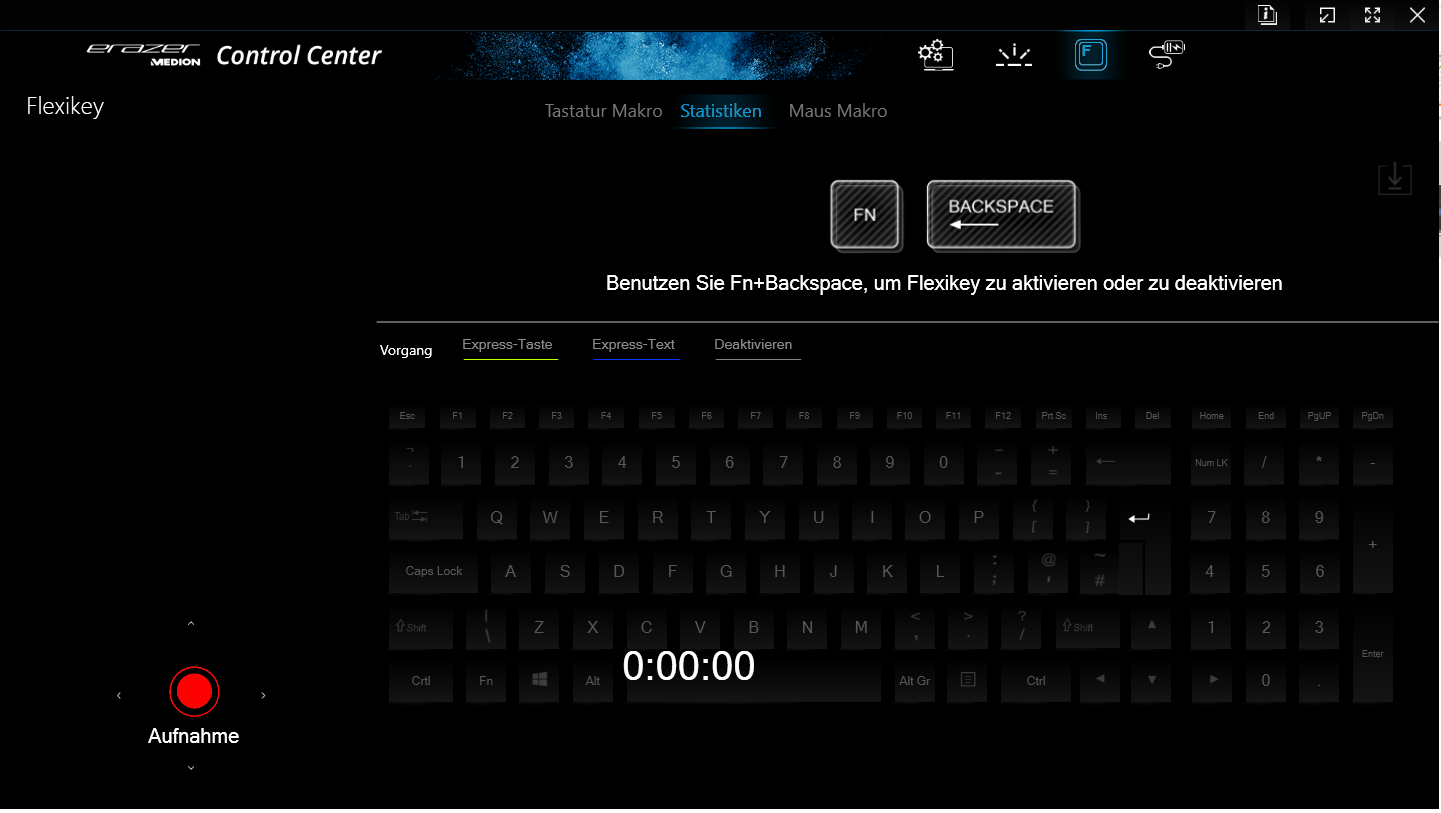
Dispositivi di input - La tastiera del P40 è retroilluminata RGB
Tastiera
La tastiera chiclet illuminata (a 4 livelli) del portatile (compreso il tastierino numerico) è composta da tasti lisci e uniformi. Hanno un'altezza ridotta, un punto di pressione chiaro e un buon livello di resistenza. Quando si digita, i tasti presentano un leggero cedimento, che tuttavia non dovrebbe essere troppo fastidioso. Nel complesso, Medion ha realizzato una tastiera adatta all'uso quotidiano.
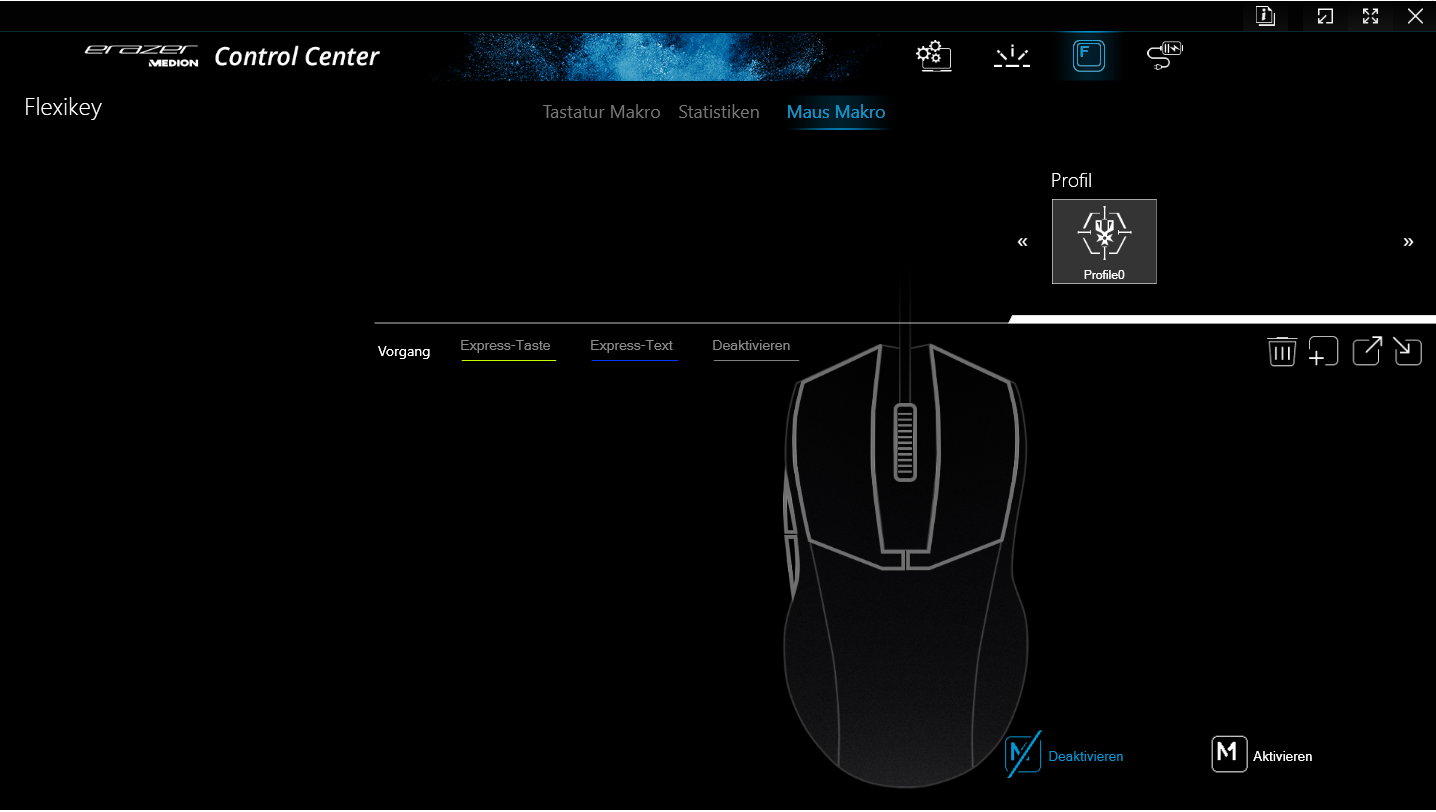
Touchpad
Un click pad (circa 15,1 x 9,2 cm) sostituisce il mouse: ha una superficie liscia su cui le dita possono scivolare facilmente. Ha un'altezza ridotta e un chiaro punto di pressione.
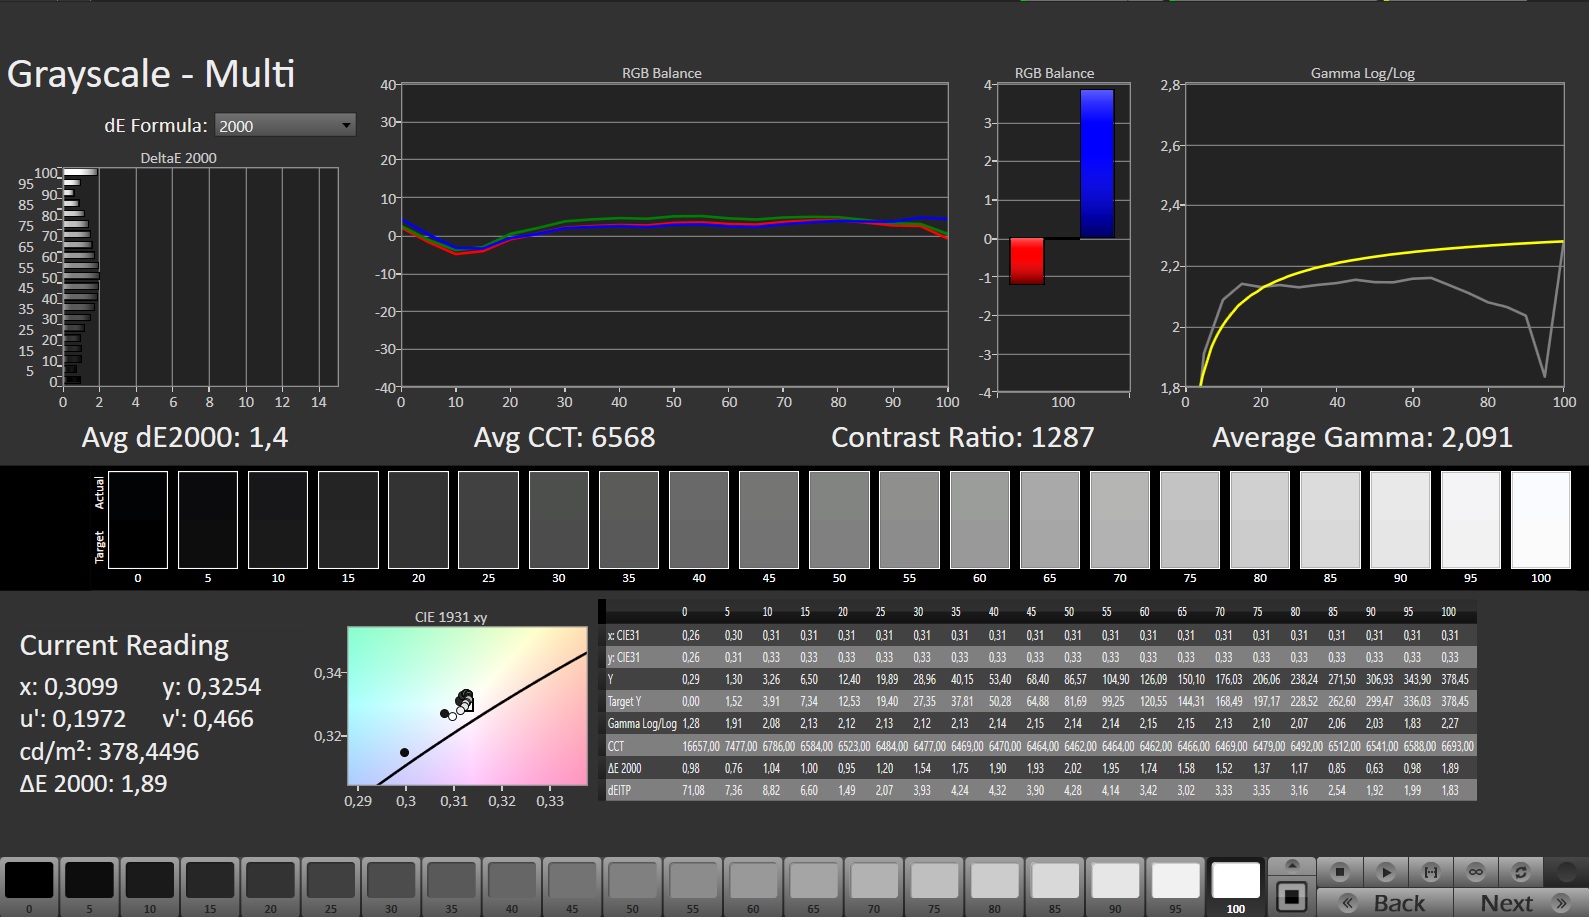
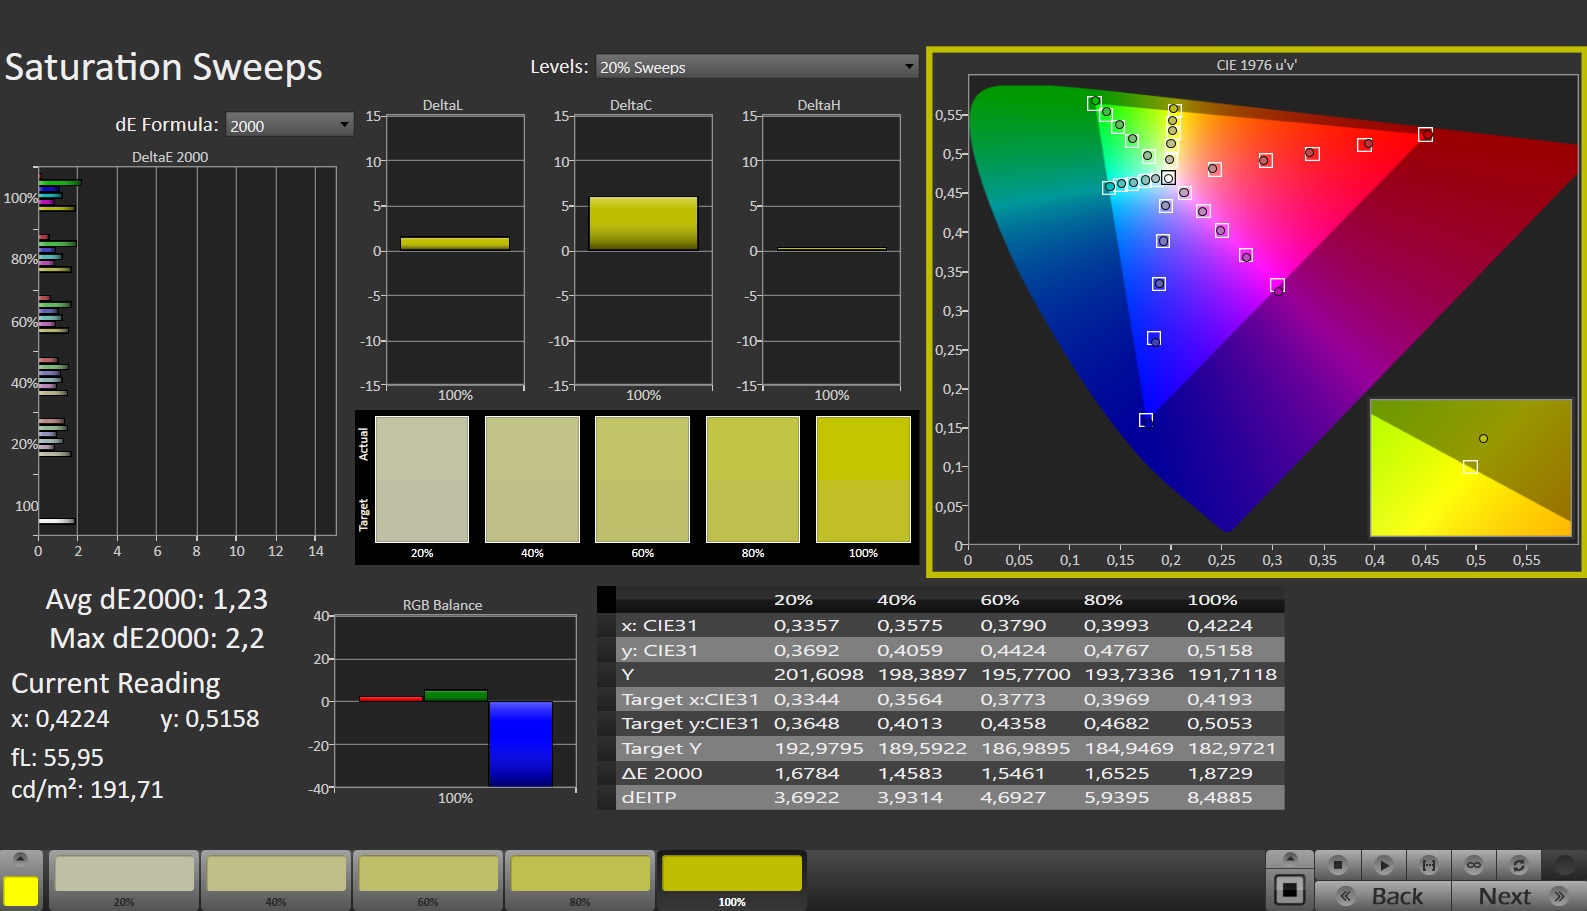
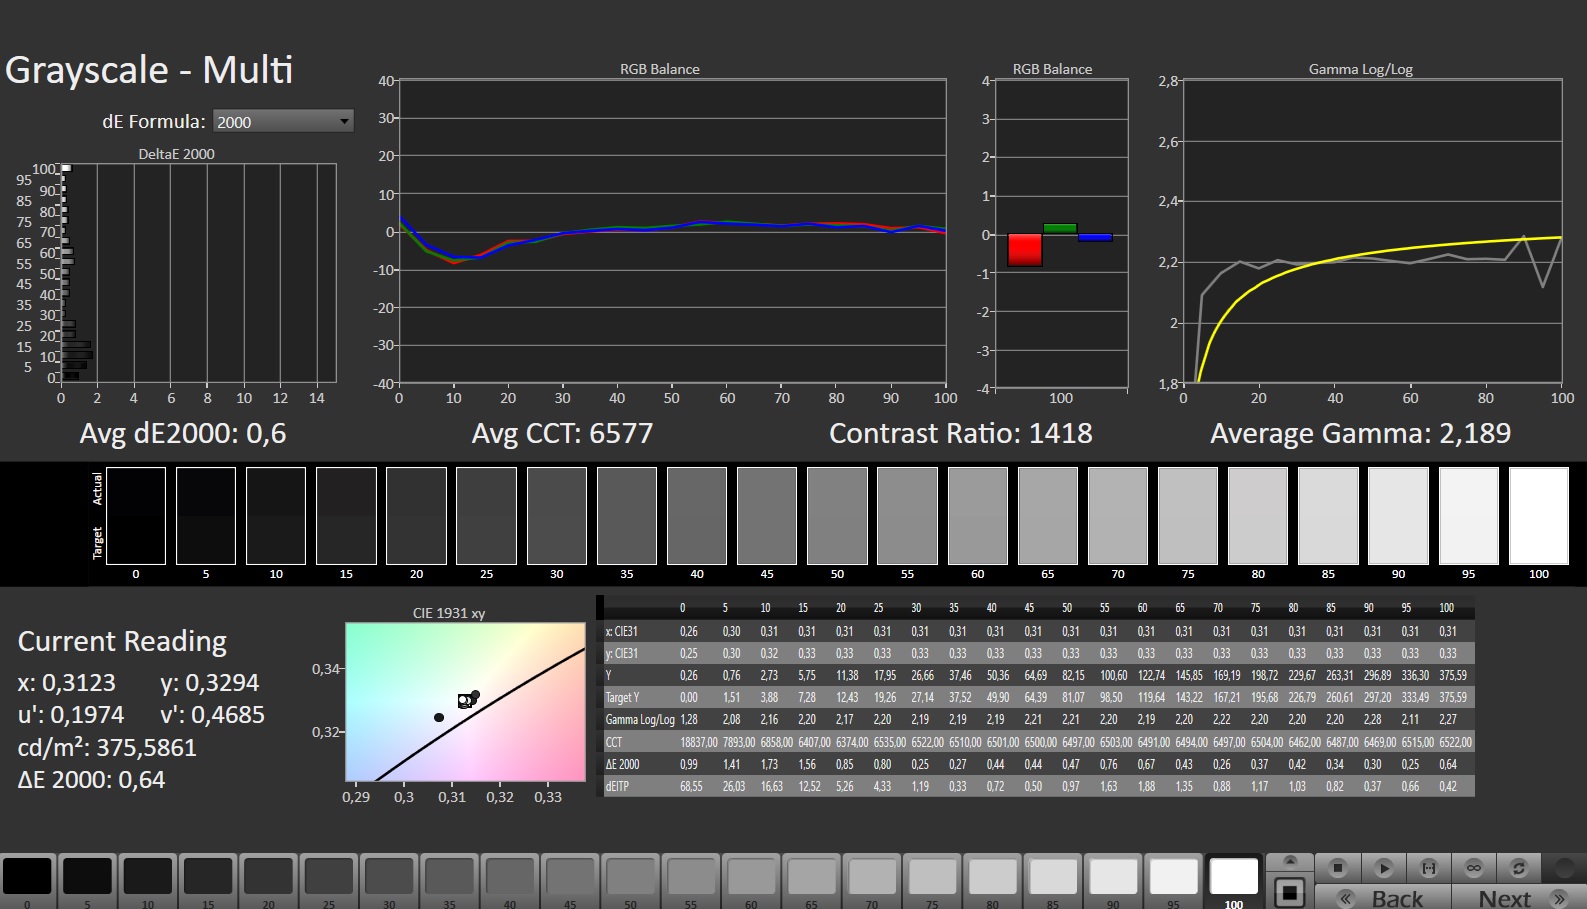
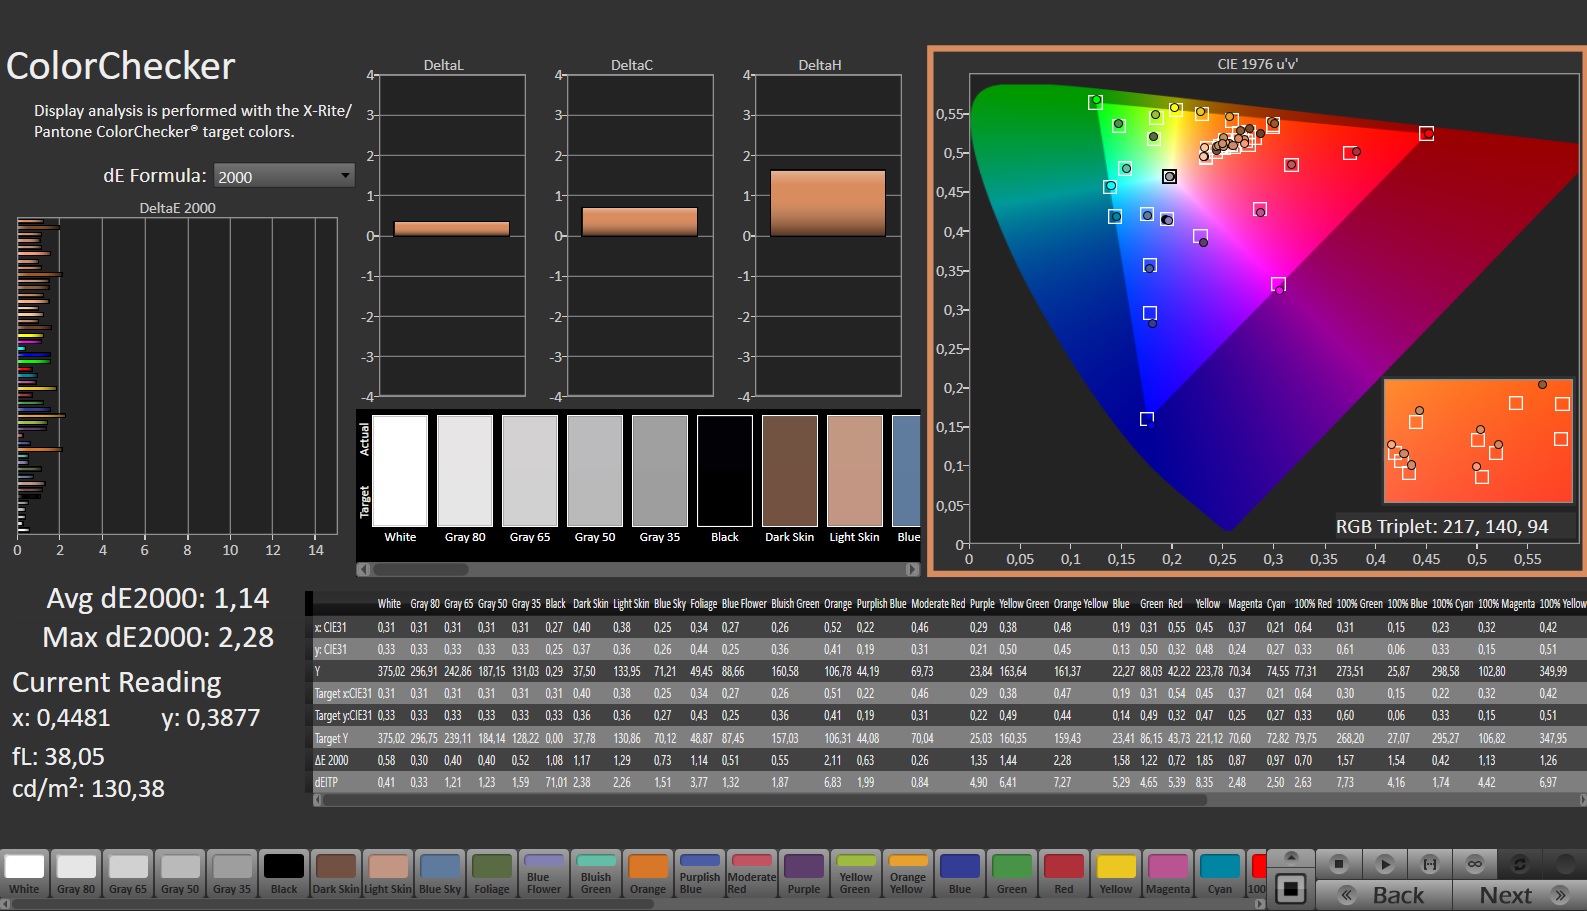
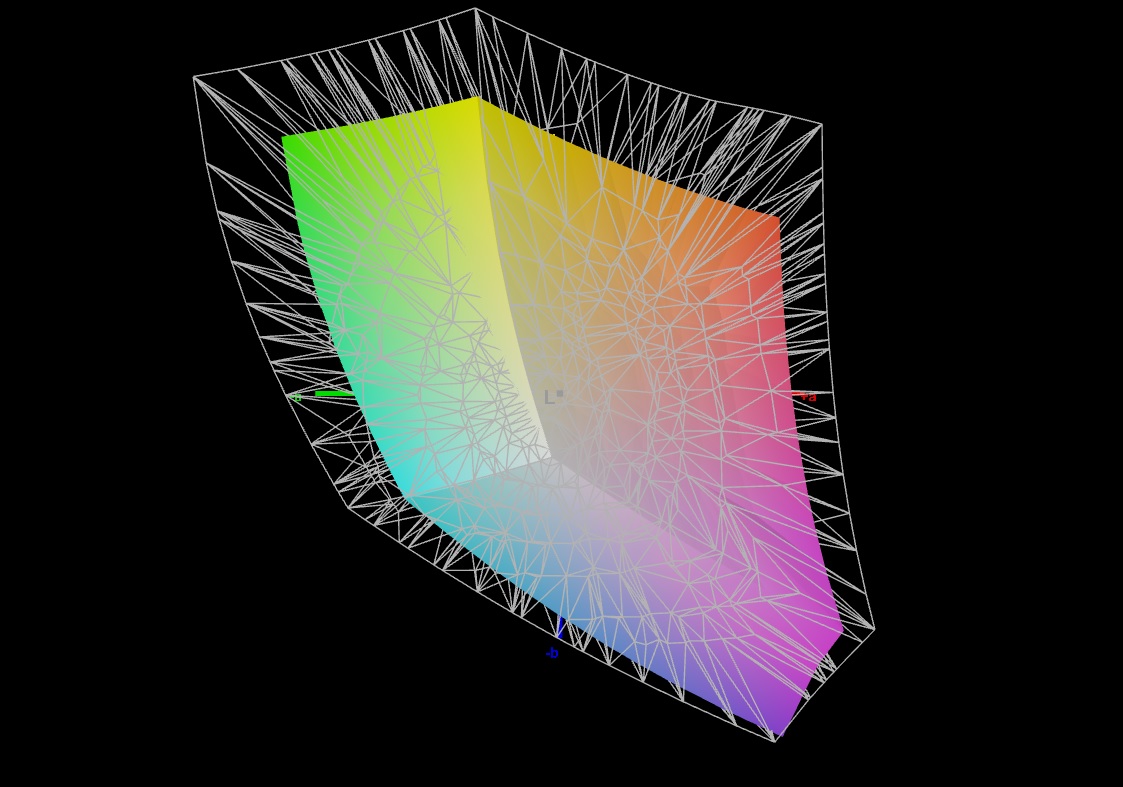
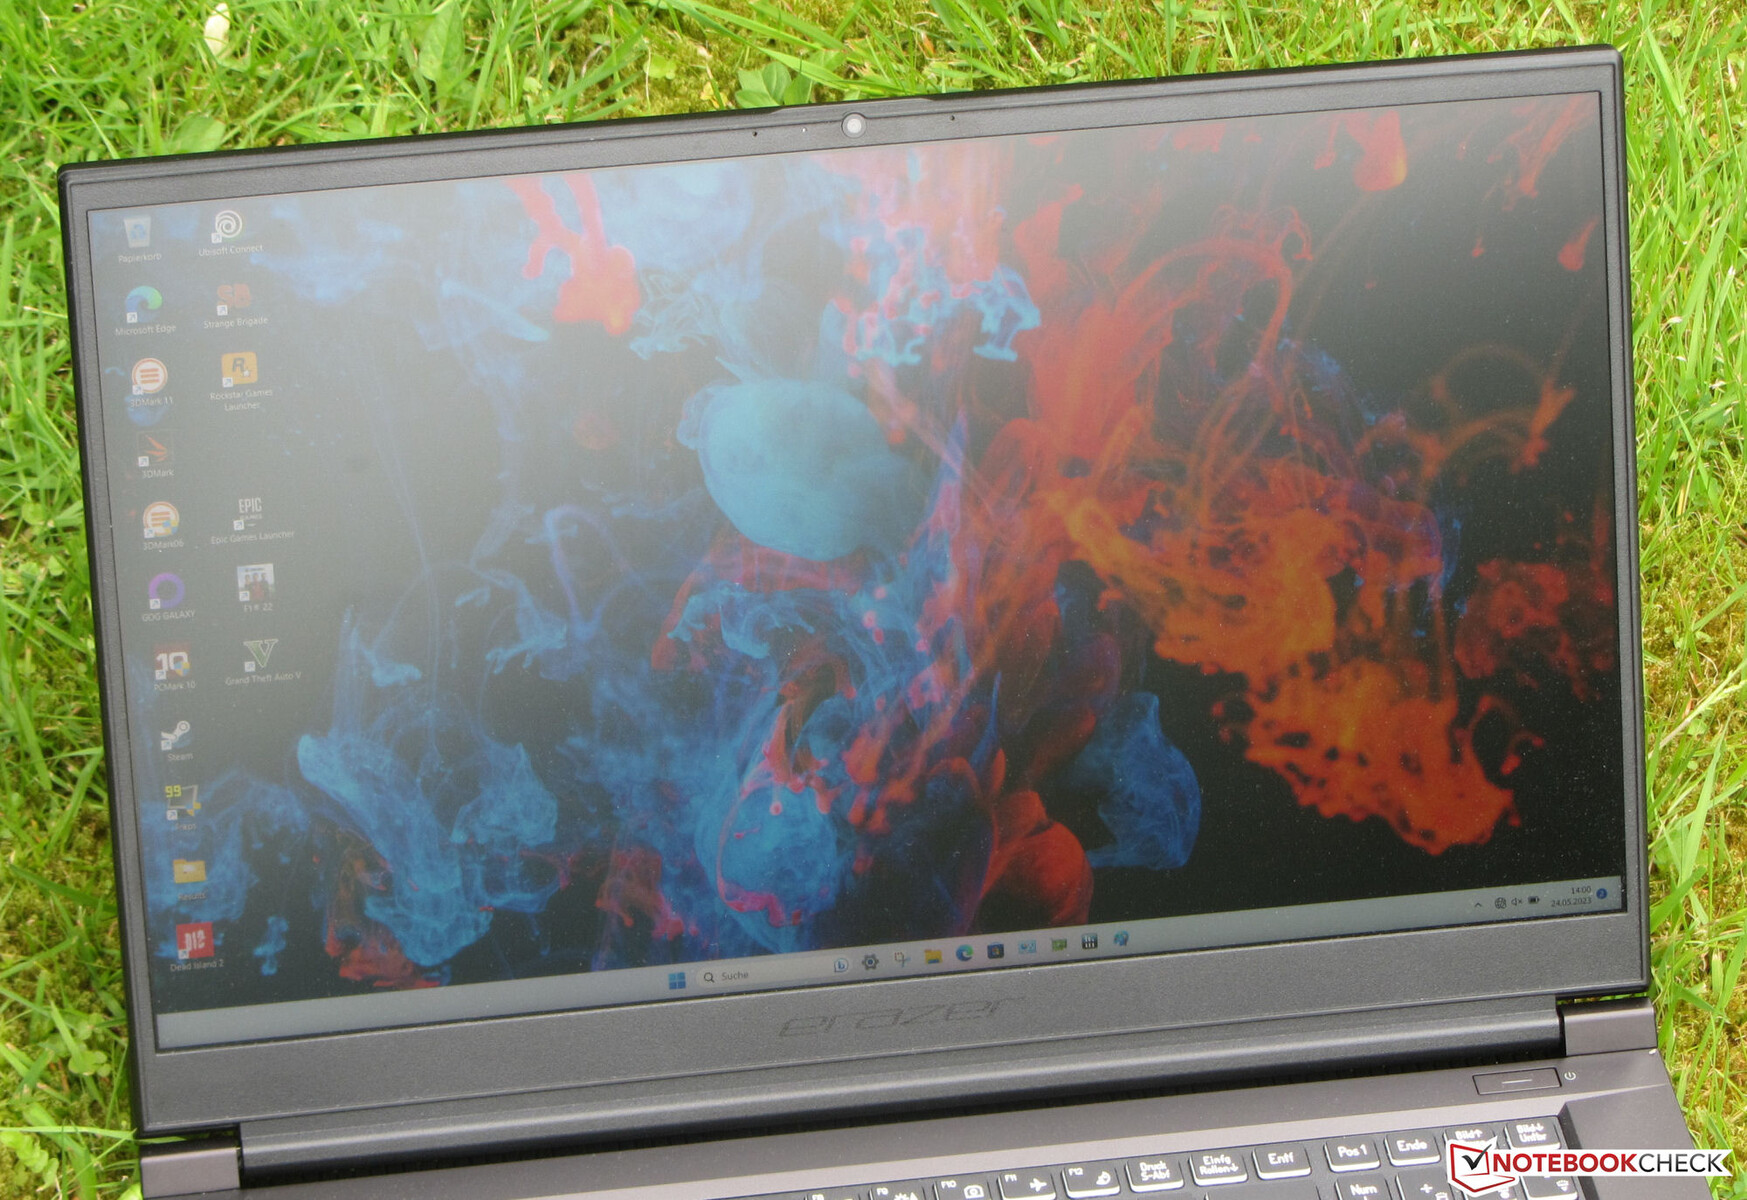
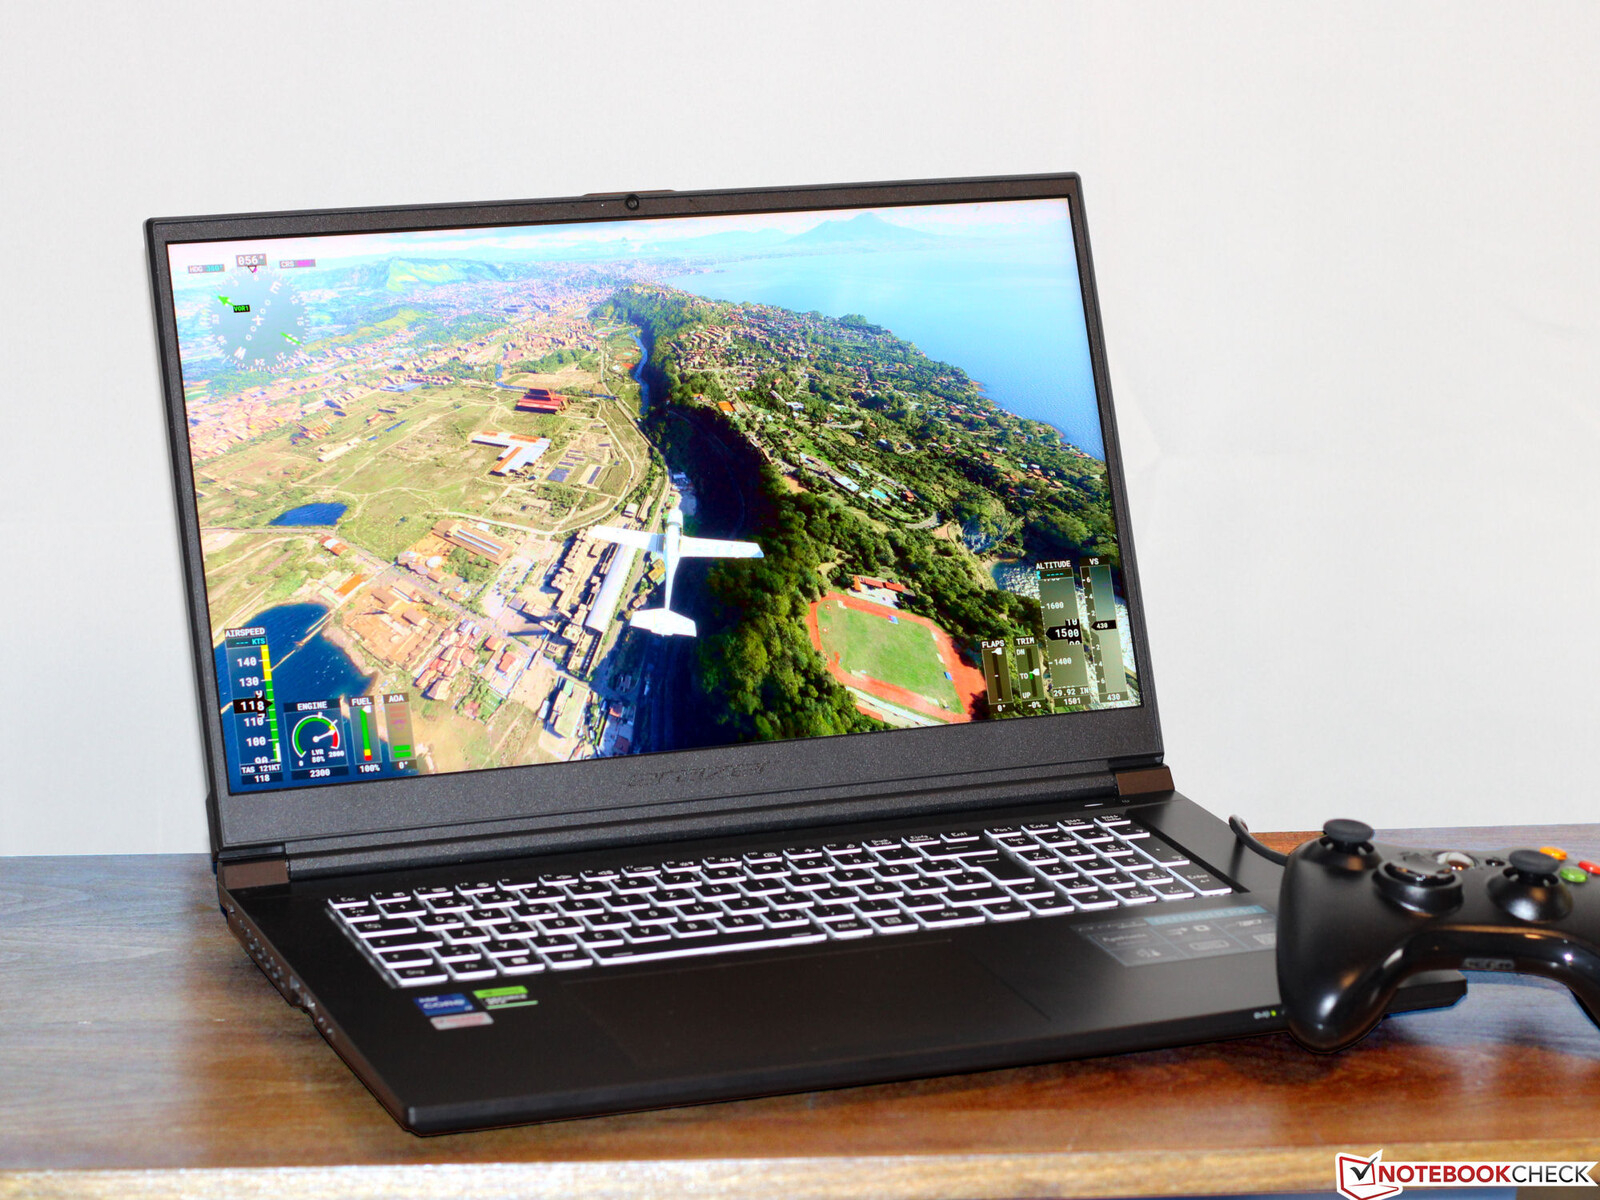
Display - Schermo QHD con copertura sRGB
Il pannello swift a 240 Hz con formato 16:9 non mostra alcuno sfarfallio PWM a qualsiasi livello di luminosità. La luminosità e il contrasto del display da 17,3 pollici (2.560 x 1.440 pixel) sono esattamente come dovrebbero essere (> 300 cd/m² o 1.000:1). Medion non offre altre opzioni di display.
| |||||||||||||||||||||||||
Distribuzione della luminosità: 86 %
Al centro con la batteria: 364 cd/m²
Contrasto: 1300:1 (Nero: 0.28 cd/m²)
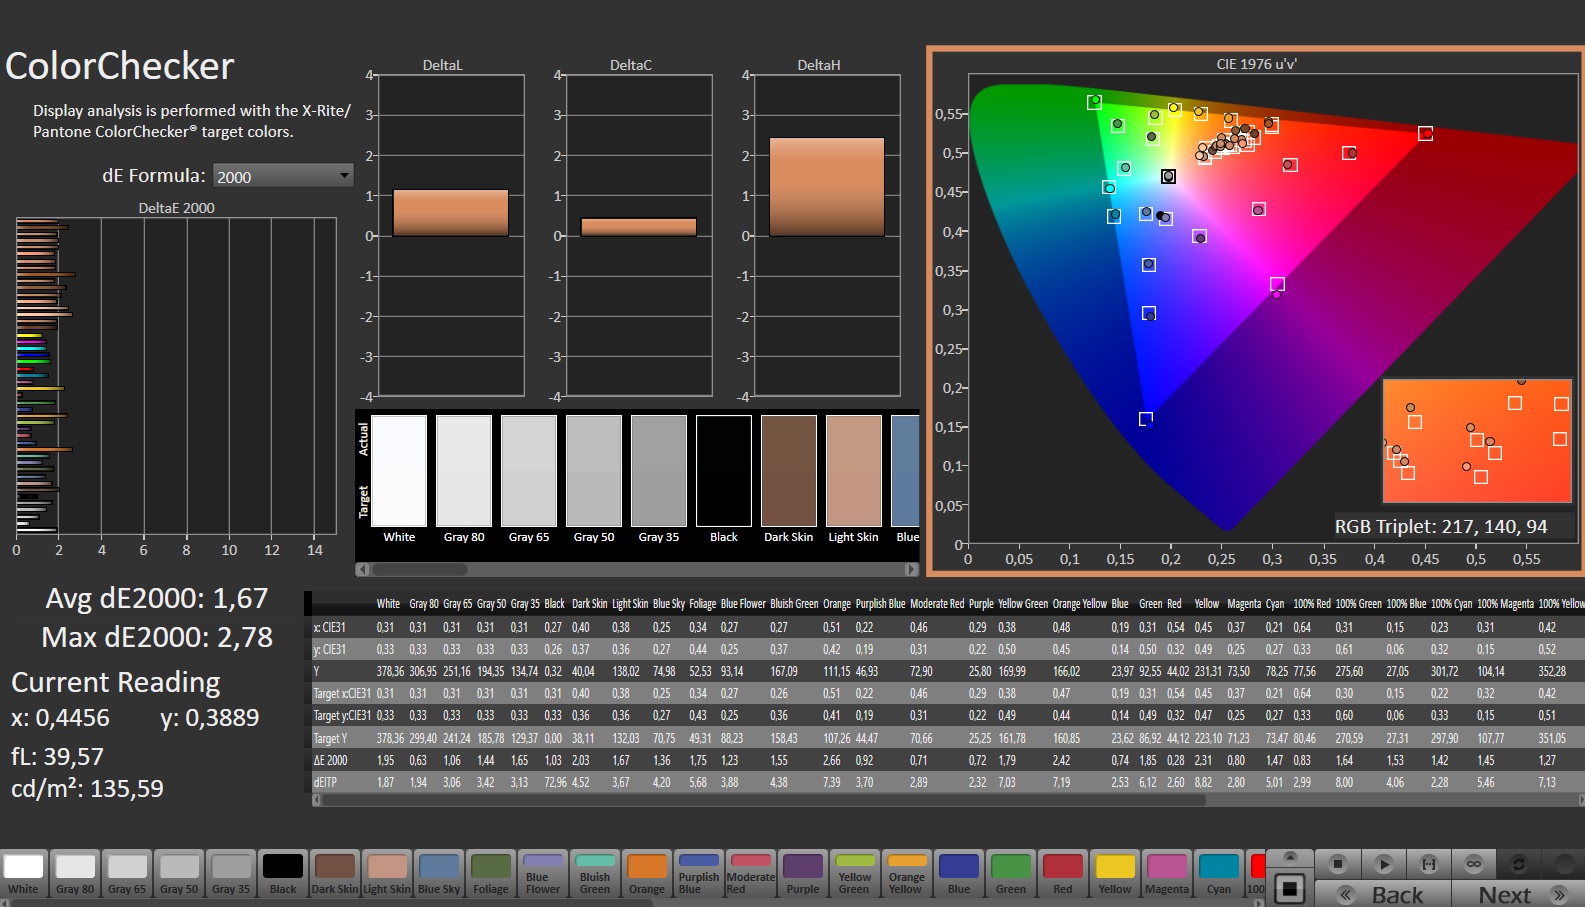
ΔE Color 1.67 | 0.5-29.43 Ø4.86, calibrated: 1.14
ΔE Greyscale 1.4 | 0.5-98 Ø5.1
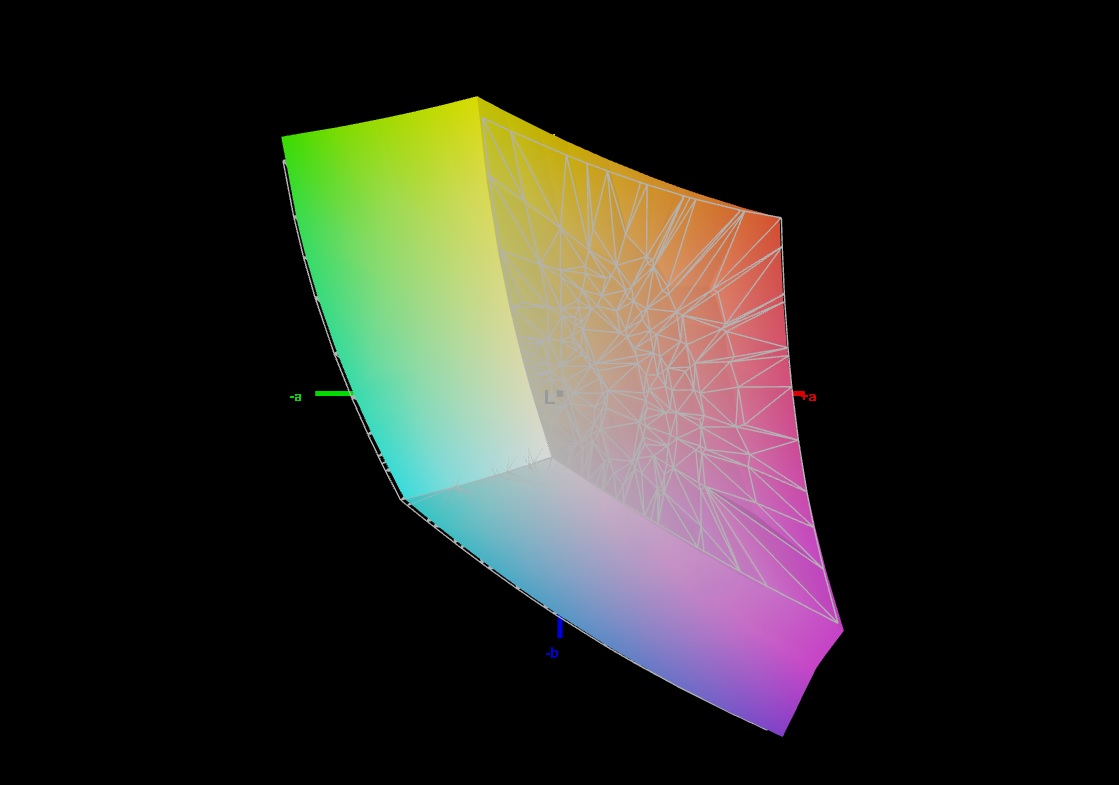
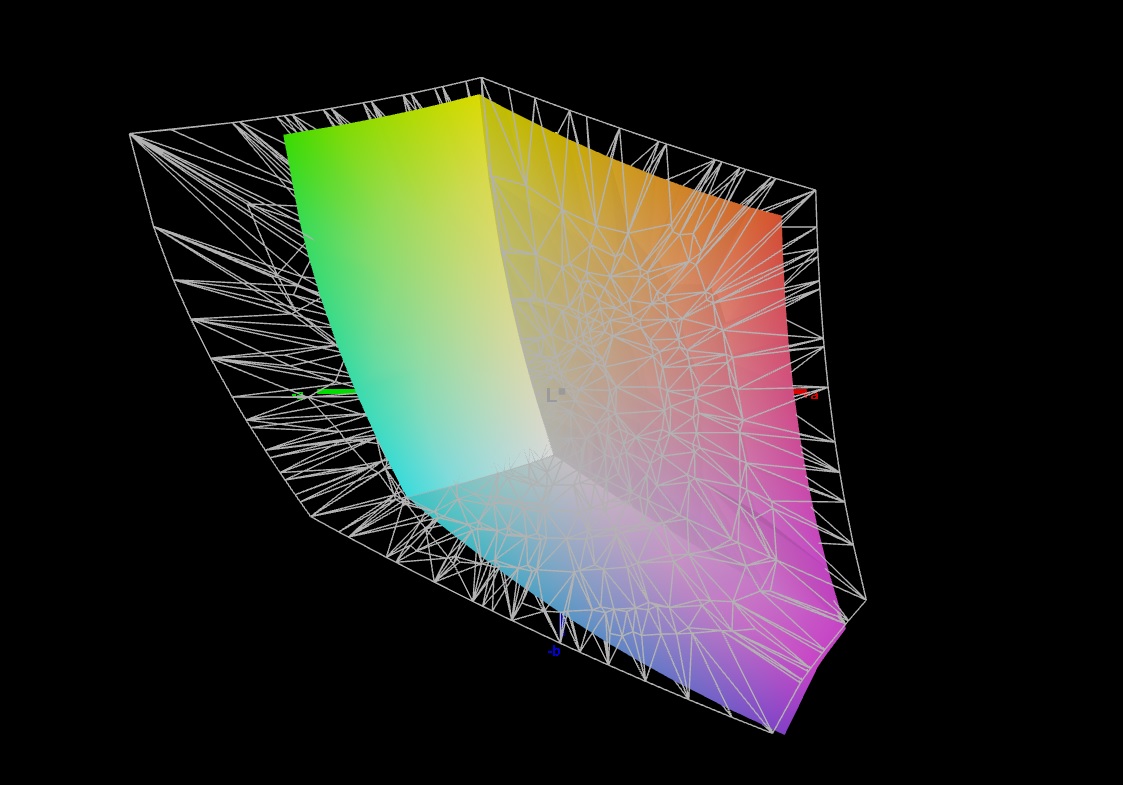
69.8% AdobeRGB 1998 (Argyll 2.2.0 3D)
98.1% sRGB (Argyll 2.2.0 3D)
68.3% Display P3 (Argyll 2.2.0 3D)
Gamma: 2.091
| Medion Erazer Defender P40 BOE CQ NE173QHM-NZ3, IPS, 2560x1440, 17.3" | MSI Katana 17 B13VFK B173HAN04.9, IPS LED, 1920x1080, 17.3" | Acer Predator Helios 300 (i7-12700H, RTX 3070 Ti) BOE0A1A, IPS, 2560x1440, 17.3" | Lenovo Legion Pro 5 16IRX8 AU Optronics B160QAN03.1, IPS, 2560x1600, 16" | Asus TUF Gaming A16 FA617 NE160WUM-NX2 (BOE0B33), IPS-Level, 1920x1200, 16" | Gigabyte G7 KE AU Optronics B173HAN05.1, IPS, 1920x1080, 17.3" | |
|---|---|---|---|---|---|---|
| Display | -39% | 22% | 3% | 1% | 3% | |
| Display P3 Coverage | 68.3 | 40.8 -40% | 96.8 42% | 71.2 4% | 69.4 2% | 70.4 3% |
| sRGB Coverage | 98.1 | 61 -38% | 99.9 2% | 98.8 1% | 97.8 0% | 99.8 2% |
| AdobeRGB 1998 Coverage | 69.8 | 42.2 -40% | 84.8 21% | 73.3 5% | 70.9 2% | 71.7 3% |
| Response Times | -163% | -21% | -10% | -16% | 36% | |
| Response Time Grey 50% / Grey 80% * | 14.6 ? | 33 ? -126% | 16.4 ? -12% | 14.5 ? 1% | 17 ? -16% | 5 ? 66% |
| Response Time Black / White * | 8.7 ? | 26 ? -199% | 11.2 ? -29% | 10.4 ? -20% | 10.1 ? -16% | 8.3 ? 5% |
| PWM Frequency | ||||||
| Screen | -126% | -59% | -2% | -5% | -6% | |
| Brightness middle | 364 | 267 -27% | 366 1% | 405.7 11% | 308 -15% | 307 -16% |
| Brightness | 343 | 256 -25% | 340 -1% | 368 7% | 293 -15% | 301 -12% |
| Brightness Distribution | 86 | 93 8% | 85 -1% | 87 1% | 90 5% | 93 8% |
| Black Level * | 0.28 | 0.21 25% | 0.31 -11% | 0.38 -36% | 0.23 18% | 0.2 29% |
| Contrast | 1300 | 1271 -2% | 1181 -9% | 1068 -18% | 1339 3% | 1535 18% |
| Colorchecker dE 2000 * | 1.67 | 4.7 -181% | 3.56 -113% | 1.65 1% | 1.47 12% | 1.32 21% |
| Colorchecker dE 2000 max. * | 2.78 | 20.4 -634% | 5.66 -104% | 4.2 -51% | 2.98 -7% | 4.6 -65% |
| Colorchecker dE 2000 calibrated * | 1.14 | 4.5 -295% | 3.31 -190% | 0.53 54% | 1.02 11% | 1.03 10% |
| Greyscale dE 2000 * | 1.4 | 1.5 -7% | 2.84 -103% | 1.2 14% | 2.2 -57% | 2.1 -50% |
| Gamma | 2.091 105% | 2.12 104% | 2.29 96% | 2.3 96% | 2.228 99% | 2.247 98% |
| CCT | 6568 99% | 6552 99% | 6835 95% | 6453 101% | 6228 104% | 6815 95% |
| Media totale (Programma / Settaggio) | -109% /
-113% | -19% /
-36% | -3% /
-2% | -7% /
-5% | 11% /
2% |
* ... Meglio usare valori piccoli
Ex funziona, lo schermo ha già un'ottima rappresentazione dei colori: Una deviazione di circa 1,7 è accettabile (DeltaE < 3). La calibrazione porta a una deviazione minore di 1,13 e a toni di grigio più equilibrati.
Il pannello copre l'intero spazio colore sRGB, ma non AdobeRGB o DCI P3. Questo non è molto diverso dai concorrenti del dispositivo. Solo lo schermo dell'Acer Predator Recensione dell'Acer Predator Helios 300: Un portatile gaming overclockato con un buon display può rappresentare lo spazio P3.

Tempi di risposta del Display
| ↔ Tempi di risposta dal Nero al Bianco | ||
|---|---|---|
| 8.7 ms ... aumenta ↗ e diminuisce ↘ combinato | ↗ 3.6 ms Incremento | 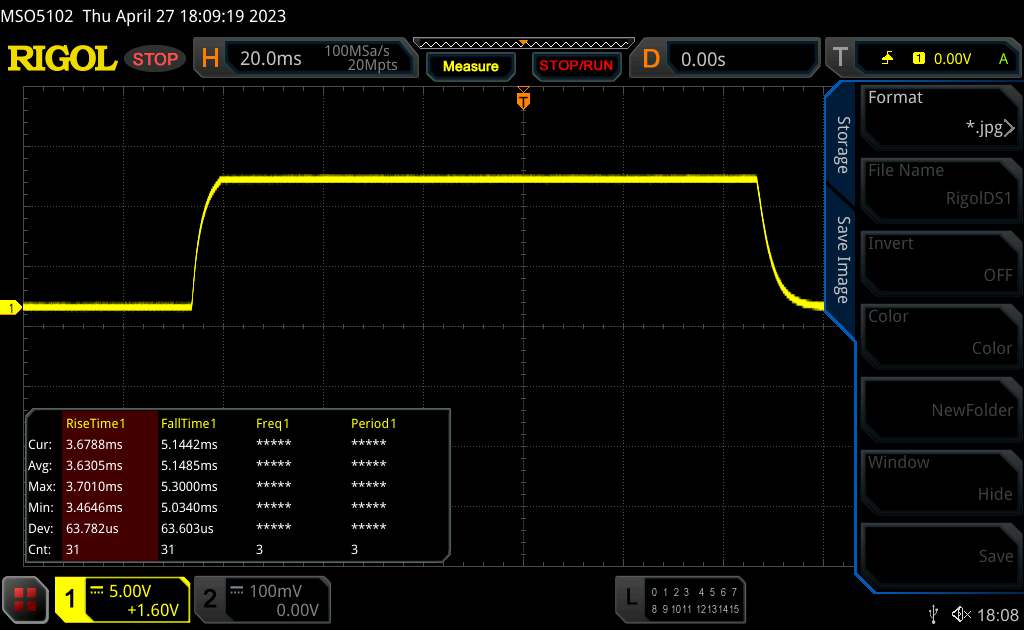 |
| ↘ 5.1 ms Calo | ||
| Lo schermo mostra veloci tempi di risposta durante i nostri tests e dovrebbe esere adatto al gaming In confronto, tutti i dispositivi di test variano da 0.1 (minimo) a 240 (massimo) ms. » 22 % di tutti i dispositivi è migliore. Questo significa che i tempi di risposta rilevati sono migliori rispettto alla media di tutti i dispositivi testati (20.7 ms). | ||
| ↔ Tempo di risposta dal 50% Grigio all'80% Grigio | ||
| 14.6 ms ... aumenta ↗ e diminuisce ↘ combinato | ↗ 7.1 ms Incremento | 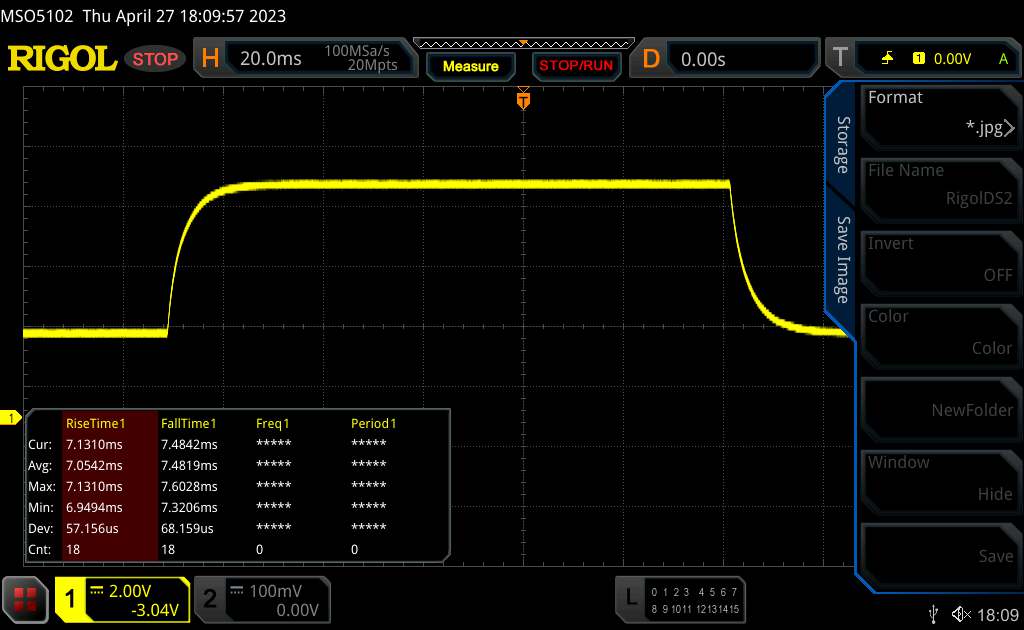 |
| ↘ 7.5 ms Calo | ||
| Lo schermo mostra buoni tempi di risposta durante i nostri tests, ma potrebbe essere troppo lento per i gamers competitivi. In confronto, tutti i dispositivi di test variano da 0.165 (minimo) a 636 (massimo) ms. » 26 % di tutti i dispositivi è migliore. Questo significa che i tempi di risposta rilevati sono migliori rispettto alla media di tutti i dispositivi testati (32.4 ms). | ||
Sfarfallio dello schermo / PWM (Pulse-Width Modulation)
| flickering dello schermo / PWM non rilevato | 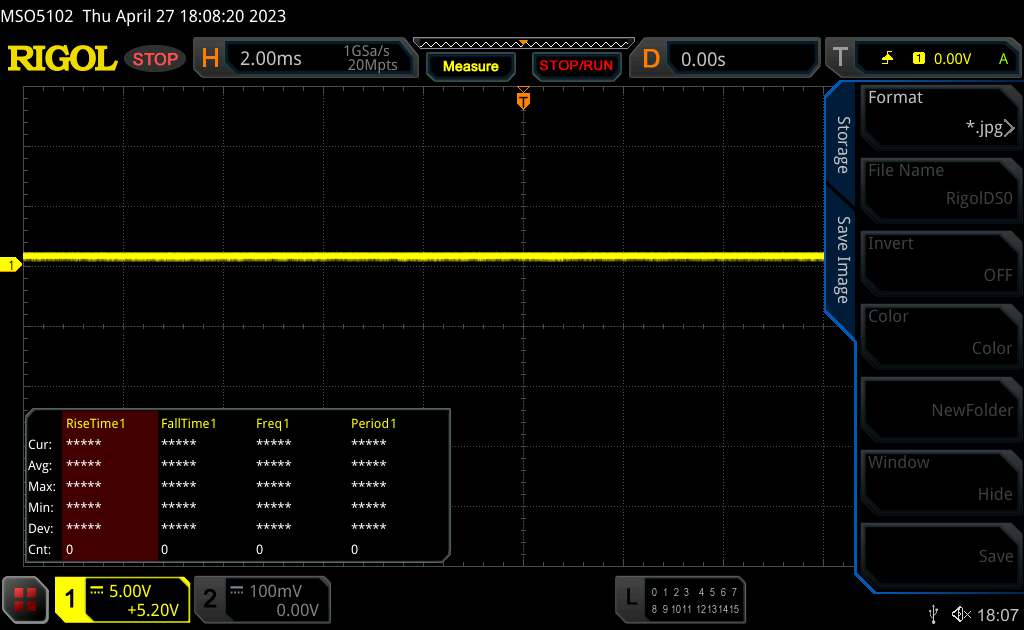 | ||
In confronto: 53 % di tutti i dispositivi testati non utilizza PWM per ridurre la luminosita' del display. Se è rilevato PWM, una media di 8455 (minimo: 5 - massimo: 343500) Hz è stata rilevata. | |||
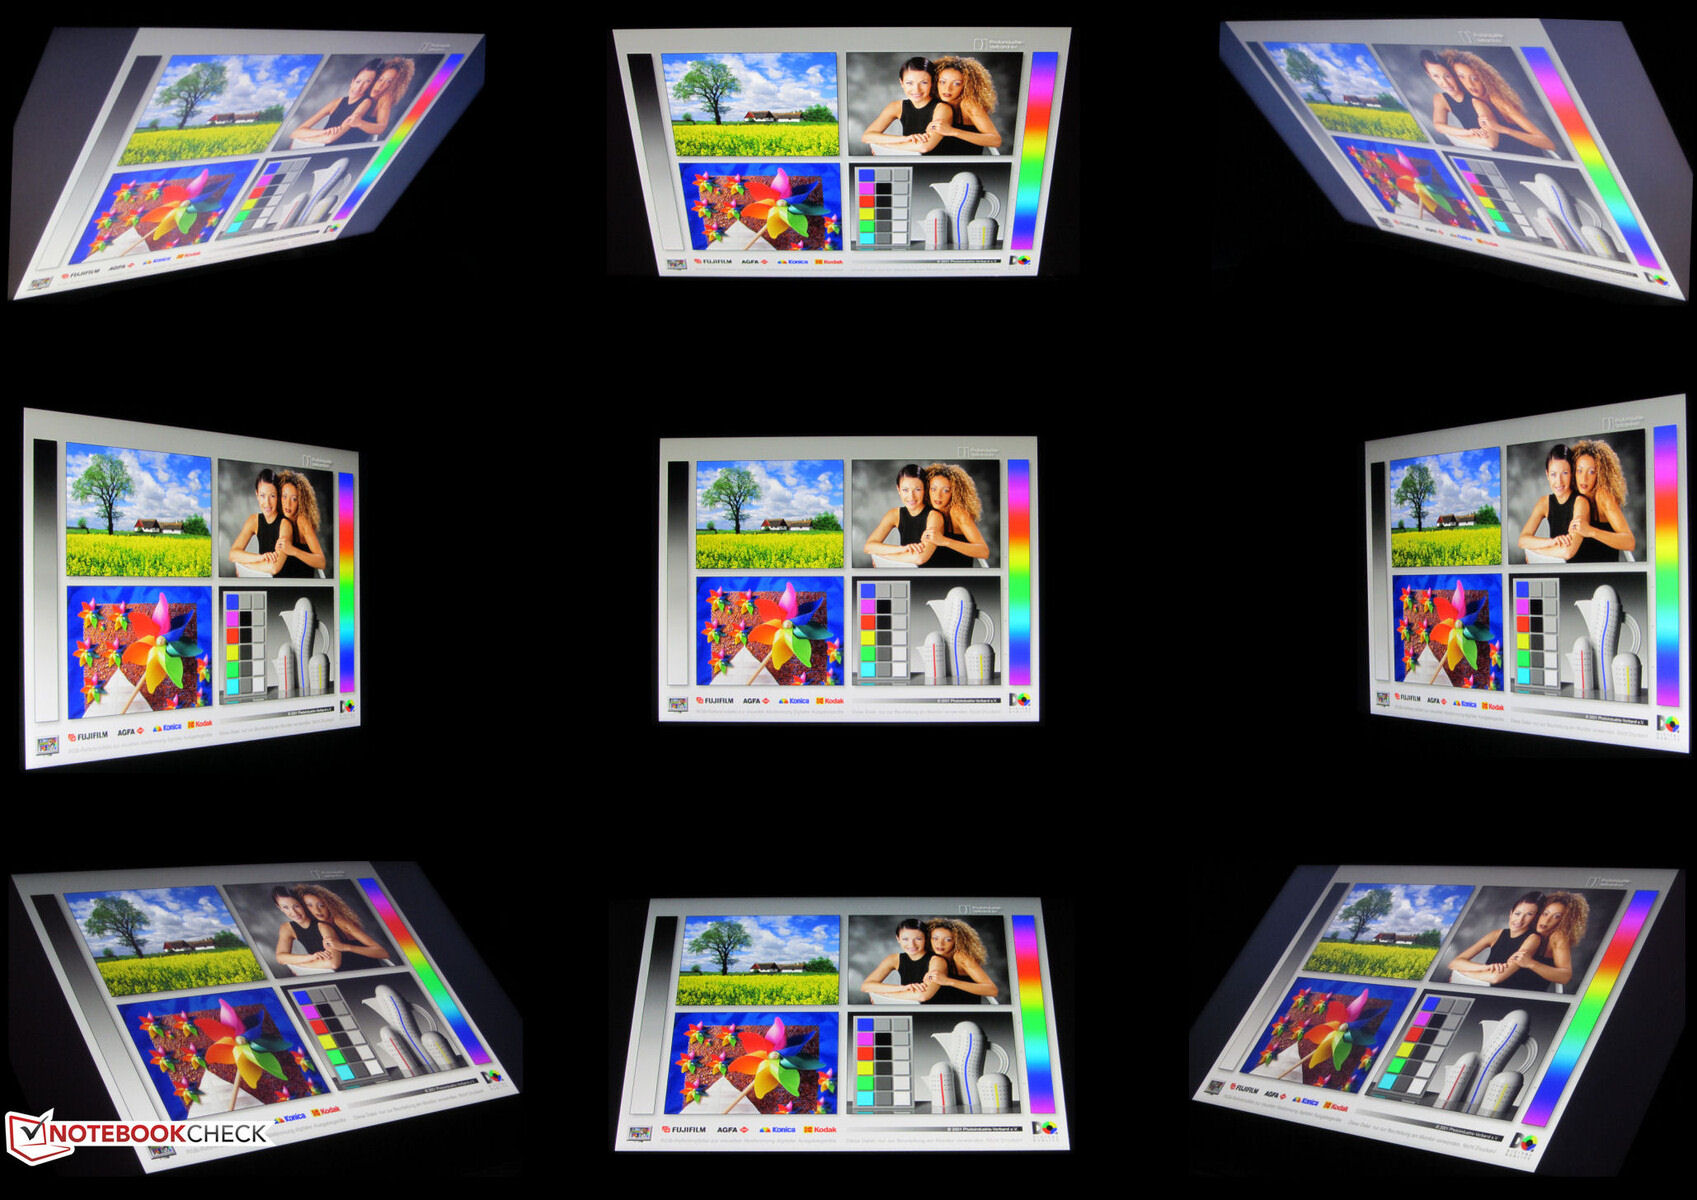
Il pannello IBS stabile nell'angolo di visione rimane leggibile da qualsiasi posizione. All'aperto, lo schermo rimane leggibile a condizione che il sole non sia troppo forte.
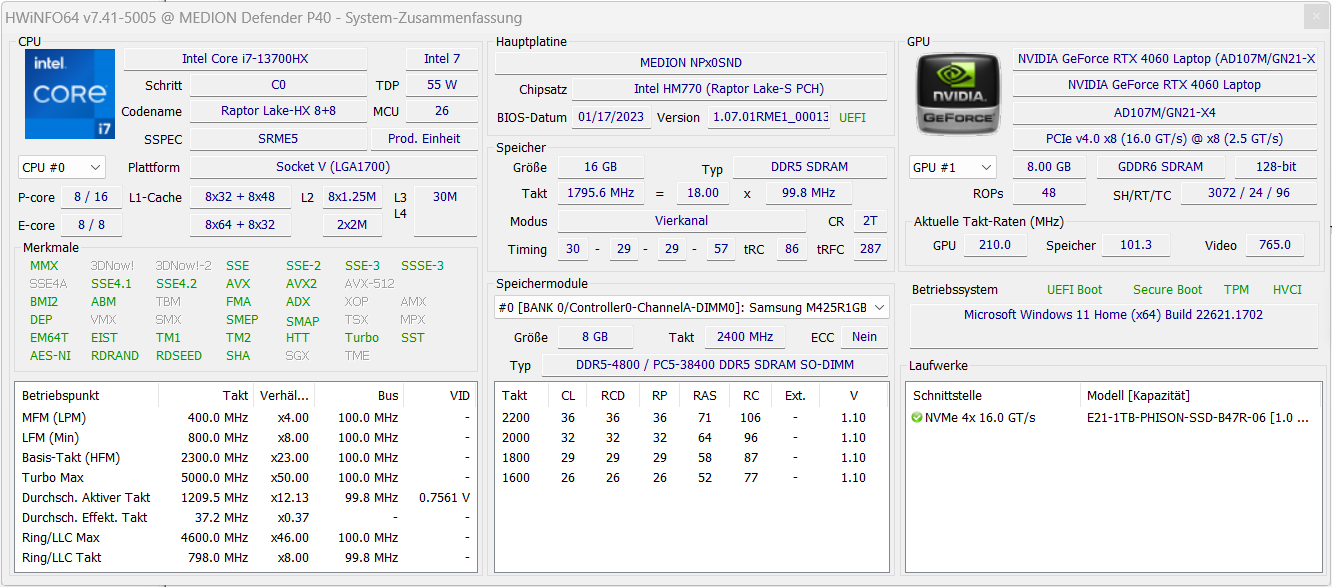
Prestazioni - Il computer Erazer è dotato di hardware di fascia media
Erazer Defender P40 di Medion è un portatile da gioco QHD di fascia media. Raptor Lake e Ada Lovelace garantiscono le necessarie prestazioni di elaborazione. Il modello attuale può essere acquistato per circa 1.900 dollari - altri modelli con caratteristiche diverse non sono disponibili.
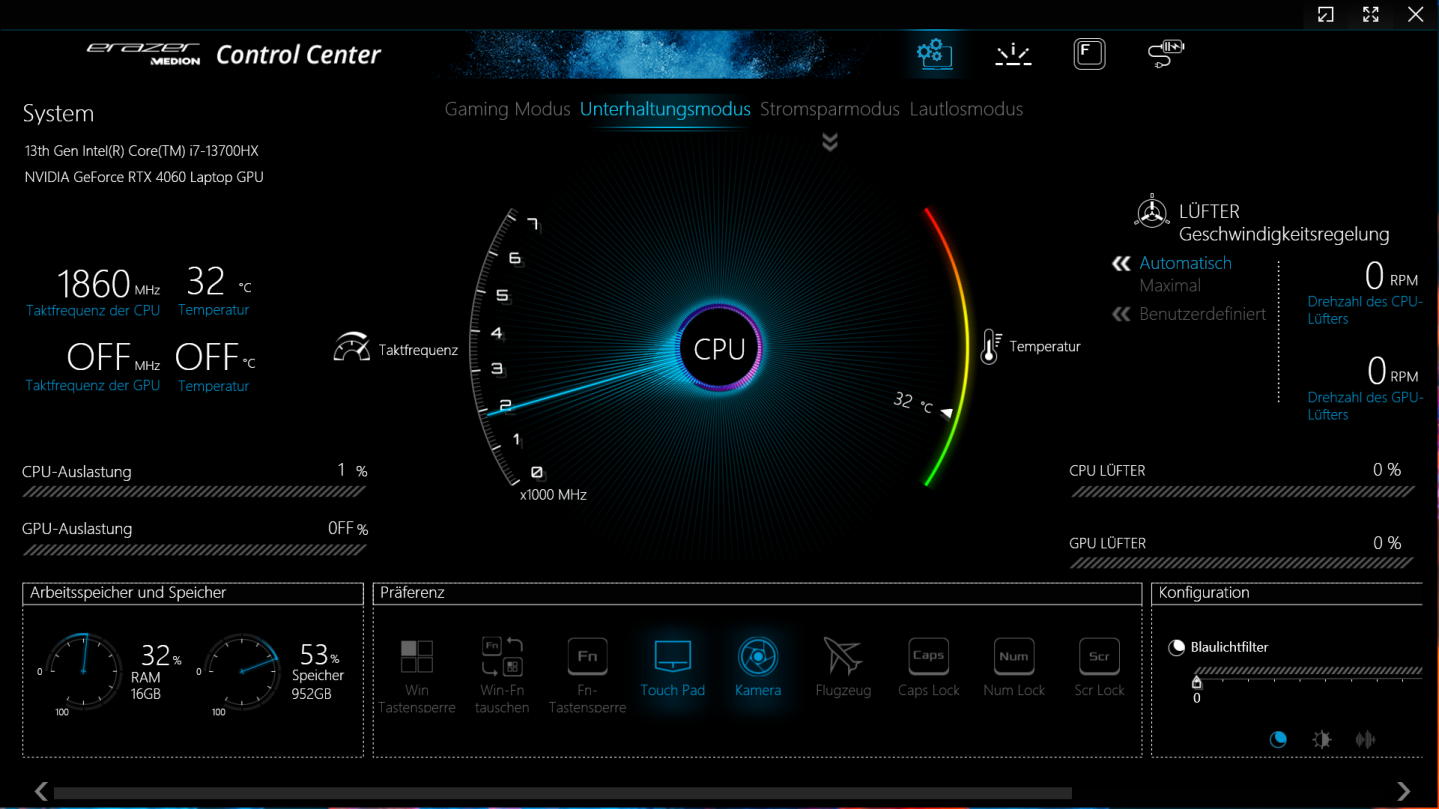
Condizioni di test
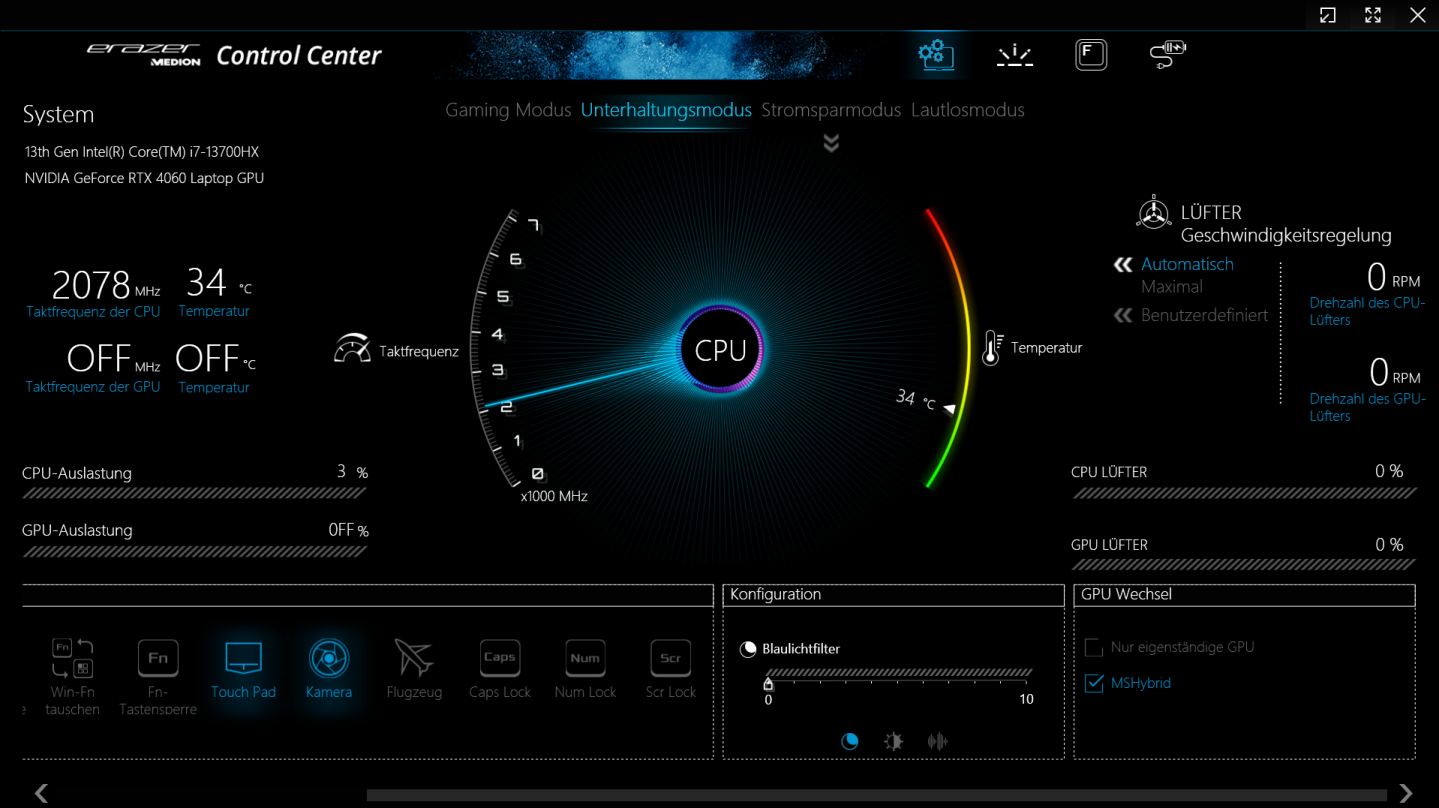
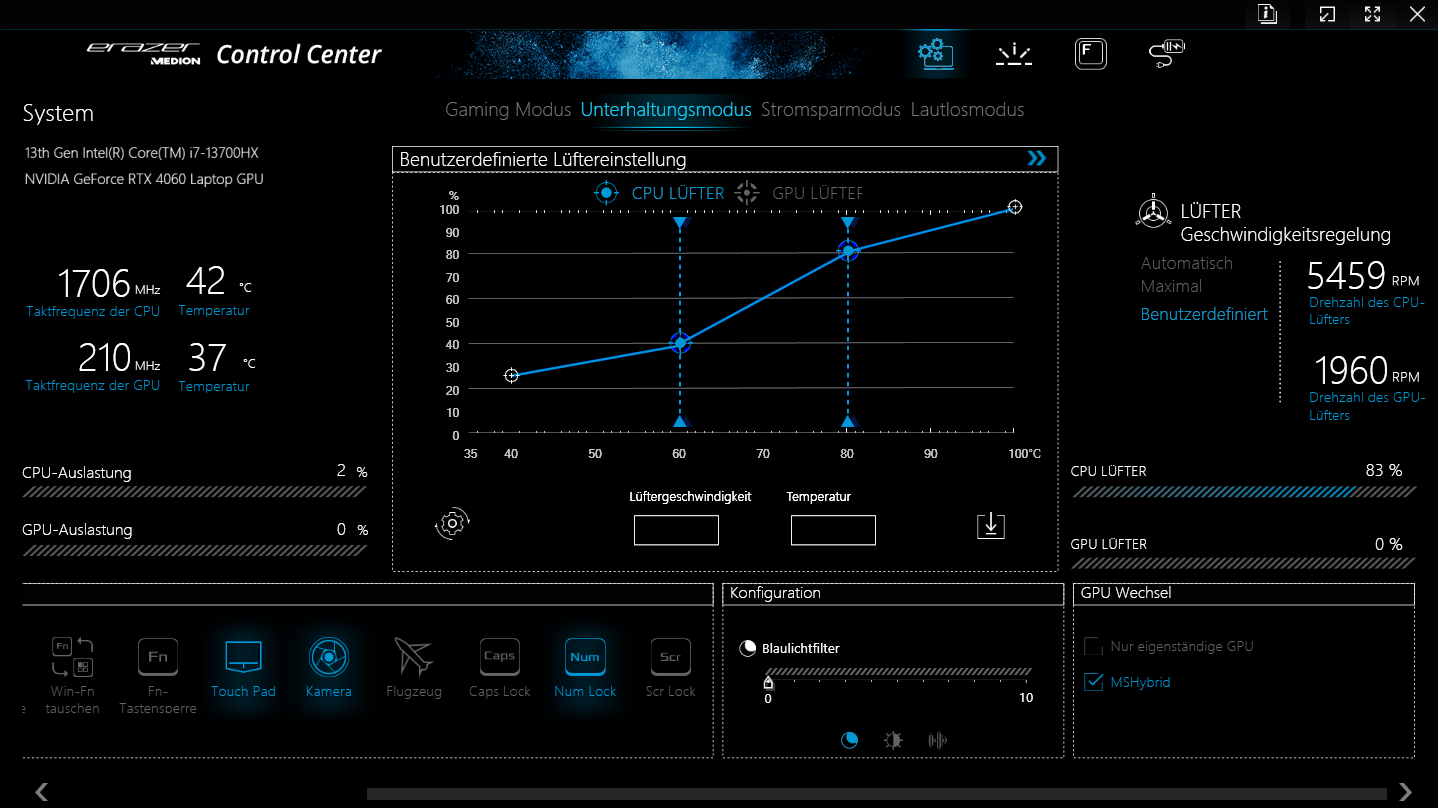
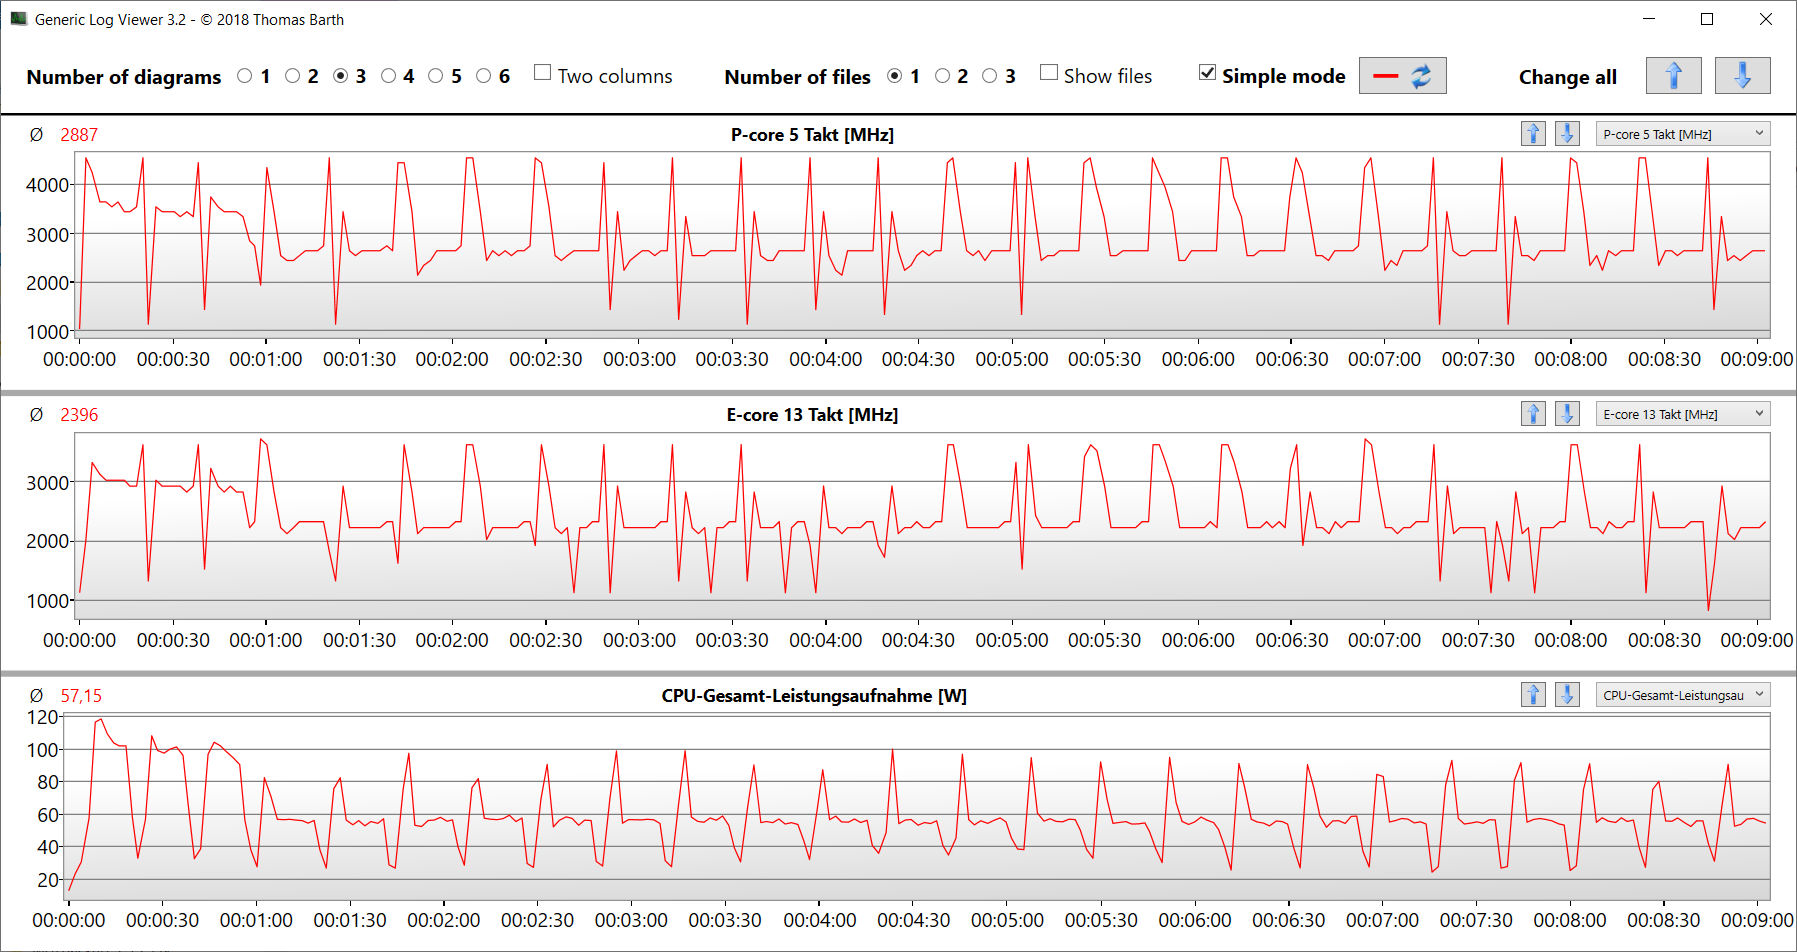
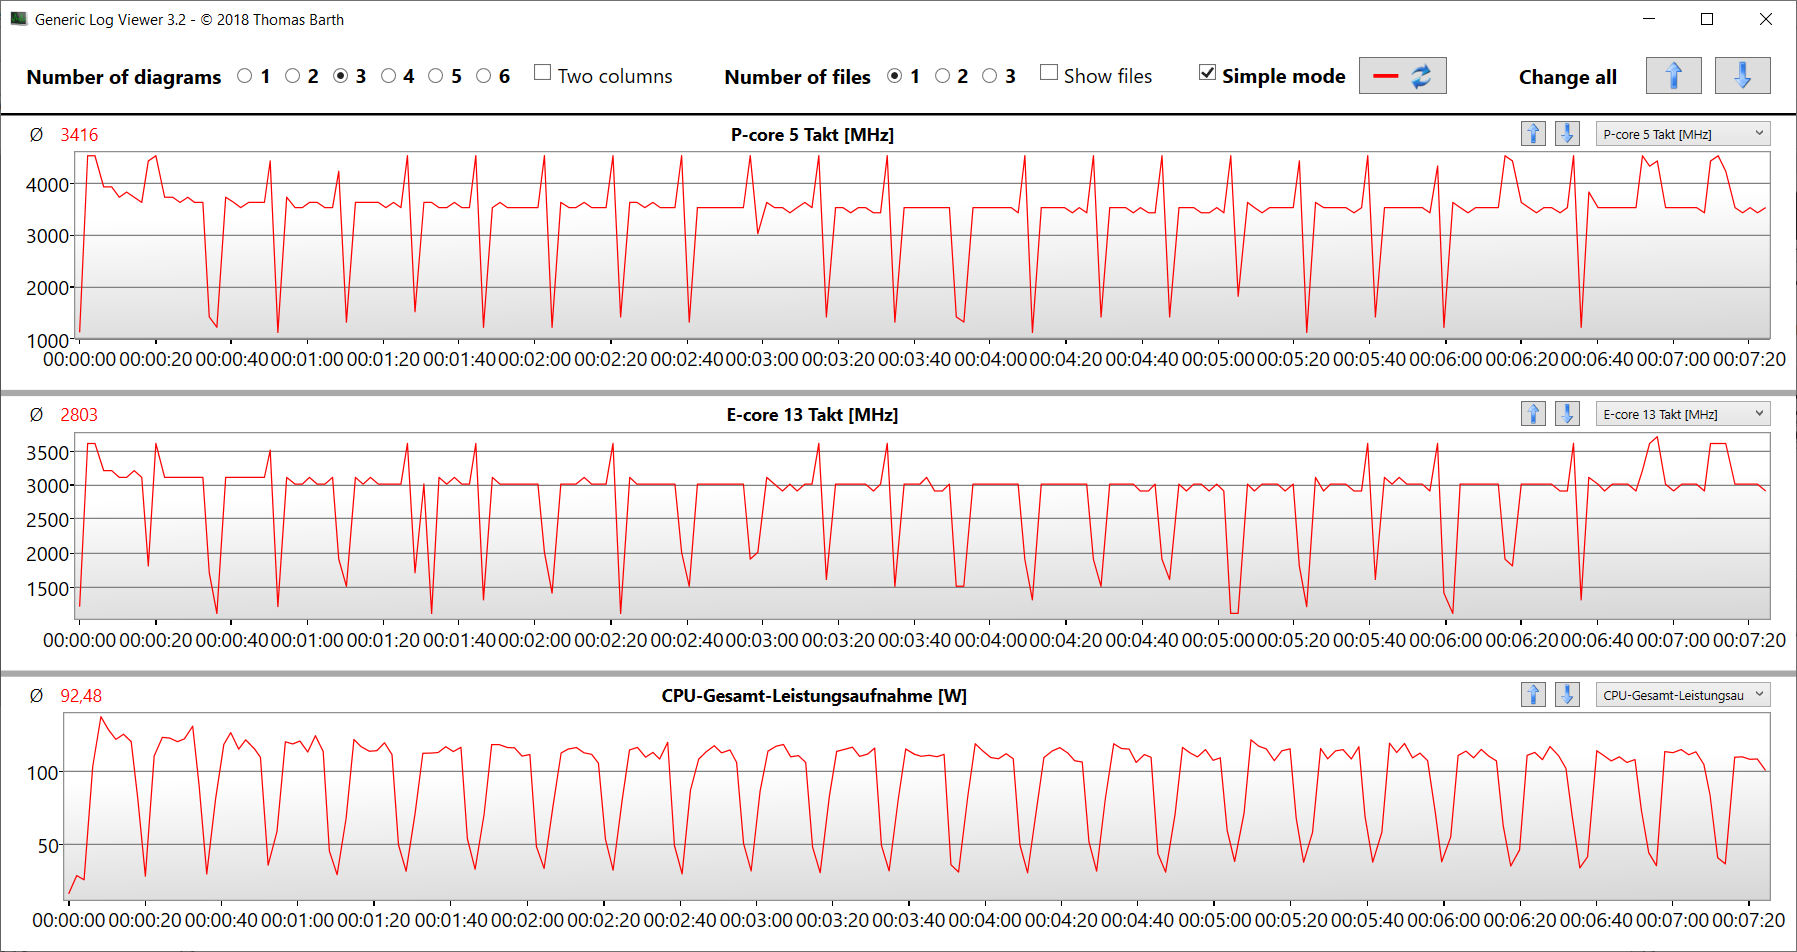
Il P40 ha quattro modalità di prestazioni specifiche del produttore (vedi tabella) che possono essere alternate tramite il software del centro di controllo del portatile. Abbiamo utilizzato la "modalità intrattenimento" (benchmark) e la "modalità risparmio energetico" (test della batteria; disattiva la RTX 4060). Optimus è stato attivato. Abbiamo anche testato entrambe le altre modalità: "Modalità gioco" porta a miglioramenti nelle prestazioni della CPU e "Modalità silenziosa" consente di giocare con emissioni acustiche ridotte.
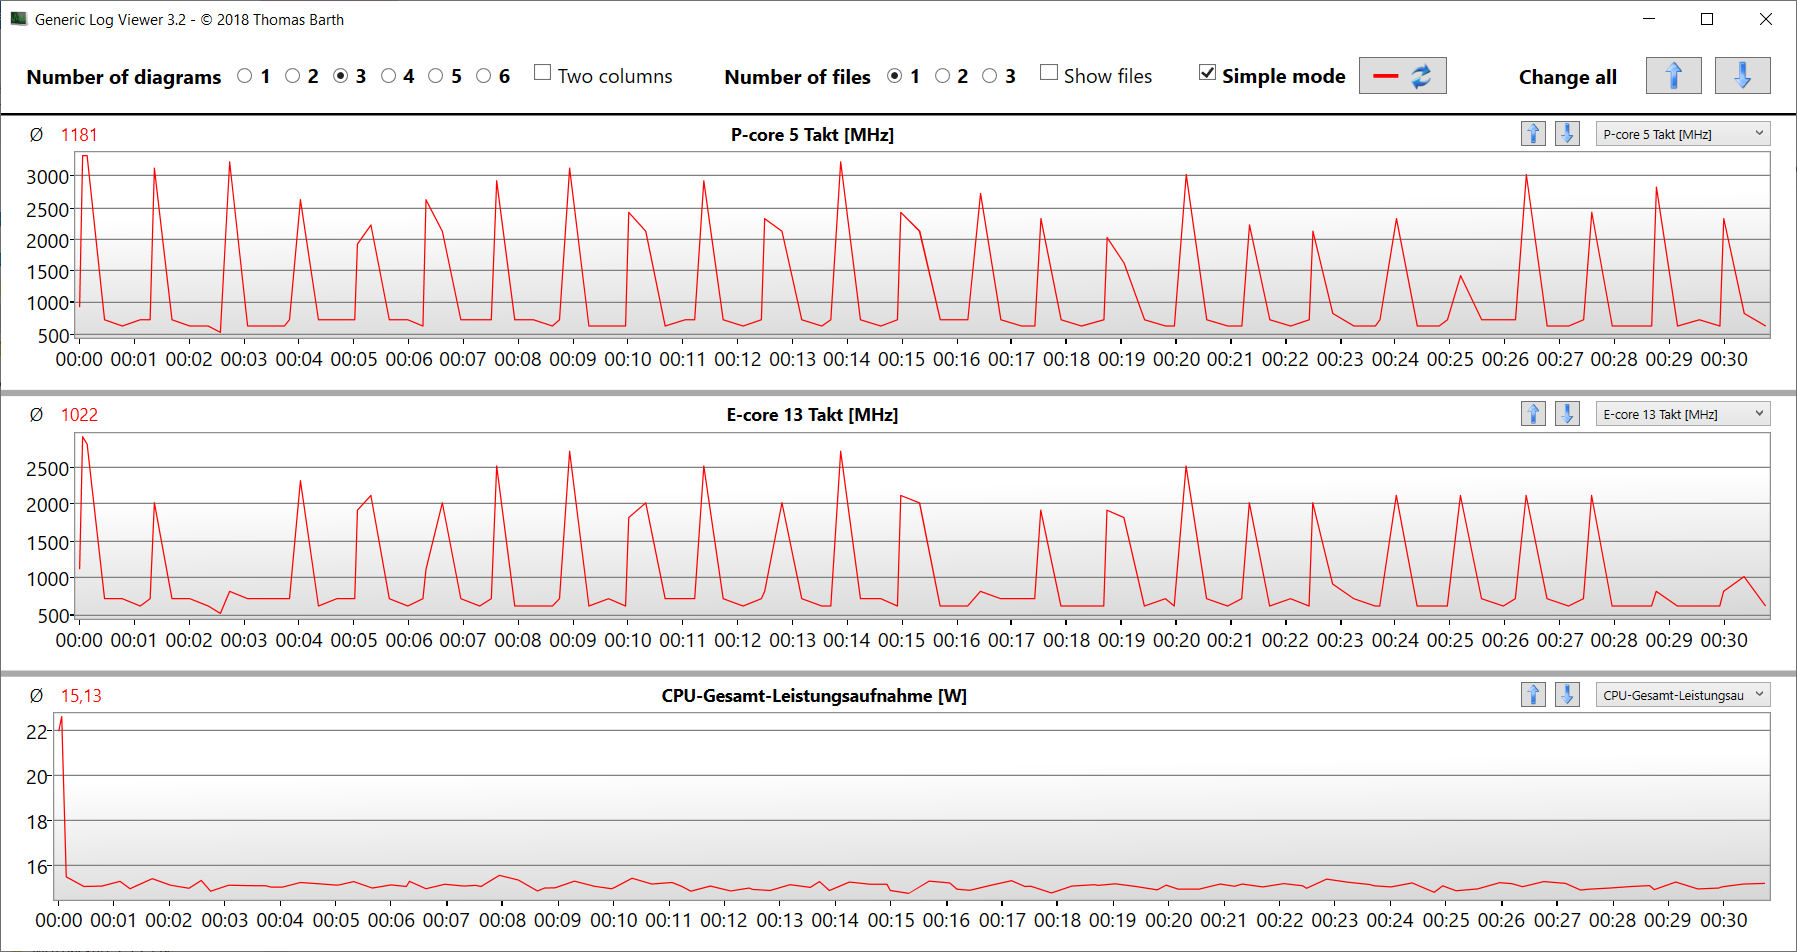
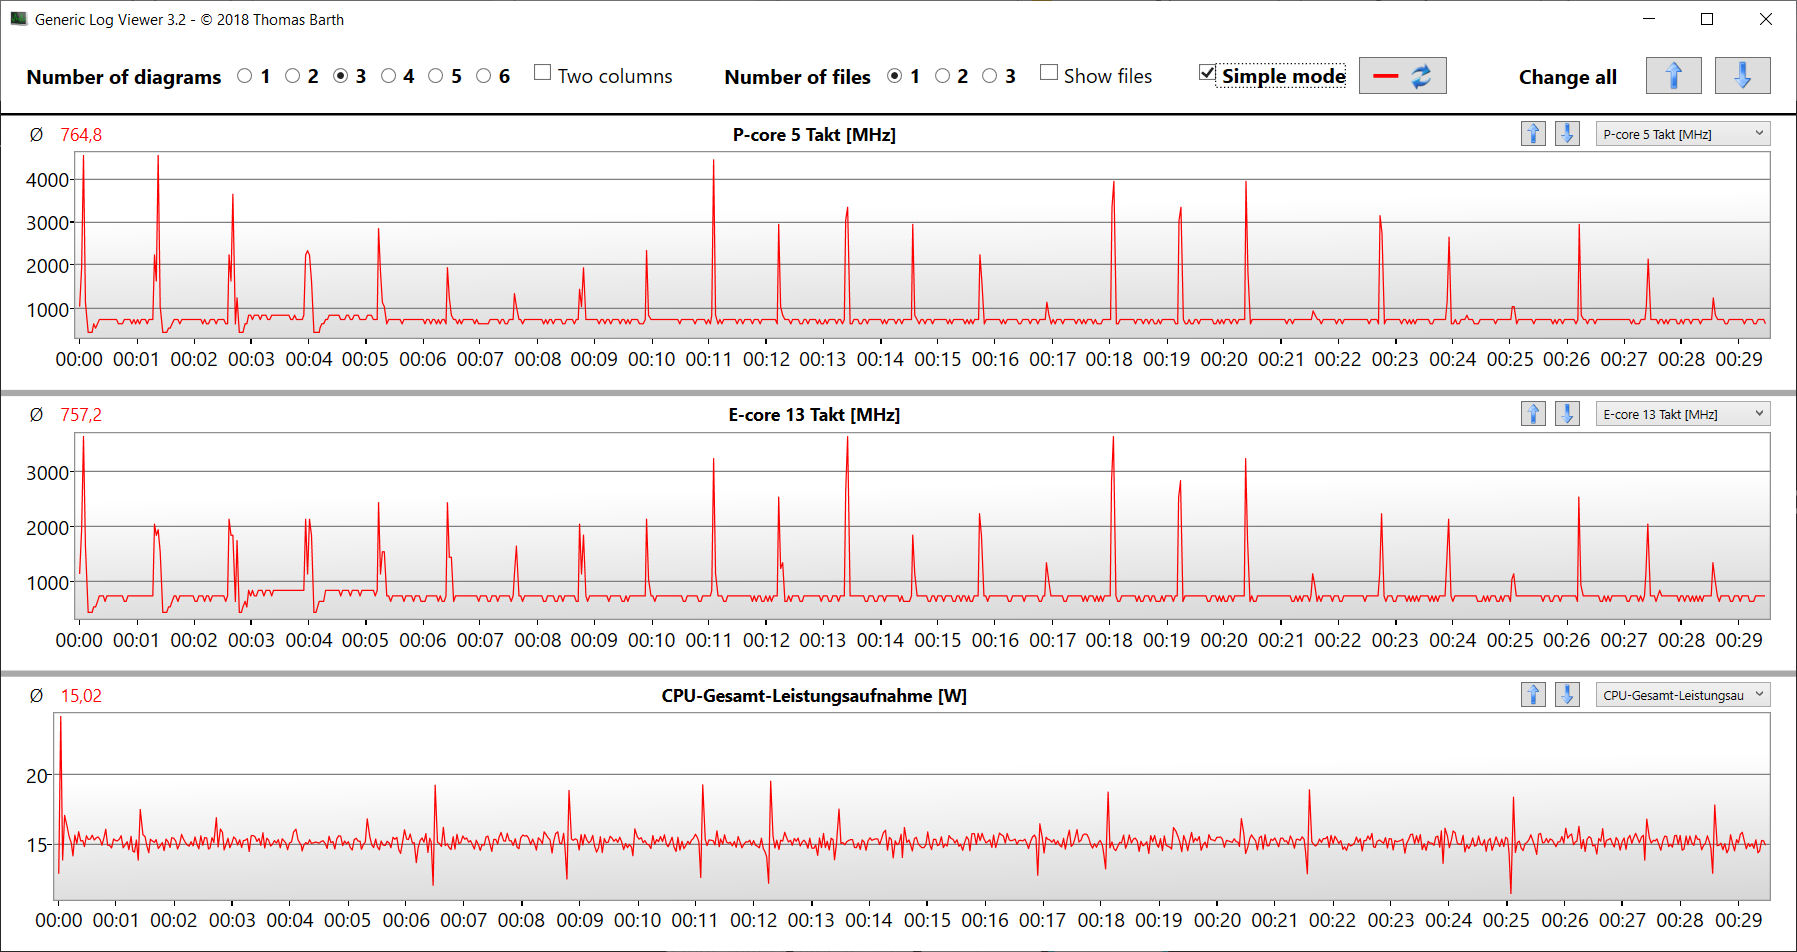
Secondo HWInfo, la "modalità di risparmio energetico" imposta il PL 1 della CPU (45 watt) a un livello superiore rispetto al PL 2 (30 watt). Molto probabilmente si tratta di un bug. Durante l'esecuzione del ciclo CB15, il consumo energetico della CPU è di 15 watt.
| Modalità gioco | Modalità intrattenimento | Modalità risparmio energetico | Modalità silenziosa | |
|---|---|---|---|---|
| CPU PL1 (HWInfo) | 135 watt | 65 watt | 45 watt | 15 watt |
| CPU PL2 (HWInfo) | 162 watt | 130 watt | 30 watt | 30 watt |
| Rumore (Witcher 3) | 62 dB(A) | 56 dB(A) | - | 36 dB(A) |
| Prestazioni (Witcher 3) | ~102 fps | ~100 fps | - | 30 - 50 fps |
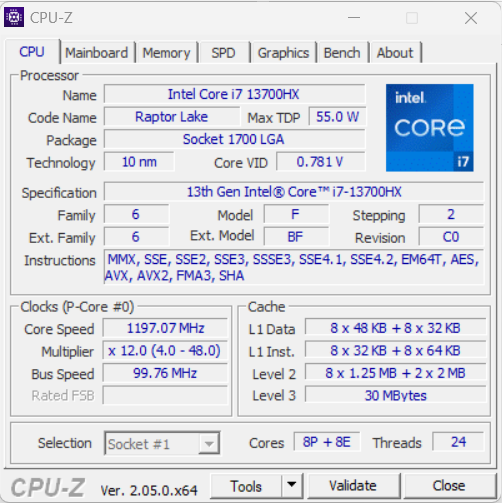
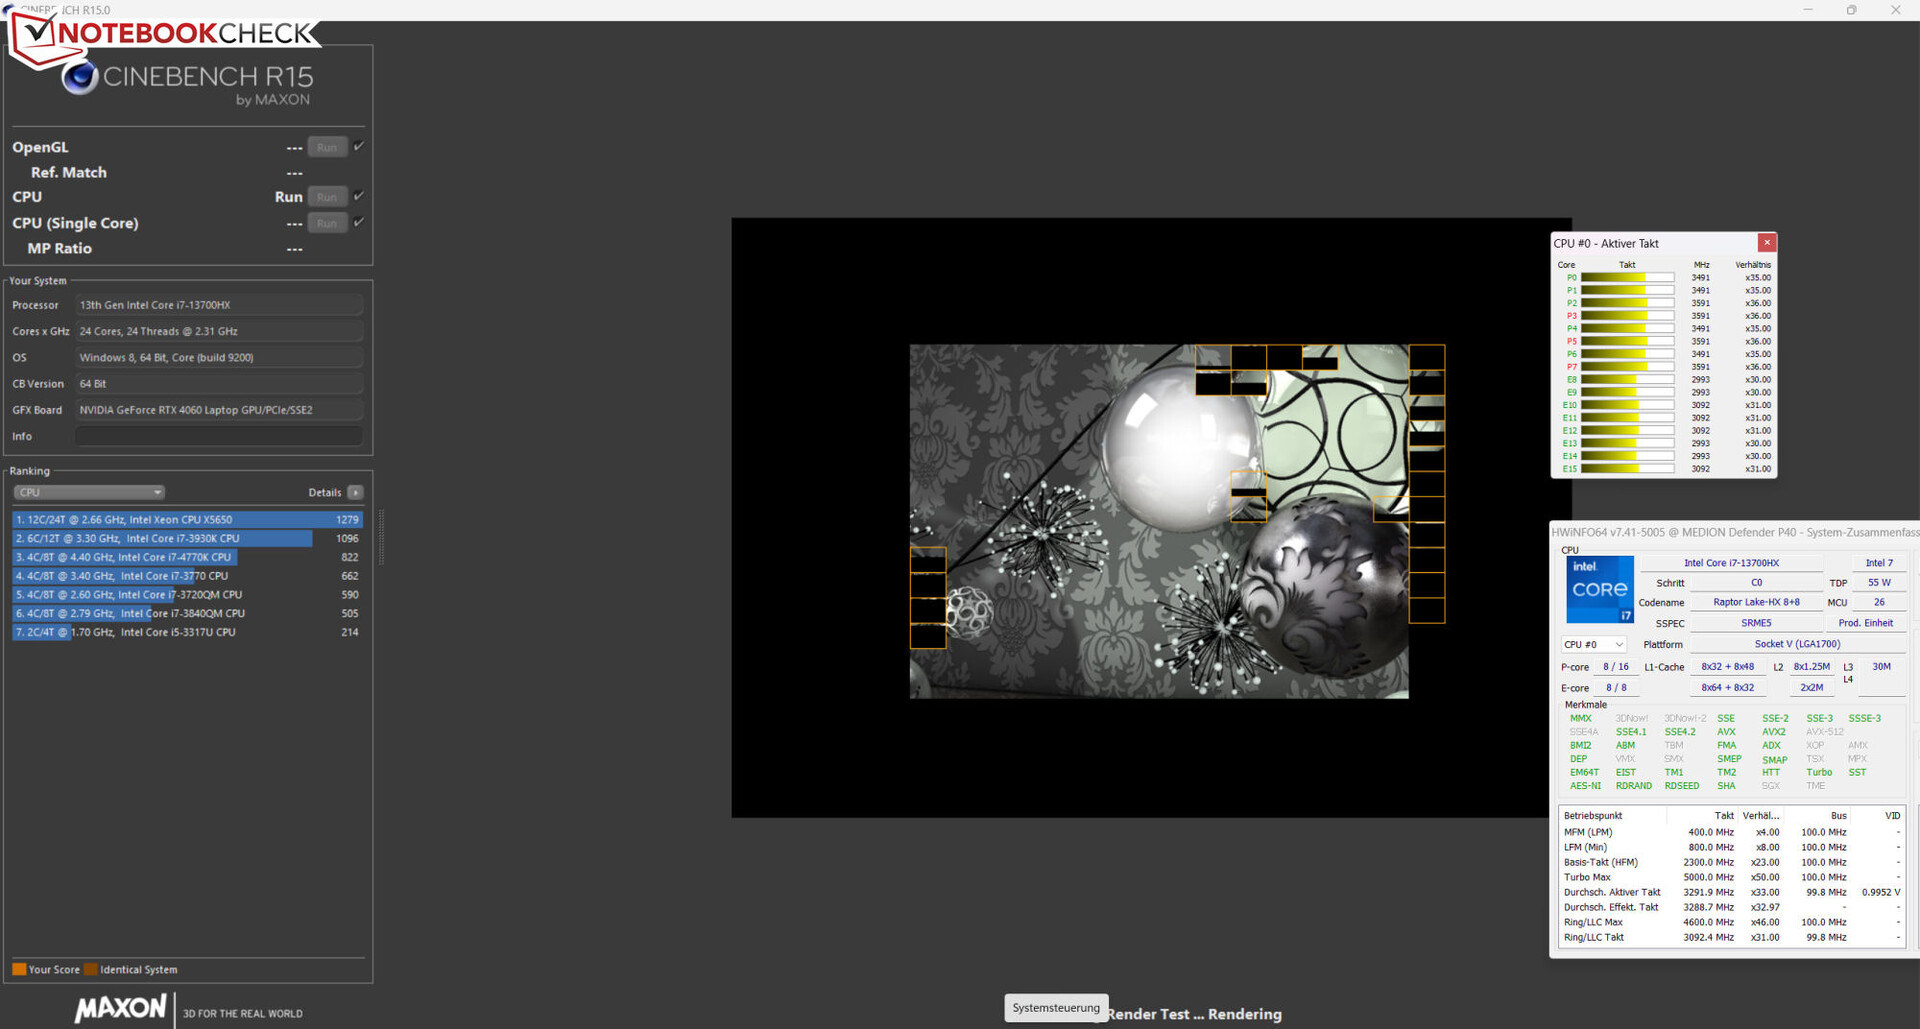
Processore
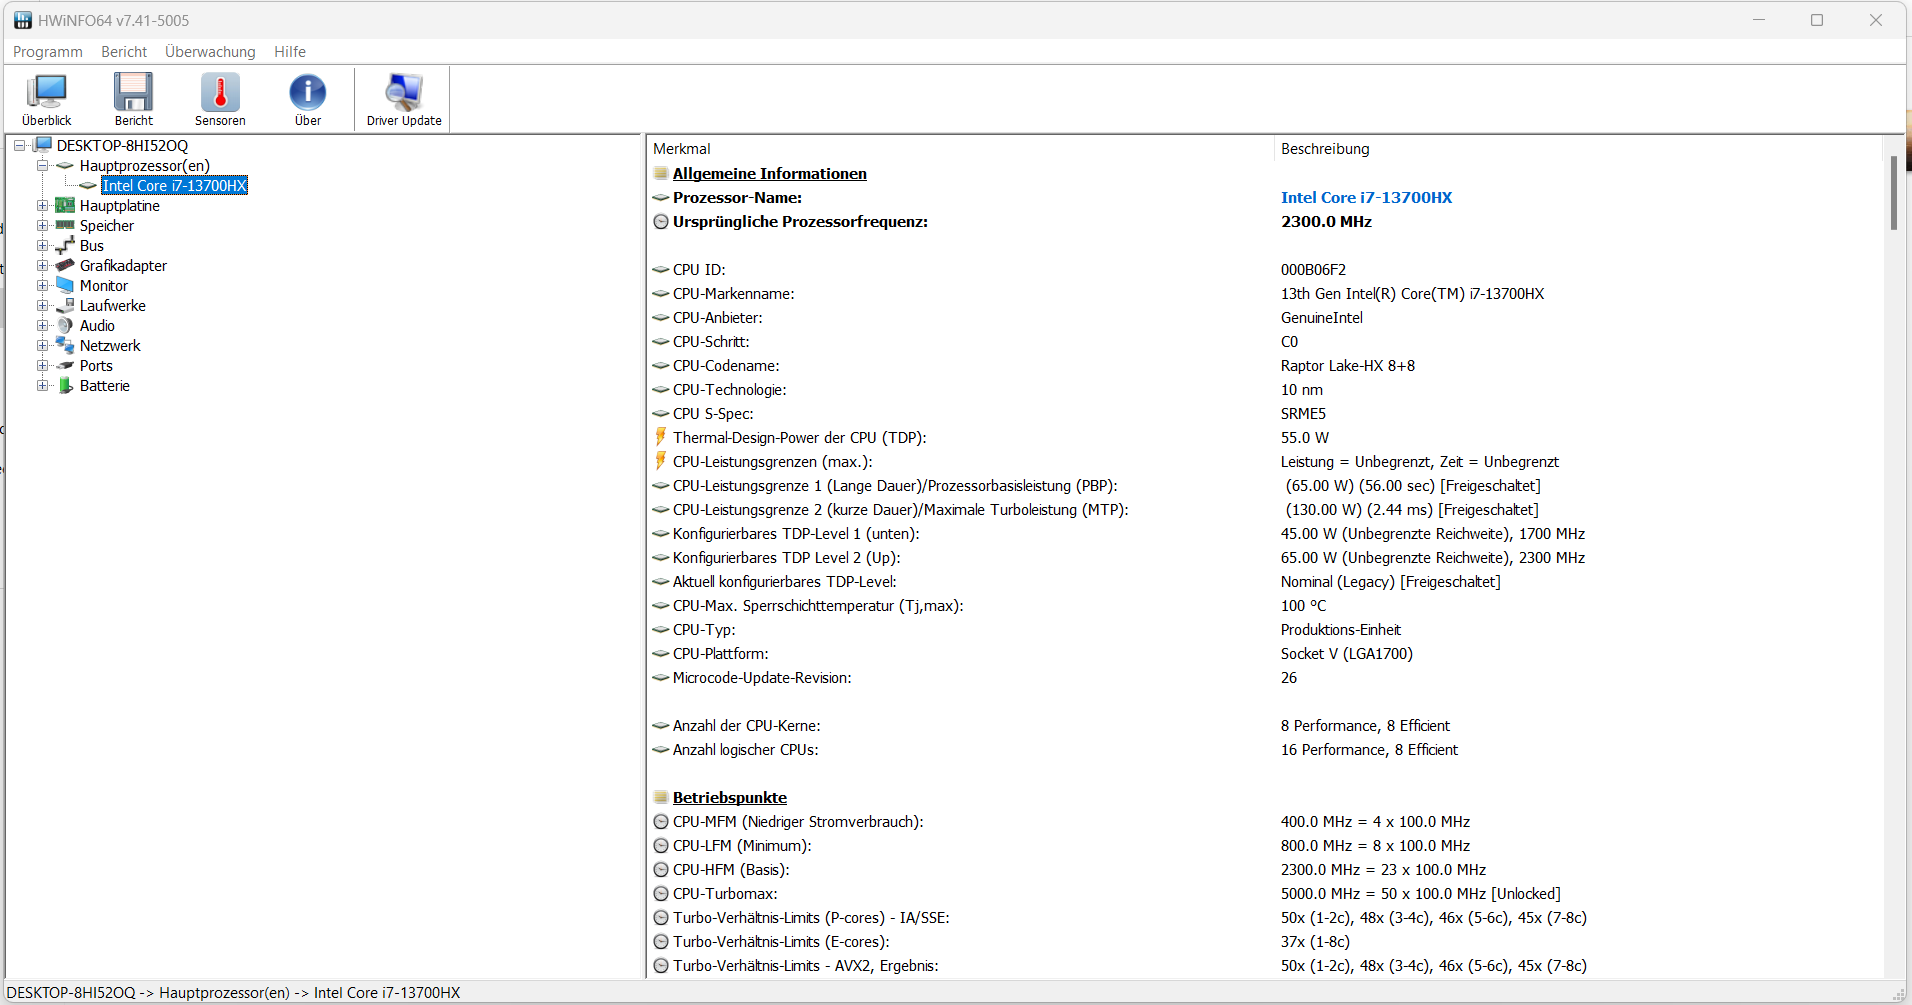
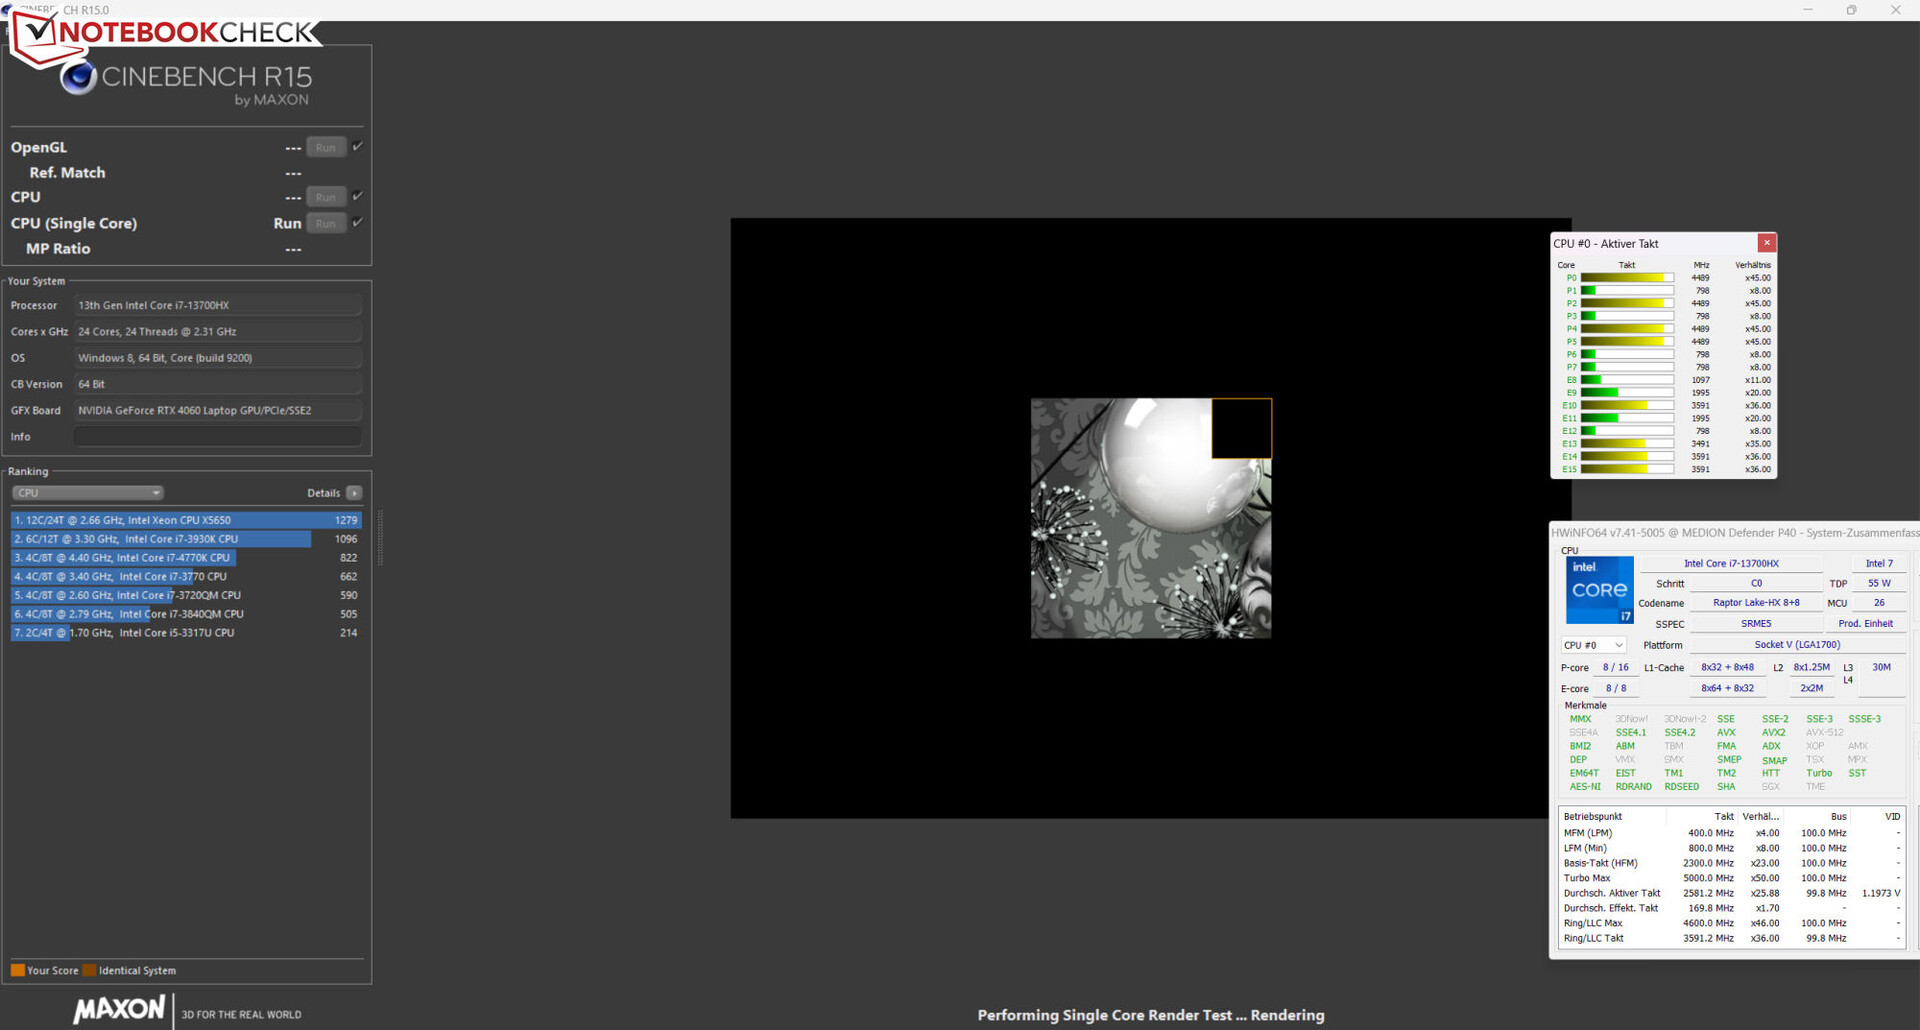
IlCore-i7-13700HX(Raptor Lake) è composto da otto core di efficienza (senza hyperthreading, 1,5 - 3,7 GHz) e otto core di prestazioni (hyperthreading, 2,1 - 5 GHz). Il totale è di 24 core logici della CPU.
I benchmark hanno fornito risultati appena inferiori alla media della CPU precedente ("modalità intrattenimento"). la "modalità gioco" ha portato di solito solo a un aumento minimo delle prestazioni, con l'eccezione dei benchmark AIDA64. Ha potuto mostrare le sue qualità migliori solo con un carico continuo. Le prestazioni single-thread più rilevanti del portatile (205 punti) si sono ridotte meno in modalità batteria rispetto alle prestazioni multi-core (1.619 punti).
Il test CB15 ha dimostrato che: Il carico permanente del multi-thread ha portato il tasso di clock del turbo a diminuire dalla prima alla quarta esecuzione. Successivamente, ha mantenuto tassi costanti. la modalità "Gaming" ha portato a tassi di clock costantemente più elevati.
Cinebench R15 Multi continuous test
* ... Meglio usare valori piccoli
AIDA64: FP32 Ray-Trace | FPU Julia | CPU SHA3 | CPU Queen | FPU SinJulia | FPU Mandel | CPU AES | CPU ZLib | FP64 Ray-Trace | CPU PhotoWorxx
| Performance Rating | |
| Media della classe Gaming | |
| Lenovo Legion Pro 5 16IRX8 | |
| Media Intel Core i7-13700HX | |
| Acer Predator Helios 300 (i7-12700H, RTX 3070 Ti) | |
| Asus TUF Gaming A16 FA617 | |
| Medion Erazer Defender P40 | |
| Gigabyte G7 KE | |
| MSI Katana 17 B13VFK | |
| AIDA64 / FP32 Ray-Trace | |
| Media della classe Gaming (7192 - 85542, n=143, ultimi 2 anni) | |
| Lenovo Legion Pro 5 16IRX8 (v6.85.6300) | |
| Media Intel Core i7-13700HX (15397 - 21999, n=10) | |
| Acer Predator Helios 300 (i7-12700H, RTX 3070 Ti) (v6.75.6100) | |
| Asus TUF Gaming A16 FA617 (v6.85.6300) | |
| Medion Erazer Defender P40 (v6.75.6100) | |
| MSI Katana 17 B13VFK (v6.85.6300) | |
| Gigabyte G7 KE (v6.75.6100) | |
| AIDA64 / FPU Julia | |
| Media della classe Gaming (35040 - 252486, n=143, ultimi 2 anni) | |
| Lenovo Legion Pro 5 16IRX8 (v6.85.6300) | |
| Asus TUF Gaming A16 FA617 (v6.85.6300) | |
| Media Intel Core i7-13700HX (77807 - 109364, n=10) | |
| Acer Predator Helios 300 (i7-12700H, RTX 3070 Ti) (v6.75.6100) | |
| Medion Erazer Defender P40 (v6.75.6100) | |
| MSI Katana 17 B13VFK (v6.85.6300) | |
| Gigabyte G7 KE (v6.75.6100) | |
| AIDA64 / CPU SHA3 | |
| Media della classe Gaming (1728 - 10389, n=143, ultimi 2 anni) | |
| Lenovo Legion Pro 5 16IRX8 (v6.85.6300) | |
| Media Intel Core i7-13700HX (3412 - 5053, n=10) | |
| Acer Predator Helios 300 (i7-12700H, RTX 3070 Ti) (v6.75.6100) | |
| Asus TUF Gaming A16 FA617 (v6.85.6300) | |
| Medion Erazer Defender P40 (v6.75.6100) | |
| Gigabyte G7 KE (v6.75.6100) | |
| MSI Katana 17 B13VFK (v6.85.6300) | |
| AIDA64 / CPU Queen | |
| Media della classe Gaming (50699 - 200651, n=143, ultimi 2 anni) | |
| Lenovo Legion Pro 5 16IRX8 (v6.85.6300) | |
| Medion Erazer Defender P40 (v6.75.6100) | |
| Media Intel Core i7-13700HX (105112 - 114717, n=10) | |
| Asus TUF Gaming A16 FA617 (v6.85.6300) | |
| Acer Predator Helios 300 (i7-12700H, RTX 3070 Ti) (v6.75.6100) | |
| Gigabyte G7 KE (v6.75.6100) | |
| MSI Katana 17 B13VFK | |
| AIDA64 / FPU SinJulia | |
| Media della classe Gaming (5020 - 32988, n=143, ultimi 2 anni) | |
| Lenovo Legion Pro 5 16IRX8 (v6.85.6300) | |
| Asus TUF Gaming A16 FA617 (v6.85.6300) | |
| Media Intel Core i7-13700HX (10407 - 13519, n=10) | |
| Medion Erazer Defender P40 (v6.75.6100) | |
| Acer Predator Helios 300 (i7-12700H, RTX 3070 Ti) (v6.75.6100) | |
| MSI Katana 17 B13VFK | |
| Gigabyte G7 KE (v6.75.6100) | |
| AIDA64 / FPU Mandel | |
| Media della classe Gaming (17585 - 134044, n=143, ultimi 2 anni) | |
| Asus TUF Gaming A16 FA617 (v6.85.6300) | |
| Lenovo Legion Pro 5 16IRX8 (v6.85.6300) | |
| Media Intel Core i7-13700HX (38311 - 53484, n=10) | |
| Acer Predator Helios 300 (i7-12700H, RTX 3070 Ti) (v6.75.6100) | |
| Medion Erazer Defender P40 (v6.75.6100) | |
| MSI Katana 17 B13VFK (v6.85.6300) | |
| Gigabyte G7 KE (v6.75.6100) | |
| AIDA64 / CPU AES | |
| Media Intel Core i7-13700HX (72510 - 182575, n=10) | |
| Gigabyte G7 KE (v6.75.6100) | |
| Media della classe Gaming (19065 - 328679, n=143, ultimi 2 anni) | |
| Lenovo Legion Pro 5 16IRX8 (v6.85.6300) | |
| Acer Predator Helios 300 (i7-12700H, RTX 3070 Ti) (v6.75.6100) | |
| Medion Erazer Defender P40 (v6.75.6100) | |
| Asus TUF Gaming A16 FA617 (v6.85.6300) | |
| MSI Katana 17 B13VFK (v6.85.6300) | |
| AIDA64 / CPU ZLib | |
| Media della classe Gaming (373 - 2531, n=143, ultimi 2 anni) | |
| Lenovo Legion Pro 5 16IRX8 (v6.85.6300) | |
| Media Intel Core i7-13700HX (981 - 1451, n=10) | |
| Acer Predator Helios 300 (i7-12700H, RTX 3070 Ti) (v6.75.6100) | |
| Medion Erazer Defender P40 (v6.75.6100) | |
| Gigabyte G7 KE (v6.75.6100) | |
| Asus TUF Gaming A16 FA617 (v6.85.6300) | |
| MSI Katana 17 B13VFK (v6.85.6300) | |
| AIDA64 / FP64 Ray-Trace | |
| Media della classe Gaming (3856 - 45446, n=143, ultimi 2 anni) | |
| Lenovo Legion Pro 5 16IRX8 (v6.85.6300) | |
| Media Intel Core i7-13700HX (8145 - 11837, n=10) | |
| Acer Predator Helios 300 (i7-12700H, RTX 3070 Ti) (v6.75.6100) | |
| Asus TUF Gaming A16 FA617 (v6.85.6300) | |
| Medion Erazer Defender P40 (v6.75.6100) | |
| MSI Katana 17 B13VFK (v6.85.6300) | |
| Gigabyte G7 KE (v6.75.6100) | |
| AIDA64 / CPU PhotoWorxx | |
| Media della classe Gaming (10805 - 62274, n=143, ultimi 2 anni) | |
| Acer Predator Helios 300 (i7-12700H, RTX 3070 Ti) (v6.75.6100) | |
| Lenovo Legion Pro 5 16IRX8 (v6.85.6300) | |
| Medion Erazer Defender P40 (v6.75.6100) | |
| Media Intel Core i7-13700HX (20471 - 42415, n=10) | |
| MSI Katana 17 B13VFK (v6.85.6300) | |
| Gigabyte G7 KE (v6.75.6100) | |
| Asus TUF Gaming A16 FA617 (v6.85.6300) | |
Prestazioni del sistema
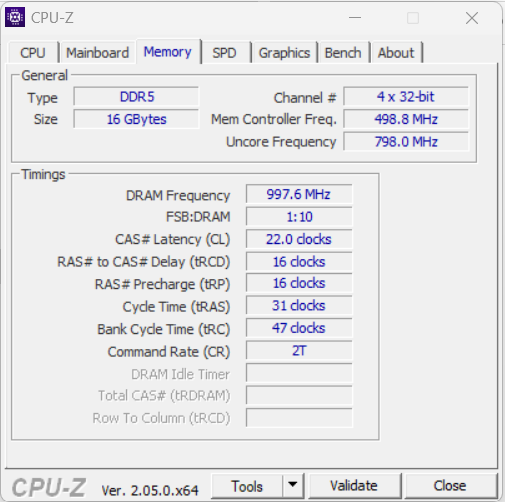
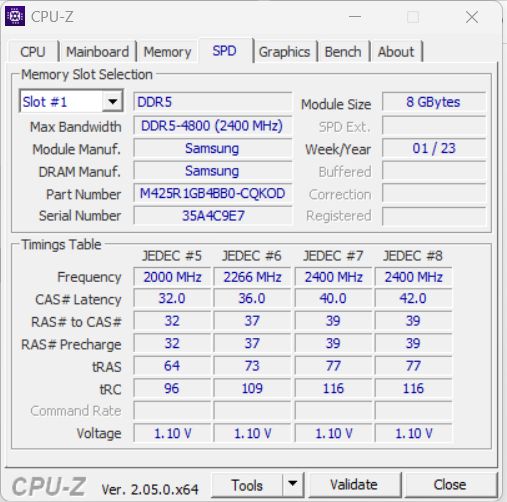
Il suo sistema fluido è pronto per le applicazioni più esigenti in termini di prestazioni, come il rendering e il gioco - i buoni risultati di PCMark del portatile lo confermano. Le velocità di trasferimento della RAM sono nella norma per una RAM DDR5 4800.
CrossMark: Overall | Productivity | Creativity | Responsiveness
| PCMark 10 / Score | |
| Media della classe Gaming (5776 - 9852, n=130, ultimi 2 anni) | |
| Acer Predator Helios 300 (i7-12700H, RTX 3070 Ti) | |
| Lenovo Legion Pro 5 16IRX8 | |
| Media Intel Core i7-13700HX, NVIDIA GeForce RTX 4060 Laptop GPU (6909 - 7743, n=5) | |
| Asus TUF Gaming A16 FA617 | |
| MSI Katana 17 B13VFK | |
| Medion Erazer Defender P40 | |
| Gigabyte G7 KE | |
| PCMark 10 / Essentials | |
| Lenovo Legion Pro 5 16IRX8 | |
| MSI Katana 17 B13VFK | |
| Media della classe Gaming (9057 - 12600, n=130, ultimi 2 anni) | |
| Acer Predator Helios 300 (i7-12700H, RTX 3070 Ti) | |
| Media Intel Core i7-13700HX, NVIDIA GeForce RTX 4060 Laptop GPU (9760 - 11313, n=5) | |
| Asus TUF Gaming A16 FA617 | |
| Gigabyte G7 KE | |
| Medion Erazer Defender P40 | |
| PCMark 10 / Productivity | |
| Acer Predator Helios 300 (i7-12700H, RTX 3070 Ti) | |
| Media della classe Gaming (6662 - 14612, n=130, ultimi 2 anni) | |
| Medion Erazer Defender P40 | |
| Media Intel Core i7-13700HX, NVIDIA GeForce RTX 4060 Laptop GPU (9131 - 11018, n=5) | |
| Asus TUF Gaming A16 FA617 | |
| MSI Katana 17 B13VFK | |
| Lenovo Legion Pro 5 16IRX8 | |
| Gigabyte G7 KE | |
| PCMark 10 / Digital Content Creation | |
| Media della classe Gaming (7440 - 19351, n=130, ultimi 2 anni) | |
| Acer Predator Helios 300 (i7-12700H, RTX 3070 Ti) | |
| Lenovo Legion Pro 5 16IRX8 | |
| Media Intel Core i7-13700HX, NVIDIA GeForce RTX 4060 Laptop GPU (9393 - 12434, n=5) | |
| Asus TUF Gaming A16 FA617 | |
| MSI Katana 17 B13VFK | |
| Medion Erazer Defender P40 | |
| Gigabyte G7 KE | |
| CrossMark / Overall | |
| Media della classe Gaming (1247 - 2344, n=110, ultimi 2 anni) | |
| Acer Predator Helios 300 (i7-12700H, RTX 3070 Ti) | |
| Media Intel Core i7-13700HX, NVIDIA GeForce RTX 4060 Laptop GPU (1663 - 2105, n=5) | |
| MSI Katana 17 B13VFK | |
| Gigabyte G7 KE | |
| Medion Erazer Defender P40 | |
| Lenovo Legion Pro 5 16IRX8 | |
| CrossMark / Productivity | |
| Media della classe Gaming (1299 - 2204, n=110, ultimi 2 anni) | |
| Gigabyte G7 KE | |
| Acer Predator Helios 300 (i7-12700H, RTX 3070 Ti) | |
| Media Intel Core i7-13700HX, NVIDIA GeForce RTX 4060 Laptop GPU (1618 - 1989, n=5) | |
| MSI Katana 17 B13VFK | |
| Medion Erazer Defender P40 | |
| Lenovo Legion Pro 5 16IRX8 | |
| CrossMark / Creativity | |
| Media della classe Gaming (1275 - 2660, n=110, ultimi 2 anni) | |
| Acer Predator Helios 300 (i7-12700H, RTX 3070 Ti) | |
| Media Intel Core i7-13700HX, NVIDIA GeForce RTX 4060 Laptop GPU (1710 - 2274, n=5) | |
| MSI Katana 17 B13VFK | |
| Medion Erazer Defender P40 | |
| Gigabyte G7 KE | |
| Lenovo Legion Pro 5 16IRX8 | |
| CrossMark / Responsiveness | |
| Gigabyte G7 KE | |
| MSI Katana 17 B13VFK | |
| Acer Predator Helios 300 (i7-12700H, RTX 3070 Ti) | |
| Media della classe Gaming (1030 - 2330, n=110, ultimi 2 anni) | |
| Media Intel Core i7-13700HX, NVIDIA GeForce RTX 4060 Laptop GPU (1269 - 1983, n=5) | |
| Lenovo Legion Pro 5 16IRX8 | |
| Medion Erazer Defender P40 | |
| PCMark 8 Home Score Accelerated v2 | 4659 punti | |
| PCMark 8 Work Score Accelerated v2 | 5797 punti | |
| PCMark 10 Score | 6909 punti | |
Aiuto | ||
| AIDA64 / Memory Copy | |
| Media della classe Gaming (21750 - 97515, n=143, ultimi 2 anni) | |
| Lenovo Legion Pro 5 16IRX8 | |
| Medion Erazer Defender P40 | |
| Media Intel Core i7-13700HX (36504 - 63990, n=10) | |
| Acer Predator Helios 300 (i7-12700H, RTX 3070 Ti) | |
| MSI Katana 17 B13VFK | |
| Asus TUF Gaming A16 FA617 | |
| Gigabyte G7 KE | |
| AIDA64 / Memory Read | |
| Media della classe Gaming (22956 - 102937, n=143, ultimi 2 anni) | |
| Lenovo Legion Pro 5 16IRX8 | |
| Medion Erazer Defender P40 | |
| Media Intel Core i7-13700HX (36510 - 69729, n=10) | |
| MSI Katana 17 B13VFK | |
| Acer Predator Helios 300 (i7-12700H, RTX 3070 Ti) | |
| Asus TUF Gaming A16 FA617 | |
| Gigabyte G7 KE | |
| AIDA64 / Memory Write | |
| Media della classe Gaming (22297 - 108954, n=143, ultimi 2 anni) | |
| Lenovo Legion Pro 5 16IRX8 | |
| Media Intel Core i7-13700HX (33598 - 85675, n=10) | |
| Medion Erazer Defender P40 | |
| Acer Predator Helios 300 (i7-12700H, RTX 3070 Ti) | |
| Asus TUF Gaming A16 FA617 | |
| MSI Katana 17 B13VFK | |
| Gigabyte G7 KE | |
| AIDA64 / Memory Latency | |
| MSI Katana 17 B13VFK | |
| Media della classe Gaming (59.5 - 259, n=143, ultimi 2 anni) | |
| Medion Erazer Defender P40 | |
| Acer Predator Helios 300 (i7-12700H, RTX 3070 Ti) | |
| Gigabyte G7 KE | |
| Media Intel Core i7-13700HX (81.9 - 97.9, n=10) | |
| Asus TUF Gaming A16 FA617 | |
| Lenovo Legion Pro 5 16IRX8 | |
* ... Meglio usare valori piccoli
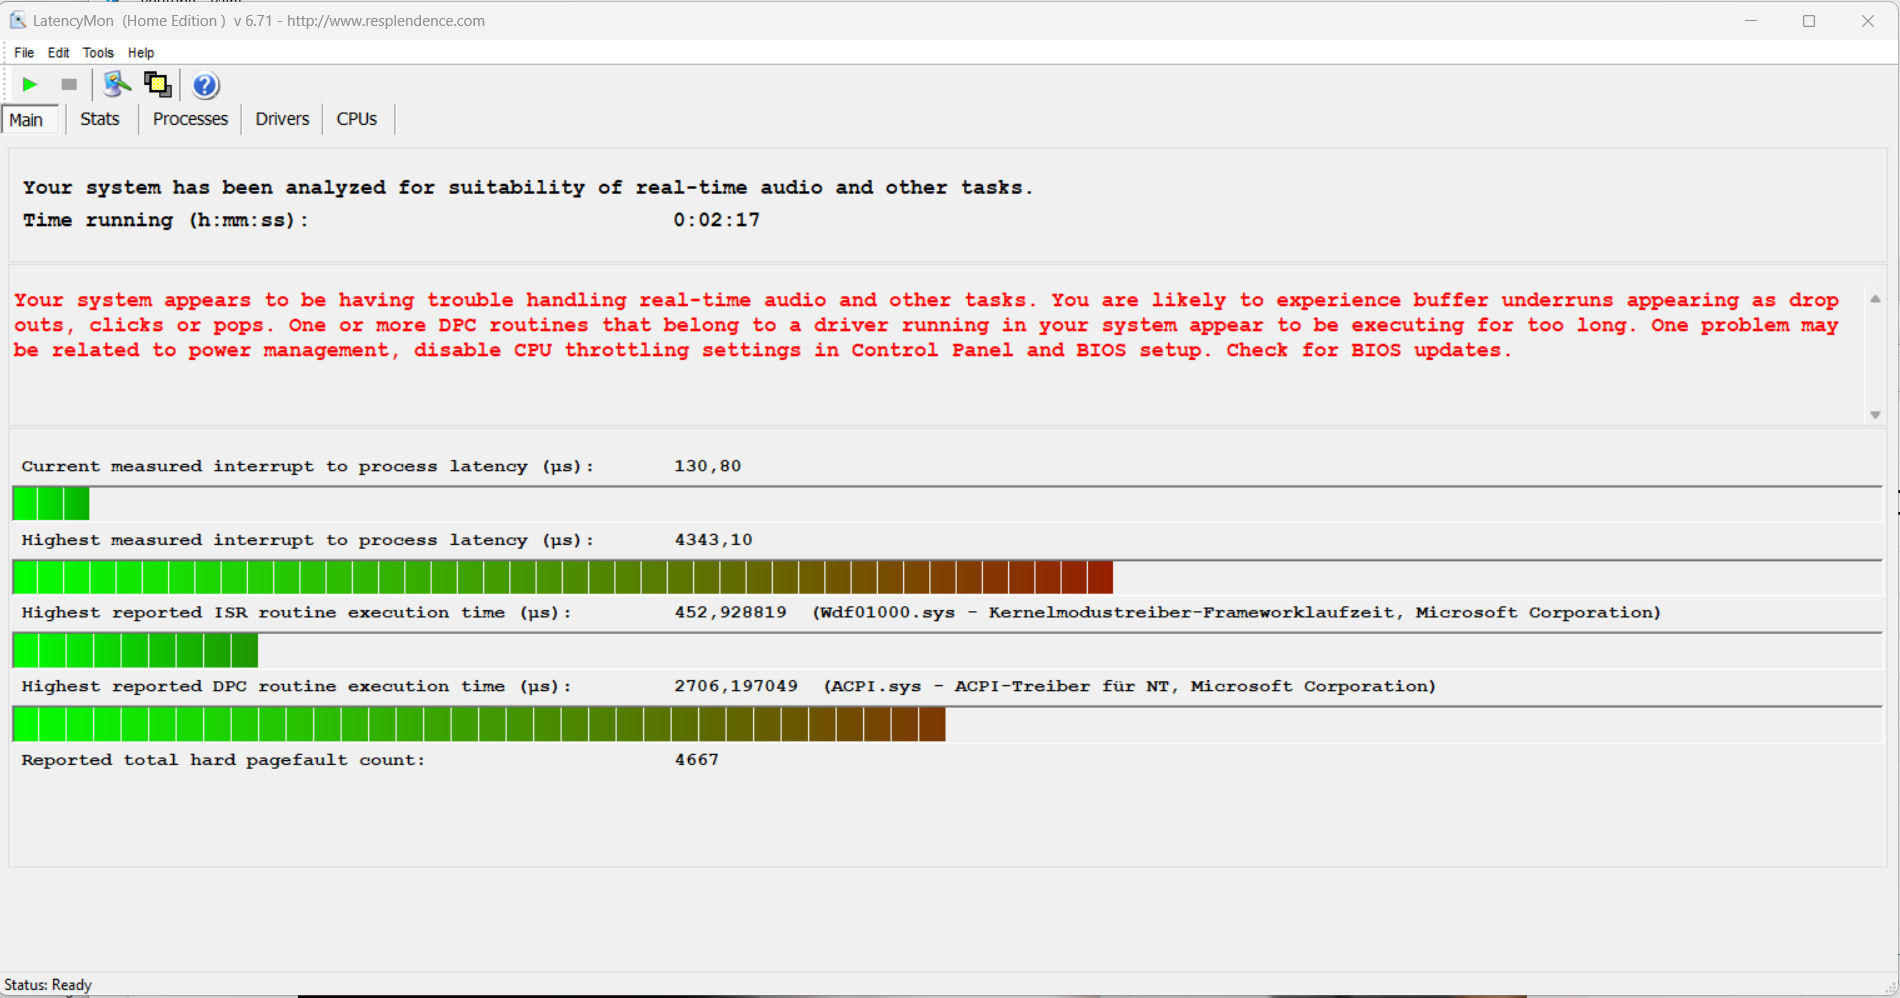
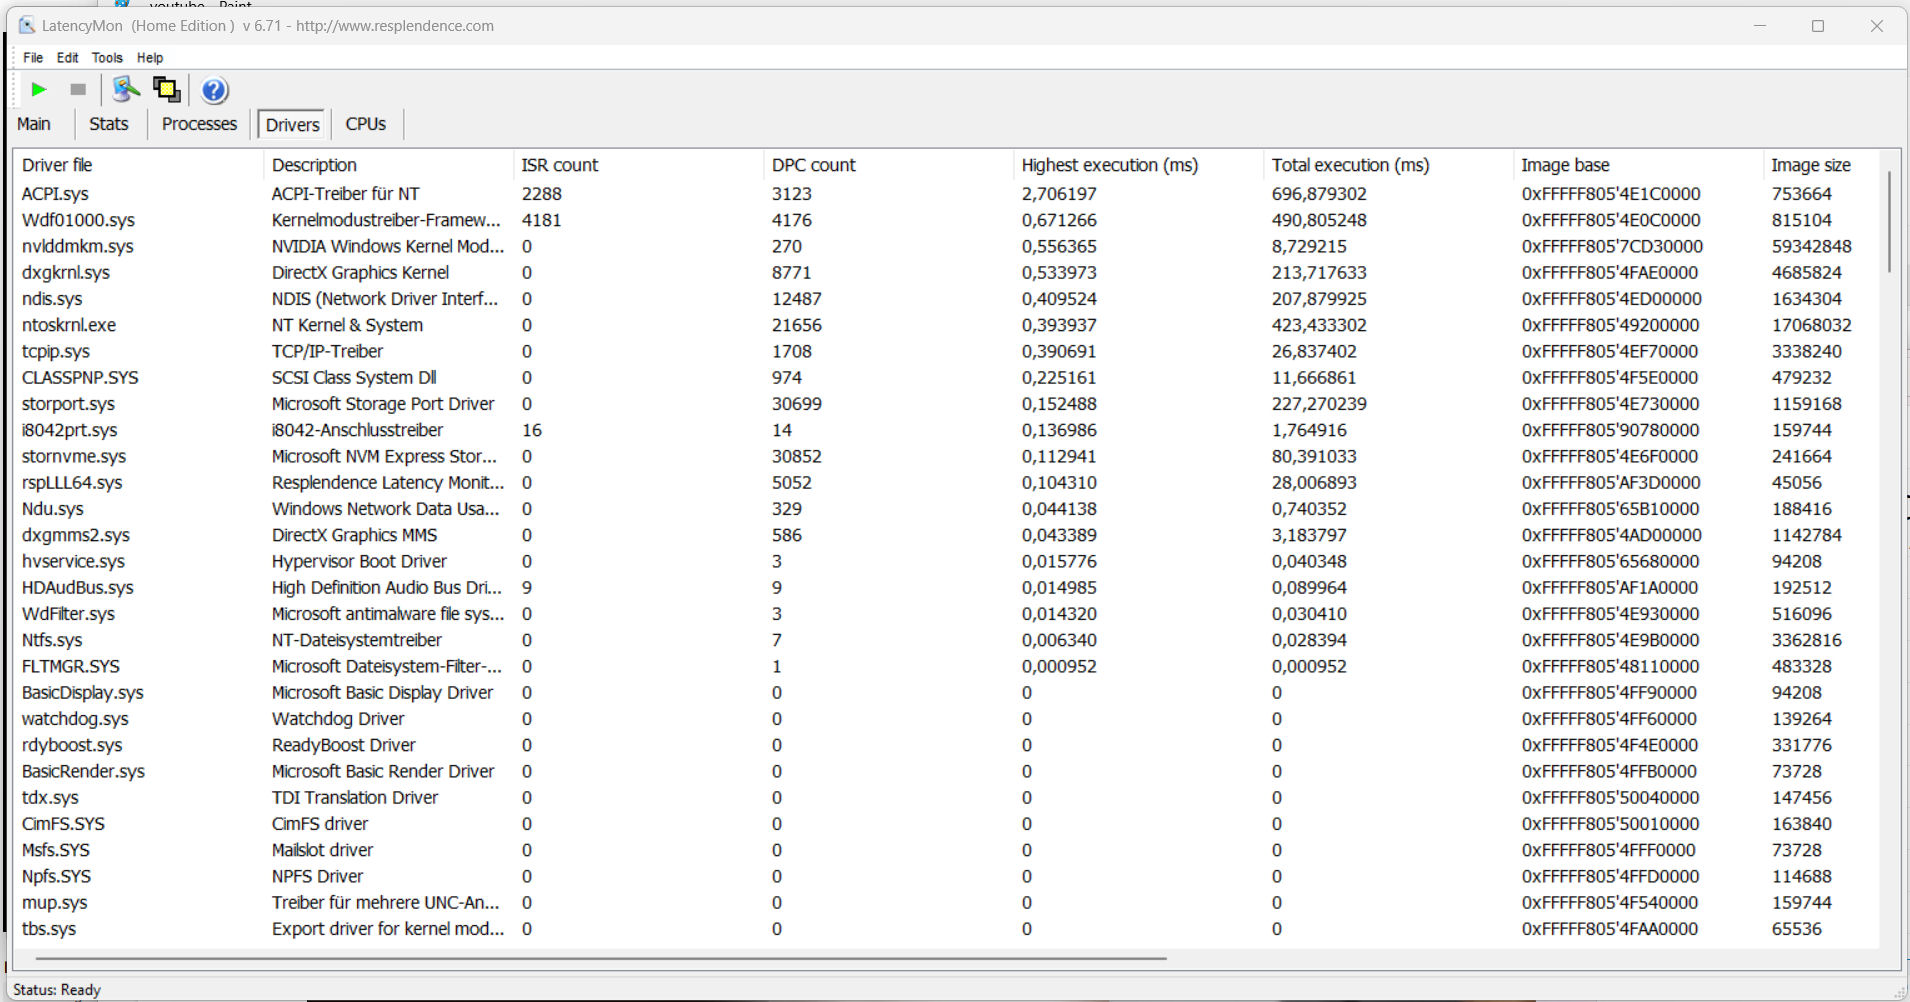
Latenza DPC
Il test standardizzato di monitoraggio della latenza (navigazione web, riproduzione video 4k, Prime95 ad alto carico) ha rivelato alcune anomalie. Il sistema non sembra essere adatto all'editing video e audio in tempo reale. I futuri aggiornamenti del software potrebbero portare a miglioramenti o addirittura a peggioramenti.
| DPC Latencies / LatencyMon - interrupt to process latency (max), Web, Youtube, Prime95 | |
| Medion Erazer Defender P40 | |
| MSI Katana 17 B13VFK | |
| Gigabyte G7 KE | |
| Acer Predator Helios 300 (i7-12700H, RTX 3070 Ti) | |
| Lenovo Legion Pro 5 16IRX8 | |
| Asus TUF Gaming A16 FA617 | |
* ... Meglio usare valori piccoli
Dispositivi di archiviazione
Il P40 dispone di un'unità SSD PCIe-4 (1 TB) in formato M.2-2280 di Phison. Offre ottime velocità di trasferimento, ma non è una delle migliori unità SSD. Non si verificano cali di prestazioni dovuti al thermal throttling. Il portatile ha spazio per una seconda unità SSD PCIe-4.

* ... Meglio usare valori piccoli
Reading continuous performance: DiskSpd Read Loop, Queue Depth 8
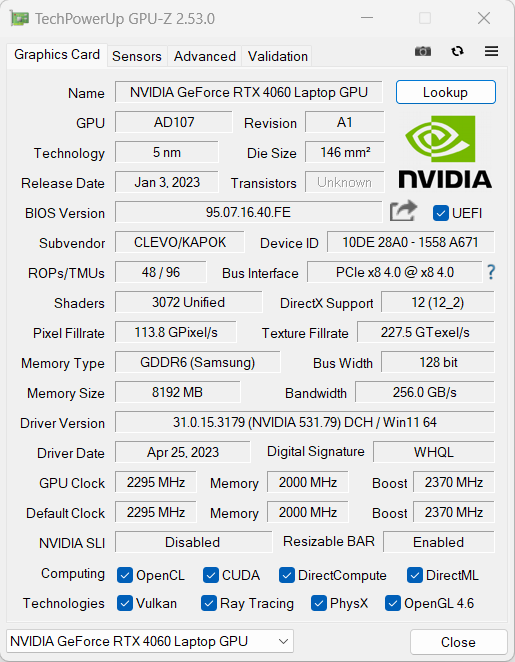
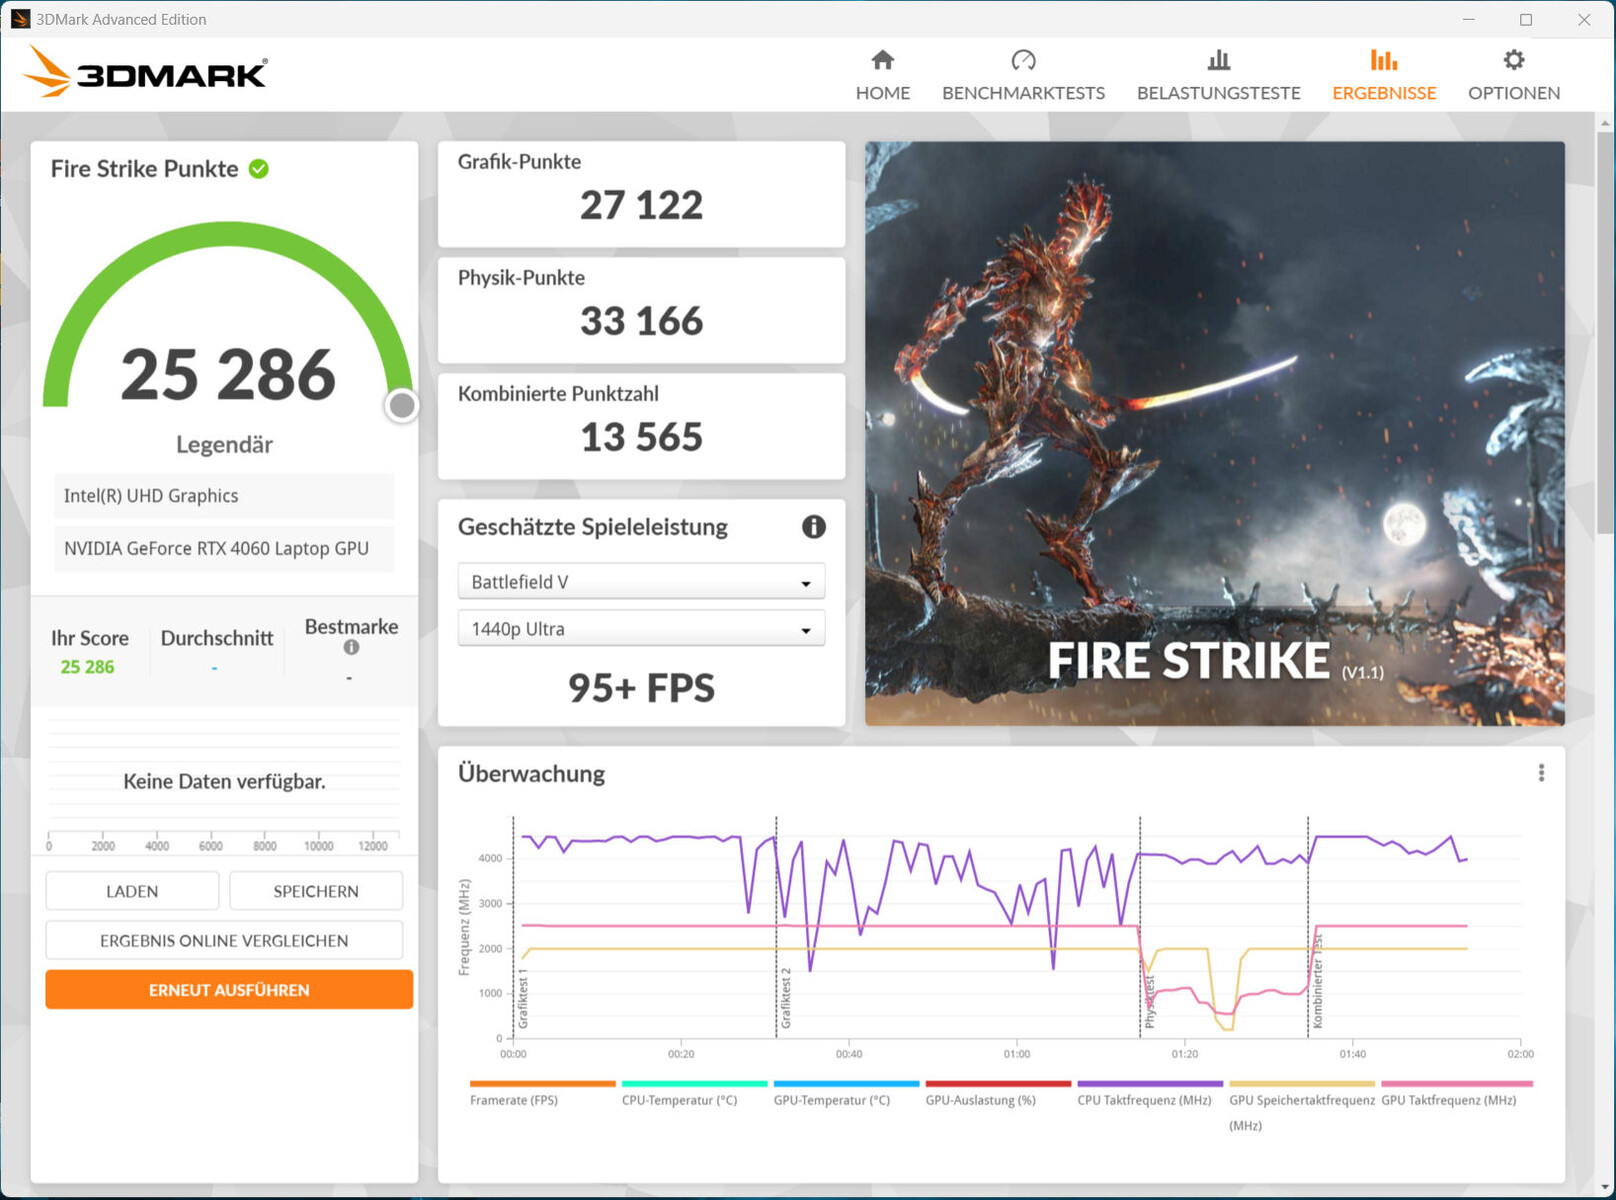
Scheda grafica
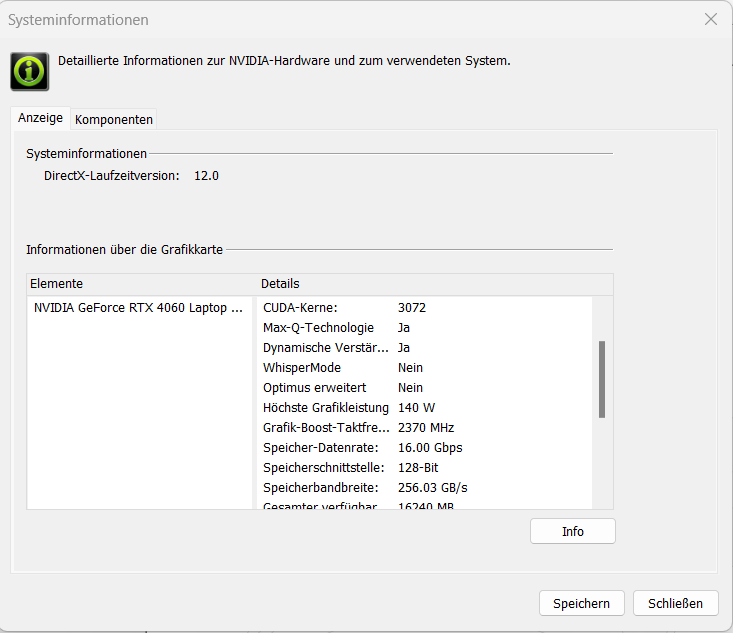
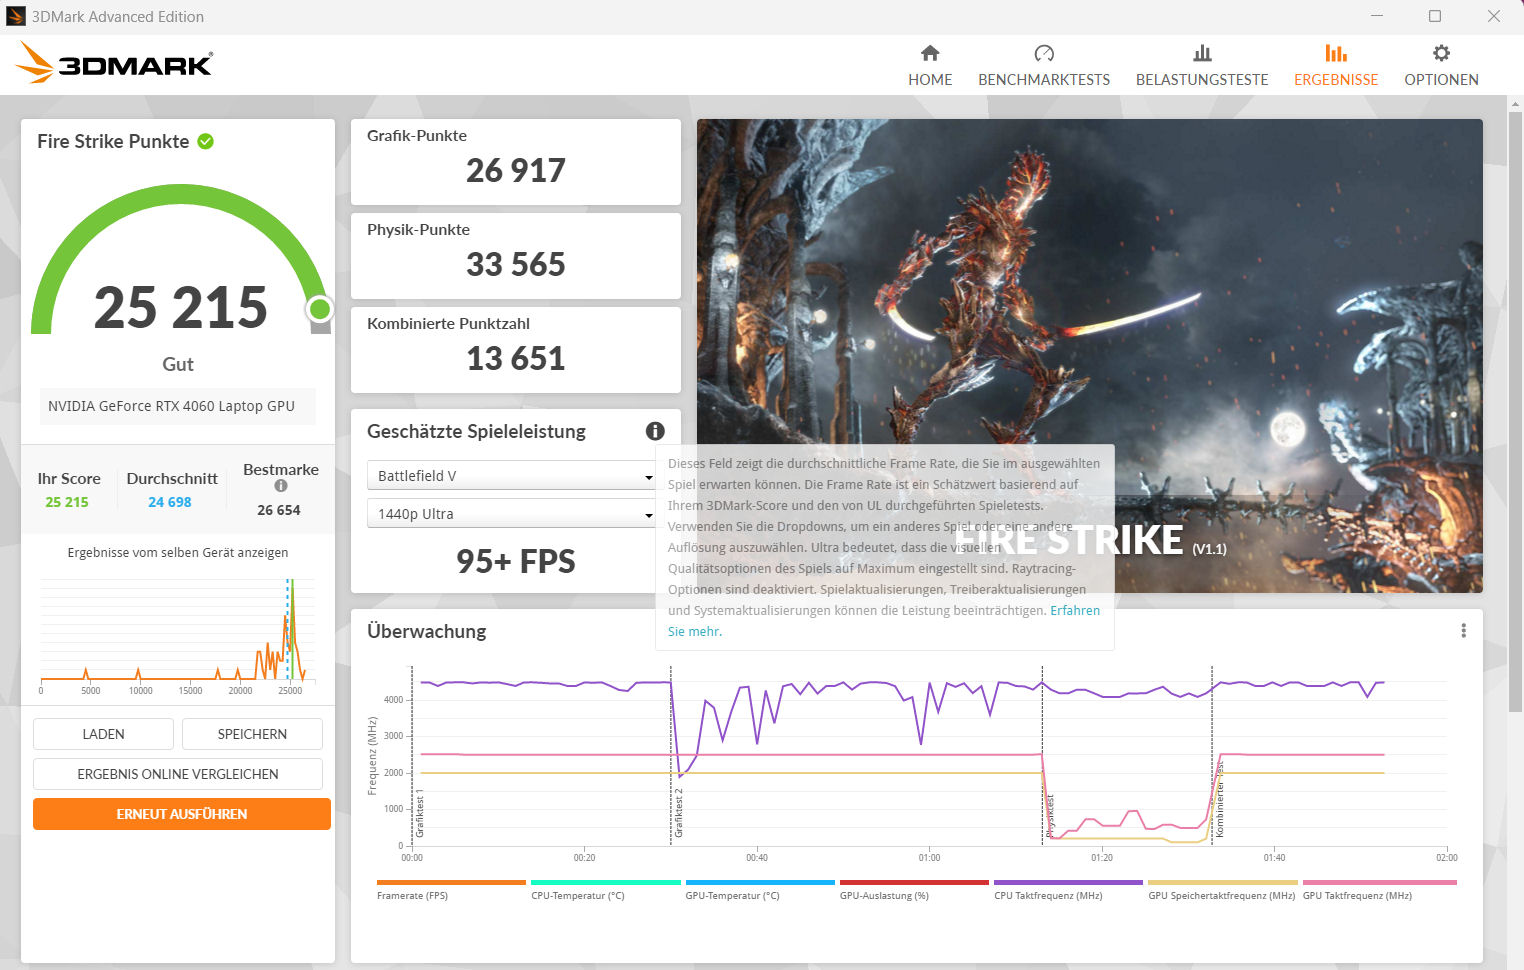
All'interno dell'attuale gamma di GPU RTX 4000 di Nvidia per computer portatili, laGeForce-RTX-4060 utilizzato in questo caso occupa la quarta posizione e può quindi essere classificato come modello di fascia media. Offre 3.072 shader, un bus ampio 128 bit e una memoria GDDR6 veloce (8.192 MB). Ha un TGP massimo di 140 watt (115 watt + 25 watt di Dynamic Boost) - di più non è possibile. Secondo il test, il TGP non viene utilizzato completamente Witcher 3 test.
I risultati del benchmark sono al di sopra della media della RTX 4060 precedentemente determinata ("modalità intrattenimento") - alla pari con i tassi dellaMSI Katana 17 (RTX 4060, 140 watt). Né la "modalità gaming" né l'output diretto delle immagini tramite la GPU GeForce (modalità dGPU) hanno portato a un aumento delle prestazioni. La commutazione tra modalità Optimus e dGPU può essere effettuata tramite il BIOS o il Control Center. La modalità Optimus avanzata non è supportata.
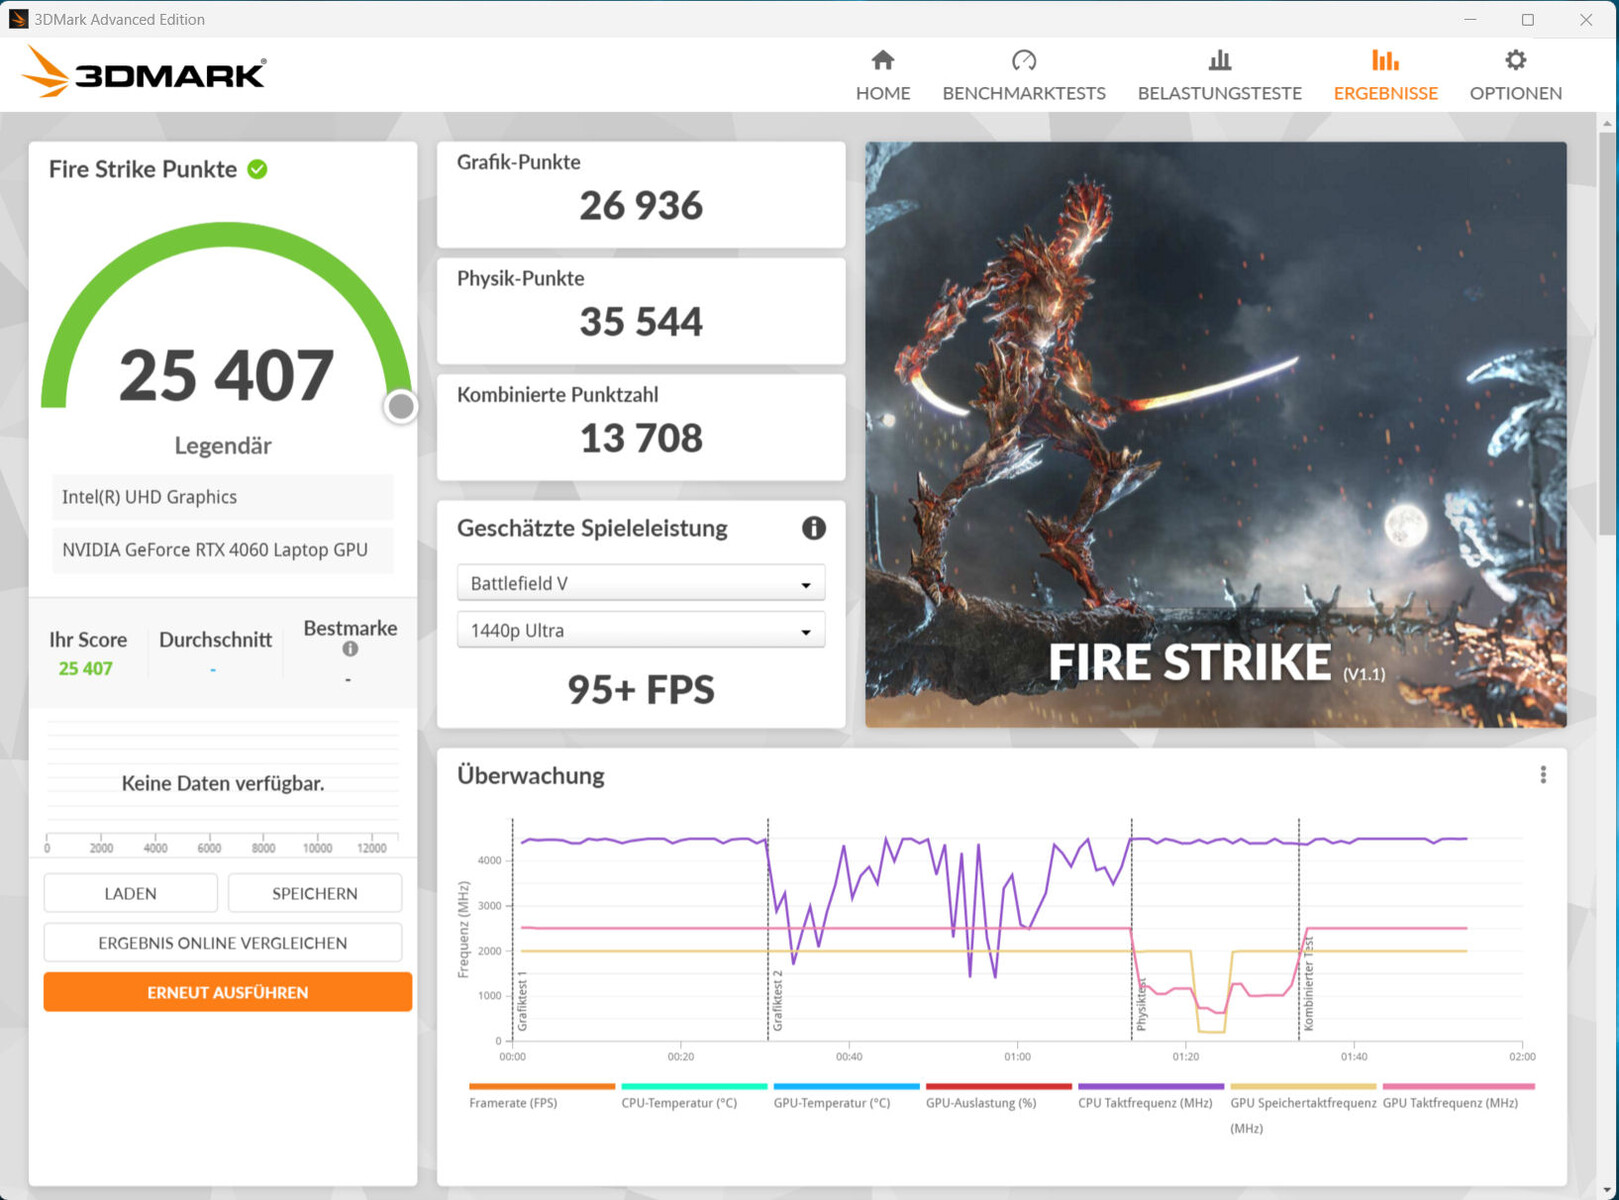
| 3DMark 06 Standard Score | 50480 punti | |
| 3DMark 11 Performance | 31939 punti | |
| 3DMark Cloud Gate Standard Score | 57165 punti | |
| 3DMark Fire Strike Score | 25286 punti | |
| 3DMark Time Spy Score | 10764 punti | |
Aiuto | ||
| V-Ray Benchmark Next 4.10 | |
| GPU | |
| Media della classe Gaming (54 - 1317, n=118, ultimi 2 anni) | |
| MSI Katana 17 B13VFK (v4.10.07 ) | |
| Media NVIDIA GeForce RTX 4060 Laptop GPU (483 - 715, n=46) | |
| Medion Erazer Defender P40 (v4.10.07 ) | |
| Acer Predator Helios 300 (i7-12700H, RTX 3070 Ti) (v4.10.07 ) | |
| Gigabyte G7 KE (v4.10.07 ) | |
| Asus TUF Gaming A16 FA617 (v4.10.07 ) | |
| CPU | |
| Media della classe Gaming (6122 - 44129, n=118, ultimi 2 anni) | |
| Media NVIDIA GeForce RTX 4060 Laptop GPU (12680 - 32360, n=46) | |
| Medion Erazer Defender P40 (v4.10.07 ) | |
| Acer Predator Helios 300 (i7-12700H, RTX 3070 Ti) (v4.10.07 ) | |
| MSI Katana 17 B13VFK (v4.10.07 ) | |
| Asus TUF Gaming A16 FA617 (v4.10.07 ) | |
| Gigabyte G7 KE (v4.10.07 ) | |
* ... Meglio usare valori piccoli
Prestazioni di gioco
Il Medion Defender è progettato per i giochi in QHD con impostazioni elevate o massime. Risoluzioni più elevate possono essere raggiunte con un monitor esterno, con impostazioni parzialmente ridotte. Si ottengono frame rate superiori alla media RTX 4060. La modalità dGPU può, a seconda del gioco, portare a un aumento minimo dei frame rate.
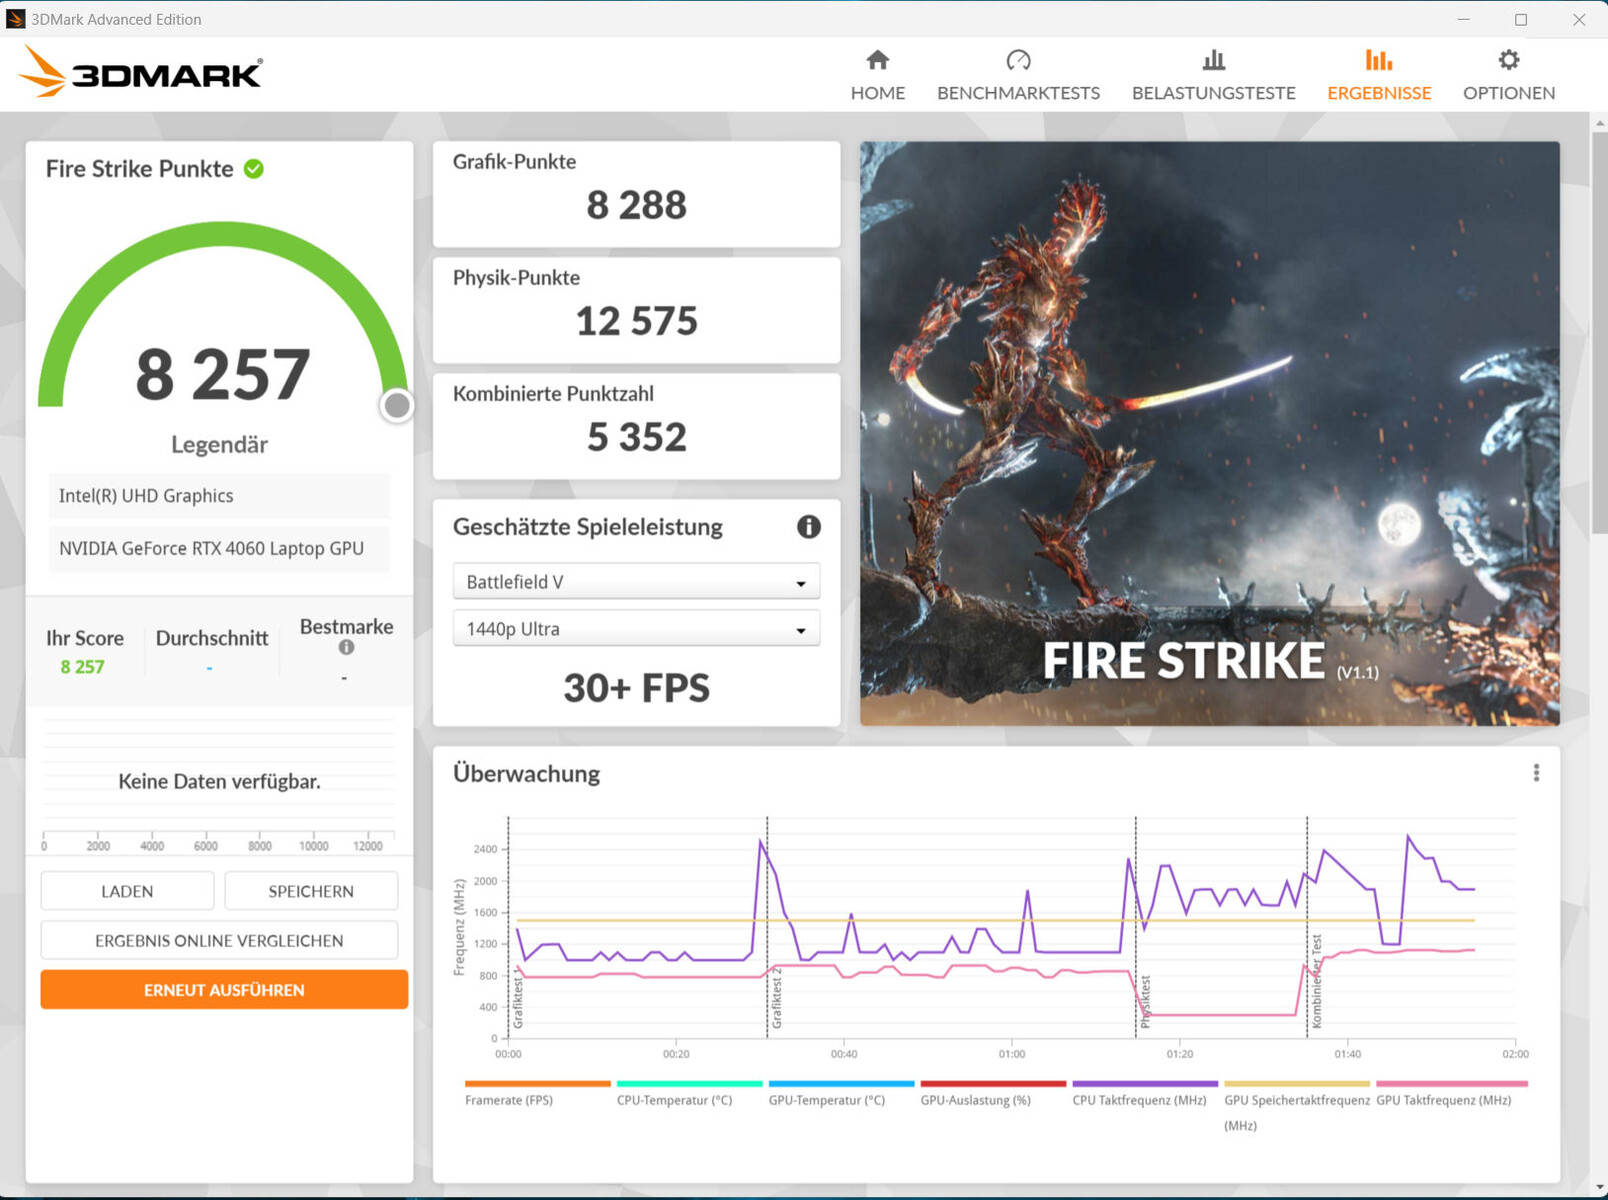
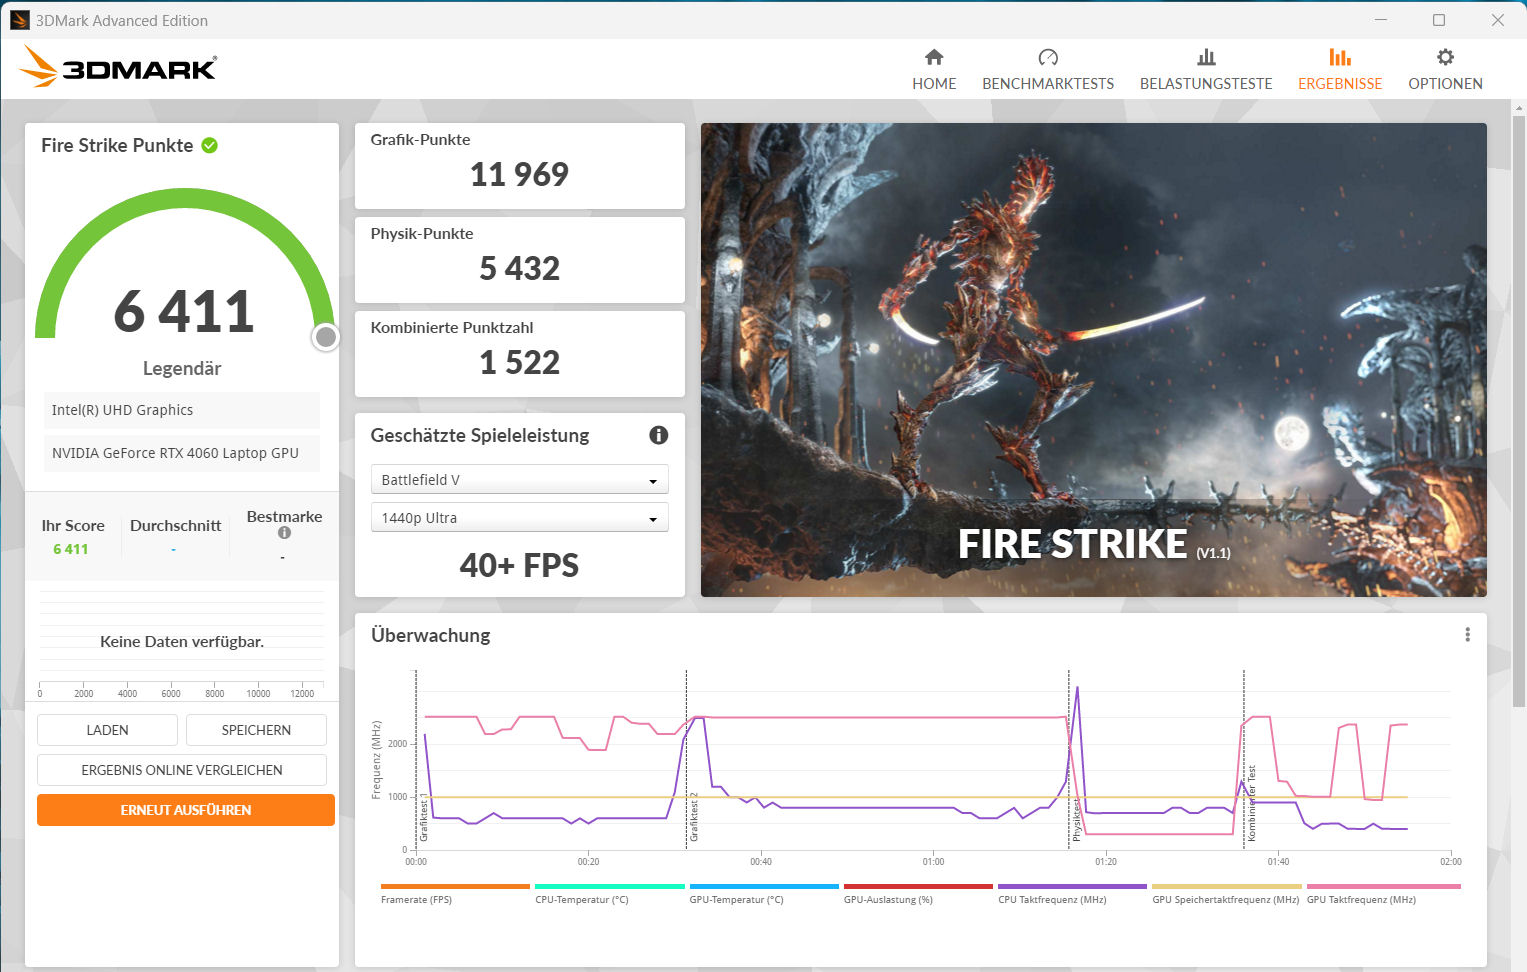
La "modalità silenziosa" consente di giocare con un basso rumore di funzionamento. Tuttavia, i frame rate giocabili si ottengono di solito solo con impostazioni ridotte, perché la potenza di calcolo dell'hardware è notevolmente ridotta.
| The Witcher 3 - 1920x1080 Ultra Graphics & Postprocessing (HBAO+) | |
| Media della classe Gaming (18.4 - 224, n=105, ultimi 2 anni) | |
| Acer Predator Helios 300 (i7-12700H, RTX 3070 Ti) | |
| Lenovo Legion Pro 5 16IRX8 | |
| MSI Katana 17 B13VFK | |
| Medion Erazer Defender P40 | |
| Media NVIDIA GeForce RTX 4060 Laptop GPU (77 - 159.7, n=42) | |
| Asus TUF Gaming A16 FA617 | |
| Gigabyte G7 KE | |
| GTA V - 1920x1080 Highest Settings possible AA:4xMSAA + FX AF:16x | |
| Lenovo Legion Pro 5 16IRX8 | |
| Media della classe Gaming (12.1 - 168.2, n=123, ultimi 2 anni) | |
| Medion Erazer Defender P40 | |
| Acer Predator Helios 300 (i7-12700H, RTX 3070 Ti) | |
| MSI Katana 17 B13VFK | |
| Media NVIDIA GeForce RTX 4060 Laptop GPU (76.9 - 126.3, n=48) | |
| Gigabyte G7 KE | |
| Asus TUF Gaming A16 FA617 | |
| Final Fantasy XV Benchmark - 1920x1080 High Quality | |
| Media della classe Gaming (19.2 - 210, n=139, ultimi 2 anni) | |
| Acer Predator Helios 300 (i7-12700H, RTX 3070 Ti) (1.3) | |
| Lenovo Legion Pro 5 16IRX8 (1.3) | |
| Medion Erazer Defender P40 (1.3) | |
| Media NVIDIA GeForce RTX 4060 Laptop GPU (75.1 - 109.8, n=51) | |
| MSI Katana 17 B13VFK (1.3) | |
| Gigabyte G7 KE (1.3) | |
| Asus TUF Gaming A16 FA617 (1.3) | |
| Strange Brigade - 1920x1080 ultra AA:ultra AF:16 | |
| Media della classe Gaming (38.9 - 434, n=135, ultimi 2 anni) | |
| Acer Predator Helios 300 (i7-12700H, RTX 3070 Ti) (1.47.22.14 D3D12) | |
| Medion Erazer Defender P40 (1.47.22.14 D3D12) | |
| MSI Katana 17 B13VFK (1.47.22.14 D3D12) | |
| Media NVIDIA GeForce RTX 4060 Laptop GPU (135.3 - 210, n=50) | |
| Asus TUF Gaming A16 FA617 (1.47.22.14 D3D12) | |
| Gigabyte G7 KE (1.47.22.14 D3D12) | |
| Dead Space Remake | |
| 1920x1080 Ultra Preset AA:T | |
| Medion Erazer Defender P40 | |
| MSI Katana 17 B13VFK | |
| Media NVIDIA GeForce RTX 4060 Laptop GPU (53.3 - 70.4, n=3) | |
| Gigabyte G7 KE | |
| Asus TUF Gaming A16 FA617 | |
| Media della classe Gaming (14 - 39.8, n=3, ultimi 2 anni) | |
| 2560x1440 Ultra Preset AA:T | |
| Medion Erazer Defender P40 | |
| Media NVIDIA GeForce RTX 4060 Laptop GPU (43.4 - 44.5, n=2) | |
| MSI Katana 17 B13VFK | |
| Asus TUF Gaming A16 FA617 | |
| The Witcher 3 v4.00 | |
| 1920x1080 Ultra Preset / On AA:FX | |
| Asus TUF Gaming A16 FA617 | |
| Gigabyte G7 KE | |
| Medion Erazer Defender P40 | |
| MSI Katana 17 B13VFK | |
| Media NVIDIA GeForce RTX 4060 Laptop GPU (50.3 - 72.8, n=3) | |
| Media della classe Gaming (25.7 - 86.5, n=5, ultimi 2 anni) | |
| 2560x1440 Ultra Preset / On AA:FX | |
| Media della classe Gaming (n=1ultimi 2 anni) | |
| Asus TUF Gaming A16 FA617 | |
| Medion Erazer Defender P40 | |
| Media NVIDIA GeForce RTX 4060 Laptop GPU (40.5 - 44.8, n=2) | |
| MSI Katana 17 B13VFK | |
| Resident Evil 4 Remake | |
| 1920x1080 Max Preset | |
| Medion Erazer Defender P40 | |
| Media della classe Gaming (19.7 - 143.2, n=9, ultimi 2 anni) | |
| Media NVIDIA GeForce RTX 4060 Laptop GPU (50.9 - 72.7, n=3) | |
| 2560x1440 Max Preset | |
| Media della classe Gaming (29.4 - 113.2, n=5, ultimi 2 anni) | |
| Media NVIDIA GeForce RTX 4060 Laptop GPU (52.1 - 55.1, n=2) | |
| Medion Erazer Defender P40 | |
| Dead Island 2 | |
| 1920x1080 Ultra Preset AA:High T | |
| XMG Pro 15 E23 | |
| Media NVIDIA GeForce RTX 4060 Laptop GPU (148.5 - 158.8, n=2) | |
| Medion Erazer Defender P40 | |
| Media della classe Gaming (14.6 - 181.7, n=8, ultimi 2 anni) | |
| 2560x1440 Ultra Preset AA:High T | |
| Media della classe Gaming (61.8 - 178.5, n=4, ultimi 2 anni) | |
| XMG Pro 15 E23 | |
| Media NVIDIA GeForce RTX 4060 Laptop GPU (98 - 101.9, n=2) | |
| Medion Erazer Defender P40 | |
| Star Wars Jedi Survivor | |
| 1920x1080 Epic Preset | |
| Media della classe Gaming (27.2 - 148, n=18, ultimi 2 anni) | |
| XMG Pro 15 E23 | |
| Medion Erazer Defender P40 | |
| Media NVIDIA GeForce RTX 4060 Laptop GPU (45.5 - 66.7, n=10) | |
| 2560x1440 Epic Preset | |
| Media della classe Gaming (30.4 - 114, n=13, ultimi 2 anni) | |
| XMG Pro 15 E23 | |
| Medion Erazer Defender P40 | |
| Media NVIDIA GeForce RTX 4060 Laptop GPU (30.3 - 41.7, n=10) | |
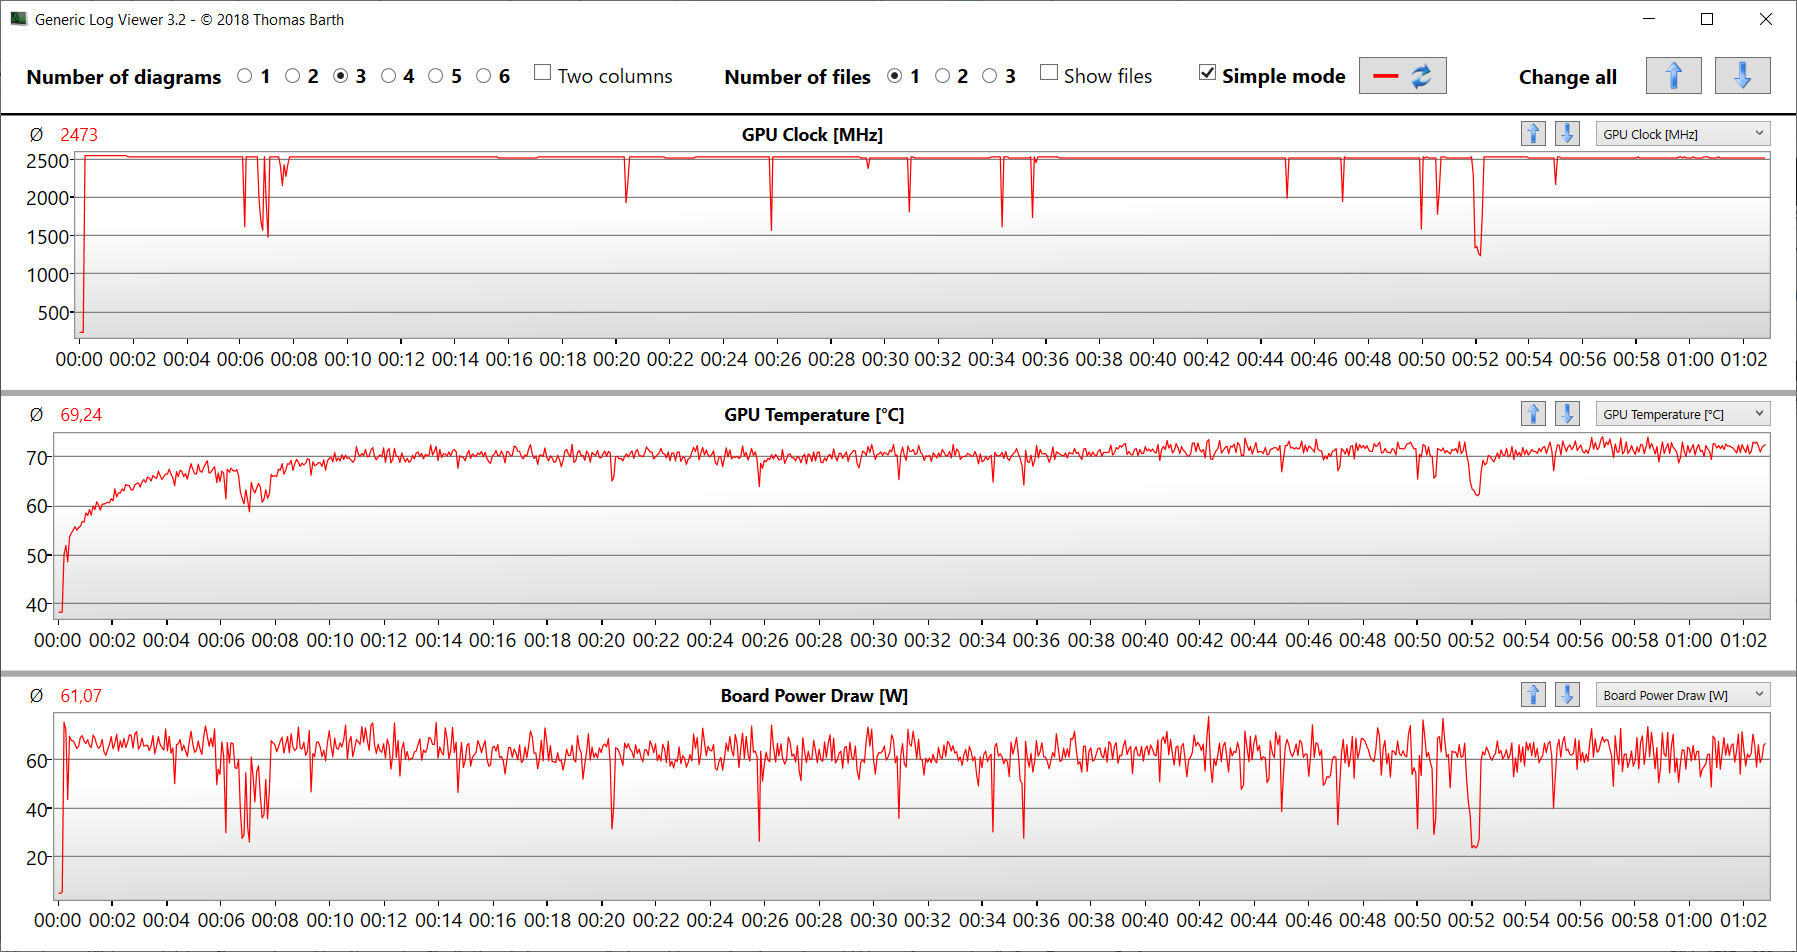
Per verificare se la frequenza dei fotogrammi rimane sostanzialmente costante per un periodo più lungo, abbiamo eseguito il gioco The Witcher 3 per circa 60 minuti con risoluzione Full HD e impostazioni di qualità massime. Il personaggio del gioco non è stato spostato. Il calo della frequenza dei fotogrammi si è verificato solo quando era attiva la "modalità silenziosa".
Witcher 3 FPS diagram
| basso | medio | alto | ultra | QHD | |
|---|---|---|---|---|---|
| GTA V (2015) | 186.3 | 183.1 | 176 | 113.9 | 83.1 |
| The Witcher 3 (2015) | 459.5 | 318.2 | 195.9 | 103 | |
| Dota 2 Reborn (2015) | 178.7 | 163.1 | 151.3 | 144.3 | |
| Final Fantasy XV Benchmark (2018) | 188.5 | 141.9 | 100.8 | 74 | |
| X-Plane 11.11 (2018) | 159.8 | 139.1 | 109.3 | ||
| Far Cry 5 (2018) | 167 | 142 | 136 | 128 | 102 |
| Strange Brigade (2018) | 473 | 279 | 221 | 188.3 | 126.4 |
| F1 22 (2022) | 243 | 232 | 178 | 65.7 | 42 |
| The Witcher 3 v4.00 (2023) | 210 | 171.6 | 85.4 | 72.8 | 44.8 |
| Dead Space Remake (2023) | 88.5 | 83.2 | 71.1 | 70.4 | 44.5 |
| Resident Evil 4 Remake (2023) | 141.5 | 107.2 | 97.3 | 72.7 | 52.1 |
| Dead Island 2 (2023) | 189.9 | 181.7 | 153.5 | 148.5 | 98 |
| Star Wars Jedi Survivor (2023) | 77.2 | 69.1 | 64.8 | 61.7 | 38.5 |
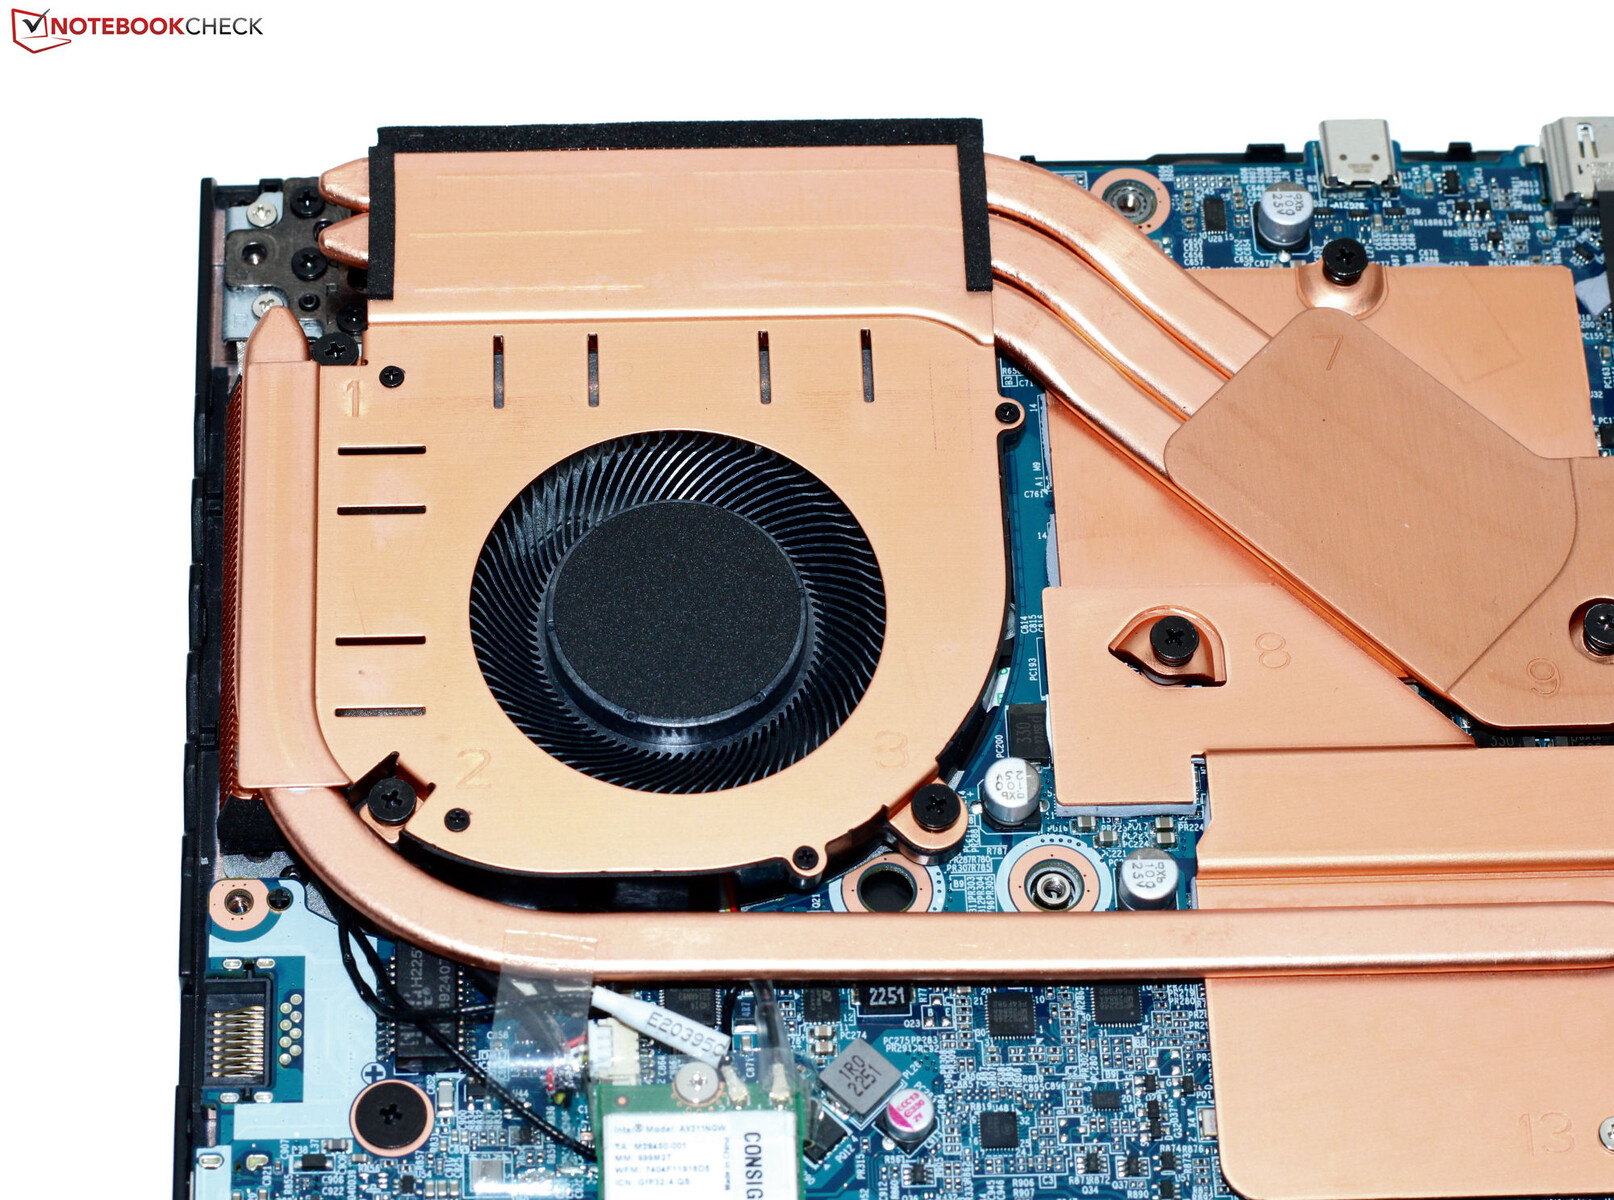
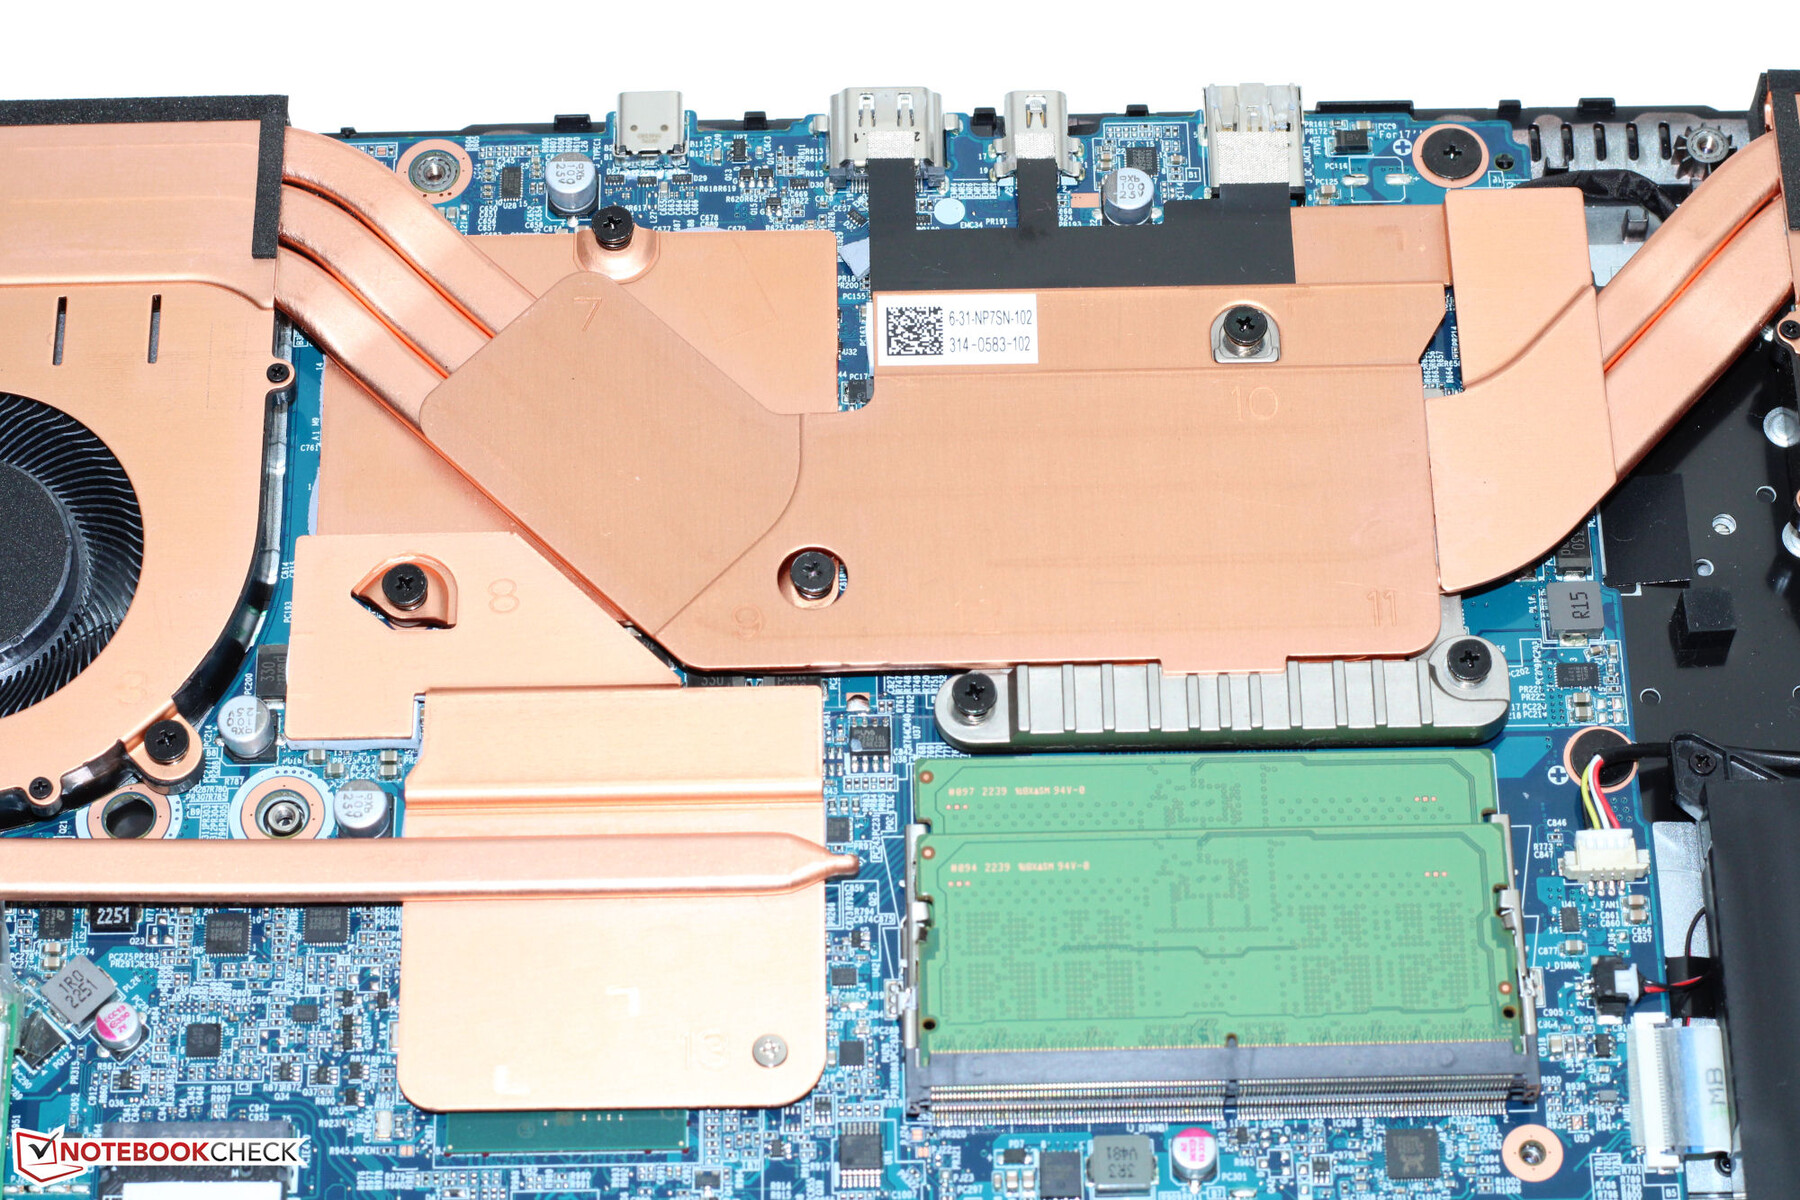
Emissioni - Un portatile Medion con aumenti di temperatura moderati
Emissioni acustiche
Sotto carico, l'Erazer Defender può produrre molto rumore. la modalità "Gaming" ha fatto salire il livello di pressione sonora fino a 62 dB(A), mentre con la modalità "Entertainment" attivata si è raggiunto un massimo di 56 dB(A), comunque molto forte.
Le altre due modalità hanno ridotto notevolmente il rumore a scapito della potenza di calcolo - probabilmente una prima scelta per l'uso quotidiano. Tuttavia, la "modalità silenziosa" non è all'altezza del suo nome. Tuttavia: Permette di giocare a un volume operativo basso (Witcher 3: 36 dB(A)).
| HD Basso | FHD Basso | FHD Medio | FHD Alto | FHD Ultra | |
|---|---|---|---|---|---|
| Dota 2 Reborn | 85,8 fps | - | - | 51,7 fps | 45,1 fps |
| X-Plane 11.11 | 52.1 fps | - | 41.2 fps | 35.9 fps | - |
| Strange Brigade | - | - | - | - | 60 fps |
Il notebook funziona spesso in modo silenzioso, a volte anche in modalità idle, così come nell'uso quotidiano (ufficio, Internet). Tuttavia, a volte le ventole accelerano inutilmente (un fenomeno tipico dei barebone Clevo).
Rumorosità
| Idle |
| 26 / 27 / 32 dB(A) |
| Sotto carico |
| 53 / 64 dB(A) |
 | ||
30 dB silenzioso 40 dB(A) udibile 50 dB(A) rumoroso |
||
min: | ||
| Medion Erazer Defender P40 NVIDIA GeForce RTX 4060 Laptop GPU, i7-13700HX, Phison PS5021-E21 1TB | MSI Katana 17 B13VFK NVIDIA GeForce RTX 4060 Laptop GPU, i7-13620H, Micron 2400 MTFDKBA1T0QFM | Acer Predator Helios 300 (i7-12700H, RTX 3070 Ti) GeForce RTX 3070 Ti Laptop GPU, i7-12700H, Samsung PM9A1 MZVL21T0HCLR | Lenovo Legion Pro 5 16IRX8 NVIDIA GeForce RTX 4060 Laptop GPU, i7-13700HX, SK hynix PC801 HFS512GEJ9X115N | Asus TUF Gaming A16 FA617 Radeon RX 7600S, R7 7735HS, Micron 2400 MTFDKBA1T0QFM | Gigabyte G7 KE GeForce RTX 3060 Laptop GPU, i5-12500H, Gigabyte AG470S1TB-SI B10 | |
|---|---|---|---|---|---|---|
| Noise | 1% | 1% | 16% | 12% | -7% | |
| off /ambiente * | 25 | 24.5 2% | 23 8% | 23 8% | 24 4% | 27 -8% |
| Idle Minimum * | 26 | 24.5 6% | 23 12% | 23.1 11% | 24 8% | 27 -4% |
| Idle Average * | 27 | 24.5 9% | 25.92 4% | 23.1 14% | 25 7% | 35 -30% |
| Idle Maximum * | 32 | 40 -25% | 40.67 -27% | 26.6 17% | 28 12% | 38 -19% |
| Load Average * | 53 | 48.3 9% | 42.7 19% | 34.7 35% | 42 21% | 52 2% |
| Witcher 3 ultra * | 56 | 56 -0% | 62.48 -12% | 47.6 15% | 50 11% | 56 -0% |
| Load Maximum * | 64 | 59.1 8% | 62.67 2% | 54.8 14% | 50 22% | 59 8% |
* ... Meglio usare valori piccoli
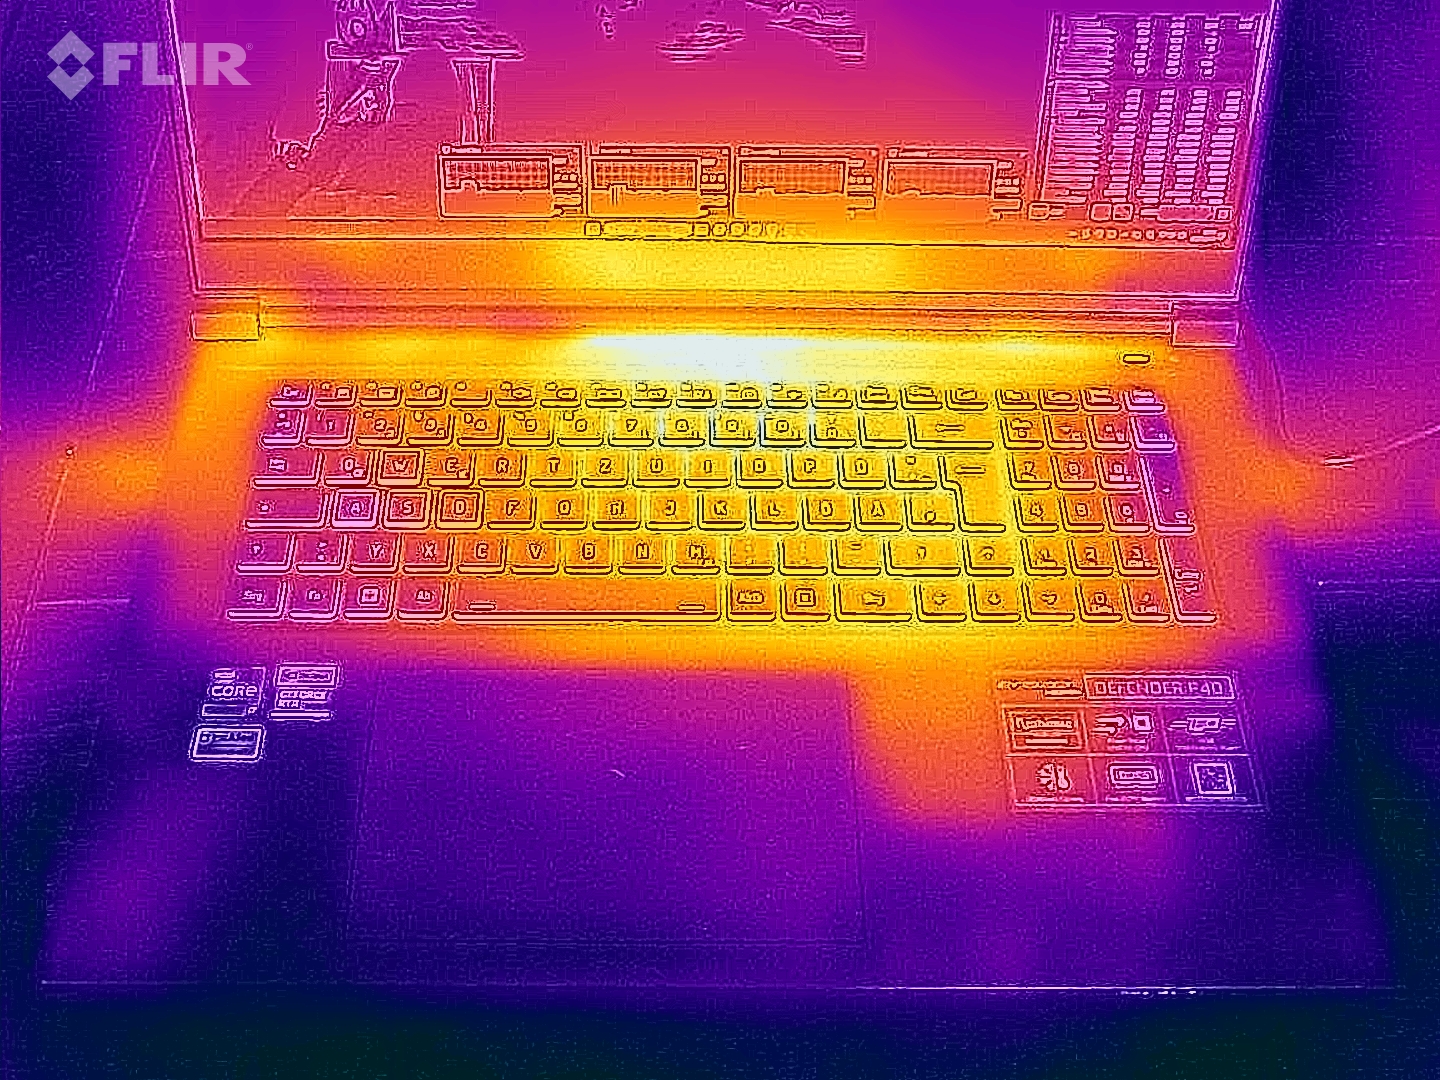
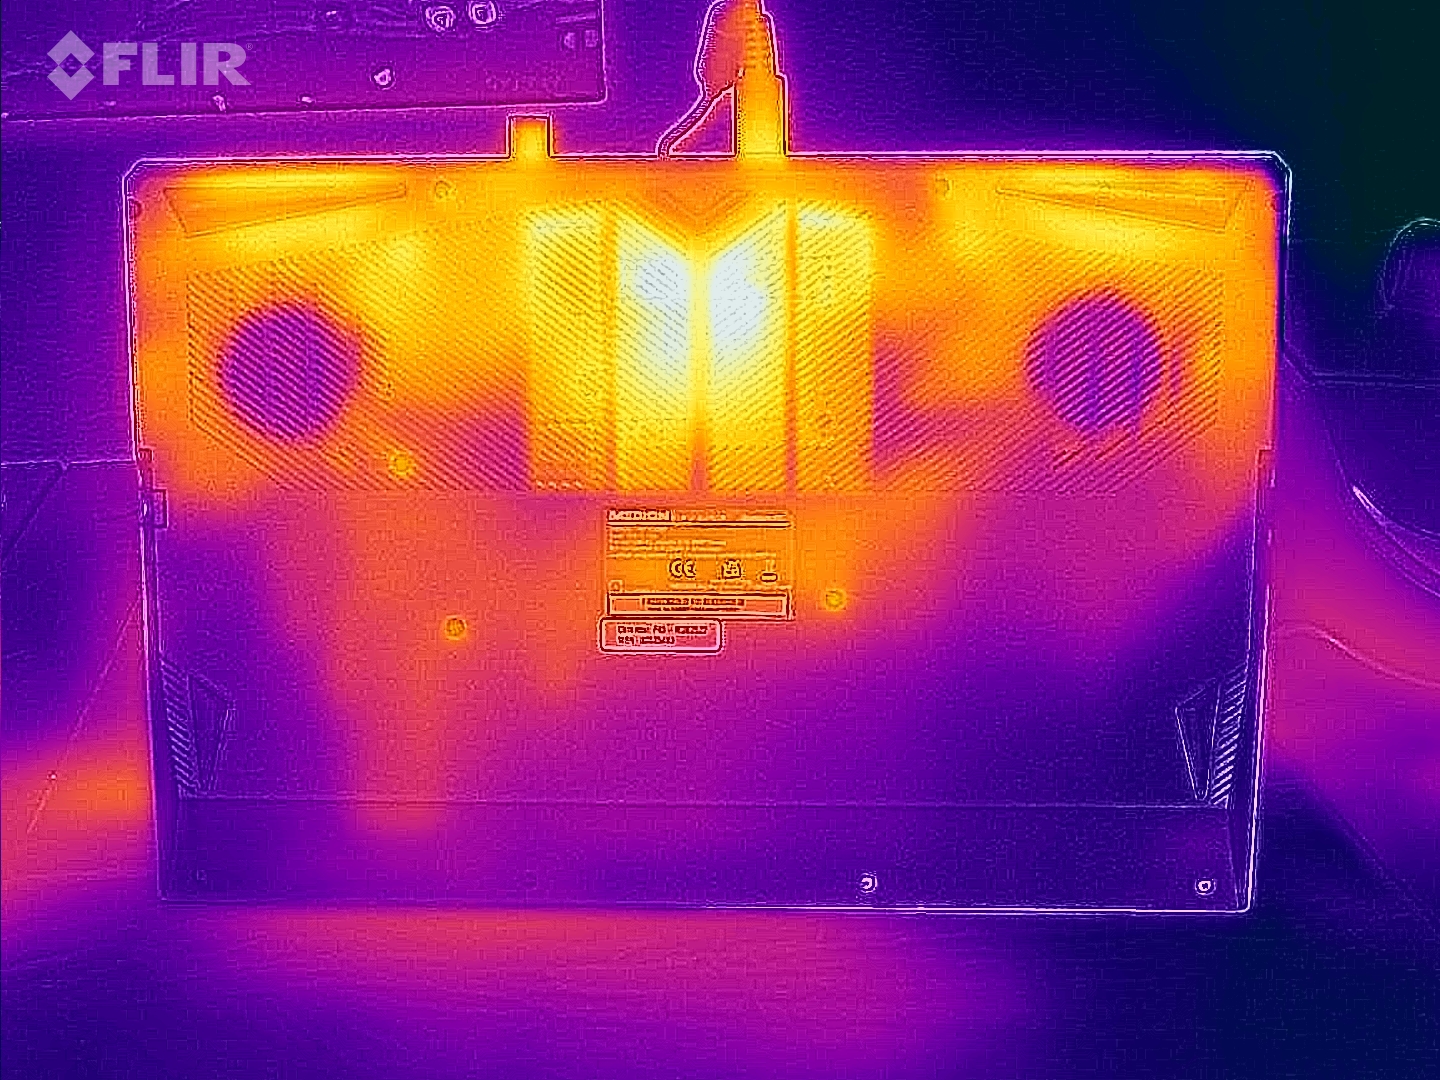
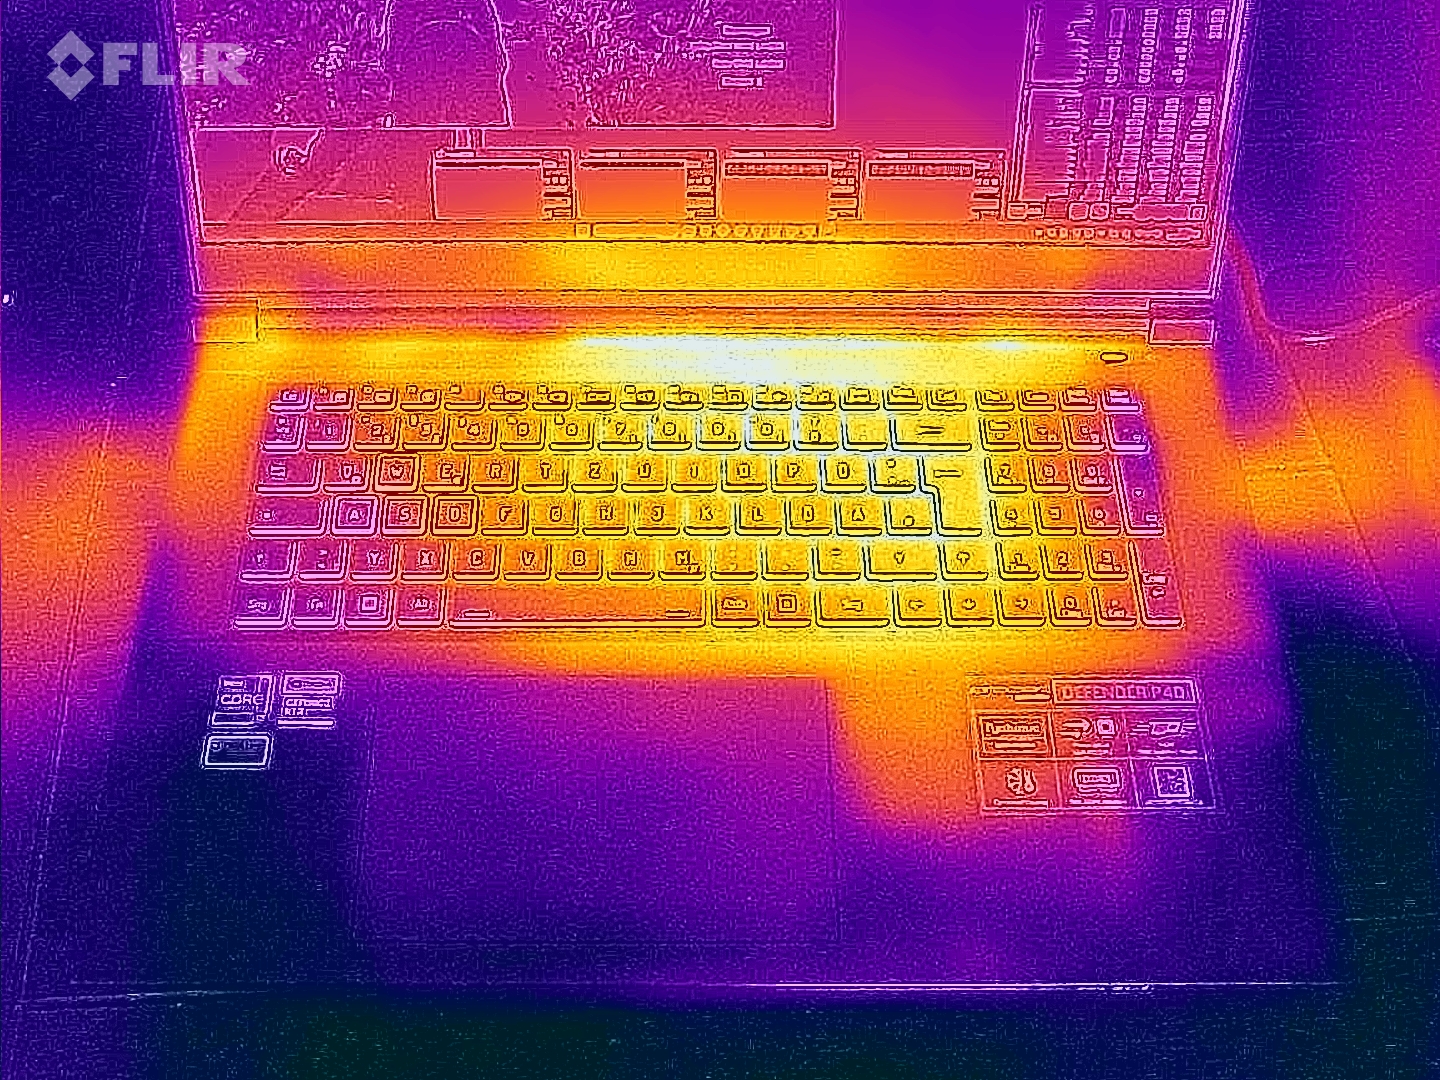
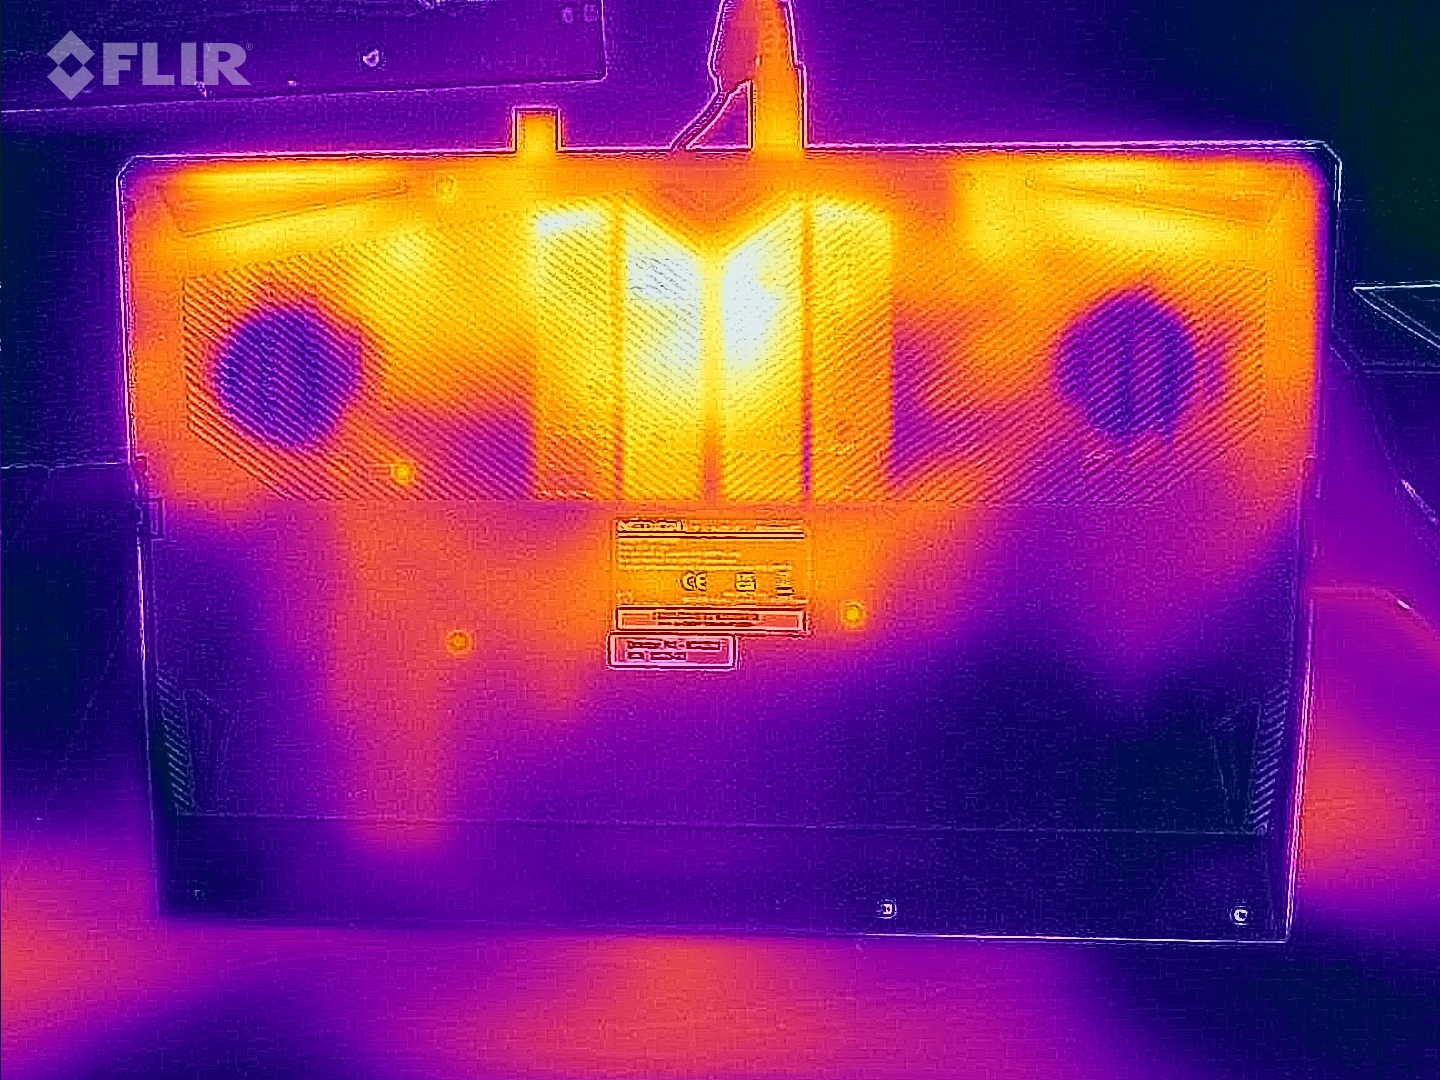
Temperatura
Il notebook non si riscalda molto. In tutti i punti di misurazione si registrano temperature ben al di sotto dei 50°C. Nell'uso quotidiano le percentuali rientrano nella zona verde.
(±) La temperatura massima sul lato superiore è di 42 °C / 108 F, rispetto alla media di 40.4 °C / 105 F, che varia da 21.2 a 68.8 °C per questa classe Gaming.
(±) Il lato inferiore si riscalda fino ad un massimo di 45 °C / 113 F, rispetto alla media di 43.3 °C / 110 F
(+) In idle, la temperatura media del lato superiore è di 26.6 °C / 80 F, rispetto alla media deld ispositivo di 33.9 °C / 93 F.
(±) Riproducendo The Witcher 3, la temperatura media per il lato superiore e' di 37.1 °C / 99 F, rispetto alla media del dispositivo di 33.9 °C / 93 F.
(+) I poggiapolsi e il touchpad sono piu' freddi della temperatura della pelle con un massimo di 31 °C / 87.8 F e sono quindi freddi al tatto.
(-) La temperatura media della zona del palmo della mano di dispositivi simili e'stata di 28.9 °C / 84 F (-2.1 °C / -3.8 F).
| Medion Erazer Defender P40 Intel Core i7-13700HX, NVIDIA GeForce RTX 4060 Laptop GPU | MSI Katana 17 B13VFK Intel Core i7-13620H, NVIDIA GeForce RTX 4060 Laptop GPU | Acer Predator Helios 300 (i7-12700H, RTX 3070 Ti) Intel Core i7-12700H, NVIDIA GeForce RTX 3070 Ti Laptop GPU | Lenovo Legion Pro 5 16IRX8 Intel Core i7-13700HX, NVIDIA GeForce RTX 4060 Laptop GPU | Asus TUF Gaming A16 FA617 AMD Ryzen 7 7735HS, AMD Radeon RX 7600S | Gigabyte G7 KE Intel Core i5-12500H, NVIDIA GeForce RTX 3060 Laptop GPU | |
|---|---|---|---|---|---|---|
| Heat | -7% | -5% | -8% | -27% | -13% | |
| Maximum Upper Side * | 42 | 41.6 1% | 35 17% | 42.8 -2% | 54 -29% | 52 -24% |
| Maximum Bottom * | 45 | 43.1 4% | 53 -18% | 50 -11% | 47 -4% | 54 -20% |
| Idle Upper Side * | 28 | 32 -14% | 29 -4% | 29.6 -6% | 40 -43% | 28 -0% |
| Idle Bottom * | 30 | 35.8 -19% | 34 -13% | 34 -13% | 40 -33% | 32 -7% |
* ... Meglio usare valori piccoli
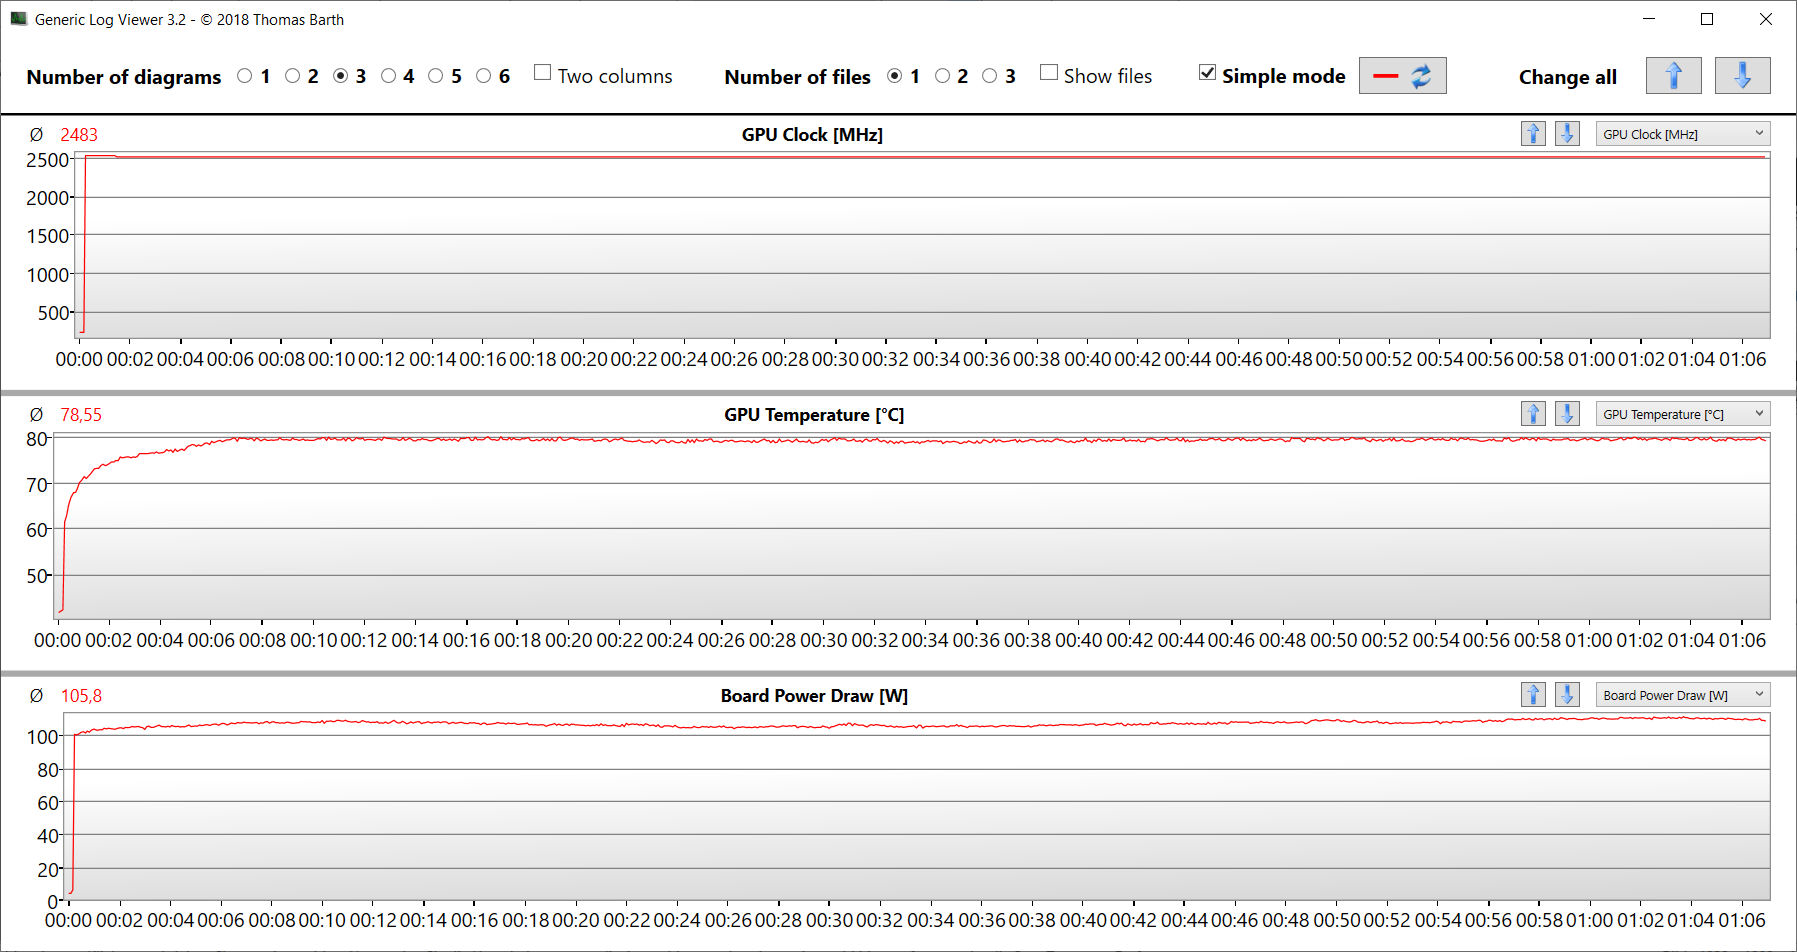
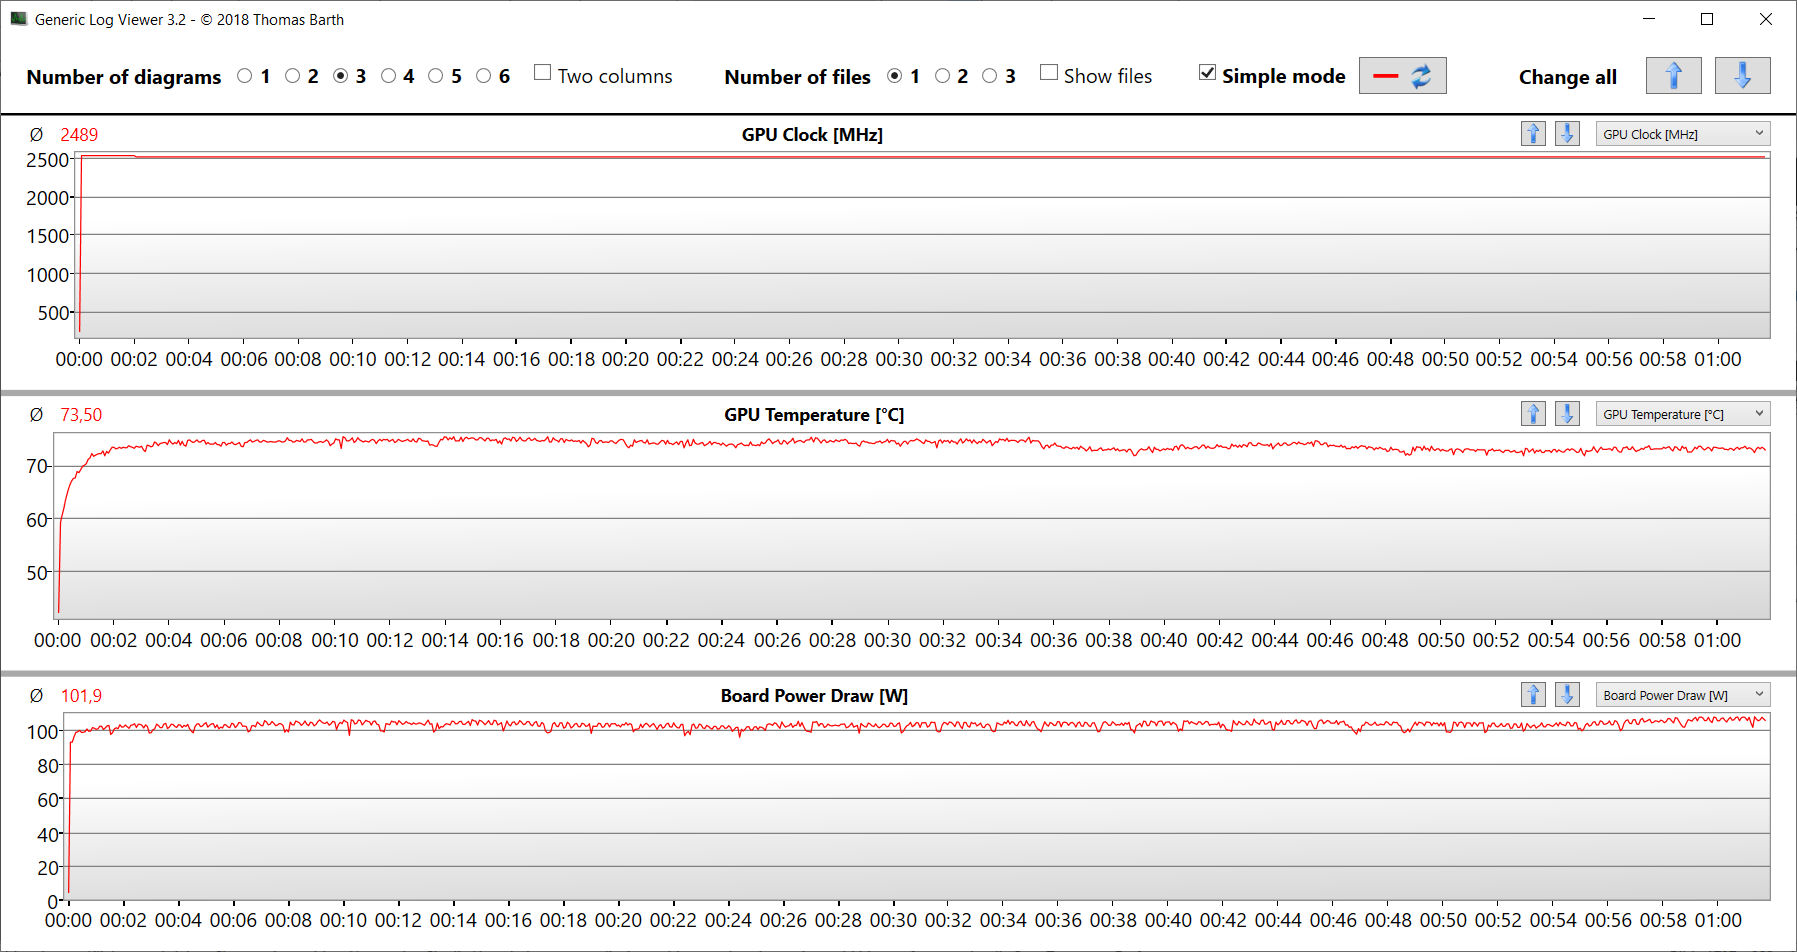
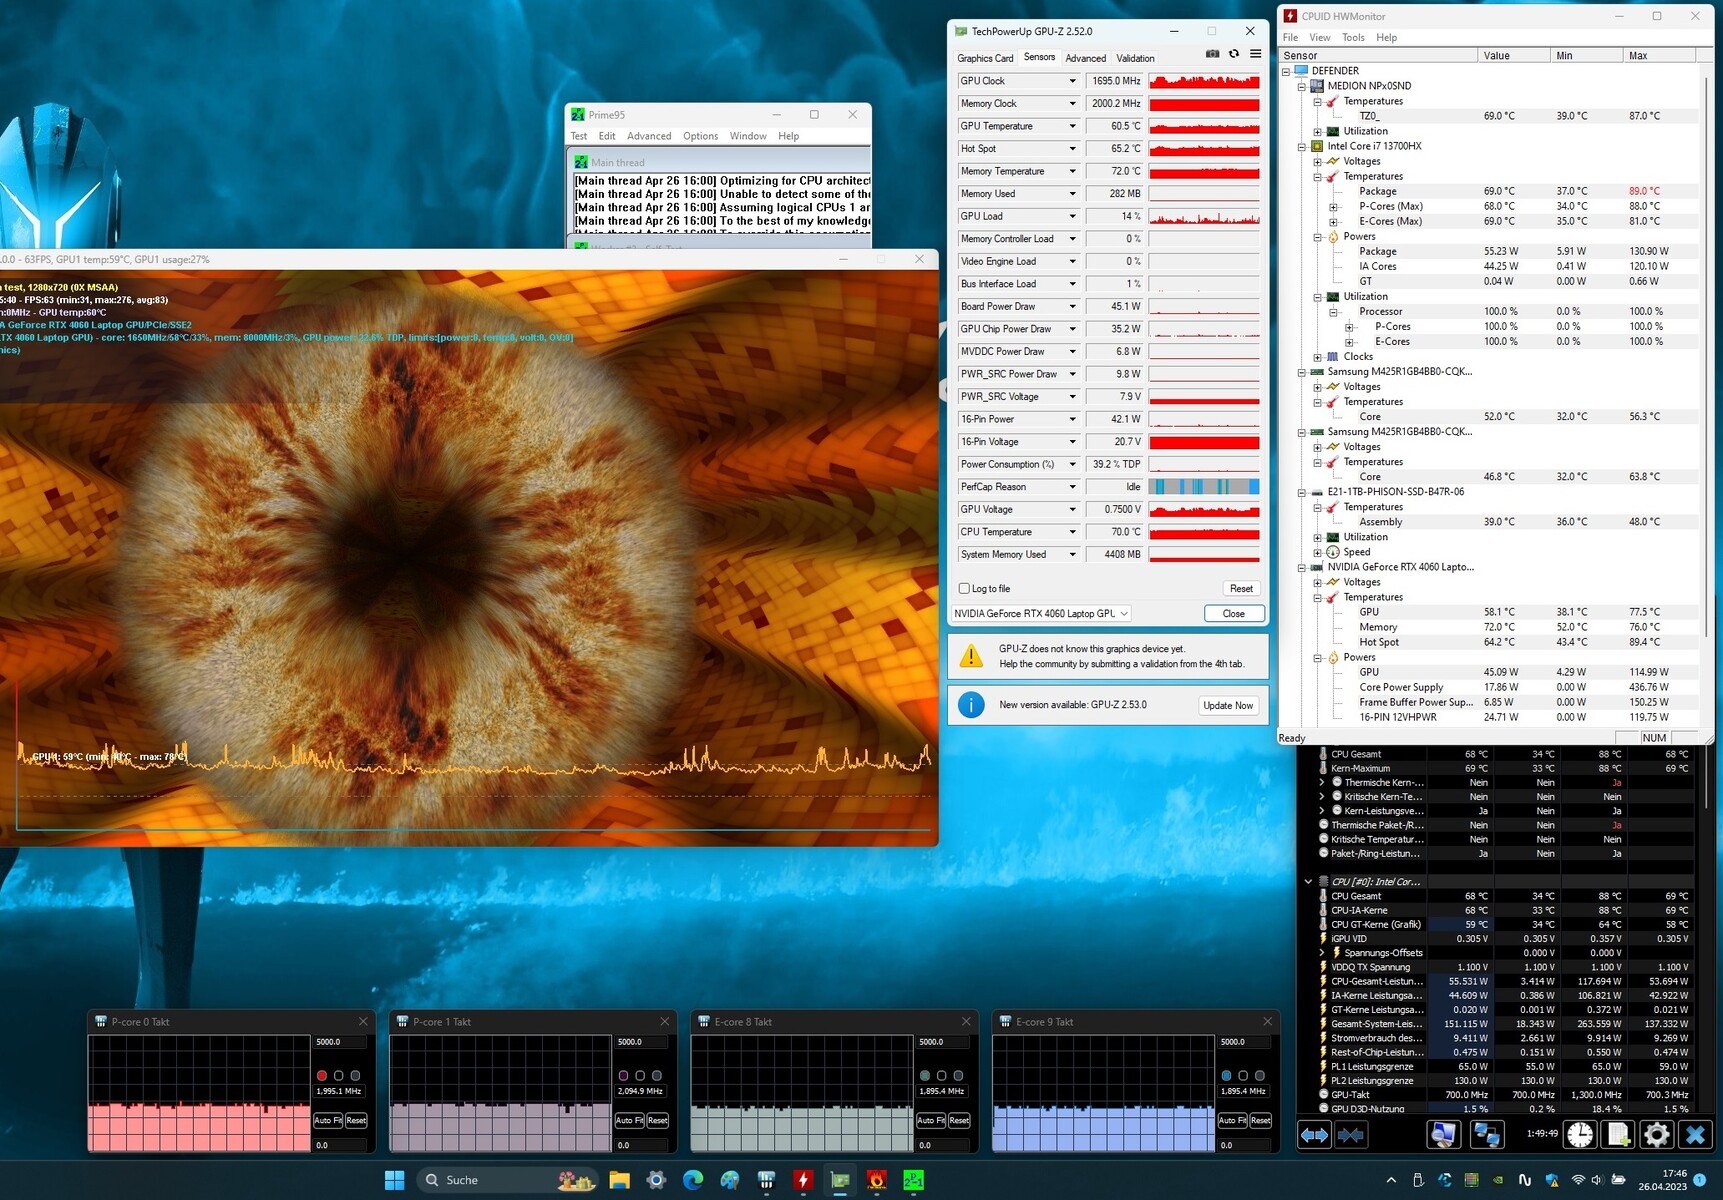
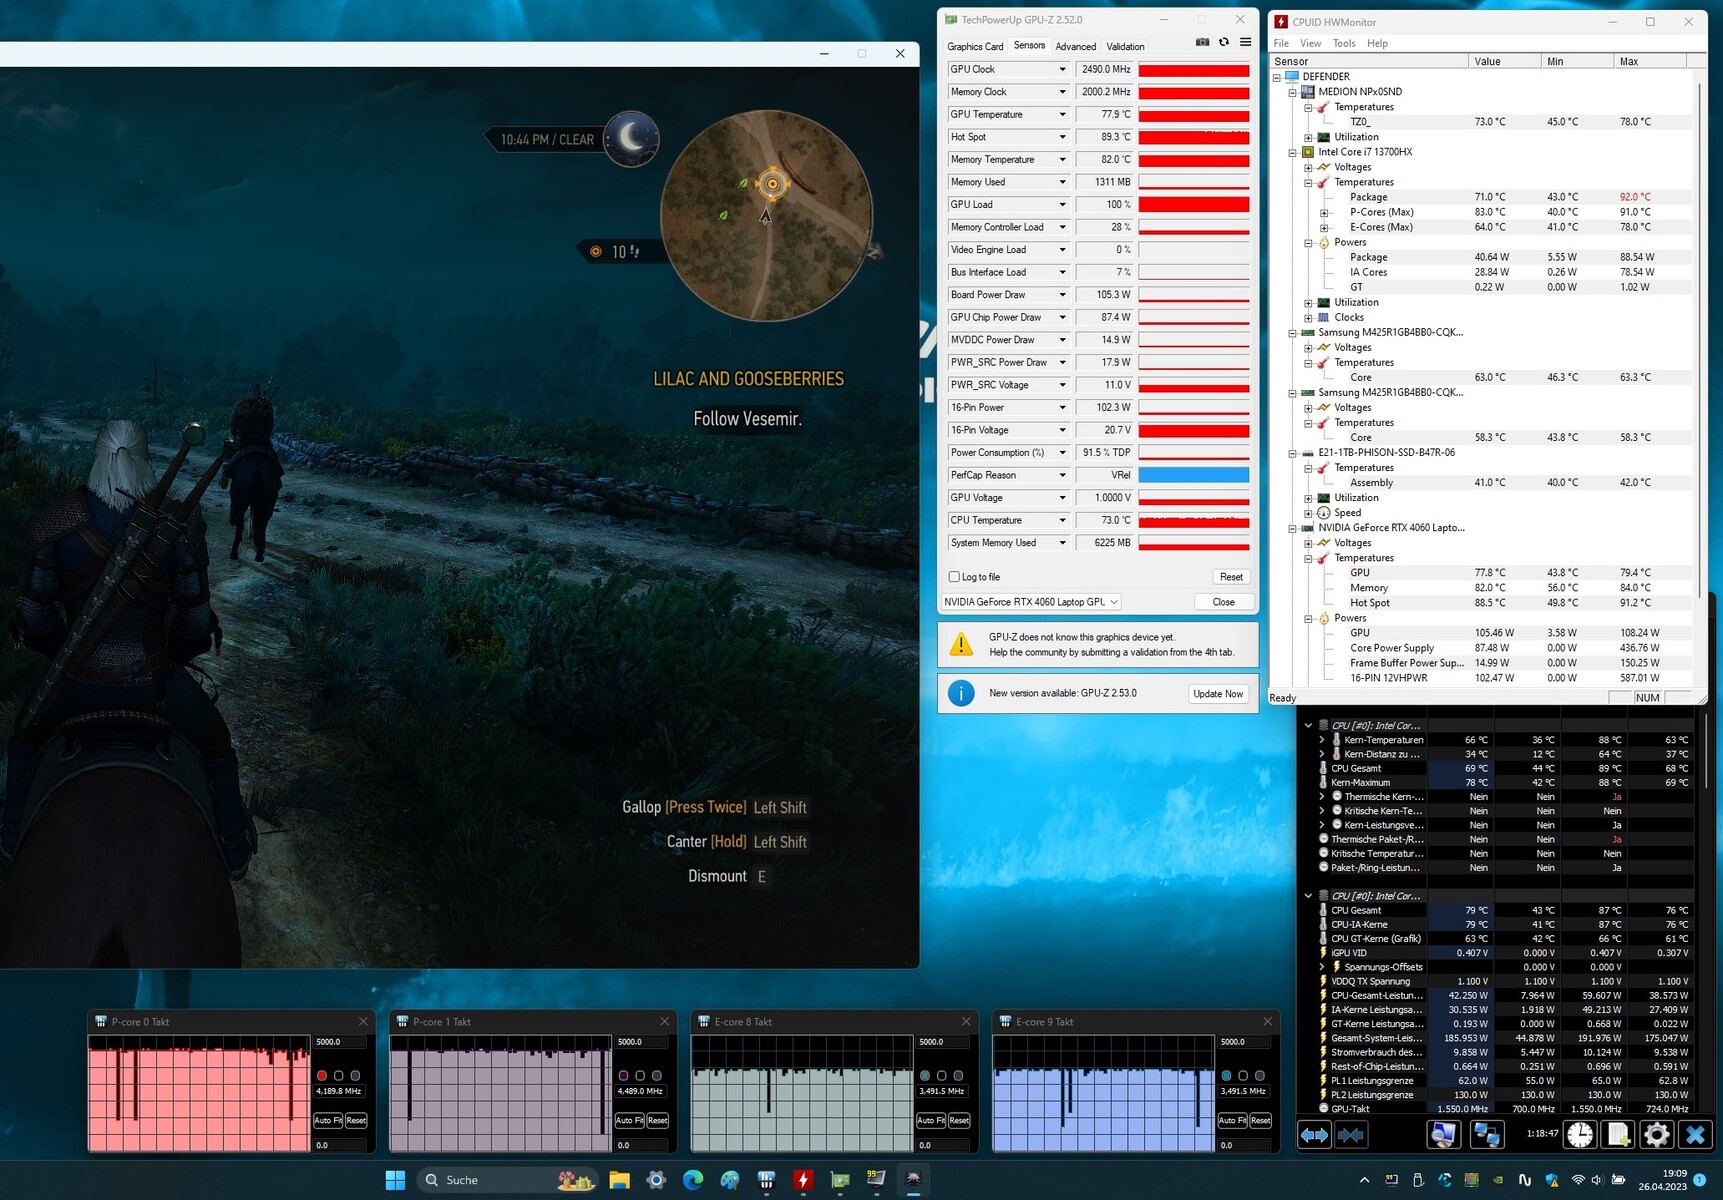
Test da sforzo
Lo stress test (Prime95 e Furmark in funzionamento continuo) simula uno scenario estremo per testare la stabilità del sistema a pieno carico. La CPU ha iniziato il test con velocità di clock elevate (P: da 3,5 a 3,8 GHz, E: da 3,1 a 3,2 GHz), mentre la GPU ha funzionato a 2,4-2,5 GHz. Mentre il clock della CPU è stato ridotto dopo poco meno di un minuto, la GPU ha lavorato a piena potenza per tutto il tempo.
Altoparlanti
Gli altoparlanti stereo producono un suono decente che, purtroppo, non ha quasi nessun basso da offrire. Un'esperienza sonora migliore potrebbe essere ottenuta utilizzando cuffie o altoparlanti esterni.
Medion Erazer Defender P40 analisi audio
(±) | potenza degli altiparlanti media ma buona (81 dB)
Bassi 100 - 315 Hz
(-) | quasi nessun basso - in media 29.9% inferiori alla media
(±) | la linearità dei bassi è media (12.4% delta rispetto alla precedente frequenza)
Medi 400 - 2000 Hz
(±) | medi elevati - circa 6.4% superiore alla media
(±) | linearità dei medi adeguata (8.1% delta rispetto alla precedente frequenza)
Alti 2 - 16 kHz
(+) | Alti bilanciati - appena 2.4% dalla media
(+) | alti lineari (3.6% delta rispetto alla precedente frequenza)
Nel complesso 100 - 16.000 Hz
(±) | la linearità complessiva del suono è media (22.4% di differenza rispetto alla media
Rispetto alla stessa classe
» 79% di tutti i dispositivi testati in questa classe è stato migliore, 6% simile, 16% peggiore
» Il migliore ha avuto un delta di 6%, medio di 18%, peggiore di 132%
Rispetto a tutti i dispositivi testati
» 63% di tutti i dispositivi testati in questa classe è stato migliore, 6% similare, 31% peggiore
» Il migliore ha avuto un delta di 4%, medio di 24%, peggiore di 134%
MSI Katana 17 B13VFK analisi audio
(±) | potenza degli altiparlanti media ma buona (78.5 dB)
Bassi 100 - 315 Hz
(-) | quasi nessun basso - in media 17.7% inferiori alla media
(±) | la linearità dei bassi è media (11.7% delta rispetto alla precedente frequenza)
Medi 400 - 2000 Hz
(±) | medi elevati - circa 6.8% superiore alla media
(+) | medi lineari (6.7% delta rispetto alla precedente frequenza)
Alti 2 - 16 kHz
(+) | Alti bilanciati - appena 3.2% dalla media
(±) | la linearità degli alti è media (7.2% delta rispetto alla precedente frequenza)
Nel complesso 100 - 16.000 Hz
(±) | la linearità complessiva del suono è media (19.4% di differenza rispetto alla media
Rispetto alla stessa classe
» 65% di tutti i dispositivi testati in questa classe è stato migliore, 7% simile, 28% peggiore
» Il migliore ha avuto un delta di 6%, medio di 18%, peggiore di 132%
Rispetto a tutti i dispositivi testati
» 45% di tutti i dispositivi testati in questa classe è stato migliore, 7% similare, 48% peggiore
» Il migliore ha avuto un delta di 4%, medio di 24%, peggiore di 134%
Gestione dell'energia - Il portatile da gioco con tempi di esecuzione decenti
Consumo di energia
Il consumo energetico del computer portatile Medion è normale per l'hardware installato. Il test e lo stress test sono stati eseguiti con un consumo di energia costante o relativamente costante Witcher 3 test e lo stress test sono stati eseguiti con un consumo di energia costante o relativamente costante. L'alimentatore (280 watt) è sufficientemente dimensionato.
| Off / Standby | |
| Idle | |
| Sotto carico |
|
Leggenda:
min: | |
| Medion Erazer Defender P40 i7-13700HX, NVIDIA GeForce RTX 4060 Laptop GPU, Phison PS5021-E21 1TB, IPS, 2560x1440, 17.3" | MSI Katana 17 B13VFK i7-13620H, NVIDIA GeForce RTX 4060 Laptop GPU, Micron 2400 MTFDKBA1T0QFM, IPS LED, 1920x1080, 17.3" | Acer Predator Helios 300 (i7-12700H, RTX 3070 Ti) i7-12700H, GeForce RTX 3070 Ti Laptop GPU, Samsung PM9A1 MZVL21T0HCLR, IPS, 2560x1440, 17.3" | Lenovo Legion Pro 5 16IRX8 i7-13700HX, NVIDIA GeForce RTX 4060 Laptop GPU, SK hynix PC801 HFS512GEJ9X115N, IPS, 2560x1600, 16" | Asus TUF Gaming A16 FA617 R7 7735HS, Radeon RX 7600S, Micron 2400 MTFDKBA1T0QFM, IPS-Level, 1920x1200, 16" | Gigabyte G7 KE i5-12500H, GeForce RTX 3060 Laptop GPU, Gigabyte AG470S1TB-SI B10, IPS, 1920x1080, 17.3" | Media NVIDIA GeForce RTX 4060 Laptop GPU | Media della classe Gaming | |
|---|---|---|---|---|---|---|---|---|
| Power Consumption | -1% | -40% | -71% | 13% | -24% | -11% | -37% | |
| Idle Minimum * | 8 | 12.2 -53% | 15 -88% | 24.5 -206% | 8 -0% | 15 -88% | 11.5 ? -44% | 14 ? -75% |
| Idle Average * | 12 | 14.9 -24% | 20 -67% | 29.2 -143% | 11 8% | 17 -42% | 16 ? -33% | 19.9 ? -66% |
| Idle Maximum * | 18 | 15.8 12% | 22.3 -24% | 34.3 -91% | 16 11% | 24 -33% | 20.3 ? -13% | 27.4 ? -52% |
| Load Average * | 101 | 85.22 16% | 133 -32% | 98.7 2% | 97 4% | 111 -10% | 92.9 ? 8% | 104.9 ? -4% |
| Witcher 3 ultra * | 180.8 | 151.1 16% | 231 -28% | 178.6 1% | 161.5 11% | 174.1 4% | ||
| Load Maximum * | 284 | 212.8 25% | 290 -2% | 249.6 12% | 168 41% | 208 27% | 210 ? 26% | 251 ? 12% |
* ... Meglio usare valori piccoli
Power consumption Witcher 3 / stress test
Power consumption with external monitor
Durata della batteria
Il portatile da 17,3 pollici ha raggiunto tempi di esecuzione di 6:13 ore e 5:39 ore rispettivamente nel test WLAN (richiamo di siti web tramite uno script) e nel test video (breve film Big Buck Bunny (codifica H.264, FHD) in loop). Durante entrambi i test, le funzioni di risparmio energetico del dispositivo erano disattivate e la luminosità del display era impostata a circa 150 cd/m². Anche i moduli wireless sono stati disattivati per il test video.
Nel complesso, il P40 ha raggiunto tassi di resistenza molto buoni. Si è posizionato nella fascia media dei dispositivi di confronto. Nessuno dei computer è riuscito ad essere all'altezza degli eccellenti tempi di esecuzione dell'Asus TUF Gaming A16 Asus TUF Gaming A16. Quest'ultimo beneficia della combinazione di una APU frugale e di una batteria di grande capacità.
| Medion Erazer Defender P40 i7-13700HX, NVIDIA GeForce RTX 4060 Laptop GPU, 73 Wh | MSI Katana 17 B13VFK i7-13620H, NVIDIA GeForce RTX 4060 Laptop GPU, 53.5 Wh | Acer Predator Helios 300 (i7-12700H, RTX 3070 Ti) i7-12700H, GeForce RTX 3070 Ti Laptop GPU, 90 Wh | Lenovo Legion Pro 5 16IRX8 i7-13700HX, NVIDIA GeForce RTX 4060 Laptop GPU, 80 Wh | Asus TUF Gaming A16 FA617 R7 7735HS, Radeon RX 7600S, 90 Wh | Gigabyte G7 KE i5-12500H, GeForce RTX 3060 Laptop GPU, 54 Wh | Media della classe Gaming | |
|---|---|---|---|---|---|---|---|
| Autonomia della batteria | -39% | 13% | -38% | 81% | -24% | 14% | |
| Reader / Idle | 528 | 401 -24% | 1212 130% | 425 -20% | 569 ? 8% | ||
| H.264 | 339 | 354 4% | 132 -61% | 453 ? 34% | |||
| WiFi v1.3 | 373 | 176 -53% | 362 -3% | 205 -45% | 724 94% | 317 -15% | 385 ? 3% |
| Load | 76 | 58 -24% | 105 38% | 41 -46% | 90 18% | 76 0% | 84.2 ? 11% |
Pro
Contro
Verdetto - Un prodotto ben assortito
Il P40 è adatto per i giochi in QHD con impostazioni elevate o massime, ma il portatile dovrebbe essere ottimo per l'uso in molti altri settori (editing video, rendering) grazie al suoCore i7-13700HXeGeForce RTX 4060. La CPU e la GPU funzionano con velocità di clock costantemente elevate e la veloce unità SSD PCIe 4 (1 TB) garantisce tempi di caricamento rapidi.
Erazer Defender P40 di Medion è un portatile da gioco QHD di fascia media ben equipaggiato.
Il portatile non si scalda particolarmente sotto carico, ma può diventare rumoroso. Per compensare questo problema, il dispositivo dispone di una "modalità silenziosa", a scapito delle prestazioni di elaborazione. Questa modalità consente di giocare in modo più silenzioso (ma non del tutto).
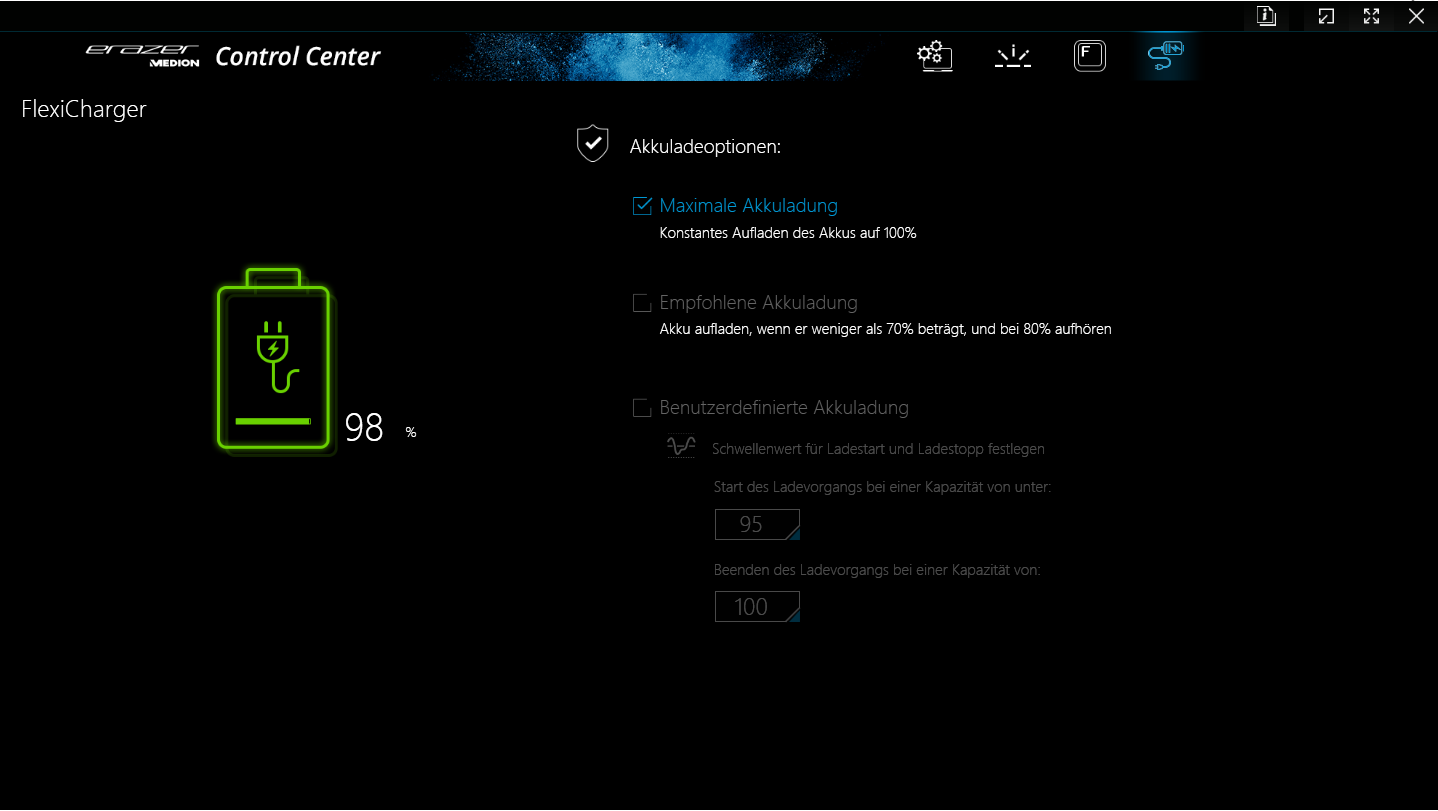
Una carica della batteria (73 Wh) significa che è possibile ottenere realisticamente un'autonomia di 5,5-6,5 ore - abbastanza decente. La batteria non può essere ricaricata tramite un caricatore USB-C, ma è necessario utilizzare l'ingombrante alimentatore fornito con il portatile. Nel complesso, il display opaco da 17,3 pollici (QHD, IPS, 240 Hz, sRGB) ci ha lasciato una buona impressione.
IlMSI Katana 17ci viene in mente come possibile alternativa al P40. Offre prestazioni simili, ma tempi di esecuzione peggiori. IlGigabyte G7 KEè un'alternativa leggermente più economica: a circa 1.000 dollari (senza Windows), consente di giocare in FHD con impostazioni elevate o massime.
Prezzo e disponibilità
Il Medion Erazer Defender P40 ha un prezzo di vendita di circa 1.900 dollari. Al momento dell'acquisto, non siamo riusciti a trovare il portatile in vendita presso i principali rivenditori online negli Stati Uniti, tuttavia è possibile controllare dispositivi simili come l'MSI Katana 17 o l'Acer Predator Helios 300 su Amazon.
Medion Erazer Defender P40
- 05/24/2023 v7 (old)
Sascha Mölck
Transparency
La selezione dei dispositivi da recensire viene effettuata dalla nostra redazione. Il campione di prova è stato fornito all'autore come prestito dal produttore o dal rivenditore ai fini di questa recensione. L'istituto di credito non ha avuto alcuna influenza su questa recensione, né il produttore ne ha ricevuto una copia prima della pubblicazione. Non vi era alcun obbligo di pubblicare questa recensione. Non accettiamo mai compensi o pagamenti in cambio delle nostre recensioni. In quanto società mediatica indipendente, Notebookcheck non è soggetta all'autorità di produttori, rivenditori o editori.
Ecco come Notebookcheck esegue i test
Ogni anno, Notebookcheck esamina in modo indipendente centinaia di laptop e smartphone utilizzando procedure standardizzate per garantire che tutti i risultati siano comparabili. Da circa 20 anni sviluppiamo continuamente i nostri metodi di prova e nel frattempo stabiliamo gli standard di settore. Nei nostri laboratori di prova, tecnici ed editori esperti utilizzano apparecchiature di misurazione di alta qualità. Questi test comportano un processo di validazione in più fasi. Il nostro complesso sistema di valutazione si basa su centinaia di misurazioni e parametri di riferimento ben fondati, che mantengono l'obiettività.Price comparison

