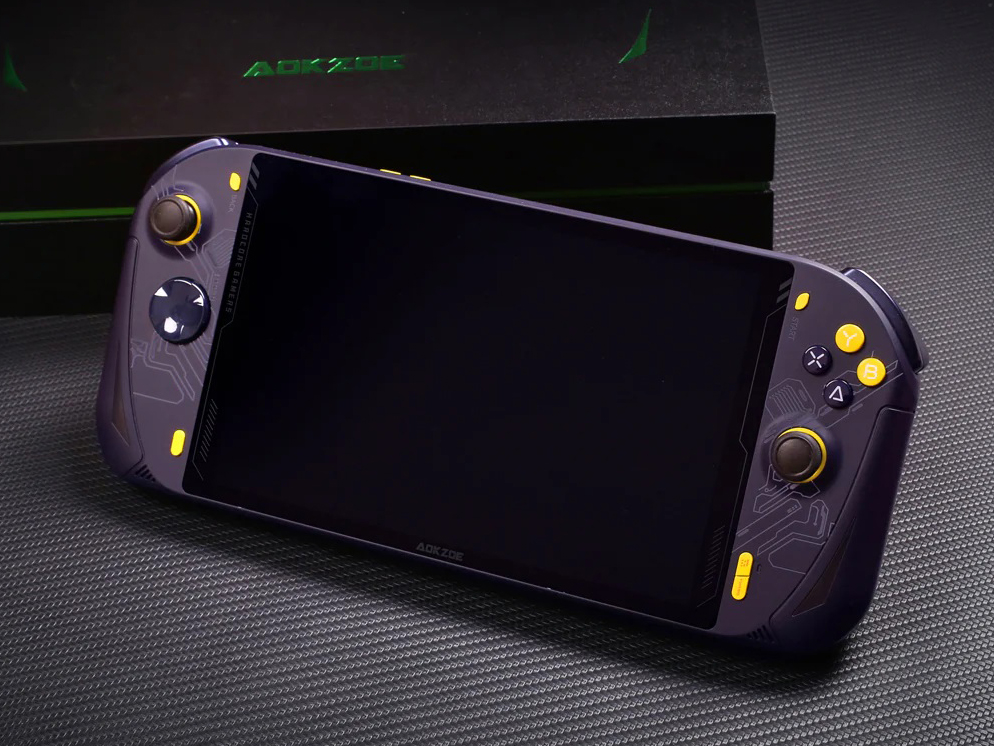
Recensione del palmare gaming Aokzoe A1: Ambizioso con margini di miglioramento

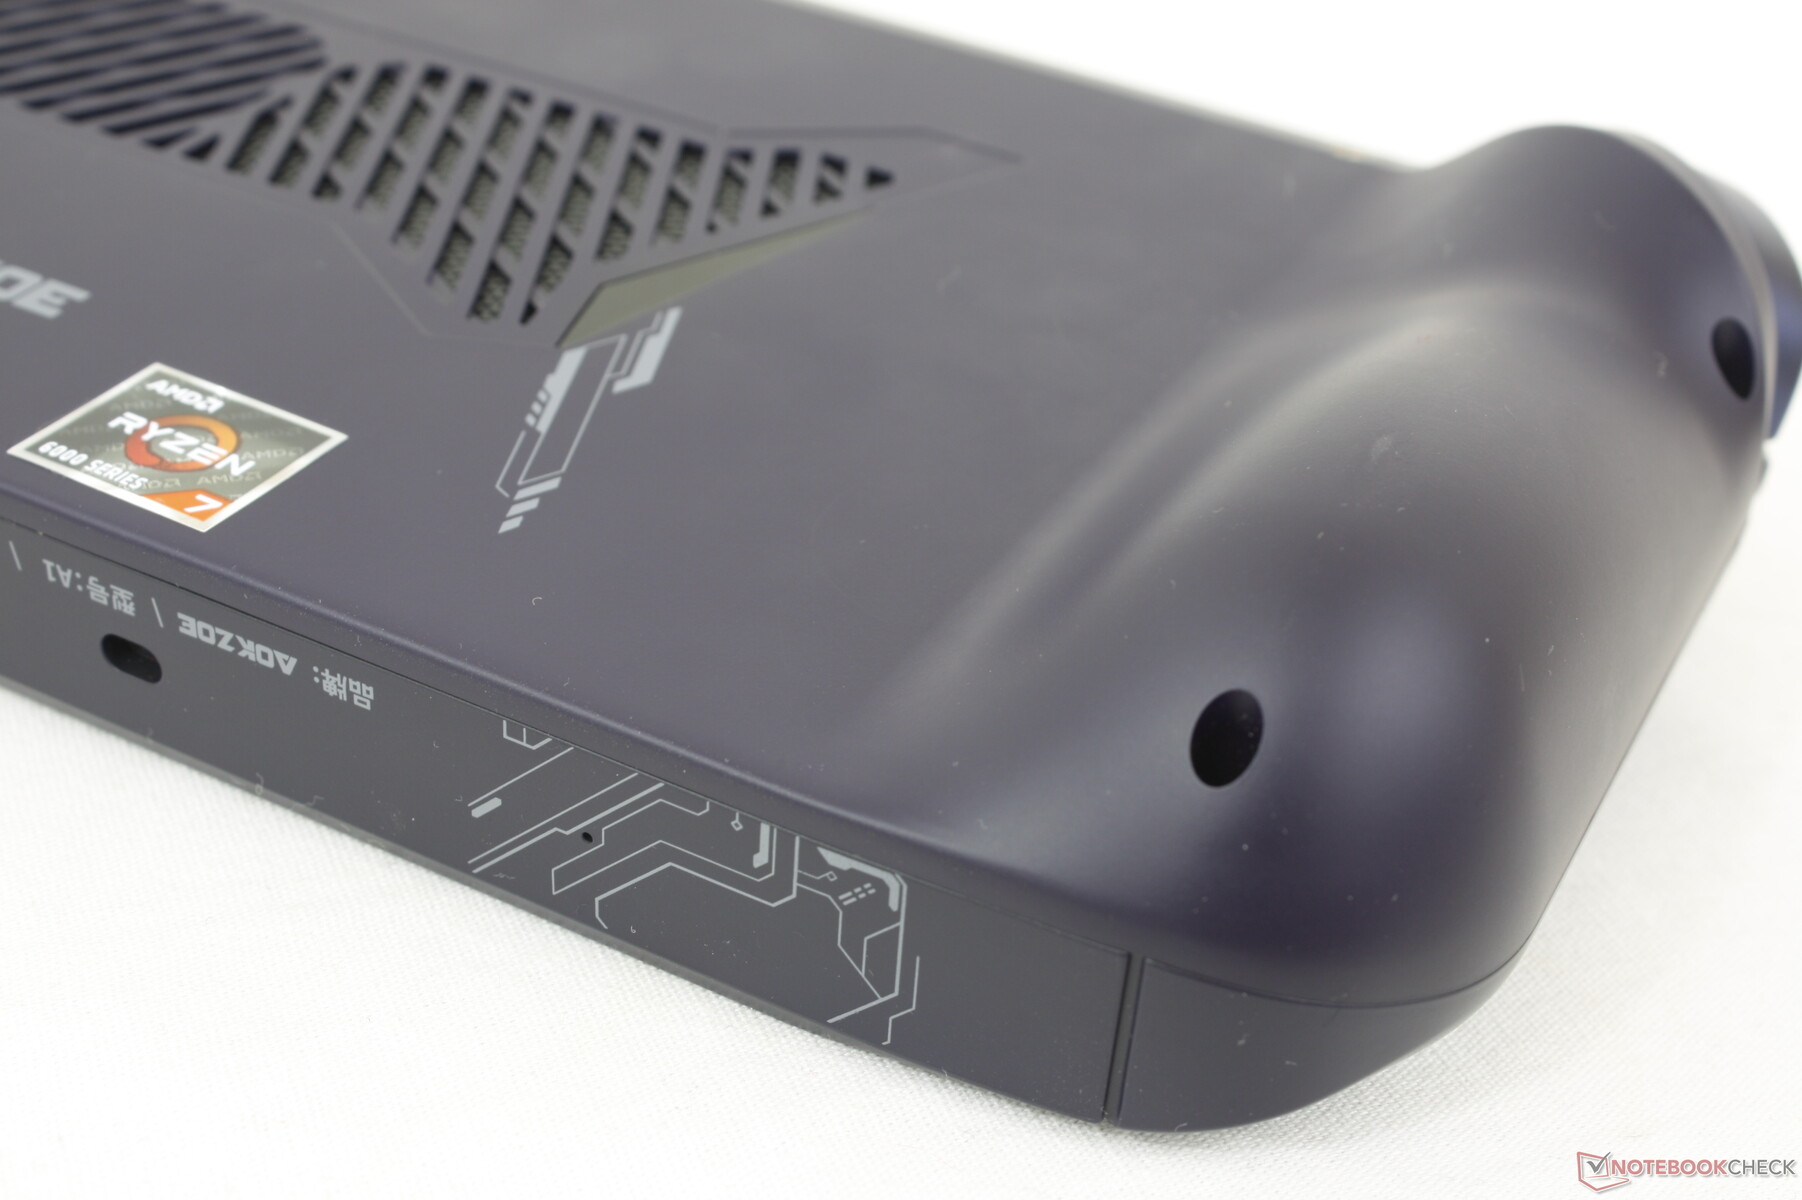
I PC Windows portatili sullo stile del Nintendo Switch stanno rapidamente diventando popolari ora che le CPU e le GPU ULV sono abbastanza potenti da far girare i giochi moderni a risoluzioni di 1080p. L'ultimo nato è l'A1 del produttore cinese Aokzoe con CPU Zen 3+ Ryzen 7 6800U e grafica integrata Radeon 680M, al prezzo di circa 900-1300 dollari al dettaglio. Nelle prossime settimane dovrebbe essere disponibile anche una versione aggiornata chiamata A1 Pro con Zen 4 Ryzen 7 7840U e Radeon 780M, ma sia l'A1 che l'A1 Pro sono fisicamente identici per quanto riguarda il design dello chassis, il display e i controlli.
Tra le alternative all'Aokzoe A1 ci sono altri portatili Windows PC come il GPD Win 4, Steam Deck, OneXPlayer 2o l' Asus ROG Ally.
Potenziali concorrenti a confronto
Punteggio | Data | Modello | Peso | Altezza | Dimensione | Risoluzione | Prezzo |
|---|---|---|---|---|---|---|---|
| 80.1 % v7 (old) | 09/2023 | Aokzoe A1 R7 6800U, Radeon 680M | 735 gr | 21 mm | 8.00" | 1920x1200 | |
| 84 % v7 (old) | One Netbook XPlayer 2 R7 6800U, Radeon 680M | 864 gr | 23 mm | 8.40" | 2560x1600 | ||
| 87.5 % v7 (old) | 05/2023 | Asus ROG Ally Z1 Extreme Z1 Extreme, Radeon 780M | 611 gr | 21.22 mm | 7.00" | 1920x1080 | |
| 80.3 % v7 (old) | 03/2023 | GPD Win 4 R7 6800U, Radeon 680M | 607 gr | 28 mm | 6.00" | 1920x1080 | |
v (old) | 01/2021 | GPD Win 3 i5-1135G7, Iris Xe G7 80EUs | 553 gr | 27 mm | 5.50" | 1280x720 |
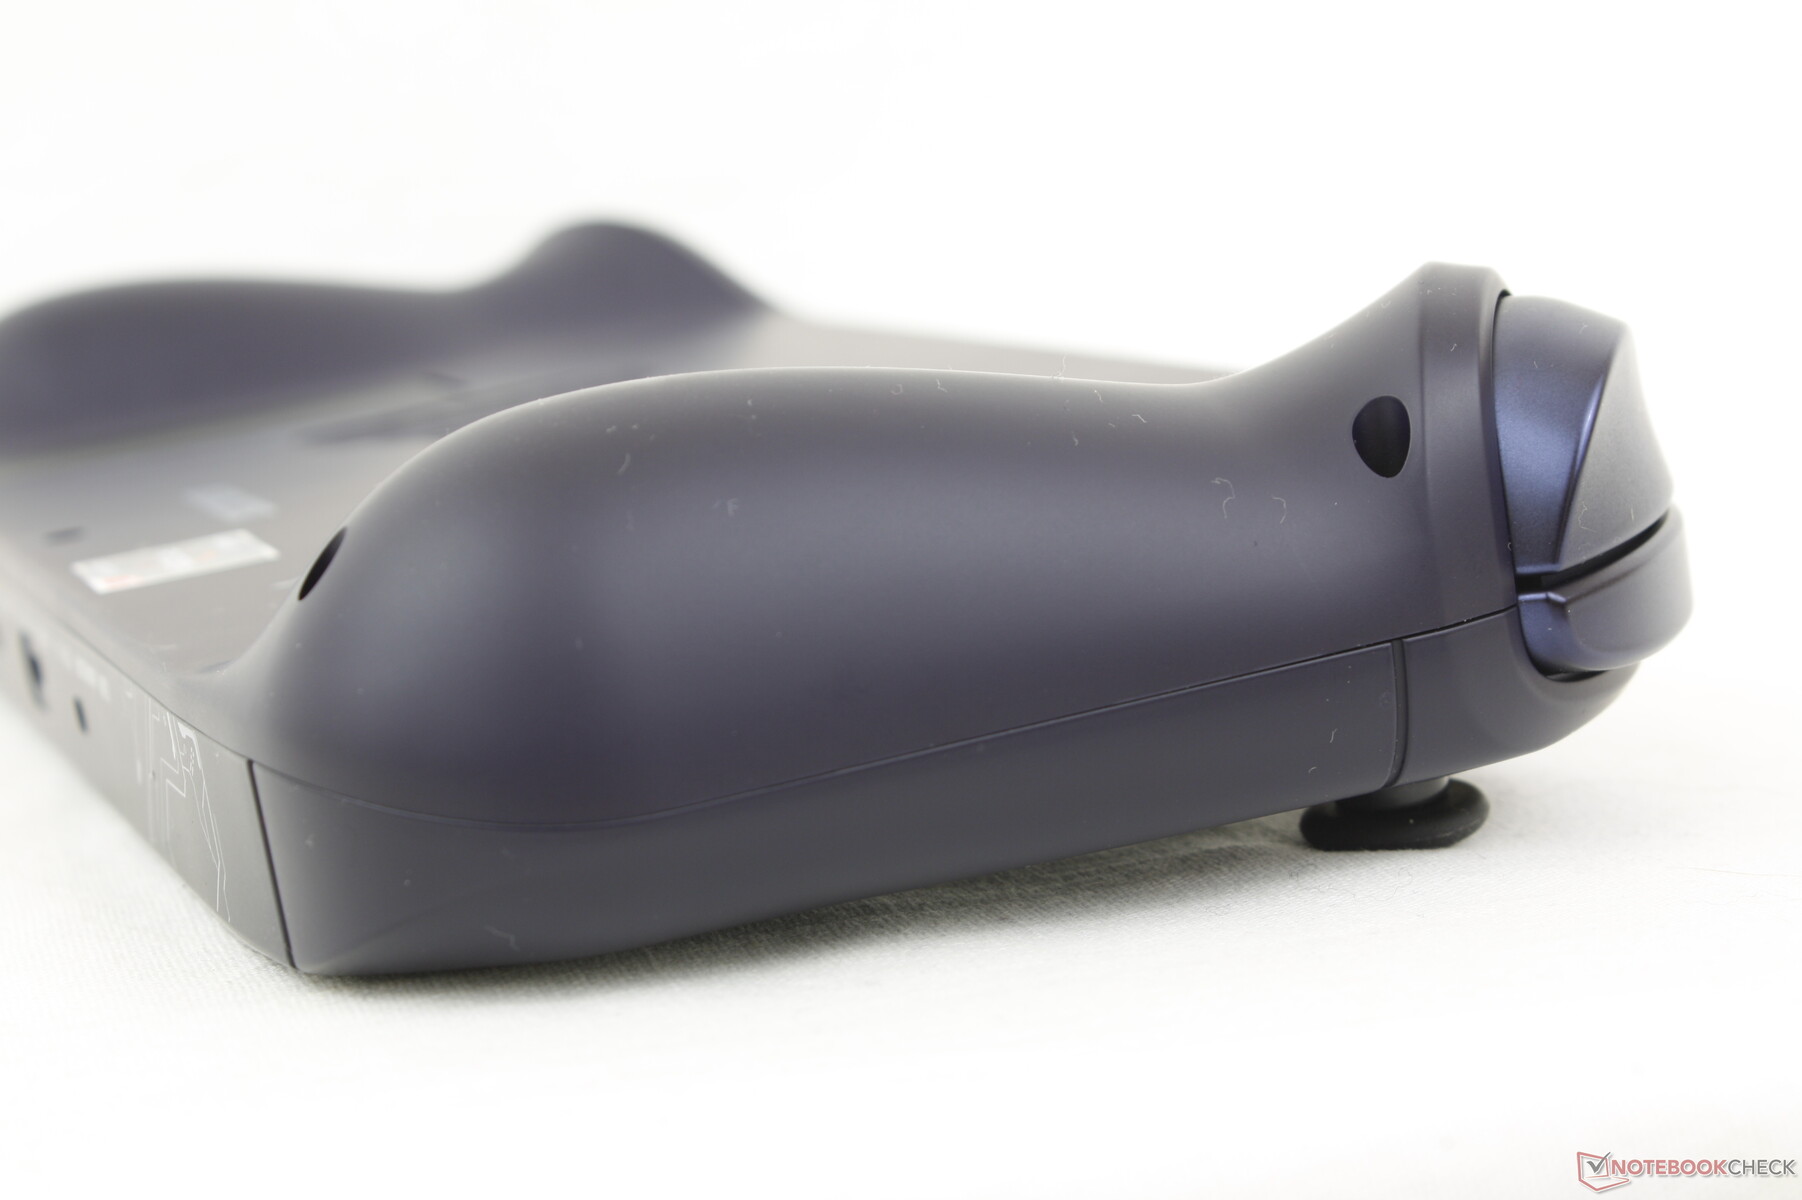
Caso
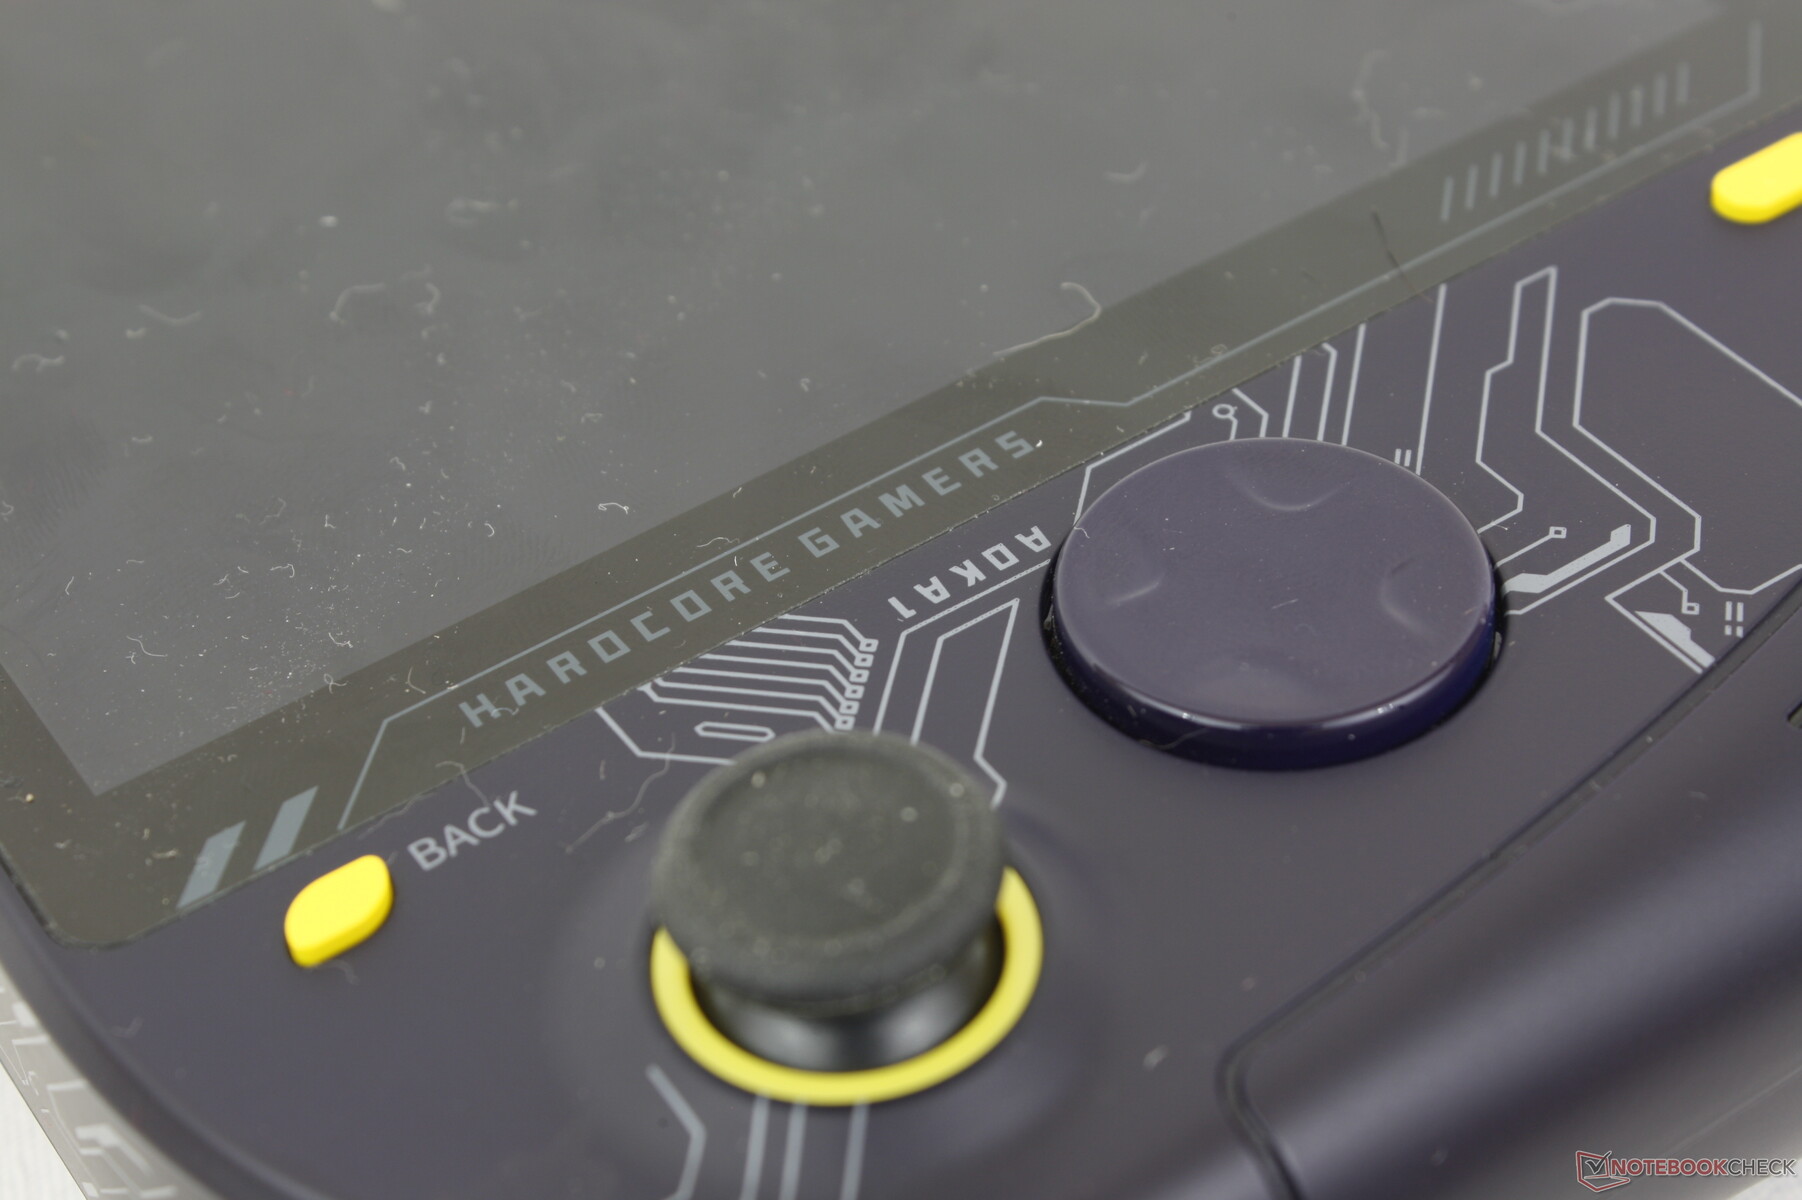
Lo chassis è prevalentemente in plastica, a differenza di quello in metallo del GPD Win 4. La qualità dello chassis è comunque eccellente, senza grandi scricchiolii o torsioni, per una prima impressione solida. La sensazione dei pulsanti, tuttavia, può essere contrastante, come vedremo nel dettaglio nella sezione Input.
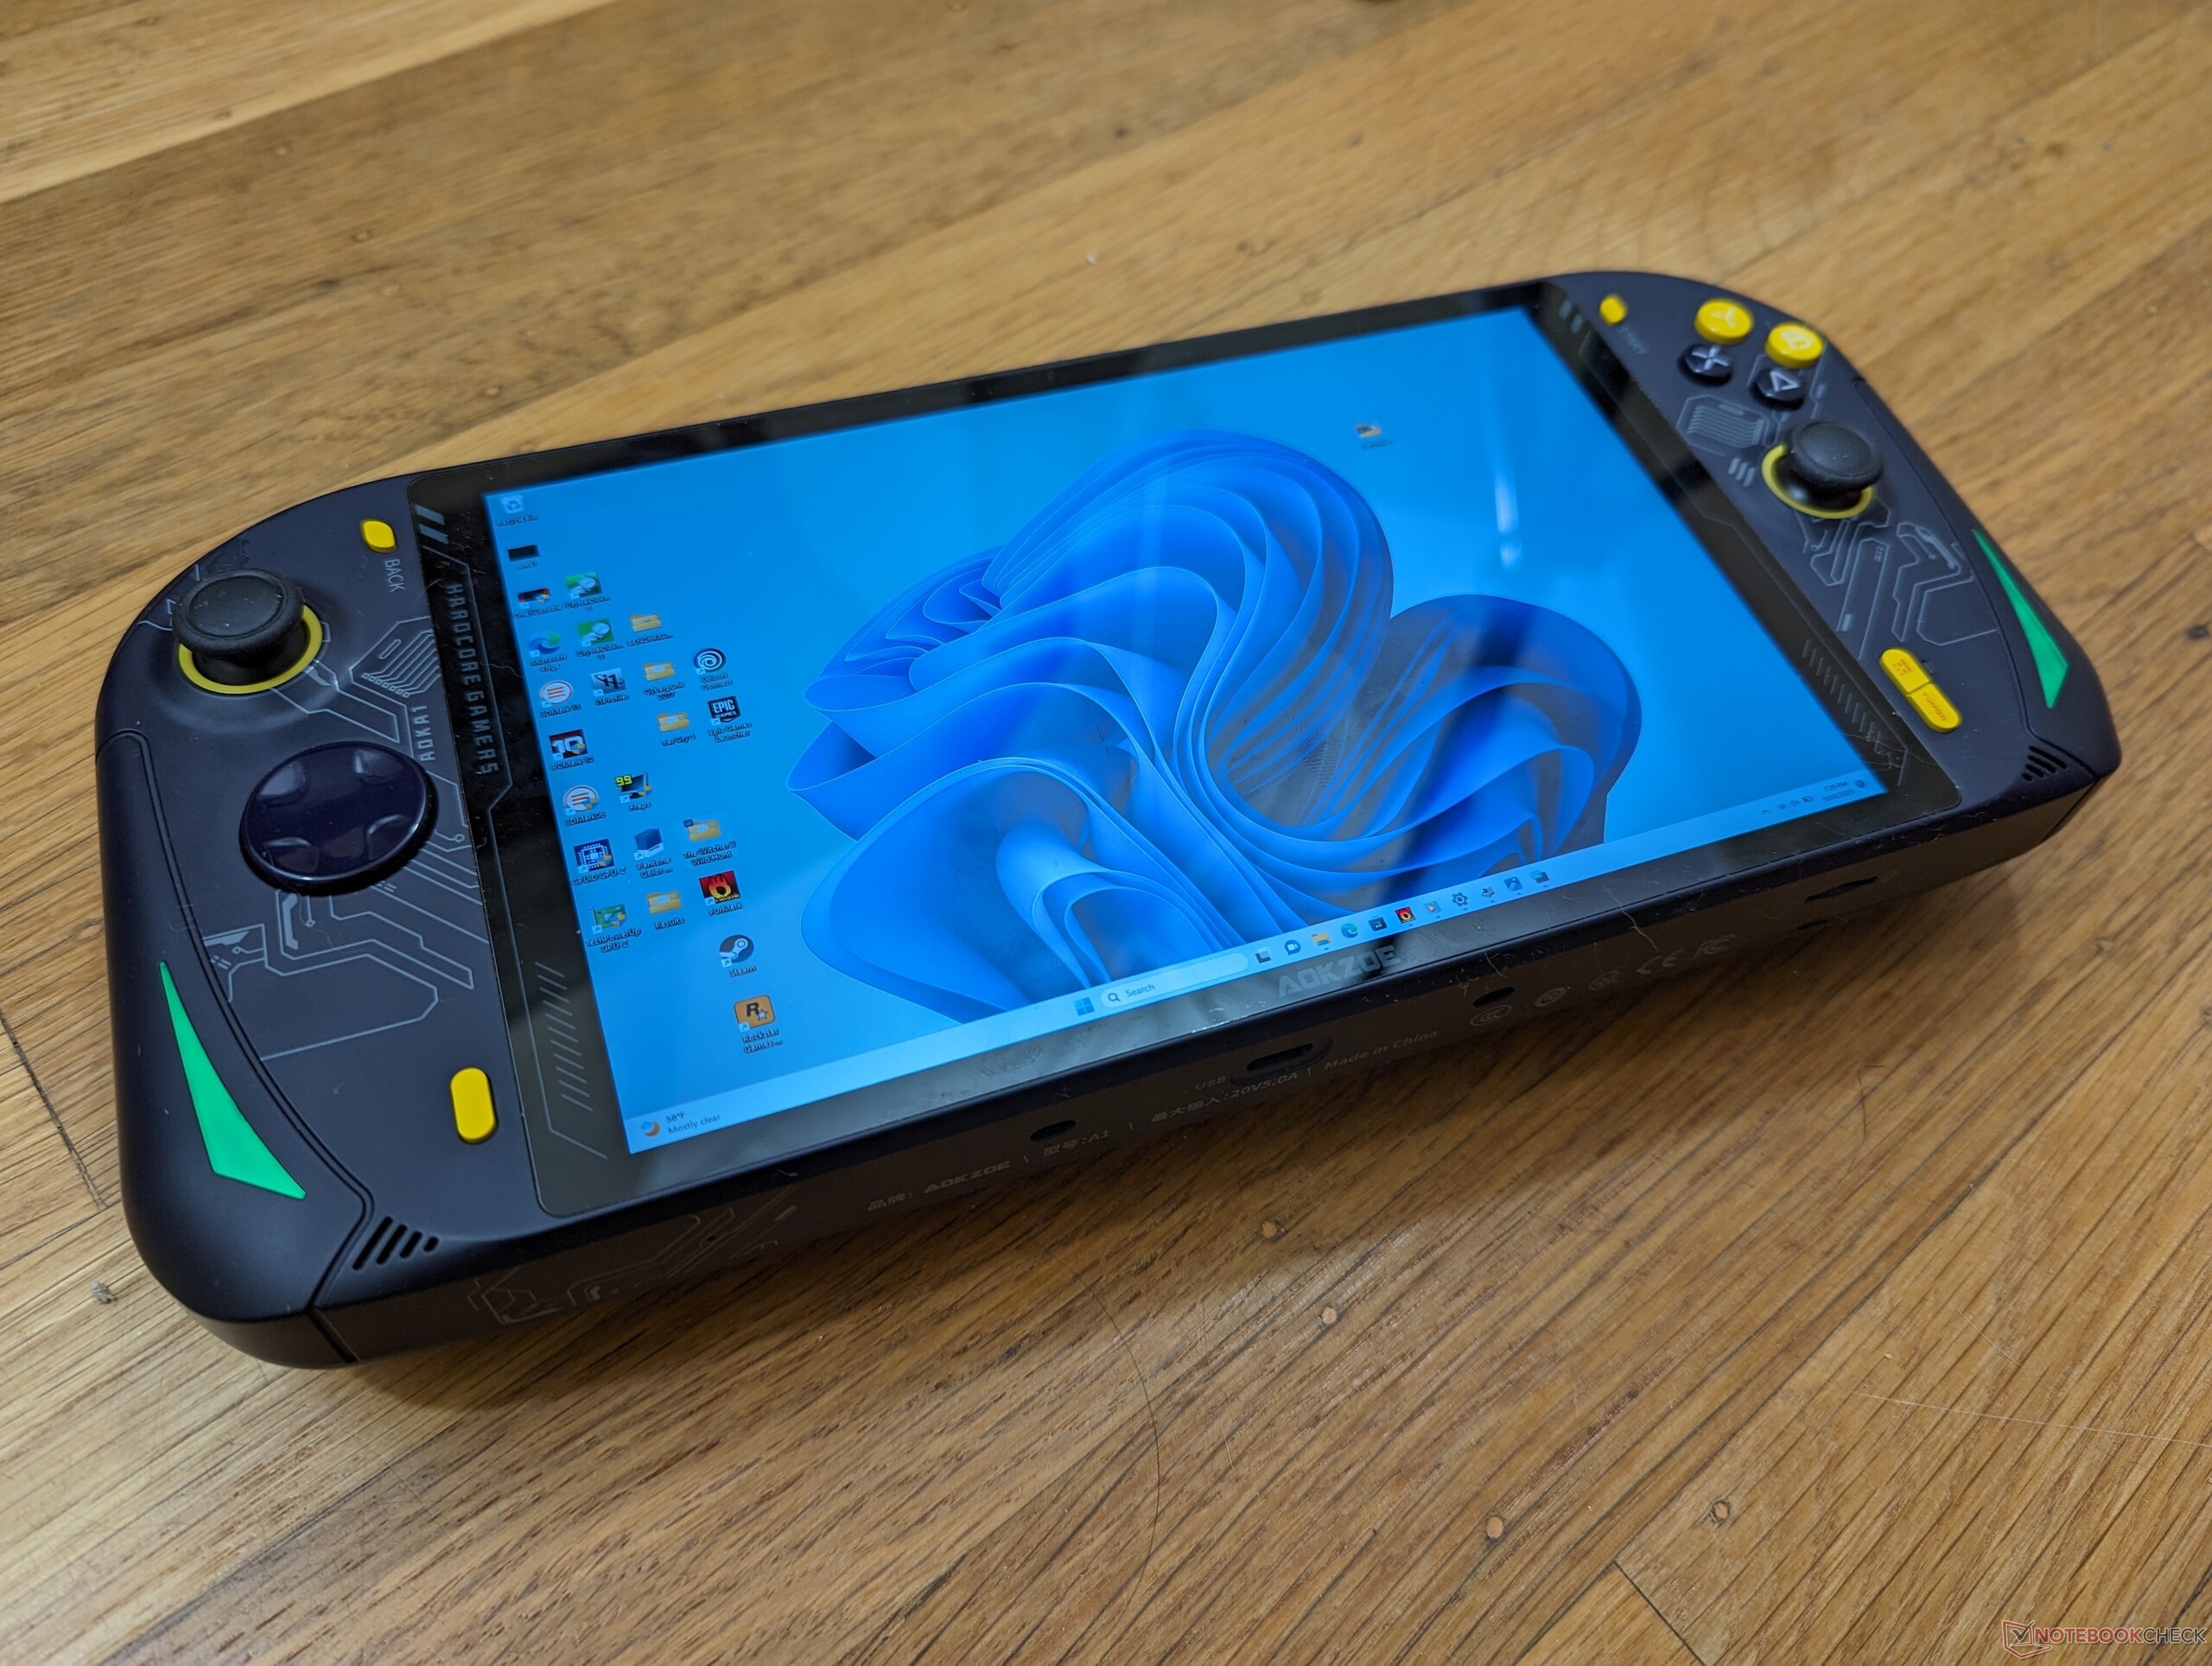
L'A1 è più grande e più pesante di molte alternative, tra cui il ROG Ally, poiché ha uno schermo più grande da 8 pollici. Lo spessore è di circa 41 mm nel punto più spesso, se si includono le impugnature rigonfie, e di soli 21 mm dalla parte anteriore dello schermo a quella posteriore. A causa del suo peso, l'A1 è più adatto per giocare da seduti in treno o in auto piuttosto che in piedi o a piedi.
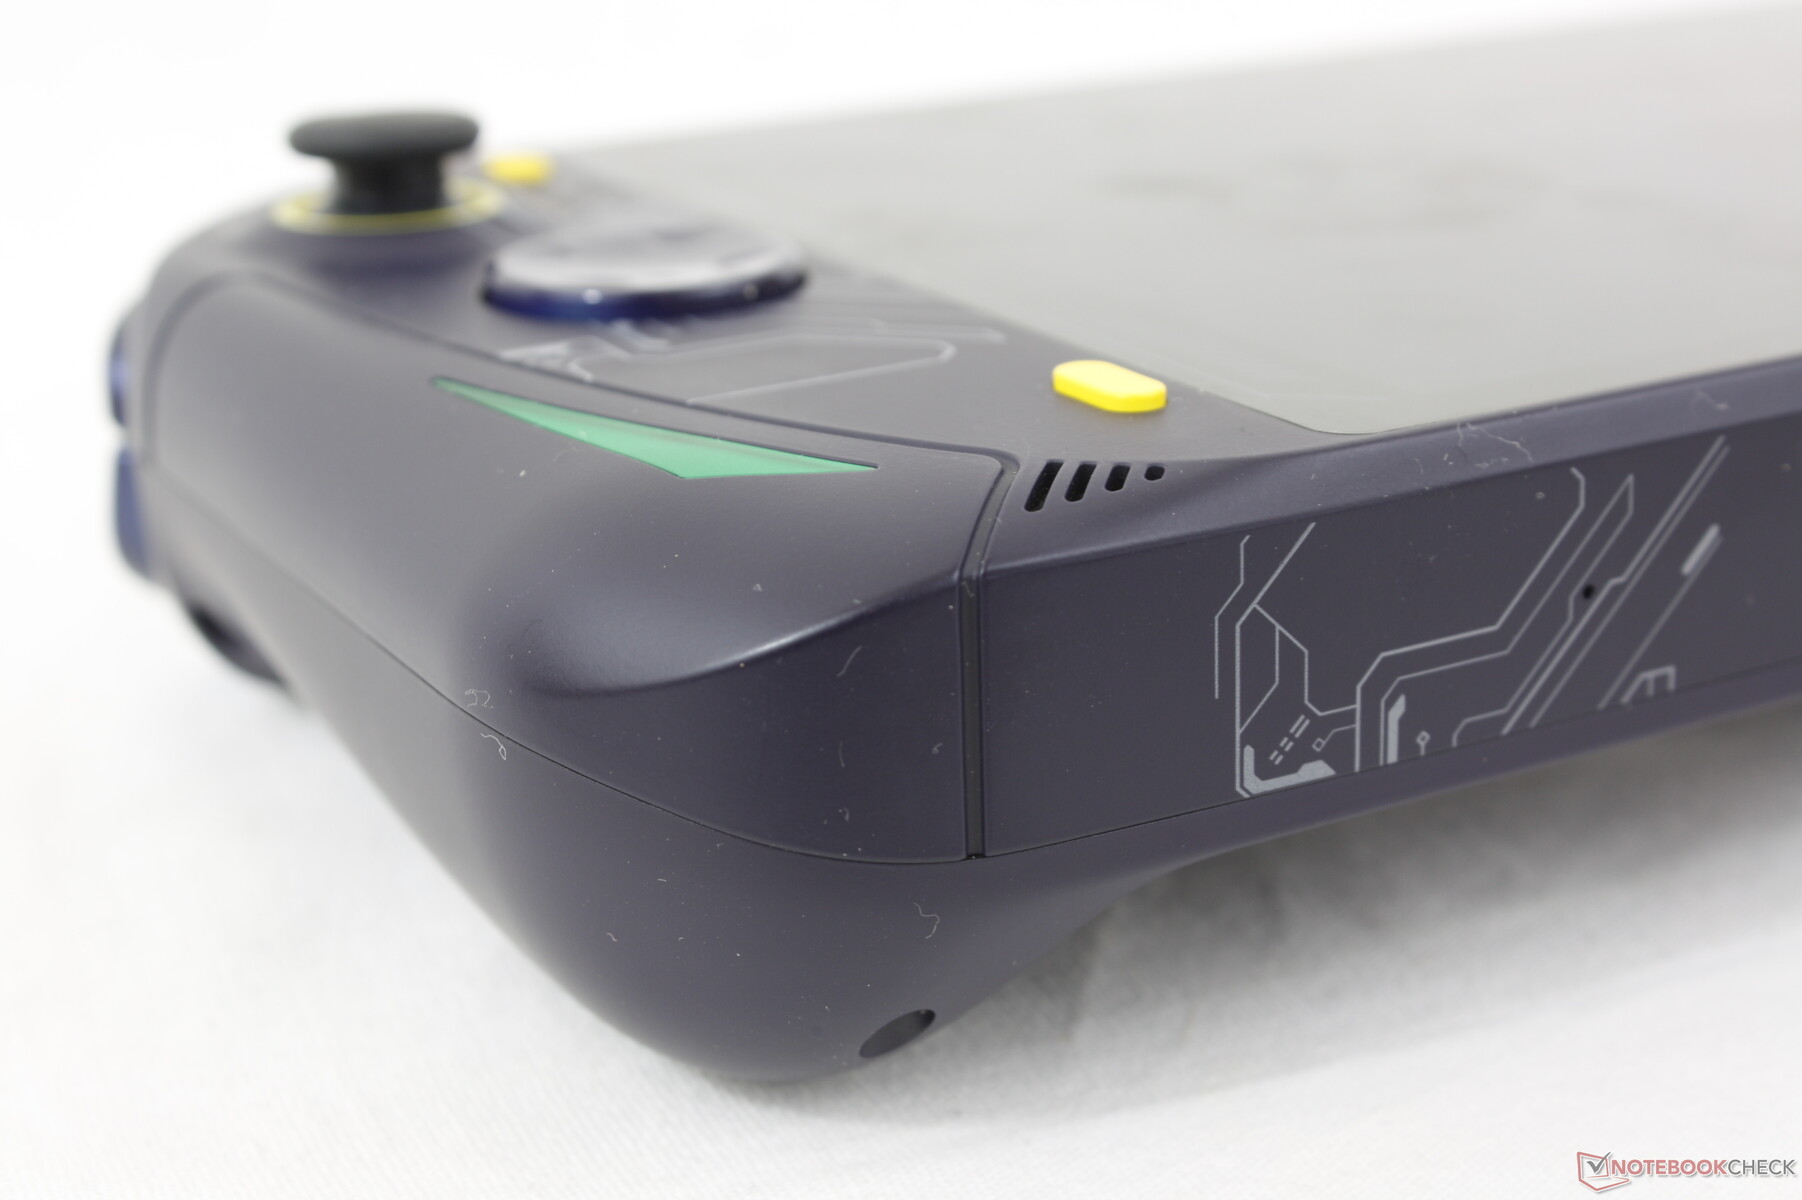
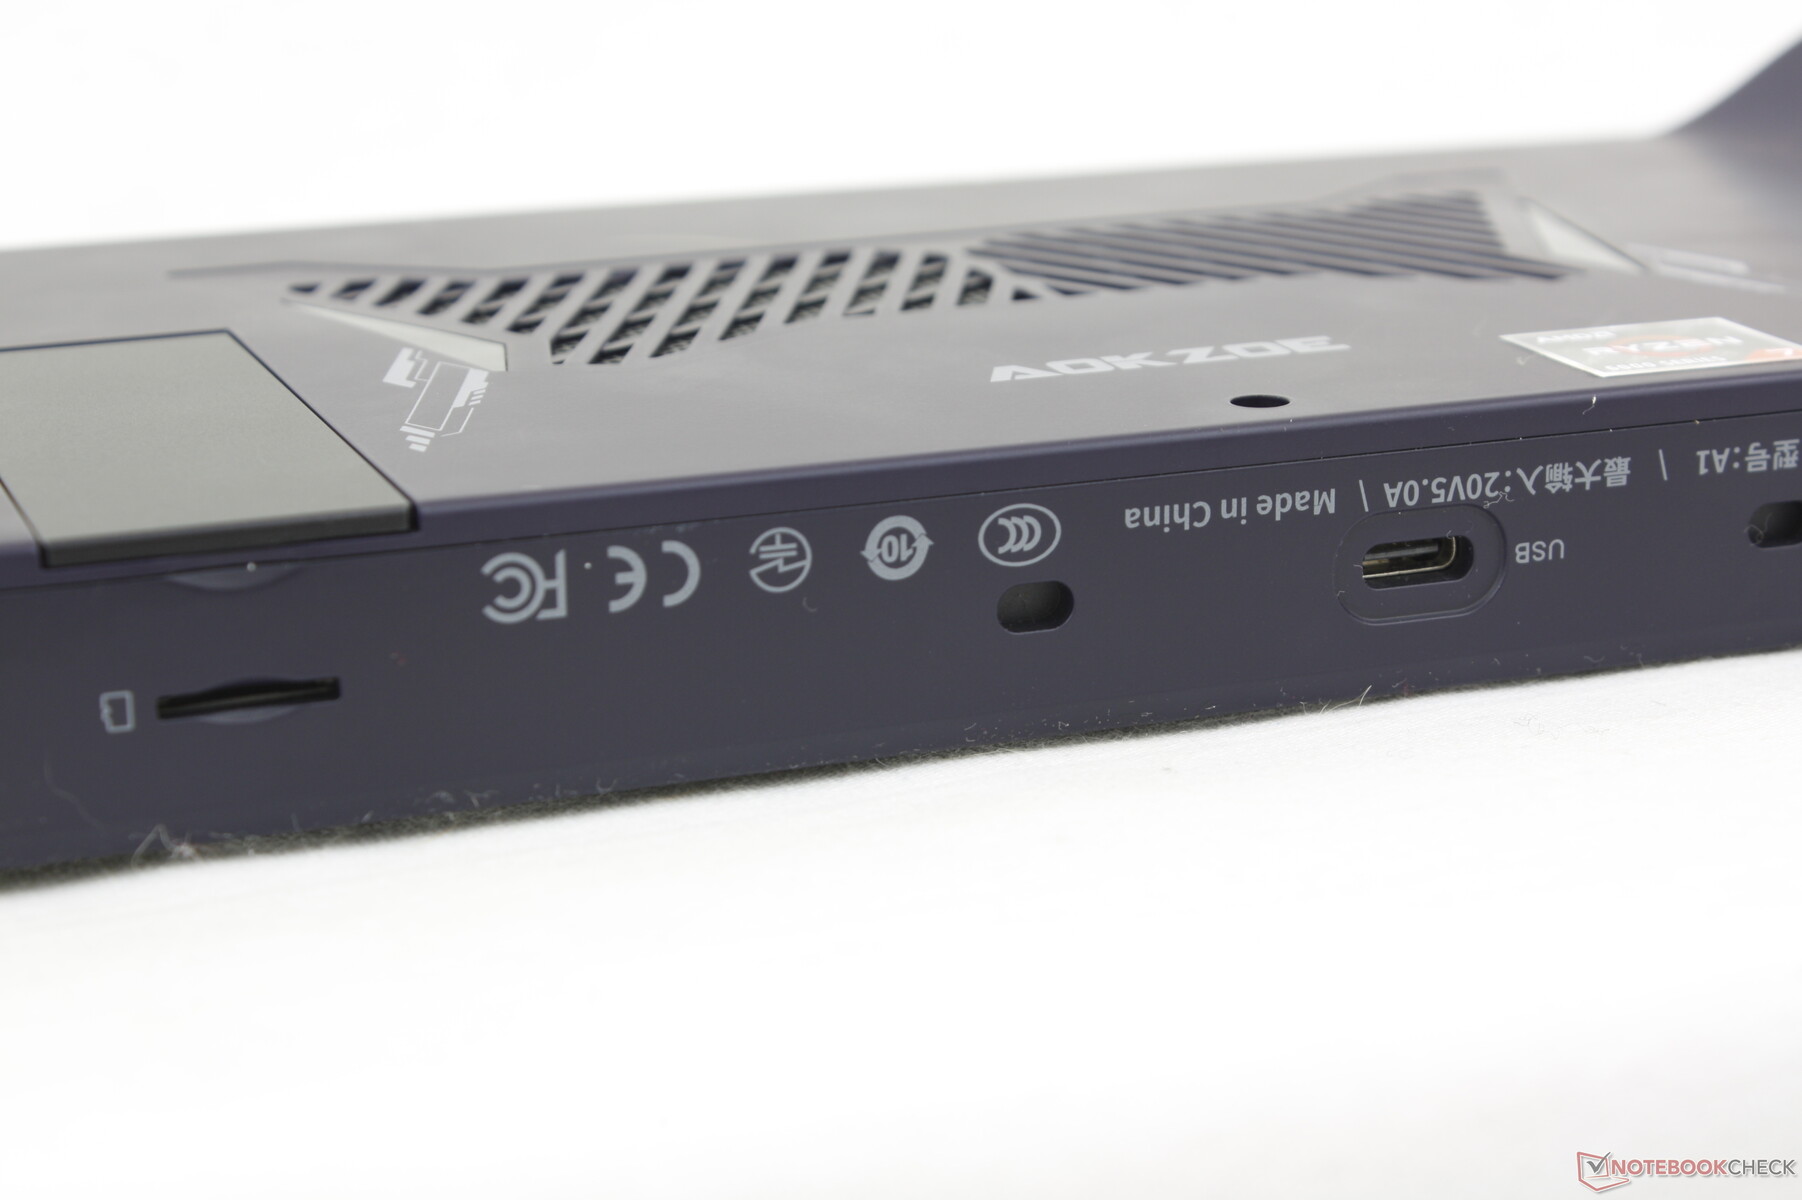
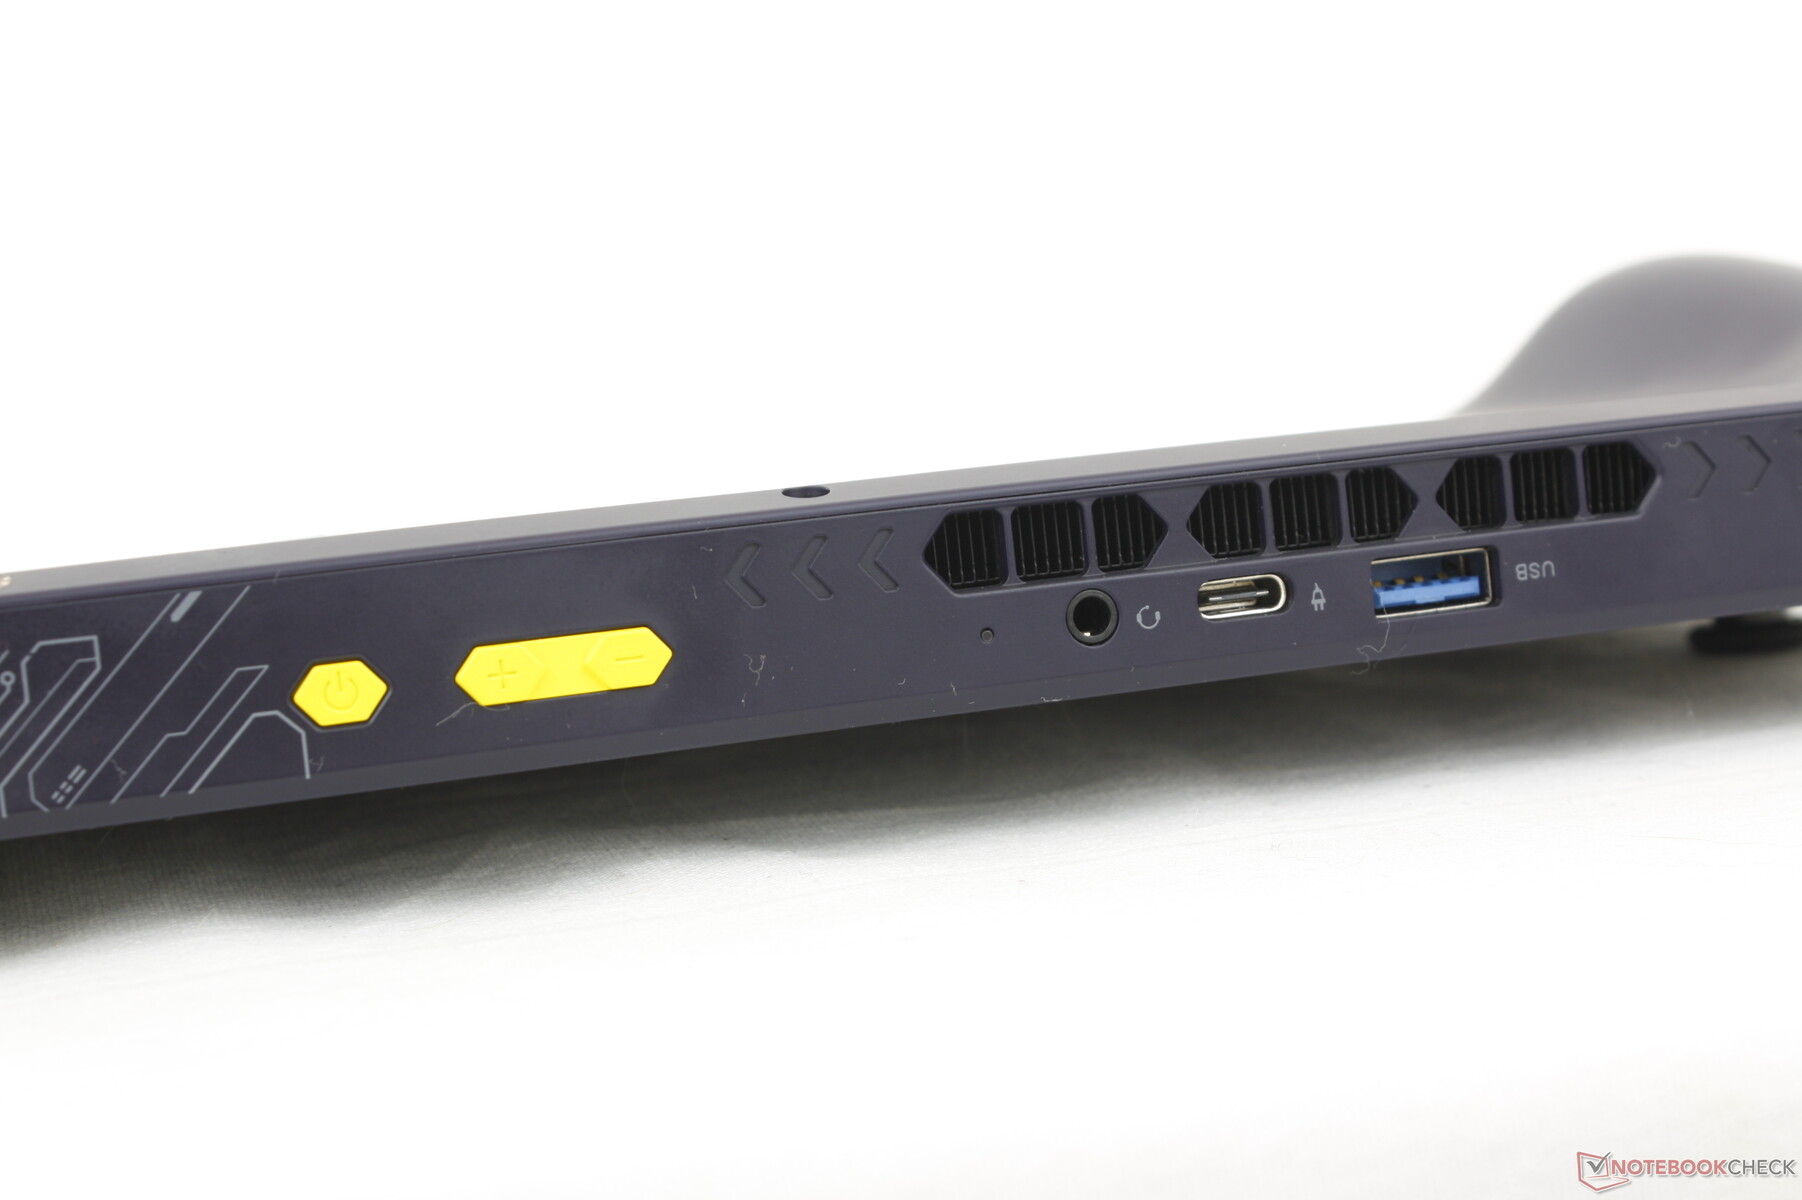
Connettività
Le due porte USB-C sono comodamente posizionate lungo i bordi superiore e inferiore dell'unità. Ciascuna può essere utilizzata per ricaricare il dispositivo o per l'uscita verso un display esterno, mentre solo la porta superiore è compatibile con l'USB4 per le eGPU.
Lettore di schede SD
Mentre le velocità di lettura sono elevate, quasi 200 MB/s con la nostra scheda di prova UHS-II, le velocità di trasferimento sono notevolmente più lente. Per spostare 1 GB di immagini dalla nostra scheda al desktop sono stati necessari quasi 20 secondi, contro i soli 6-7 secondi del ROG Ally.
| SD Card Reader | |
| average JPG Copy Test (av. of 3 runs) | |
| Asus ROG Ally Z1 Extreme (Angelbird AV Pro V60) | |
| One Netbook XPlayer 2 (Angelbird AV Pro V60) | |
| GPD Win 3 (Toshiba Exceria Pro M501 32 GB UHS-II) | |
| GPD Win 4 (AV Pro SD microSD 128 GB V60) | |
| Aokzoe A1 (Angelbird AV Pro V60) | |
| maximum AS SSD Seq Read Test (1GB) | |
| Asus ROG Ally Z1 Extreme (Angelbird AV Pro V60) | |
| One Netbook XPlayer 2 (Angelbird AV Pro V60) | |
| Aokzoe A1 (Angelbird AV Pro V60) | |
| GPD Win 4 (AV Pro SD microSD 128 GB V60) | |
| GPD Win 3 (Toshiba Exceria Pro M501 32 GB UHS-II) | |
Comunicazione
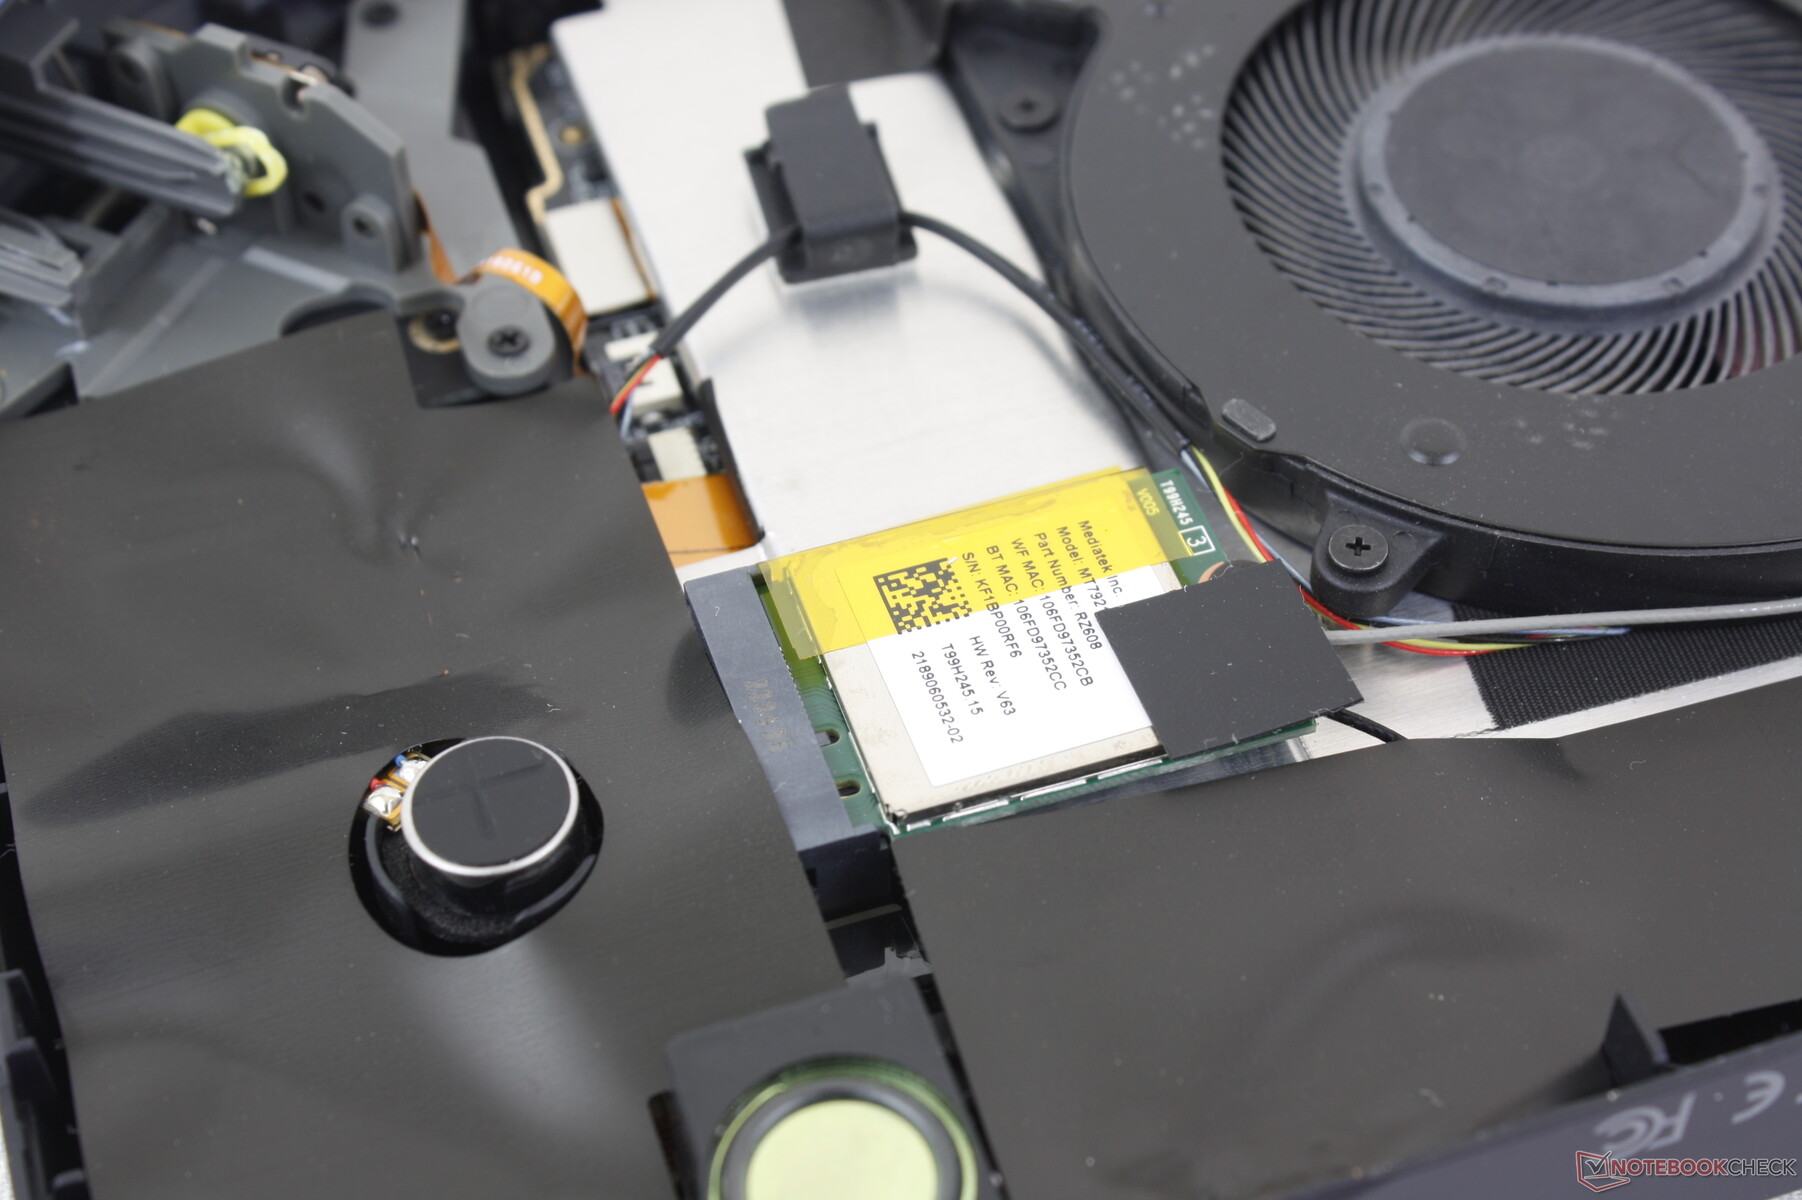
Il MediaTek RZ608 è di serie per la connettività Wi-Fi 6E. Rispetto al Wi-Fi 6, il Wi-Fi 6E offre una latenza più veloce per ridurre il ritardo durante lo streaming dei giochi via cloud. Tuttavia, nella maggior parte degli scenari, la velocità di trasferimento non è necessariamente molto superiore a quella del Wi-Fi 6.
| Networking | |
| iperf3 transmit AX12 | |
| GPD Win 3 | |
| iperf3 receive AX12 | |
| GPD Win 3 | |
| iperf3 transmit AXE11000 | |
| Asus ROG Ally Z1 Extreme | |
| One Netbook XPlayer 2 | |
| Aokzoe A1 | |
| GPD Win 4 | |
| iperf3 receive AXE11000 | |
| Asus ROG Ally Z1 Extreme | |
| One Netbook XPlayer 2 | |
| GPD Win 4 | |
| Aokzoe A1 | |
| iperf3 transmit AXE11000 6GHz | |
| Aokzoe A1 | |
| GPD Win 4 | |
| iperf3 receive AXE11000 6GHz | |
| GPD Win 4 | |
| Aokzoe A1 | |
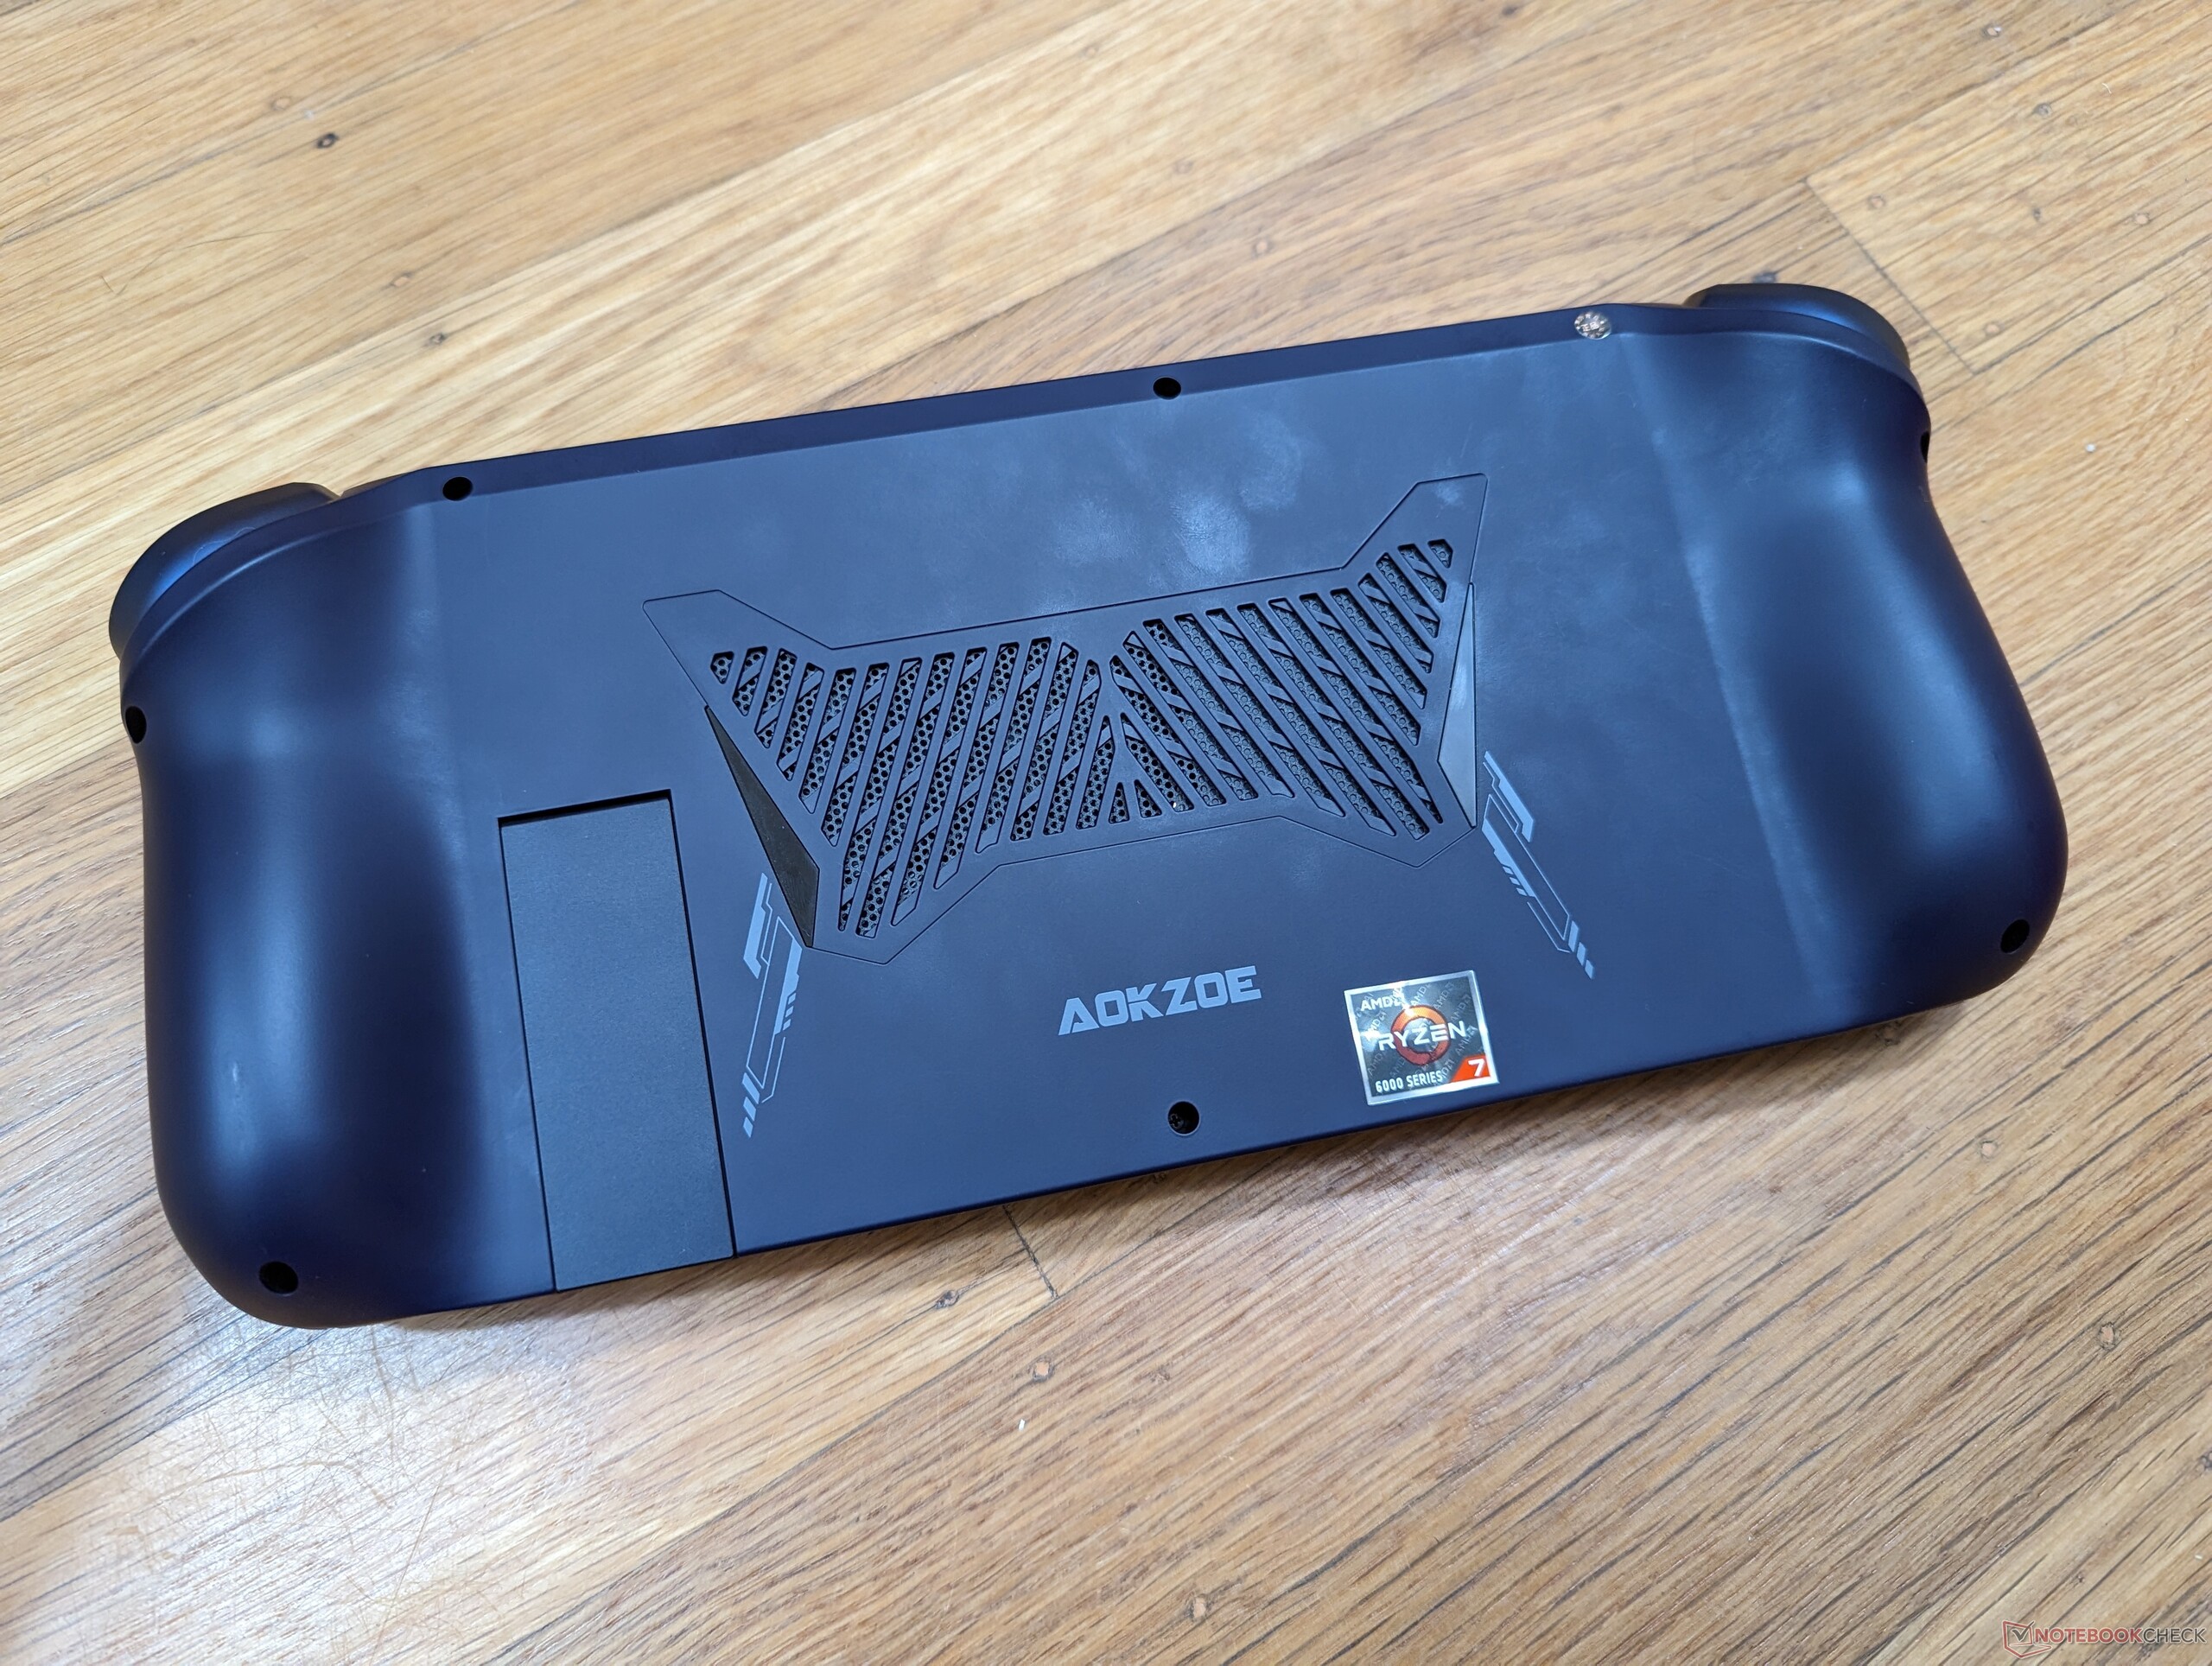
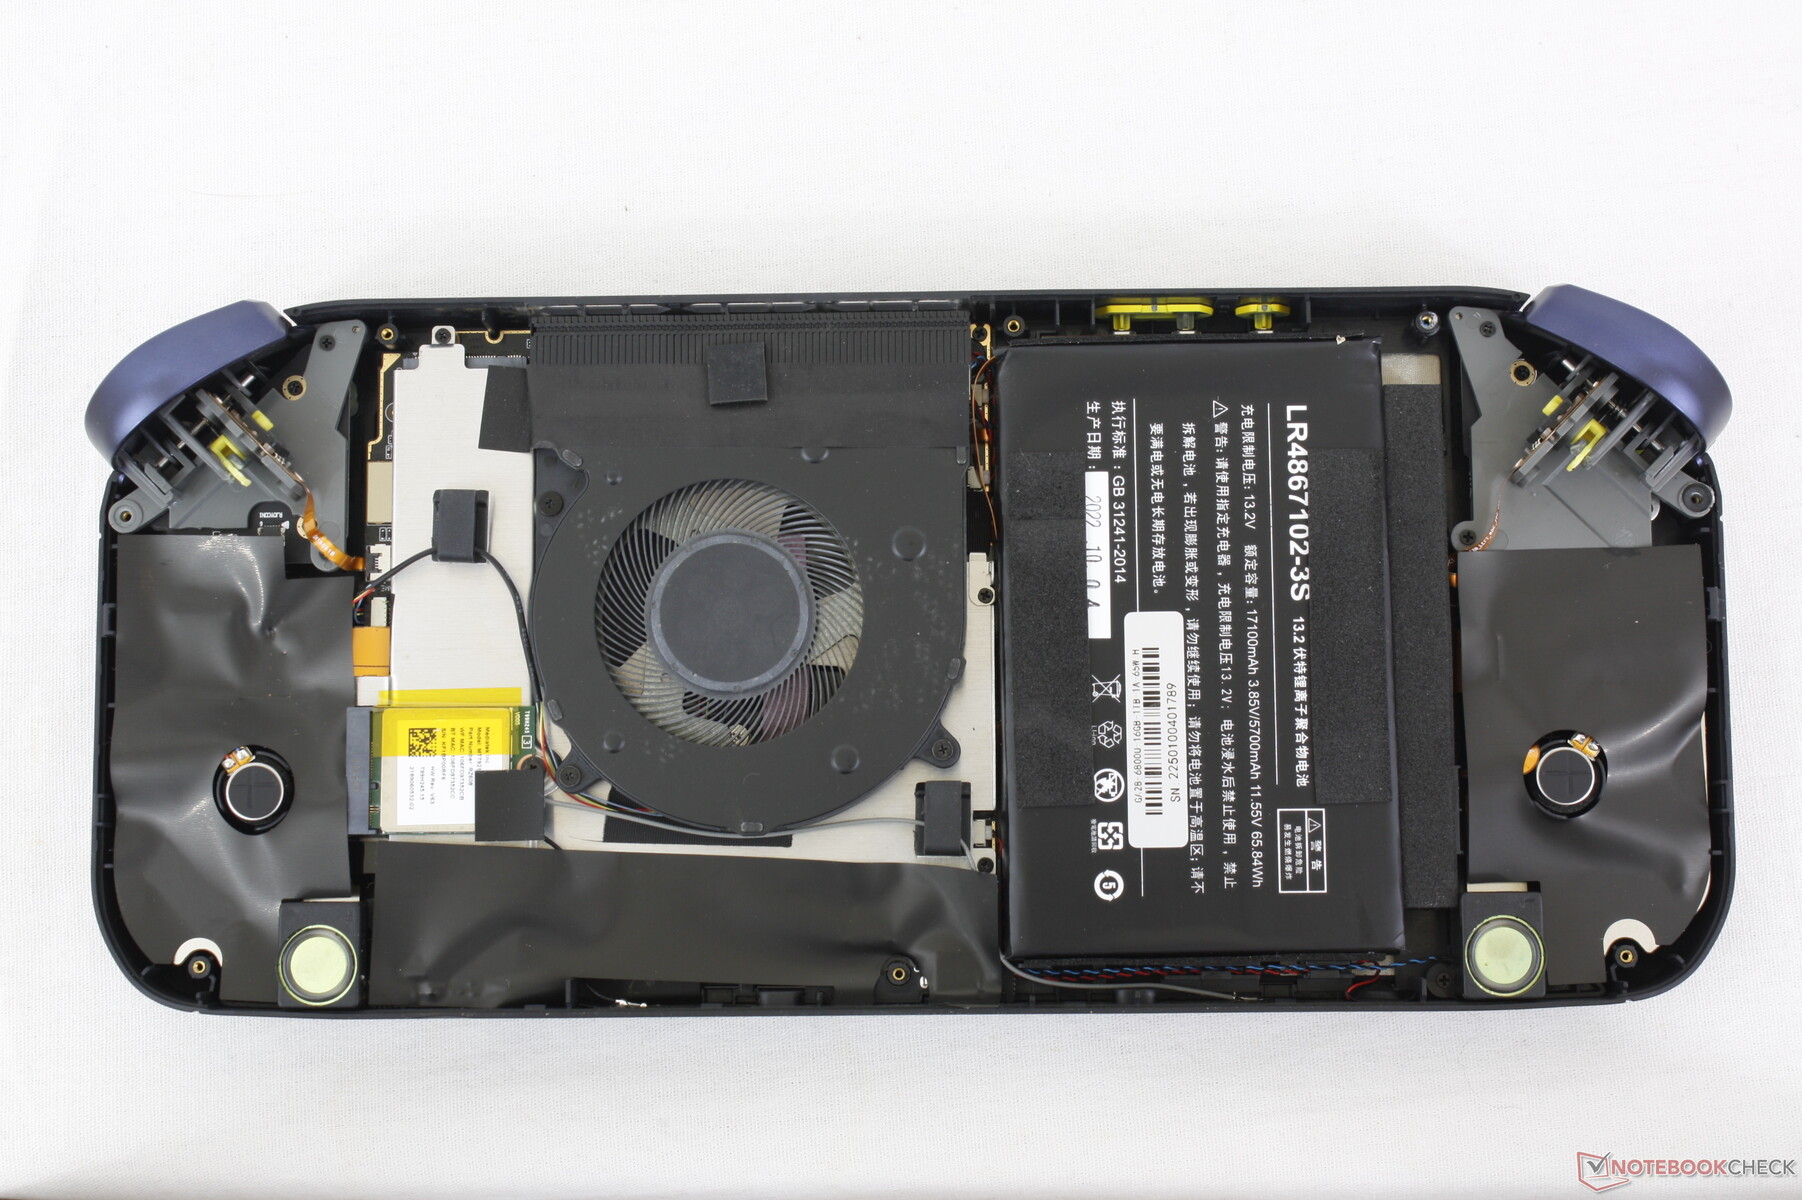
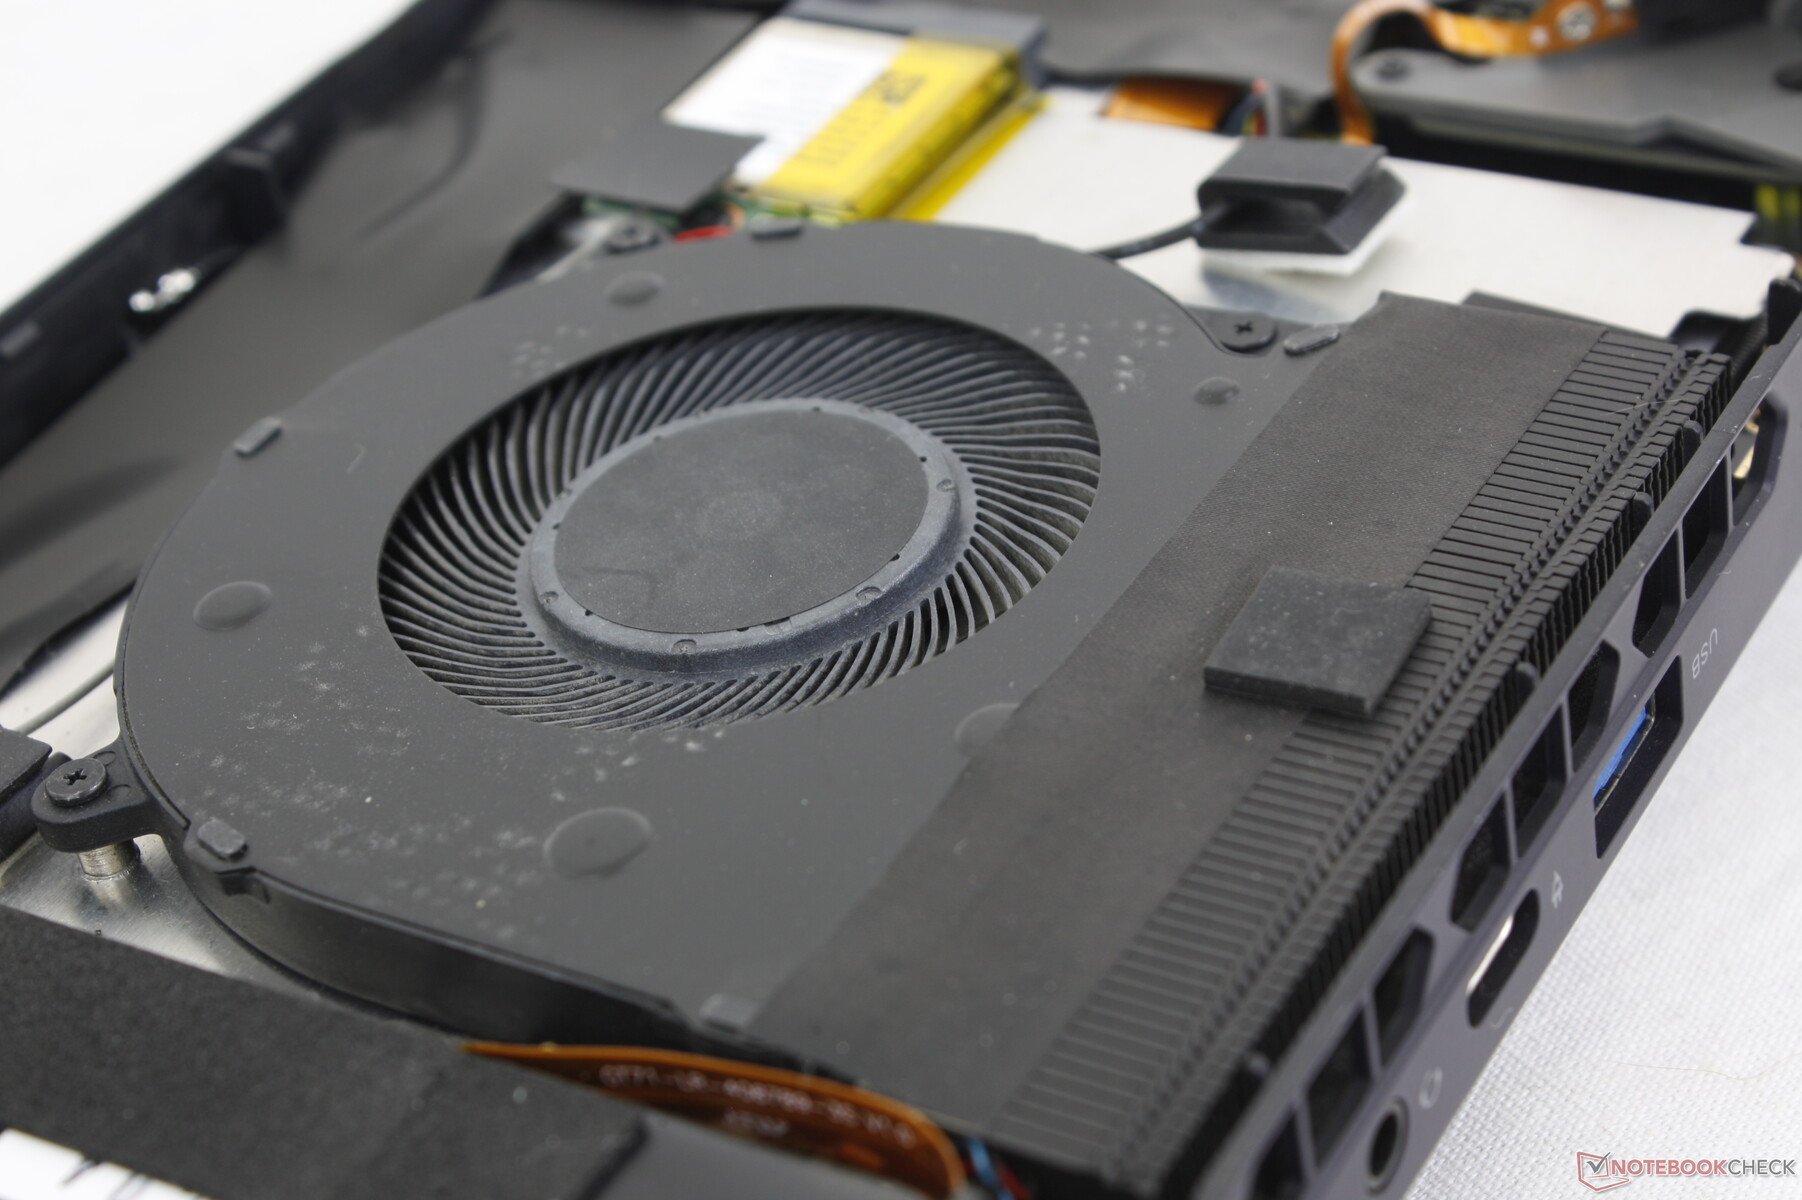
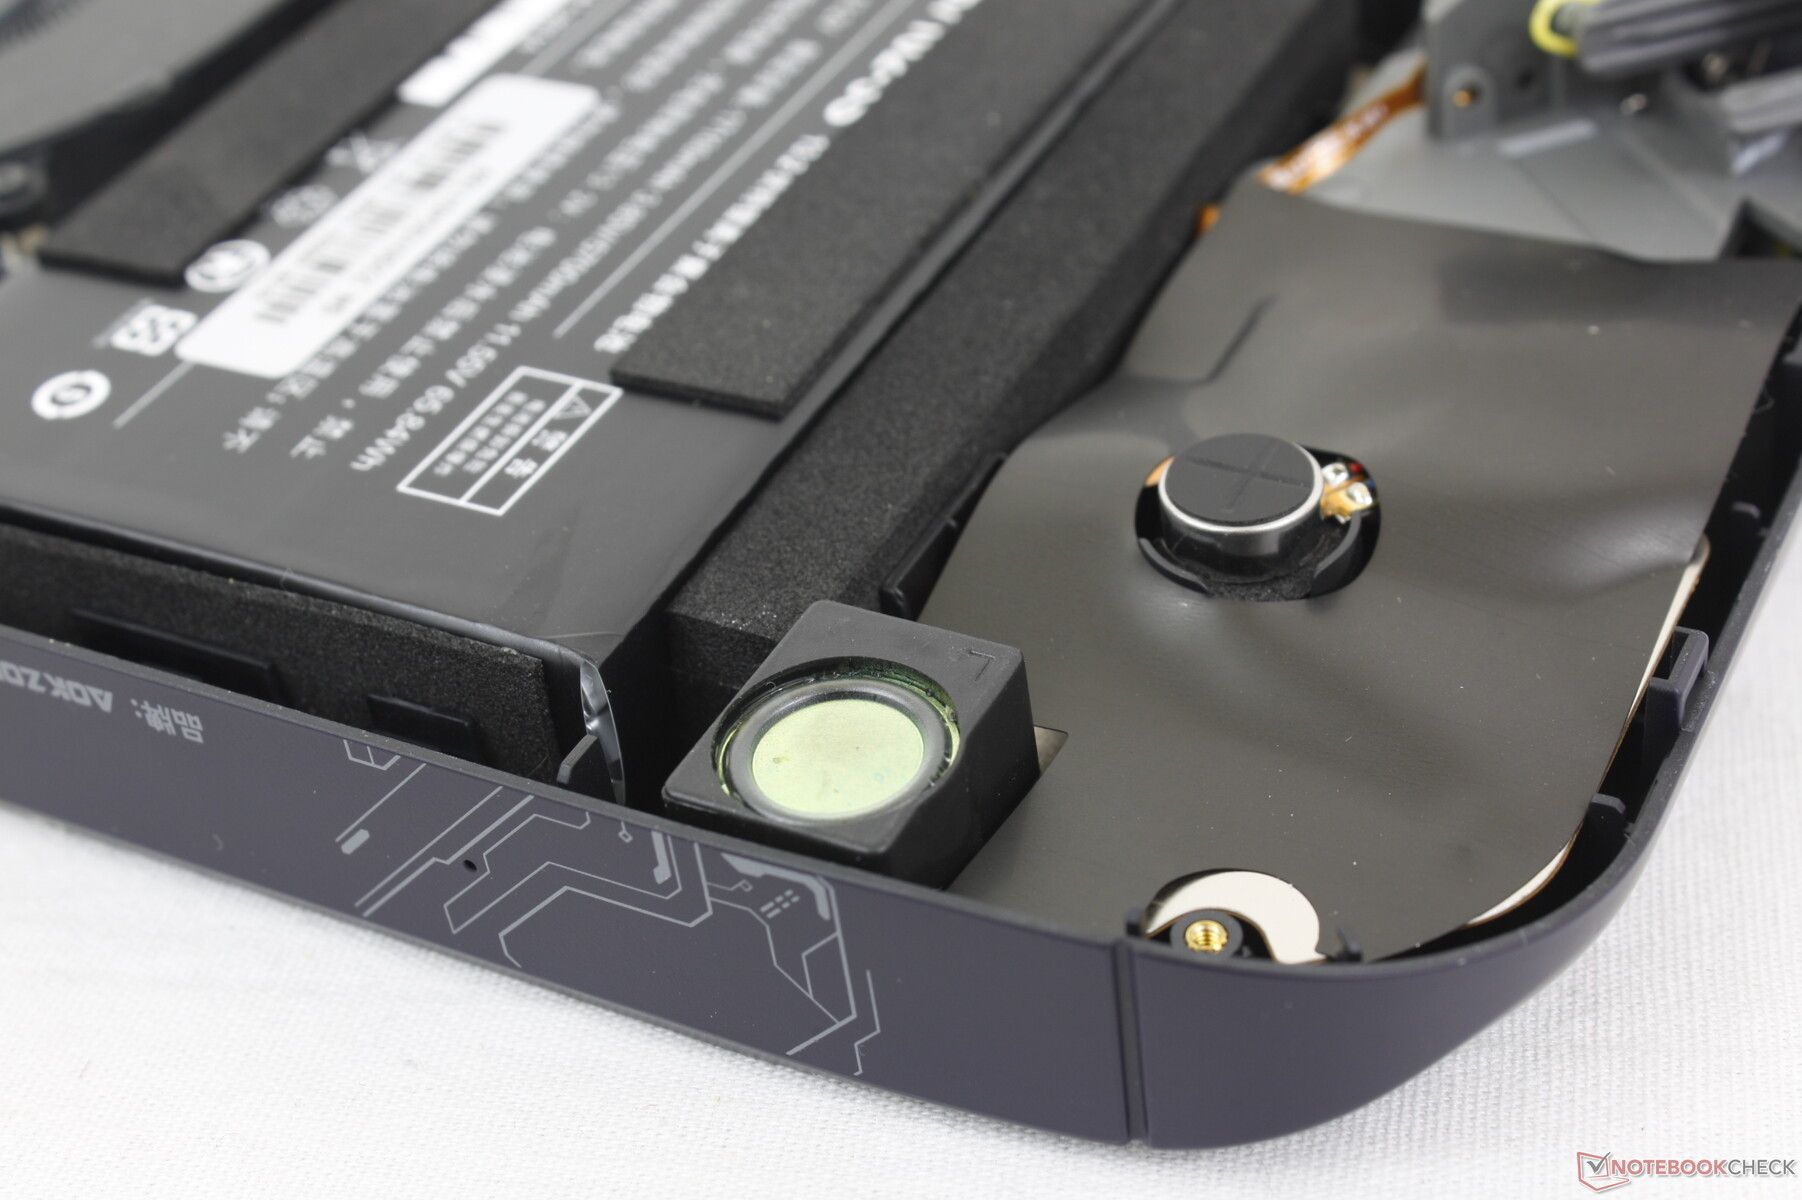
Manutenzione
La manutenzione è generalmente molto buona per un PC portatile. Mentre i moduli RAM sono saldati, altri componenti come la batteria, la WLAN, l'SSD M.2 2280 e la ventola di raffreddamento possono essere sostituiti se necessario. L'SSD, tuttavia, è sepolto sotto il diffusore di calore in alluminio, il modulo WLAN e la ventola di sistema, rendendo l'accesso più difficile e lungo.
Accessori e garanzia
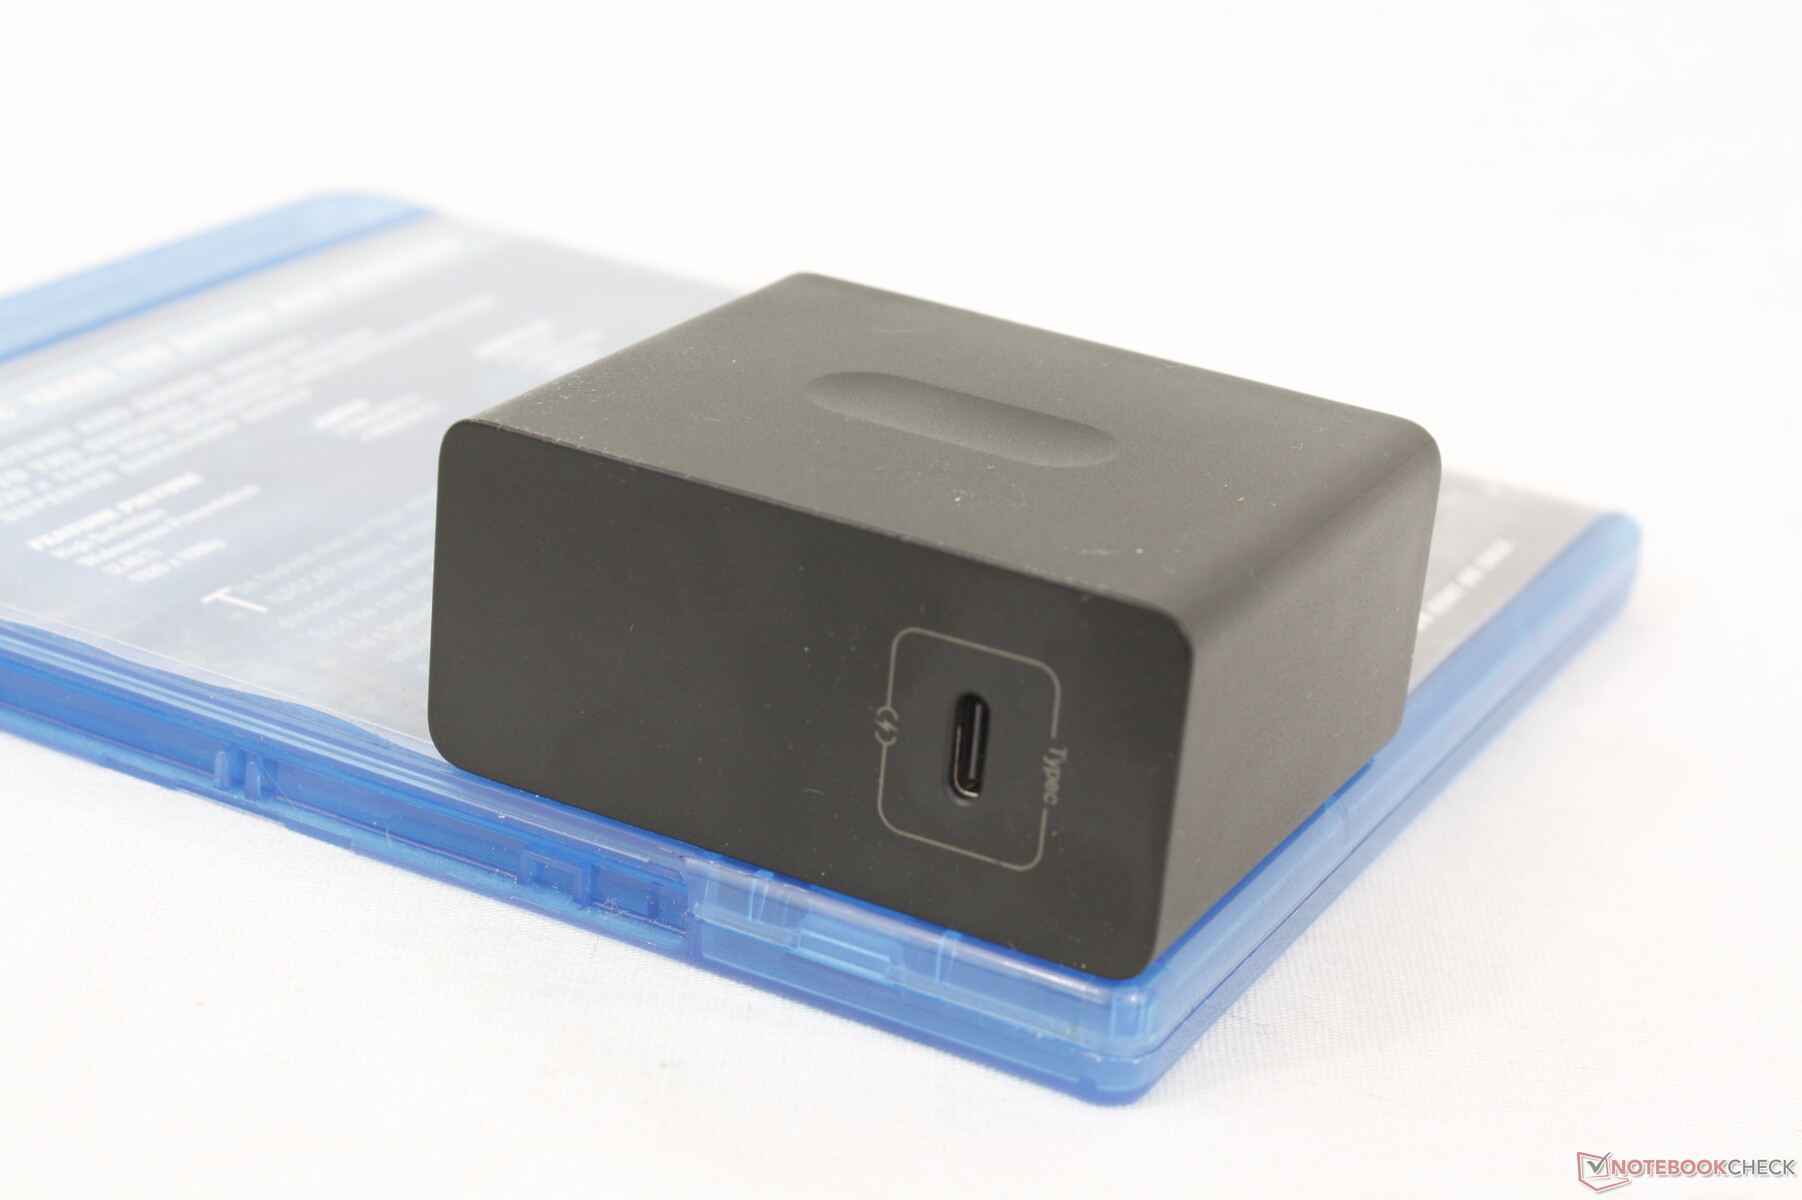
La confezione non contiene altri extra oltre all'adattatore CA e alla documentazione. Si applica la consueta garanzia limitata di un anno del produttore.
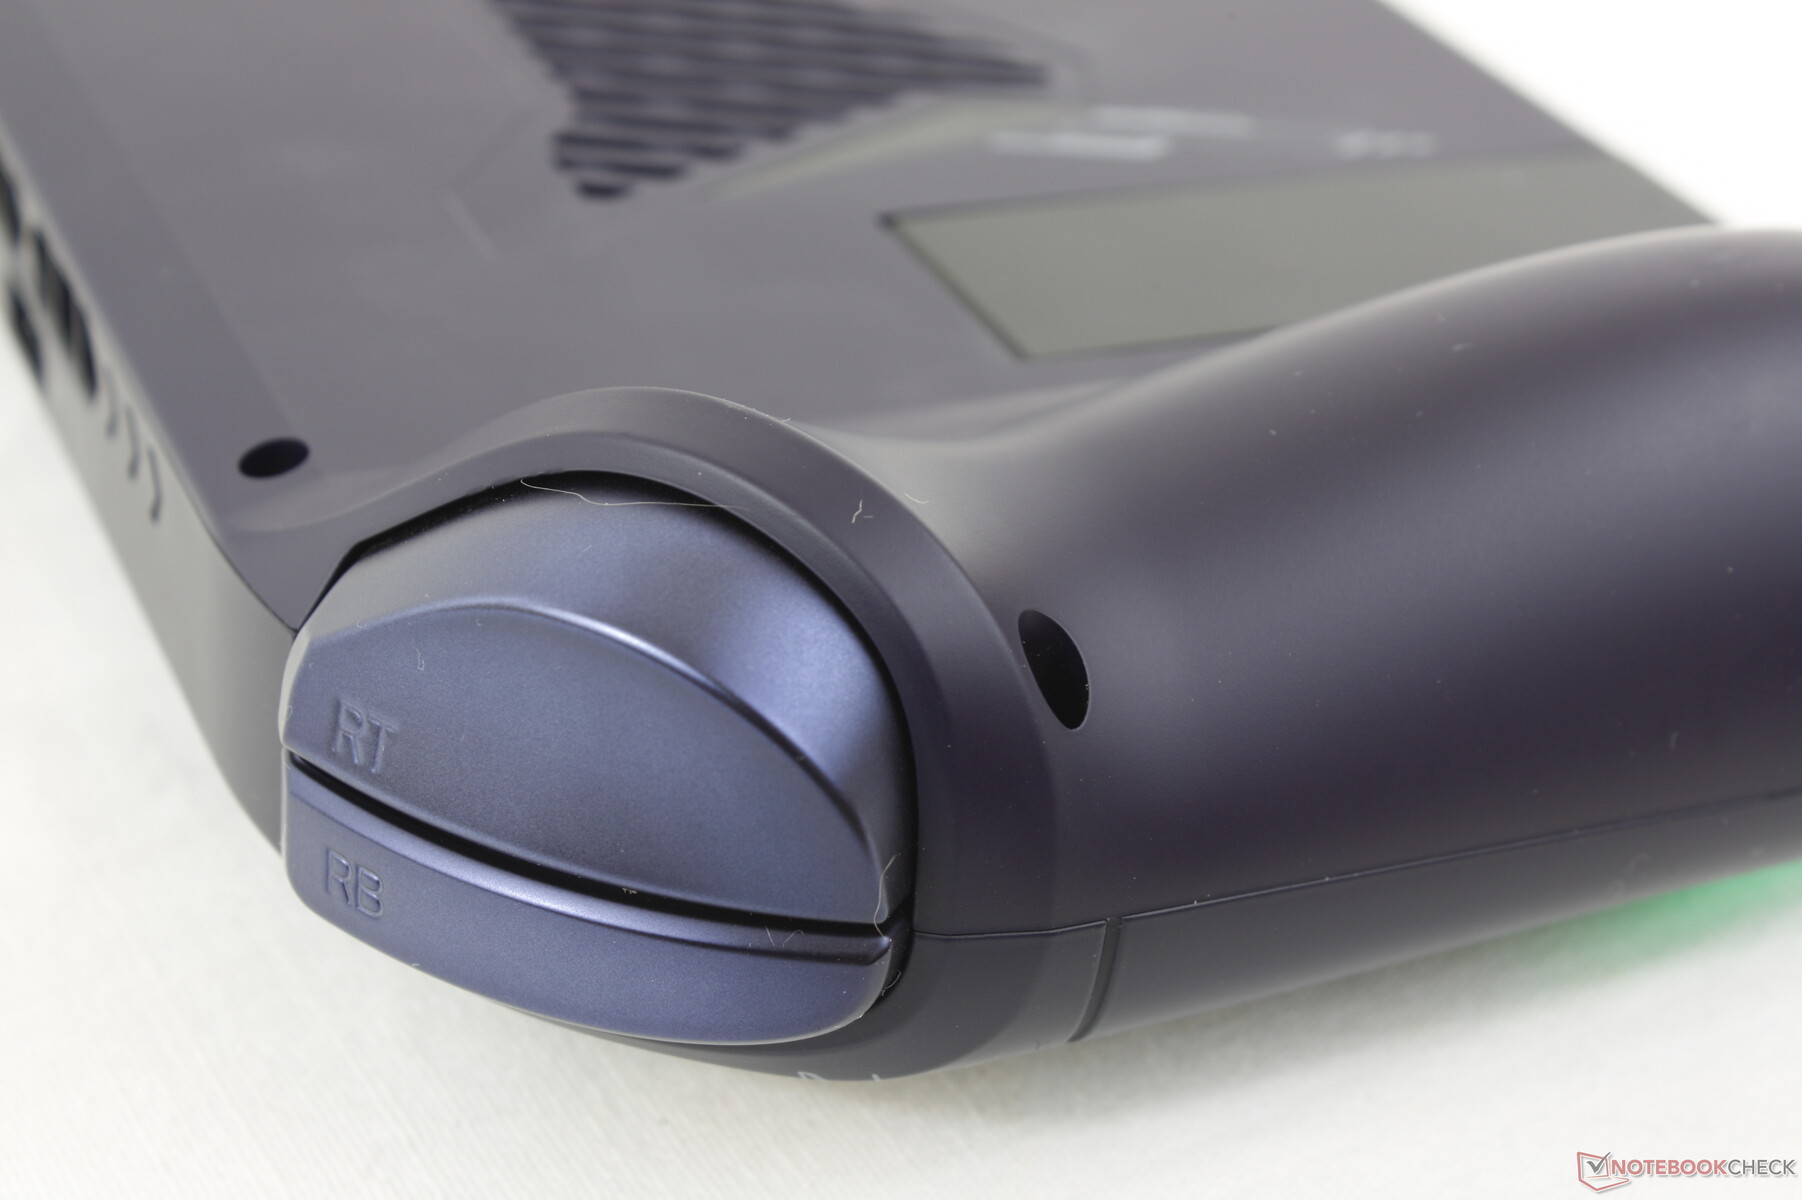
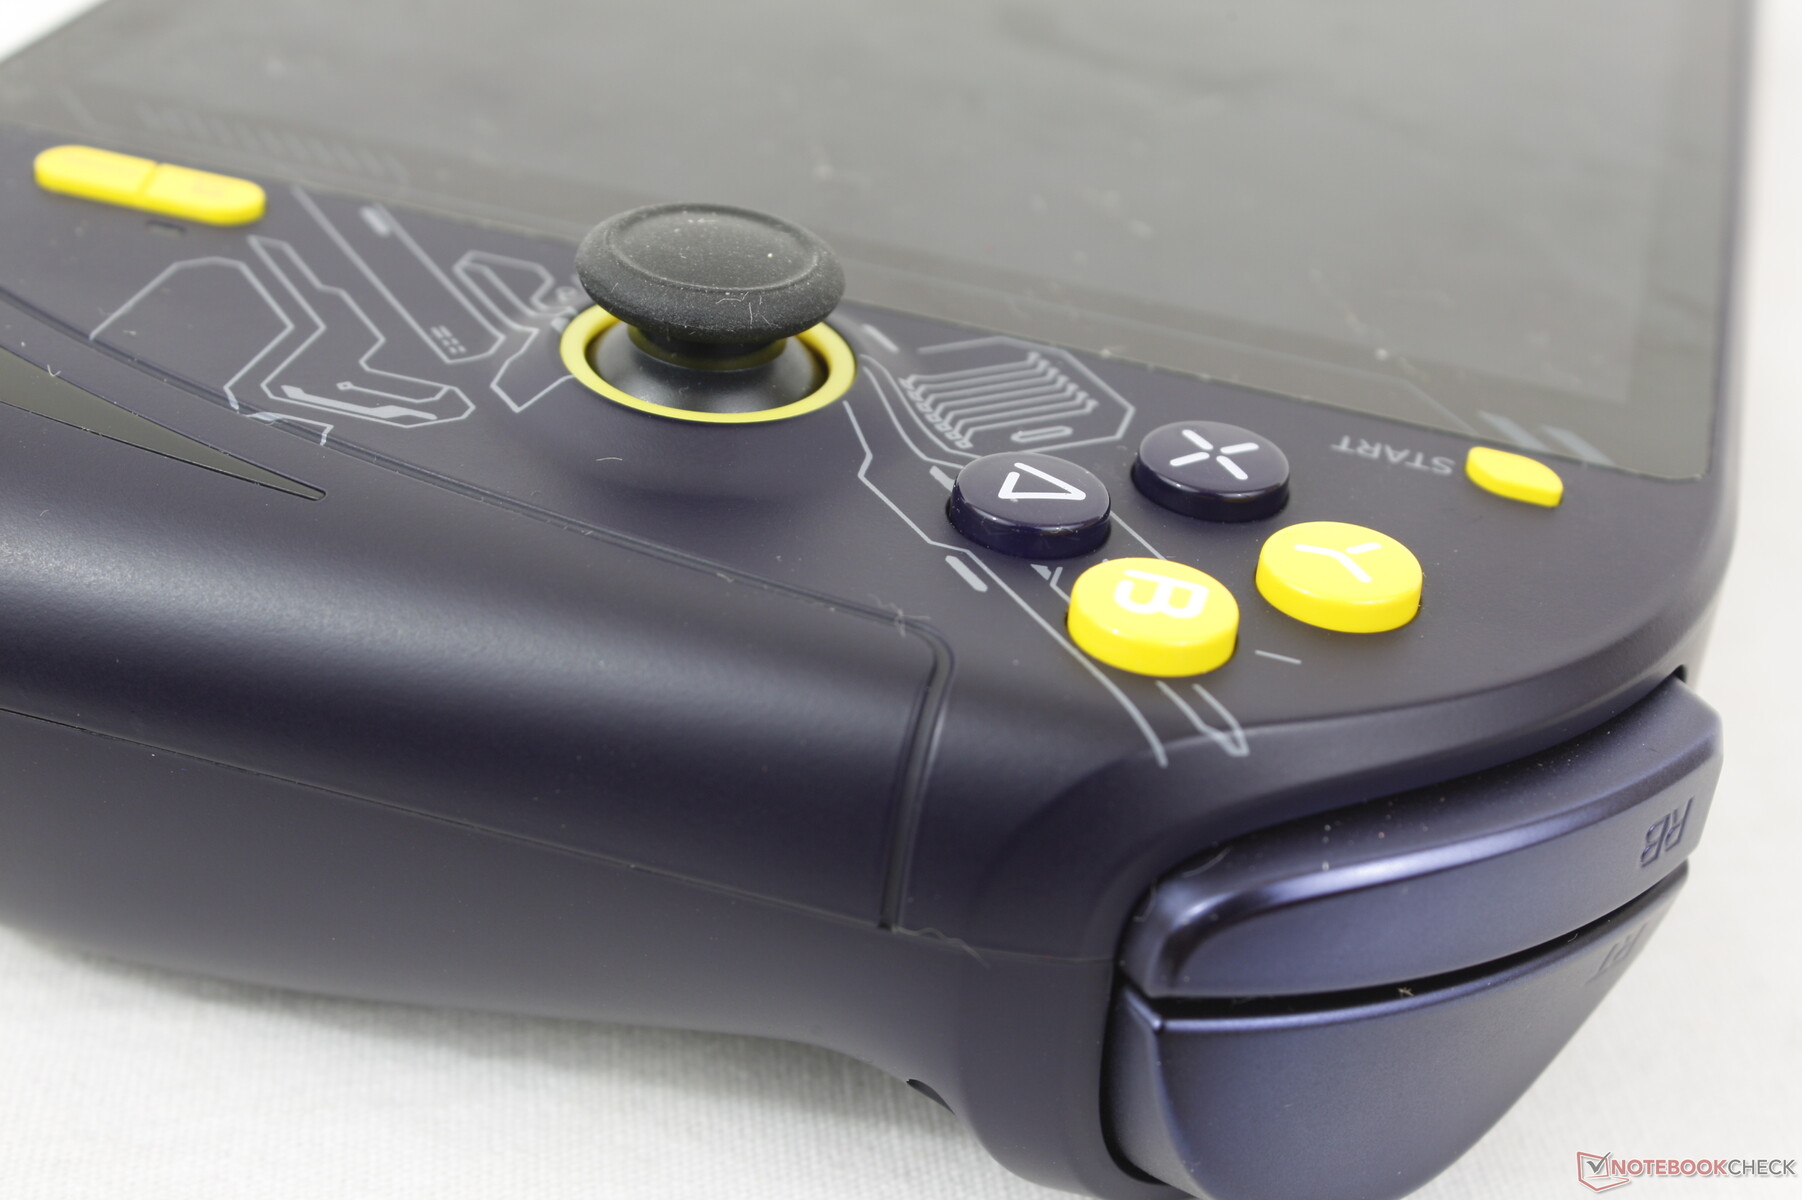
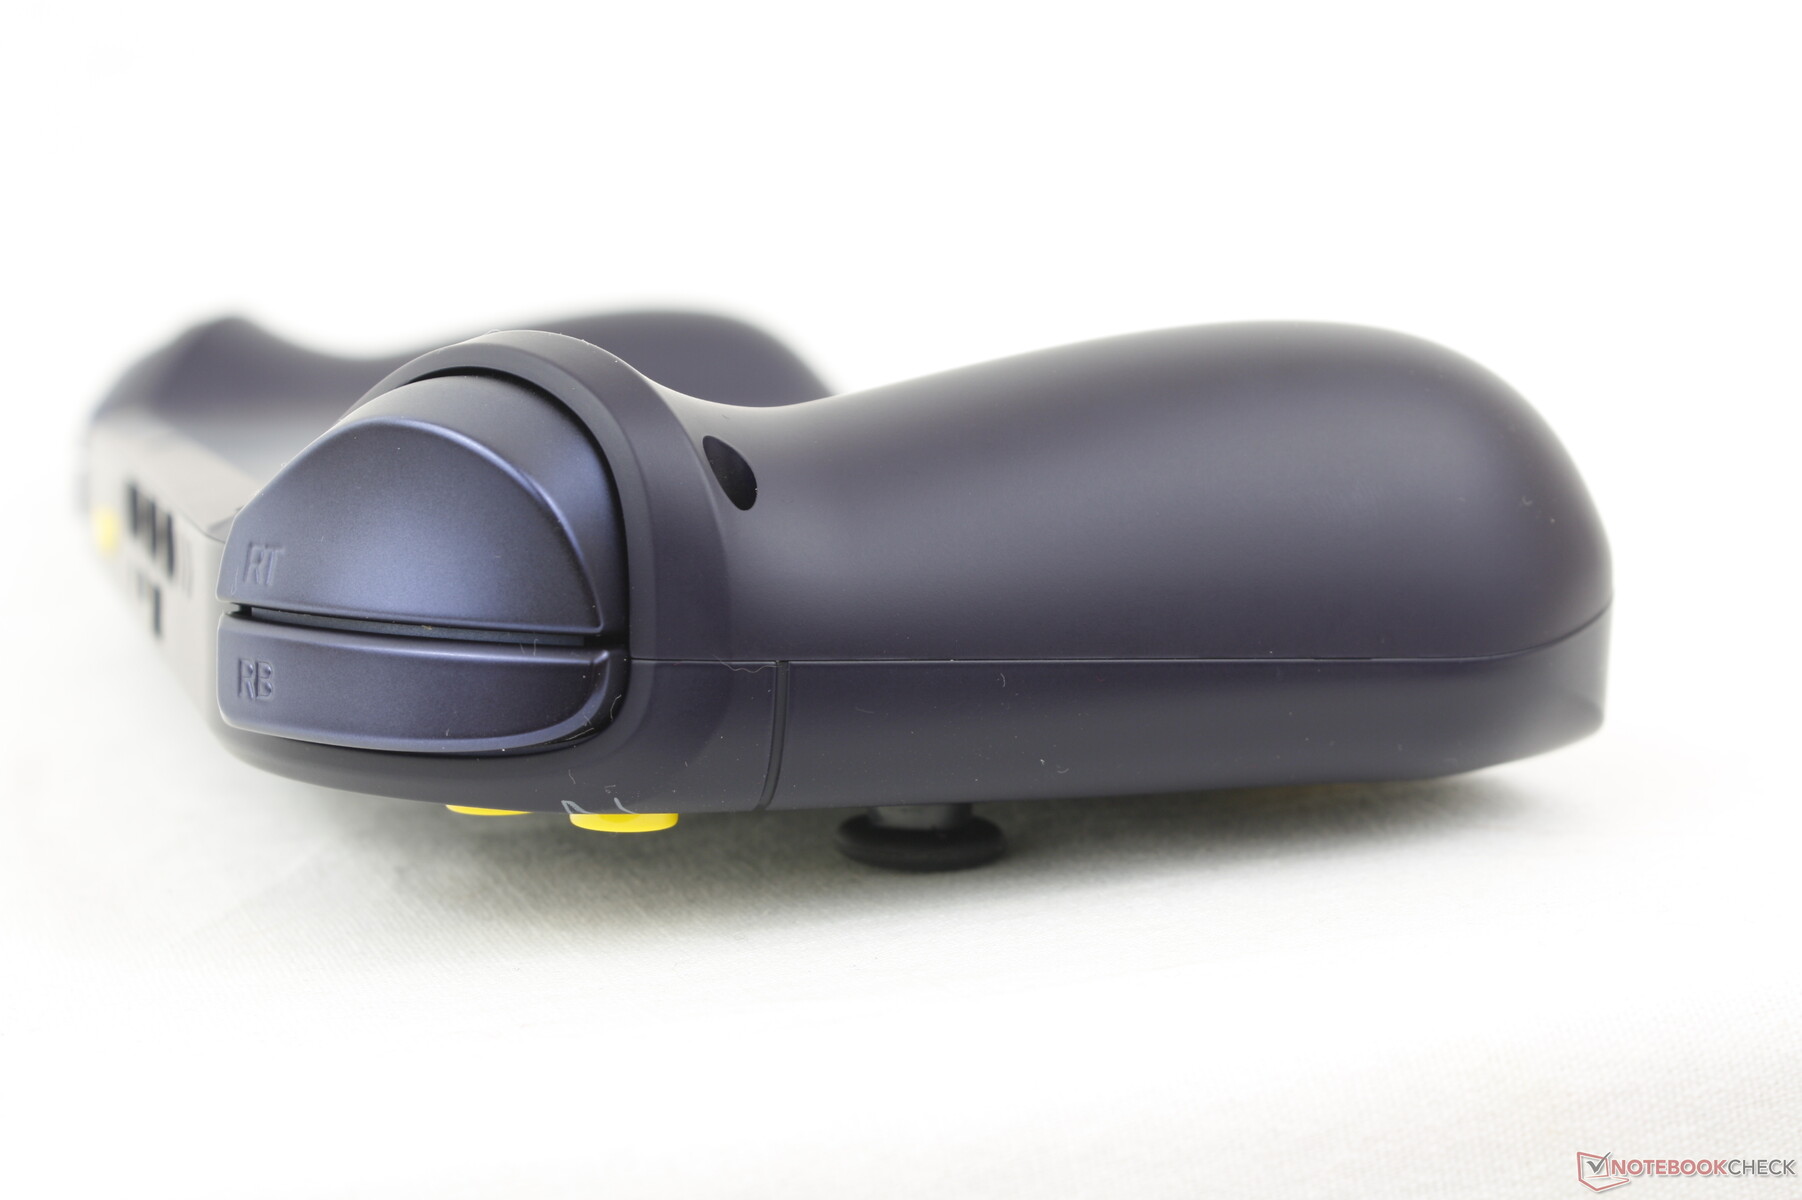
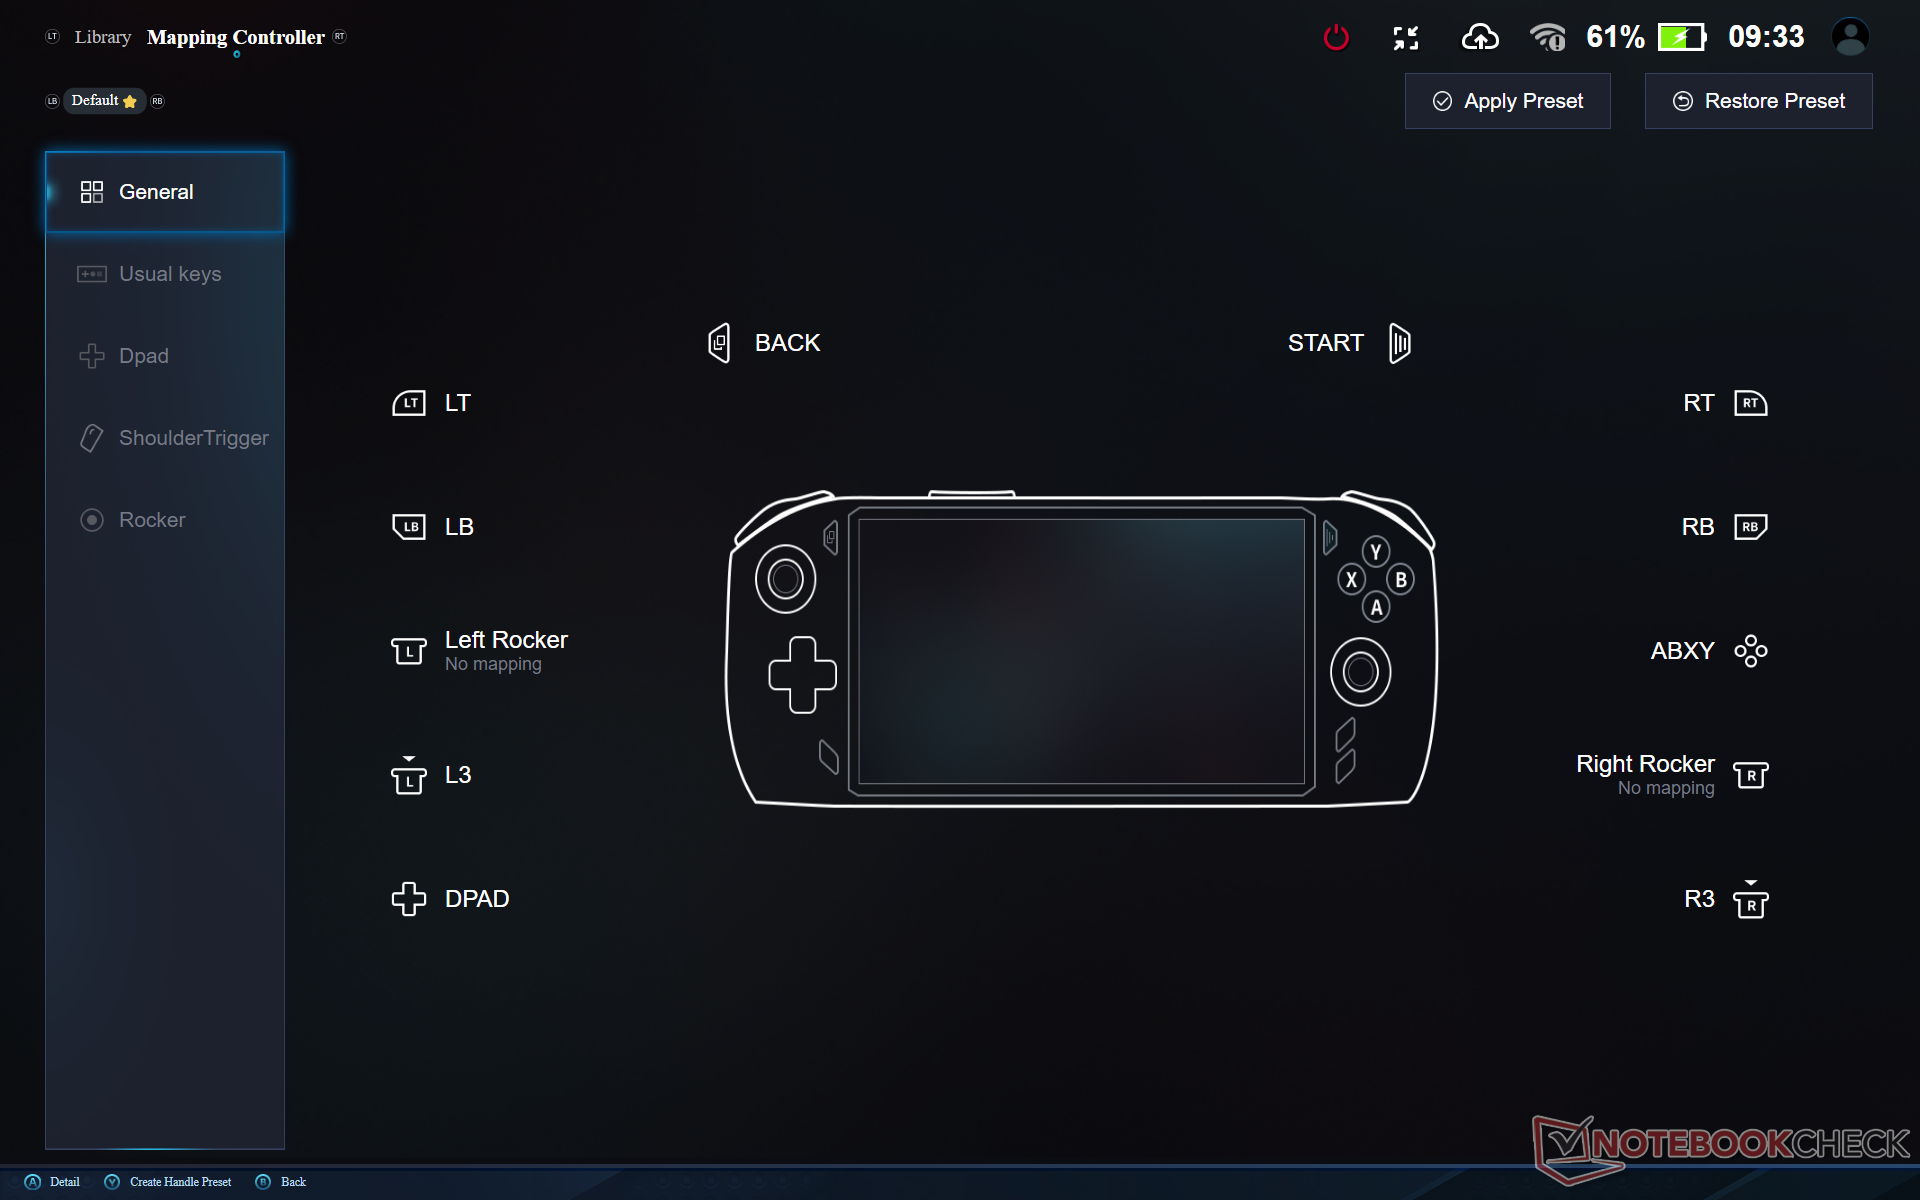
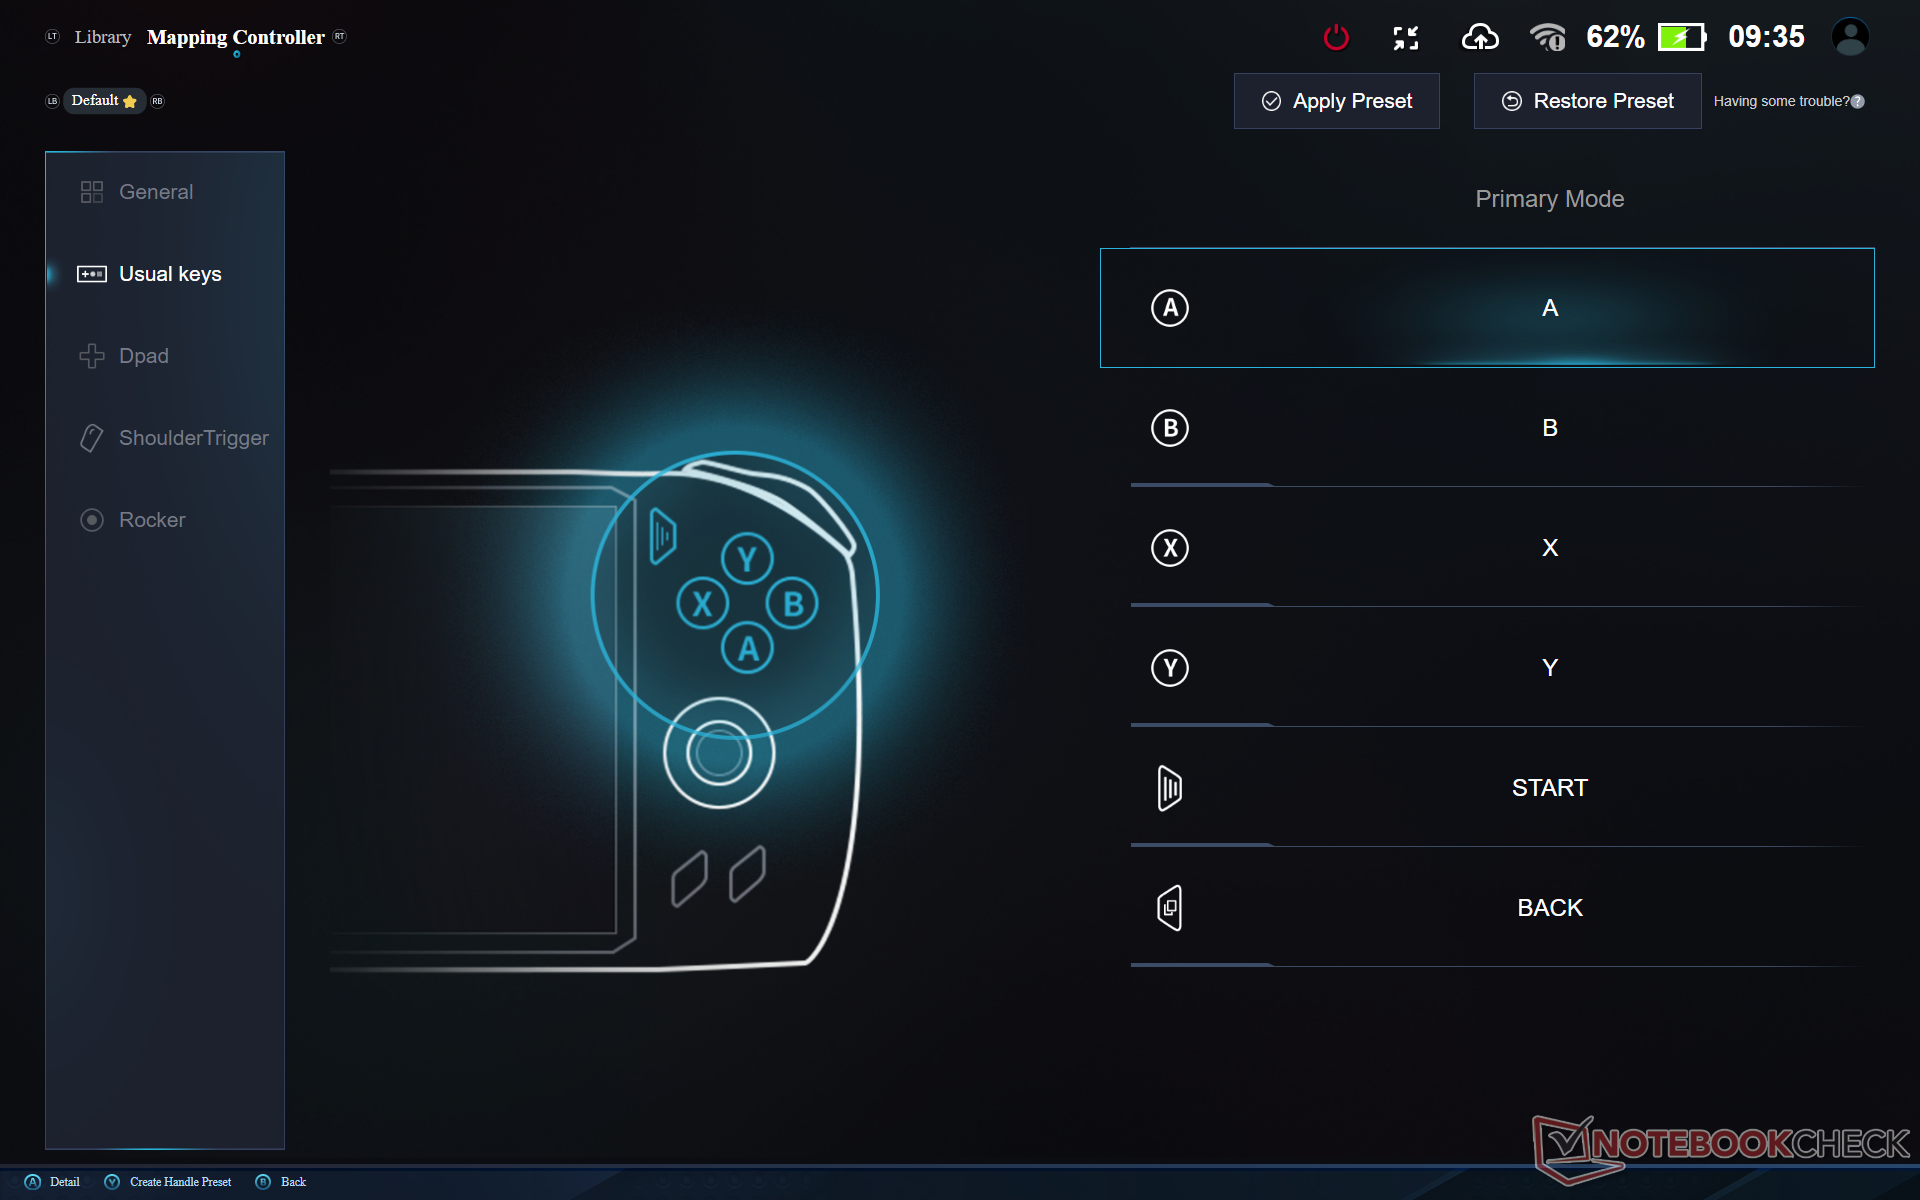
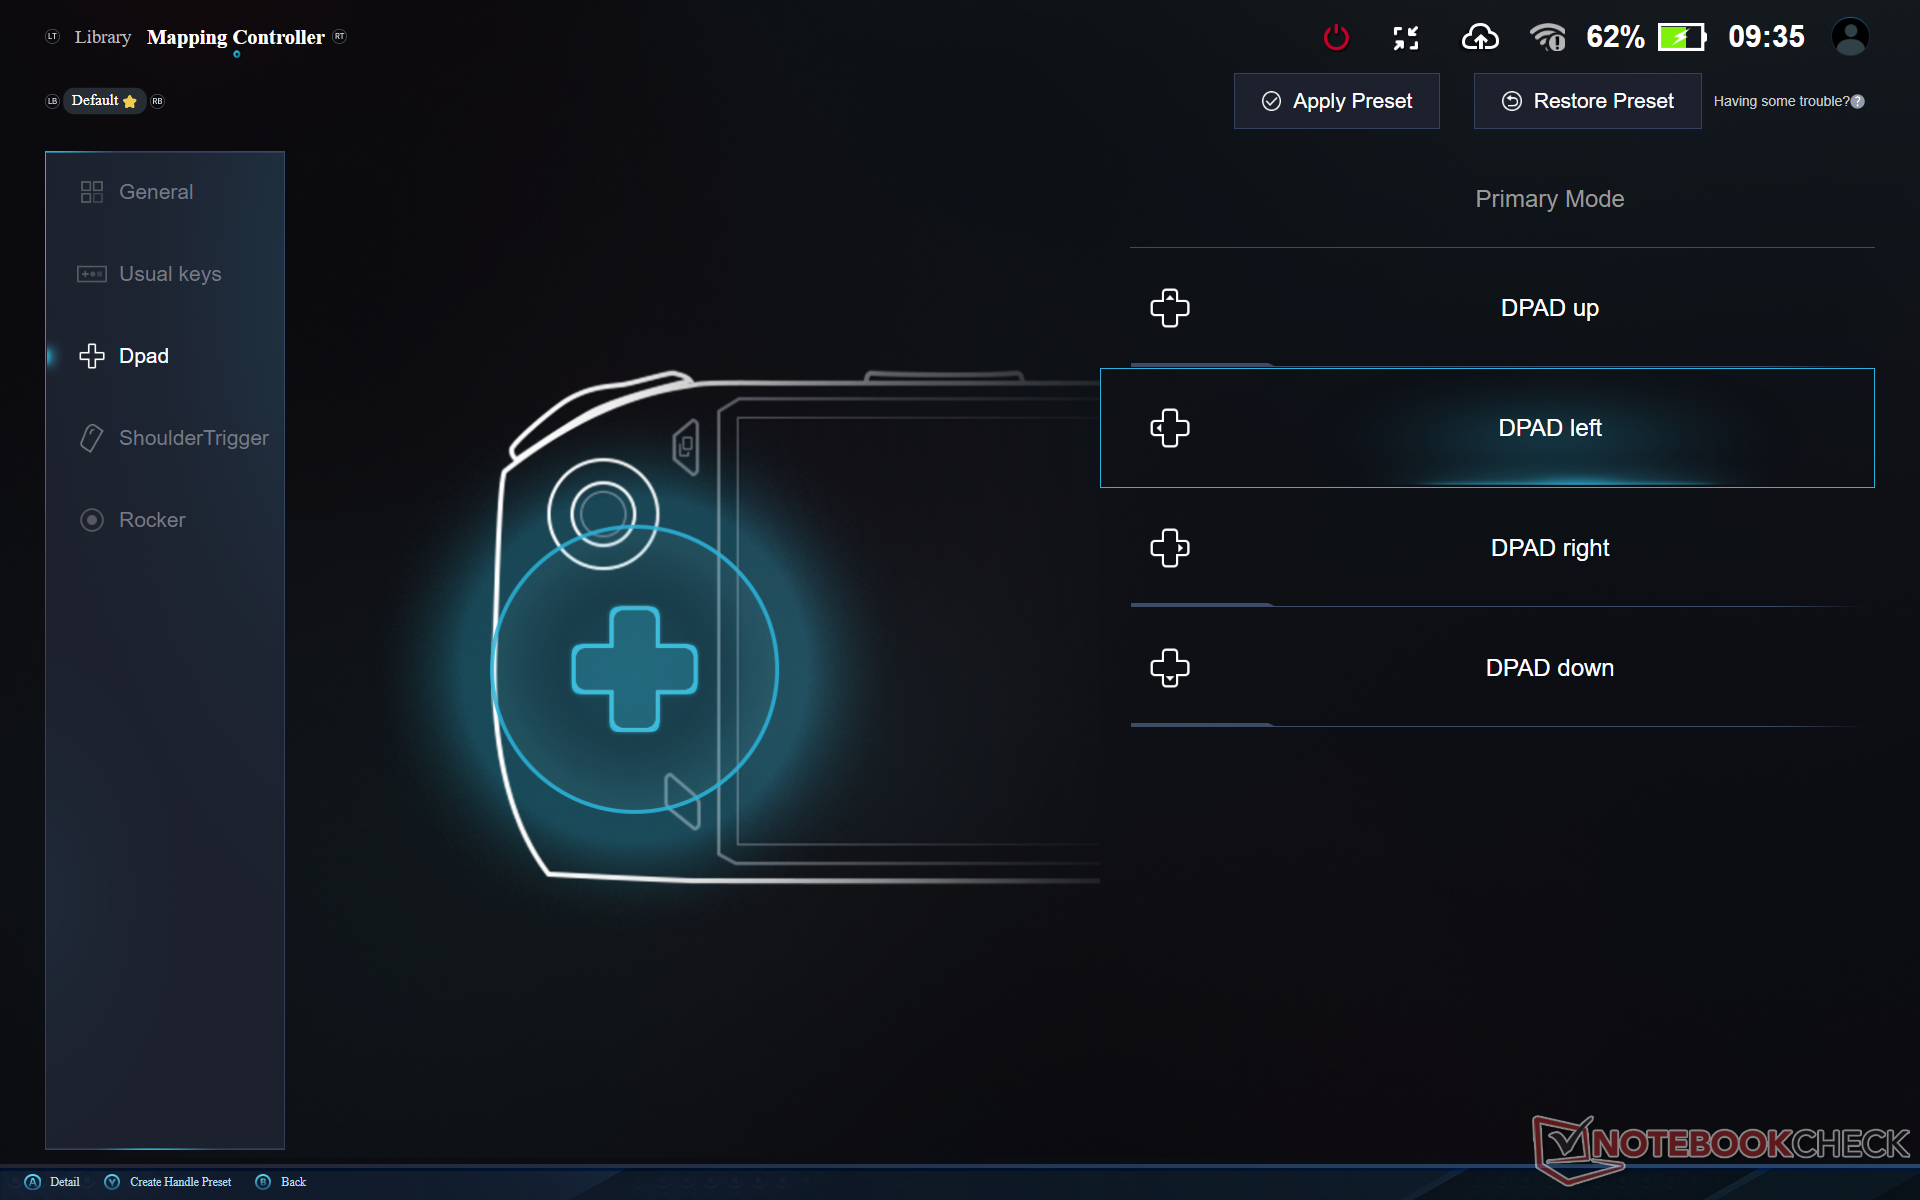
Dispositivi di ingresso
Basta un solo pulsante scomodo su un controller per lasciare una cattiva impressione e, sfortunatamente per l'A1, quel pulsante è il tasto della spalla. I tasti LB e RB, in particolare, sono difficili da premere perché richiedono molta forza prima di registrare un input. Anche il punto in cui si preme sul pulsante è importante, poiché il feedback non è uniforme. Ad esempio, premere i pulsanti vicino ai bordi superiori è più difficile che premere i pulsanti vicino ai bordi inferiori, per una sensazione molto disomogenea. Al contrario, i pulsanti a spalla dello Switch o della Playstation sono più facili da premere, indipendentemente dall'angolo in cui si preme.
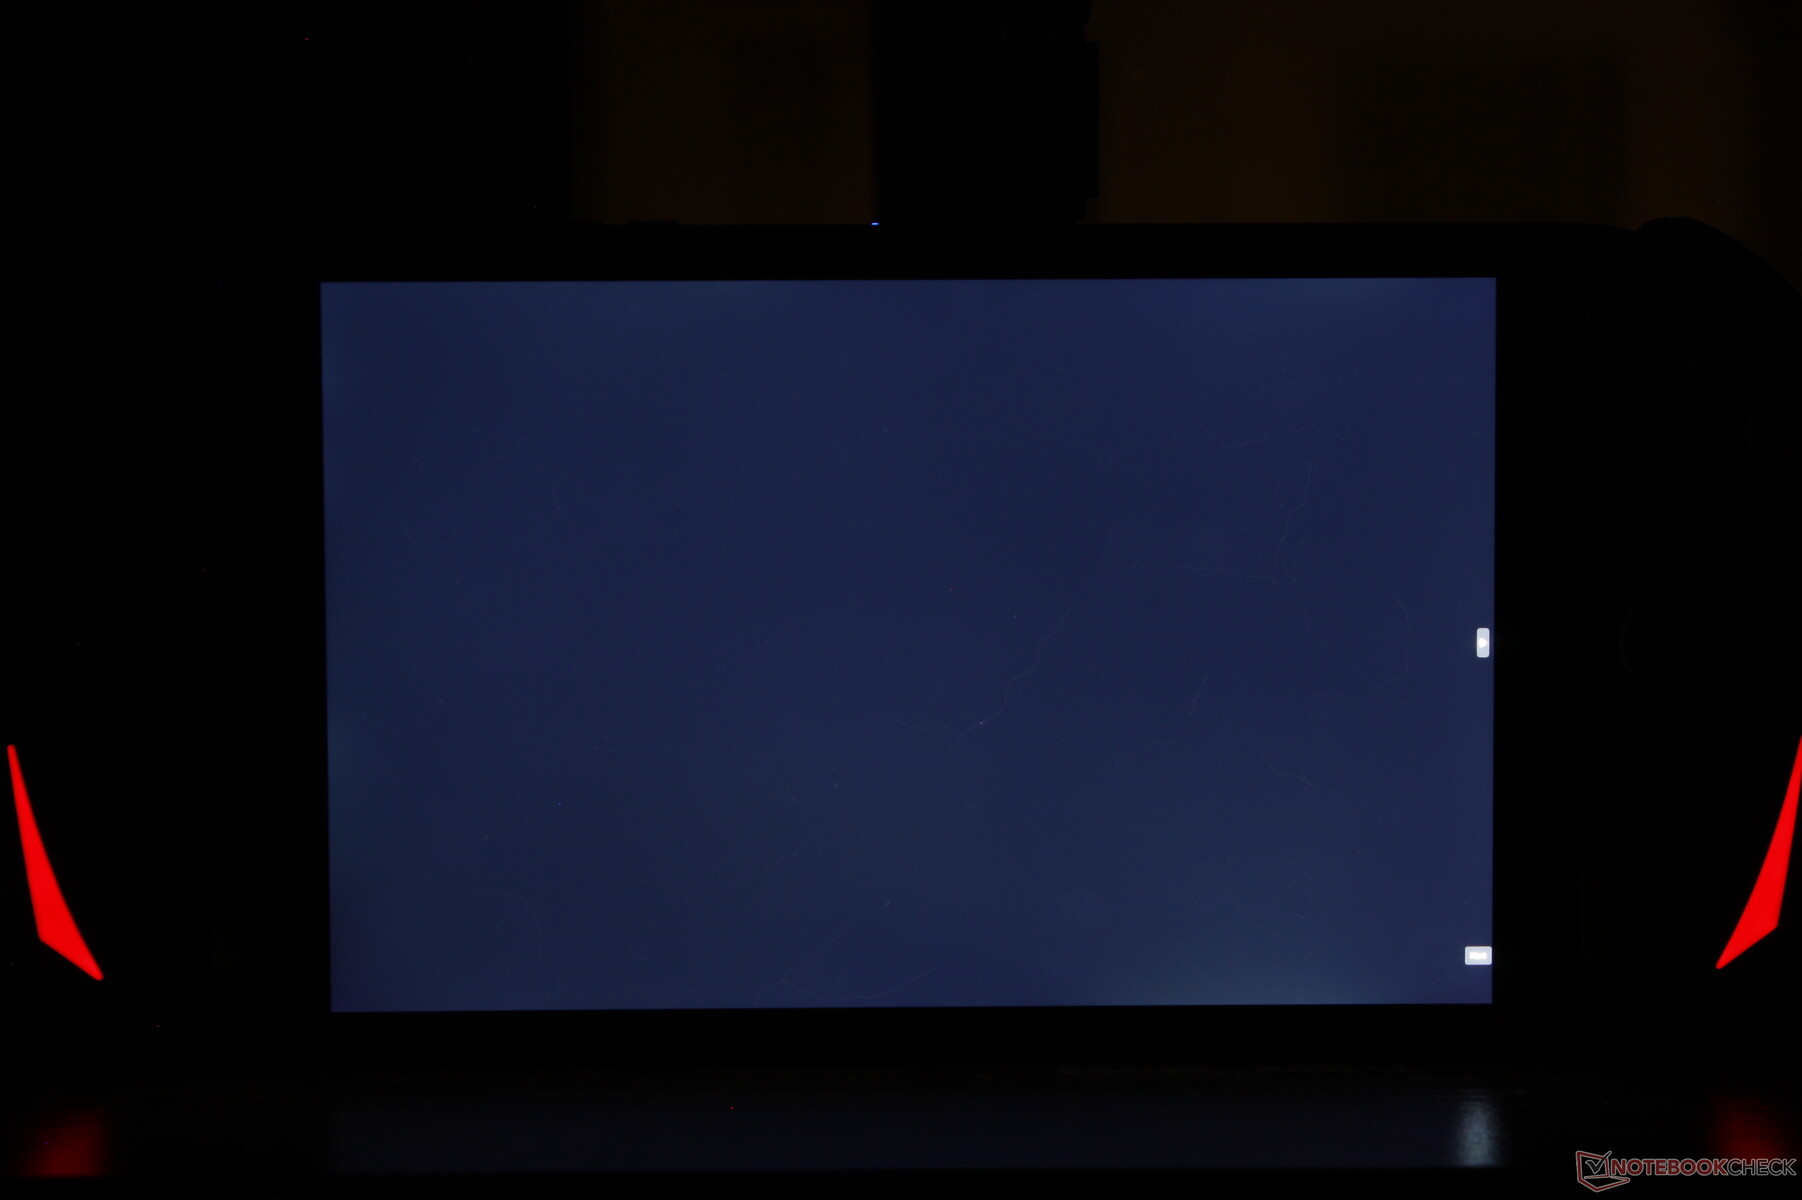
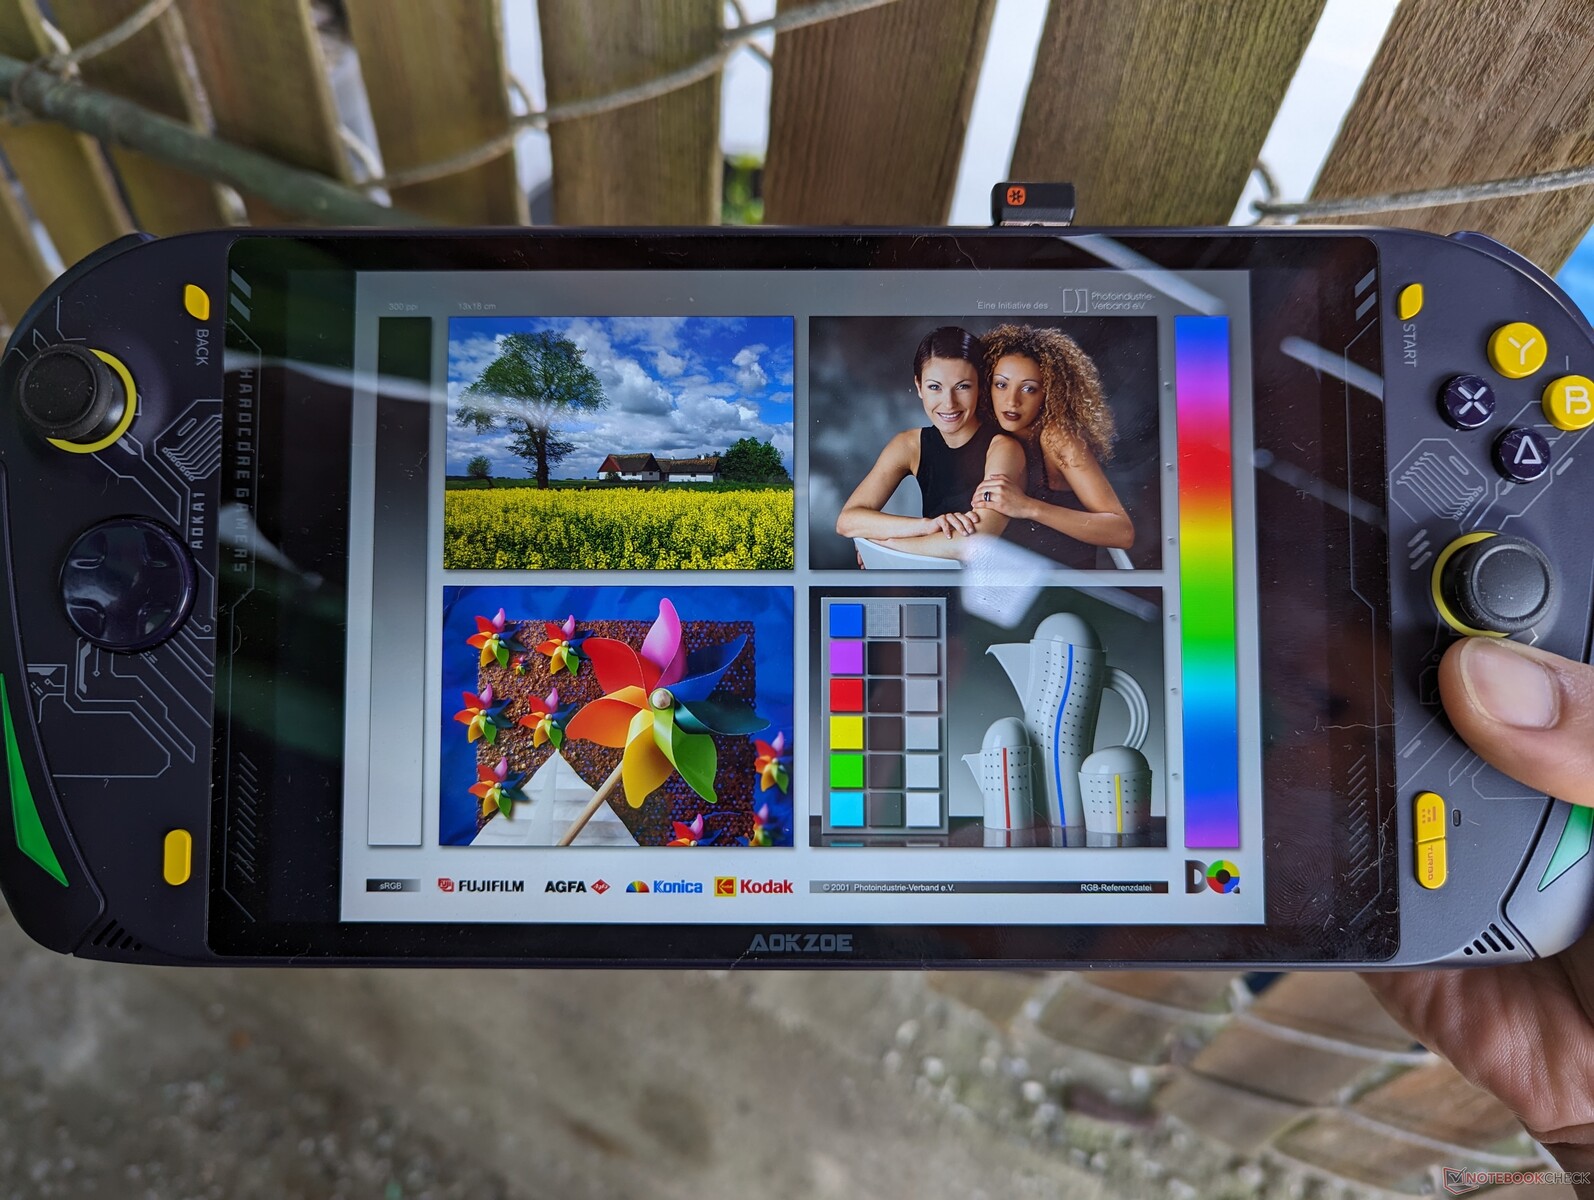
Display - IPS ampio e nitido
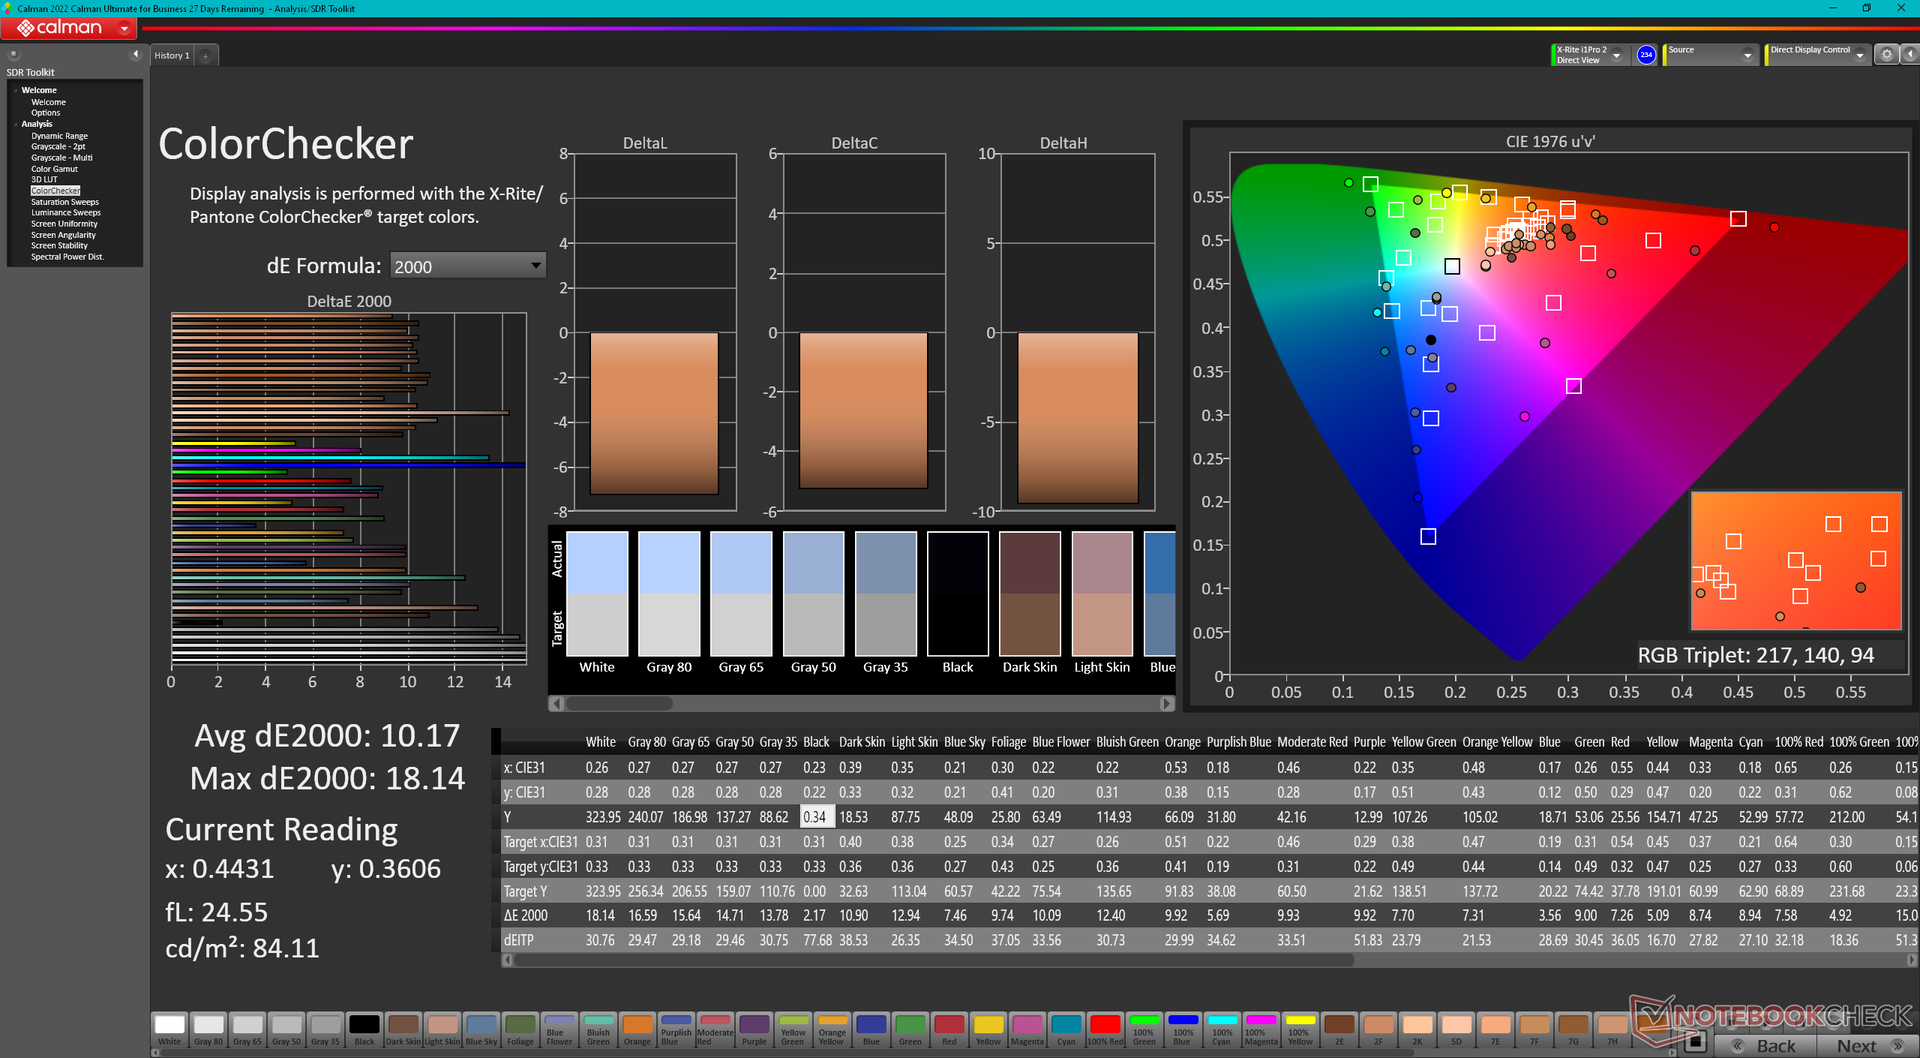
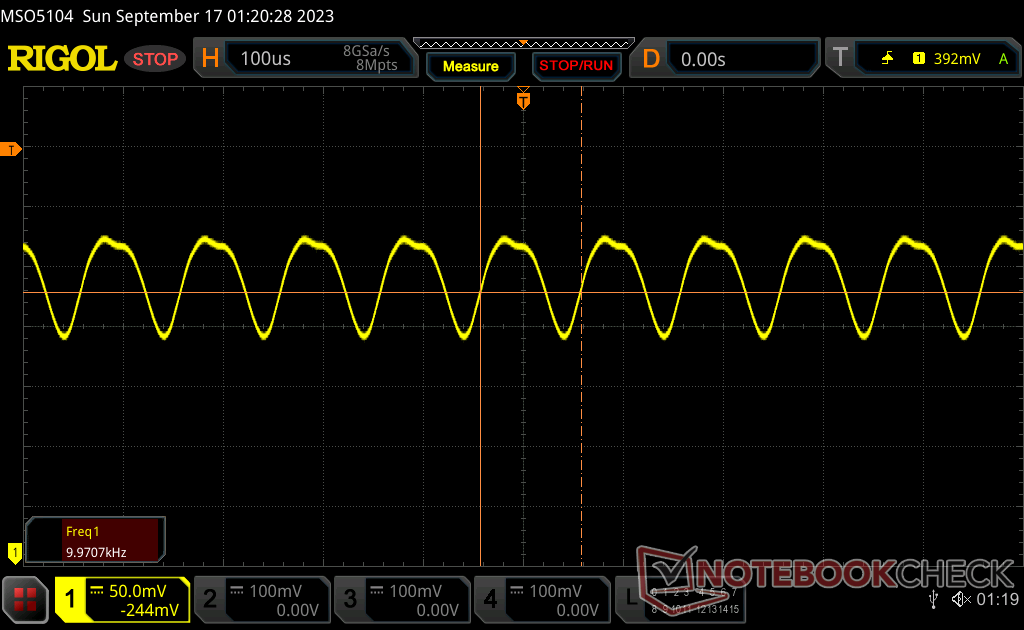
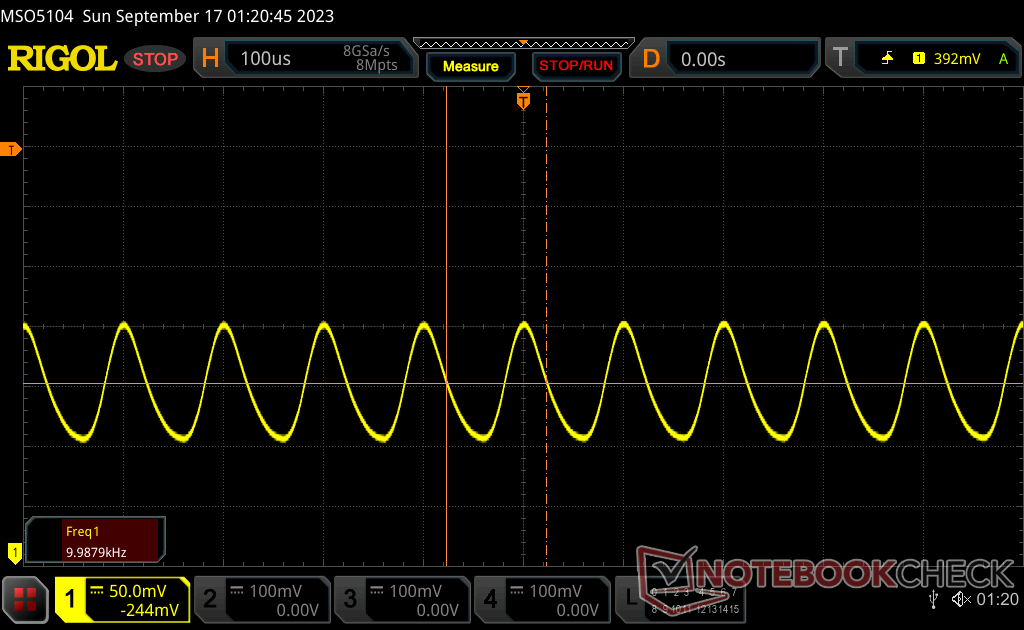
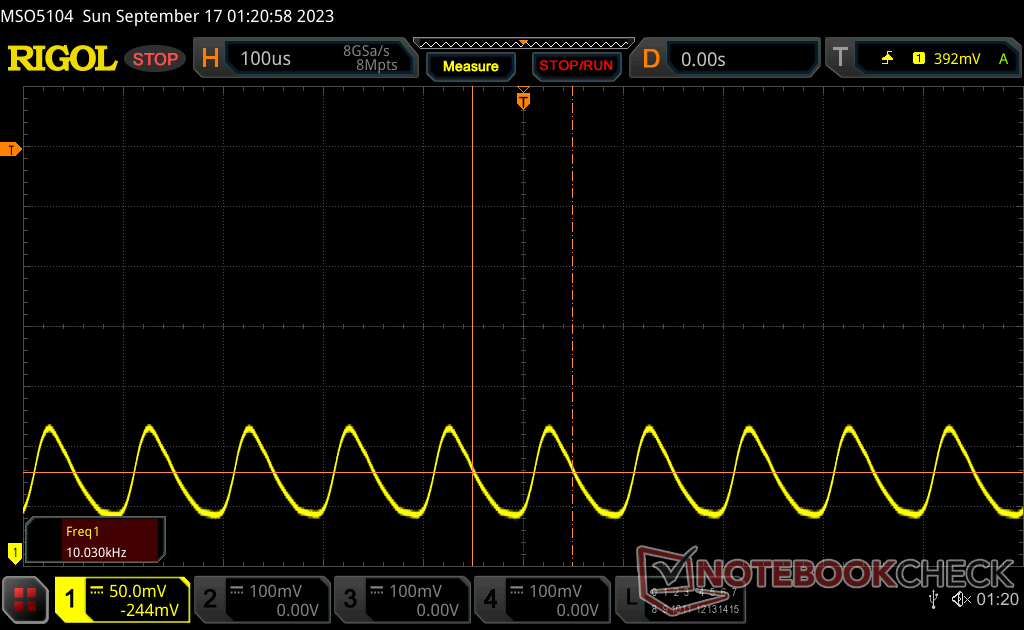
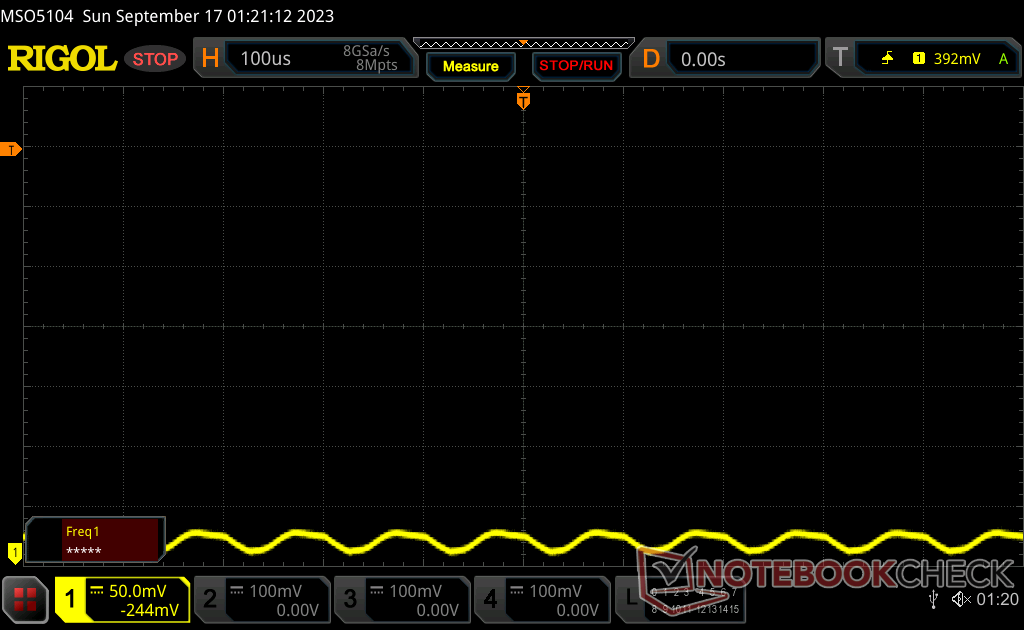
Il touchscreen IPS BOE da 1200p offre immagini nitide, buoni colori e tempi di risposta e rapporto di contrasto decenti, adatti ai giochi. I suoi principali svantaggi sono i livelli di luminosità medi, la frequenza di aggiornamento di 60 Hz e la presenza di PWM, che possono influire sulla visibilità all'aperto e causare affaticamento della vista agli utenti sensibili. Manca inoltre il supporto FreeSync.

| |||||||||||||||||||||||||
Distribuzione della luminosità: 92 %
Al centro con la batteria: 328.4 cd/m²
Contrasto: 842:1 (Nero: 0.39 cd/m²)
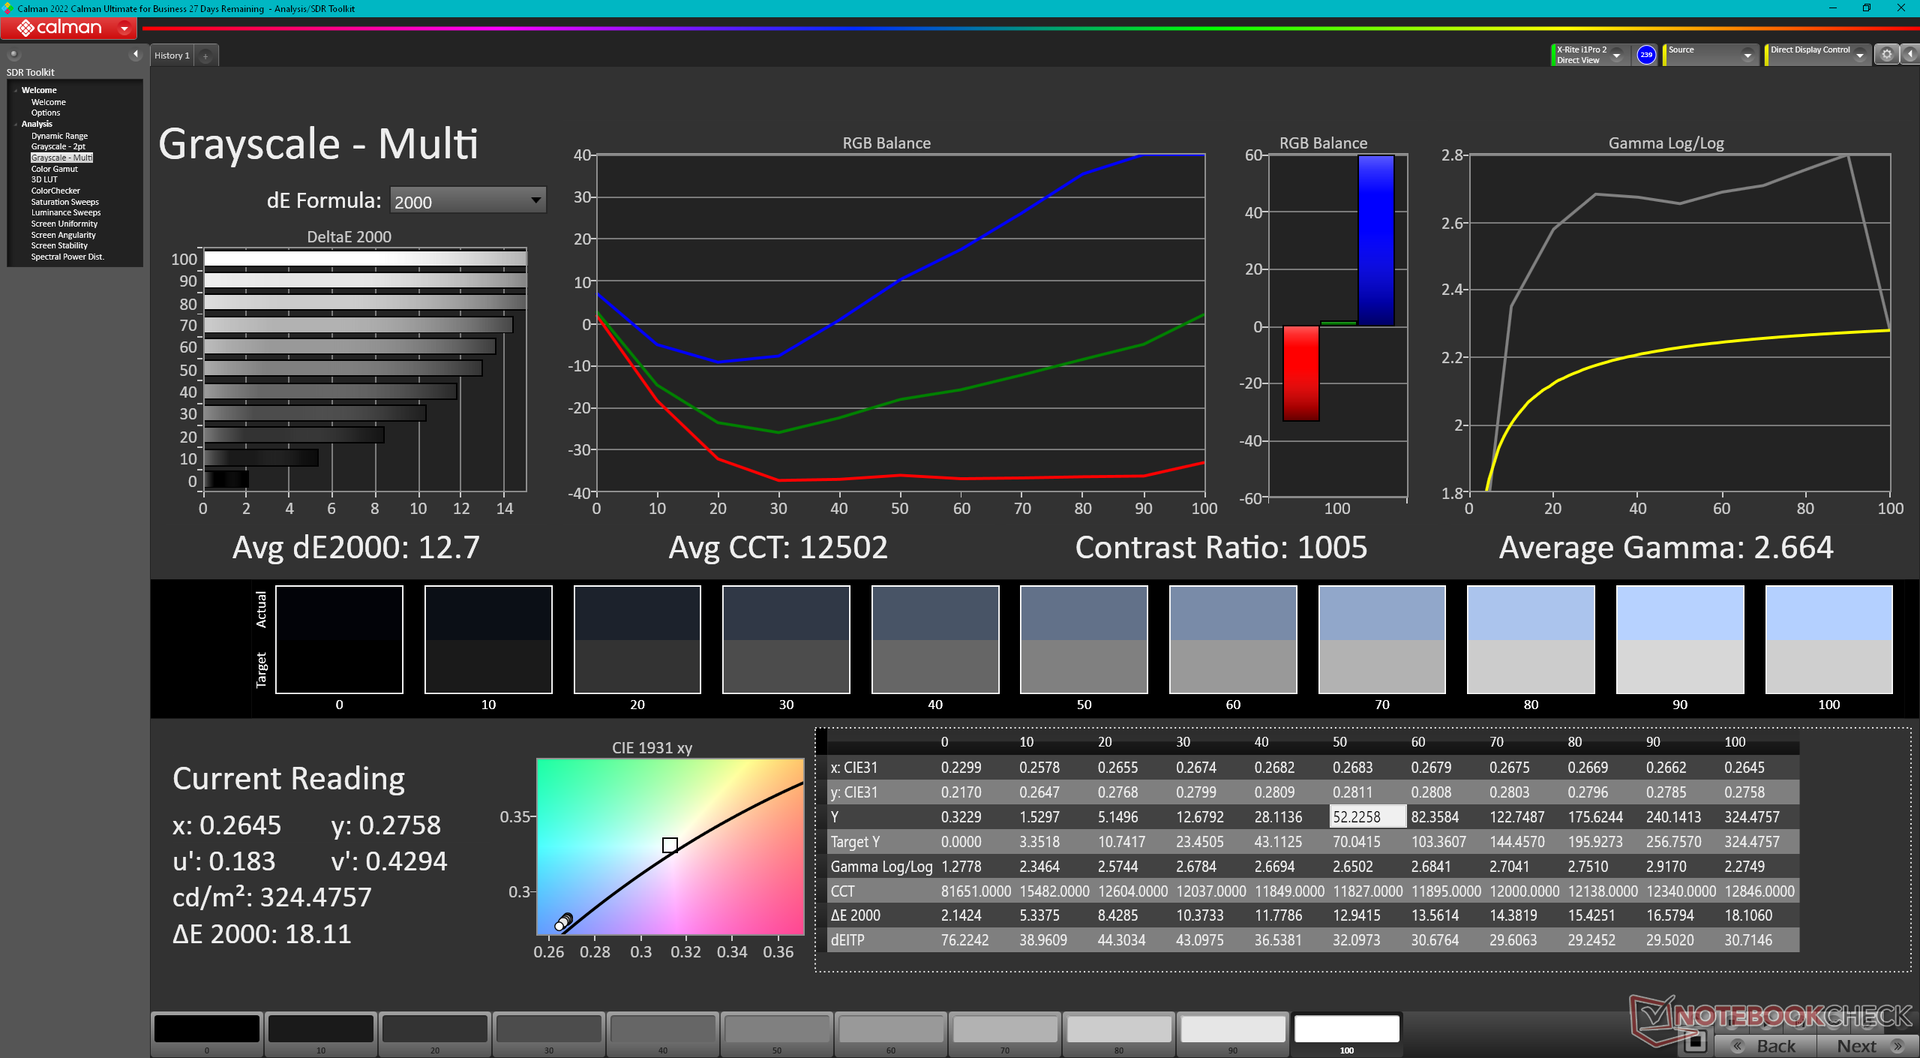
ΔE ColorChecker Calman: 10.17 | ∀{0.5-29.43 Ø4.71}
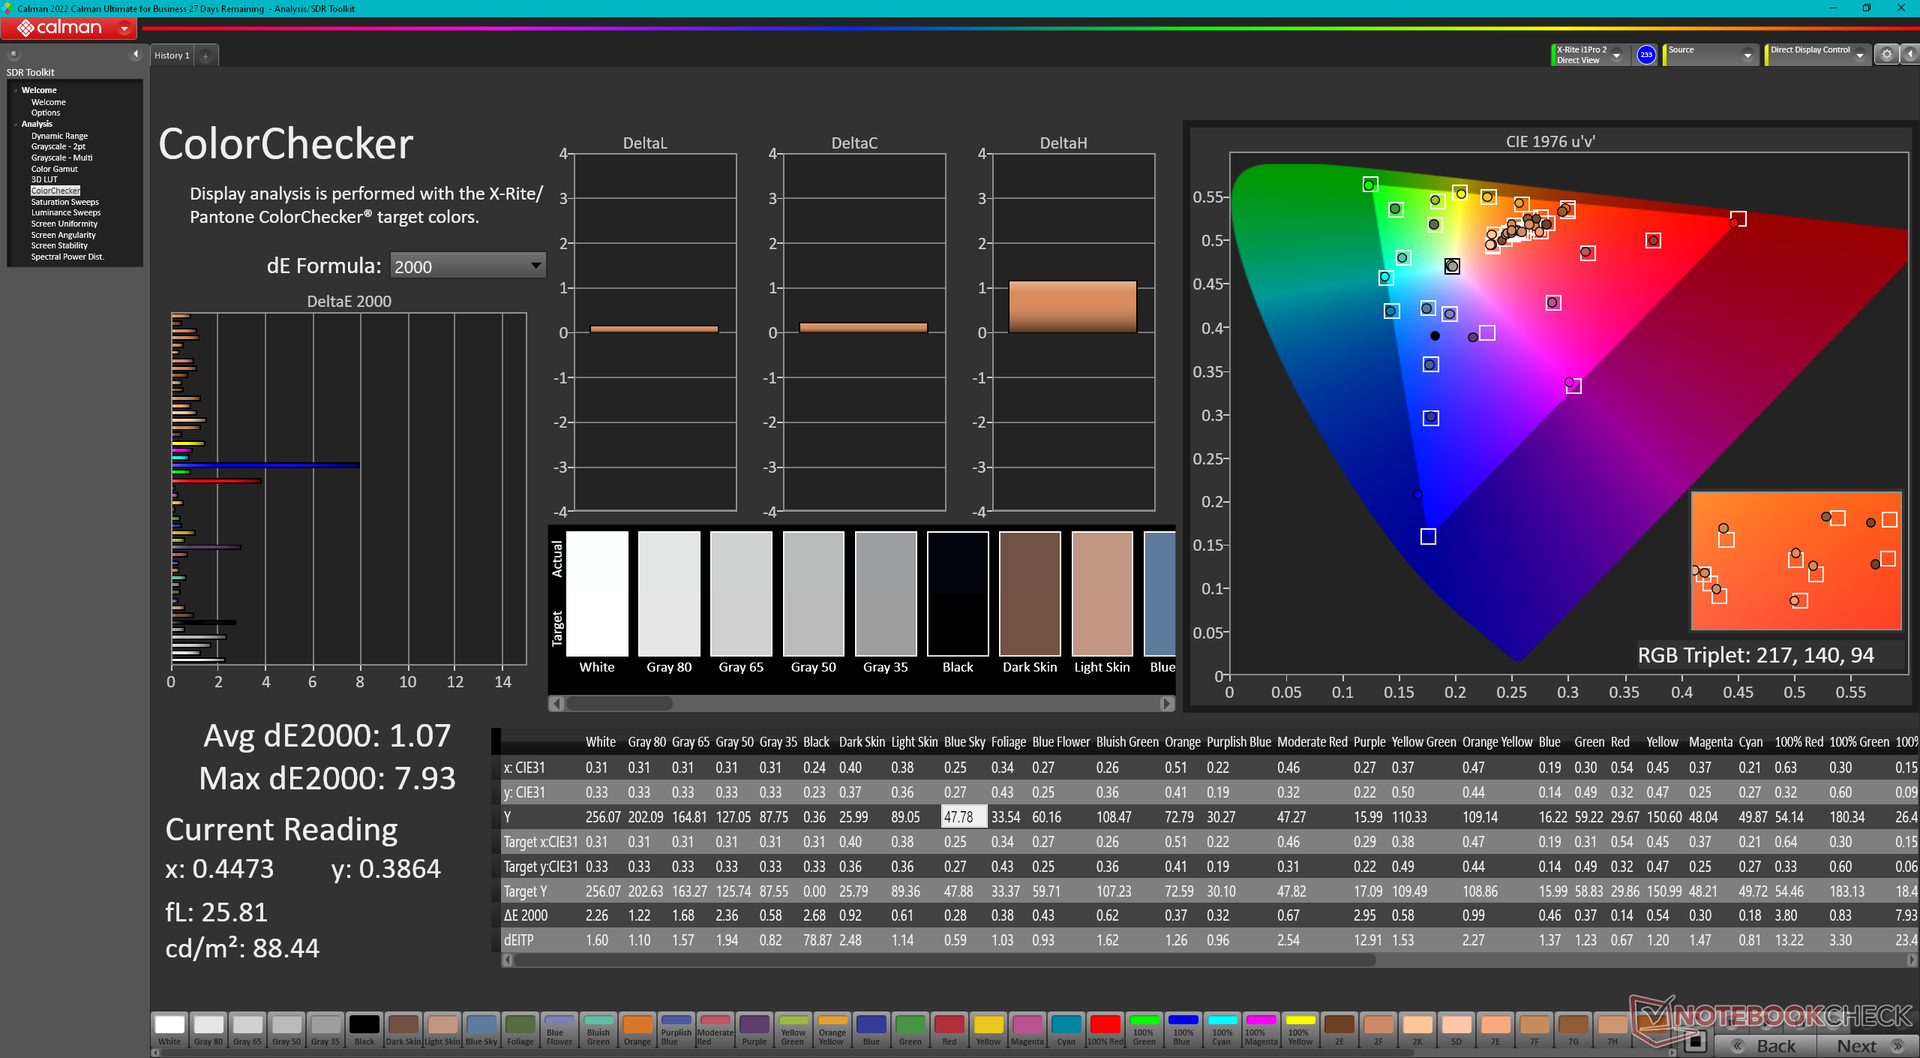
calibrated: 1.07
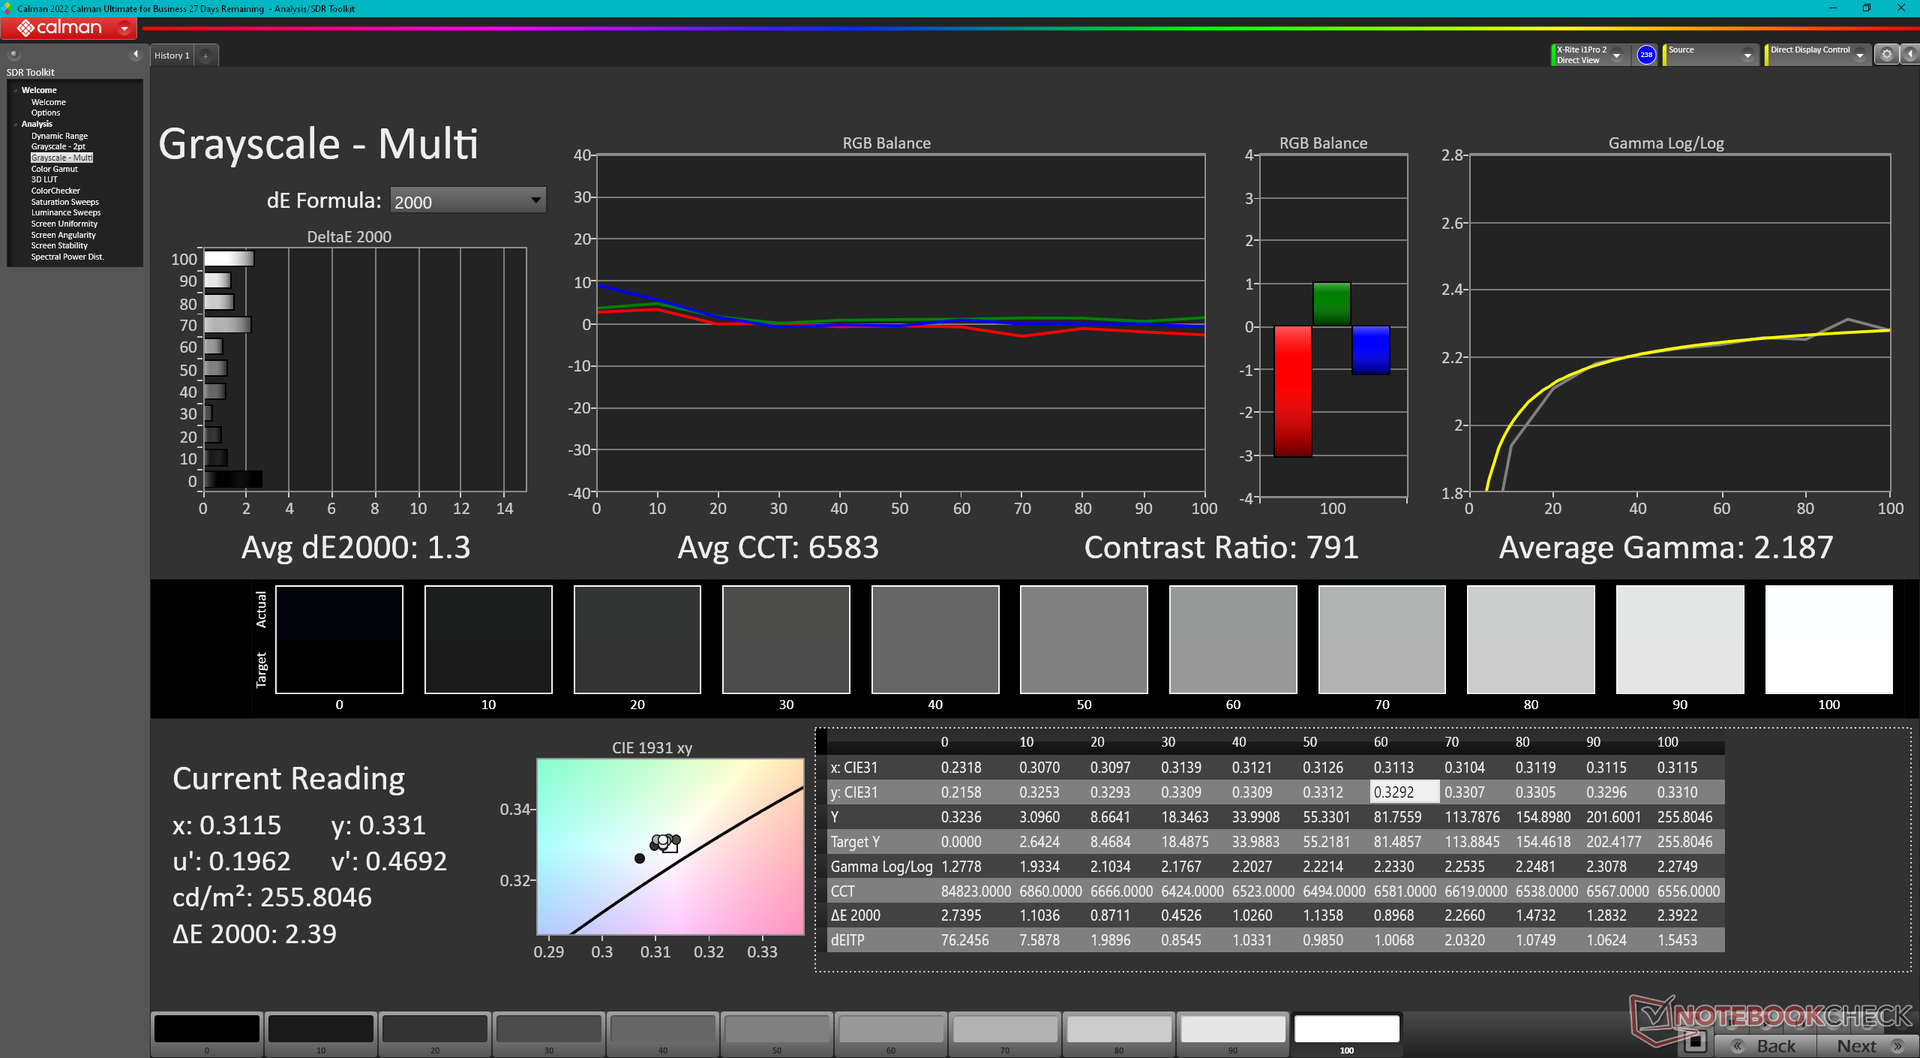
ΔE Greyscale Calman: 12.7 | ∀{0.09-98 Ø4.96}
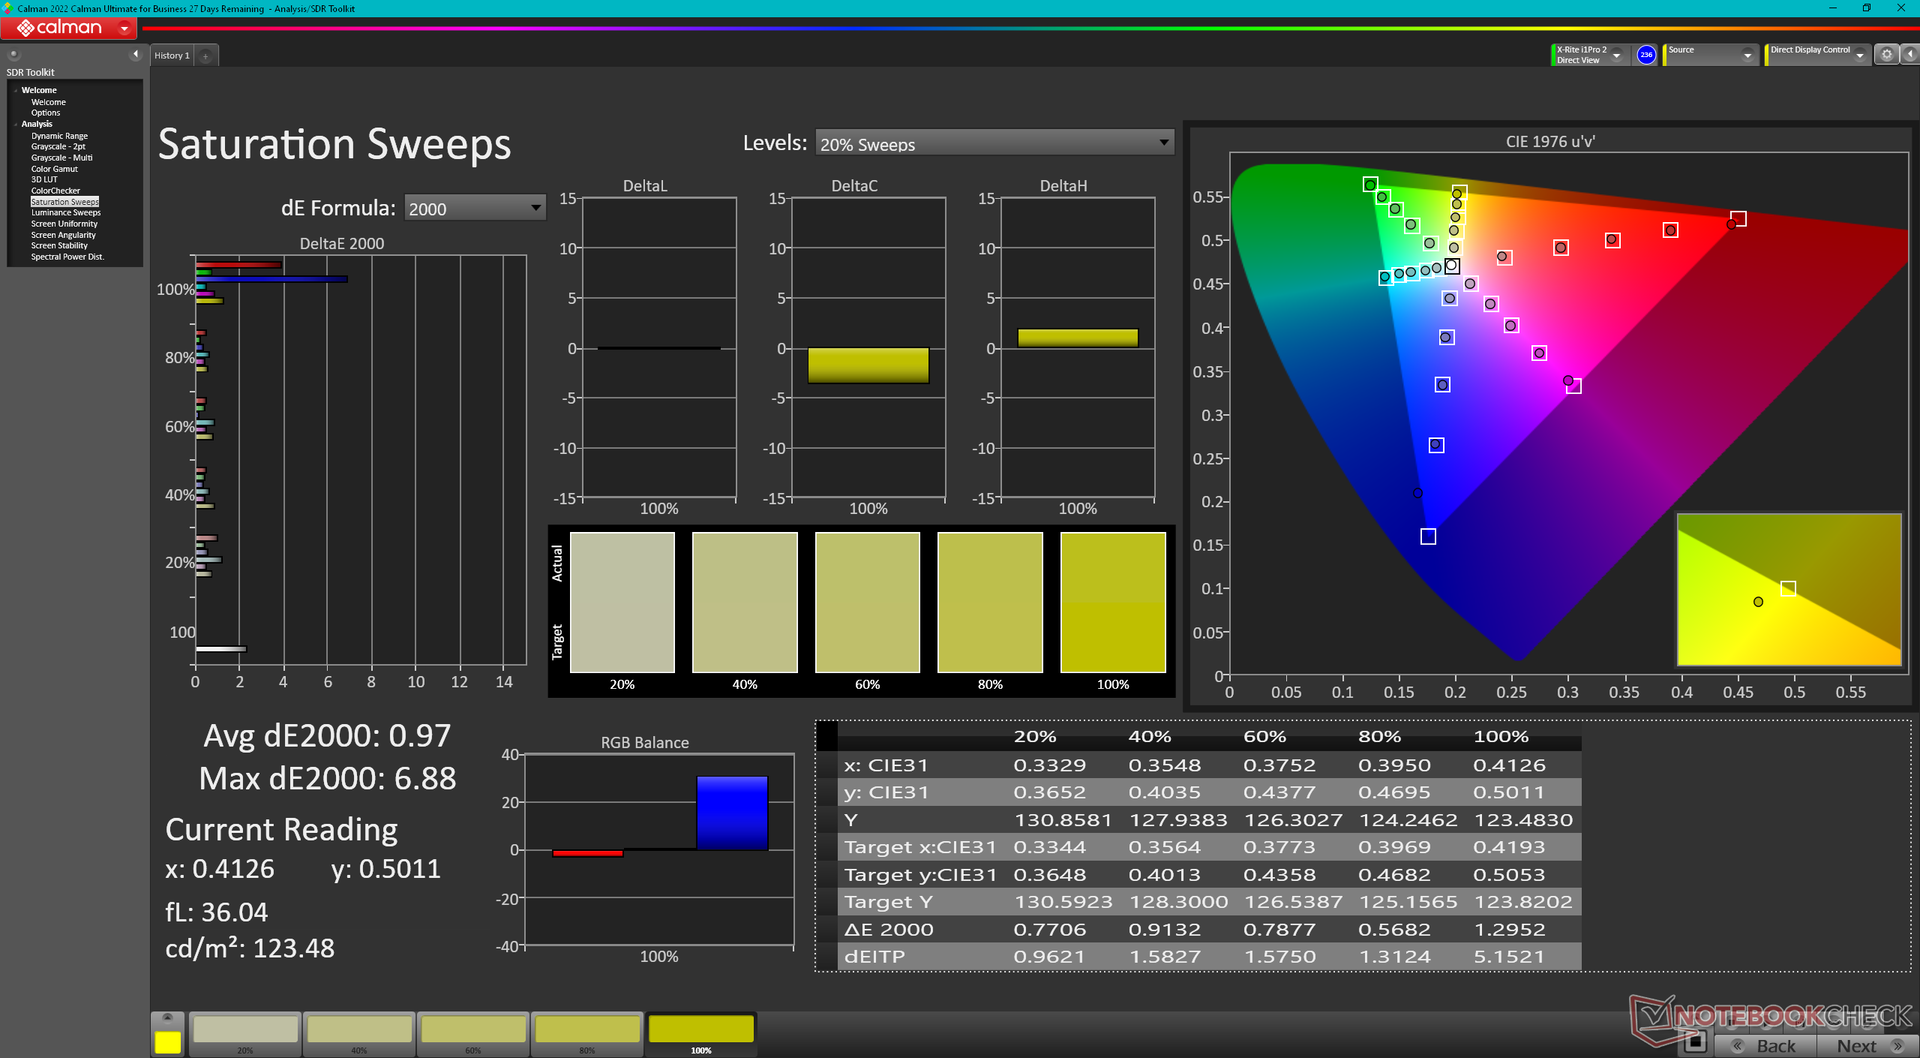
73.4% AdobeRGB 1998 (Argyll 3D)
92.6% sRGB (Argyll 3D)
72.3% Display P3 (Argyll 3D)
Gamma: 2.7
CCT: 12502 K
| Aokzoe A1 BOE0207, IPS, 1920x1200, 8" | One Netbook XPlayer 2 FLQ8423, IPS, 2560x1600, 8.4" | Asus ROG Ally Z1 Extreme TL070FVSX01-0, IPS, 1920x1080, 7" | GPD Win 4 G1618-04, IPS, 1920x1080, 6" | GPD Win 3 IPS, 1280x720, 5.5" | |
|---|---|---|---|---|---|
| Display | 2% | -6% | -9% | -12% | |
| Display P3 Coverage (%) | 72.3 | 75.4 4% | 65.6 -9% | 63.1 -13% | 59.5 -18% |
| sRGB Coverage (%) | 92.6 | 97 5% | 92.1 -1% | 92 -1% | 89.6 -3% |
| AdobeRGB 1998 Coverage (%) | 73.4 | 71.1 -3% | 67.9 -7% | 64.6 -12% | 61.4 -16% |
| Response Times | -18% | 68% | 4% | -30% | |
| Response Time Grey 50% / Grey 80% * (ms) | 28.9 ? | 36.8 ? -27% | 10.5 ? 64% | 26.8 ? 7% | 40 ? -38% |
| Response Time Black / White * (ms) | 21.1 ? | 22.8 ? -8% | 6 ? 72% | 20.9 ? 1% | 25.6 ? -21% |
| PWM Frequency (Hz) | 9970.7 | ||||
| Screen | 8% | 42% | 14% | 6% | |
| Brightness middle (cd/m²) | 328.4 | 369 12% | 513 56% | 413.1 26% | 468.8 43% |
| Brightness (cd/m²) | 323 | 363 12% | 474 47% | 407 26% | 460 42% |
| Brightness Distribution (%) | 92 | 89 -3% | 84 -9% | 81 -12% | 93 1% |
| Black Level * (cd/m²) | 0.39 | 0.28 28% | 0.38 3% | 0.39 -0% | 0.45 -15% |
| Contrast (:1) | 842 | 1318 57% | 1350 60% | 1059 26% | 1042 24% |
| Colorchecker dE 2000 * | 10.17 | 7.1 30% | 3.7 64% | 6.97 31% | 9 12% |
| Colorchecker dE 2000 max. * | 18.14 | 10.9 40% | 8.3 54% | 14.11 22% | 15.5 15% |
| Colorchecker dE 2000 calibrated * | 1.07 | 2.6 -143% | 1.24 -16% | 1.91 -79% | |
| Greyscale dE 2000 * | 12.7 | 8.3 35% | 5.1 60% | 9.9 22% | 10.9 14% |
| Gamma | 2.7 81% | 2.01 109% | 2.14 103% | 2.04 108% | 2.13 103% |
| CCT | 12502 52% | 8838 74% | 7732 84% | 9571 68% | 10972 59% |
| Color Space (Percent of AdobeRGB 1998) (%) | 56.6 | ||||
| Color Space (Percent of sRGB) (%) | 89.2 | ||||
| Media totale (Programma / Settaggio) | -3% /
3% | 35% /
35% | 3% /
8% | -12% /
-3% |
* ... Meglio usare valori piccoli
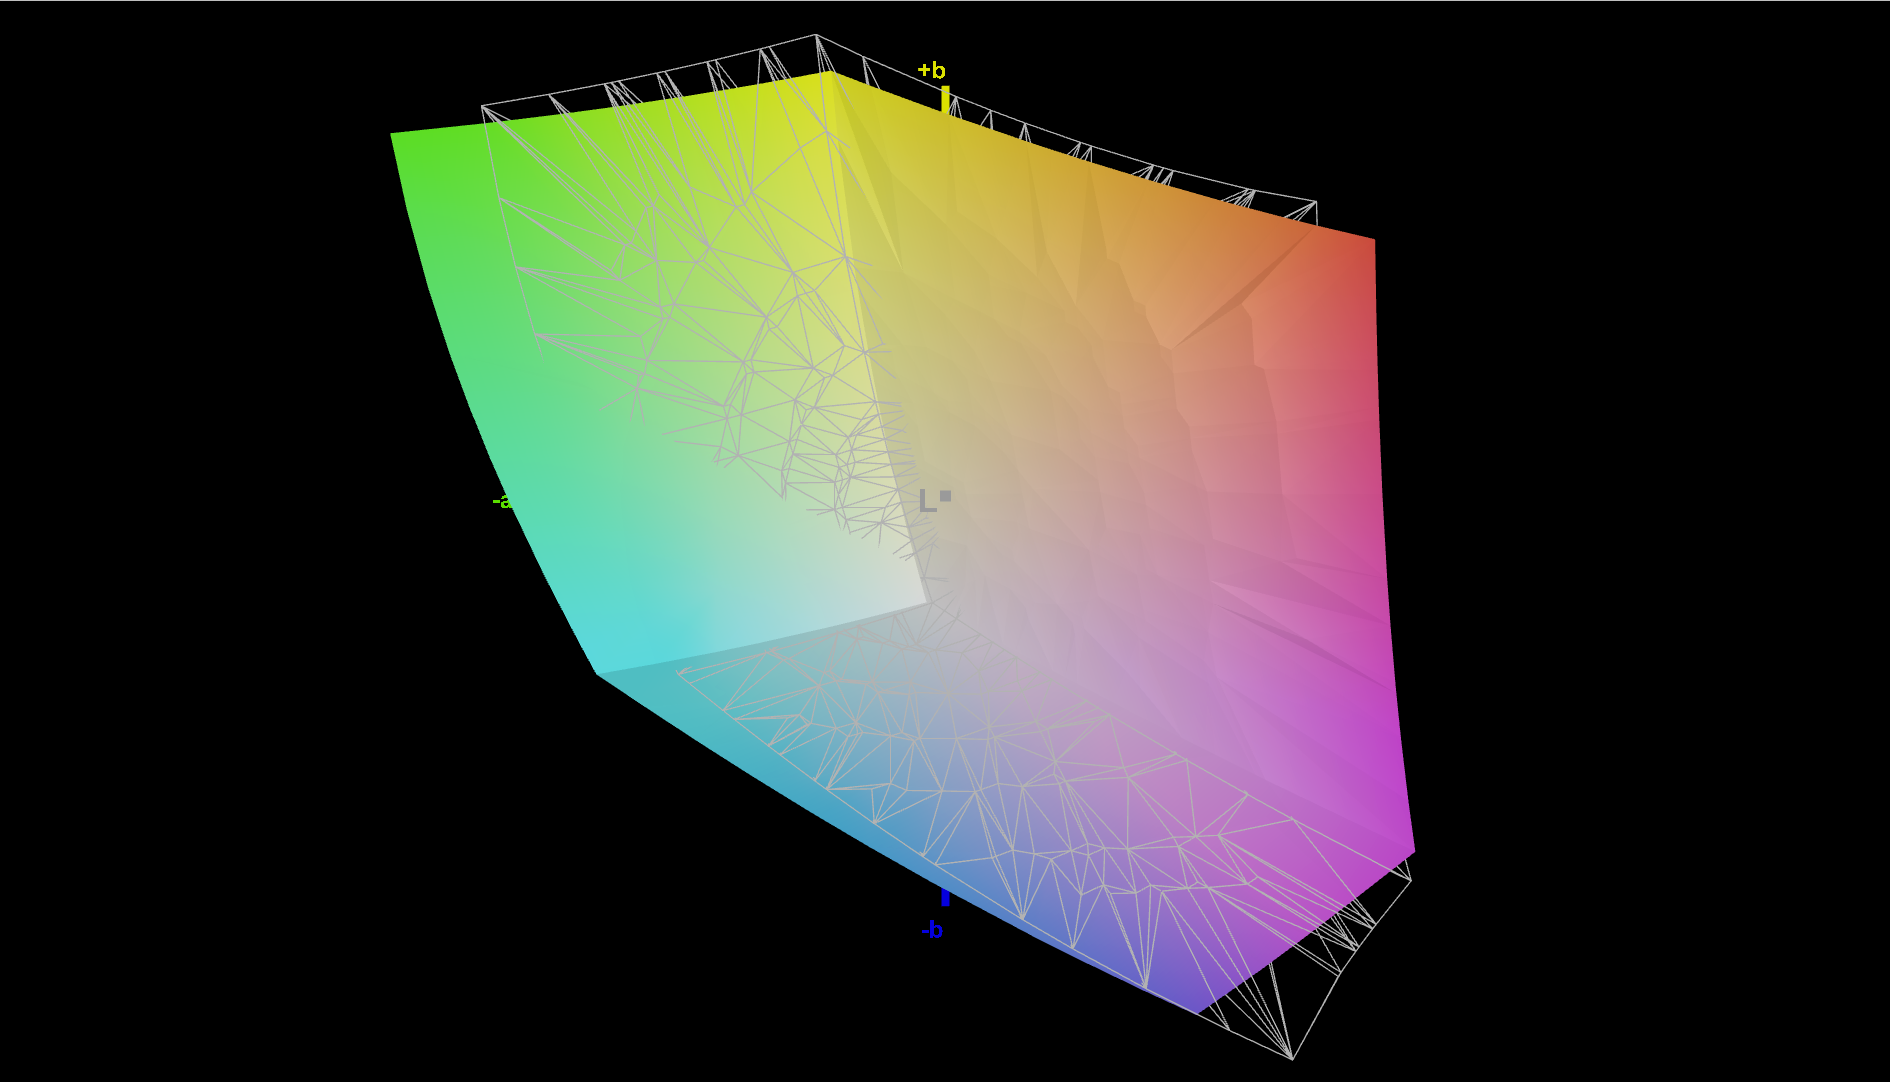
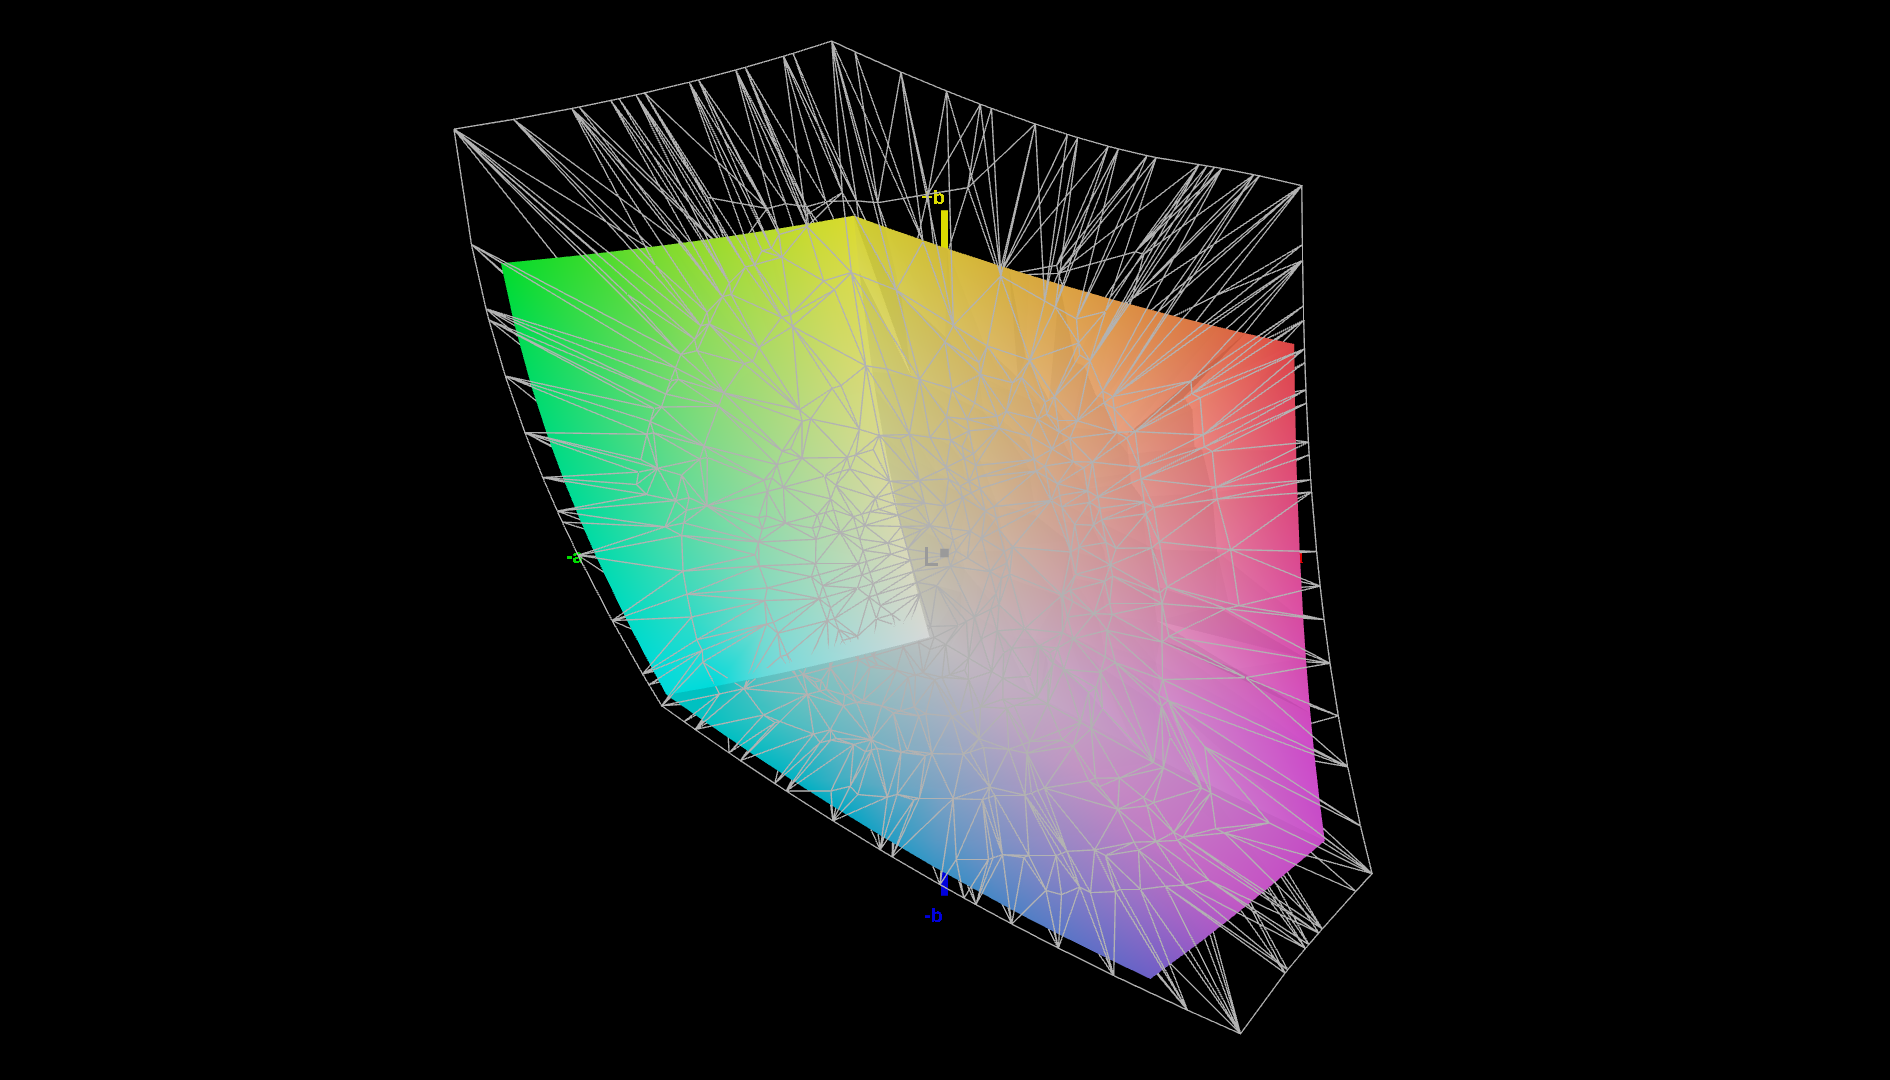
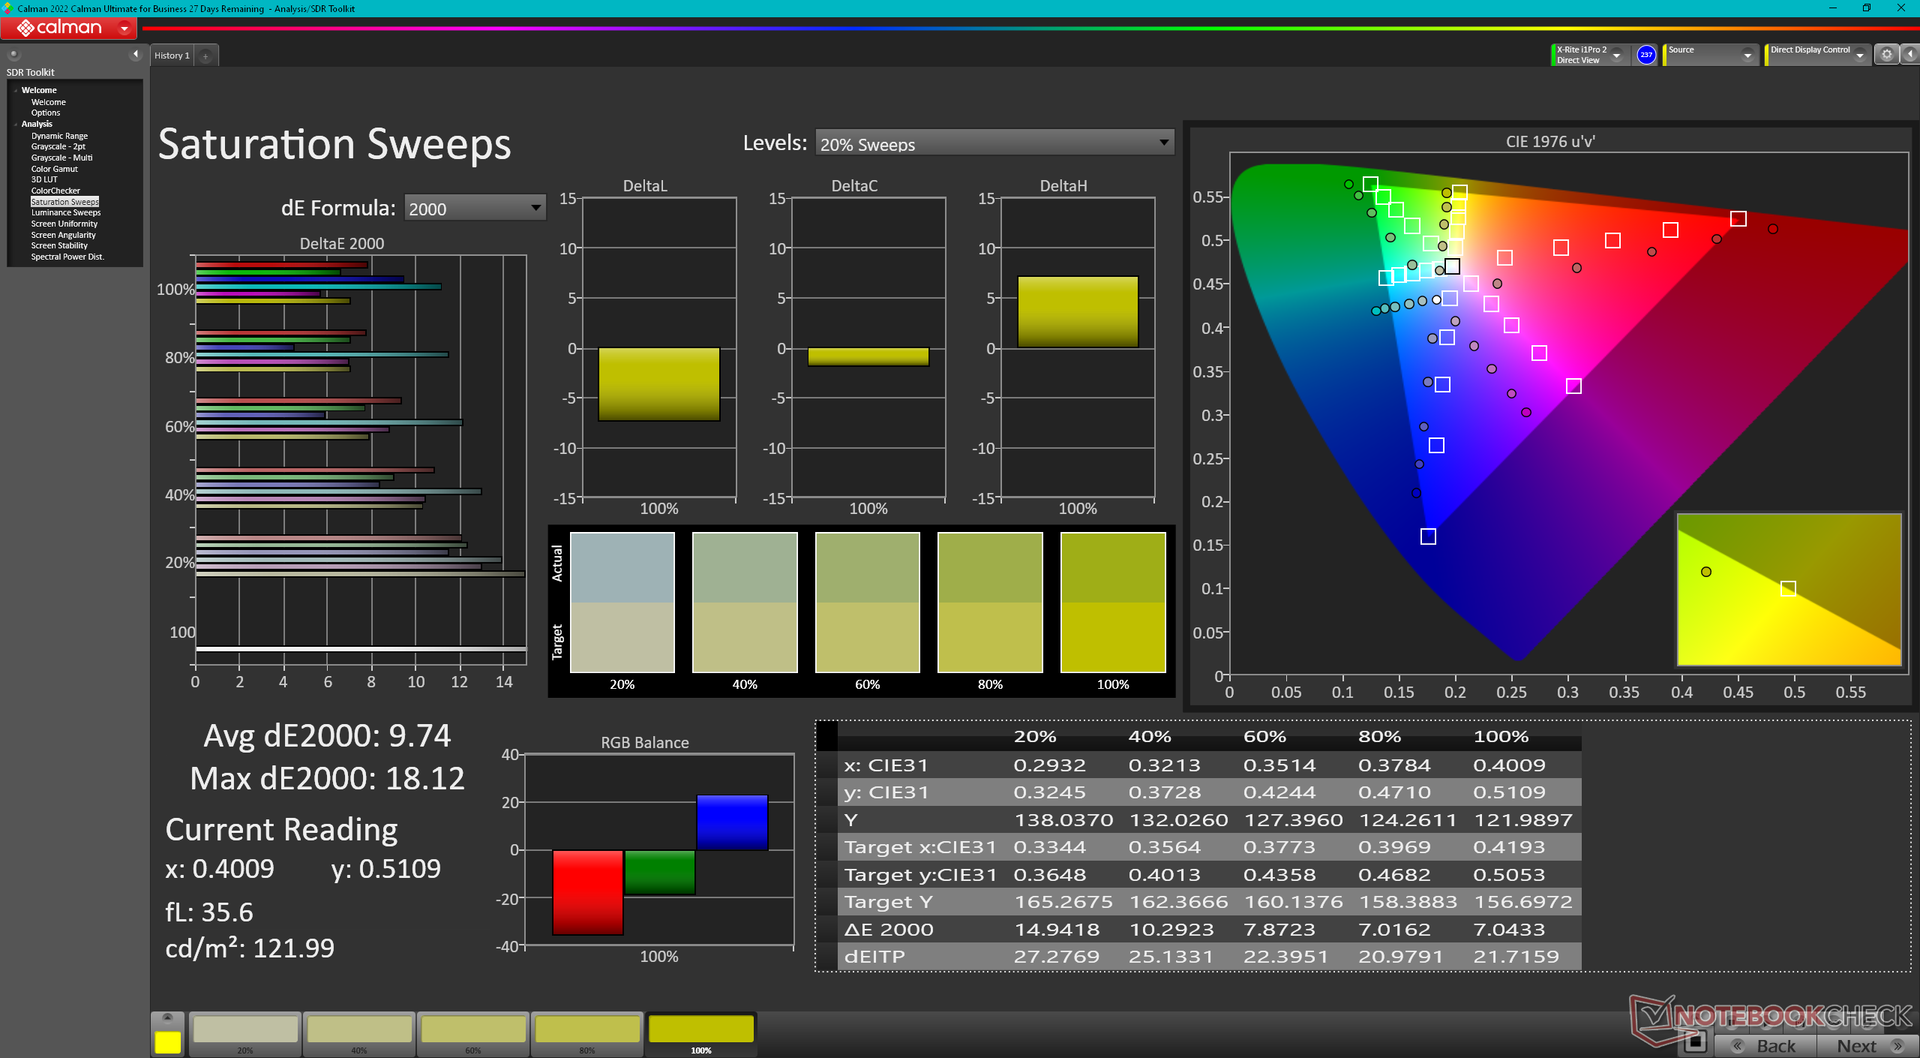
Il display è calibrato in modo molto scarso, in quanto la temperatura del colore è troppo fredda. Consigliamo di applicare il nostro profilo ICM calibrato sopra per ottenere di più dal display, soprattutto perché copre oltre il 90% dello standard sRGB.
Tempi di risposta del Display
| ↔ Tempi di risposta dal Nero al Bianco | ||
|---|---|---|
| 21.1 ms ... aumenta ↗ e diminuisce ↘ combinato | ↗ 11.1 ms Incremento | 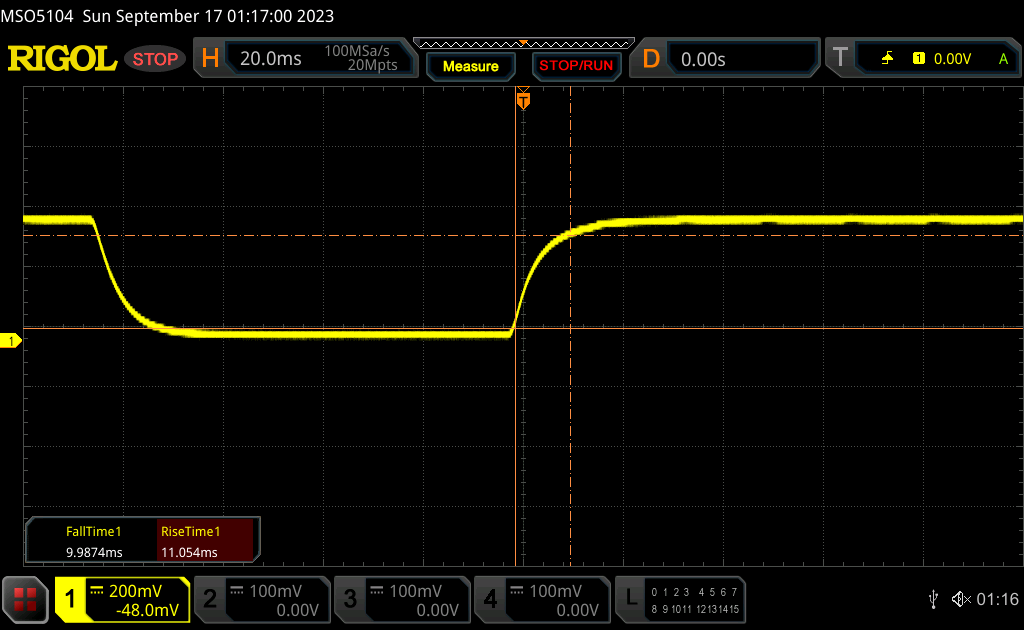 |
| ↘ 10 ms Calo | ||
| Lo schermo mostra buoni tempi di risposta durante i nostri tests, ma potrebbe essere troppo lento per i gamers competitivi. In confronto, tutti i dispositivi di test variano da 0.1 (minimo) a 240 (massimo) ms. » 47 % di tutti i dispositivi è migliore. Questo significa che i tempi di risposta rilevati sono simili alla media di tutti i dispositivi testati (19.8 ms). | ||
| ↔ Tempo di risposta dal 50% Grigio all'80% Grigio | ||
| 28.9 ms ... aumenta ↗ e diminuisce ↘ combinato | ↗ 13.8 ms Incremento | 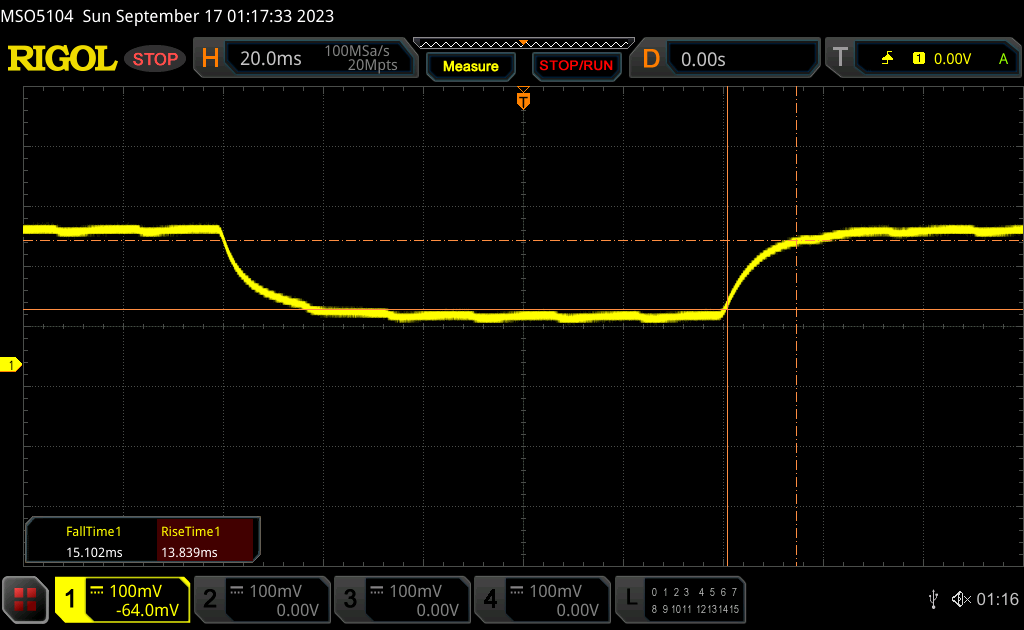 |
| ↘ 15.1 ms Calo | ||
| Lo schermo mostra tempi di risposta relativamente lenti nei nostri tests e potrebbe essere troppo lento per i gamers. In confronto, tutti i dispositivi di test variano da 0.165 (minimo) a 636 (massimo) ms. » 39 % di tutti i dispositivi è migliore. Questo significa che i tempi di risposta rilevati sono simili alla media di tutti i dispositivi testati (31 ms). | ||
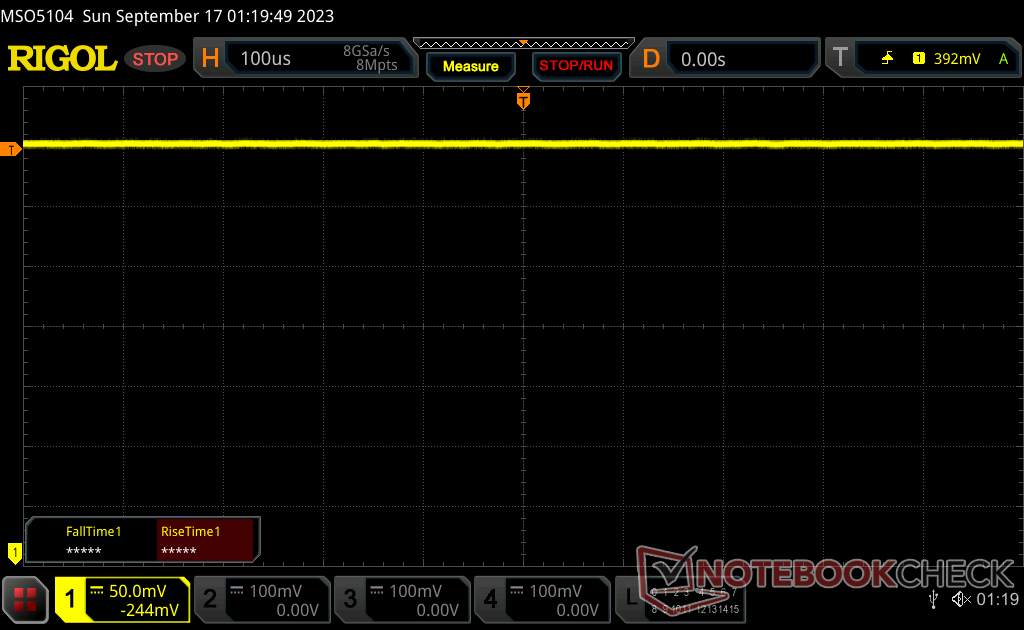
Sfarfallio dello schermo / PWM (Pulse-Width Modulation)
| flickering dello schermo / PWM rilevato | 9970.7 Hz | 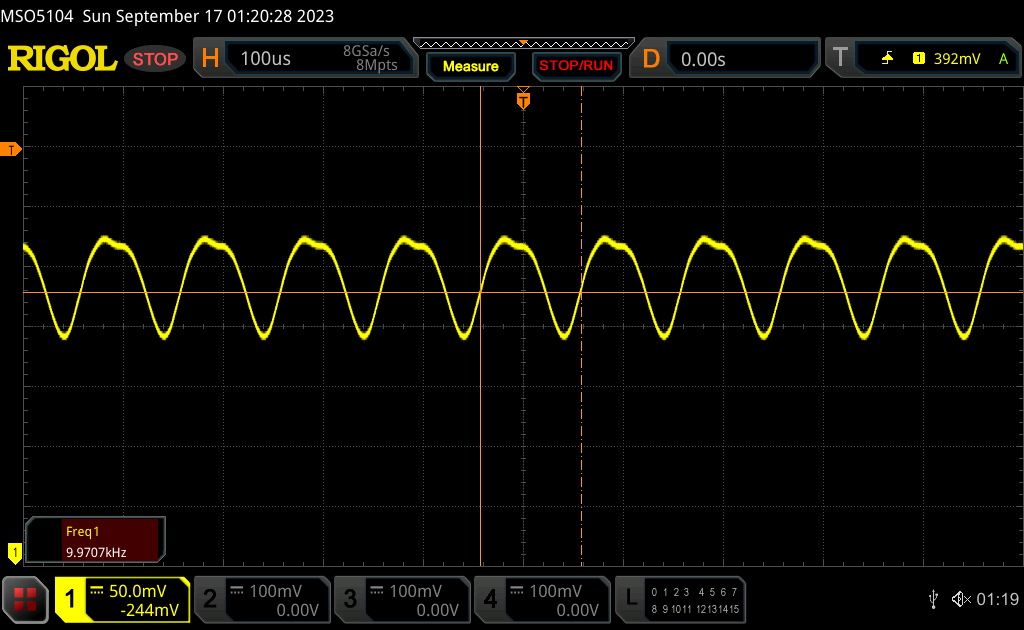 | |
Il display sfarfalla a 9970.7 Hz (Probabilmente a causa dell'uso di PWM) . La frequenza di 9970.7 Hz è abbastanza alta, quindi la maggioranza degli utenti sensibili al PWM non dovrebbero notare alcun flickering. In confronto: 52 % di tutti i dispositivi testati non utilizza PWM per ridurre la luminosita' del display. Se è rilevato PWM, una media di 7757 (minimo: 5 - massimo: 343500) Hz è stata rilevata. | |||
La modulazione di larghezza di impulso (PWM) è presente su tutti i livelli di luminosità fino al 99%. Questo purtroppo rende il pannello A1 IPS uno dei pochissimi ad avere la PWM, dato che la maggior parte degli altri display IPS non presenta alcuno sfarfallio, indipendentemente dall'impostazione della luminosità.
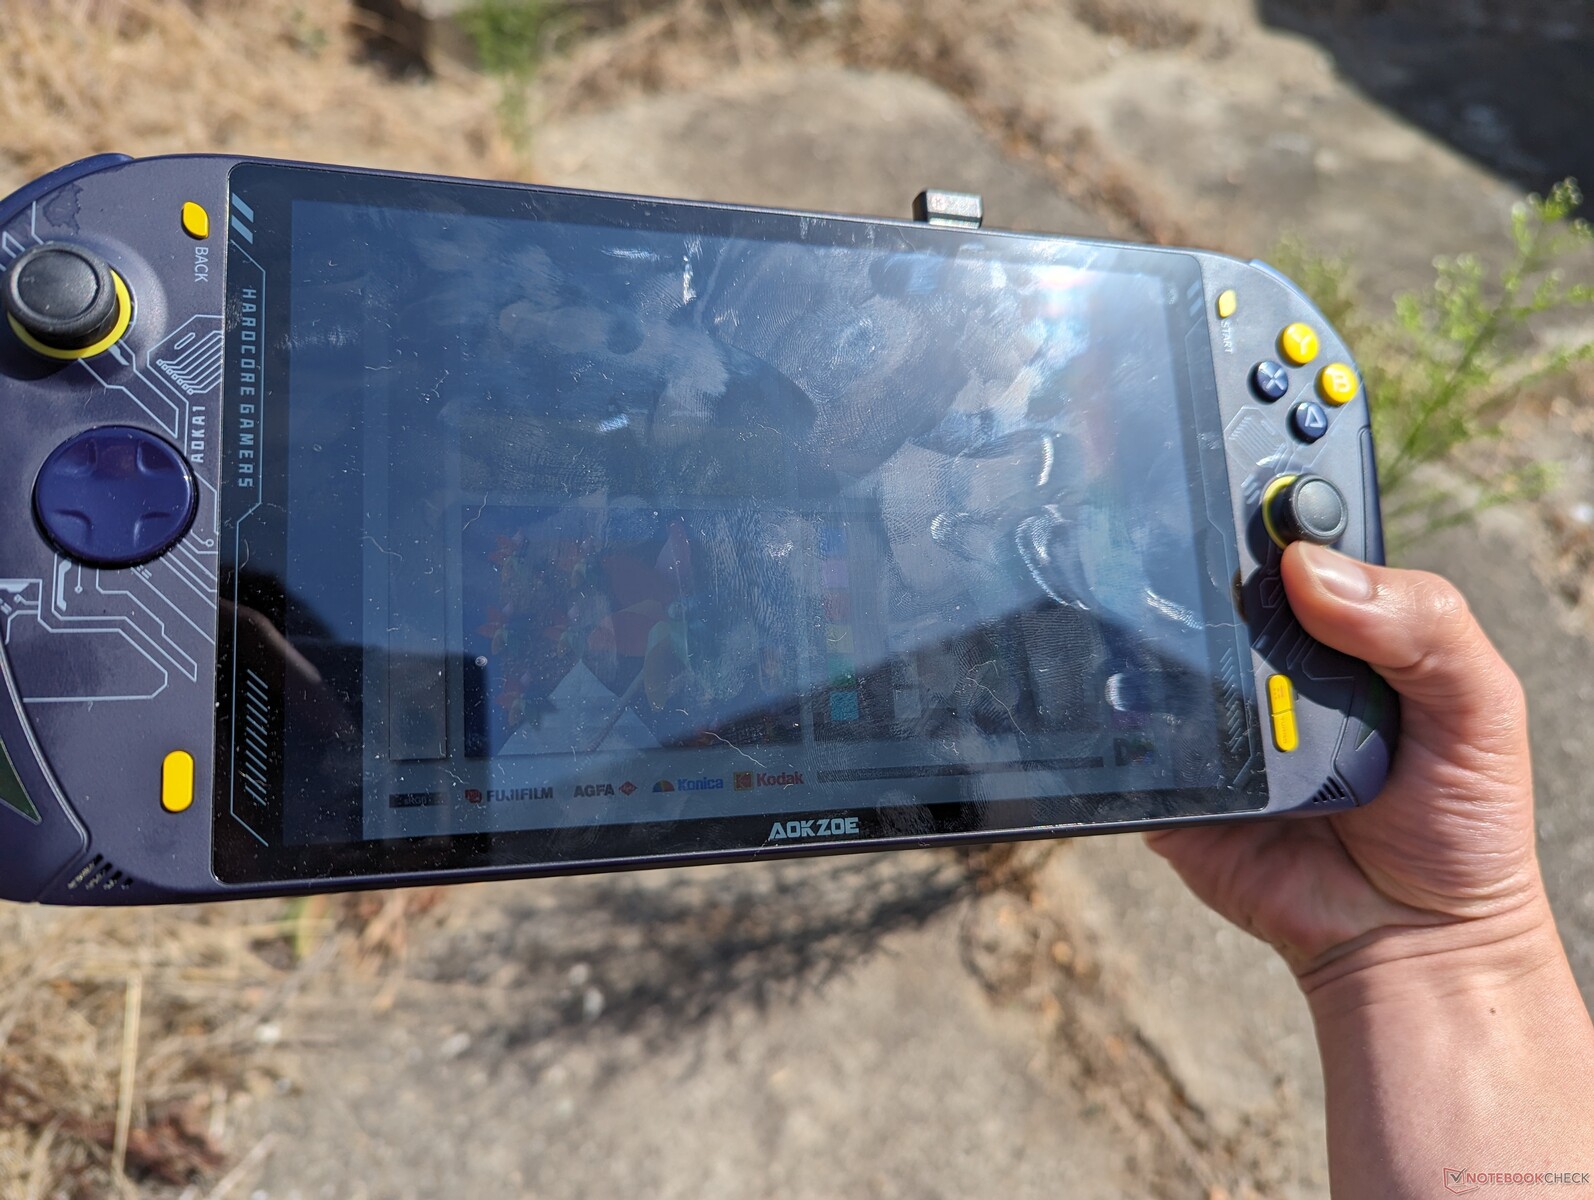
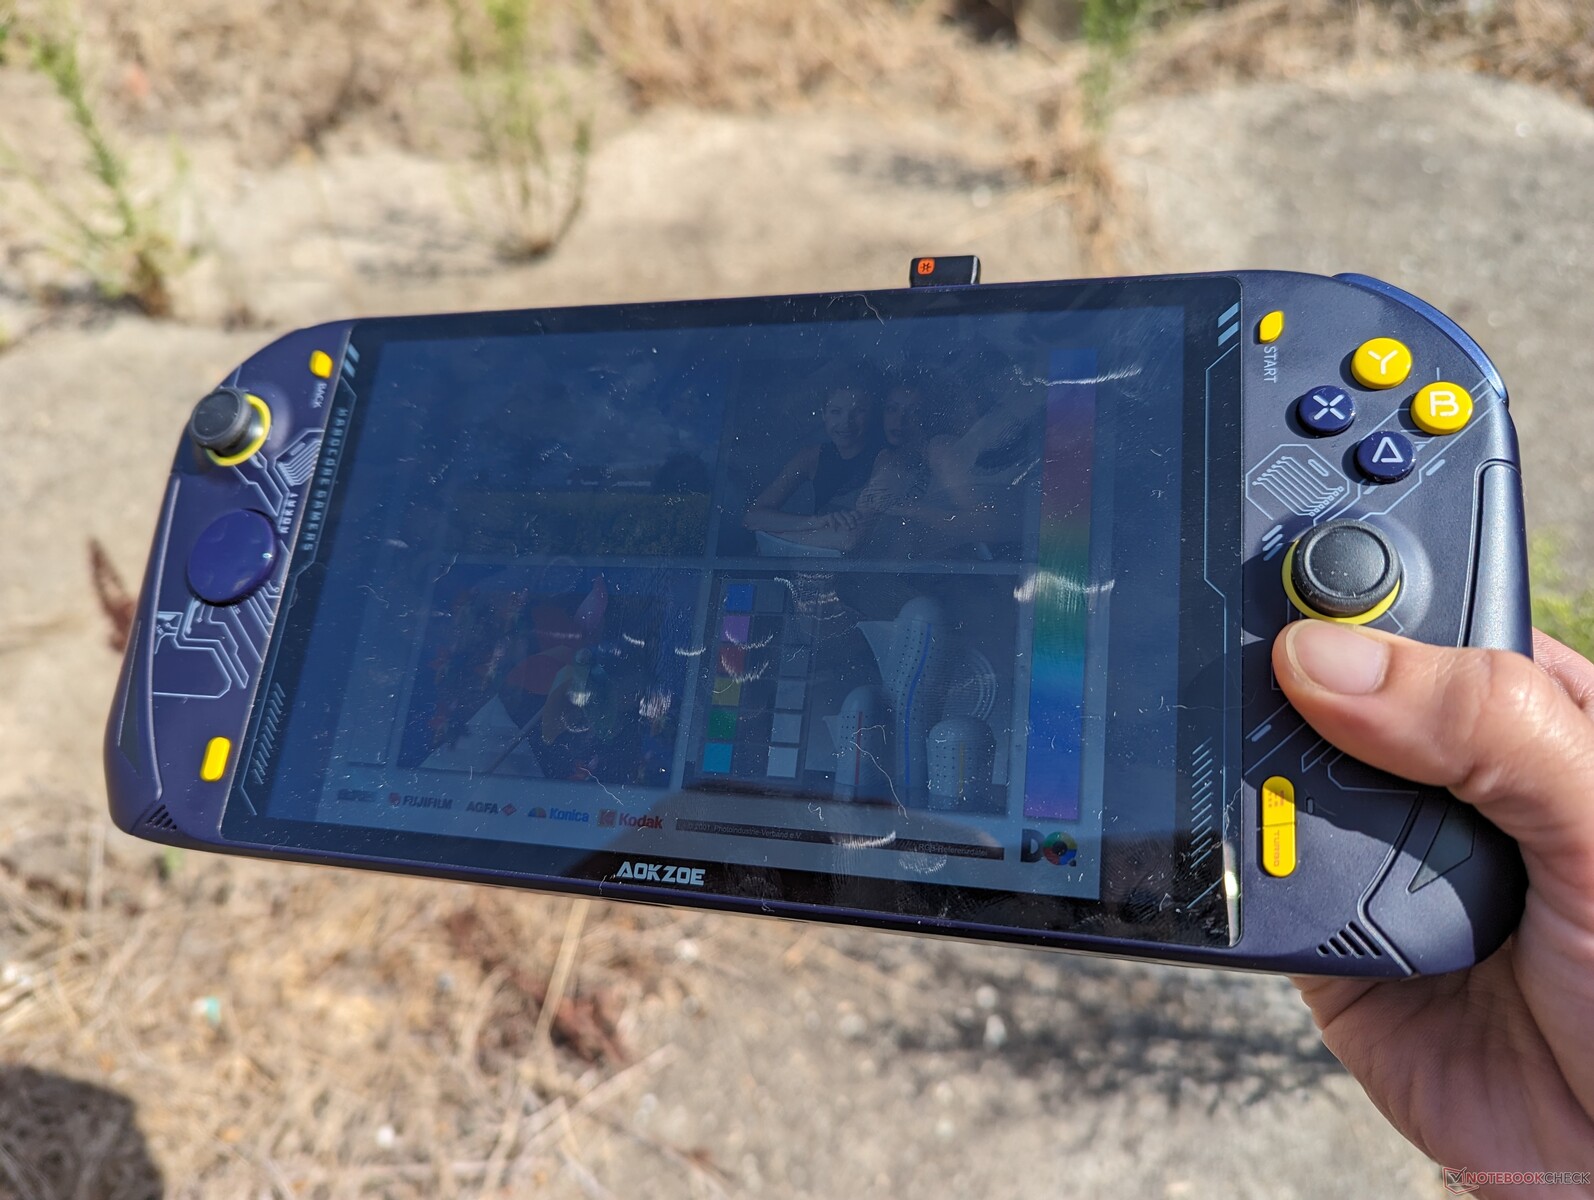
La visibilità all'aperto è al massimo decente, anche quando è all'ombra. Lo schermo lucido invita al riflesso e i colori appaiono sbiaditi dalla limitata luminosità della retroilluminazione. I testi e gli elementi dell'HUD sono particolarmente difficili da leggere quando si gioca all'aperto, poiché sono molto più piccoli e meno luminosi rispetto a un monitor desktop. IlROG Ally ha uno schermo molto più luminoso.
Assicurarsi di disabilitare AMD Vari-Bright, altrimenti la luminosità massima diminuirà se si utilizza la batteria.

Prestazioni: veloce come i moderni Ultrabook
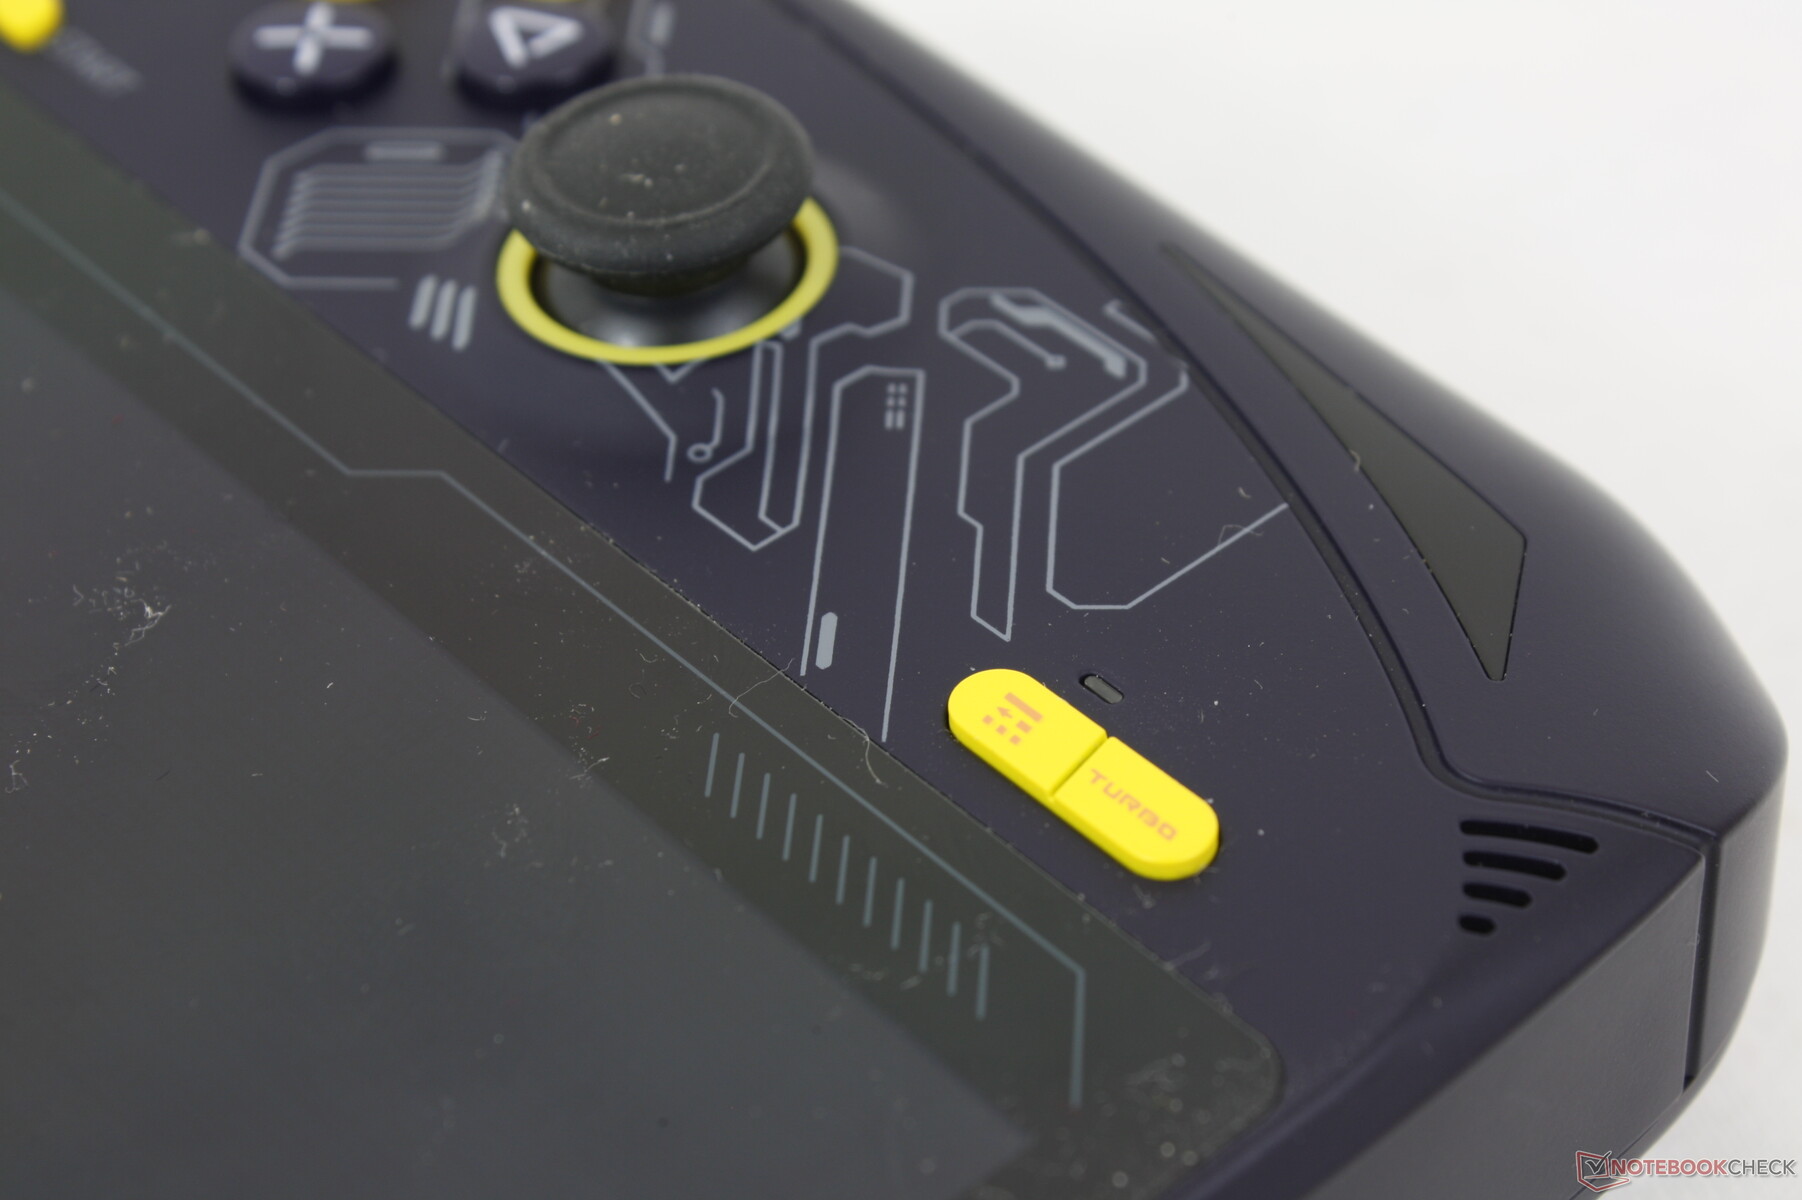
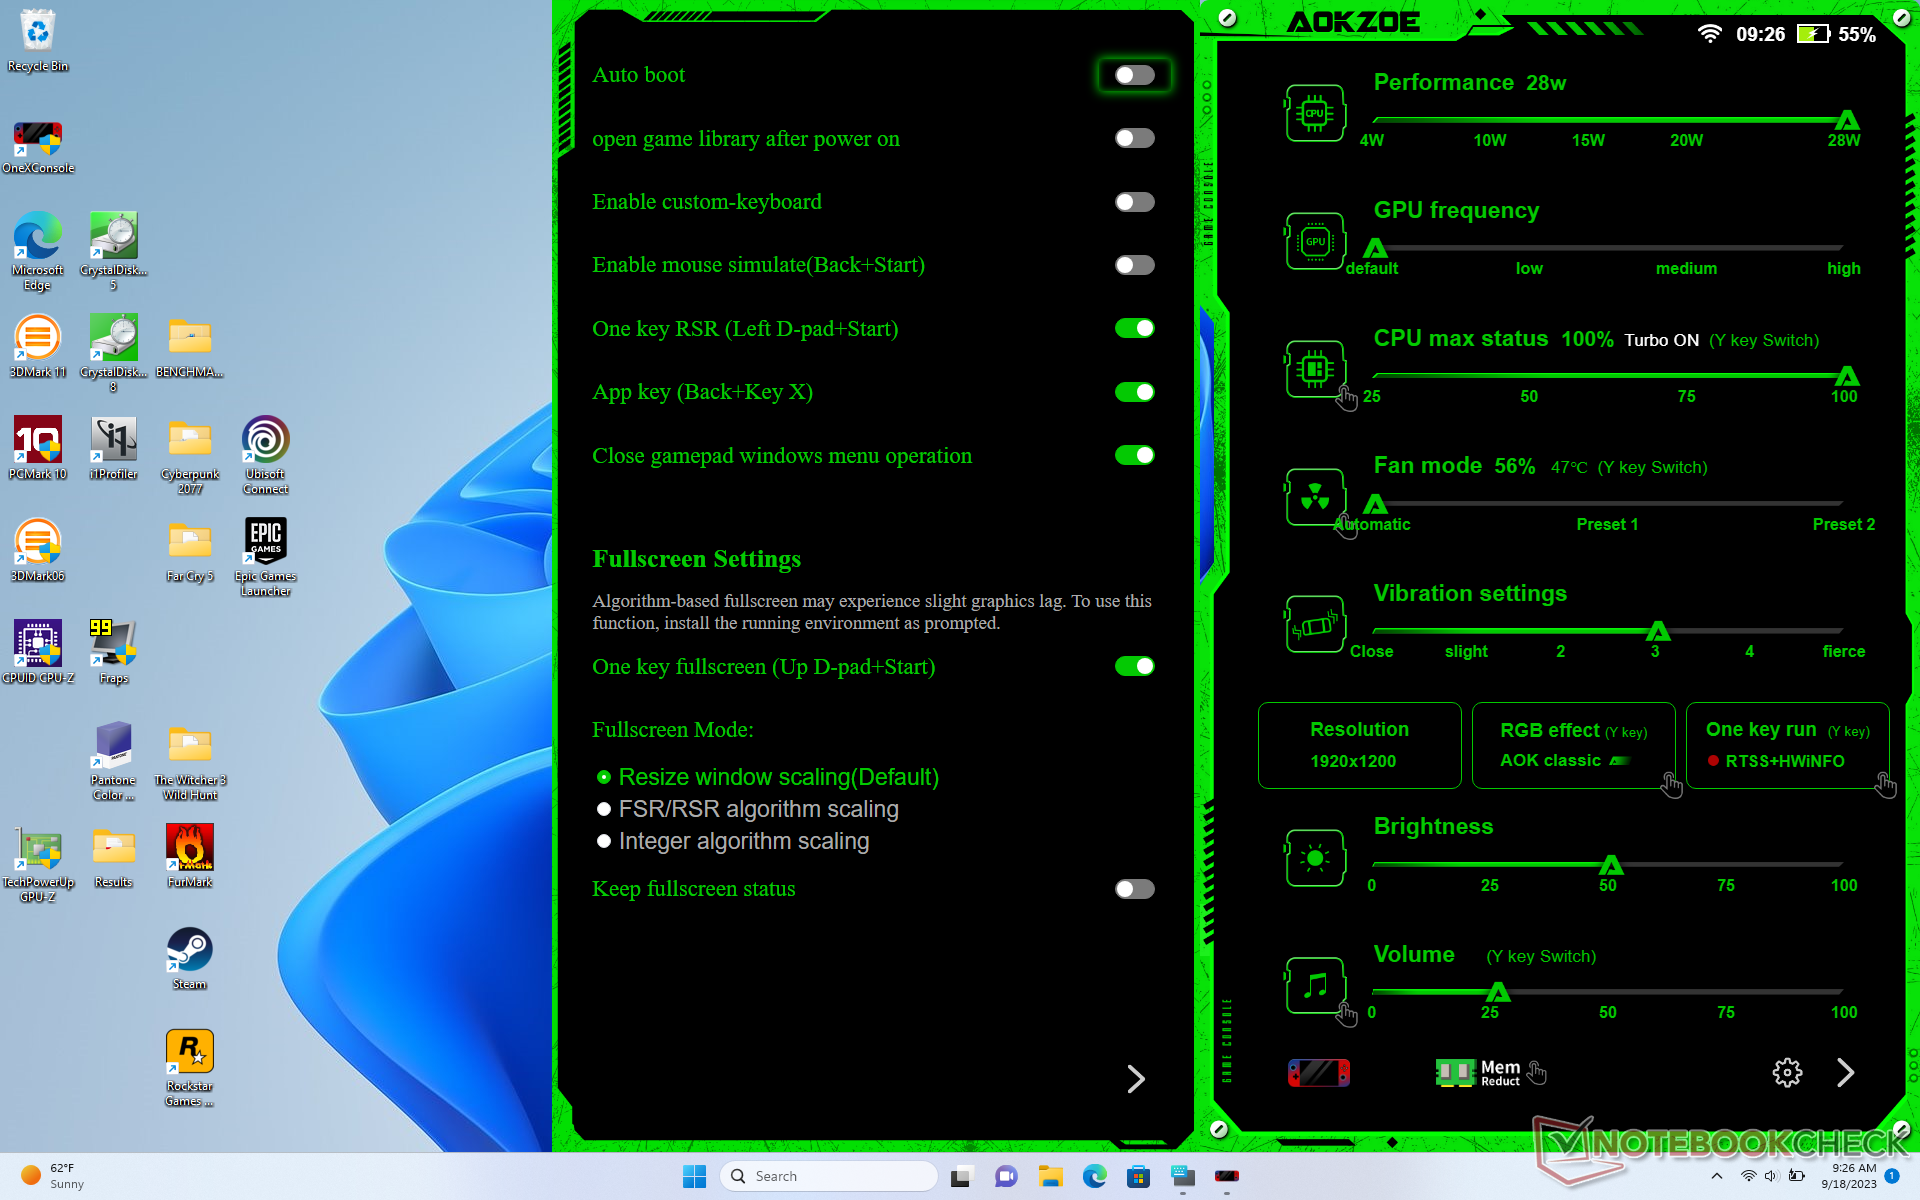
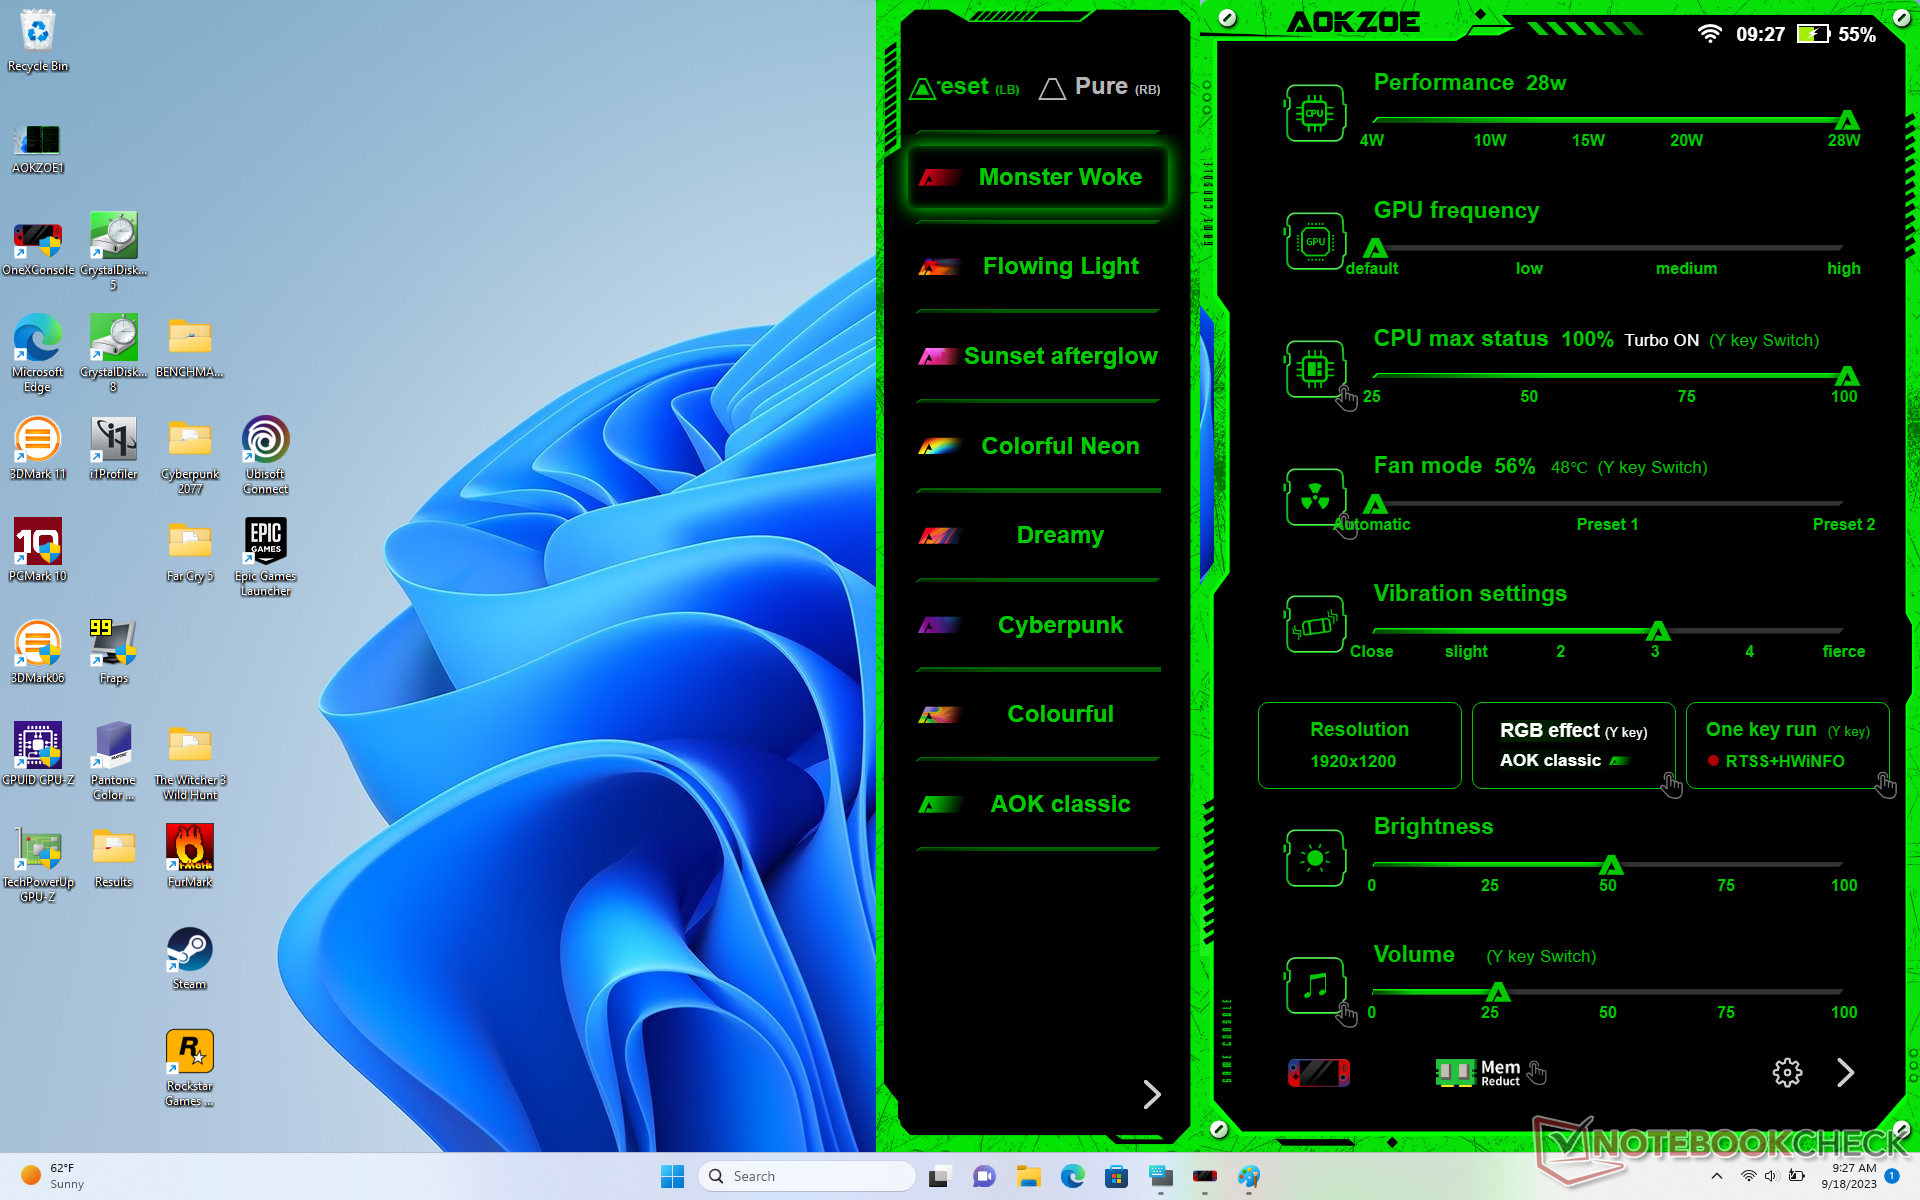
Condizioni di test
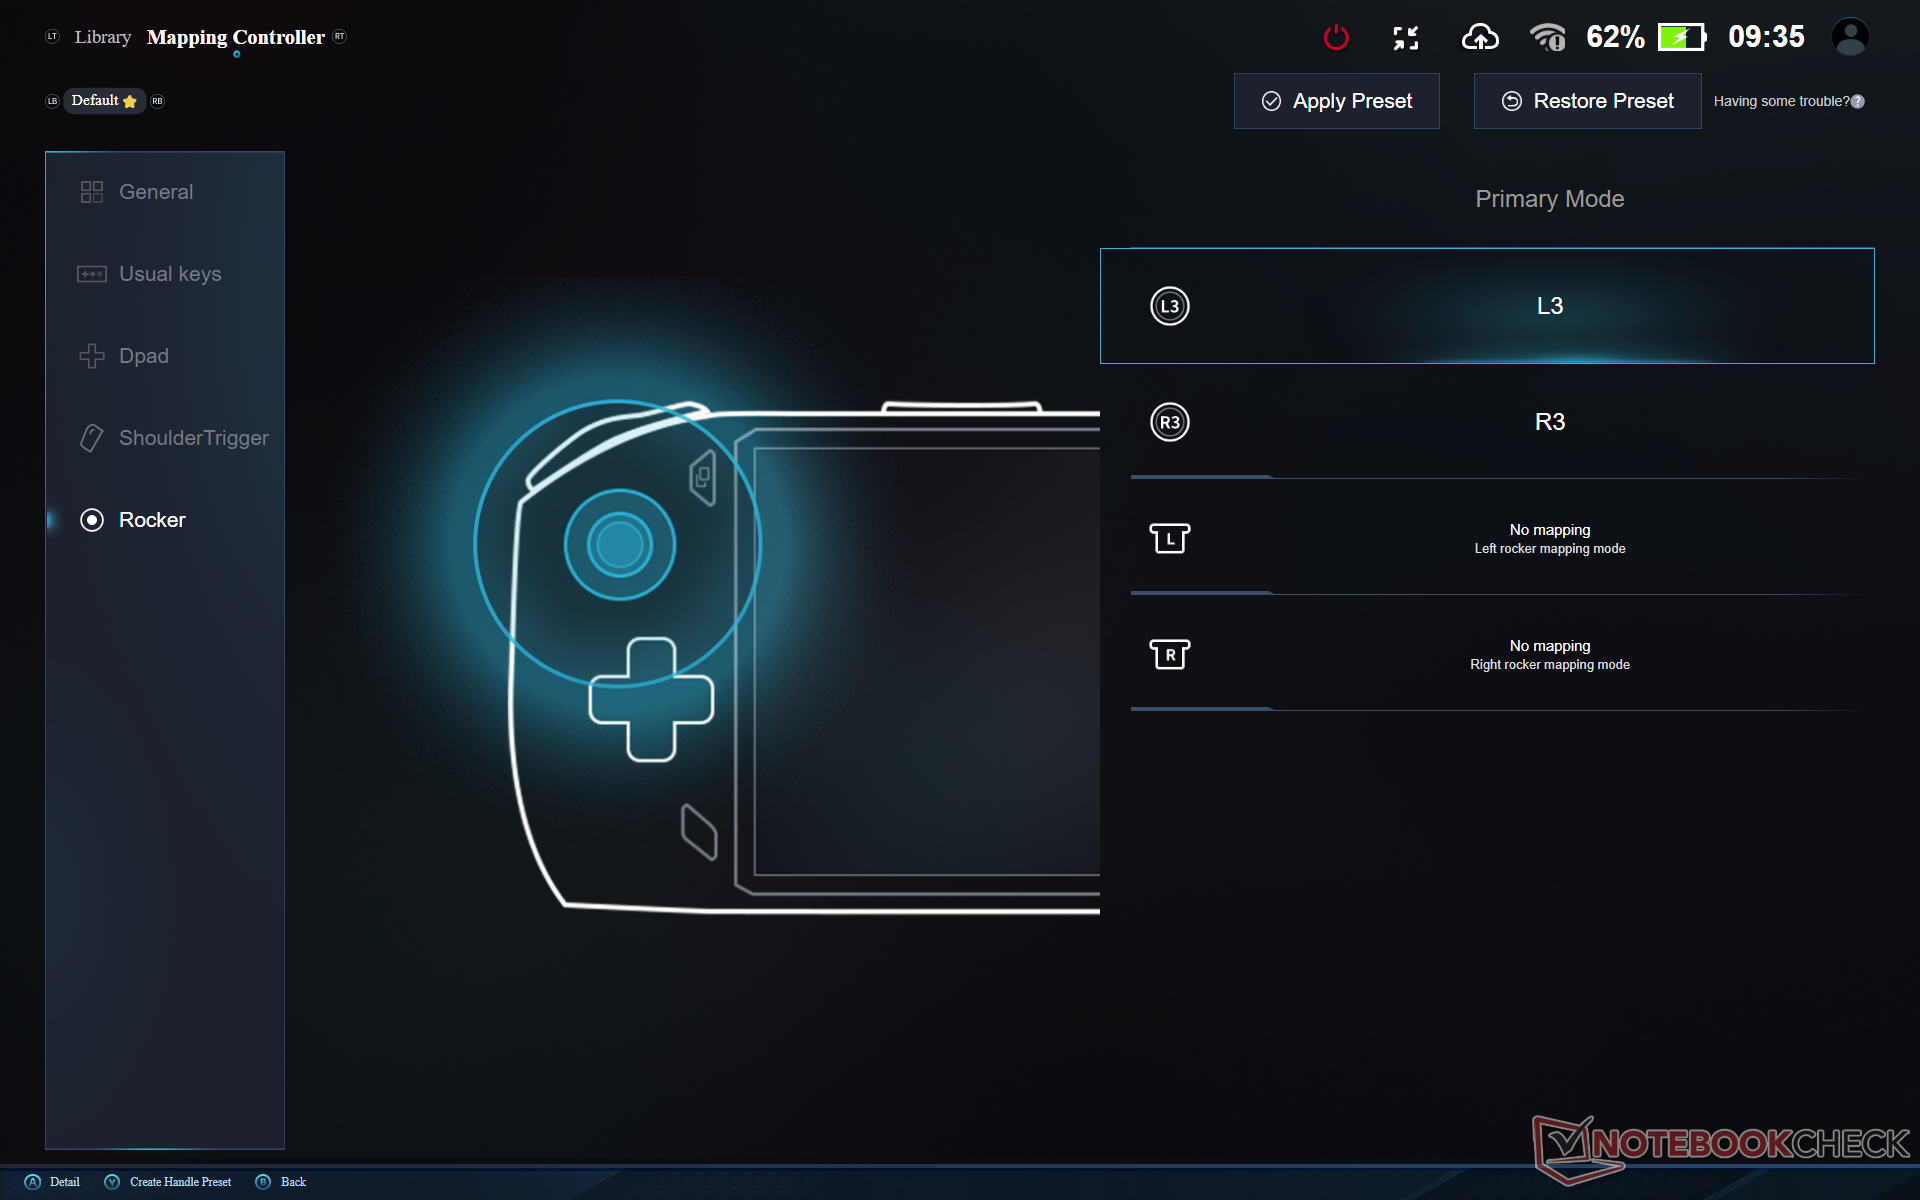
Per impostazione predefinita, il sistema è impostato sulla modalità Bilanciata e la CPU solo su 15 W. Abbiamo invece impostato Windows in modalità Prestazioni e la CPU a 28 W prima di eseguire i benchmark qui sotto. Per accedere a quest'ultima modalità è sufficiente premere il pulsante giallo Turbo in basso a destra dello schermo. Si consiglia agli utenti di familiarizzare con il menu Turbo preinstallato e con le applicazioni OneXConsole per personalizzare le funzioni ausiliarie come i LED frontali o la mappatura dei pulsanti.
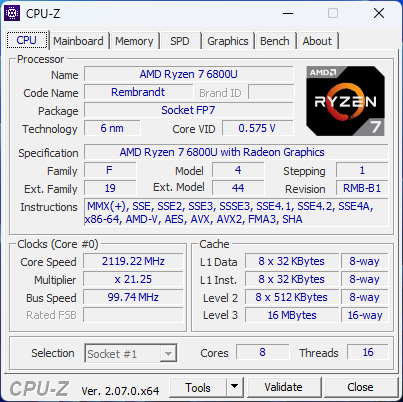
Processore
Le prestazioni della CPU sono eccellenti e paragonabili a quelle dei computer portatili che utilizzano lo stesso Ryzen 7 6800U Nonostante le dimensioni ridotte del nostro palmare A1. Tuttavia, il Ryzen Z1 Extreme nel ROG Ally è del 30% più veloce, mentre ilRyzen 7 7840HS è ancora più veloce, con il 40% in più rispetto al nostro Aokzoe.
Vale la pena di notare che le prestazioni del processore sono più veloci del 25% rispetto al modelloOneXPlayer 2 anche se entrambi i modelli utilizzano lo stesso processore Ryzen 7 6800U. Ciò suggerisce che la CPU del OneXPlayer soffre di un throttling più intenso rispetto al nostro modello A1.
Cinebench R15 Multi Loop
Cinebench R23: Multi Core | Single Core
Cinebench R20: CPU (Multi Core) | CPU (Single Core)
Cinebench R15: CPU Multi 64Bit | CPU Single 64Bit
Blender: v2.79 BMW27 CPU
7-Zip 18.03: 7z b 4 | 7z b 4 -mmt1
Geekbench 5.5: Multi-Core | Single-Core
HWBOT x265 Benchmark v2.2: 4k Preset
LibreOffice : 20 Documents To PDF
R Benchmark 2.5: Overall mean
| CPU Performance rating | |
| Beelink SER7 | |
| Asus ROG Ally Z1 Extreme | |
| Ayaneo Air 1S Retro Power | |
| Aokzoe A1 | |
| GPD Win 4 | |
| Acer Swift Edge SFE16-42-R1GM | |
| Media AMD Ryzen 7 6800U | |
| HP Pavilion Aero 13 be0097nr -2! | |
| Lenovo ThinkPad X13 Yoga G3 21AW003UGE | |
| One Netbook XPlayer 2 -1! | |
| GPD Win Max 2021 -2! | |
| Asus ZenBook 14X OLED UX5400EA-L7154W | |
| GPD Win 3 | |
| Cinebench R23 / Multi Core | |
| Beelink SER7 | |
| Asus ROG Ally Z1 Extreme | |
| Ayaneo Air 1S Retro Power | |
| Aokzoe A1 | |
| Media AMD Ryzen 7 6800U (9130 - 11741, n=7) | |
| GPD Win 4 | |
| Acer Swift Edge SFE16-42-R1GM | |
| One Netbook XPlayer 2 | |
| Lenovo ThinkPad X13 Yoga G3 21AW003UGE | |
| HP Pavilion Aero 13 be0097nr | |
| GPD Win Max 2021 | |
| Asus ZenBook 14X OLED UX5400EA-L7154W | |
| GPD Win 3 | |
| Cinebench R23 / Single Core | |
| Asus ROG Ally Z1 Extreme | |
| Beelink SER7 | |
| Ayaneo Air 1S Retro Power | |
| GPD Win 4 | |
| Aokzoe A1 | |
| Lenovo ThinkPad X13 Yoga G3 21AW003UGE | |
| Acer Swift Edge SFE16-42-R1GM | |
| Asus ZenBook 14X OLED UX5400EA-L7154W | |
| Media AMD Ryzen 7 6800U (878 - 1534, n=7) | |
| HP Pavilion Aero 13 be0097nr | |
| GPD Win 3 | |
| GPD Win Max 2021 | |
| One Netbook XPlayer 2 | |
| Cinebench R20 / CPU (Multi Core) | |
| Beelink SER7 | |
| Asus ROG Ally Z1 Extreme | |
| Ayaneo Air 1S Retro Power | |
| Aokzoe A1 | |
| Media AMD Ryzen 7 6800U (3529 - 4574, n=8) | |
| GPD Win 4 | |
| Acer Swift Edge SFE16-42-R1GM | |
| One Netbook XPlayer 2 | |
| Lenovo ThinkPad X13 Yoga G3 21AW003UGE | |
| HP Pavilion Aero 13 be0097nr | |
| GPD Win Max 2021 | |
| Asus ZenBook 14X OLED UX5400EA-L7154W | |
| GPD Win 3 | |
| Cinebench R20 / CPU (Single Core) | |
| Beelink SER7 | |
| Asus ROG Ally Z1 Extreme | |
| Ayaneo Air 1S Retro Power | |
| GPD Win 4 | |
| Aokzoe A1 | |
| Lenovo ThinkPad X13 Yoga G3 21AW003UGE | |
| Asus ZenBook 14X OLED UX5400EA-L7154W | |
| Media AMD Ryzen 7 6800U (341 - 602, n=8) | |
| HP Pavilion Aero 13 be0097nr | |
| Acer Swift Edge SFE16-42-R1GM | |
| GPD Win 3 | |
| GPD Win Max 2021 | |
| One Netbook XPlayer 2 | |
| Cinebench R15 / CPU Multi 64Bit | |
| Beelink SER7 | |
| Asus ROG Ally Z1 Extreme | |
| Ayaneo Air 1S Retro Power | |
| Aokzoe A1 | |
| GPD Win 4 | |
| Media AMD Ryzen 7 6800U (1463 - 1979, n=7) | |
| Acer Swift Edge SFE16-42-R1GM | |
| One Netbook XPlayer 2 | |
| HP Pavilion Aero 13 be0097nr | |
| GPD Win Max 2021 | |
| Lenovo ThinkPad X13 Yoga G3 21AW003UGE | |
| Asus ZenBook 14X OLED UX5400EA-L7154W | |
| GPD Win 3 | |
| Cinebench R15 / CPU Single 64Bit | |
| Beelink SER7 | |
| Asus ROG Ally Z1 Extreme | |
| Ayaneo Air 1S Retro Power | |
| GPD Win 4 | |
| Aokzoe A1 | |
| Acer Swift Edge SFE16-42-R1GM | |
| HP Pavilion Aero 13 be0097nr | |
| Media AMD Ryzen 7 6800U (142.6 - 246, n=6) | |
| Asus ZenBook 14X OLED UX5400EA-L7154W | |
| GPD Win 3 | |
| GPD Win Max 2021 | |
| Lenovo ThinkPad X13 Yoga G3 21AW003UGE | |
| One Netbook XPlayer 2 | |
| Blender / v2.79 BMW27 CPU | |
| GPD Win 3 | |
| Asus ZenBook 14X OLED UX5400EA-L7154W | |
| Lenovo ThinkPad X13 Yoga G3 21AW003UGE | |
| Lenovo ThinkPad X13 Yoga G3 21AW003UGE | |
| GPD Win Max 2021 | |
| One Netbook XPlayer 2 | |
| HP Pavilion Aero 13 be0097nr | |
| Acer Swift Edge SFE16-42-R1GM | |
| GPD Win 4 | |
| Media AMD Ryzen 7 6800U (272 - 347, n=7) | |
| Aokzoe A1 | |
| Ayaneo Air 1S Retro Power | |
| Asus ROG Ally Z1 Extreme | |
| Beelink SER7 | |
| 7-Zip 18.03 / 7z b 4 | |
| Beelink SER7 | |
| Asus ROG Ally Z1 Extreme | |
| Ayaneo Air 1S Retro Power | |
| Aokzoe A1 | |
| GPD Win 4 | |
| Media AMD Ryzen 7 6800U (40058 - 53934, n=6) | |
| Acer Swift Edge SFE16-42-R1GM | |
| HP Pavilion Aero 13 be0097nr | |
| One Netbook XPlayer 2 | |
| Lenovo ThinkPad X13 Yoga G3 21AW003UGE | |
| GPD Win Max 2021 | |
| Asus ZenBook 14X OLED UX5400EA-L7154W | |
| GPD Win 3 | |
| 7-Zip 18.03 / 7z b 4 -mmt1 | |
| Beelink SER7 | |
| Asus ROG Ally Z1 Extreme | |
| Ayaneo Air 1S Retro Power | |
| Acer Swift Edge SFE16-42-R1GM | |
| Aokzoe A1 | |
| GPD Win 4 | |
| HP Pavilion Aero 13 be0097nr | |
| Media AMD Ryzen 7 6800U (3398 - 5511, n=6) | |
| Asus ZenBook 14X OLED UX5400EA-L7154W | |
| GPD Win 3 | |
| Lenovo ThinkPad X13 Yoga G3 21AW003UGE | |
| GPD Win Max 2021 | |
| One Netbook XPlayer 2 | |
| Geekbench 5.5 / Multi-Core | |
| Beelink SER7 | |
| Asus ROG Ally Z1 Extreme | |
| Acer Swift Edge SFE16-42-R1GM | |
| Aokzoe A1 | |
| Lenovo ThinkPad X13 Yoga G3 21AW003UGE | |
| GPD Win 4 | |
| Media AMD Ryzen 7 6800U (6854 - 8935, n=9) | |
| Ayaneo Air 1S Retro Power | |
| One Netbook XPlayer 2 | |
| Asus ZenBook 14X OLED UX5400EA-L7154W | |
| Asus ZenBook 14X OLED UX5400EA-L7154W | |
| GPD Win 3 | |
| Geekbench 5.5 / Single-Core | |
| Beelink SER7 | |
| Asus ROG Ally Z1 Extreme | |
| Ayaneo Air 1S Retro Power | |
| GPD Win 4 | |
| Aokzoe A1 | |
| Acer Swift Edge SFE16-42-R1GM | |
| Asus ZenBook 14X OLED UX5400EA-L7154W | |
| Asus ZenBook 14X OLED UX5400EA-L7154W | |
| Media AMD Ryzen 7 6800U (926 - 1555, n=9) | |
| Lenovo ThinkPad X13 Yoga G3 21AW003UGE | |
| GPD Win 3 | |
| One Netbook XPlayer 2 | |
| HWBOT x265 Benchmark v2.2 / 4k Preset | |
| Beelink SER7 | |
| Asus ROG Ally Z1 Extreme | |
| Ayaneo Air 1S Retro Power | |
| Aokzoe A1 | |
| Media AMD Ryzen 7 6800U (11.8 - 14.2, n=6) | |
| GPD Win 4 | |
| Acer Swift Edge SFE16-42-R1GM | |
| One Netbook XPlayer 2 | |
| HP Pavilion Aero 13 be0097nr | |
| GPD Win Max 2021 | |
| Lenovo ThinkPad X13 Yoga G3 21AW003UGE | |
| Asus ZenBook 14X OLED UX5400EA-L7154W | |
| GPD Win 3 | |
| LibreOffice / 20 Documents To PDF | |
| One Netbook XPlayer 2 | |
| Asus ZenBook 14X OLED UX5400EA-L7154W | |
| GPD Win Max 2021 | |
| Acer Swift Edge SFE16-42-R1GM | |
| Media AMD Ryzen 7 6800U (50.1 - 84.9, n=6) | |
| HP Pavilion Aero 13 be0097nr | |
| Lenovo ThinkPad X13 Yoga G3 21AW003UGE | |
| GPD Win 4 | |
| Aokzoe A1 | |
| GPD Win 3 | |
| Ayaneo Air 1S Retro Power | |
| Asus ROG Ally Z1 Extreme | |
| Beelink SER7 | |
Cinebench R23: Multi Core | Single Core
Cinebench R20: CPU (Multi Core) | CPU (Single Core)
Cinebench R15: CPU Multi 64Bit | CPU Single 64Bit
Blender: v2.79 BMW27 CPU
7-Zip 18.03: 7z b 4 | 7z b 4 -mmt1
Geekbench 5.5: Multi-Core | Single-Core
HWBOT x265 Benchmark v2.2: 4k Preset
LibreOffice : 20 Documents To PDF
R Benchmark 2.5: Overall mean
* ... Meglio usare valori piccoli
AIDA64: FP32 Ray-Trace | FPU Julia | CPU SHA3 | CPU Queen | FPU SinJulia | FPU Mandel | CPU AES | CPU ZLib | FP64 Ray-Trace | CPU PhotoWorxx
| Performance rating | |
| Asus ROG Ally Z1 Extreme | |
| Aokzoe A1 | |
| Media AMD Ryzen 7 6800U | |
| GPD Win 4 | |
| One Netbook XPlayer 2 | |
| AIDA64 / FP32 Ray-Trace | |
| Asus ROG Ally Z1 Extreme | |
| Aokzoe A1 | |
| Media AMD Ryzen 7 6800U (10902 - 12818, n=6) | |
| GPD Win 4 | |
| One Netbook XPlayer 2 | |
| AIDA64 / FPU Julia | |
| Asus ROG Ally Z1 Extreme | |
| Aokzoe A1 | |
| Media AMD Ryzen 7 6800U (67503 - 84031, n=6) | |
| GPD Win 4 | |
| One Netbook XPlayer 2 | |
| AIDA64 / CPU SHA3 | |
| Asus ROG Ally Z1 Extreme | |
| Aokzoe A1 | |
| Media AMD Ryzen 7 6800U (2296 - 2818, n=6) | |
| GPD Win 4 | |
| One Netbook XPlayer 2 | |
| AIDA64 / CPU Queen | |
| Asus ROG Ally Z1 Extreme | |
| Aokzoe A1 | |
| GPD Win 4 | |
| Media AMD Ryzen 7 6800U (62082 - 96306, n=6) | |
| One Netbook XPlayer 2 | |
| AIDA64 / FPU SinJulia | |
| Asus ROG Ally Z1 Extreme | |
| Aokzoe A1 | |
| GPD Win 4 | |
| Media AMD Ryzen 7 6800U (7753 - 11982, n=6) | |
| One Netbook XPlayer 2 | |
| AIDA64 / FPU Mandel | |
| Asus ROG Ally Z1 Extreme | |
| Aokzoe A1 | |
| Media AMD Ryzen 7 6800U (37417 - 45748, n=6) | |
| GPD Win 4 | |
| One Netbook XPlayer 2 | |
| AIDA64 / CPU AES | |
| Aokzoe A1 | |
| GPD Win 4 | |
| Media AMD Ryzen 7 6800U (50547 - 115681, n=6) | |
| One Netbook XPlayer 2 | |
| Asus ROG Ally Z1 Extreme | |
| AIDA64 / CPU ZLib | |
| Asus ROG Ally Z1 Extreme | |
| Aokzoe A1 | |
| Media AMD Ryzen 7 6800U (554 - 755, n=6) | |
| GPD Win 4 | |
| One Netbook XPlayer 2 | |
| AIDA64 / FP64 Ray-Trace | |
| Asus ROG Ally Z1 Extreme | |
| Aokzoe A1 | |
| Media AMD Ryzen 7 6800U (5825 - 6694, n=6) | |
| GPD Win 4 | |
| One Netbook XPlayer 2 | |
| AIDA64 / CPU PhotoWorxx | |
| Asus ROG Ally Z1 Extreme | |
| GPD Win 4 | |
| One Netbook XPlayer 2 | |
| Media AMD Ryzen 7 6800U (24728 - 27274, n=6) | |
| Aokzoe A1 | |
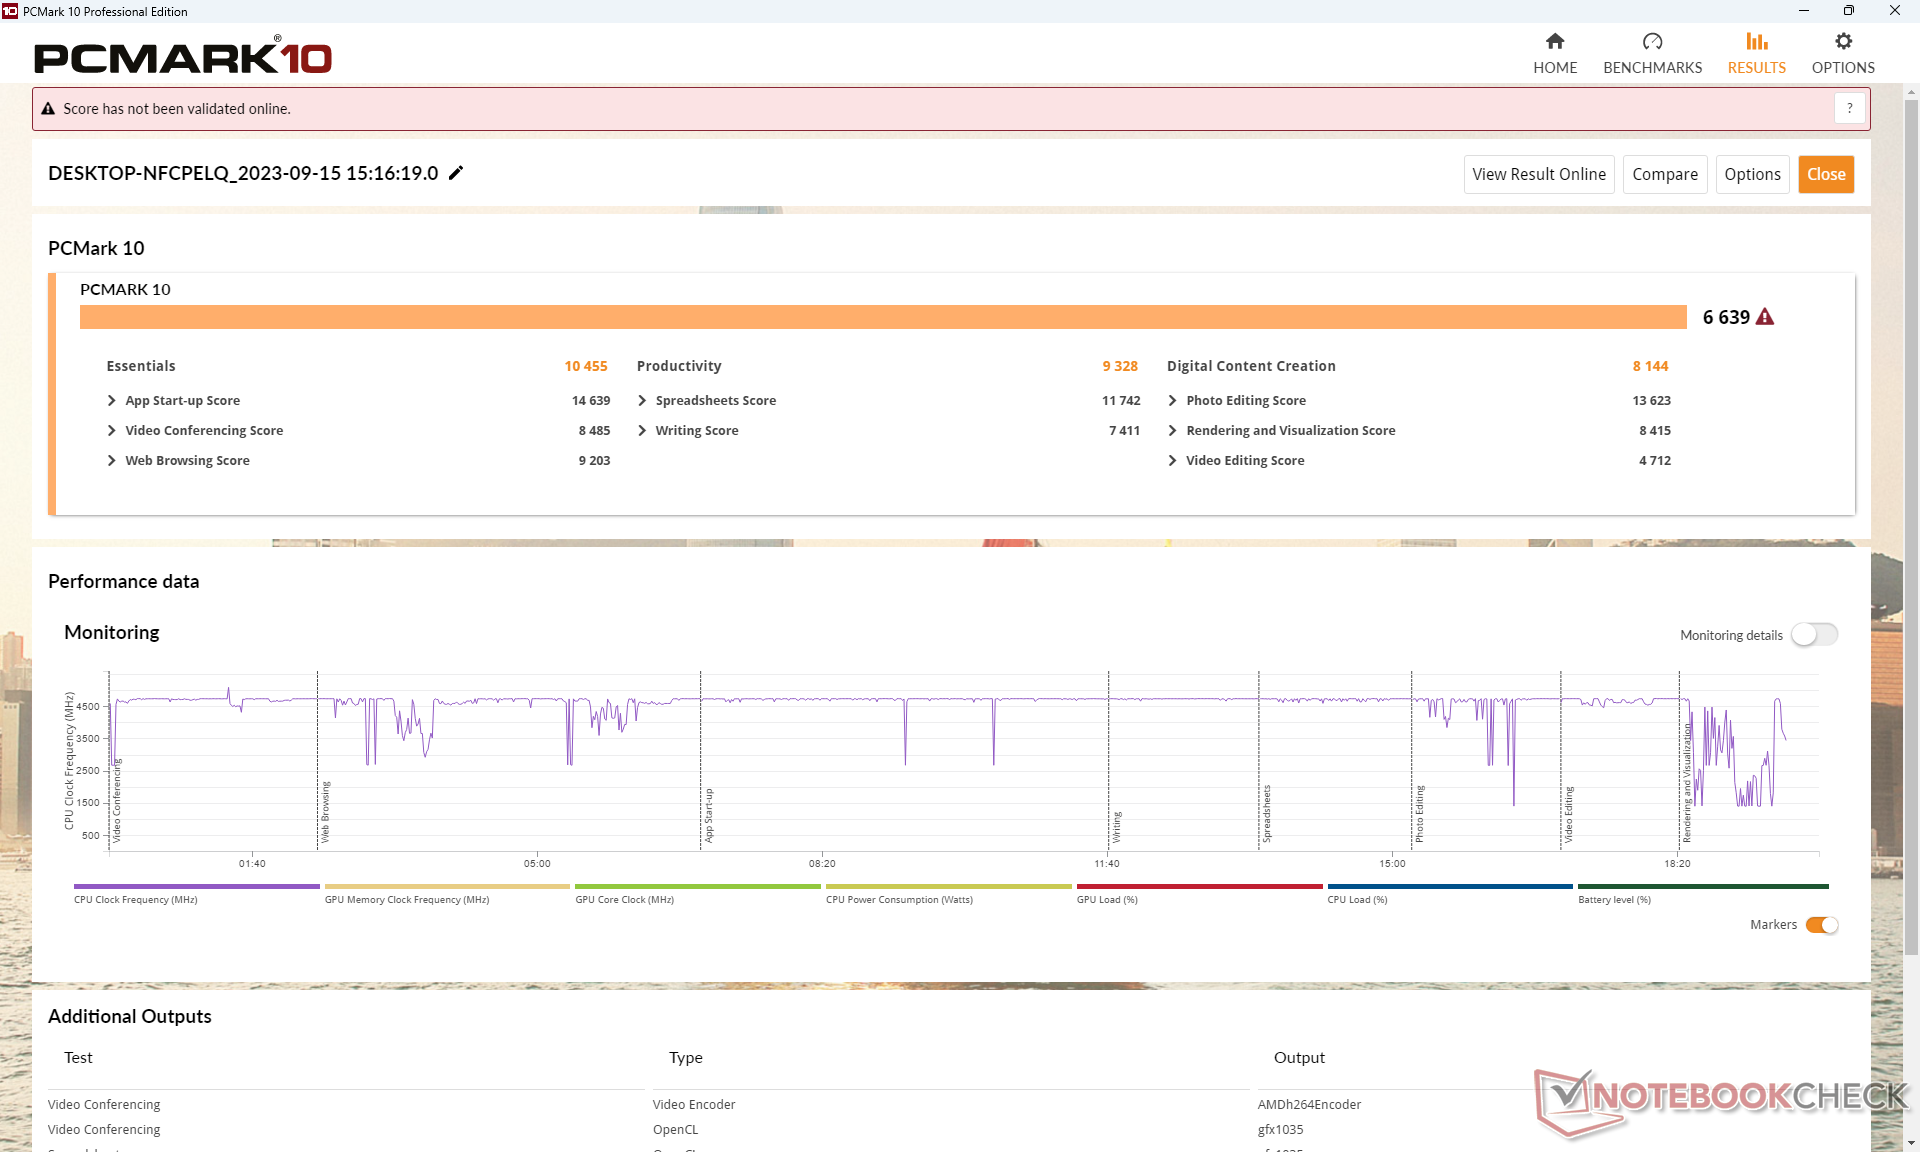
Prestazioni del sistema
I punteggi di PCMark sono molto alti e paragonabili a quelli di molti altri portatili di fascia alta come ilLenovo Yoga 7 14il ROG Ally Z1 Extreme ha ottenuto punteggi ancora migliori grazie al suo processore più veloce.
Abbiamo riscontrato un paio di bug sulla nostra unità di test, il più importante dei quali è il problema del risveglio dal sonno. Premendo il pulsante di accensione si spegne lo schermo per la modalità sleep, ma a volte lo schermo non si riaccende anche se la ventola continua a girare. Per tornare a Windows è necessario un riavvio forzato.
CrossMark: Overall | Productivity | Creativity | Responsiveness
| PCMark 10 / Score | |
| Asus ROG Ally Z1 Extreme | |
| Aokzoe A1 | |
| GPD Win 4 | |
| Media AMD Ryzen 7 6800U, AMD Radeon 680M (5057 - 6639, n=7) | |
| One Netbook XPlayer 2 | |
| GPD Win 3 | |
| PCMark 10 / Essentials | |
| Aokzoe A1 | |
| Asus ROG Ally Z1 Extreme | |
| GPD Win 4 | |
| Media AMD Ryzen 7 6800U, AMD Radeon 680M (8143 - 10766, n=6) | |
| GPD Win 3 | |
| One Netbook XPlayer 2 | |
| PCMark 10 / Productivity | |
| Asus ROG Ally Z1 Extreme | |
| Aokzoe A1 | |
| GPD Win 4 | |
| Media AMD Ryzen 7 6800U, AMD Radeon 680M (6089 - 9328, n=6) | |
| GPD Win 3 | |
| One Netbook XPlayer 2 | |
| PCMark 10 / Digital Content Creation | |
| Asus ROG Ally Z1 Extreme | |
| Aokzoe A1 | |
| GPD Win 4 | |
| Media AMD Ryzen 7 6800U, AMD Radeon 680M (6066 - 8144, n=6) | |
| One Netbook XPlayer 2 | |
| GPD Win 3 | |
| CrossMark / Overall | |
| Asus ROG Ally Z1 Extreme | |
| GPD Win 4 | |
| Aokzoe A1 | |
| Media AMD Ryzen 7 6800U, AMD Radeon 680M (1009 - 1575, n=7) | |
| One Netbook XPlayer 2 | |
| CrossMark / Productivity | |
| Asus ROG Ally Z1 Extreme | |
| GPD Win 4 | |
| Aokzoe A1 | |
| Media AMD Ryzen 7 6800U, AMD Radeon 680M (971 - 1596, n=7) | |
| One Netbook XPlayer 2 | |
| CrossMark / Creativity | |
| Asus ROG Ally Z1 Extreme | |
| GPD Win 4 | |
| Aokzoe A1 | |
| Media AMD Ryzen 7 6800U, AMD Radeon 680M (1054 - 1686, n=7) | |
| One Netbook XPlayer 2 | |
| CrossMark / Responsiveness | |
| GPD Win 4 | |
| Asus ROG Ally Z1 Extreme | |
| Aokzoe A1 | |
| Media AMD Ryzen 7 6800U, AMD Radeon 680M (994 - 1473, n=7) | |
| One Netbook XPlayer 2 | |
| PCMark 10 Score | 6639 punti | |
Aiuto | ||
| AIDA64 / Memory Copy | |
| Asus ROG Ally Z1 Extreme | |
| GPD Win 4 | |
| Media AMD Ryzen 7 6800U (47010 - 52159, n=6) | |
| One Netbook XPlayer 2 | |
| Aokzoe A1 | |
| AIDA64 / Memory Read | |
| Asus ROG Ally Z1 Extreme | |
| GPD Win 4 | |
| One Netbook XPlayer 2 | |
| Media AMD Ryzen 7 6800U (39197 - 45084, n=6) | |
| Aokzoe A1 | |
| AIDA64 / Memory Write | |
| Asus ROG Ally Z1 Extreme | |
| GPD Win 4 | |
| One Netbook XPlayer 2 | |
| Media AMD Ryzen 7 6800U (48723 - 51117, n=6) | |
| Aokzoe A1 | |
| AIDA64 / Memory Latency | |
| One Netbook XPlayer 2 | |
| Asus ROG Ally Z1 Extreme | |
| Media AMD Ryzen 7 6800U (106.3 - 123.1, n=6) | |
| GPD Win 4 | |
| Aokzoe A1 | |
* ... Meglio usare valori piccoli
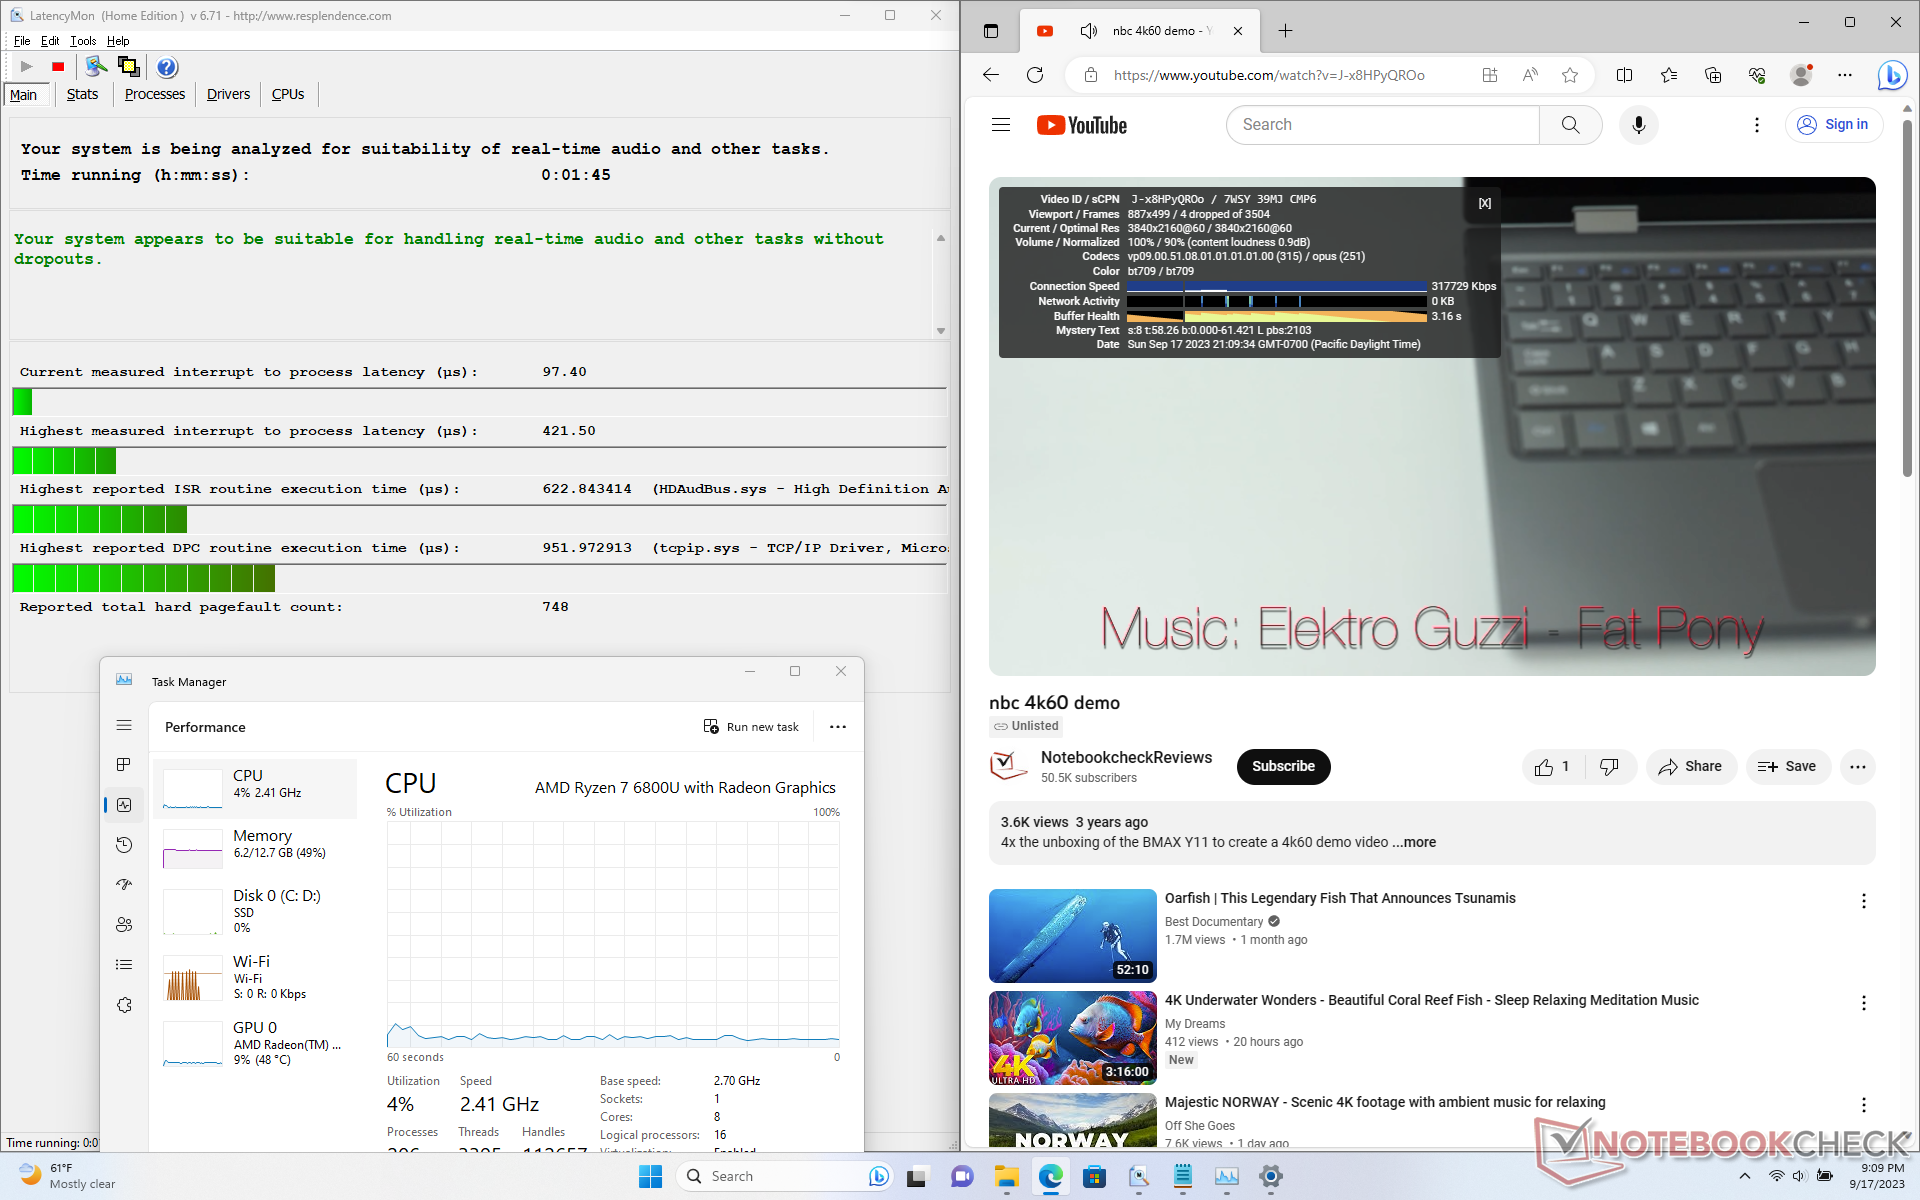
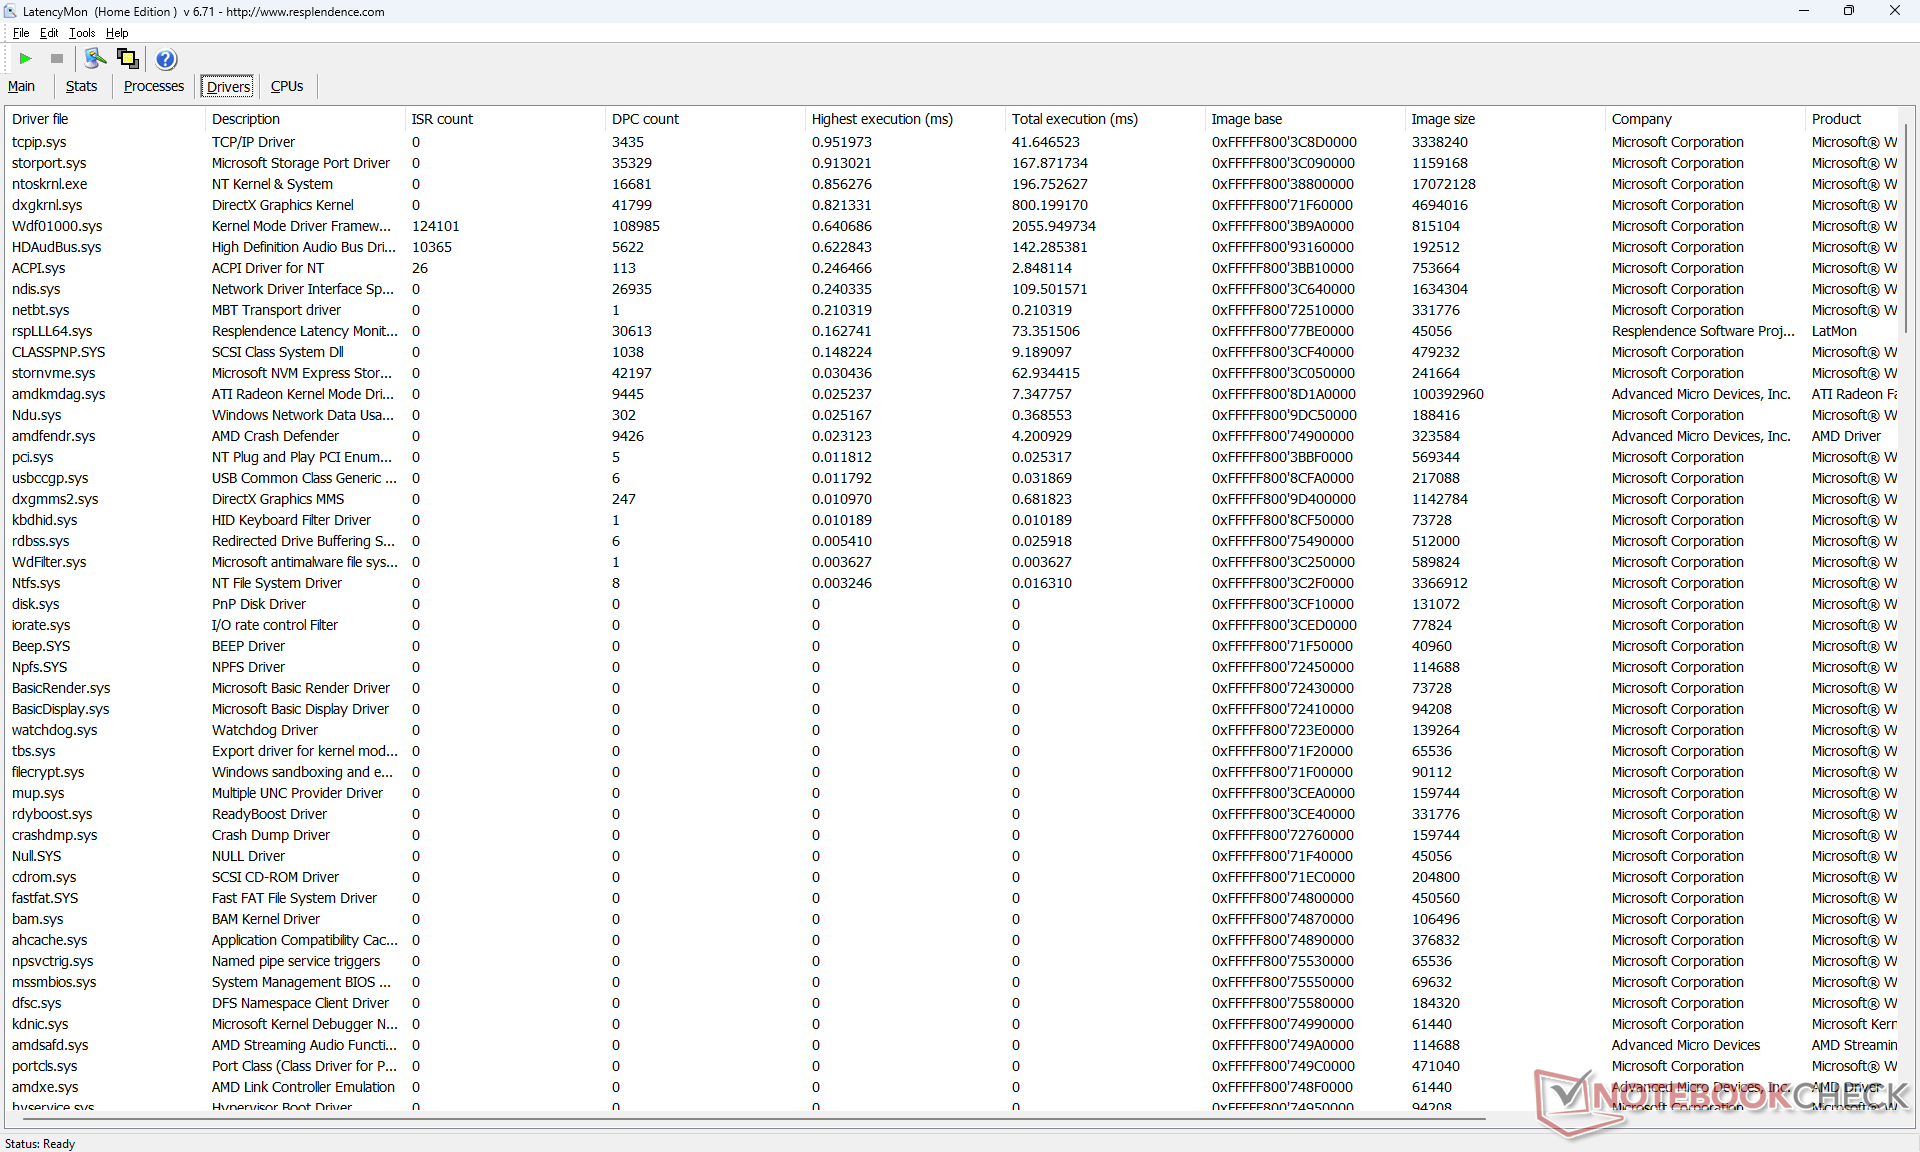
Latenza DPC
LatencyMon non mostra alcun problema di DPC quando si aprono più schede della nostra homepage. la riproduzione di video 4K a 60 FPS è buona, ma non perfetta, con 4 fotogrammi caduti durante un video di prova di un minuto.
| DPC Latencies / LatencyMon - interrupt to process latency (max), Web, Youtube, Prime95 | |
| One Netbook XPlayer 2 | |
| Asus ROG Ally Z1 Extreme | |
| GPD Win 3 | |
| GPD Win 4 | |
| Aokzoe A1 | |
* ... Meglio usare valori piccoli
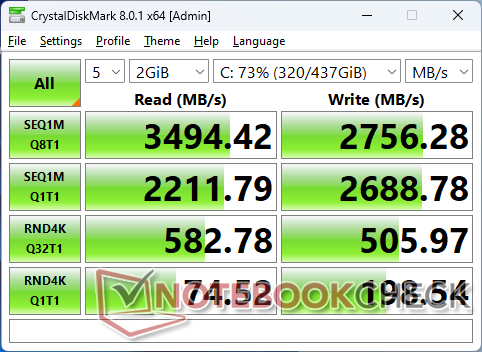
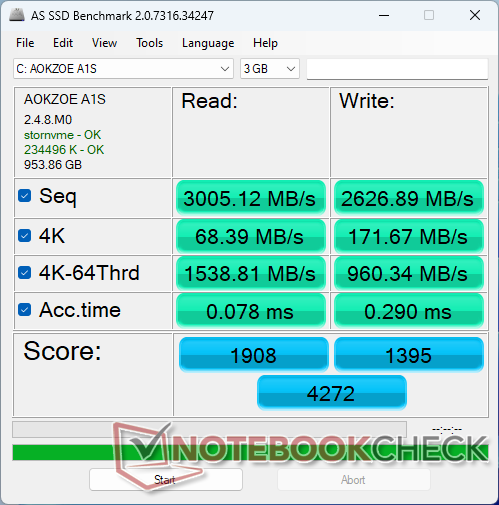
Dispositivi di archiviazione
L'A1 supporta le unità SSD M.2 2280 full-size, mentre altri PC portatili come lo Steam Deck supportano solo il fattore di forma 2230 più corto. L'unità Biwin Aokzoe A1S PCIe3 x4 nella nostra unità di test non ha avuto problemi a mantenere velocità di trasferimento massime di 3400 MB/s per periodi prolungati.

| Drive Performance rating - Percent | |
| One Netbook XPlayer 2 | |
| GPD Win 4 | |
| Aokzoe A1 | |
| GPD Win 3 | |
| Asus ROG Ally Z1 Extreme | |
| DiskSpd | |
| seq read | |
| GPD Win 4 | |
| Asus ROG Ally Z1 Extreme | |
| One Netbook XPlayer 2 | |
| Aokzoe A1 | |
| GPD Win 3 | |
| seq write | |
| GPD Win 4 | |
| One Netbook XPlayer 2 | |
| Aokzoe A1 | |
| GPD Win 3 | |
| Asus ROG Ally Z1 Extreme | |
| seq q8 t1 read | |
| Asus ROG Ally Z1 Extreme | |
| GPD Win 4 | |
| Aokzoe A1 | |
| One Netbook XPlayer 2 | |
| GPD Win 3 | |
| seq q8 t1 write | |
| GPD Win 4 | |
| One Netbook XPlayer 2 | |
| Aokzoe A1 | |
| GPD Win 3 | |
| Asus ROG Ally Z1 Extreme | |
| 4k q1 t1 read | |
| GPD Win 4 | |
| Aokzoe A1 | |
| One Netbook XPlayer 2 | |
| GPD Win 3 | |
| Asus ROG Ally Z1 Extreme | |
| 4k q1 t1 write | |
| GPD Win 3 | |
| GPD Win 4 | |
| Aokzoe A1 | |
| One Netbook XPlayer 2 | |
| Asus ROG Ally Z1 Extreme | |
| 4k q32 t16 read | |
| Aokzoe A1 | |
| GPD Win 4 | |
| One Netbook XPlayer 2 | |
| GPD Win 3 | |
| Asus ROG Ally Z1 Extreme | |
| 4k q32 t16 write | |
| GPD Win 3 | |
| GPD Win 4 | |
| One Netbook XPlayer 2 | |
| Aokzoe A1 | |
| Asus ROG Ally Z1 Extreme | |
| AS SSD | |
| Score Total | |
| One Netbook XPlayer 2 | |
| Aokzoe A1 | |
| GPD Win 4 | |
| GPD Win 3 | |
| Asus ROG Ally Z1 Extreme | |
| Score Read | |
| Aokzoe A1 | |
| One Netbook XPlayer 2 | |
| GPD Win 4 | |
| GPD Win 3 | |
| Asus ROG Ally Z1 Extreme | |
| Score Write | |
| Asus ROG Ally Z1 Extreme | |
| GPD Win 3 | |
| One Netbook XPlayer 2 | |
| GPD Win 4 | |
| Aokzoe A1 | |
| Seq Read | |
| Asus ROG Ally Z1 Extreme | |
| Aokzoe A1 | |
| GPD Win 4 | |
| One Netbook XPlayer 2 | |
| GPD Win 3 | |
| Seq Write | |
| One Netbook XPlayer 2 | |
| Aokzoe A1 | |
| GPD Win 4 | |
| GPD Win 3 | |
| Asus ROG Ally Z1 Extreme | |
| 4K Read | |
| GPD Win 4 | |
| One Netbook XPlayer 2 | |
| Aokzoe A1 | |
| GPD Win 3 | |
| Asus ROG Ally Z1 Extreme | |
| 4K Write | |
| GPD Win 3 | |
| GPD Win 4 | |
| Aokzoe A1 | |
| One Netbook XPlayer 2 | |
| Asus ROG Ally Z1 Extreme | |
| 4K-64 Read | |
| One Netbook XPlayer 2 | |
| Aokzoe A1 | |
| GPD Win 4 | |
| GPD Win 3 | |
| Asus ROG Ally Z1 Extreme | |
| 4K-64 Write | |
| Asus ROG Ally Z1 Extreme | |
| GPD Win 3 | |
| One Netbook XPlayer 2 | |
| GPD Win 4 | |
| Aokzoe A1 | |
| Access Time Read | |
| Aokzoe A1 | |
| One Netbook XPlayer 2 | |
| GPD Win 4 | |
| Asus ROG Ally Z1 Extreme | |
| GPD Win 3 | |
| Access Time Write | |
| Aokzoe A1 | |
| GPD Win 4 | |
| Asus ROG Ally Z1 Extreme | |
| One Netbook XPlayer 2 | |
| GPD Win 3 | |
* ... Meglio usare valori piccoli
Disk Throttling: DiskSpd Read Loop, Queue Depth 8
Prestazioni della GPU
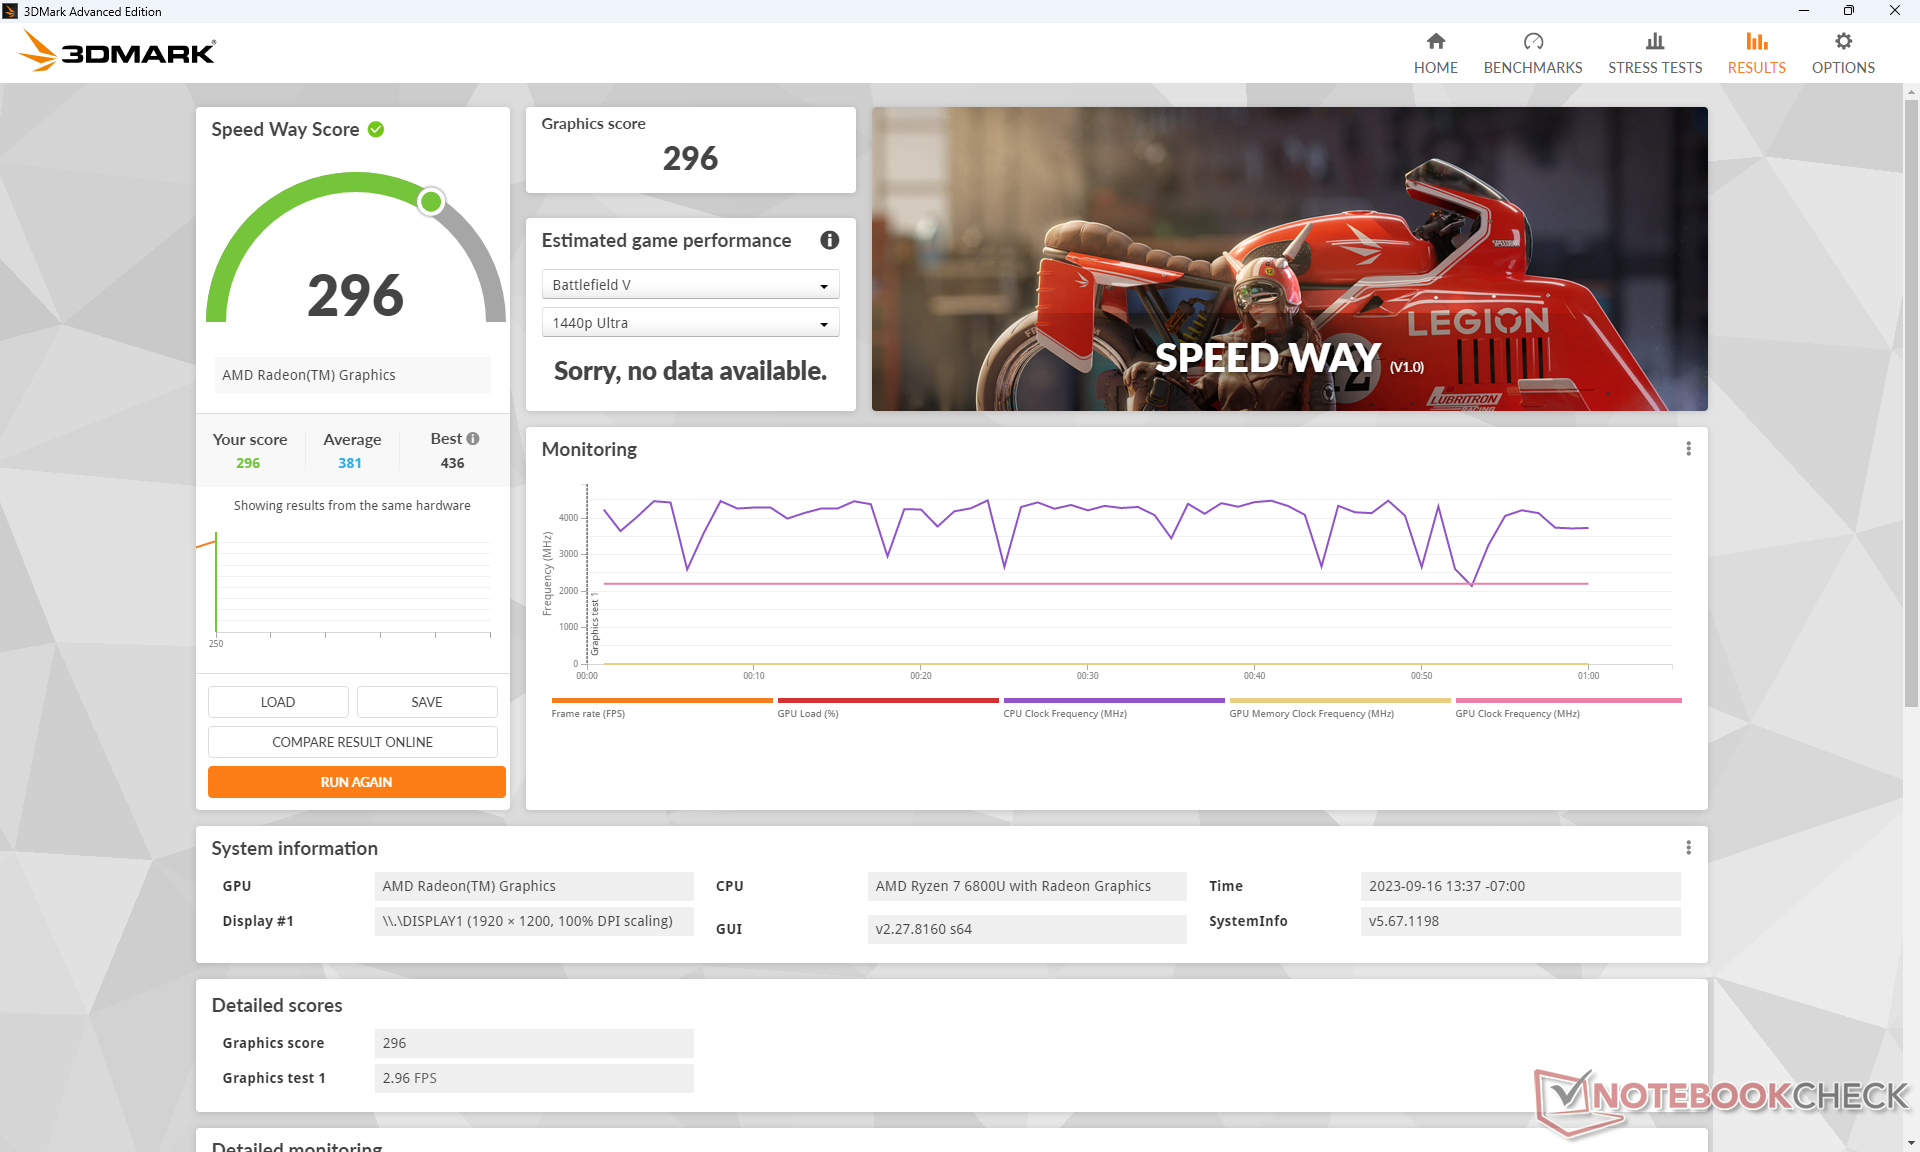
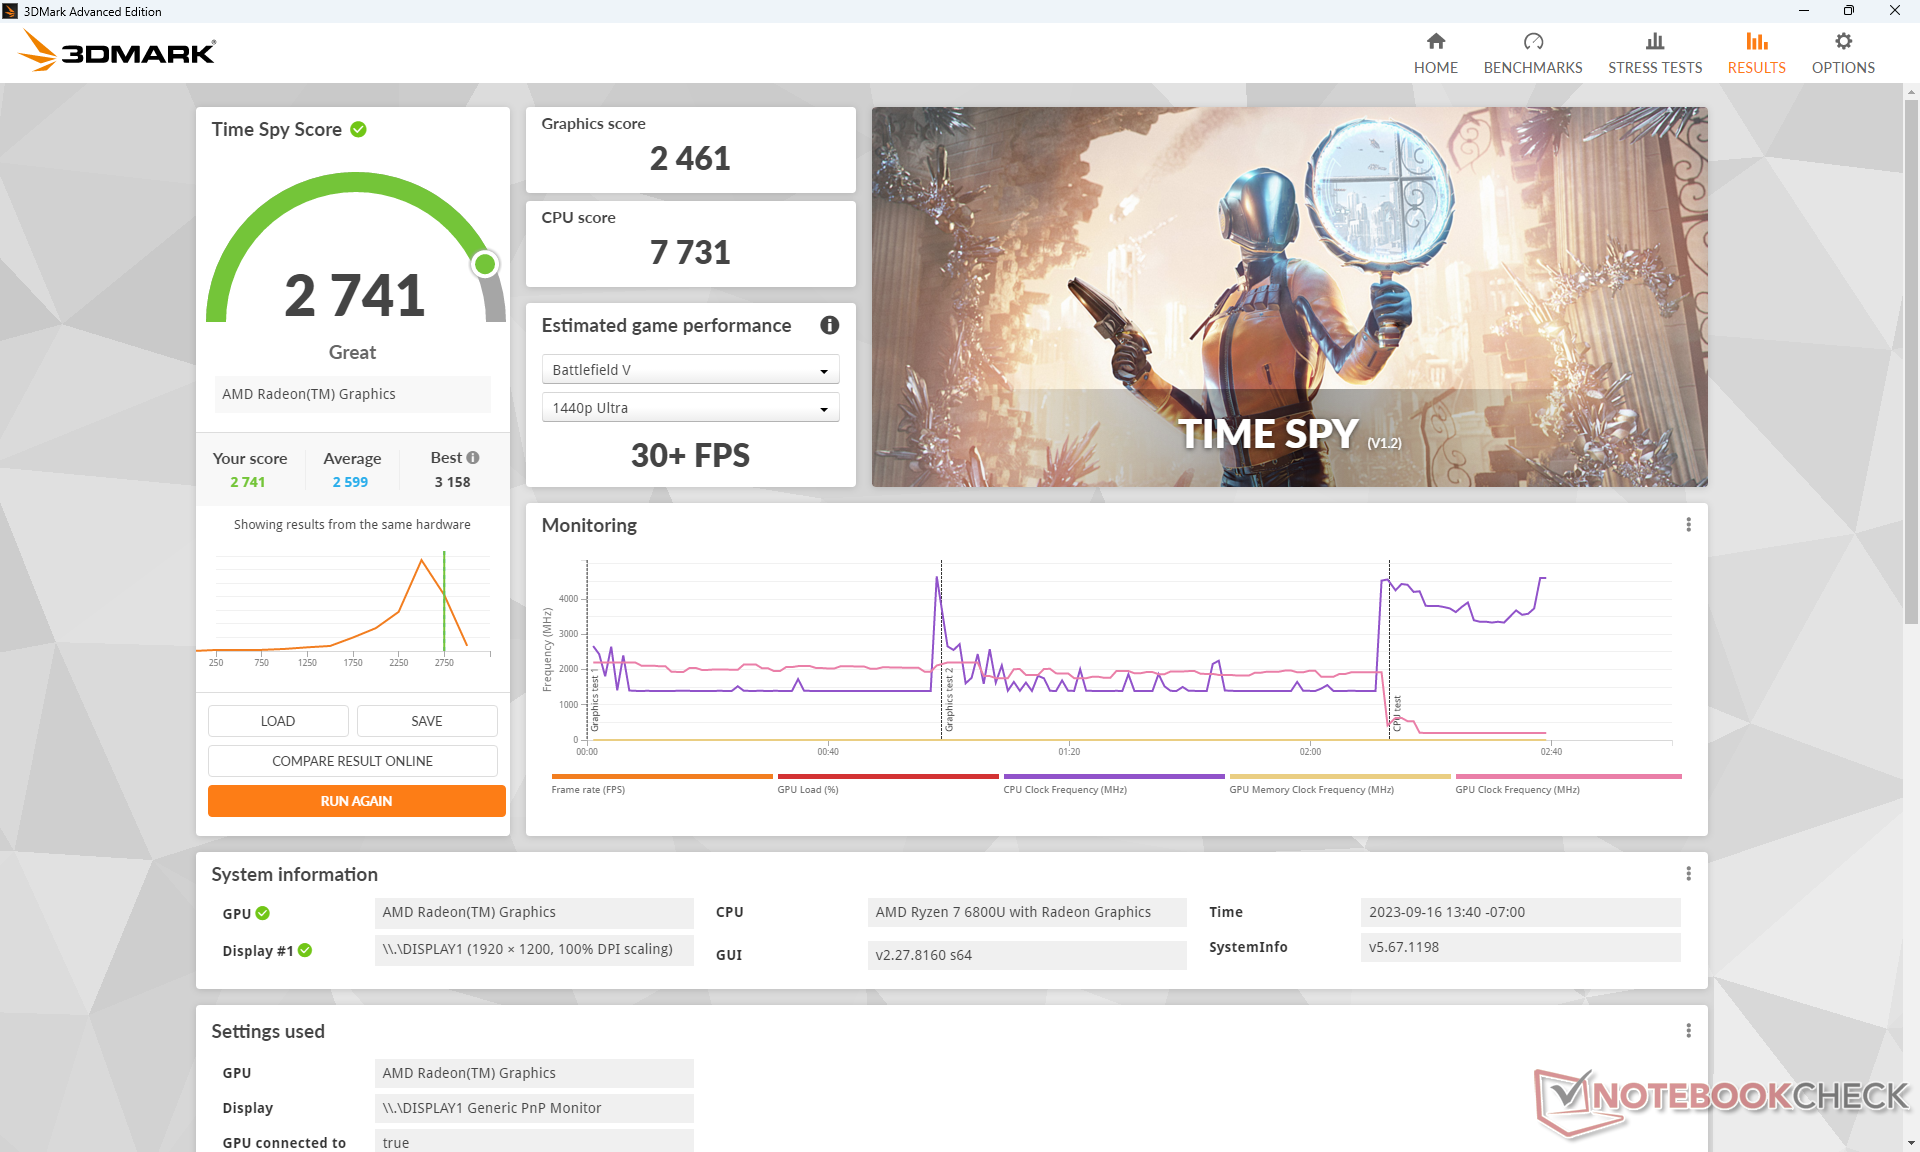
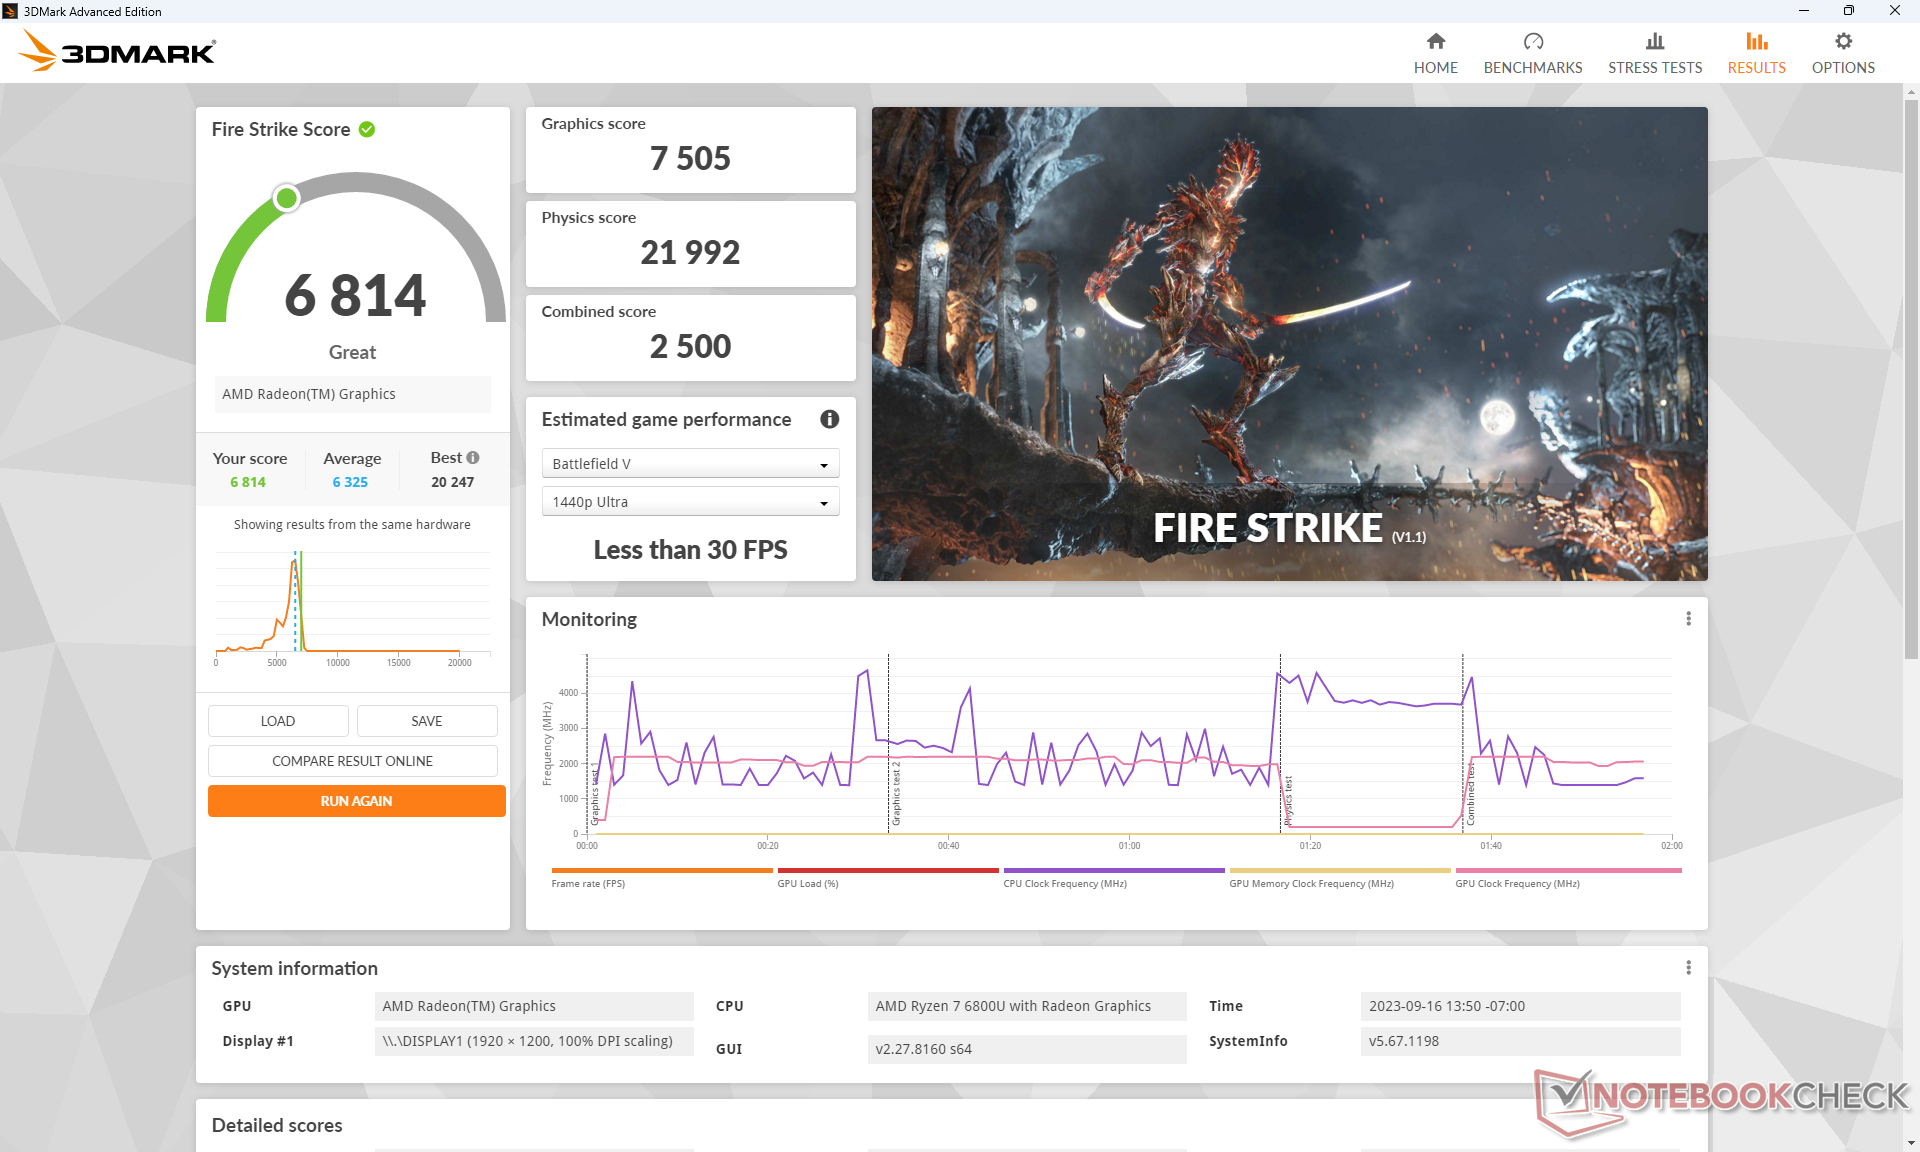
La Radeon 680M è ancora molto veloce nonostante la disponibilità della più recente Radeon 780M. i risultati di 3DMark sono quelli che ci aspettiamo rispetto ai portatili con la stessa GPU, se non leggermente più veloci per non mostrare problemi di throttling.
Le prestazioni complete sono disponibili con l'alimentazione a batteria. Tuttavia, si noti che le prestazioni grafiche possono diminuire fino al 30% se il profilo di alimentazione è impostato sulla modalità Bilanciata invece che sulla modalità Prestazioni, come mostra la tabella dei risultati di 3DMark 11 qui sotto, anche se collegato alla rete elettrica.
L'aggiornamento all'Aokzoe A1 Pro con la Radeon 780M dovrebbe aumentare le prestazioni grafiche di circa il 10-20%.
| Profilo energetico | Punteggio fisico | Punteggio grafico | Punteggio combinato |
| Profilo delle prestazioni | 14280 | 10741 | 6407 |
| Potenza della batteria | 14732 (-0%) | 10884 (-0%) | 6486 (-0%) |
| Profilo bilanciato | 11954 (-16%) | 7652 (-30%) | 5591 (-13%) |
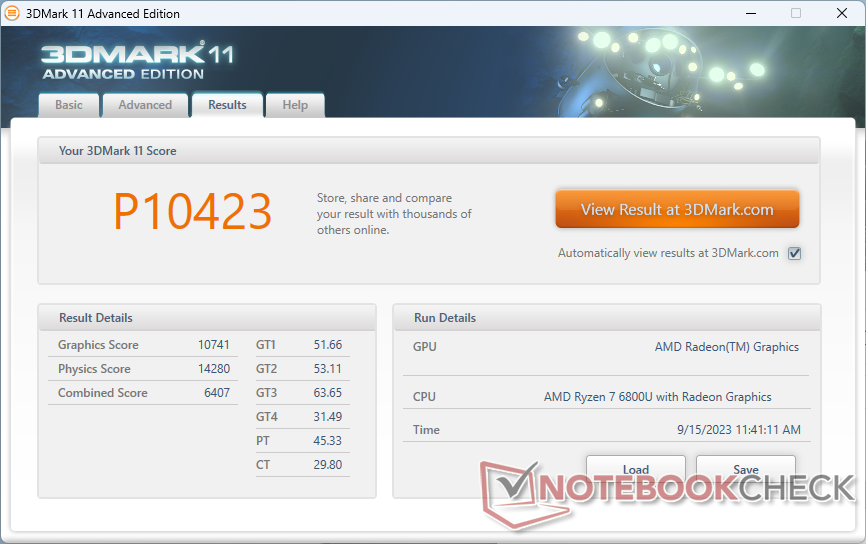
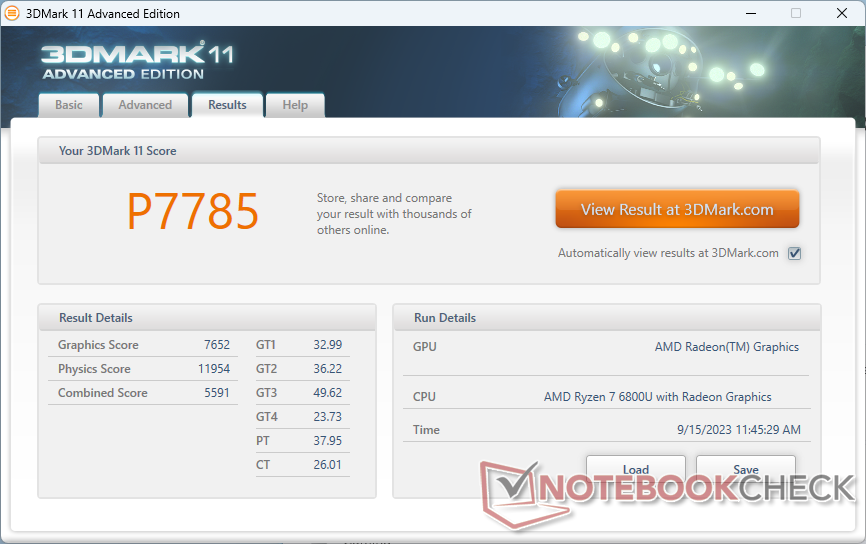
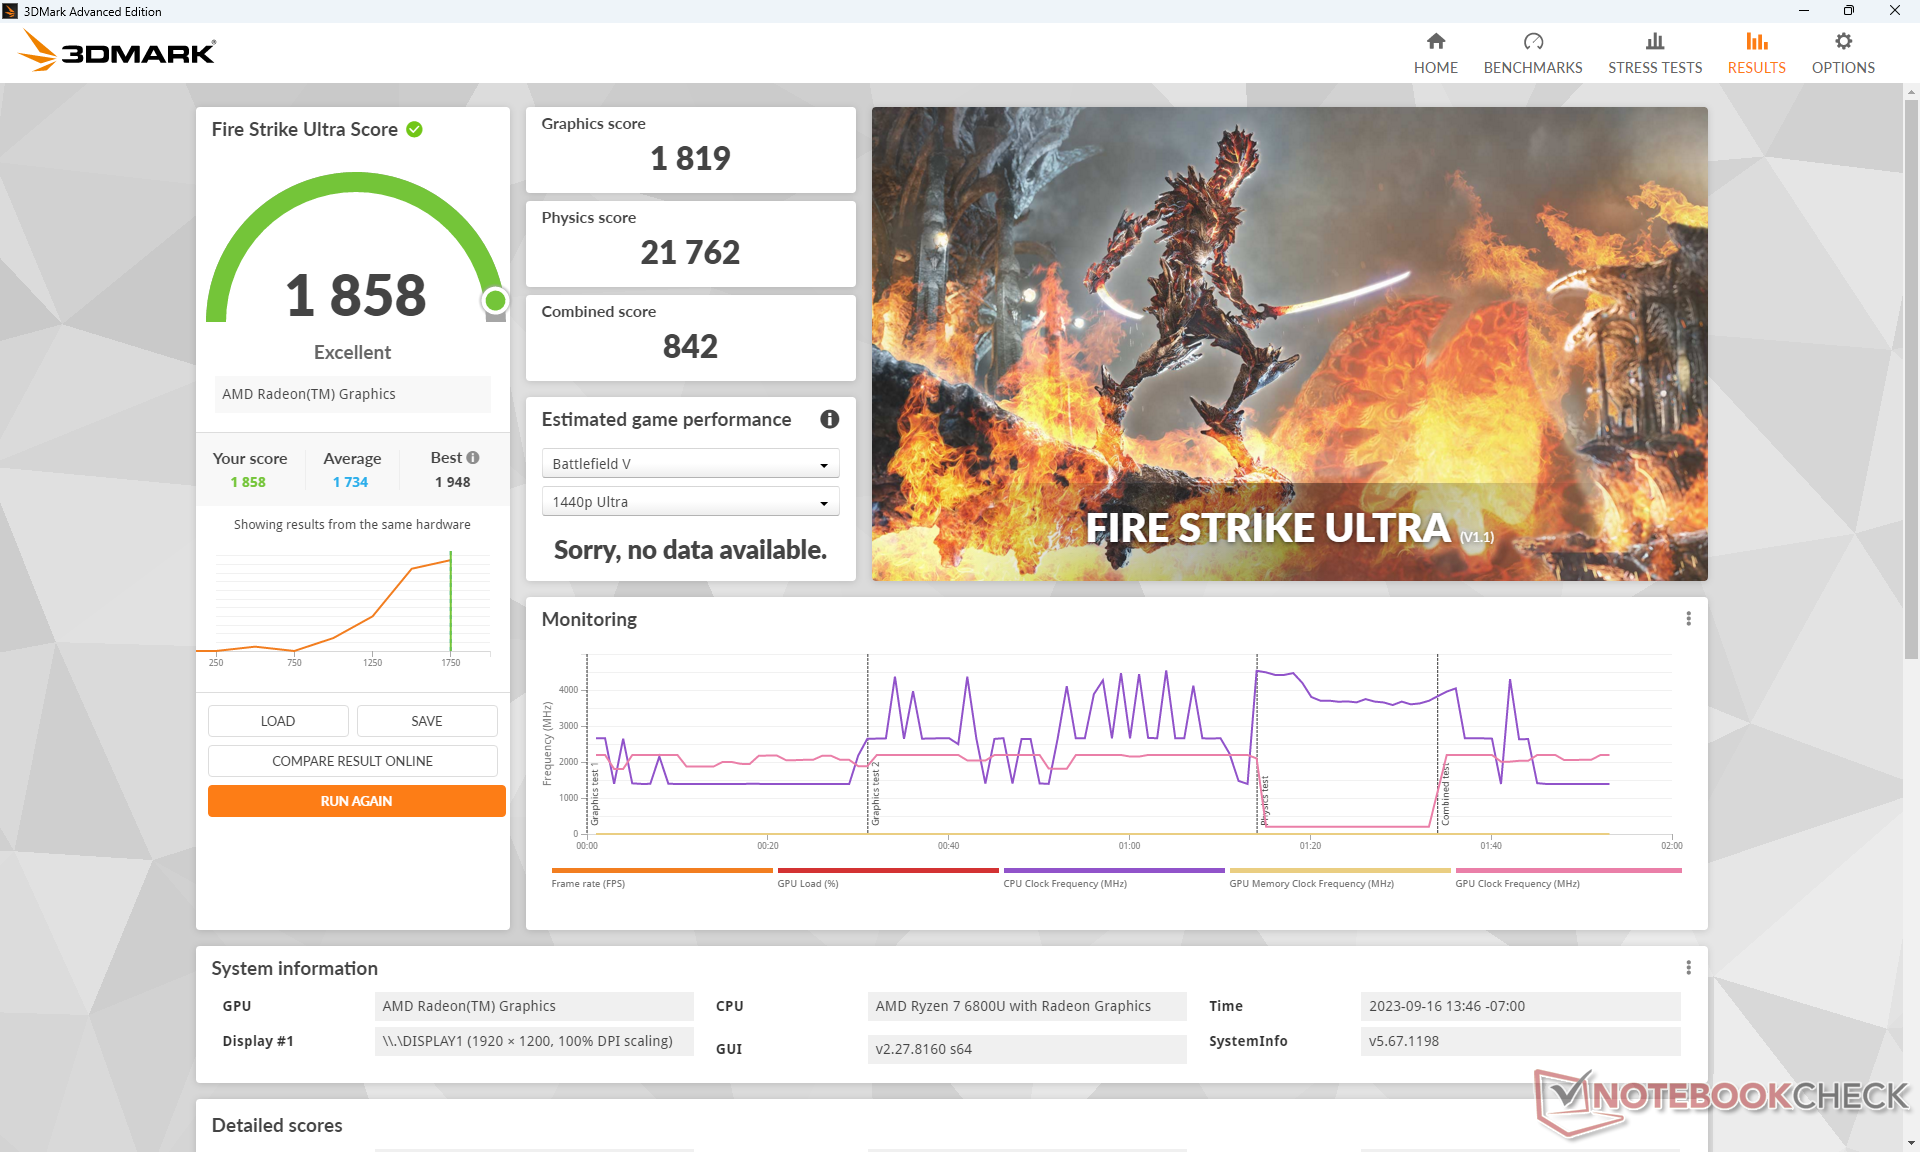
| 3DMark 11 Performance | 10423 punti | |
| 3DMark Fire Strike Score | 6814 punti | |
| 3DMark Time Spy Score | 2741 punti | |
Aiuto | ||
| Blender | |
| v3.3 Classroom HIP/AMD | |
| Acer Swift Edge SFE16-42-R1GM | |
| Media AMD Radeon 680M (270 - 555, n=34) | |
| Aokzoe A1 | |
| One Netbook XPlayer 2 | |
| GPD Win 4 | |
| v3.3 Classroom CPU | |
| Lenovo ThinkPad X13 Yoga G3 21AW003UGE | |
| One Netbook XPlayer 2 | |
| GPD Win 4 | |
| Acer Swift Edge SFE16-42-R1GM | |
| Media AMD Radeon 680M (389 - 980, n=37) | |
| Aokzoe A1 | |
| Ayaneo Air 1S Retro Power | |
| Asus ROG Ally Z1 Extreme | |
| Beelink SER7 | |
* ... Meglio usare valori piccoli
Prestazioni di gioco
I titoli moderni sono giocabili alla risoluzione nativa di 1200p e alcuni possono addirittura raggiungere una media di 60 FPS, tra cui F1 22. Tuttavia, consigliamo di abbassare le impostazioni a livelli bassi, soprattutto per i titoli più impegnativi come Cyberpunk 2077, per ridurre i cali di frame. Il display interno non supporta il FreeSync, il che è un vero peccato perché si sarebbe accoppiato molto bene con la Radeon 680M.
| The Witcher 3 | |
| 1024x768 Low Graphics & Postprocessing | |
| Beelink SER7 | |
| Media AMD Radeon 680M (67.4 - 150, n=31) | |
| Aokzoe A1 | |
| Acer Swift Edge SFE16-42-R1GM | |
| GPD Win 4 | |
| GPD Win 3 | |
| GPD Win Max 2021 | |
| HP Pavilion Aero 13 be0097nr | |
| Lenovo ThinkPad X13 Yoga G3 21AW003UGE | |
| 1920x1080 High Graphics & Postprocessing (Nvidia HairWorks Off) | |
| Beelink SER7 | |
| Asus ROG Ally Z1 Extreme | |
| Asus ZenBook 14X OLED UX5400EA-L7154W | |
| Aokzoe A1 | |
| Media AMD Radeon 680M (22.3 - 48, n=33) | |
| GPD Win 4 | |
| One Netbook XPlayer 2 | |
| Ayaneo Air 1S Retro Power | |
| Acer Swift Edge SFE16-42-R1GM | |
| GPD Win 3 | |
| Lenovo ThinkPad X13 Yoga G3 21AW003UGE | |
| GPD Win Max 2021 | |
| HP Pavilion Aero 13 be0097nr | |
| 1920x1080 Ultra Graphics & Postprocessing (HBAO+) | |
| Beelink SER7 | |
| Asus ROG Ally Z1 Extreme | |
| Ayaneo Air 1S Retro Power | |
| Aokzoe A1 | |
| Asus ZenBook 14X OLED UX5400EA-L7154W | |
| One Netbook XPlayer 2 | |
| Media AMD Radeon 680M (14.3 - 27.1, n=33) | |
| GPD Win 4 | |
| Acer Swift Edge SFE16-42-R1GM | |
| HP Pavilion Aero 13 be0097nr | |
| GPD Win Max 2021 | |
| GPD Win 3 | |
| Lenovo ThinkPad X13 Yoga G3 21AW003UGE | |
| Tiny Tina's Wonderlands | |
| 1280x720 Lowest Preset (DX12) | |
| Beelink SER7 | |
| Media AMD Radeon 680M (59.3 - 126.2, n=17) | |
| Aokzoe A1 | |
| Acer Swift Edge SFE16-42-R1GM | |
| 1920x1080 Low Preset (DX12) | |
| Beelink SER7 | |
| Aokzoe A1 | |
| Media AMD Radeon 680M (37.7 - 65.8, n=18) | |
| Asus ZenBook 14X OLED UX5400EA-L7154W | |
| Acer Swift Edge SFE16-42-R1GM | |
| 1920x1080 Medium Preset (DX12) | |
| Beelink SER7 | |
| Aokzoe A1 | |
| Media AMD Radeon 680M (28.2 - 47.7, n=18) | |
| Acer Swift Edge SFE16-42-R1GM | |
| Asus ZenBook 14X OLED UX5400EA-L7154W | |
| 1920x1080 High Preset (DX12) | |
| Beelink SER7 | |
| Aokzoe A1 | |
| Media AMD Radeon 680M (19.8 - 32.3, n=18) | |
| Acer Swift Edge SFE16-42-R1GM | |
| Asus ZenBook 14X OLED UX5400EA-L7154W | |
| 1920x1080 Badass Preset (DX12) | |
| Beelink SER7 | |
| Aokzoe A1 | |
| Media AMD Radeon 680M (16 - 26.1, n=18) | |
| Acer Swift Edge SFE16-42-R1GM | |
| Asus ZenBook 14X OLED UX5400EA-L7154W | |
| Cyberpunk 2077 1.6 | |
| 1280x720 Low Preset | |
| Beelink SER7 | |
| Media AMD Radeon 680M (46.1 - 77.6, n=14) | |
| GPD Win 4 | |
| Ayaneo Air 1S Retro Power | |
| Aokzoe A1 | |
| 1920x1080 Low Preset | |
| Beelink SER7 | |
| Asus ROG Ally Z1 Extreme | |
| Ayaneo Air 1S Retro Power | |
| Media AMD Radeon 680M (26 - 50.6, n=15) | |
| GPD Win 4 | |
| Aokzoe A1 | |
| 1920x1080 Medium Preset | |
| Beelink SER7 | |
| Asus ROG Ally Z1 Extreme | |
| Ayaneo Air 1S Retro Power | |
| Media AMD Radeon 680M (20.1 - 41.8, n=15) | |
| GPD Win 4 | |
| Aokzoe A1 | |
| 1920x1080 High Preset | |
| Beelink SER7 | |
| Asus ROG Ally Z1 Extreme | |
| Ayaneo Air 1S Retro Power | |
| GPD Win 4 | |
| Media AMD Radeon 680M (16.3 - 33.6, n=15) | |
| Aokzoe A1 | |
| 1920x1080 Ultra Preset | |
| Beelink SER7 | |
| Asus ROG Ally Z1 Extreme | |
| Media AMD Radeon 680M (14 - 23.8, n=15) | |
| GPD Win 4 | |
| Aokzoe A1 | |
Witcher 3 FPS Chart
| basso | medio | alto | ultra | |
|---|---|---|---|---|
| GTA V (2015) | 136.6 | 50.5 | 23.5 | |
| The Witcher 3 (2015) | 108.2 | 40.1 | 24.5 | |
| Dota 2 Reborn (2015) | 108.3 | 96.3 | 73 | 69.7 |
| Final Fantasy XV Benchmark (2018) | 63.6 | 33.5 | 24.1 | |
| X-Plane 11.11 (2018) | 57.2 | 46.1 | 36 | |
| Far Cry 5 (2018) | 62 | 38 | 35 | 34 |
| Strange Brigade (2018) | 146.2 | 61.7 | 50.6 | 43.4 |
| Cyberpunk 2077 1.6 (2022) | 34 | 25.8 | 19 | 16.7 |
| Tiny Tina's Wonderlands (2022) | 57.3 | 44 | 28.3 | 22.3 |
| F1 22 (2022) | 78.4 | 69 | 50.5 | 13.2 |
Emissioni
Rumore di sistema - Problemi di pulsazioni persistenti
Il rumore della ventola è uno degli aspetti più deboli dell'A1. Pulsa molto frequentemente tra il silenzio e i 37 dB(A) ogni minuto circa, tanto da risultare evidente e persino fastidioso in ambienti interni più silenziosi. Questo comportamento si verifica quando il sistema è in modalità batteria o anche quando è semplicemente al minimo sulla scrivania. L'impostazione del sistema in modalità bilanciata non sembra risolvere il problema delle pulsazioni.
Anche il rumore della ventola quando si gioca è piuttosto forte, ma non sorprende viste le prestazioni e le dimensioni dell'A1. Tuttavia, il gioco in modalità Balanced è più silenzioso, con circa 37 dB(A), rispetto ai 41 dB(A) o più forte se si utilizza la modalità Performance. Questi intervalli sono paragonabili a quelli del ROG Ally o del OneXPlayer 2, mentre sono generalmente più silenziosi rispetto a quelli di Win 4.
Rumorosità
| Idle |
| 23.3 / 27.1 / 37.3 dB(A) |
| Sotto carico |
| 37.4 / 46.2 dB(A) |
 | ||
30 dB silenzioso 40 dB(A) udibile 50 dB(A) rumoroso |
||
min: | ||
| Aokzoe A1 Radeon 680M, R7 6800U | One Netbook XPlayer 2 Radeon 680M, R7 6800U | Asus ROG Ally Z1 Extreme Radeon 780M, Z1 Extreme, Micron 2400 MTFDKBK512QFM | GPD Win 4 Radeon 680M, R7 6800U, BiWin CE480Y2D100-1TB | GPD Win 3 Iris Xe G7 80EUs, i5-1135G7, BIWIN NS200 1TB CNF82GS1G02-1TB | |
|---|---|---|---|---|---|
| Noise | -3% | 8% | -13% | -6% | |
| off /ambiente * (dB) | 23 | 26.1 -13% | 23.3 -1% | 24 -4% | 27.4 -19% |
| Idle Minimum * (dB) | 23.3 | 26.1 -12% | 23.3 -0% | 31.2 -34% | 29.1 -25% |
| Idle Average * (dB) | 27.1 | 31.6 -17% | 23.3 14% | 31.2 -15% | 29.1 -7% |
| Idle Maximum * (dB) | 37.3 | 31.6 15% | 27.3 27% | 33.5 10% | 29.1 22% |
| Load Average * (dB) | 37.4 | 35.7 5% | 39.2 -5% | 45.5 -22% | 40.7 -9% |
| Witcher 3 ultra * (dB) | 41.2 | 43.3 -5% | 39.2 5% | 48.6 -18% | 42.8 -4% |
| Load Maximum * (dB) | 46.2 | 43.3 6% | 39.2 15% | 49 -6% | 46.3 -0% |
* ... Meglio usare valori piccoli
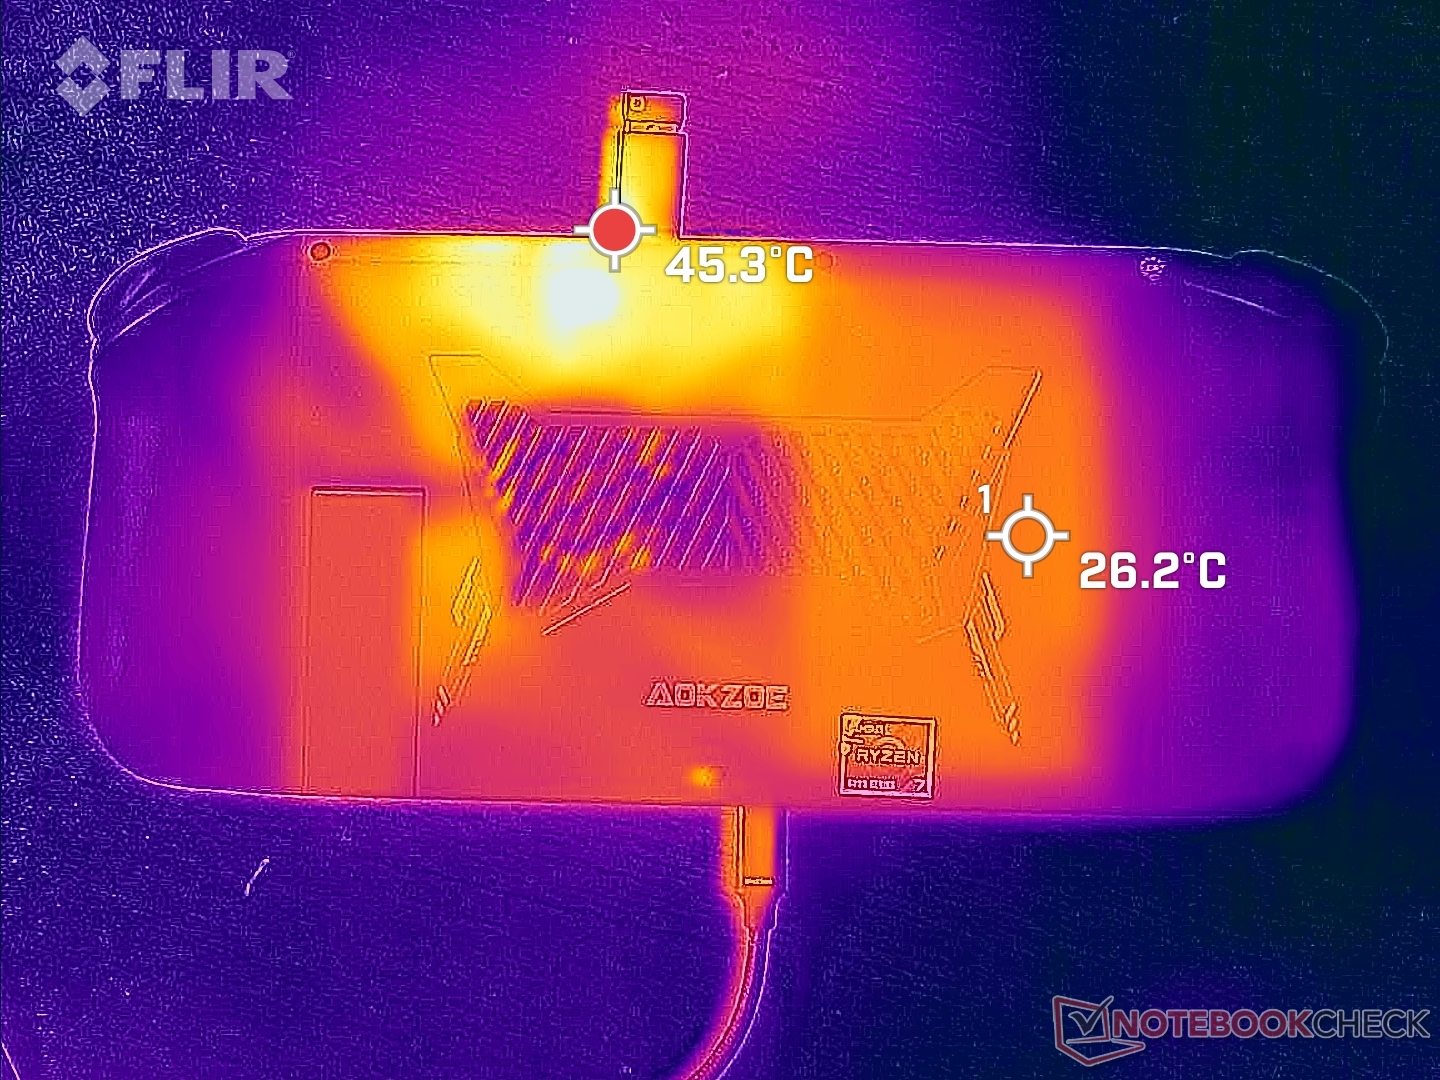
Temperatura
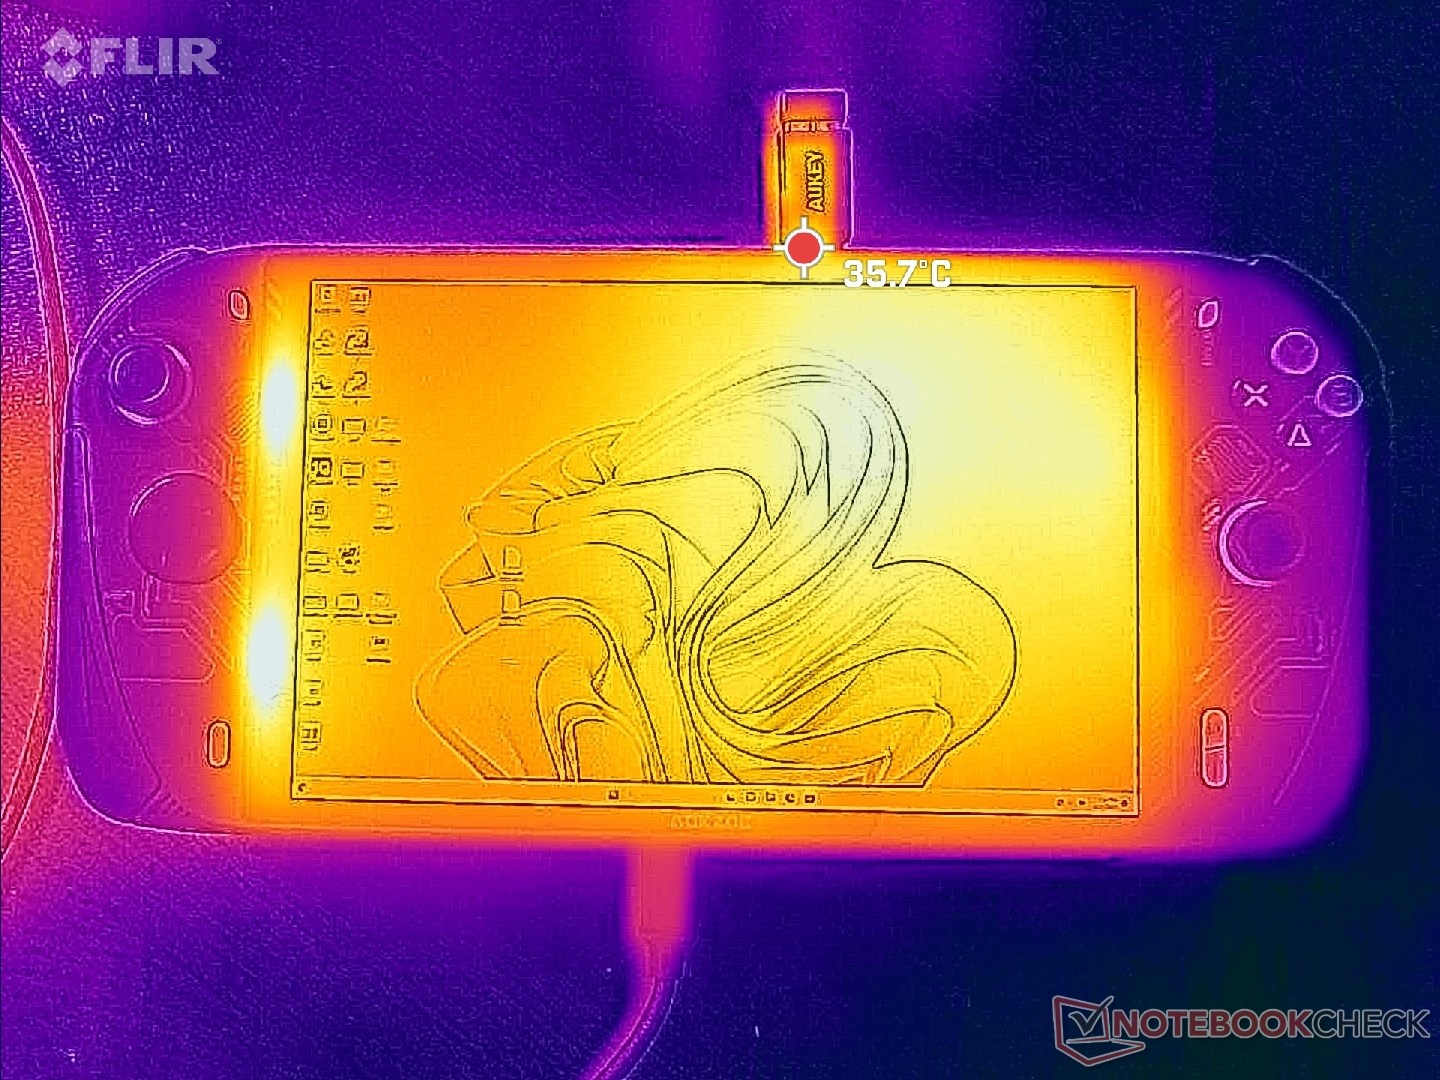
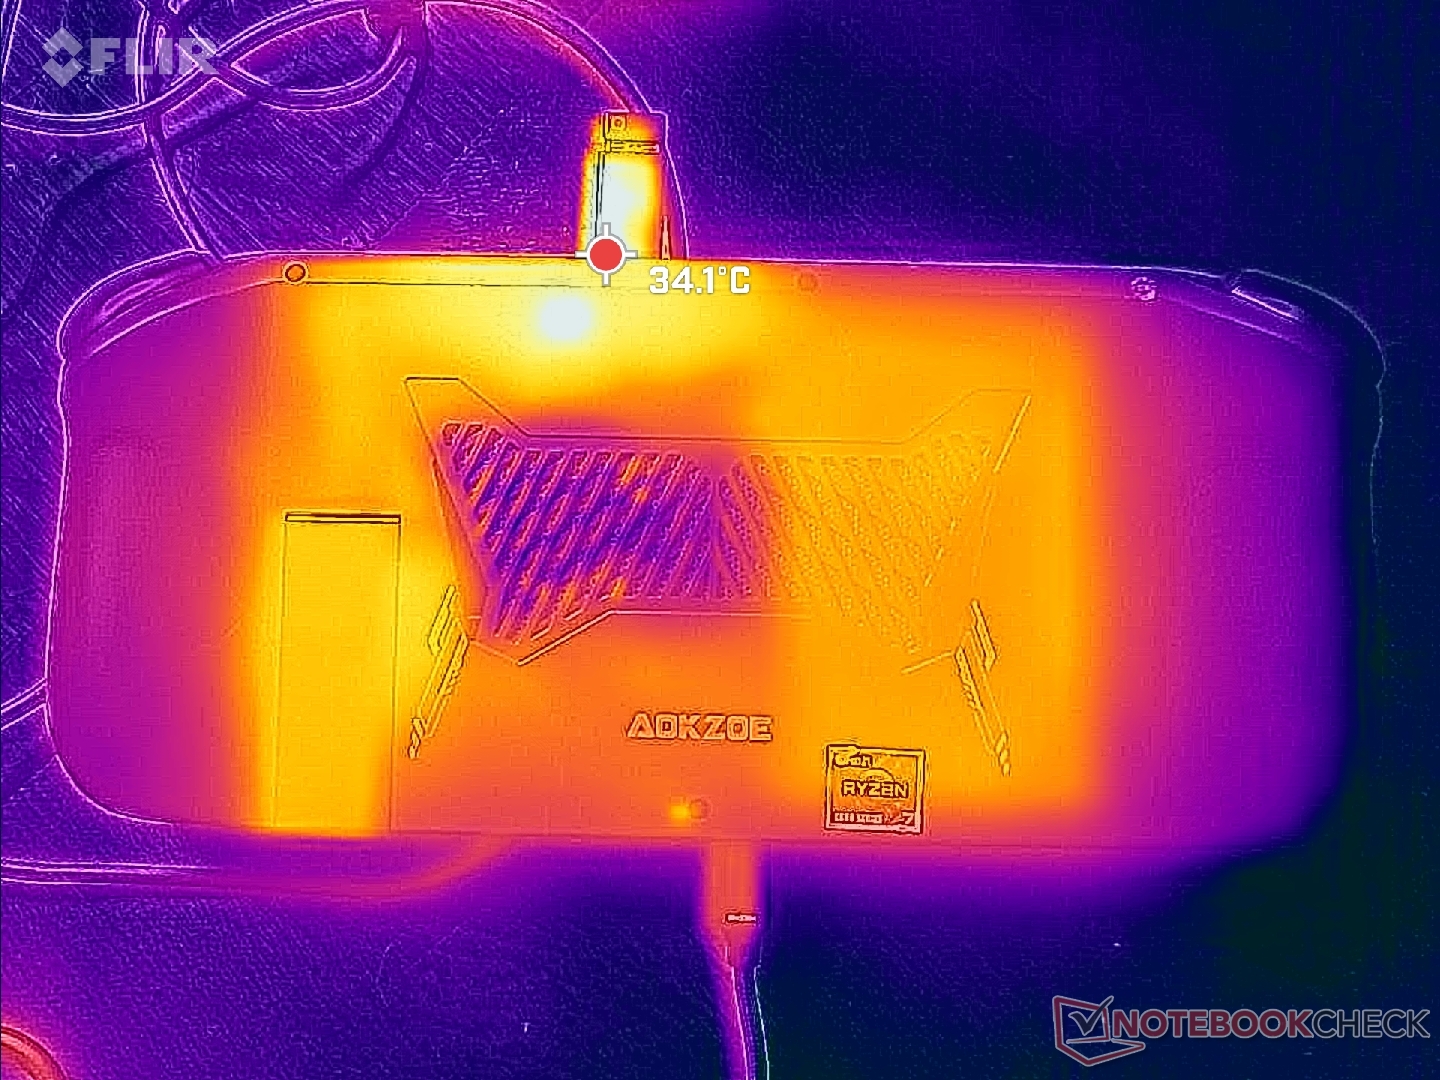
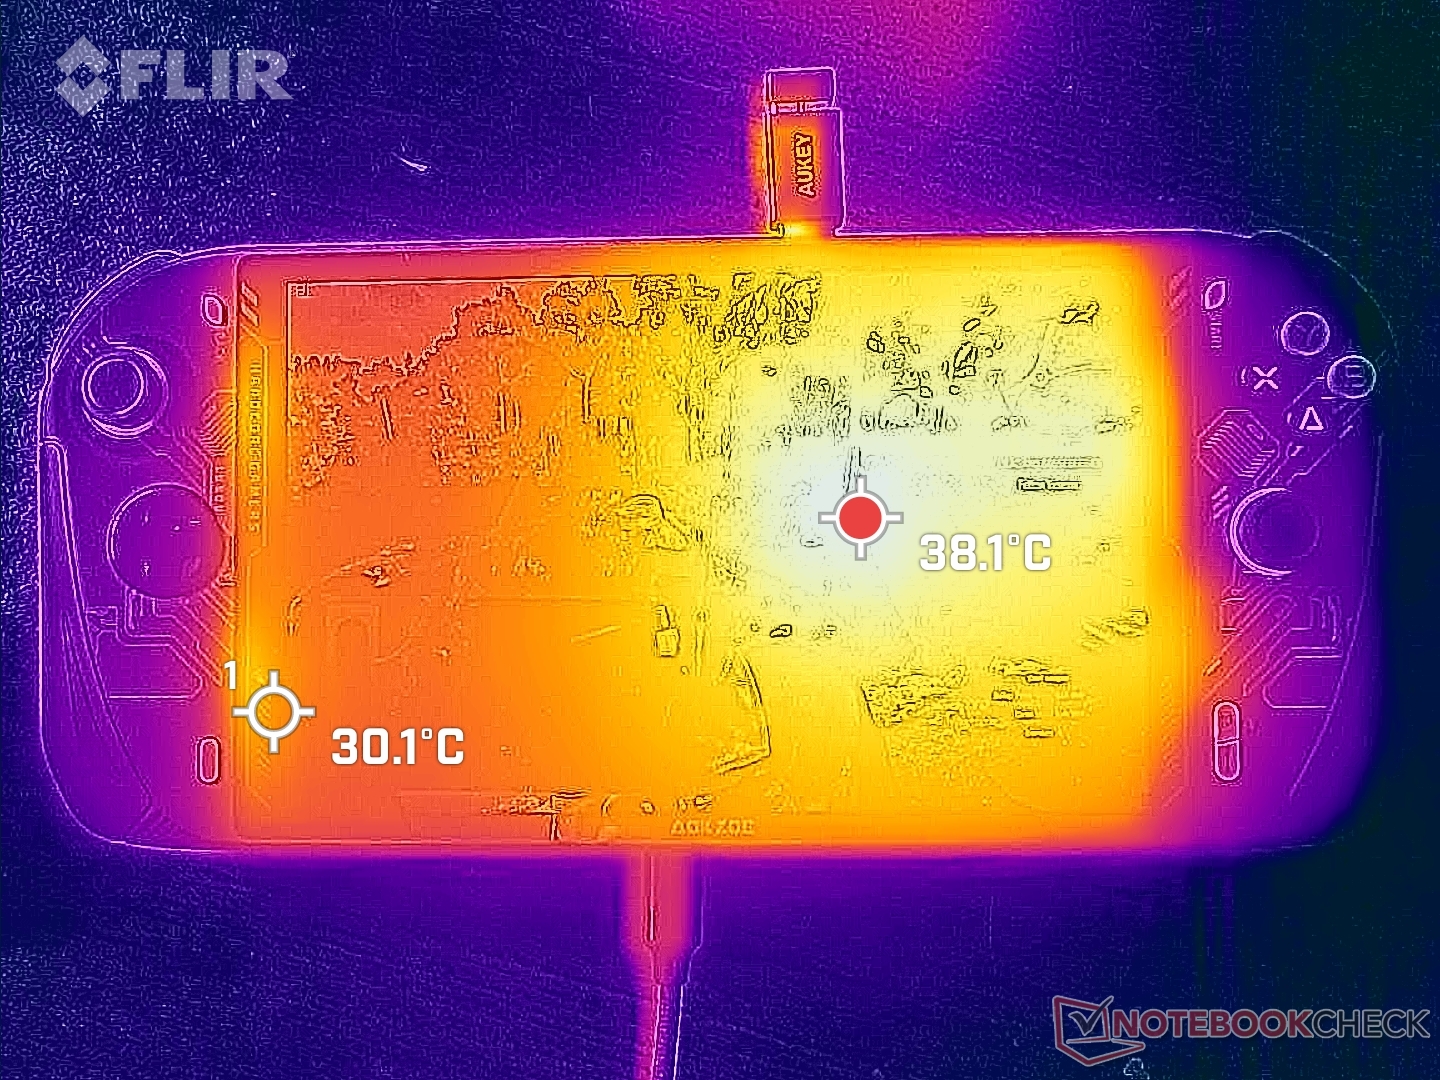
La temperatura della superficie può raggiungere i 39 C sulla parte anteriore e i 45 C su quella posteriore durante il gioco. Fortunatamente, questi punti caldi si trovano al centro dello schermo o sul bordo superiore, dove è improbabile che le dita tocchino l'unità. Le parti del controller e dei pulsanti si mantengono più fresche, tra i 20 e i 30 gradi centigradi. Le nostre mani non sono mai state fastidiosamente calde, indipendentemente dal tempo trascorso a giocare con l'A1.
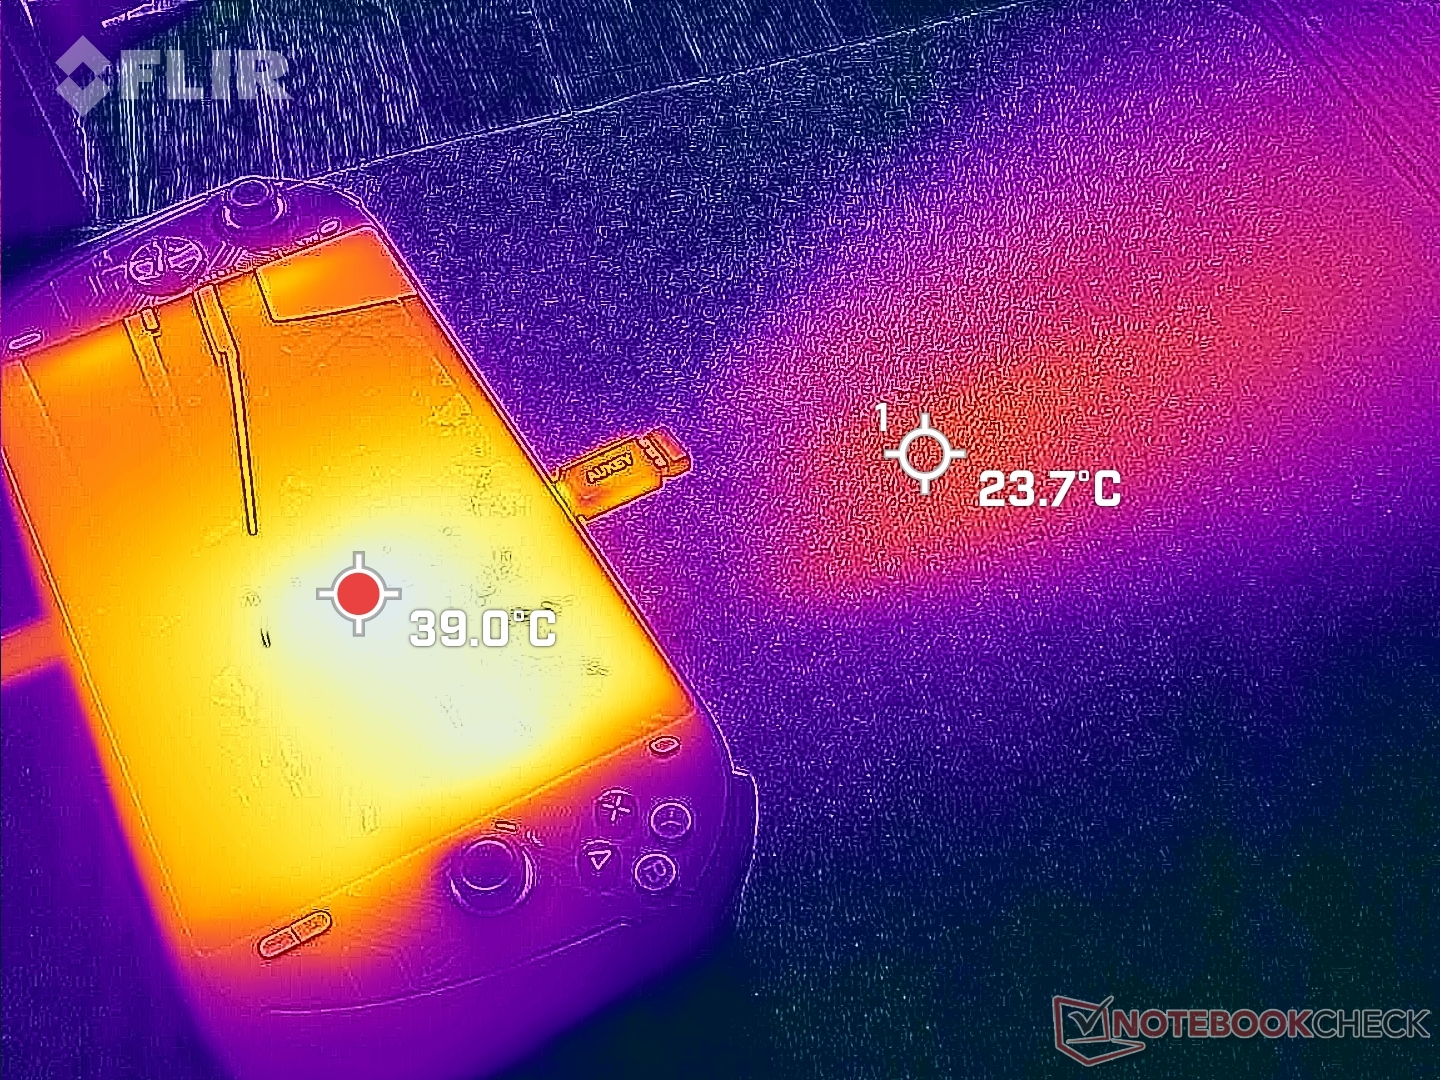
(±) La temperatura massima sul lato superiore è di 41.6 °C / 107 F, rispetto alla media di 40.4 °C / 105 F, che varia da 21.2 a 68.8 °C per questa classe Gaming.
(±) Il lato inferiore si riscalda fino ad un massimo di 41.6 °C / 107 F, rispetto alla media di 43.2 °C / 110 F
(+) In idle, la temperatura media del lato superiore è di 31.2 °C / 88 F, rispetto alla media deld ispositivo di 33.9 °C / 93 F.
(±) I poggiapolsi e il touchpad possono diventare molto caldi al tatto con un massimo di 38.8 °C / 101.8 F.
(-) La temperatura media della zona del palmo della mano di dispositivi simili e'stata di 28.8 °C / 83.8 F (-10 °C / -18 F).
| Aokzoe A1 AMD Ryzen 7 6800U, AMD Radeon 680M | One Netbook XPlayer 2 AMD Ryzen 7 6800U, AMD Radeon 680M | Asus ROG Ally Z1 Extreme AMD Ryzen Z1 Extreme, AMD Radeon 780M | GPD Win 4 AMD Ryzen 7 6800U, AMD Radeon 680M | GPD Win Max 2 Intel Core i7-1260P, Intel Iris Xe Graphics G7 96EUs | |
|---|---|---|---|---|---|
| Heat | 2% | 8% | 24% | 25% | |
| Maximum Upper Side * (°C) | 41.6 | 42.6 -2% | 44.4 -7% | 35 16% | 28.6 31% |
| Maximum Bottom * (°C) | 41.6 | 39.6 5% | 37.9 9% | 26.8 36% | 33 21% |
| Idle Upper Side * (°C) | 34.8 | 32.4 7% | 29.9 14% | 28.4 18% | 24.6 29% |
| Idle Bottom * (°C) | 33.6 | 34.3 -2% | 28.3 16% | 25 26% | 27.6 18% |
* ... Meglio usare valori piccoli
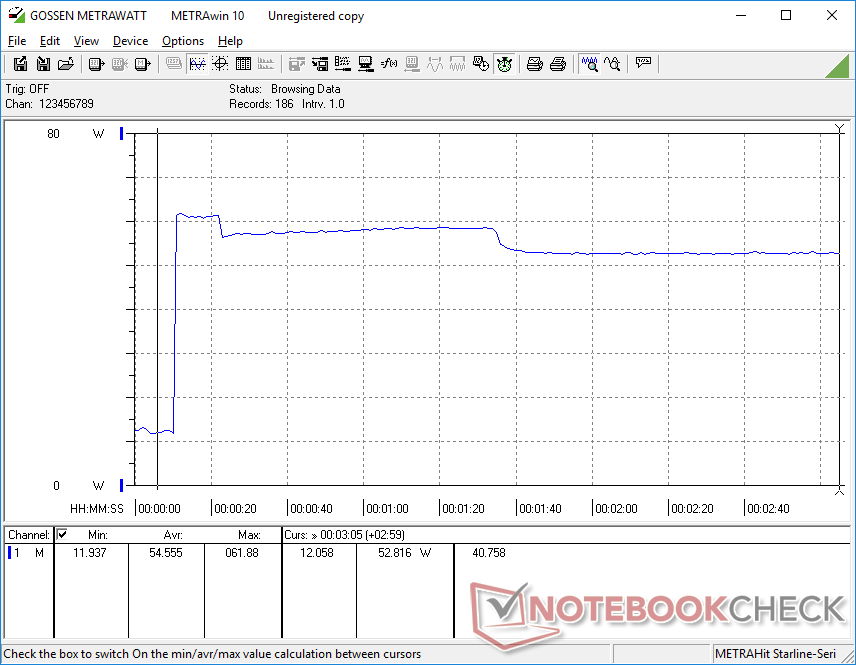
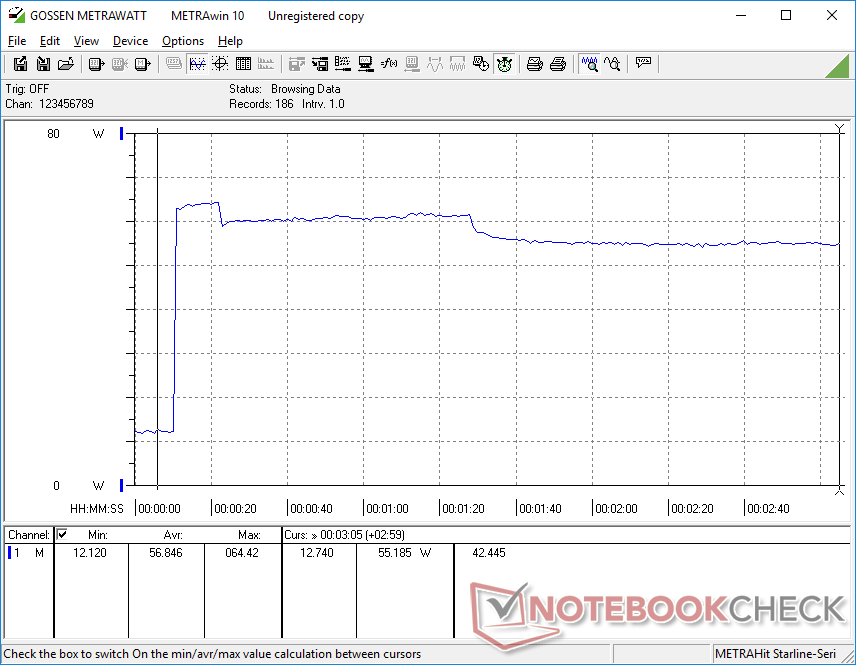
Stress test
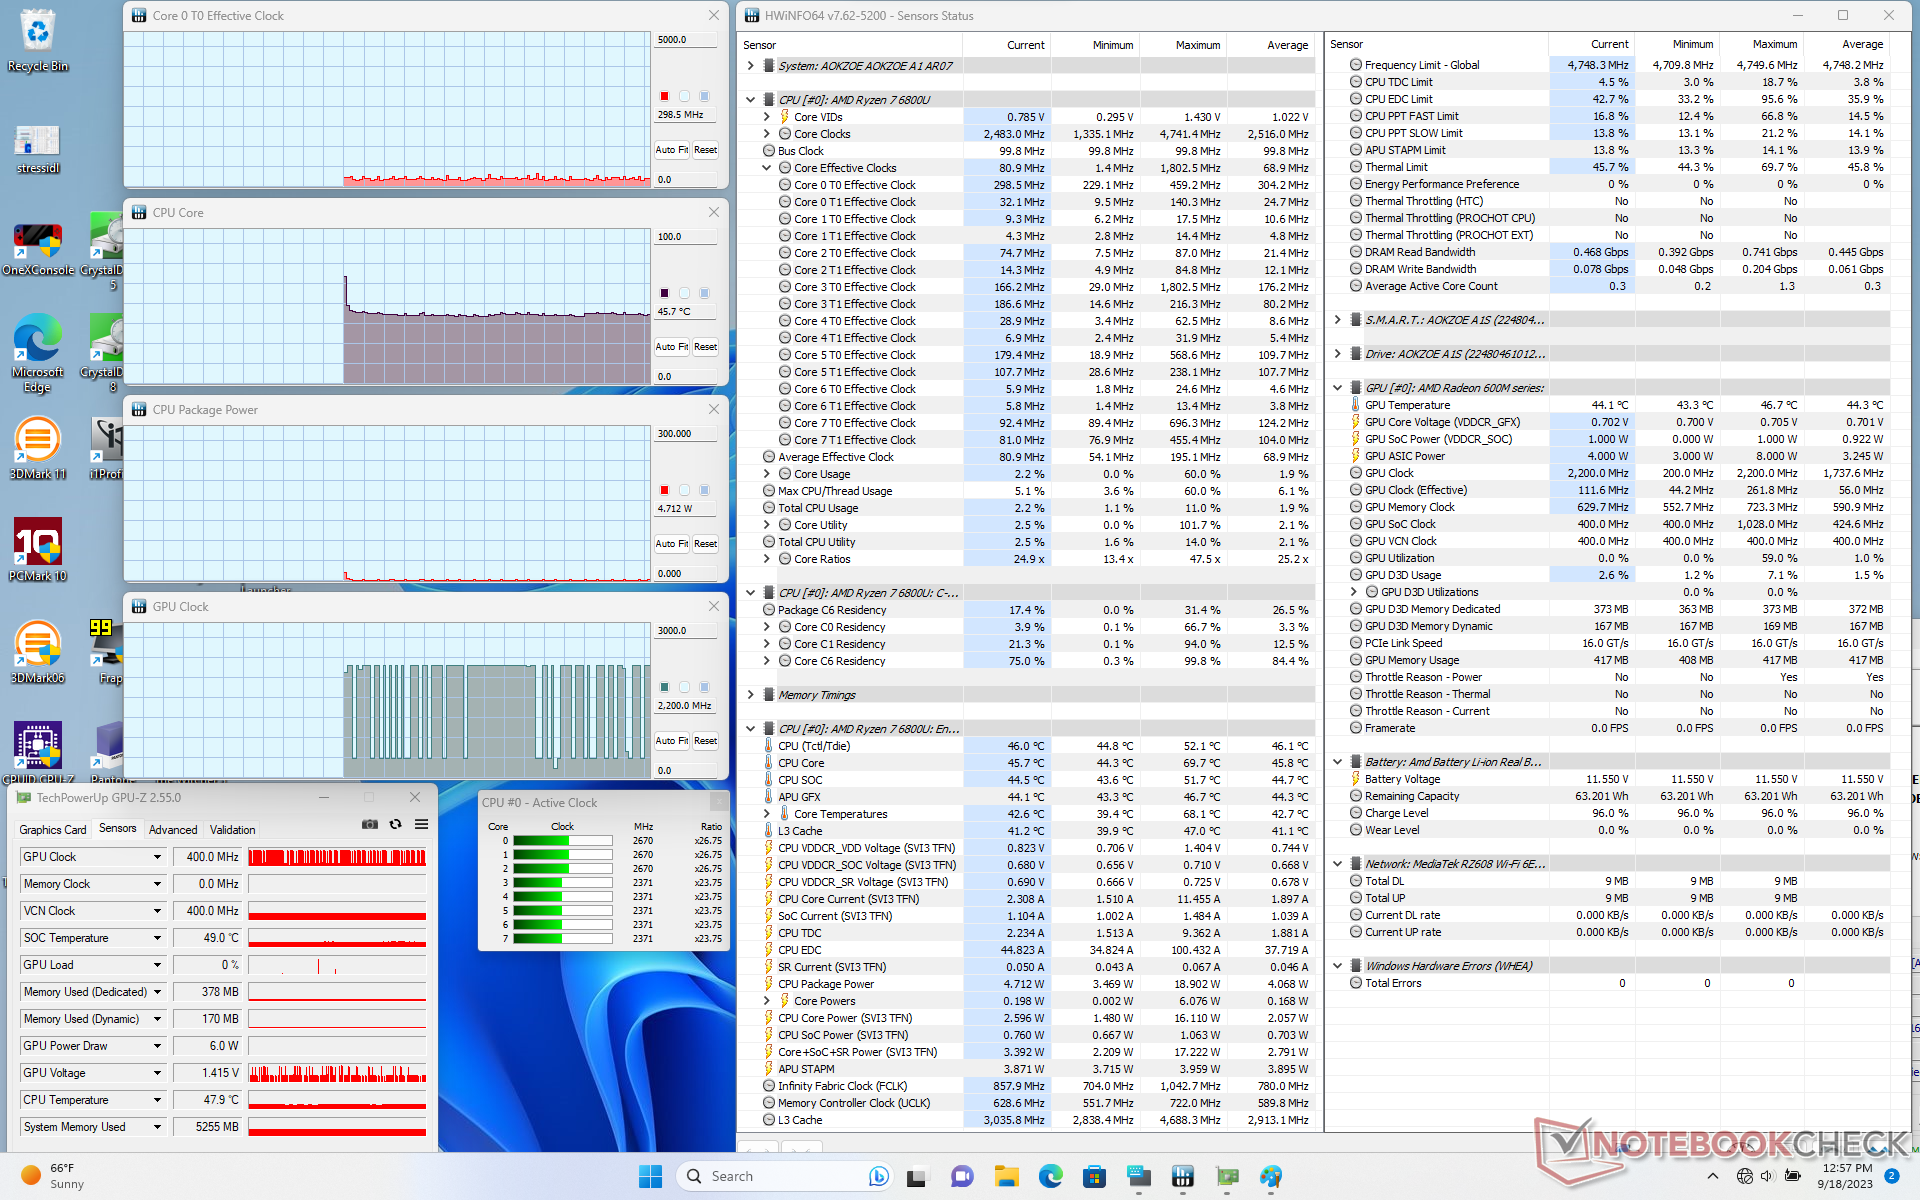
La velocità di clock della CPU, l'assorbimento di potenza della scheda e la temperatura del core si stabilizzano rispettivamente a 2,8 GHz, 28 W e 79 C quando si avvia lo stress Prime95. Il sistema è in grado di mantenere l'obiettivo di 28 W di TDP per periodi prolungati, a differenza dello stesso processore del Win 4 che scende a soli 2,2 GHz e 18 W in condizioni simili, anche se impostato in modalità Performance.
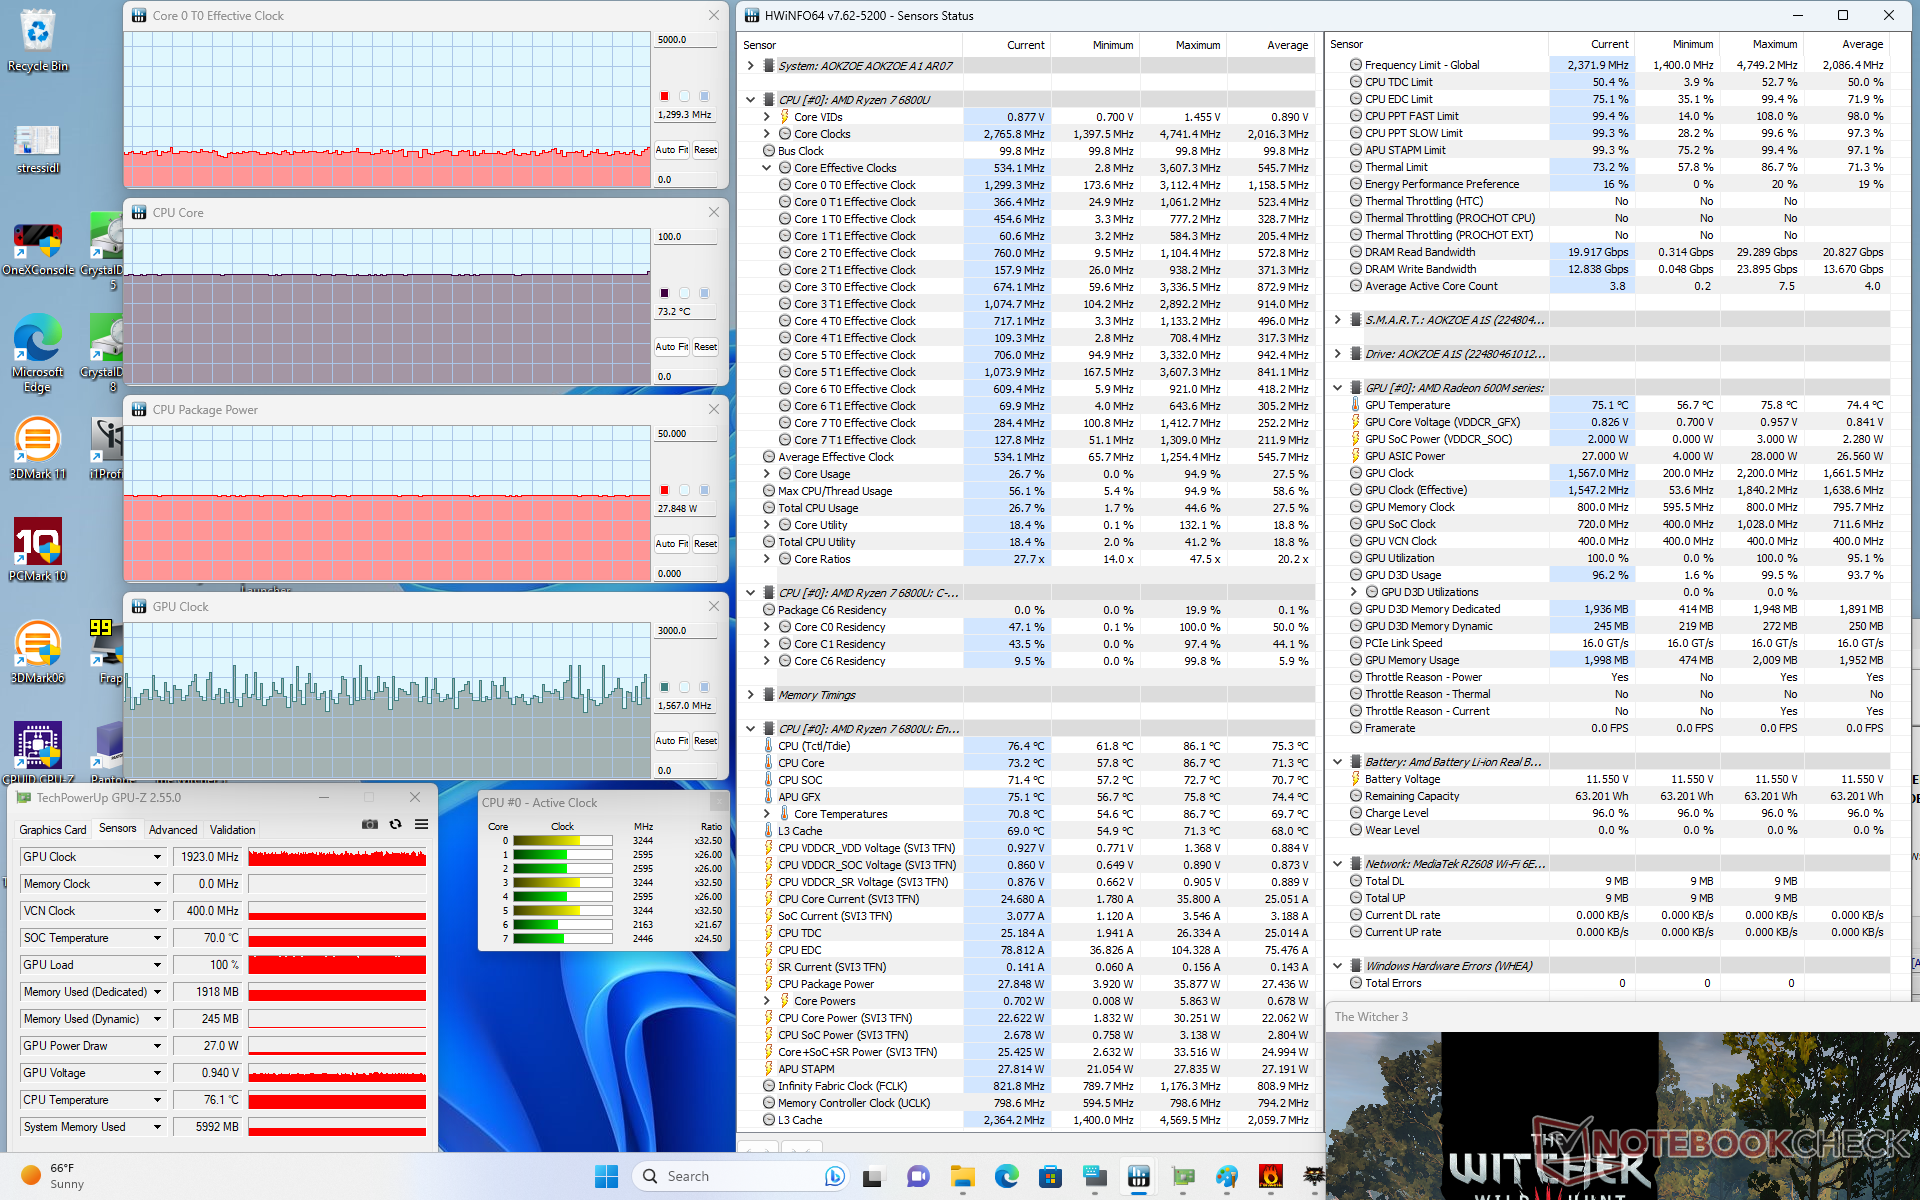
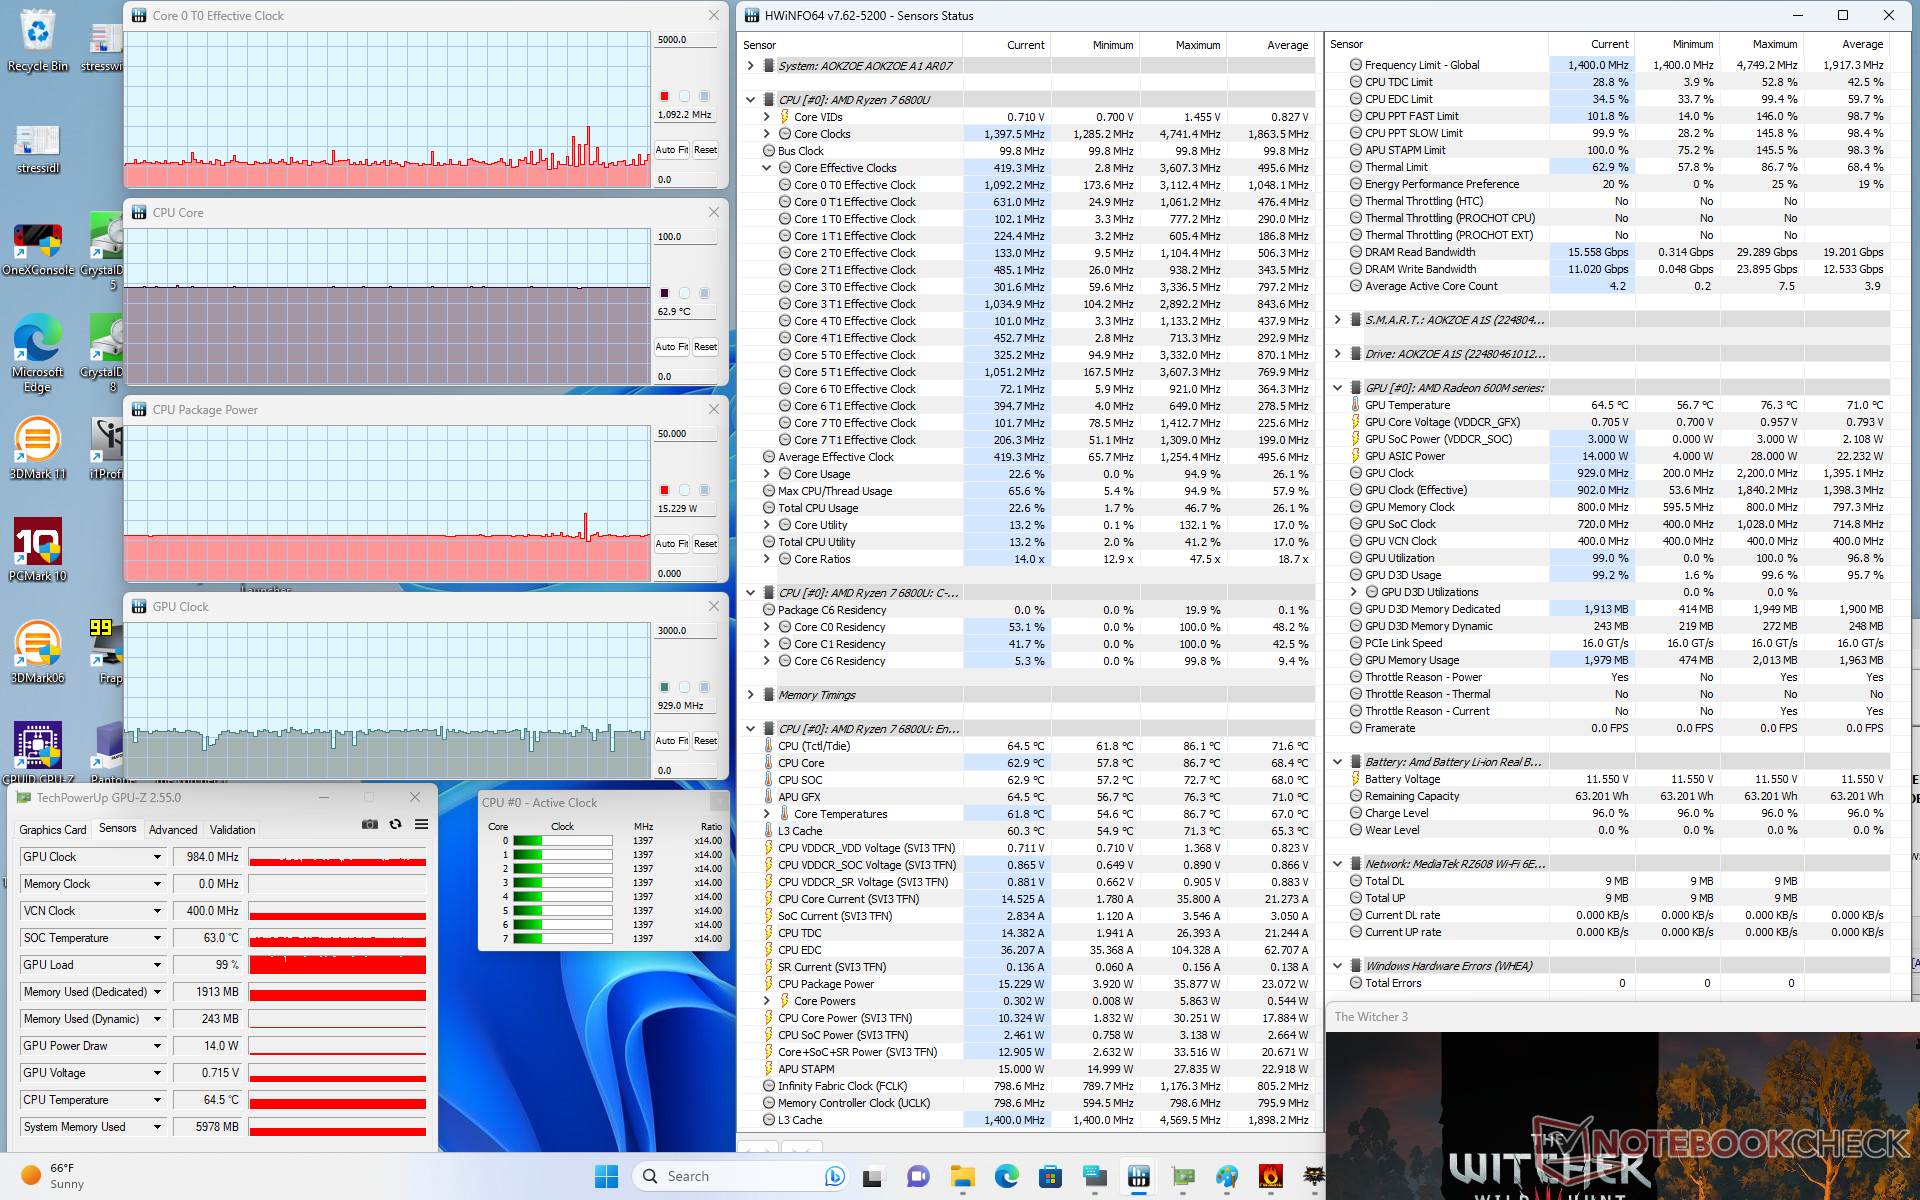
La frequenza di clock della GPU e l'assorbimento di potenza sono pari a 1923 MHz e 27 W, rispettivamente, quando si utilizza la modalità Performance Witcher 3 in modalità Performance. In modalità Balanced, la GPU scende a soli 984 MHz e 14 W, il che corrisponde alle osservazioni di 3DMark e al rumore della ventola.
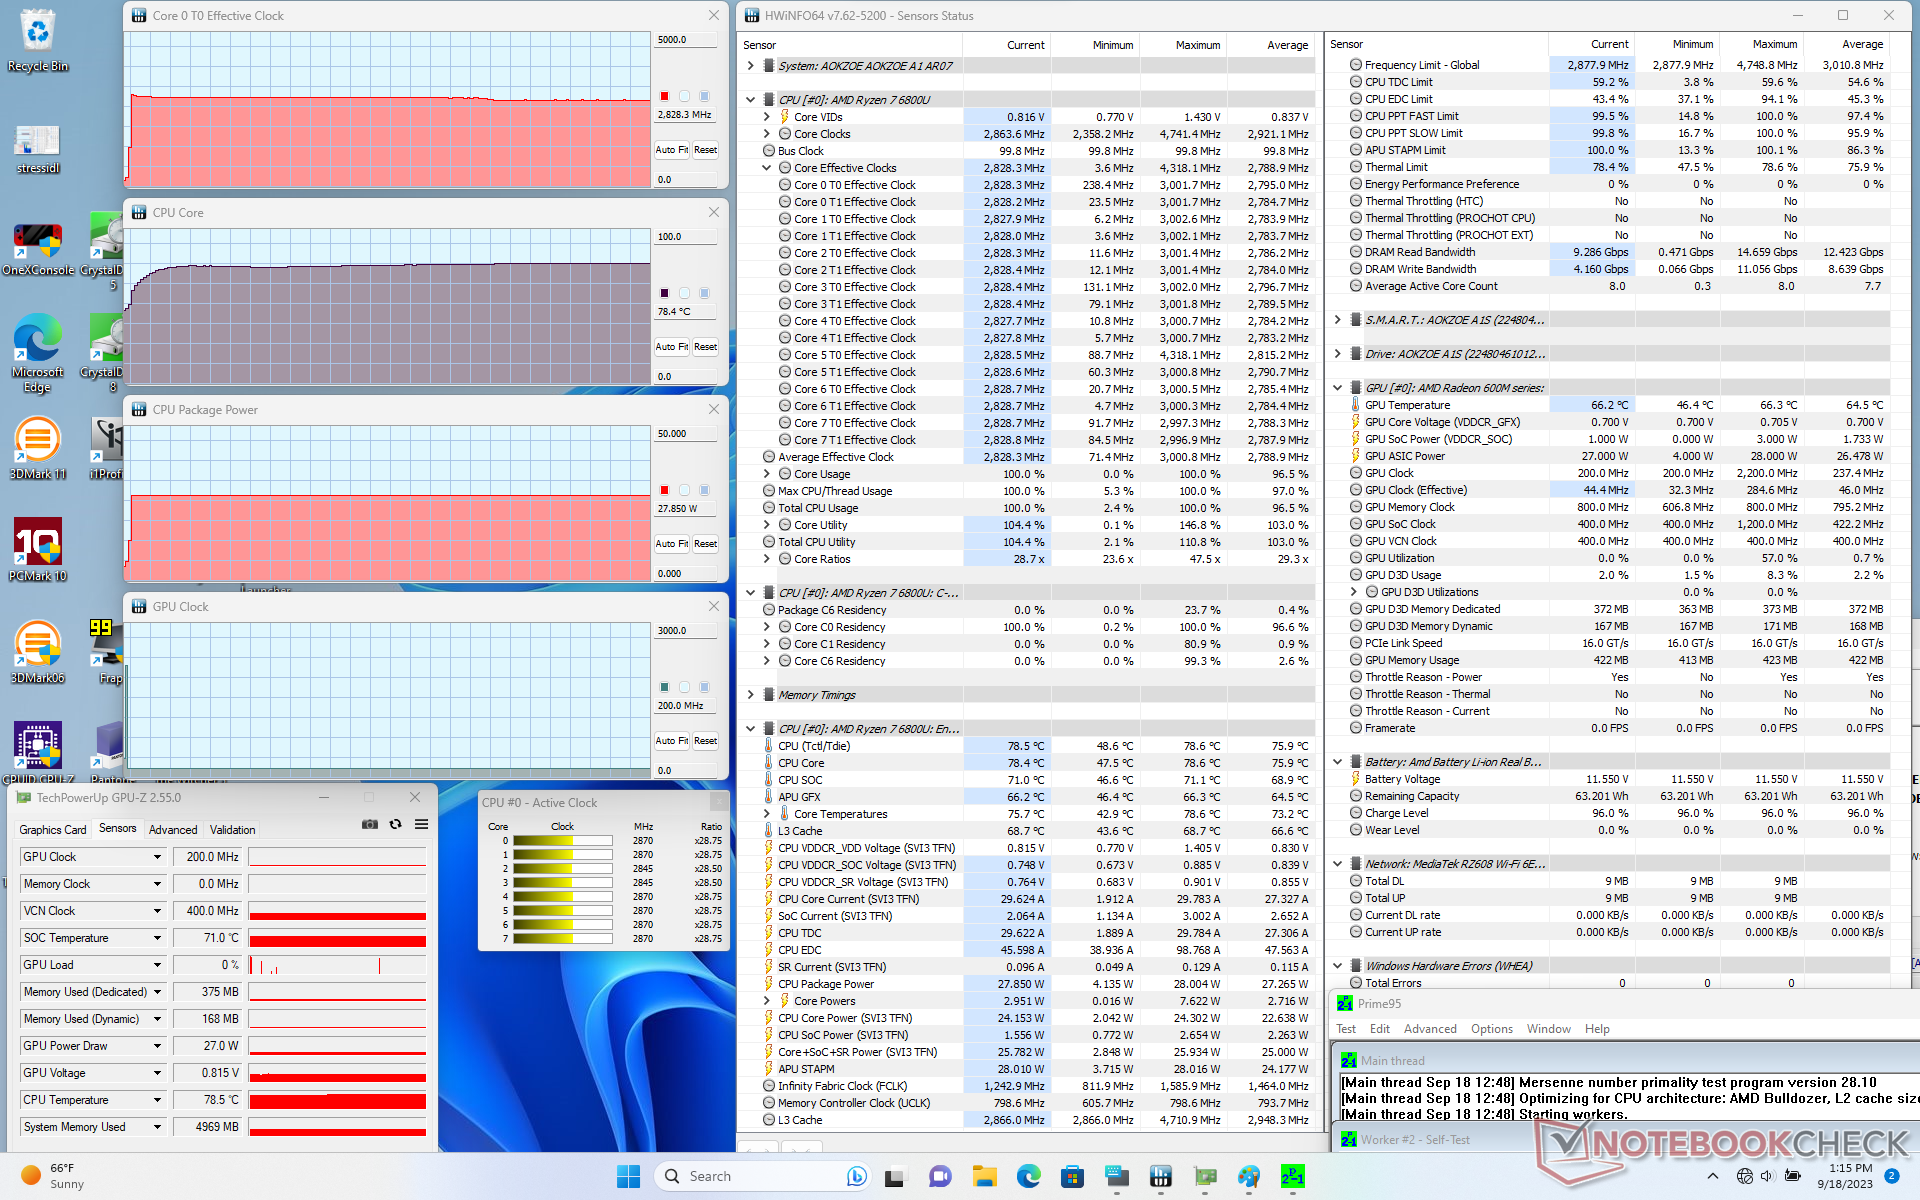
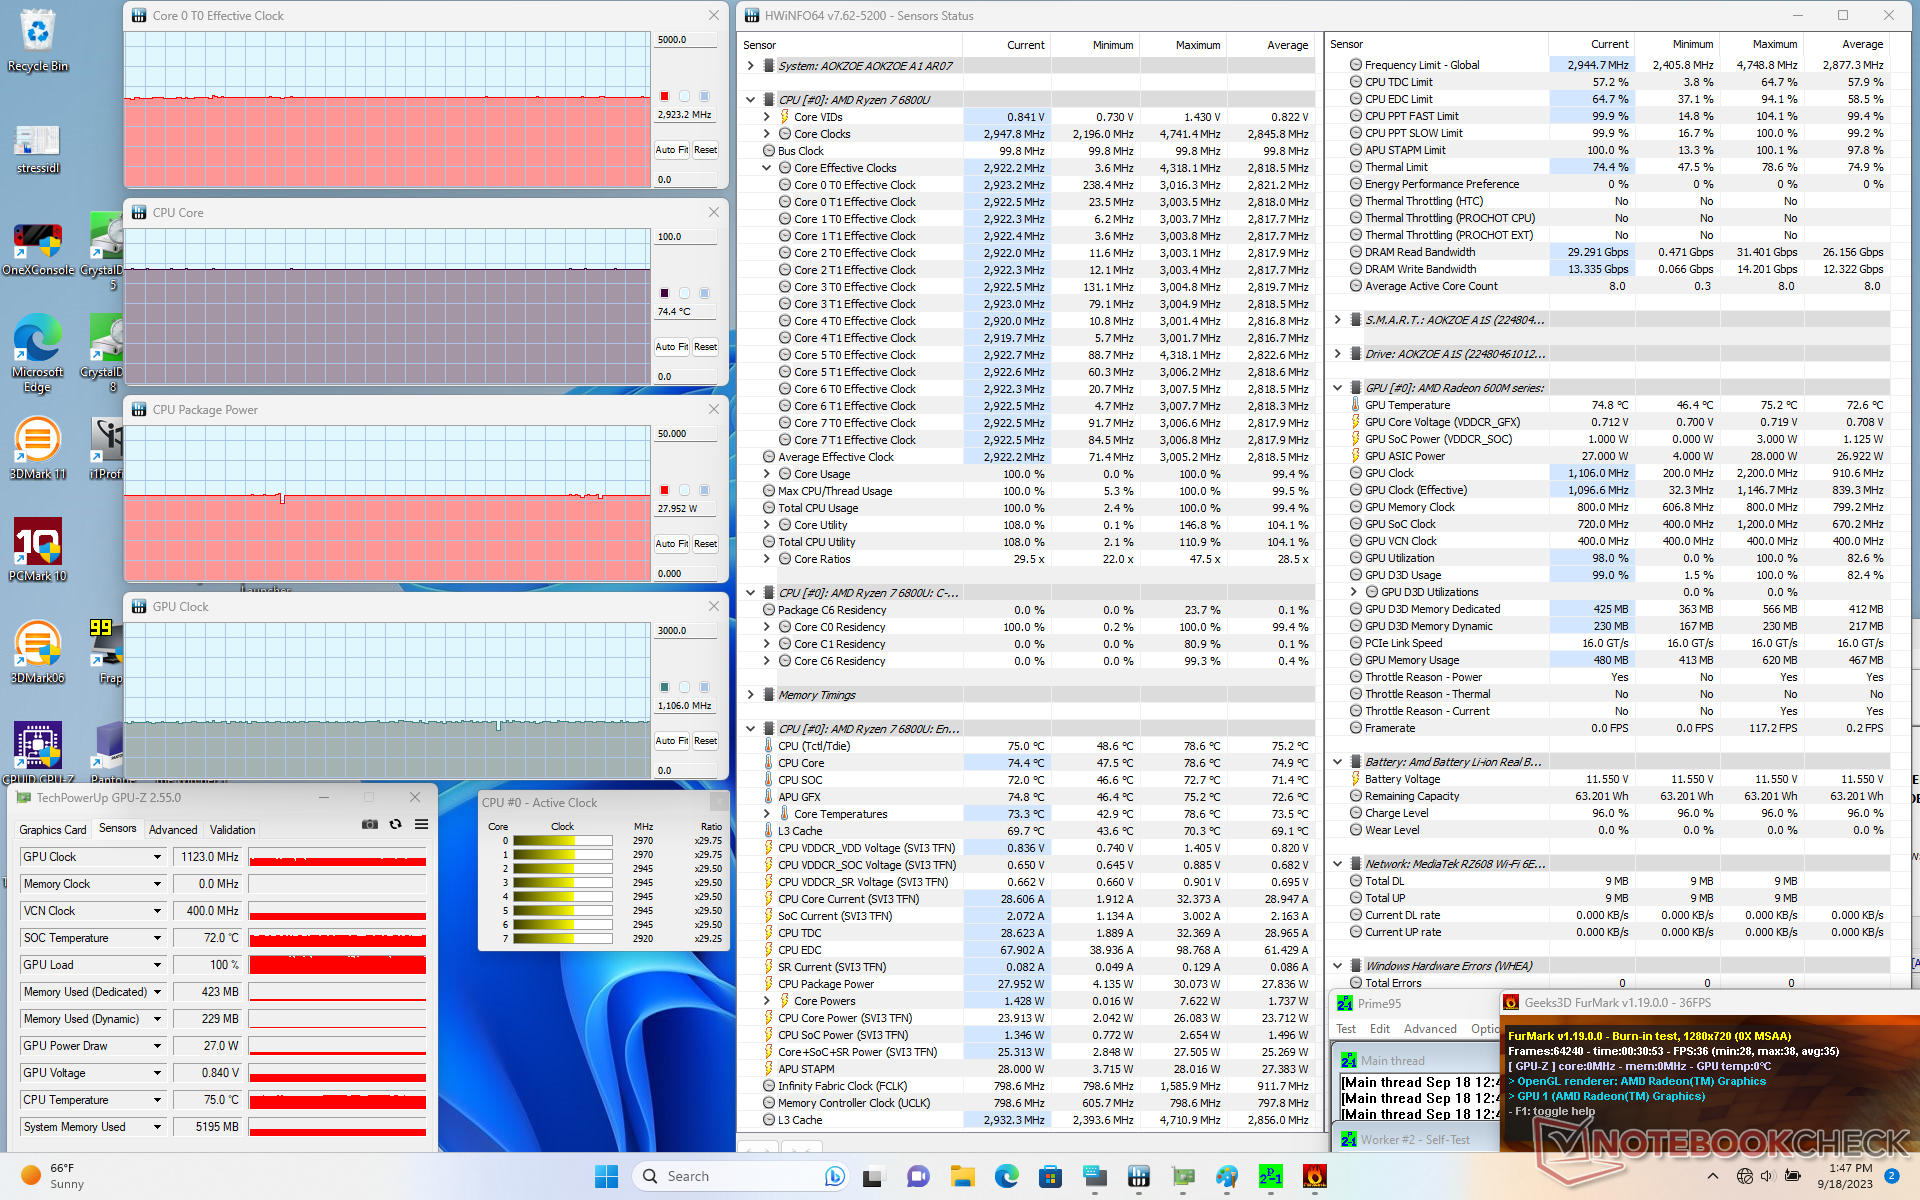
| Clock della CPU (GHz) | Clock della GPU (MHz) | Temperatura media della CPU (°C) | |
| Sistema inattivo | -- | -- | 46 |
| Stress Prime95 | 2,8 | -- | 79 |
| StressPrime95 + FurMark | 2,9 | 1106 | 75 |
| Witcher 3 Stress (modalità bilanciata) | ~1,1 | 929 | 63 |
| Witcher 3 Stress (modalità Performance) | ~1,3 | ~1567 | 73 |
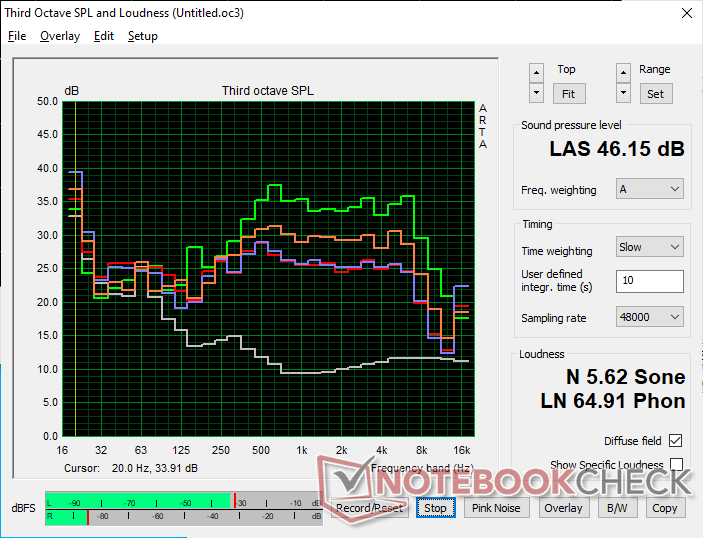
Altoparlanti
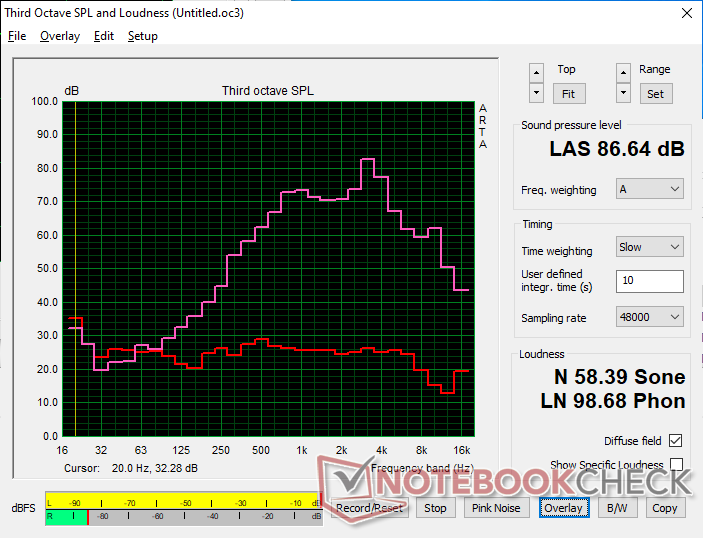
Aokzoe A1 analisi audio
(+) | gli altoparlanti sono relativamente potenti (86.6 dB)
Bassi 100 - 315 Hz
(-) | quasi nessun basso - in media 22.7% inferiori alla media
(±) | la linearità dei bassi è media (12.6% delta rispetto alla precedente frequenza)
Medi 400 - 2000 Hz
(±) | medi elevati - circa 7.2% superiore alla media
(±) | linearità dei medi adeguata (7.6% delta rispetto alla precedente frequenza)
Alti 2 - 16 kHz
(±) | alti elevati - circa 7.9% superiori alla media
(±) | la linearità degli alti è media (14.5% delta rispetto alla precedente frequenza)
Nel complesso 100 - 16.000 Hz
(-) | suono nel complesso non lineare (33.1% di differenza rispetto alla media
Rispetto alla stessa classe
» 98% di tutti i dispositivi testati in questa classe è stato migliore, 1% simile, 1% peggiore
» Il migliore ha avuto un delta di 6%, medio di 18%, peggiore di 132%
Rispetto a tutti i dispositivi testati
» 92% di tutti i dispositivi testati in questa classe è stato migliore, 1% similare, 7% peggiore
» Il migliore ha avuto un delta di 4%, medio di 23%, peggiore di 134%
Apple MacBook Pro 16 2021 M1 Pro analisi audio
(+) | gli altoparlanti sono relativamente potenti (84.7 dB)
Bassi 100 - 315 Hz
(+) | bassi buoni - solo 3.8% dalla media
(+) | bassi in lineaa (5.2% delta rispetto alla precedente frequenza)
Medi 400 - 2000 Hz
(+) | medi bilanciati - solo only 1.3% rispetto alla media
(+) | medi lineari (2.1% delta rispetto alla precedente frequenza)
Alti 2 - 16 kHz
(+) | Alti bilanciati - appena 1.9% dalla media
(+) | alti lineari (2.7% delta rispetto alla precedente frequenza)
Nel complesso 100 - 16.000 Hz
(+) | suono nel complesso lineare (4.6% differenza dalla media)
Rispetto alla stessa classe
» 0% di tutti i dispositivi testati in questa classe è stato migliore, 0% simile, 100% peggiore
» Il migliore ha avuto un delta di 5%, medio di 17%, peggiore di 45%
Rispetto a tutti i dispositivi testati
» 0% di tutti i dispositivi testati in questa classe è stato migliore, 0% similare, 100% peggiore
» Il migliore ha avuto un delta di 4%, medio di 23%, peggiore di 134%
Gestione dell'energia
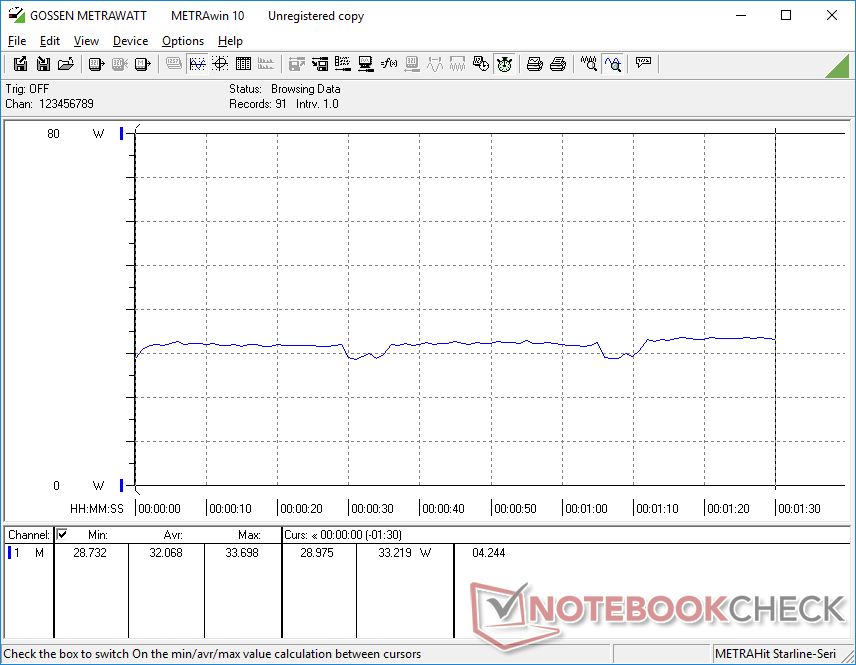
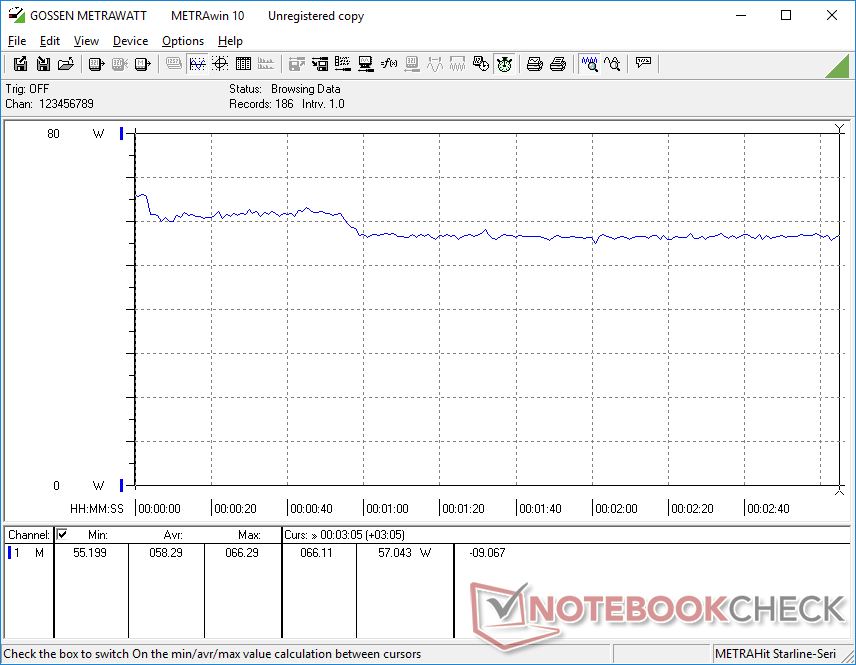
Consumo di energia
Il consumo energetico è leggermente superiore a quello delOneXPlayer 2 probabilmente a causa delle maggiori prestazioni della nostra CPU Ryzen 7 6800U. Il ROG Ally è ancora più esigente per riflettere i suoi obiettivi di prestazioni più elevati.
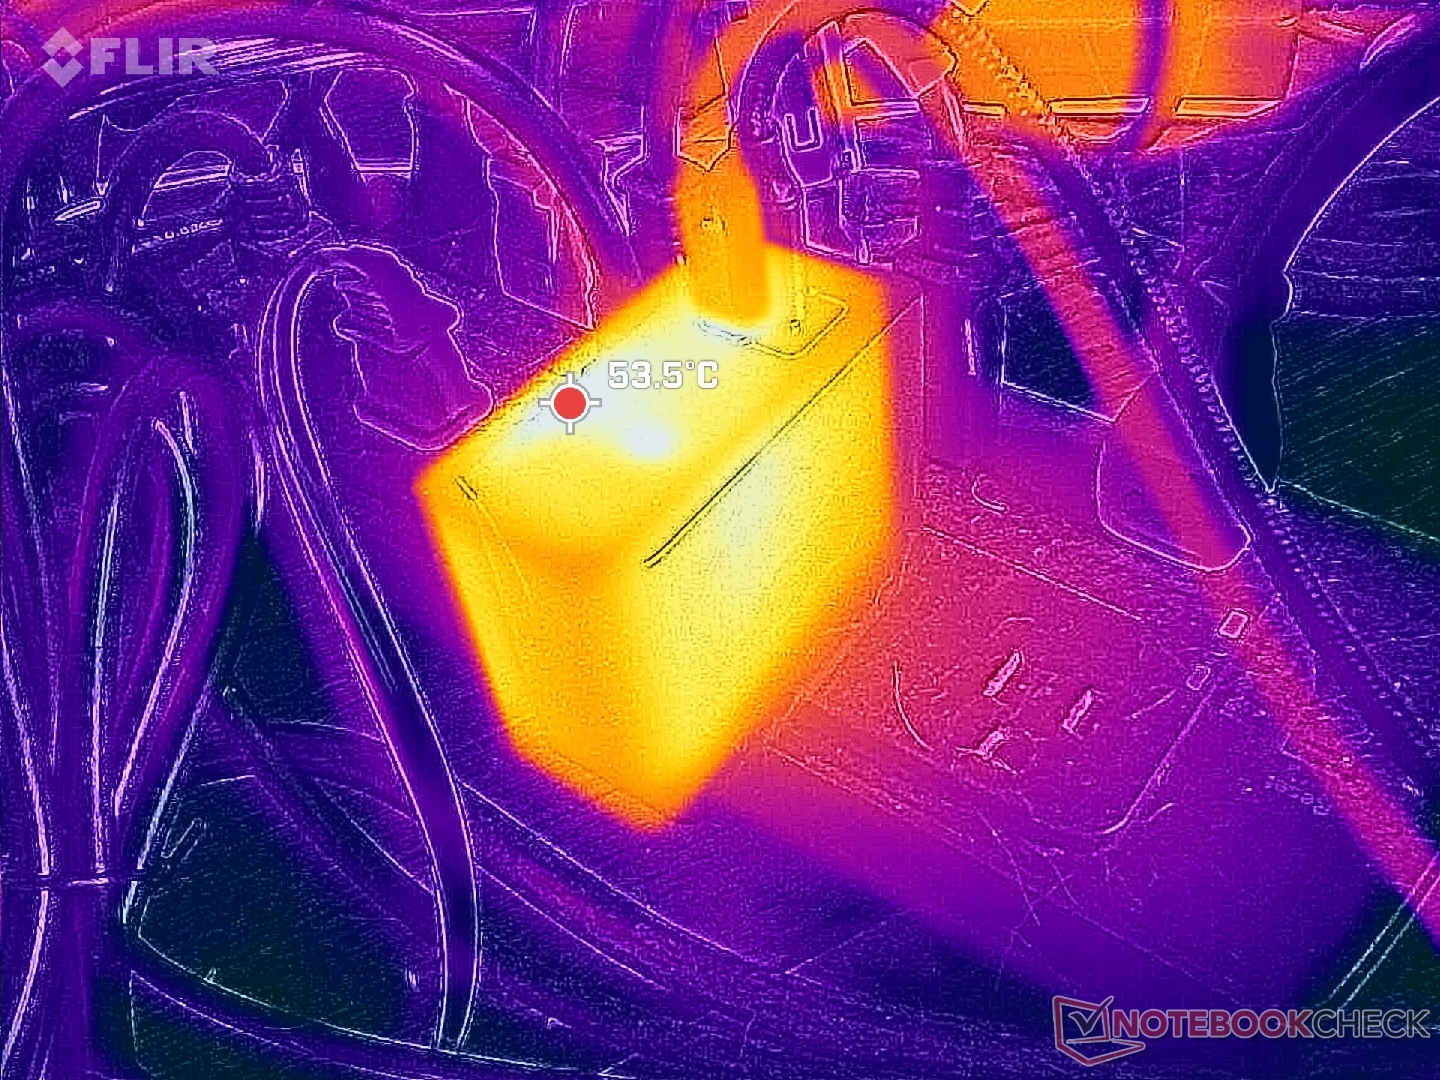
Siamo riusciti a misurare un consumo massimo di 65 W dal piccolo adattatore GaN USB-C da 100 W (6,6 x 5,4 x 3,1 cm) quando la CPU è al 100%. Il gaming assorbe in media circa 58 W e quindi c'è molto spazio per la ricarica e l'alimentazione di qualsiasi dispositivo USB.
| Off / Standby | |
| Idle | |
| Sotto carico |
|
Leggenda:
min: | |
| Aokzoe A1 R7 6800U, Radeon 680M, , IPS, 1920x1200, 8" | One Netbook XPlayer 2 R7 6800U, Radeon 680M, , IPS, 2560x1600, 8.4" | Asus ROG Ally Z1 Extreme Z1 Extreme, Radeon 780M, Micron 2400 MTFDKBK512QFM, IPS, 1920x1080, 7" | GPD Win 4 R7 6800U, Radeon 680M, BiWin CE480Y2D100-1TB, IPS, 1920x1080, 6" | GPD Win 3 i5-1135G7, Iris Xe G7 80EUs, BIWIN NS200 1TB CNF82GS1G02-1TB, IPS, 1280x720, 5.5" | |
|---|---|---|---|---|---|
| Power Consumption | 14% | 9% | -3% | 42% | |
| Idle Minimum * (Watt) | 8.8 | 7.2 18% | 4.2 52% | 7.5 15% | 2.9 67% |
| Idle Average * (Watt) | 11.3 | 9.3 18% | 6.1 46% | 12.4 -10% | 4.5 60% |
| Idle Maximum * (Watt) | 11.5 | 9.7 16% | 6.3 45% | 13 -13% | 4.5 61% |
| Load Average * (Watt) | 32.1 | 33.1 -3% | 56.6 -76% | 46 -43% | 38.5 -20% |
| Witcher 3 ultra * (Watt) | 58.3 | 49.6 15% | 64.1 -10% | 45.2 22% | 28.9 50% |
| Load Maximum * (Watt) | 64.5 | 50.7 21% | 67.2 -4% | 56 13% | 41.4 36% |
* ... Meglio usare valori piccoli
Power Consumption Witcher 3 / Stresstest
Power Consumption external Monitor
Durata della batteria
La batteria da 65 Wh è abbastanza capiente per una console portatile, considerando che alcuni portatili come ilLenovo IdeaPad 3 14 hanno capacità inferiori. La durata della batteria, tuttavia, è nella media: poco meno di 6,5 ore di navigazione WLAN in modalità bilanciata rispetto alle 8 ore o alle oltre 10 ore del ROG Ally o del OneXPlayer 2, rispettivamente. Ciò può essere in parte attribuito alla ventola che pulsa frequentemente senza motivo, come già detto. L'illuminazione RGB non può essere disattivata per non compromettere ulteriormente la durata della batteria.
Se si gioca, ci si aspetta che l'A1 duri solo circa 80 minuti o poco meno di 2 ore nel migliore dei casi. La breve durata è condivisa anche da altri palmari per il gioco, come il OneXPlayer 2 o il GPD Win 4.
La ricarica da vuoto a pieno regime con l'adattatore CA in dotazione richiede poco più di 2 ore.
| Aokzoe A1 R7 6800U, Radeon 680M, 65 Wh | One Netbook XPlayer 2 R7 6800U, Radeon 680M, 65.5 Wh | Asus ROG Ally Z1 Extreme Z1 Extreme, Radeon 780M, 40 Wh | GPD Win 4 R7 6800U, Radeon 680M, 46 Wh | GPD Win 3 i5-1135G7, Iris Xe G7 80EUs, 44 Wh | |
|---|---|---|---|---|---|
| Autonomia della batteria | 64% | 22% | 17% | 39% | |
| Reader / Idle (h) | 7.2 | 9.7 35% | |||
| WiFi v1.3 (h) | 6.4 | 10.5 64% | 7.8 22% | 7.5 17% | 11.3 77% |
| Load (h) | 1.3 | 1.3 0% | 1.3 0% | ||
| Witcher 3 ultra (h) | 1.6 | 1 | |||
| H.264 (h) | 9.5 |
Pro
Contro
Verdetto - Potrebbe valere la pena dopo alcuni tagli di prezzo
L'Aokzoe A1 eccelle nel massimizzare le prestazioni rispetto al suo piccolo fattore di forma. Le console portatili hanno la tendenza a sottocloccare i loro processori o a farli funzionare con clock rate Turbo Boost più bassi a causa delle loro dimensioni, ma il Ryzen 7 6800U dell'A1 si comporta molto bene anche quando è sotto stress. Inoltre, non presenta i problemi di stuttering dei fotogrammi che abbiamo riscontrato sul GPD Win 4.
Sebbene l'A1 sia impressionante dal punto di vista delle prestazioni, il suo hardware e le sue caratteristiche potrebbero richiedere maggiore attenzione. In particolare, i tasti della spalla sono inaffidabilmente difficili da premere rispetto a quelli dei controller di Nintendo Switch o GPD Win 4. La ventola pulsa troppo frequentemente e rumorosamente anche in modalità risparmio energetico, mentre i LED frontali sono sempre attivi e non possono essere facilmente disattivati. I problemi di risveglio dal sonno, il PWM, i colori poco calibrati e la visibilità limitata all'esterno potrebbero allontanare molti potenziali acquirenti. Alcuni inconvenienti sono prevedibili, ma tendono a essere più evidenti sull'A1, soprattutto se confrontato con il modello di prezzo simile Asus ROG Ally.
L'Aokzoe A1 è in grado di offrire prestazioni eccellenti. Sfortunatamente, molte delle sue caratteristiche mancano dello smalto e dell'attenzione ai dettagli che ci aspettiamo da un PC da 1000 dollari.
C'è molto spazio per i miglioramenti, se in futuro ci sarà una rielaborazione. Pulsanti migliori, un display più luminoso e un migliore comportamento della ventola sono tutti elementi in cima alla nostra lista. L'A1 è una buona opzione per coloro che desiderano uno schermo touch da 8 pollici relativamente grande e prestazioni costanti di Ryzen 7 6800U, ma i giocatori più seri troveranno un valore e prestazioni migliori nell'altamente competitivo Asus ROG Ally che costa circa lo stesso prezzo.
Prezzo e disponibilità
Aokzoe sta spedendo l'A1 direttamente ai clienti al prezzo di 1000 dollari per la configurazione da 32 GB+2 TB. In alternativa, Amazon offre la stessa configurazione a 1300 dollari, mentre la configurazione inferiore da 16 GB+512 GB si può trovare a soli 930 dollari.
Aokzoe A1
- 09/20/2023 v7 (old)
Allen Ngo
Transparency
La selezione dei dispositivi da recensire viene effettuata dalla nostra redazione. Il campione di prova è stato fornito all'autore come prestito dal produttore o dal rivenditore ai fini di questa recensione. L'istituto di credito non ha avuto alcuna influenza su questa recensione, né il produttore ne ha ricevuto una copia prima della pubblicazione. Non vi era alcun obbligo di pubblicare questa recensione. In quanto società mediatica indipendente, Notebookcheck non è soggetta all'autorità di produttori, rivenditori o editori.
Ecco come Notebookcheck esegue i test
Ogni anno, Notebookcheck esamina in modo indipendente centinaia di laptop e smartphone utilizzando procedure standardizzate per garantire che tutti i risultati siano comparabili. Da circa 20 anni sviluppiamo continuamente i nostri metodi di prova e nel frattempo stabiliamo gli standard di settore. Nei nostri laboratori di prova, tecnici ed editori esperti utilizzano apparecchiature di misurazione di alta qualità. Questi test comportano un processo di validazione in più fasi. Il nostro complesso sistema di valutazione si basa su centinaia di misurazioni e parametri di riferimento ben fondati, che mantengono l'obiettività.Price comparison

