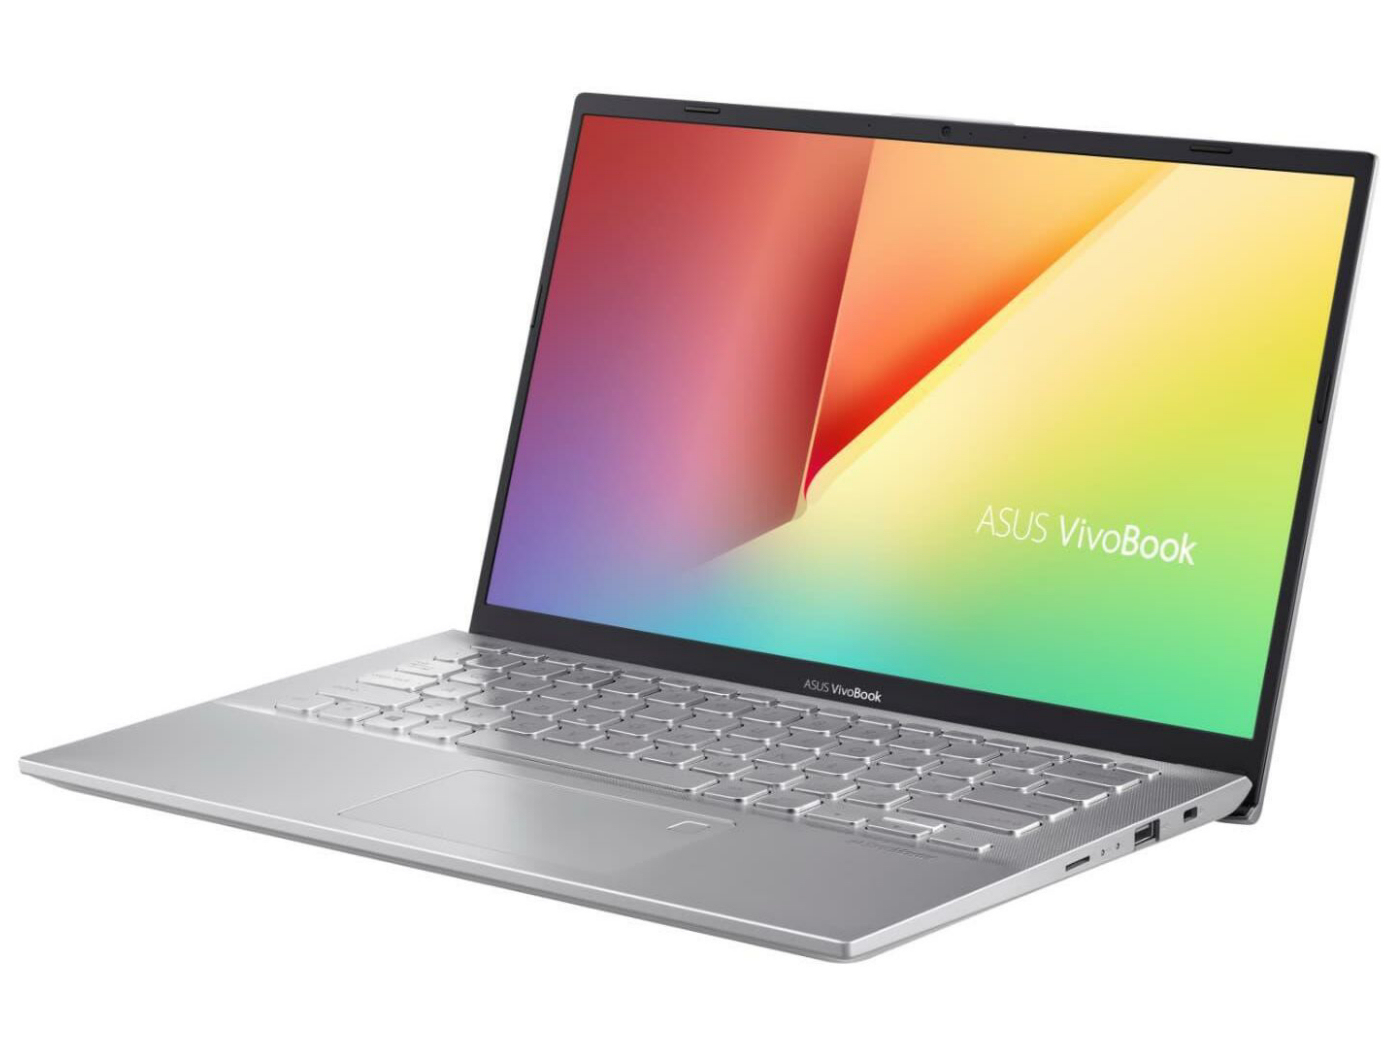
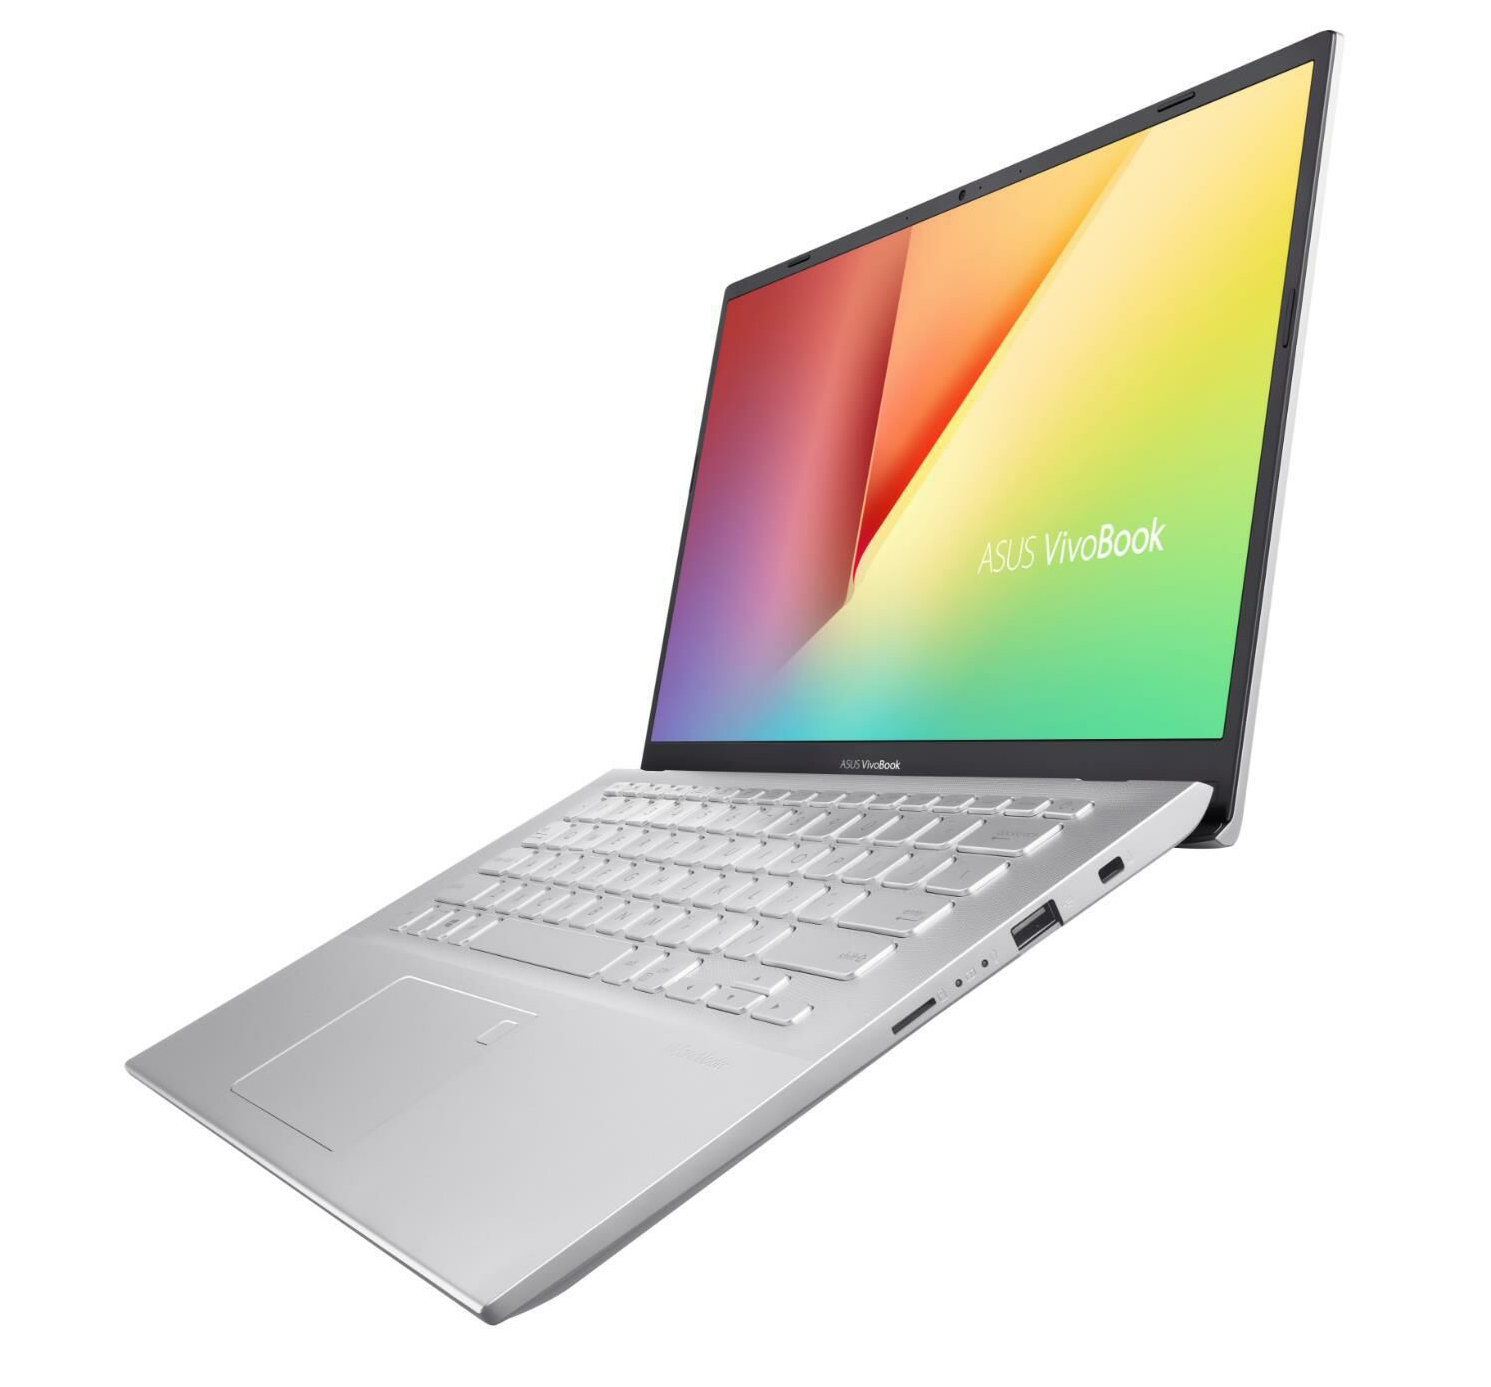
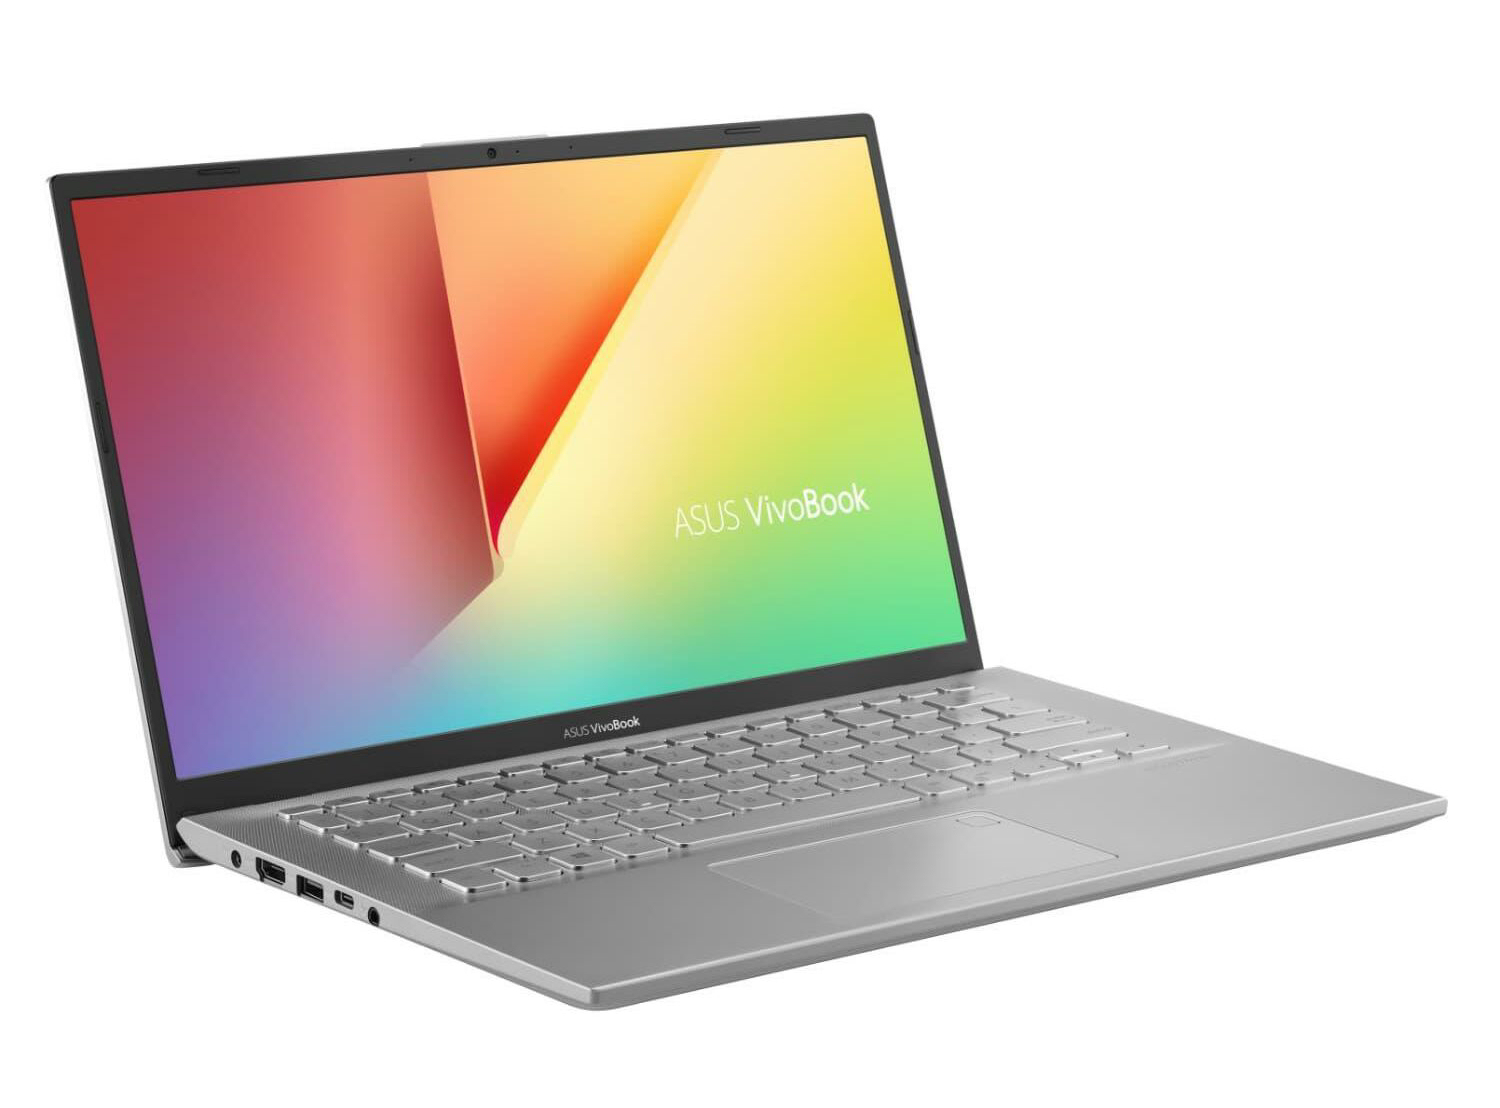
Recensione del Laptop ASUS VivoBook 14 X412FJ: un computer portatile da 14" con qualche problema di prestazioni
| SD Card Reader | |
| average JPG Copy Test (av. of 3 runs) | |
| Media della classe Multimedia (23 - 531, n=42, ultimi 2 anni) | |
| Lenovo Ideapad S340-14IWL-81N70056GE (Toshiba Exceria Pro SDXC 64 GB UHS-II) | |
| HP 14-dk0008ng (Toshiba Exceria Pro SDXC 64 GB UHS-II) | |
| Asus VivoBook 14 X412FJ-EB023T (Toshiba Exceria Pro M501 microSDXC 64GB) | |
| Asus VivoBook 14 F412FJ-EB084T (Toshiba Exceria Pro M501 microSDXC 64GB) | |
| maximum AS SSD Seq Read Test (1GB) | |
| Media della classe Multimedia (37.3 - 1455, n=41, ultimi 2 anni) | |
| Lenovo Ideapad S340-14IWL-81N70056GE (Toshiba Exceria Pro SDXC 64 GB UHS-II) | |
| HP 14-dk0008ng (Toshiba Exceria Pro SDXC 64 GB UHS-II) | |
| Asus VivoBook 14 X412FJ-EB023T (Toshiba Exceria Pro M501 microSDXC 64GB) | |
| Asus VivoBook 14 F412FJ-EB084T (Toshiba Exceria Pro M501 microSDXC 64GB) | |
| Networking | |
| iperf3 transmit AX12 | |
| Asus VivoBook 14 F412FJ-EB084T | |
| Honor Magicbook | |
| Honor Magicbook | |
| Asus VivoBook 14 X412FJ-EB023T | |
| Huawei MateBook D 14 W00D-53010GXL | |
| Lenovo Ideapad S340-14IWL-81N70056GE | |
| HP 14-dk0008ng | |
| iperf3 receive AX12 | |
| Huawei MateBook D 14 W00D-53010GXL | |
| Asus VivoBook 14 F412FJ-EB084T | |
| Asus VivoBook 14 X412FJ-EB023T | |
| Honor Magicbook | |
| Honor Magicbook | |
| HP 14-dk0008ng | |
| Lenovo Ideapad S340-14IWL-81N70056GE | |
| |||||||||||||||||||||||||
Distribuzione della luminosità: 89 %
Al centro con la batteria: 274 cd/m²
Contrasto: 898:1 (Nero: 0.305 cd/m²)
ΔE ColorChecker Calman: 3.66 | ∀{0.5-29.43 Ø4.72}
ΔE Greyscale Calman: 1.45 | ∀{0.09-98 Ø4.97}
59% sRGB (Argyll 1.6.3 3D)
38% AdobeRGB 1998 (Argyll 1.6.3 3D)
40.96% AdobeRGB 1998 (Argyll 3D)
59.5% sRGB (Argyll 3D)
39.65% Display P3 (Argyll 3D)
Gamma: 2.49
CCT: 6597 K
| Asus VivoBook 14 X412FJ-EB023T IPS, 1920x1080, 14" | Asus VivoBook 14 F412FJ-EB084T IPS, 1920x1080, 14" | Lenovo Ideapad S340-14IWL-81N70056GE IPS, 1920x1080, 14" | HP 14-dk0008ng IPS, 1920x1080, 14" | Honor Magicbook 1920x1080, 14" | Honor Magicbook IPS LED, 1920x1080, 14" | Huawei MateBook D 14 W00D-53010GXL IPS, 1920x1080, 14" | |
|---|---|---|---|---|---|---|---|
| Display | 0% | -3% | -0% | 11% | 8% | 11% | |
| Display P3 Coverage (%) | 39.65 | 39.71 0% | 38.41 -3% | 39.53 0% | 44.59 12% | 43.09 9% | 44.26 12% |
| sRGB Coverage (%) | 59.5 | 59.6 0% | 57.8 -3% | 59.1 -1% | 65.7 10% | 63.1 6% | 65.1 9% |
| AdobeRGB 1998 Coverage (%) | 40.96 | 41.04 0% | 39.68 -3% | 40.84 0% | 46.07 12% | 44.52 9% | 45.73 12% |
| Response Times | 0% | 9% | 6% | -13% | -12% | -10% | |
| Response Time Grey 50% / Grey 80% * (ms) | 40 ? | 40 ? -0% | 36 ? 10% | 38 ? 5% | 44.8 ? -12% | 44.4 ? -11% | 42.4 ? -6% |
| Response Time Black / White * (ms) | 29 ? | 29 ? -0% | 27 ? 7% | 27 ? 7% | 32.8 ? -13% | 32.8 ? -13% | 32.8 ? -13% |
| PWM Frequency (Hz) | 200 ? | 200 ? | 198.4 ? | ||||
| Screen | 7% | -40% | 7% | -27% | -19% | -23% | |
| Brightness middle (cd/m²) | 274 | 267 -3% | 260 -5% | 269 -2% | 318 16% | 287 5% | 287 5% |
| Brightness (cd/m²) | 255 | 257 1% | 250 -2% | 257 1% | 308 21% | 273 7% | 276 8% |
| Brightness Distribution (%) | 89 | 91 2% | 87 -2% | 89 0% | 90 1% | 86 -3% | 86 -3% |
| Black Level * (cd/m²) | 0.305 | 0.2 34% | 0.29 5% | 0.2 34% | 0.26 15% | 0.21 31% | 0.25 18% |
| Contrast (:1) | 898 | 1335 49% | 897 0% | 1345 50% | 1223 36% | 1367 52% | 1148 28% |
| Colorchecker dE 2000 * | 3.66 | 3.79 -4% | 6.29 -72% | 3.68 -1% | 5.3 -45% | 5 -37% | 5.4 -48% |
| Colorchecker dE 2000 max. * | 7.54 | 8.18 -8% | 14.77 -96% | 7.36 2% | 19.3 -156% | 20.1 -167% | 18.1 -140% |
| Greyscale dE 2000 * | 1.45 | 1.49 -3% | 4.65 -221% | 1.69 -17% | 4 -176% | 2.7 -86% | 3.1 -114% |
| Gamma | 2.49 88% | 2.48 89% | 2.73 81% | 2.49 88% | 2.23 99% | 2.18 101% | 1.99 111% |
| CCT | 6597 99% | 6659 98% | 7331 89% | 6406 101% | 6991 93% | 6653 98% | 6769 96% |
| Color Space (Percent of AdobeRGB 1998) (%) | 38 | 38 0% | 37 -3% | 38 0% | 42.23 11% | 40.59 7% | 41.8 10% |
| Color Space (Percent of sRGB) (%) | 59 | 59 0% | 58 -2% | 59 0% | 65.31 11% | 62.66 6% | 64.6 9% |
| Colorchecker dE 2000 calibrated * | 4.71 | 4.51 | 4.8 | 4.2 | 4.5 | 5 | |
| Media totale (Programma / Settaggio) | 2% /
5% | -11% /
-26% | 4% /
5% | -10% /
-17% | -8% /
-12% | -7% /
-14% |
* ... Meglio usare valori piccoli
Tempi di risposta del Display
| ↔ Tempi di risposta dal Nero al Bianco | ||
|---|---|---|
| 29 ms ... aumenta ↗ e diminuisce ↘ combinato | ↗ 17 ms Incremento | 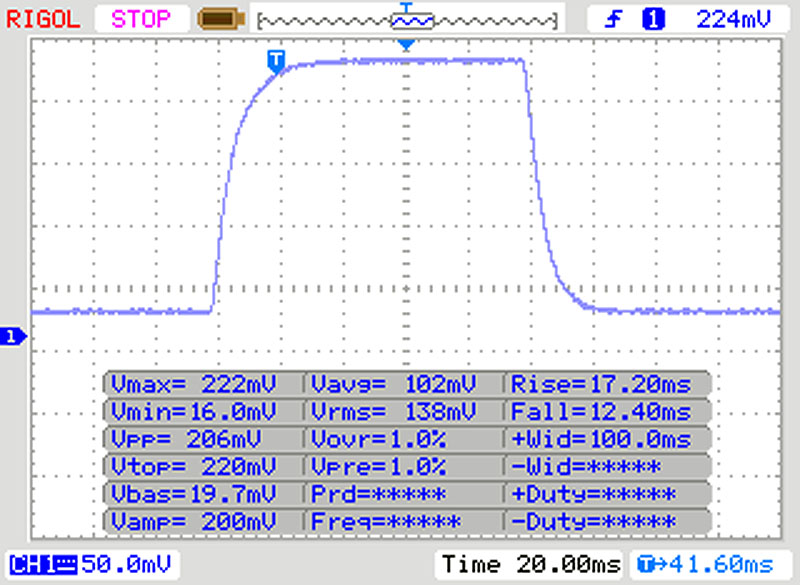 |
| ↘ 12 ms Calo | ||
| Lo schermo mostra tempi di risposta relativamente lenti nei nostri tests e potrebbe essere troppo lento per i gamers. In confronto, tutti i dispositivi di test variano da 0.1 (minimo) a 240 (massimo) ms. » 77 % di tutti i dispositivi è migliore. Questo significa che i tempi di risposta rilevati sono peggiori rispetto alla media di tutti i dispositivi testati (19.8 ms). | ||
| ↔ Tempo di risposta dal 50% Grigio all'80% Grigio | ||
| 40 ms ... aumenta ↗ e diminuisce ↘ combinato | ↗ 18 ms Incremento | 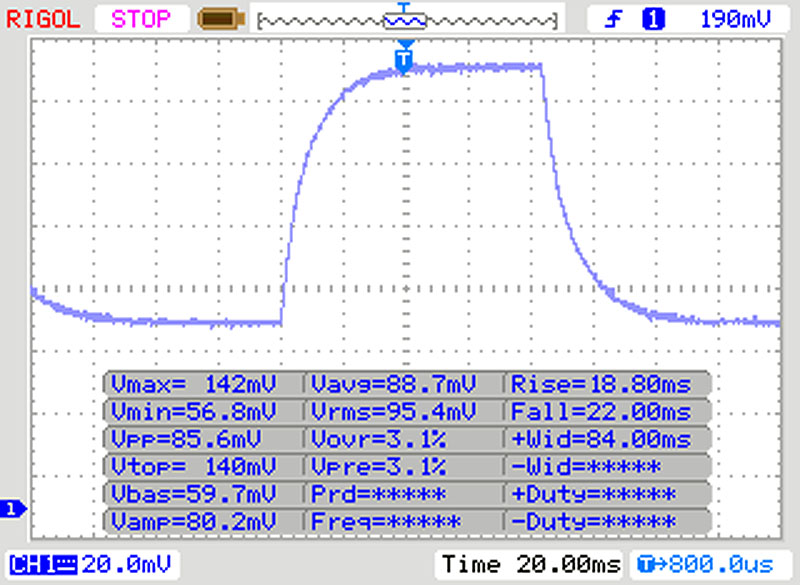 |
| ↘ 22 ms Calo | ||
| Lo schermo mostra tempi di risposta lenti nei nostri tests e sarà insoddisfacente per i gamers. In confronto, tutti i dispositivi di test variano da 0.165 (minimo) a 636 (massimo) ms. » 61 % di tutti i dispositivi è migliore. Questo significa che i tempi di risposta rilevati sono peggiori rispetto alla media di tutti i dispositivi testati (31 ms). | ||
Sfarfallio dello schermo / PWM (Pulse-Width Modulation)
| flickering dello schermo / PWM non rilevato | 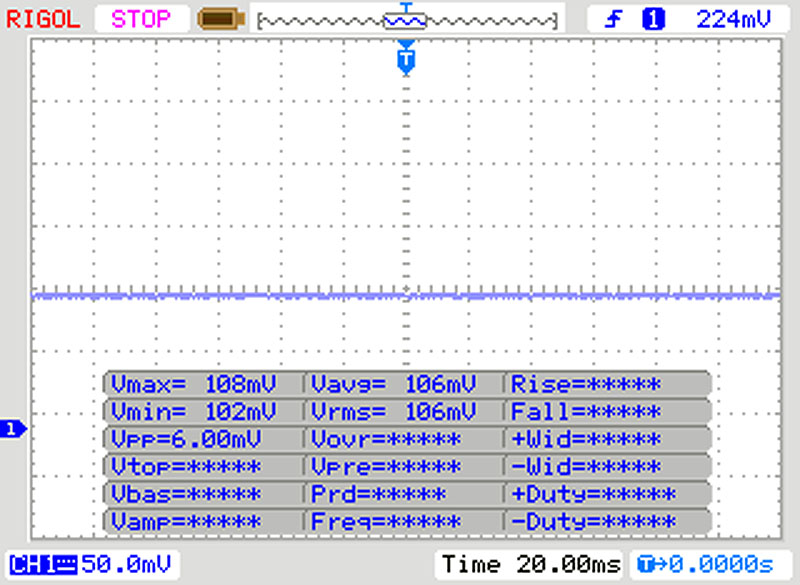 | ||
In confronto: 52 % di tutti i dispositivi testati non utilizza PWM per ridurre la luminosita' del display. Se è rilevato PWM, una media di 7753 (minimo: 5 - massimo: 343500) Hz è stata rilevata. | |||
| Cinebench R10 | |
| Rendering Single 32Bit | |
| Media della classe Multimedia (3234 - 11576, n=8, ultimi 2 anni) | |
| Asus VivoBook 14 X412FJ-EB023T | |
| Media Intel Core i5-8265U (5841 - 6209, n=9) | |
| HP 14-dk0008ng | |
| Rendering Multiple CPUs 32Bit | |
| Media della classe Multimedia (17722 - 84729, n=8, ultimi 2 anni) | |
| Asus VivoBook 14 X412FJ-EB023T | |
| Media Intel Core i5-8265U (16318 - 22962, n=9) | |
| HP 14-dk0008ng | |
| Geekbench 3 | |
| 32 Bit Multi-Core Score | |
| Asus VivoBook 14 X412FJ-EB023T | |
| Media Intel Core i5-8265U (12198 - 14499, n=6) | |
| HP 14-dk0008ng | |
| 32 Bit Single-Core Score | |
| Asus VivoBook 14 X412FJ-EB023T | |
| Media Intel Core i5-8265U (3470 - 3842, n=6) | |
| HP 14-dk0008ng | |
| Mozilla Kraken 1.1 - Total | |
| Huawei MateBook D 14 W00D-53010GXL | |
| HP 14-dk0008ng (Edge 44) | |
| Asus VivoBook 14 X412FJ-EB023T (Edge 44) | |
| Media Intel Core i5-8265U (851 - 1245, n=25) | |
| Honor Magicbook (Chrome 82) | |
| Lenovo Ideapad S340-14IWL-81N70056GE | |
| Media della classe Multimedia (228 - 835, n=71, ultimi 2 anni) | |
| JetStream 1.1 - 1.1 Total | |
| Media della classe Multimedia (n=1ultimi 2 anni) | |
| Lenovo Ideapad S340-14IWL-81N70056GE | |
| Asus VivoBook 14 X412FJ-EB023T (Edge 44) | |
| Media Intel Core i5-8265U (193.7 - 244, n=19) | |
| HP 14-dk0008ng (Edge 44) | |
| Huawei MateBook D 14 W00D-53010GXL | |
* ... Meglio usare valori piccoli
| PCMark 8 Home Score Accelerated v2 | 3609 punti | |
| PCMark 8 Creative Score Accelerated v2 | 3616 punti | |
| PCMark 8 Work Score Accelerated v2 | 4967 punti | |
| PCMark 10 Score | 3847 punti | |
Aiuto | ||

| Asus VivoBook 14 X412FJ-EB023T Kingston RBUSNS8180DS3256GJ | Asus VivoBook 14 F412FJ-EB084T Kingston RBU-SNS8180DS3512GJ | Lenovo Ideapad S340-14IWL-81N70056GE WDC PC SN520 SDAPNUW-512G | HP 14-dk0008ng Samsung PM871b MZNLN128HAHQ | Honor Magicbook Samsung SSD PM871b MZNLN256HAJQ | Honor Magicbook Samsung SSD PM871b MZNLN256HAJQ | Huawei MateBook D 14 W00D-53010GXL SK Hynix SC313 HFS256G39TNF | Media Kingston RBUSNS8180DS3256GJ | Media della classe Multimedia | |
|---|---|---|---|---|---|---|---|---|---|
| CrystalDiskMark 5.2 / 6 | -15% | 162% | 6% | 4% | 4% | 4% | -6% | 455% | |
| Write 4K (MB/s) | 79.7 | 55 -31% | 160.8 102% | 90.6 14% | 76.5 -4% | 82.1 3% | 72.3 -9% | 71.8 ? -10% | 164.2 ? 106% |
| Read 4K (MB/s) | 28.14 | 28.79 2% | 50.5 79% | 33.17 18% | 30.02 7% | 21.11 -25% | 30.77 9% | 31.3 ? 11% | 67.8 ? 141% |
| Write Seq (MB/s) | 450.9 | 307.5 -32% | 1458 223% | 483 7% | 461.2 2% | 451.7 0% | 468.1 4% | 412 ? -9% | 2680 ? 494% |
| Read Seq (MB/s) | 434.7 | 430 -1% | 1447 233% | 511 18% | 508 17% | 477.7 10% | 518 19% | 423 ? -3% | 3133 ? 621% |
| Write 4K Q32T1 (MB/s) | 228.5 | 149.5 -35% | 406.5 78% | 170.7 -25% | 212.3 -7% | 242.2 6% | 214.2 -6% | 176.3 ? -23% | 454 ? 99% |
| Read 4K Q32T1 (MB/s) | 244.1 | 207.2 -15% | 476.8 95% | 235 -4% | 239.7 -2% | 257.4 5% | 241.1 -1% | 191.8 ? -21% | 580 ? 138% |
| Write Seq Q32T1 (MB/s) | 478.4 | 389.2 -19% | 1458 205% | 496.5 4% | 482.7 1% | 526 10% | 482 1% | 489 ? 2% | 4626 ? 867% |
| Read Seq Q32T1 (MB/s) | 456.6 | 497.1 9% | 1743 282% | 534 17% | 535 17% | 550 20% | 537 18% | 497 ? 9% | 5831 ? 1177% |
| 3DMark 11 Performance | 3673 punti | |
| 3DMark Ice Storm Standard Score | 64029 punti | |
| 3DMark Cloud Gate Standard Score | 10746 punti | |
| 3DMark Fire Strike Score | 2395 punti | |
| 3DMark Time Spy Score | 882 punti | |
Aiuto | ||
| BioShock Infinite - 1366x768 High Preset | |
| Lenovo Ideapad S340-14IWL-81N70056GE | |
| Asus VivoBook 14 X412FJ-EB023T | |
| Media NVIDIA GeForce MX230 (61.8 - 79.8, n=5) | |
| Asus VivoBook 14 F412FJ-EB084T | |
| HP 14-dk0008ng | |
| F1 2019 - 1280x720 Ultra Low Preset | |
| Honor Magicbook | |
| Asus VivoBook 14 X412FJ-EB023T | |
| Media NVIDIA GeForce MX230 (n=1) | |
| Huawei MateBook D 14 W00D-53010GXL | |
| Total War: Three Kingdoms - 1280x720 Low (incl textures) | |
| Media della classe Multimedia (186 - 317, n=2, ultimi 2 anni) | |
| Honor Magicbook | |
| Media NVIDIA GeForce MX230 (55.5 - 67.7, n=3) | |
| Asus VivoBook 14 X412FJ-EB023T | |
| Fortnite - 1280x720 Low Preset | |
| Honor Magicbook | |
| Asus VivoBook 14 X412FJ-EB023T | |
| Media NVIDIA GeForce MX230 (n=1) | |
| Honor Magicbook | |
| Team Fortress 2 - 1920x1080 maximum AA:8x MS AF:16x | |
| Asus VivoBook 14 X412FJ-EB023T | |
| Media NVIDIA GeForce MX230 (n=1) | |
| basso | medio | alto | ultra | |
|---|---|---|---|---|
| StarCraft 2 (2010) | 234.3 | 111.7 | 85.9 | 41.4 |
| Diablo III (2012) | 142.6 | 114.2 | 96.1 | 52.6 |
| Counter-Strike: GO (2012) | 178.1 | 127.1 | 90.7 | 64.9 |
| BioShock Infinite (2013) | 146.4 | 81.4 | 72.7 | 27.4 |
| Sims 4 (2014) | 171.9 | 110 | 60.5 | 48.7 |
| The Witcher 3 (2015) | 45.9 | 26.4 | 13.5 | 7.7 |
| World of Warships (2015) | 101.2 | 84.1 | 52.8 | 33.2 |
| Rainbow Six Siege (2015) | 85.9 | 61.9 | 32.2 | 22.5 |
| Ashes of the Singularity (2016) | 18.4 | 10.6 | 9 | |
| Doom (2016) | 56.4 | 45.9 | 19.3 | 15.6 |
| Civilization 6 (2016) | 86 | 45.6 | 14.7 | 10.6 |
| For Honor (2017) | 63 | 21 | 18.7 | 15 |
| Ghost Recon Wildlands (2017) | 35.5 | 15.2 | 13 | 3.5 |
| Prey (2017) | 90.9 | 34.7 | 25.3 | 21.3 |
| Team Fortress 2 (2017) | 96 | 91.4 | 68.8 | 62.9 |
| Middle-earth: Shadow of War (2017) | 50 | 18 | 12 | 9 |
| Fortnite (2018) | 84.7 | 33.2 | 19.5 | 15.6 |
| X-Plane 11.11 (2018) | 48.4 | 36.3 | 32.9 | |
| World of Tanks enCore (2018) | 235 | 54.4 | 17.9 | |
| Far Cry 5 (2018) | 31 | 15 | 13 | 12 |
| Anno 1800 (2019) | 24.4 | 8.1 | 4.9 | 2.1 |
| Rage 2 (2019) | 24.5 | 10.2 | 8 | 4.1 |
| Total War: Three Kingdoms (2019) | 61 | 16.6 | 7.9 | 4.9 |
| F1 2019 (2019) | 62 | 25 | 20 | 12 |
Rumorosità
| Idle |
| 30.5 / 30.5 / 30.5 dB(A) |
| Sotto carico |
| 38.2 / 40.2 dB(A) |
 | ||
30 dB silenzioso 40 dB(A) udibile 50 dB(A) rumoroso |
||
min: | ||
(-) La temperatura massima sul lato superiore è di 45.2 °C / 113 F, rispetto alla media di 36.8 °C / 98 F, che varia da 21 a 71 °C per questa classe Multimedia.
(±) Il lato inferiore si riscalda fino ad un massimo di 42.7 °C / 109 F, rispetto alla media di 39.1 °C / 102 F
(+) In idle, la temperatura media del lato superiore è di 26.4 °C / 80 F, rispetto alla media deld ispositivo di 31.3 °C / 88 F.
(+) I poggiapolsi e il touchpad sono piu' freddi della temperatura della pelle con un massimo di 31.6 °C / 88.9 F e sono quindi freddi al tatto.
(-) La temperatura media della zona del palmo della mano di dispositivi simili e'stata di 28.7 °C / 83.7 F (-2.9 °C / -5.2 F).
Asus VivoBook 14 X412FJ-EB023T analisi audio
(-) | altoparlanti non molto potenti (60.9 dB)
Bassi 100 - 315 Hz
(-) | quasi nessun basso - in media 19.8% inferiori alla media
(±) | la linearità dei bassi è media (12.5% delta rispetto alla precedente frequenza)
Medi 400 - 2000 Hz
(+) | medi bilanciati - solo only 3.7% rispetto alla media
(±) | linearità dei medi adeguata (7.1% delta rispetto alla precedente frequenza)
Alti 2 - 16 kHz
(+) | Alti bilanciati - appena 2.5% dalla media
(±) | la linearità degli alti è media (7.6% delta rispetto alla precedente frequenza)
Nel complesso 100 - 16.000 Hz
(±) | la linearità complessiva del suono è media (24.4% di differenza rispetto alla media
Rispetto alla stessa classe
» 86% di tutti i dispositivi testati in questa classe è stato migliore, 5% simile, 9% peggiore
» Il migliore ha avuto un delta di 5%, medio di 17%, peggiore di 45%
Rispetto a tutti i dispositivi testati
» 74% di tutti i dispositivi testati in questa classe è stato migliore, 6% similare, 20% peggiore
» Il migliore ha avuto un delta di 4%, medio di 23%, peggiore di 134%
| Off / Standby | |
| Idle | |
| Sotto carico |
|
Leggenda:
min: | |
Pro
Contro
L'ASUS VivoBook 14 è un elegante e compatto computer portatile da 14 pollici che si è dimostrato parzialmente convincente nei nostri test. Il suo processore quad-core e la GPU dedicata sono abbastanza potenti per tutte le applicazioni standard e anche per alcuni giochi leggeri, anche se ci sono delle restrizioni.
Il VivoBook 14 X412FJ è un compatto e potente tuttofare che ASUS ha limitato quando si usa la batteria.
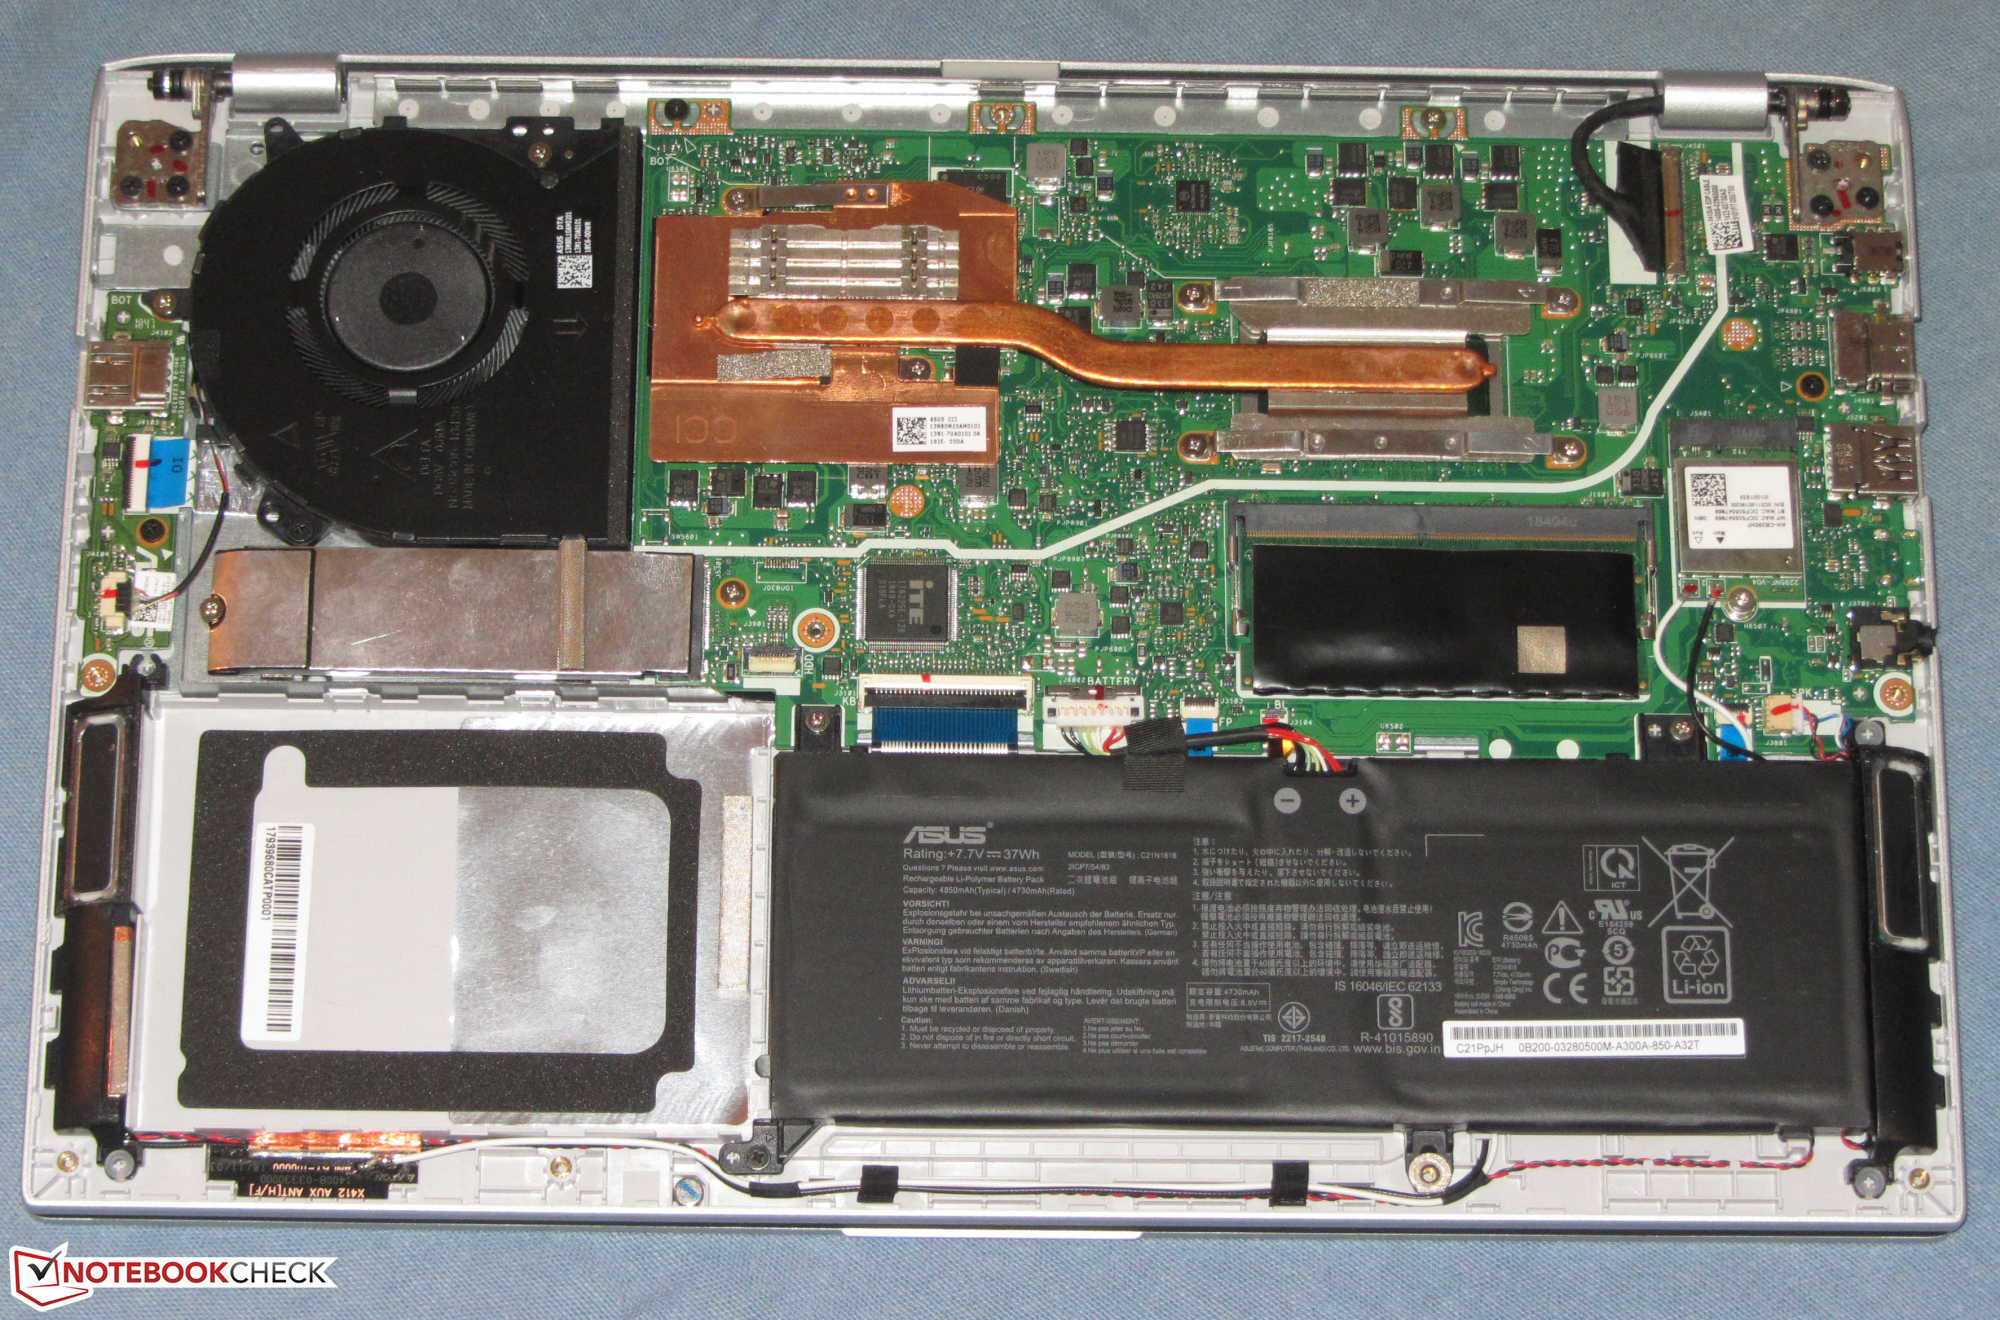
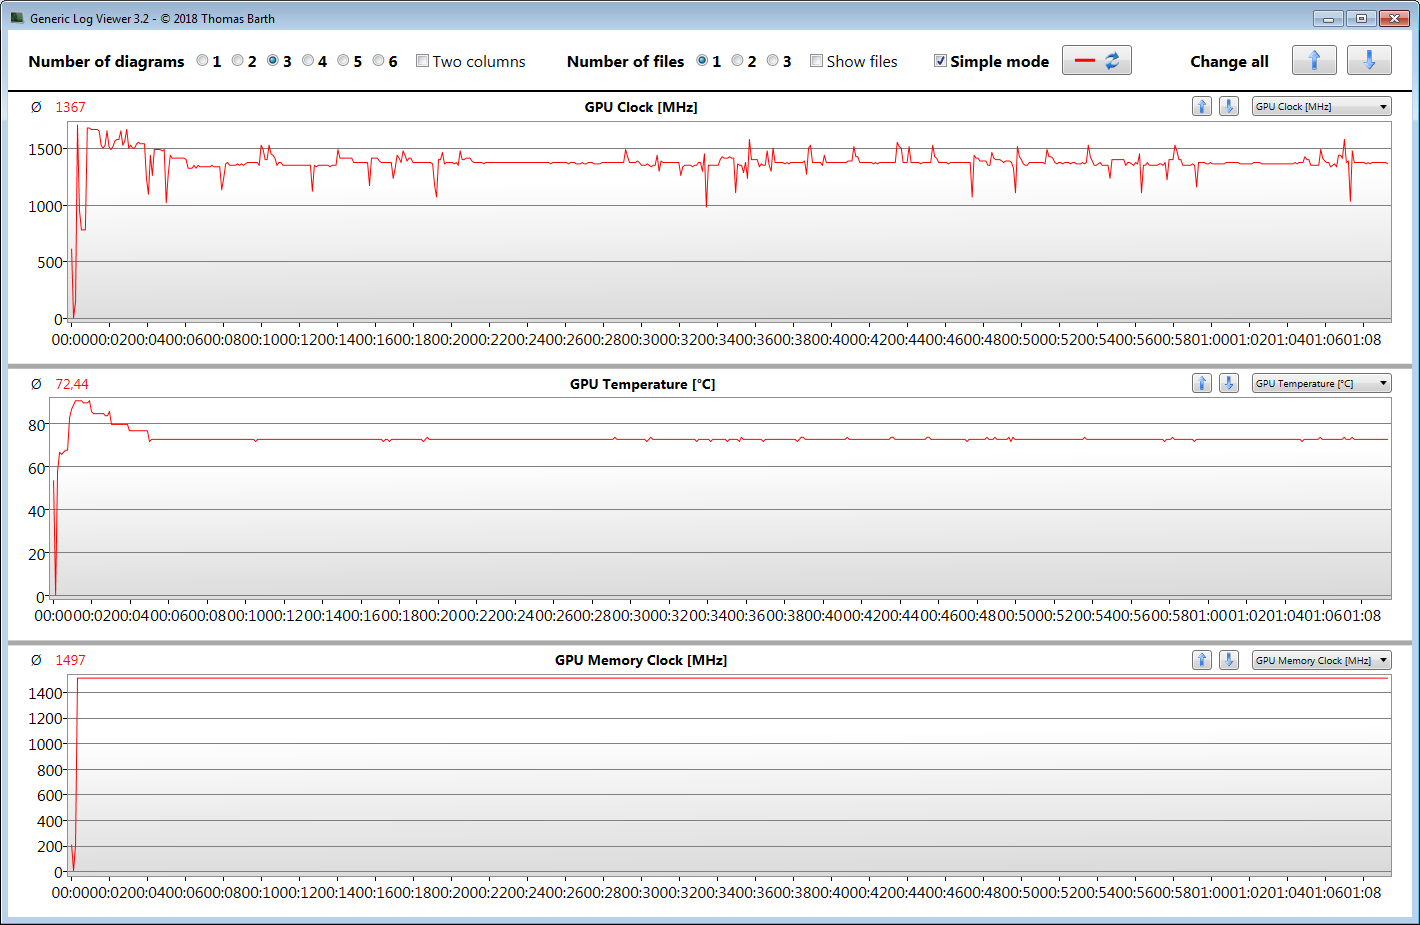
In particolare, il sistema rallenta molto quando funziona a batteria, come fa durante periodi prolungati di stress. Anche la GPU non raggiunge la sua velocità di clock di base in condizioni di carico sostenuto, il che è deludente. Allo stesso modo, mentre ASUS ha incluso un SSD, l'azienda ha optato per un'unità SATA III che è notevolmente più lenta delle unità PCIe trovate in alcuni dei nostri dispositivi di confronto. Se lo si desidera, è sempre possibile sostituire l'unità SSD, il che richiedere la rimozione della piastra inferiore.
Peggio ancora, ASUS ha equipaggiato il VivoBook 14 con una pietosa batteria da 37 Wh, che è durata per meno di sei ore nel nostro pratico test di durata della batteria Wi-Fi. Il display ha i suoi aspetti positivi, come gli angoli di visualizzazione stabili, la finitura opaca e la buona precisione del colore, ma è troppo debole e sbiadito per i nostri gusti.
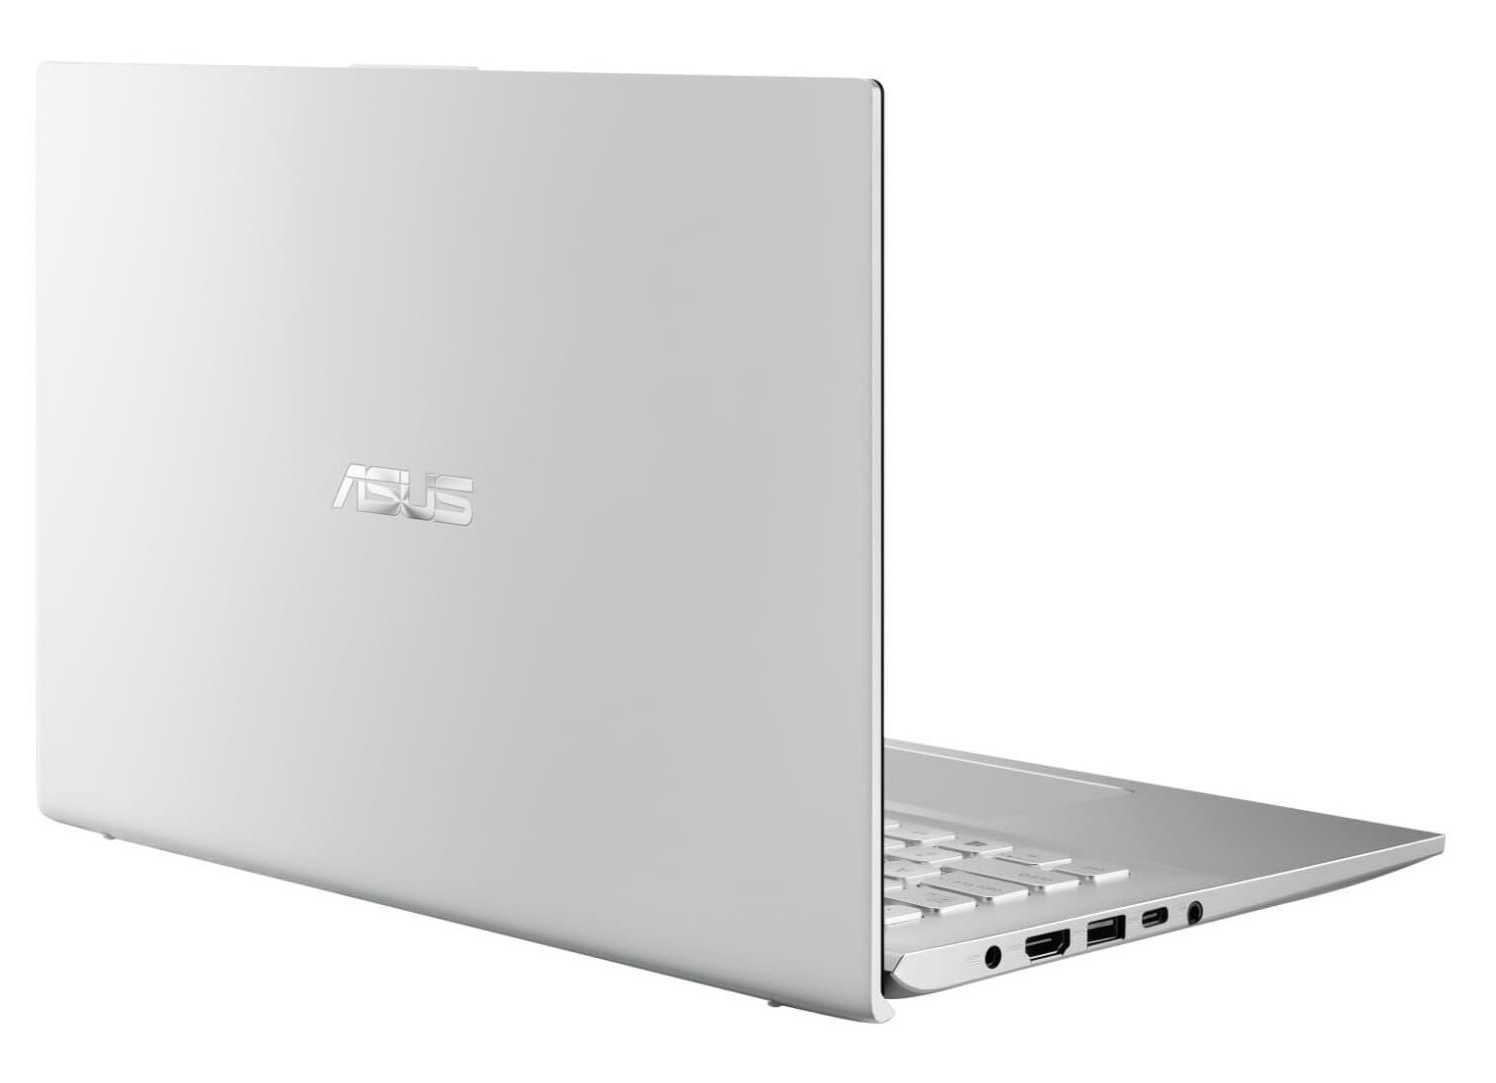
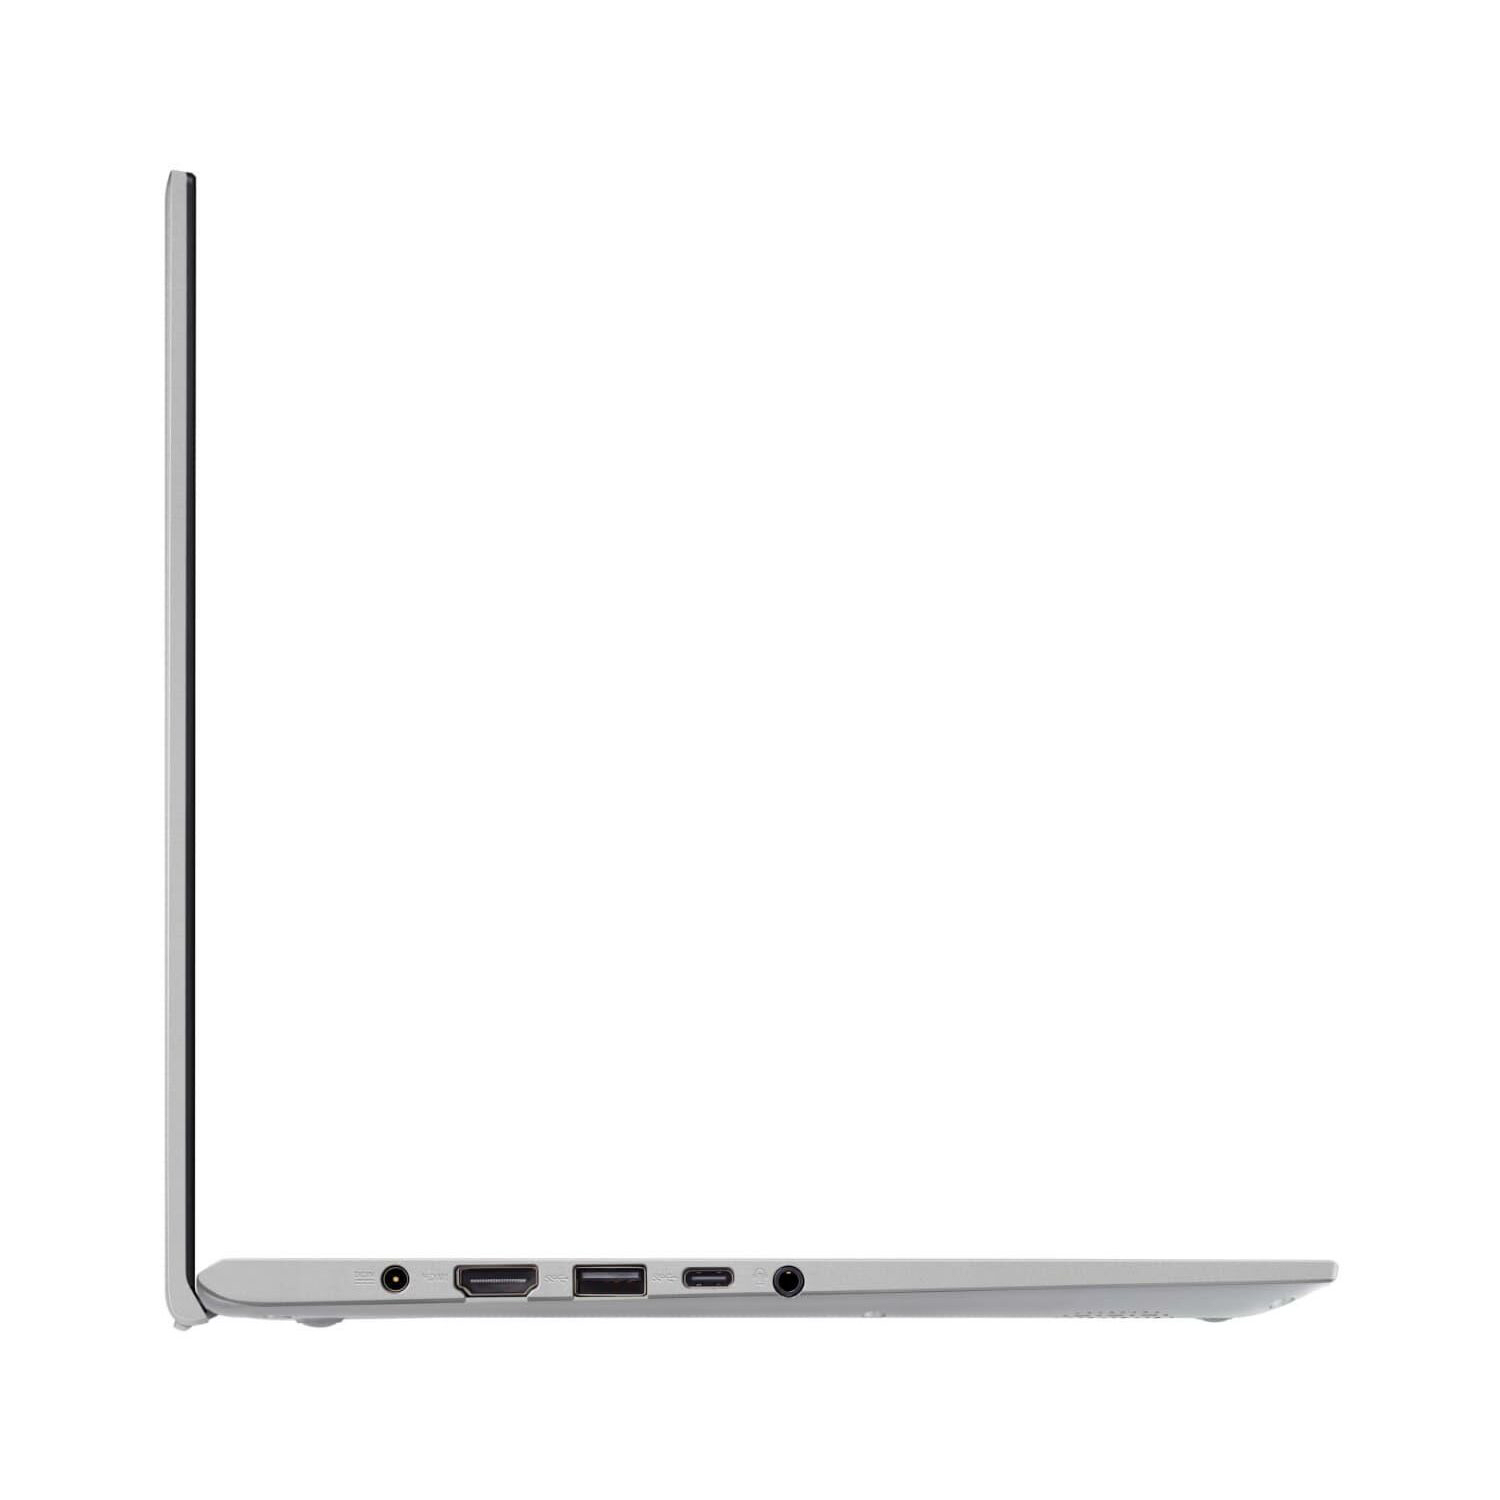
Inoltre, mentre accogliamo sempre con favore una porta USB Type-C, non riusciamo a capire perché ASUS ha scelto di eliminare il supporto DisplayPort e Power Delivery quando entrambi avrebbero dato a VivoBook 14 una maggiore flessibilità.
Di positivo, il VivoBook 14 ha una tastiera decente, è relativamente leggero e ha un design moderno. In definitiva, il VivoBook 14 X412FJ è un buon computer portatile da 14 pollici, ma ci sono alternative migliori in giro, il che gli renderà difficile l'inserimento sul mercato e non possiamo consigliarvi il suo acquisto.
Asus VivoBook 14 X412FJ-EB023T
- 08/25/2019 v6 (old)
Sascha Mölck
Price comparison
