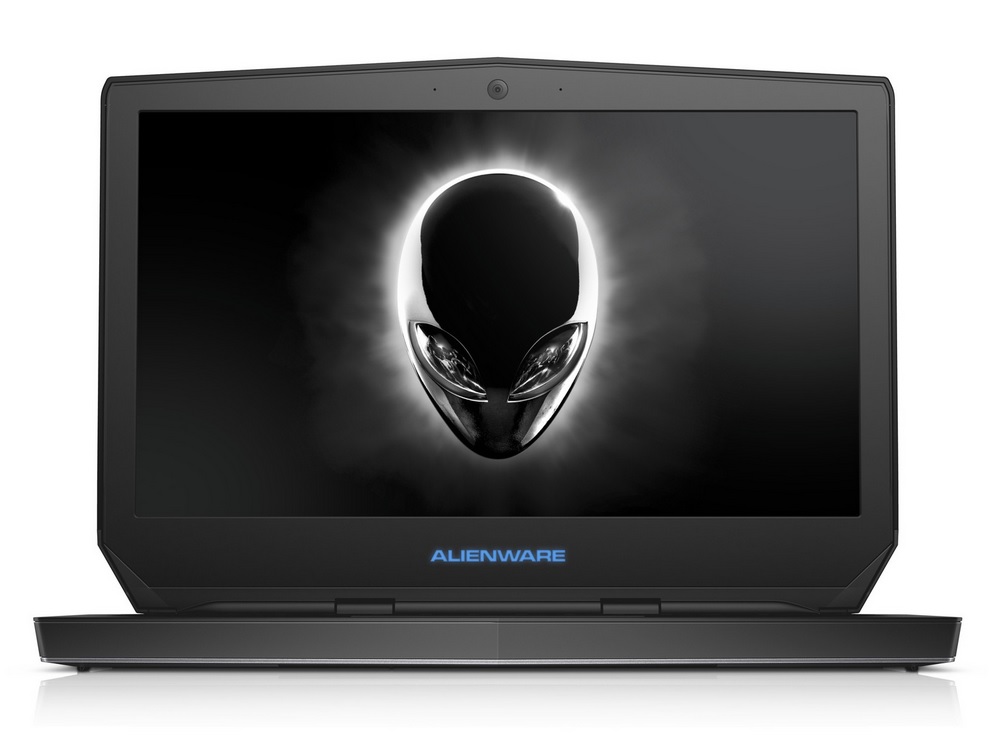
Recensione breve del portatile Alienware 13 (GTX 960M)
| |||||||||||||||||||||||||
Distribuzione della luminosità: 78 %
Al centro con la batteria: 327 cd/m²
Contrasto: 1055:1 (Nero: 0.31 cd/m²)
ΔE ColorChecker Calman: 5.14 | ∀{0.5-29.43 Ø4.72}
ΔE Greyscale Calman: 6.51 | ∀{0.09-98 Ø4.97}
97% sRGB (Argyll 1.6.3 3D)
61% AdobeRGB 1998 (Argyll 1.6.3 3D)
67.1% AdobeRGB 1998 (Argyll 3D)
94.9% sRGB (Argyll 3D)
64.9% Display P3 (Argyll 3D)
Gamma: 2.69
CCT: 7347 K
| Alienware 13 (GTX 960M) 9T7WM_133HL (SDC4C48) | MSI GS30 Shadow BOEhydis HN133WU3-102 (BOE05E3) | Alienware 13 9T7WM_133HL (SDC4C48) | Schenker XMG A305 CMN N133HSE-EA1 (CMN1343) | Schenker XMG C405 AU Optronics B140HAN01.1 (AUO113ED) | Razer Blade 14 2015 | |
|---|---|---|---|---|---|---|
| Display | -5% | -6% | -2% | 5% | ||
| Display P3 Coverage (%) | 64.9 | 65.9 2% | 61.8 -5% | 66.8 3% | 70.3 8% | |
| sRGB Coverage (%) | 94.9 | 85.5 -10% | 88.3 -7% | 89.6 -6% | 97.1 2% | |
| AdobeRGB 1998 Coverage (%) | 67.1 | 62.5 -7% | 63.4 -6% | 65.6 -2% | 71.1 6% | |
| Screen | -6% | -6% | -5% | -3% | -1% | |
| Brightness middle (cd/m²) | 327 | 273 -17% | 319 -2% | 315 -4% | 280 -14% | 318.4 -3% |
| Brightness (cd/m²) | 305 | 258 -15% | 295 -3% | 310 2% | 267 -12% | 311 2% |
| Brightness Distribution (%) | 78 | 88 13% | 83 6% | 86 10% | 85 9% | 78 0% |
| Black Level * (cd/m²) | 0.31 | 0.38 -23% | 0.32 -3% | 0.35 -13% | 0.32 -3% | 0.416 -34% |
| Contrast (:1) | 1055 | 718 -32% | 997 -5% | 900 -15% | 875 -17% | 765 -27% |
| Colorchecker dE 2000 * | 5.14 | 4.86 5% | 5.83 -13% | 5.63 -10% | 4.75 8% | 3.67 29% |
| Greyscale dE 2000 * | 6.51 | 4.56 30% | 7.63 -17% | 6.71 -3% | 5.91 9% | 5.41 17% |
| Gamma | 2.69 82% | 2.23 99% | 2.57 86% | 2.53 87% | 2.52 87% | 2.26 97% |
| CCT | 7347 88% | 7292 89% | 7195 90% | 5920 110% | 5742 113% | 7118 91% |
| Color Space (Percent of AdobeRGB 1998) (%) | 61 | 56 -8% | 57 -7% | 57 -7% | 59 -3% | 64.64 6% |
| Color Space (Percent of sRGB) (%) | 97 | |||||
| Media totale (Programma / Settaggio) | -6% /
-6% | -6% /
-6% | -5% /
-5% | -3% /
-3% | 2% /
1% |
* ... Meglio usare valori piccoli
| PCMark 7 Score | 5238 punti | |
Aiuto | ||

| 3DMark 11 Performance | 4684 punti | |
| 3DMark Ice Storm Standard Score | 44549 punti | |
| 3DMark Cloud Gate Standard Score | 10287 punti | |
| 3DMark Fire Strike Score | 3611 punti | |
Aiuto | ||
| 3DMark | |
| 1920x1080 Fire Strike Score (ordina per valore) | |
| Alienware 13 (GTX 960M) | |
| MSI GS30 Shadow | |
| Alienware 13 | |
| Schenker XMG A305 | |
| Schenker XMG C405 | |
| Razer Blade 14 2015 | |
| 1920x1080 Fire Strike Graphics (ordina per valore) | |
| Alienware 13 (GTX 960M) | |
| MSI GS30 Shadow | |
| Alienware 13 | |
| Schenker XMG A305 | |
| Schenker XMG C405 | |
| Razer Blade 14 2015 | |
| basso | medio | alto | ultra | |
|---|---|---|---|---|
| Sims 4 (2014) | 184.6 | 104.9 | 65.8 | 56.9 |
| Fifa 15 (2014) | 172.9 | 133.4 | 96.8 | |
| Alien: Isolation (2014) | 142.2 | 110.3 | 59.8 | 43.1 |
| Call of Duty: Advanced Warfare (2014) | 90.7 | 60.7 | 42.6 | 24.1 |
| Assassin's Creed Unity (2014) | 50.8 | 38.9 | 25.3 | 7.3 |
| Far Cry 4 (2014) | 76.2 | 64.7 | 32 | 26.1 |
| 3DMark | |
| 1920x1080 Fire Strike Score (ordina per valore) | |
| Alienware 13 (GTX 960M) | |
| Alienware Amplifier | |
| Alienware Amplifier | |
| Desktop-PC | |
| MSI GamingDock | |
| 1920x1080 Fire Strike Graphics (ordina per valore) | |
| Alienware 13 (GTX 960M) | |
| Alienware Amplifier | |
| Alienware Amplifier | |
| Desktop-PC | |
| MSI GamingDock | |
| Alien: Isolation | |
| 1920x1080 Ultra, On, Shadow Map 2048, HDAO AA:2x SM AF:16x (ordina per valore) | |
| Alienware 13 (GTX 960M) | |
| Alienware Amplifier | |
| Alienware Amplifier | |
| Desktop-PC | |
| MSI GamingDock | |
| 1920x1080 High, On, Shadow Map 1536, Standard SSAO AA:FX AF:8x (ordina per valore) | |
| Alienware 13 (GTX 960M) | |
| Alienware Amplifier | |
| Alienware Amplifier | |
| Desktop-PC | |
| MSI GamingDock | |
| Assassin's Creed Unity | |
| 1920x1080 Ultra High Graphics Quality AA:4x MS (ordina per valore) | |
| Alienware 13 (GTX 960M) | |
| Alienware Amplifier | |
| Alienware Amplifier | |
| Alienware Amplifier | |
| Desktop-PC | |
| 1920x1080 High Graphics Quality AA:2x MS (ordina per valore) | |
| Alienware 13 (GTX 960M) | |
| Alienware Amplifier | |
| Alienware Amplifier | |
| Alienware Amplifier | |
| Desktop-PC | |
| Call of Duty: Advanced Warfare | |
| 1920x1080 Extra / On (Cache Shadow Maps Off), 2x Supersampling AA:2x SM (ordina per valore) | |
| Alienware 13 (GTX 960M) | |
| Alienware Amplifier | |
| Alienware Amplifier | |
| Alienware Amplifier | |
| Desktop-PC | |
| MSI GamingDock | |
| 1920x1080 High / On (Cache Shadow Maps Off) AA:FX (ordina per valore) | |
| Alienware 13 (GTX 960M) | |
| Alienware Amplifier | |
| Alienware Amplifier | |
| Alienware Amplifier | |
| Desktop-PC | |
| MSI GamingDock | |
| GRID: Autosport | |
| 1920x1080 Ultra Preset AA:4x MS (ordina per valore) | |
| Alienware Amplifier | |
| Alienware Amplifier | |
| Alienware Amplifier | |
| Desktop-PC | |
| MSI GamingDock | |
| 1920x1080 High Preset (ordina per valore) | |
| Alienware Amplifier | |
| Alienware Amplifier | |
| Alienware Amplifier | |
| Desktop-PC | |
| MSI GamingDock | |
| Far Cry 4 | |
| 1920x1080 Ultra Graphics Quality AA:SM (ordina per valore) | |
| Alienware 13 (GTX 960M) | |
| Alienware Amplifier | |
| Alienware Amplifier | |
| Alienware Amplifier | |
| Desktop-PC | |
| MSI GamingDock | |
| 1920x1080 High Graphics Quality AA:SM (ordina per valore) | |
| Alienware 13 (GTX 960M) | |
| Alienware Amplifier | |
| Alienware Amplifier | |
| Alienware Amplifier | |
| Desktop-PC | |
| MSI GamingDock | |
| Watch Dogs | |
| 1920x1080 Ultra Overall Quality, Ultra Textures AA:4x MS (ordina per valore) | |
| Alienware Amplifier | |
| Alienware Amplifier | |
| Alienware Amplifier | |
| Desktop-PC | |
| MSI GamingDock | |
| 1920x1080 High Overall Quality, High Textures AA:2x MS (ordina per valore) | |
| Alienware Amplifier | |
| Alienware Amplifier | |
| Alienware Amplifier | |
| Desktop-PC | |
| MSI GamingDock | |
Rumorosità
| Idle |
| 29.2 / 29.4 / 29.6 dB(A) |
| Sotto carico |
| 45.8 / 52 dB(A) |
 | ||
30 dB silenzioso 40 dB(A) udibile 50 dB(A) rumoroso |
||
min: | ||
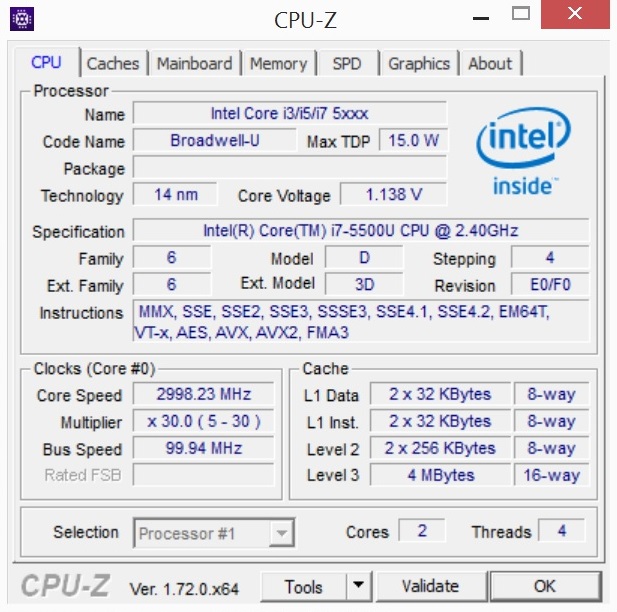
| Alienware 13 (GTX 960M) GeForce GTX 960M, 5500U | MSI GS30 Shadow Iris Pro Graphics 5200, 4870HQ | Alienware 13 GeForce GTX 860M, 4210U | Schenker XMG A305 GeForce GTX 960M, 4710MQ | Schenker XMG C405 GeForce GTX 965M, 4720HQ | Razer Blade 14 2015 GeForce GTX 970M, 4720HQ | |
|---|---|---|---|---|---|---|
| Noise | -17% | 4% | -3% | -14% | -2% | |
| Idle Minimum * (dB) | 29.2 | 29.4 -1% | 29.2 -0% | 29.4 -1% | 29.2 -0% | 29.7 -2% |
| Idle Average * (dB) | 29.4 | 36.2 -23% | 29.4 -0% | 30.1 -2% | 34.6 -18% | 29.9 -2% |
| Idle Maximum * (dB) | 29.6 | 42 -42% | 29.8 -1% | 30.8 -4% | 38.8 -31% | 30 -1% |
| Load Average * (dB) | 45.8 | 52.8 -15% | 37.6 18% | 49.2 -7% | 54 -18% | 42.1 8% |
| Load Maximum * (dB) | 52 | 53.6 -3% | 50.8 2% | 53.8 -3% | 54.4 -5% | 59 -13% |
* ... Meglio usare valori piccoli
(-) La temperatura massima sul lato superiore è di 47.4 °C / 117 F, rispetto alla media di 40.4 °C / 105 F, che varia da 21.2 a 68.8 °C per questa classe Gaming.
(-) Il lato inferiore si riscalda fino ad un massimo di 63.1 °C / 146 F, rispetto alla media di 43.2 °C / 110 F
(+) In idle, la temperatura media del lato superiore è di 27.8 °C / 82 F, rispetto alla media deld ispositivo di 33.9 °C / 93 F.
(+) I poggiapolsi e il touchpad raggiungono la temperatura massima della pelle (32.2 °C / 90 F) e quindi non sono caldi.
(-) La temperatura media della zona del palmo della mano di dispositivi simili e'stata di 28.8 °C / 83.8 F (-3.4 °C / -6.2 F).
| Alienware 13 (GTX 960M) GeForce GTX 960M, 5500U | MSI GS30 Shadow Iris Pro Graphics 5200, 4870HQ | Alienware 13 GeForce GTX 860M, 4210U | Schenker XMG A305 GeForce GTX 960M, 4710MQ | Schenker XMG C405 GeForce GTX 965M, 4720HQ | Razer Blade 14 2015 GeForce GTX 970M, 4720HQ | |
|---|---|---|---|---|---|---|
| Heat | -8% | 3% | -6% | -19% | 4% | |
| Maximum Upper Side * (°C) | 47.4 | 49.8 -5% | 44.5 6% | 46.2 3% | 47.8 -1% | 51.6 -9% |
| Maximum Bottom * (°C) | 63.1 | 52.5 17% | 60.2 5% | 47.7 24% | 60.4 4% | 51.2 19% |
| Idle Upper Side * (°C) | 30.3 | 35.2 -16% | 29.4 3% | 35 -16% | 37.7 -24% | 29.2 4% |
| Idle Bottom * (°C) | 28.8 | 36.8 -28% | 29.6 -3% | 38.2 -33% | 44.8 -56% | 28.8 -0% |
* ... Meglio usare valori piccoli
| Off / Standby | |
| Idle | |
| Sotto carico |
|
Leggenda:
min: | |
| Alienware 13 (GTX 960M) GeForce GTX 960M, 5500U | MSI GS30 Shadow Iris Pro Graphics 5200, 4870HQ | Alienware 13 GeForce GTX 860M, 4210U | Schenker XMG A305 GeForce GTX 960M, 4710MQ | Schenker XMG C405 GeForce GTX 965M, 4720HQ | Razer Blade 14 2015 GeForce GTX 970M, 4720HQ | |
|---|---|---|---|---|---|---|
| Power Consumption | -12% | 20% | -57% | -100% | ||
| Idle Minimum * (Watt) | 6.2 | 7.5 -21% | 5.1 18% | 11.4 -84% | 15.8 -155% | |
| Idle Average * (Watt) | 8.7 | 11.6 -33% | 7.3 16% | 16.3 -87% | 22.8 -162% | |
| Idle Maximum * (Watt) | 13.9 | 21.2 -53% | 11.2 19% | 22.6 -63% | 27.3 -96% | |
| Load Average * (Watt) | 66.2 | 65.4 1% | 51.5 22% | 92.4 -40% | 106.8 -61% | |
| Load Maximum * (Watt) | 123 | 66.4 46% | 92.9 24% | 136 -11% | 152 -24% |
* ... Meglio usare valori piccoli
| Alienware 13 (GTX 960M) GeForce GTX 960M, 5500U | MSI GS30 Shadow Iris Pro Graphics 5200, 4870HQ | Alienware 13 GeForce GTX 860M, 4210U | Schenker XMG A305 GeForce GTX 960M, 4710MQ | Schenker XMG C405 GeForce GTX 965M, 4720HQ | Razer Blade 14 2015 GeForce GTX 970M, 4720HQ | |
|---|---|---|---|---|---|---|
| Autonomia della batteria | -50% | 12% | -19% | -43% | ||
| Reader / Idle (h) | 11.3 | 6.7 -41% | 12.1 7% | 7 -38% | 6.3 -44% | |
| Load (h) | 1.9 | 0.8 -58% | 2.2 16% | 1.9 0% | 1.1 -42% |
Pro
Contro
In ritardo, ma non cambia il risultato: l'upgrade dell'hardware per l'Alienware 13 non è purtroppo quello che speravamo. Anche se il Core i7-5500U è superiore al Core i5-4210U in molti casi, non può competere con i notebook gaming dotati di un processore quad-core.
La GeForce GTX 960M e l'amplificatore grafico esterno soffrono a causa della CPU dual-core. Anche se il notebook è portatile, non sarà la scelta primaria per gli appassionati di games, a causa del debole Core i7-5500U.
Nel complesso, il verdetto è molto simile a quello dello scorso anno. Nel complesso, il verdetto è molto simile a quello dello. Diamo punti aggiuntivi per la lunga durata della batteria. Tuttavia, il touchpad e il sistema audio richiedono un certo lavoro. Tutto si riduce alle preferenze personali se optare per l'Alienware 13 o l'MSI GS30. La valutazione complessiva di 82% per l'Alienware 13 resta nvariata nel corso degli anni.
Nota: si tratta di una recensione breve, con alcune sezioni non tradotte, per la versione integrale in inglese guardate qui.
Alienware 13 (GTX 960M)
- 05/20/2015 v4 (old)
Florian Glaser