Recensione breve del Portatile Asus ASUSPRO Advanced B8430UA-FA0084E
| |||||||||||||||||||||||||
Distribuzione della luminosità: 87 %
Al centro con la batteria: 213 cd/m²
Contrasto: 525:1 (Nero: 0.4 cd/m²)
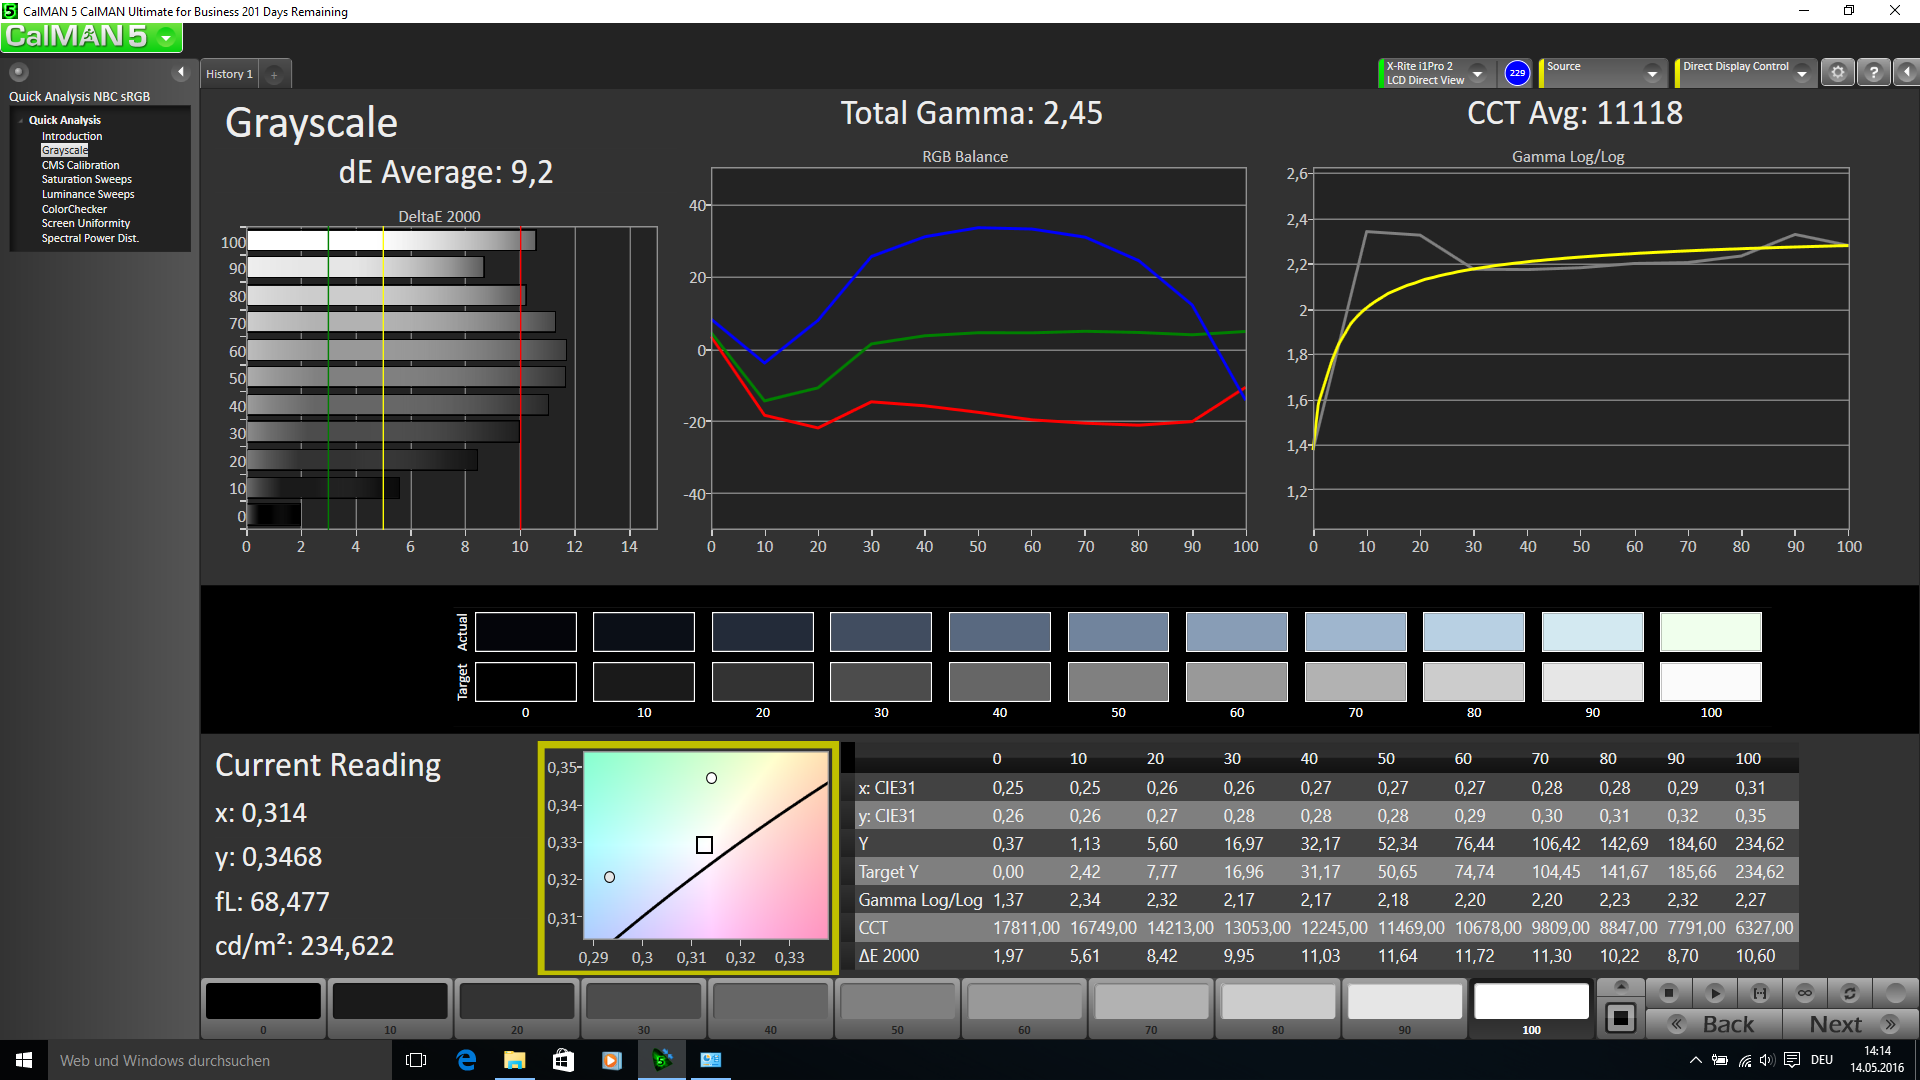
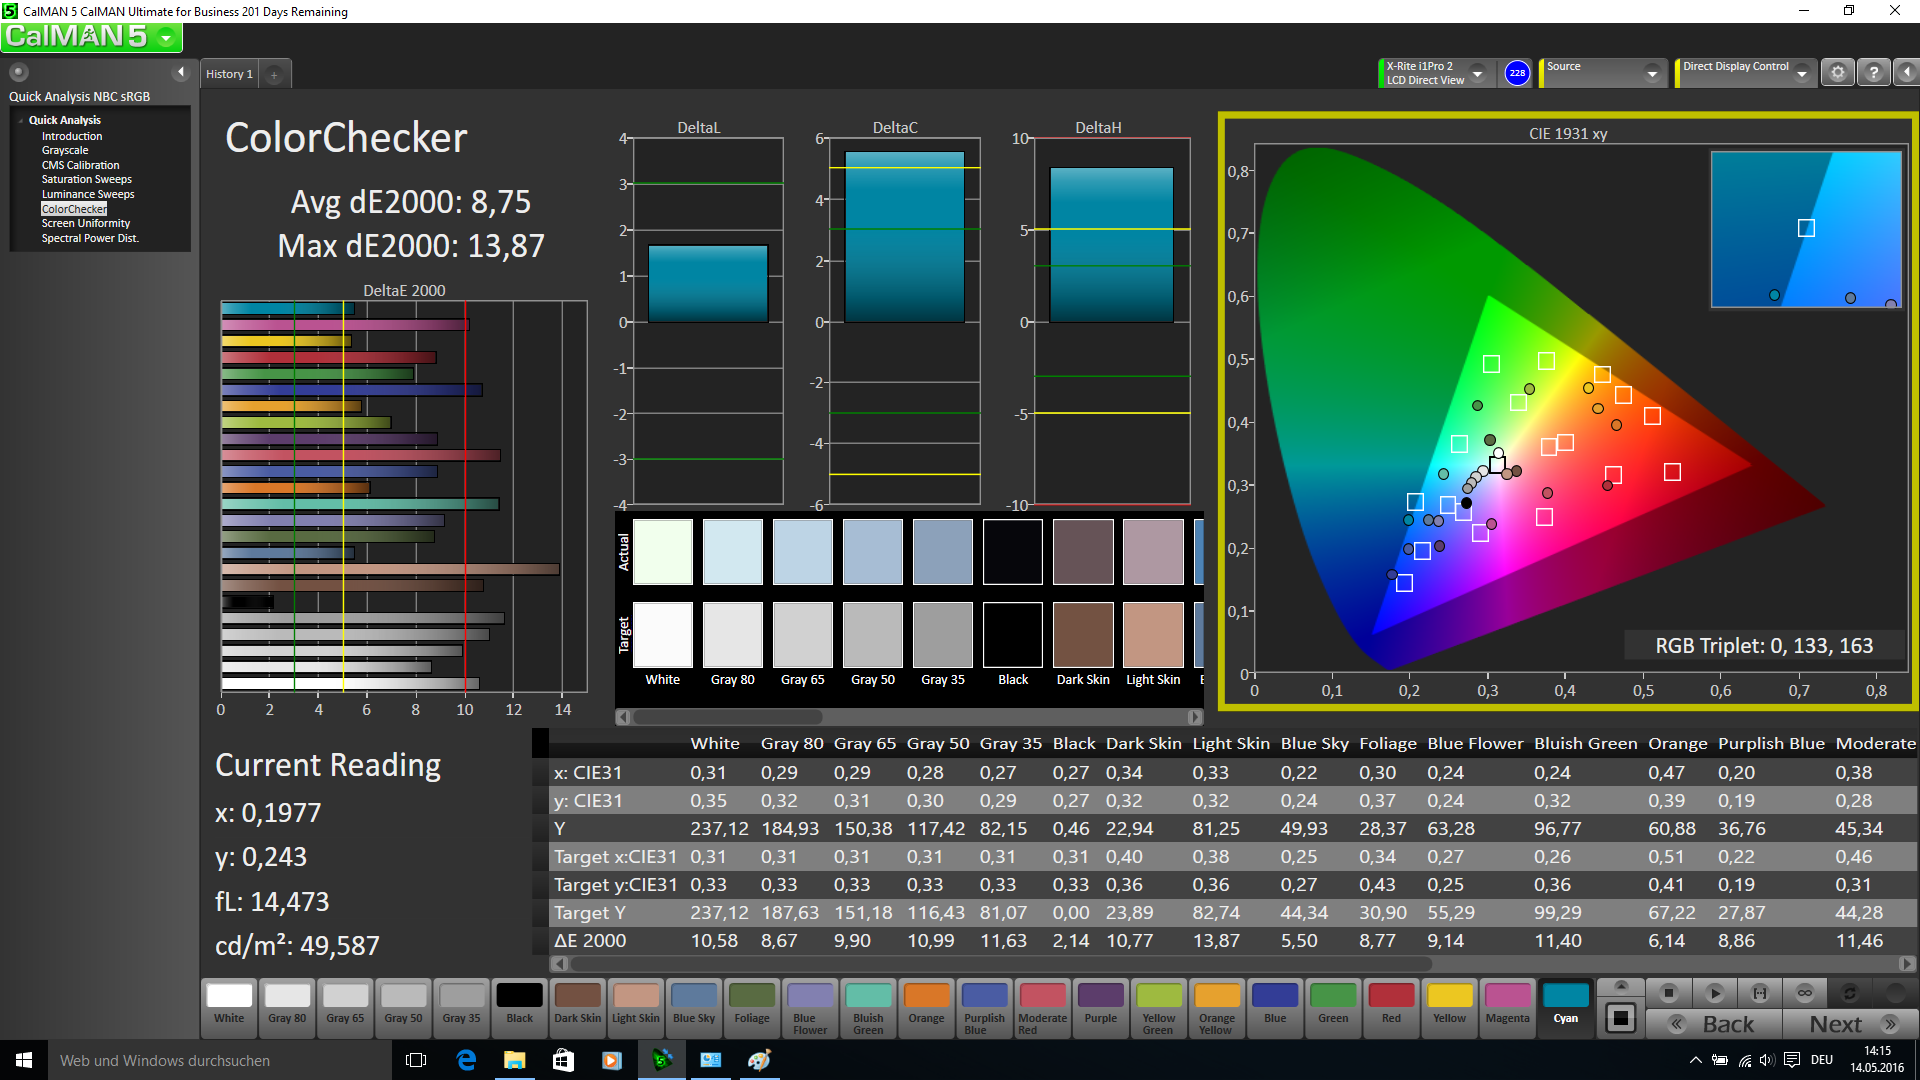
ΔE ColorChecker Calman: 8.75 | ∀{0.5-29.43 Ø4.71}
ΔE Greyscale Calman: 9.2 | ∀{0.09-98 Ø4.96}
57.96% sRGB (Argyll 1.6.3 3D)
37.46% AdobeRGB 1998 (Argyll 1.6.3 3D)
40.63% AdobeRGB 1998 (Argyll 3D)
58.1% sRGB (Argyll 3D)
39.25% Display P3 (Argyll 3D)
Gamma: 2.45
CCT: 11118 K
| Asus ASUSPRO Advanced B8430UA-FA0084E TN WLED, 1920x1080 | Asus ASUSPRO Advanced BU401LA-CZ020G TN-Panel, 1600x900 | Lenovo ThinkPad L460-20FVS01400 IPS, 1920x1080 | Dell Latitude 14 E5470 TN, 1366x768 | HP EliteBook 840 G3 T9X59ET#ABD TN LED, 1920x1080 | Lenovo ThinkPad T460s-20F9003SGE IPS, 1920x1080 | Lenovo ThinkPad T460-20FN003LGE IPS, 1920x1080 | |
|---|---|---|---|---|---|---|---|
| Display | 20% | 8% | 3% | 25% | 6% | 7% | |
| Display P3 Coverage (%) | 39.25 | 46.98 20% | 42.2 8% | 40.06 2% | 48.93 25% | 41.65 6% | 42.09 7% |
| sRGB Coverage (%) | 58.1 | 69.8 20% | 62.3 7% | 60.3 4% | 73.7 27% | 61.6 6% | 62 7% |
| AdobeRGB 1998 Coverage (%) | 40.63 | 48.67 20% | 43.72 8% | 41.42 2% | 50.5 24% | 43.14 6% | 43.6 7% |
| Response Times | -23% | -36% | -10% | -19% | -9% | ||
| Response Time Grey 50% / Grey 80% * (ms) | 42 ? | 44.4 ? -6% | 56.8 ? -35% | 43 ? -2% | 42 ? -0% | 42.4 ? -1% | |
| Response Time Black / White * (ms) | 21.2 ? | 29.6 ? -40% | 28.8 ? -36% | 25 ? -18% | 29.2 ? -38% | 24.8 ? -17% | |
| PWM Frequency (Hz) | 204 ? | ||||||
| Screen | -2% | 19% | -16% | 10% | 20% | 14% | |
| Brightness middle (cd/m²) | 210 | 216 3% | 245 17% | 229 9% | 366 74% | 226 8% | 230 10% |
| Brightness (cd/m²) | 207 | 209 1% | 225 9% | 207 0% | 336 62% | 211 2% | 216 4% |
| Brightness Distribution (%) | 87 | 89 2% | 83 -5% | 80 -8% | 87 0% | 89 2% | 85 -2% |
| Black Level * (cd/m²) | 0.4 | 0.436 -9% | 0.24 40% | 0.69 -73% | 0.65 -63% | 0.22 45% | 0.26 35% |
| Contrast (:1) | 525 | 495 -6% | 1021 94% | 332 -37% | 563 7% | 1027 96% | 885 69% |
| Colorchecker dE 2000 * | 8.75 | 9.63 -10% | 6.89 21% | 10.16 -16% | 10.26 -17% | 6.44 26% | 7.32 16% |
| Colorchecker dE 2000 max. * | 13.87 | 17.62 -27% | 17.18 -24% | 17.18 -24% | 18.14 -31% | ||
| Greyscale dE 2000 * | 9.2 | 10.72 -17% | 6.45 30% | 10.87 -18% | 11.51 -25% | 5.87 36% | 6.98 24% |
| Gamma | 2.45 90% | 2.49 88% | 2.46 89% | 2.41 91% | 2.4 92% | 2.37 93% | 2.5 88% |
| CCT | 11118 58% | 12873 50% | 6857 95% | 12881 50% | 12725 51% | 6856 95% | 6683 97% |
| Color Space (Percent of AdobeRGB 1998) (%) | 37.46 | 44.8 20% | 40.1 7% | 38.4 3% | 47 25% | 39.58 6% | 39.97 7% |
| Color Space (Percent of sRGB) (%) | 57.96 | 61.8 7% | 60.4 4% | 74 28% | 61.15 6% | 61.55 6% | |
| Media totale (Programma / Settaggio) | 9% /
4% | 1% /
11% | -16% /
-15% | 8% /
11% | 2% /
12% | 4% /
9% |
* ... Meglio usare valori piccoli
Tempi di risposta del Display
| ↔ Tempi di risposta dal Nero al Bianco | ||
|---|---|---|
| 21.2 ms ... aumenta ↗ e diminuisce ↘ combinato | ↗ 16.8 ms Incremento | 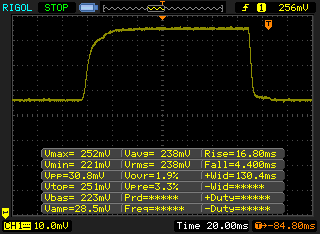 |
| ↘ 4.4 ms Calo | ||
| Lo schermo mostra buoni tempi di risposta durante i nostri tests, ma potrebbe essere troppo lento per i gamers competitivi. In confronto, tutti i dispositivi di test variano da 0.1 (minimo) a 240 (massimo) ms. » 48 % di tutti i dispositivi è migliore. Questo significa che i tempi di risposta rilevati sono simili alla media di tutti i dispositivi testati (19.8 ms). | ||
| ↔ Tempo di risposta dal 50% Grigio all'80% Grigio | ||
| 42 ms ... aumenta ↗ e diminuisce ↘ combinato | ↗ 22.4 ms Incremento | 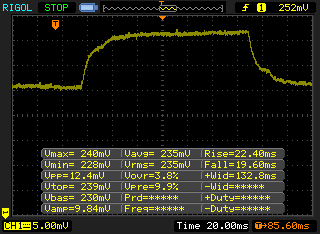 |
| ↘ 19.6 ms Calo | ||
| Lo schermo mostra tempi di risposta lenti nei nostri tests e sarà insoddisfacente per i gamers. In confronto, tutti i dispositivi di test variano da 0.165 (minimo) a 636 (massimo) ms. » 67 % di tutti i dispositivi è migliore. Questo significa che i tempi di risposta rilevati sono peggiori rispetto alla media di tutti i dispositivi testati (30.9 ms). | ||
Sfarfallio dello schermo / PWM (Pulse-Width Modulation)
| flickering dello schermo / PWM non rilevato | ||
In confronto: 52 % di tutti i dispositivi testati non utilizza PWM per ridurre la luminosita' del display. Se è rilevato PWM, una media di 7748 (minimo: 5 - massimo: 343500) Hz è stata rilevata. | ||
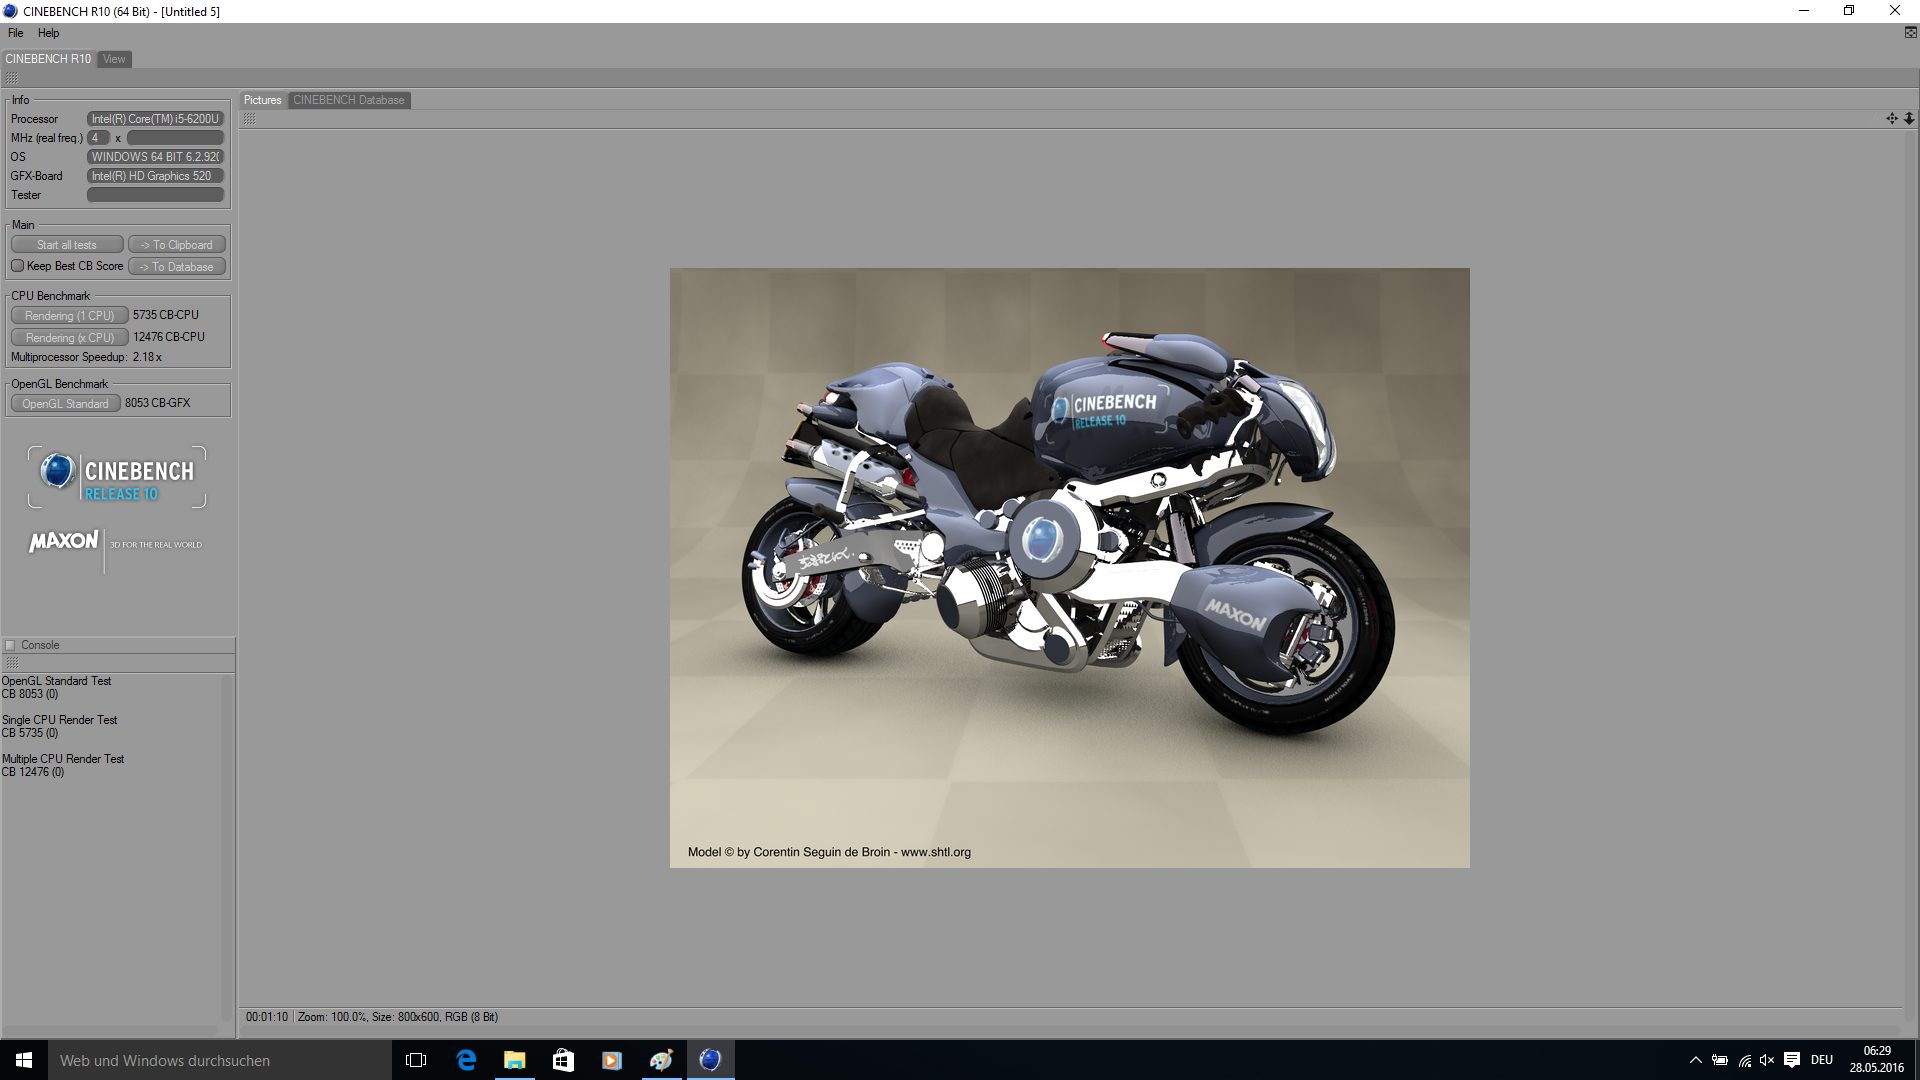
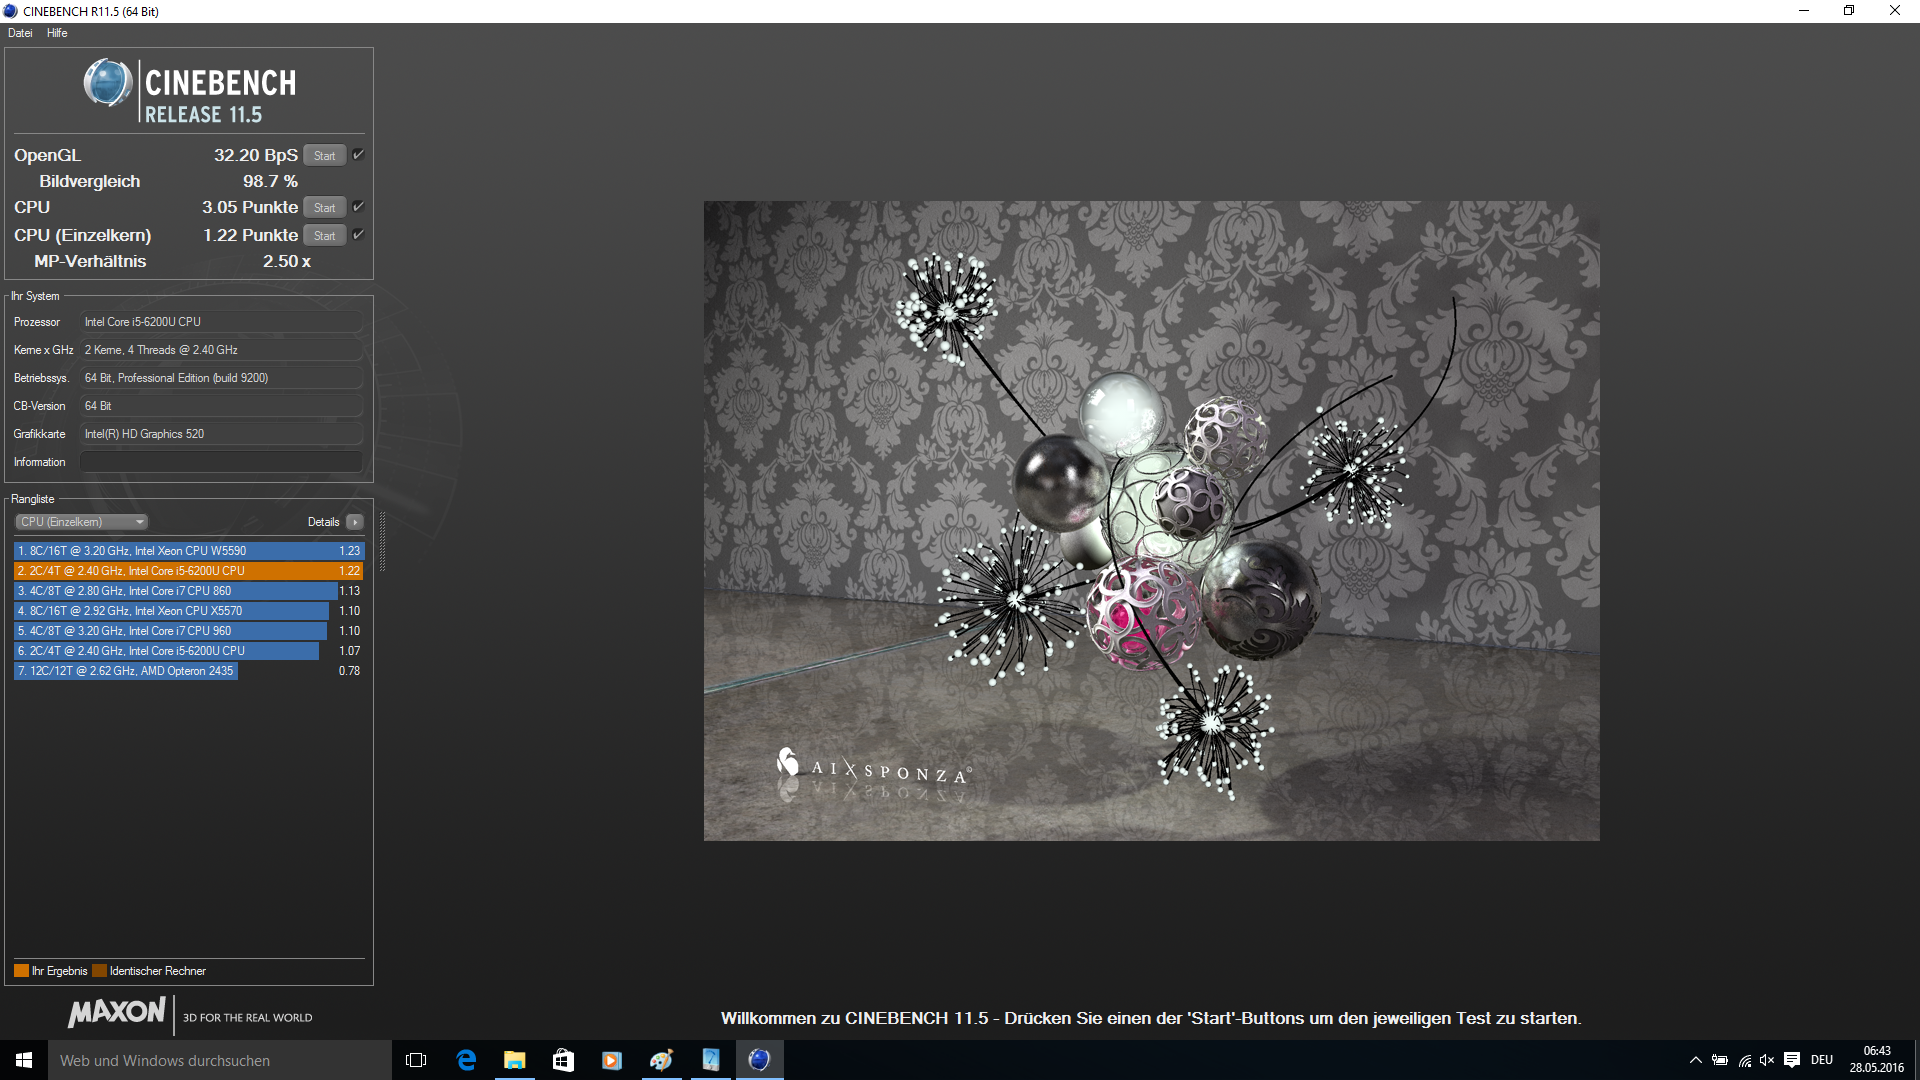
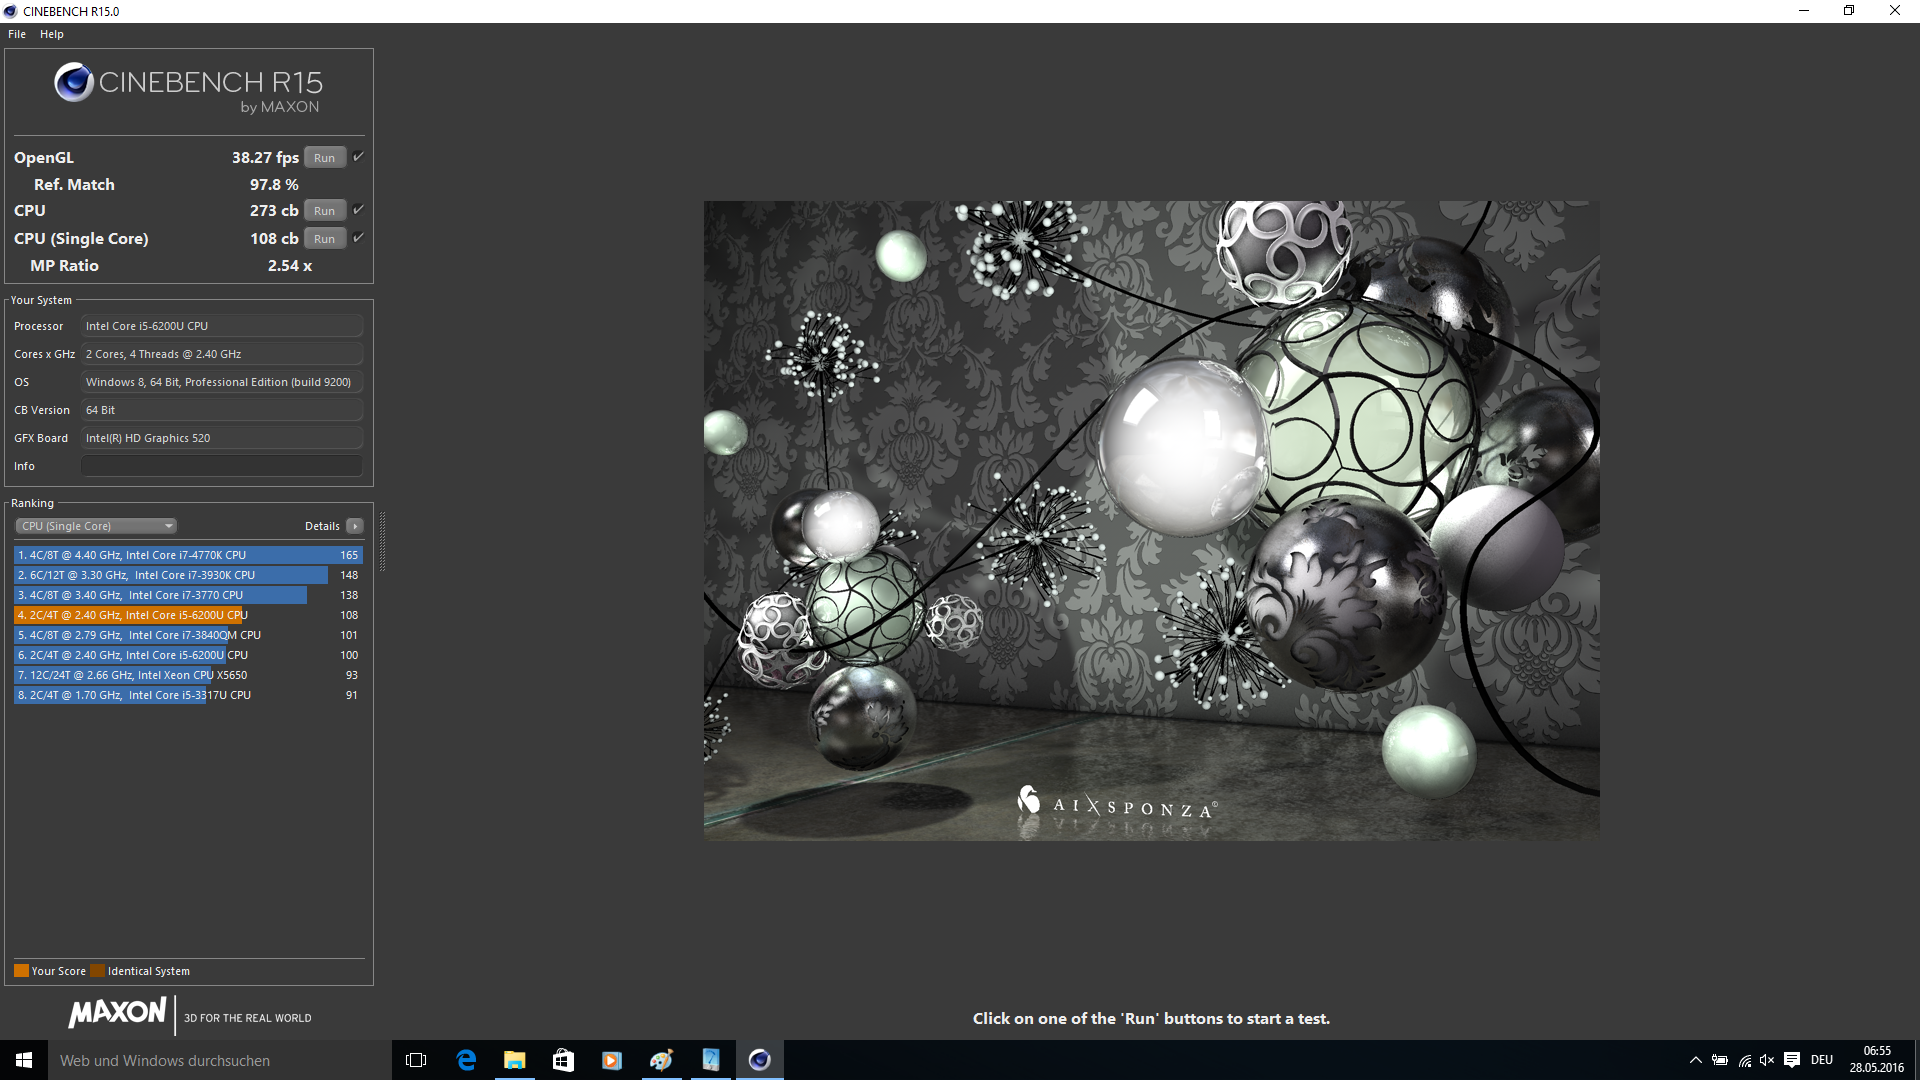
| Cinebench R10 | |
| Rendering Single CPUs 64Bit (ordina per valore) | |
| Asus ASUSPRO Advanced B8430UA-FA0084E | |
| Asus ASUSPRO Advanced BU401LA-CZ020G | |
| Dell Latitude 14 E5470 | |
| Rendering Multiple CPUs 64Bit (ordina per valore) | |
| Asus ASUSPRO Advanced B8430UA-FA0084E | |
| Asus ASUSPRO Advanced BU401LA-CZ020G | |
| Dell Latitude 14 E5470 | |
* ... Meglio usare valori piccoli
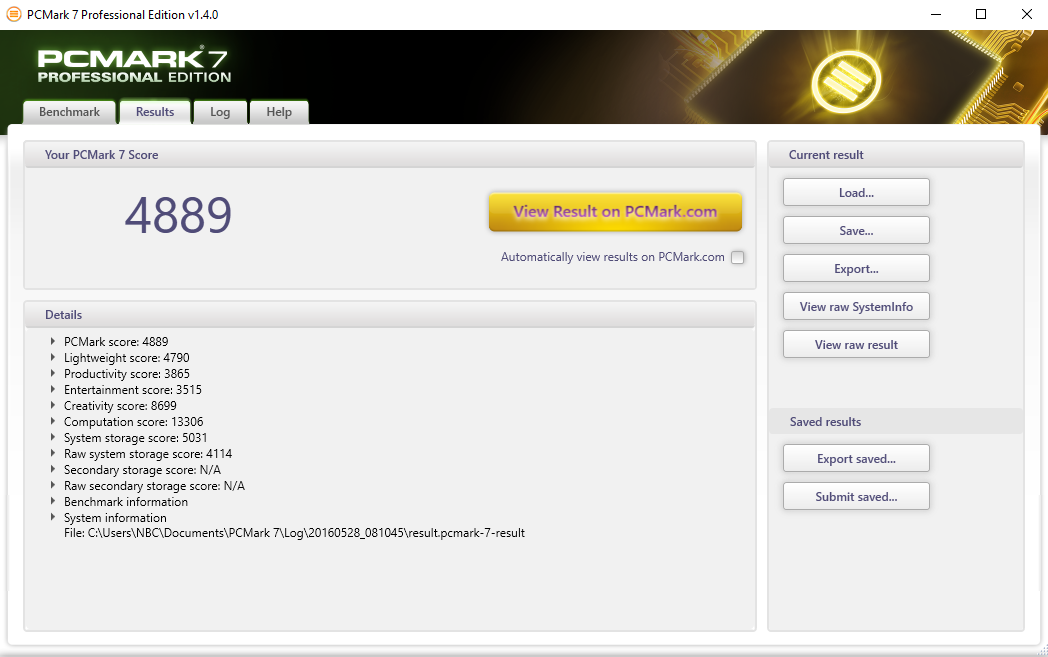
| PCMark 7 Score | 4889 punti | |
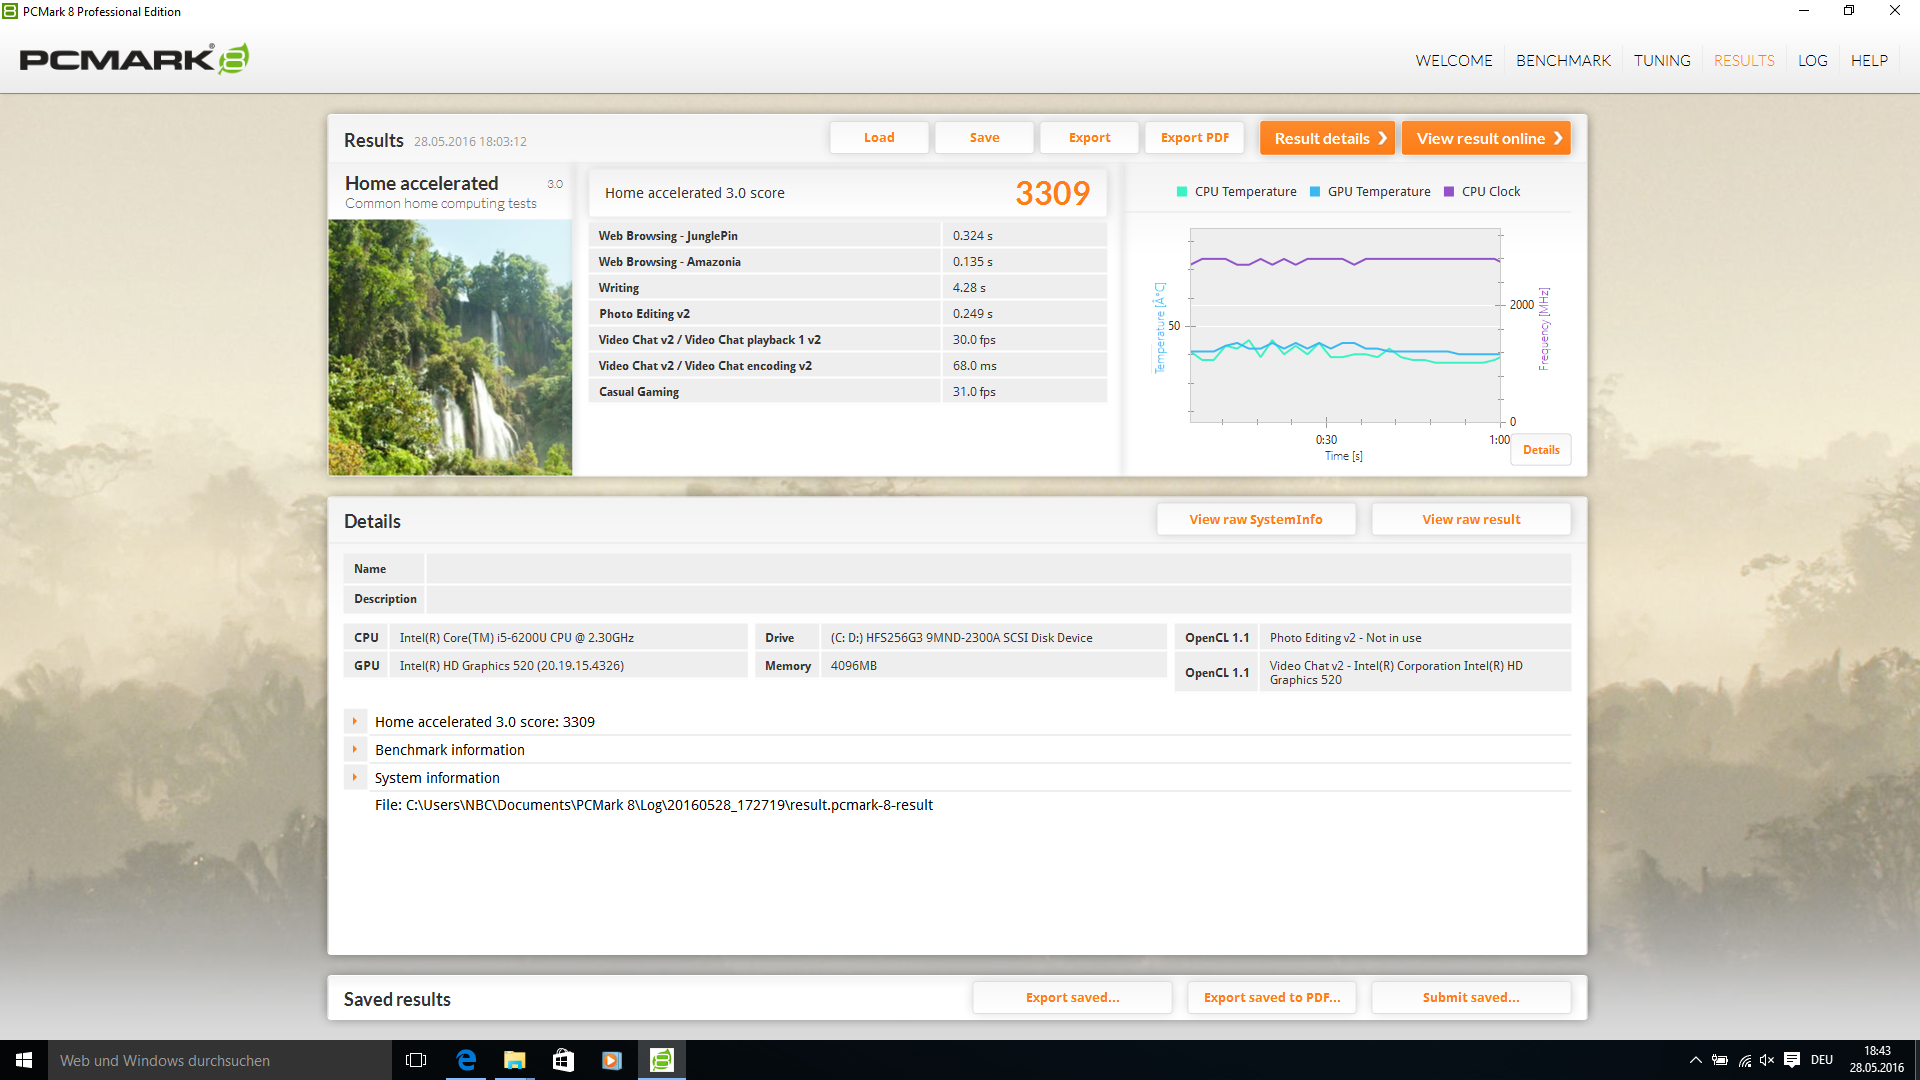
| PCMark 8 Home Score Accelerated v2 | 3309 punti | |
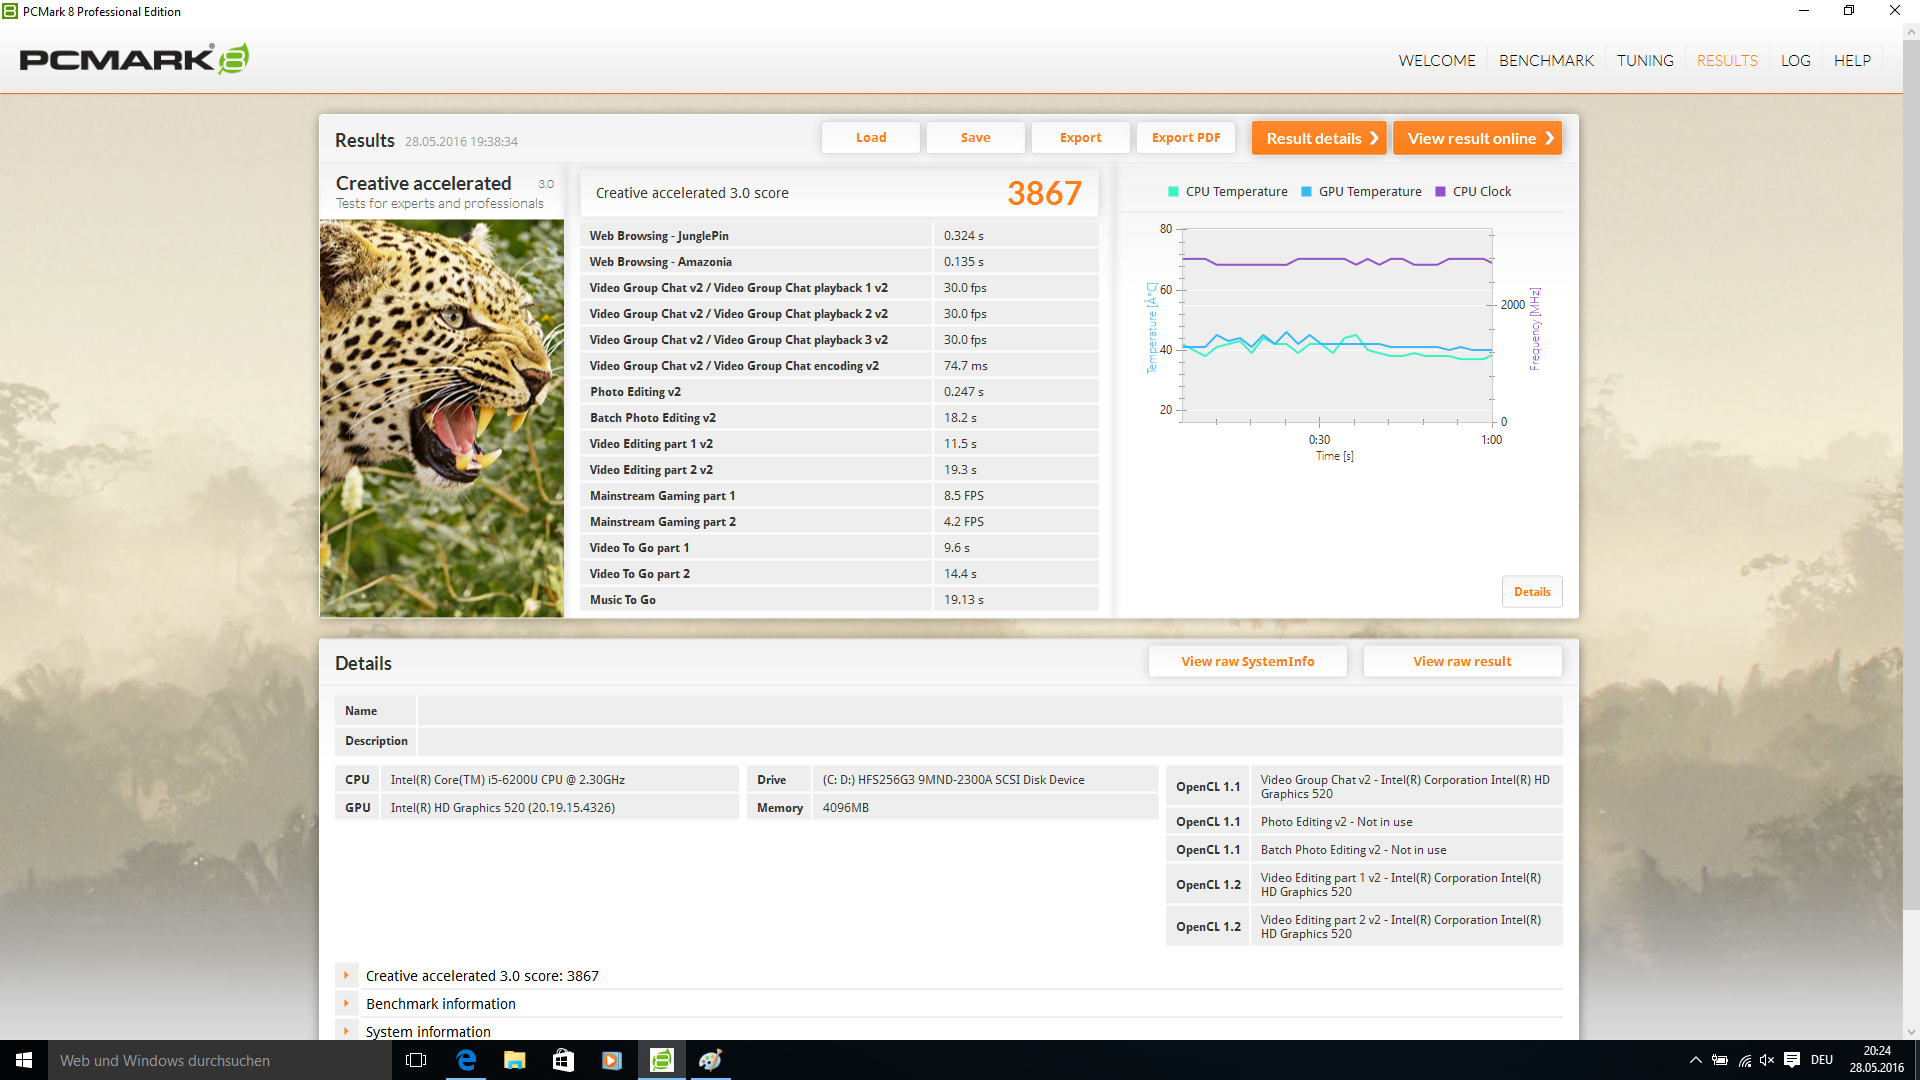
| PCMark 8 Creative Score Accelerated v2 | 3867 punti | |
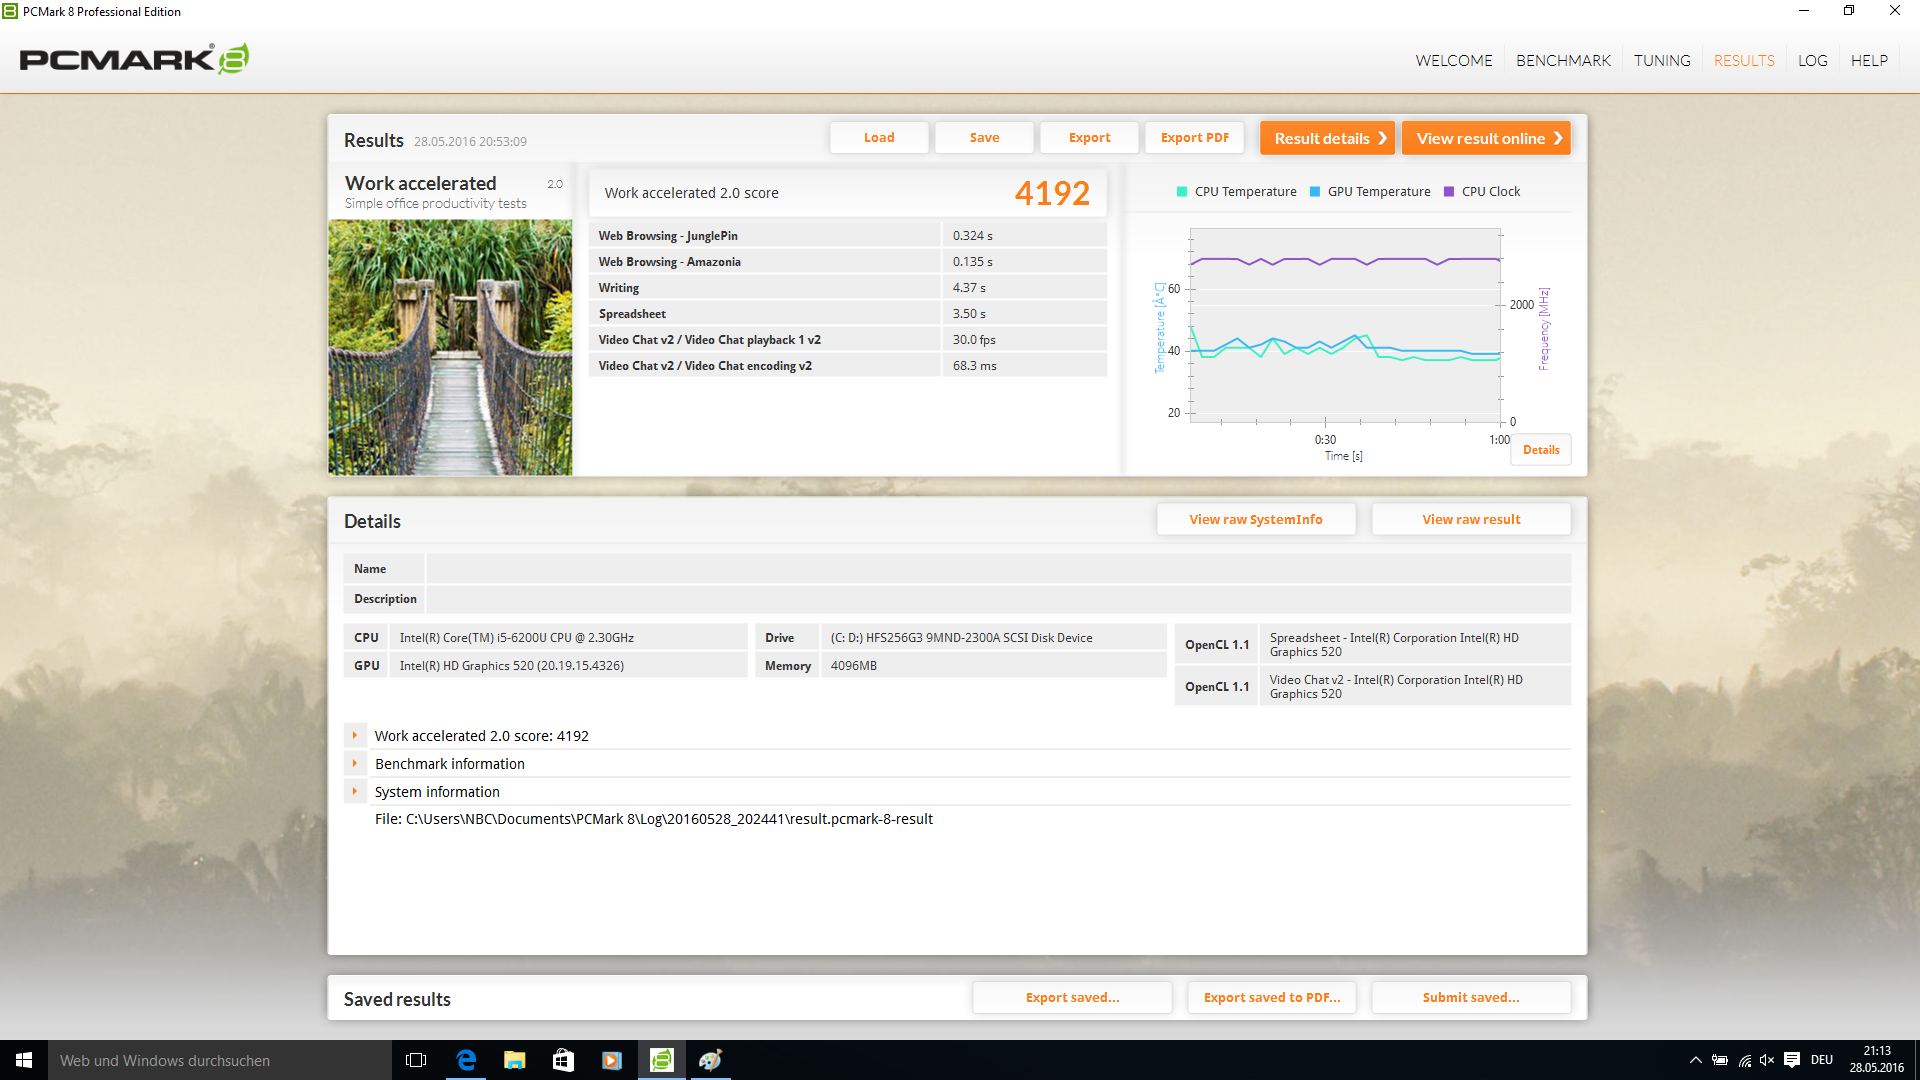
| PCMark 8 Work Score Accelerated v2 | 4192 punti | |
Aiuto | ||

| 3DMark 06 - 1280x1024 Standard Score AA:0x AF:0x (ordina per valore) | |
| Asus ASUSPRO Advanced B8430UA-FA0084E | |
| Lenovo ThinkPad L460-20FVS01400 | |
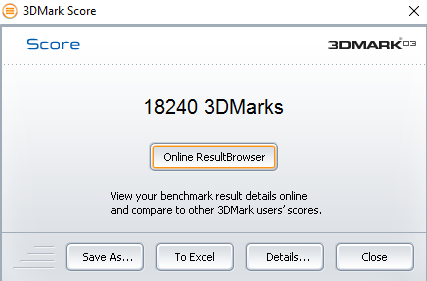
| 3DMark 03 Standard | 18240 punti | |
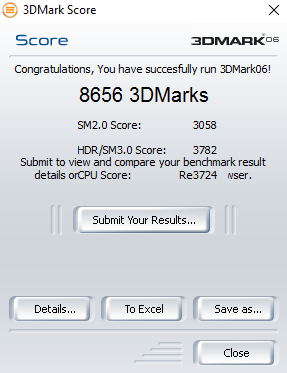
| 3DMark 06 Standard Score | 8656 punti | |
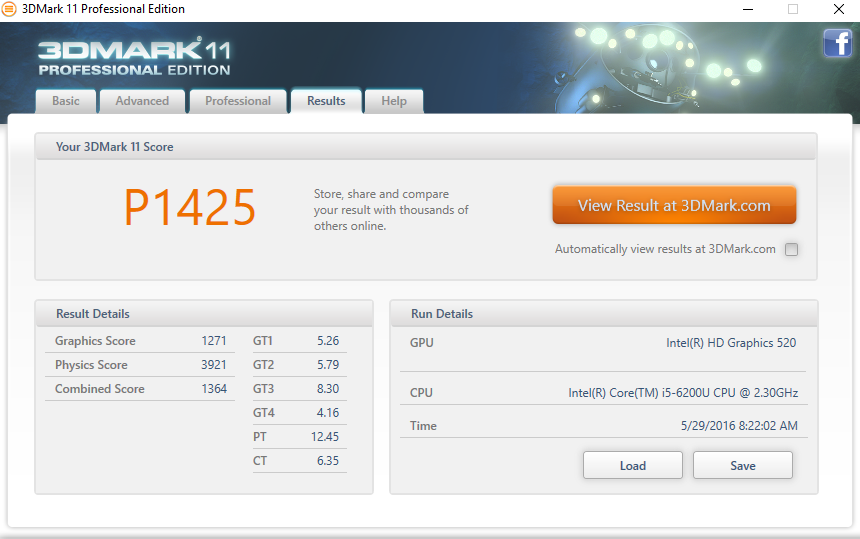
| 3DMark 11 Performance | 1425 punti | |
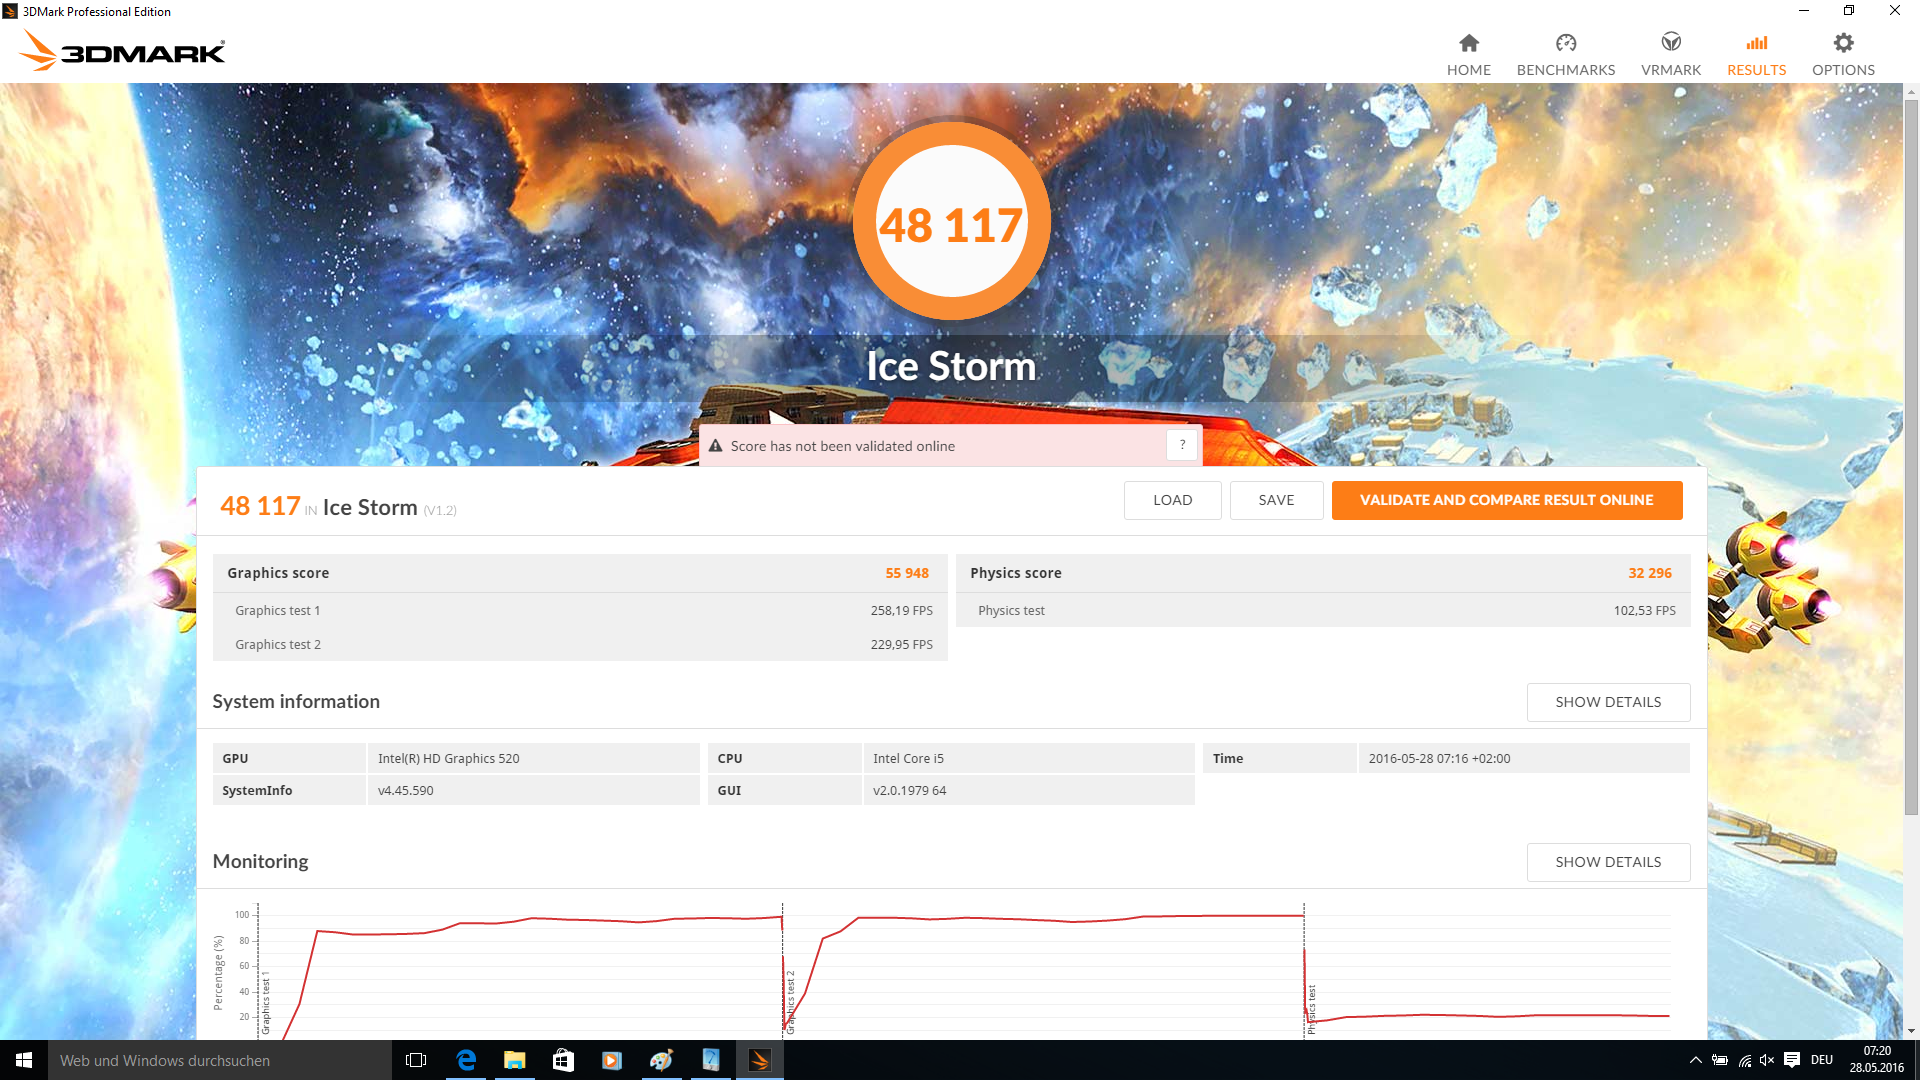
| 3DMark Ice Storm Standard Score | 48117 punti | |
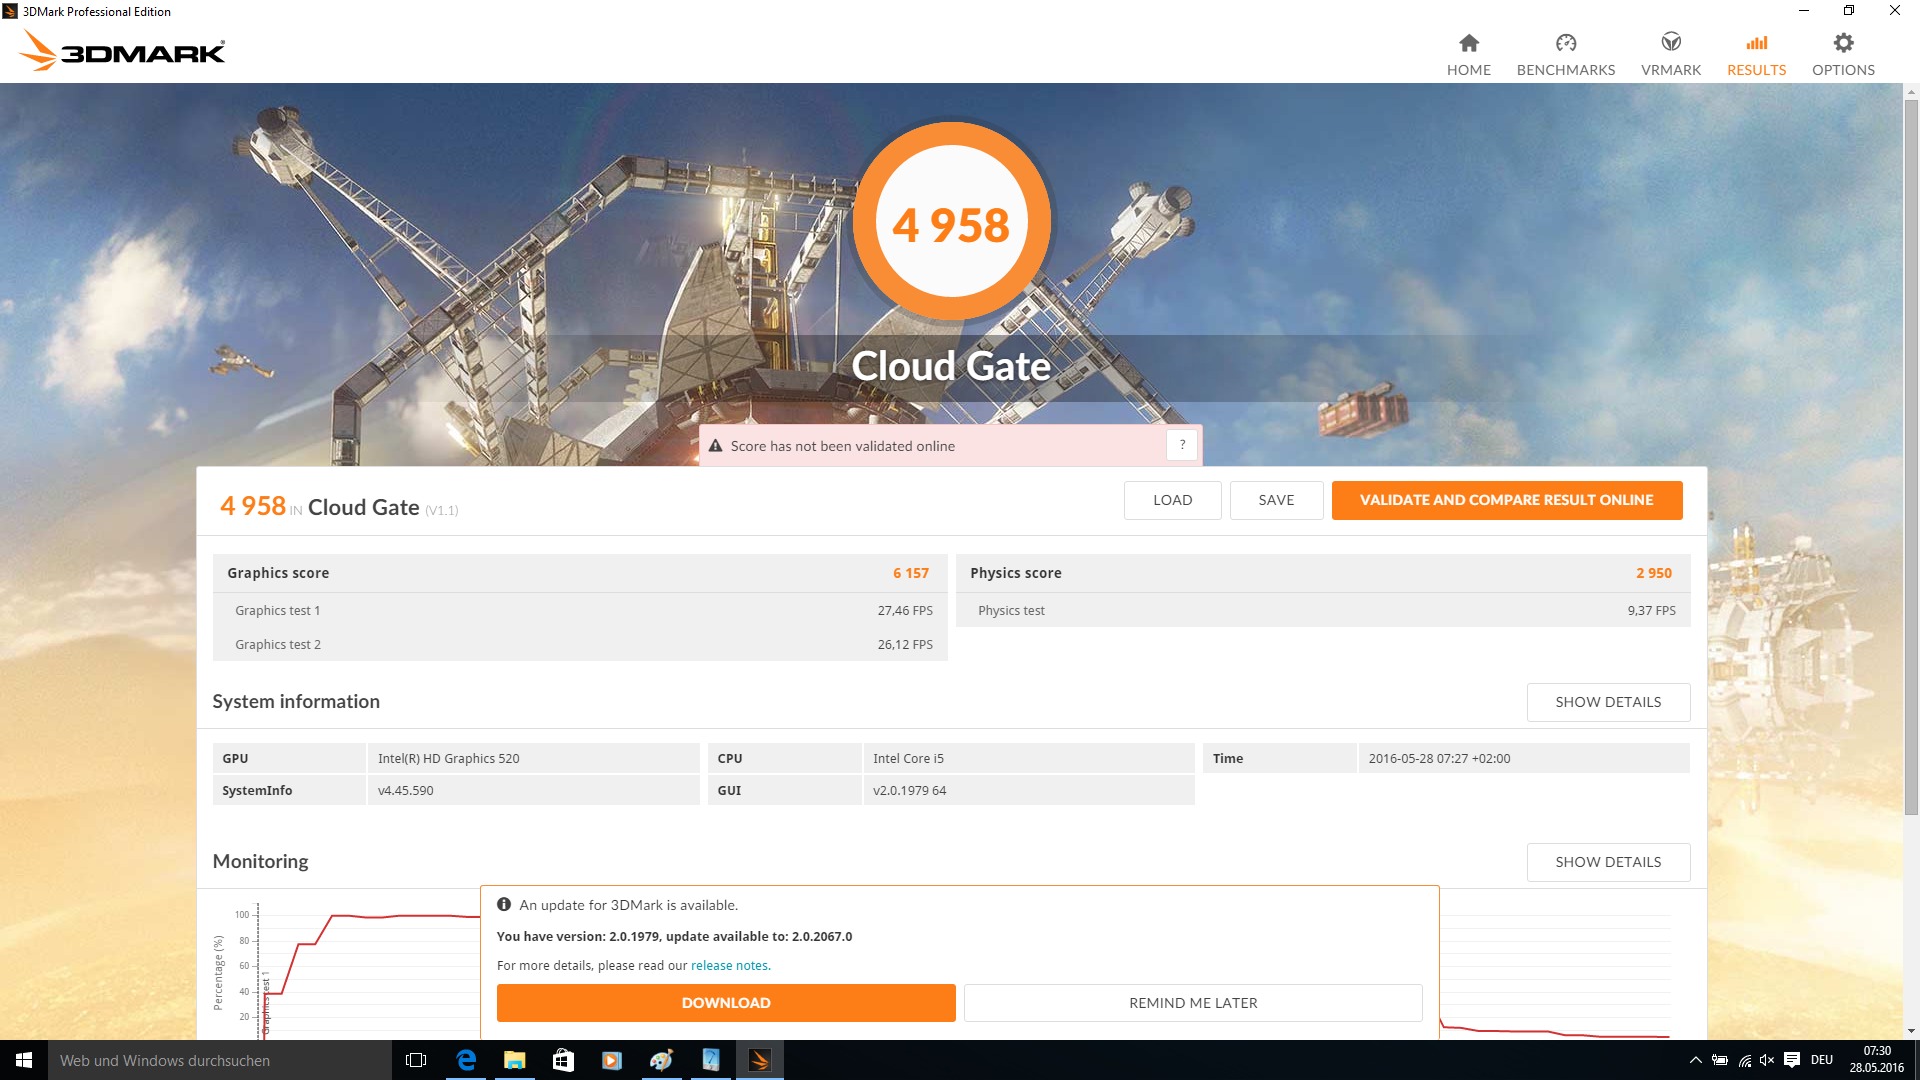
| 3DMark Cloud Gate Standard Score | 4958 punti | |
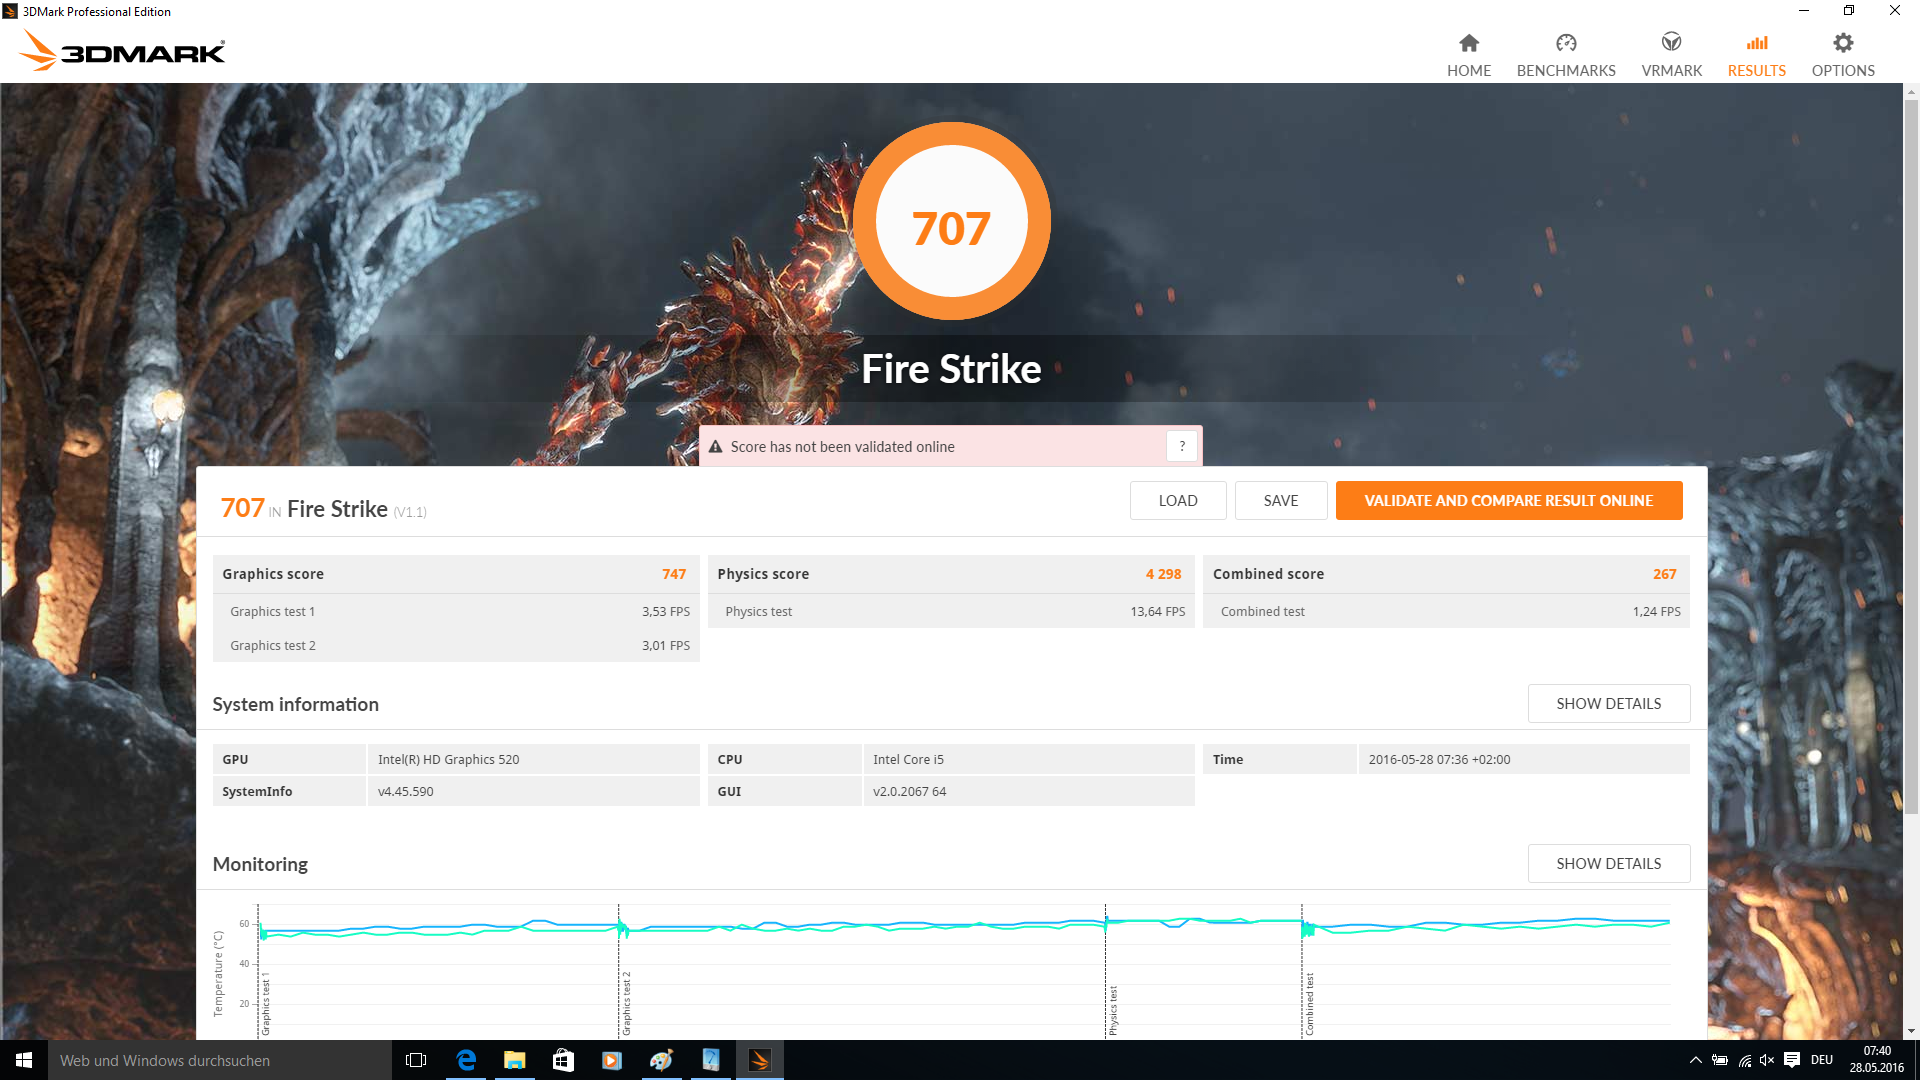
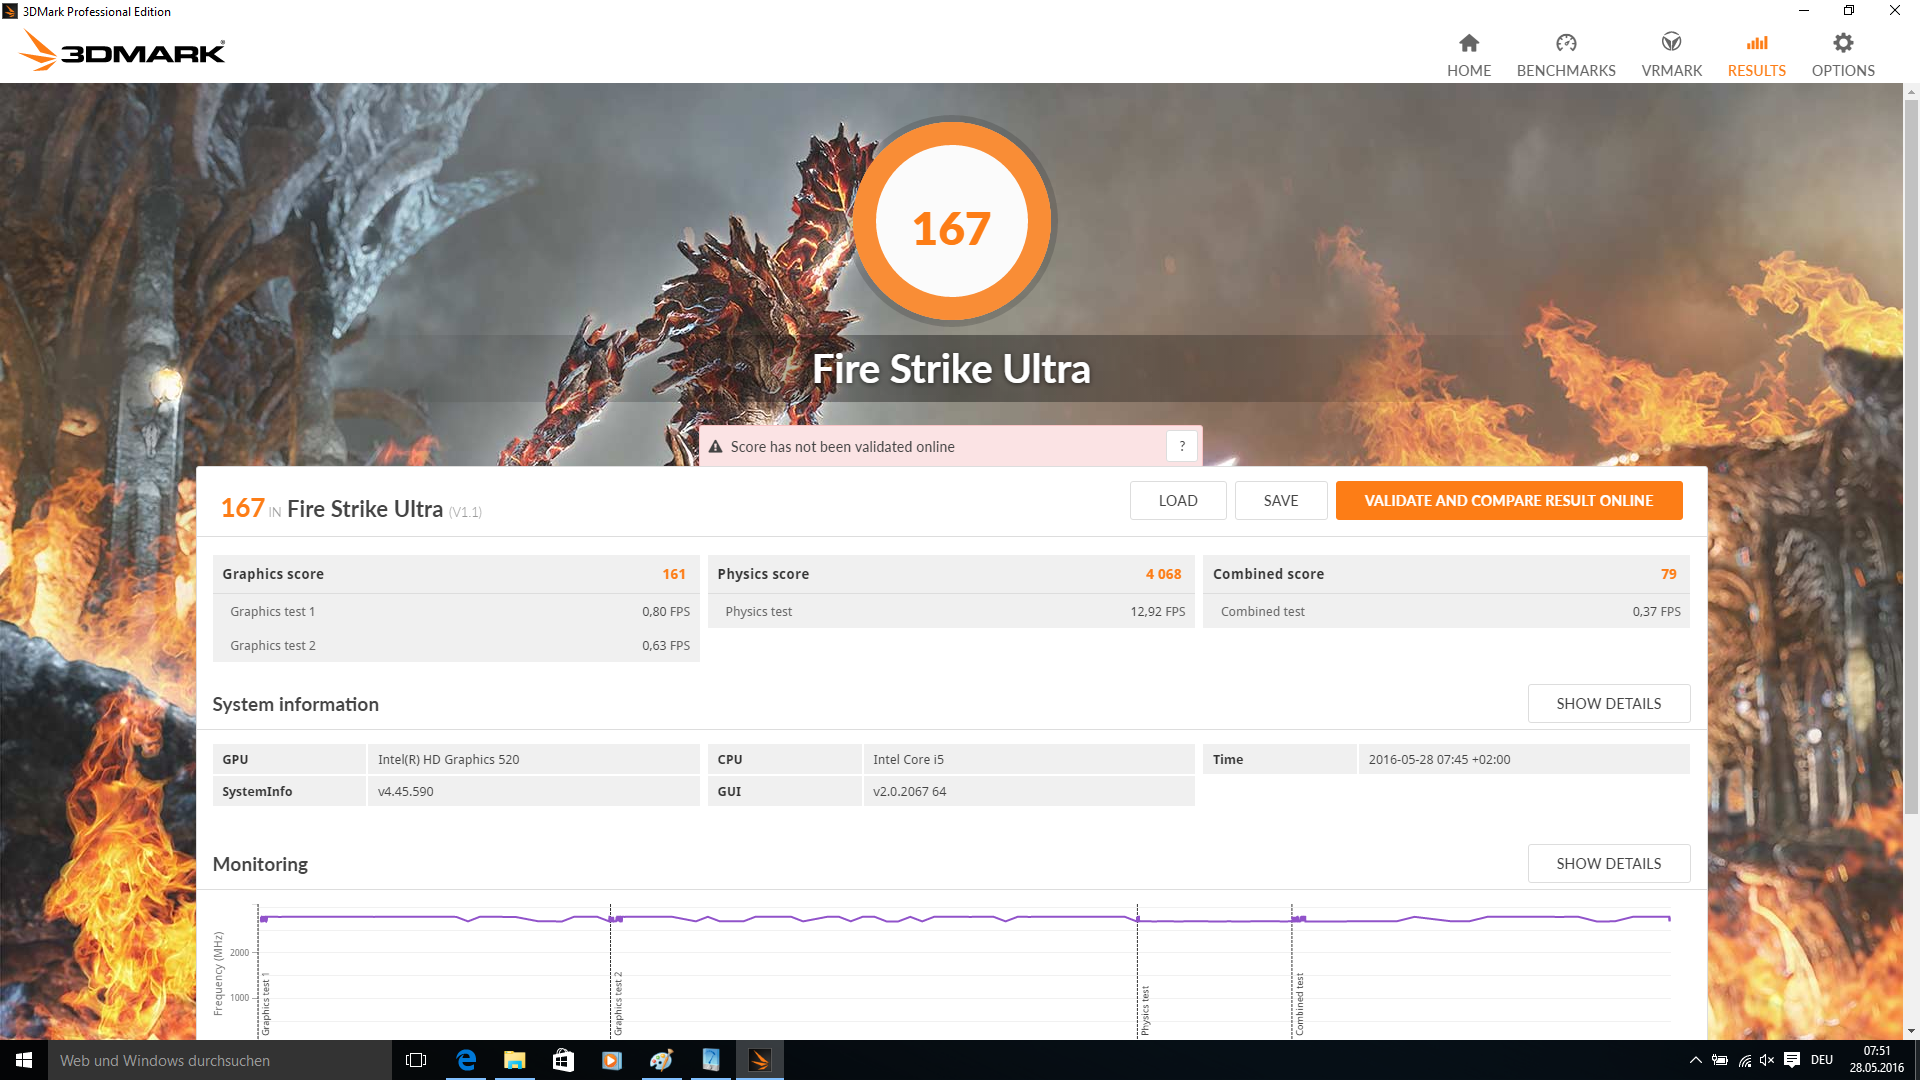
| 3DMark Fire Strike Score | 707 punti | |
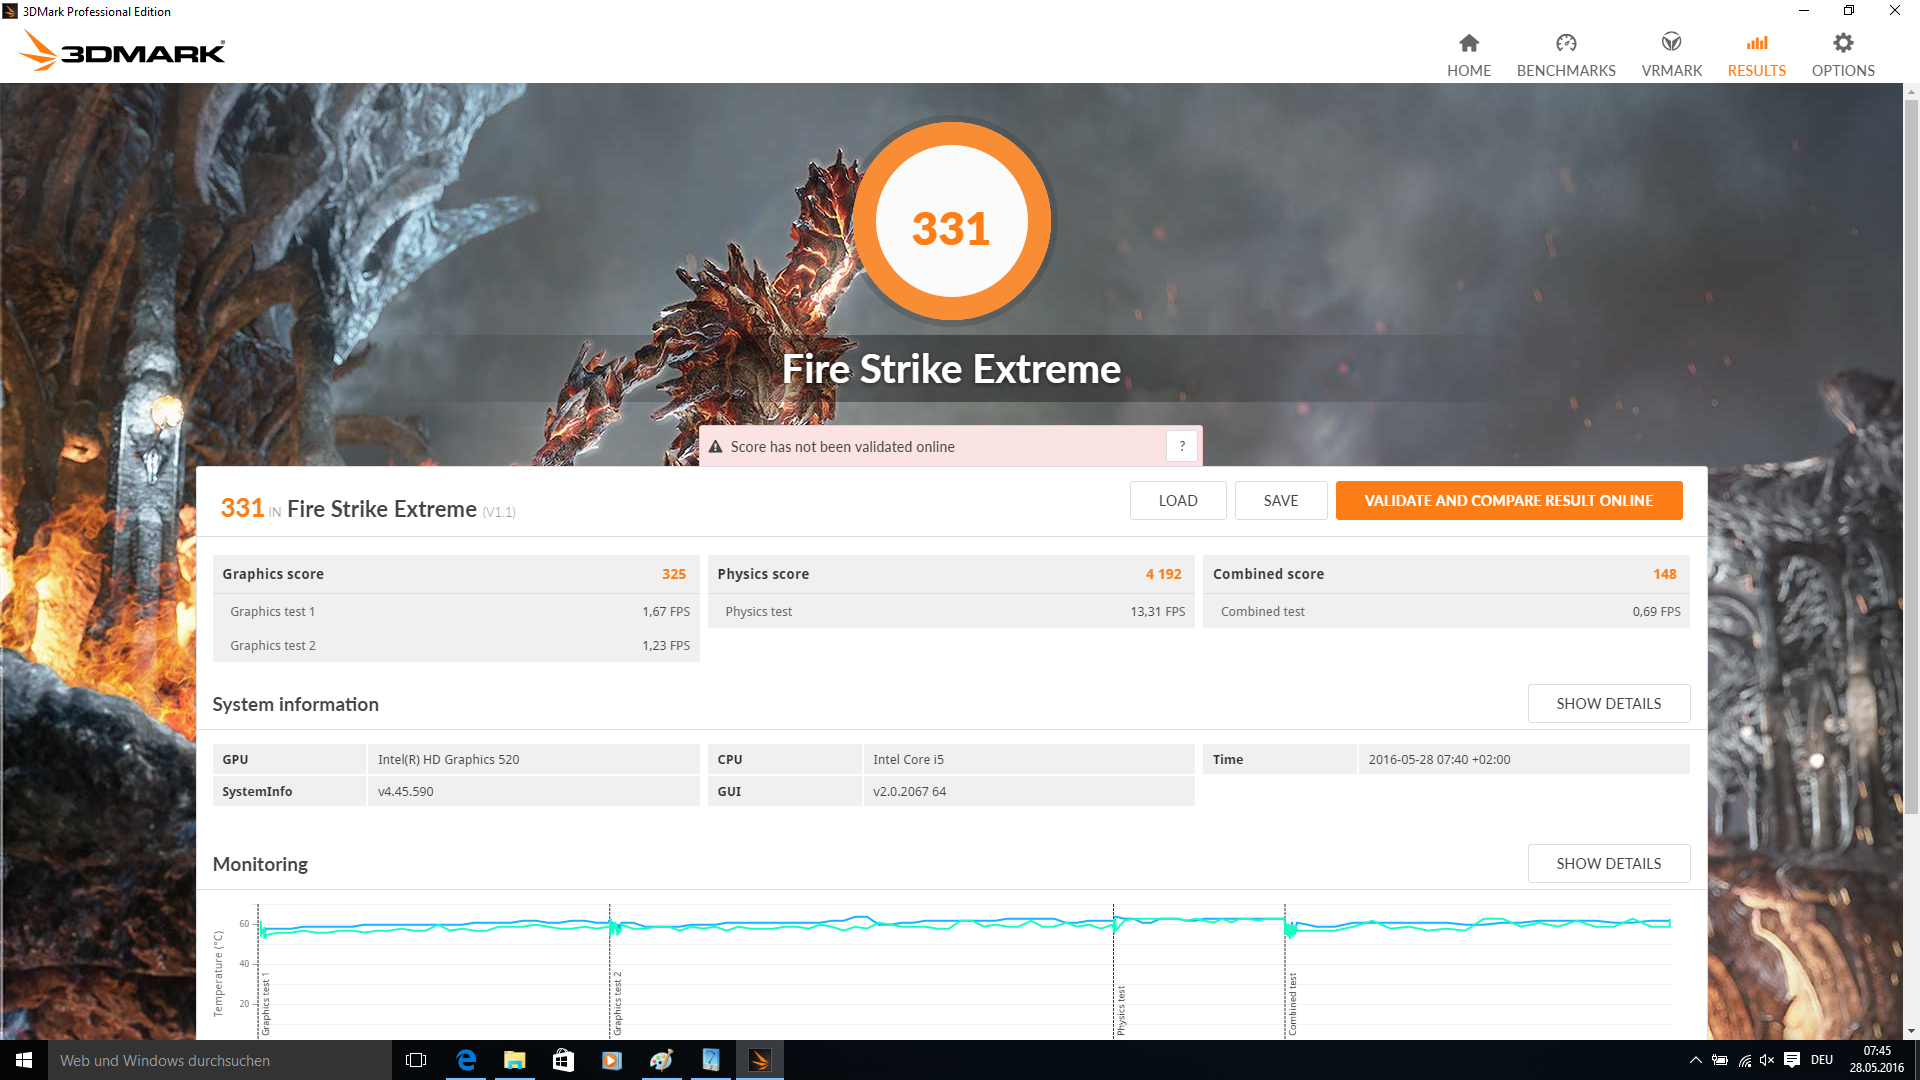
| 3DMark Fire Strike Extreme Score | 331 punti | |
Aiuto | ||
| basso | medio | alto | ultra | |
|---|---|---|---|---|
| BioShock Infinite (2013) | 44.04 | 23.58 | 19.79 | 5.82 |
| Battlefield 4 (2013) | 40.9 | 24.1 | 18.7 | |
| Rise of the Tomb Raider (2016) | 17.8 | 11.9 | 7.2 |
Rumorosità
| Idle |
| 28.8 / 28.8 / 28.8 dB(A) |
| Sotto carico |
| 34.7 / 36.1 dB(A) |
 | ||
30 dB silenzioso 40 dB(A) udibile 50 dB(A) rumoroso |
||
min: | ||
| Asus ASUSPRO Advanced B8430UA-FA0084E Intel Core i5-6200U, HD Graphics 520 | Asus ASUSPRO Advanced BU401LA-CZ020G Intel Core i7-4650U, HD Graphics 5000 | Lenovo ThinkPad L460-20FVS01400 Intel Core i7-6500U, Radeon R5 M330 | Dell Latitude 14 E5470 Intel Core i5-6300U, HD Graphics 520 | HP EliteBook 840 G3 T9X59ET#ABD Intel Core i7-6500U, HD Graphics 520 | Lenovo ThinkPad T460s-20F9003SGE Intel Core i5-6200U, HD Graphics 520 | Lenovo ThinkPad T460-20FN003LGE Intel Core i5-6200U, HD Graphics 520 | |
|---|---|---|---|---|---|---|---|
| Noise | -2% | -0% | 0% | -9% | 0% | -1% | |
| off /ambiente * (dB) | 28.8 | 29.2 -1% | 29.2 -1% | 31.2 -8% | 29.1 -1% | 29 -1% | |
| Idle Minimum * (dB) | 28.8 | 29.3 -2% | 29.2 -1% | 29.2 -1% | 31.2 -8% | 29.1 -1% | 29 -1% |
| Idle Average * (dB) | 28.8 | 29.3 -2% | 29.2 -1% | 29.2 -1% | 32.1 -11% | 29.1 -1% | 29 -1% |
| Idle Maximum * (dB) | 28.8 | 30.9 -7% | 29.2 -1% | 29.2 -1% | 33.1 -15% | 29.1 -1% | 29 -1% |
| Load Average * (dB) | 34.7 | 33.1 5% | 32.5 6% | 32.1 7% | 36.2 -4% | 32.3 7% | 34.2 1% |
| Load Maximum * (dB) | 36.1 | 37.3 -3% | 37.2 -3% | 36.8 -2% | 37.8 -5% | 36.6 -1% | 37.8 -5% |
* ... Meglio usare valori piccoli
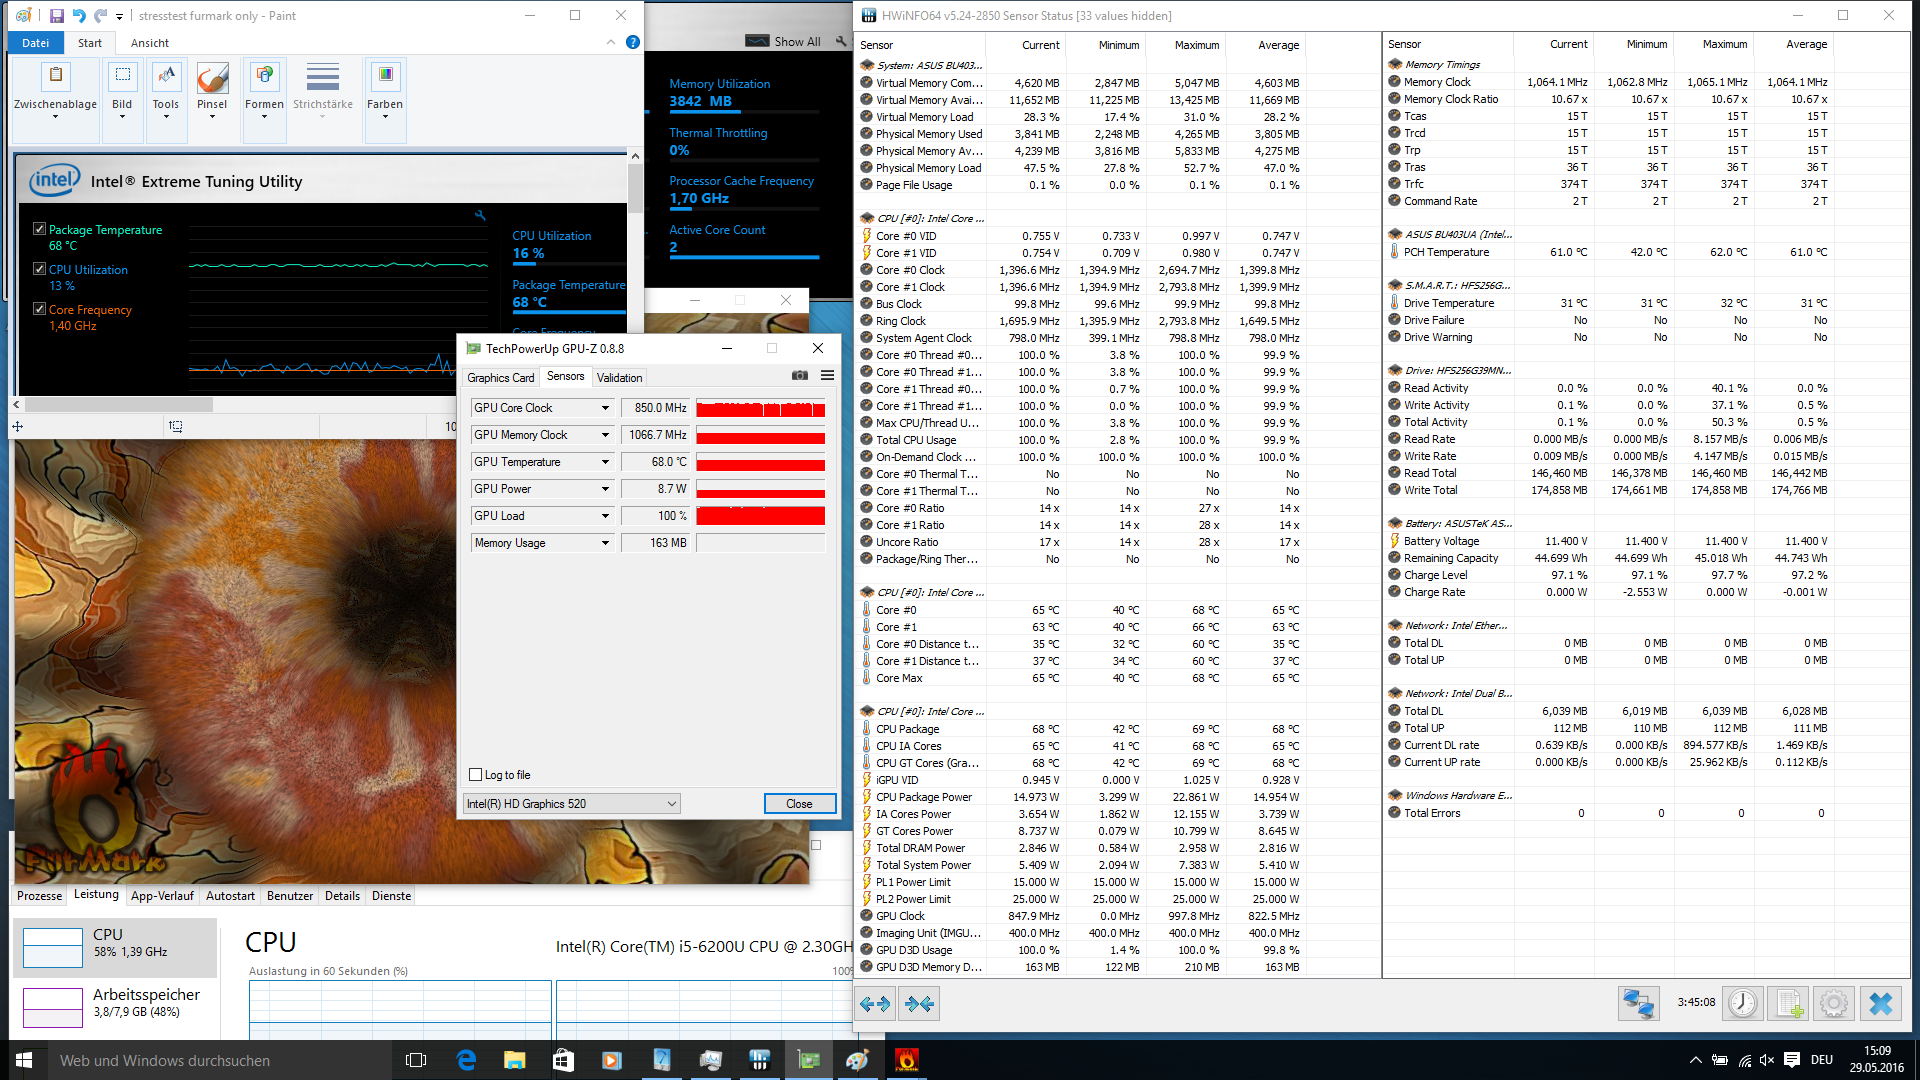
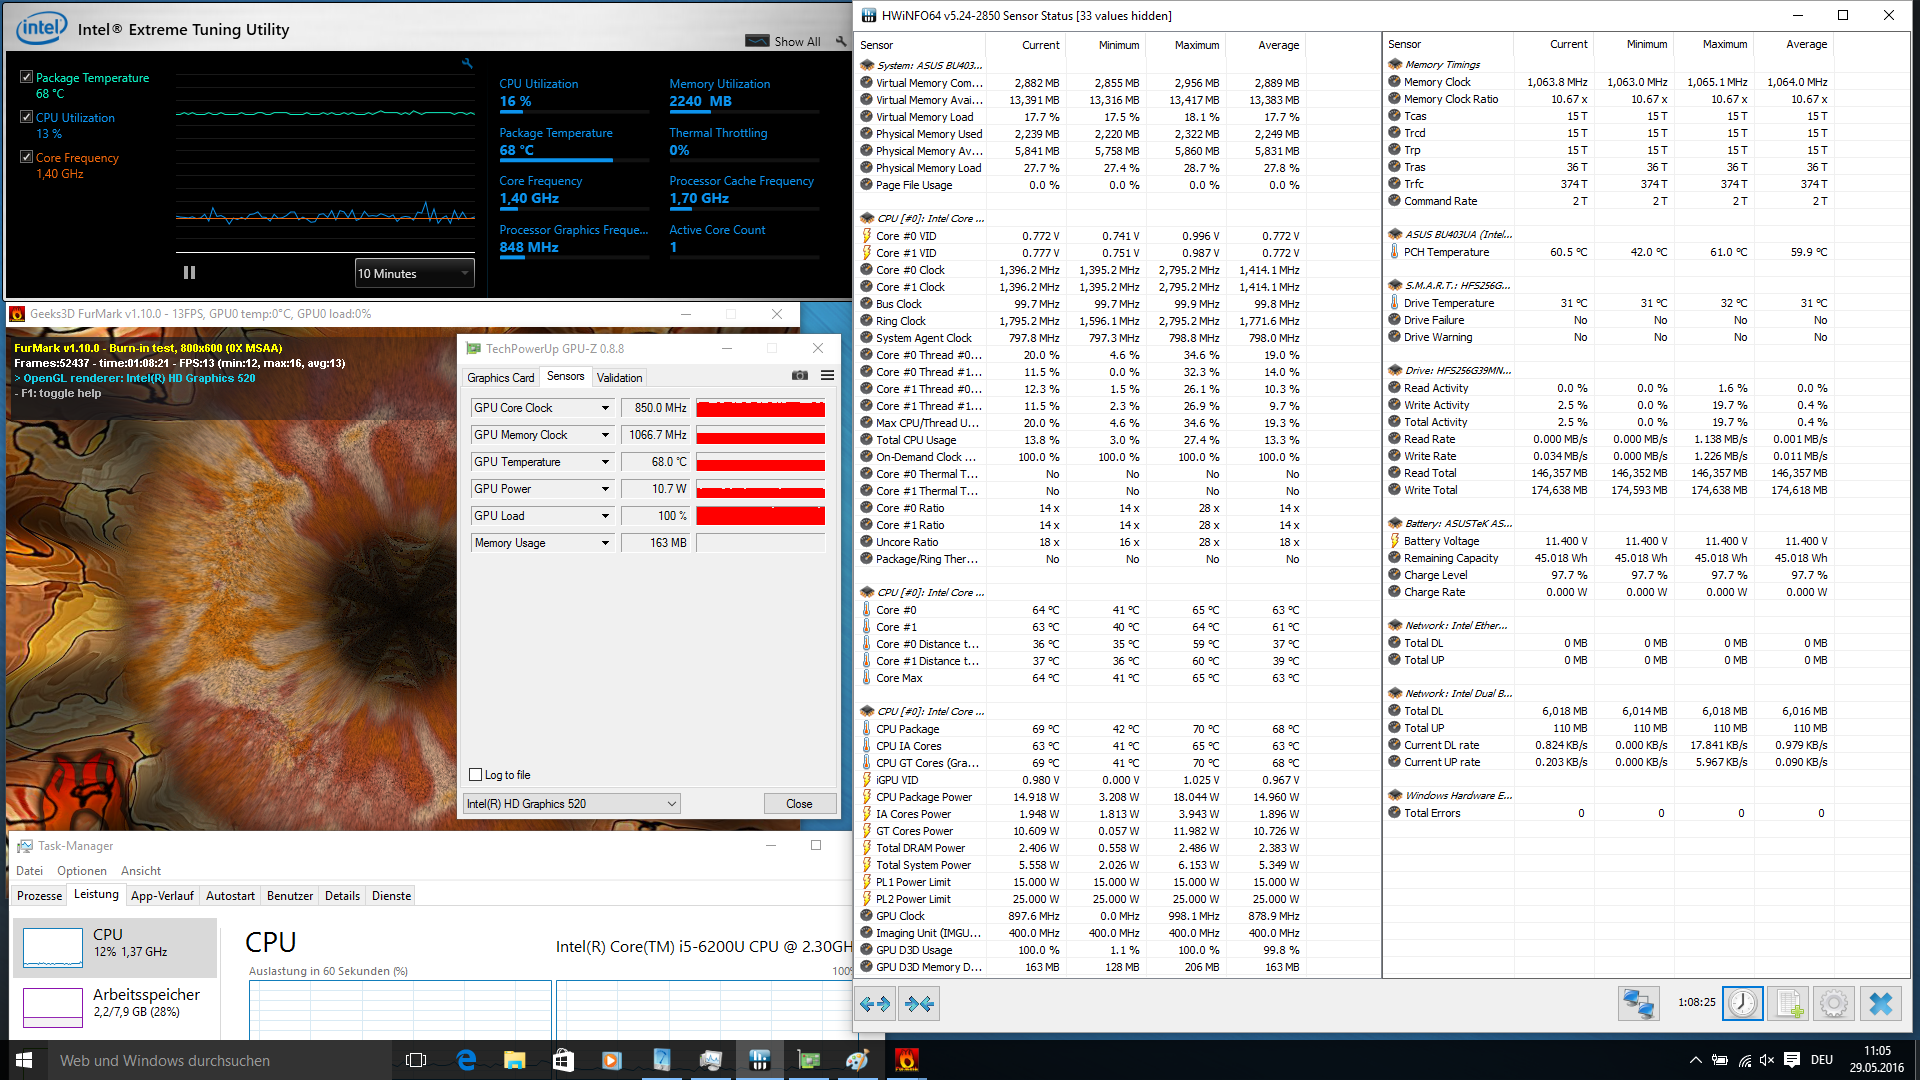
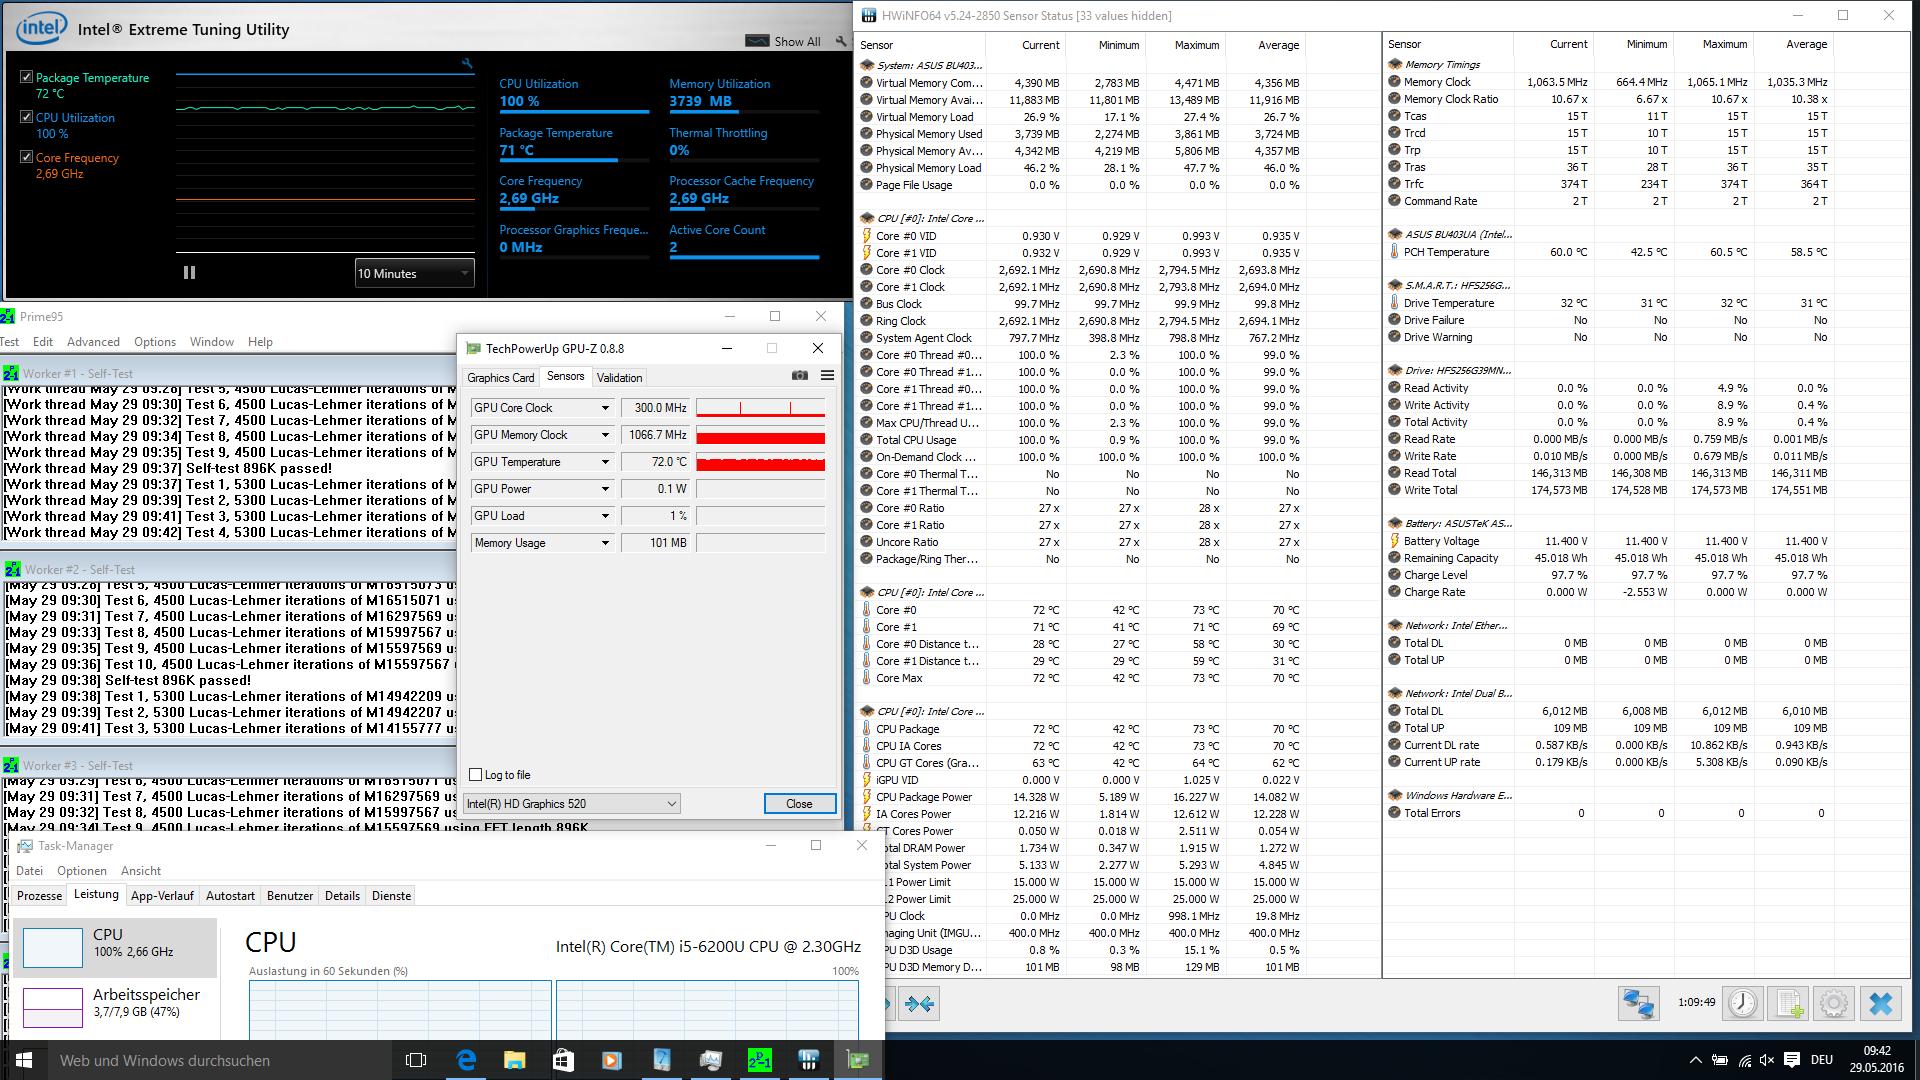
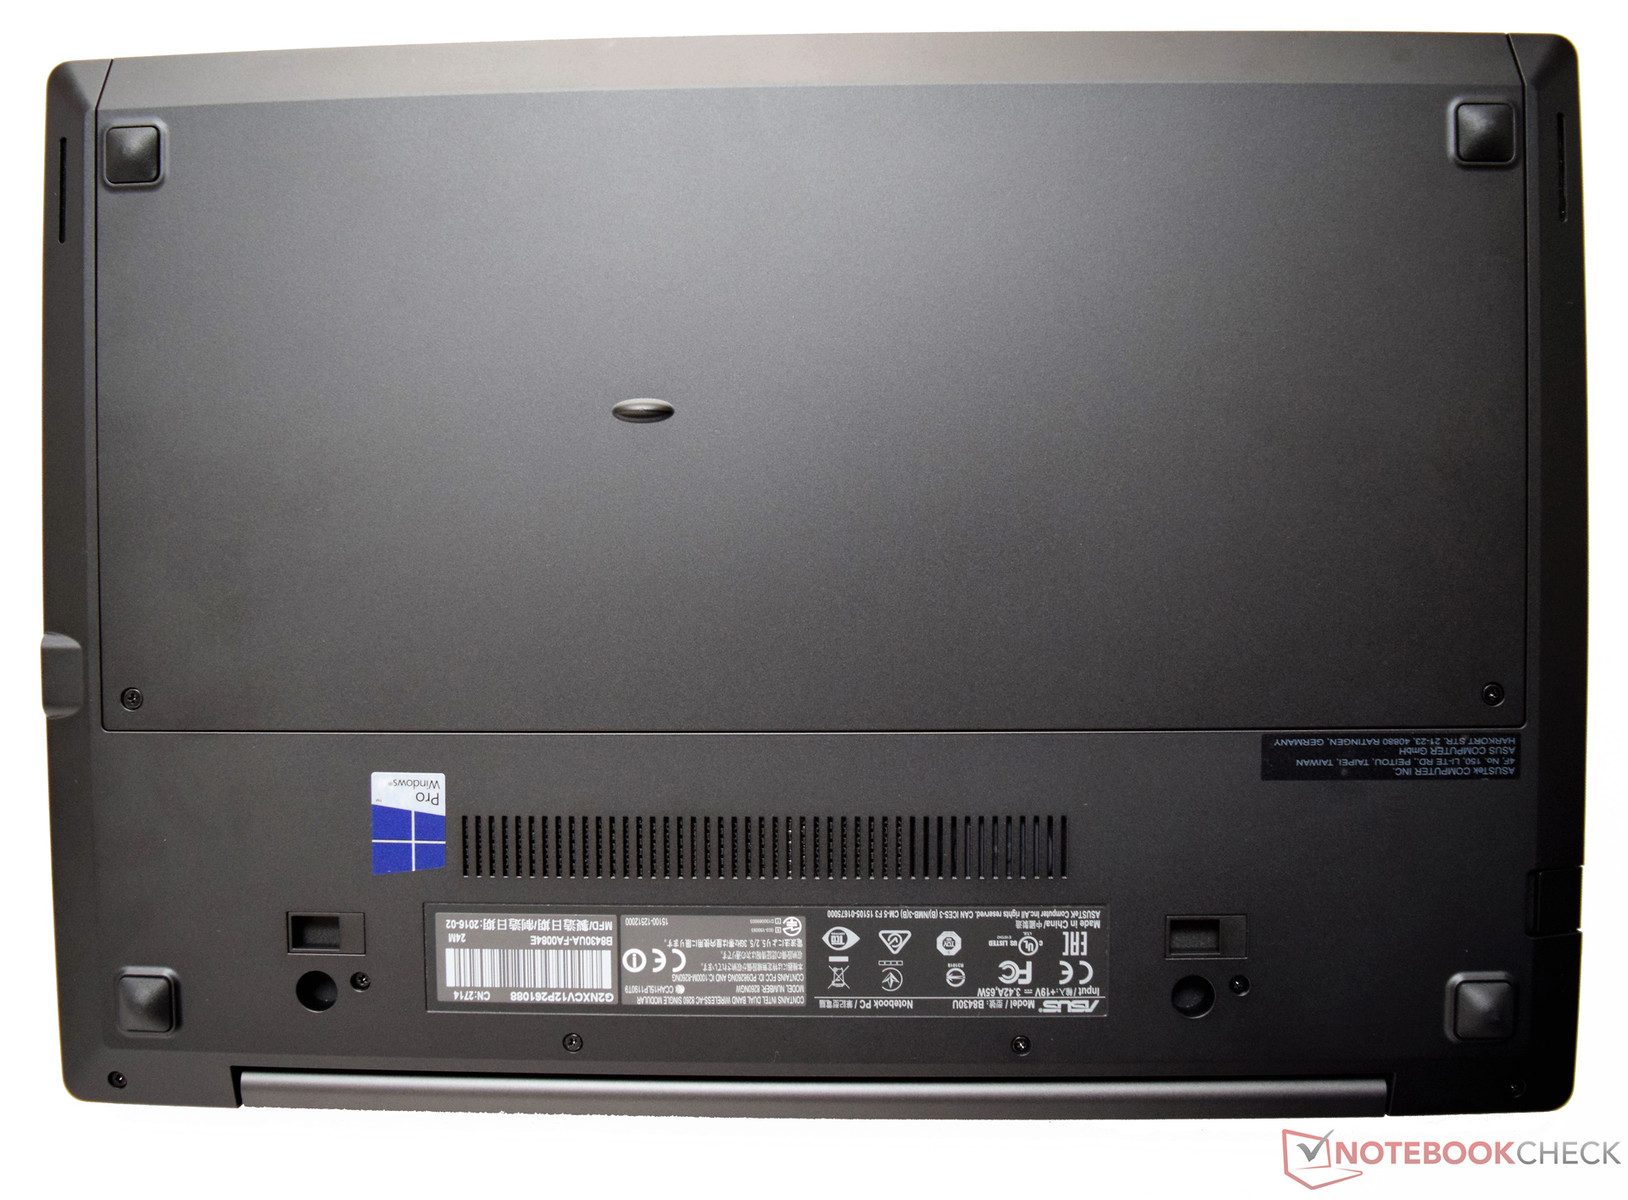
(±) La temperatura massima sul lato superiore è di 40.1 °C / 104 F, rispetto alla media di 34.3 °C / 94 F, che varia da 21.2 a 62.5 °C per questa classe Office.
(±) Il lato inferiore si riscalda fino ad un massimo di 41.8 °C / 107 F, rispetto alla media di 36.8 °C / 98 F
(+) In idle, la temperatura media del lato superiore è di 28.8 °C / 84 F, rispetto alla media deld ispositivo di 29.5 °C / 85 F.
(+) I poggiapolsi e il touchpad sono piu' freddi della temperatura della pelle con un massimo di 30.7 °C / 87.3 F e sono quindi freddi al tatto.
(-) La temperatura media della zona del palmo della mano di dispositivi simili e'stata di 27.6 °C / 81.7 F (-3.1 °C / -5.6 F).
| Asus ASUSPRO Advanced B8430UA-FA0084E HD Graphics 520, 6200U, Hynix HFS256G39MND | Asus ASUSPRO Advanced BU401LA-CZ020G HD Graphics 5000, 4650U, Liteonit LCS-256M6S | Lenovo ThinkPad L460-20FVS01400 Radeon R5 M330, 6500U, Toshiba HG6 THNSFJ256GCSU | Dell Latitude 14 E5470 HD Graphics 520, 6300U, Liteon L8H-256V2G | HP EliteBook 840 G3 T9X59ET#ABD HD Graphics 520, 6500U, Samsung SSD PM851 256 GB MZNTE256HMHP | Lenovo ThinkPad T460s-20F9003SGE HD Graphics 520, 6200U, Samsung CM871 MZ7LF192HCGS | Lenovo ThinkPad T460-20FN003LGE HD Graphics 520, 6200U, Toshiba HG6 THNSFJ256GCSU | |
|---|---|---|---|---|---|---|---|
| Power Consumption | 4% | -4% | 15% | 6% | 6% | 6% | |
| Idle Minimum * (Watt) | 4.2 | 4.1 2% | 3.1 26% | 3.5 17% | 3.8 10% | 3.7 12% | 3.5 17% |
| Idle Average * (Watt) | 6.5 | 7.1 -9% | 6.3 3% | 5.3 18% | 6.3 3% | 6.8 -5% | 6.7 -3% |
| Idle Maximum * (Watt) | 7.2 | 7.3 -1% | 7.9 -10% | 6 17% | 6.8 6% | 7.3 -1% | 7.3 -1% |
| Load Average * (Watt) | 29.2 | 28.9 1% | 29.5 -1% | 26.3 10% | 34.4 -18% | 26.3 10% | 28.2 3% |
| Load Maximum * (Watt) | 41 | 29.3 29% | 57.3 -40% | 36.6 11% | 28.3 31% | 34.6 16% | 34.6 16% |
* ... Meglio usare valori piccoli
| Off / Standby | |
| Idle | |
| Sotto carico |
|
Leggenda:
min: | |
| Asus ASUSPRO Advanced B8430UA-FA0084E 48 Wh | Asus ASUSPRO Advanced BU401LA-CZ020G 53 Wh | Lenovo ThinkPad L460-20FVS01400 48 Wh | Dell Latitude 14 E5470 62 Wh | HP EliteBook 840 G3 T9X59ET#ABD 46 Wh | Lenovo ThinkPad T460s-20F9003SGE 49 Wh | Lenovo ThinkPad T460-20FN003LGE 46 Wh | |
|---|---|---|---|---|---|---|---|
| Autonomia della batteria | -8% | 22% | 76% | 28% | 23% | 14% | |
| Reader / Idle (h) | 11.9 | 11.7 -2% | 19.2 61% | 21.7 82% | 17 43% | 15.3 29% | 15.9 34% |
| H.264 (h) | 5.6 | 4.9 -12% | 7.2 29% | 10.8 93% | 8.9 59% | 8.5 52% | |
| WiFi v1.3 (h) | 5.7 | 7.1 25% | 11.1 95% | 7.6 33% | 6.6 16% | 5.6 -2% | |
| Load (h) | 2.2 | 2 -9% | 1.6 -27% | 2.9 32% | 2.4 9% | 1.9 -14% | 1.6 -27% |
| WiFi (h) | 5.2 |
Pro
Contro
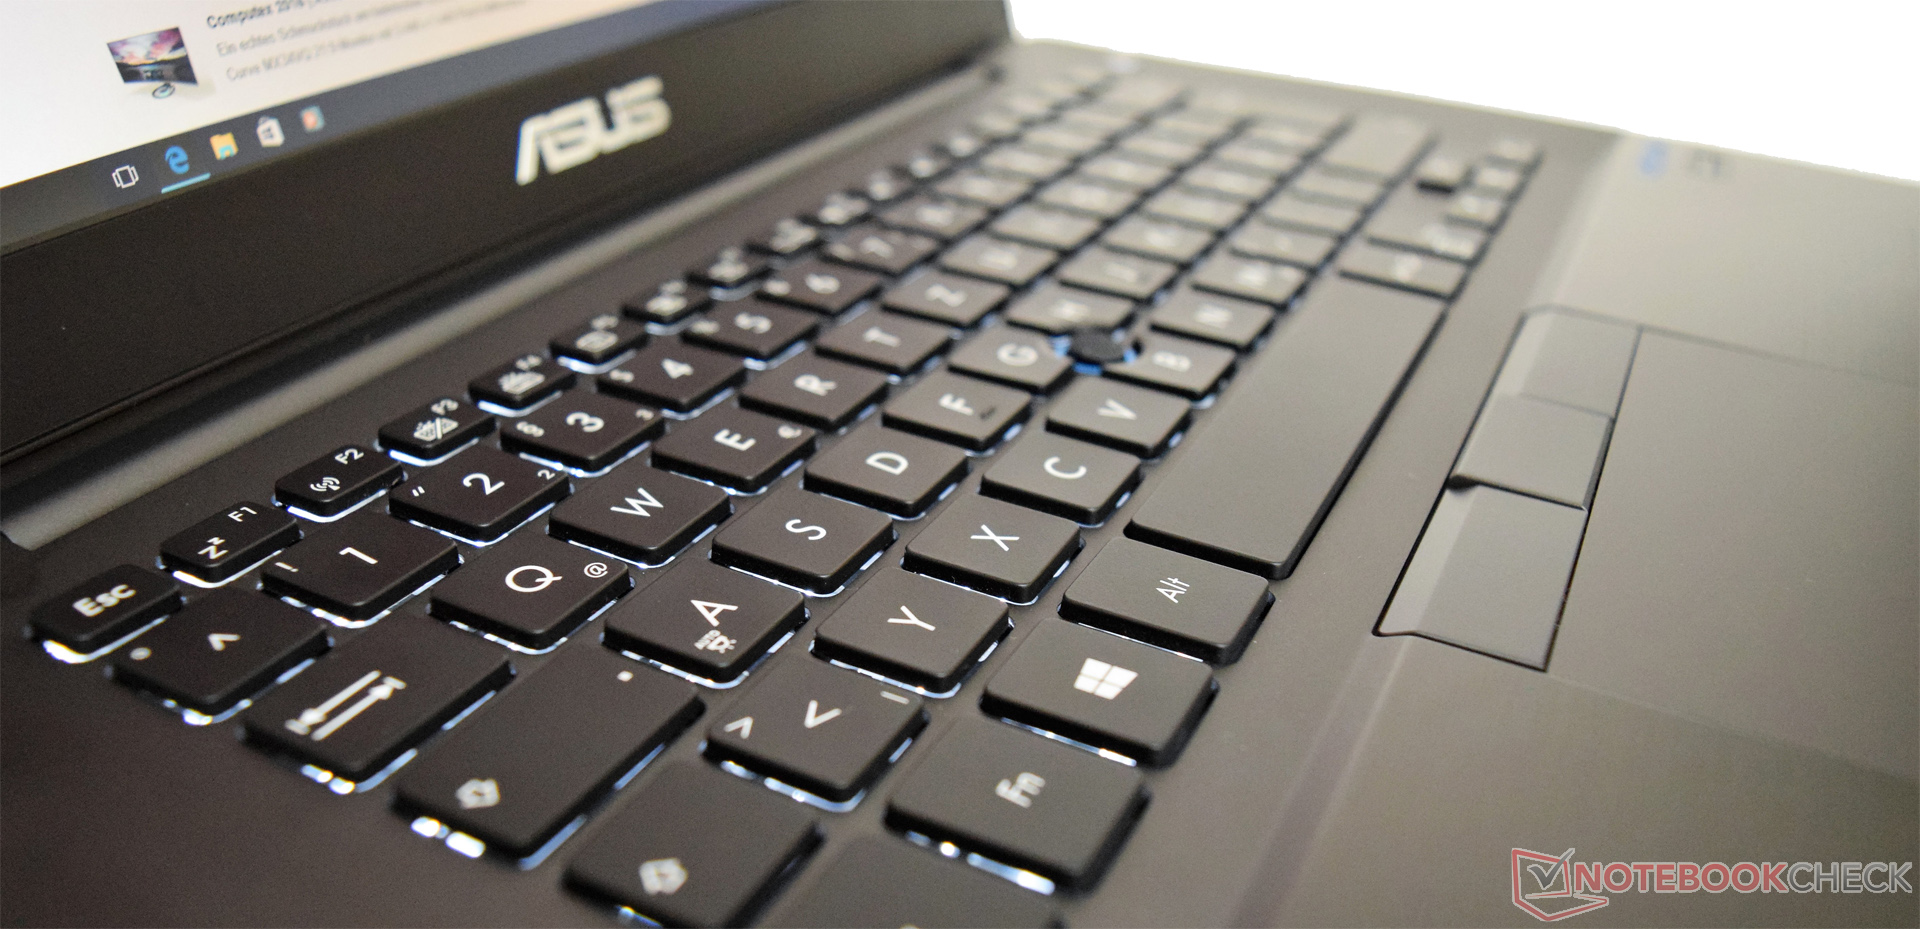
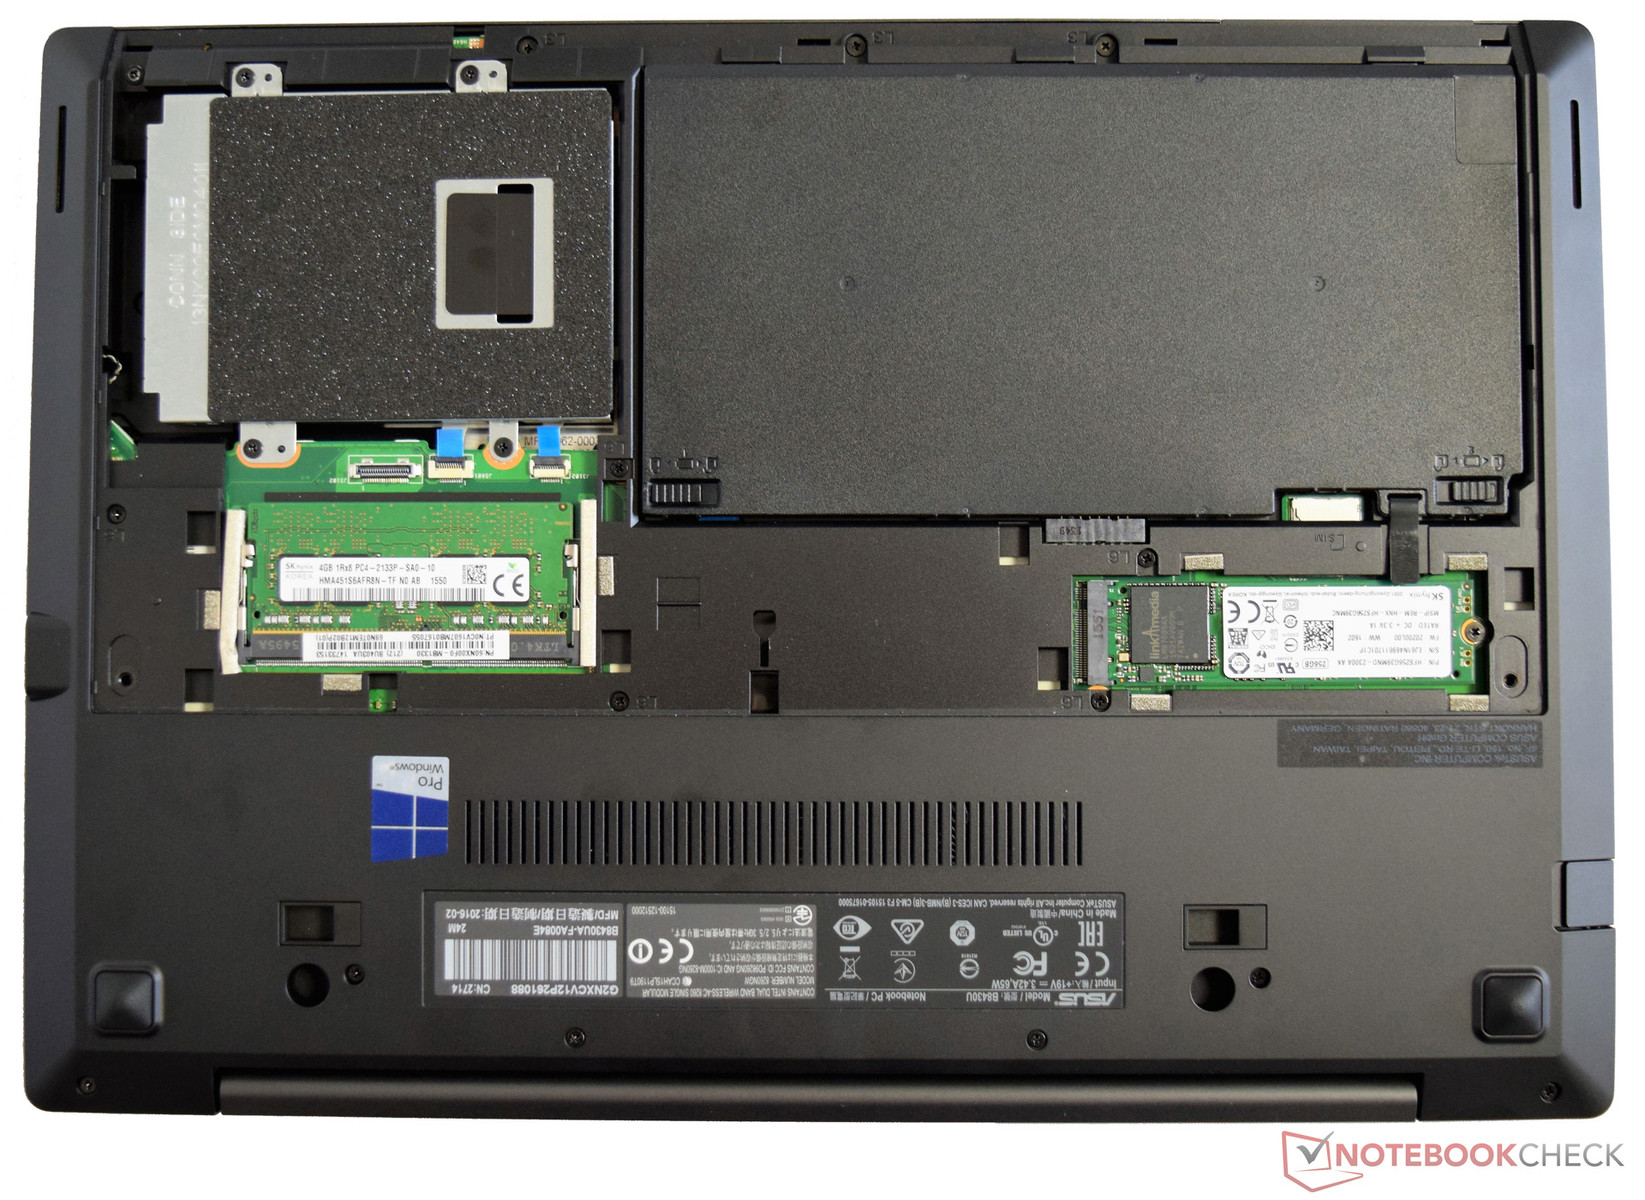
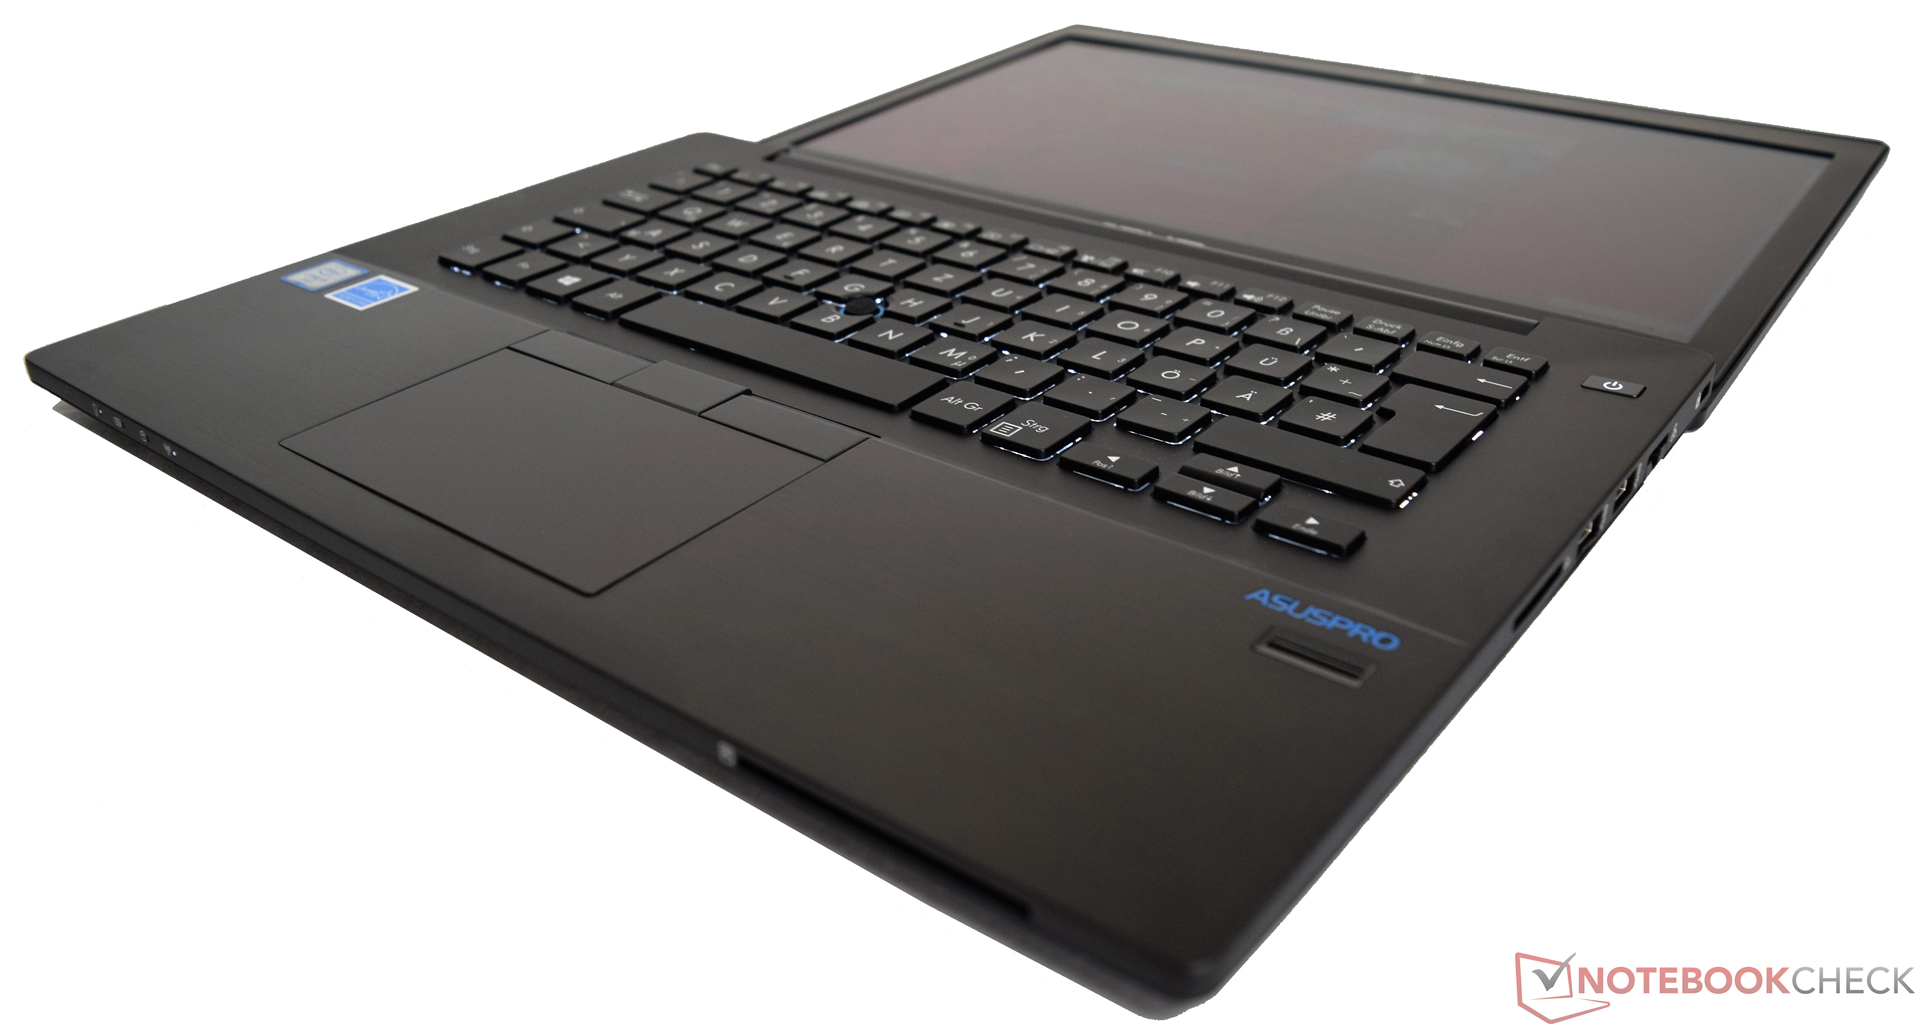
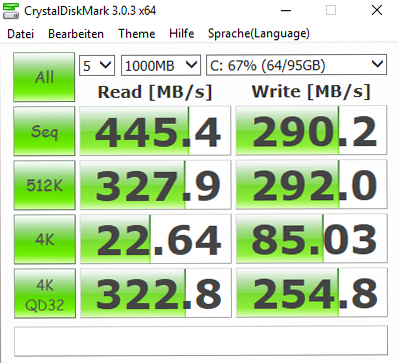
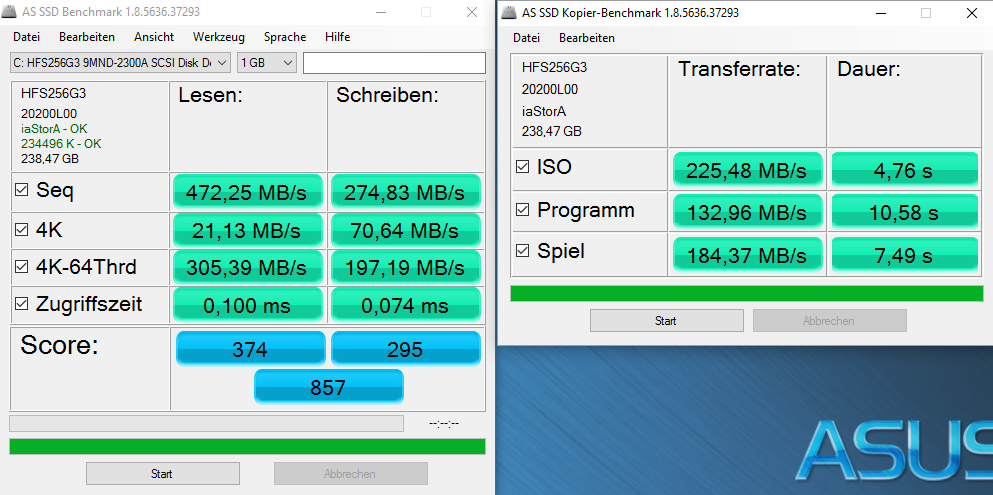
L'AsusPro Advanced B8430UA è un buono e resistente portatile bus.iness da 14". Grazie a moderni componenti, le prestazioni sono cresciute notevolmente rispetto al predecessore. Il peso contenuto garantisce una decente mobilità e il prezzo inferiore a 1000 Euro (~$1128) è sicuramente una tentazione. Le buone prestazioni di sistema sono un aspetto importante quando usate il dispositivo tutti i giorni, quindi l'SSD ha la sua importanza, in quanto aumenta in modo impressionante le performance.
Lo chassis robusto e sottile ospita una configurazione bilanciata di componenti - tutto ad un attraente prezzo inferiore ai 1.000 Euro (~$1128).
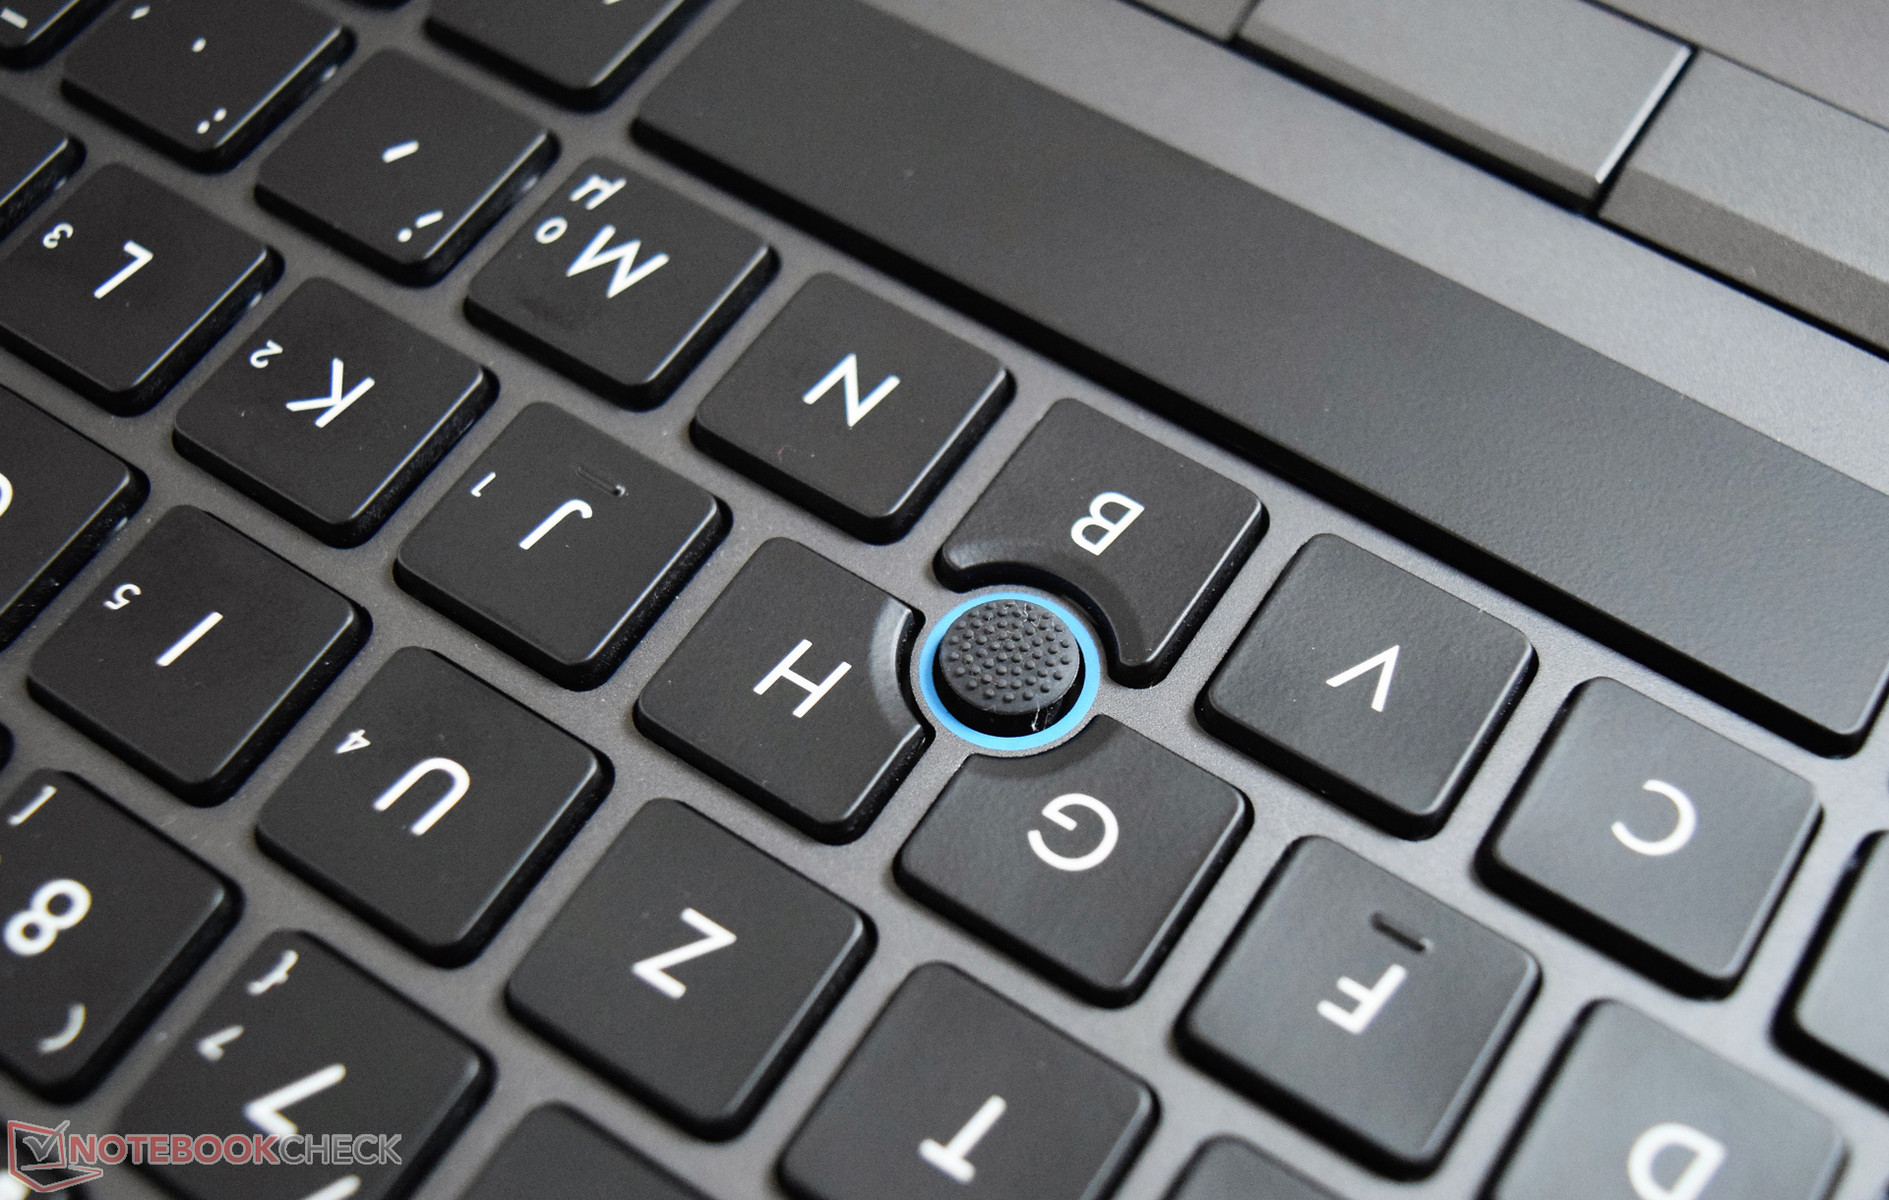
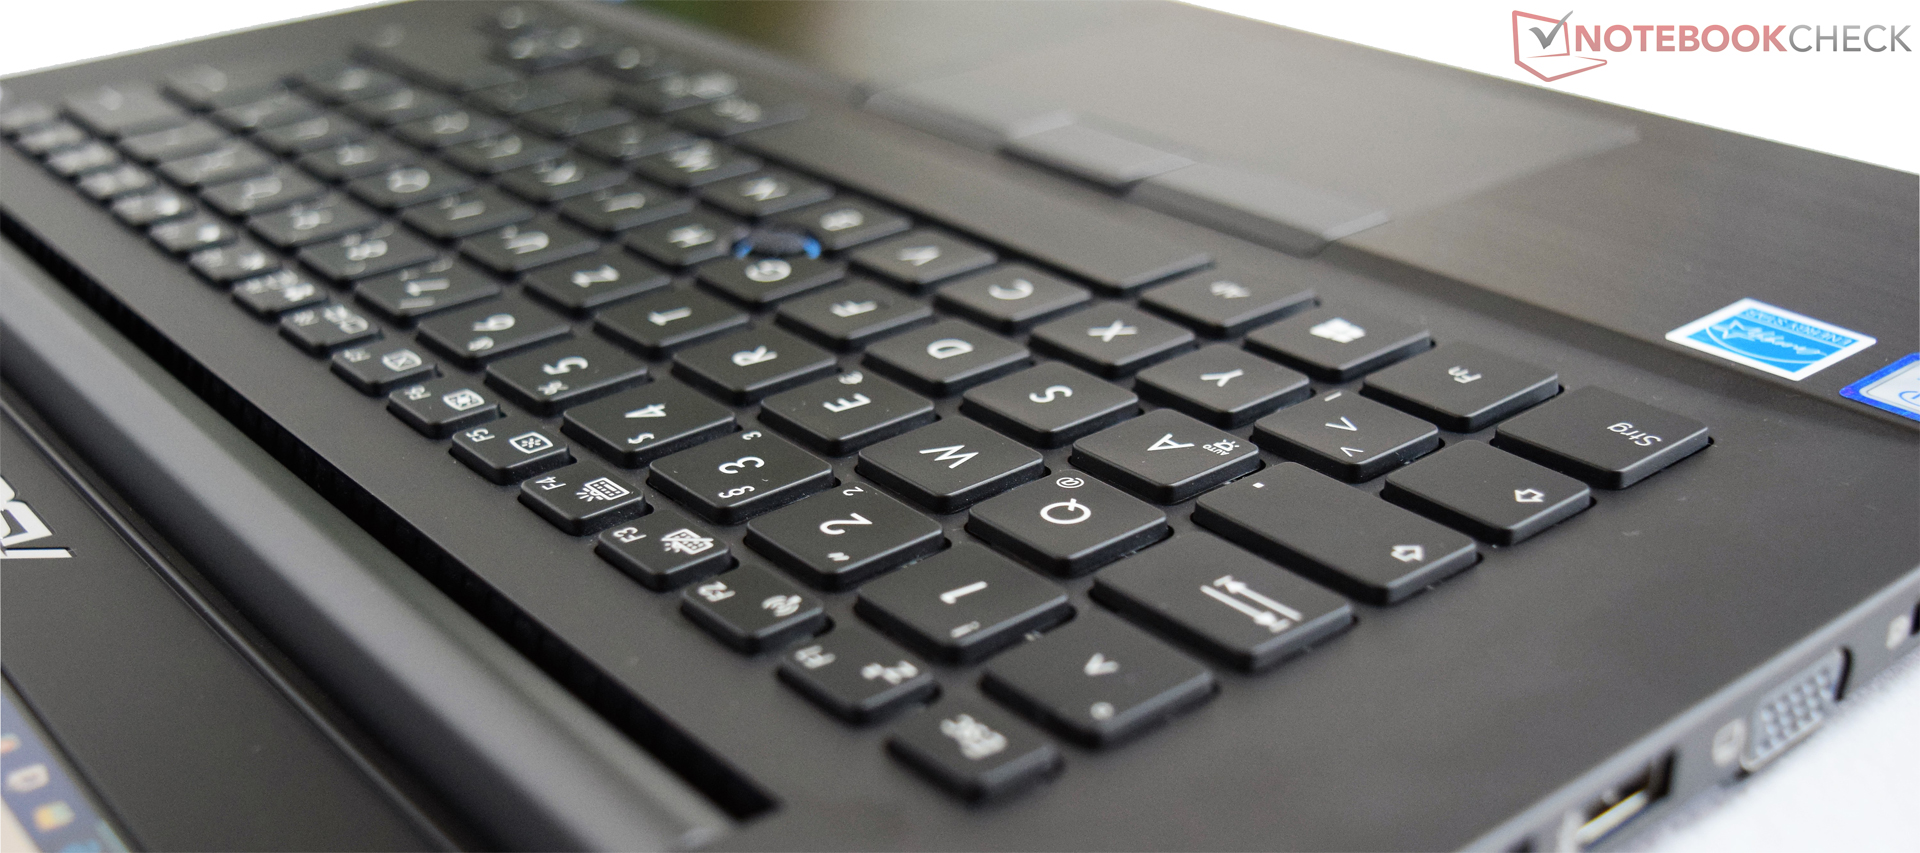
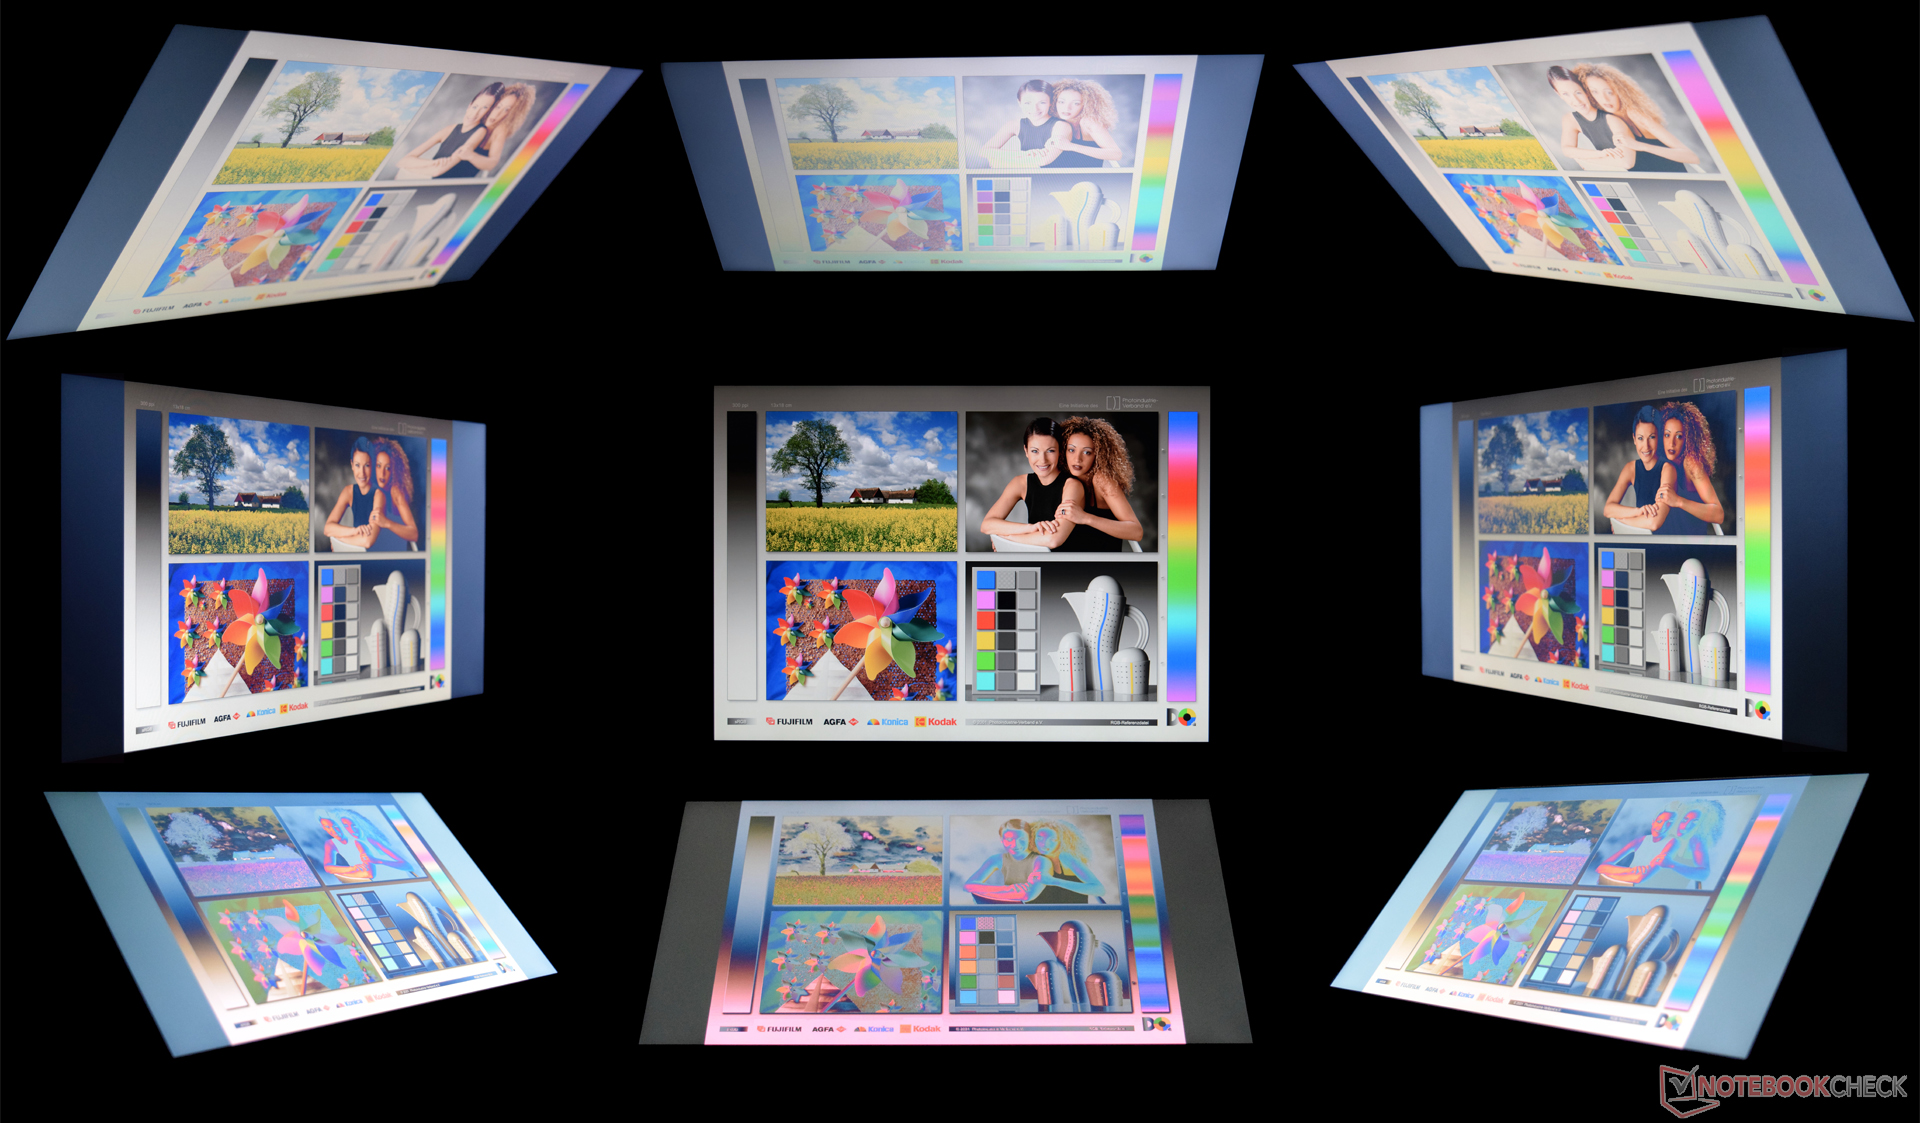
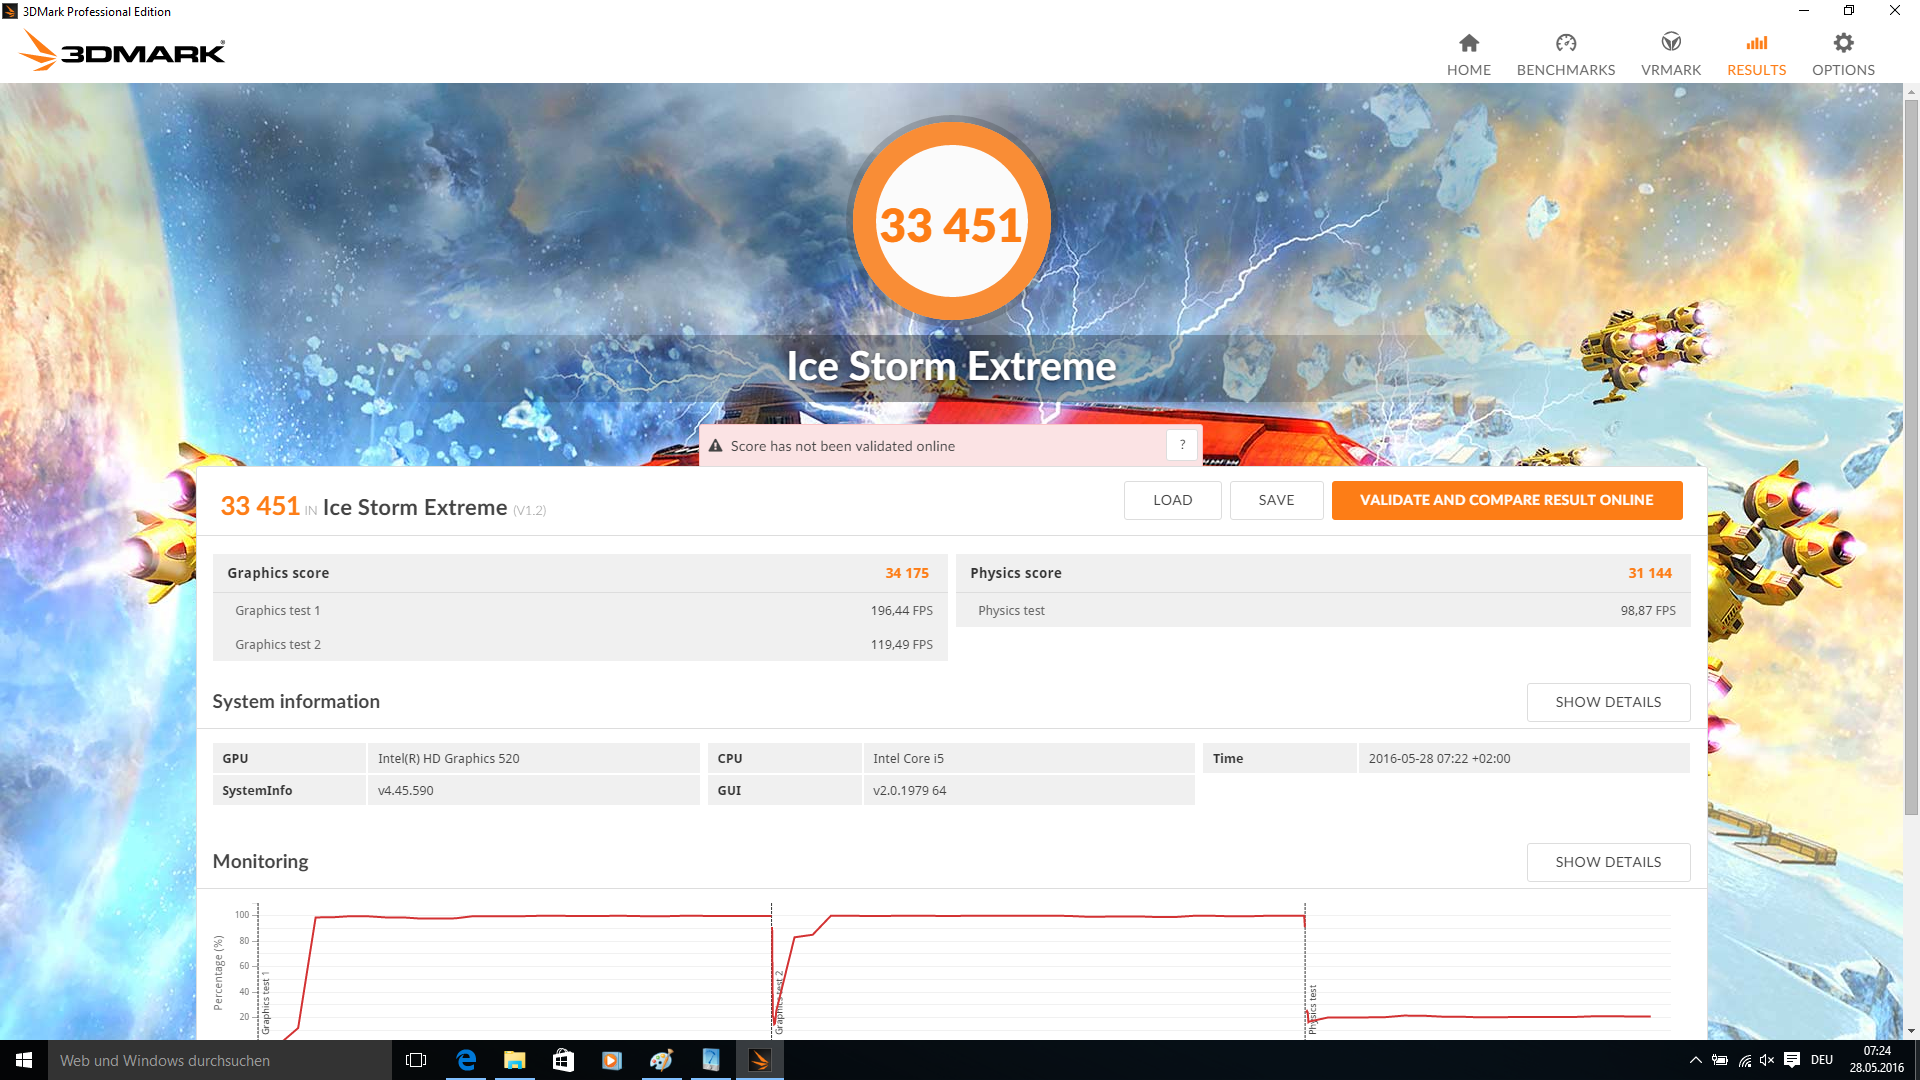
Siamo un po' delusi dal display, che ha angoli di visuale decenti nonostante la tecnologia TN, ma non soddisfa le attese in termini di luminosità. Le piccole casse stereo non ci convincono. Le prestazioni della nostra unità non sono sufficienti per i moderni giochi 3D, ma non importa considerando il target di clienti. Se non volete rinunciare al gaming, dovete scegliere un portatile con GPU dedicata. Abbiamo apprezzato i dispositivi di input, che sono importantissimi per un dispositivo da ufficio, oltre alla buona autonomia della batteria. L'AsusPro Advanced è un degno successore dell'AsusPro Advanced BU401LA.
Nota: si tratta di una recensione breve, con alcune sezioni non tradotte, per la versione integrale in inglese guardate qui.
Asus ASUSPRO Advanced B8430UA-FA0084E
- 07/03/2016 v5.1 (old)
Sebastian Bade
Price comparison
