Recensione breve del Portatile Schenker Technologies XMG P407 (Clevo P641HK1)
| SD Card Reader | |
| average JPG Copy Test (av. of 3 runs) | |
| Schenker XMG P406 | |
| Schenker XMG P407 | |
| MSI GL62M 7RD-077 | |
| maximum AS SSD Seq Read Test (1GB) | |
| Schenker XMG P407 | |
| Schenker XMG P406 | |
| MSI GL62M 7RD-077 | |
| Networking | |
| iperf3 transmit AX12 | |
| Razer Blade (2016) FHD | |
| Schenker XMG P407 | |
| MSI GL62M 7RD-077 (jseb) | |
| iperf3 receive AX12 | |
| Razer Blade (2016) FHD | |
| Schenker XMG P407 | |
| MSI GL62M 7RD-077 (jseb) | |
| |||||||||||||||||||||||||
Distribuzione della luminosità: 80 %
Al centro con la batteria: 298 cd/m²
Contrasto: 1104:1 (Nero: 0.27 cd/m²)
ΔE ColorChecker Calman: 4.42 | ∀{0.5-29.43 Ø4.71}
ΔE Greyscale Calman: 4.11 | ∀{0.09-98 Ø4.96}
82% sRGB (Argyll 1.6.3 3D)
54% AdobeRGB 1998 (Argyll 1.6.3 3D)
60% AdobeRGB 1998 (Argyll 3D)
82.1% sRGB (Argyll 3D)
64.5% Display P3 (Argyll 3D)
Gamma: 2.5
CCT: 6329 K
| Schenker XMG P407 LG Philips LP140WF3-SPD1 (LGD046D), 1920x1080, 14" | Schenker XMG P406 LG Philips 140WF1 (LGD040A), 1920x1080, 14" | Razer Blade (2016) FHD LG Philips LP140WF3-SPD1 (LGD046D), 1920x1080, 14" | Gigabyte P34W v5 2560x1440, 14" | MSI GL62M 7RD-077 Chi Mei N156HGE-EAL, 1920x1080, 15.6" | |
|---|---|---|---|---|---|
| Display | 2% | 1% | -13% | 31% | |
| Display P3 Coverage (%) | 64.5 | 66.2 3% | 65.2 1% | 51.4 -20% | 85.4 32% |
| sRGB Coverage (%) | 82.1 | 82.8 1% | 83.4 2% | 76.6 -7% | 100 22% |
| AdobeRGB 1998 Coverage (%) | 60 | 60.5 1% | 60.9 1% | 52.8 -12% | 83.8 40% |
| Response Times | -15% | 2% | 9% | -1% | |
| Response Time Grey 50% / Grey 80% * (ms) | 47 ? | 56 ? -19% | 47 ? -0% | 41.2 ? 12% | 44 ? 6% |
| Response Time Black / White * (ms) | 27 ? | 30 ? -11% | 26 ? 4% | 25.4 ? 6% | 29 ? -7% |
| PWM Frequency (Hz) | 198 ? | ||||
| Screen | -1% | -1% | 3% | -50% | |
| Brightness middle (cd/m²) | 298 | 282 -5% | 272 -9% | 277.8 -7% | 258 -13% |
| Brightness (cd/m²) | 282 | 266 -6% | 277 -2% | 270 -4% | 234 -17% |
| Brightness Distribution (%) | 80 | 81 1% | 84 5% | 83 4% | 79 -1% |
| Black Level * (cd/m²) | 0.27 | 0.22 19% | 0.26 4% | 0.38 -41% | 0.54 -100% |
| Contrast (:1) | 1104 | 1282 16% | 1046 -5% | 731 -34% | 478 -57% |
| Colorchecker dE 2000 * | 4.42 | 4.98 -13% | 4.59 -4% | 2.71 39% | 9.74 -120% |
| Colorchecker dE 2000 max. * | 8.57 | 10.2 -19% | 8.49 1% | 5.47 36% | 14.6 -70% |
| Greyscale dE 2000 * | 4.11 | 4.08 1% | 4.28 -4% | 2.11 49% | 11.59 -182% |
| Gamma | 2.5 88% | 2.51 88% | 2.23 99% | 2.19 100% | 2.19 100% |
| CCT | 6329 103% | 5877 111% | 6848 95% | 6314 103% | 11851 55% |
| Color Space (Percent of AdobeRGB 1998) (%) | 54 | 54 0% | 55 2% | 48.5 -10% | 76 41% |
| Color Space (Percent of sRGB) (%) | 82 | 83 1% | 83 1% | 76.9 -6% | 100 22% |
| Media totale (Programma / Settaggio) | -5% /
-2% | 1% /
-0% | -0% /
0% | -7% /
-27% |
* ... Meglio usare valori piccoli
Sfarfallio dello schermo / PWM (Pulse-Width Modulation)
| flickering dello schermo / PWM non rilevato | 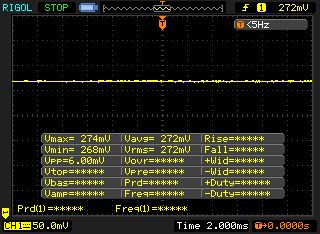 | ||
In confronto: 52 % di tutti i dispositivi testati non utilizza PWM per ridurre la luminosita' del display. Se è rilevato PWM, una media di 7754 (minimo: 5 - massimo: 343500) Hz è stata rilevata. | |||
Tempi di risposta del Display
| ↔ Tempi di risposta dal Nero al Bianco | ||
|---|---|---|
| 27 ms ... aumenta ↗ e diminuisce ↘ combinato | ↗ 5 ms Incremento | 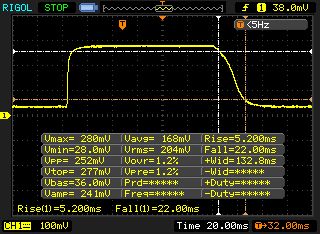 |
| ↘ 22 ms Calo | ||
| Lo schermo mostra tempi di risposta relativamente lenti nei nostri tests e potrebbe essere troppo lento per i gamers. In confronto, tutti i dispositivi di test variano da 0.1 (minimo) a 240 (massimo) ms. » 67 % di tutti i dispositivi è migliore. Questo significa che i tempi di risposta rilevati sono peggiori rispetto alla media di tutti i dispositivi testati (19.8 ms). | ||
| ↔ Tempo di risposta dal 50% Grigio all'80% Grigio | ||
| 47 ms ... aumenta ↗ e diminuisce ↘ combinato | ↗ 14 ms Incremento | 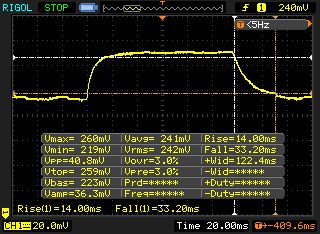 |
| ↘ 33 ms Calo | ||
| Lo schermo mostra tempi di risposta lenti nei nostri tests e sarà insoddisfacente per i gamers. In confronto, tutti i dispositivi di test variano da 0.165 (minimo) a 636 (massimo) ms. » 81 % di tutti i dispositivi è migliore. Questo significa che i tempi di risposta rilevati sono peggiori rispetto alla media di tutti i dispositivi testati (31 ms). | ||
| Cinebench R15 | |
| CPU Single 64Bit | |
| Razer Blade (2016) FHD | |
| Schenker XMG P407 | |
| MSI GL62M 7RD-077 | |
| Schenker XMG P406 | |
| Gigabyte P34W v5 | |
| CPU Multi 64Bit | |
| Schenker XMG P407 | |
| MSI GL62M 7RD-077 | |
| Gigabyte P34W v5 | |
| Schenker XMG P406 | |
| Razer Blade (2016) FHD | |
| Cinebench R11.5 | |
| CPU Multi 64Bit | |
| MSI GL62M 7RD-077 | |
| Schenker XMG P407 | |
| Gigabyte P34W v5 | |
| Razer Blade (2016) FHD | |
| Schenker XMG P406 | |
| CPU Single 64Bit | |
| Razer Blade (2016) FHD | |
| Schenker XMG P407 | |
| Gigabyte P34W v5 | |
| MSI GL62M 7RD-077 | |
| Schenker XMG P406 | |
| Cinebench R10 | |
| Rendering Multiple CPUs 32Bit | |
| Schenker XMG P407 | |
| MSI GL62M 7RD-077 | |
| Razer Blade (2016) FHD | |
| Schenker XMG P406 | |
| Gigabyte P34W v5 | |
| Rendering Single 32Bit | |
| Schenker XMG P407 | |
| MSI GL62M 7RD-077 | |
| Razer Blade (2016) FHD | |
| Gigabyte P34W v5 | |
| Schenker XMG P406 | |
| Geekbench 3 | |
| 32 Bit Single-Core Score | |
| Schenker XMG P407 | |
| Razer Blade (2016) FHD | |
| MSI GL62M 7RD-077 | |
| 32 Bit Multi-Core Score | |
| Schenker XMG P407 | |
| MSI GL62M 7RD-077 | |
| Razer Blade (2016) FHD | |
| Geekbench 4.0 | |
| 64 Bit Single-Core Score | |
| Razer Blade (2016) FHD | |
| Schenker XMG P407 | |
| MSI GL62M 7RD-077 | |
| 64 Bit Multi-Core Score | |
| Schenker XMG P407 | |
| Razer Blade (2016) FHD | |
| MSI GL62M 7RD-077 | |
| JetStream 1.1 - 1.1 Total | |
| MSI GL62M 7RD-077 | |
| Razer Blade (2016) FHD | |
| Schenker XMG P407 | |
| PCMark 7 Score | 6266 punti | |
| PCMark 8 Home Score Accelerated v2 | 4069 punti | |
| PCMark 8 Creative Score Accelerated v2 | 5146 punti | |
| PCMark 8 Work Score Accelerated v2 | 5234 punti | |
Aiuto | ||
| PCMark 8 | |
| Home Score Accelerated v2 | |
| Schenker XMG P407 | |
| Razer Blade (2016) FHD | |
| MSI GL62M 7RD-077 | |
| Gigabyte P34W v5 | |
| Schenker XMG P406 | |
| Work Score Accelerated v2 | |
| Schenker XMG P407 | |
| Schenker XMG P406 | |
| Razer Blade (2016) FHD | |
| MSI GL62M 7RD-077 | |
| Gigabyte P34W v5 | |
| PCMark 7 - Score | |
| Schenker XMG P407 | |
| Gigabyte P34W v5 | |
| Schenker XMG P406 | |
| Razer Blade (2016) FHD | |
| MSI GL62M 7RD-077 | |

| Schenker XMG P407 Samsung SM961 MZVPW256 m.2 PCI-e | Schenker XMG P406 Samsung SM951 MZHPV256HDGL m.2 PCI-e | Razer Blade (2016) FHD | Gigabyte P34W v5 Samsung SSD 950 Pro 512GB m.2 NVMe | MSI GL62M 7RD-077 HGST Travelstar 7K1000 HTS721010A9E630 | |
|---|---|---|---|---|---|
| CrystalDiskMark 3.0 | 14% | 20% | 31% | -96% | |
| Read Seq (MB/s) | 1345 | 1634 21% | 1977 47% | 2269 69% | 112.4 -92% |
| Write Seq (MB/s) | 1502 | 1290 -14% | 1668 11% | 1524 1% | 107.3 -93% |
| Read 512 (MB/s) | 320.3 | 1149 259% | 800 150% | 937 193% | 43.19 -87% |
| Write 512 (MB/s) | 1276 | 1285 1% | 1030 -19% | 1483 16% | 57 -96% |
| Read 4k (MB/s) | 58.9 | 43.82 -26% | 58.1 -1% | 53.8 -9% | 0.494 -99% |
| Write 4k (MB/s) | 171 | 110.3 -35% | 145.6 -15% | 167.3 -2% | 1.122 -99% |
| Read 4k QD32 (MB/s) | 625 | 320.5 -49% | 592 -5% | 622 0% | 1.088 -100% |
| Write 4k QD32 (MB/s) | 539 | 287.3 -47% | 508 -6% | 418.9 -22% | 1.234 -100% |
| 3DMark 06 Standard Score | 26084 punti | |
| 3DMark 11 Performance | 9921 punti | |
| 3DMark Ice Storm Standard Score | 83626 punti | |
| 3DMark Cloud Gate Standard Score | 22393 punti | |
| 3DMark Fire Strike Score | 7194 punti | |
| 3DMark Fire Strike Extreme Score | 3766 punti | |
| 3DMark Time Spy Score | 2659 punti | |
Aiuto | ||
| 3DMark | |
| 1280x720 Cloud Gate Standard Graphics | |
| Asus Strix GL502VM-FY039T | |
| Razer Blade (2016) FHD | |
| Schenker XMG P407 | |
| Schenker XMG P406 | |
| Gigabyte P34W v5 | |
| Dell Inspiron 15 7000 7567 | |
| MSI GL62M 7RD-077 | |
| 1920x1080 Fire Strike Graphics | |
| Asus Strix GL502VM-FY039T | |
| Razer Blade (2016) FHD | |
| Schenker XMG P407 | |
| Dell Inspiron 15 7000 7567 | |
| Gigabyte P34W v5 | |
| Schenker XMG P406 | |
| MSI GL62M 7RD-077 | |
| 3DMark 11 - 1280x720 Performance GPU | |
| Asus Strix GL502VM-FY039T | |
| Razer Blade (2016) FHD | |
| Schenker XMG P407 | |
| Dell Inspiron 15 7000 7567 | |
| Gigabyte P34W v5 | |
| Schenker XMG P406 | |
| MSI GL62M 7RD-077 | |
| basso | medio | alto | ultra | |
|---|---|---|---|---|
| Tomb Raider (2013) | 360.1 | 258.1 | 199.2 | 98.9 |
| BioShock Infinite (2013) | 168.9 | 159.2 | 152.2 | 76.4 |
| Battlefield 4 (2013) | 178.6 | 174.9 | 145.7 | 71 |
| Ashes of the Singularity (2016) | 63.2 | 45.6 | 40.4 | |
| Deus Ex Mankind Divided (2016) | 99 | 74.7 | 39.8 | 20.3 |
| Battlefield 1 (2016) | 142.1 | 122.1 | 62.4 | 56.3 |
| Civilization 6 (2016) | 70.2 | 50.1 | 41.8 | 42.4 |
| Titanfall 2 (2016) | 143.7 | 136.5 | 68.5 | 58.6 |
| BioShock Infinite - 1920x1080 Ultra Preset, DX11 (DDOF) | |
| Asus Strix GL502VM-FY039T | |
| Razer Blade (2016) FHD | |
| Schenker XMG P407 | |
| Dell Inspiron 15 7000 7567 | |
| Gigabyte P34W v5 | |
| MSI GL62M 7RD-077 | |
| Tomb Raider - 1920x1080 Ultra Preset AA:FX AF:16x | |
| Asus Strix GL502VM-FY039T | |
| Razer Blade (2016) FHD | |
| Schenker XMG P407 | |
| Gigabyte P34W v5 | |
| MSI GL62M 7RD-077 | |
| Battlefield 4 - 1920x1080 Ultra Preset AA:4x MS | |
| Asus Strix GL502VM-FY039T | |
| Razer Blade (2016) FHD | |
| Schenker XMG P407 | |
| Schenker XMG P406 | |
| MSI GL62M 7RD-077 | |
| Battlefield 1 - 1920x1080 Ultra Preset AA:T | |
| Schenker XMG P407 | |
| Dell Inspiron 15 7000 7567 | |
| MSI GL62M 7RD-077 | |
| Ashes of the Singularity - 1920x1080 high | |
| Asus Strix GL502VM-FY039T | |
| Razer Blade (2016) FHD | |
| Schenker XMG P407 | |
| MSI GL62M 7RD-077 | |
| Titanfall 2 - 1920x1080 Very High (Insane Texture Quality) / Enabled AA:TS AF:16x | |
| Asus Strix GL502VM-FY039T | |
| Dell Inspiron 15 7000 7567 | |
| Schenker XMG P407 | |
| MSI GL62M 7RD-077 | |
| Civilization 6 - 1920x1080 Ultra Preset AA:4xMS | |
| Schenker XMG P407 | |
| MSI GL62M 7RD-077 | |
| Deus Ex Mankind Divided - 1920x1080 High Preset AF:4x | |
| Razer Blade (2016) FHD | |
| Schenker XMG P407 | |
| MSI GL62M 7RD-077 | |
Rumorosità
| Idle |
| 31 / 32 / 36 dB(A) |
| HDD |
| 32 dB(A) |
| Sotto carico |
| 43 / 48 dB(A) |
 | ||
30 dB silenzioso 40 dB(A) udibile 50 dB(A) rumoroso |
||
min: | ||
| Schenker XMG P407 i7-7700HQ, GeForce GTX 1050 Ti Mobile | Schenker XMG P406 6700HQ, GeForce GTX 970M | Razer Blade (2016) FHD 6700HQ, GeForce GTX 1060 Mobile | Gigabyte P34W v5 6700HQ, GeForce GTX 970M | MSI GL62M 7RD-077 i7-7700HQ, GeForce GTX 1050 Mobile | |
|---|---|---|---|---|---|
| Noise | -5% | -9% | -2% | 1% | |
| off /ambiente * (dB) | 29 | 31 -7% | 30.6 -6% | ||
| Idle Minimum * (dB) | 31 | 30 3% | 35 -13% | 31.6 -2% | 32.5 -5% |
| Idle Average * (dB) | 32 | 32 -0% | 36 -13% | 31.6 1% | 32.5 -2% |
| Idle Maximum * (dB) | 36 | 40 -11% | 37 -3% | 32.5 10% | 32.5 10% |
| Load Average * (dB) | 43 | 47 -9% | 43 -0% | 46.5 -8% | 36.4 15% |
| Load Maximum * (dB) | 48 | 51 -6% | 57 -19% | 52.5 -9% | 52.4 -9% |
* ... Meglio usare valori piccoli
(-) La temperatura massima sul lato superiore è di 49 °C / 120 F, rispetto alla media di 40.4 °C / 105 F, che varia da 21.2 a 68.8 °C per questa classe Gaming.
(-) Il lato inferiore si riscalda fino ad un massimo di 50.8 °C / 123 F, rispetto alla media di 43.2 °C / 110 F
(+) In idle, la temperatura media del lato superiore è di 23.5 °C / 74 F, rispetto alla media deld ispositivo di 33.9 °C / 93 F.
(±) I poggiapolsi e il touchpad possono diventare molto caldi al tatto con un massimo di 36.4 °C / 97.5 F.
(-) La temperatura media della zona del palmo della mano di dispositivi simili e'stata di 28.8 °C / 83.8 F (-7.6 °C / -13.7 F).
| Schenker XMG P407 i7-7700HQ, GeForce GTX 1050 Ti Mobile | Schenker XMG P406 6700HQ, GeForce GTX 970M | Razer Blade (2016) FHD 6700HQ, GeForce GTX 1060 Mobile | Gigabyte P34W v5 6700HQ, GeForce GTX 970M | MSI GL62M 7RD-077 i7-7700HQ, GeForce GTX 1050 Mobile | |
|---|---|---|---|---|---|
| Heat | -35% | -6% | -18% | 2% | |
| Maximum Upper Side * (°C) | 49 | 55 -12% | 54 -10% | 59.3 -21% | 44.9 8% |
| Maximum Bottom * (°C) | 50.8 | 58.7 -16% | 49.4 3% | 56.5 -11% | 38.2 25% |
| Idle Upper Side * (°C) | 26.3 | 36.9 -40% | 28 -6% | 27.8 -6% | 27.4 -4% |
| Idle Bottom * (°C) | 24.1 | 41.7 -73% | 26.8 -11% | 31.8 -32% | 29 -20% |
* ... Meglio usare valori piccoli
Speakers
Schenker XMG P407 analisi audio
(±) | potenza degli altiparlanti media ma buona (78 dB)
Bassi 100 - 315 Hz
(-) | quasi nessun basso - in media 19.2% inferiori alla media
(±) | la linearità dei bassi è media (11% delta rispetto alla precedente frequenza)
Medi 400 - 2000 Hz
(+) | medi bilanciati - solo only 4.4% rispetto alla media
(±) | linearità dei medi adeguata (9.6% delta rispetto alla precedente frequenza)
Alti 2 - 16 kHz
(+) | Alti bilanciati - appena 3.7% dalla media
(+) | alti lineari (5.5% delta rispetto alla precedente frequenza)
Nel complesso 100 - 16.000 Hz
(±) | la linearità complessiva del suono è media (20.5% di differenza rispetto alla media
Rispetto alla stessa classe
» 73% di tutti i dispositivi testati in questa classe è stato migliore, 5% simile, 22% peggiore
» Il migliore ha avuto un delta di 6%, medio di 18%, peggiore di 132%
Rispetto a tutti i dispositivi testati
» 54% di tutti i dispositivi testati in questa classe è stato migliore, 8% similare, 38% peggiore
» Il migliore ha avuto un delta di 4%, medio di 23%, peggiore di 134%
Razer Blade (2016) FHD analisi audio
(±) | potenza degli altiparlanti media ma buona (79 dB)
Bassi 100 - 315 Hz
(±) | bassi ridotti - in media 10.6% inferiori alla media
(±) | la linearità dei bassi è media (12.4% delta rispetto alla precedente frequenza)
Medi 400 - 2000 Hz
(+) | medi bilanciati - solo only 4.3% rispetto alla media
(+) | medi lineari (3.9% delta rispetto alla precedente frequenza)
Alti 2 - 16 kHz
(+) | Alti bilanciati - appena 3.4% dalla media
(+) | alti lineari (5.7% delta rispetto alla precedente frequenza)
Nel complesso 100 - 16.000 Hz
(±) | la linearità complessiva del suono è media (17.3% di differenza rispetto alla media
Rispetto alla stessa classe
» 47% di tutti i dispositivi testati in questa classe è stato migliore, 12% simile, 41% peggiore
» Il migliore ha avuto un delta di 6%, medio di 18%, peggiore di 132%
Rispetto a tutti i dispositivi testati
» 33% di tutti i dispositivi testati in questa classe è stato migliore, 8% similare, 59% peggiore
» Il migliore ha avuto un delta di 4%, medio di 23%, peggiore di 134%
| Off / Standby | |
| Idle | |
| Sotto carico |
|
Leggenda:
min: | |
| Schenker XMG P407 i7-7700HQ, GeForce GTX 1050 Ti Mobile | Schenker XMG P406 6700HQ, GeForce GTX 970M | Razer Blade (2016) FHD 6700HQ, GeForce GTX 1060 Mobile | MSI GL62M 7RD-077 i7-7700HQ, GeForce GTX 1050 Mobile | |
|---|---|---|---|---|
| Power Consumption | -13% | -10% | 3% | |
| Idle Minimum * (Watt) | 10 | 12 -20% | 14 -40% | 10.6 -6% |
| Idle Average * (Watt) | 15 | 16 -7% | 18 -20% | 14.5 3% |
| Idle Maximum * (Watt) | 24 | 22 8% | 21 12% | 15 37% |
| Load Average * (Watt) | 82 | 90 -10% | 70 15% | 90 -10% |
| Load Maximum * (Watt) | 124 | 170 -37% | 146 -18% | 135 -9% |
* ... Meglio usare valori piccoli
| Schenker XMG P407 i7-7700HQ, GeForce GTX 1050 Ti Mobile, 45 Wh | Schenker XMG P406 6700HQ, GeForce GTX 970M, 45 Wh | Razer Blade (2016) FHD 6700HQ, GeForce GTX 1060 Mobile, 70 Wh | Gigabyte P34W v5 6700HQ, GeForce GTX 970M, 61 Wh | MSI GL62M 7RD-077 i7-7700HQ, GeForce GTX 1050 Mobile, 41 Wh | |
|---|---|---|---|---|---|
| Autonomia della batteria | -25% | 40% | -20% | -18% | |
| Reader / Idle (h) | 7.4 | 4.6 -38% | 12.7 72% | 6.5 -12% | 6.5 -12% |
| H.264 (h) | 3.6 | 5.2 44% | 3.6 0% | ||
| WiFi v1.3 (h) | 4 | 3.3 -17% | 7.1 78% | 3.9 -2% | 3.8 -5% |
| Load (h) | 1.5 | 1.2 -20% | 1 -33% | 0.8 -47% | 0.7 -53% |
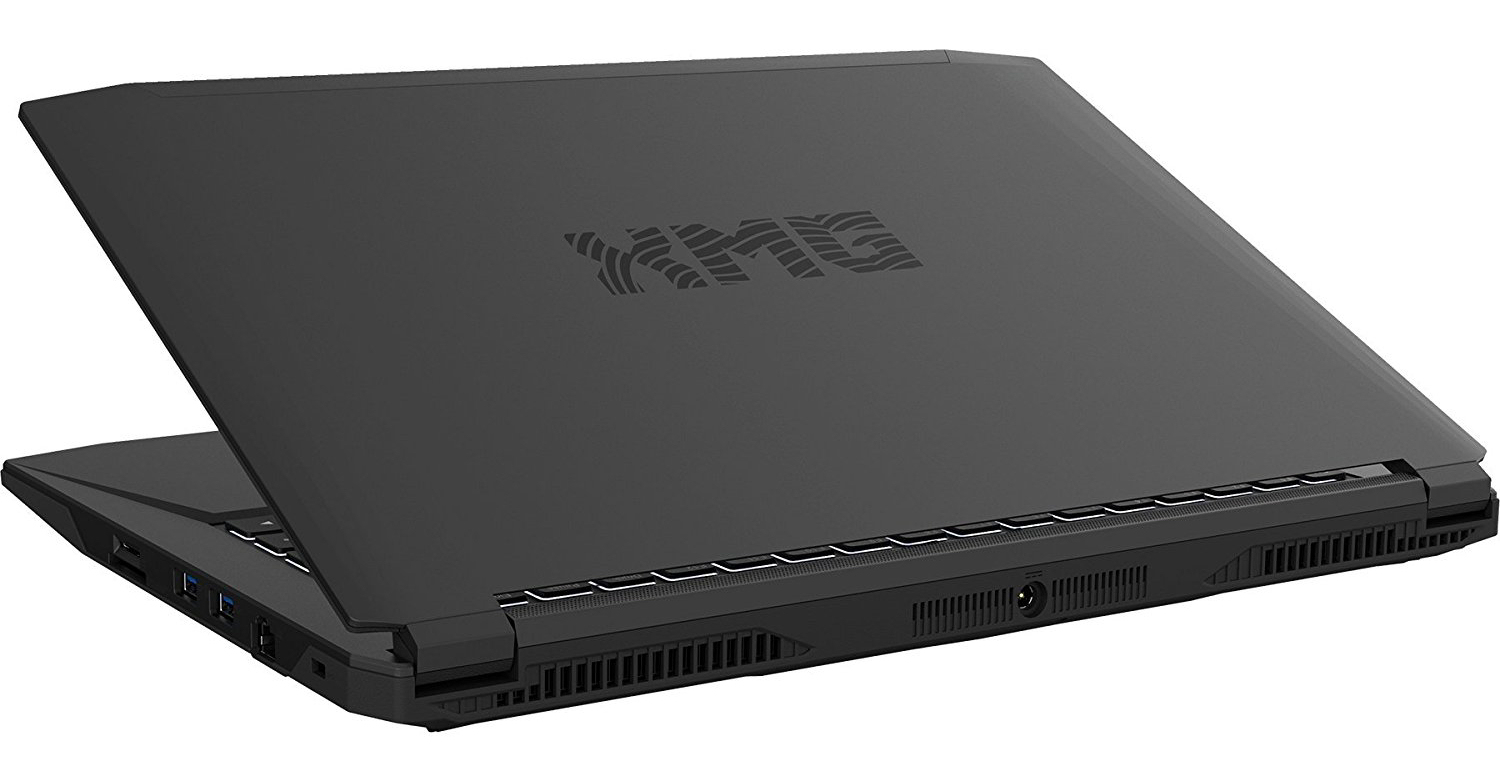
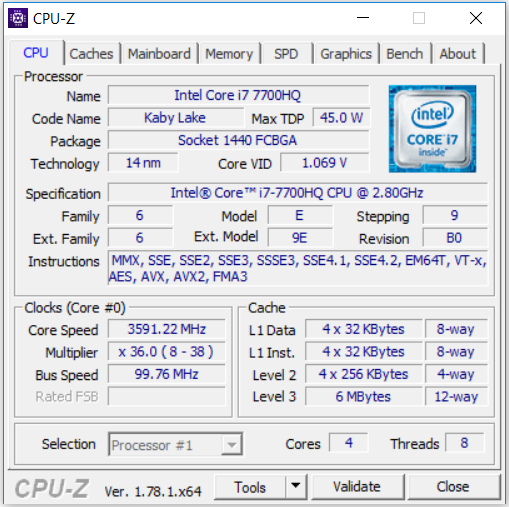
All'esterno l'XMG P407 non differisce dal predecessore. Ecco perché ci focalizziamo sulle nuove features, che si trovano prevalentemente all'interno. Il nuovo processore Kaby Lake fornisce un buon incremento di prestazioni. La nuova CPU ha anche un buono, ma modesto, impatto sull'autonomia. La GeForce GTX 1050 Ti fa parte della fascia superiore delle schede Nvidia, ma offre più prestazioni rispetto ai modelli top delle precedenti generazioni. In altre parole il chip GeForce GTX 970M dell'XMG P406 perde nei 3DMark benchmarks e nel gaming.
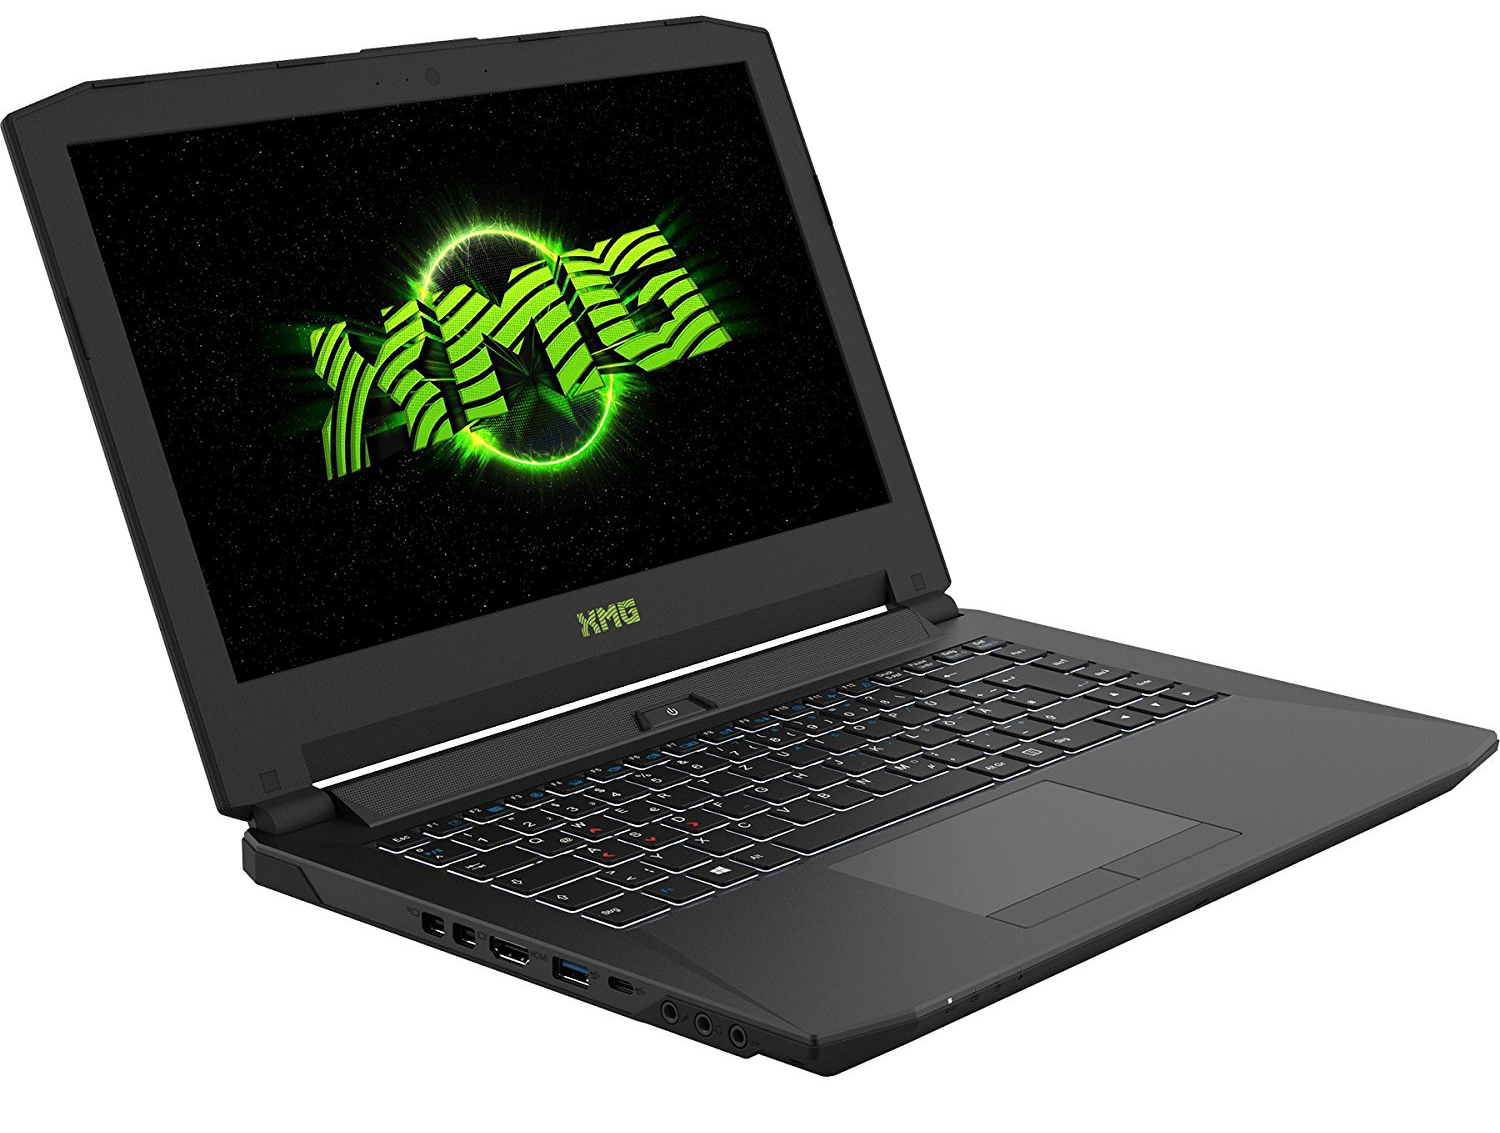
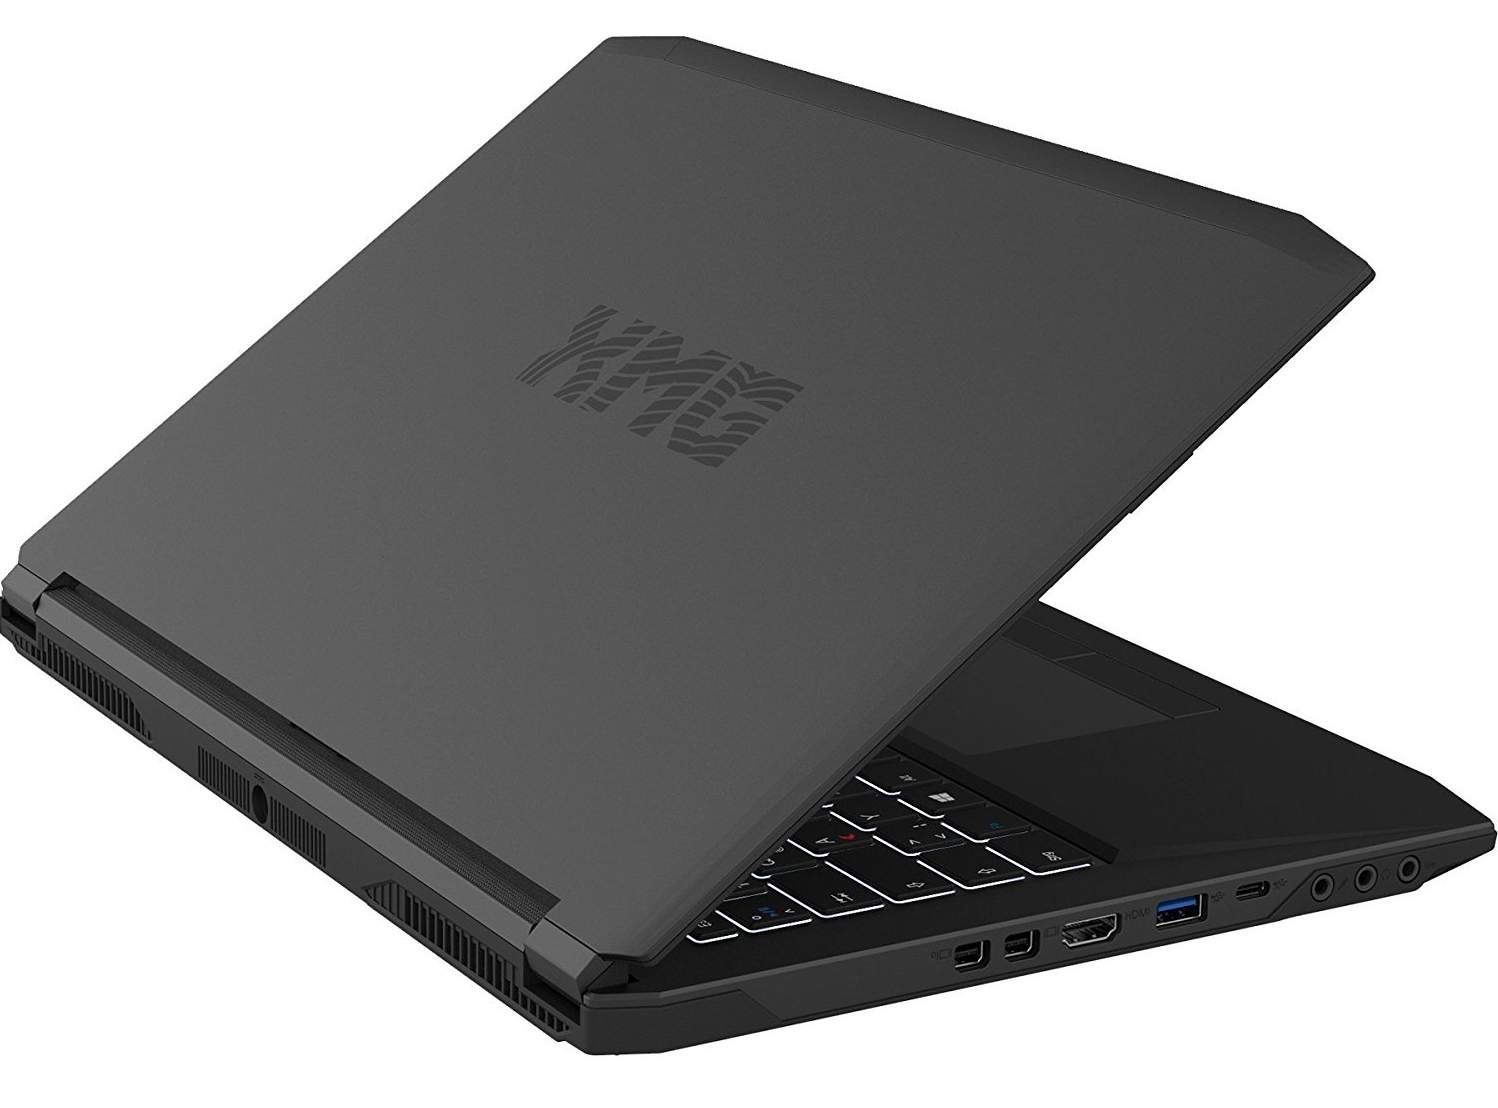
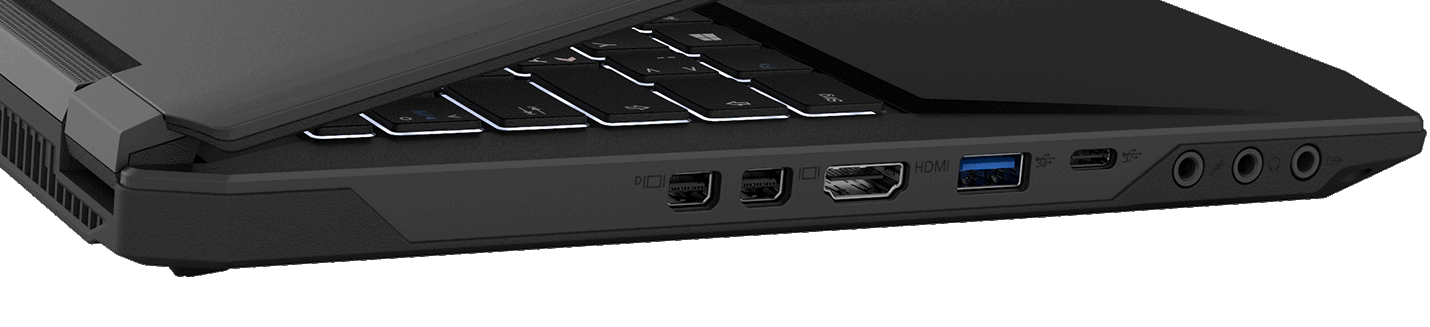
Lo sviluppo di calore sotto sforzo è moderato: l'XMG P407 non diventa caldo come il suo predecessore. La differenza tra il P406 ed il P407 in termini di rumorosità è minima. Tuttavia notiamo qualche miglioramento: la ventola della CPU del P406 accelera inaspettatamente e si fa sentire. Questo comportamento non si nota con il P407. Anche le porte sono aggiornate: una delle quattro porte USB 3.1 Type-A Gen-1 è una USB 3.1 Type-C Gen-2. In aggiunta, una delle due Mini DisplayPorts ora monta lo standard 1.4.
Con l'XMG P407, Schenker realizza un buon portatile gaming da 14".
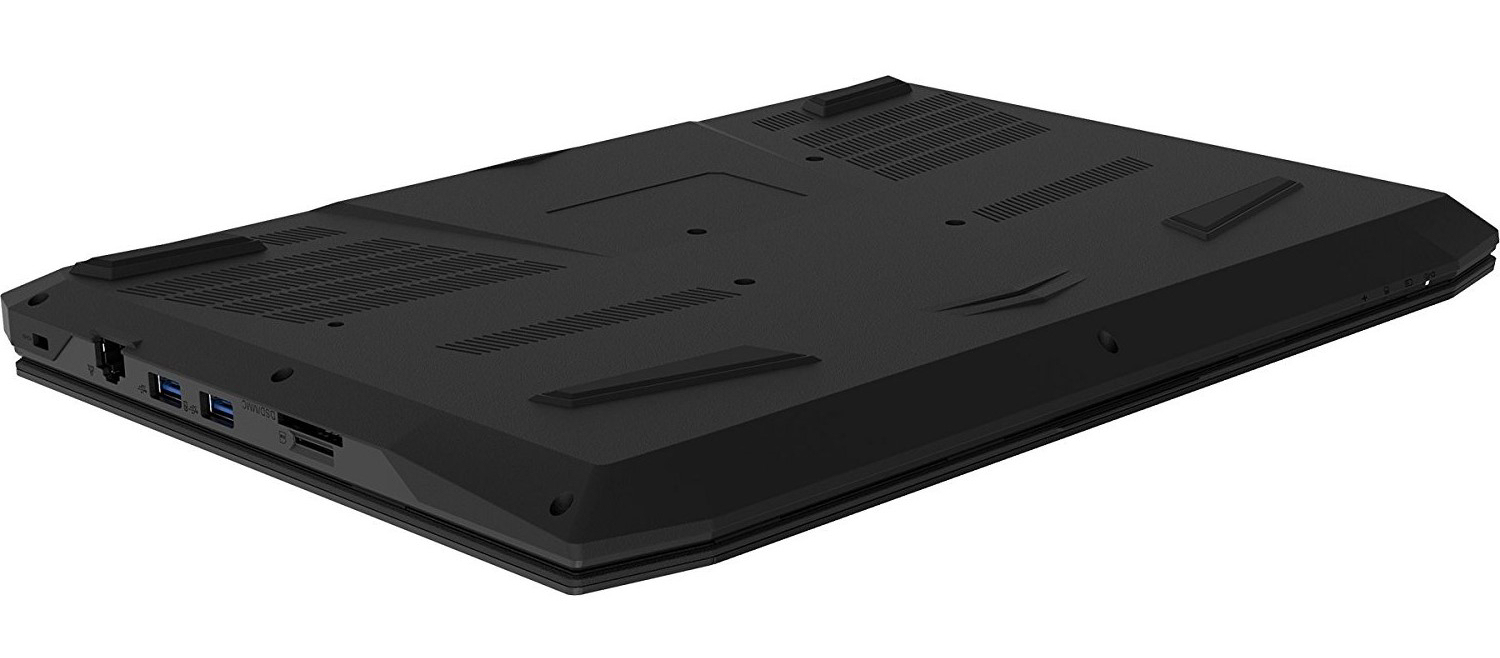
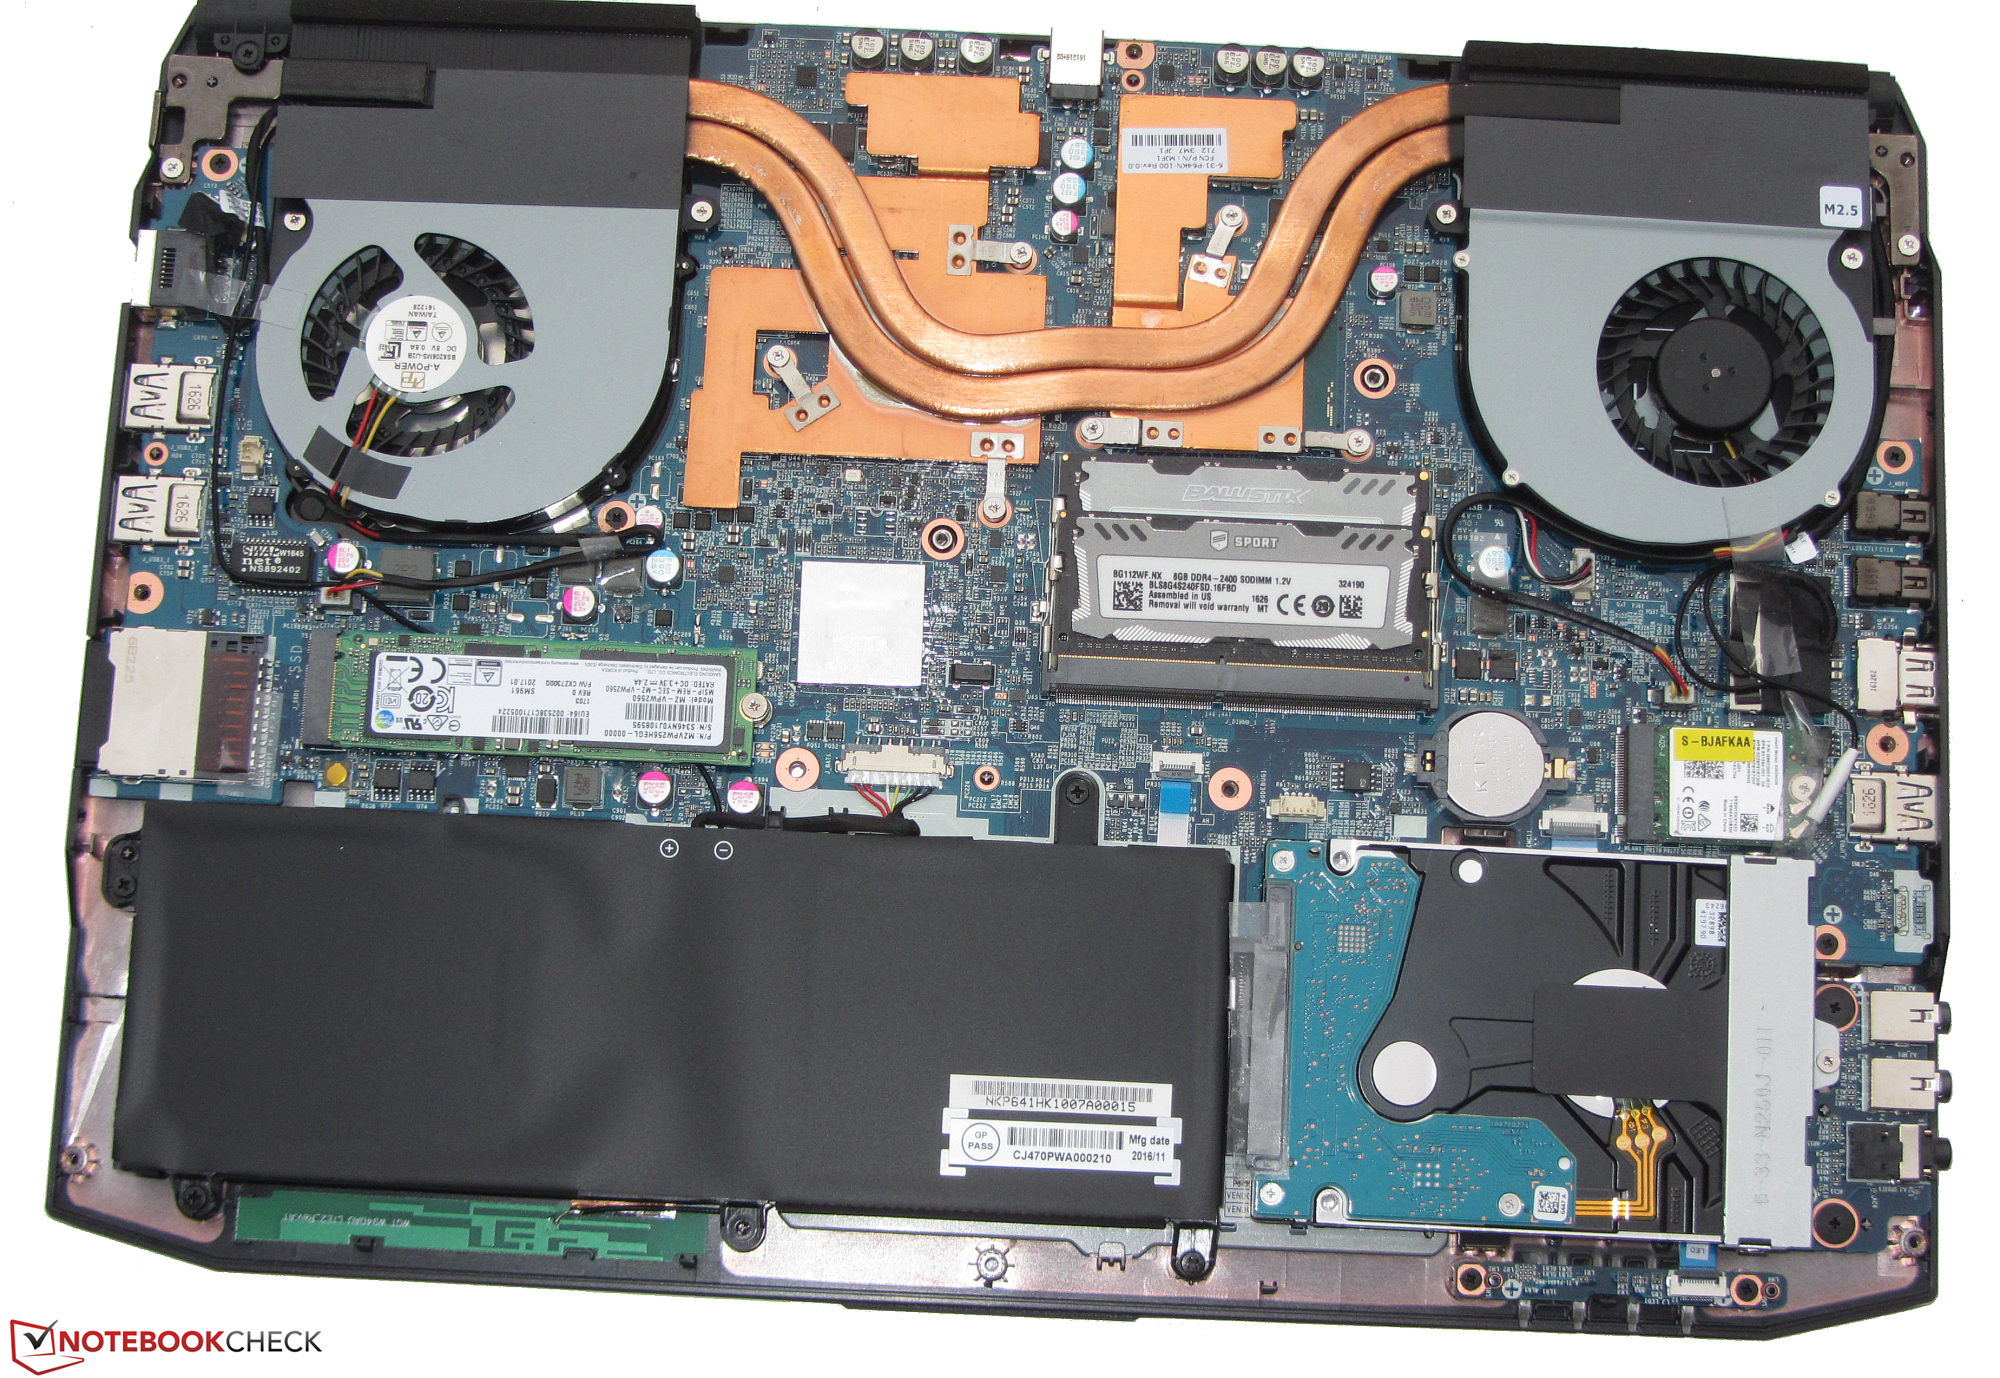
Un velocissimo SSD NVMe garantisce la fluidità di sistema. Lo spazio di archiviazione è fornito da un hard drive da 2,5". Entrambi i drives possono essere cambiati, in quanto il vassoio inferiore si apre senza sforzi particolari. Nel pacchetto è compresa una buona tastiera. Il display IPS matto ha piacevoli angoli di visuale e buon contrasto. Tuttavia, il display potrebbe offrire di più in termini di luminosità. I tempi di switching del display sono leggermente migliori rispetto a quelli dell'XMG P406.
Nota: si tratta di una recensione breve, con alcune sezioni non tradotte, per la versione integrale in inglese guardate qui.
Pro
Contro
On the outside, the XMG P407 is not different from its predecessor. That is why we shall focus on the new features, which are found primarily on the inside. The new Kaby Lake processor provides a slight performance increase. The fresh CPU also has a good, though modest, impact on battery life. The built-in GeForce GTX 1050 Ti core is in the upper middle range of Nvidia's current line-up, but it offers more performance than many top-range models of the previous generation. In other words: The GeForce GTX 970M chip built into the XMG P406 loses in 3DMark benchmarks as well as in real-world gaming.
The heat development under load can be described as moderate: The XMG P407 does not become as warm as its predecessor. The differences between the P406 and the P407 in terms of system noise are small. However, we notice some improvement: The CPU fan on the P406 likes to speed up unexpectedly and is then clearly perceptible. This behaviour is apparently not present on the P407. The ports bear further updates: One of the four USB 3.1 Type-A Gen-1 ports makes way for a USB 3.1 Type-C Gen-2 slot. In addition, one of the two Mini DisplayPorts is now equipped with the 1.4 standard.
With the XMG P407, Schenker delivers a well-rounded 14-inch gaming notebook.
A lightning-quick NVMe SSD ensures a snappy system. The required storage space is provided by a 2.5-inch hard drive. Both drives can be exchanged, since the bottom plate of the base unit can be removed effortlessly. A good keyboard is also in the package. The matte IPS display has pleasantly wide viewing angles and good contrast. However, the display could offer more in terms of brightness. The switching times of the built-in display are only slightly better than the ones on the XMG P406.
Schenker XMG P407
- 03/06/2017 v6 (old)
Sascha Mölck