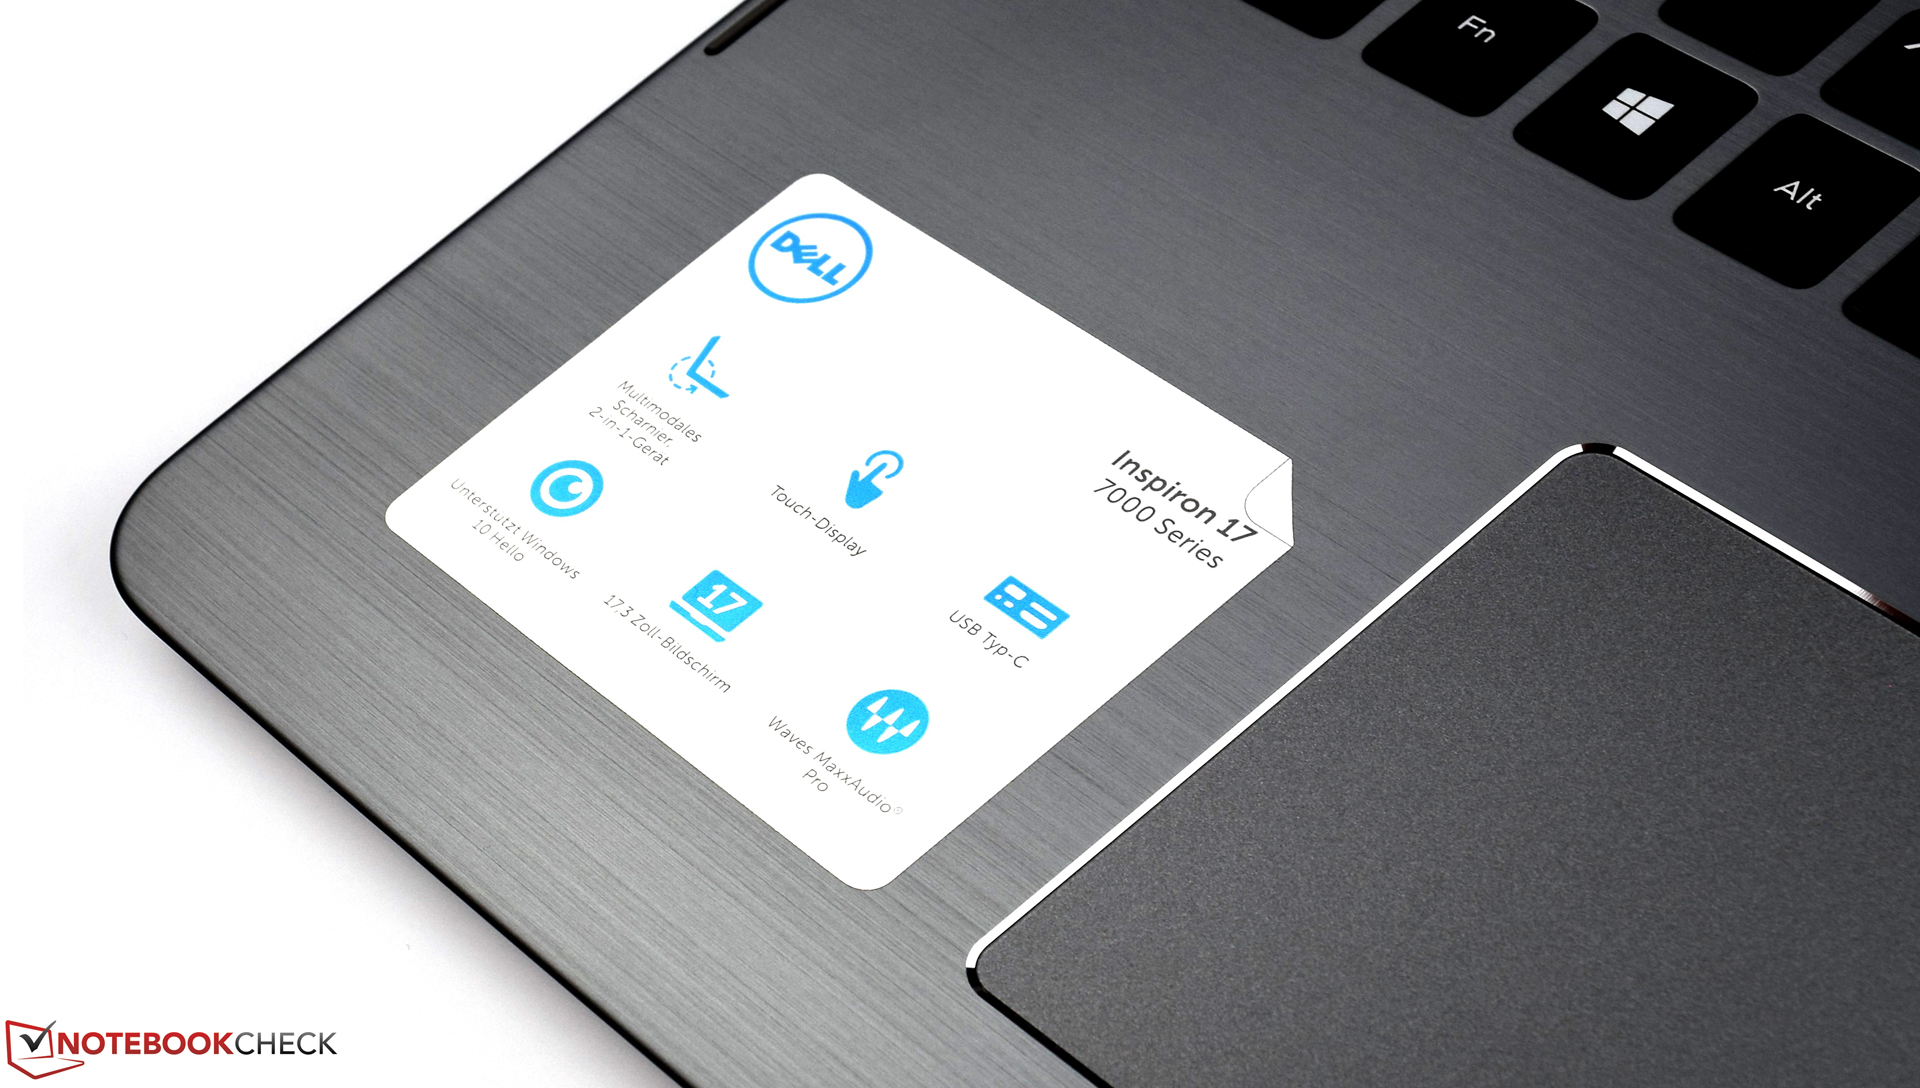
Recensione breve del Convertibile Dell Inspiron 17 7773 (i7-8550U, 16 GB, 17" Touch)
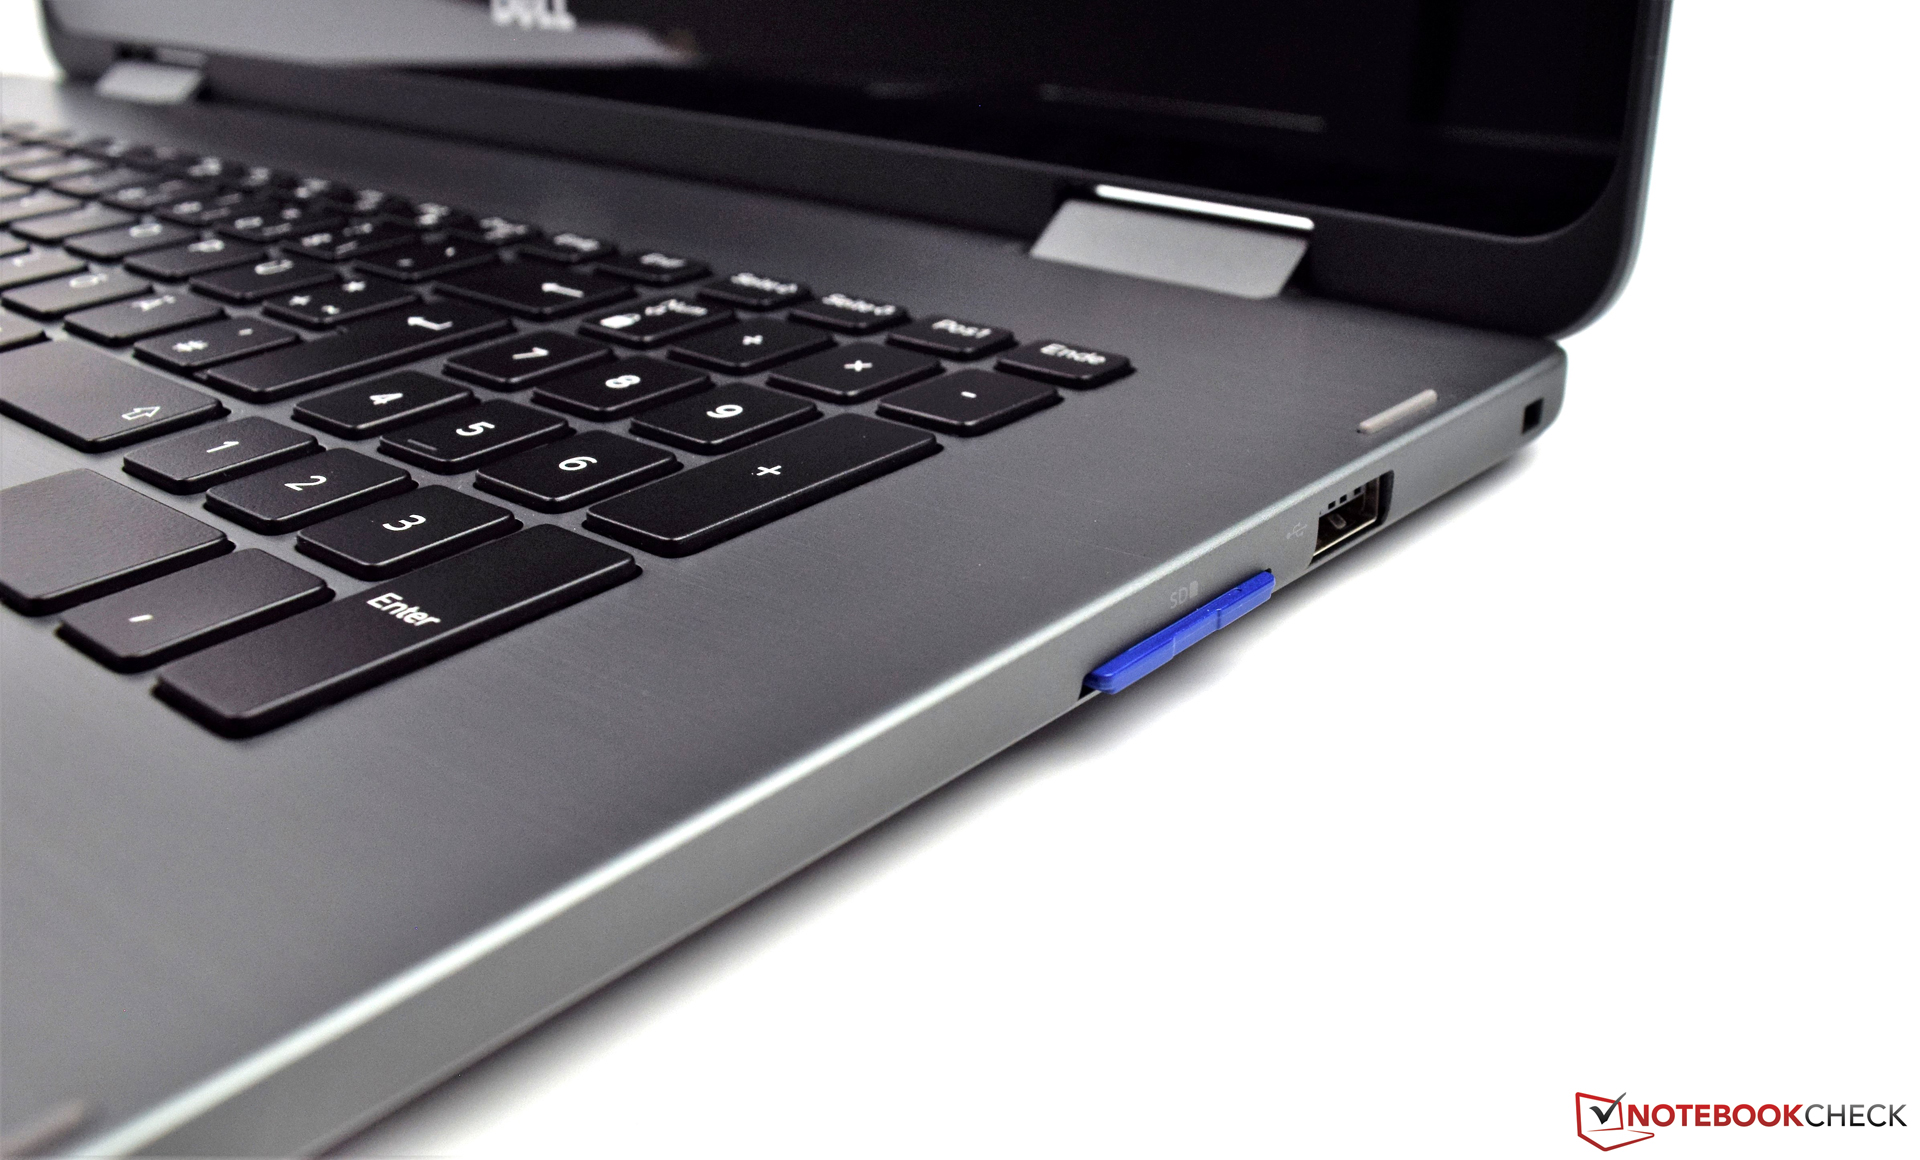
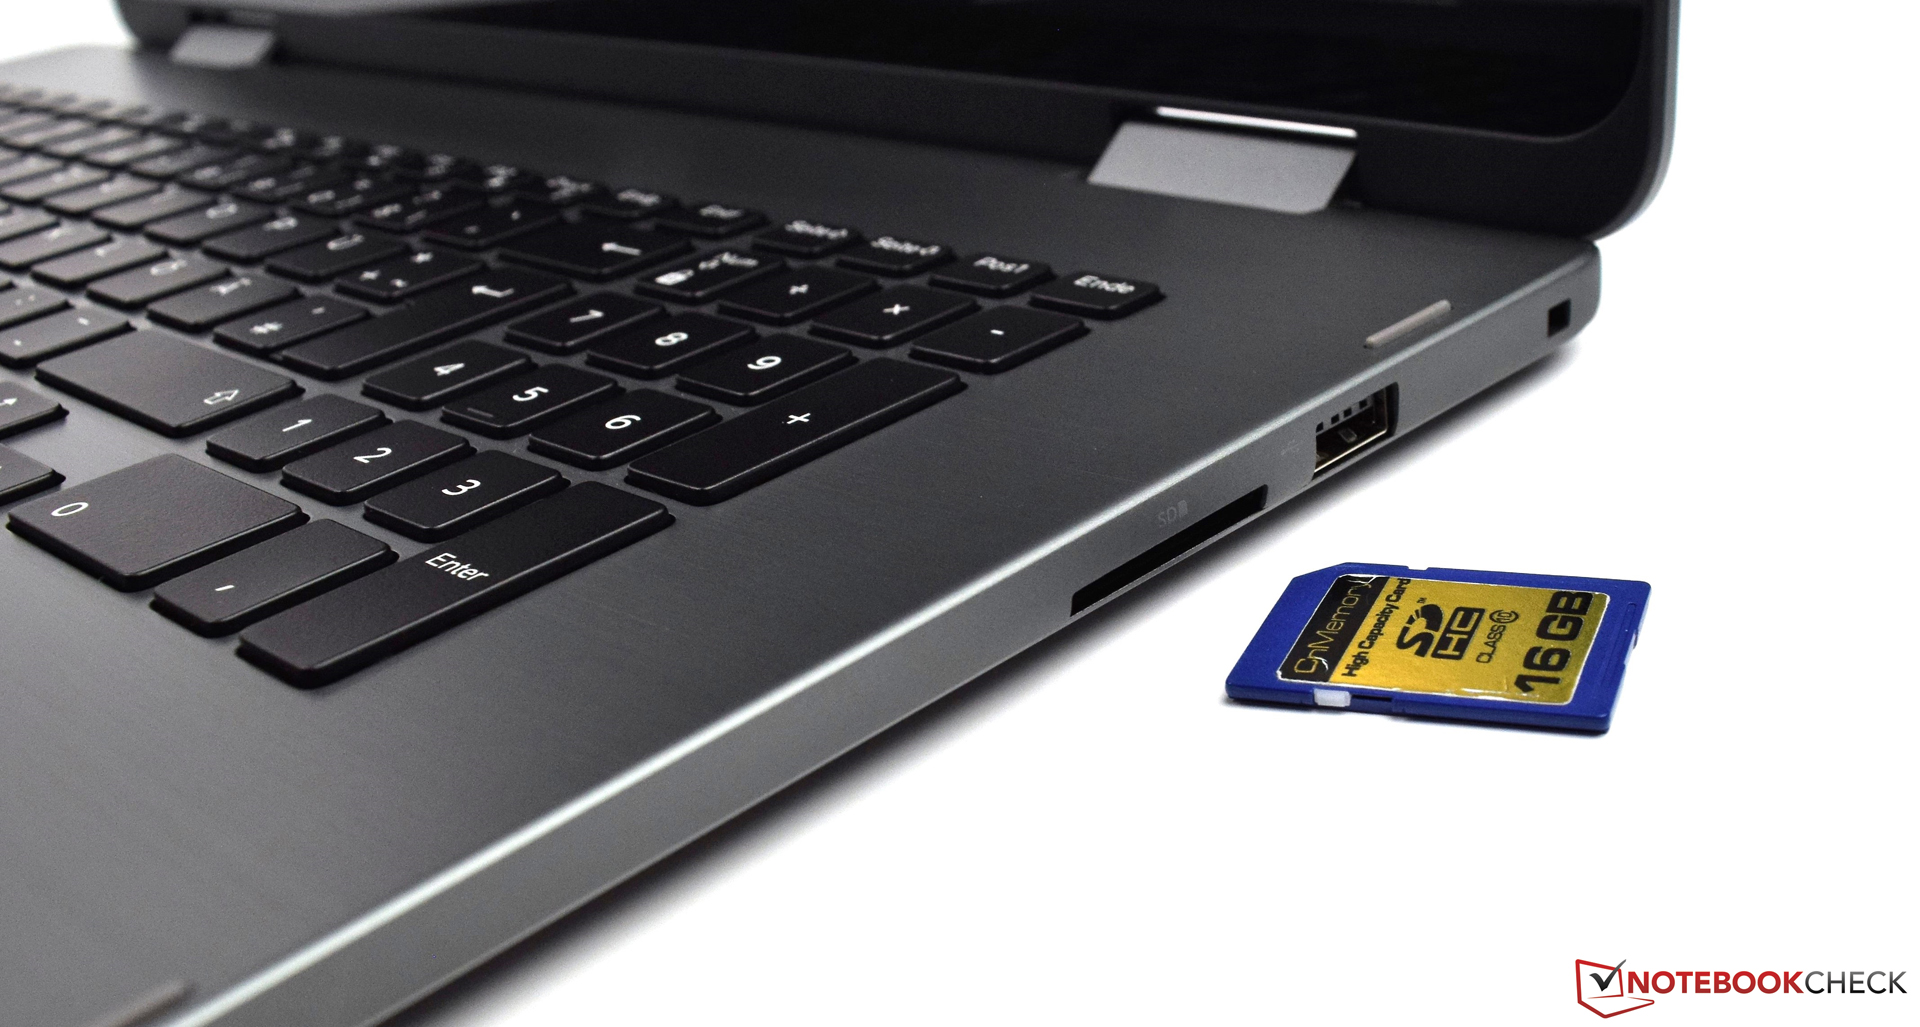
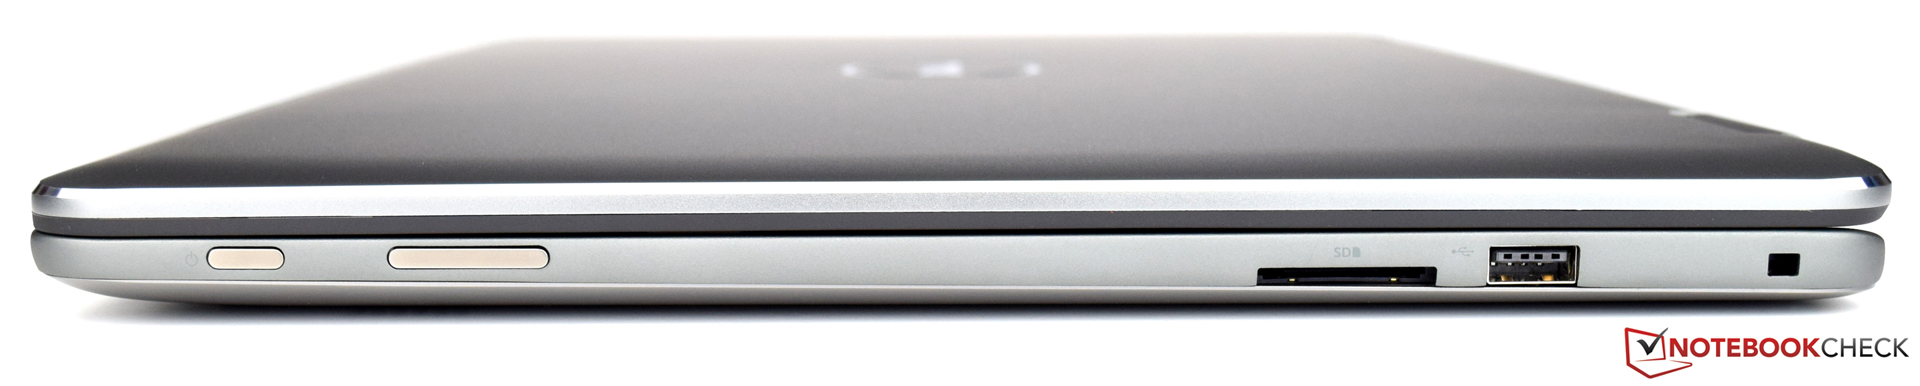
| SD Card Reader | |
| average JPG Copy Test (av. of 3 runs) | |
| HP Omen 17-w206ng (Toshiba Exceria Pro SDXC 64 GB UHS-II) | |
| Acer Aspire 5 A517-51G-80L (Toshiba Exceria Pro SDXC 64 GB UHS-II) | |
| Acer Aspire 7 A717-71G-72VY (Toshiba Exceria Pro SDXC 64 GB UHS-II) | |
| Dell Inspiron 17-7773-0043 (Toshiba Exceria Pro SDXC 64 GB UHS-II) | |
| Acer Aspire Nitro BE VN7-793G-5811 (Toshiba Exceria Pro SDXC 64 GB UHS-II) | |
| Dell Inspiron 17 7778 | |
| maximum AS SSD Seq Read Test (1GB) | |
| HP Omen 17-w206ng (Toshiba Exceria Pro SDXC 64 GB UHS-II) | |
| Acer Aspire 7 A717-71G-72VY (Toshiba Exceria Pro SDXC 64 GB UHS-II) | |
| Acer Aspire 5 A517-51G-80L (Toshiba Exceria Pro SDXC 64 GB UHS-II) | |
| Dell Inspiron 17-7773-0043 (Toshiba Exceria Pro SDXC 64 GB UHS-II) | |
| Dell Inspiron 17 7778 | |
| Acer Aspire Nitro BE VN7-793G-5811 (Toshiba Exceria Pro SDXC 64 GB UHS-II) | |
| |||||||||||||||||||||||||
Distribuzione della luminosità: 77 %
Al centro con la batteria: 323 cd/m²
Contrasto: 1538:1 (Nero: 0.21 cd/m²)
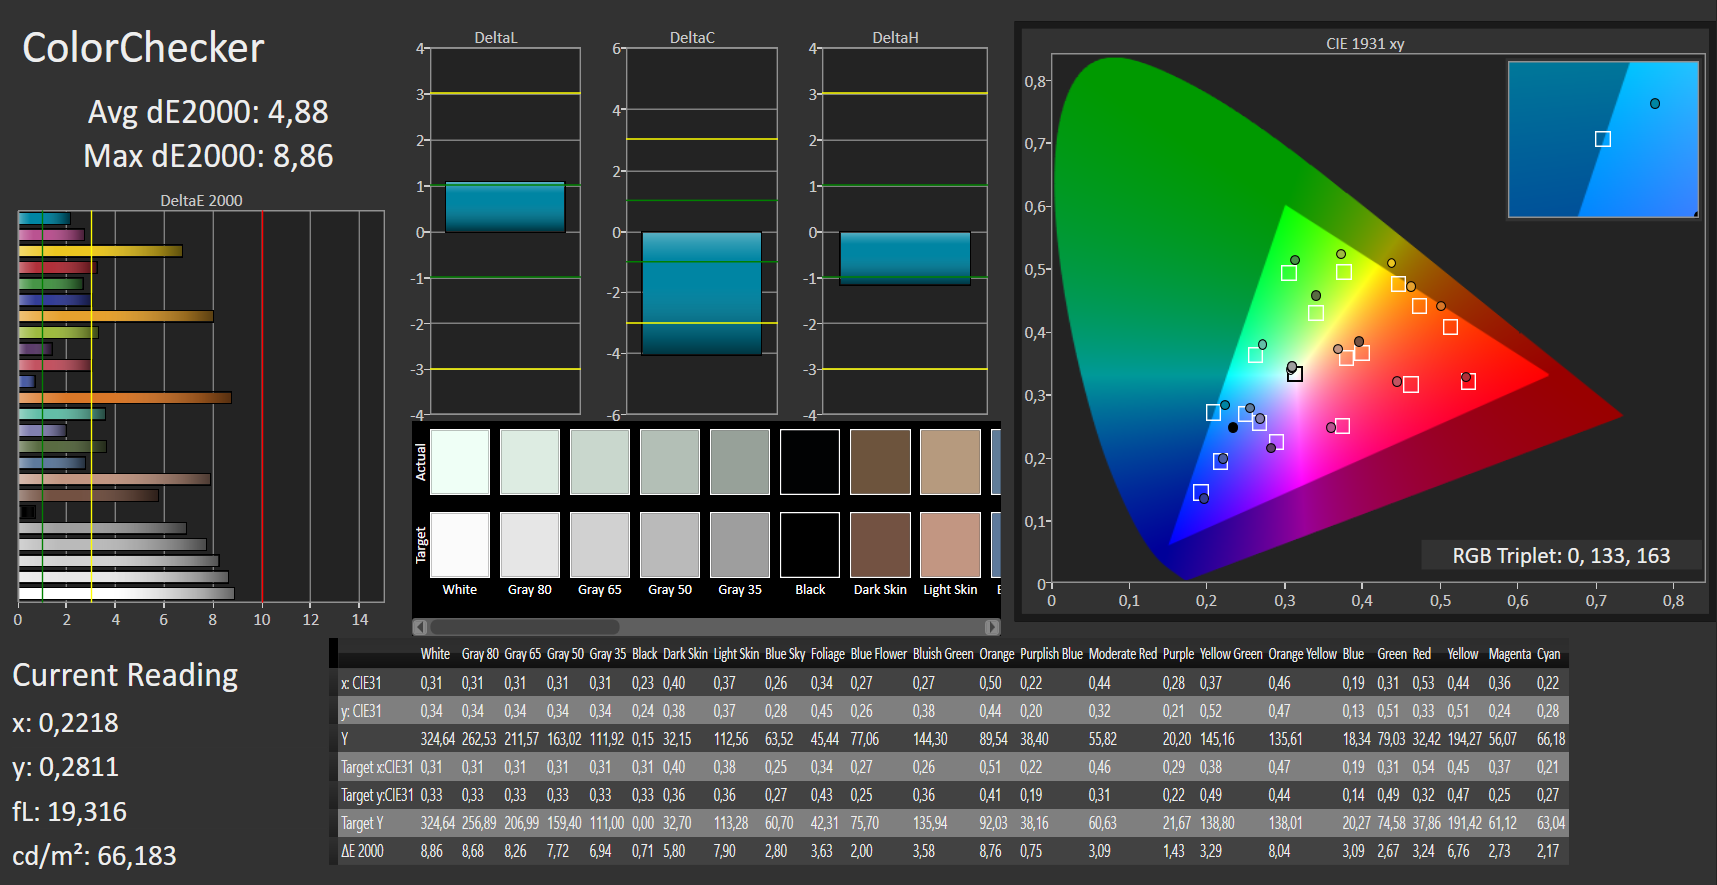
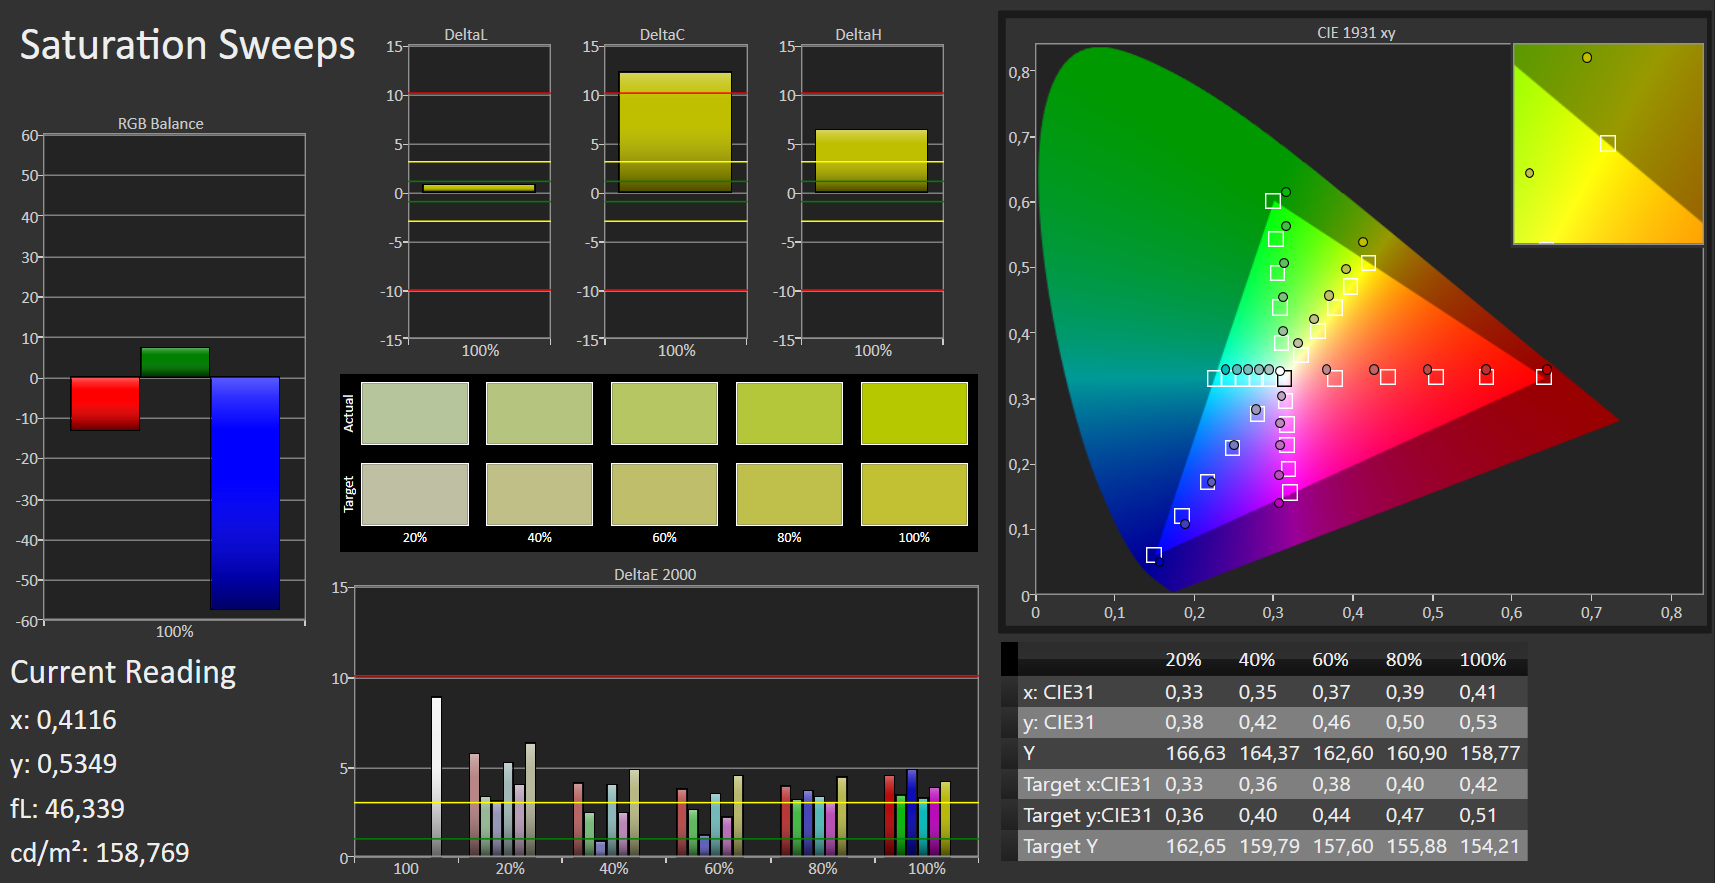
ΔE ColorChecker Calman: 4.88 | ∀{0.5-29.43 Ø4.73}
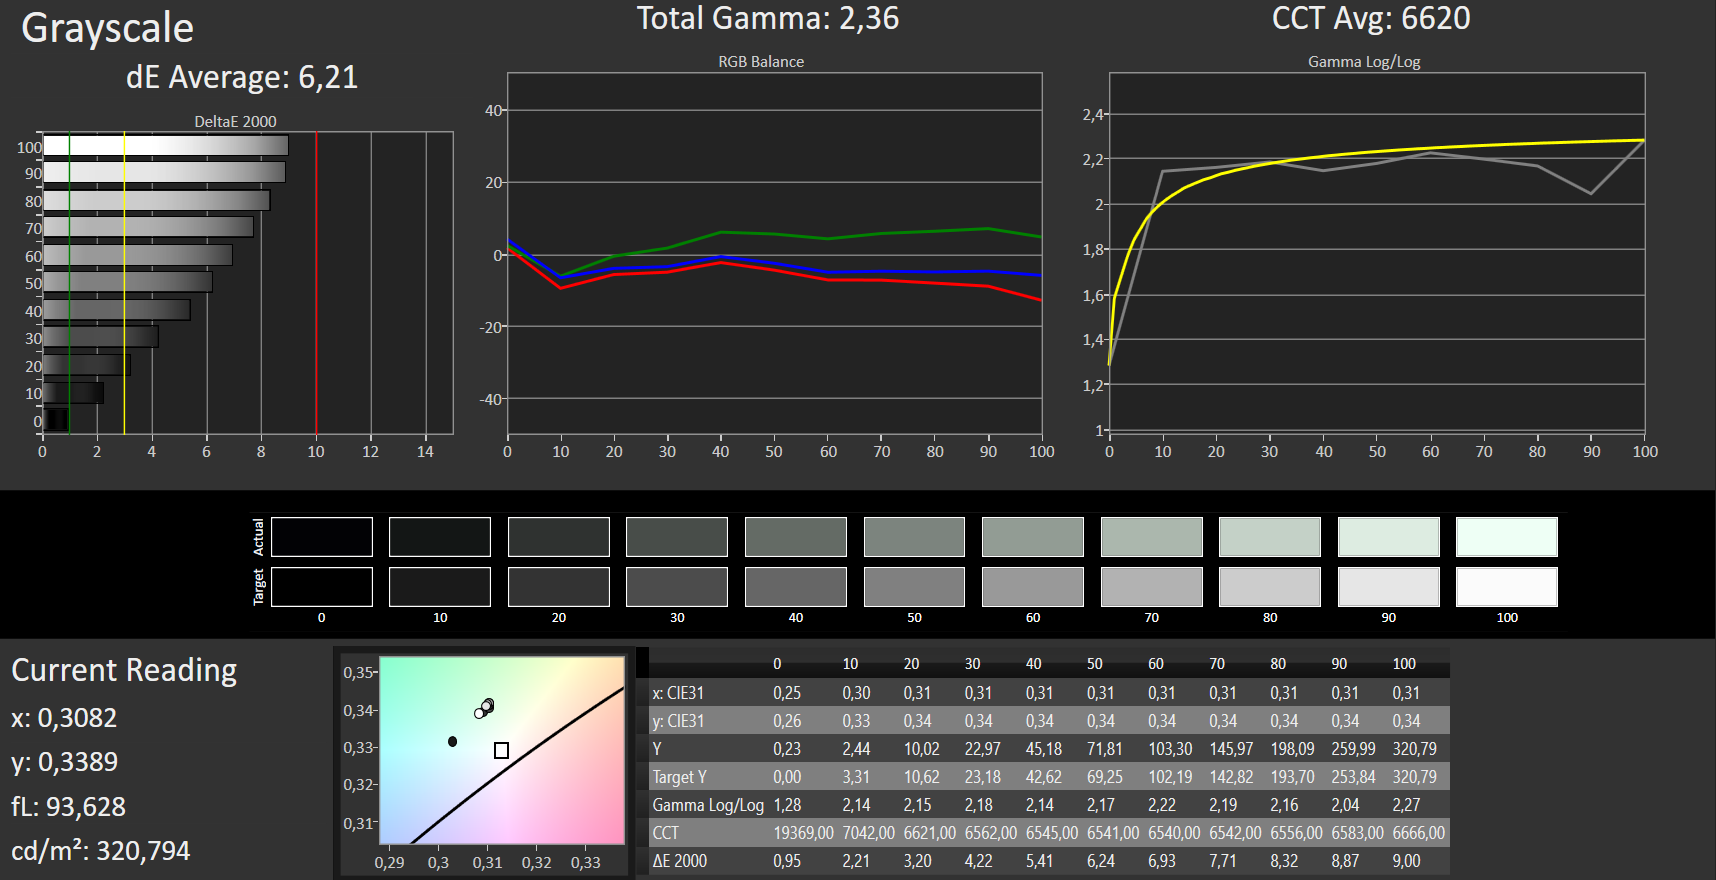
ΔE Greyscale Calman: 6.21 | ∀{0.09-98 Ø4.97}
92% sRGB (Argyll 1.6.3 3D)
60% AdobeRGB 1998 (Argyll 1.6.3 3D)
67.2% AdobeRGB 1998 (Argyll 3D)
91.9% sRGB (Argyll 3D)
67.4% Display P3 (Argyll 3D)
Gamma: 2.36
CCT: 6620 K
| Dell Inspiron 17-7773-0043 Chi Mei CMN1738, 1920x1080, 17.3" | Dell Inspiron 17 7778 LG Philips LGD 0513 / 173WF4, 1920x1080, 17.3" | Acer Aspire 5 A517-51G-80L LG Display, LP173WF4-SPF5, 1920x1080, 17.3" | Acer Aspire Nitro BE VN7-793G-5811 AU Optronics, 1920x1080, 17.3" | HP Omen 17-w206ng Chi Mei CMN1738, 1920x1080, 17.3" | Acer Aspire 7 A717-71G-72VY LG Philips LGD056D / LP173WF4-SPF5, 1920x1080, 17.3" | |
|---|---|---|---|---|---|---|
| Display | -4% | -6% | -6% | 0% | -5% | |
| Display P3 Coverage (%) | 67.4 | 67.4 0% | 66.3 -2% | 63.1 -6% | 67.2 0% | 66.2 -2% |
| sRGB Coverage (%) | 91.9 | 86.3 -6% | 84.2 -8% | 86.5 -6% | 93.1 1% | 85.2 -7% |
| AdobeRGB 1998 Coverage (%) | 67.2 | 63.1 -6% | 61.6 -8% | 63.3 -6% | 67.4 0% | 62.3 -7% |
| Response Times | 16% | -7% | 5% | 6% | 5% | |
| Response Time Grey 50% / Grey 80% * (ms) | 40 ? | 36 ? 10% | 41 ? -2% | 38 ? 5% | 38 ? 5% | 41 ? -2% |
| Response Time Black / White * (ms) | 28 ? | 22 ? 21% | 31 ? -11% | 27 ? 4% | 26 ? 7% | 25 ? 11% |
| PWM Frequency (Hz) | 1000 ? | 122000 ? | 200 ? | 125000 ? | ||
| Screen | -16% | 7% | -4% | -1% | -20% | |
| Brightness middle (cd/m²) | 323 | 327 1% | 397 23% | 301 -7% | 318 -2% | 382 18% |
| Brightness (cd/m²) | 290 | 314 8% | 364 26% | 270 -7% | 295 2% | 357 23% |
| Brightness Distribution (%) | 77 | 87 13% | 84 9% | 79 3% | 79 3% | 86 12% |
| Black Level * (cd/m²) | 0.21 | 0.3 -43% | 0.29 -38% | 0.38 -81% | 0.25 -19% | 0.38 -81% |
| Contrast (:1) | 1538 | 1090 -29% | 1369 -11% | 792 -49% | 1272 -17% | 1005 -35% |
| Colorchecker dE 2000 * | 4.88 | 6.75 -38% | 3.88 20% | 3.49 28% | 4.7 4% | 6.9 -41% |
| Colorchecker dE 2000 max. * | 8.86 | 11.82 -33% | 8.22 7% | 7.49 15% | 8.8 1% | 13.14 -48% |
| Greyscale dE 2000 * | 6.21 | 7.91 -27% | 3.1 50% | 1.88 70% | 5 19% | 8.22 -32% |
| Gamma | 2.36 93% | 2.31 95% | 2.59 85% | 2.35 94% | 2.28 96% | 2.39 92% |
| CCT | 6620 98% | 7642 85% | 6570 99% | 6587 99% | 7374 88% | 7580 86% |
| Color Space (Percent of AdobeRGB 1998) (%) | 60 | 57 -5% | 55 -8% | 56 -7% | 61 2% | 56 -7% |
| Color Space (Percent of sRGB) (%) | 92 | 86 -7% | 84 -9% | 86 -7% | 93 1% | 85 -8% |
| Media totale (Programma / Settaggio) | -1% /
-9% | -2% /
3% | -2% /
-3% | 2% /
0% | -7% /
-14% |
* ... Meglio usare valori piccoli
Tempi di risposta del Display
| ↔ Tempi di risposta dal Nero al Bianco | ||
|---|---|---|
| 28 ms ... aumenta ↗ e diminuisce ↘ combinato | ↗ 17 ms Incremento | 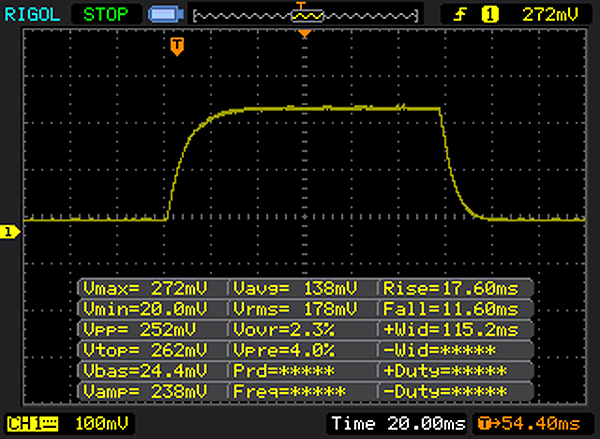 |
| ↘ 11 ms Calo | ||
| Lo schermo mostra tempi di risposta relativamente lenti nei nostri tests e potrebbe essere troppo lento per i gamers. In confronto, tutti i dispositivi di test variano da 0.1 (minimo) a 240 (massimo) ms. » 71 % di tutti i dispositivi è migliore. Questo significa che i tempi di risposta rilevati sono peggiori rispetto alla media di tutti i dispositivi testati (19.9 ms). | ||
| ↔ Tempo di risposta dal 50% Grigio all'80% Grigio | ||
| 40 ms ... aumenta ↗ e diminuisce ↘ combinato | ↗ 22 ms Incremento | 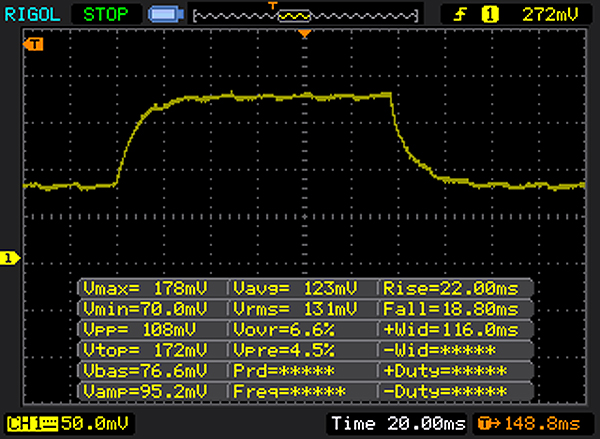 |
| ↘ 18 ms Calo | ||
| Lo schermo mostra tempi di risposta lenti nei nostri tests e sarà insoddisfacente per i gamers. In confronto, tutti i dispositivi di test variano da 0.165 (minimo) a 636 (massimo) ms. » 61 % di tutti i dispositivi è migliore. Questo significa che i tempi di risposta rilevati sono peggiori rispetto alla media di tutti i dispositivi testati (31.1 ms). | ||
Sfarfallio dello schermo / PWM (Pulse-Width Modulation)
| flickering dello schermo / PWM rilevato | 1000 Hz | ≤ 90 % settaggio luminosita' |  |
Il display sfarfalla a 1000 Hz (Probabilmente a causa dell'uso di PWM) Flickering rilevato ad una luminosita' di 90 % o inferiore. Non dovrebbe verificarsi flickering o PWM sopra questo valore di luminosita'. La frequenza di 1000 Hz è abbastanza alta, quindi la maggioranza degli utenti sensibili al PWM non dovrebbero notare alcun flickering. In confronto: 52 % di tutti i dispositivi testati non utilizza PWM per ridurre la luminosita' del display. Se è rilevato PWM, una media di 7801 (minimo: 5 - massimo: 343500) Hz è stata rilevata. | |||
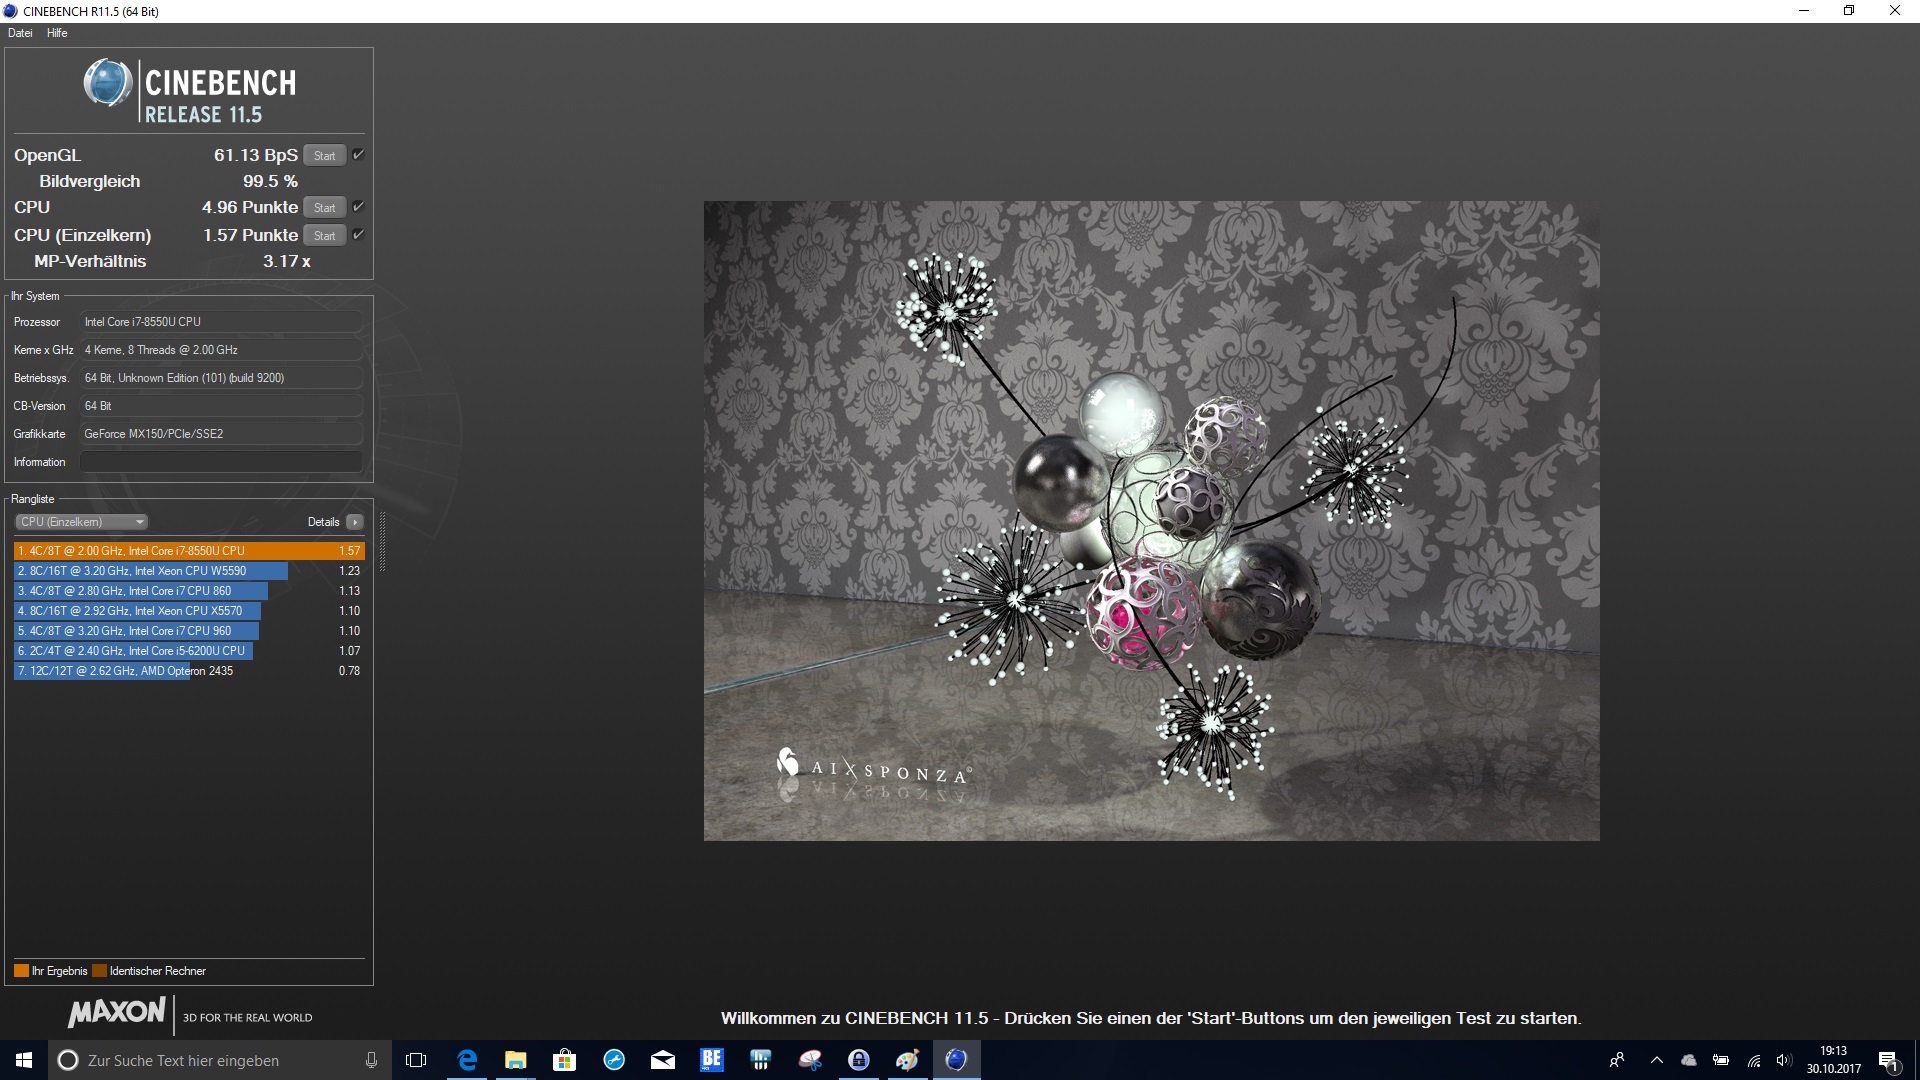
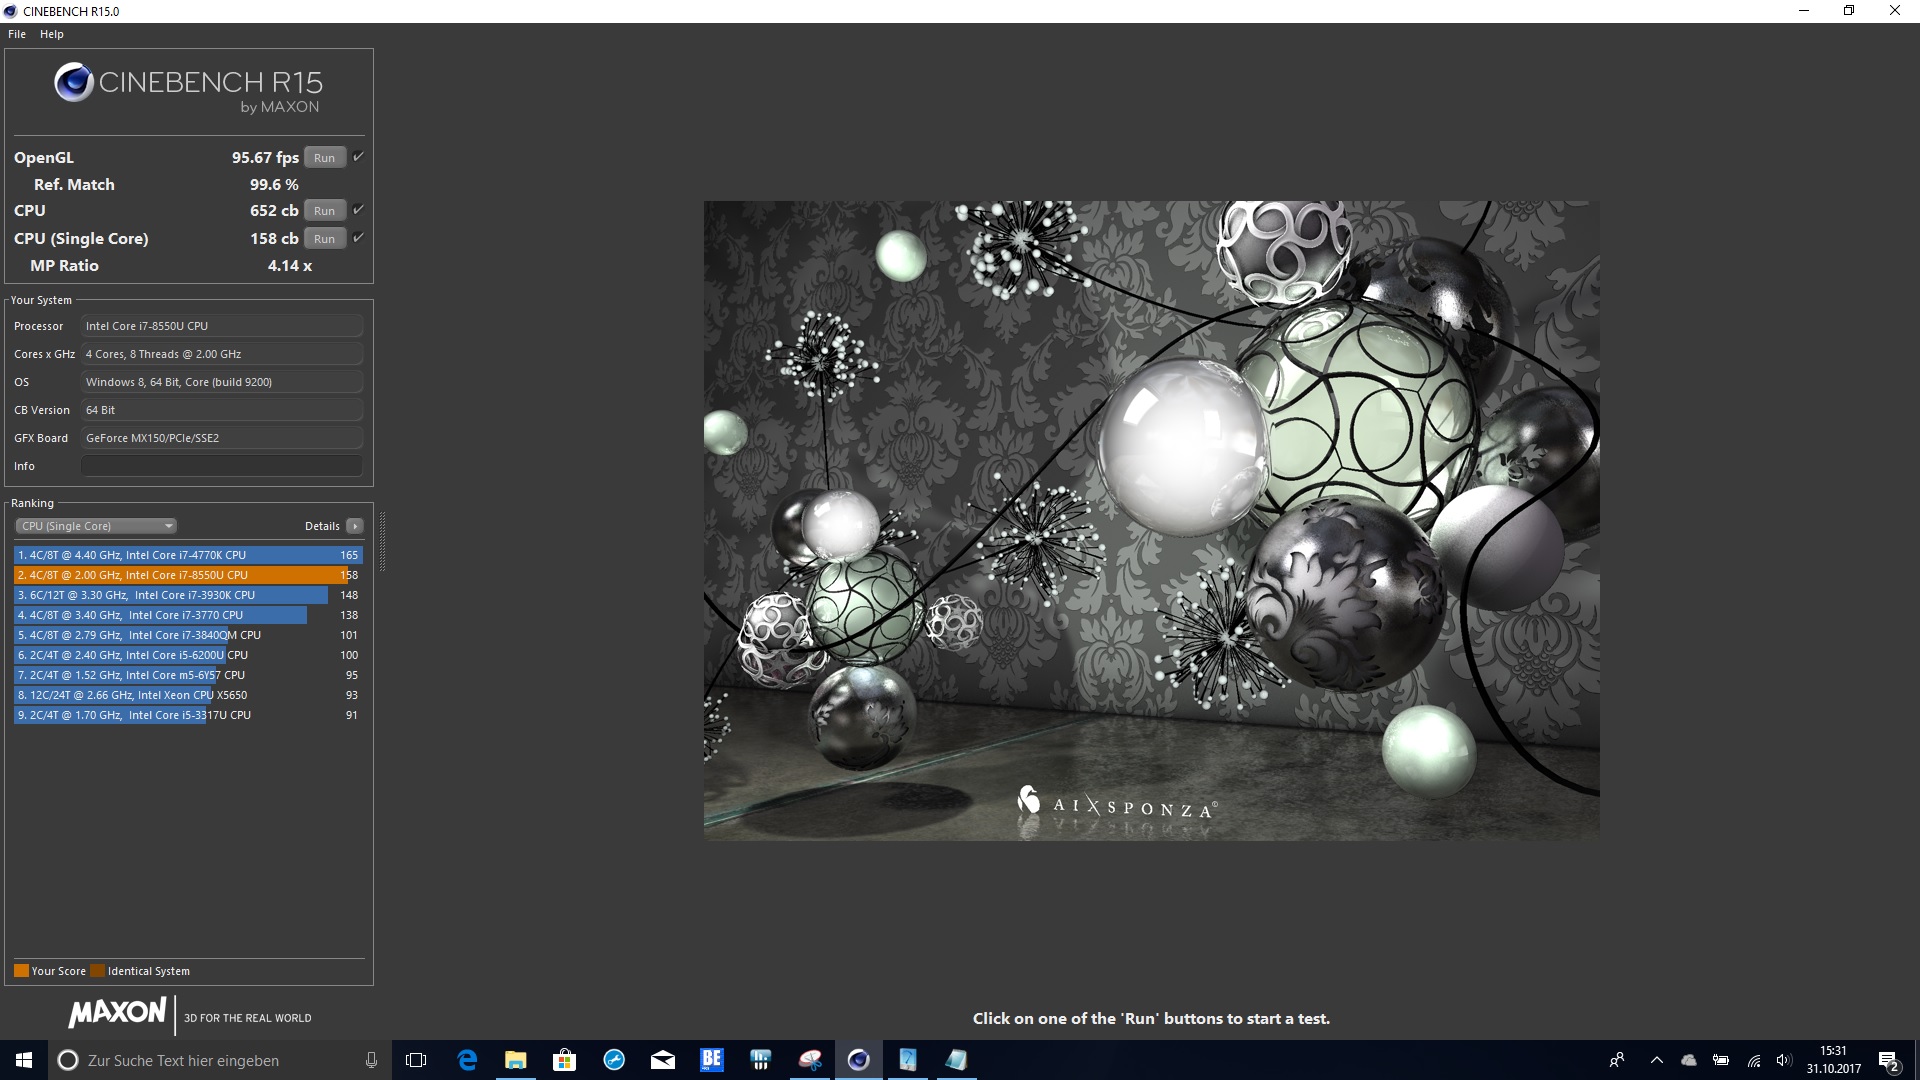
| Cinebench R11.5 | |
| CPU Single 64Bit | |
| Acer Aspire 5 A517-51G-80L | |
| HP Omen 17-w206ng | |
| Dell Inspiron 17-7773-0043 | |
| CPU Multi 64Bit | |
| HP Omen 17-w206ng | |
| Acer Aspire 5 A517-51G-80L | |
| Dell Inspiron 17-7773-0043 | |
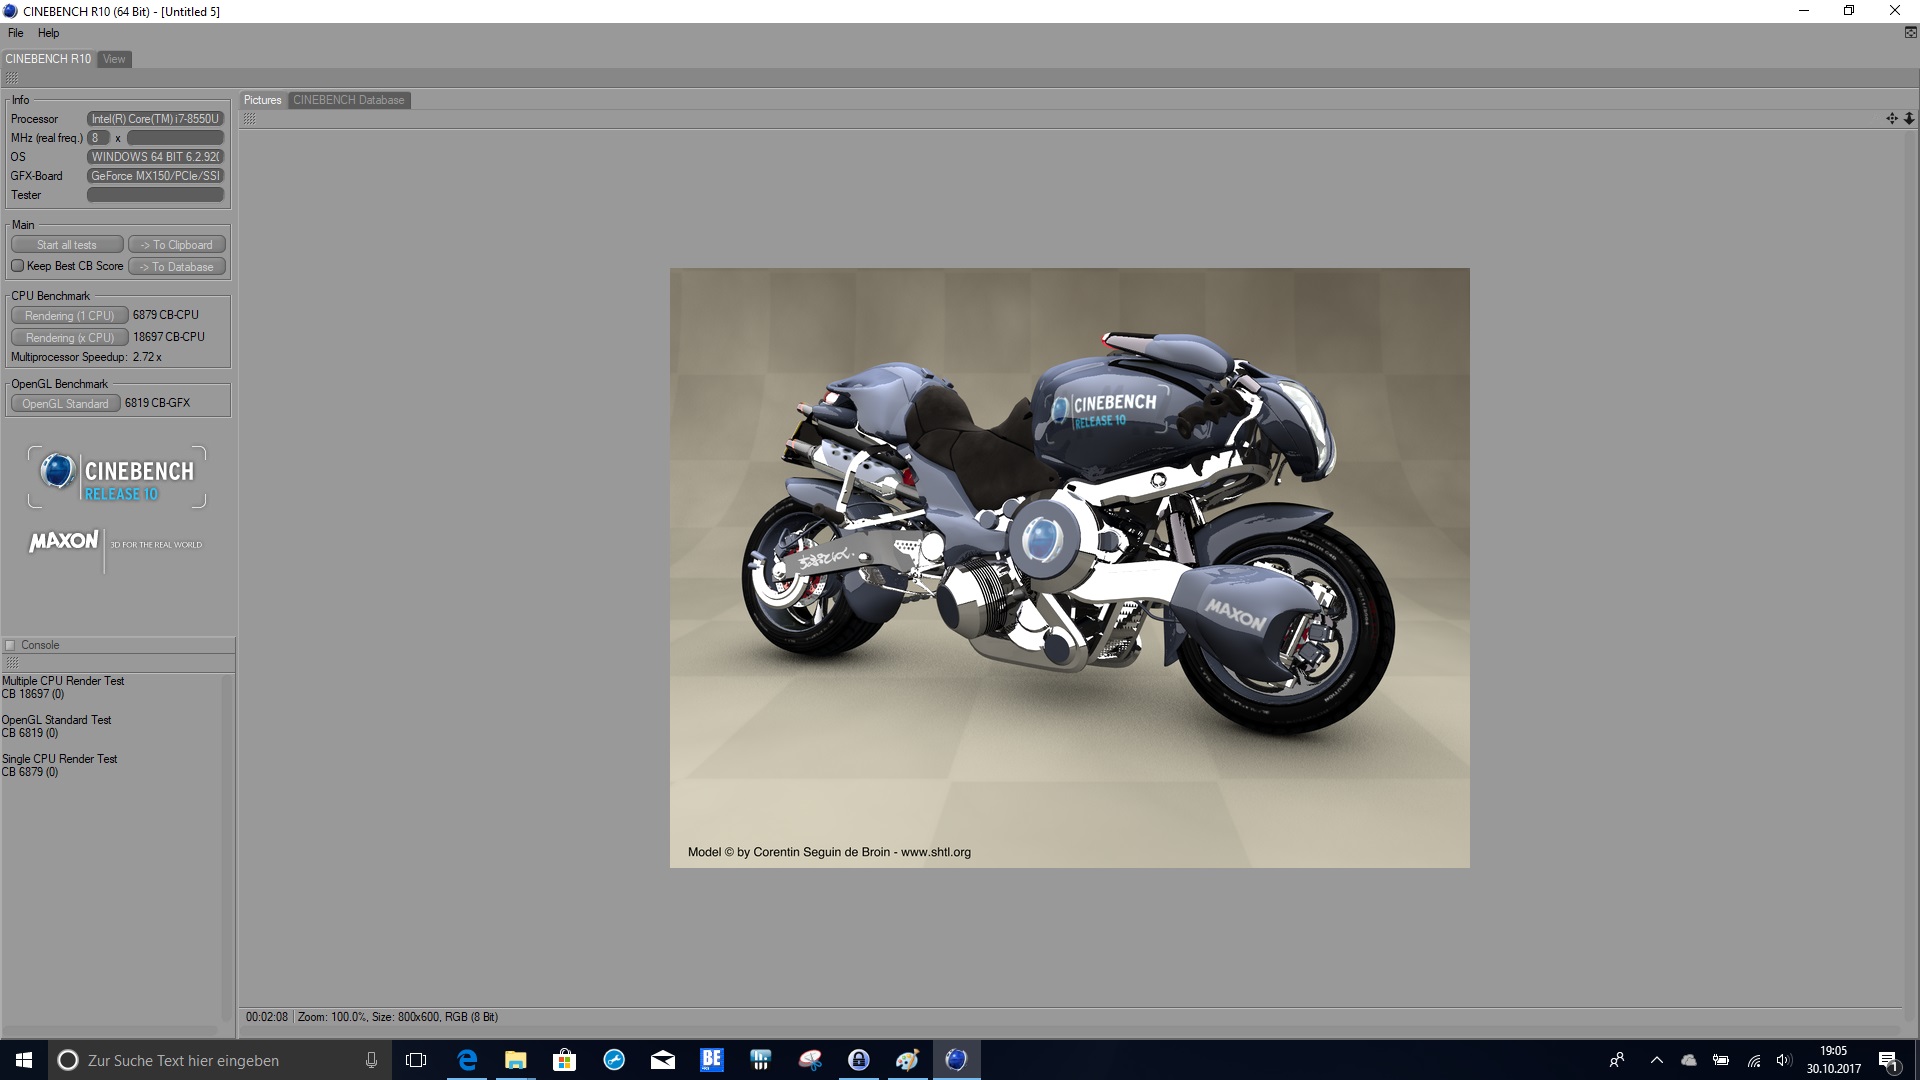
| Cinebench R10 | |
| Rendering Single CPUs 64Bit | |
| Acer Aspire 5 A517-51G-80L | |
| HP Omen 17-w206ng | |
| Dell Inspiron 17-7773-0043 | |
| Rendering Multiple CPUs 64Bit | |
| HP Omen 17-w206ng | |
| Acer Aspire 5 A517-51G-80L | |
| Dell Inspiron 17-7773-0043 | |
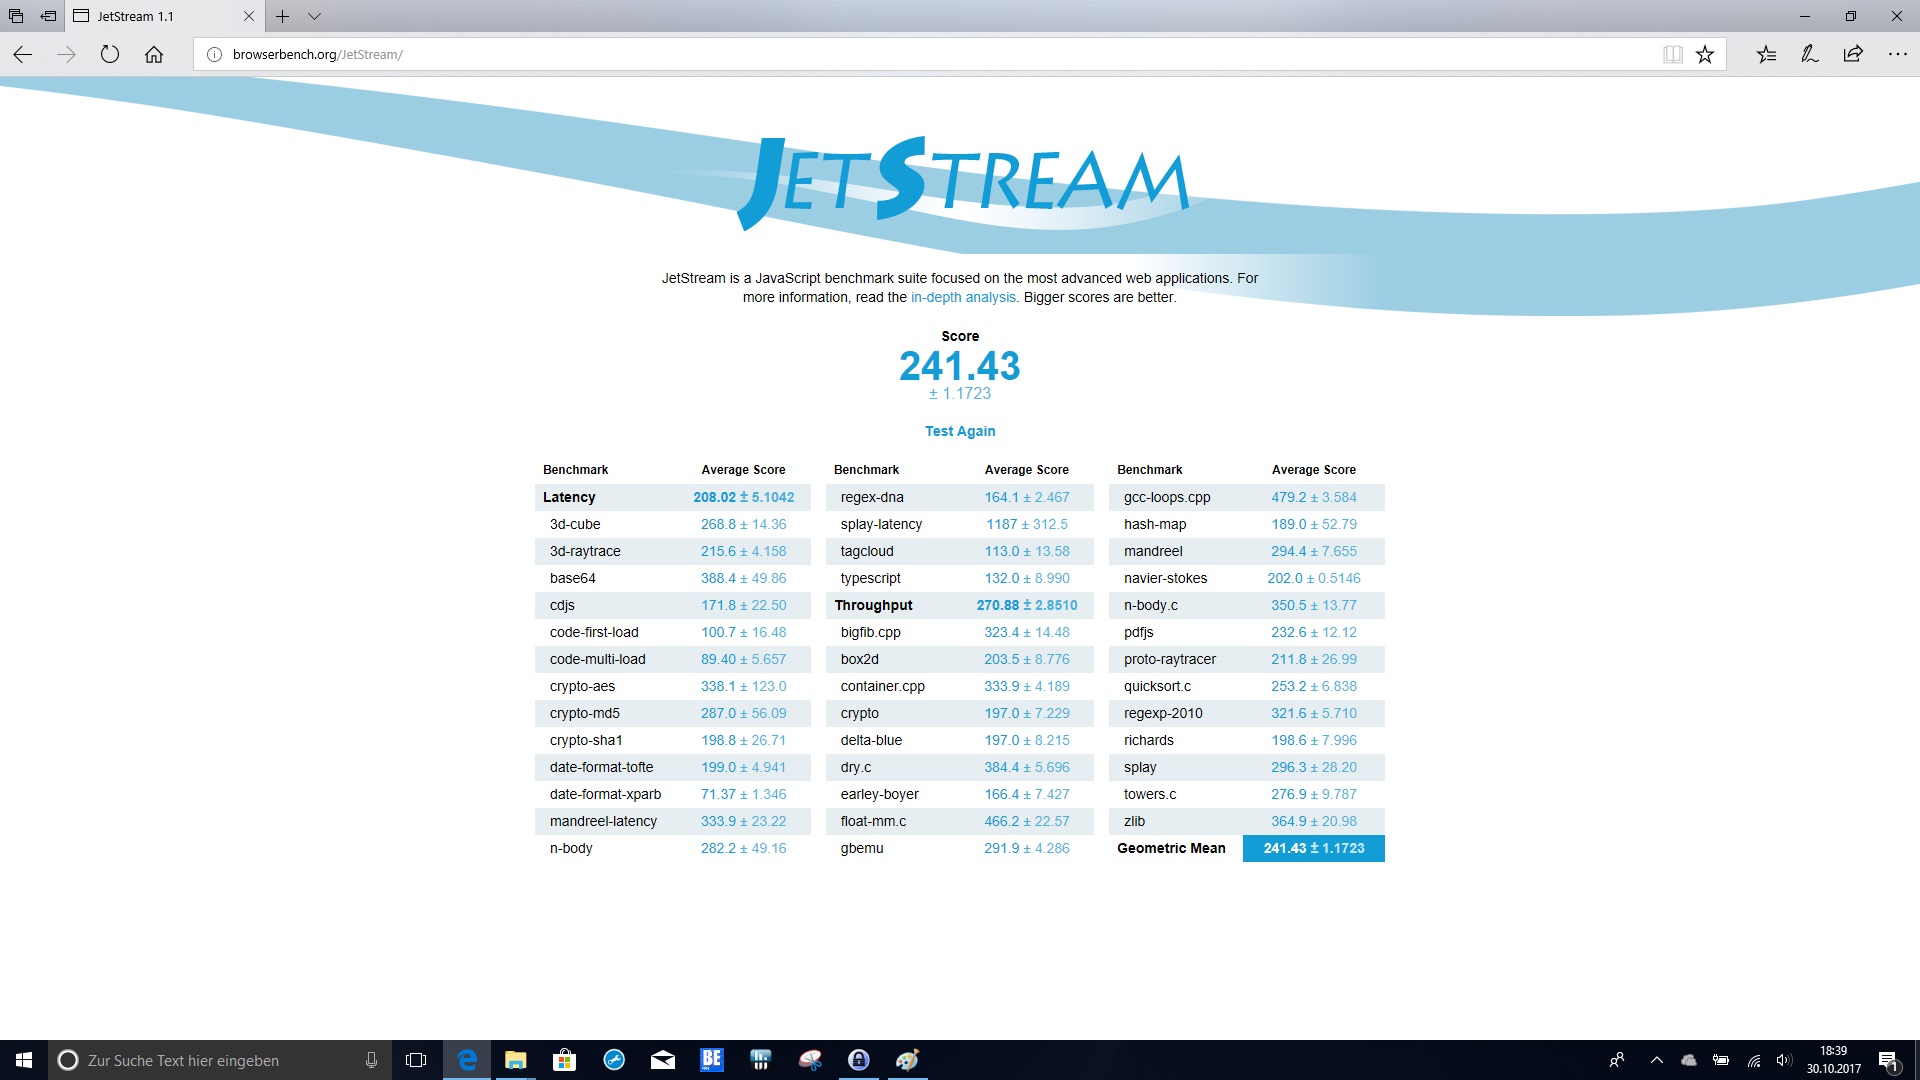
| JetStream 1.1 - 1.1 Total | |
| Acer Aspire 5 A517-51G-80L | |
| HP Omen 17-w206ng | |
| Acer Aspire Nitro BE VN7-793G-5811 | |
| Dell Inspiron 17-7773-0043 | |
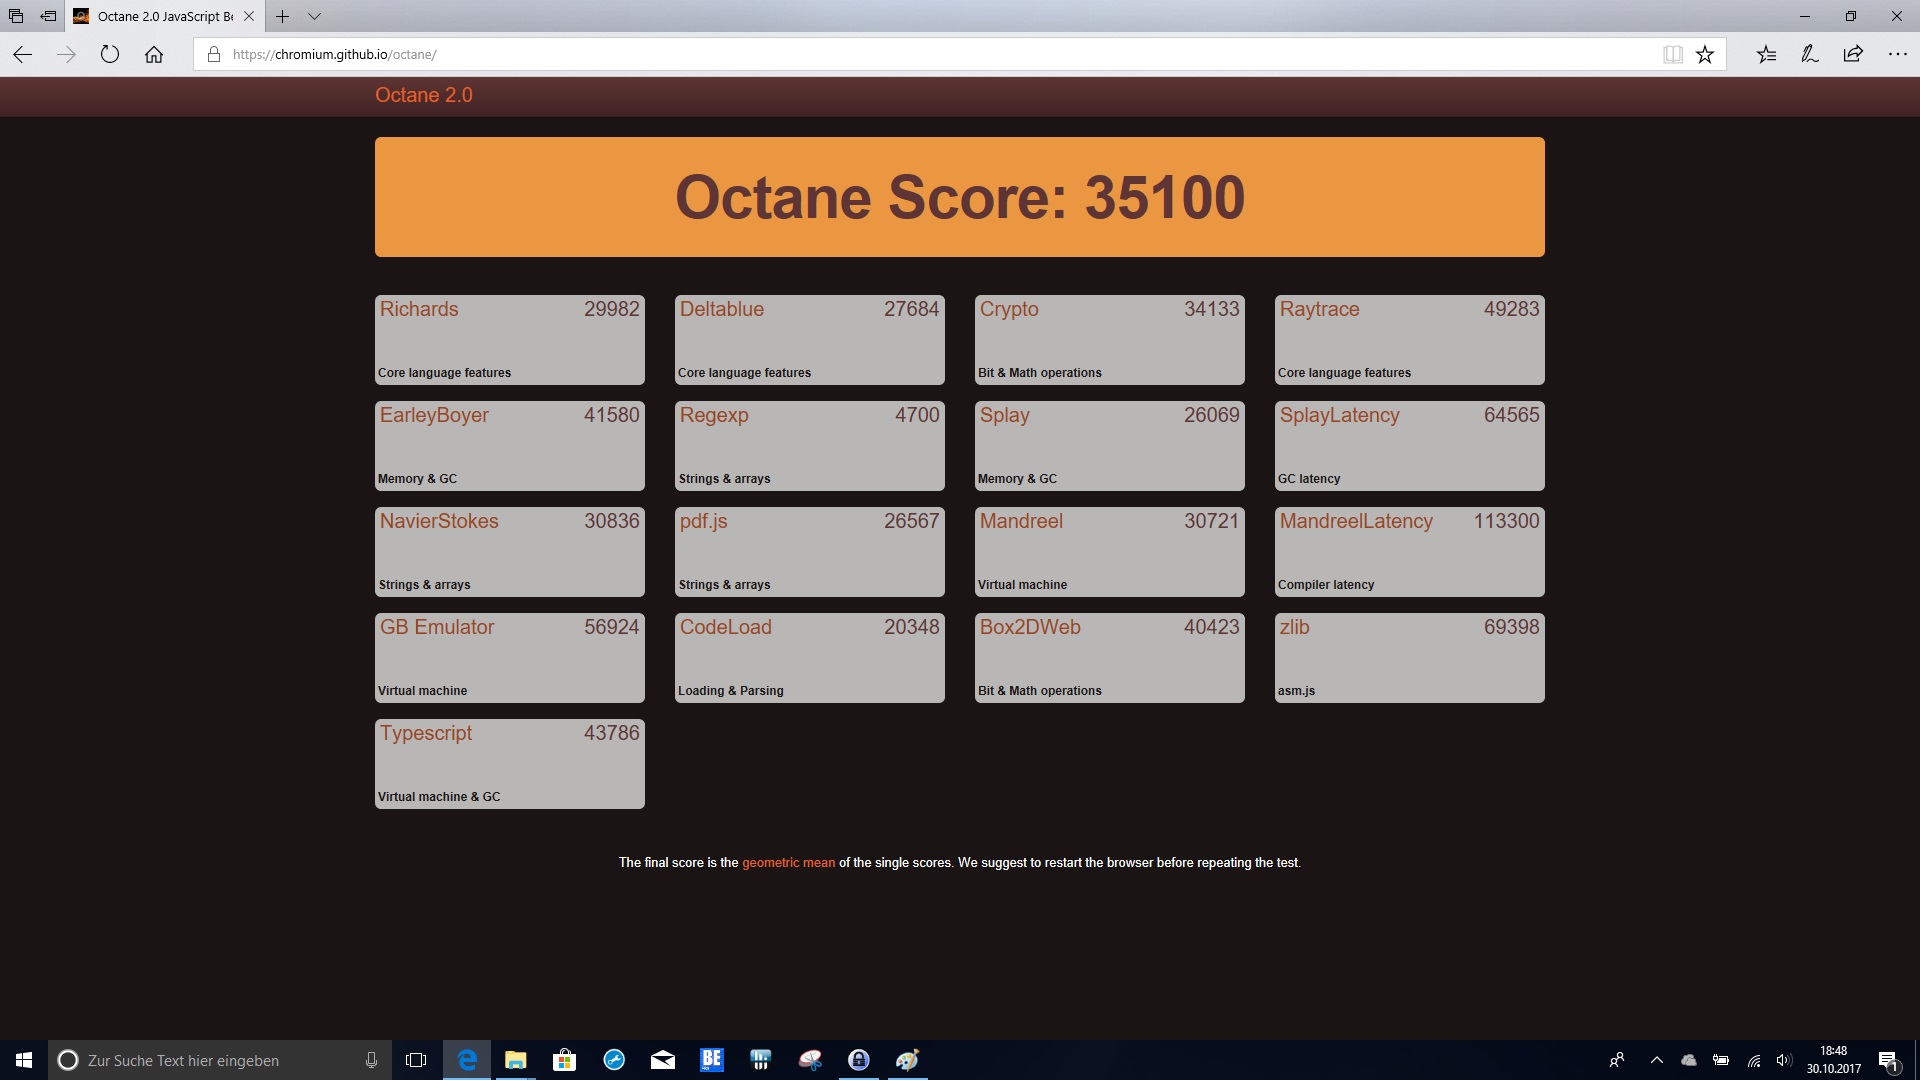
| Octane V2 - Total Score | |
| Acer Aspire 5 A517-51G-80L | |
| Dell Inspiron 17-7773-0043 | |
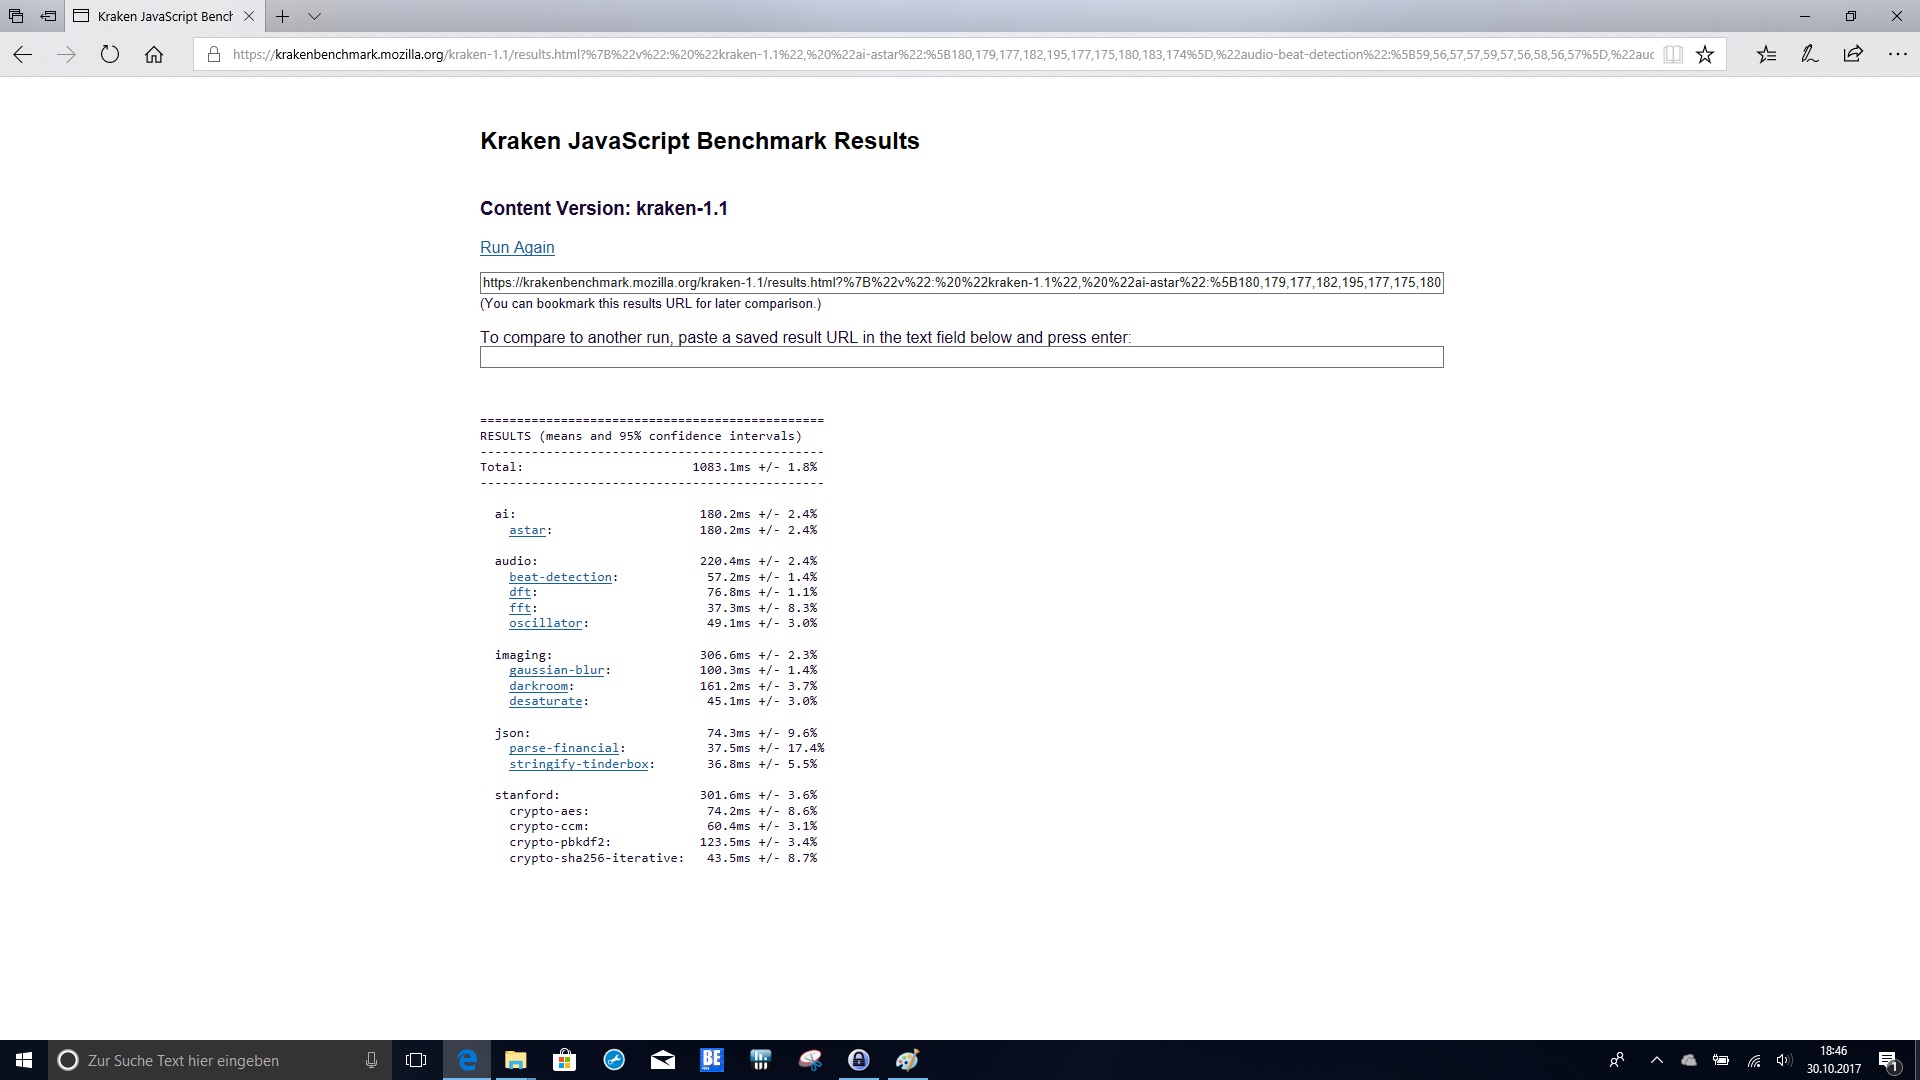
| Mozilla Kraken 1.1 - Total | |
| Dell Inspiron 17-7773-0043 | |
| Acer Aspire 5 A517-51G-80L | |
* ... Meglio usare valori piccoli
| PCMark 10 | |
| Score | |
| Acer Aspire 5 A517-51G-80L | |
| Dell Inspiron 17-7773-0043 | |
| Productivity | |
| Acer Aspire 5 A517-51G-80L | |
| Dell Inspiron 17-7773-0043 | |
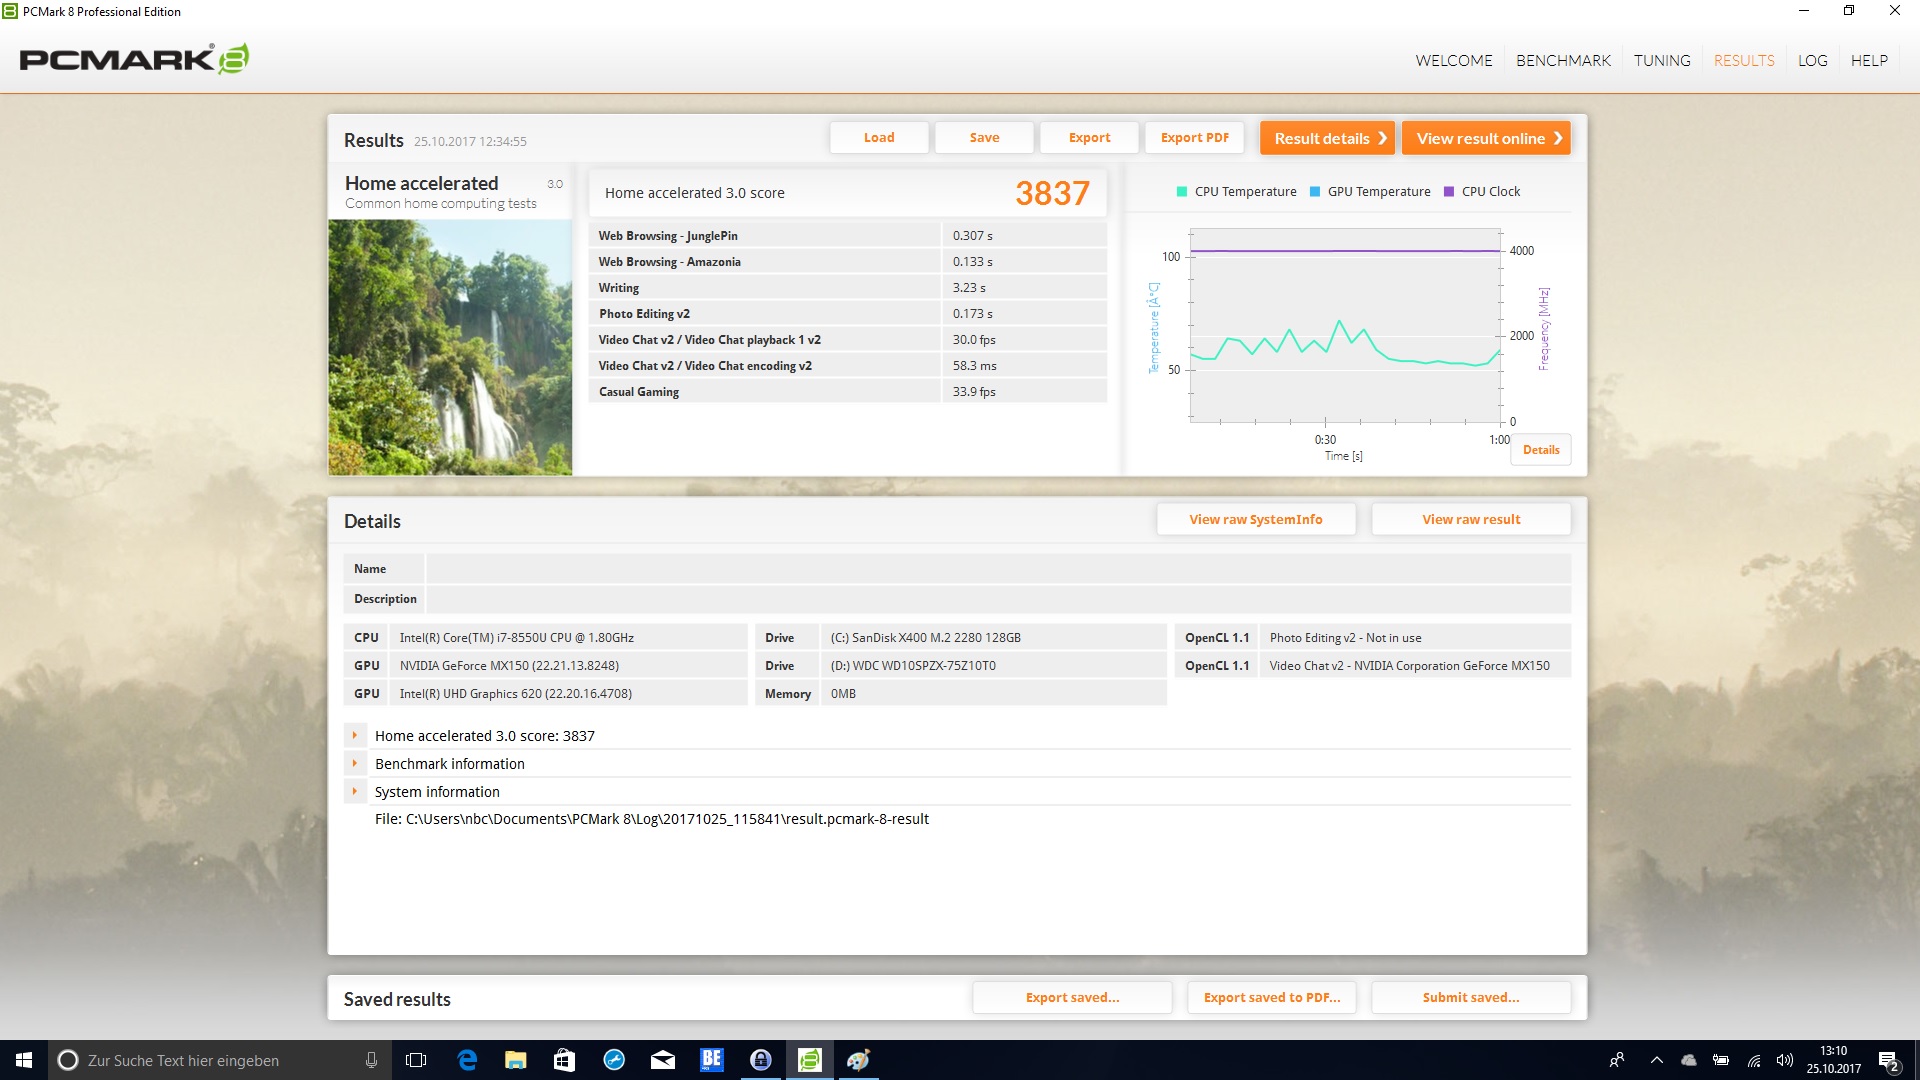
| PCMark 8 Home Score Accelerated v2 | 3837 punti | |
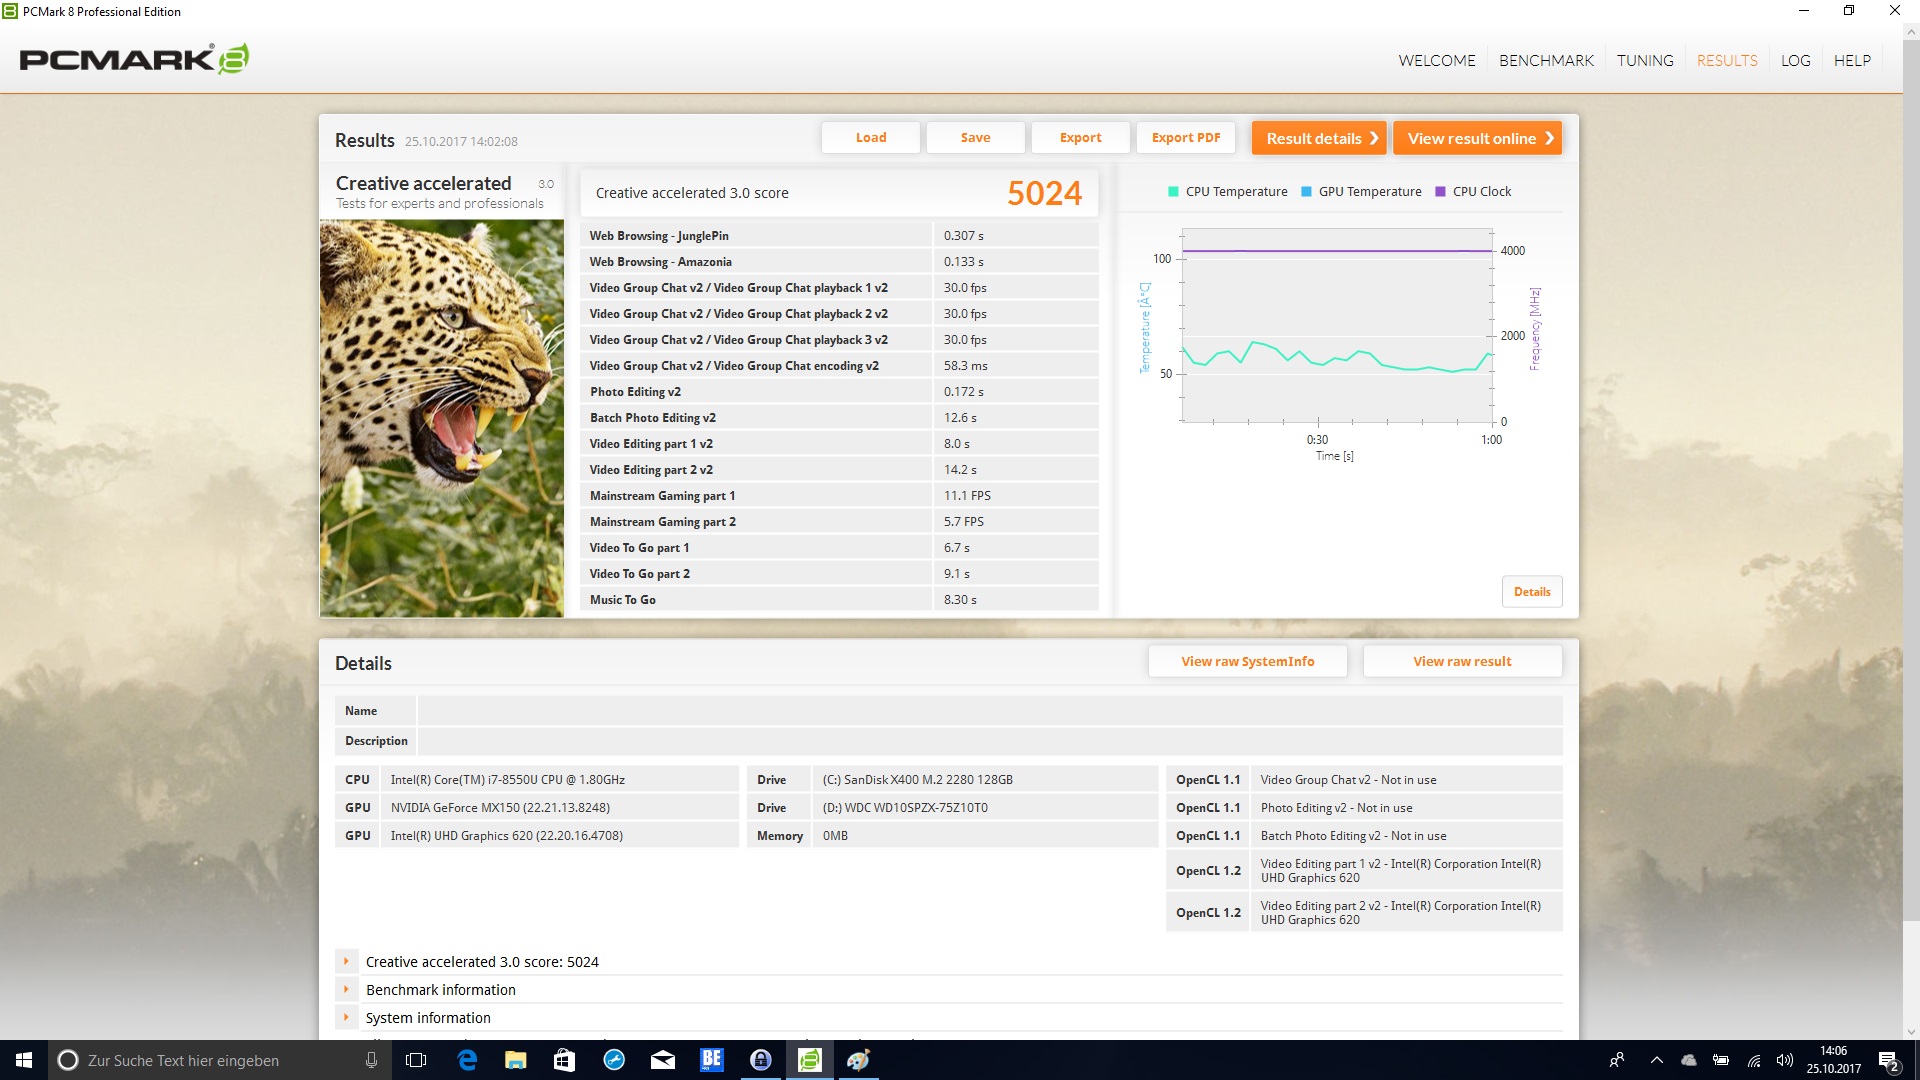
| PCMark 8 Creative Score Accelerated v2 | 5024 punti | |
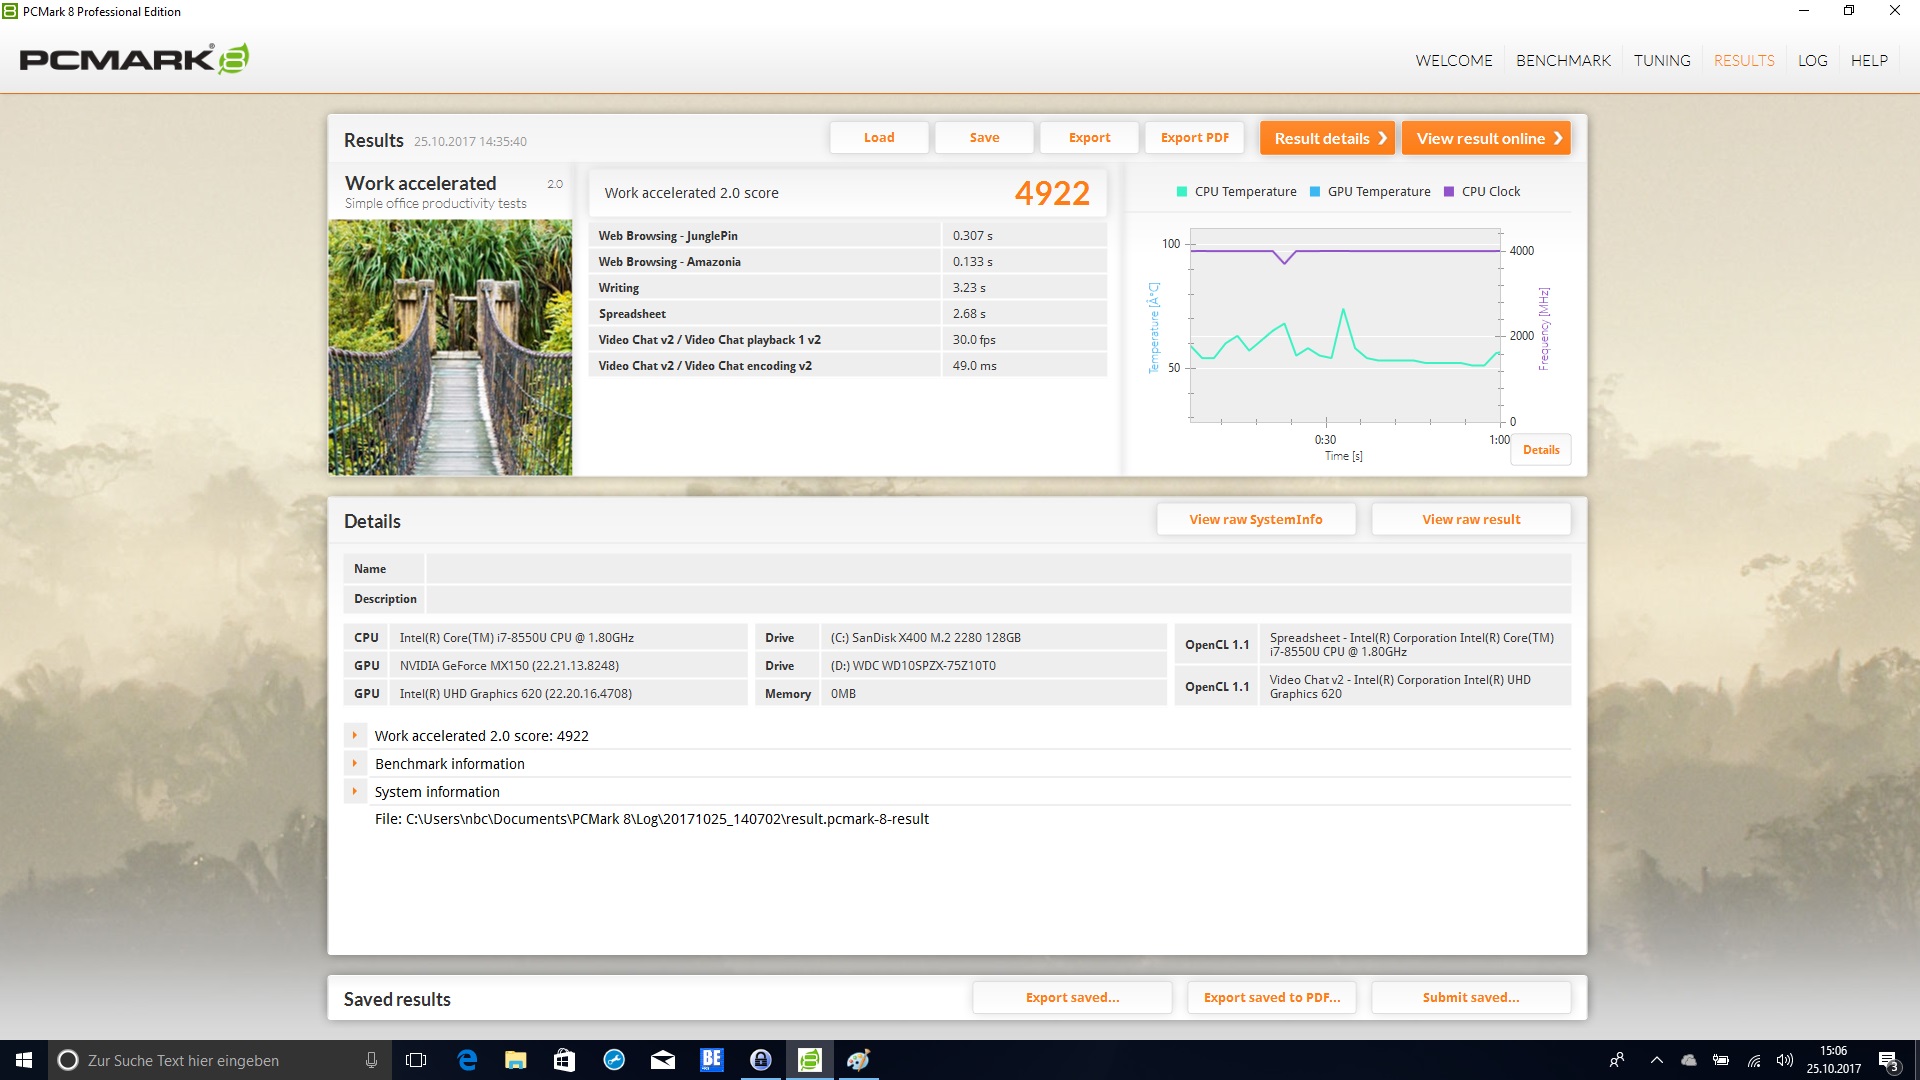
| PCMark 8 Work Score Accelerated v2 | 4922 punti | |
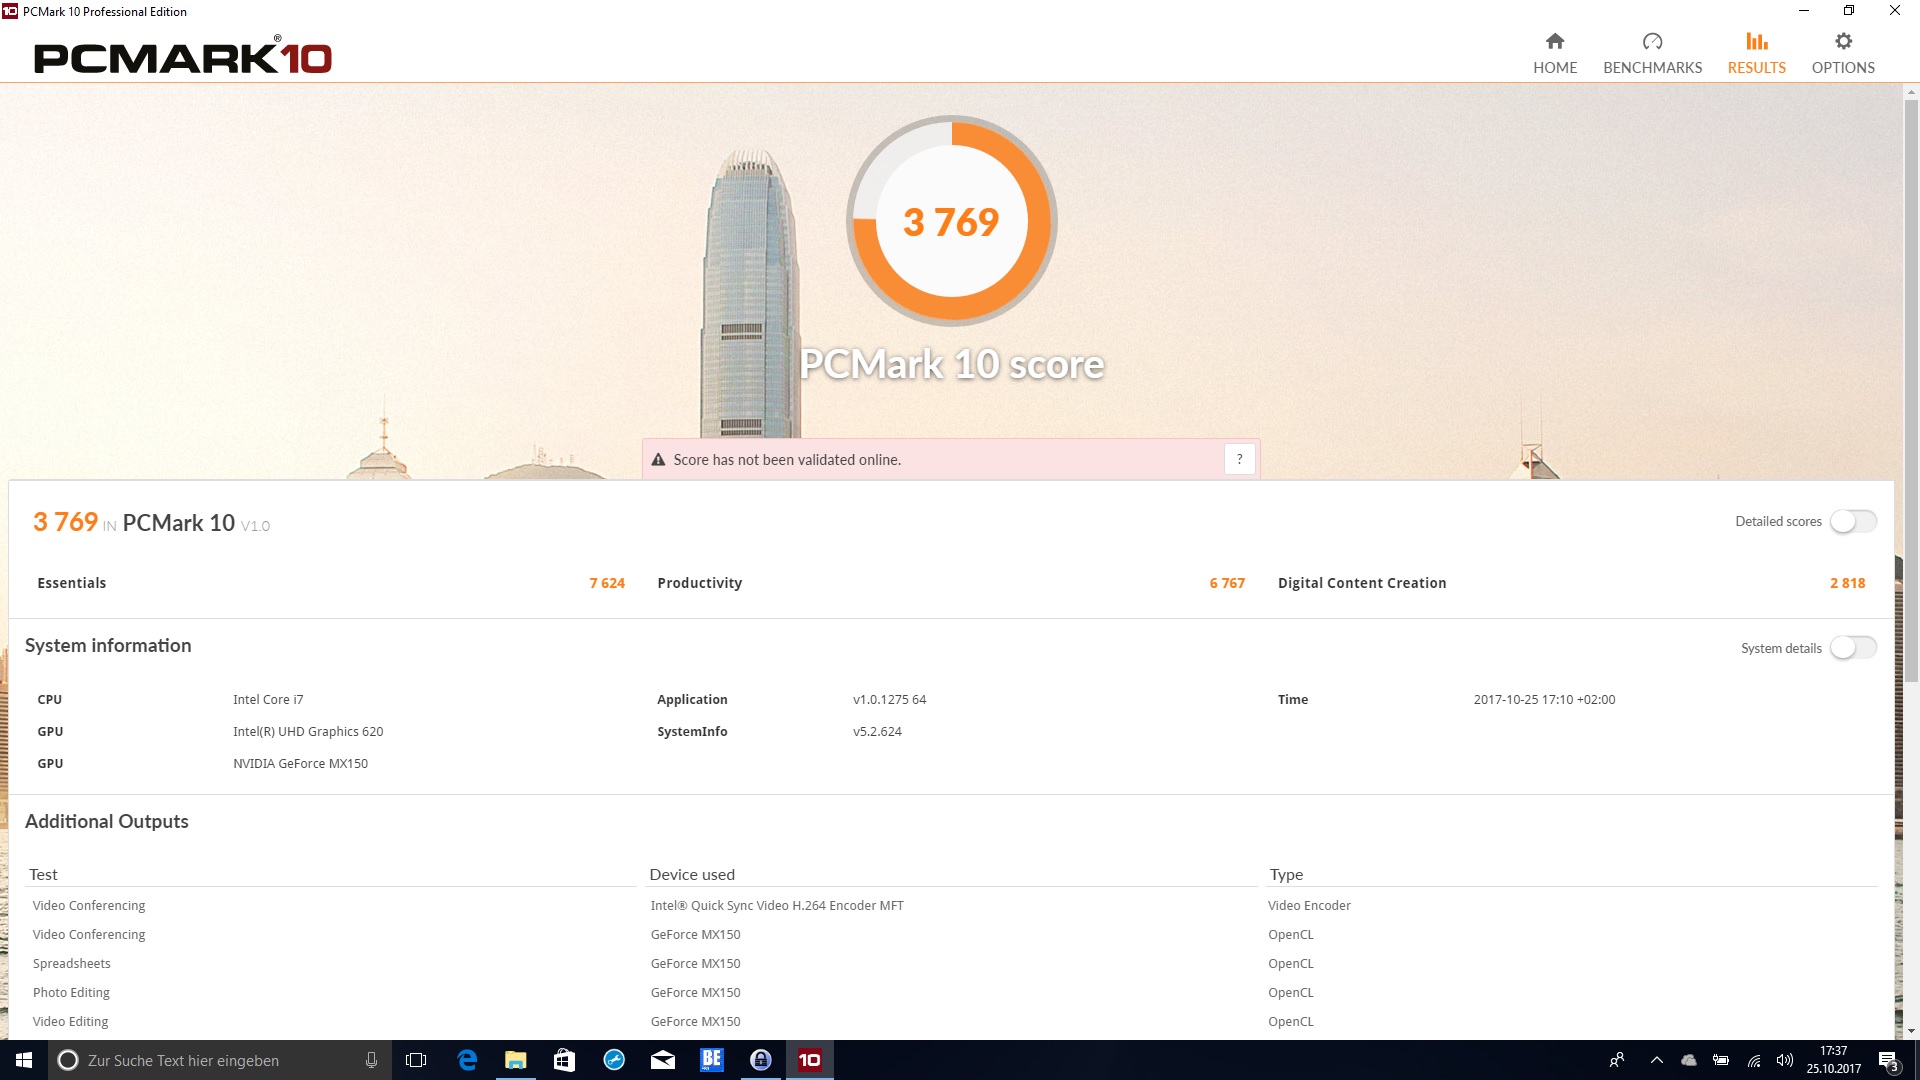
| PCMark 10 Score | 3769 punti | |
Aiuto | ||
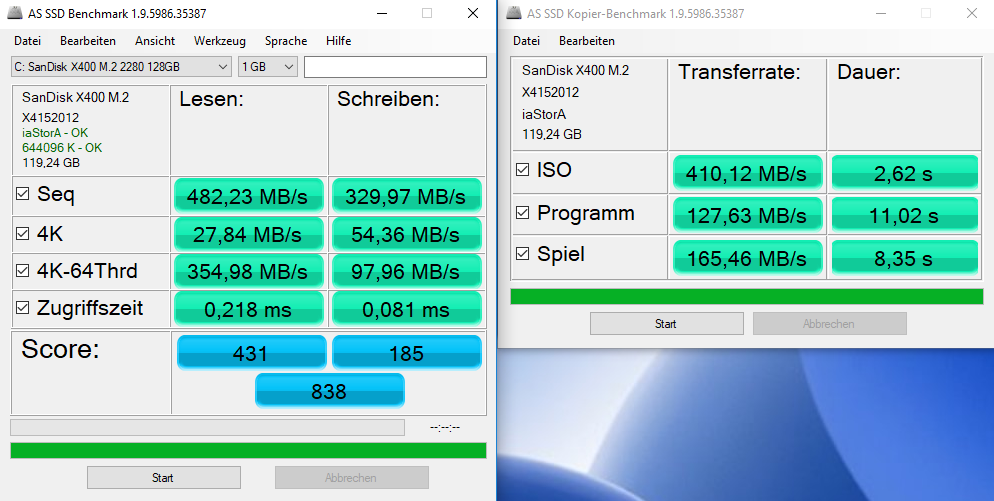
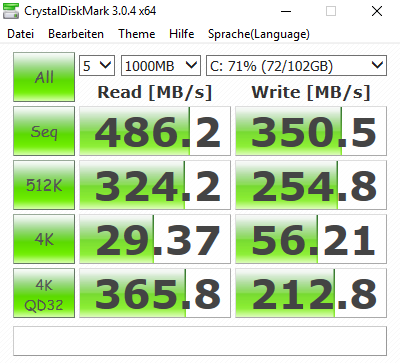
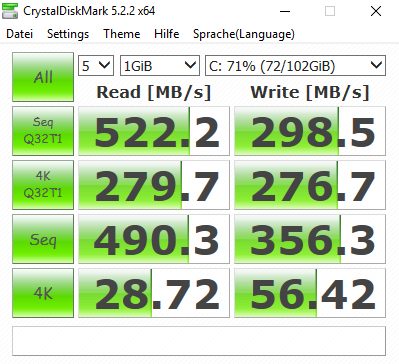
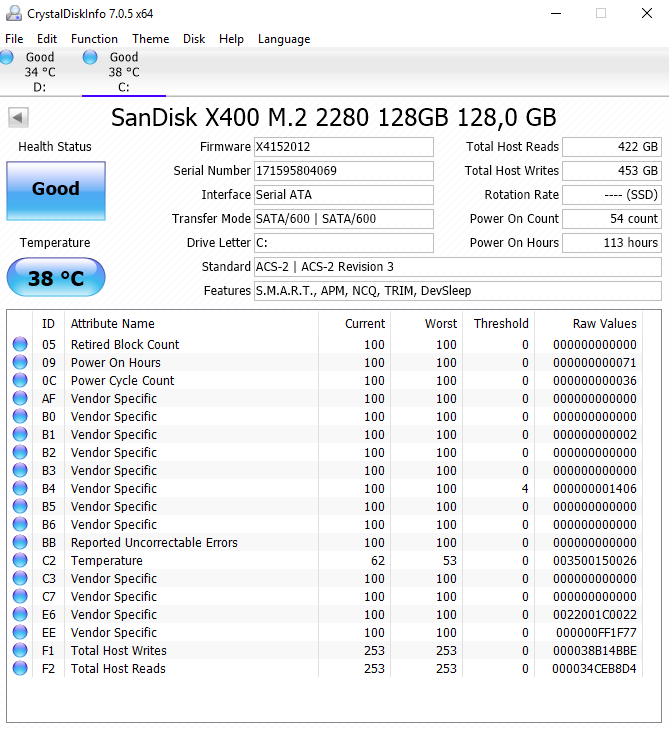
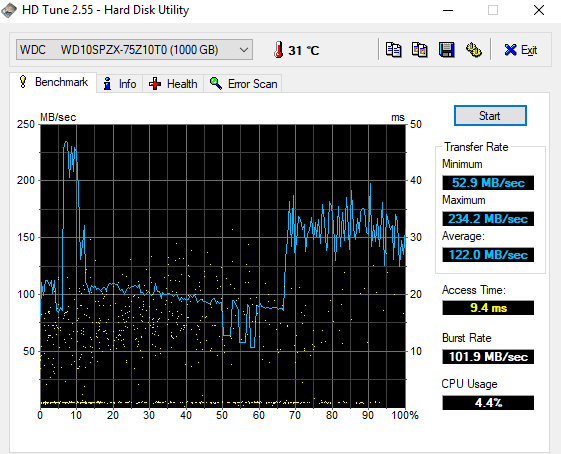
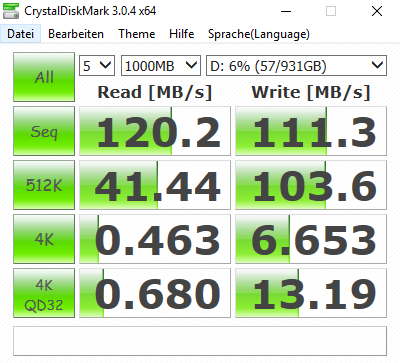
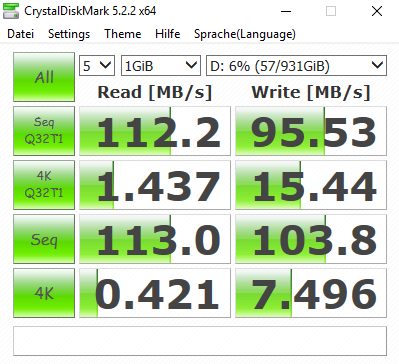
| Dell Inspiron 17-7773-0043 SanDisk X400 M.2 2280 128GB | Dell Inspiron 17 7778 Liteonit CV3-CE512 | Acer Aspire 5 A517-51G-80L Micron 1100 MTFDDAV256TBN | Acer Aspire Nitro BE VN7-793G-5811 Seagate Mobile HDD 1TB ST1000LM035 | HP Omen 17-w206ng Samsung PM961 MZVLW256HEHP | Acer Aspire 7 A717-71G-72VY Toshiba MQ01ABD100 | |
|---|---|---|---|---|---|---|
| CrystalDiskMark 3.0 | 13% | 5% | -86% | 165% | -91% | |
| Read Seq (MB/s) | 486.2 | 486.4 0% | 480.1 -1% | 117.6 -76% | 1606 230% | 108.7 -78% |
| Write Seq (MB/s) | 350.5 | 438.4 25% | 385.6 10% | 109.1 -69% | 1176 236% | 100.7 -71% |
| Read 512 (MB/s) | 324.2 | 232.8 -28% | 295.6 -9% | 39.93 -88% | 846 161% | 29.74 -91% |
| Write 512 (MB/s) | 254.8 | 386.7 52% | 302.5 19% | 98.6 -61% | 805 216% | 28.06 -89% |
| Read 4k (MB/s) | 29.37 | 32.3 10% | 27.58 -6% | 0.435 -99% | 59.9 104% | 0.345 -99% |
| Write 4k (MB/s) | 56.2 | 65.8 17% | 81.4 45% | 3.152 -94% | 155.6 177% | 0.78 -99% |
| Read 4k QD32 (MB/s) | 365.8 | 334.4 -9% | 247.4 -32% | 1.008 -100% | 588 61% | 0.688 -100% |
| Write 4k QD32 (MB/s) | 212.8 | 289.5 36% | 237.7 12% | 4.705 -98% | 505 137% | 0.767 -100% |

| 3DMark | |
| 1280x720 Cloud Gate Standard Graphics | |
| Acer Aspire 7 A717-71G-72VY | |
| Acer Aspire Nitro BE VN7-793G-5811 | |
| Dell Inspiron 17-7773-0043 | |
| Acer Aspire 5 A517-51G-80L | |
| Dell Inspiron 17 7778 | |
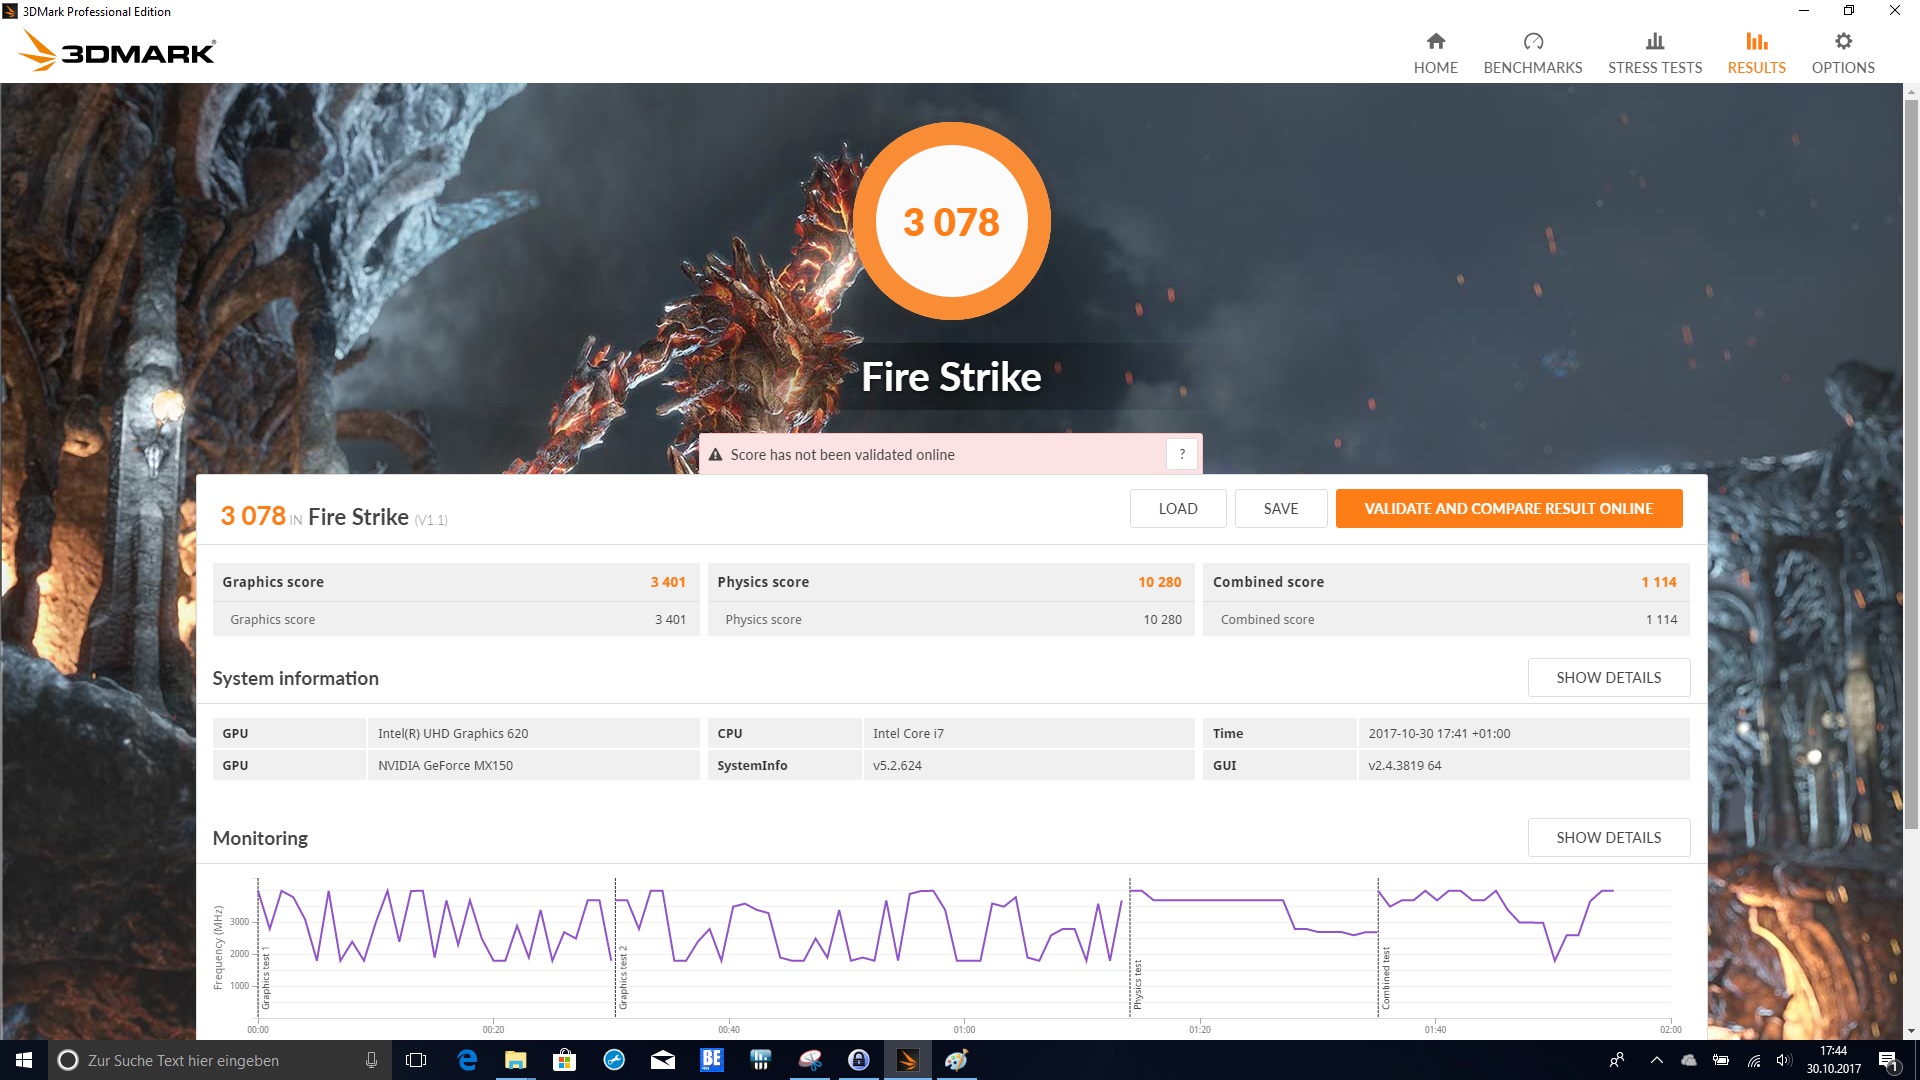
| 1920x1080 Fire Strike Graphics | |
| Acer Aspire 7 A717-71G-72VY | |
| Acer Aspire Nitro BE VN7-793G-5811 | |
| Acer Aspire 5 A517-51G-80L | |
| Dell Inspiron 17-7773-0043 | |
| Dell Inspiron 17 7778 | |
| 3DMark 11 - 1280x720 Performance GPU | |
| Acer Aspire 7 A717-71G-72VY | |
| Acer Aspire Nitro BE VN7-793G-5811 | |
| HP Omen 17-w206ng | |
| Acer Aspire 5 A517-51G-80L | |
| Dell Inspiron 17-7773-0043 | |
| Dell Inspiron 17 7778 | |
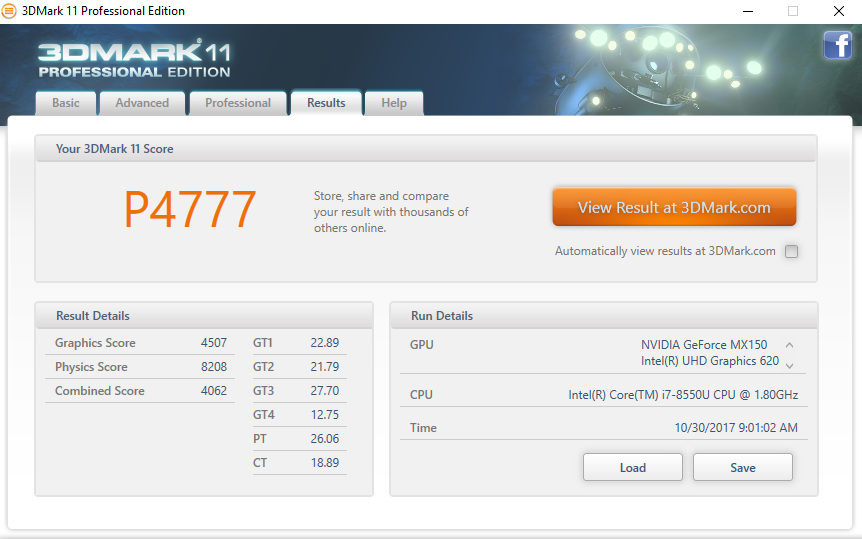
| 3DMark 11 Performance | 4777 punti | |
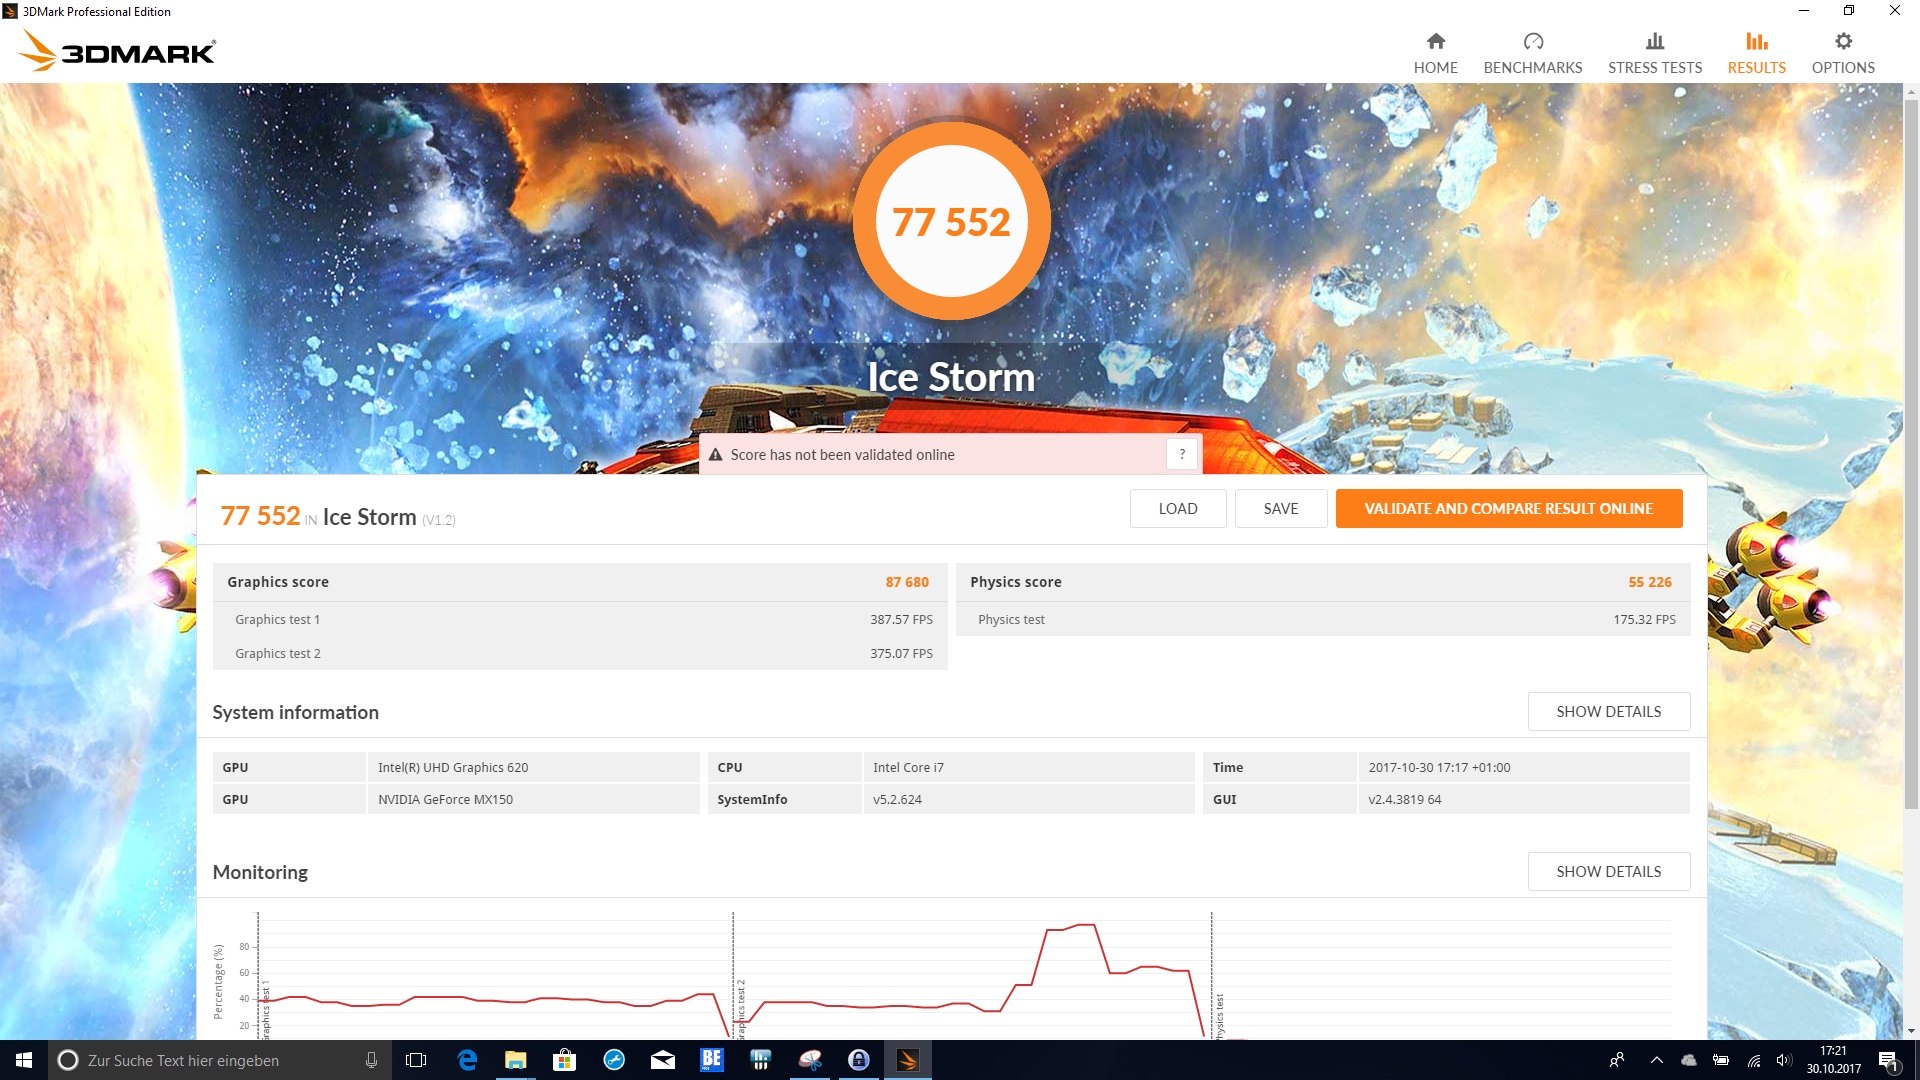
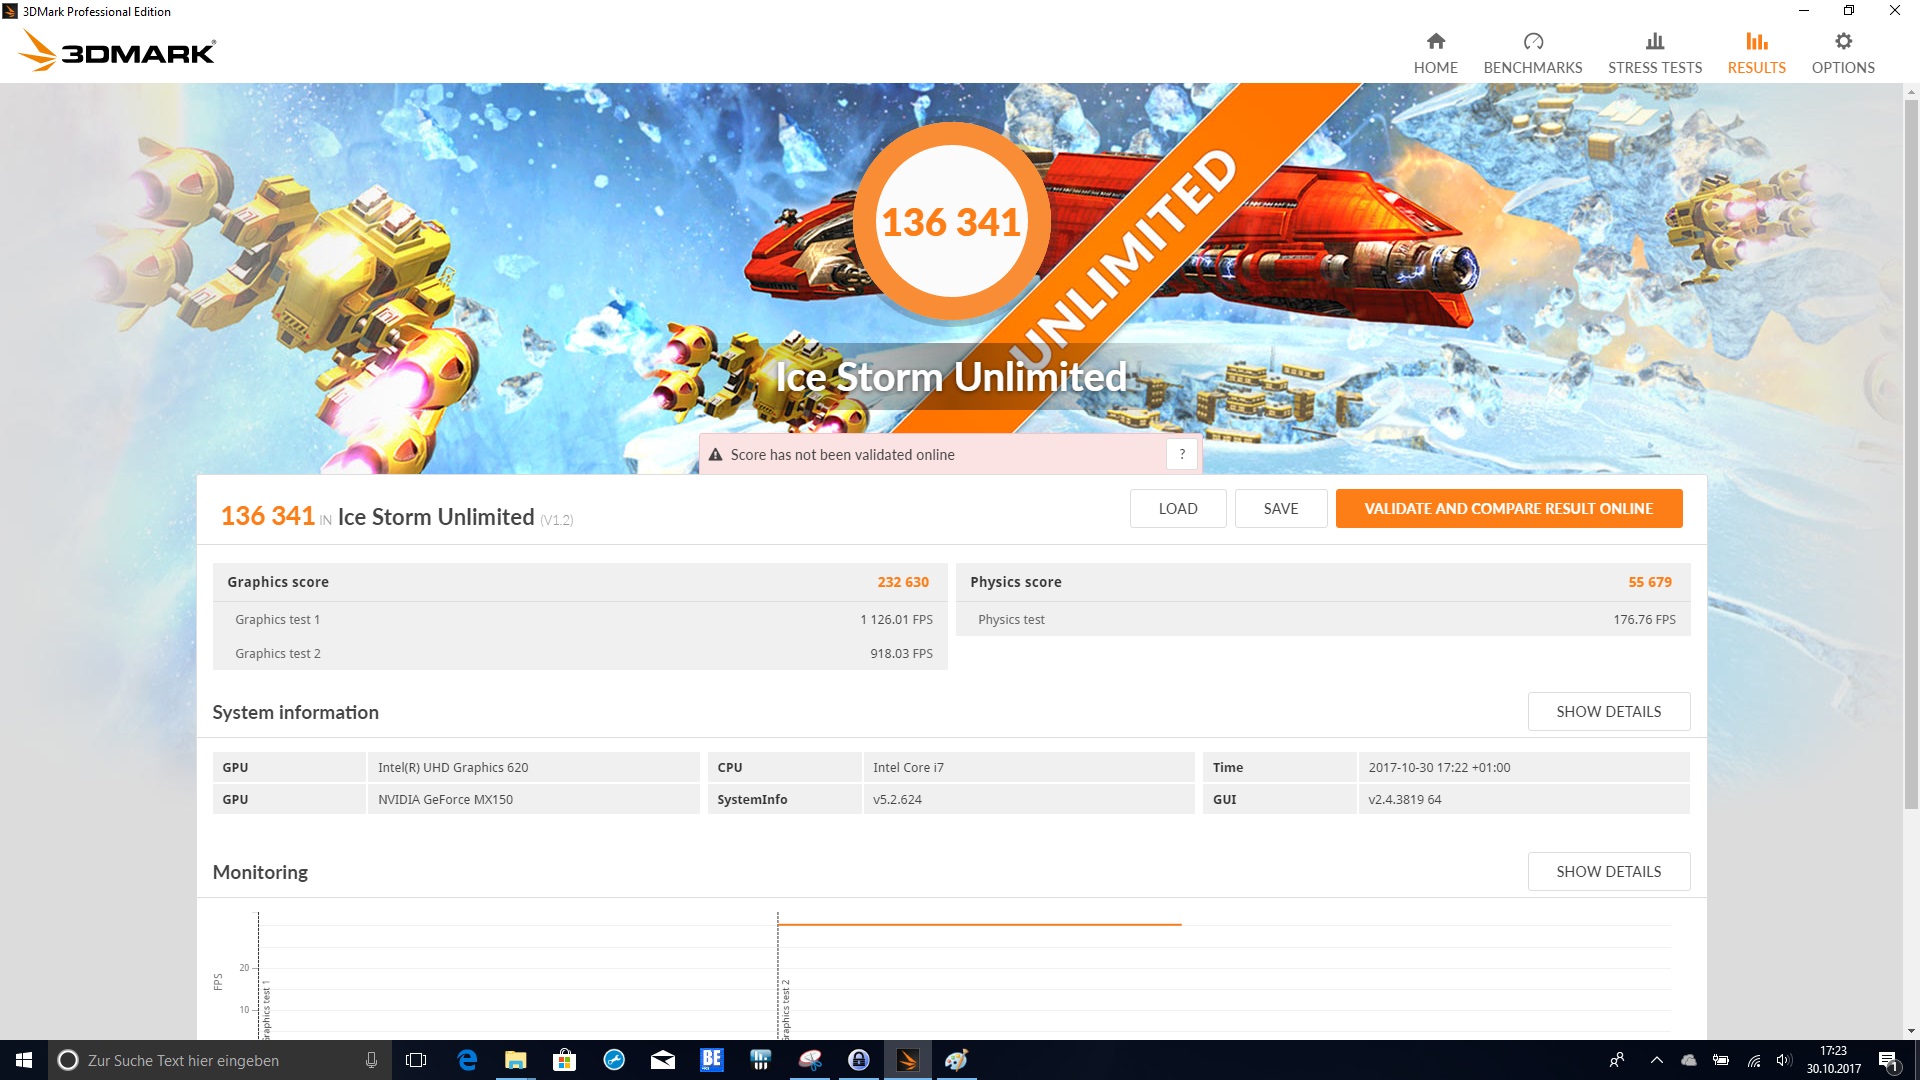
| 3DMark Ice Storm Standard Score | 77552 punti | |
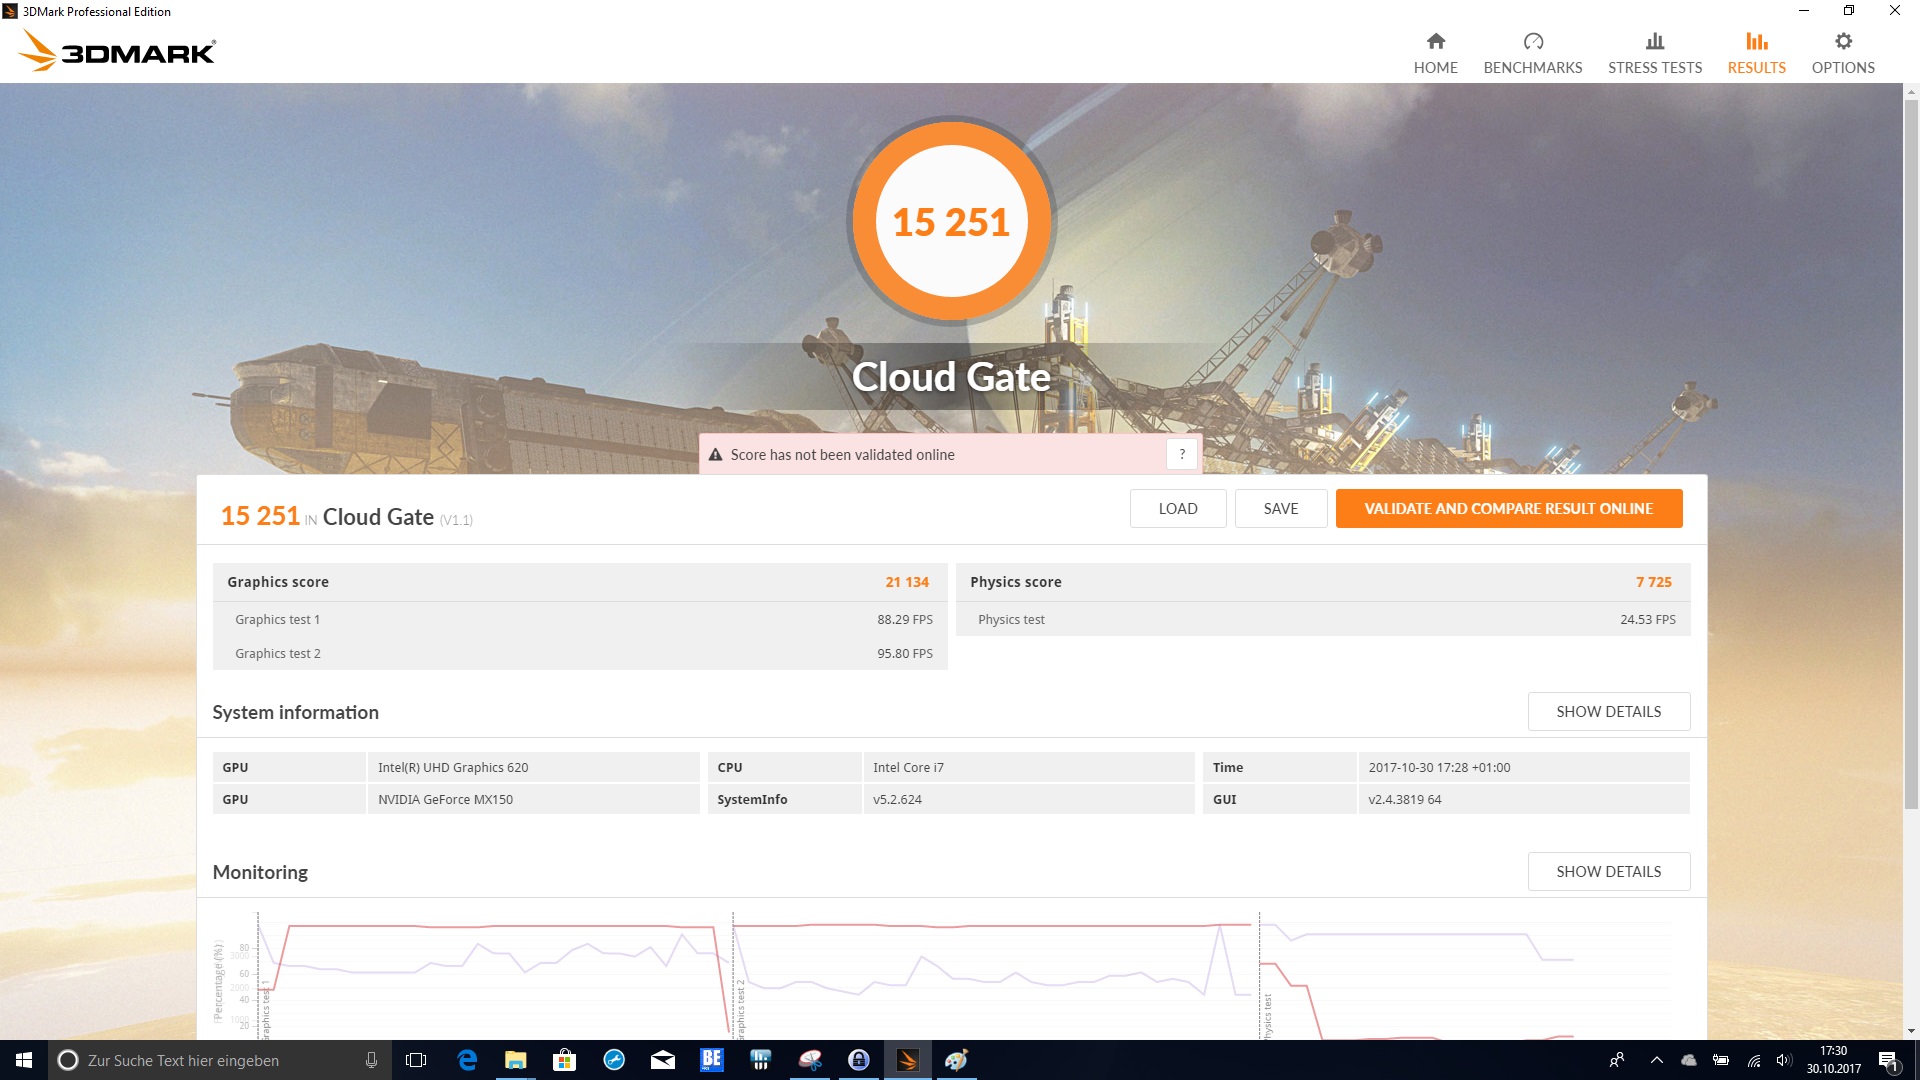
| 3DMark Cloud Gate Standard Score | 15251 punti | |
| 3DMark Fire Strike Score | 3078 punti | |
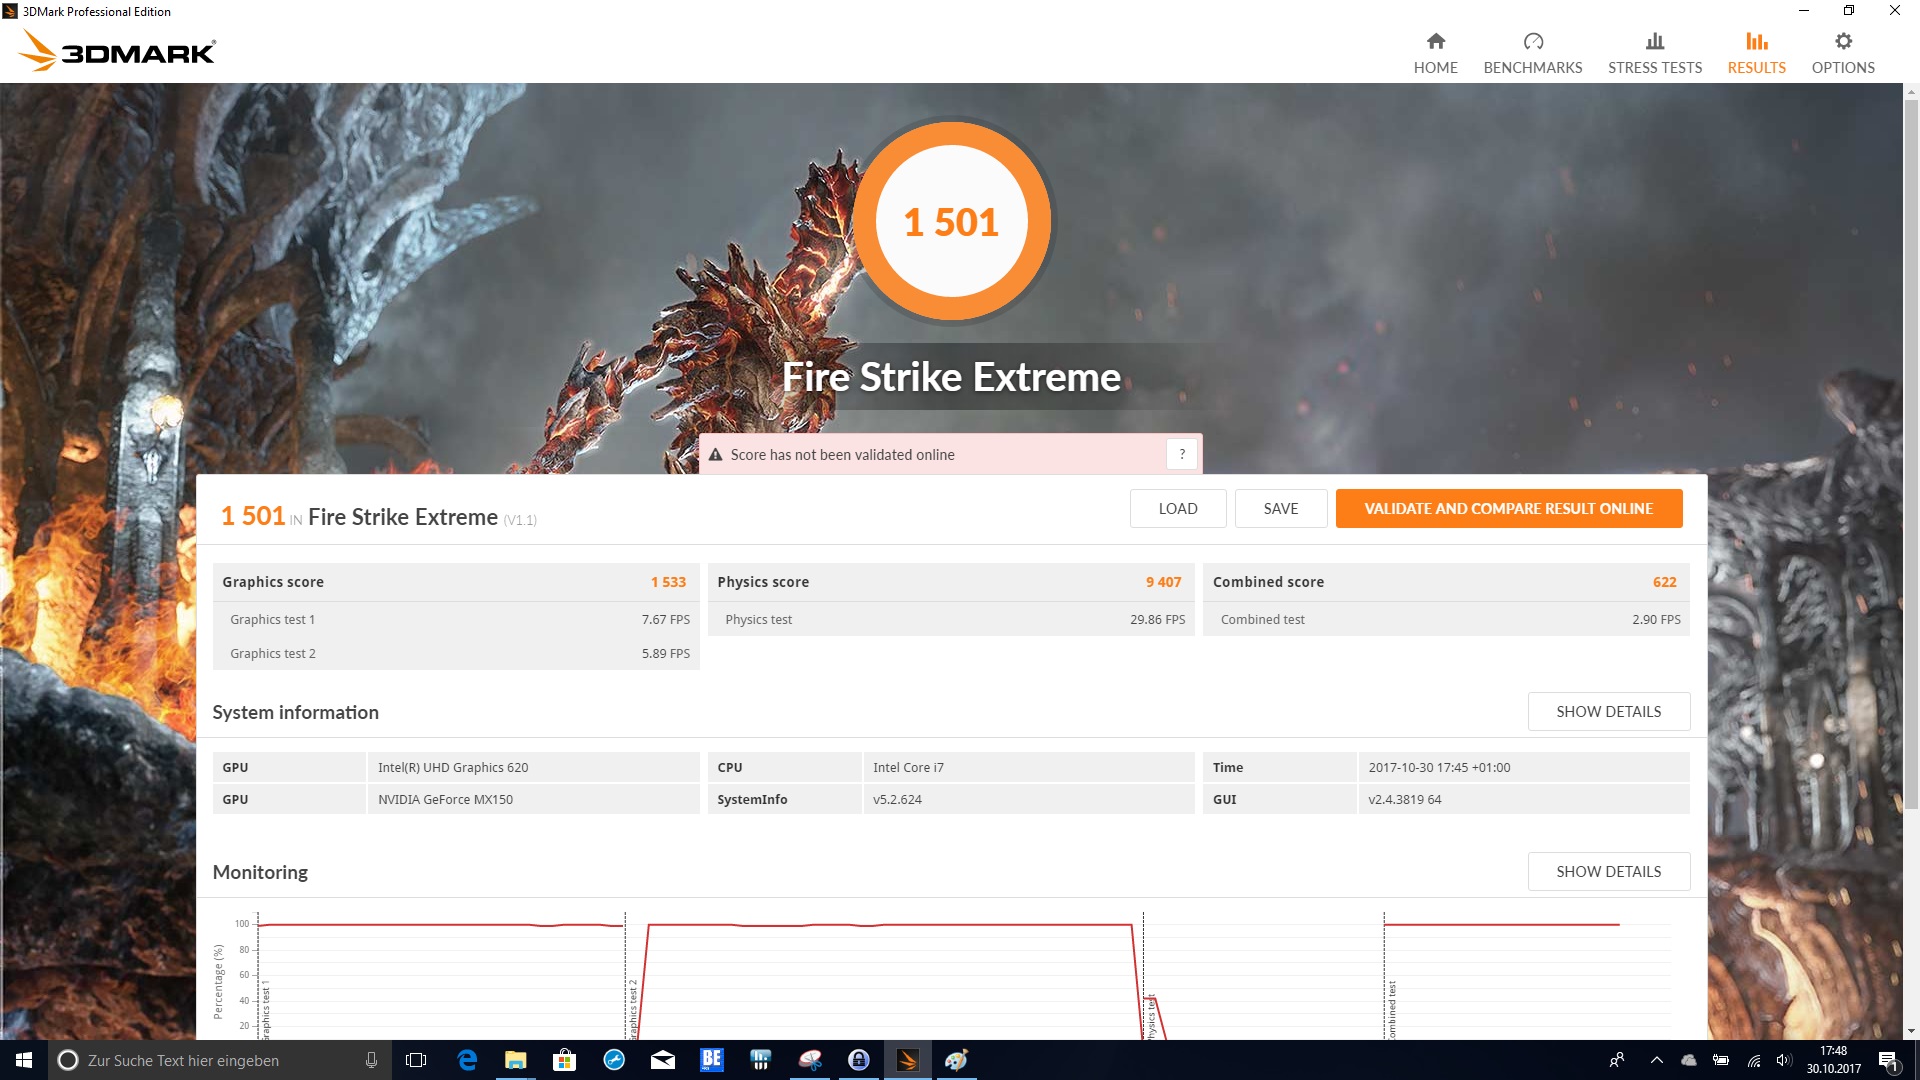
| 3DMark Fire Strike Extreme Score | 1501 punti | |
Aiuto | ||
| basso | medio | alto | ultra | |
|---|---|---|---|---|
| BioShock Infinite (2013) | 170 | 85.9 | 70.4 | 30.5 |
| Battlefield 4 (2013) | 111.1 | 66.7 | 26 | 17.9 |
| Rise of the Tomb Raider (2016) | 61.1 | 32.4 | 18.4 | 15.2 |
Rumorosità
| Idle |
| 30.6 / 30.6 / 32.2 dB(A) |
| Sotto carico |
| 40.5 / 39.5 dB(A) |
 | ||
30 dB silenzioso 40 dB(A) udibile 50 dB(A) rumoroso |
||
min: | ||
| Dell Inspiron 17-7773-0043 GeForce MX150, i5-8550U, SanDisk X400 M.2 2280 128GB | Dell Inspiron 17 7778 GeForce 940MX, 6500U, Liteonit CV3-CE512 | Acer Aspire 5 A517-51G-80L GeForce MX150, i5-8550U, Micron 1100 MTFDDAV256TBN | Acer Aspire Nitro BE VN7-793G-5811 GeForce GTX 1050 Ti Mobile, i5-7300HQ, Seagate Mobile HDD 1TB ST1000LM035 | HP Omen 17-w206ng GeForce GTX 1050 Ti Mobile, i7-7700HQ, Samsung PM961 MZVLW256HEHP | Acer Aspire 7 A717-71G-72VY GeForce GTX 1060 Mobile, i7-7700HQ, Toshiba MQ01ABD100 | |
|---|---|---|---|---|---|---|
| Noise | -5% | 7% | 3% | -14% | 0% | |
| off /ambiente * (dB) | 30.3 | 32.1 -6% | 29.4 3% | 29.7 2% | 30 1% | 30.1 1% |
| Idle Minimum * (dB) | 30.6 | 32.1 -5% | 30.1 2% | 30.2 1% | 34 -11% | 31.4 -3% |
| Idle Average * (dB) | 30.6 | 32.1 -5% | 30.1 2% | 30.2 1% | 35 -14% | 31.4 -3% |
| Idle Maximum * (dB) | 32.2 | 34 -6% | 29.7 8% | 30.6 5% | 36 -12% | 31.7 2% |
| Load Average * (dB) | 40.5 | 40.3 -0% | 34.4 15% | 33.8 17% | 47 -16% | 35.2 13% |
| Load Maximum * (dB) | 39.5 | 42.6 -8% | 34.4 13% | 42.6 -8% | 52 -32% | 43.5 -10% |
| Witcher 3 ultra * (dB) | 39.5 | 48 | 39.9 |
* ... Meglio usare valori piccoli
(±) La temperatura massima sul lato superiore è di 42.7 °C / 109 F, rispetto alla media di 36.8 °C / 98 F, che varia da 21 a 71 °C per questa classe Multimedia.
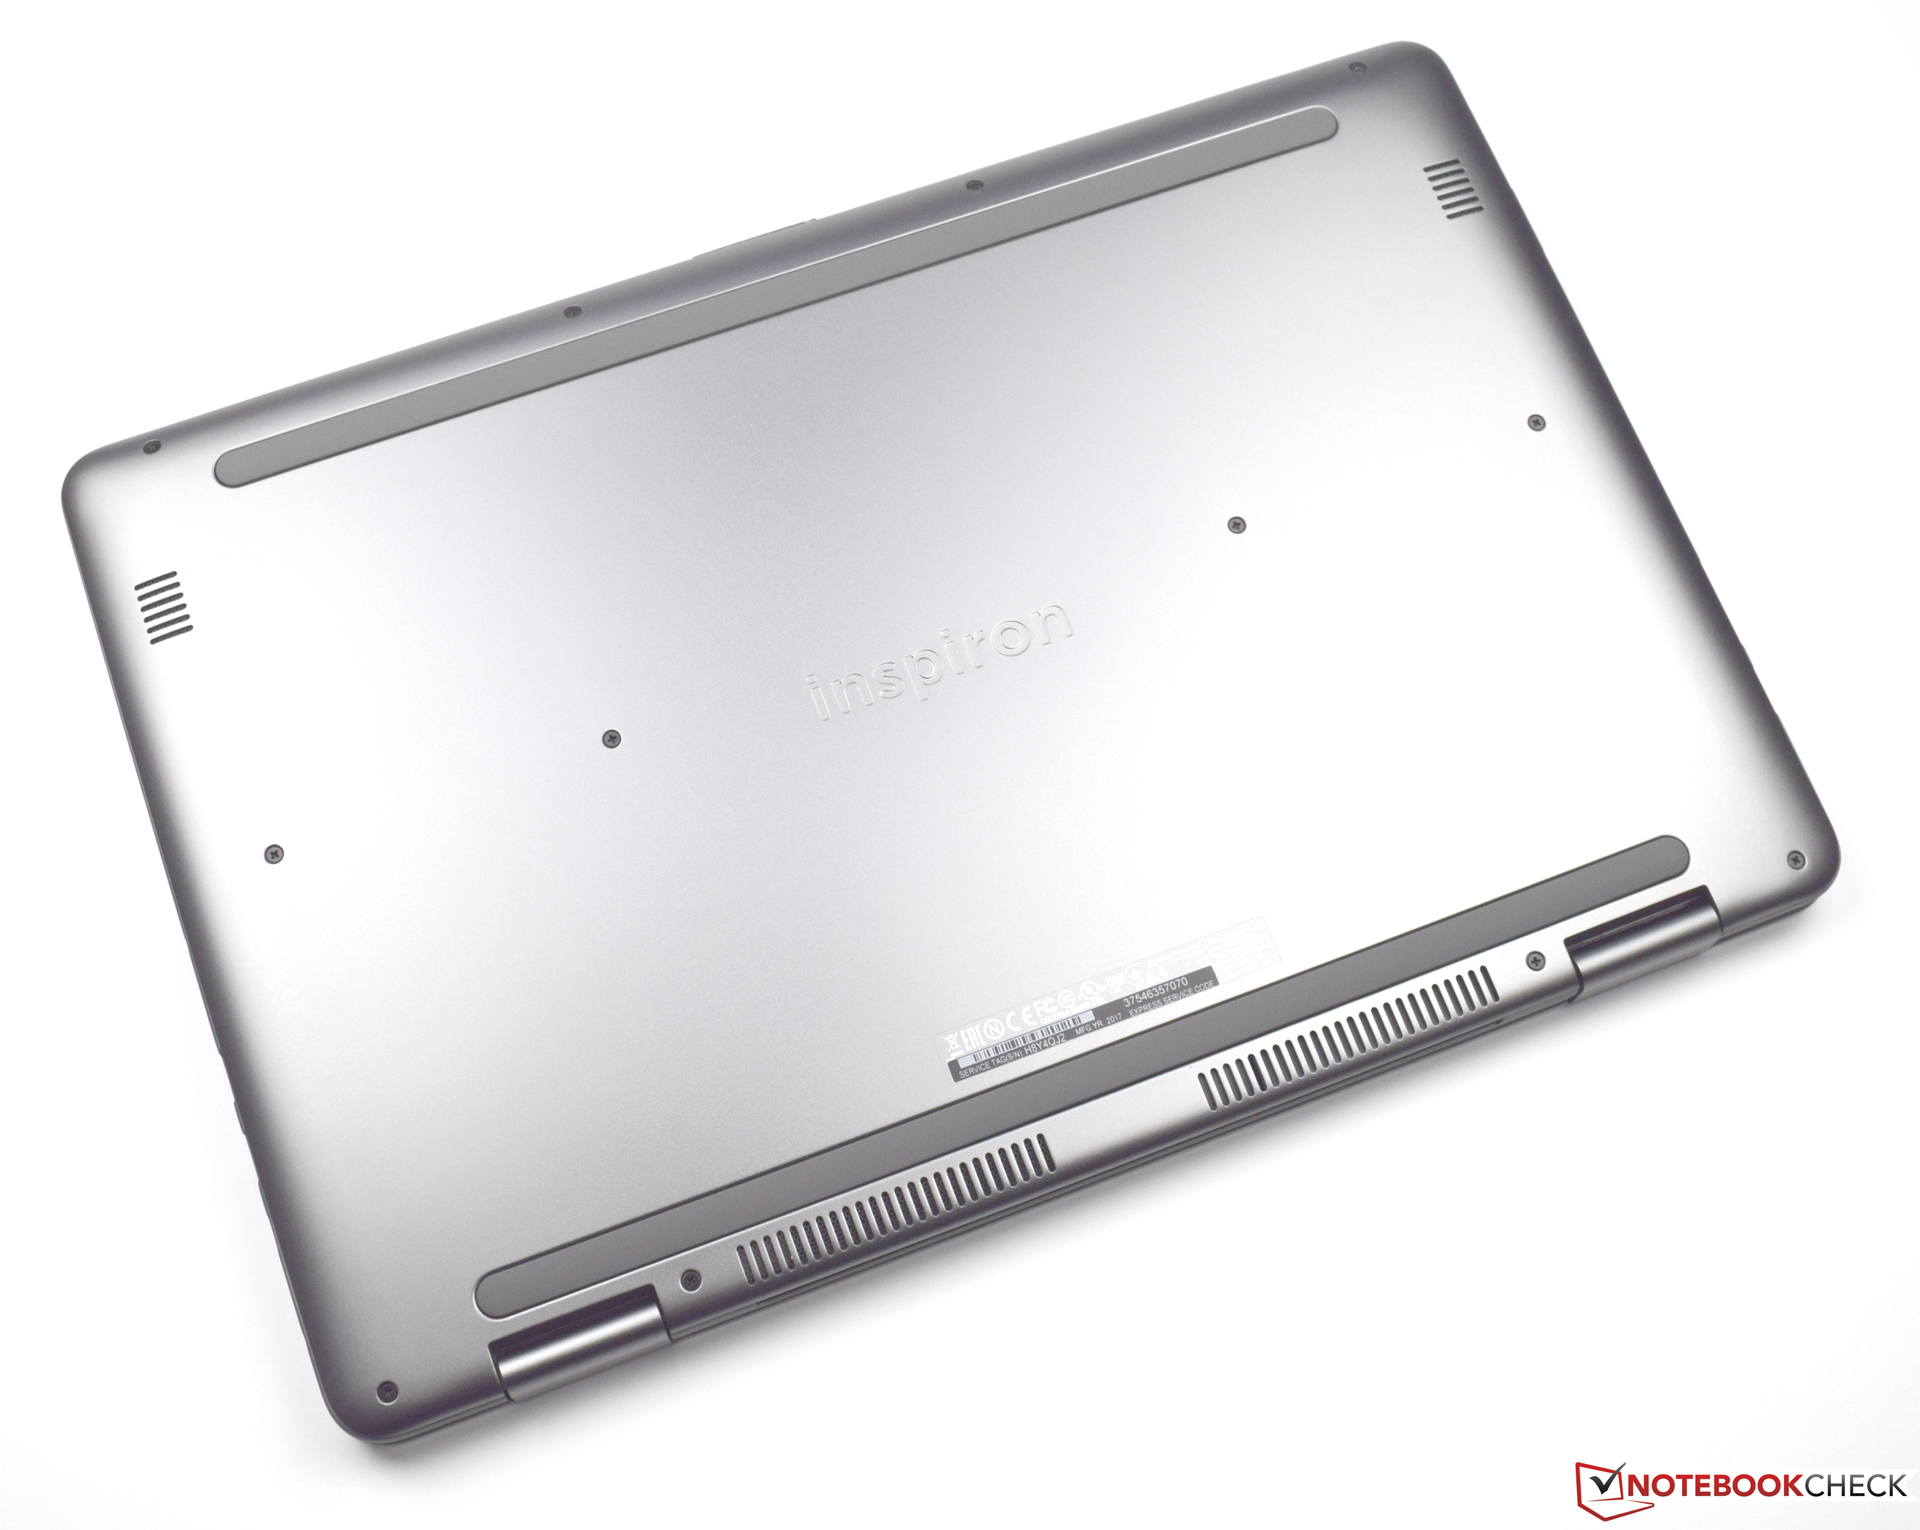
(-) Il lato inferiore si riscalda fino ad un massimo di 47.2 °C / 117 F, rispetto alla media di 39.1 °C / 102 F
(+) In idle, la temperatura media del lato superiore è di 27.3 °C / 81 F, rispetto alla media deld ispositivo di 31.3 °C / 88 F.
(+) I poggiapolsi e il touchpad sono piu' freddi della temperatura della pelle con un massimo di 29.2 °C / 84.6 F e sono quindi freddi al tatto.
(±) La temperatura media della zona del palmo della mano di dispositivi simili e'stata di 28.7 °C / 83.7 F (-0.5 °C / -0.9 F).
| Dell Inspiron 17-7773-0043 GeForce MX150, i5-8550U, SanDisk X400 M.2 2280 128GB | Dell Inspiron 17 7778 GeForce 940MX, 6500U, Liteonit CV3-CE512 | Acer Aspire 5 A517-51G-80L GeForce MX150, i5-8550U, Micron 1100 MTFDDAV256TBN | Acer Aspire Nitro BE VN7-793G-5811 GeForce GTX 1050 Ti Mobile, i5-7300HQ, Seagate Mobile HDD 1TB ST1000LM035 | HP Omen 17-w206ng GeForce GTX 1050 Ti Mobile, i7-7700HQ, Samsung PM961 MZVLW256HEHP | Acer Aspire 7 A717-71G-72VY GeForce GTX 1060 Mobile, i7-7700HQ, Toshiba MQ01ABD100 | |
|---|---|---|---|---|---|---|
| Heat | -4% | 14% | -1% | -14% | -7% | |
| Maximum Upper Side * (°C) | 42.7 | 44.7 -5% | 40.4 5% | 48 -12% | 55.6 -30% | 48 -12% |
| Maximum Bottom * (°C) | 47.2 | 45.5 4% | 37 22% | 40.8 14% | 57.7 -22% | 46.6 1% |
| Idle Upper Side * (°C) | 28.4 | 31 -9% | 25.3 11% | 29.9 -5% | 32.2 -13% | 31.1 -10% |
| Idle Bottom * (°C) | 29.7 | 31.4 -6% | 24.7 17% | 29.8 -0% | 27.2 8% | 31.7 -7% |
* ... Meglio usare valori piccoli
Dell Inspiron 17-7773-0043 analisi audio
(-) | altoparlanti non molto potenti (67.2 dB)
Bassi 100 - 315 Hz
(±) | bassi ridotti - in media 14.8% inferiori alla media
(±) | la linearità dei bassi è media (12.9% delta rispetto alla precedente frequenza)
Medi 400 - 2000 Hz
(+) | medi bilanciati - solo only 4.1% rispetto alla media
(+) | medi lineari (6.4% delta rispetto alla precedente frequenza)
Alti 2 - 16 kHz
(+) | Alti bilanciati - appena 3.3% dalla media
(±) | la linearità degli alti è media (8.7% delta rispetto alla precedente frequenza)
Nel complesso 100 - 16.000 Hz
(±) | la linearità complessiva del suono è media (18.5% di differenza rispetto alla media
Rispetto alla stessa classe
» 57% di tutti i dispositivi testati in questa classe è stato migliore, 7% simile, 36% peggiore
» Il migliore ha avuto un delta di 5%, medio di 17%, peggiore di 45%
Rispetto a tutti i dispositivi testati
» 41% di tutti i dispositivi testati in questa classe è stato migliore, 8% similare, 51% peggiore
» Il migliore ha avuto un delta di 4%, medio di 24%, peggiore di 134%
Acer Aspire 5 A517-51G-80L analisi audio
(-) | altoparlanti non molto potenti (71.9 dB)
Bassi 100 - 315 Hz
(-) | quasi nessun basso - in media 15.8% inferiori alla media
(+) | bassi in lineaa (5% delta rispetto alla precedente frequenza)
Medi 400 - 2000 Hz
(+) | medi bilanciati - solo only 3.5% rispetto alla media
(±) | linearità dei medi adeguata (7.6% delta rispetto alla precedente frequenza)
Alti 2 - 16 kHz
(+) | Alti bilanciati - appena 3.6% dalla media
(+) | alti lineari (6.9% delta rispetto alla precedente frequenza)
Nel complesso 100 - 16.000 Hz
(±) | la linearità complessiva del suono è media (16.3% di differenza rispetto alla media
Rispetto alla stessa classe
» 41% di tutti i dispositivi testati in questa classe è stato migliore, 8% simile, 51% peggiore
» Il migliore ha avuto un delta di 5%, medio di 17%, peggiore di 45%
Rispetto a tutti i dispositivi testati
» 27% di tutti i dispositivi testati in questa classe è stato migliore, 6% similare, 68% peggiore
» Il migliore ha avuto un delta di 4%, medio di 24%, peggiore di 134%
| Off / Standby | |
| Idle | |
| Sotto carico |
|
Leggenda:
min: | |
| Dell Inspiron 17-7773-0043 i5-8550U, GeForce MX150, SanDisk X400 M.2 2280 128GB, IPS, 1920x1080, 17.3" | Dell Inspiron 17 7778 6500U, GeForce 940MX, Liteonit CV3-CE512, IPS, 1920x1080, 17.3" | Acer Aspire 5 A517-51G-80L i5-8550U, GeForce MX150, Micron 1100 MTFDDAV256TBN, aSi TFT, IPS, 1920x1080, 17.3" | Acer Aspire Nitro BE VN7-793G-5811 i5-7300HQ, GeForce GTX 1050 Ti Mobile, Seagate Mobile HDD 1TB ST1000LM035, IPS, 1920x1080, 17.3" | HP Omen 17-w206ng i7-7700HQ, GeForce GTX 1050 Ti Mobile, Samsung PM961 MZVLW256HEHP, IPS, 1920x1080, 17.3" | Acer Aspire 7 A717-71G-72VY i7-7700HQ, GeForce GTX 1060 Mobile, Toshiba MQ01ABD100, IPS, 1920x1080, 17.3" | |
|---|---|---|---|---|---|---|
| Power Consumption | 8% | 10% | -47% | -88% | -47% | |
| Idle Minimum * (Watt) | 5.5 | 5.6 -2% | 4.1 25% | 8.7 -58% | 11 -100% | 7 -27% |
| Idle Average * (Watt) | 11.6 | 11.2 3% | 9.3 20% | 12.4 -7% | 18 -55% | 12.3 -6% |
| Idle Maximum * (Watt) | 12.4 | 11.9 4% | 9.8 21% | 15.4 -24% | 24 -94% | 14.2 -15% |
| Load Average * (Watt) | 65 | 46 29% | 64 2% | 73 -12% | 84 -29% | 72.6 -12% |
| Load Maximum * (Watt) | 56 | 53 5% | 66.4 -19% | 130 -132% | 146 -161% | 153 -173% |
| Witcher 3 ultra * (Watt) | 98 | 101 | 125 |
* ... Meglio usare valori piccoli

| Dell Inspiron 17-7773-0043 i5-8550U, GeForce MX150, 56 Wh | Dell Inspiron 17 7778 6500U, GeForce 940MX, 56 Wh | Acer Aspire 5 A517-51G-80L i5-8550U, GeForce MX150, 48 Wh | Acer Aspire Nitro BE VN7-793G-5811 i5-7300HQ, GeForce GTX 1050 Ti Mobile, 52.5 Wh | HP Omen 17-w206ng i7-7700HQ, GeForce GTX 1050 Ti Mobile, 62 Wh | Acer Aspire 7 A717-71G-72VY i7-7700HQ, GeForce GTX 1060 Mobile, 48 Wh | |
|---|---|---|---|---|---|---|
| Autonomia della batteria | 1% | -21% | -32% | -12% | -30% | |
| Reader / Idle (h) | 14.7 | 13.5 -8% | 9.3 -37% | 13.3 -10% | 9.2 -37% | |
| H.264 (h) | 6.2 | 5.4 -13% | 4.7 -24% | |||
| WiFi v1.3 (h) | 6.8 | 8.3 22% | 6.3 -7% | 4.6 -32% | 6.3 -7% | 5.6 -18% |
| Load (h) | 2 | 1.8 -10% | 1.5 -25% | 1.6 -20% | 1.2 -40% |
Pro
Contro

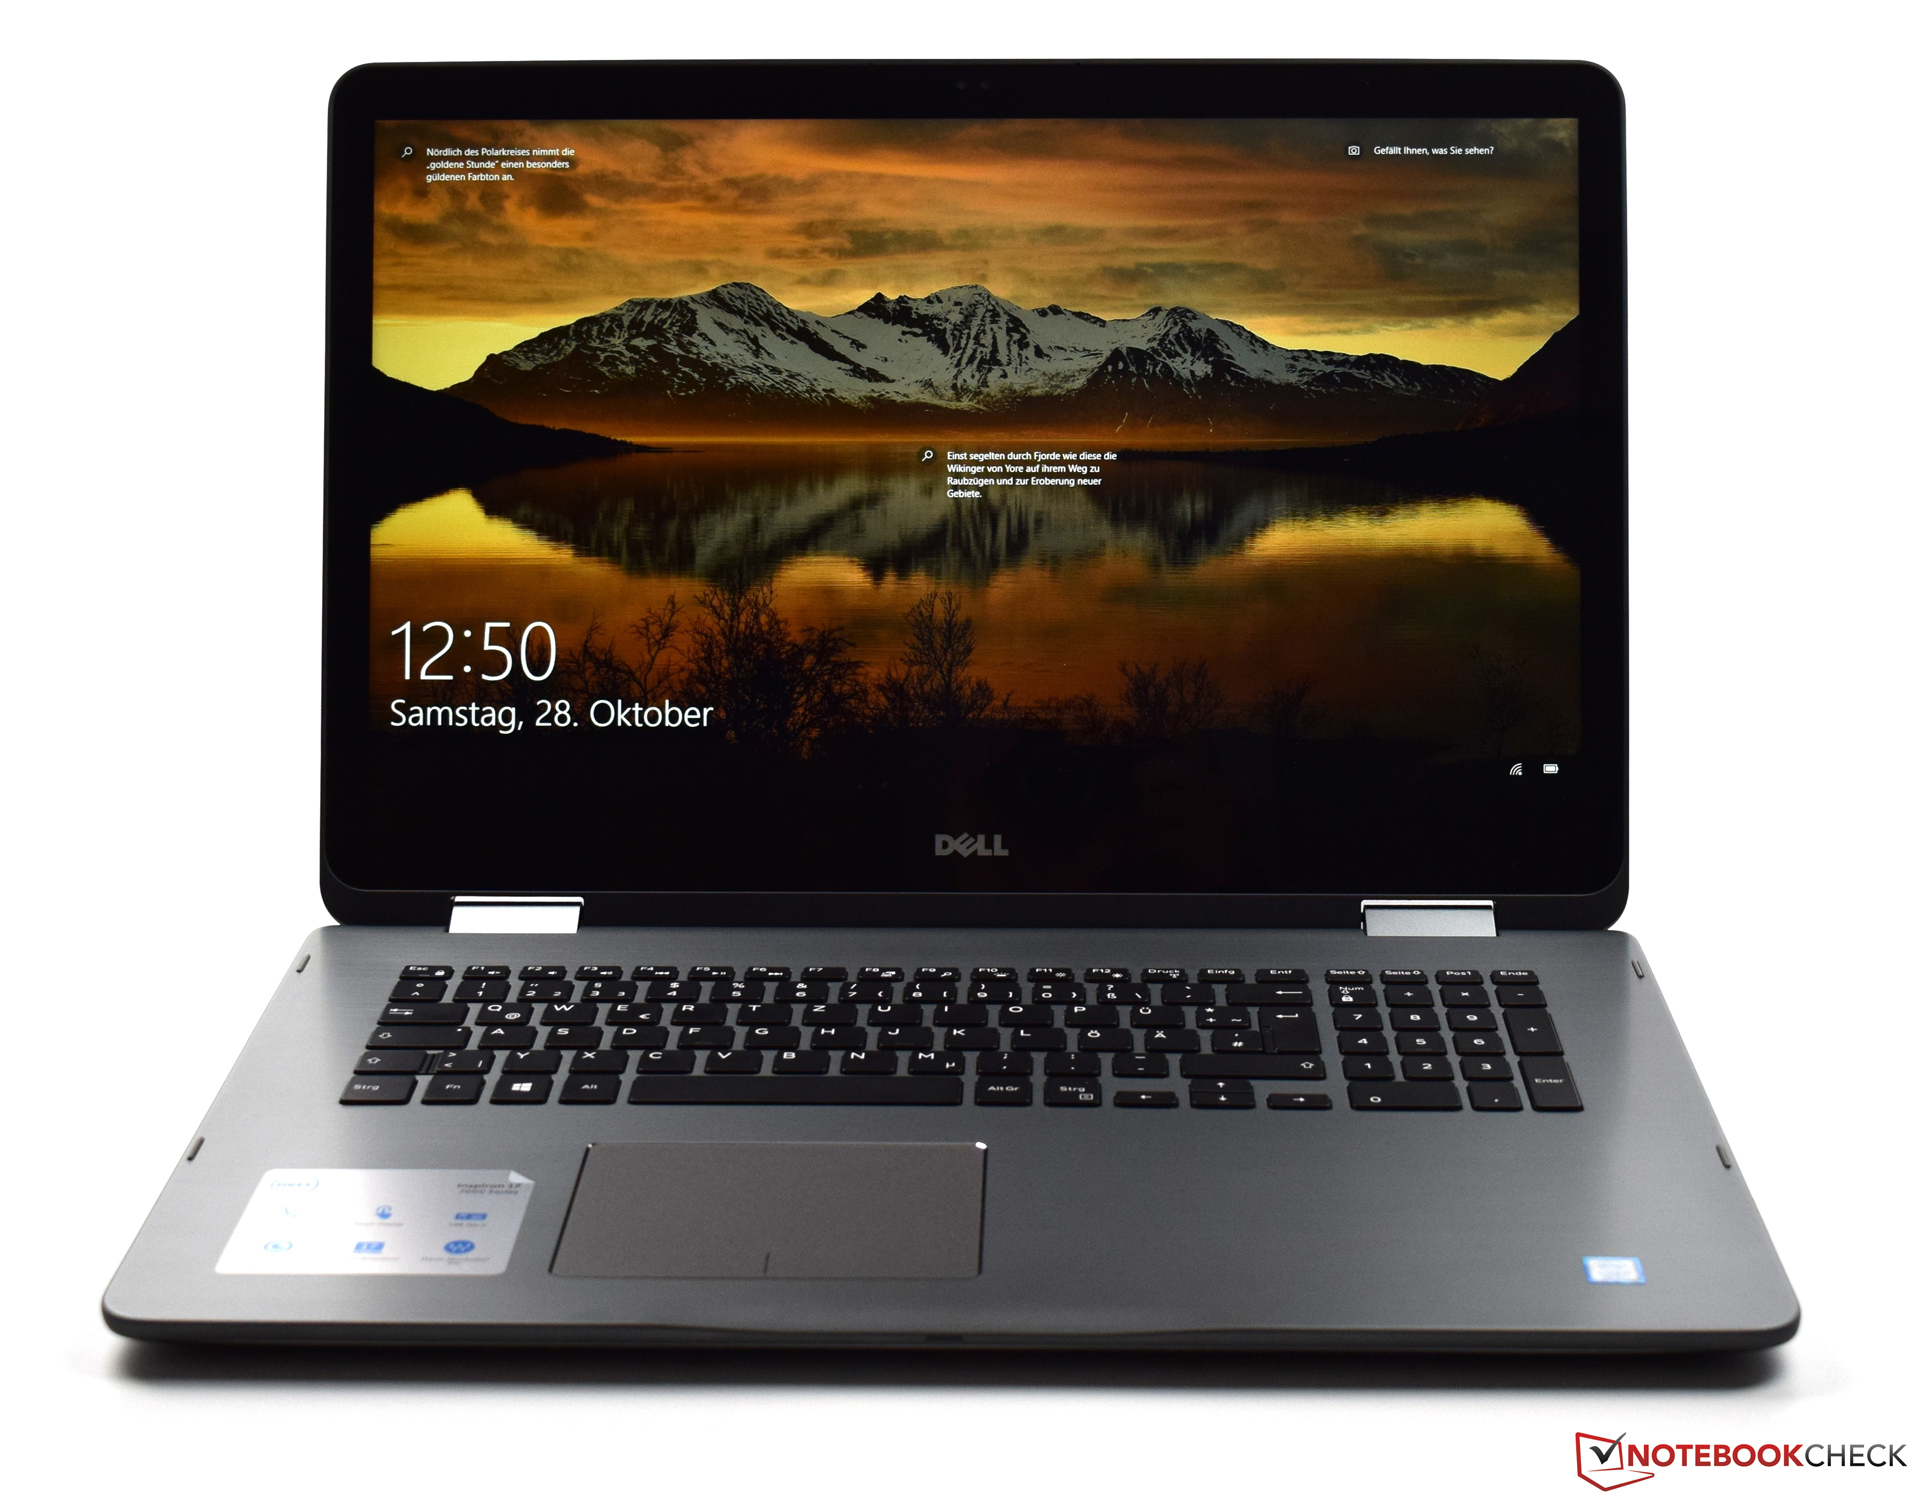
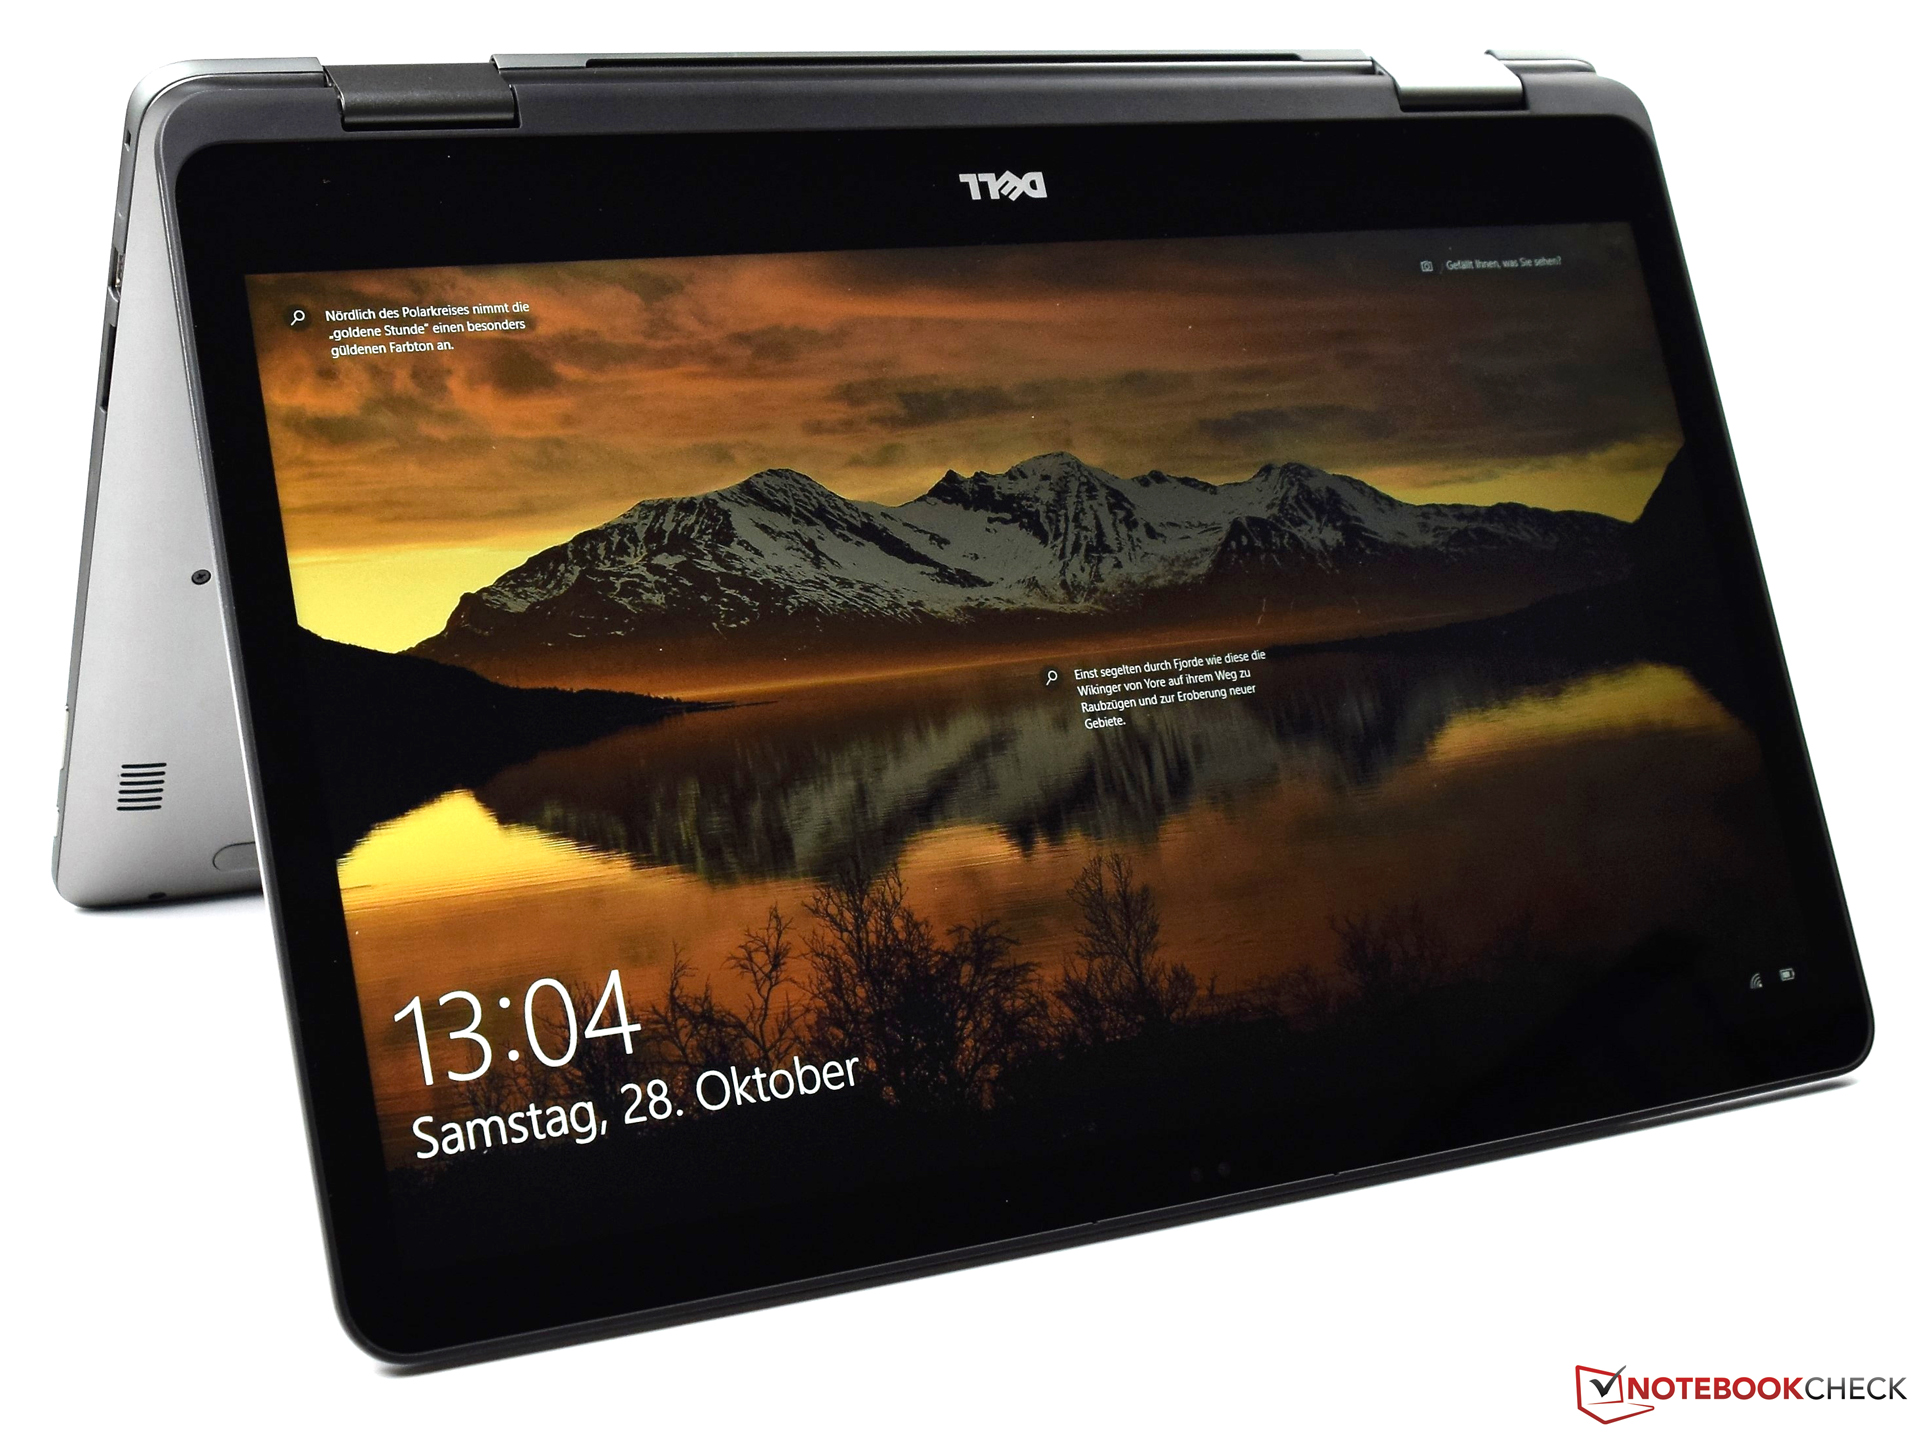
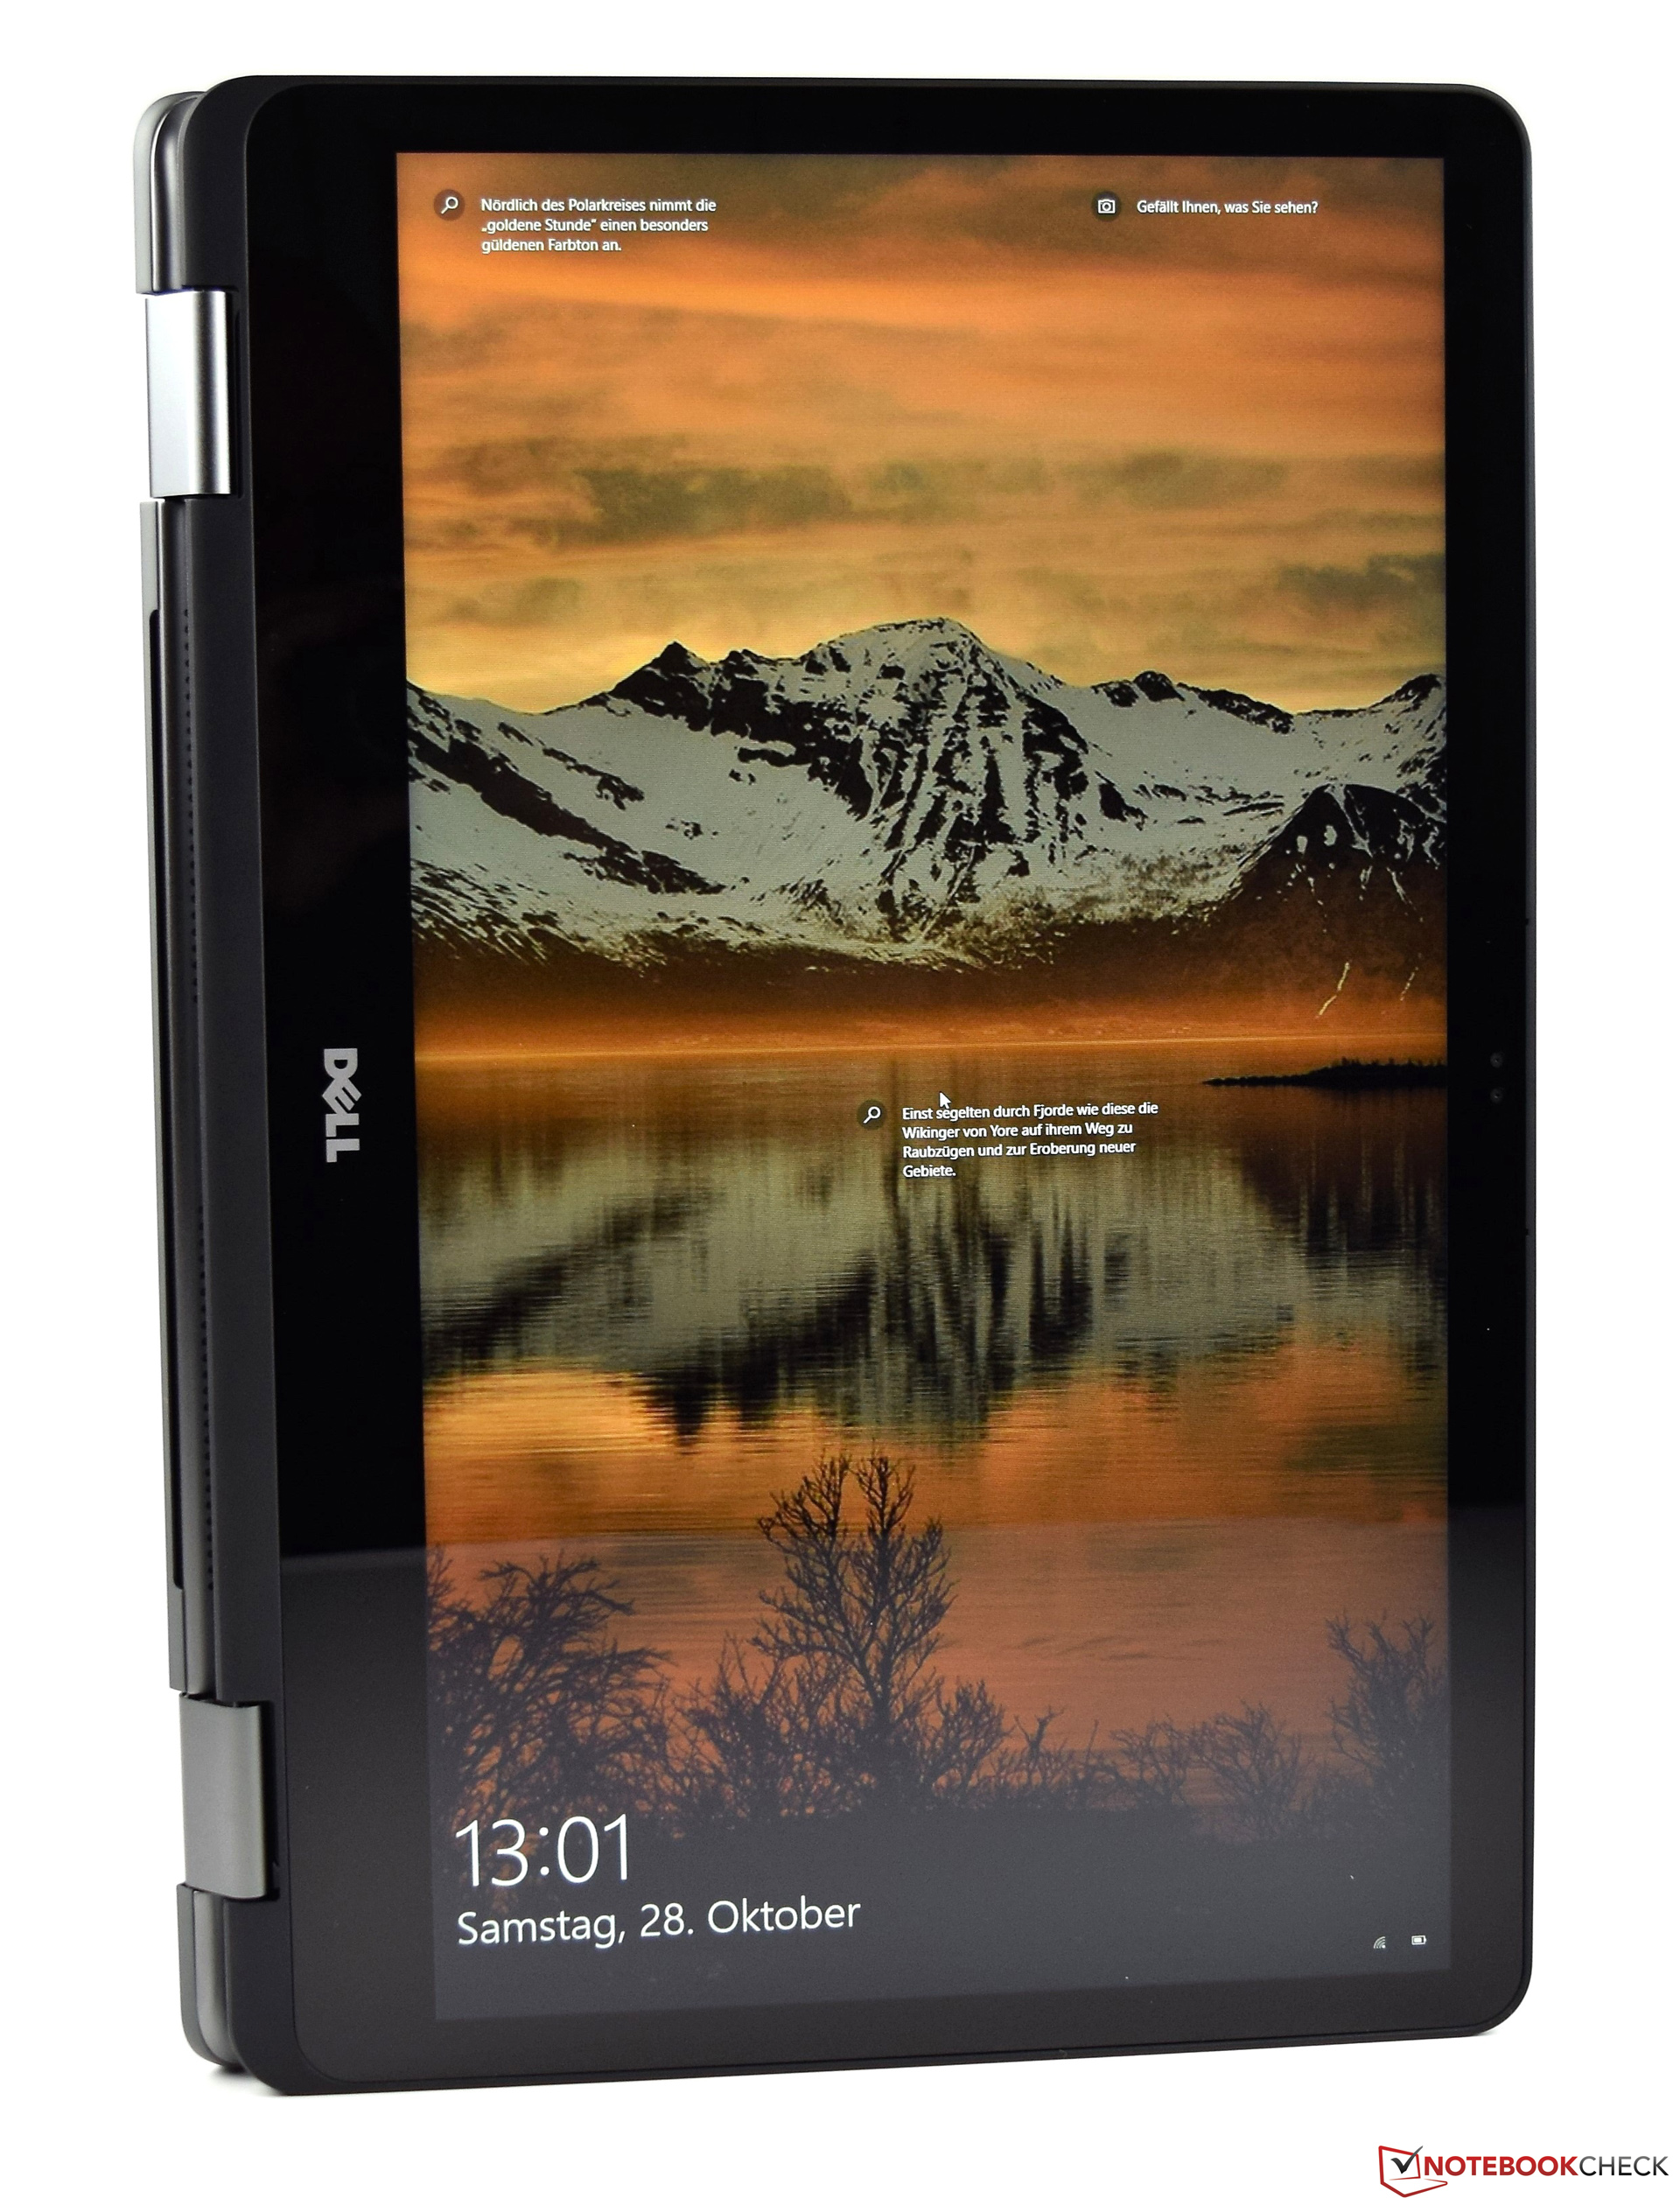
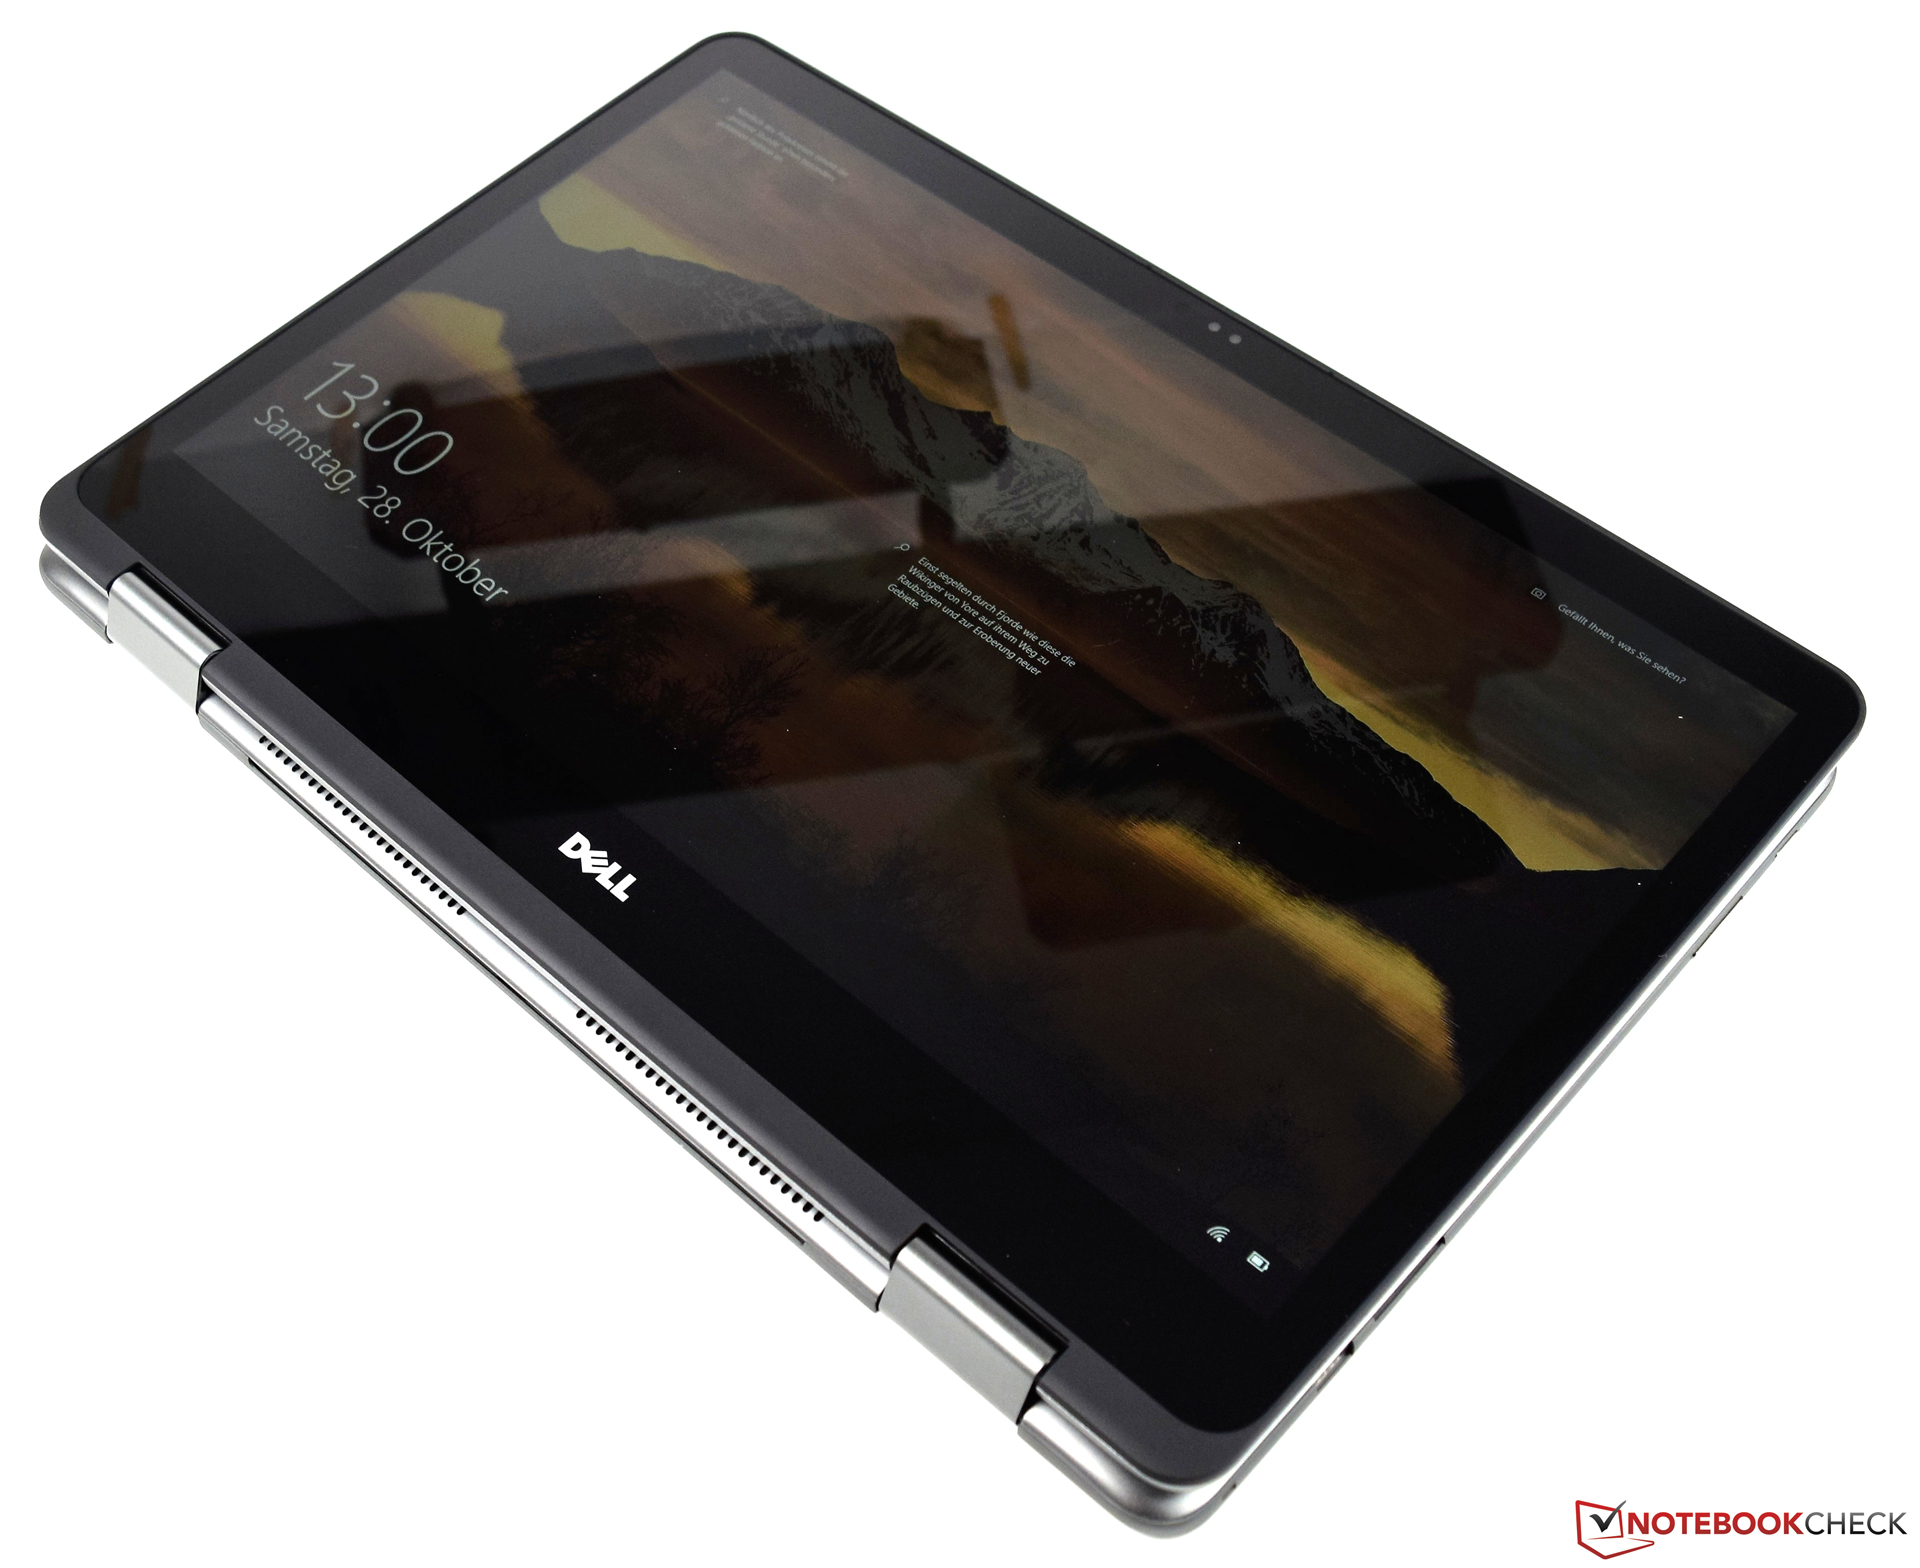
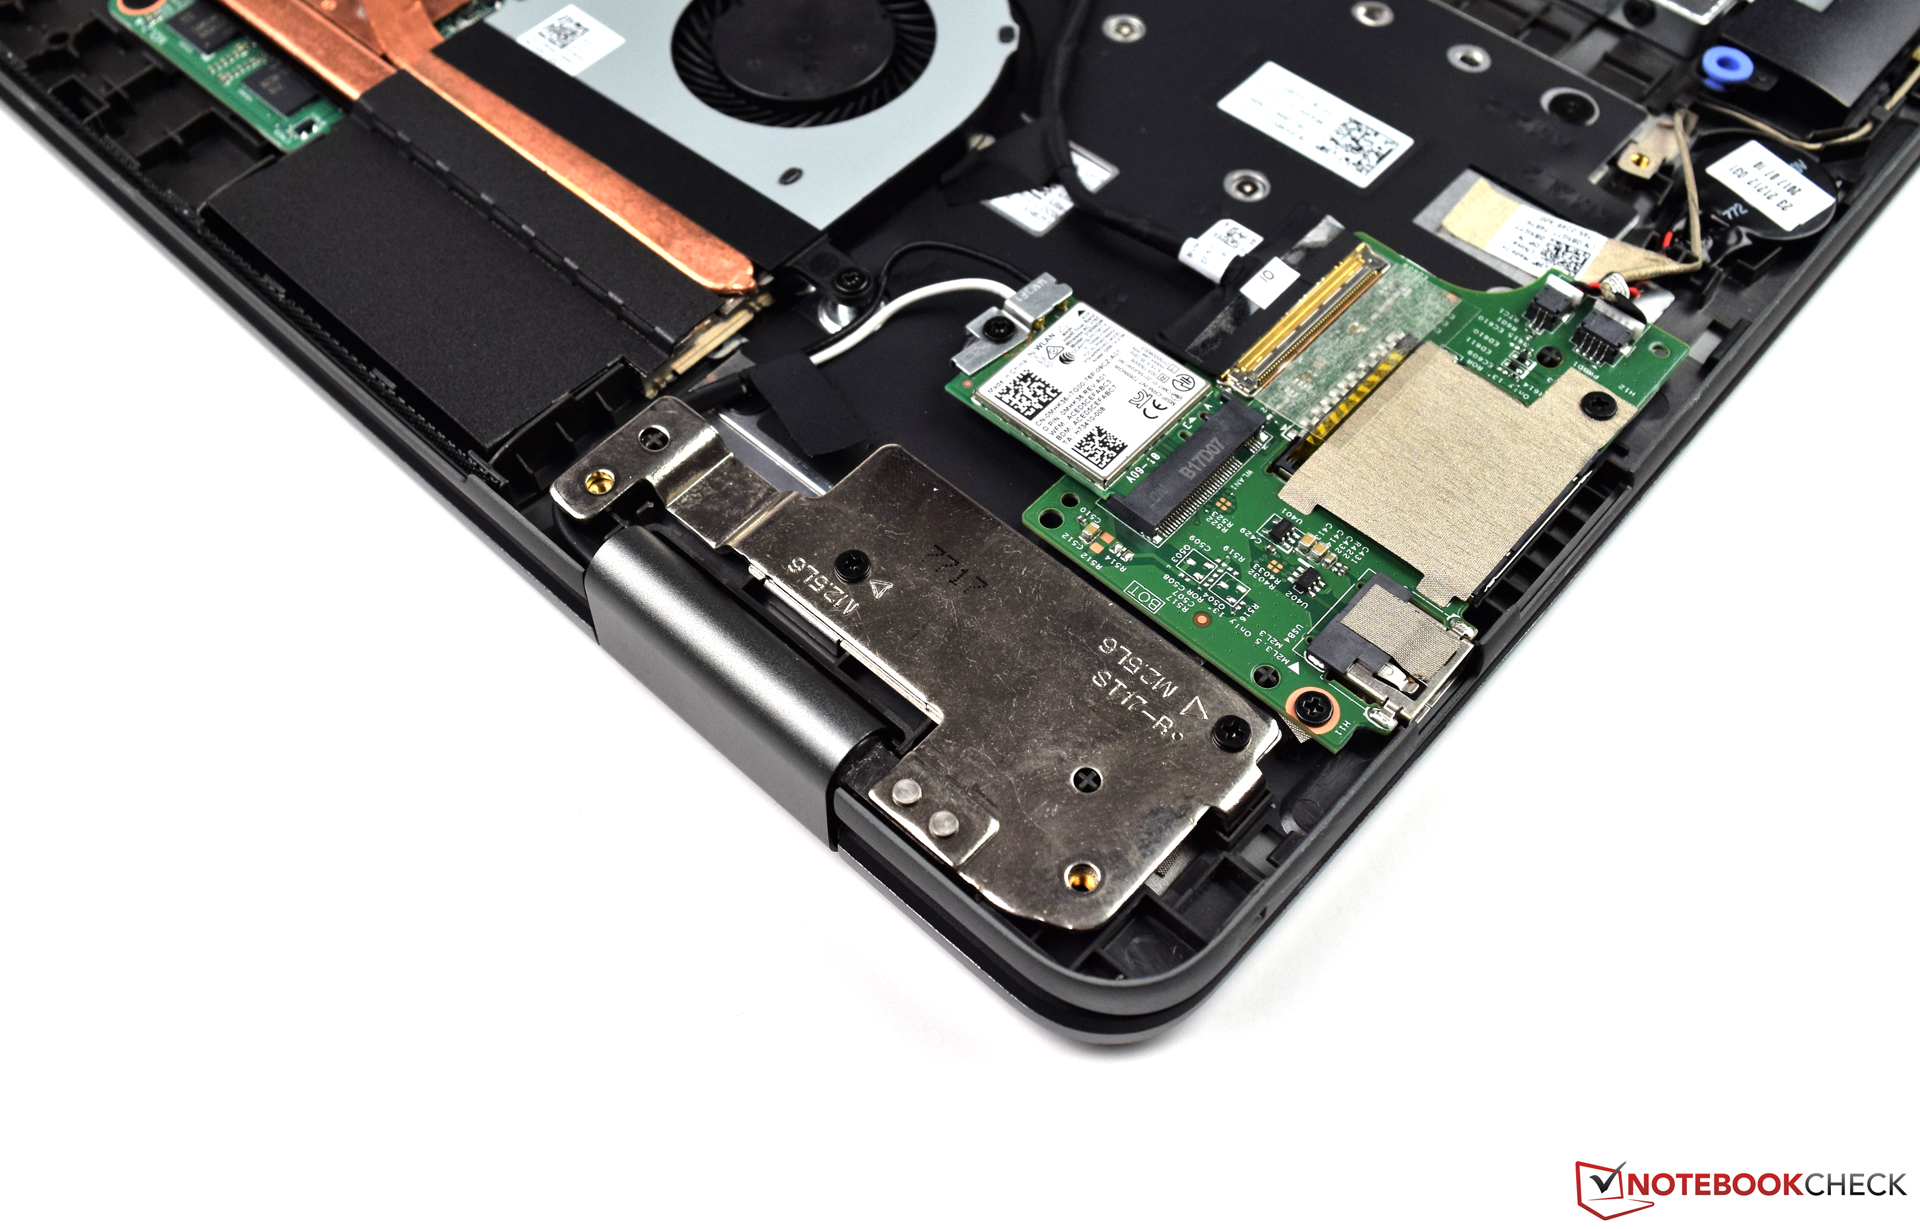
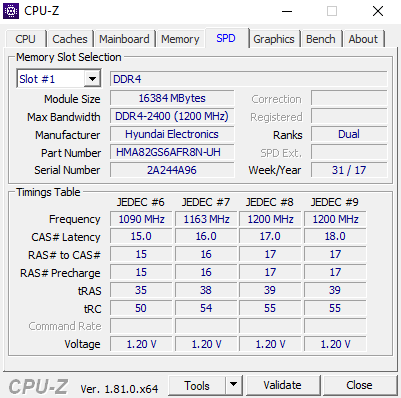
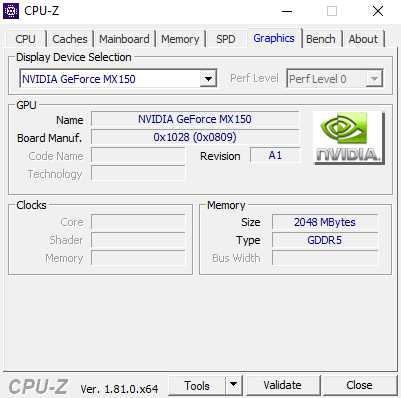
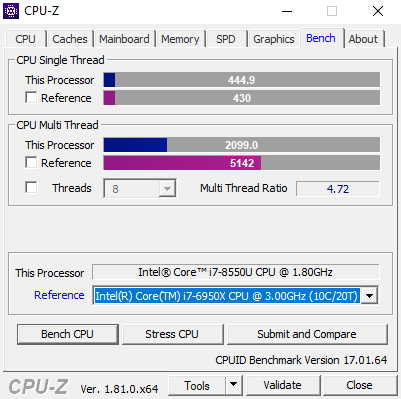
Bisogna ammetterlo, il Dell Inspiron 17 7773 non ha molti concorrenti a parte il suo predecessore. Nel nostro test, il convertibile con insolito formato da 17" ci ha convito con prestazioni molto buone. L'Intel Core i7-8550U offre una base perfetta per applicazioni pesanti. L'ampia RAM da 16-GB DDR4 gioca un ruolo importante, così come la soluzione di archiviazione che combina SSD e hard drive convenzionale. Il Dell Inspiron 17 7773 è presente online per 1199 Euro (~$1391). In particolare la Nvidia GeForce MX150, che amplia l'area di utilizzo del convertibile, è degna di nota.
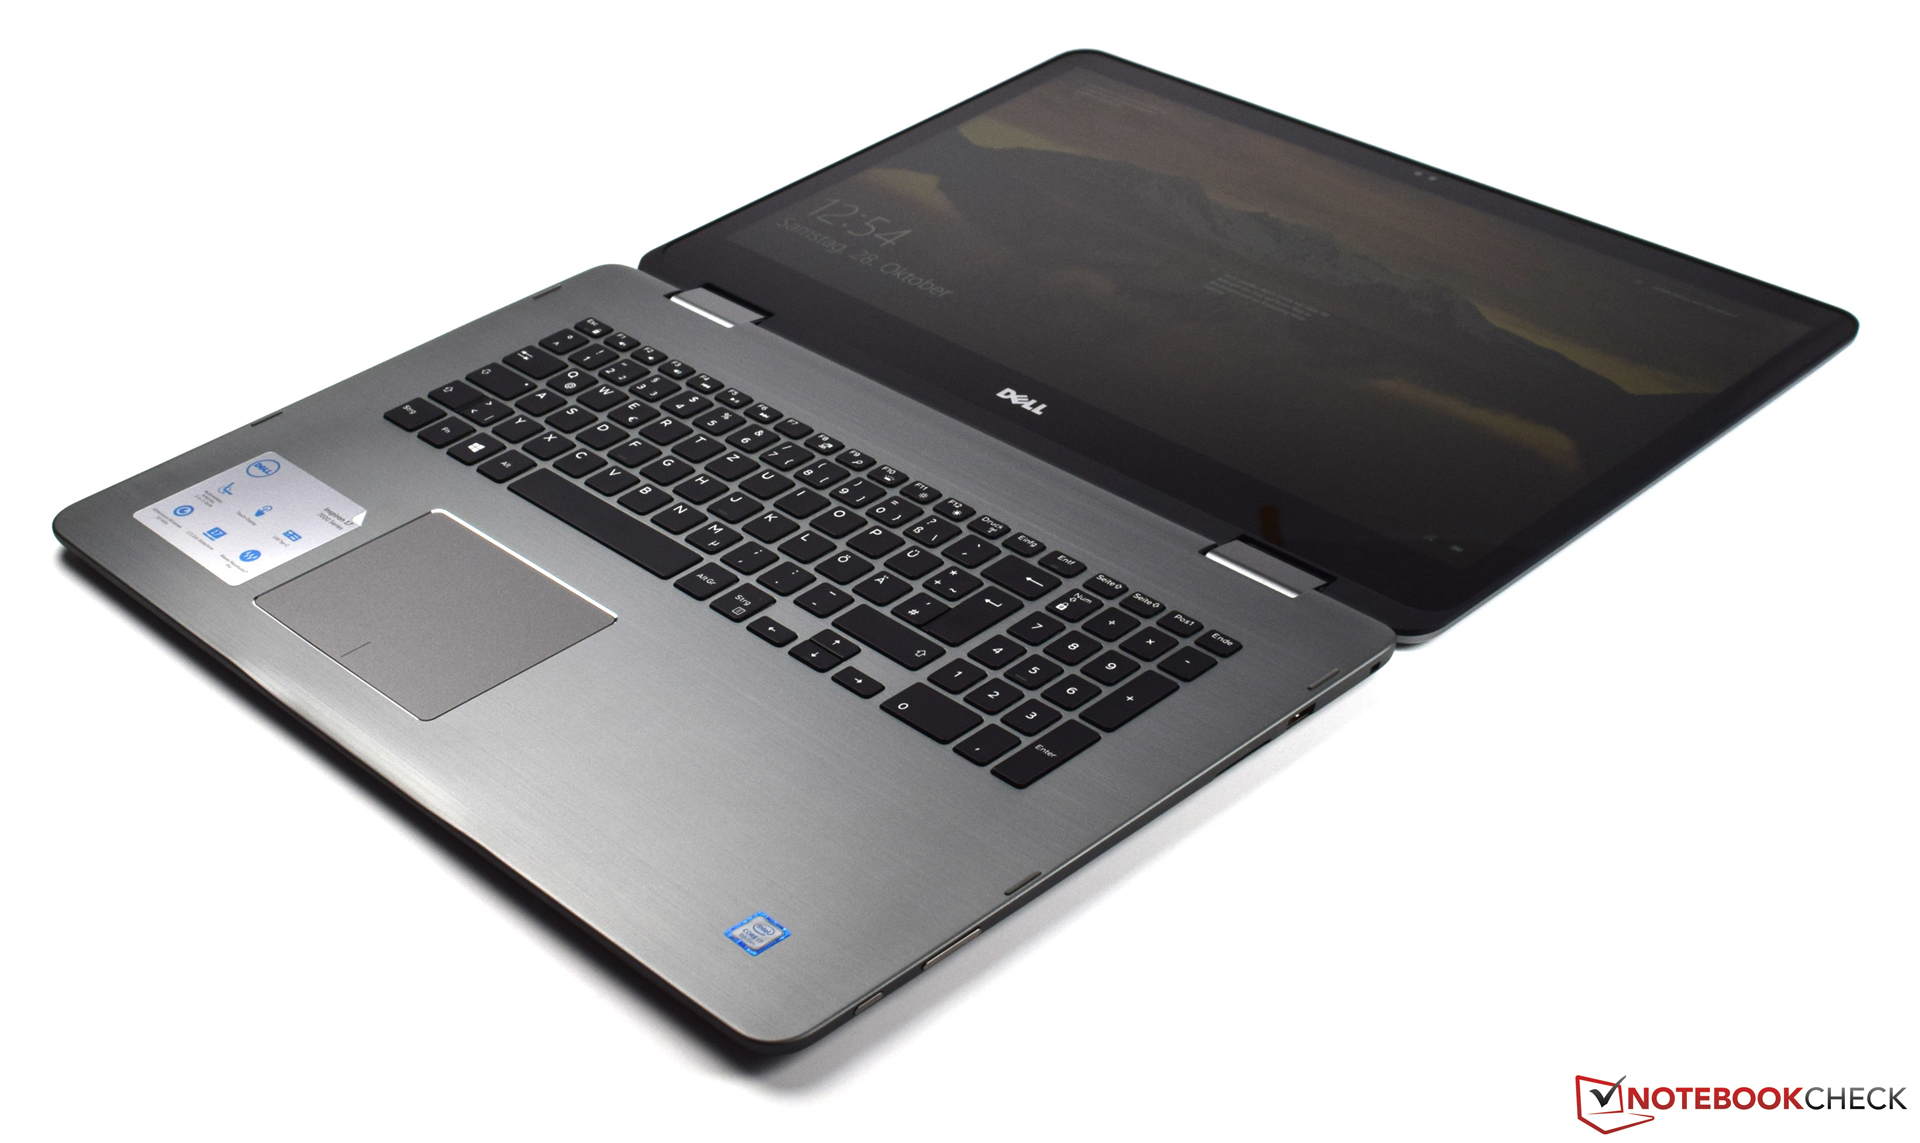
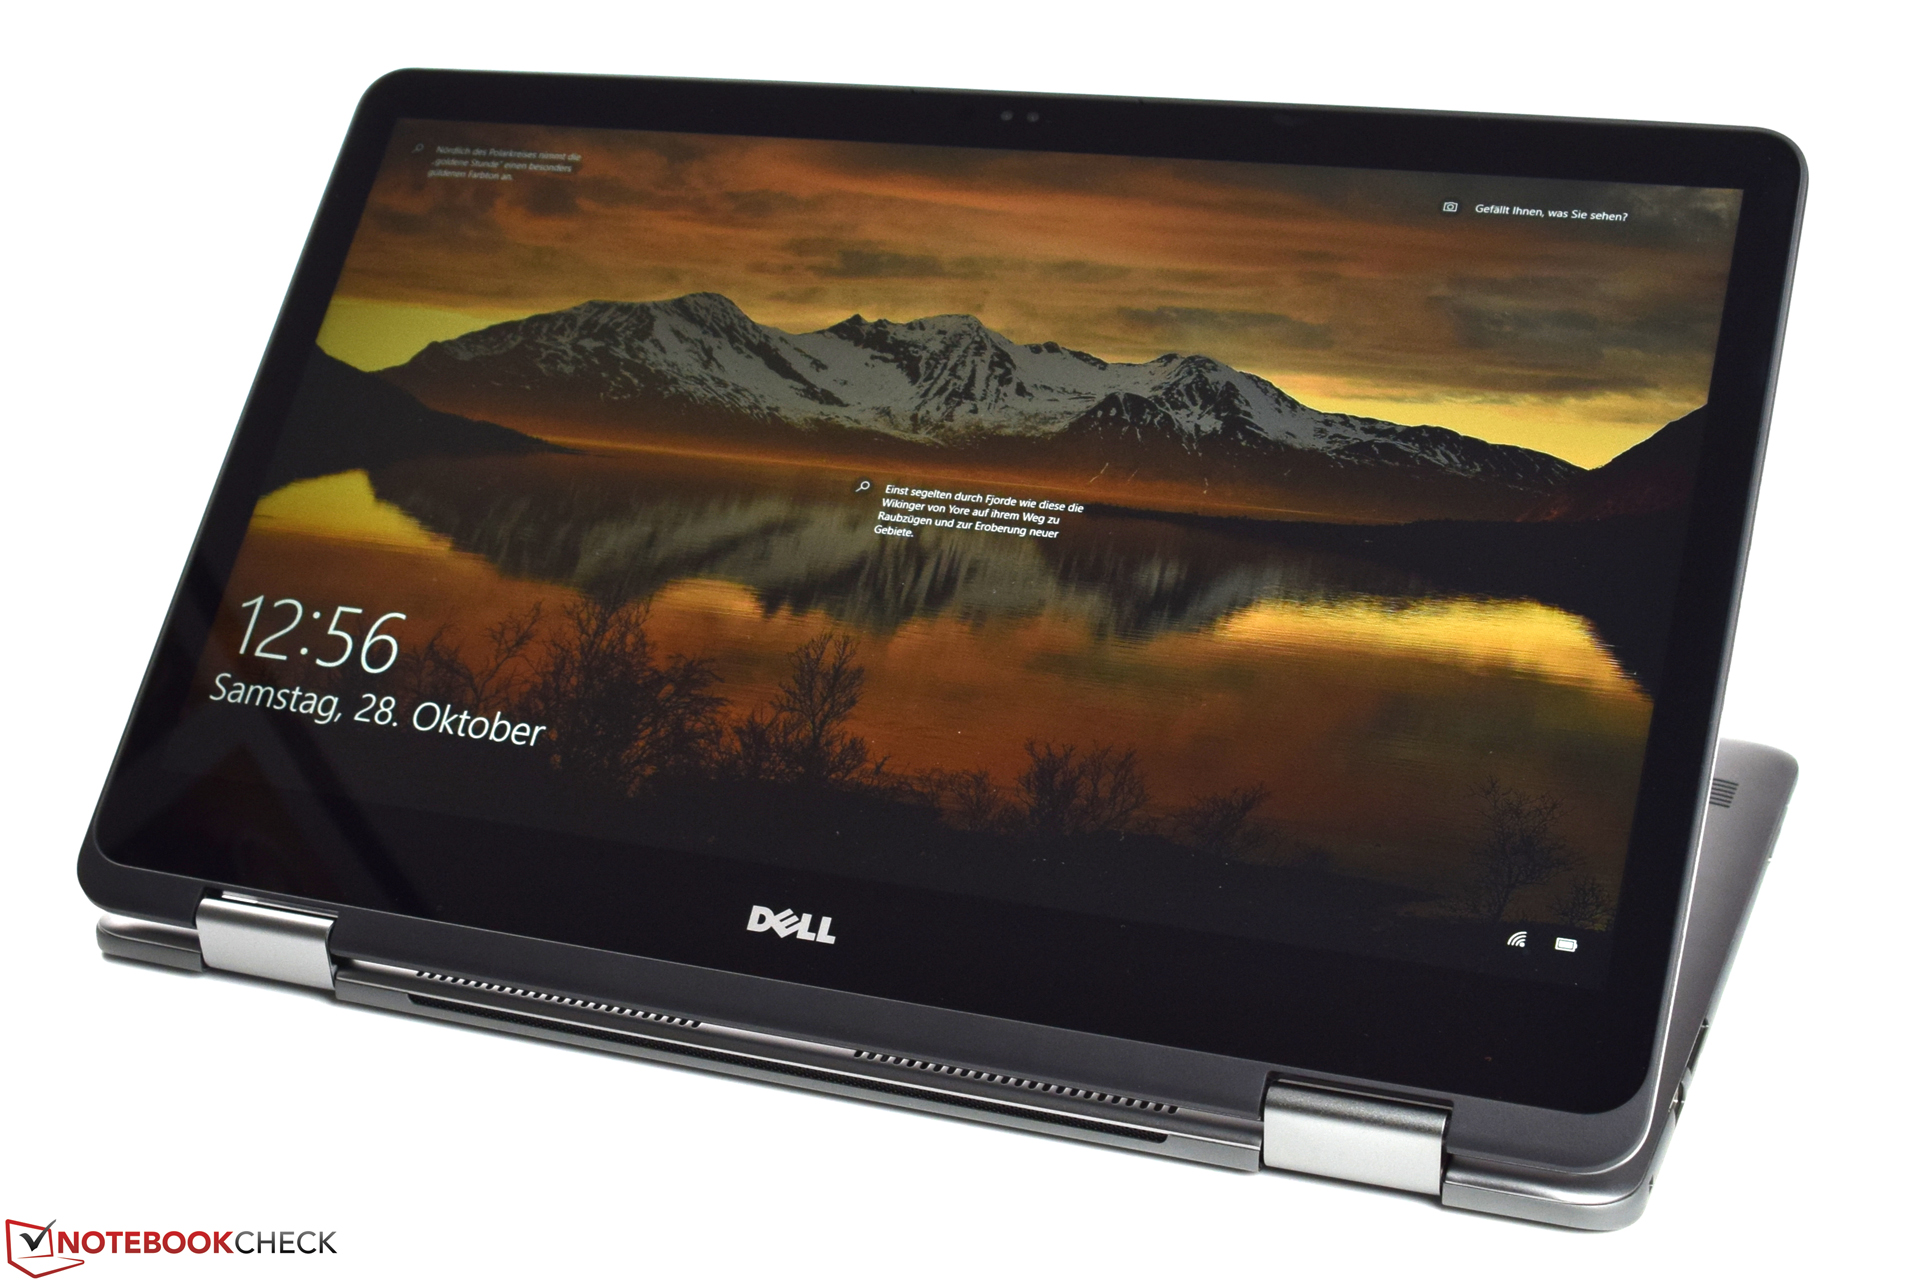
Sebbene, il Dell Inspiron 17 7773 non sia forse per tutti, sarete ripagati con prestazioni decenti, Inoltre, questo convertibile gigante è molto flessibile negli utilizzi e attualmente di fatto non ha concorrenti.
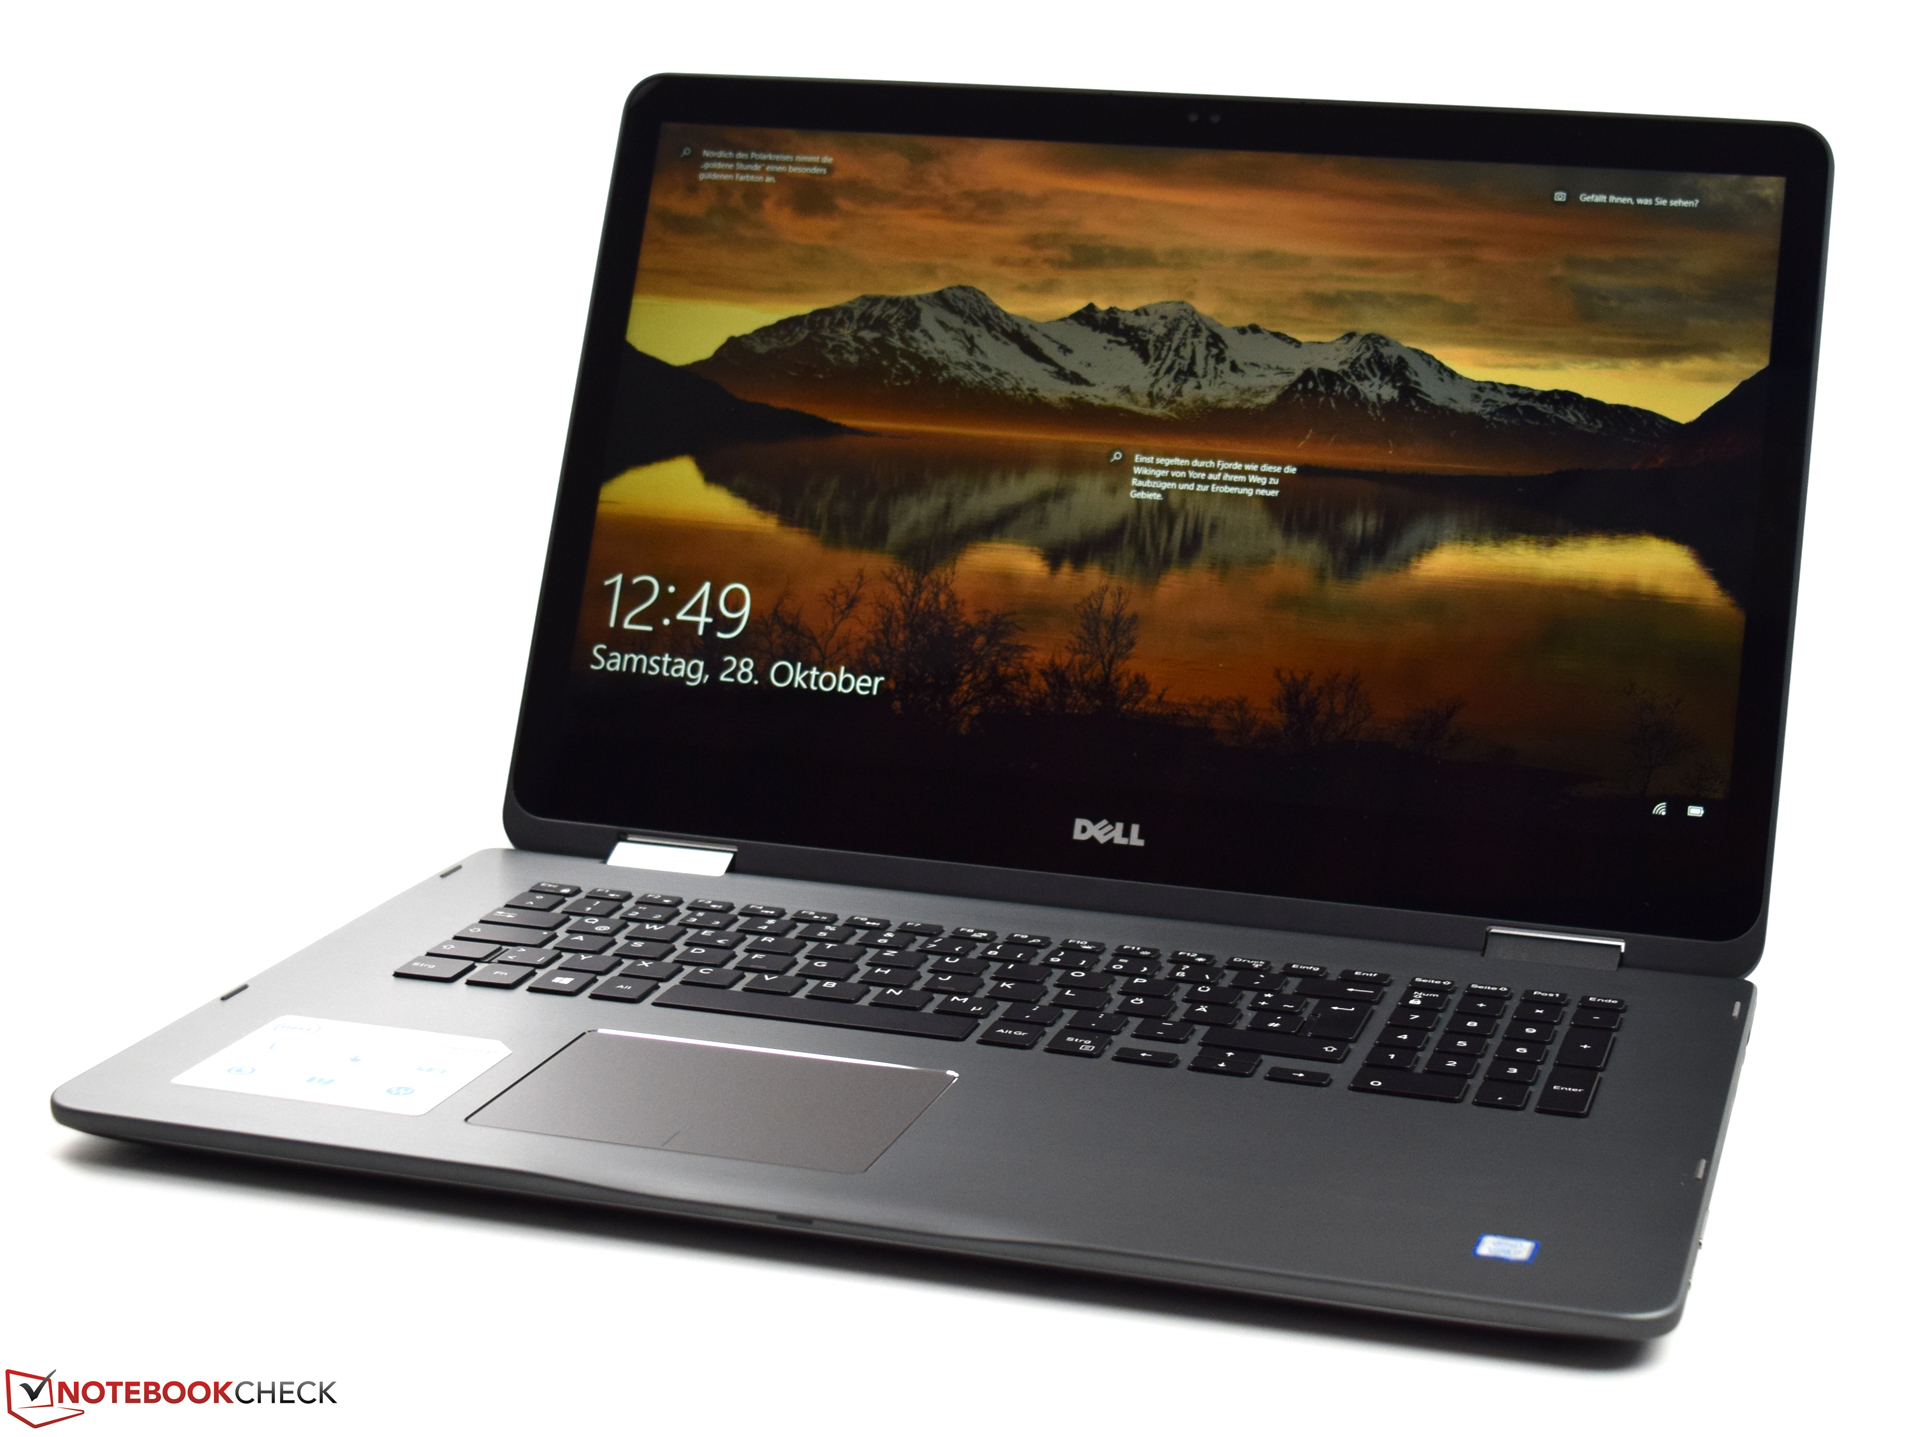
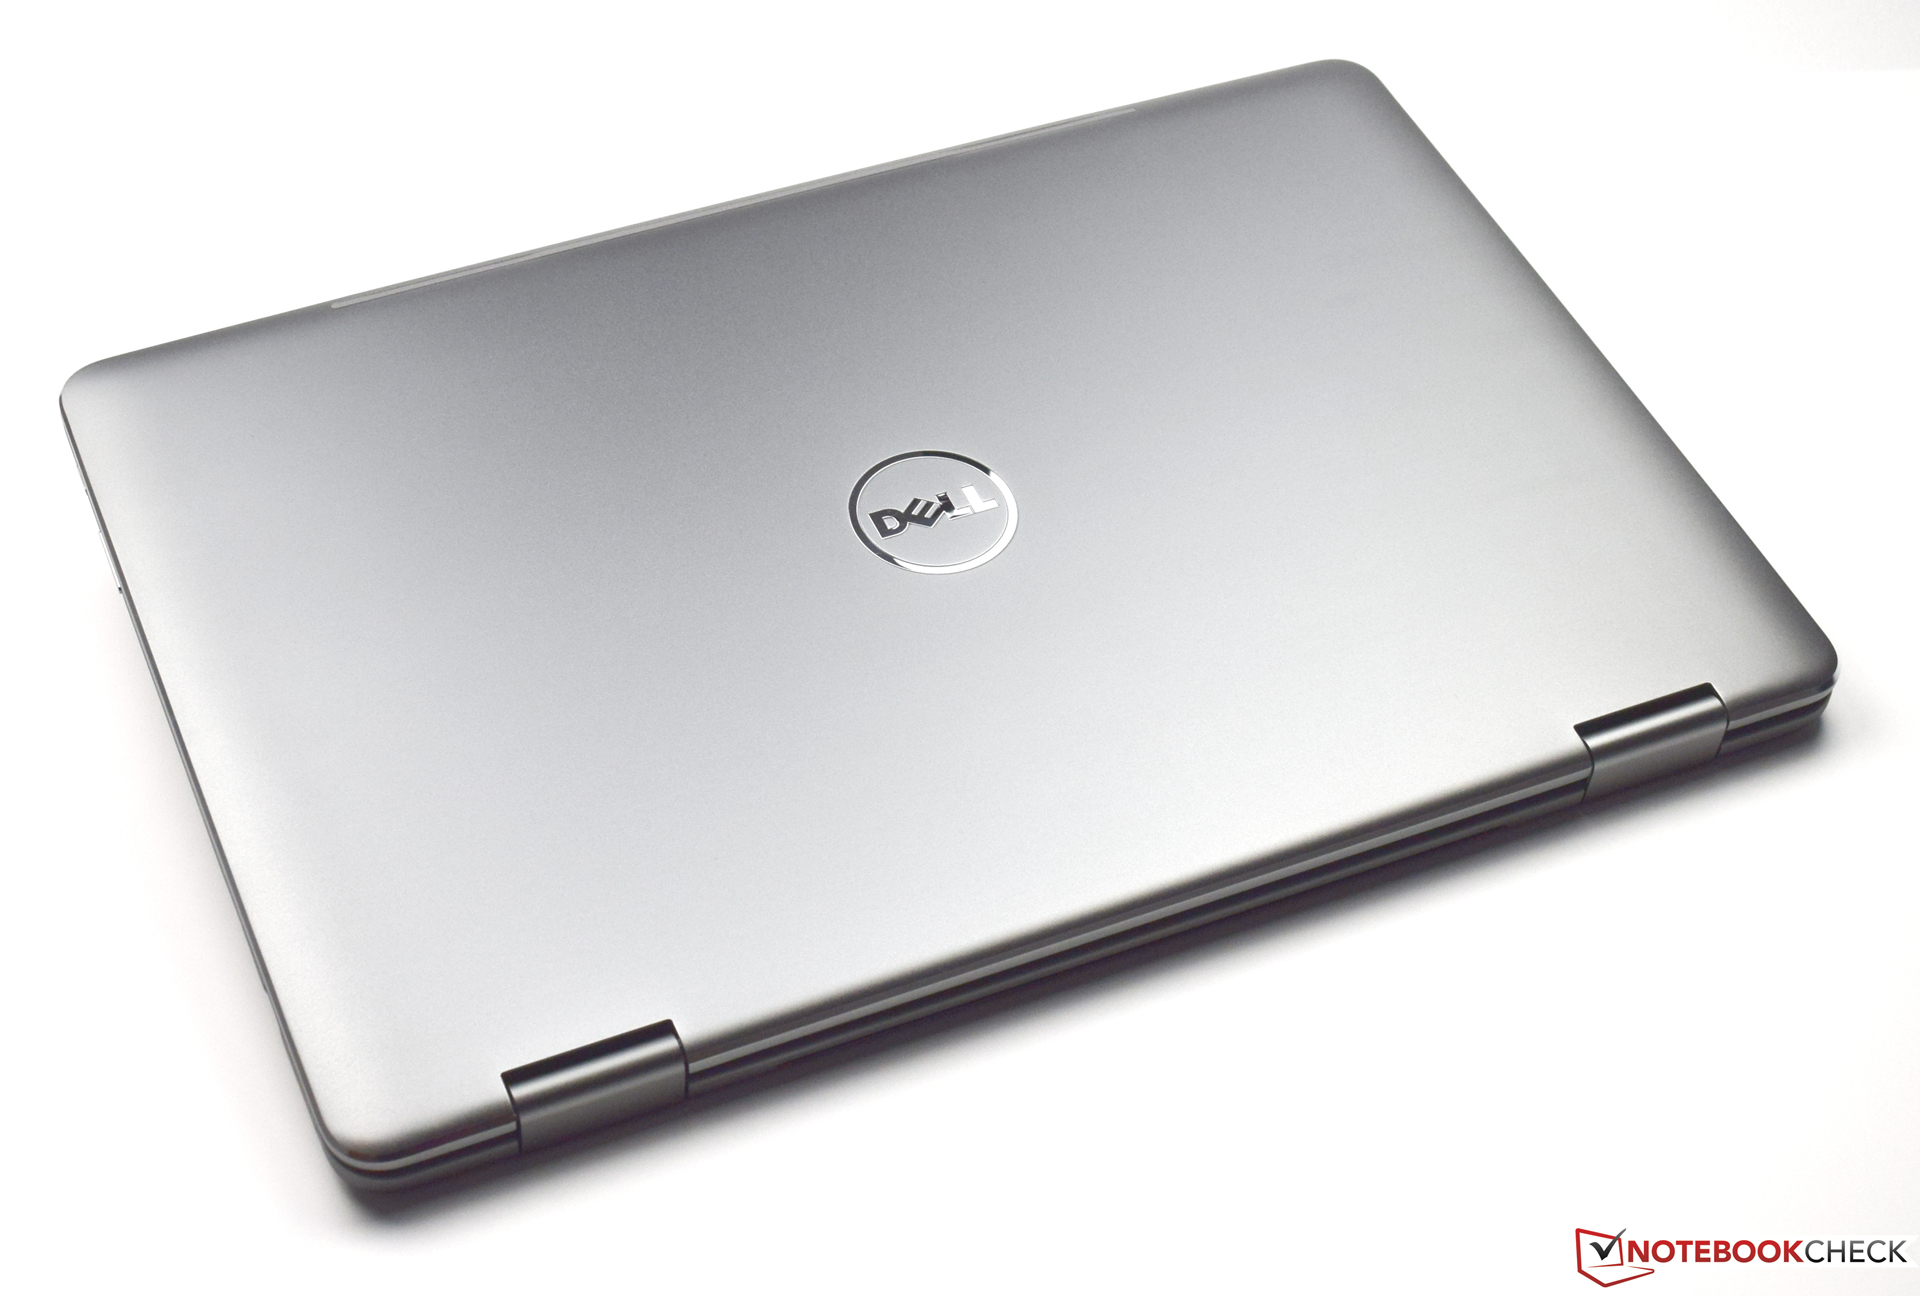
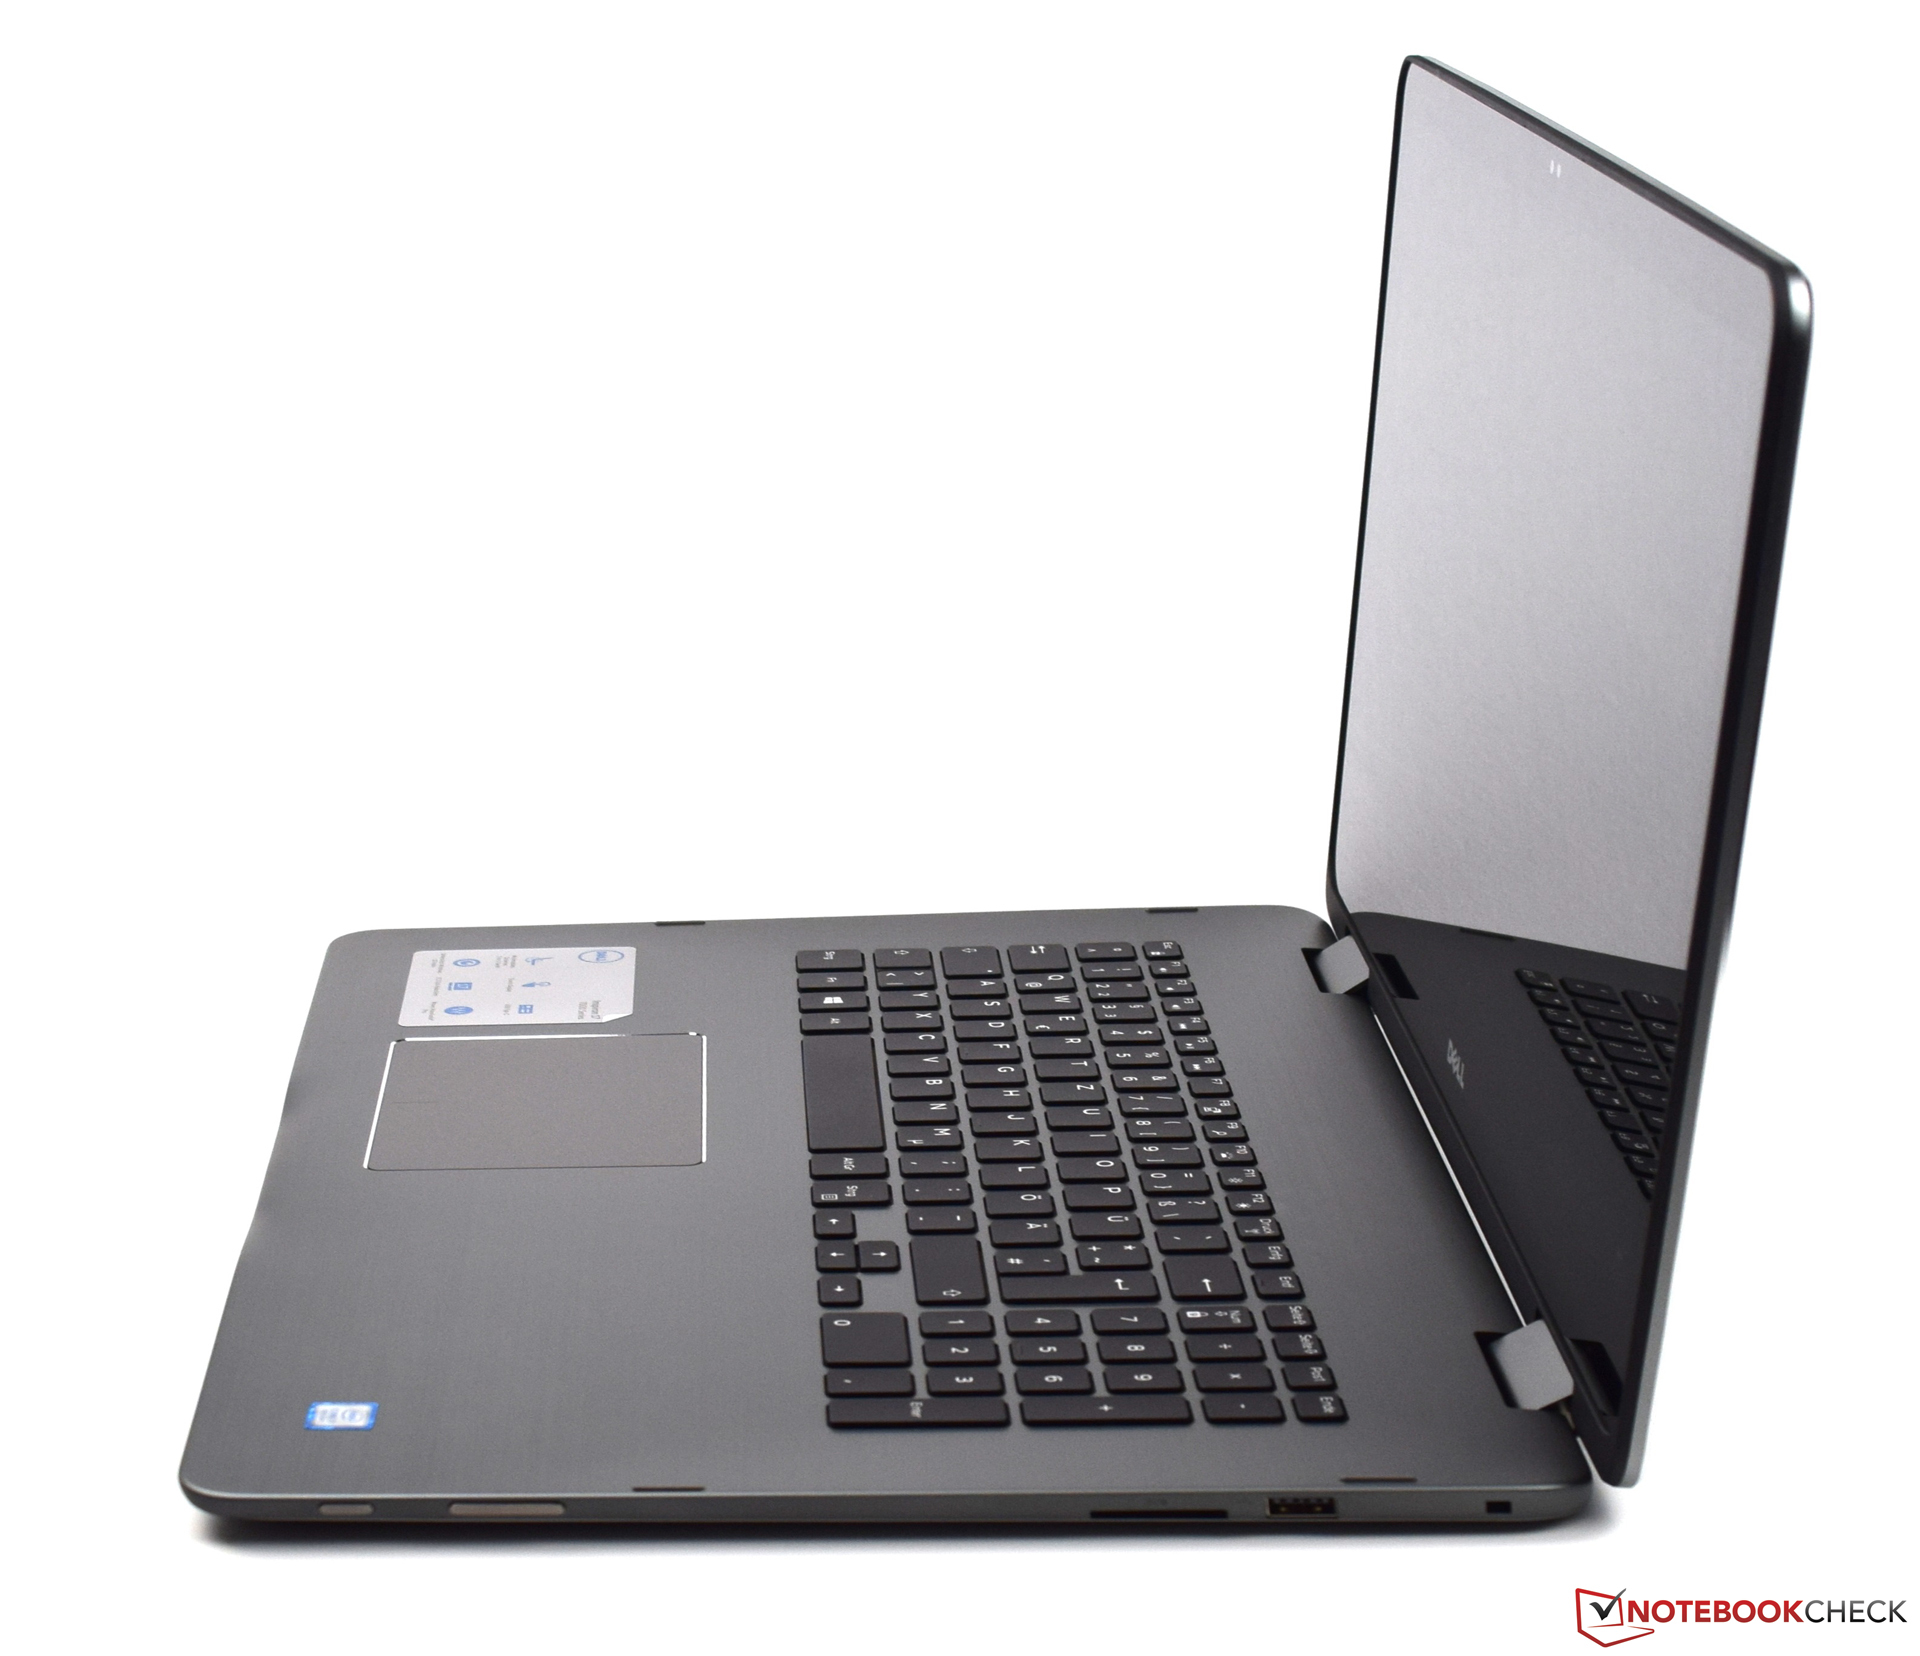
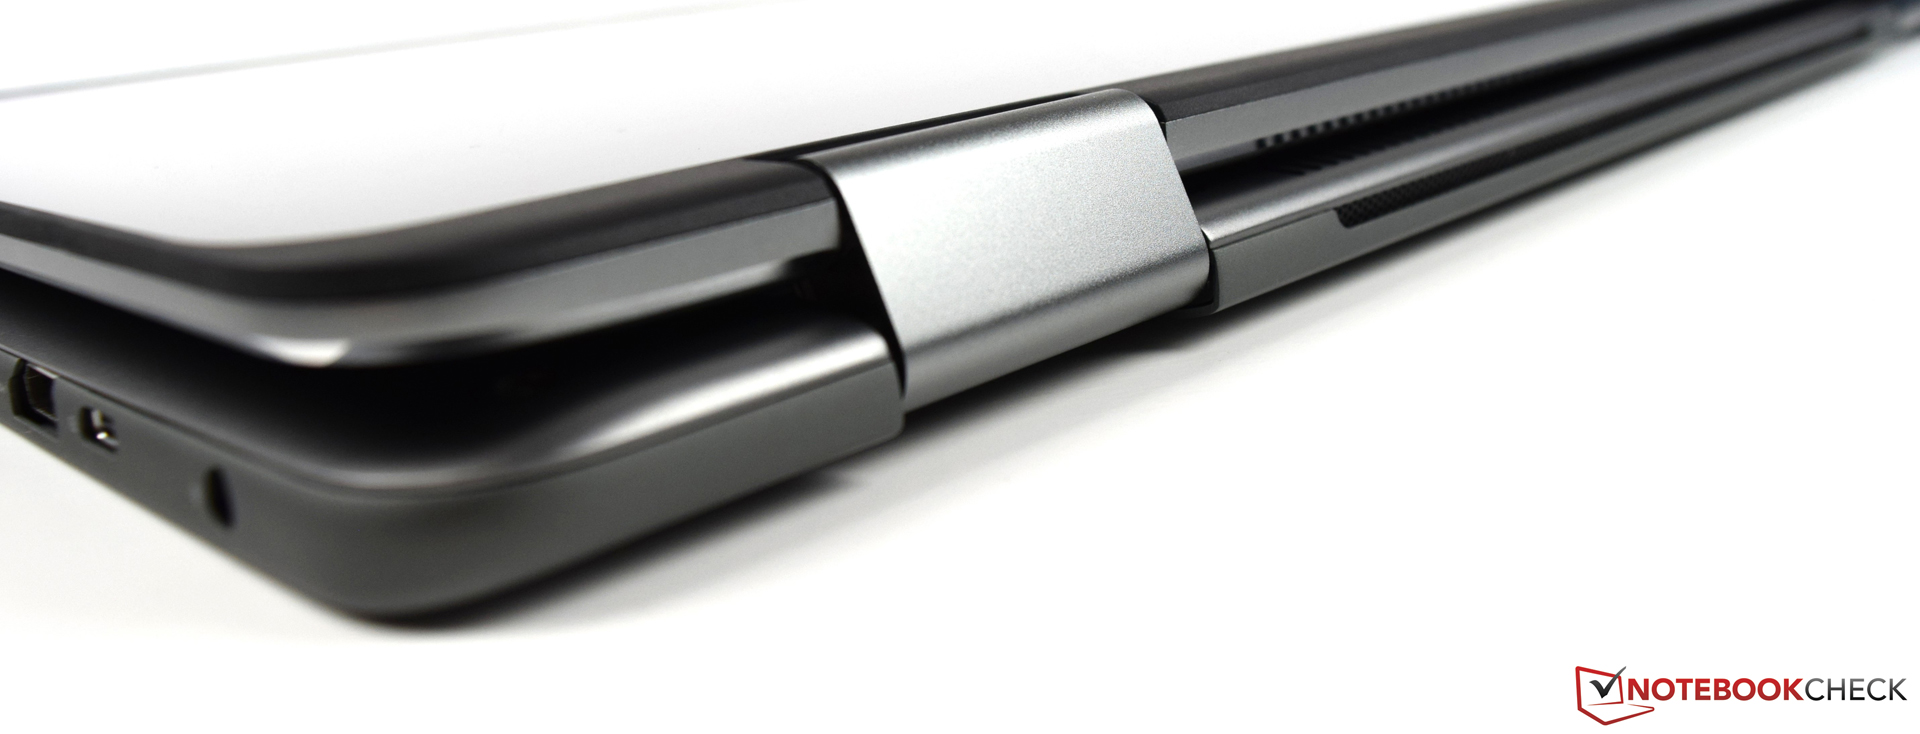
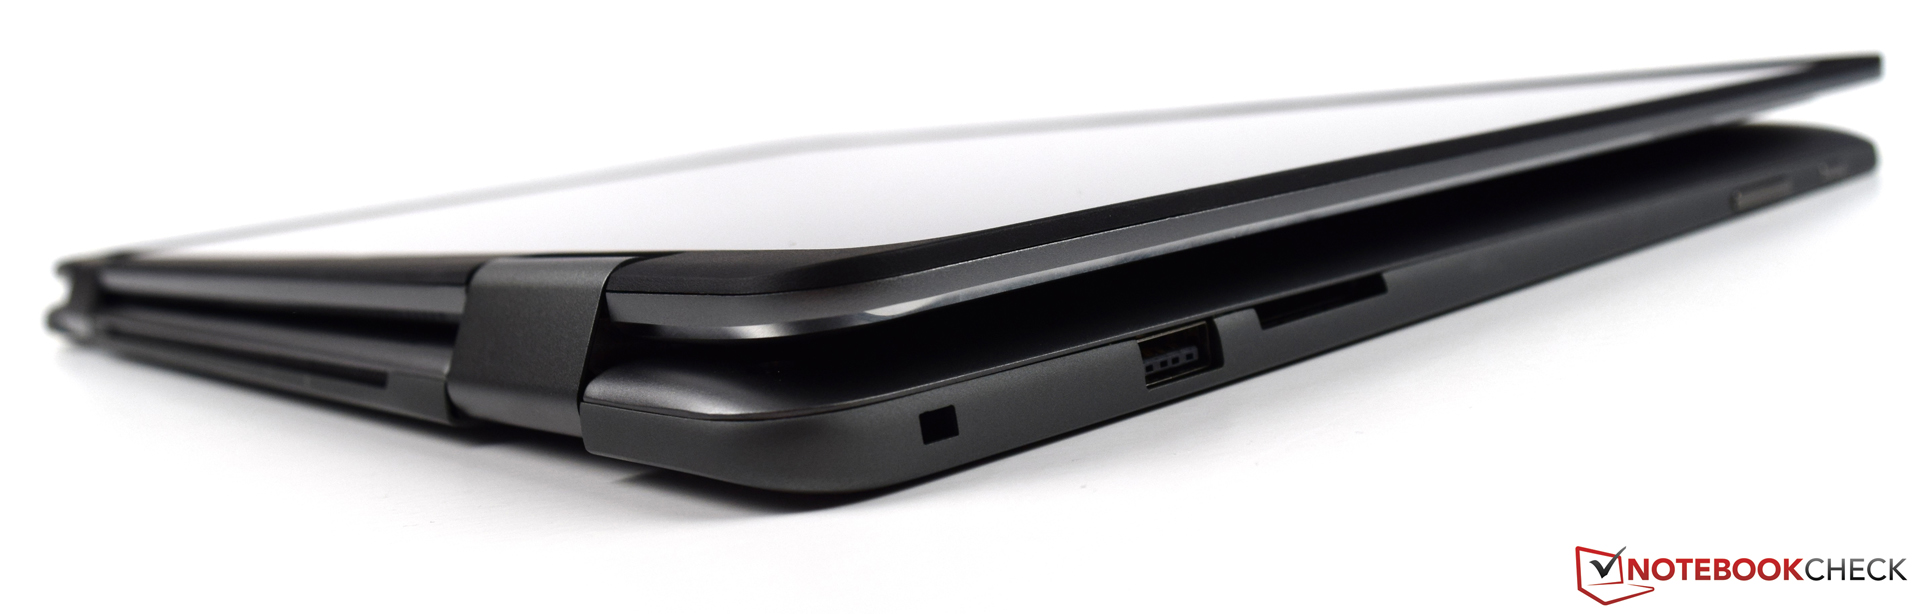
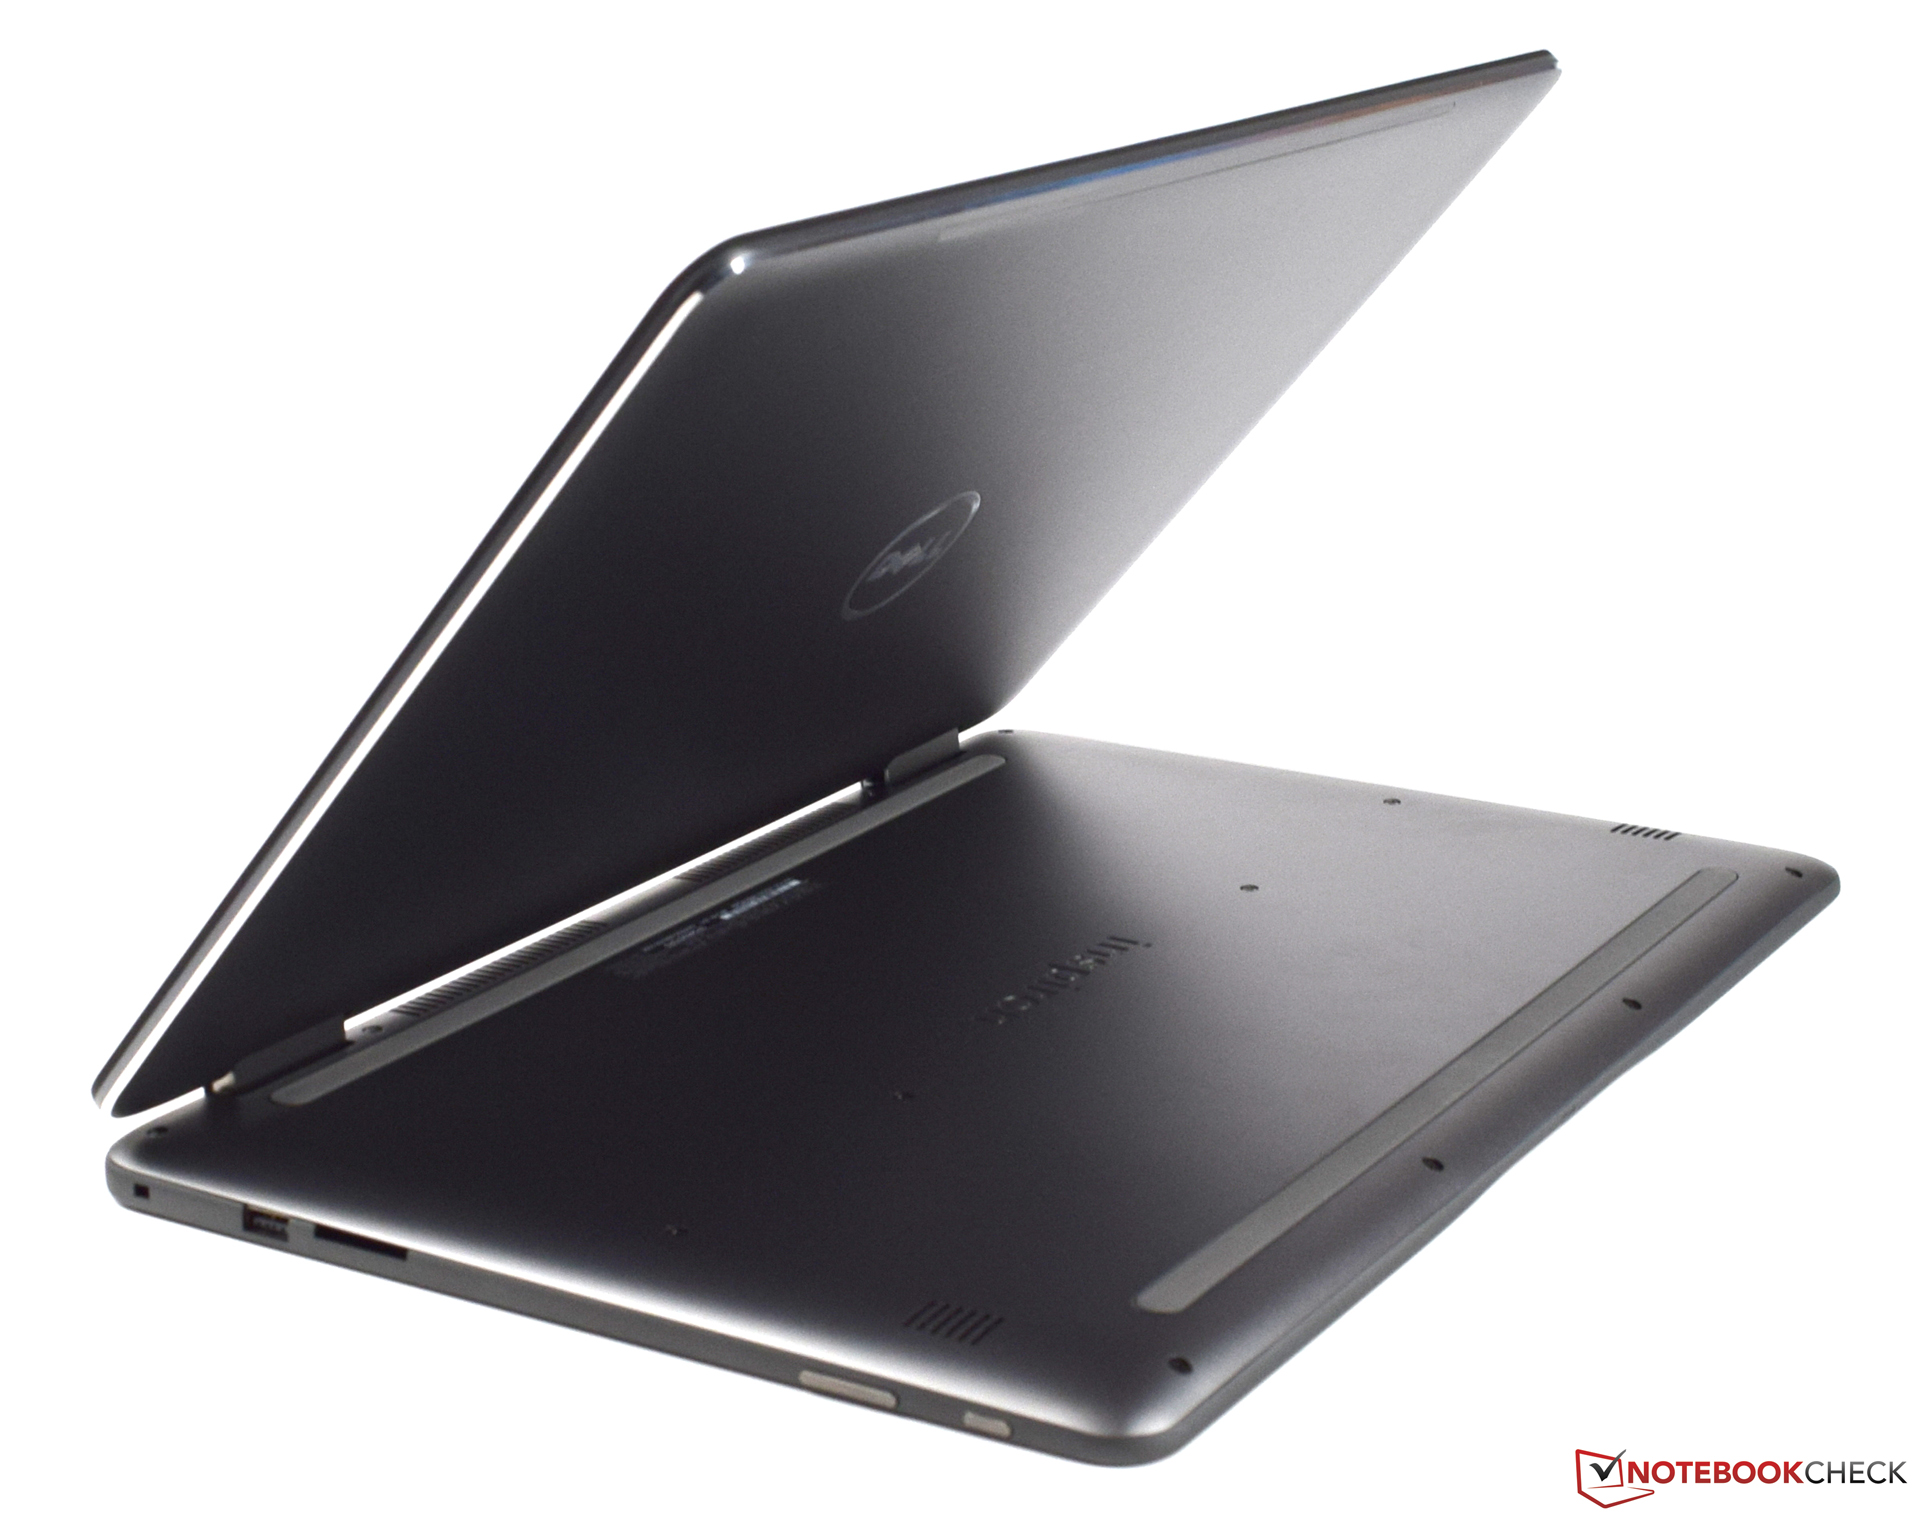
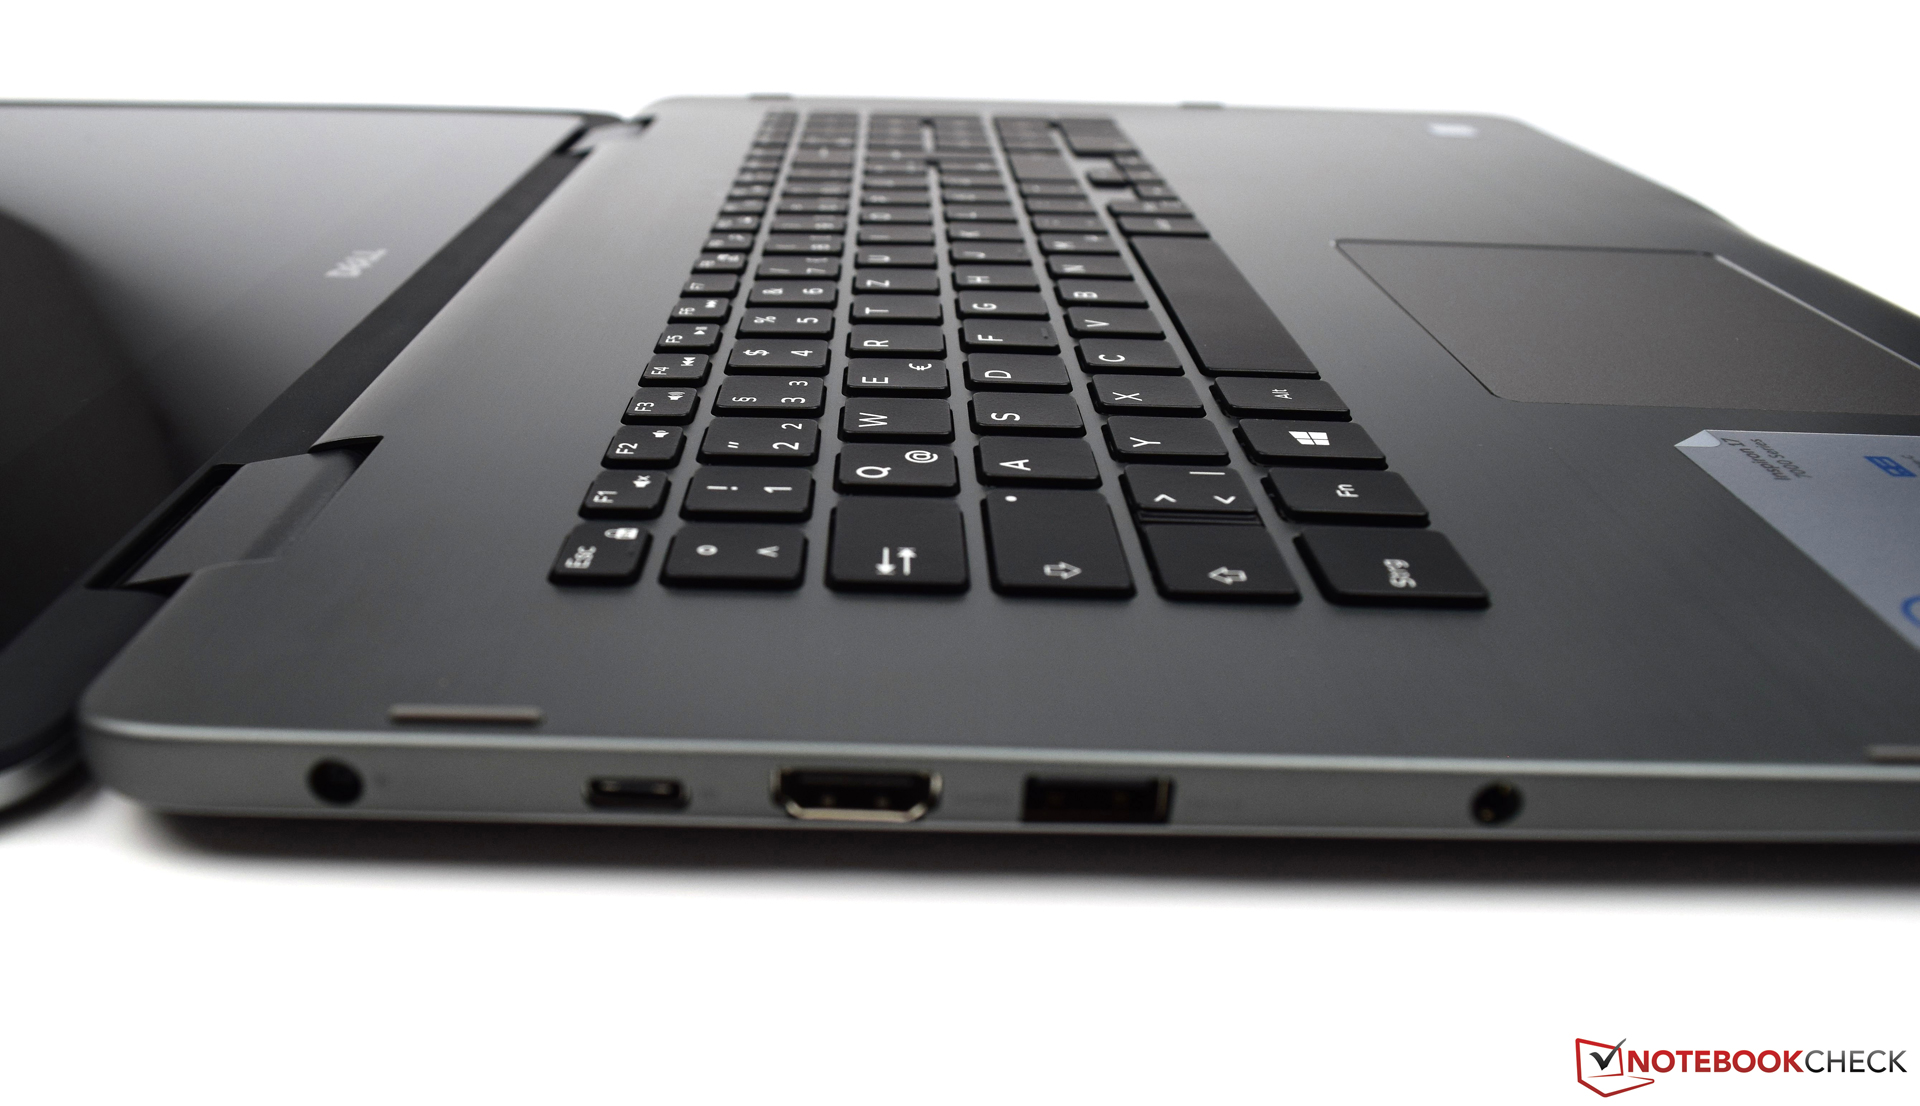
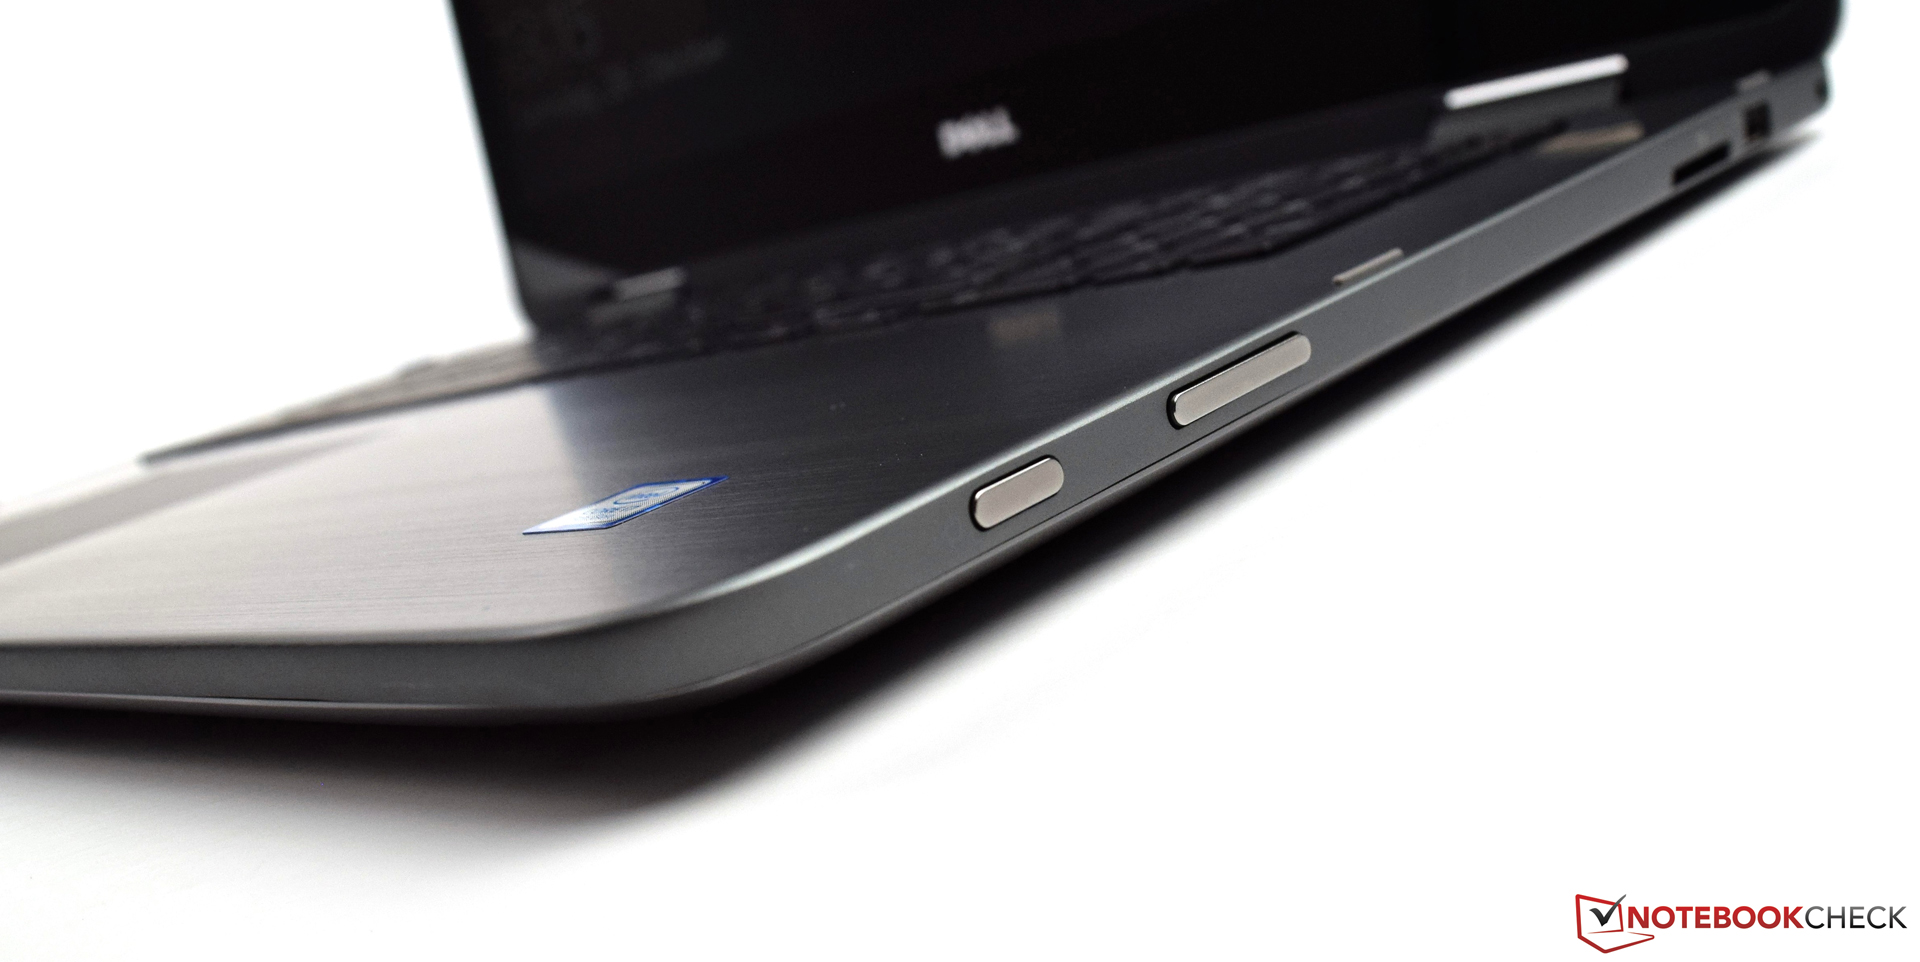
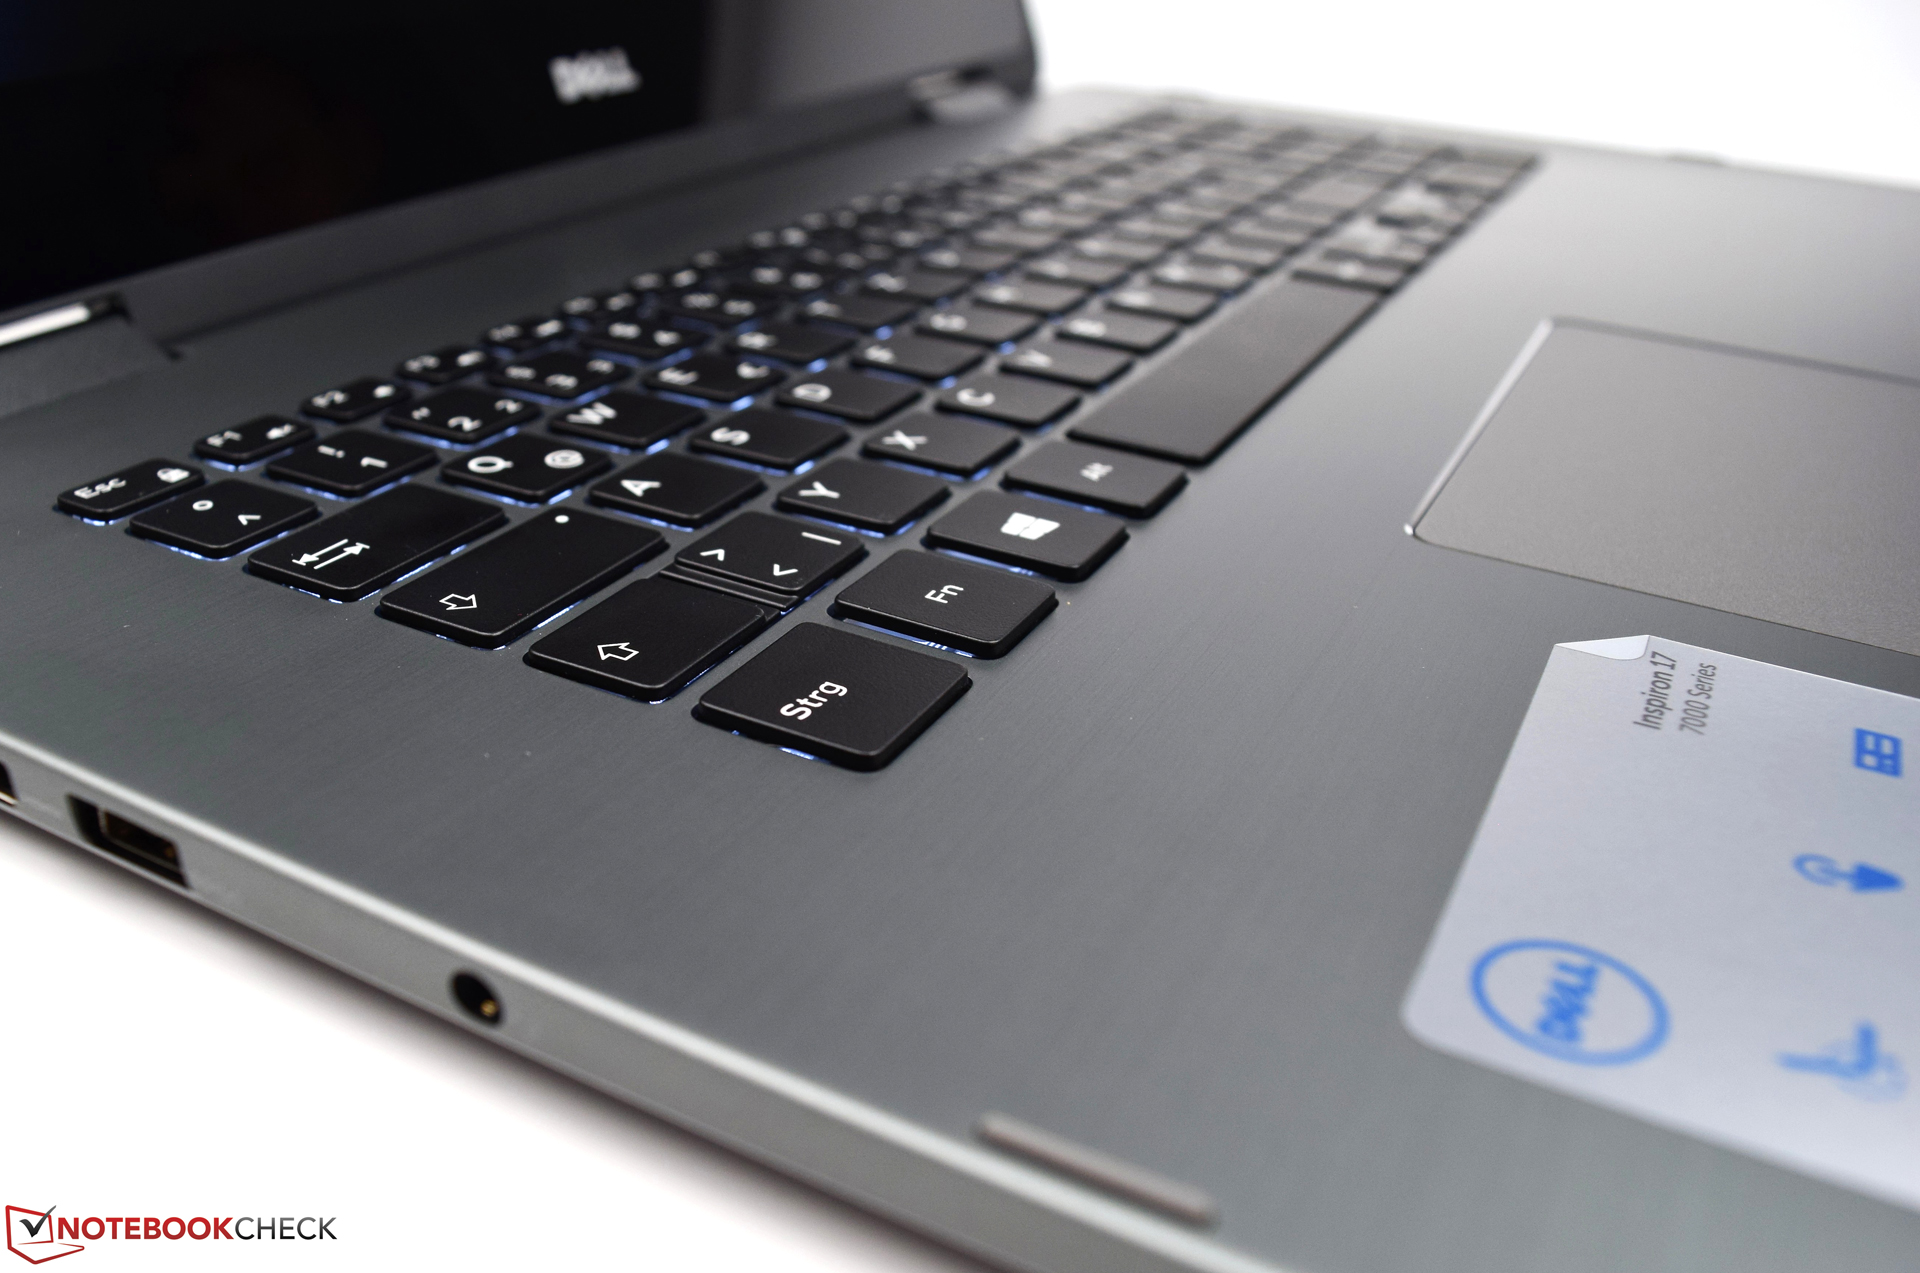
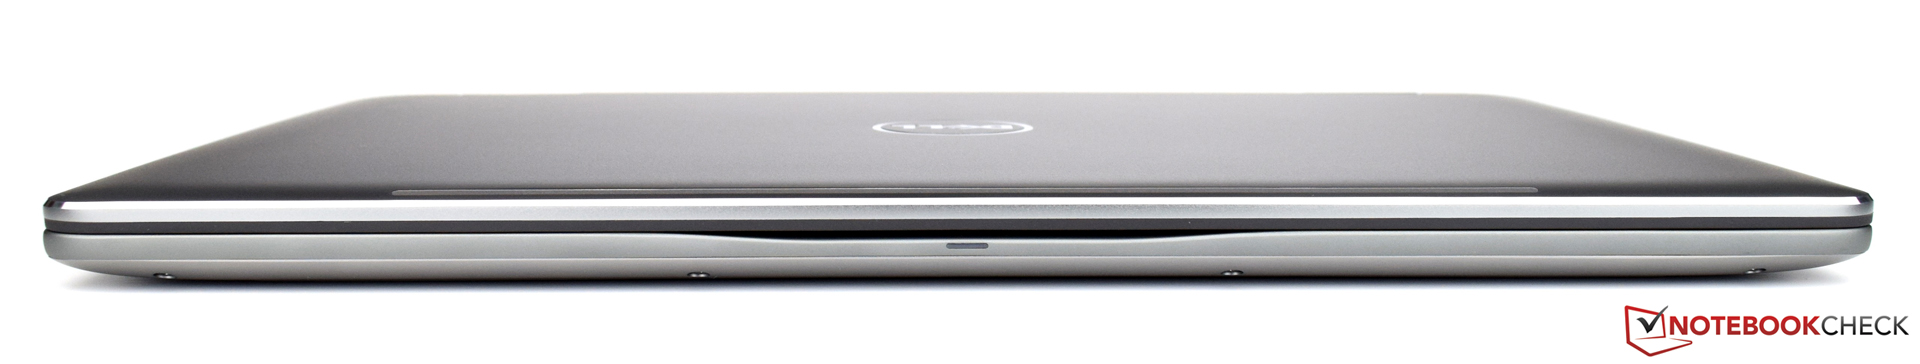
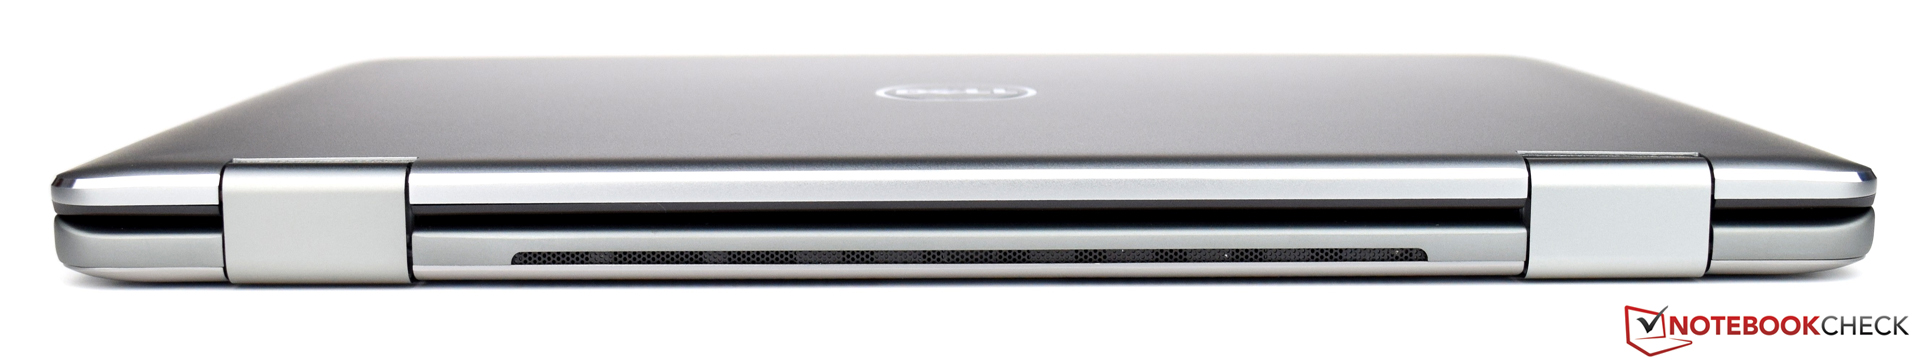
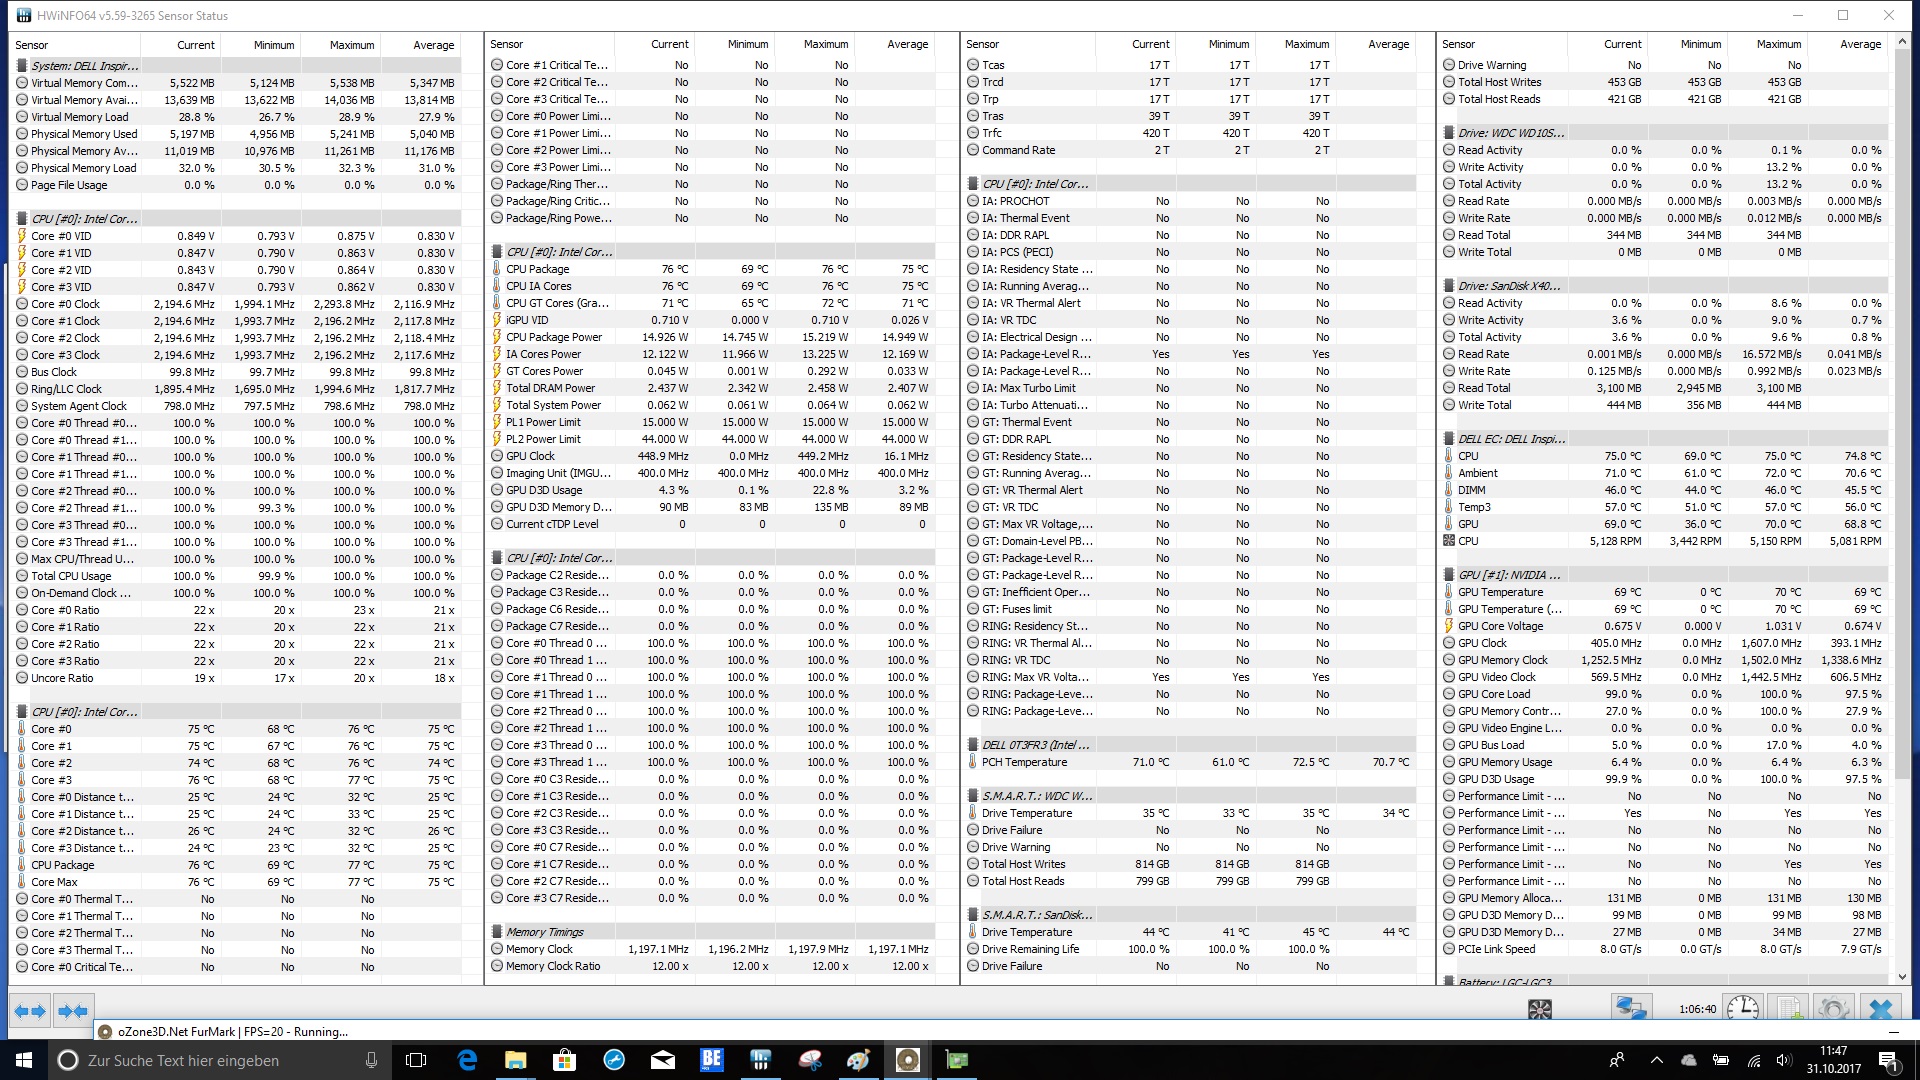
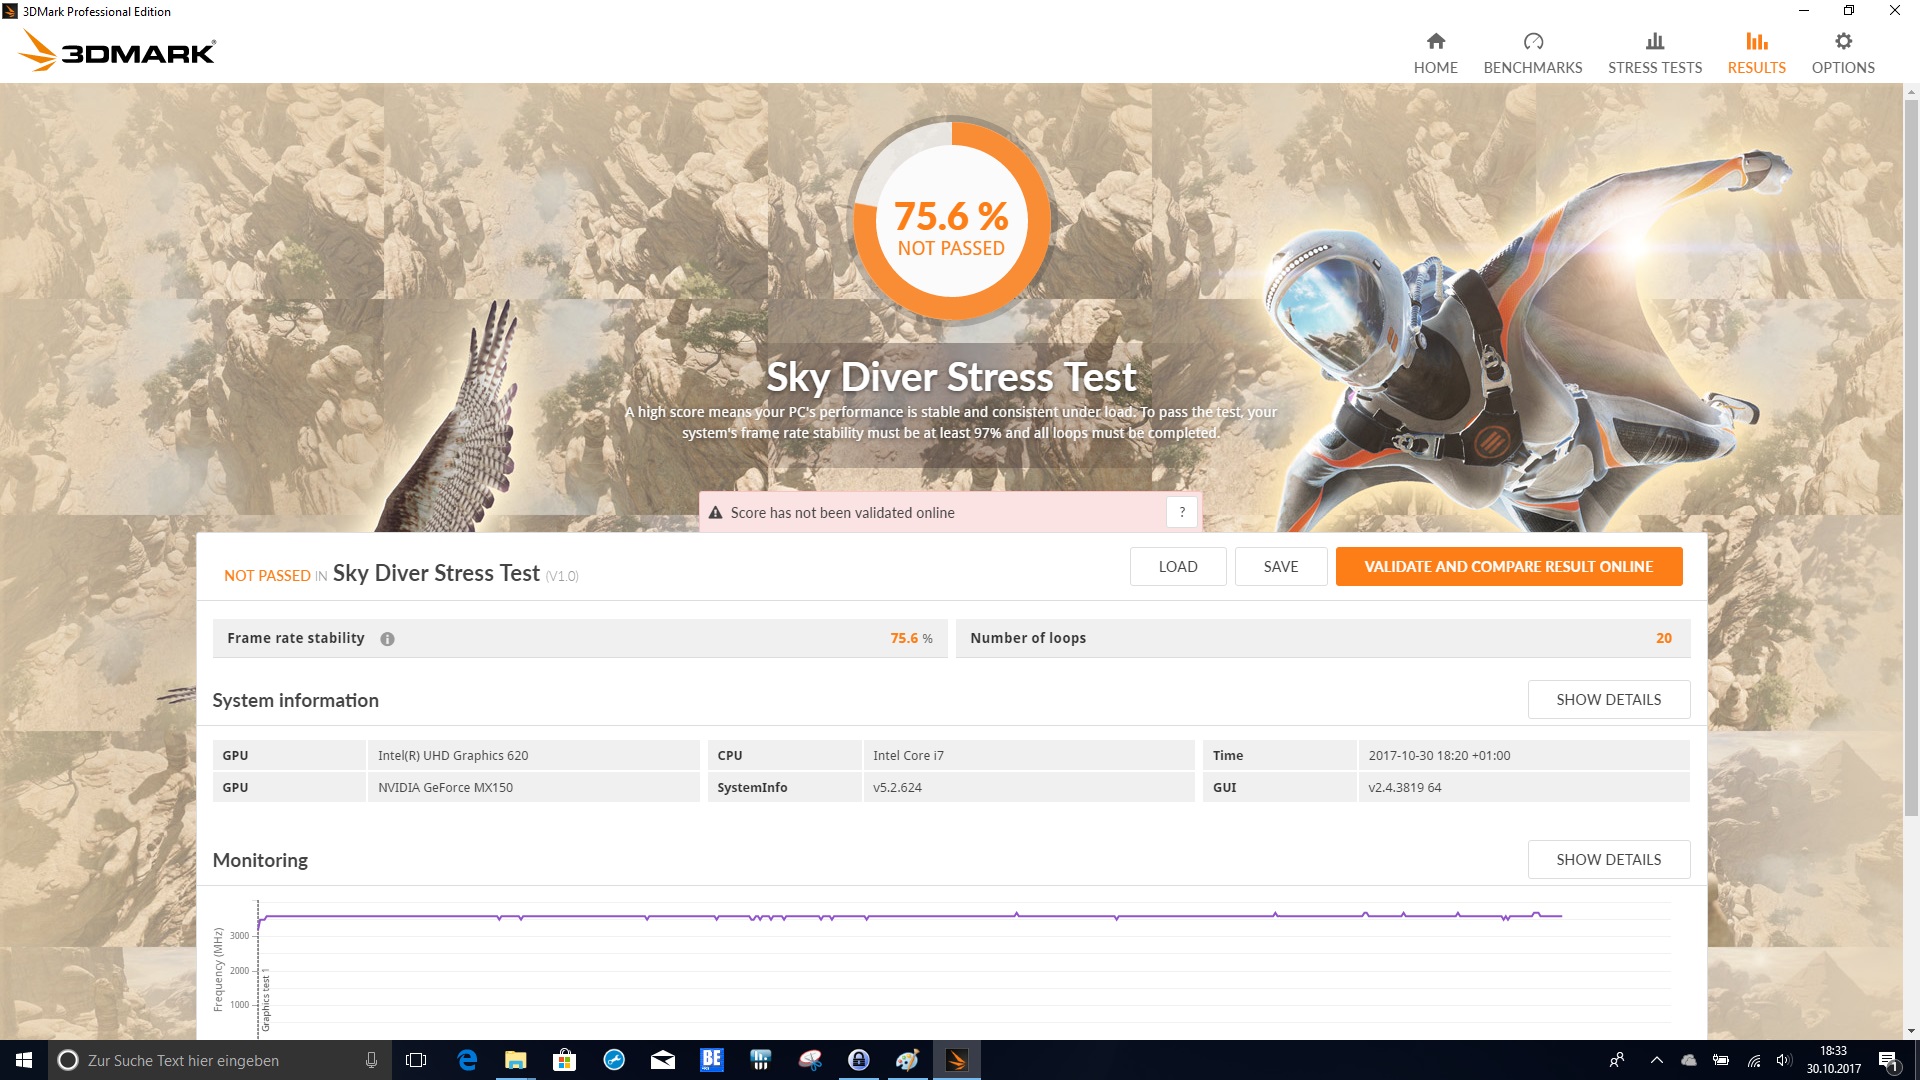
In particolare il design elegante ma modesto ci ha conviti. La scelta dei materiali, che conferiscono una stabilità molto buona al dispositivo, è altrettanto lodevole. Con display e tastiera, il produttore deve prendere qualche nota in modo da eliminare qualche piccolo errore nei prossimi update. La scheda grafica tende al throttling anche se la sua influenza sulle prestazioni complessive non è evidente. Nel complesso, il Dell Inspiron 17 7773 è un dispositivo multimedia molto buono con i vantaggi di un convertibile.
Nota: si tratta di una recensione breve, con alcune sezioni non tradotte, per la versione integrale in inglese guardate qui.
Dell Inspiron 17-7773-0043
- 11/06/2017 v6 (old)
Sebastian Bade