Recensione Breve del Portatile MSI PE70 2QE
| |||||||||||||||||||||||||
Distribuzione della luminosità: 79 %
Al centro con la batteria: 245 cd/m²
Contrasto: 610:1 (Nero: 0.5 cd/m²)
ΔE ColorChecker Calman: 4.83 | ∀{0.5-29.43 Ø4.72}
ΔE Greyscale Calman: 3.29 | ∀{0.09-98 Ø4.97}
84% sRGB (Argyll 1.6.3 3D)
56% AdobeRGB 1998 (Argyll 1.6.3 3D)
61.9% AdobeRGB 1998 (Argyll 3D)
84.6% sRGB (Argyll 3D)
66.6% Display P3 (Argyll 3D)
Gamma: 2.39
CCT: 7080 K
| MSI PE70-2QEi581 GeForce GTX 960M, 4210H, Toshiba HG5d THNSNH256GMCT | Acer Aspire V Nitro 7-791G-70TW GeForce GTX 960M, 4720HQ, Kingston RBU-SNS8100S3256GD | Asus N751JX-T4056H GeForce GTX 950M, 4720HQ, Toshiba MQ01ABD100 | Lenovo Y70 DU004HUS GeForce GTX 860M, 4710HQ, Western Digital WD10S21X SSHD 1TB + 8GB SSD-Cache | Asus GL771JM GeForce GTX 860M, 4710HQ, Kingston RBU-SC100S37128GD | |
|---|---|---|---|---|---|
| Display | 4% | 15% | 4% | 6% | |
| Display P3 Coverage (%) | 66.6 | 70.1 5% | 76.8 15% | 69.2 4% | 71.8 8% |
| sRGB Coverage (%) | 84.6 | 87.5 3% | 97.6 15% | 87.8 4% | 88.7 5% |
| AdobeRGB 1998 Coverage (%) | 61.9 | 63.9 3% | 71.4 15% | 64.4 4% | 64.8 5% |
| Screen | -7% | -0% | 15% | -1% | |
| Brightness middle (cd/m²) | 305 | 347 14% | 337 10% | 329.5 8% | 336 10% |
| Brightness (cd/m²) | 265 | 326 23% | 312 18% | 325 23% | 309 17% |
| Brightness Distribution (%) | 79 | 90 14% | 86 9% | 91 15% | 84 6% |
| Black Level * (cd/m²) | 0.5 | 0.409 18% | 0.61 -22% | 0.381 24% | 0.41 18% |
| Contrast (:1) | 610 | 848 39% | 552 -10% | 865 42% | 820 34% |
| Colorchecker dE 2000 * | 4.83 | 6.81 -41% | 5.84 -21% | 4.45 8% | 7.21 -49% |
| Greyscale dE 2000 * | 3.29 | 7.27 -121% | 3.86 -17% | 3.45 -5% | 4.96 -51% |
| Gamma | 2.39 92% | 2.4 92% | 2.59 85% | 2.03 108% | 2.98 74% |
| CCT | 7080 92% | 7546 86% | 6859 95% | 6623 98% | 6572 99% |
| Color Space (Percent of AdobeRGB 1998) (%) | 56 | 57 2% | 64 14% | 57.81 3% | 58 4% |
| Color Space (Percent of sRGB) (%) | 84 | 97 15% | |||
| Media totale (Programma / Settaggio) | -2% /
-4% | 8% /
3% | 10% /
12% | 3% /
1% |
* ... Meglio usare valori piccoli
| PCMark 7 - Score (ordina per valore) | |
| MSI PE70-2QEi581 | |
| Acer Aspire V Nitro 7-791G-70TW | |
| Lenovo Y70 DU004HUS | |
| Asus GL771JM | |
| PCMark 8 | |
| Home Score Accelerated v2 (ordina per valore) | |
| MSI PE70-2QEi581 | |
| Asus N751JX-T4056H | |
| Lenovo Y70 DU004HUS | |
| Asus GL771JM | |
| Work Score Accelerated v2 (ordina per valore) | |
| MSI PE70-2QEi581 | |
| Asus N751JX-T4056H | |
| Lenovo Y70 DU004HUS | |
| Asus GL771JM | |
| PCMark 7 Score | 3126 punti | |
| PCMark 8 Home Score Accelerated v2 | 3194 punti | |
| PCMark 8 Work Score Accelerated v2 | 4407 punti | |
Aiuto | ||

| 3DMark 11 - 1280x720 Performance (ordina per valore) | |
| MSI PE70-2QEi581 | |
| Acer Aspire V Nitro 7-791G-70TW | |
| Asus N751JX-T4056H | |
| Lenovo Y70 DU004HUS | |
| Asus GL771JM | |
| 3DMark - 1920x1080 Fire Strike Score (ordina per valore) | |
| MSI PE70-2QEi581 | |
| Acer Aspire V Nitro 7-791G-70TW | |
| Asus N751JX-T4056H | |
| Lenovo Y70 DU004HUS | |
| Asus GL771JM | |
| 3DMark 06 Standard Score | 20363 punti | |
| 3DMark 11 Performance | 4880 punti | |
| 3DMark Ice Storm Standard Score | 47288 punti | |
| 3DMark Cloud Gate Standard Score | 10548 punti | |
| 3DMark Fire Strike Score | 3661 punti | |
Aiuto | ||
| Tomb Raider | |
| 1366x768 High Preset AA:FX AF:8x (ordina per valore) | |
| MSI PE70-2QEi581 | |
| Acer Aspire V Nitro 7-791G-70TW | |
| Asus N751JX-T4056H | |
| Lenovo Y70 DU004HUS | |
| Asus GL771JM | |
| 1920x1080 Ultra Preset AA:FX AF:16x (ordina per valore) | |
| MSI PE70-2QEi581 | |
| Acer Aspire V Nitro 7-791G-70TW | |
| Asus N751JX-T4056H | |
| Lenovo Y70 DU004HUS | |
| Asus GL771JM | |
| BioShock Infinite | |
| 1366x768 High Preset (ordina per valore) | |
| MSI PE70-2QEi581 | |
| Acer Aspire V Nitro 7-791G-70TW | |
| Lenovo Y70 DU004HUS | |
| Asus GL771JM | |
| 1920x1080 Ultra Preset, DX11 (DDOF) (ordina per valore) | |
| MSI PE70-2QEi581 | |
| Acer Aspire V Nitro 7-791G-70TW | |
| Lenovo Y70 DU004HUS | |
| Asus GL771JM | |
| basso | medio | alto | ultra | |
|---|---|---|---|---|
| Tomb Raider (2013) | 178.4 | 158 | 104.5 | 48.4 |
| BioShock Infinite (2013) | 115.8 | 109.1 | 96.4 | 37.7 |
| Dirt Rally (2015) | 98.7 | 69.3 | 40.5 | 29.3 |
| MSI PE70-2QEi581 GeForce GTX 960M, 4210H, Toshiba HG5d THNSNH256GMCT | Acer Aspire V Nitro 7-791G-70TW GeForce GTX 960M, 4720HQ, Kingston RBU-SNS8100S3256GD | Asus N751JX-T4056H GeForce GTX 950M, 4720HQ, Toshiba MQ01ABD100 | Lenovo Y70 DU004HUS GeForce GTX 860M, 4710HQ, Western Digital WD10S21X SSHD 1TB + 8GB SSD-Cache | Asus GL771JM GeForce GTX 860M, 4710HQ, Kingston RBU-SC100S37128GD | |
|---|---|---|---|---|---|
| Noise | -1% | 3% | 8% | 7% | |
| Idle Minimum * (dB) | 33 | 29.6 10% | 33.2 -1% | 29.1 12% | 29.8 10% |
| Idle Average * (dB) | 34 | 32.1 6% | 33.3 2% | 30.8 9% | 32.4 5% |
| Idle Maximum * (dB) | 36.2 | 35.4 2% | 33.6 7% | 31.2 14% | 33.2 8% |
| Load Average * (dB) | 39.1 | 47.3 -21% | 40.4 -3% | 39.1 -0% | 39.6 -1% |
| Load Maximum * (dB) | 48.1 | 48.1 -0% | 42.4 12% | 46.5 3% | 41.6 14% |
* ... Meglio usare valori piccoli
Rumorosità
| Idle |
| 33 / 34 / 36.2 dB(A) |
| HDD |
| 33.3 dB(A) |
| DVD |
| 37.4 / dB(A) |
| Sotto carico |
| 39.1 / 48.1 dB(A) |
 | ||
30 dB silenzioso 40 dB(A) udibile 50 dB(A) rumoroso |
||
min: | ||
(-) La temperatura massima sul lato superiore è di 46 °C / 115 F, rispetto alla media di 36.8 °C / 98 F, che varia da 21 a 71 °C per questa classe Multimedia.
(±) Il lato inferiore si riscalda fino ad un massimo di 42.3 °C / 108 F, rispetto alla media di 39.1 °C / 102 F
(±) In idle, la temperatura media del lato superiore è di 32.4 °C / 90 F, rispetto alla media deld ispositivo di 31.3 °C / 88 F.
(±) I poggiapolsi e il touchpad possono diventare molto caldi al tatto con un massimo di 36 °C / 96.8 F.
(-) La temperatura media della zona del palmo della mano di dispositivi simili e'stata di 28.7 °C / 83.7 F (-7.3 °C / -13.1 F).
| MSI PE70-2QEi581 GeForce GTX 960M, 4210H, Toshiba HG5d THNSNH256GMCT | Acer Aspire V Nitro 7-791G-70TW GeForce GTX 960M, 4720HQ, Kingston RBU-SNS8100S3256GD | Asus N751JX-T4056H GeForce GTX 950M, 4720HQ, Toshiba MQ01ABD100 | Asus GL771JM GeForce GTX 860M, 4710HQ, Kingston RBU-SC100S37128GD | |
|---|---|---|---|---|
| Power Consumption | 34% | 31% | 27% | |
| Idle Minimum * (Watt) | 19.1 | 5.8 70% | 9.1 52% | 7.2 62% |
| Idle Average * (Watt) | 24.3 | 13.1 46% | 13.8 43% | 14.2 42% |
| Idle Maximum * (Watt) | 29.2 | 14.5 50% | 17.8 39% | 23.5 20% |
| Load Average * (Watt) | 88.6 | 98 -11% | 89.7 -1% | 85.6 3% |
| Load Maximum * (Watt) | 122 | 104.9 14% | 92.3 24% | 111.4 9% |
* ... Meglio usare valori piccoli
| Off / Standby | |
| Idle | |
| Sotto carico |
|
Leggenda:
min: | |
| MSI PE70-2QEi581 GeForce GTX 960M, 4210H, Toshiba HG5d THNSNH256GMCT | Acer Aspire V Nitro 7-791G-70TW GeForce GTX 960M, 4720HQ, Kingston RBU-SNS8100S3256GD | Asus N751JK-T4144H GeForce GTX 850M, 4710HQ, SanDisk X300s SD7SB3Q-128G | Lenovo Y70 DU004HUS GeForce GTX 860M, 4710HQ, Western Digital WD10S21X SSHD 1TB + 8GB SSD-Cache | Asus GL771JM GeForce GTX 860M, 4710HQ, Kingston RBU-SC100S37128GD | |
|---|---|---|---|---|---|
| Autonomia della batteria | 31% | -14% | 38% | 39% | |
| Reader / Idle (h) | 5.8 | 5.9 2% | 7.3 26% | 9.6 66% | |
| WiFi v1.3 (h) | 2.6 | 3.4 31% | 4.2 62% | ||
| Load (h) | 1 | 0.7 -30% | 1.5 50% | 0.9 -10% | |
| WiFi (h) | 5 | 3.6 |
Pro
Contro
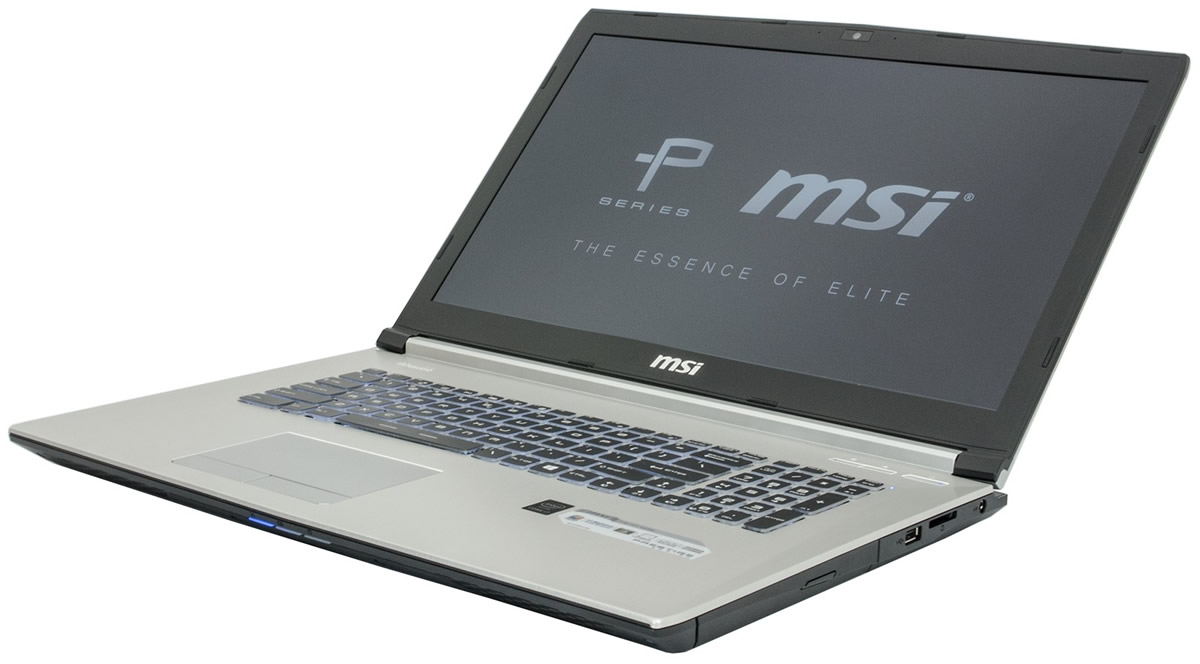
MSI usa un marketing molto aggressivo per la sua nuova linea Prestige e include molte features, ma non tutte ci hanno convinto durante la recensione. Lo chassis è ottimo al primo sguardo con la sua superficie in alluminio, ma la stabilità dell'unità base e della tastiera sono discutibili. Abbiamo apprezzato l'esperienza di digitazione con la tastiera, ma non l'utilizzo dei pulsanti del touchpad che davvero non sono a livello Prestige. La piccola batteria e la breve autonomia intaccano la mobilità del dispositivo.
Ovviamente ci sono anche aspetti positivi per il PE70. Il display matto Full HD IPS ha una buona qualità di immagine, sebbene MSI utilizzi un pannello migliore per il più piccolo PE60. Potete usare tutte le prestazioni dei componenti se siete collegati alla rete elettrica, e le casse funzionano bene unitamente al software Nahimic. Gli altri software sono nel complesso convincenti.
L'MSI PE70 è un decente portatile multimedia, ma non mantiene pienamente le promesse.
Poi c'è il prezzo. La versione entry-level del PE70 costa 1.299 Euro (~$1430), ma avrete appena un processore dual-core ed un hard drive convenzionale. La concorrenza monta quad-cores e a volte SSDs allo stesso prezzo, ma il quad-core è un aspetto particolarmente importante se volete un dispositivo da utilizzare anche in futuro. Uno sguardo ai rivali è raccomandato, in quanto il rapporto prezzo-performance del PE70 non è molto buono.
Nota: si tratta di una recensione breve, con alcune sezioni non tradotte, per la versione integrale in inglese guardate qui.
MSI PE70-2QEi581
- 03/10/2016 v5 (old)
Andreas Osthoff
Price comparison
