Recensione breve del portatile business HP ProBook 640 G3 (7200U, Full HD)
| SD Card Reader | |
| average JPG Copy Test (av. of 3 runs) | |
| Dell Latitude 14 E5470 | |
| Dell Latitude 14 E5470 | |
| HP ProBook 640 G2-T9X60ET | |
| Acer TravelMate P648-M-757N | |
| HP ProBook 640 G3 Z2W33ET | |
| Lenovo ThinkPad L460-20FVS01400 | |
| maximum AS SSD Seq Read Test (1GB) | |
| Dell Latitude 14 E5470 | |
| Dell Latitude 14 E5470 | |
| HP ProBook 640 G2-T9X60ET | |
| Lenovo ThinkPad L460-20FVS01400 | |
| HP ProBook 640 G3 Z2W33ET | |
| Networking | |
| iperf3 transmit AX12 | |
| HP ProBook 640 G3 Z2W33ET (jseb) | |
| Dell Latitude 14 E5470 (jseb) | |
| iperf3 receive AX12 | |
| Dell Latitude 14 E5470 (jseb) | |
| HP ProBook 640 G3 Z2W33ET (jseb) | |
| |||||||||||||||||||||||||
Distribuzione della luminosità: 88 %
Al centro con la batteria: 360 cd/m²
Contrasto: 497:1 (Nero: 0.69 cd/m²)
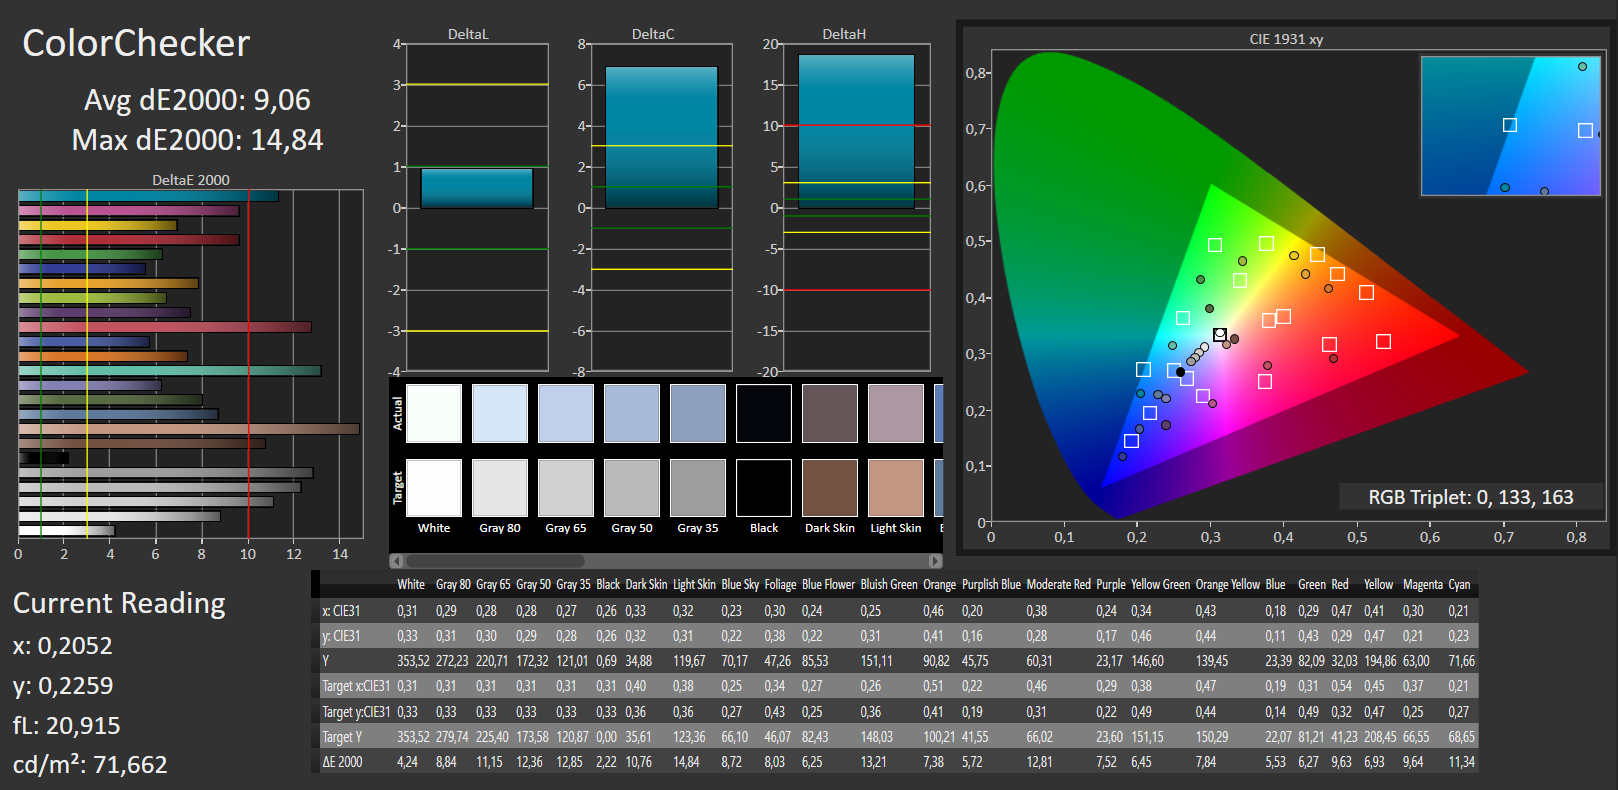
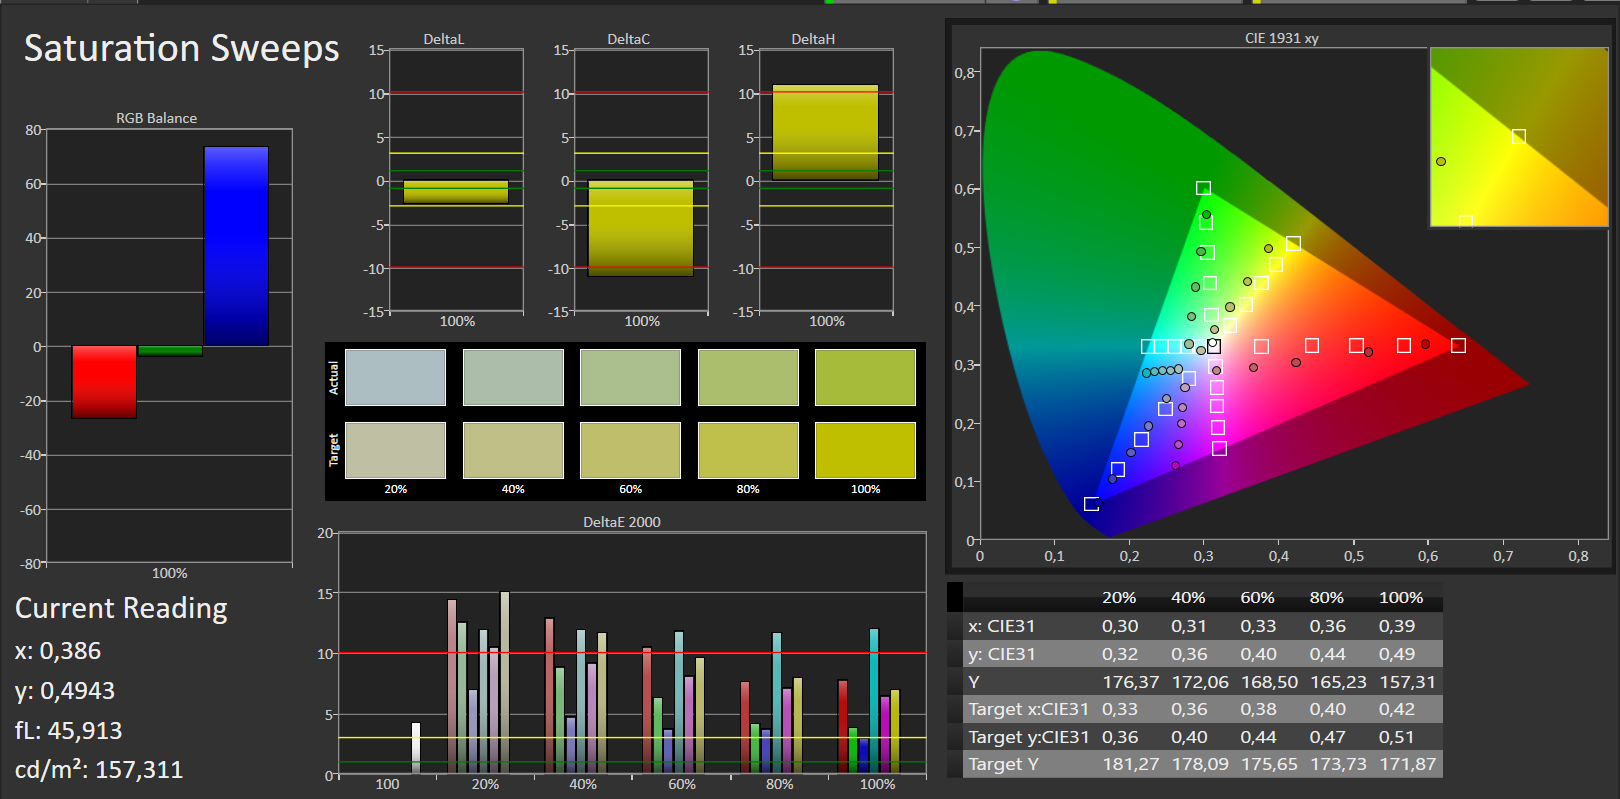
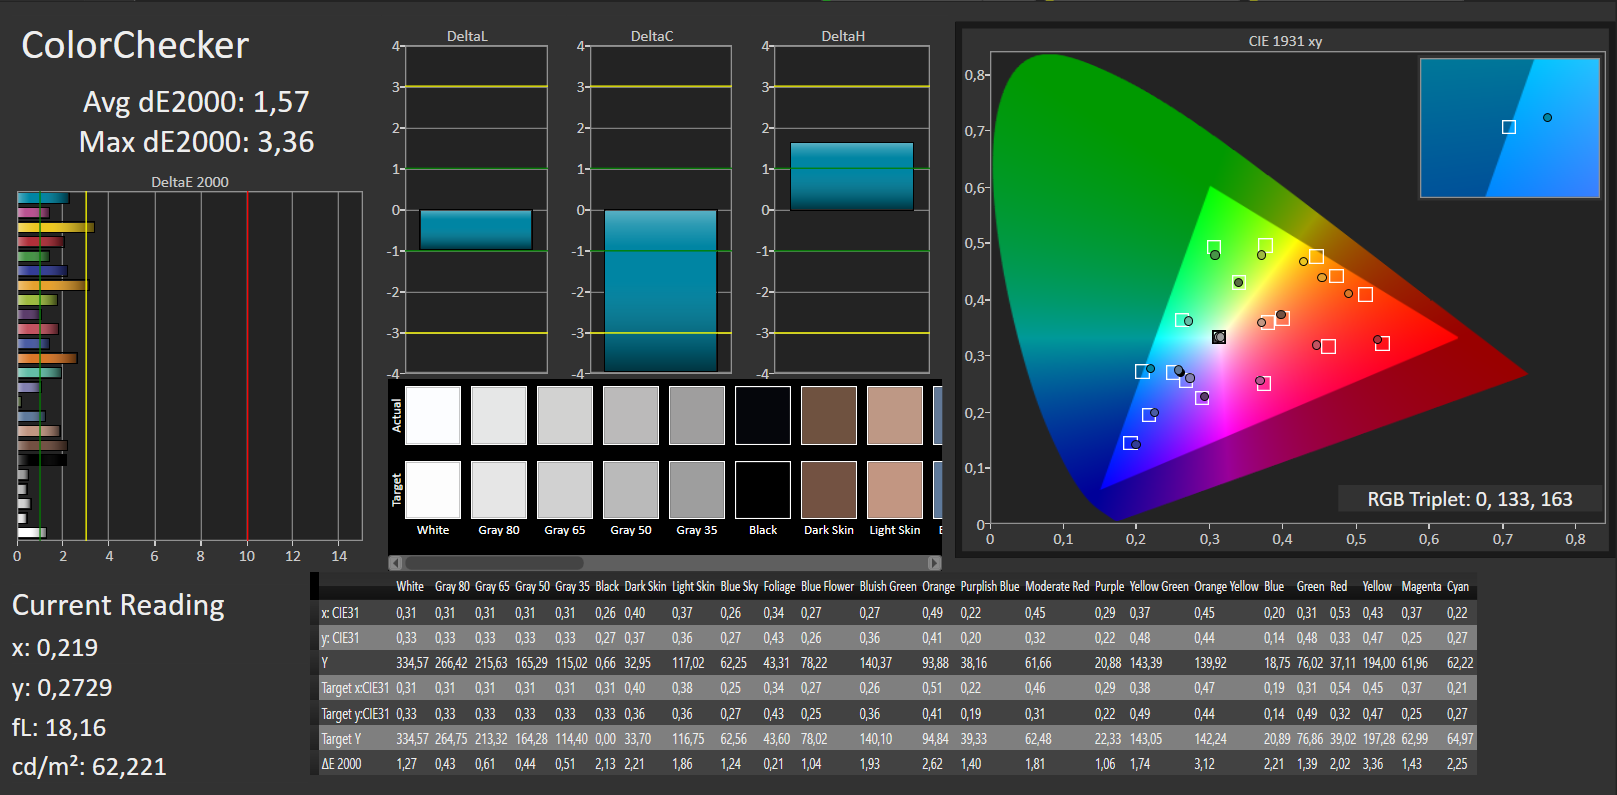
ΔE ColorChecker Calman: 9.06 | ∀{0.5-29.43 Ø4.71}
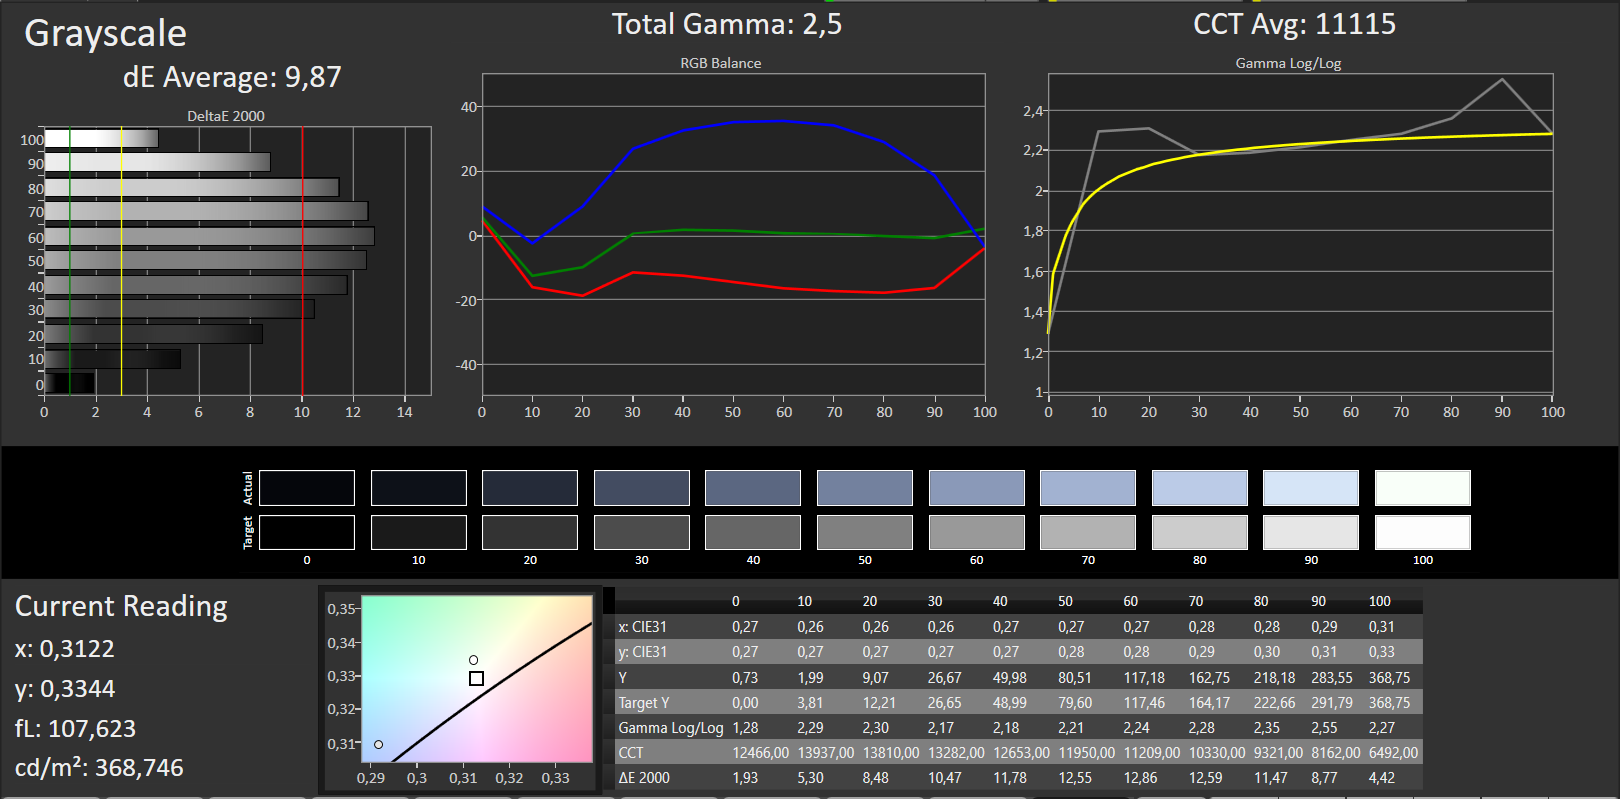
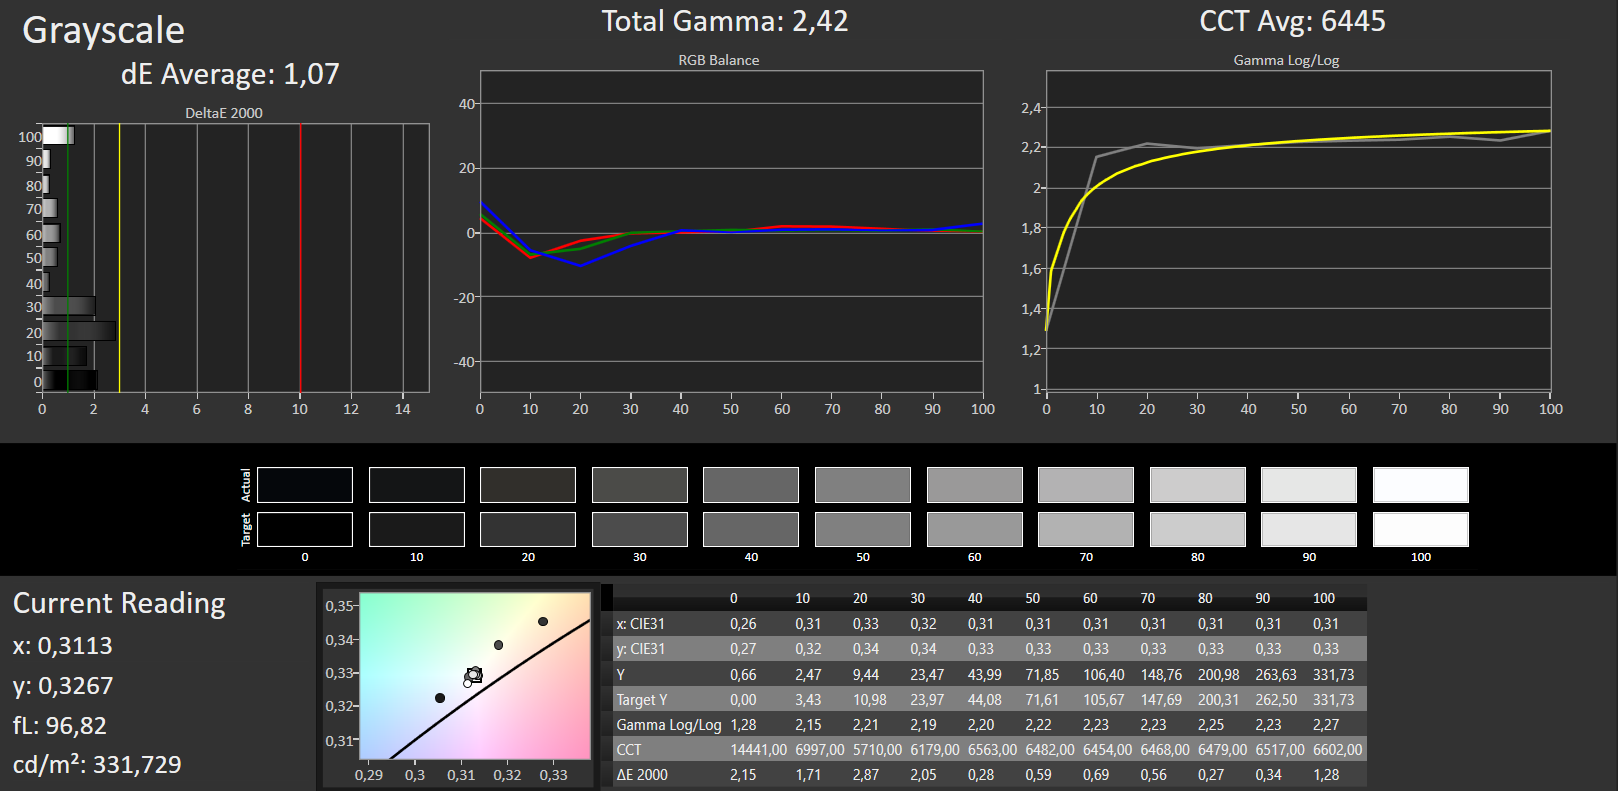
ΔE Greyscale Calman: 9.87 | ∀{0.09-98 Ø4.96}
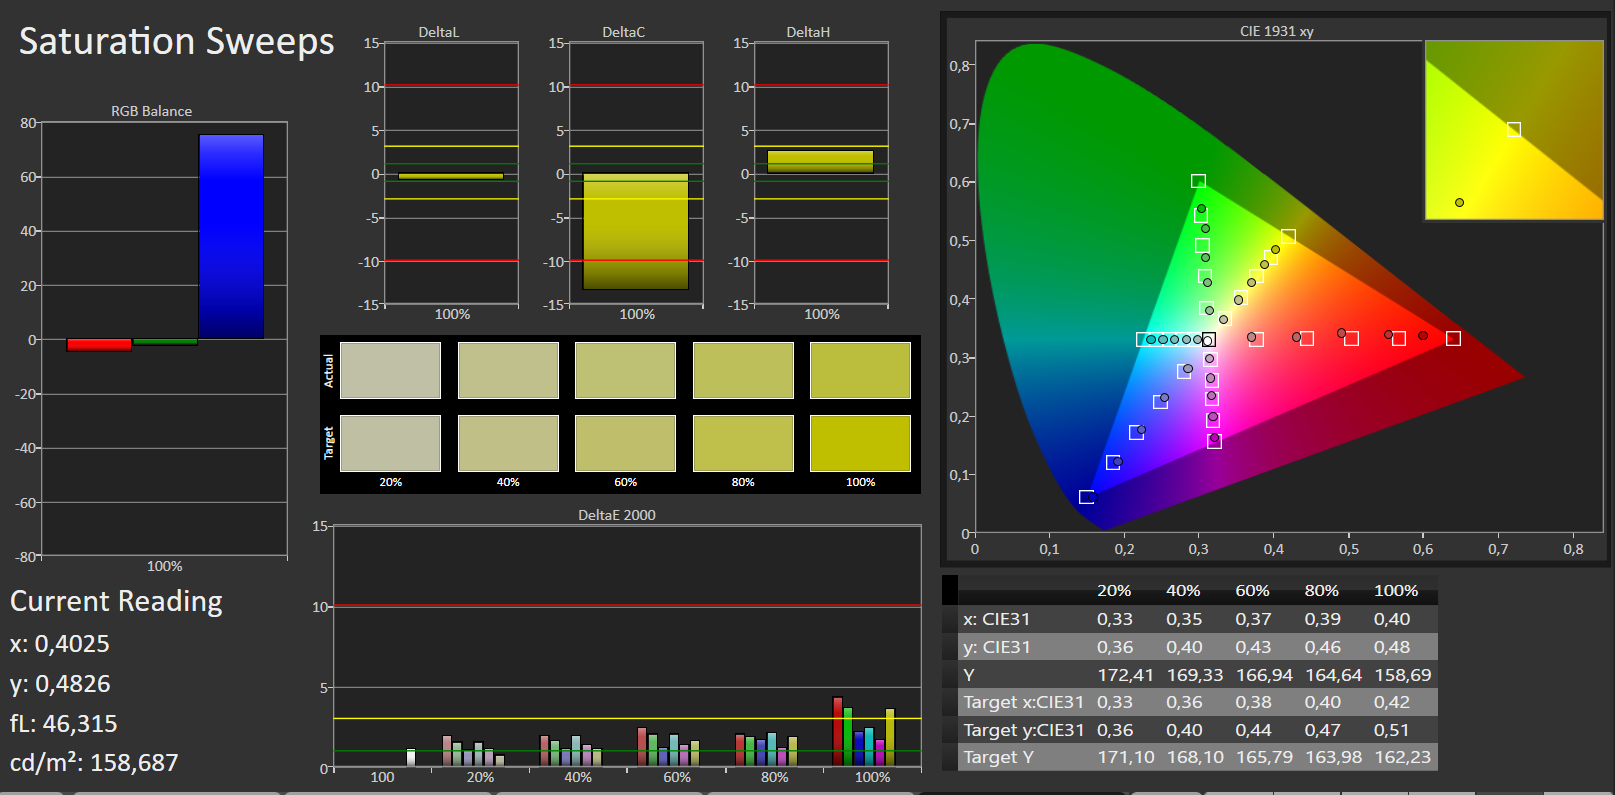
75% sRGB (Argyll 1.6.3 3D)
47% AdobeRGB 1998 (Argyll 1.6.3 3D)
51.1% AdobeRGB 1998 (Argyll 3D)
74.5% sRGB (Argyll 3D)
49.46% Display P3 (Argyll 3D)
Gamma: 2.5
CCT: 11115 K
| HP ProBook 640 G3 Z2W33ET TN LED, 1920x1080, 14" | HP ProBook 640 G2-T9X60ET TN-Panel, 1920x1080, 14" | Dell Latitude 14 E5470 AH-IPS, WLED, 1920x1080, 14" | Dell Latitude 14 E5470 TN, 1366x768, 14" | Lenovo ThinkPad L460-20FVS01400 IPS, 1920x1080, 14" | Acer TravelMate P648-M-757N IPS, 1920x1080, 14" | |
|---|---|---|---|---|---|---|
| Display | 0% | 22% | -19% | -15% | -28% | |
| Display P3 Coverage (%) | 49.46 | 49.54 0% | 64.8 31% | 40.06 -19% | 42.2 -15% | 35.53 -28% |
| sRGB Coverage (%) | 74.5 | 74.6 0% | 84.8 14% | 60.3 -19% | 62.3 -16% | 53.3 -28% |
| AdobeRGB 1998 Coverage (%) | 51.1 | 51.2 0% | 62 21% | 41.42 -19% | 43.72 -14% | 36.72 -28% |
| Response Times | 8% | 9% | -18% | -4% | 5% | |
| Response Time Grey 50% / Grey 80% * (ms) | 41 ? | 43.2 ? -5% | 39 ? 5% | 56.8 ? -39% | 44.4 ? -8% | 44 ? -7% |
| Response Time Black / White * (ms) | 30 ? | 24 ? 20% | 26 ? 13% | 28.8 ? 4% | 29.6 ? 1% | 25 ? 17% |
| PWM Frequency (Hz) | 192 ? | 200 ? | ||||
| Screen | 1% | 21% | -19% | 11% | 28% | |
| Brightness middle (cd/m²) | 343 | 315 -8% | 323 -6% | 229 -33% | 245 -29% | 254 -26% |
| Brightness (cd/m²) | 332 | 304 -8% | 316 -5% | 207 -38% | 225 -32% | 243 -27% |
| Brightness Distribution (%) | 88 | 93 6% | 79 -10% | 80 -9% | 83 -6% | 90 2% |
| Black Level * (cd/m²) | 0.69 | 0.61 12% | 0.57 17% | 0.69 -0% | 0.24 65% | 0.19 72% |
| Contrast (:1) | 497 | 516 4% | 567 14% | 332 -33% | 1021 105% | 1337 169% |
| Colorchecker dE 2000 * | 9.06 | 8.8 3% | 3.68 59% | 10.16 -12% | 6.89 24% | 4.93 46% |
| Colorchecker dE 2000 max. * | 14.84 | 15.03 -1% | 8.33 44% | 17.18 -16% | 17.62 -19% | 10.14 32% |
| Greyscale dE 2000 * | 9.87 | 9.44 4% | 2.99 70% | 10.87 -10% | 6.45 35% | 2.71 73% |
| Gamma | 2.5 88% | 2.53 87% | 2.49 88% | 2.41 91% | 2.46 89% | 2.36 93% |
| CCT | 11115 58% | 11794 55% | 6572 99% | 12881 50% | 6857 95% | 6914 94% |
| Color Space (Percent of AdobeRGB 1998) (%) | 47 | 47.37 1% | 55 17% | 38.4 -18% | 40.1 -15% | 34 -28% |
| Color Space (Percent of sRGB) (%) | 75 | 74.78 0% | 85 13% | 60.4 -19% | 61.8 -18% | 53 -29% |
| Media totale (Programma / Settaggio) | 3% /
2% | 17% /
20% | -19% /
-19% | -3% /
4% | 2% /
14% |
* ... Meglio usare valori piccoli
Sfarfallio dello schermo / PWM (Pulse-Width Modulation)
| flickering dello schermo / PWM rilevato | 192 Hz | ≤ 90 % settaggio luminosita' | 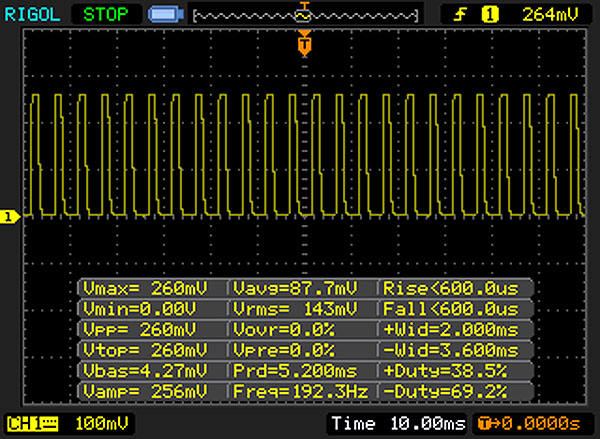 |
Il display sfarfalla a 192 Hz (Probabilmente a causa dell'uso di PWM) Flickering rilevato ad una luminosita' di 90 % o inferiore. Non dovrebbe verificarsi flickering o PWM sopra questo valore di luminosita'. La frequenza di 192 Hz è relativamente bassa, quindi gli utenti sensibili potrebbero notare il flickering ed accusare stanchezza agli occhi a questo livello di luminosità e a livelli inferiori. In confronto: 52 % di tutti i dispositivi testati non utilizza PWM per ridurre la luminosita' del display. Se è rilevato PWM, una media di 7741 (minimo: 5 - massimo: 343500) Hz è stata rilevata. | |||
Tempi di risposta del Display
| ↔ Tempi di risposta dal Nero al Bianco | ||
|---|---|---|
| 30 ms ... aumenta ↗ e diminuisce ↘ combinato | ↗ 13 ms Incremento | 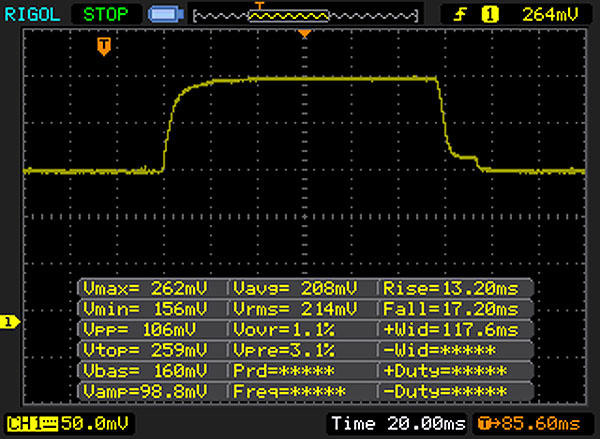 |
| ↘ 17 ms Calo | ||
| Lo schermo mostra tempi di risposta lenti nei nostri tests e sarà insoddisfacente per i gamers. In confronto, tutti i dispositivi di test variano da 0.1 (minimo) a 240 (massimo) ms. » 80 % di tutti i dispositivi è migliore. Questo significa che i tempi di risposta rilevati sono peggiori rispetto alla media di tutti i dispositivi testati (19.8 ms). | ||
| ↔ Tempo di risposta dal 50% Grigio all'80% Grigio | ||
| 41 ms ... aumenta ↗ e diminuisce ↘ combinato | ↗ 19 ms Incremento | 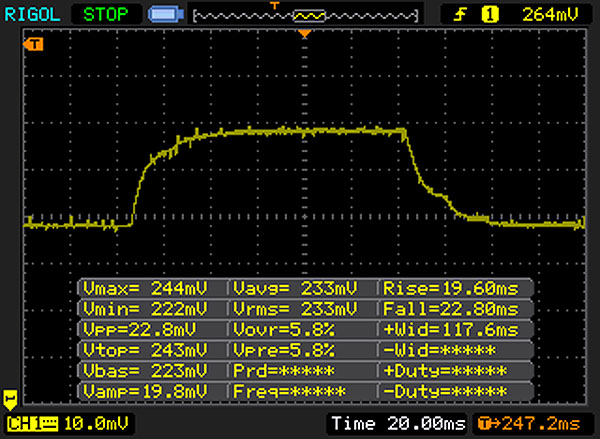 |
| ↘ 22 ms Calo | ||
| Lo schermo mostra tempi di risposta lenti nei nostri tests e sarà insoddisfacente per i gamers. In confronto, tutti i dispositivi di test variano da 0.165 (minimo) a 636 (massimo) ms. » 65 % di tutti i dispositivi è migliore. Questo significa che i tempi di risposta rilevati sono peggiori rispetto alla media di tutti i dispositivi testati (30.9 ms). | ||
| Cinebench R15 | |
| CPU Single 64Bit | |
| Dell Latitude 14 E5470 | |
| Lenovo ThinkPad L460-20FVS01400 | |
| HP ProBook 640 G3 Z2W33ET | |
| Dell Latitude 14 E5470 | |
| HP ProBook 640 G2-T9X60ET | |
| Acer TravelMate P648-M-757N | |
| CPU Multi 64Bit | |
| Dell Latitude 14 E5470 | |
| HP ProBook 640 G3 Z2W33ET | |
| Dell Latitude 14 E5470 | |
| Lenovo ThinkPad L460-20FVS01400 | |
| HP ProBook 640 G2-T9X60ET | |
| Acer TravelMate P648-M-757N | |
| Cinebench R11.5 | |
| CPU Multi 64Bit | |
| Dell Latitude 14 E5470 | |
| HP ProBook 640 G3 Z2W33ET | |
| Dell Latitude 14 E5470 | |
| Lenovo ThinkPad L460-20FVS01400 | |
| HP ProBook 640 G2-T9X60ET | |
| Acer TravelMate P648-M-757N | |
| CPU Single 64Bit | |
| HP ProBook 640 G3 Z2W33ET | |
| Dell Latitude 14 E5470 | |
| Dell Latitude 14 E5470 | |
| Lenovo ThinkPad L460-20FVS01400 | |
| HP ProBook 640 G2-T9X60ET | |
| Acer TravelMate P648-M-757N | |
| Cinebench R10 | |
| Rendering Multiple CPUs 32Bit | |
| Dell Latitude 14 E5470 | |
| HP ProBook 640 G3 Z2W33ET | |
| Lenovo ThinkPad L460-20FVS01400 | |
| Dell Latitude 14 E5470 | |
| HP ProBook 640 G2-T9X60ET | |
| Acer TravelMate P648-M-757N | |
| Rendering Single 32Bit | |
| HP ProBook 640 G3 Z2W33ET | |
| Lenovo ThinkPad L460-20FVS01400 | |
| Dell Latitude 14 E5470 | |
| Dell Latitude 14 E5470 | |
| HP ProBook 640 G2-T9X60ET | |
| Acer TravelMate P648-M-757N | |
| Geekbench 3 | |
| 32 Bit Single-Core Score | |
| Acer TravelMate P648-M-757N | |
| HP ProBook 640 G3 Z2W33ET | |
| Lenovo ThinkPad L460-20FVS01400 | |
| 32 Bit Multi-Core Score | |
| Acer TravelMate P648-M-757N | |
| HP ProBook 640 G3 Z2W33ET | |
| Lenovo ThinkPad L460-20FVS01400 | |
| Geekbench 4.0 | |
| 64 Bit Single-Core Score | |
| HP ProBook 640 G3 Z2W33ET | |
| 64 Bit Multi-Core Score | |
| HP ProBook 640 G3 Z2W33ET | |
| JetStream 1.1 - 1.1 Total | |
| HP ProBook 640 G3 Z2W33ET | |
| Dell Latitude 14 E5470 | |
| Lenovo ThinkPad L460-20FVS01400 | |
| HP ProBook 640 G2-T9X60ET | |
| Acer TravelMate P648-M-757N | |
| PCMark 7 Score | 5067 punti | |
| PCMark 8 Home Score Accelerated v2 | 3414 punti | |
| PCMark 8 Creative Score Accelerated v2 | 4274 punti | |
| PCMark 8 Work Score Accelerated v2 | 4545 punti | |
Aiuto | ||
| PCMark 8 | |
| Home Score Accelerated v2 | |
| Acer TravelMate P648-M-757N | |
| Dell Latitude 14 E5470 | |
| Dell Latitude 14 E5470 | |
| HP ProBook 640 G3 Z2W33ET | |
| HP ProBook 640 G2-T9X60ET | |
| Lenovo ThinkPad L460-20FVS01400 | |
| Work Score Accelerated v2 | |
| Dell Latitude 14 E5470 | |
| Dell Latitude 14 E5470 | |
| Acer TravelMate P648-M-757N | |
| Lenovo ThinkPad L460-20FVS01400 | |
| HP ProBook 640 G3 Z2W33ET | |
| HP ProBook 640 G2-T9X60ET | |

| HP ProBook 640 G3 Z2W33ET Samsung PM951 NVMe MZVLV256 | HP ProBook 640 G2-T9X60ET Samsung SSD PM871 MZNLN256HCHP | Dell Latitude 14 E5470 Micron SSD 1100 (MTFDDAV256TBN) | Dell Latitude 14 E5470 Liteon L8H-256V2G | Lenovo ThinkPad L460-20FVS01400 Toshiba HG6 THNSFJ256GCSU | Acer TravelMate P648-M-757N Lite-On CV1-8B256 | |
|---|---|---|---|---|---|---|
| CrystalDiskMark 3.0 | -22% | -34% | -26% | -31% | -25% | |
| Read Seq (MB/s) | 1285 | 492.8 -62% | 465.4 -64% | 508 -60% | 480.9 -63% | 531 -59% |
| Write Seq (MB/s) | 283.6 | 303.2 7% | 363.1 28% | 360.6 27% | 426.4 50% | 358.8 27% |
| Read 512 (MB/s) | 679 | 417.4 -39% | 338.4 -50% | 374.1 -45% | 361.8 -47% | 384.8 -43% |
| Write 512 (MB/s) | 300.8 | 301.5 0% | 246.1 -18% | 300.2 0% | 220.9 -27% | 363 21% |
| Read 4k (MB/s) | 41.79 | 33.28 -20% | 25.83 -38% | 31.98 -23% | 21.51 -49% | 31.3 -25% |
| Write 4k (MB/s) | 138.6 | 84.6 -39% | 80.3 -42% | 93.1 -33% | 71.5 -48% | 80.3 -42% |
| Read 4k QD32 (MB/s) | 507 | 394.2 -22% | 246.1 -51% | 274.7 -46% | 277.6 -45% | 239.4 -53% |
| Write 4k QD32 (MB/s) | 293.3 | 295.5 1% | 197.7 -33% | 205.6 -30% | 230.4 -21% | 225.3 -23% |
| 3DMark 06 Standard Score | 7879 punti | |
| 3DMark 11 Performance | 1541 punti | |
| 3DMark Ice Storm Standard Score | 52206 punti | |
| 3DMark Cloud Gate Standard Score | 5693 punti | |
| 3DMark Fire Strike Score | 754 punti | |
| 3DMark Fire Strike Extreme Score | 337 punti | |
Aiuto | ||
| 3DMark 11 - 1280x720 Performance GPU | |
| Lenovo ThinkPad L460-20FVS01400 | |
| HP ProBook 640 G3 Z2W33ET | |
| HP ProBook 640 G2-T9X60ET | |
| Dell Latitude 14 E5470 | |
| Dell Latitude 14 E5470 | |
| Acer TravelMate P648-M-757N | |
| 3DMark | |
| 1280x720 Cloud Gate Standard Graphics | |
| HP ProBook 640 G3 Z2W33ET | |
| Acer TravelMate P648-M-757N | |
| HP ProBook 640 G2-T9X60ET | |
| Dell Latitude 14 E5470 | |
| Dell Latitude 14 E5470 | |
| Lenovo ThinkPad L460-20FVS01400 | |
| 1920x1080 Fire Strike Graphics | |
| Lenovo ThinkPad L460-20FVS01400 | |
| Acer TravelMate P648-M-757N | |
| HP ProBook 640 G3 Z2W33ET | |
| Dell Latitude 14 E5470 | |
| HP ProBook 640 G2-T9X60ET | |
| Dell Latitude 14 E5470 | |
| basso | medio | alto | ultra | |
|---|---|---|---|---|
| Tomb Raider (2013) | 65.6 | 33.4 | 19.2 | 9.7 |
| BioShock Infinite (2013) | 39.9 | 24.5 | 20.2 | 7.1 |
| Battlefield 4 (2013) | 30.7 | 24.5 | 15.9 | 5.3 |
Rumorosità
| Idle |
| 30.7 / 30.7 / 31.5 dB(A) |
| DVD |
| 35.7 / dB(A) |
| Sotto carico |
| 31.4 / 31.1 dB(A) |
 | ||
30 dB silenzioso 40 dB(A) udibile 50 dB(A) rumoroso |
||
min: | ||
| HP ProBook 640 G3 Z2W33ET i5-7200U, HD Graphics 620 | HP ProBook 640 G2-T9X60ET 6200U, HD Graphics 520 | Dell Latitude 14 E5470 6440HQ, HD Graphics 530 | Dell Latitude 14 E5470 6300U, HD Graphics 520 | Lenovo ThinkPad L460-20FVS01400 6500U, Radeon R5 M330 | Acer TravelMate P648-M-757N 6500U, HD Graphics 520 | |
|---|---|---|---|---|---|---|
| Noise | 2% | -1% | 0% | -0% | -3% | |
| off /ambiente * (dB) | 30.7 | 29 6% | 30.3 1% | 29.2 5% | 29.2 5% | 31.2 -2% |
| Idle Minimum * (dB) | 30.7 | 29 6% | 30.3 1% | 29.2 5% | 29.2 5% | 31.2 -2% |
| Idle Average * (dB) | 30.7 | 29.8 3% | 30.3 1% | 29.2 5% | 29.2 5% | 31.2 -2% |
| Idle Maximum * (dB) | 31.5 | 30.2 4% | 30.3 4% | 29.2 7% | 29.2 7% | 31.6 -0% |
| Load Average * (dB) | 31.4 | 30.2 4% | 31.6 -1% | 32.1 -2% | 32.5 -4% | 33.3 -6% |
| Load Maximum * (dB) | 31.1 | 33.9 -9% | 35 -13% | 36.8 -18% | 37.2 -20% | 32.4 -4% |
* ... Meglio usare valori piccoli
(+) La temperatura massima sul lato superiore è di 34 °C / 93 F, rispetto alla media di 34.3 °C / 94 F, che varia da 21.2 a 62.5 °C per questa classe Office.
(+) Il lato inferiore si riscalda fino ad un massimo di 33.2 °C / 92 F, rispetto alla media di 36.8 °C / 98 F
(+) In idle, la temperatura media del lato superiore è di 24.9 °C / 77 F, rispetto alla media deld ispositivo di 29.5 °C / 85 F.
(+) I poggiapolsi e il touchpad sono piu' freddi della temperatura della pelle con un massimo di 25.6 °C / 78.1 F e sono quindi freddi al tatto.
(±) La temperatura media della zona del palmo della mano di dispositivi simili e'stata di 27.6 °C / 81.7 F (+2 °C / 3.6 F).
| HP ProBook 640 G3 Z2W33ET i5-7200U, HD Graphics 620 | HP ProBook 640 G2-T9X60ET 6200U, HD Graphics 520 | Dell Latitude 14 E5470 6440HQ, HD Graphics 530 | Dell Latitude 14 E5470 6300U, HD Graphics 520 | Lenovo ThinkPad L460-20FVS01400 6500U, Radeon R5 M330 | Acer TravelMate P648-M-757N 6500U, HD Graphics 520 | |
|---|---|---|---|---|---|---|
| Heat | -21% | -25% | -17% | -20% | -15% | |
| Maximum Upper Side * (°C) | 34 | 40.7 -20% | 43 -26% | 41.5 -22% | 40.8 -20% | 38.5 -13% |
| Maximum Bottom * (°C) | 33.2 | 42.6 -28% | 43 -30% | 41.4 -25% | 51.9 -56% | 36.7 -11% |
| Idle Upper Side * (°C) | 25.6 | 29.9 -17% | 31.2 -22% | 26.9 -5% | 25.2 2% | 31.5 -23% |
| Idle Bottom * (°C) | 26 | 30.3 -17% | 31.3 -20% | 29.6 -14% | 27.6 -6% | 29.6 -14% |
* ... Meglio usare valori piccoli
HP ProBook 640 G3 Z2W33ET analisi audio
(-) | altoparlanti non molto potenti (70 dB)
Bassi 100 - 315 Hz
(-) | quasi nessun basso - in media 15% inferiori alla media
(±) | la linearità dei bassi è media (7.5% delta rispetto alla precedente frequenza)
Medi 400 - 2000 Hz
(+) | medi bilanciati - solo only 4.1% rispetto alla media
(+) | medi lineari (6.1% delta rispetto alla precedente frequenza)
Alti 2 - 16 kHz
(±) | alti elevati - circa 8.8% superiori alla media
(+) | alti lineari (4.6% delta rispetto alla precedente frequenza)
Nel complesso 100 - 16.000 Hz
(±) | la linearità complessiva del suono è media (22.2% di differenza rispetto alla media
Rispetto alla stessa classe
» 58% di tutti i dispositivi testati in questa classe è stato migliore, 9% simile, 33% peggiore
» Il migliore ha avuto un delta di 7%, medio di 21%, peggiore di 53%
Rispetto a tutti i dispositivi testati
» 65% di tutti i dispositivi testati in questa classe è stato migliore, 6% similare, 29% peggiore
» Il migliore ha avuto un delta di 4%, medio di 23%, peggiore di 134%
Apple MacBook 12 (Early 2016) 1.1 GHz analisi audio
(+) | gli altoparlanti sono relativamente potenti (83.6 dB)
Bassi 100 - 315 Hz
(±) | bassi ridotti - in media 11.3% inferiori alla media
(±) | la linearità dei bassi è media (14.2% delta rispetto alla precedente frequenza)
Medi 400 - 2000 Hz
(+) | medi bilanciati - solo only 2.4% rispetto alla media
(+) | medi lineari (5.5% delta rispetto alla precedente frequenza)
Alti 2 - 16 kHz
(+) | Alti bilanciati - appena 2% dalla media
(+) | alti lineari (4.5% delta rispetto alla precedente frequenza)
Nel complesso 100 - 16.000 Hz
(+) | suono nel complesso lineare (10.2% differenza dalla media)
Rispetto alla stessa classe
» 7% di tutti i dispositivi testati in questa classe è stato migliore, 2% simile, 90% peggiore
» Il migliore ha avuto un delta di 5%, medio di 18%, peggiore di 53%
Rispetto a tutti i dispositivi testati
» 5% di tutti i dispositivi testati in questa classe è stato migliore, 1% similare, 94% peggiore
» Il migliore ha avuto un delta di 4%, medio di 23%, peggiore di 134%
| Off / Standby | |
| Idle | |
| Sotto carico |
|
Leggenda:
min: | |
| HP ProBook 640 G3 Z2W33ET i5-7200U, HD Graphics 620 | HP ProBook 640 G2-T9X60ET 6200U, HD Graphics 520 | Dell Latitude 14 E5470 6440HQ, HD Graphics 530 | Dell Latitude 14 E5470 6300U, HD Graphics 520 | Lenovo ThinkPad L460-20FVS01400 6500U, Radeon R5 M330 | Acer TravelMate P648-M-757N 6500U, HD Graphics 520 | |
|---|---|---|---|---|---|---|
| Power Consumption | -22% | -66% | -17% | -41% | -68% | |
| Idle Minimum * (Watt) | 2.3 | 3.3 -43% | 4.1 -78% | 3.5 -52% | 3.1 -35% | 5.3 -130% |
| Idle Average * (Watt) | 5.2 | 6 -15% | 8.1 -56% | 5.3 -2% | 6.3 -21% | 9.3 -79% |
| Idle Maximum * (Watt) | 5.6 | 6.9 -23% | 11.4 -104% | 6 -7% | 7.9 -41% | 11.5 -105% |
| Load Average * (Watt) | 27.2 | 27.7 -2% | 33.5 -23% | 26.3 3% | 29.5 -8% | 30.8 -13% |
| Load Maximum * (Watt) | 28.7 | 36.6 -28% | 49 -71% | 36.6 -28% | 57.3 -100% | 32 -11% |
* ... Meglio usare valori piccoli
| HP ProBook 640 G3 Z2W33ET i5-7200U, HD Graphics 620, 46 Wh | HP ProBook 640 G2-T9X60ET 6200U, HD Graphics 520, 46 Wh | Dell Latitude 14 E5470 6440HQ, HD Graphics 530, 62 Wh | Dell Latitude 14 E5470 6300U, HD Graphics 520, 62 Wh | Lenovo ThinkPad L460-20FVS01400 6500U, Radeon R5 M330, 48 Wh | Acer TravelMate P648-M-757N 6500U, HD Graphics 520, 54 Wh | |
|---|---|---|---|---|---|---|
| Autonomia della batteria | -9% | -32% | 9% | -26% | -14% | |
| Reader / Idle (h) | 24.6 | 16.6 -33% | 15.2 -38% | 21.7 -12% | 19.2 -22% | 18.1 -26% |
| H.264 (h) | 8.7 | 6.9 -21% | 10.8 24% | 7.2 -17% | 9.1 5% | |
| WiFi v1.3 (h) | 8.7 | 9.6 10% | 7.2 -17% | 11.1 28% | 7.1 -18% | 9.1 5% |
| Load (h) | 3 | 2.9 -3% | 1.4 -53% | 2.9 -3% | 1.6 -47% | 1.8 -40% |
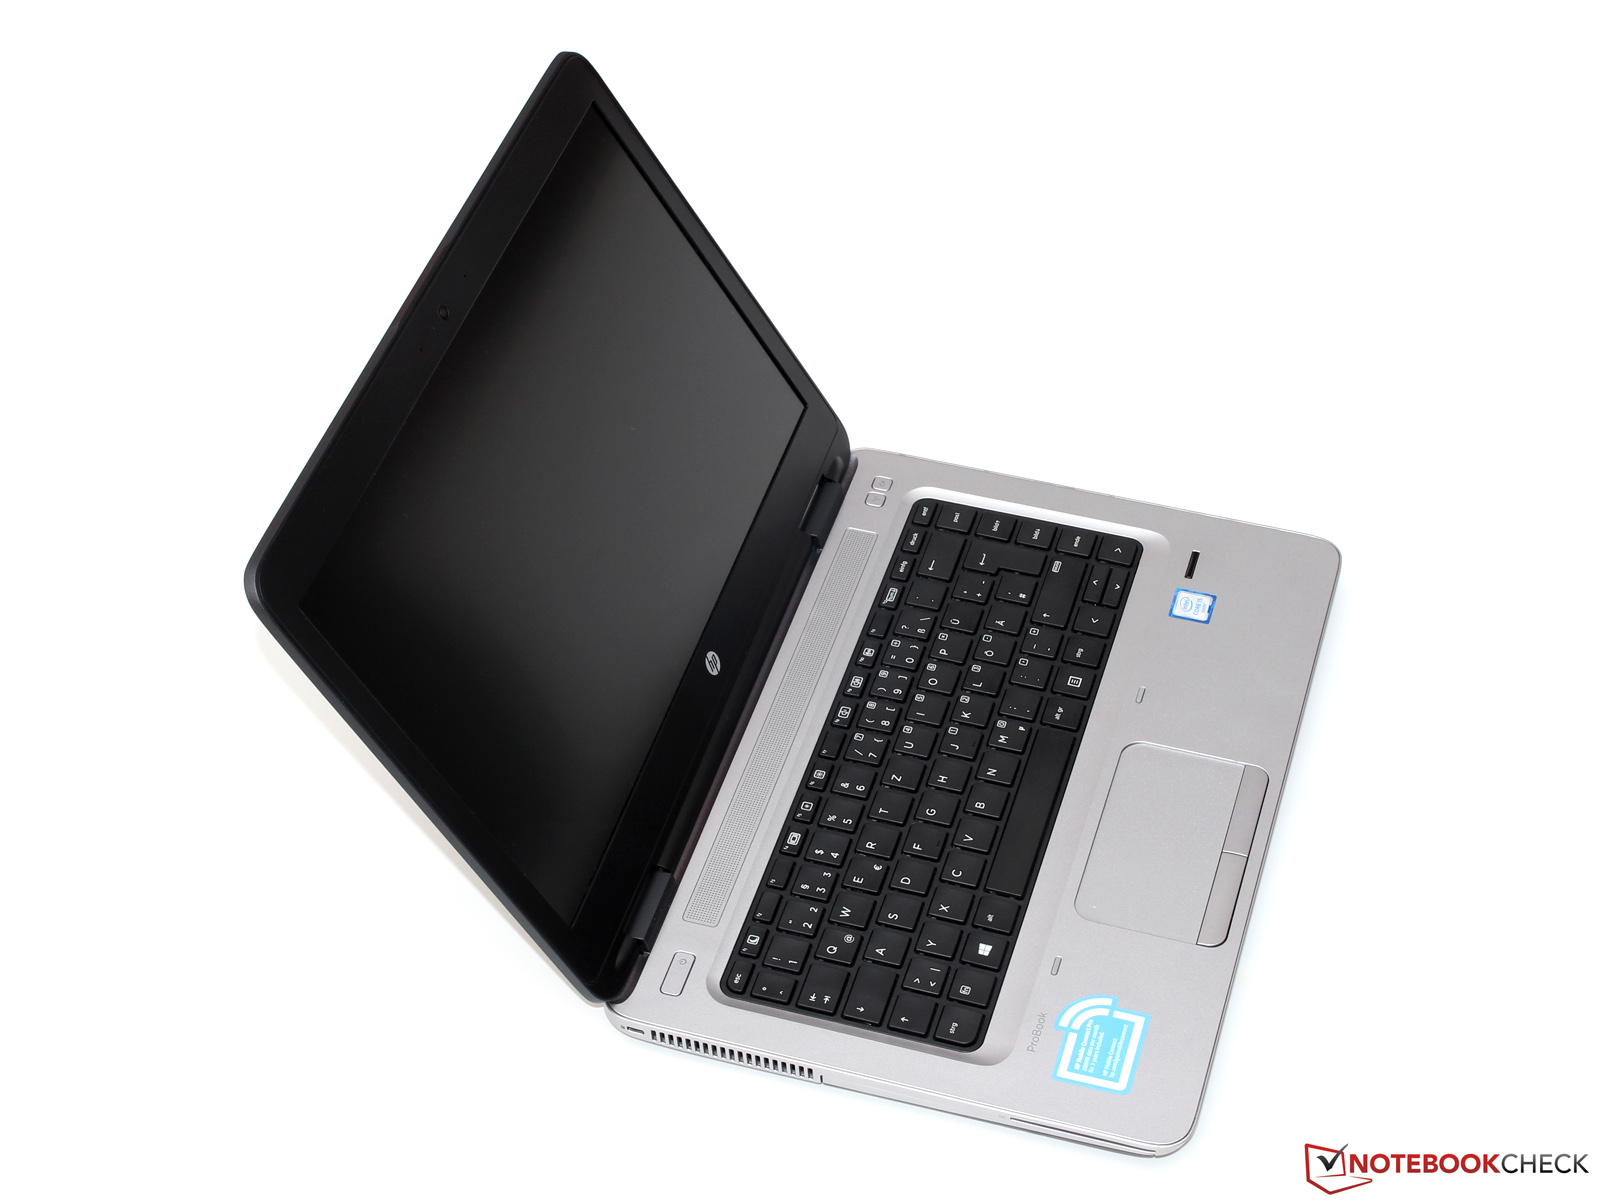
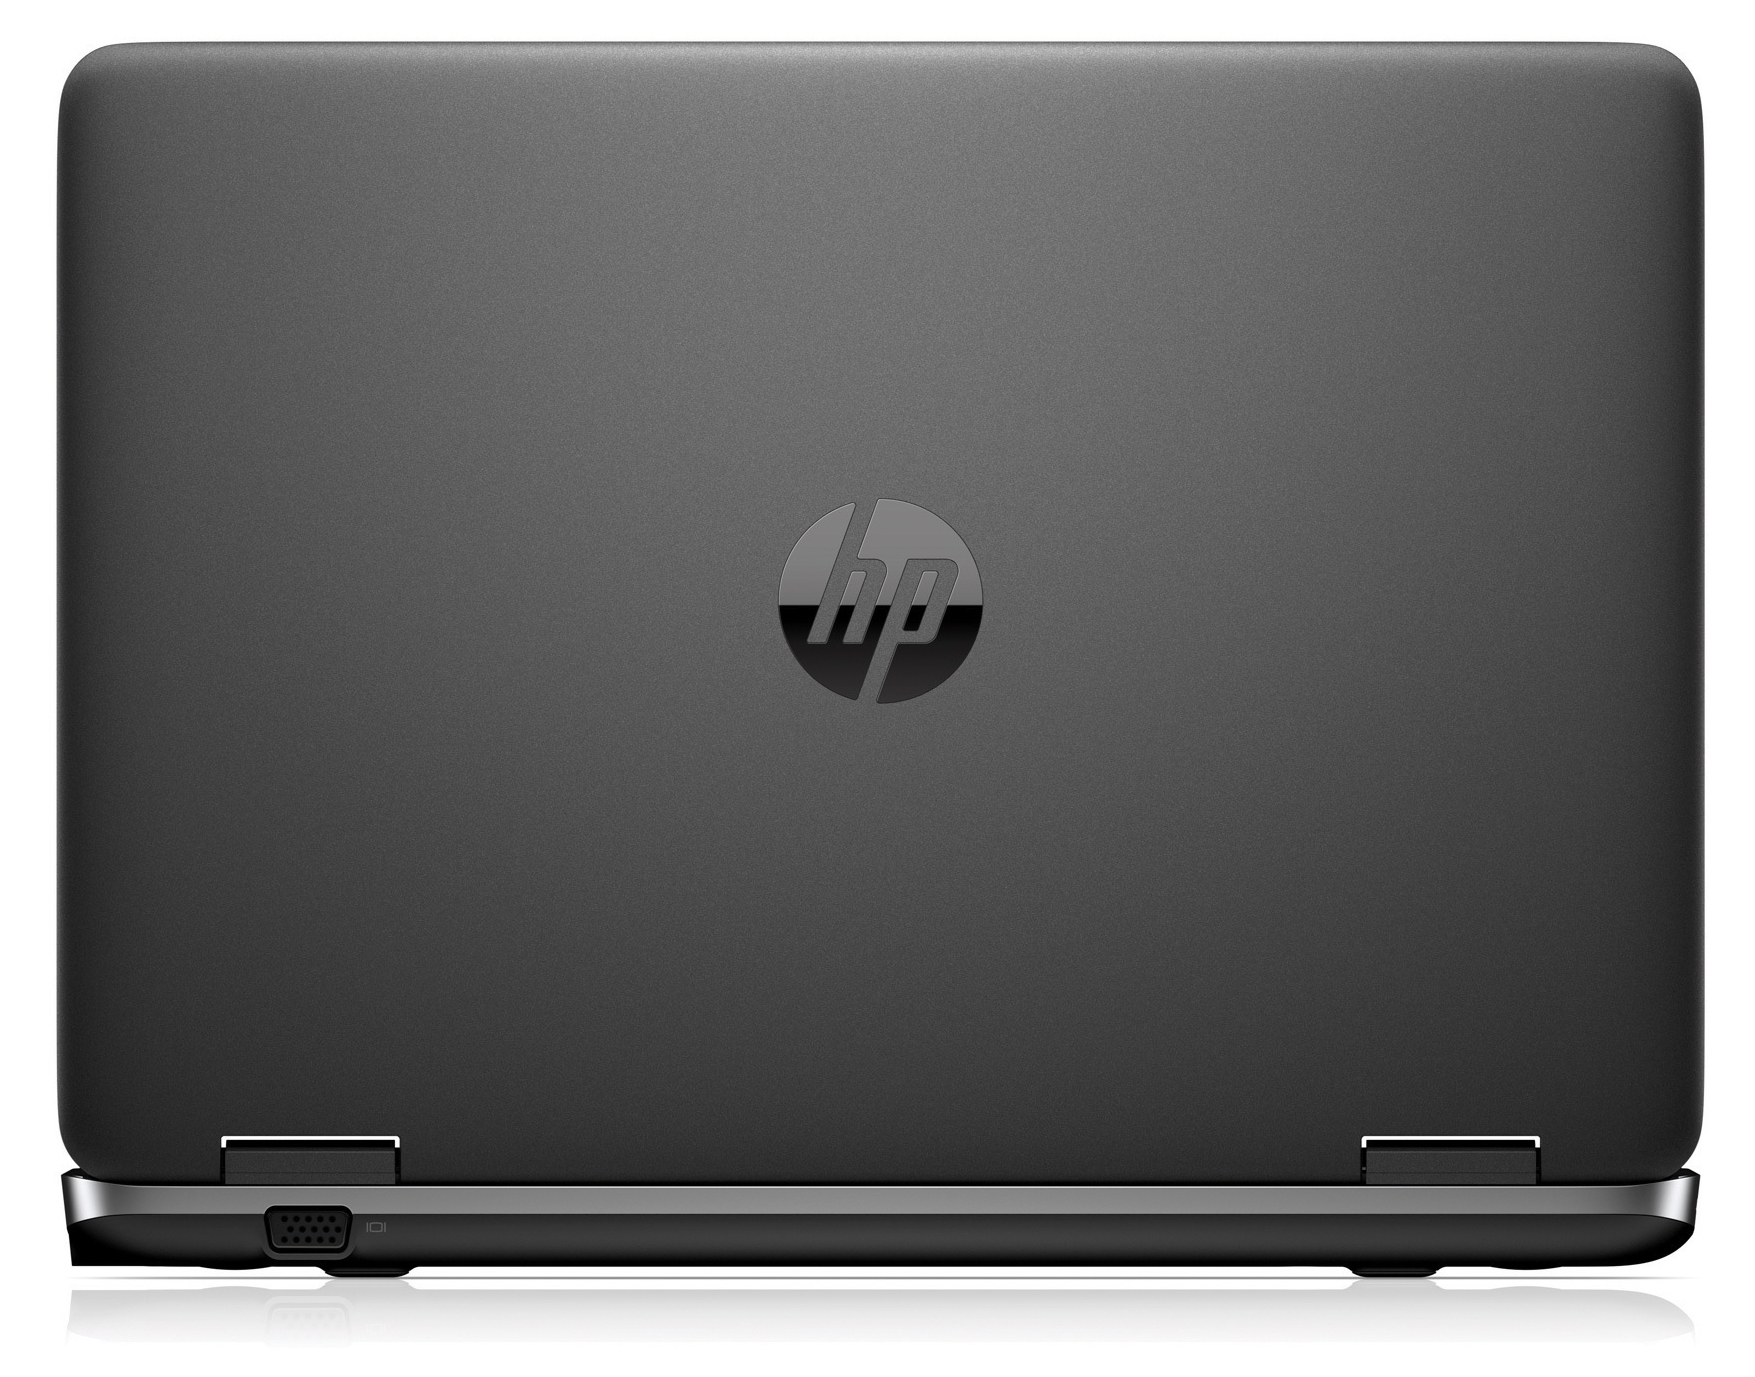
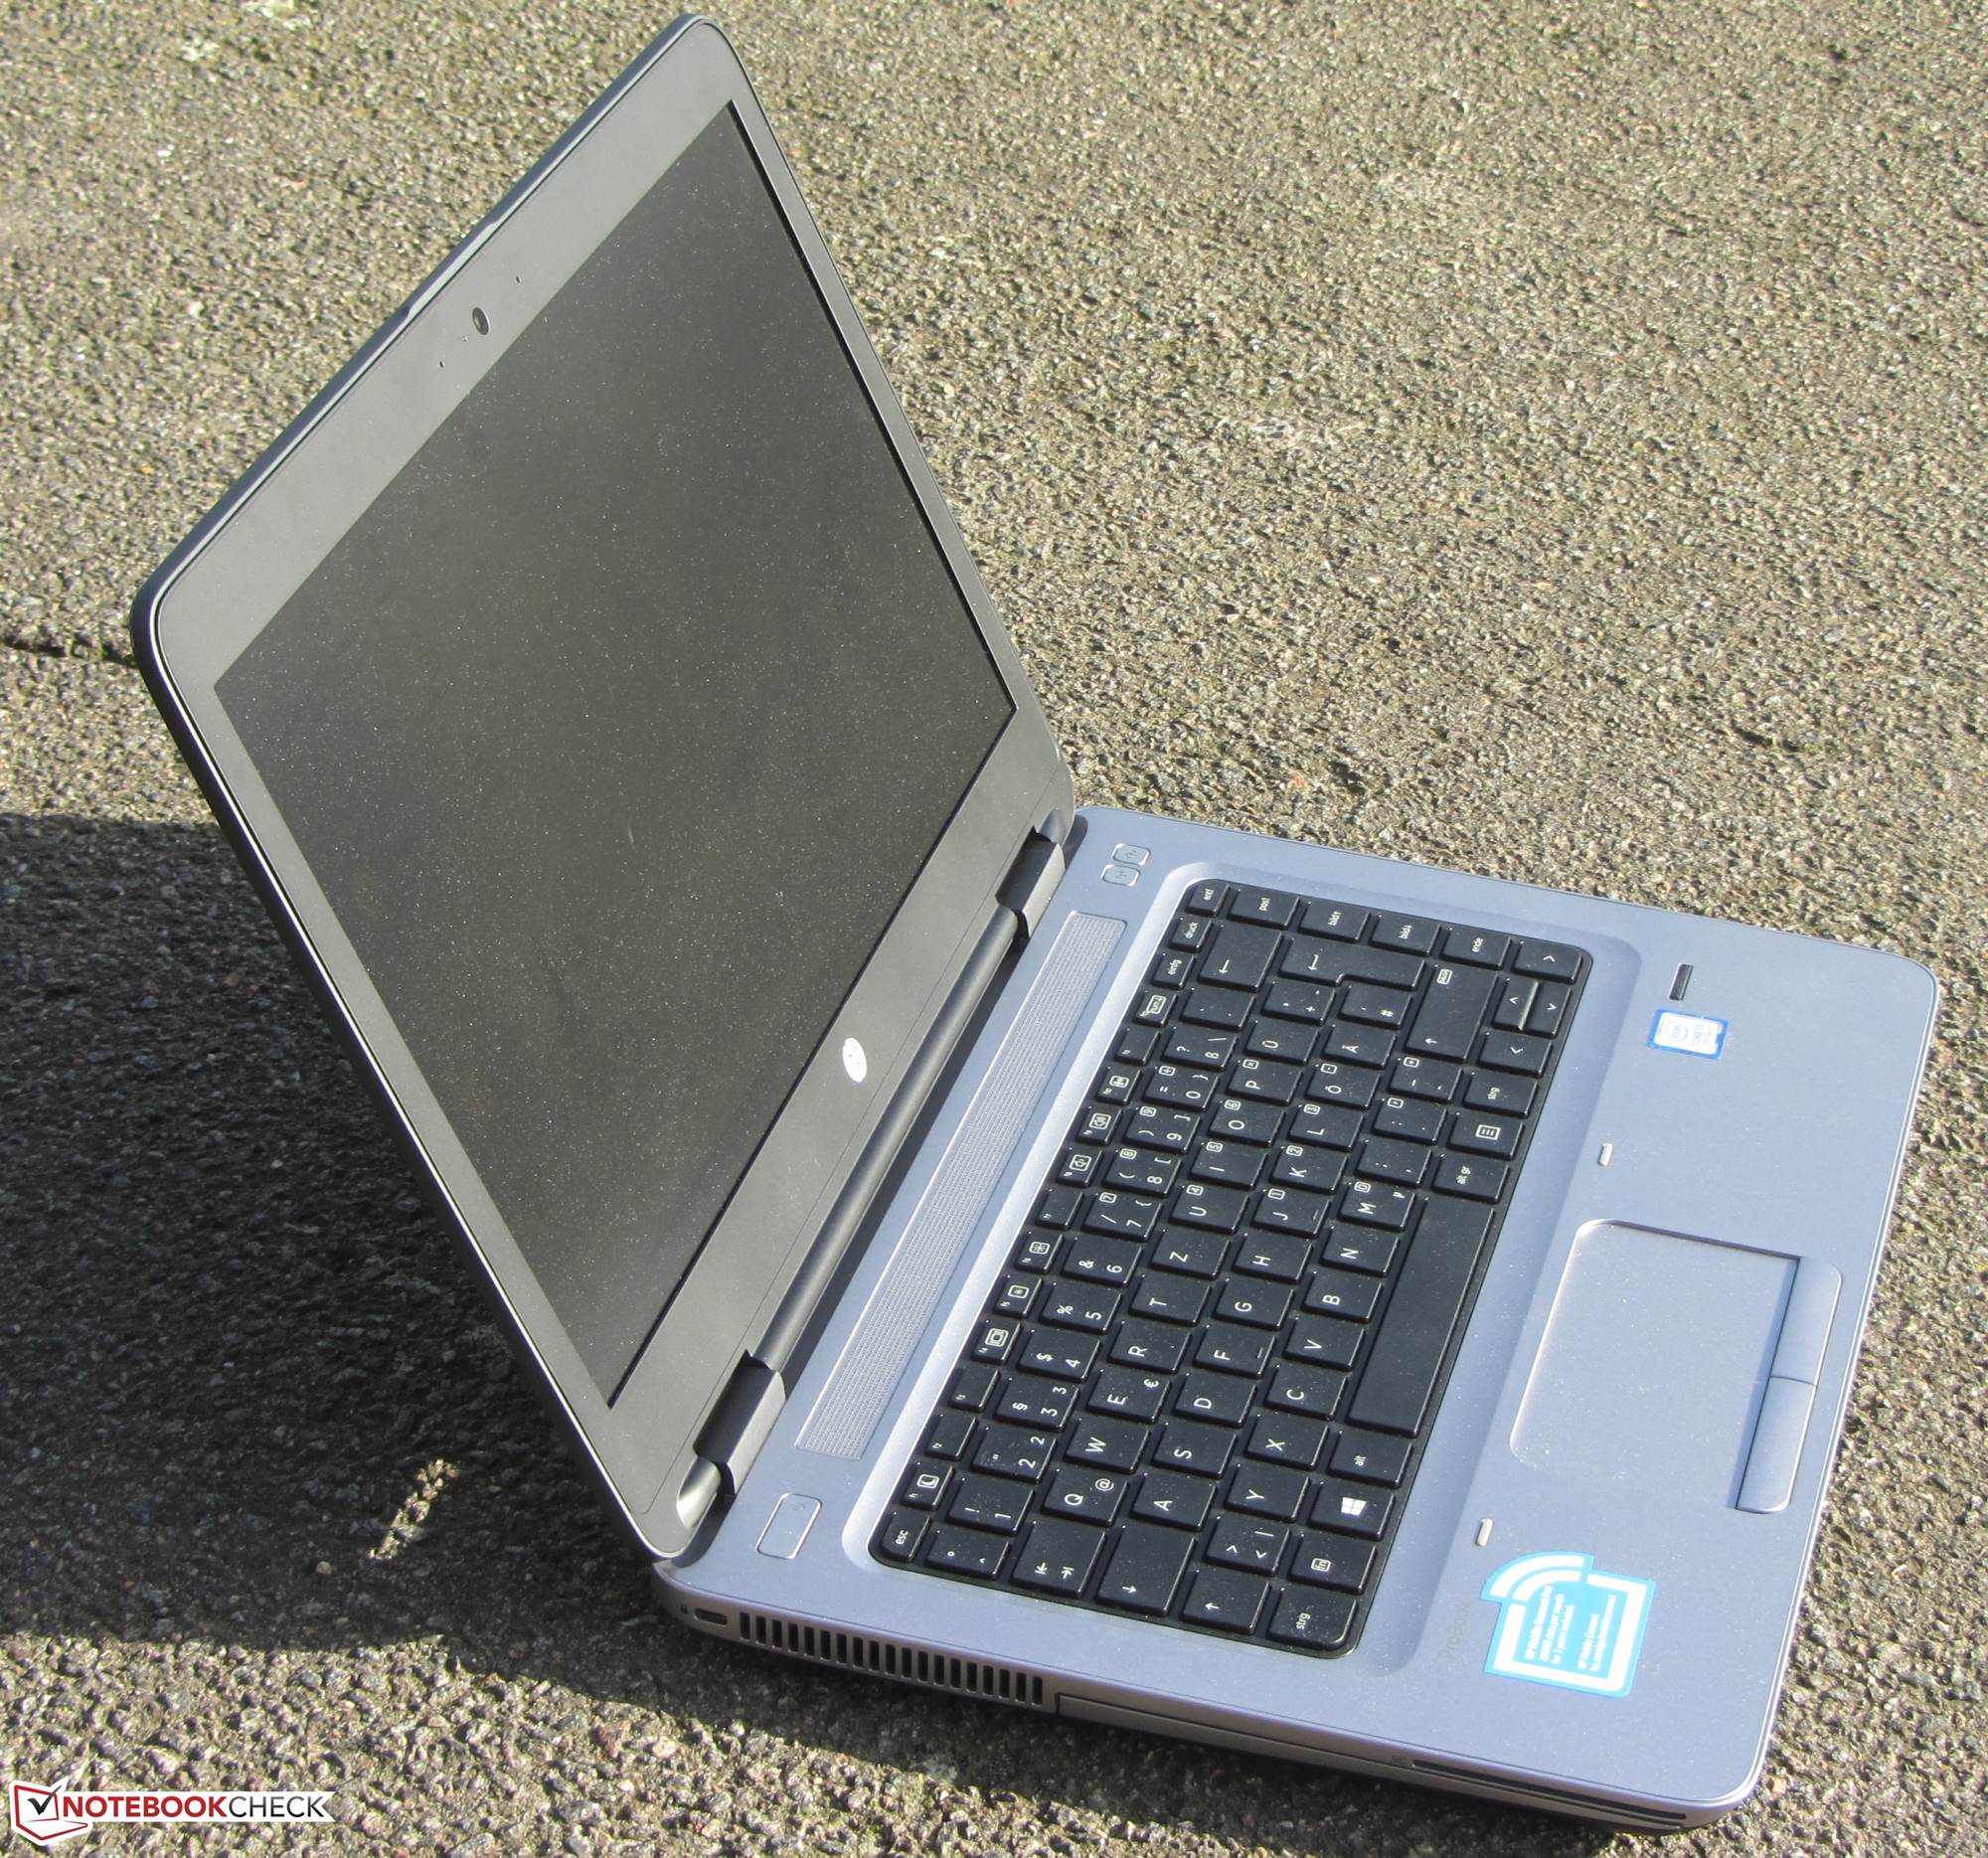
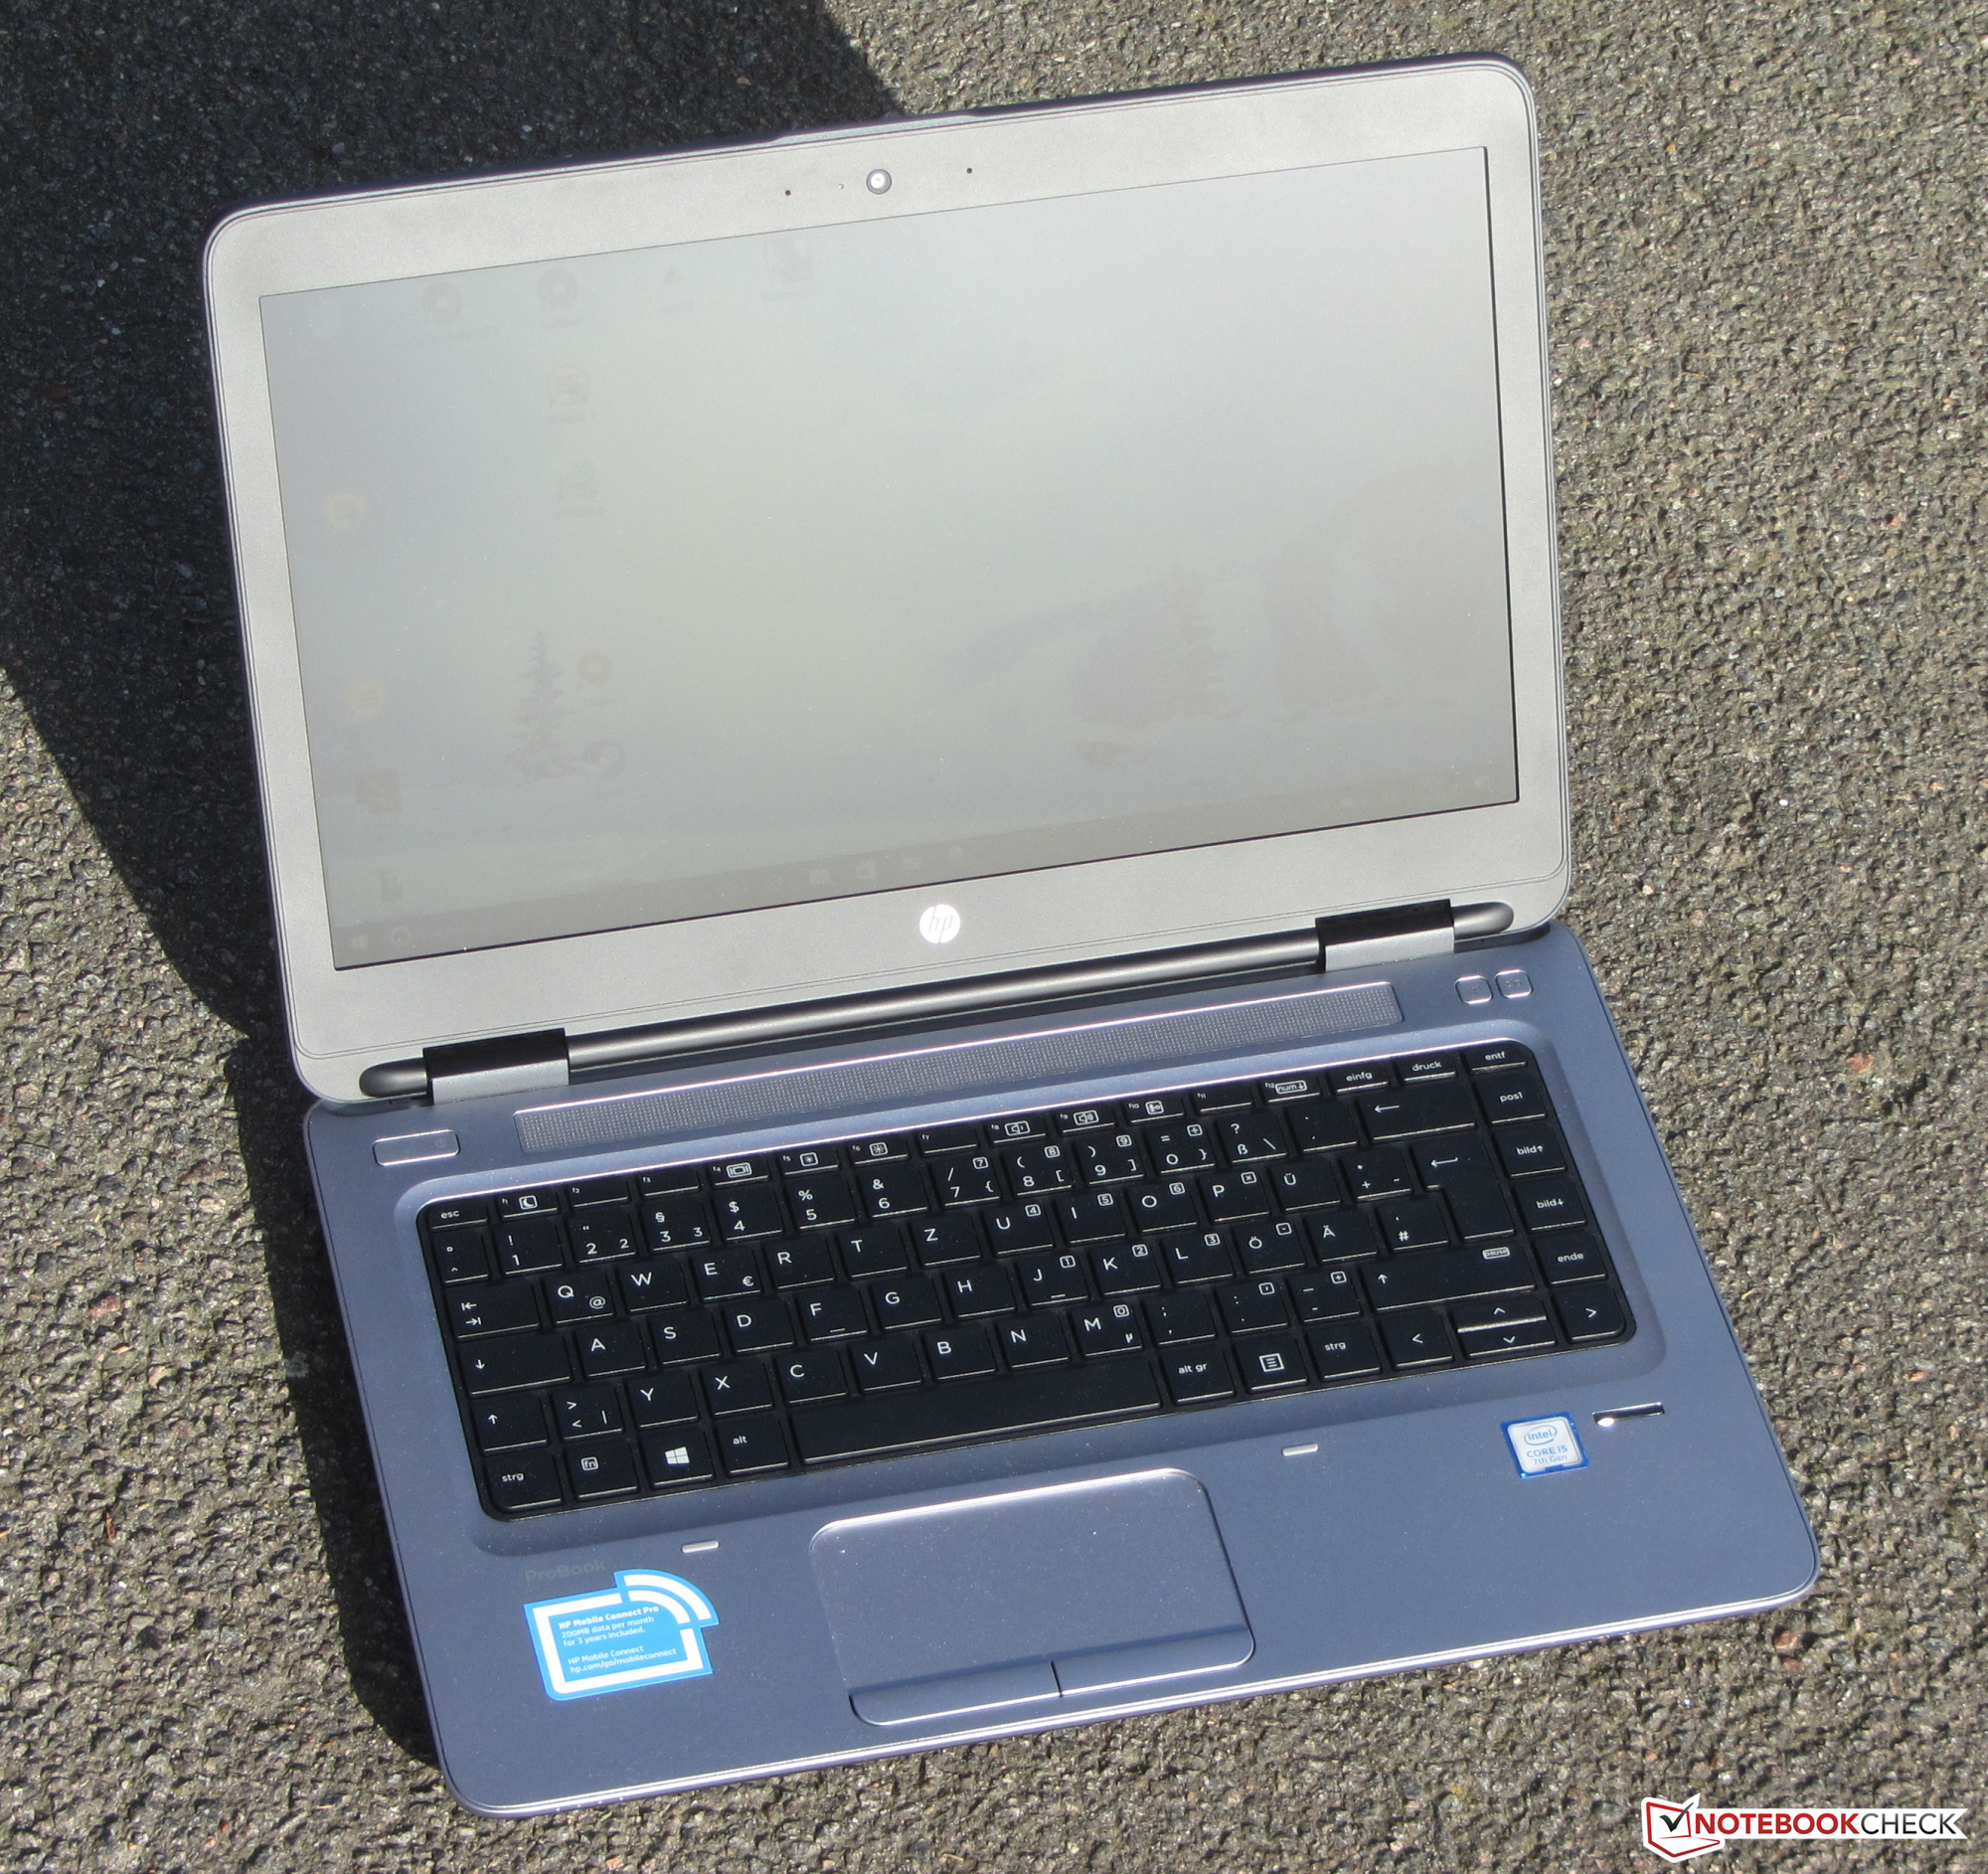
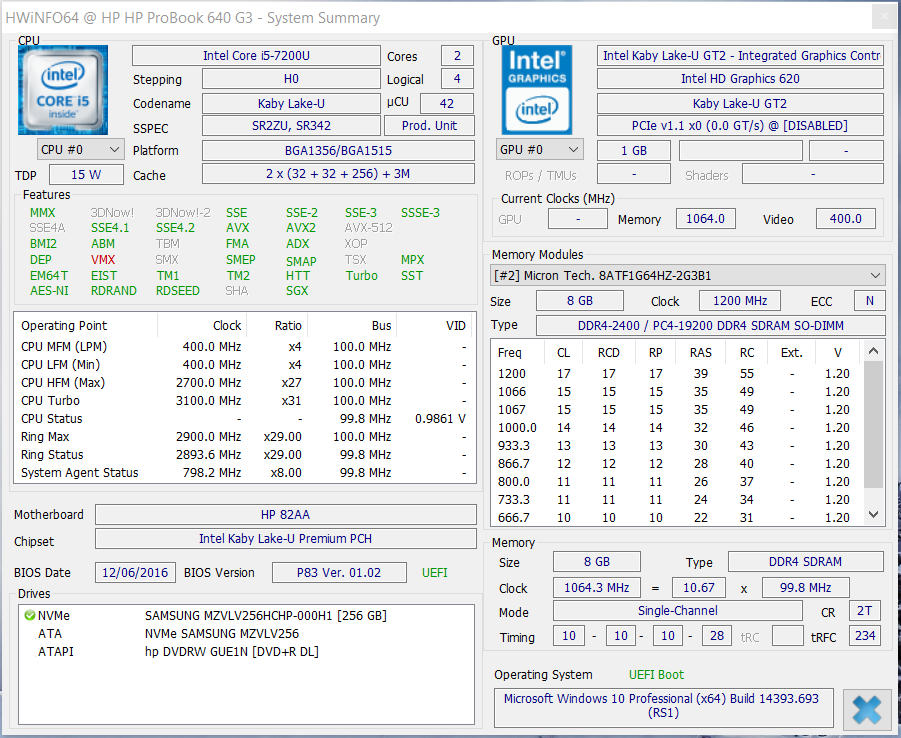
Grazie al processore Kaby Lake, il ProBook offre elevate perfomance delle applicazioni. Tuttavia, il vantaggio rispetto al suo predecessore Skylake è sottile. Il laptop funziona senza far rumore o per lo meno in silenzio su tutta la gamma di carico ed ha ridotto lo sviluppo di calore - qualità molto positiva per un dispositivo lavoro. Il NVMe SSD incorporato garantisce un sistema rapido di esecuzione e tempi di caricamento brevi. La sostituzione della SSD sarebbe possibile togliendo il guscio inferiore del notebook, facilmente compiuta.
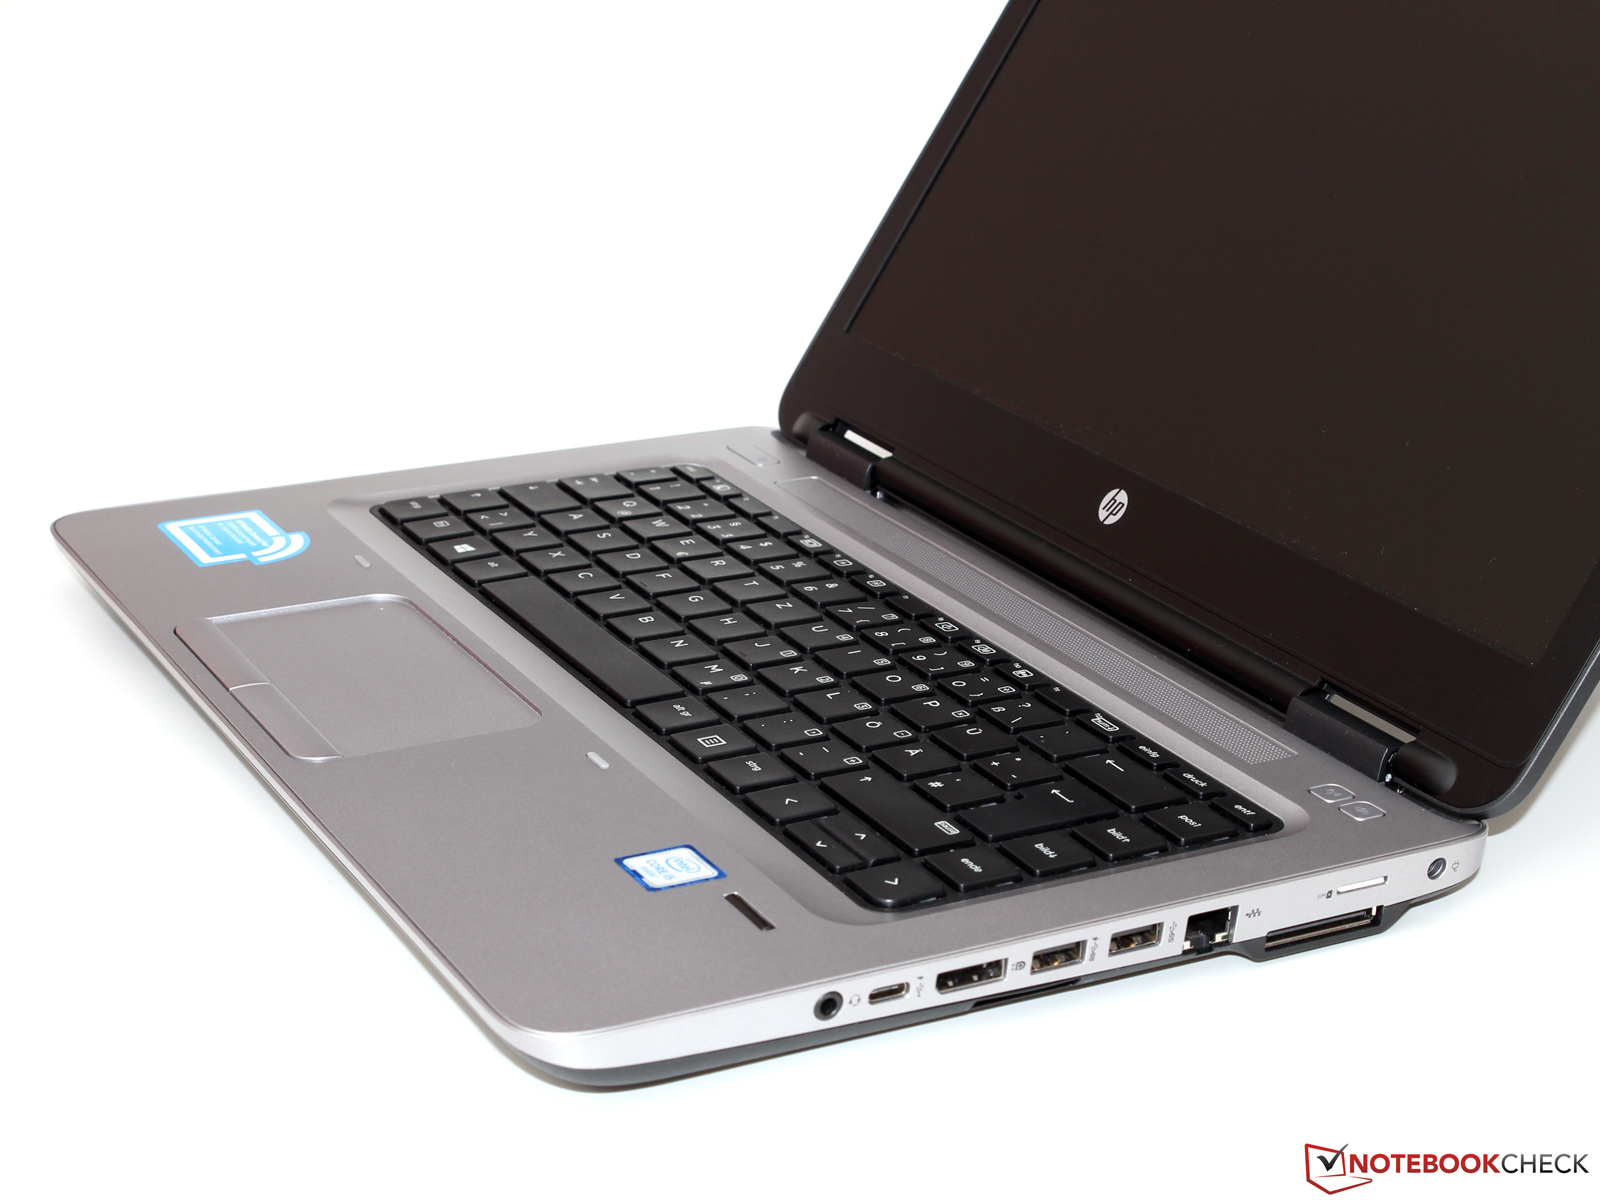
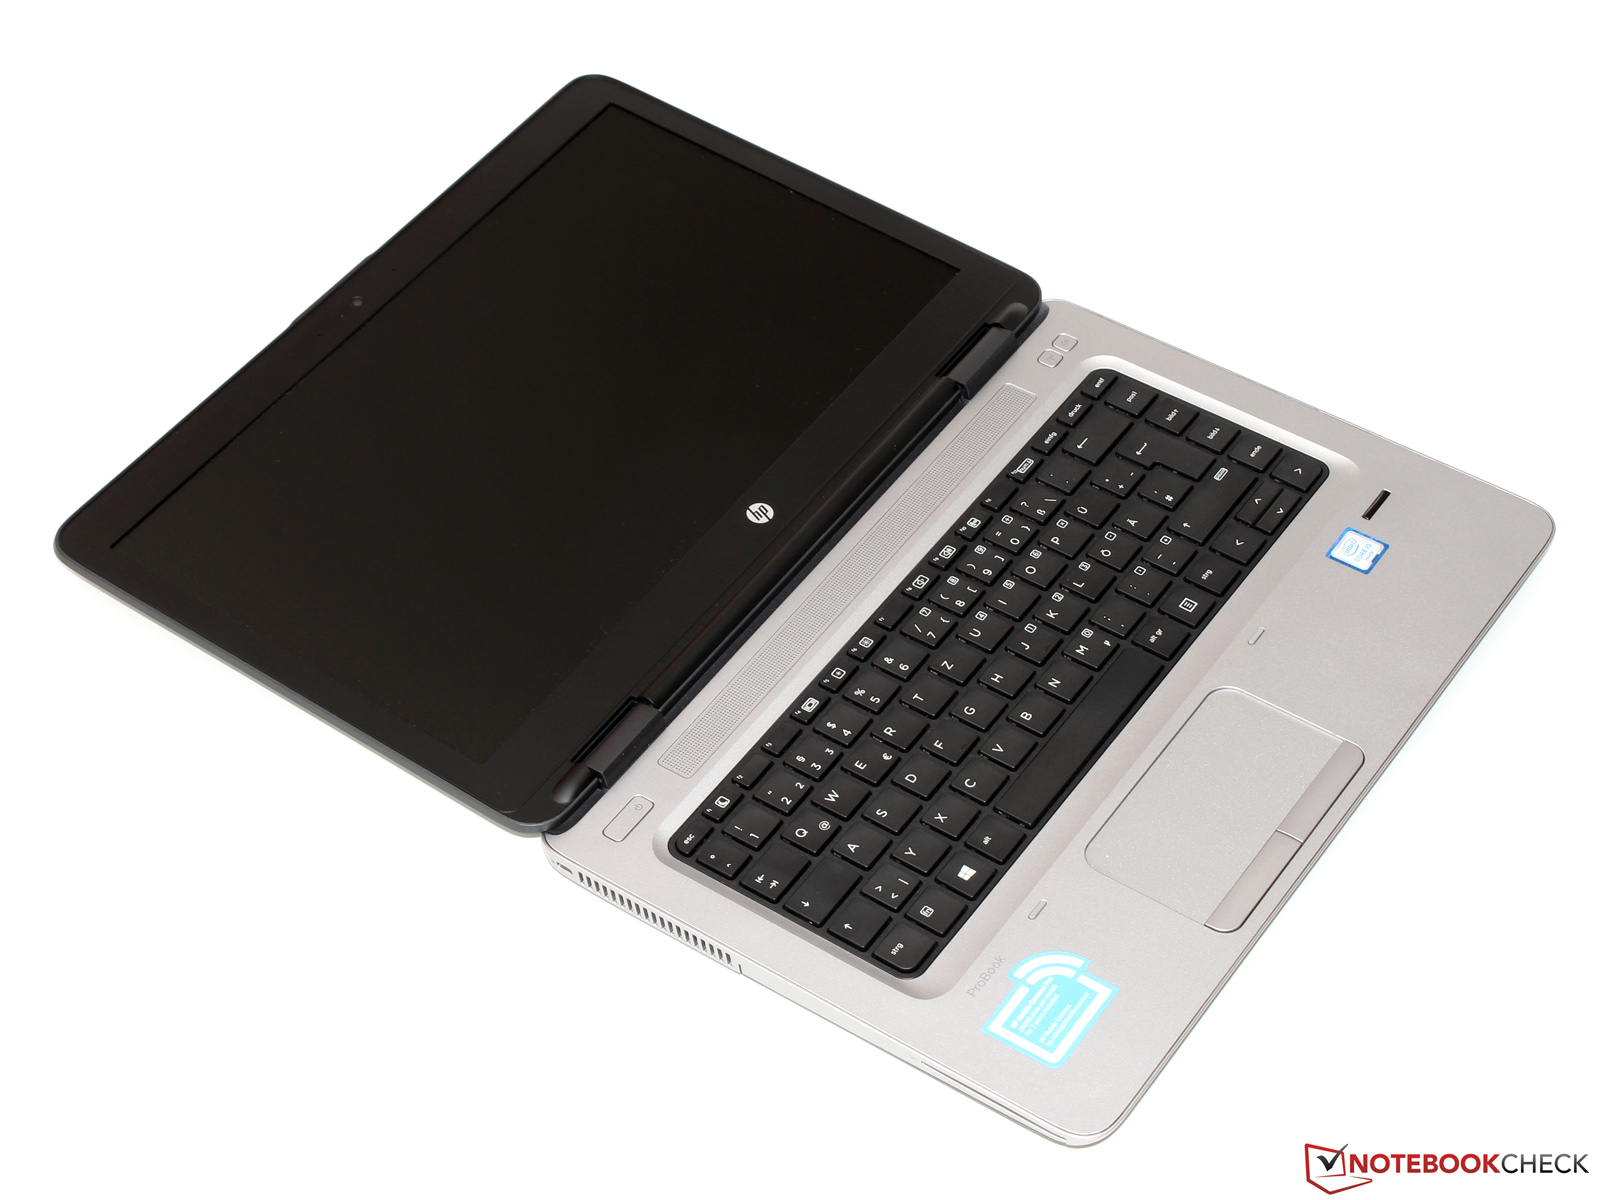
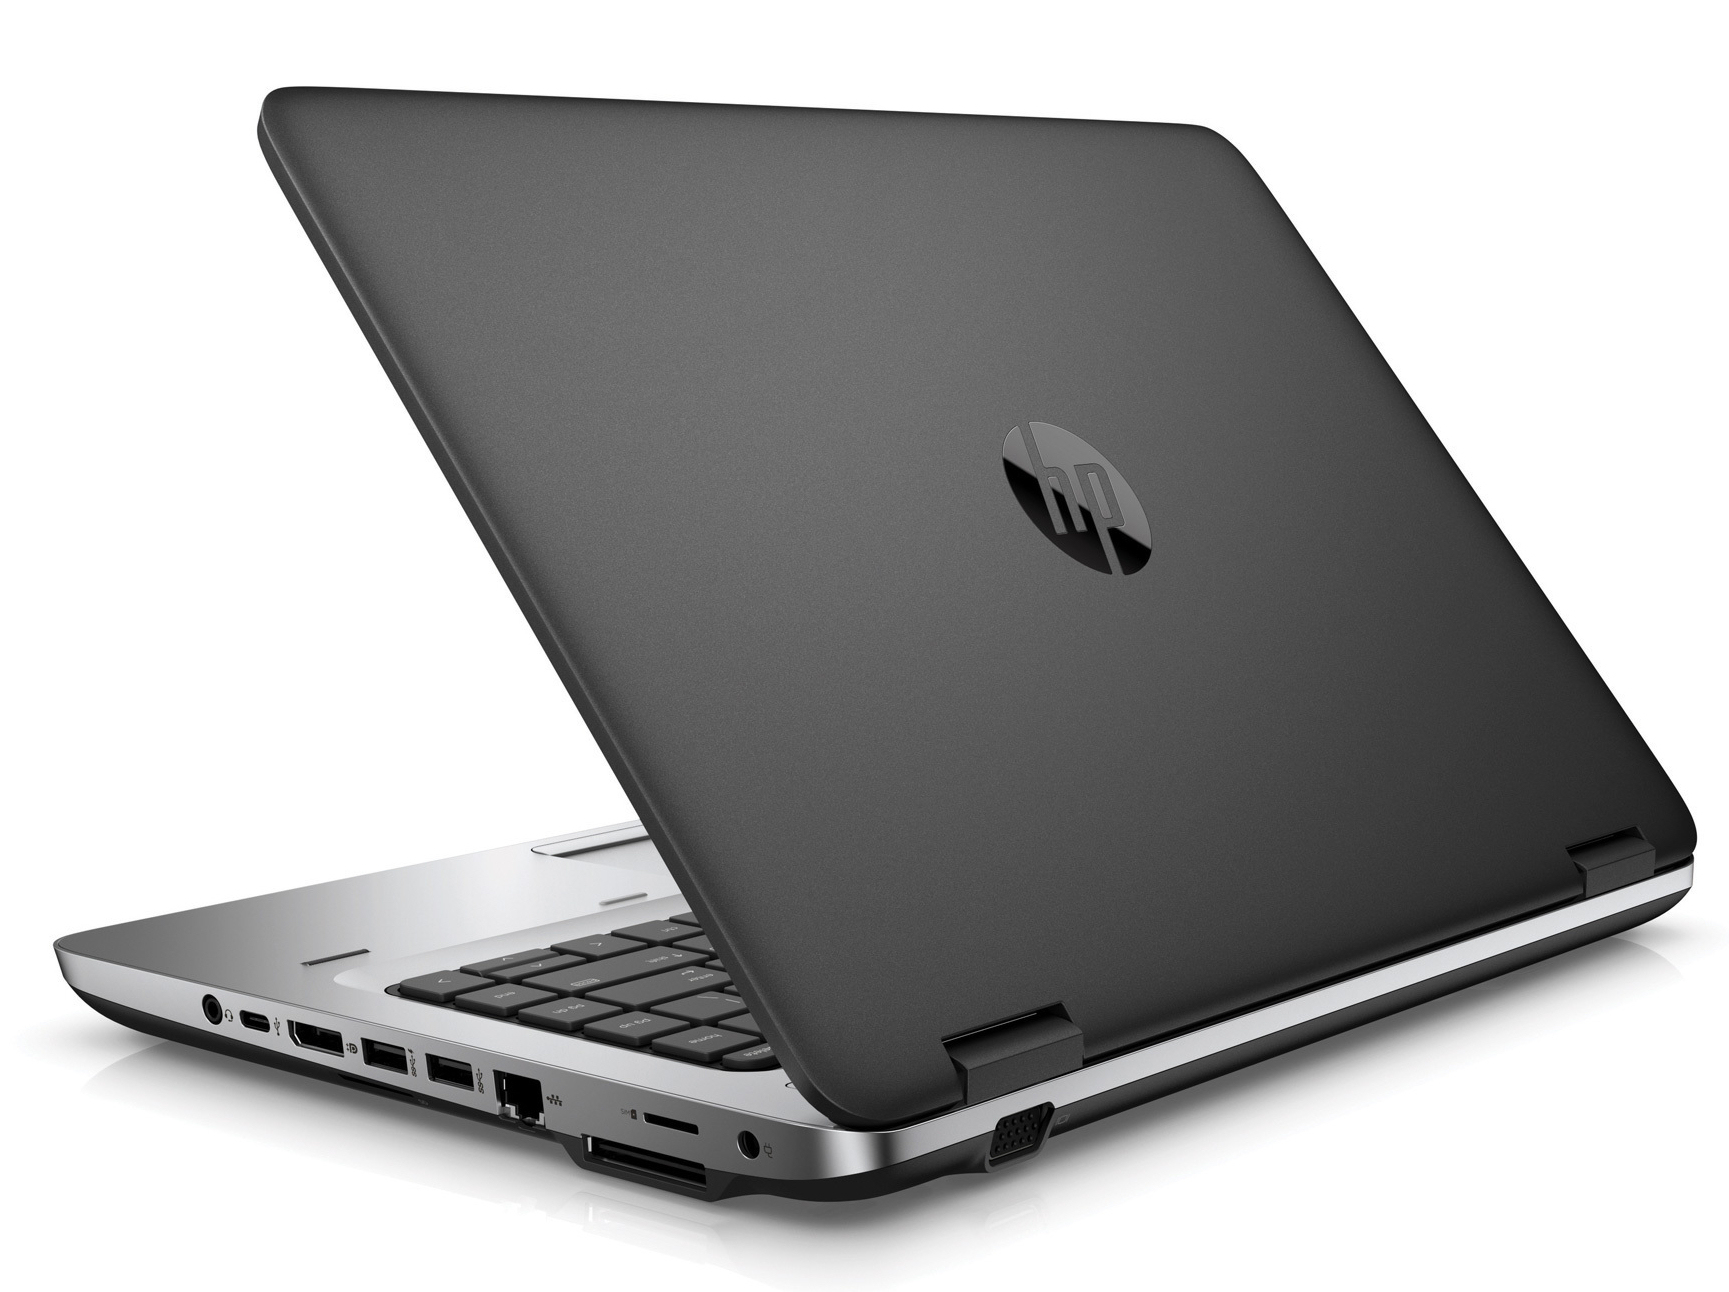
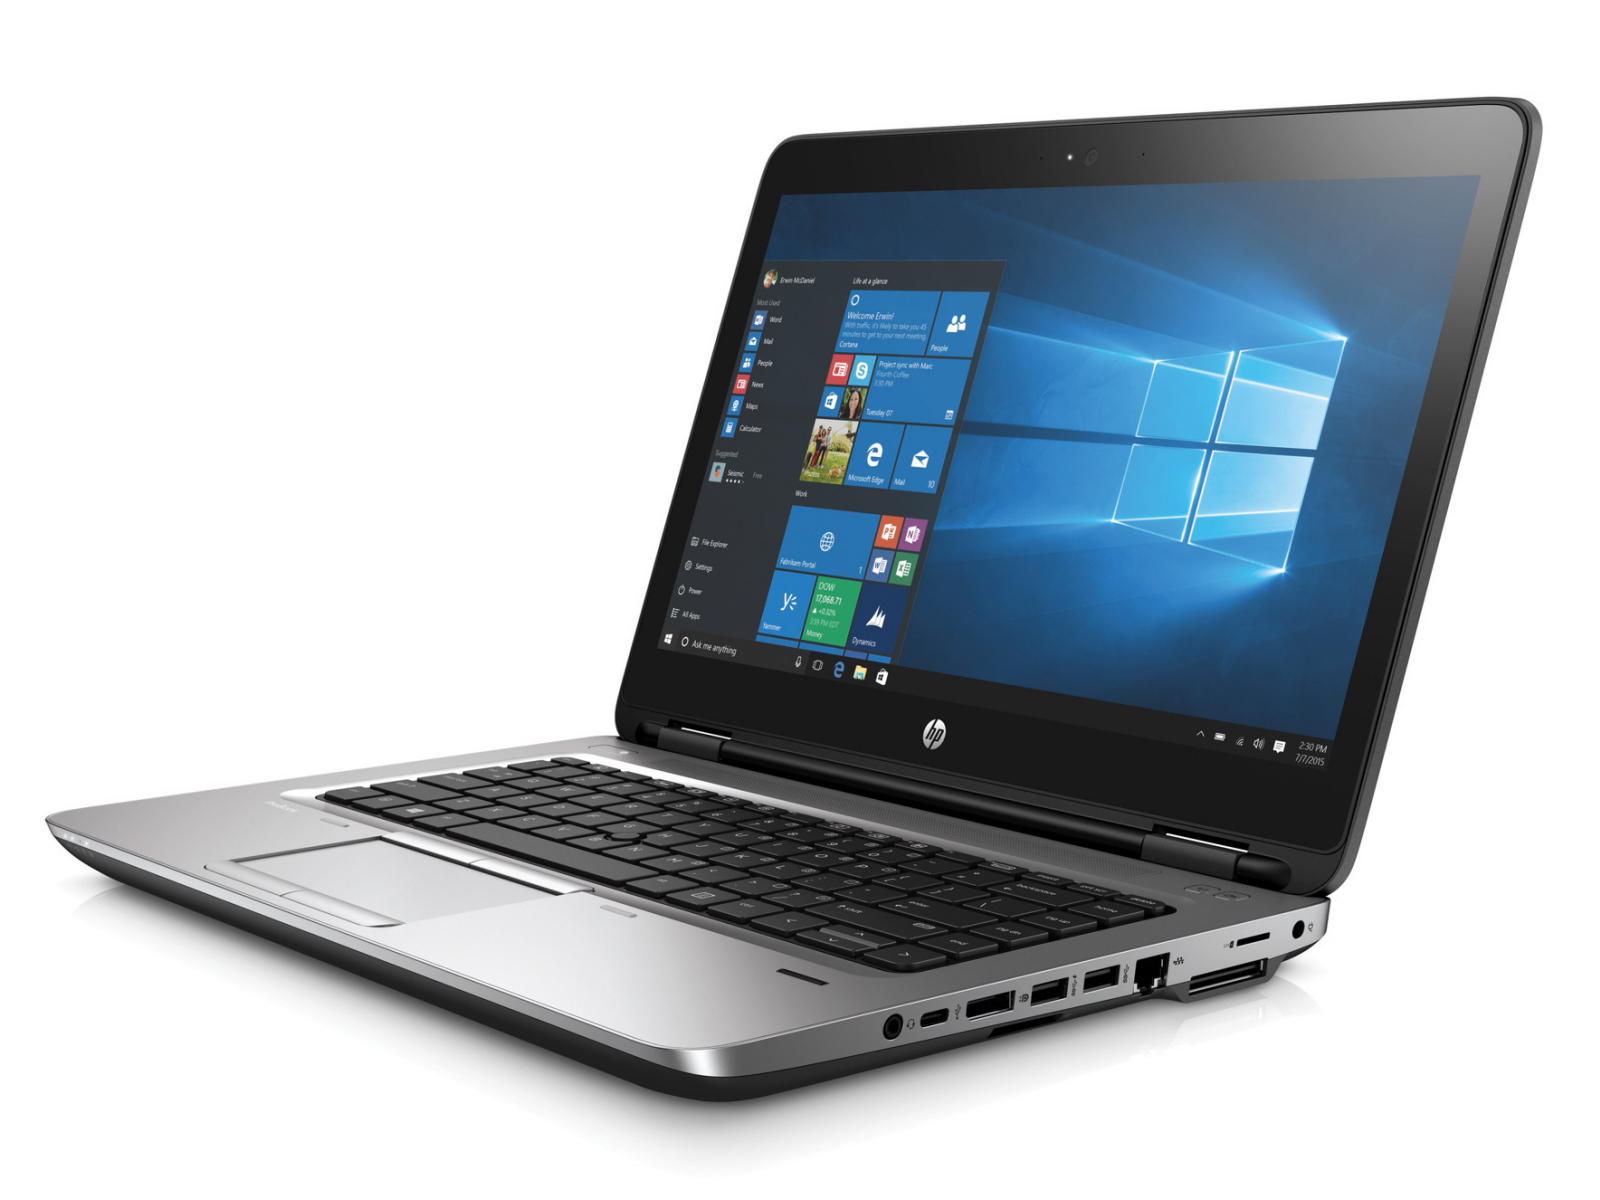
Il case e i dispositivi di input non mostrano alcuna modifica; HP li toglie dal predecessore. Nulla contro ciò, dal momento che entrambi i componenti hanno lasciato una buona impressione. La durata della batteria è molto buona, come è avvenuto con il predecessore, e quindi dovrebbe essere sufficiente per una giornata di lavoro. Un LTE / HSPA + modem consente di accedere a Internet o una rete aziendale tramite telefonia mobile.
HP fa bene molte cose con questo notebook, eppure riesce ancora a raccogliere critiche.
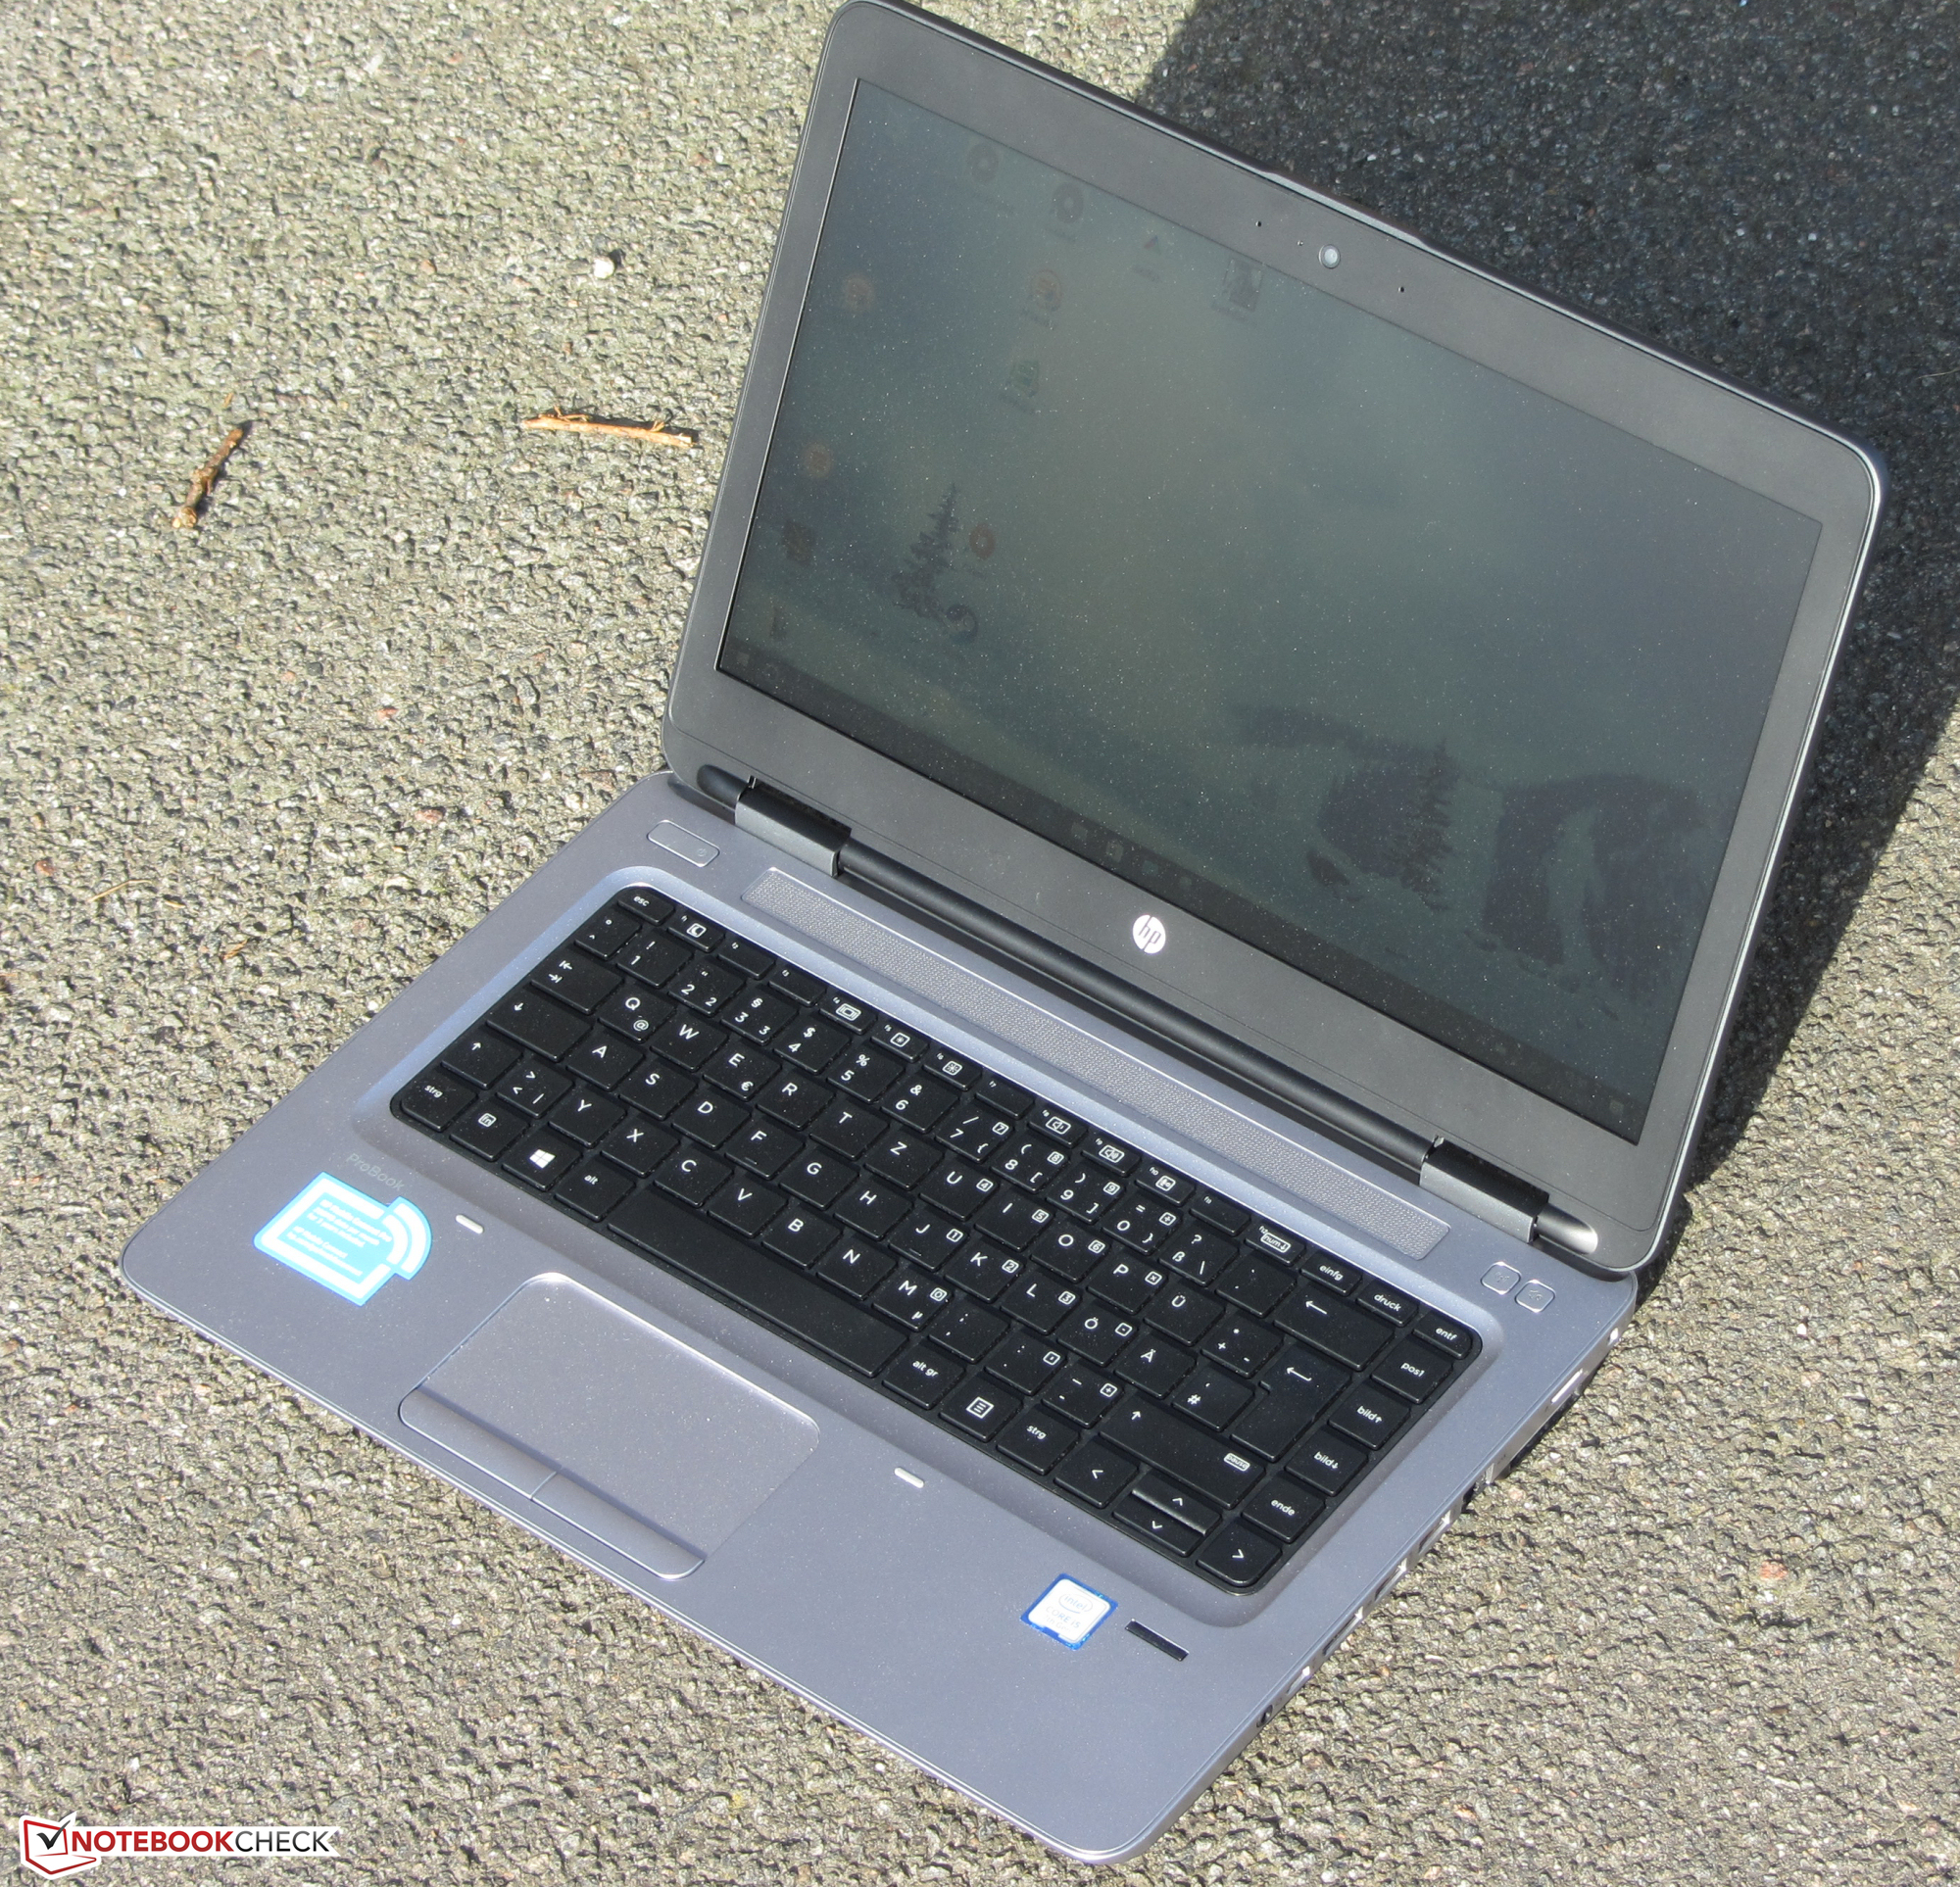
La nostra critica si riferisce ancora una volta al display: Ha angoli di visione stretti e basso contrasto. Questo non è accettabile. La fascia di prezzo al di sopra di 1.000 euro richiede l'integrazione di un display eccellente. Un altro punto di critica è la tastiera che ci aspettiamo essere retroilluminata in questa fascia di prezzo. E, ultimo ma non meno importante: HP include una garanzia di un solo anno.
Nota: si tratta di una recensione breve, con alcune sezioni non tradotte, per la versione integrale in inglese guardate qui.
Pro
Contro
Thanks to the Kaby Lake processor, the ProBook offers high application performance. However, the advantage over its Skylake predecessor is slim. The laptop runs noiselessly or at least quietly over the entire load range and has low heat development - very positive qualities for a work device. The built-in NVMe SSD ensures a swiftly running system and short loading times. Replacing the SSD would be possible by removing the bottom shell of the notebook, which is quickly accomplished.
The case and input devices show no modifications; HP brings them over from the predecessor. Nothing speaks against this, since both components left a good impression. The battery life is very good, as was the case with the predecessor, so it should suffice for a workday. An LTE/HSPA+ modem enables you to access the internet or a company network via mobile communications.
HP does many things right with this notebook, yet still manages to collect criticism.
Our criticism relates once again to the display: It has narrow viewing angles and low contrast. This is not acceptable. The price range above 1,000 Euros demands the integration of an excellent display. Another point of critique is the keyboard that we expect to be backlit in this price range. And last but not least: HP only includes a one-year warranty.
HP ProBook 640 G3 Z2W33ET
- 02/27/2017 v6 (old)
Sascha Mölck