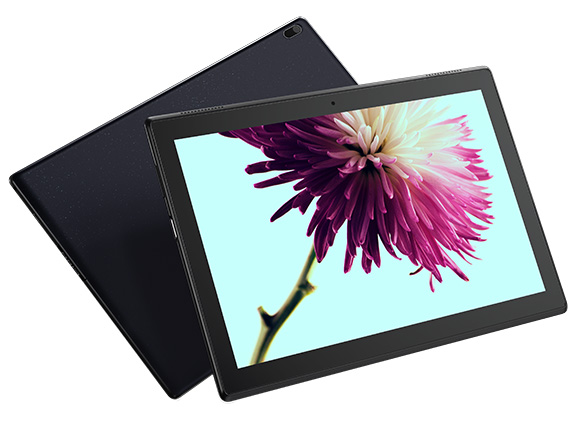
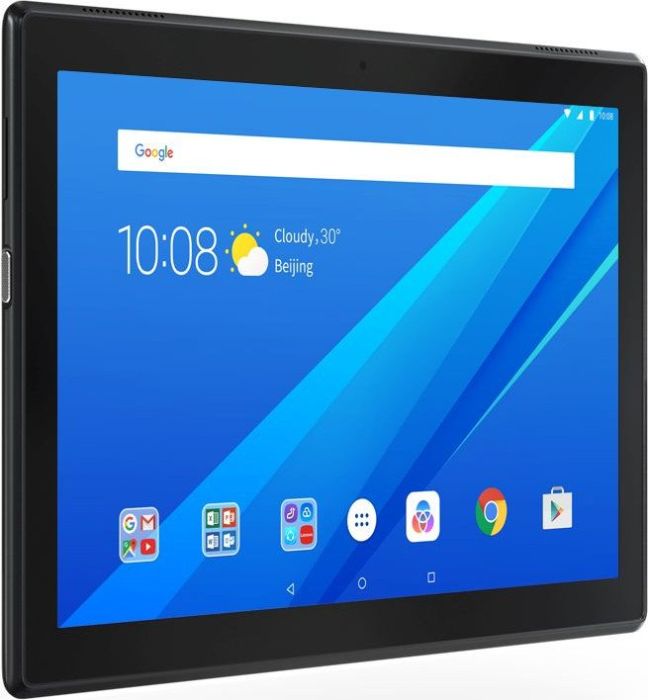
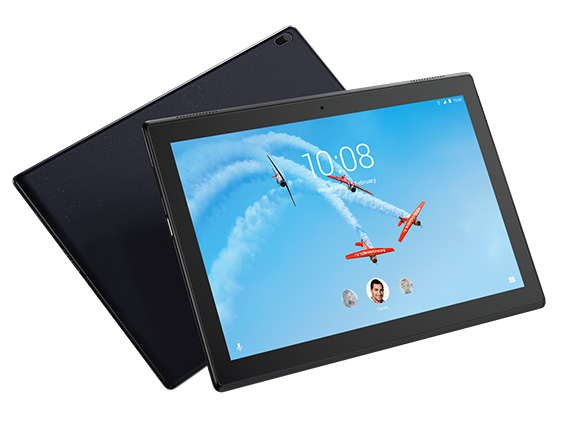
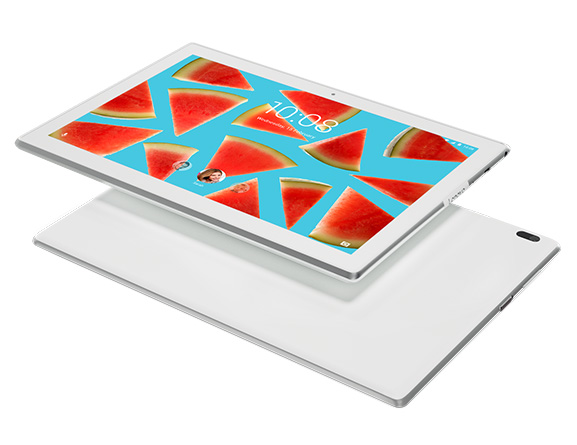
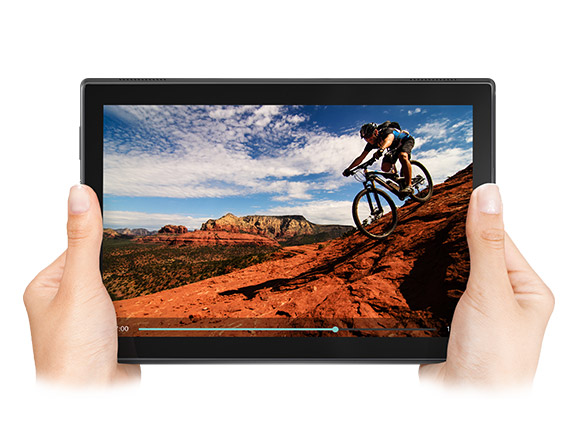
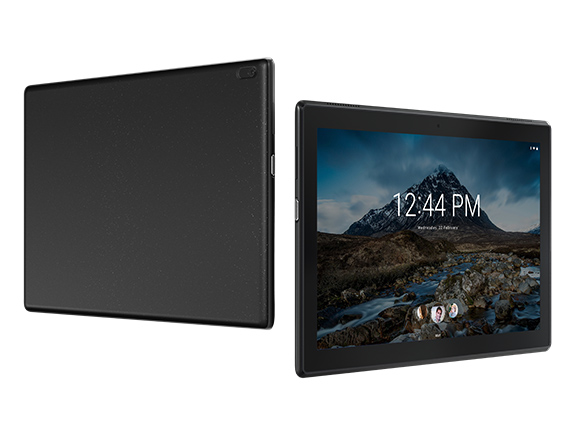
Recensione breve del Tablet Lenovo Tab 4 10
| Networking | |
| iperf3 transmit AX12 | |
| Samsung Galaxy Tab S3 SM-T825 | |
| Huawei MediaPad T3 10 | |
| Asus ZenPad 10 (Z301ML) | |
| Lenovo Tab 4 10 | |
| iperf3 receive AX12 | |
| Samsung Galaxy Tab S3 SM-T825 | |
| Huawei MediaPad T3 10 | |
| Asus ZenPad 10 (Z301ML) | |
| Lenovo Tab 4 10 | |


| |||||||||||||||||||||||||
Distribuzione della luminosità: 86 %
Al centro con la batteria: 316 cd/m²
Contrasto: 1580:1 (Nero: 0.2 cd/m²)
ΔE ColorChecker Calman: 5 | ∀{0.5-29.43 Ø4.73}
ΔE Greyscale Calman: 5.7 | ∀{0.09-98 Ø4.97}
84% sRGB (Calman 2D)
Gamma: 2.25
CCT: 7921 K
| Lenovo Tab 4 10 IPS, 1280x800, 10.1" | Huawei MediaPad T3 10 IPS, 1280x800, 9.6" | Asus ZenPad 10 (Z301ML) IPS, 1280x800, 10.1" | Samsung Galaxy Tab S3 SM-T825 Super AMOLED, 2048x1526, 9.7" | Samsung Galaxy Tab A 10.1 2016 SM-T585 TFT, 1920x1200, 10.1" | |
|---|---|---|---|---|---|
| Screen | 1% | 7% | 48% | -11% | |
| Brightness middle (cd/m²) | 316 | 410 30% | 392 24% | 452 43% | 542 72% |
| Brightness (cd/m²) | 305 | 409 34% | 383 26% | 468 53% | 520 70% |
| Brightness Distribution (%) | 86 | 92 7% | 81 -6% | 82 -5% | 91 6% |
| Black Level * (cd/m²) | 0.2 | 0.32 -60% | 0.25 -25% | 0.68 -240% | |
| Contrast (:1) | 1580 | 1281 -19% | 1568 -1% | 797 -50% | |
| Colorchecker dE 2000 * | 5 | 4.5 10% | 4.2 16% | 1.8 64% | 4.2 16% |
| Colorchecker dE 2000 max. * | 8.7 | 14.2 -63% | 11.2 -29% | 4 54% | 6.7 23% |
| Greyscale dE 2000 * | 5.7 | 2 65% | 2.9 49% | 1.2 79% | 4.8 16% |
| Gamma | 2.25 98% | 2.17 101% | 2.23 99% | 2.11 104% | 2.42 91% |
| CCT | 7921 82% | 6930 94% | 7115 91% | 6500 100% | 7434 87% |
| Color Space (Percent of AdobeRGB 1998) (%) | 82.32 | ||||
| Color Space (Percent of sRGB) (%) | 99.06 |
* ... Meglio usare valori piccoli
Sfarfallio dello schermo / PWM (Pulse-Width Modulation)
| flickering dello schermo / PWM non rilevato | 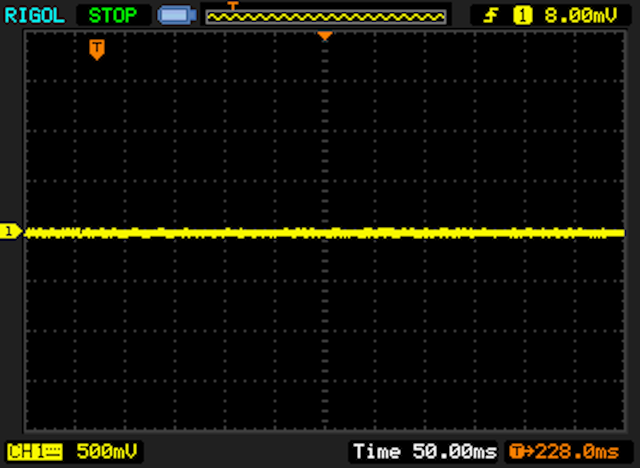 | ||
In confronto: 52 % di tutti i dispositivi testati non utilizza PWM per ridurre la luminosita' del display. Se è rilevato PWM, una media di 7794 (minimo: 5 - massimo: 343500) Hz è stata rilevata. | |||
Tempi di risposta del Display
| ↔ Tempi di risposta dal Nero al Bianco | ||
|---|---|---|
| 36 ms ... aumenta ↗ e diminuisce ↘ combinato | ↗ 19 ms Incremento | 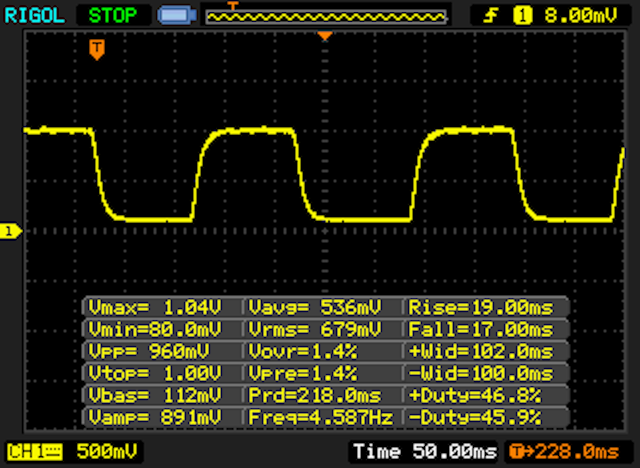 |
| ↘ 17 ms Calo | ||
| Lo schermo mostra tempi di risposta lenti nei nostri tests e sarà insoddisfacente per i gamers. In confronto, tutti i dispositivi di test variano da 0.1 (minimo) a 240 (massimo) ms. » 94 % di tutti i dispositivi è migliore. Questo significa che i tempi di risposta rilevati sono peggiori rispetto alla media di tutti i dispositivi testati (19.9 ms). | ||
| ↔ Tempo di risposta dal 50% Grigio all'80% Grigio | ||
| 42 ms ... aumenta ↗ e diminuisce ↘ combinato | ↗ 21 ms Incremento |  |
| ↘ 21 ms Calo | ||
| Lo schermo mostra tempi di risposta lenti nei nostri tests e sarà insoddisfacente per i gamers. In confronto, tutti i dispositivi di test variano da 0.165 (minimo) a 636 (massimo) ms. » 67 % di tutti i dispositivi è migliore. Questo significa che i tempi di risposta rilevati sono peggiori rispetto alla media di tutti i dispositivi testati (31.1 ms). | ||
| AnTuTu v6 - Total Score | |
| Samsung Galaxy Tab S3 SM-T825 | |
| Samsung Galaxy Tab A 10.1 2016 SM-T585 | |
| Huawei MediaPad T3 10 | |
| Lenovo Tab 4 10 | |
| Asus ZenPad 10 (Z301ML) | |
| PCMark for Android | |
| Work performance score | |
| Samsung Galaxy Tab S3 SM-T825 | |
| Huawei MediaPad T3 10 | |
| Samsung Galaxy Tab A 10.1 2016 SM-T585 | |
| Lenovo Tab 4 10 | |
| Asus ZenPad 10 (Z301ML) | |
| Work 2.0 performance score | |
| Samsung Galaxy Tab S3 SM-T825 | |
| Huawei MediaPad T3 10 | |
| Lenovo Tab 4 10 | |
| Asus ZenPad 10 (Z301ML) | |
| Geekbench 4.4 | |
| 64 Bit Single-Core Score | |
| Samsung Galaxy Tab S3 SM-T825 | |
| Lenovo Tab 4 10 | |
| Huawei MediaPad T3 10 | |
| Asus ZenPad 10 (Z301ML) | |
| 64 Bit Multi-Core Score | |
| Samsung Galaxy Tab S3 SM-T825 | |
| Lenovo Tab 4 10 | |
| Huawei MediaPad T3 10 | |
| Asus ZenPad 10 (Z301ML) | |
| Compute RenderScript Score | |
| Samsung Galaxy Tab S3 SM-T825 | |
| Lenovo Tab 4 10 | |
| Asus ZenPad 10 (Z301ML) | |
| GFXBench (DX / GLBenchmark) 2.7 | |
| T-Rex Onscreen | |
| Samsung Galaxy Tab S3 SM-T825 | |
| Asus ZenPad 10 (Z301ML) | |
| Huawei MediaPad T3 10 | |
| Lenovo Tab 4 10 | |
| Samsung Galaxy Tab A 10.1 2016 SM-T585 | |
| 1920x1080 T-Rex Offscreen | |
| Samsung Galaxy Tab S3 SM-T825 | |
| Samsung Galaxy Tab A 10.1 2016 SM-T585 | |
| Asus ZenPad 10 (Z301ML) | |
| Lenovo Tab 4 10 | |
| Huawei MediaPad T3 10 | |
| GFXBench 3.0 | |
| on screen Manhattan Onscreen OGL | |
| Samsung Galaxy Tab S3 SM-T825 | |
| Asus ZenPad 10 (Z301ML) | |
| Huawei MediaPad T3 10 | |
| Lenovo Tab 4 10 | |
| Samsung Galaxy Tab A 10.1 2016 SM-T585 | |
| 1920x1080 1080p Manhattan Offscreen | |
| Samsung Galaxy Tab S3 SM-T825 | |
| Samsung Galaxy Tab A 10.1 2016 SM-T585 | |
| Asus ZenPad 10 (Z301ML) | |
| Lenovo Tab 4 10 | |
| Huawei MediaPad T3 10 | |
| Octane V2 - Total Score | |
| Samsung Galaxy Tab S3 SM-T825 (Samsung Browser 5.2) | |
| Samsung Galaxy Tab A 10.1 2016 SM-T585 (Chrome 52.0.2743.98) | |
| Lenovo Tab 4 10 (Chrome 60) | |
| Huawei MediaPad T3 10 (Chrome 58) | |
| Asus ZenPad 10 (Z301ML) (Chrome 59) | |
| WebXPRT 2015 - Overall | |
| Samsung Galaxy Tab S3 SM-T825 (Samsung Browser 5.2) | |
| Samsung Galaxy Tab A 10.1 2016 SM-T585 (Chrome 52.0.2743.98) | |
| Huawei MediaPad T3 10 (Chrome 58) | |
| Lenovo Tab 4 10 (Chrome 60) | |
| Asus ZenPad 10 (Z301ML) (Chrome 59) | |
| Mozilla Kraken 1.1 - Total | |
| Asus ZenPad 10 (Z301ML) (Chrome 59) | |
| Huawei MediaPad T3 10 (Chrome 58) | |
| Lenovo Tab 4 10 (Chrome 60) | |
| Samsung Galaxy Tab A 10.1 2016 SM-T585 (Chrome 52.0.2743.98) | |
| Samsung Galaxy Tab S3 SM-T825 (Samsung Browser 5.2) | |
* ... Meglio usare valori piccoli
| Lenovo Tab 4 10 | Huawei MediaPad T3 10 | Asus ZenPad 10 (Z301ML) | Samsung Galaxy Tab S3 SM-T825 | Samsung Galaxy Tab A 10.1 2016 SM-T585 | |
|---|---|---|---|---|---|
| AndroBench 3-5 | -7% | -15% | 29% | -11% | |
| Sequential Read 256KB (MB/s) | 275 | 154.7 -44% | 216 -21% | 288.6 5% | 215.8 -22% |
| Sequential Write 256KB (MB/s) | 45.3 | 41.1 -9% | 66 46% | 87.6 93% | 45.88 1% |
| Random Read 4KB (MB/s) | 32.3 | 50 55% | 23 -29% | 45.82 42% | 23.46 -27% |
| Random Write 4KB (MB/s) | 8.9 | 5.3 -40% | 9.8 10% | 13.13 48% | 10.01 12% |
| Sequential Read 256KB SDCard (MB/s) | 84.5 | 83 ? -2% | 40.9 -52% | 76.4 ? -10% | 75.5 ? -11% |
| Sequential Write 256KB SDCard (MB/s) | 59.9 | 58.7 ? -2% | 34.9 -42% | 58.6 ? -2% | 50.1 ? -16% |
(+) La temperatura massima sul lato superiore è di 34.5 °C / 94 F, rispetto alla media di 33.6 °C / 92 F, che varia da 20.7 a 53.2 °C per questa classe Tablet.
(+) Il lato inferiore si riscalda fino ad un massimo di 37.2 °C / 99 F, rispetto alla media di 33.2 °C / 92 F
(+) In idle, la temperatura media del lato superiore è di 29.3 °C / 85 F, rispetto alla media deld ispositivo di 30 °C / 86 F.
Lenovo Tab 4 10 analisi audio
(+) | gli altoparlanti sono relativamente potenti (83.6 dB)
Bassi 100 - 315 Hz
(-) | quasi nessun basso - in media 21.7% inferiori alla media
(±) | la linearità dei bassi è media (8.8% delta rispetto alla precedente frequenza)
Medi 400 - 2000 Hz
(±) | medi elevati - circa 6.3% superiore alla media
(+) | medi lineari (6.4% delta rispetto alla precedente frequenza)
Alti 2 - 16 kHz
(±) | alti elevati - circa 5.8% superiori alla media
(+) | alti lineari (3.4% delta rispetto alla precedente frequenza)
Nel complesso 100 - 16.000 Hz
(±) | la linearità complessiva del suono è media (23.2% di differenza rispetto alla media
Rispetto alla stessa classe
» 72% di tutti i dispositivi testati in questa classe è stato migliore, 4% simile, 24% peggiore
» Il migliore ha avuto un delta di 7%, medio di 20%, peggiore di 129%
Rispetto a tutti i dispositivi testati
» 69% di tutti i dispositivi testati in questa classe è stato migliore, 5% similare, 25% peggiore
» Il migliore ha avuto un delta di 4%, medio di 24%, peggiore di 134%
Huawei MediaPad T3 10 analisi audio
(+) | gli altoparlanti sono relativamente potenti (87.2 dB)
Bassi 100 - 315 Hz
(-) | quasi nessun basso - in media 32.3% inferiori alla media
(±) | la linearità dei bassi è media (9.4% delta rispetto alla precedente frequenza)
Medi 400 - 2000 Hz
(±) | medi ridotti - circa 5.6% inferiori alla media
(±) | linearità dei medi adeguata (7.6% delta rispetto alla precedente frequenza)
Alti 2 - 16 kHz
(±) | alti elevati - circa 7.8% superiori alla media
(+) | alti lineari (4.9% delta rispetto alla precedente frequenza)
Nel complesso 100 - 16.000 Hz
(±) | la linearità complessiva del suono è media (26.7% di differenza rispetto alla media
Rispetto alla stessa classe
» 84% di tutti i dispositivi testati in questa classe è stato migliore, 4% simile, 13% peggiore
» Il migliore ha avuto un delta di 7%, medio di 20%, peggiore di 129%
Rispetto a tutti i dispositivi testati
» 82% di tutti i dispositivi testati in questa classe è stato migliore, 4% similare, 14% peggiore
» Il migliore ha avuto un delta di 4%, medio di 24%, peggiore di 134%
| Off / Standby | |
| Idle | |
| Sotto carico |
|
Leggenda:
min: | |
| Lenovo Tab 4 10 7000 mAh | Asus ZenPad 10 (Z301ML) 4680 mAh | Samsung Galaxy Tab S3 SM-T825 6000 mAh | Samsung Galaxy Tab A 10.1 2016 SM-T585 7300 mAh | |
|---|---|---|---|---|
| Power Consumption | 16% | -25% | -14% | |
| Idle Minimum * (Watt) | 1.09 | 0.76 30% | 2.08 -91% | 1.18 -8% |
| Idle Average * (Watt) | 3.71 | 3.23 13% | 3.5 6% | 4.65 -25% |
| Idle Maximum * (Watt) | 3.84 | 3.35 13% | 3.58 7% | 4.74 -23% |
| Load Average * (Watt) | 5.07 | 4.79 6% | 6.97 -37% | 5.75 -13% |
| Load Maximum * (Watt) | 6.88 | 5.72 17% | 7.4 -8% | 6.97 -1% |
* ... Meglio usare valori piccoli
| Lenovo Tab 4 10 7000 mAh | Huawei MediaPad T3 10 4800 mAh | Asus ZenPad 10 (Z301ML) 4680 mAh | Samsung Galaxy Tab S3 SM-T825 6000 mAh | Samsung Galaxy Tab A 10.1 2016 SM-T585 7300 mAh | |
|---|---|---|---|---|---|
| Autonomia della batteria | -30% | -26% | 21% | 31% | |
| WiFi v1.3 (h) | 10.5 | 7.3 -30% | 7.8 -26% | 12.7 21% | 13.8 31% |
| Reader / Idle (h) | 18.9 | 22 | 31.7 | 43.9 | |
| H.264 (h) | 8.8 | 10.4 | 9.2 | 14.9 | |
| Load (h) | 3.8 | 5 | 6.3 | 7.1 |
Pro
Contro
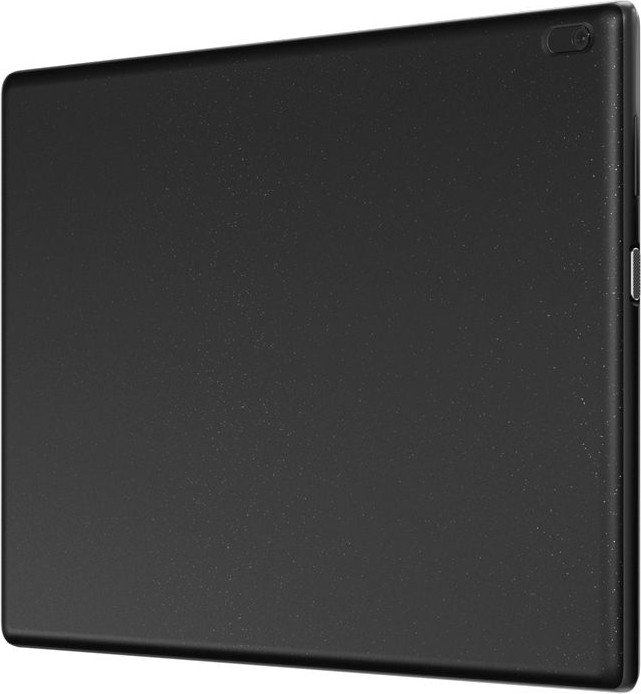
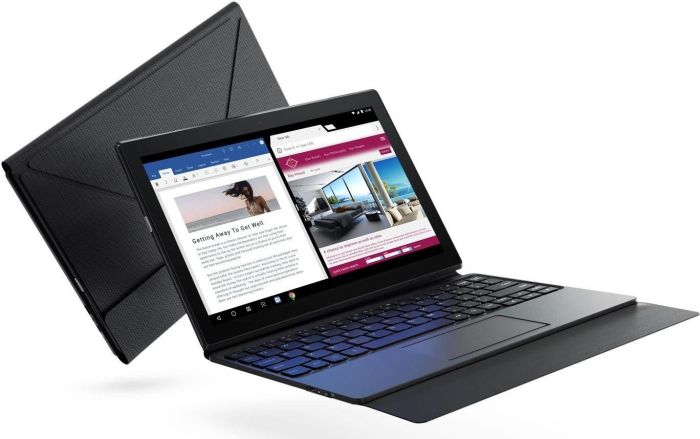
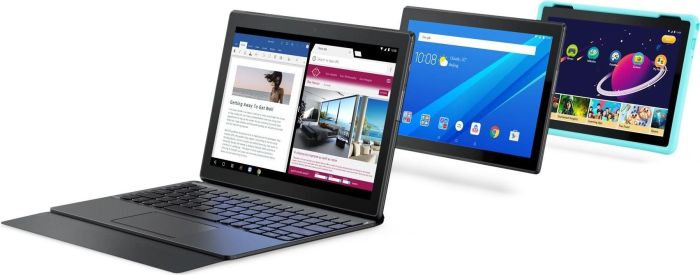
Con il Tab 4 10, Lenovo realizza un tablet economico per restare in gara con gli altri concorrenti dal prezzo simile. L'ampia autonomia, dovuta alla grande batteria è eccellente. Ma la vera highlight, è che Lenovo realizza un pacchetto di accessori per i bambini, per la produttività, o per lo smart assistant Alexa, che estende le funzioni del tablet. Anche se potrete comprare un altro case protettivo, una tastiera Bluetooth, o una cassa da un altro venditore, è piacevole che Lenovo si sia impegnata su questo dispositivo economico per renderlo più usabile dai clienti.
Il produttore potrebbe migliorare la stabilità del case del Lenovo Tab 4 10, la WLAN potrebbe essere più veloce, il display più luminoso, e le fotocamere sono quelle che vi aspettate: abbastanza mediocri. D'altro canto, il GPS è preciso, e le casse producono un suono abbastanza bilanciato.
Il Lenovo Tab 4 10 si distingue dalla massa per la grande batteria e i numerosi accessori - un buon acquisto nel complesso.
Ci sono vari motivi per scegliere il Lenovo Tab 4 10: i molti accessori, gli accounts utente multipli, la grande batteria, e le prestazioni tipiche di questa fascia di prezzo. Il tablet si comporta bene in molte aree.
Nota: si tratta di una recensione breve, con alcune sezioni non tradotte, per la versione integrale in inglese guardate qui.
Lenovo Tab 4 10
- 11/05/2019 v7 (old)
Florian Wimmer