Recensione breve del Portatile Lenovo Yoga 720-13IKB
| Networking | |
| iperf3 transmit AX12 | |
| Asus Zenbook Flip UX360UAK-BB351T | |
| Lenovo Yoga 720-13IKB | |
| Acer Spin 5 SP513-51 | |
| iperf3 receive AX12 | |
| Lenovo Yoga 720-13IKB | |
| Asus Zenbook Flip UX360UAK-BB351T | |
| Acer Spin 5 SP513-51 | |
| |||||||||||||||||||||||||
Distribuzione della luminosità: 82 %
Al centro con la batteria: 351 cd/m²
Contrasto: 949:1 (Nero: 0.37 cd/m²)
ΔE ColorChecker Calman: 5.03 | ∀{0.5-29.43 Ø4.71}
ΔE Greyscale Calman: 3.62 | ∀{0.09-98 Ø4.96}
84% sRGB (Argyll 1.6.3 3D)
55% AdobeRGB 1998 (Argyll 1.6.3 3D)
61.2% AdobeRGB 1998 (Argyll 3D)
83.7% sRGB (Argyll 3D)
65.3% Display P3 (Argyll 3D)
Gamma: 2.18
CCT: 6323 K
| Lenovo Yoga 720-13IKB IPS, 1920x1080, 13.3" | Asus Zenbook Flip UX360UAK-BB351T IPS, 1920x1080, 13.3" | Dell Inspiron 13 7359-4839 IPS, 1920x1080, 13.3" | Lenovo Yoga 3 Pro 13 80HE004LGE IPS, 3200x1800, 13.3" | Acer Spin 5 SP513-51 IPS LED, 1920x1080, 13.3" | |
|---|---|---|---|---|---|
| Display | 5% | -33% | 4% | -33% | |
| Display P3 Coverage (%) | 65.3 | 64.1 -2% | 40.31 -38% | 64.6 -1% | 39.99 -39% |
| sRGB Coverage (%) | 83.7 | 91.8 10% | 60.5 -28% | 89.5 7% | 59.5 -29% |
| AdobeRGB 1998 Coverage (%) | 61.2 | 65.2 7% | 41.65 -32% | 65.5 7% | 41.32 -32% |
| Response Times | -9% | -16% | -11% | -40% | |
| Response Time Grey 50% / Grey 80% * (ms) | 32 ? | 36 ? -13% | 38 ? -19% | 36 ? -13% | 56 ? -75% |
| Response Time Black / White * (ms) | 26 ? | 27 ? -4% | 29 ? -12% | 28 ? -8% | 27 ? -4% |
| PWM Frequency (Hz) | 50 ? | 1330 ? | |||
| Screen | 6% | -31% | 4% | -1% | |
| Brightness middle (cd/m²) | 351 | 368 5% | 253 -28% | 314 -11% | 245 -30% |
| Brightness (cd/m²) | 310 | 350 13% | 232 -25% | 294 -5% | 233 -25% |
| Brightness Distribution (%) | 82 | 87 6% | 83 1% | 83 1% | 87 6% |
| Black Level * (cd/m²) | 0.37 | 0.29 22% | 0.28 24% | 0.57 -54% | 0.21 43% |
| Contrast (:1) | 949 | 1269 34% | 904 -5% | 551 -42% | 1167 23% |
| Colorchecker dE 2000 * | 5.03 | 5.26 -5% | 6.36 -26% | 2.18 57% | 4.2 17% |
| Colorchecker dE 2000 max. * | 12 | 8.78 27% | 12.72 -6% | 6.48 46% | 8.75 27% |
| Greyscale dE 2000 * | 3.62 | 5.87 -62% | 10.26 -183% | 2.45 32% | 3.94 -9% |
| Gamma | 2.18 101% | 2.42 91% | 2.28 96% | 2.39 92% | 2.66 83% |
| CCT | 6323 103% | 6998 93% | 6500 100% | 6745 96% | 6096 107% |
| Color Space (Percent of AdobeRGB 1998) (%) | 55 | 60 9% | 38 -31% | 58 5% | 38 -31% |
| Color Space (Percent of sRGB) (%) | 84 | 92 10% | 60 -29% | 89 6% | 59 -30% |
| Media totale (Programma / Settaggio) | 1% /
4% | -27% /
-29% | -1% /
2% | -25% /
-13% |
* ... Meglio usare valori piccoli
Tempi di risposta del Display
| ↔ Tempi di risposta dal Nero al Bianco | ||
|---|---|---|
| 26 ms ... aumenta ↗ e diminuisce ↘ combinato | ↗ 15 ms Incremento | 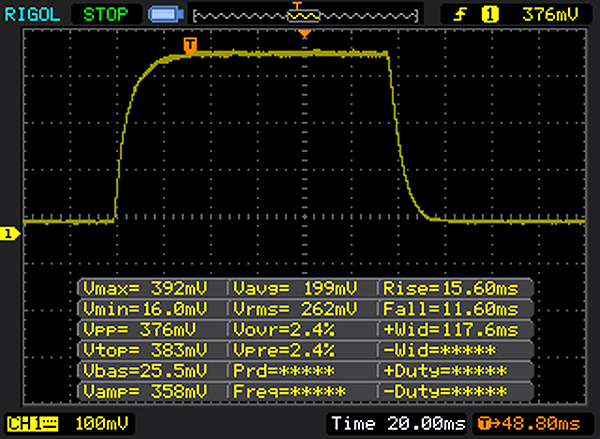 |
| ↘ 11 ms Calo | ||
| Lo schermo mostra tempi di risposta relativamente lenti nei nostri tests e potrebbe essere troppo lento per i gamers. In confronto, tutti i dispositivi di test variano da 0.1 (minimo) a 240 (massimo) ms. » 63 % di tutti i dispositivi è migliore. Questo significa che i tempi di risposta rilevati sono peggiori rispetto alla media di tutti i dispositivi testati (19.8 ms). | ||
| ↔ Tempo di risposta dal 50% Grigio all'80% Grigio | ||
| 32 ms ... aumenta ↗ e diminuisce ↘ combinato | ↗ 15 ms Incremento | 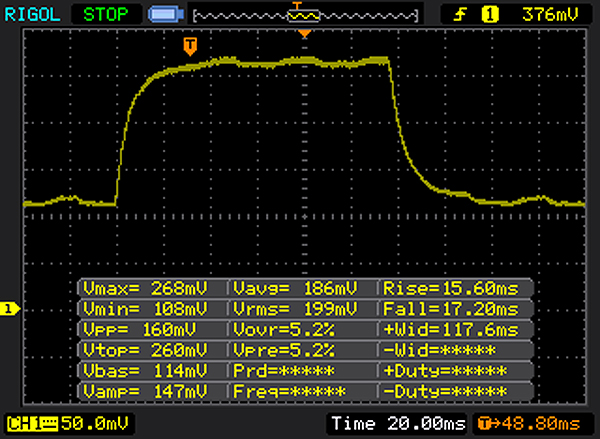 |
| ↘ 17 ms Calo | ||
| Lo schermo mostra tempi di risposta lenti nei nostri tests e sarà insoddisfacente per i gamers. In confronto, tutti i dispositivi di test variano da 0.165 (minimo) a 636 (massimo) ms. » 43 % di tutti i dispositivi è migliore. Questo significa che i tempi di risposta rilevati sono simili alla media di tutti i dispositivi testati (31 ms). | ||
Sfarfallio dello schermo / PWM (Pulse-Width Modulation)
| flickering dello schermo / PWM non rilevato | ||
In confronto: 52 % di tutti i dispositivi testati non utilizza PWM per ridurre la luminosita' del display. Se è rilevato PWM, una media di 7754 (minimo: 5 - massimo: 343500) Hz è stata rilevata. | ||
| JetStream 1.1 - 1.1 Total | |
| Asus Zenbook Flip UX360UAK-BB351T | |
| Lenovo Yoga 720-13IKB | |
| Dell Inspiron 13 7359-4839 | |
| Lenovo Yoga 3 Pro 13 80HE004LGE | |
| Acer Spin 5 SP513-51 | |
| Octane V2 - Total Score | |
| Lenovo Yoga 720-13IKB | |
| Dell Inspiron 13 7359-4839 | |
| Acer Spin 5 SP513-51 | |
| Lenovo Yoga 3 Pro 13 80HE004LGE | |
| Mozilla Kraken 1.1 - Total | |
| Lenovo Yoga 3 Pro 13 80HE004LGE | |
| Acer Spin 5 SP513-51 | |
| Lenovo Yoga 720-13IKB | |
| Dell Inspiron 13 7359-4839 | |
* ... Meglio usare valori piccoli
| PCMark 8 | |
| Home Score Accelerated v2 | |
| Lenovo Yoga 720-13IKB | |
| Asus Zenbook Flip UX360UAK-BB351T | |
| Dell Inspiron 13 7359-4839 | |
| Acer Spin 5 SP513-51 | |
| Lenovo Yoga 3 Pro 13 80HE004LGE | |
| Work Score Accelerated v2 | |
| Lenovo Yoga 720-13IKB | |
| Dell Inspiron 13 7359-4839 | |
| Acer Spin 5 SP513-51 | |
| Lenovo Yoga 3 Pro 13 80HE004LGE | |
| Creative Score Accelerated v2 | |
| Lenovo Yoga 720-13IKB | |
| Lenovo Yoga 3 Pro 13 80HE004LGE | |
| PCMark 7 Score | 5471 punti | |
| PCMark 8 Home Score Accelerated v2 | 3744 punti | |
| PCMark 8 Creative Score Accelerated v2 | 4494 punti | |
| PCMark 8 Work Score Accelerated v2 | 4717 punti | |
Aiuto | ||
| Lenovo Yoga 720-13IKB Samsung PM961 MZVLW256HEHP | Asus Zenbook Flip UX360UAK-BB351T Micron SSD 1100 (MTFDDAV256TBN) | Dell Inspiron 13 7359-4839 Liteonit LCH-256V2S | Lenovo Yoga 3 Pro 13 80HE004LGE Samsung SSD PM851 MZNTE512HMJH | |
|---|---|---|---|---|
| CrystalDiskMark 3.0 | -59% | -56% | -52% | |
| Read Seq (MB/s) | 2172 | 478.4 -78% | 486.3 -78% | 521 -76% |
| Write Seq (MB/s) | 1222 | 419.9 -66% | 283.7 -77% | 238.6 -80% |
| Read 512 (MB/s) | 1295 | 351.7 -73% | 337.5 -74% | 417.3 -68% |
| Write 512 (MB/s) | 863 | 294.2 -66% | 283.5 -67% | 237.7 -72% |
| Read 4k (MB/s) | 59.5 | 24 -60% | 26.75 -55% | 35.9 -40% |
| Write 4k (MB/s) | 150.3 | 87 -42% | 85.3 -43% | 99.9 -34% |
| Read 4k QD32 (MB/s) | 426.4 | 199.3 -53% | 309.7 -27% | 366.6 -14% |
| Write 4k QD32 (MB/s) | 360 | 232.4 -35% | 250.8 -30% | 236.7 -34% |

| 3DMark | |
| 1280x720 Cloud Gate Standard Graphics | |
| Lenovo Yoga 720-13IKB | |
| Acer Spin 5 SP513-51 | |
| Dell Inspiron 13 7359-4839 | |
| Lenovo Yoga 3 Pro 13 80HE004LGE | |
| 1920x1080 Fire Strike Graphics | |
| Lenovo Yoga 720-13IKB | |
| Acer Spin 5 SP513-51 | |
| Lenovo Yoga 3 Pro 13 80HE004LGE | |
| 3DMark 11 - 1280x720 Performance GPU | |
| Asus Zenbook Flip UX360UAK-BB351T | |
| Lenovo Yoga 720-13IKB | |
| Dell Inspiron 13 7359-4839 | |
| Acer Spin 5 SP513-51 | |
| Lenovo Yoga 3 Pro 13 80HE004LGE | |
| 3DMark 11 Performance | 1672 punti | |
| 3DMark Ice Storm Standard Score | 54379 punti | |
| 3DMark Cloud Gate Standard Score | 5768 punti | |
| 3DMark Fire Strike Score | 858 punti | |
| 3DMark Fire Strike Extreme Score | 391 punti | |
| 3DMark Time Spy Score | 364 punti | |
Aiuto | ||
| basso | medio | alto | ultra | |
|---|---|---|---|---|
| BioShock Infinite (2013) | 56.5 | 30.2 | 24.9 | 7.8 |
| Battlefield 4 (2013) | 41.3 | 32.1 | 21 | 7.5 |
| The Witcher 3 (2015) | 14.8 | 12.4 | 5.5 | |
| Rise of the Tomb Raider (2016) | 17.9 | 11.2 | 6.7 |
Rumorosità
| Idle |
| 30.5 / 30.5 / 30.5 dB(A) |
| Sotto carico |
| 37.7 / 41.5 dB(A) |
 | ||
30 dB silenzioso 40 dB(A) udibile 50 dB(A) rumoroso |
||
min: | ||
| Lenovo Yoga 720-13IKB HD Graphics 620, i5-7200U, Samsung PM961 MZVLW256HEHP | Asus Zenbook Flip UX360UAK-BB351T HD Graphics 620, i5-7200U, Micron SSD 1100 (MTFDDAV256TBN) | Dell Inspiron 13 7359-4839 HD Graphics 520, 6500U, Liteonit LCH-256V2S | Lenovo Yoga 3 Pro 13 80HE004LGE HD Graphics 5300, 5Y70, Samsung SSD PM851 MZNTE512HMJH | Acer Spin 5 SP513-51 HD Graphics 520, 6100U, Hynix HFS128G39TND | |
|---|---|---|---|---|---|
| Noise | 1% | 1% | 4% | 5% | |
| off /ambiente * (dB) | 30.5 | 30.7 -1% | 32.2 -6% | 31.2 -2% | 30.5 -0% |
| Idle Minimum * (dB) | 30.5 | 30.7 -1% | 32.2 -6% | 31.2 -2% | 30.5 -0% |
| Idle Average * (dB) | 30.5 | 30.7 -1% | 32.2 -6% | 31.4 -3% | 30.5 -0% |
| Idle Maximum * (dB) | 30.5 | 31.7 -4% | 32.2 -6% | 31.8 -4% | 30.6 -0% |
| Load Average * (dB) | 37.7 | 38.5 -2% | 34.1 10% | 32.3 14% | 31 18% |
| Load Maximum * (dB) | 41.5 | 36 13% | 34 18% | 32 23% | 36.8 11% |
* ... Meglio usare valori piccoli
(±) La temperatura massima sul lato superiore è di 41.5 °C / 107 F, rispetto alla media di 35.4 °C / 96 F, che varia da 19.6 a 60 °C per questa classe Convertible.
(±) Il lato inferiore si riscalda fino ad un massimo di 43.6 °C / 110 F, rispetto alla media di 36.9 °C / 98 F
(+) In idle, la temperatura media del lato superiore è di 24.8 °C / 77 F, rispetto alla media deld ispositivo di 30.3 °C / 87 F.
(+) I poggiapolsi e il touchpad sono piu' freddi della temperatura della pelle con un massimo di 30.5 °C / 86.9 F e sono quindi freddi al tatto.
(-) La temperatura media della zona del palmo della mano di dispositivi simili e'stata di 28 °C / 82.4 F (-2.5 °C / -4.5 F).
| Lenovo Yoga 720-13IKB i5-7200U, HD Graphics 620 | Asus Zenbook Flip UX360UAK-BB351T i5-7200U, HD Graphics 620 | Dell Inspiron 13 7359-4839 6500U, HD Graphics 520 | Lenovo Yoga 3 Pro 13 80HE004LGE 5Y70, HD Graphics 5300 | Acer Spin 5 SP513-51 6100U, HD Graphics 520 | |
|---|---|---|---|---|---|
| Heat | 5% | 3% | -6% | -2% | |
| Maximum Upper Side * (°C) | 41.5 | 41.2 1% | 39.1 6% | 41 1% | 38.3 8% |
| Maximum Bottom * (°C) | 43.6 | 41 6% | 43.6 -0% | 34.8 20% | 42.5 3% |
| Idle Upper Side * (°C) | 25.8 | 25 3% | 25.5 1% | 34.2 -33% | 28.7 -11% |
| Idle Bottom * (°C) | 27.2 | 25.1 8% | 26.5 3% | 30.4 -12% | 29.4 -8% |
* ... Meglio usare valori piccoli
Lenovo Yoga 720-13IKB analisi audio
(-) | altoparlanti non molto potenti (66 dB)
Bassi 100 - 315 Hz
(-) | quasi nessun basso - in media 21.6% inferiori alla media
(±) | la linearità dei bassi è media (12.1% delta rispetto alla precedente frequenza)
Medi 400 - 2000 Hz
(+) | medi bilanciati - solo only 3.1% rispetto alla media
(±) | linearità dei medi adeguata (10.2% delta rispetto alla precedente frequenza)
Alti 2 - 16 kHz
(+) | Alti bilanciati - appena 2% dalla media
(+) | alti lineari (4.7% delta rispetto alla precedente frequenza)
Nel complesso 100 - 16.000 Hz
(±) | la linearità complessiva del suono è media (20.4% di differenza rispetto alla media
Rispetto alla stessa classe
» 53% di tutti i dispositivi testati in questa classe è stato migliore, 7% simile, 40% peggiore
» Il migliore ha avuto un delta di 6%, medio di 20%, peggiore di 57%
Rispetto a tutti i dispositivi testati
» 54% di tutti i dispositivi testati in questa classe è stato migliore, 8% similare, 38% peggiore
» Il migliore ha avuto un delta di 4%, medio di 23%, peggiore di 134%
Apple MacBook 12 (Early 2016) 1.1 GHz analisi audio
(+) | gli altoparlanti sono relativamente potenti (83.6 dB)
Bassi 100 - 315 Hz
(±) | bassi ridotti - in media 11.3% inferiori alla media
(±) | la linearità dei bassi è media (14.2% delta rispetto alla precedente frequenza)
Medi 400 - 2000 Hz
(+) | medi bilanciati - solo only 2.4% rispetto alla media
(+) | medi lineari (5.5% delta rispetto alla precedente frequenza)
Alti 2 - 16 kHz
(+) | Alti bilanciati - appena 2% dalla media
(+) | alti lineari (4.5% delta rispetto alla precedente frequenza)
Nel complesso 100 - 16.000 Hz
(+) | suono nel complesso lineare (10.2% differenza dalla media)
Rispetto alla stessa classe
» 7% di tutti i dispositivi testati in questa classe è stato migliore, 2% simile, 90% peggiore
» Il migliore ha avuto un delta di 5%, medio di 18%, peggiore di 53%
Rispetto a tutti i dispositivi testati
» 5% di tutti i dispositivi testati in questa classe è stato migliore, 1% similare, 94% peggiore
» Il migliore ha avuto un delta di 4%, medio di 23%, peggiore di 134%
| Off / Standby | |
| Idle | |
| Sotto carico |
|
Leggenda:
min: | |
| Lenovo Yoga 720-13IKB i5-7200U, HD Graphics 620, Samsung PM961 MZVLW256HEHP, IPS, 1920x1080, 13.3" | Asus Zenbook Flip UX360UAK-BB351T i5-7200U, HD Graphics 620, Micron SSD 1100 (MTFDDAV256TBN), IPS, 1920x1080, 13.3" | Dell Inspiron 13 7359-4839 6500U, HD Graphics 520, Liteonit LCH-256V2S, IPS, 1920x1080, 13.3" | Lenovo Yoga 3 Pro 13 80HE004LGE 5Y70, HD Graphics 5300, Samsung SSD PM851 MZNTE512HMJH, IPS, 3200x1800, 13.3" | Acer Spin 5 SP513-51 6100U, HD Graphics 520, Hynix HFS128G39TND, IPS LED, 1920x1080, 13.3" | |
|---|---|---|---|---|---|
| Power Consumption | 7% | 18% | 4% | 19% | |
| Idle Minimum * (Watt) | 4.3 | 4.2 2% | 4 7% | 4.8 -12% | 4.1 5% |
| Idle Average * (Watt) | 7.9 | 7.4 6% | 4.8 39% | 10.7 -35% | 6.8 14% |
| Idle Maximum * (Watt) | 10 | 8.6 14% | 7.6 24% | 11.8 -18% | 7.9 21% |
| Load Average * (Watt) | 34.2 | 32 6% | 30 12% | 18.3 46% | 20.4 40% |
| Load Maximum * (Watt) | 32.2 | 30.2 6% | 29.3 9% | 19.7 39% | 26.8 17% |
* ... Meglio usare valori piccoli
| Lenovo Yoga 720-13IKB i5-7200U, HD Graphics 620, 48 Wh | Asus Zenbook Flip UX360UAK-BB351T i5-7200U, HD Graphics 620, 57 Wh | Dell Inspiron 13 7359-4839 6500U, HD Graphics 520, 44 Wh | Lenovo Yoga 3 Pro 13 80HE004LGE 5Y70, HD Graphics 5300, 44 Wh | Acer Spin 5 SP513-51 6100U, HD Graphics 520, 45 Wh | |
|---|---|---|---|---|---|
| Autonomia della batteria | 39% | -14% | -48% | -14% | |
| Reader / Idle (h) | 16.2 | 14.8 -9% | 12.5 -23% | ||
| H.264 (h) | 7.6 | ||||
| WiFi v1.3 (h) | 8.4 | 11.7 39% | 8.1 -4% | 4.4 -48% | 7.7 -8% |
| Load (h) | 2.5 | 1.8 -28% | 2.2 -12% |
Pro
Contro
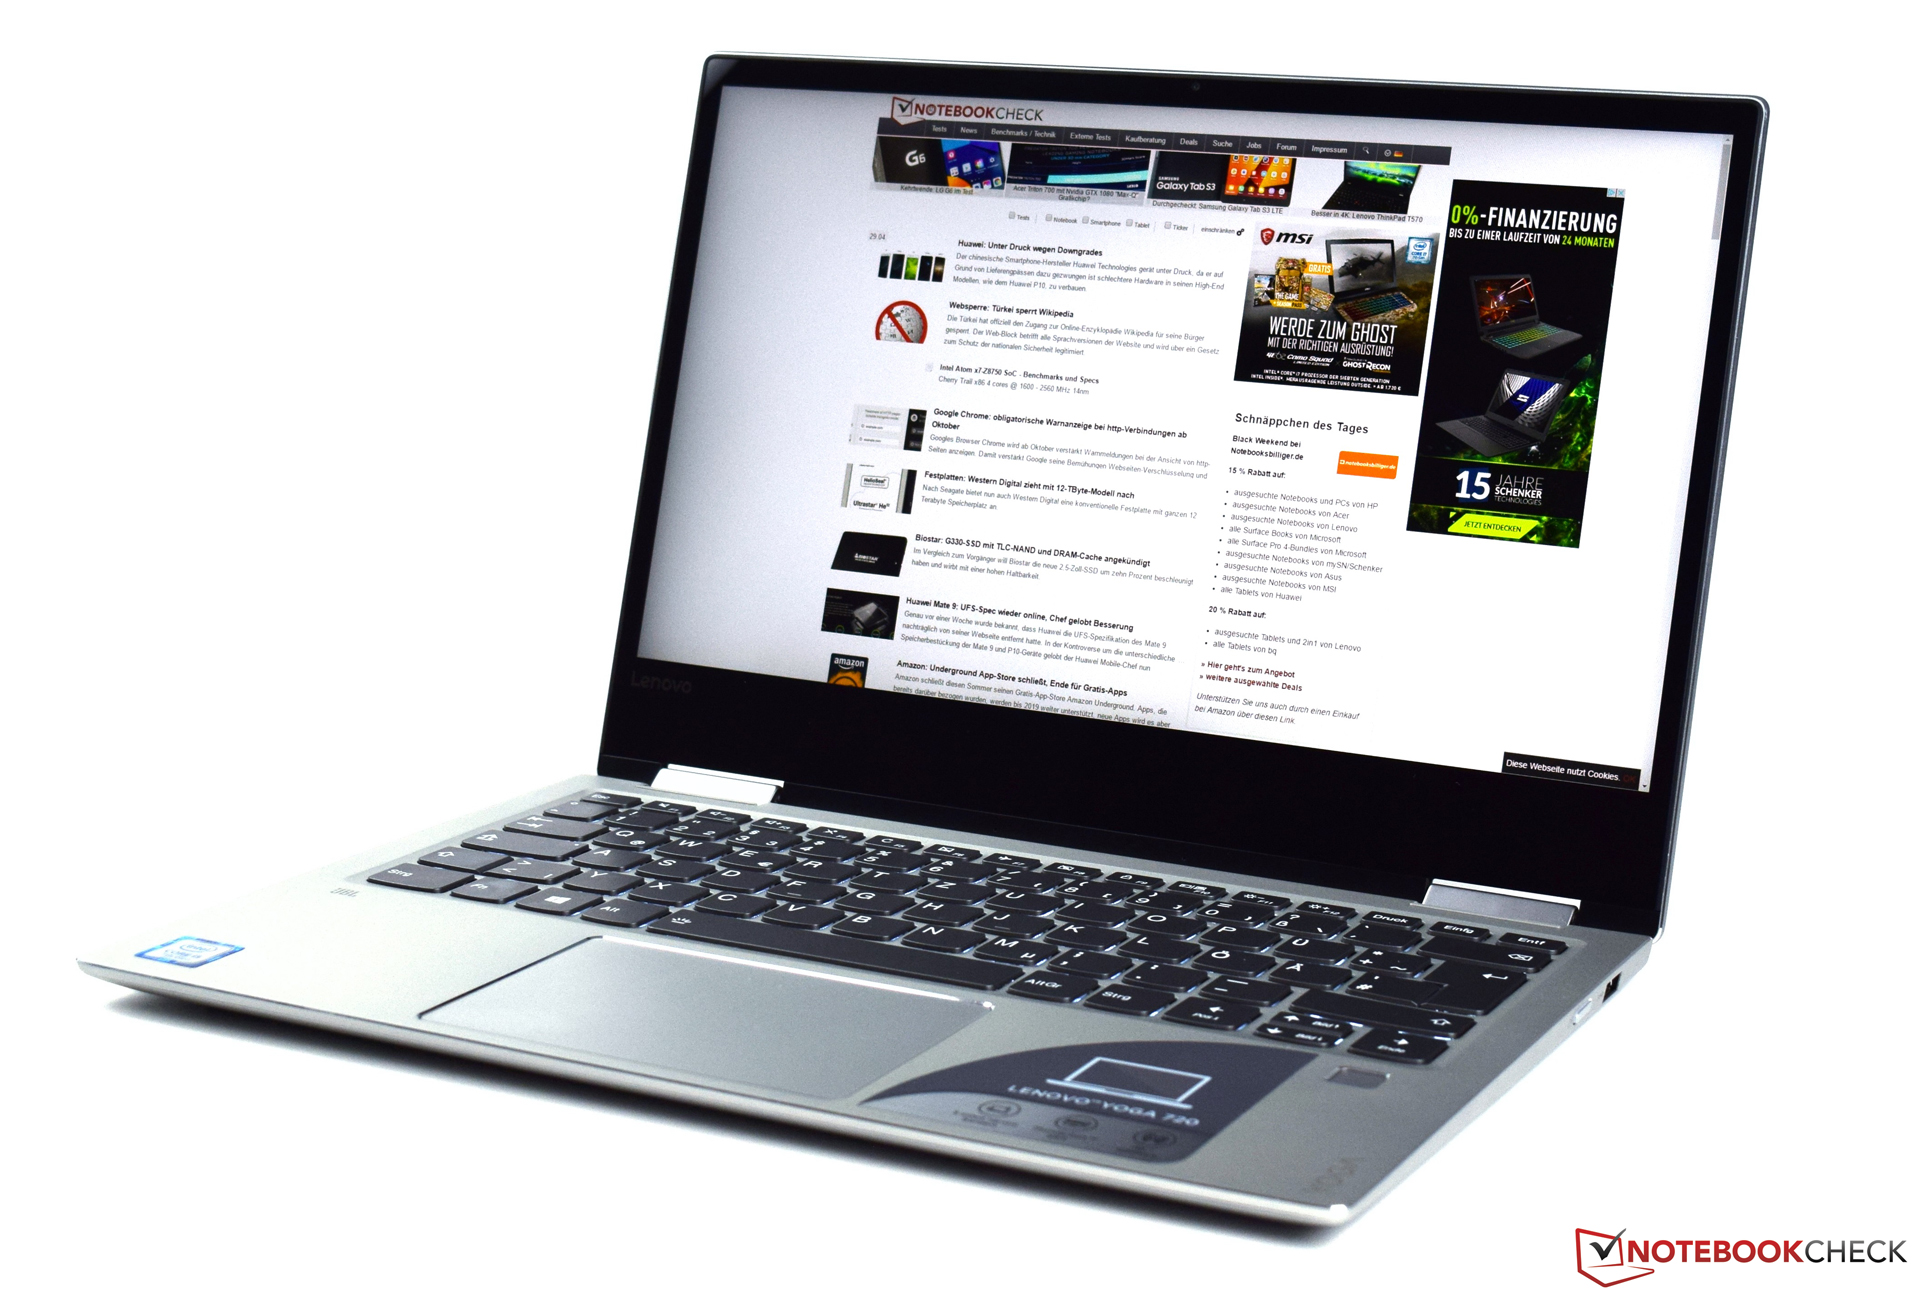
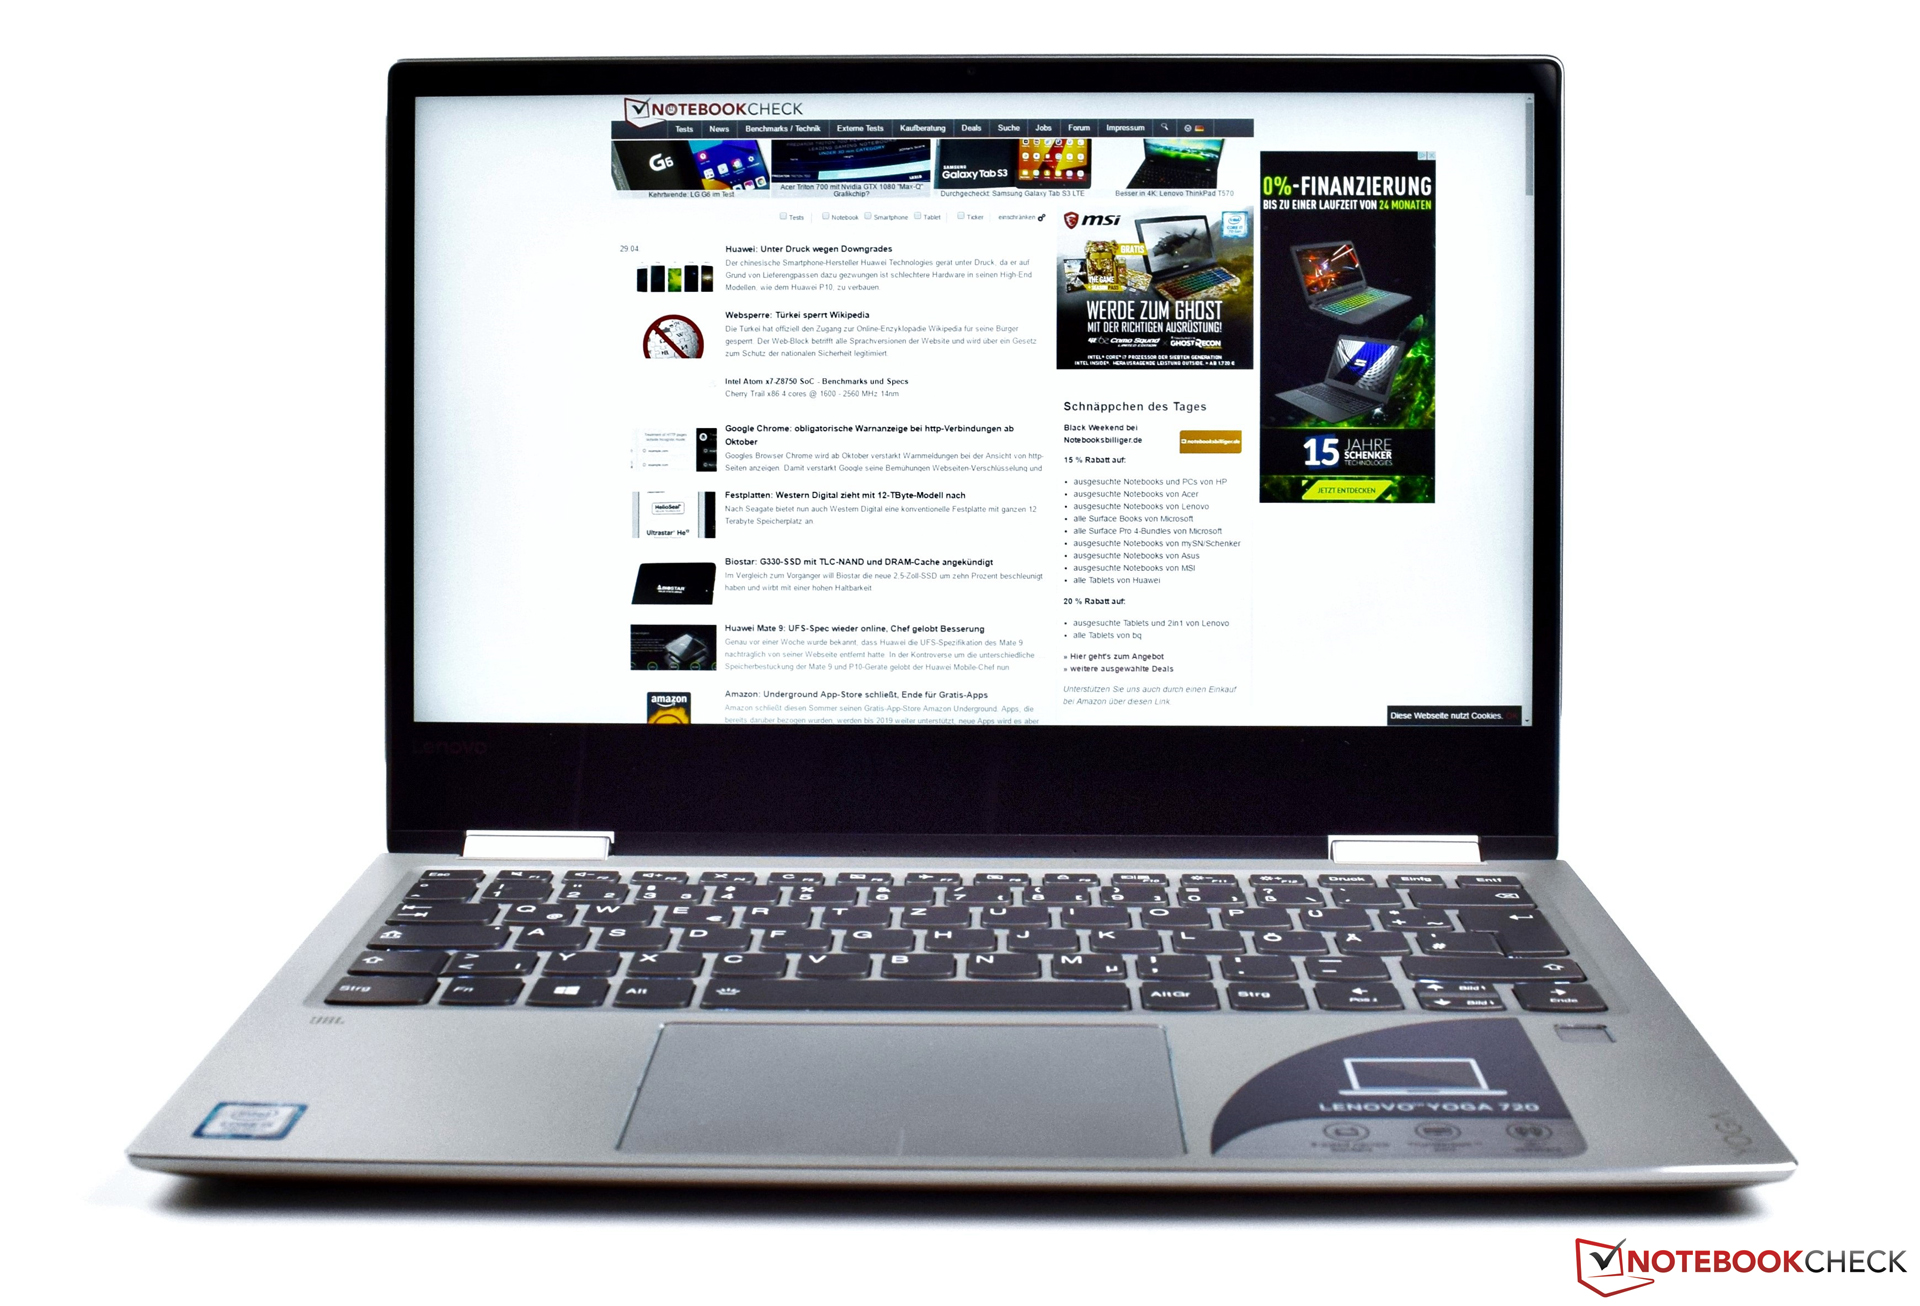
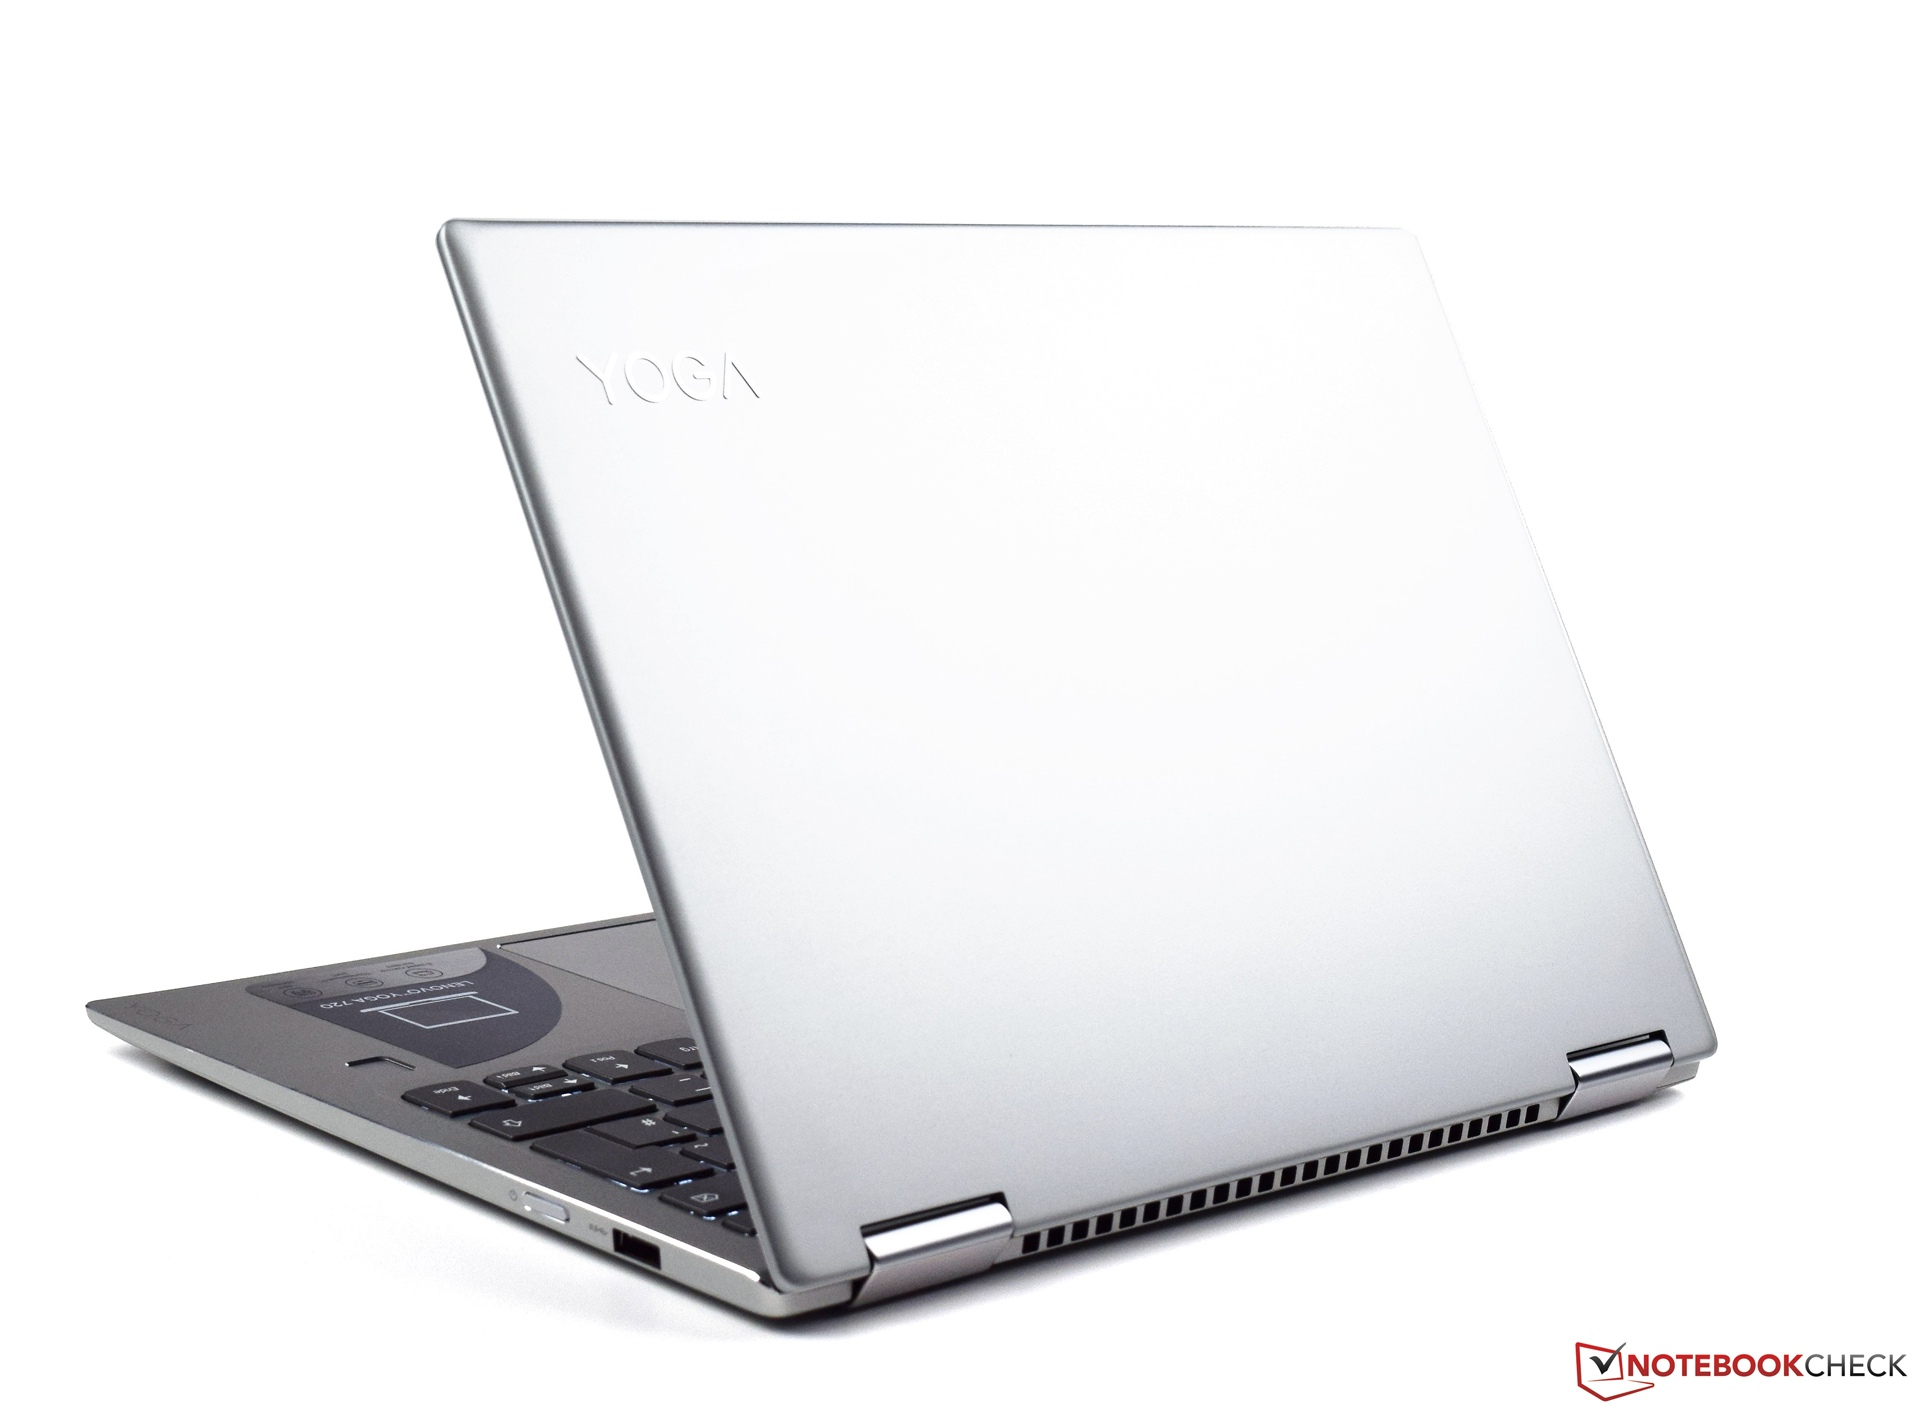
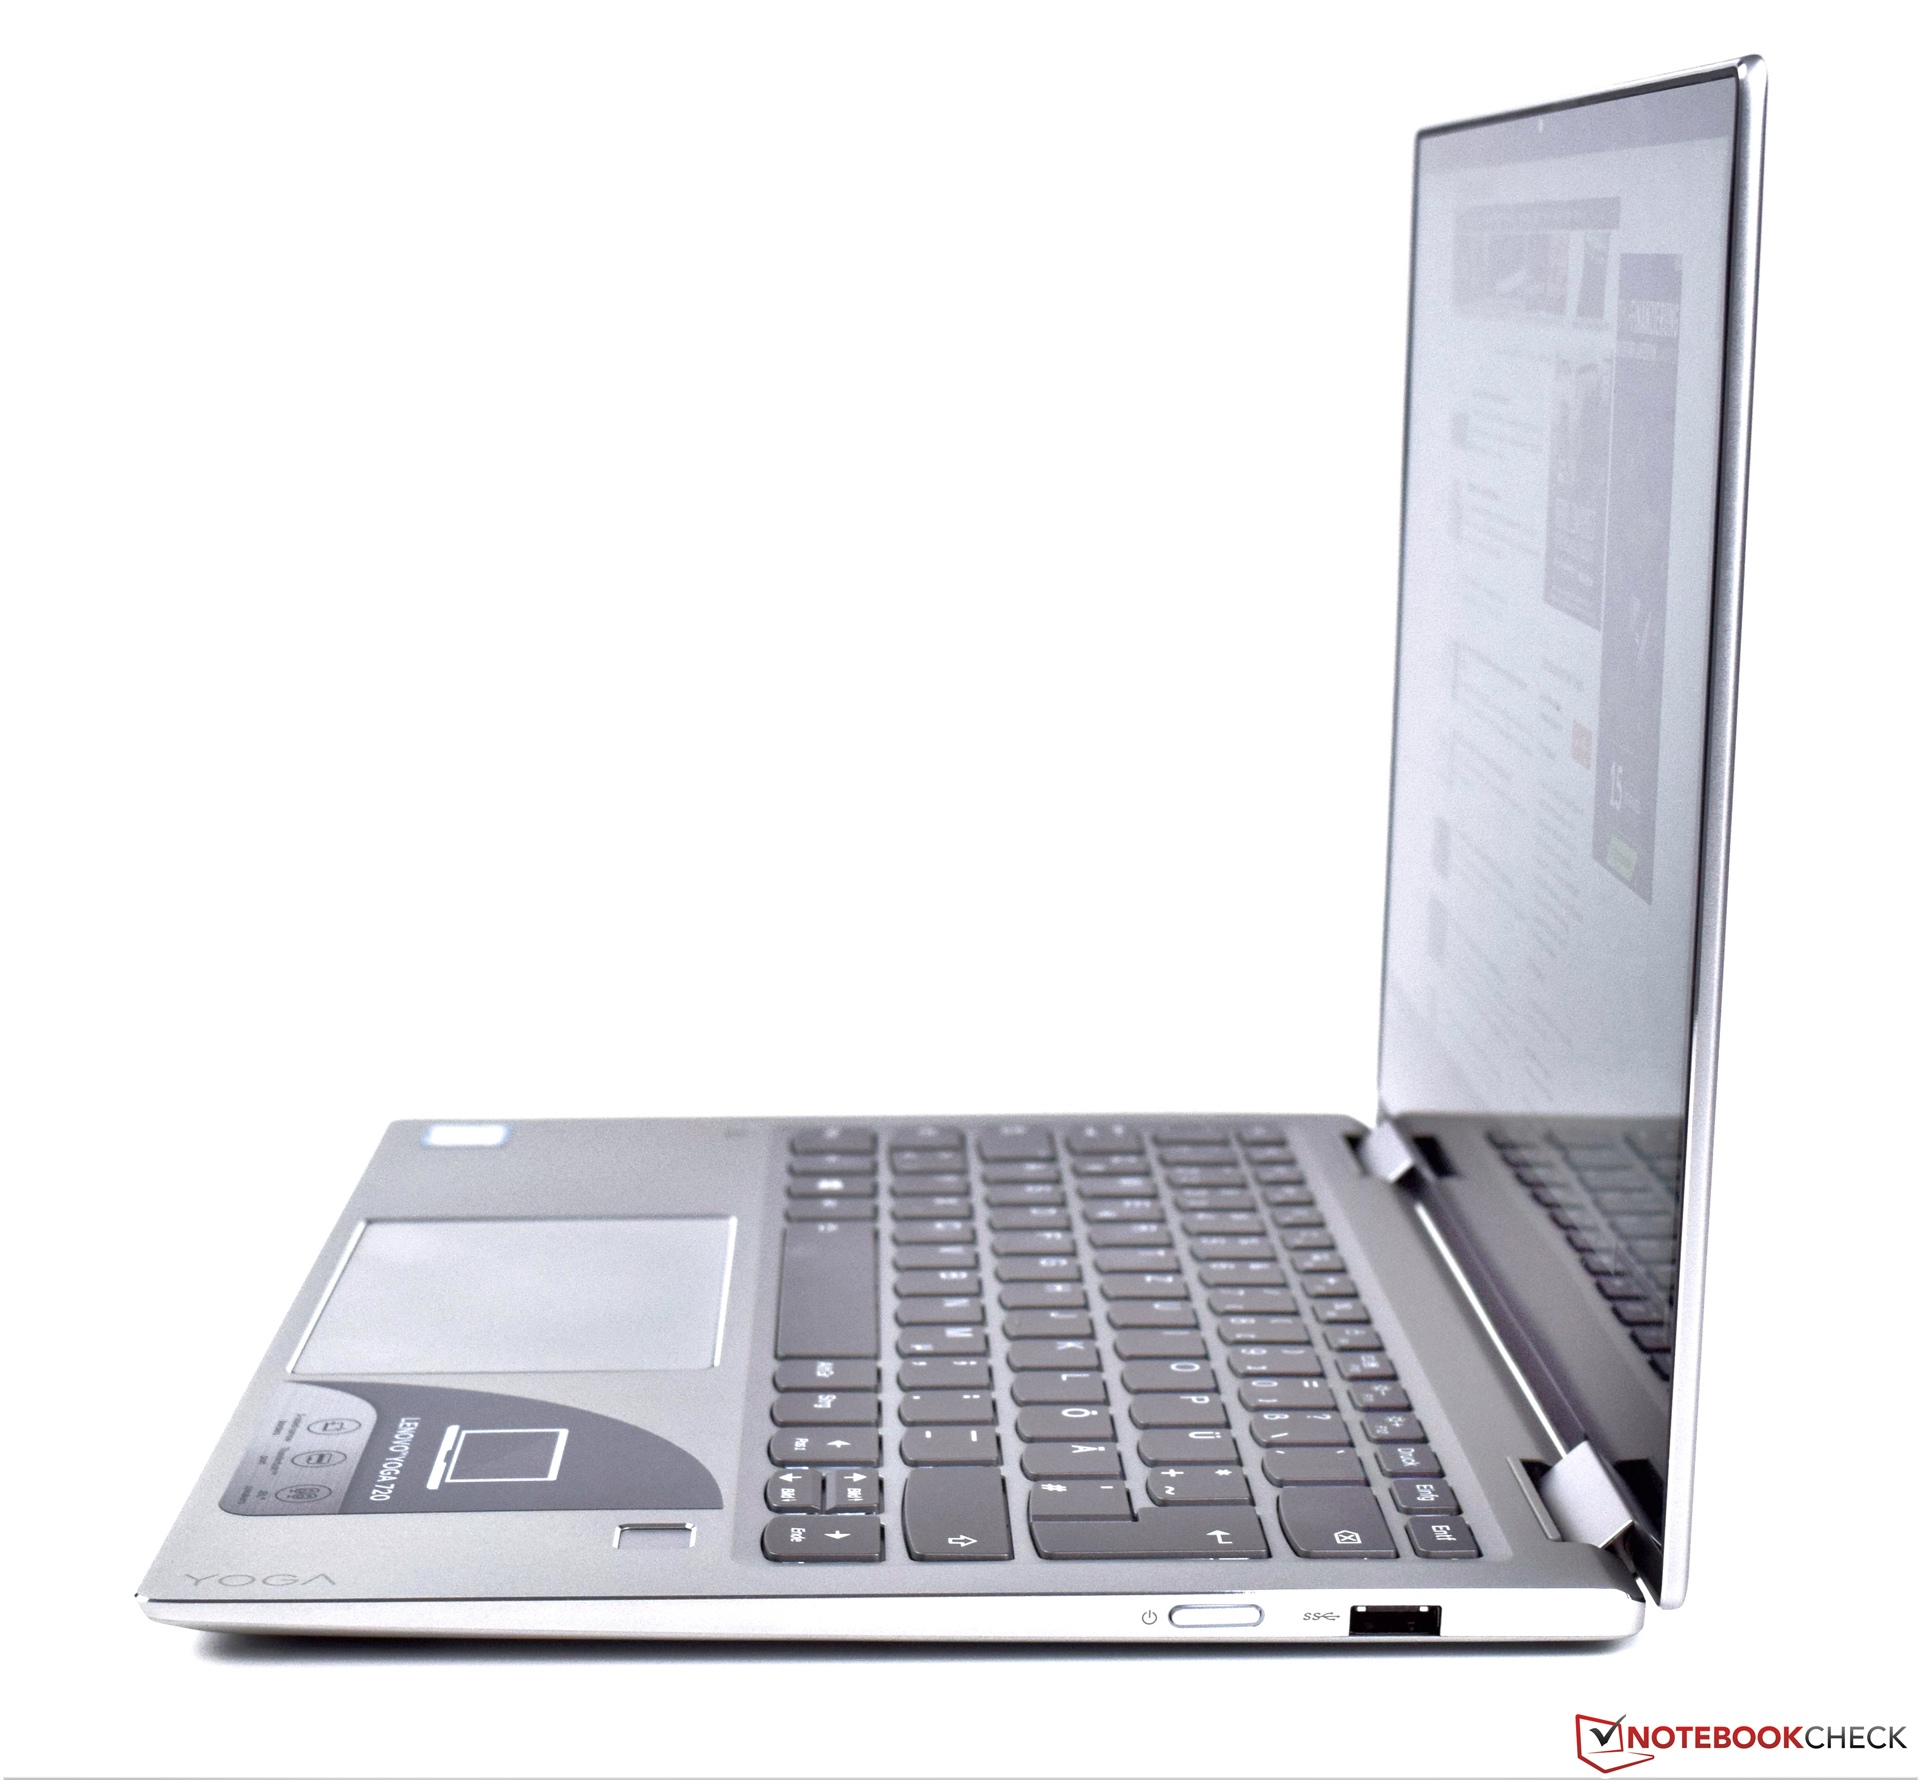
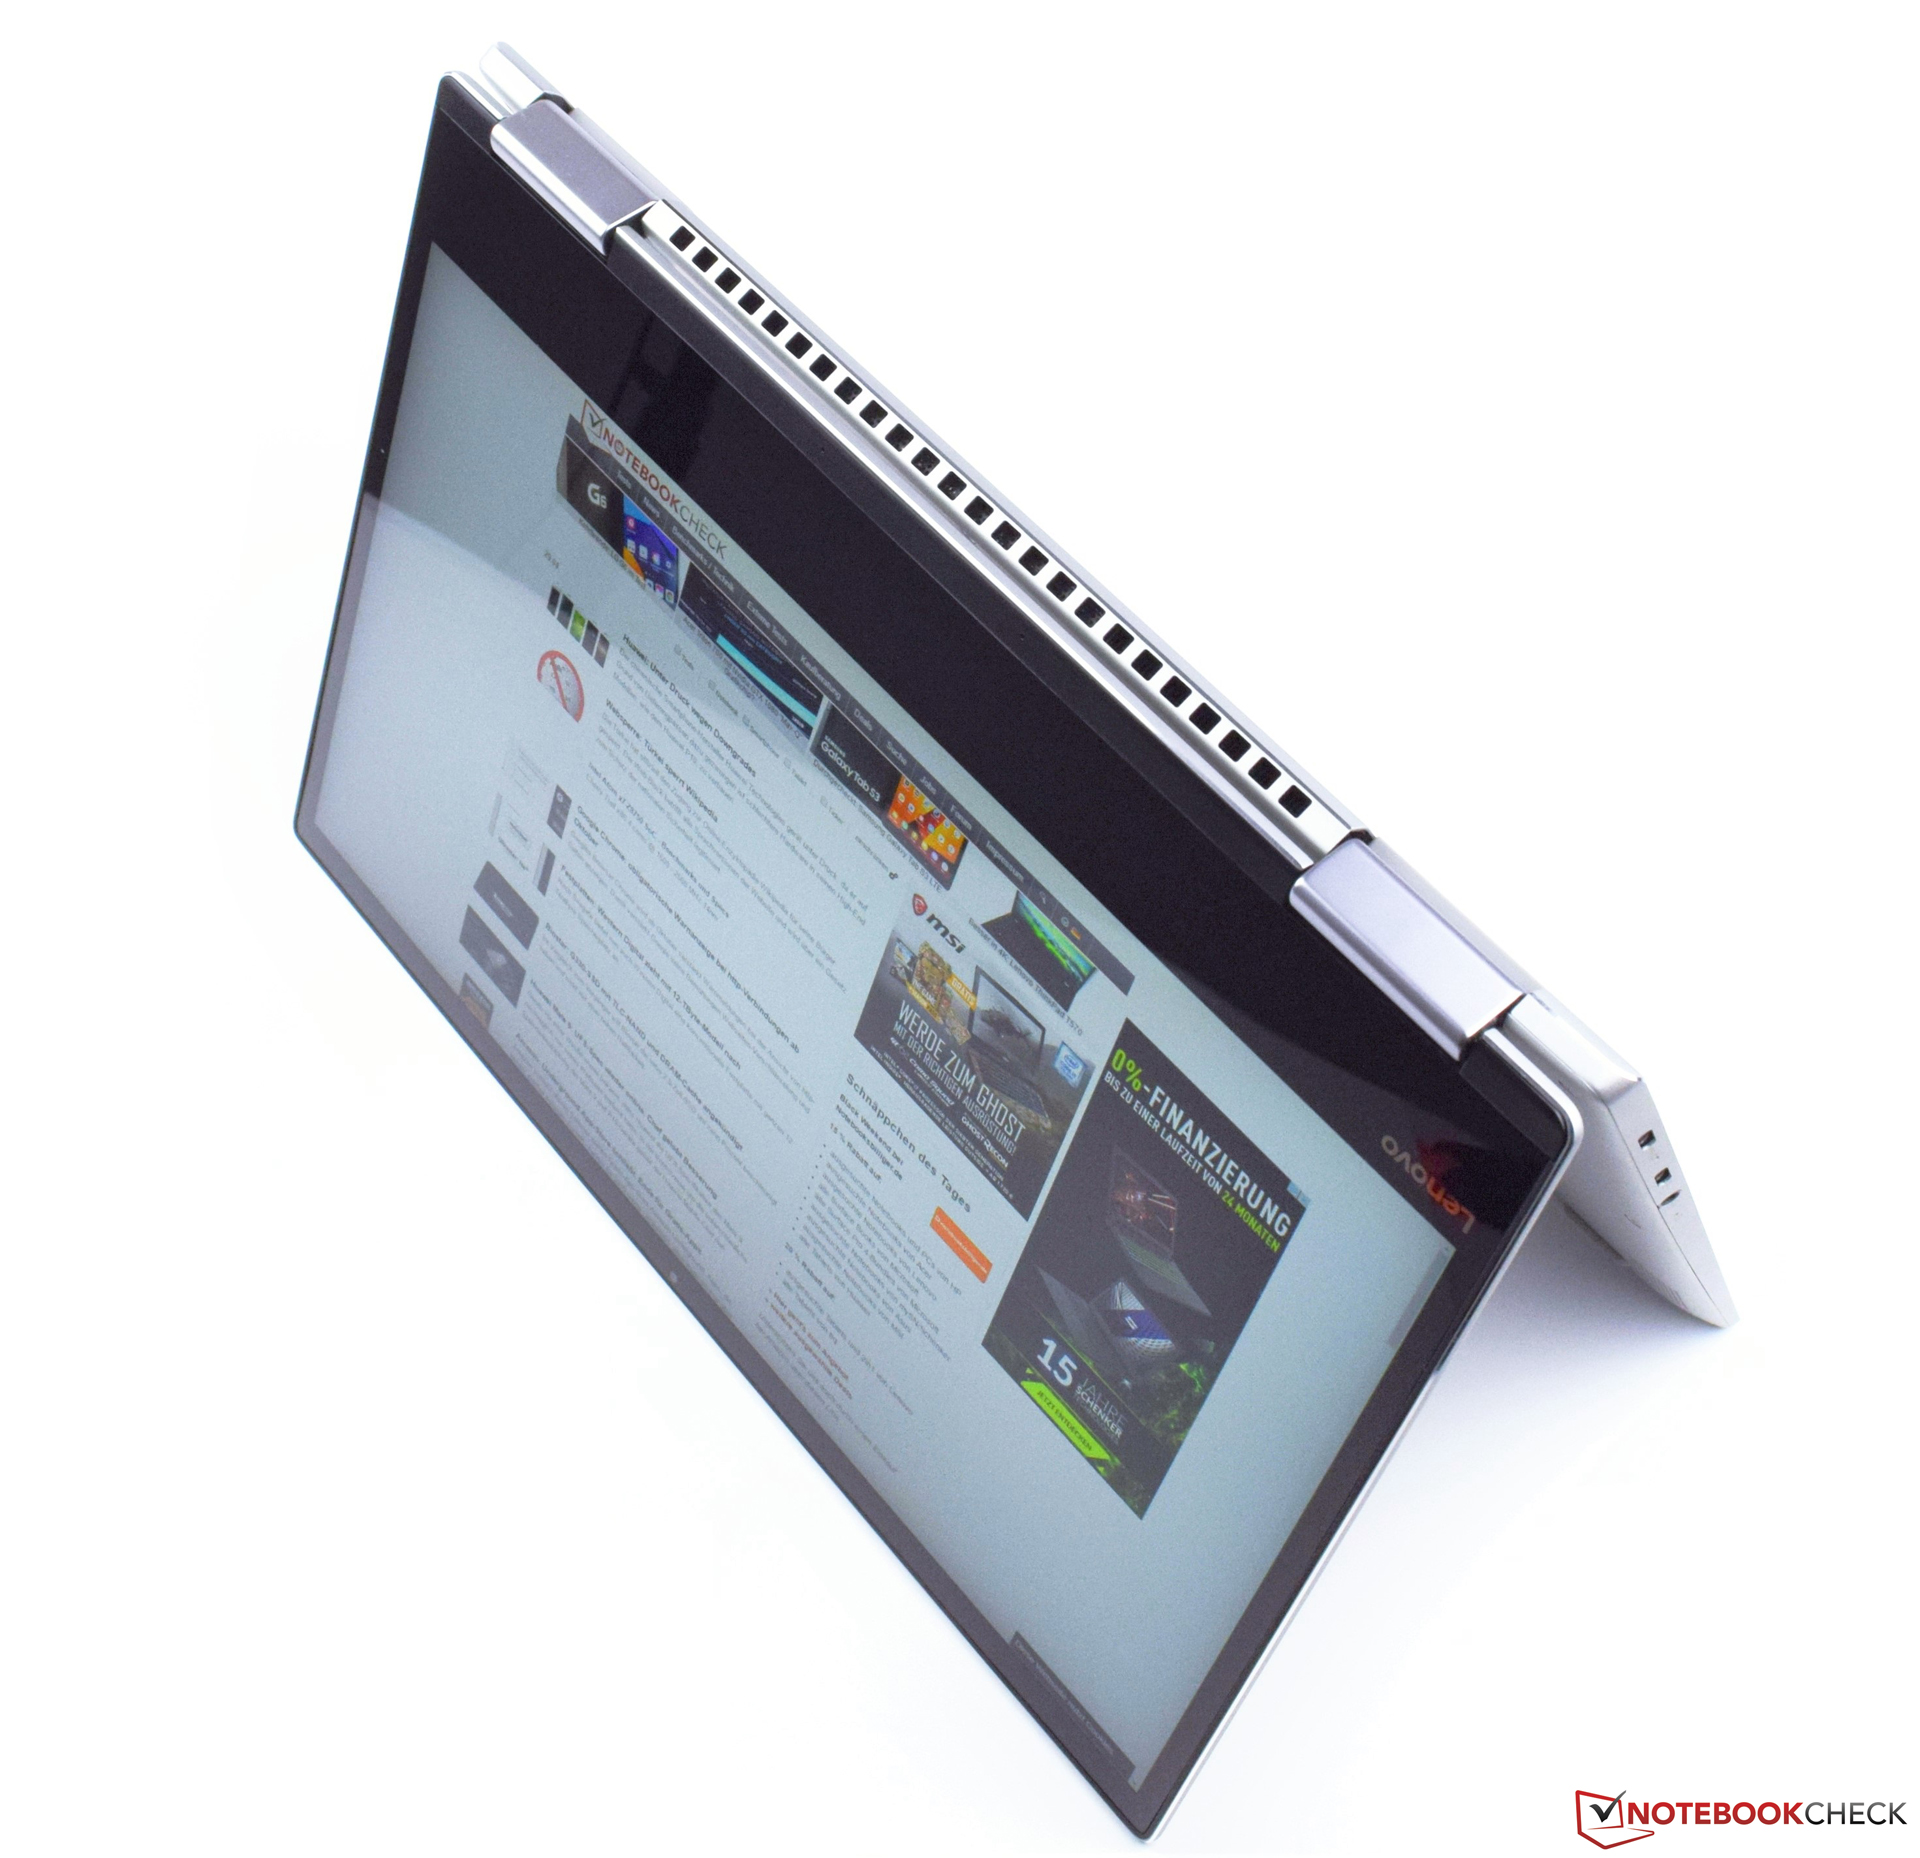
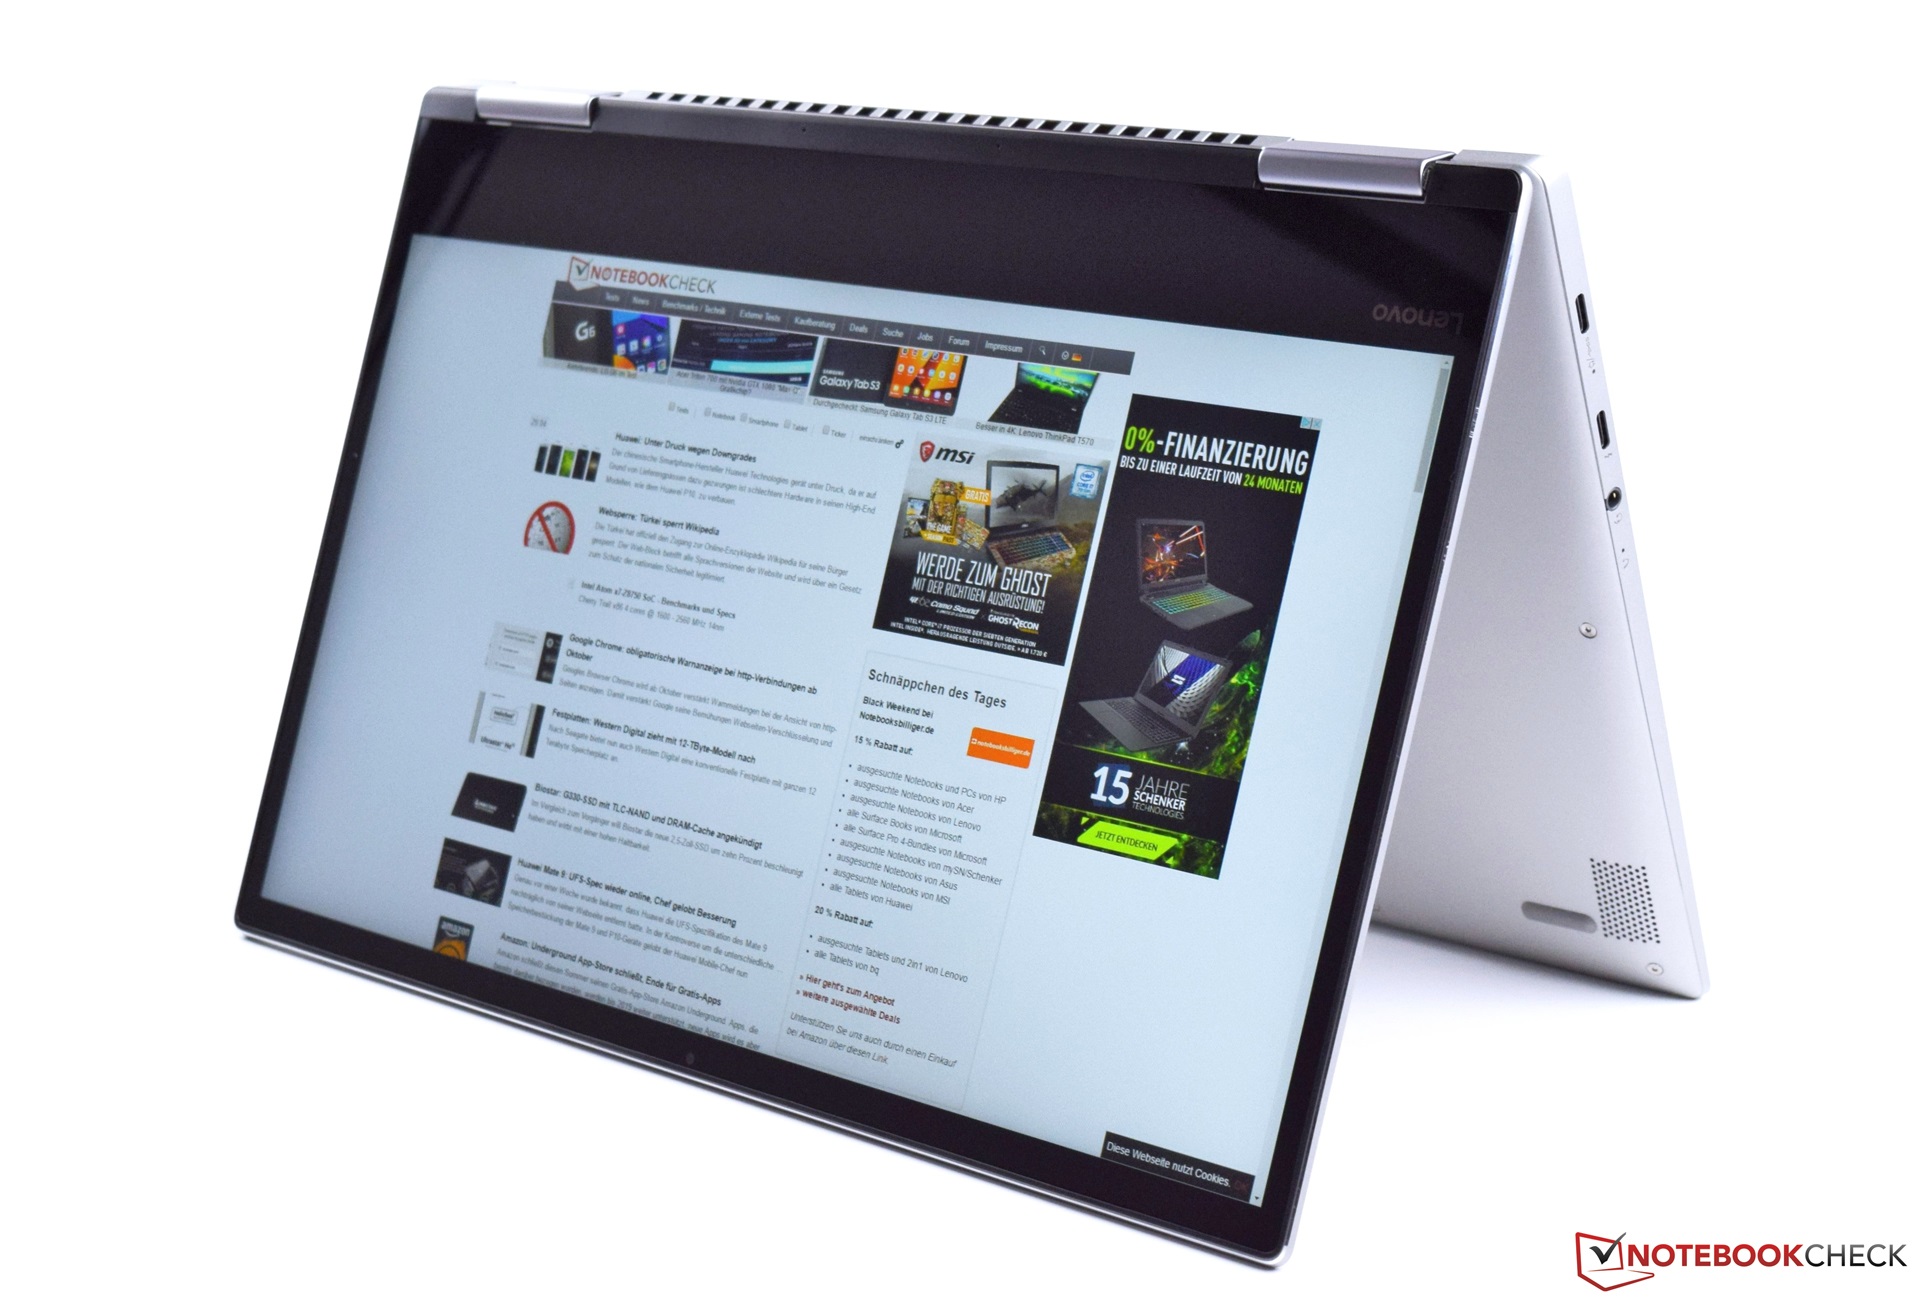
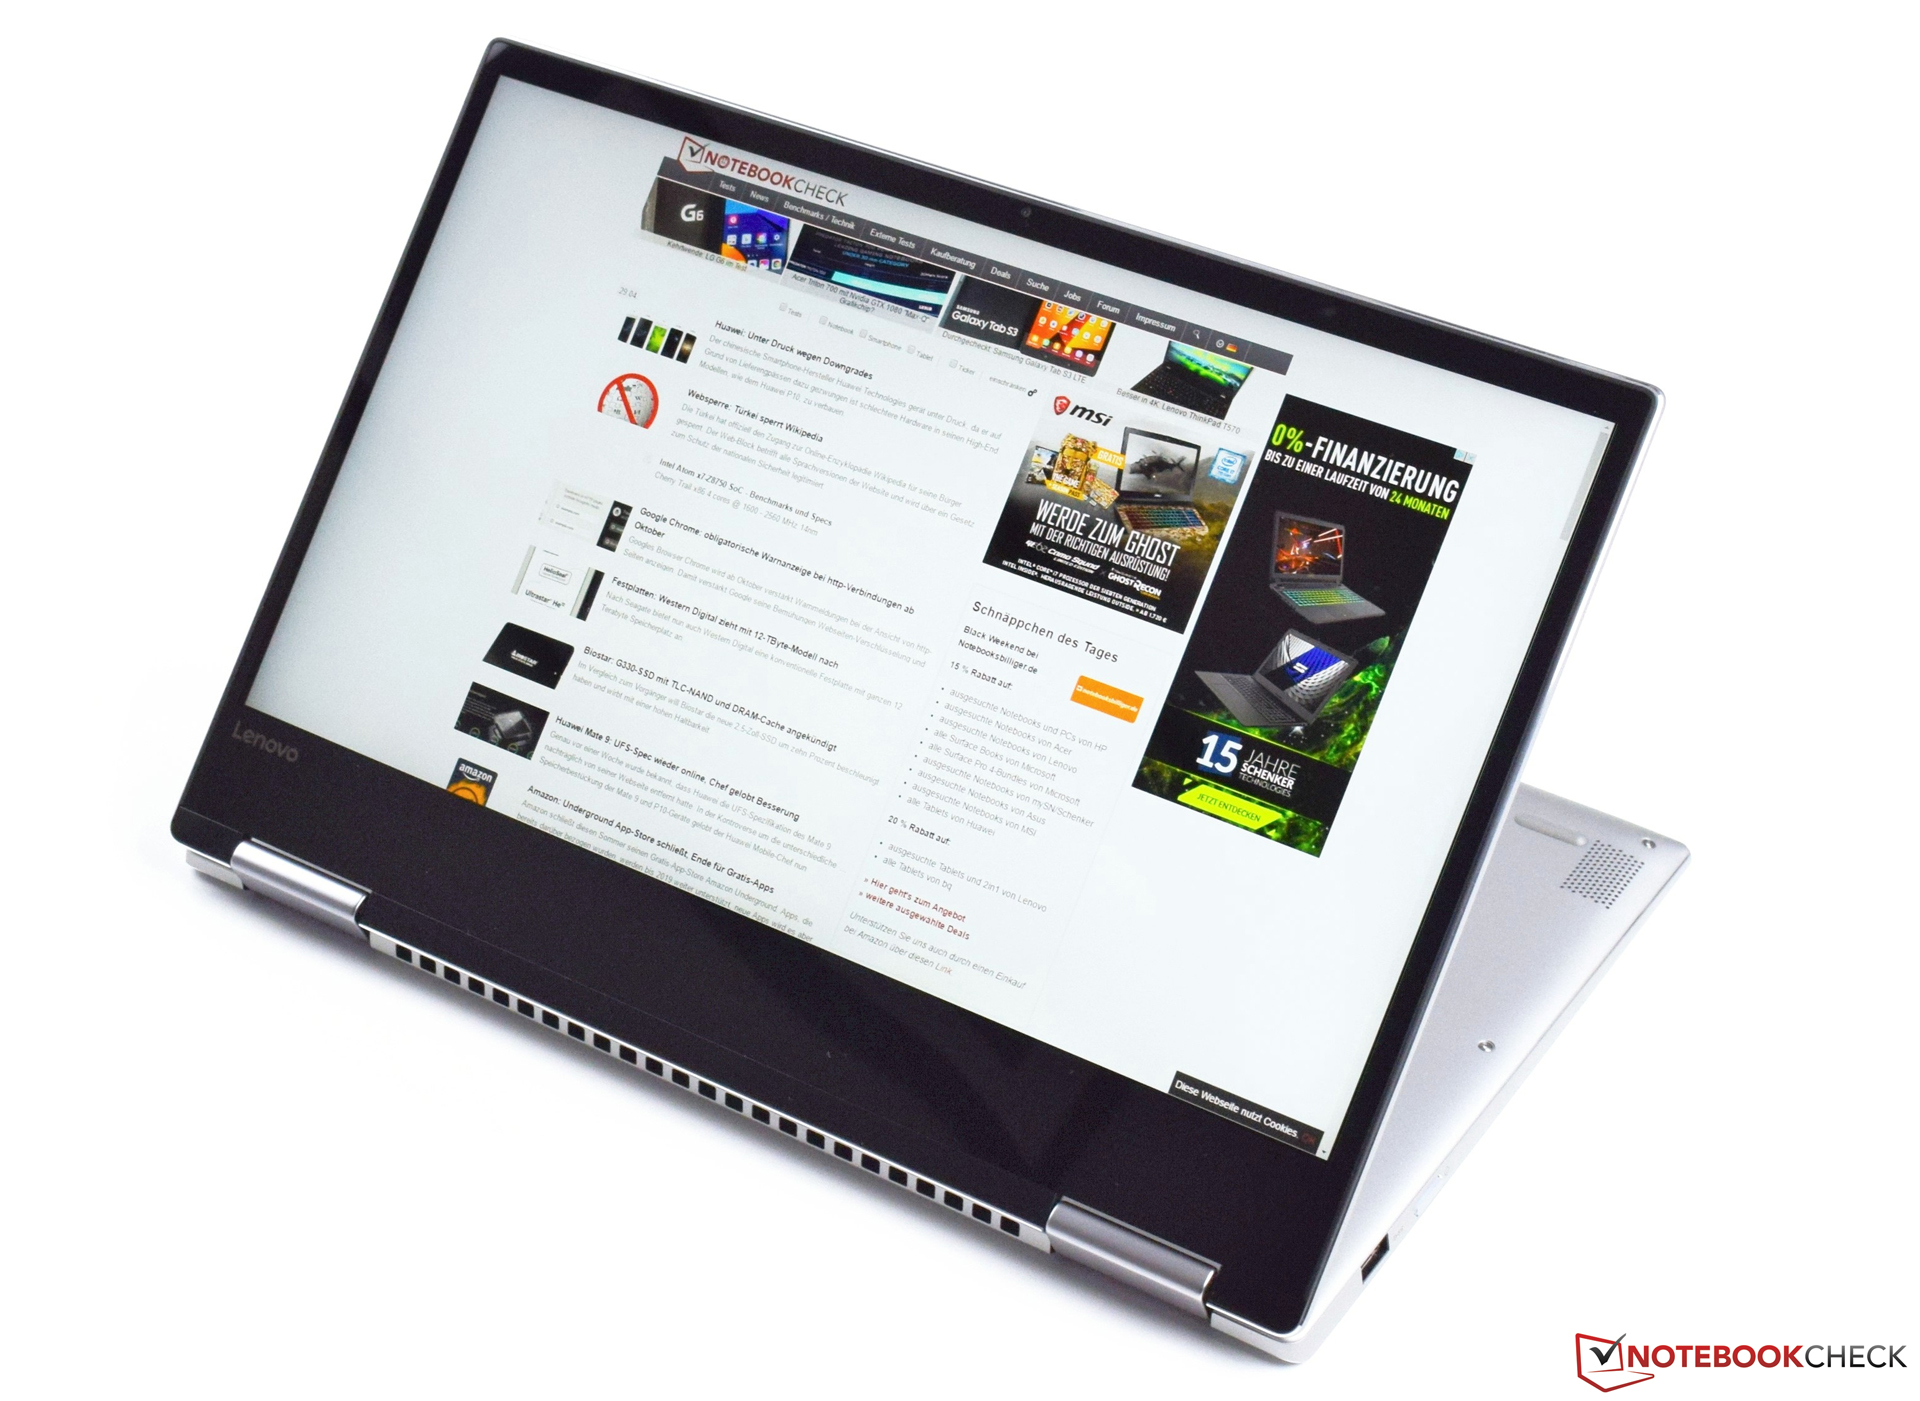
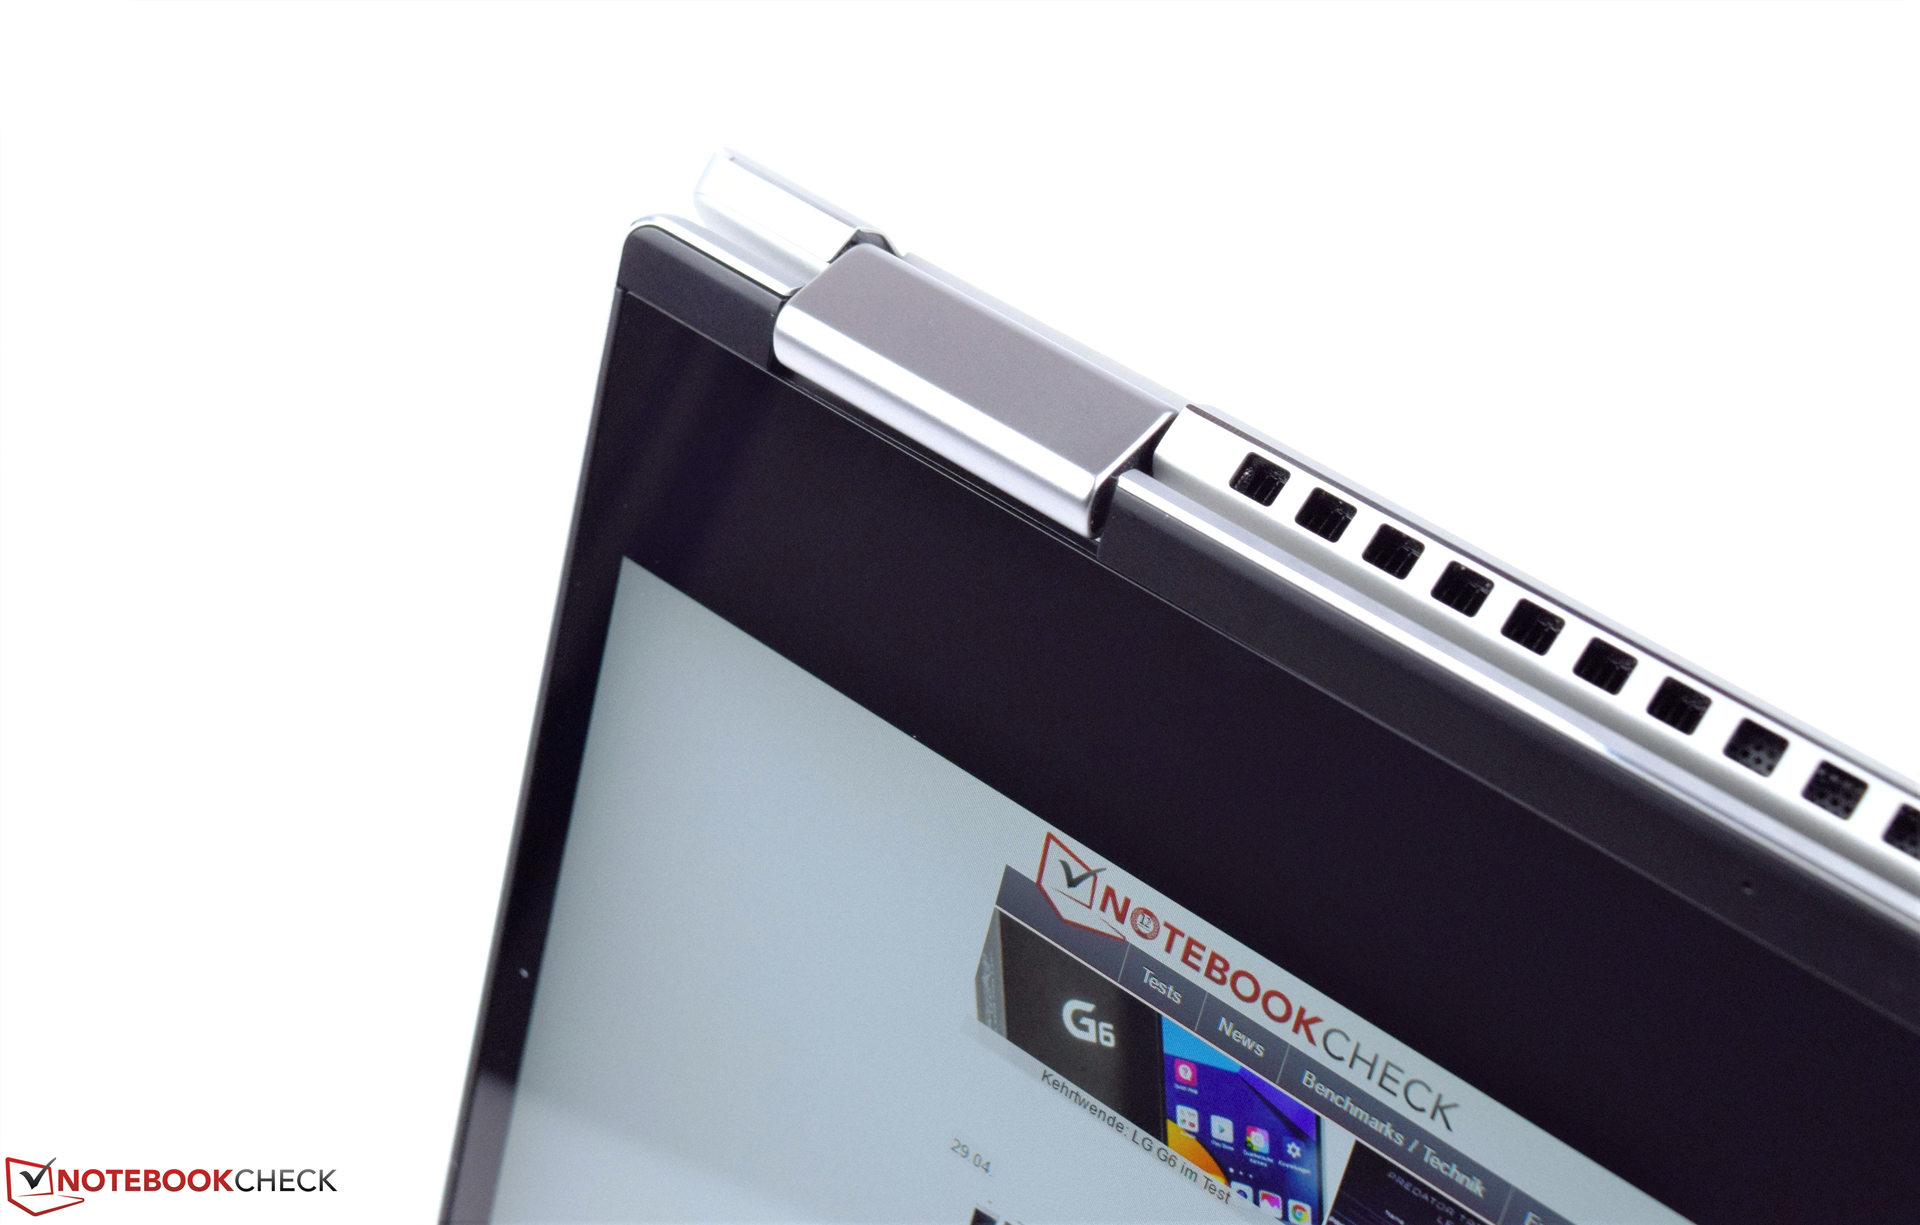
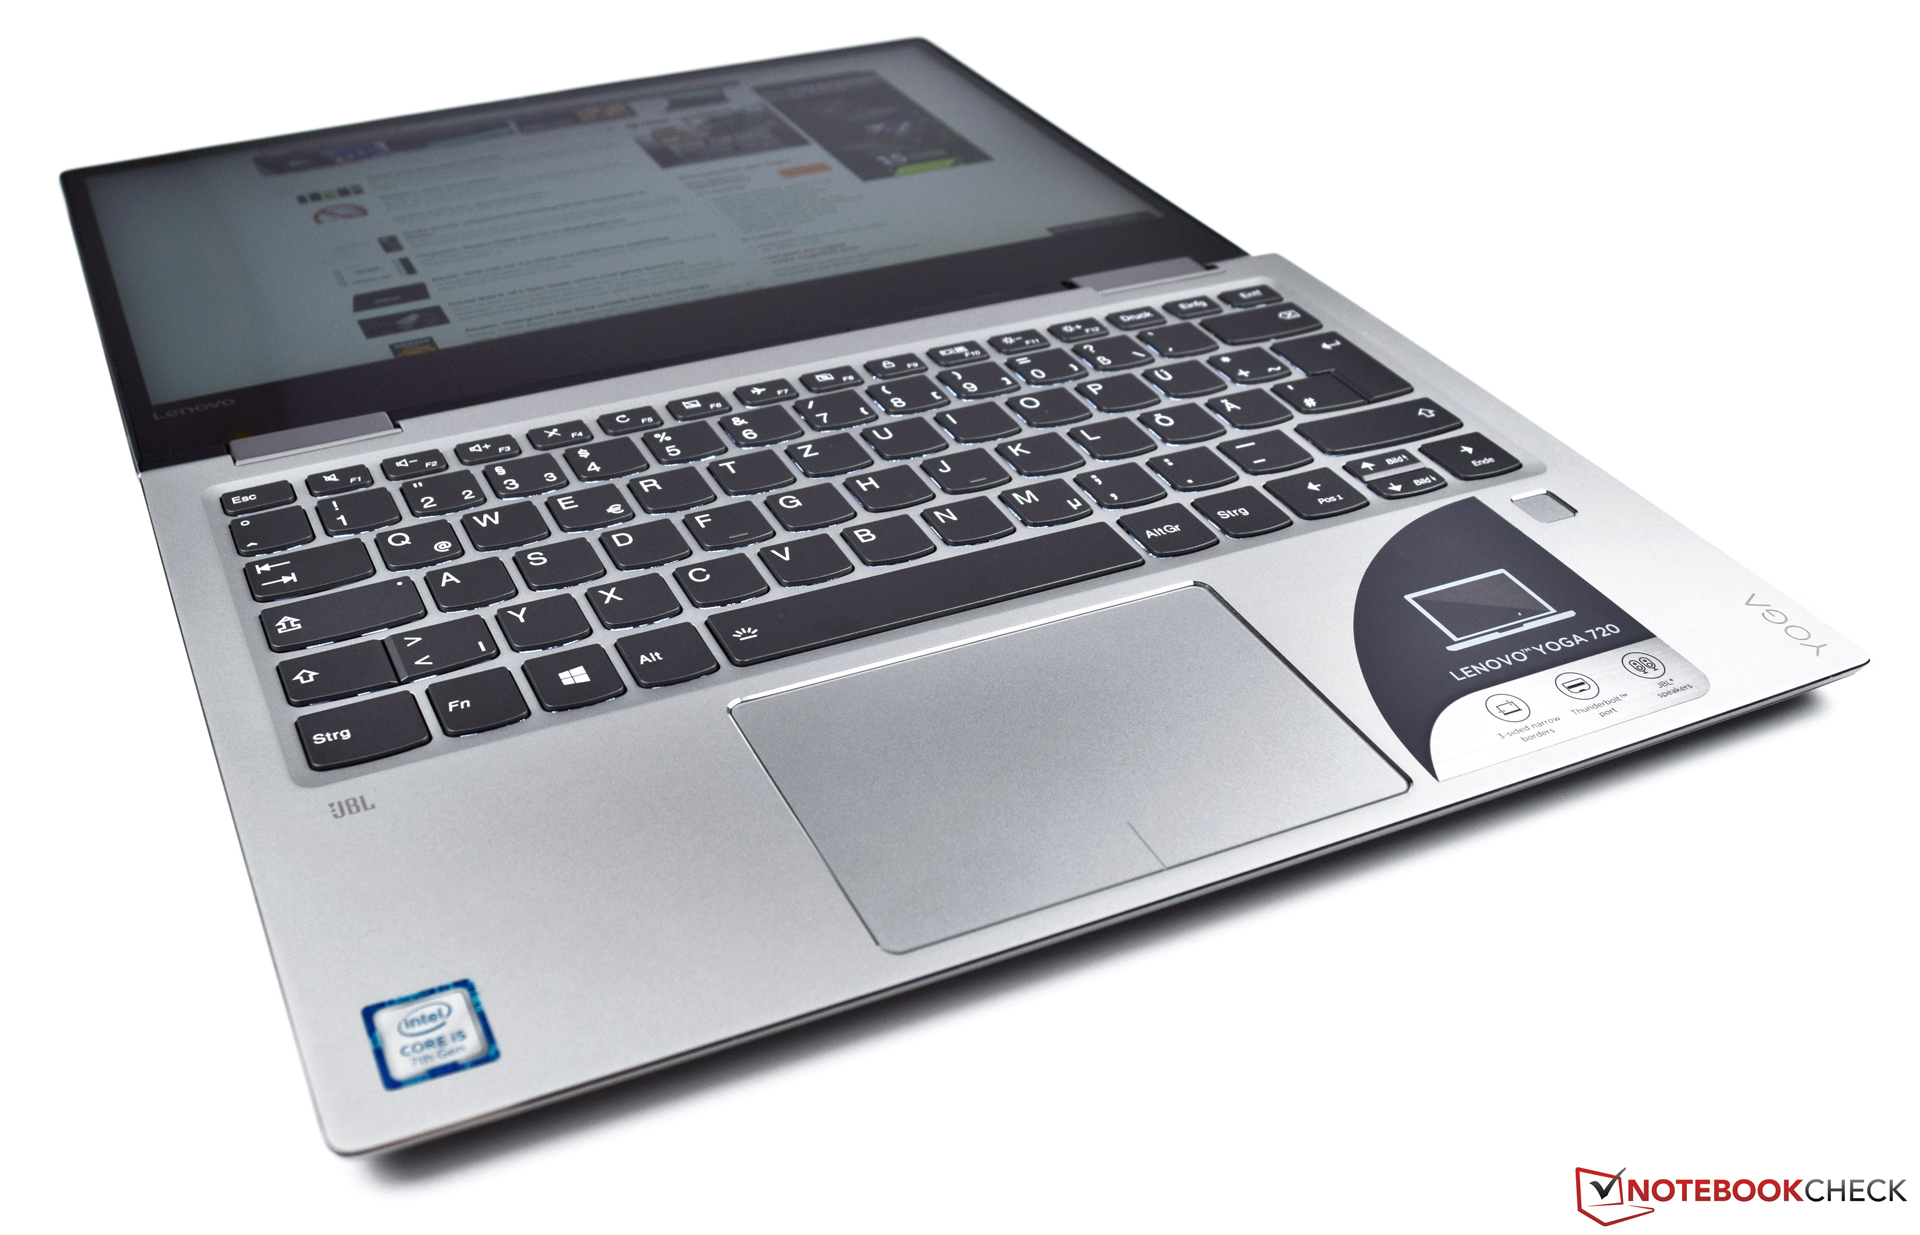
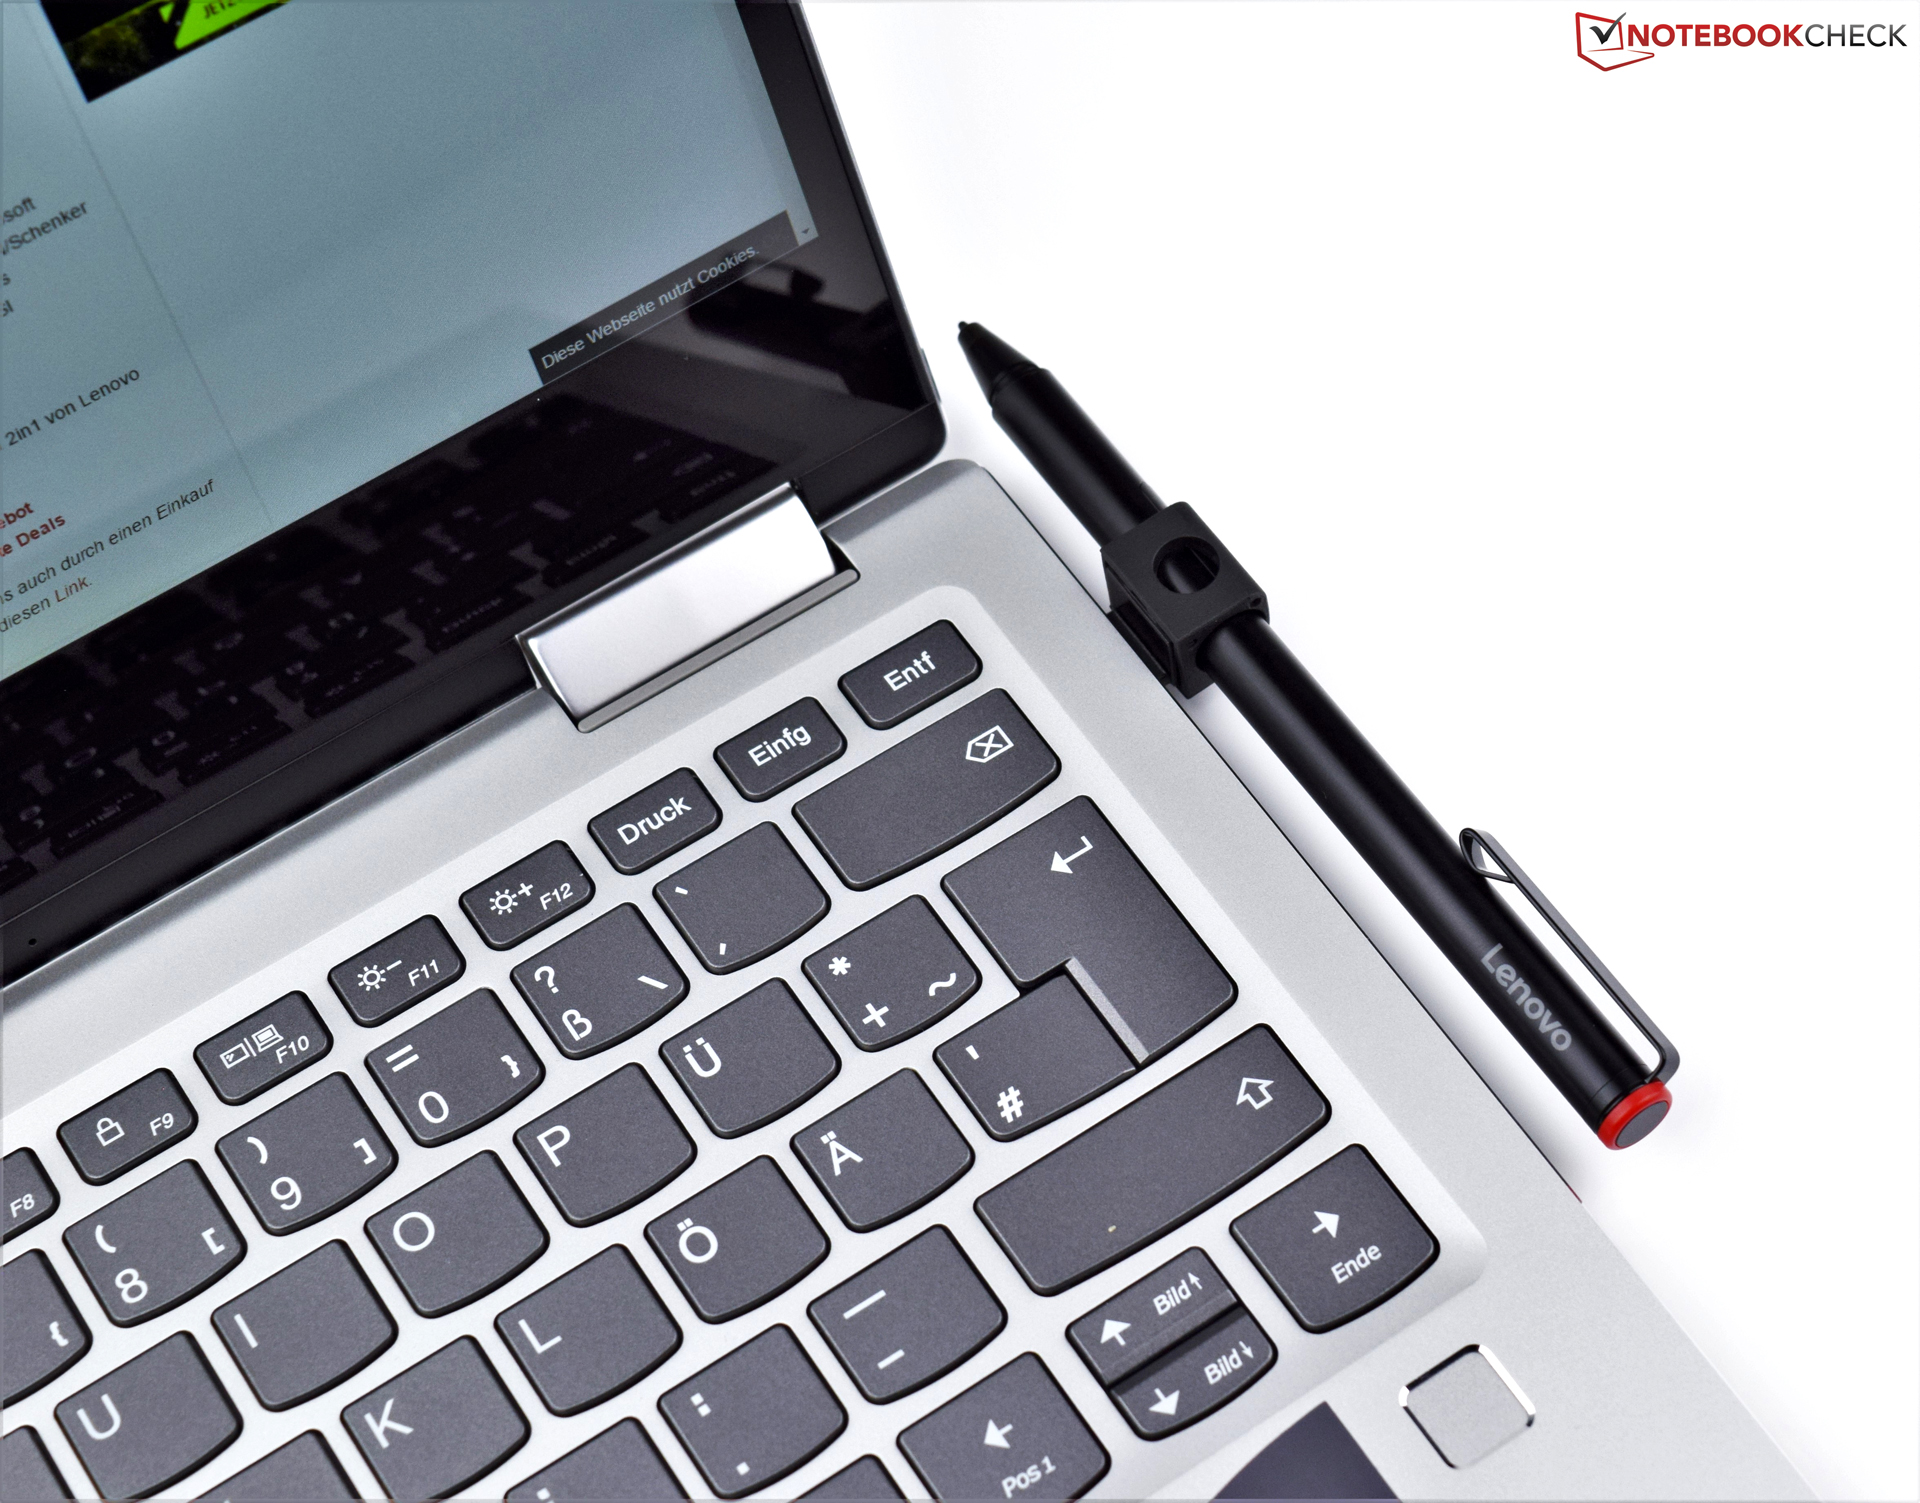
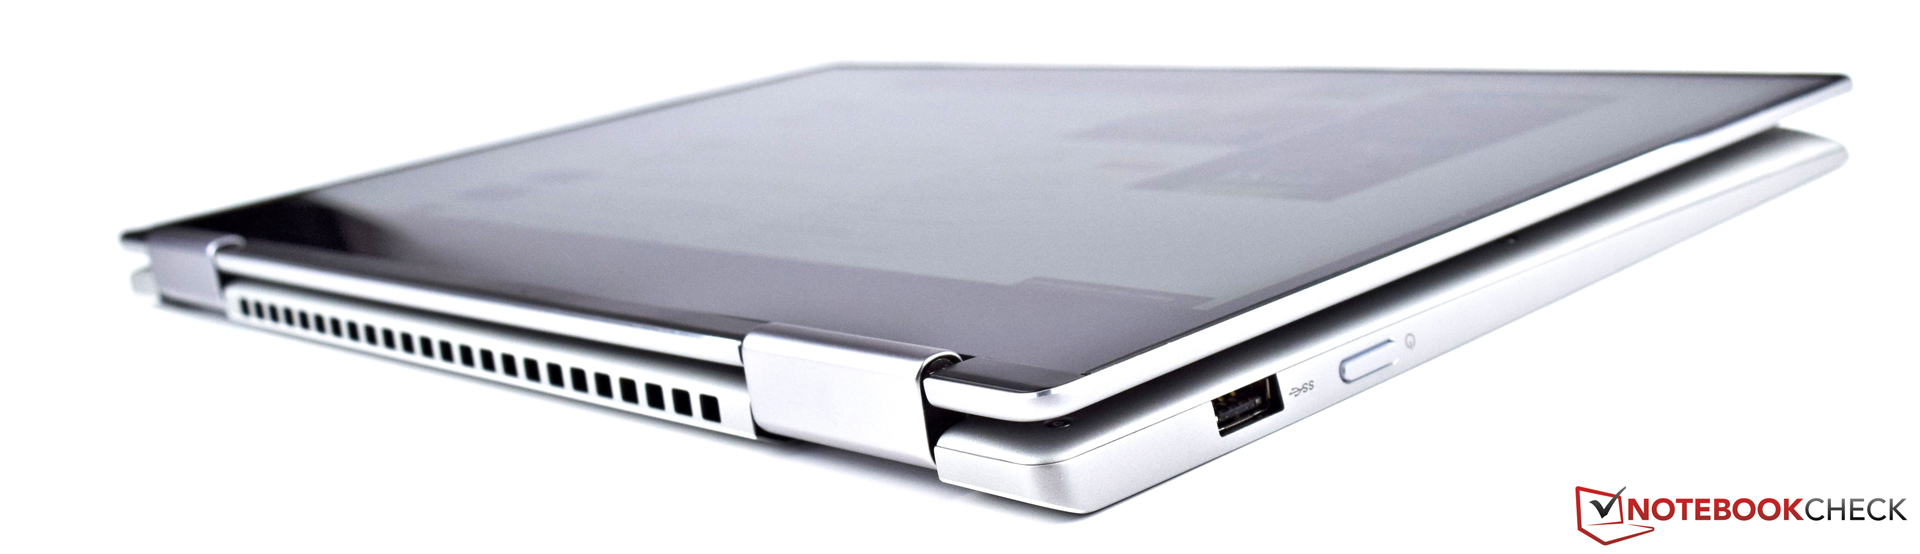
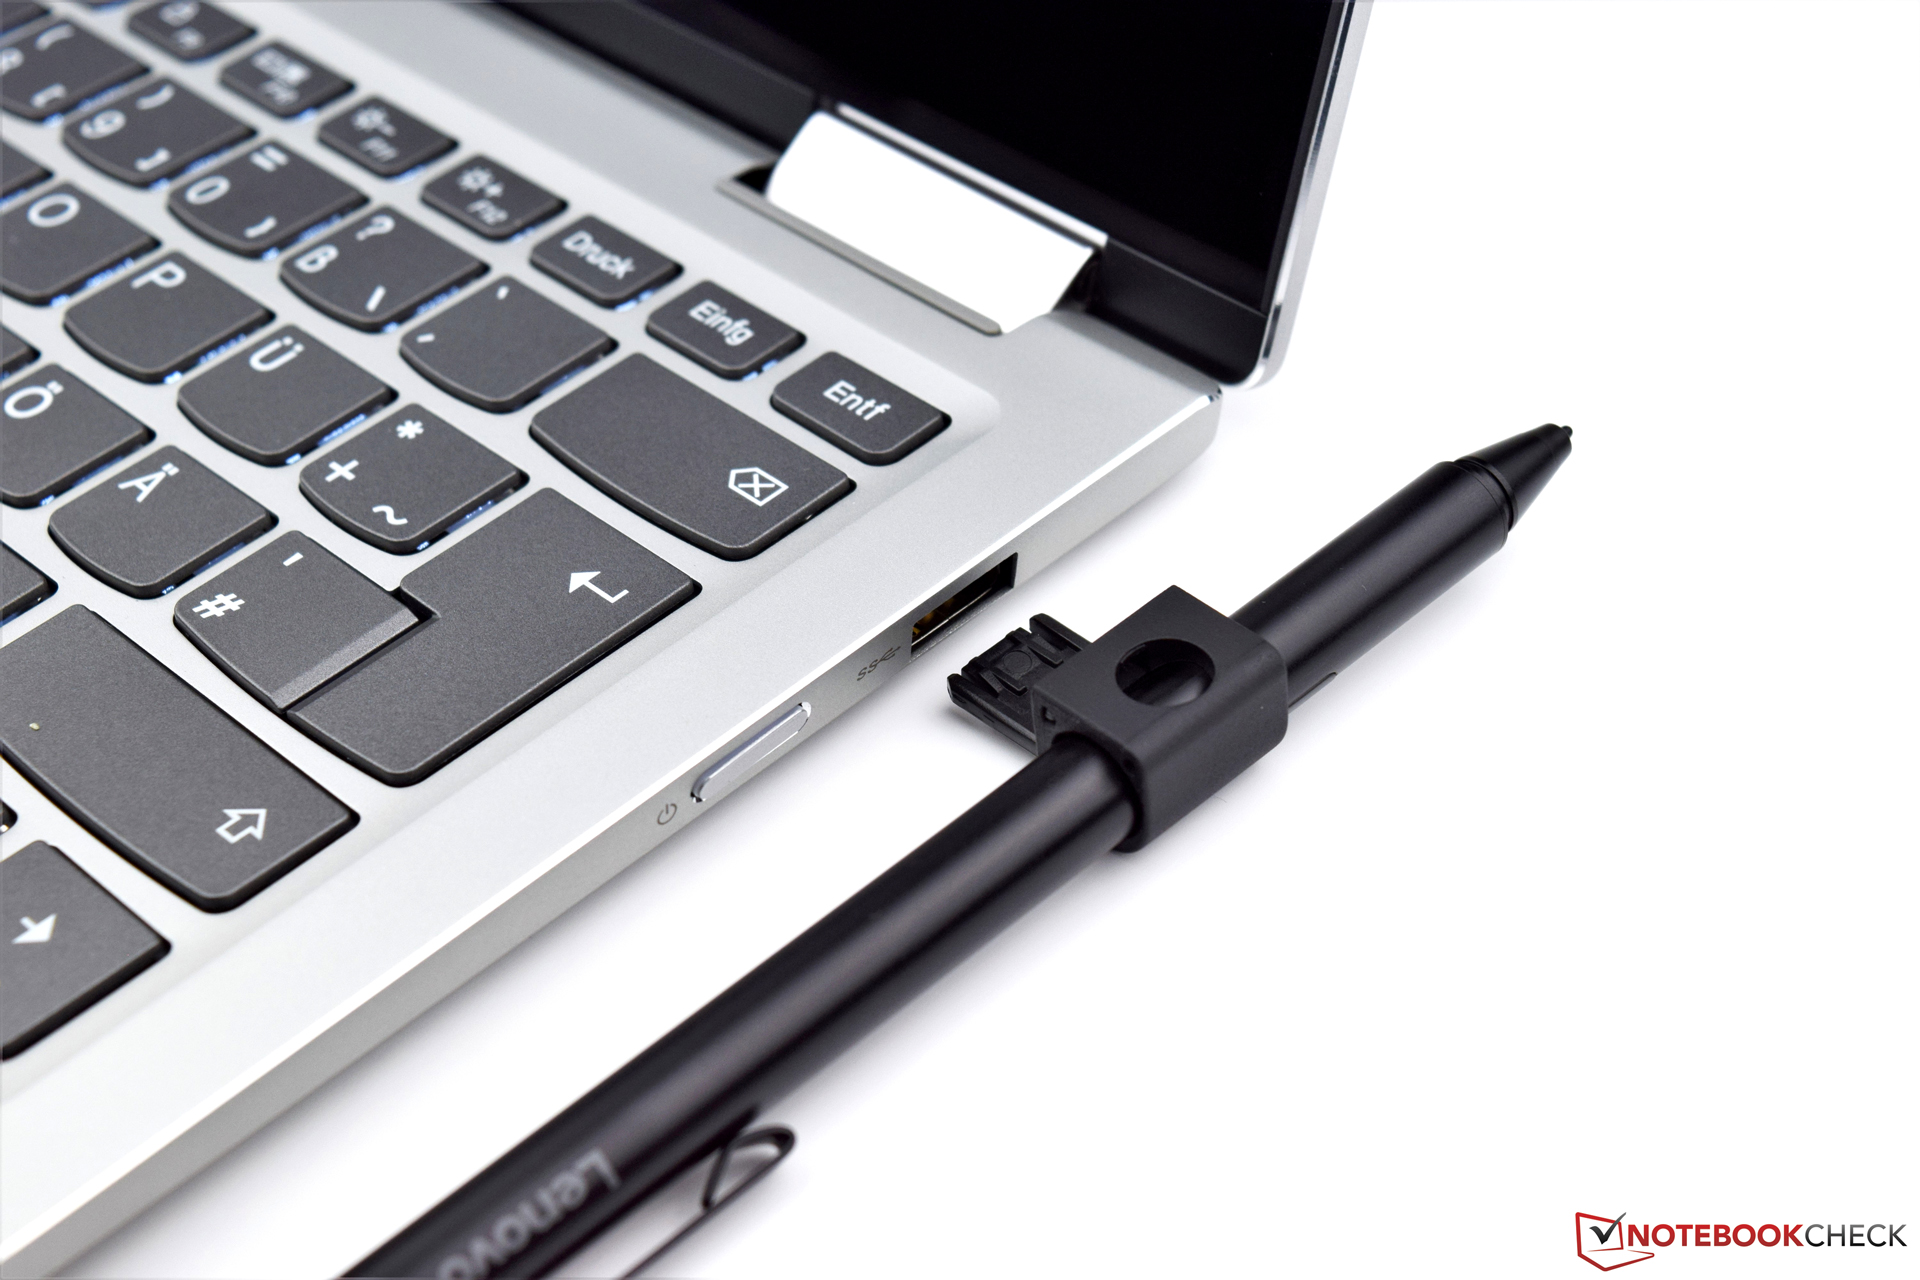
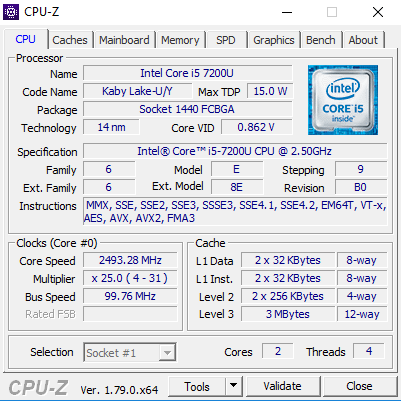
Il Lenovo Yoga 720-13IKB è un convertibile da 13" solido, duraturo e versati, con un peso contenuto, dimensioni ridotte, ed una cerniera a 360°. Si basa sull'attuale generazione Intel Core i5-7200U Kaby Lake, offre 8 GB di RAM, ed è adeguatamente veloce grazie al suo SSD con prestazioni elevate da 256 GB. Unitamente ad un display FHD, l'intero pacchetto può essere acquistato per US $850.
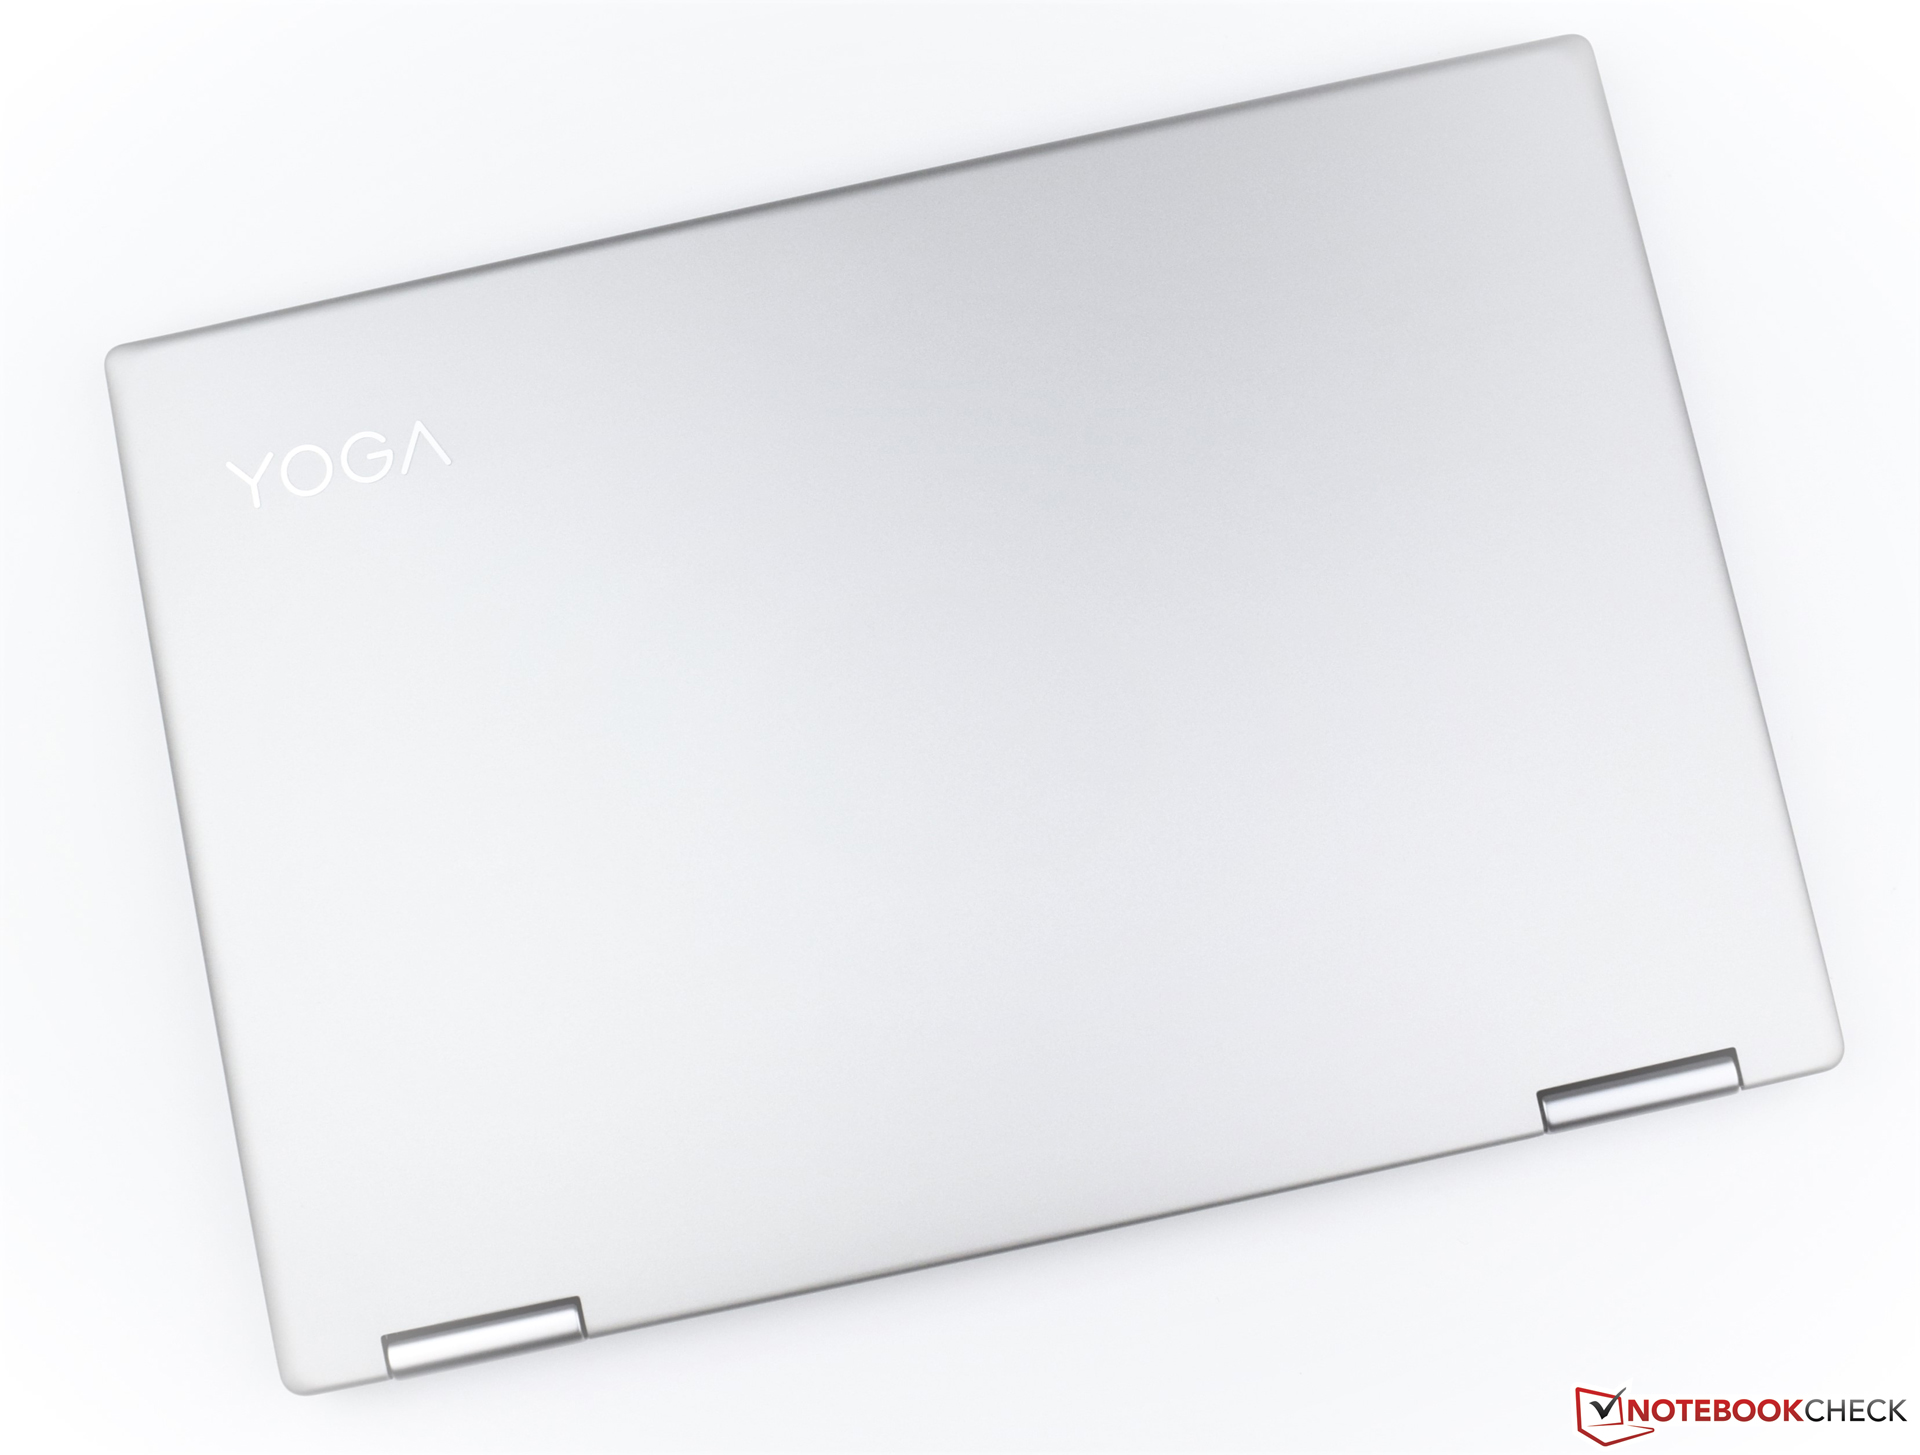
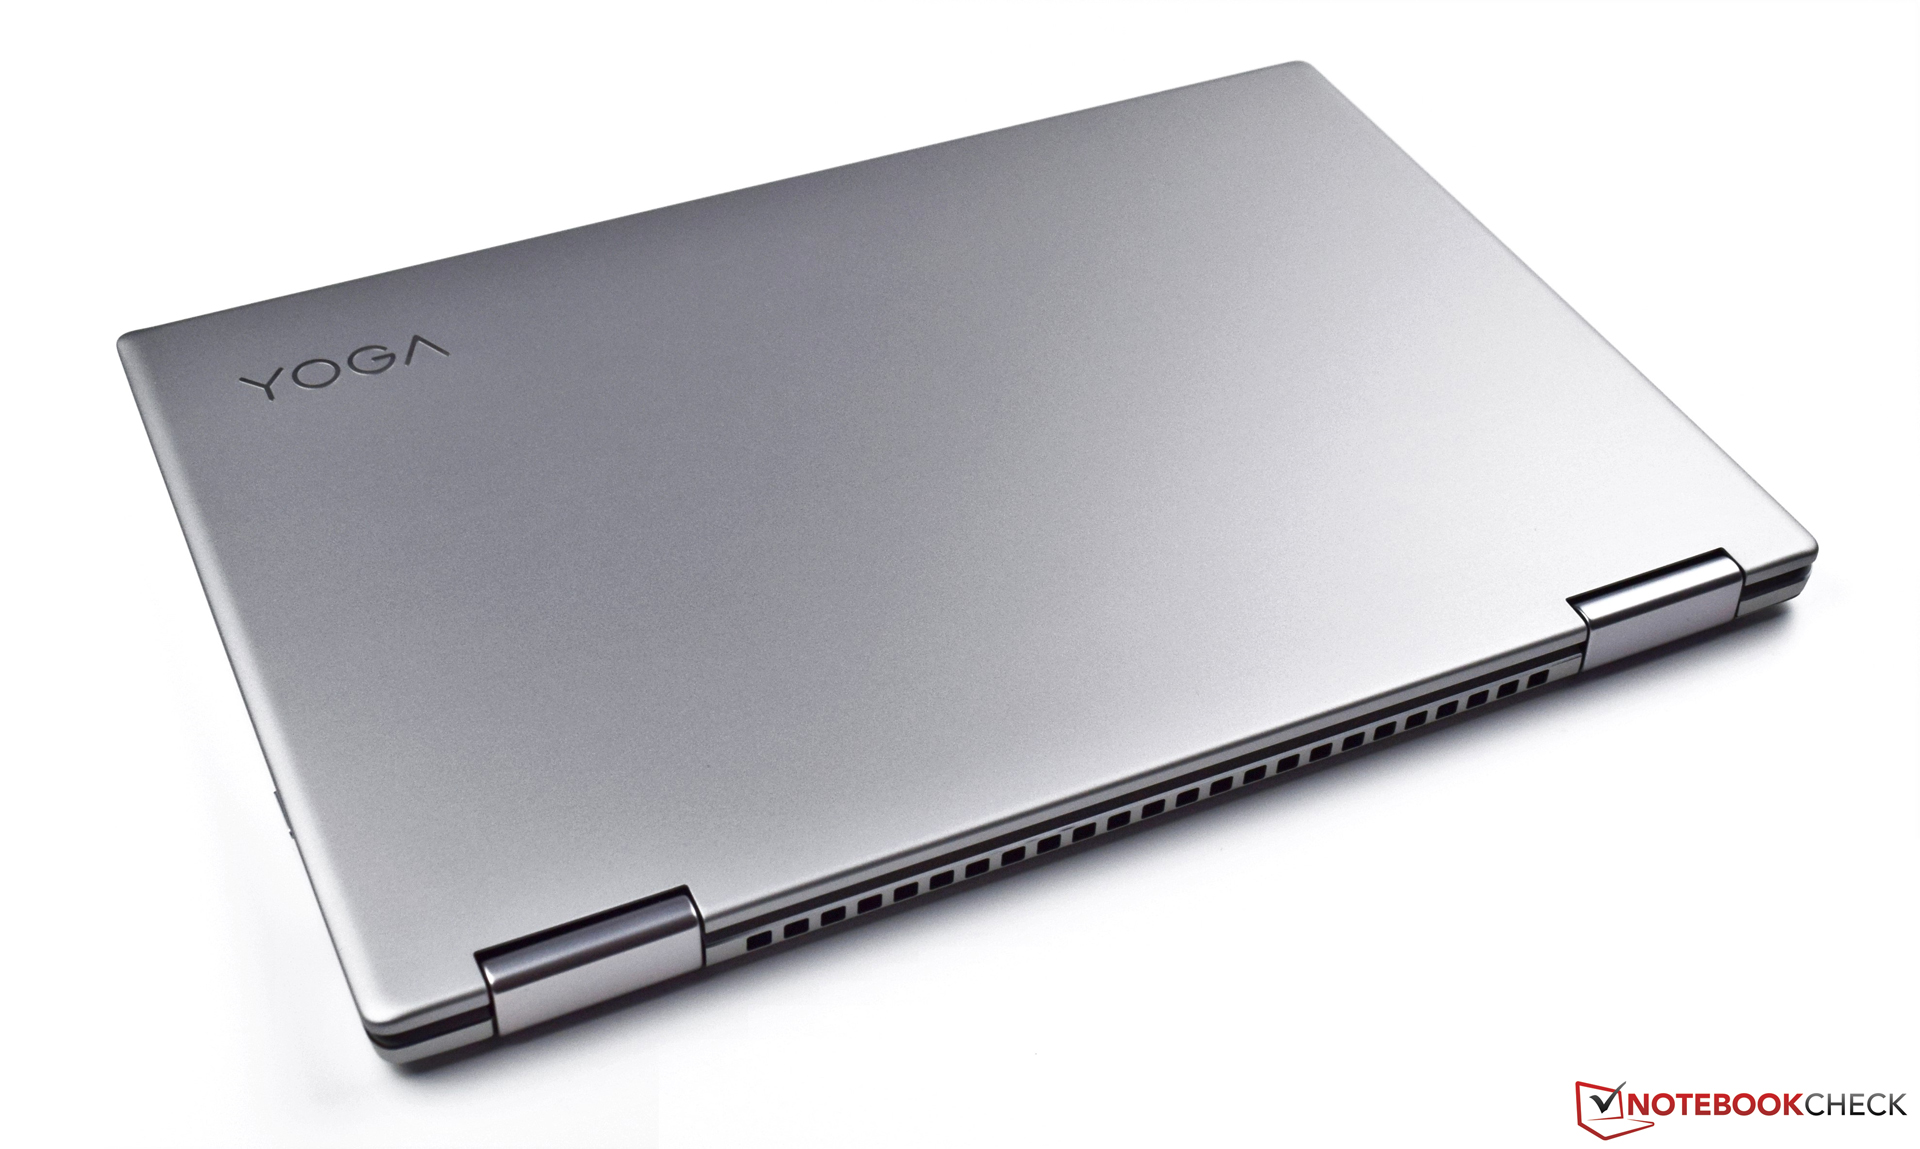
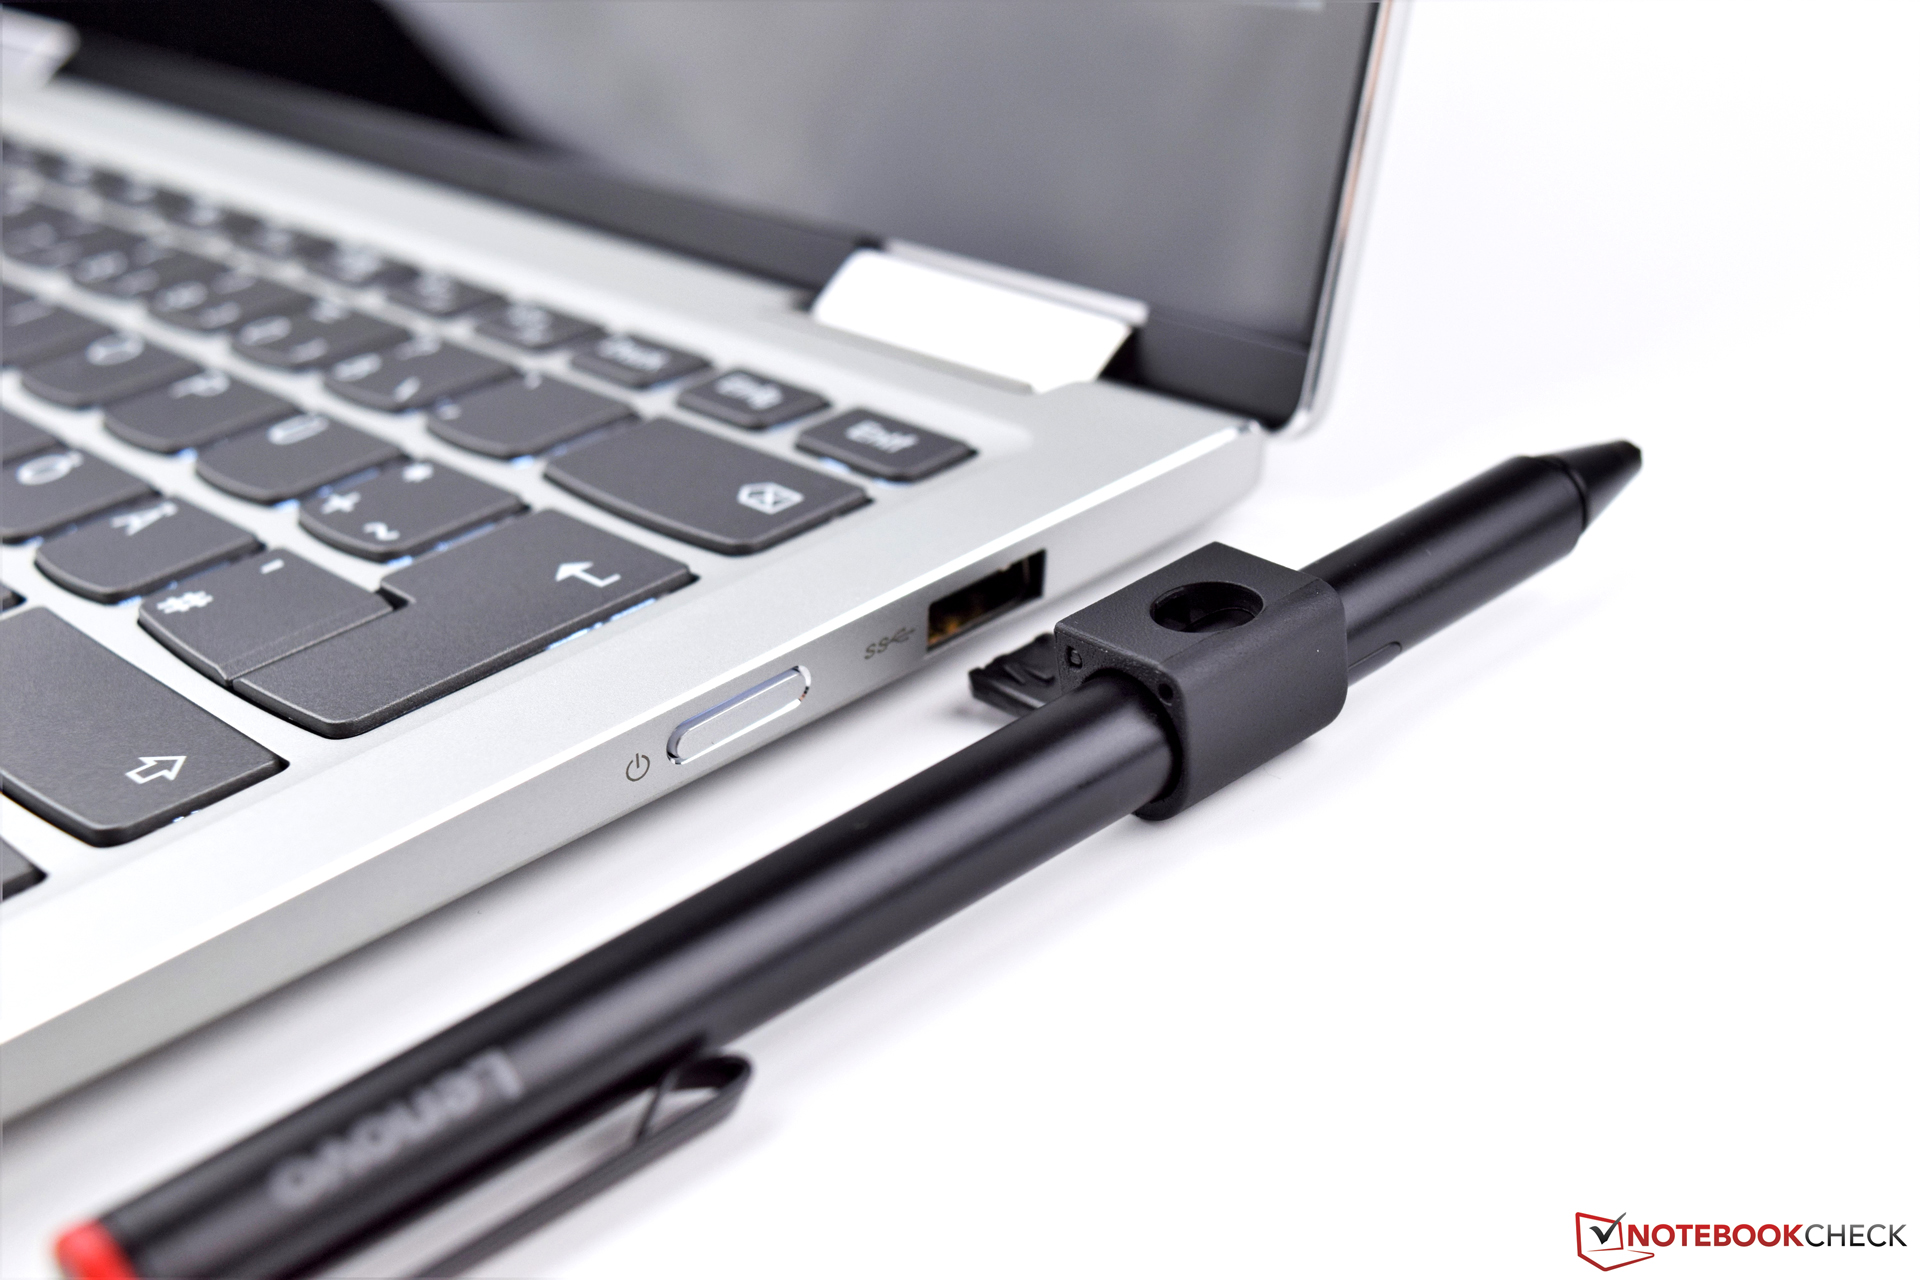
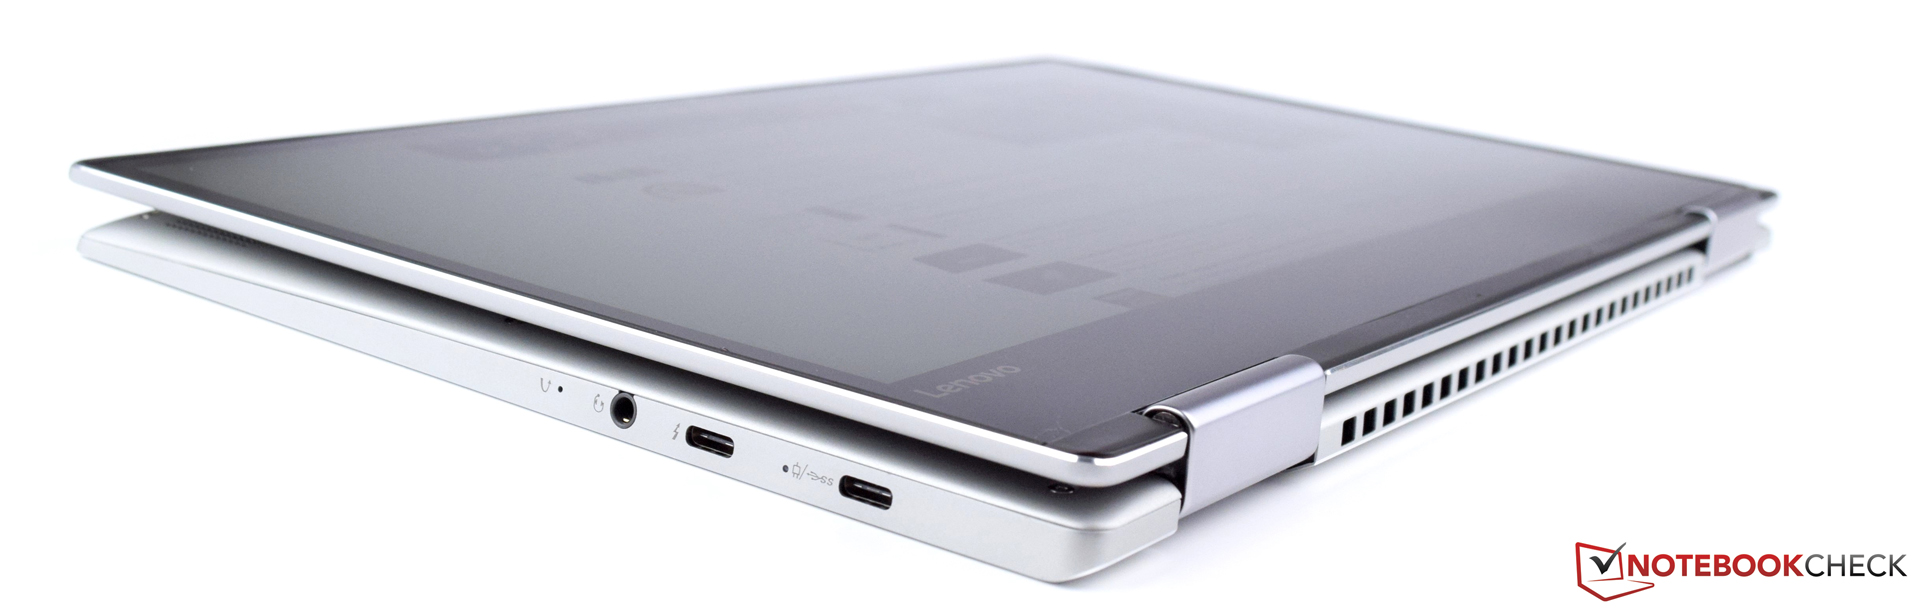
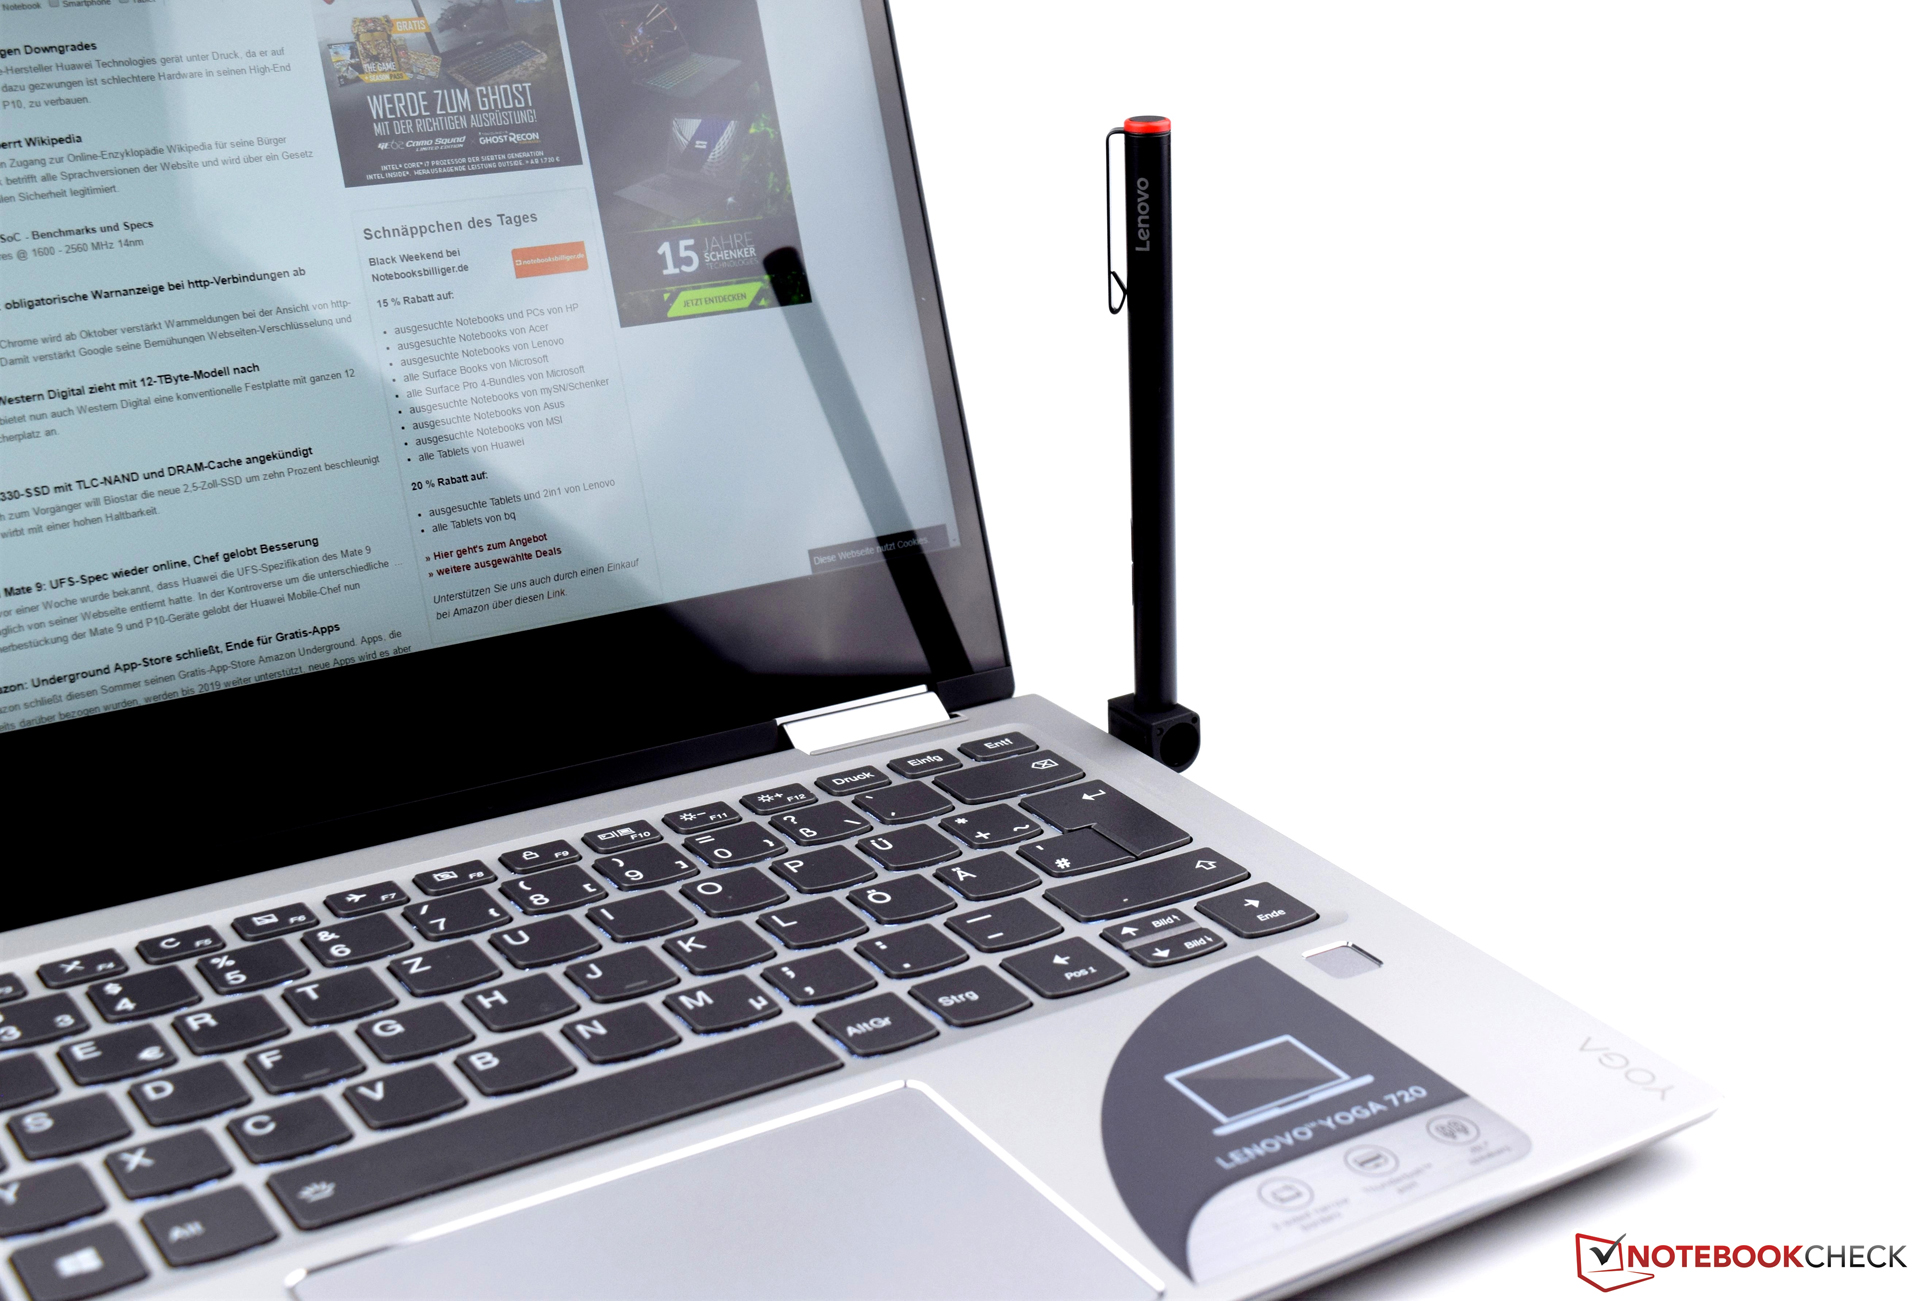
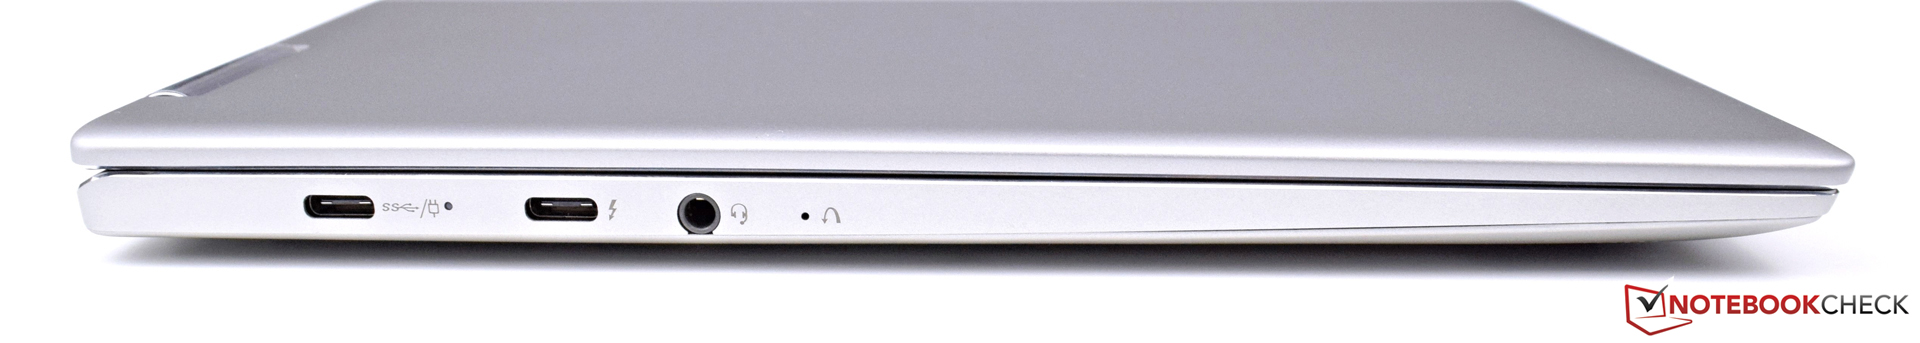
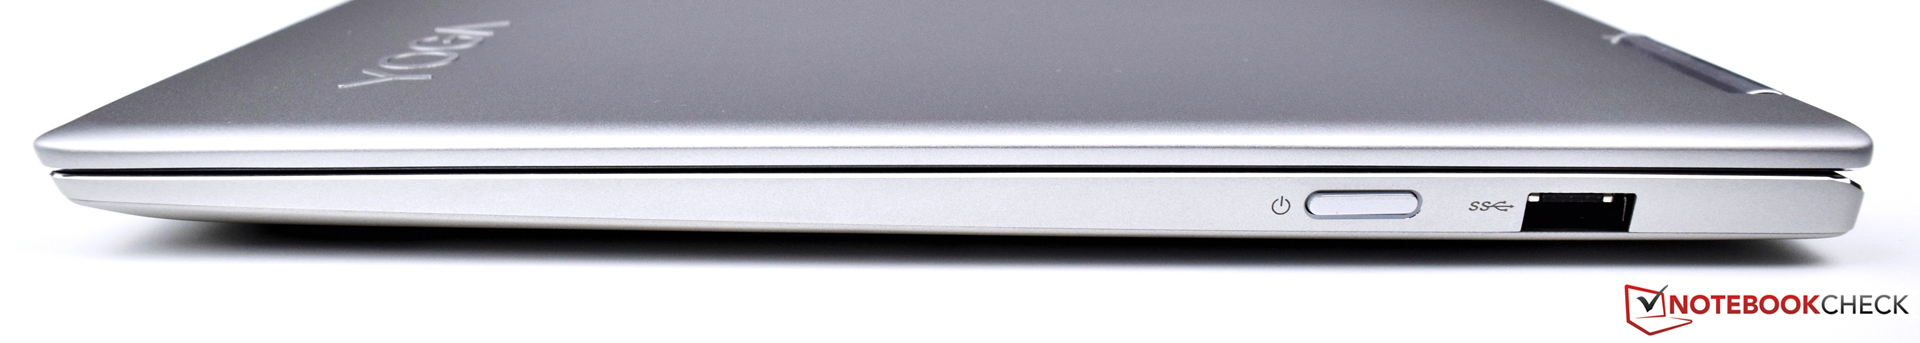
Il design minimalista senza tempo "nulla di più del necessario" e la scelta dei materiali ci ha convinto. Lo Yoga 720-13IKB spunta quasi tutte le caselle giuste ed è chiaramente basato su un approccio provato e riprovato. Cosa che in parte ci delude, infatti avremmo più di tre porte.
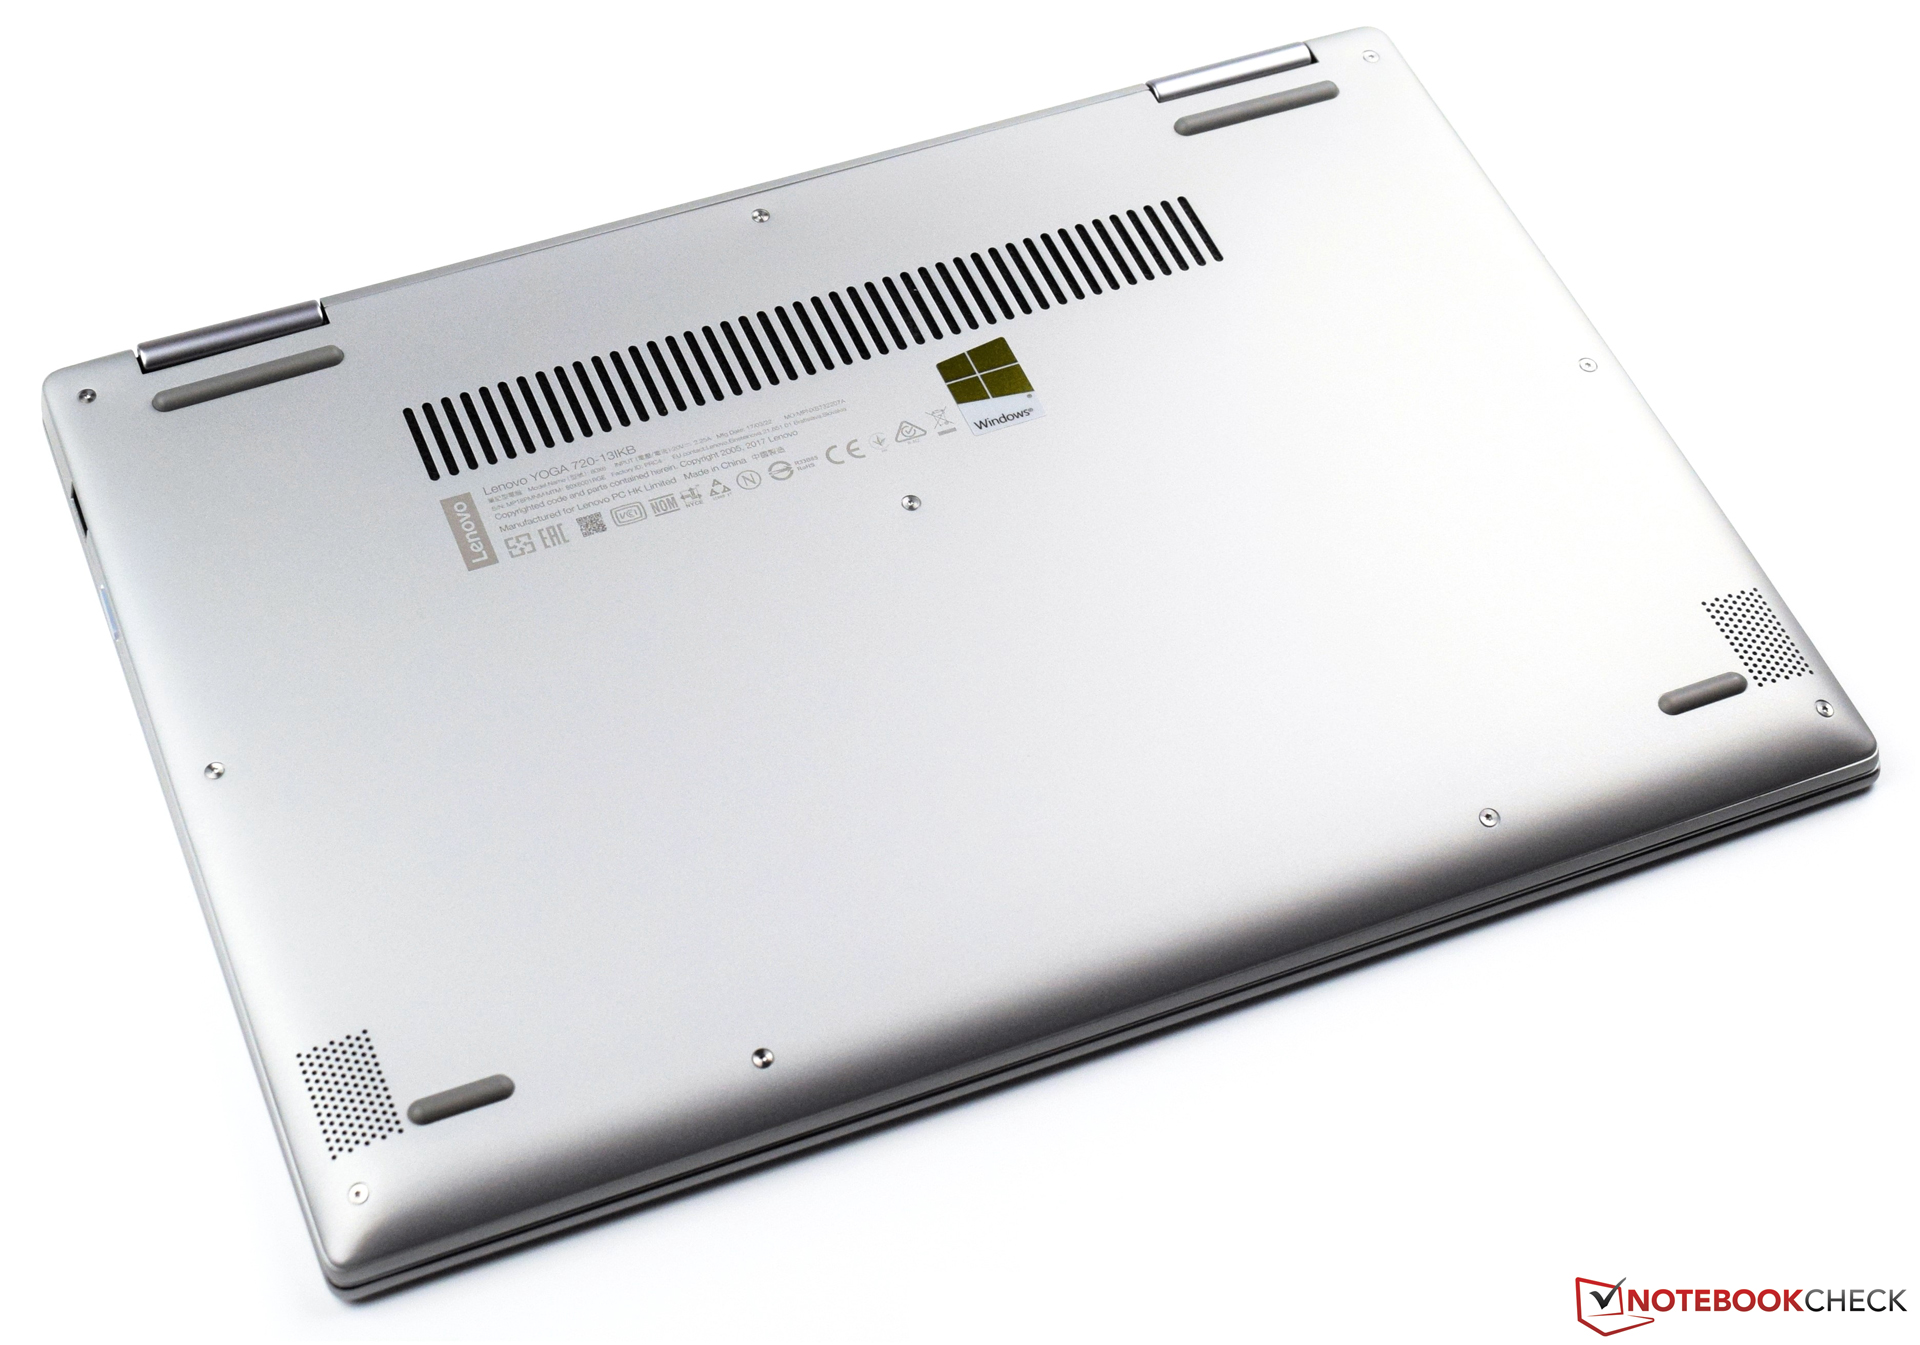
Nel complesso il Lenovo Yoga 720-13IKB ha lasciato un'impressione positiva sebbene non comprendiamo in pieno le ragioni dietro l'assenza del lettore SD. Sembra quasi che Lenovo provi ad imitare l'approccio minimalista Apple “less is more”. In definitiva, il cliente deve decidere se vale la pena o meno accettare questi compromessi. Il nostro modello ha offerto prestazioni solide e costanti, e non abbiamo rilevato seri problemi durante il periodo di utilizzo del portatile. I dispositivi di input sono stati piacevoli da usare, e considerando il tutto il prezzo di US $850 per un portatile moderno è più che giustificato.
Nota: si tratta di una recensione breve, con alcune sezioni non tradotte, per la versione integrale in inglese guardate qui.
Lenovo Yoga 720-13IKB
- 05/08/2017 v6 (old)
Sebastian Bade
Price comparison
