MSI Summit E13 Flip vs. XPS 13 2-in-1: Dare a Dell una corsa per i suoi soldi
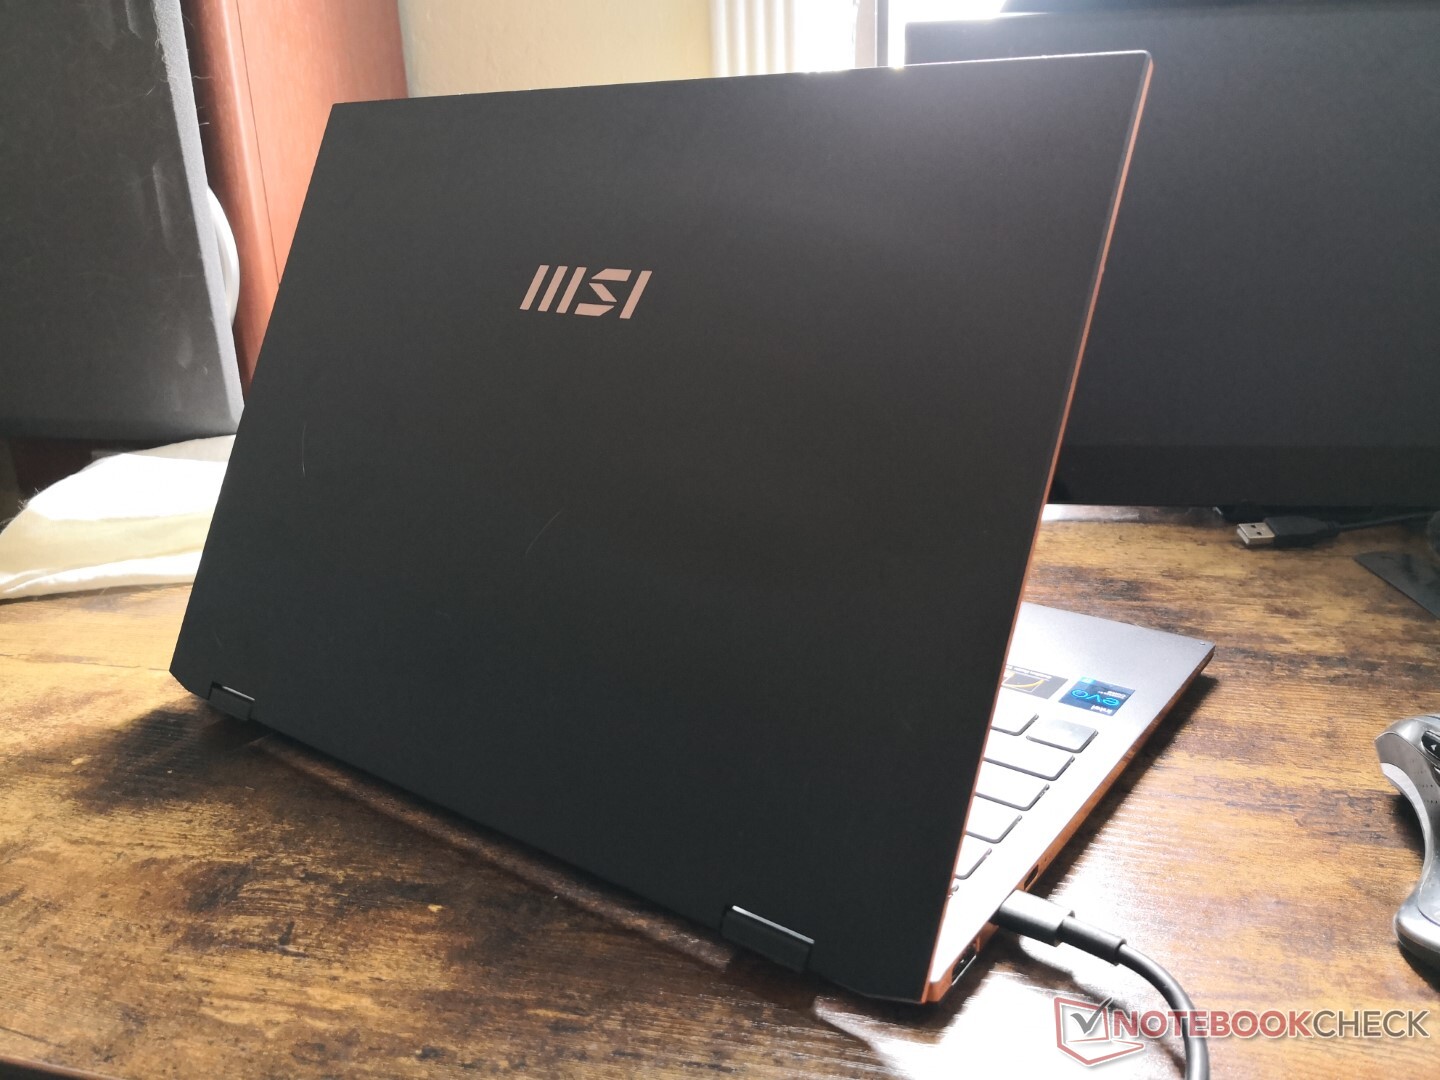
MSI non è più solo un'azienda di giochi. La sua ultima serie Summit è una risposta diretta ai popolari portatili prosumer come Dell XPS, HP Spectre, Asus ZenBook, Huawei MateBook X Pro, e anche il MacBook Air o MacBook Pro. Abbiamo recentemente finito di recensire il convertibile MSI Summit E13 Flip da 13,4 pollici e sta già dimostrando di essere una valida alternativa al venerabile XPS 13 da 13,4 pollici
I nostri grafici e tabelle qui sotto confrontano il Summit E13 Flip con l'XPS 13 7390 2-in-1 dell'anno scorso per mostrare i vantaggi e gli svantaggi di ciascuno. Ci sarebbe piaciuto confrontare il più recente Tiger Lake XPS 13 9310 2-in-1 invece, ma Dell dice che non è stata in grado di inviarci un'unità per i test e così abbiamo dovuto usare il suo vecchio modello Ice Lake come la cosa migliore successiva. L'XPS 13 7390 2-in-1 e il 9310 2-in-1 sono altrimenti identici
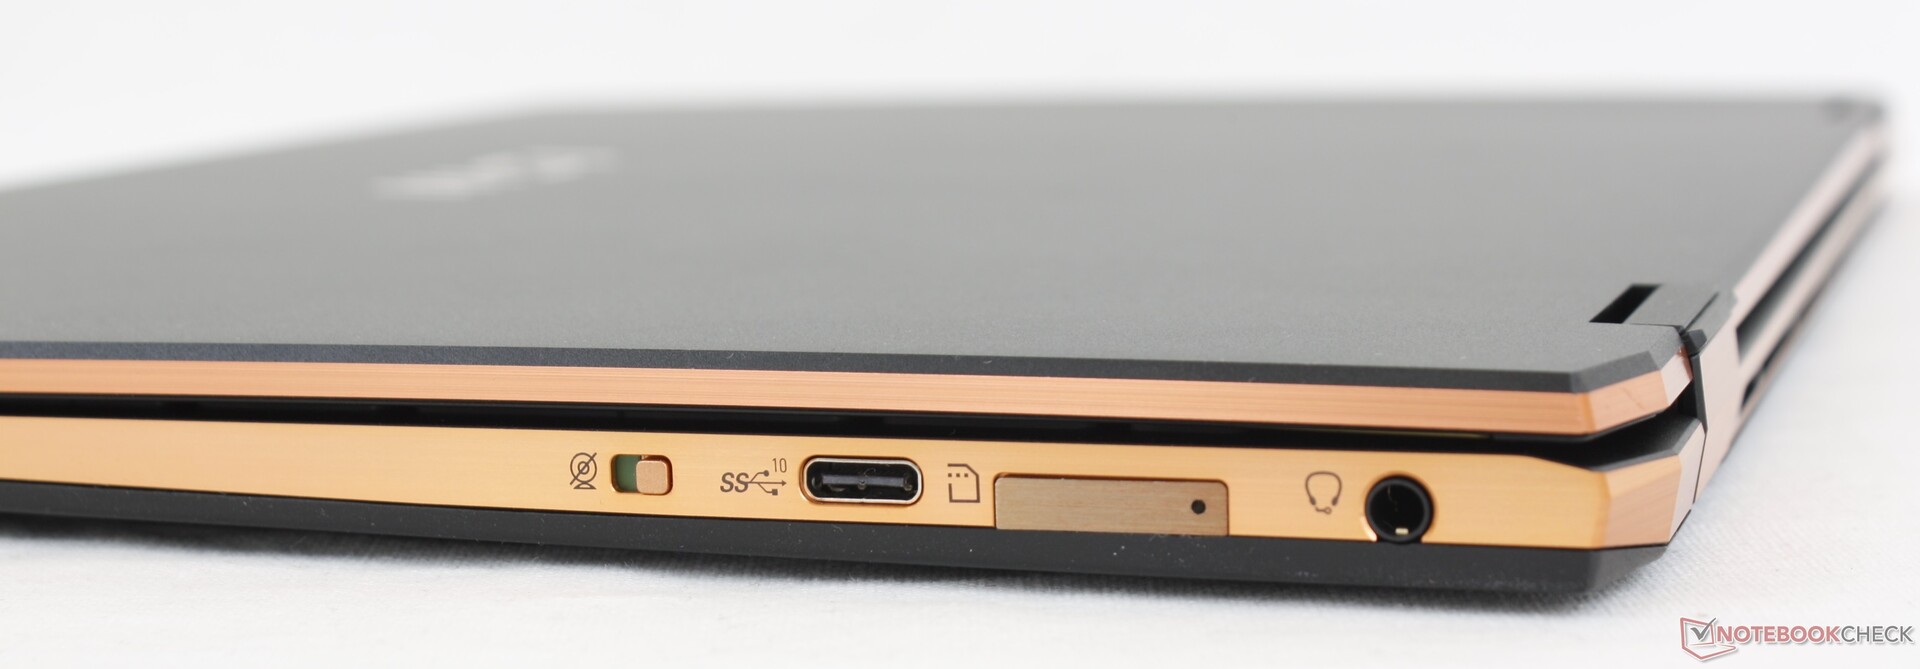
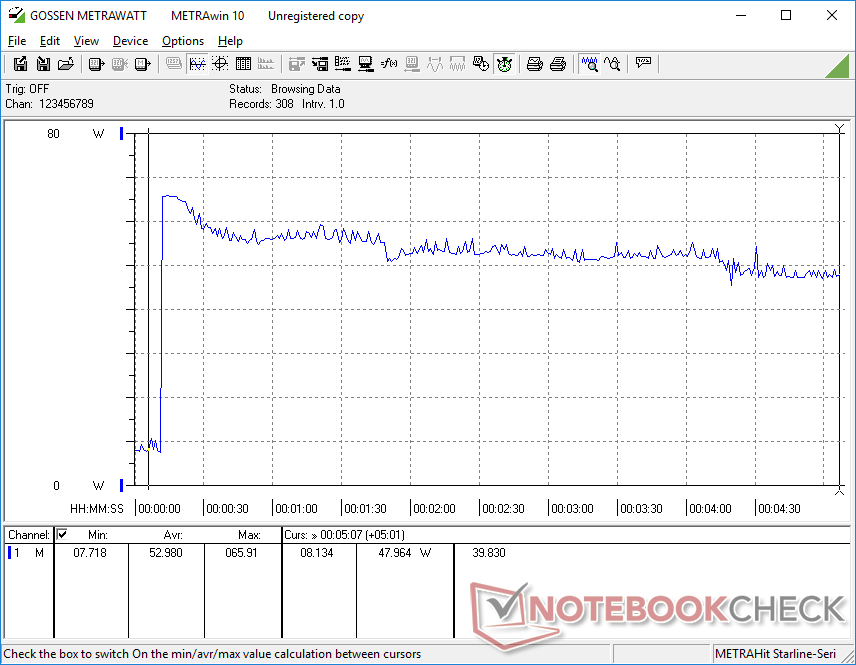
I più grandi vantaggi del sistema MSI sono la sua frequenza di aggiornamento del display di 120 Hz, le prestazioni maggiori e più consistenti, lo slot PCIe 4.0 M.2, e la batteria più grande per una maggiore autonomia. La frequenza di aggiornamento più alta in particolare aggiunge significativamente all'esperienza dell'utente in quanto aumenta la reattività soprattutto quando si utilizza uno stilo
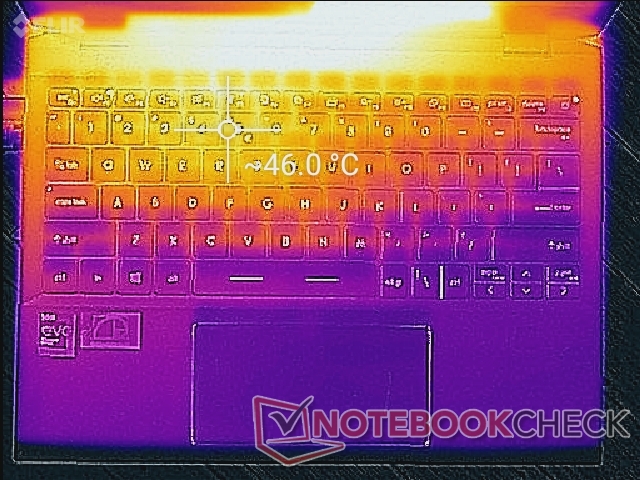
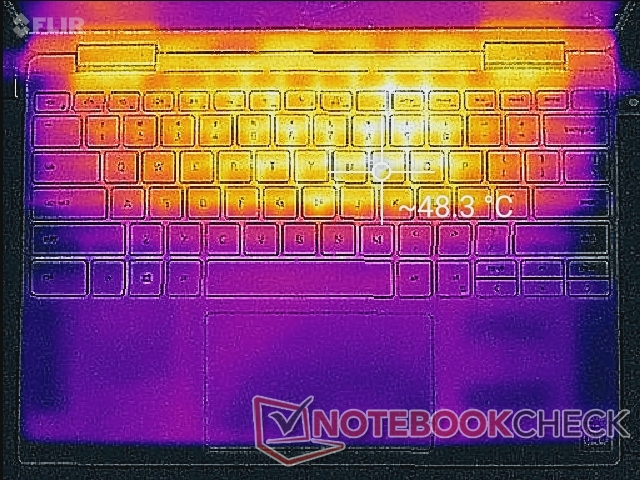
Gli svantaggi dell'MSI sono probabilmente altrettanto considerevoli. In particolare, è leggermente più pesante e più grande dell'alternativa Dell, il che significa che le sue prestazioni più elevate, i tempi di esecuzione più lunghi e le opzioni delle porte più grandi non sono gratis. Le sue ventole tendono ad essere più evidenti anche perché cambiano più frequentemente gli RPM quando si eseguono carichi più elevati
Non possiamo dichiarare che un sistema sia oggettivamente migliore dell'altro poiché hanno i loro pro e contro. Se non vi dispiace un sistema leggermente più grande per il suo display superiore, le opzioni delle porte, la durata della batteria e le prestazioni, per esempio, allora la circonferenza extra e il rumore dell'MSI potrebbero valere la pena rispetto al Dell. Vedi le nostre recensioni sul MSI Summit E13 Flip e Dell XPS 13 7390 2-in-1 per saperne di più su ogni sistema.
| MSI Summit E13 Flip Evo | Dell XPS 13 7390 2-in-1 | |
|---|---|---|
| CPU/GPU | Core i7-1185G7 di 11a generazione Iris Xe | Core i7-1065G7 di decima generazione Iris Plus G7 |
| Touchscreen | 13.4 pollici, 16:10, 1920 x 1200 120 Hz di frequenza di aggiornamento | 13.4 pollici, 16:10, 1920 x 1200 |
RAM | 32 GB LPDDR4X 2133 MHz | 16 GB LPDDR4 1866 MHz |
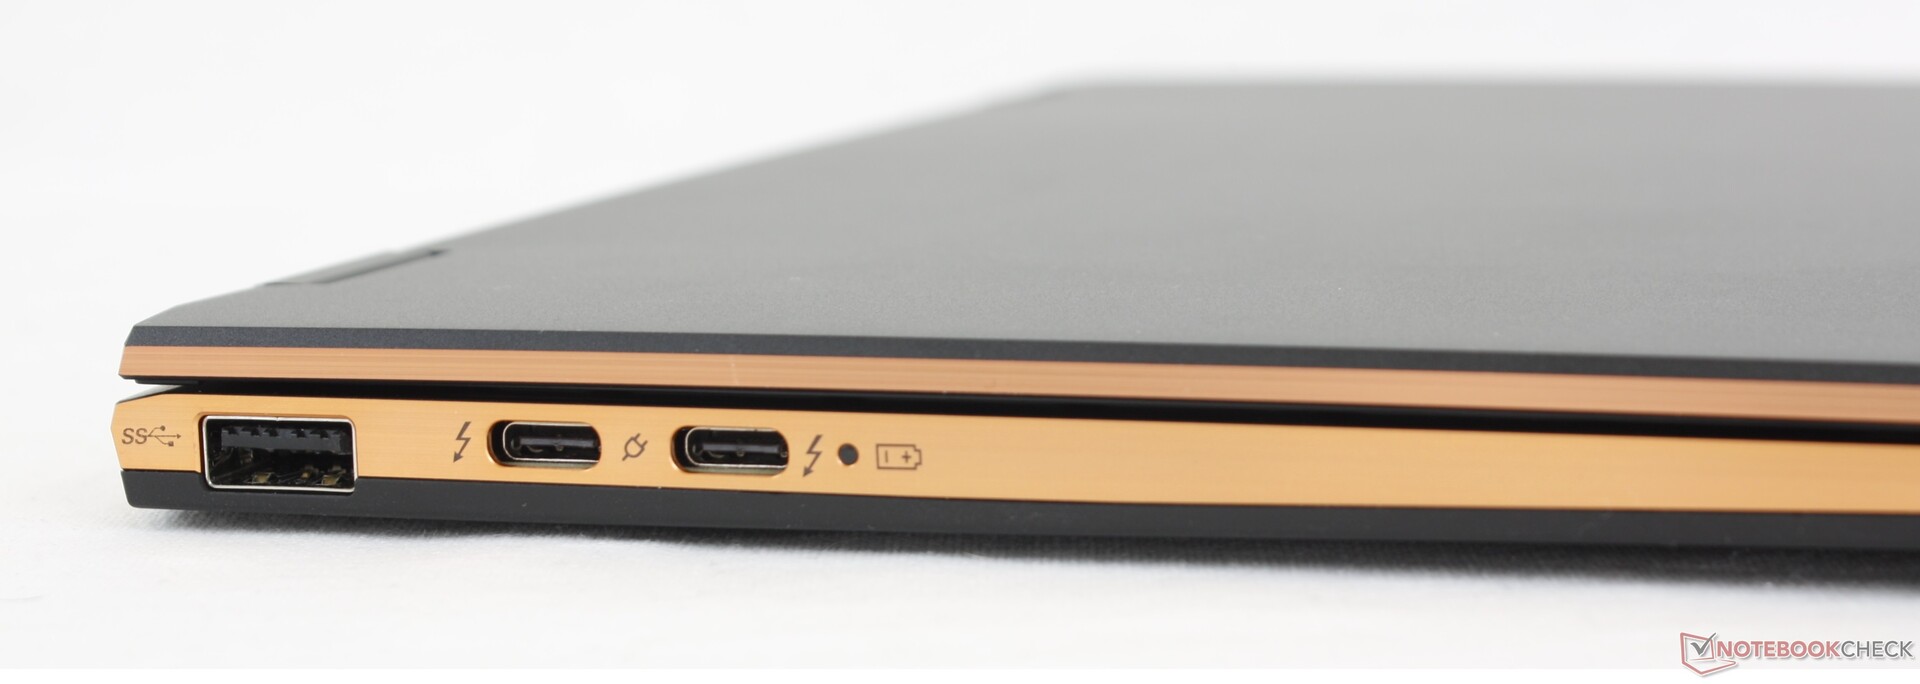
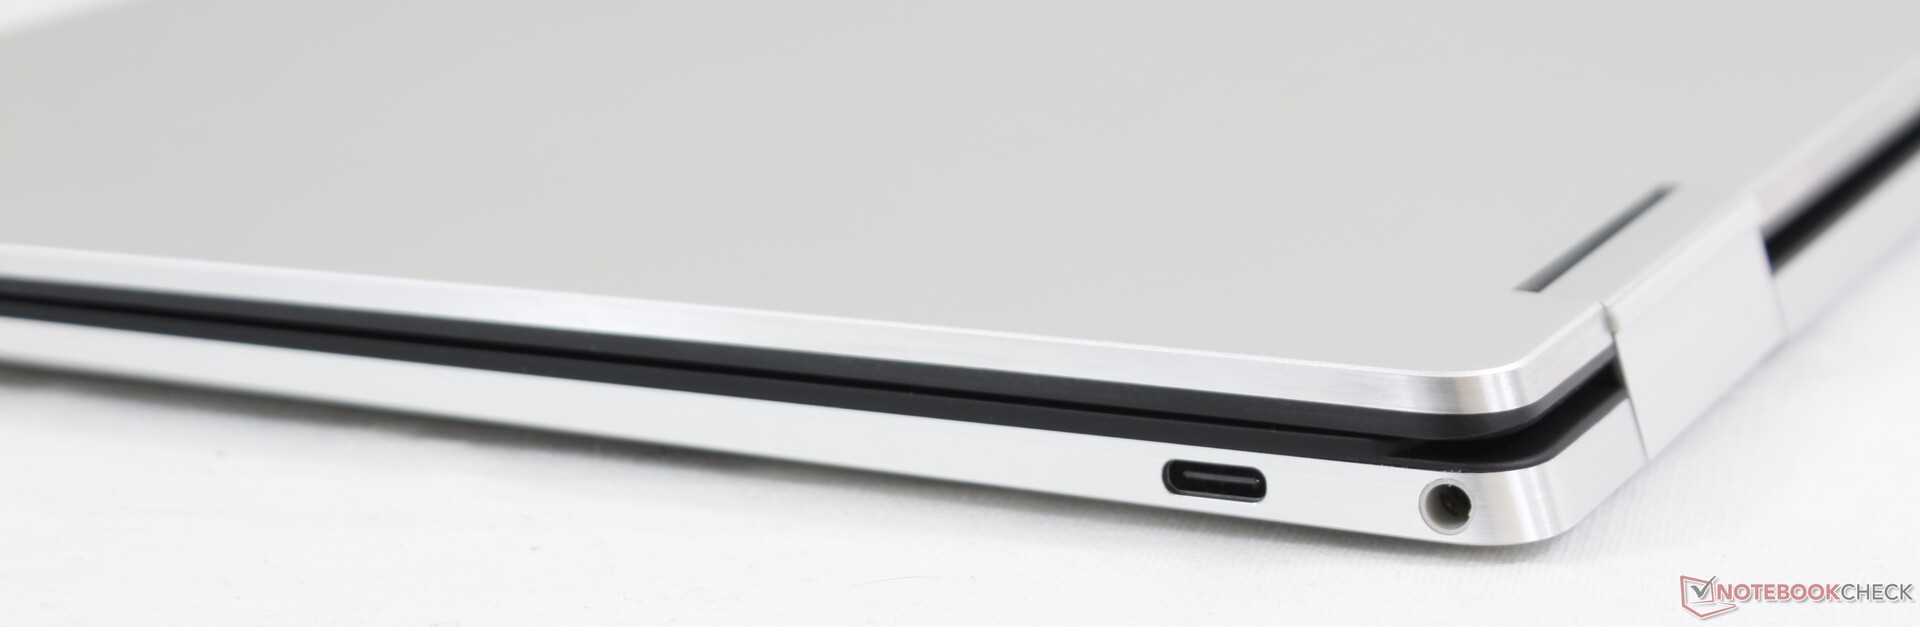
| Porte | 3x USB-C (2x Thunderbolt 4 + DisplayPort + Power Delivery) 1x USB-A 1x 3.5 mm combo audio Lettore MicroSD | 2x USB-C (2x Thunderbolt 3 + DisplayPort + Power Delivery) 1x 3.5 mm combo audio Lettore MicroSD |
| MSI Summit E13 Flip Evo A11MT Sharp LQ134N1JW53, IPS, 13.4", 1920x1200 | Dell XPS 13 7390 2-in-1 Core i7 Sharp LQ134N1, IPS, 13.4", 1920x1200 | |
|---|---|---|
| Display | 0% | |
| Display P3 Coverage (%) | 69.8 | 69.9 0% |
| sRGB Coverage (%) | 98.8 | 99.2 0% |
| AdobeRGB 1998 Coverage (%) | 70.6 | 71.5 1% |
| Response Times | 30% | |
| Response Time Grey 50% / Grey 80% * (ms) | 64 ? | 47.6 ? 26% |
| Response Time Black / White * (ms) | 44 ? | 29.2 ? 34% |
| PWM Frequency (Hz) | 2500 ? | |
| Screen | -15% | |
| Brightness middle (cd/m²) | 551.3 | 549.8 0% |
| Brightness (cd/m²) | 517 | 520 1% |
| Brightness Distribution (%) | 91 | 86 -5% |
| Black Level * (cd/m²) | 0.37 | 0.39 -5% |
| Contrast (:1) | 1490 | 1410 -5% |
| Colorchecker dE 2000 * | 1.45 | 2.12 -46% |
| Colorchecker dE 2000 max. * | 2.86 | 3.66 -28% |
| Colorchecker dE 2000 calibrated * | 1.7 | 1.37 19% |
| Greyscale dE 2000 * | 1.3 | 2.6 -100% |
| Gamma | 2.14 103% | 2.3 96% |
| CCT | 6580 99% | 6884 94% |
| Color Space (Percent of AdobeRGB 1998) (%) | 65 | 65.4 1% |
| Color Space (Percent of sRGB) (%) | 99 | 99.7 1% |
| Media totale (Programma / Settaggio) | 5% /
-7% |
* ... Meglio usare valori piccoli
Cinebench R23: Multi Core | Single Core
Cinebench R15: CPU Single 64Bit | CPU Multi 64Bit
Blender: v2.79 BMW27 CPU
7-Zip 18.03: 7z b 4 -mmt1 | 7z b 4
Geekbench 5.5: Single-Core | Multi-Core
HWBOT x265 Benchmark v2.2: 4k Preset
LibreOffice : 20 Documents To PDF
R Benchmark 2.5: Overall mean
| Cinebench R20 / CPU (Multi Core) | |
| MSI Summit E13 Flip Evo A11MT | |
| Dell XPS 13 7390 2-in-1 Core i7 | |
| Cinebench R20 / CPU (Single Core) | |
| MSI Summit E13 Flip Evo A11MT | |
| Dell XPS 13 7390 2-in-1 Core i7 | |
| Cinebench R23 / Multi Core | |
| MSI Summit E13 Flip Evo A11MT | |
| Cinebench R23 / Single Core | |
| MSI Summit E13 Flip Evo A11MT | |
| Cinebench R15 / CPU Single 64Bit | |
| MSI Summit E13 Flip Evo A11MT | |
| Dell XPS 13 7390 2-in-1 Core i7 | |
| Cinebench R15 / CPU Multi 64Bit | |
| MSI Summit E13 Flip Evo A11MT | |
| Dell XPS 13 7390 2-in-1 Core i7 | |
| Blender / v2.79 BMW27 CPU | |
| Dell XPS 13 7390 2-in-1 Core i7 | |
| MSI Summit E13 Flip Evo A11MT | |
| 7-Zip 18.03 / 7z b 4 -mmt1 | |
| MSI Summit E13 Flip Evo A11MT | |
| Dell XPS 13 7390 2-in-1 Core i7 | |
| 7-Zip 18.03 / 7z b 4 | |
| MSI Summit E13 Flip Evo A11MT | |
| Dell XPS 13 7390 2-in-1 Core i7 | |
| Geekbench 5.5 / Single-Core | |
| MSI Summit E13 Flip Evo A11MT | |
| Geekbench 5.5 / Multi-Core | |
| MSI Summit E13 Flip Evo A11MT | |
| HWBOT x265 Benchmark v2.2 / 4k Preset | |
| MSI Summit E13 Flip Evo A11MT | |
| Dell XPS 13 7390 2-in-1 Core i7 | |
| LibreOffice / 20 Documents To PDF | |
| MSI Summit E13 Flip Evo A11MT | |
| R Benchmark 2.5 / Overall mean | |
| MSI Summit E13 Flip Evo A11MT | |
* ... Meglio usare valori piccoli
| PCMark 10 | |
| Score | |
| MSI Summit E13 Flip Evo A11MT | |
| Dell XPS 13 7390 2-in-1 Core i7 | |
| Essentials | |
| Dell XPS 13 7390 2-in-1 Core i7 | |
| MSI Summit E13 Flip Evo A11MT | |
| Productivity | |
| Dell XPS 13 7390 2-in-1 Core i7 | |
| MSI Summit E13 Flip Evo A11MT | |
| Digital Content Creation | |
| MSI Summit E13 Flip Evo A11MT | |
| Dell XPS 13 7390 2-in-1 Core i7 | |
| 3DMark | |
| 1920x1080 Fire Strike Graphics | |
| MSI Summit E13 Flip Evo A11MT | |
| Dell XPS 13 9310 Core i7 4K | |
| Dell XPS 13 7390 2-in-1 Core i7 | |
| 2560x1440 Time Spy Graphics | |
| MSI Summit E13 Flip Evo A11MT | |
| Dell XPS 13 9310 Core i7 4K | |
| Dell XPS 13 7390 2-in-1 Core i7 | |
| 2560x1440 Time Spy Score | |
| MSI Summit E13 Flip Evo A11MT | |
| Dell XPS 13 9310 Core i7 4K | |
| Dell XPS 13 7390 2-in-1 Core i7 | |
| 3DMark 11 | |
| 1280x720 Performance GPU | |
| MSI Summit E13 Flip Evo A11MT | |
| Dell XPS 13 9310 Core i7 4K | |
| Dell XPS 13 7390 2-in-1 Core i7 | |
| 1280x720 Performance Combined | |
| MSI Summit E13 Flip Evo A11MT | |
| Dell XPS 13 9310 Core i7 4K | |
| Dell XPS 13 7390 2-in-1 Core i7 | |
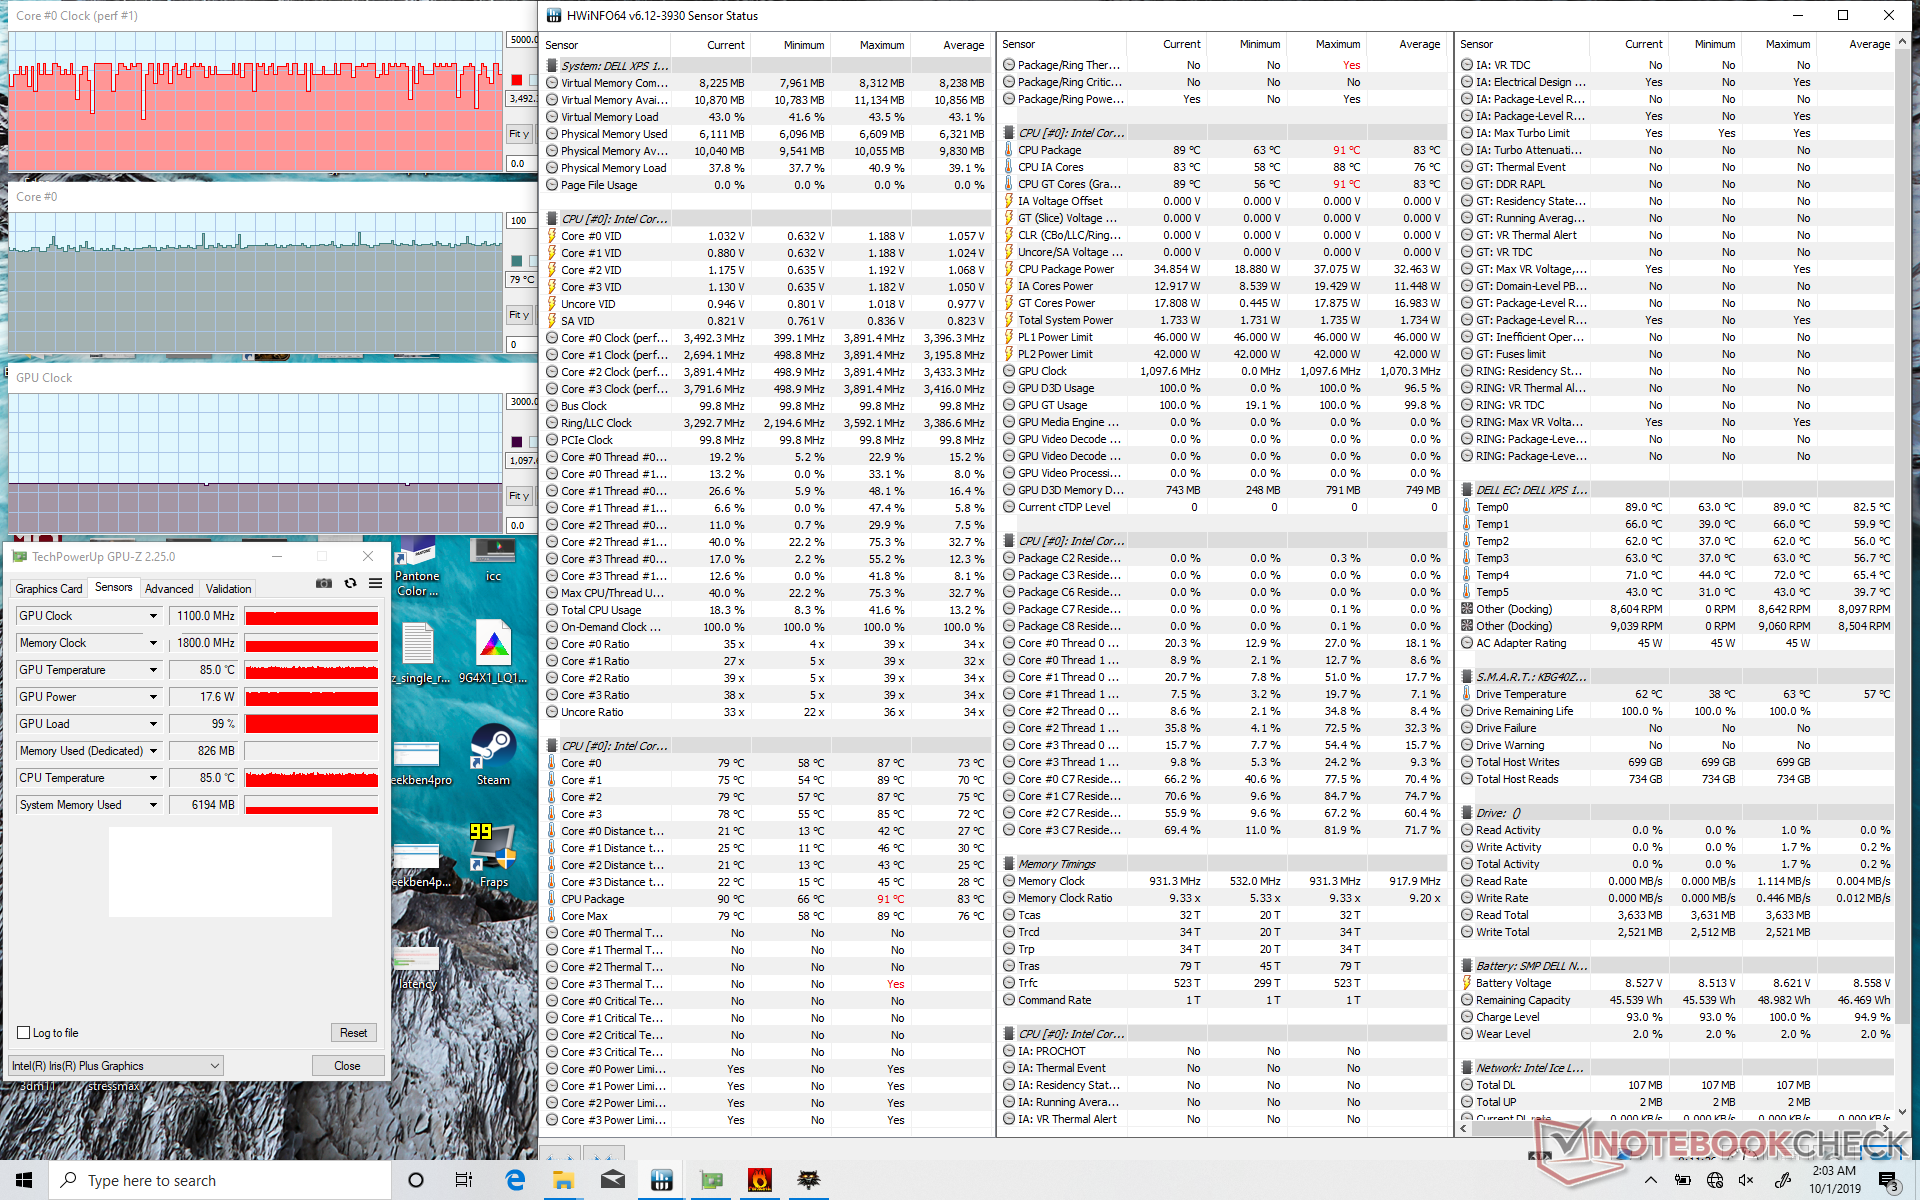
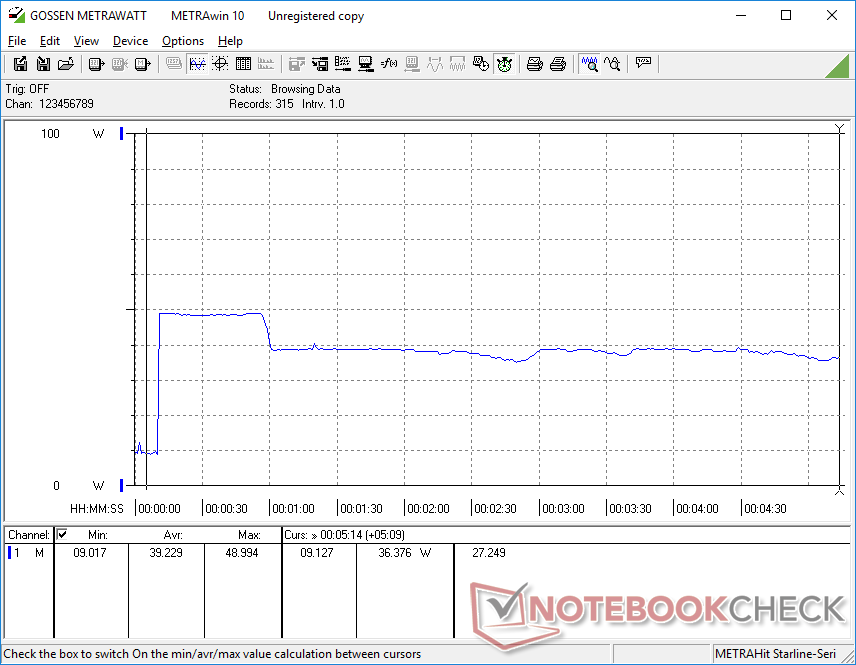
| MSI Summit E13 Flip Evo A11MT Iris Xe G7 96EUs, i7-1185G7, Phison 1TB SM2801T24GKBB4S-E162 | Dell XPS 13 7390 2-in-1 Core i7 Iris Plus Graphics G7 (Ice Lake 64 EU), i7-1065G7, Toshiba BG4 KBG40ZPZ512G | |
|---|---|---|
| Noise | -4% | |
| off /ambiente * (dB) | 24.5 | 28.1 -15% |
| Idle Minimum * (dB) | 24.7 | 28.1 -14% |
| Idle Average * (dB) | 24.7 | 28.1 -14% |
| Idle Maximum * (dB) | 26.4 | 28.1 -6% |
| Load Average * (dB) | 37.8 | 31.7 16% |
| Witcher 3 ultra * (dB) | 41.4 | 43.4 -5% |
| Load Maximum * (dB) | 48.8 | 43.4 11% |
* ... Meglio usare valori piccoli
| MSI Summit E13 Flip Evo A11MT i7-1185G7, Iris Xe G7 96EUs, 70 Wh | Dell XPS 13 7390 2-in-1 Core i7 i7-1065G7, Iris Plus Graphics G7 (Ice Lake 64 EU), 51 Wh | |
|---|---|---|
| Autonomia della batteria | -20% | |
| Reader / Idle (h) | 21.1 | |
| WiFi v1.3 (h) | 11.2 | 9 -20% |
| Load (h) | 1.8 |
Price comparison

