 Deutsch
 English
 Español
 Français
 Italiano
 Nederlands
 Polski
 Português
 Русский
 Türkçe
 Svenska
 Chinese
 Magyar
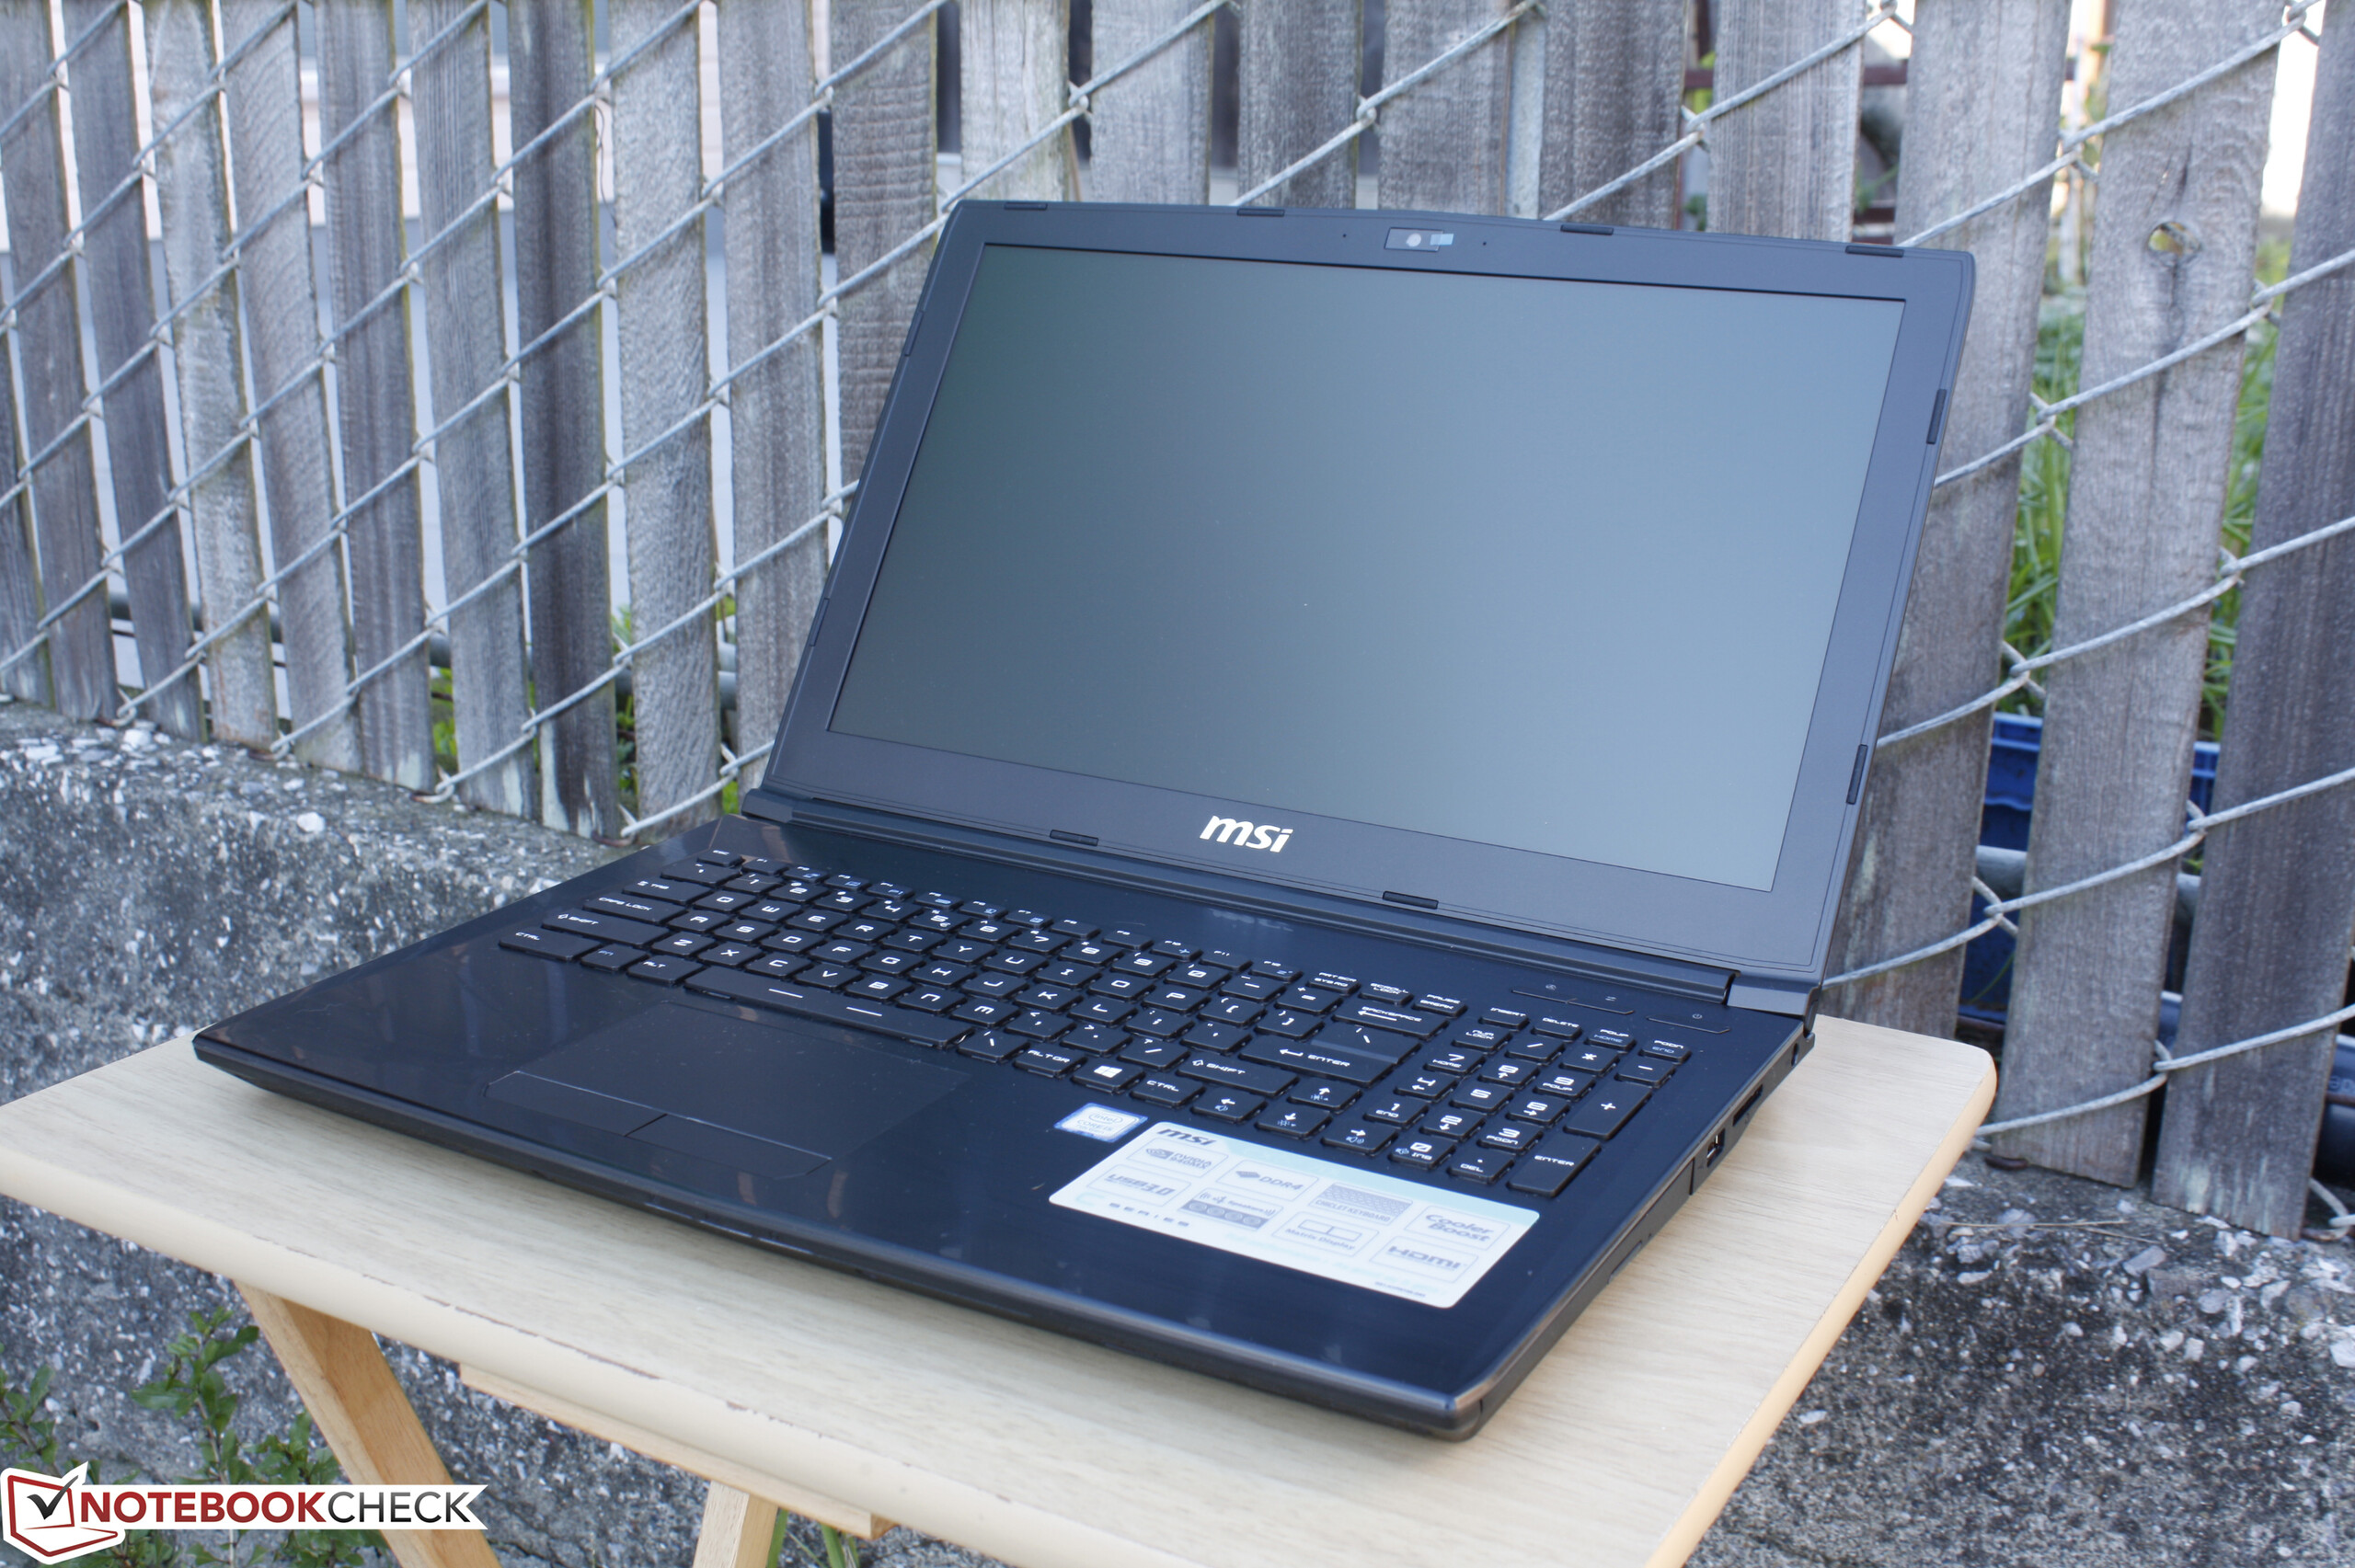
Recensione breve del portatile MSI CX62 7QL


| SD Card Reader | |
| average JPG Copy Test (av. of 3 runs) | |
| HP Pavilion 15t-au100 CTO (W0P31AV) | |
| MSI CX62 7QL | |
| Asus Zenbook UX510UW-CN044T | |
| maximum AS SSD Seq Read Test (1GB) | |
| HP Pavilion 15t-au100 CTO (W0P31AV) | |
| Asus Zenbook UX510UW-CN044T | |
| MSI CX62 7QL | |
| Networking | |
| iperf3 transmit AX12 | |
| MSI GT73VR 6RF | |
| MSI CX62 7QL | |
| HP Pavilion 15t-au100 CTO (W0P31AV) | |
| iperf3 receive AX12 | |
| MSI GT73VR 6RF | |
| MSI CX62 7QL | |
| HP Pavilion 15t-au100 CTO (W0P31AV) | |
| |||||||||||||||||||||||||
Distribuzione della luminosità: 85 %
Al centro con la batteria: 196.1 cd/m²
Contrasto: 261:1 (Nero: 0.75 cd/m²)
ΔE Color 10.9 | 0.5-29.43 Ø5
ΔE Greyscale 12.6 | 0.57-98 Ø5.3
60.6% sRGB (Argyll 1.6.3 3D)
38.4% AdobeRGB 1998 (Argyll 1.6.3 3D)
41.56% AdobeRGB 1998 (Argyll 2.2.0 3D)
60.5% sRGB (Argyll 2.2.0 3D)
40.22% Display P3 (Argyll 2.2.0 3D)
Gamma: 2.18
| MSI CX62 7QL TN LED, 15.60, 1366x768 | HP Pavilion 15t-au100 CTO (W0P31AV) BOE0693, IPS, 15.60, 1920x1080 | Lenovo Yoga 510-15IKB 80VC000XGE BOE HF NV156FHM-N42, IPS, 15.60, 1920x1080 | Asus Zenbook UX510UW-CN044T LG Philips LP156WF6-SPB6, IPS, 15.60, 1920x1080 | MSI GL62-6QFi781H11 CMN N156HGE-EAL (CMN15D2), TN LED, 15.60, 1920x1080 | |
|---|---|---|---|---|---|
| Display | 8% | 4% | 42% | 93% | |
| Display P3 Coverage | 40.22 | 43.27 8% | 41.92 4% | 61.5 53% | 85.8 113% |
| sRGB Coverage | 60.5 | 64.9 7% | 62.9 4% | 80.4 33% | 99.8 65% |
| AdobeRGB 1998 Coverage | 41.56 | 44.71 8% | 43.32 4% | 58.8 41% | 84.1 102% |
| Response Times | -2% | 1% | 14% | 17% | |
| Response Time Grey 50% / Grey 80% * | 50.4 ? | 42 ? 17% | 53 ? -5% | 40 ? 21% | 43 ? 15% |
| Response Time Black / White * | 28 ? | 33.6 ? -20% | 26 ? 7% | 26 ? 7% | 23 ? 18% |
| PWM Frequency | 198.4 | 50 ? | 1000 ? | ||
| Screen | 46% | 70% | 65% | 31% | |
| Brightness middle | 196.1 | 186.5 -5% | 236 20% | 326 66% | 216 10% |
| Brightness | 196 | 174 -11% | 212 8% | 316 61% | 202 3% |
| Brightness Distribution | 85 | 69 -19% | 78 -8% | 80 -6% | 83 -2% |
| Black Level * | 0.75 | 0.18 76% | 0.18 76% | 0.35 53% | 0.48 36% |
| Contrast | 261 | 1036 297% | 1311 402% | 931 257% | 450 72% |
| Colorchecker dE 2000 * | 10.9 | 5.7 48% | 3.92 64% | 5.49 50% | 9.98 8% |
| Colorchecker dE 2000 max. * | 19 | 22.5 -18% | 9.2 52% | 11.36 40% | 17.12 10% |
| Greyscale dE 2000 * | 12.6 | 4.4 65% | 2.35 81% | 4.84 62% | 10.91 13% |
| Gamma | 2.18 101% | 2.35 94% | 2.34 94% | 2.23 99% | 2.31 95% |
| CCT | 14195 46% | 6963 93% | 6161 106% | 5971 109% | 13185 49% |
| Color Space (Percent of AdobeRGB 1998) | 38.4 | 44.71 16% | 40 4% | 53 38% | 75 95% |
| Color Space (Percent of sRGB) | 60.6 | 64.95 7% | 63 4% | 80 32% | 100 65% |
| Media totale (Programma / Settaggio) | 17% /
32% | 25% /
48% | 40% /
54% | 47% /
42% |
* ... Meglio usare valori piccoli
Tempi di risposta del Display
| ↔ Tempi di risposta dal Nero al Bianco | ||
|---|---|---|
| 28 ms ... aumenta ↗ e diminuisce ↘ combinato | ↗ 10 ms Incremento | 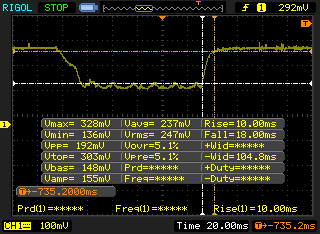 |
| ↘ 18 ms Calo | ||
| Lo schermo mostra tempi di risposta relativamente lenti nei nostri tests e potrebbe essere troppo lento per i gamers. In confronto, tutti i dispositivi di test variano da 0.1 (minimo) a 240 (massimo) ms. » 67 % di tutti i dispositivi è migliore. Questo significa che i tempi di risposta rilevati sono peggiori rispetto alla media di tutti i dispositivi testati (21.5 ms). | ||
| ↔ Tempo di risposta dal 50% Grigio all'80% Grigio | ||
| 50.4 ms ... aumenta ↗ e diminuisce ↘ combinato | ↗ 24 ms Incremento | 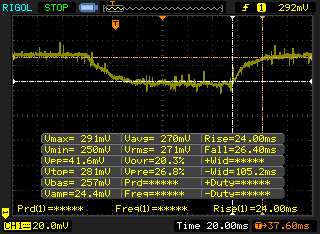 |
| ↘ 26.4 ms Calo | ||
| Lo schermo mostra tempi di risposta lenti nei nostri tests e sarà insoddisfacente per i gamers. In confronto, tutti i dispositivi di test variano da 0.2 (minimo) a 636 (massimo) ms. » 85 % di tutti i dispositivi è migliore. Questo significa che i tempi di risposta rilevati sono peggiori rispetto alla media di tutti i dispositivi testati (33.7 ms). | ||
Sfarfallio dello schermo / PWM (Pulse-Width Modulation)
| flickering dello schermo / PWM non rilevato | 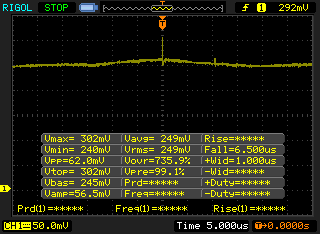 | ||
In confronto: 53 % di tutti i dispositivi testati non utilizza PWM per ridurre la luminosita' del display. Se è rilevato PWM, una media di 17900 (minimo: 5 - massimo: 3846000) Hz è stata rilevata. | |||

| Cinebench R15 | |
| CPU Single 64Bit | |
| HP Envy x360 15t-w200 | |
| Asus GL702VM-GC102D | |
| Asus Zenbook UX510UW-CN044T | |
| MSI CX62 7QL | |
| HP ProBook 640 G2-T9X60ET | |
| HP 250 G4 T6P08ES | |
| Lenovo IdeaPad Z40-59422614 | |
| CPU Multi 64Bit | |
| Asus GL702VM-GC102D | |
| HP Envy x360 15t-w200 | |
| MSI CX62 7QL | |
| Asus Zenbook UX510UW-CN044T | |
| HP ProBook 640 G2-T9X60ET | |
| HP 250 G4 T6P08ES | |
| Lenovo IdeaPad Z40-59422614 | |
| Cinebench R11.5 | |
| CPU Single 64Bit | |
| HP Envy x360 15t-w200 | |
| Asus GL702VM-GC102D | |
| Asus Zenbook UX510UW-CN044T | |
| MSI CX62 7QL | |
| HP ProBook 640 G2-T9X60ET | |
| HP 250 G4 T6P08ES | |
| Lenovo IdeaPad Z40-59422614 | |
| CPU Multi 64Bit | |
| Asus GL702VM-GC102D | |
| HP Envy x360 15t-w200 | |
| MSI CX62 7QL | |
| Asus Zenbook UX510UW-CN044T | |
| HP ProBook 640 G2-T9X60ET | |
| HP 250 G4 T6P08ES | |
| Lenovo IdeaPad Z40-59422614 | |
| Cinebench R10 | |
| Rendering Multiple CPUs 32Bit | |
| Asus GL702VM-GC102D | |
| MSI CX62 7QL | |
| Asus Zenbook UX510UW-CN044T | |
| HP ProBook 640 G2-T9X60ET | |
| HP 250 G4 T6P08ES | |
| Lenovo IdeaPad Z40-59422614 | |
| Rendering Single 32Bit | |
| Asus GL702VM-GC102D | |
| MSI CX62 7QL | |
| Asus Zenbook UX510UW-CN044T | |
| HP ProBook 640 G2-T9X60ET | |
| HP 250 G4 T6P08ES | |
| Lenovo IdeaPad Z40-59422614 | |
| wPrime 2.10 - 1024m | |
| Lenovo IdeaPad Z40-59422614 | |
| HP Envy x360 15t-w200 | |
| Super Pi Mod 1.5 XS 32M - 32M | |
| Lenovo IdeaPad Z40-59422614 | |
| HP Envy x360 15t-w200 | |
* ... Meglio usare valori piccoli
| PCMark 8 | |
| Home Score Accelerated v2 | |
| Lenovo Yoga 510-15IKB 80VC000XGE | |
| MSI GL62-6QFi781H11 | |
| MSI CX62 7QL | |
| HP Pavilion 15t-au100 CTO (W0P31AV) | |
| Asus Zenbook UX510UW-CN044T | |
| Work Score Accelerated v2 | |
| MSI GL62-6QFi781H11 | |
| MSI CX62 7QL | |
| Asus Zenbook UX510UW-CN044T | |
| HP Pavilion 15t-au100 CTO (W0P31AV) | |
| Creative Score Accelerated v2 | |
| MSI GL62-6QFi781H11 | |
| Asus Zenbook UX510UW-CN044T | |
| HP Pavilion 15t-au100 CTO (W0P31AV) | |
| MSI CX62 7QL | |
| PCMark 8 Home Score Accelerated v2 | 3594 punti | |
| PCMark 8 Creative Score Accelerated v2 | 4035 punti | |
| PCMark 8 Work Score Accelerated v2 | 4364 punti | |
Aiuto | ||
| MSI CX62 7QL WDC Scorpio Blue WD10JPVX-22JC3T0 | HP Pavilion 15t-au100 CTO (W0P31AV) Toshiba MQ01ABD100 | Lenovo Yoga 510-15IKB 80VC000XGE Samsung MZYTY256HDHP | Asus Zenbook UX510UW-CN044T SanDisk SD8SNAT256G1002 | MSI GL62-6QFi781H11 Toshiba HG6 THNSNJ128G8NY | |
|---|---|---|---|---|---|
| CrystalDiskMark 3.0 | -18% | 8589% | 5301% | 6073% | |
| Read Seq | 113.7 | 109.5 -4% | 529 365% | 459.3 304% | 530 366% |
| Write Seq | 113.3 | 105.2 -7% | 508 348% | 325.5 187% | 442.7 291% |
| Read 512 | 38.42 | 34.08 -11% | 409.8 967% | 279.2 627% | 409.1 965% |
| Write 512 | 55.8 | 40.02 -28% | 316.5 467% | 280.1 402% | 417.3 648% |
| Read 4k | 0.48 | 0.429 -11% | 36.01 7402% | 22.43 4573% | 21.81 4444% |
| Write 4k | 1.282 | 1.008 -21% | 106.7 8223% | 74.9 5742% | 93 7154% |
| Read 4k QD32 | 1.172 | 0.81 -31% | 384.8 32733% | 149 12613% | 257 21828% |
| Write 4k QD32 | 1.296 | 0.893 -31% | 237.3 18210% | 234 17956% | 168.3 12886% |

| 3DMark | |
| 1280x720 Cloud Gate Standard Graphics | |
| Asus Zenbook UX510UW-CN044T | |
| Acer Aspire E5-575G-549D | |
| Intel Skull Canyon NUC6i7KYK | |
| MSI CX62 7QL | |
| HP ProBook 440 G4-Y8B51EA | |
| Dell Latitude 15 3550-0123 | |
| HP Pavilion x360 13t-u100 | |
| 1920x1080 Fire Strike Graphics | |
| Asus Zenbook UX510UW-CN044T | |
| Acer Aspire E5-575G-549D | |
| Intel Skull Canyon NUC6i7KYK | |
| MSI CX62 7QL | |
| HP ProBook 440 G4-Y8B51EA | |
| Dell Latitude 15 3550-0123 | |
| HP Pavilion x360 13t-u100 | |
| 3DMark 11 | |
| 1280x720 Performance GPU | |
| Asus Zenbook UX510UW-CN044T | |
| Acer Aspire E5-575G-549D | |
| Intel Skull Canyon NUC6i7KYK | |
| MSI CX62 7QL | |
| HP ProBook 440 G4-Y8B51EA | |
| Dell Latitude 15 3550-0123 | |
| HP Pavilion x360 13t-u100 | |
| 1280x720 Performance Combined | |
| Asus Zenbook UX510UW-CN044T | |
| Acer Aspire E5-575G-549D | |
| Intel Skull Canyon NUC6i7KYK | |
| MSI CX62 7QL | |
| HP ProBook 440 G4-Y8B51EA | |
| Dell Latitude 15 3550-0123 | |
| HP Pavilion x360 13t-u100 | |
| 3DMark 11 Performance | 2529 punti | |
| 3DMark Ice Storm Standard Score | 65002 punti | |
| 3DMark Cloud Gate Standard Score | 6847 punti | |
| 3DMark Fire Strike Score | 1473 punti | |
| 3DMark Fire Strike Extreme Score | 753 punti | |
Aiuto | ||
| basso | medio | alto | ultra | |
| BioShock Infinite (2013) | 97.2 | 54.3 | 44 | |
| Metro: Last Light (2013) | 51.3 | 39.5 | 28.5 | |
| Thief (2014) | 50.7 | 29.3 | ||
| Batman: Arkham Knight (2015) | 28 | |||
| Metal Gear Solid V (2015) | 60 | 58 | ||
| Fallout 4 (2015) | 34.6 | |||
| Rise of the Tomb Raider (2016) | 40.1 | 23.2 | ||
| Ashes of the Singularity (2016) | 19.4 | |||
| Overwatch (2016) | 73.5 | 51.4 |
Rumorosità
| Idle |
| 32.1 / 32.2 / 32.2 dB(A) |
| Sotto carico |
| 37.4 / 51.4 dB(A) |
 | ||
30 dB silenzioso 40 dB(A) udibile 50 dB(A) rumoroso |
||
min: | ||
| MSI CX62 7QL GeForce 940MX, i5-7200U, WDC Scorpio Blue WD10JPVX-22JC3T0 | HP Pavilion 15t-au100 CTO (W0P31AV) GeForce 940MX, i7-7500U, Toshiba MQ01ABD100 | Lenovo Yoga 510-15IKB 80VC000XGE Radeon R7 M460, i5-7200U, Samsung MZYTY256HDHP | Asus Zenbook UX510UW-CN044T GeForce GTX 960M, 6500U, SanDisk SD8SNAT256G1002 | MSI GL62-6QFi781H11 GeForce GTX 960M, 6700HQ, Toshiba HG6 THNSNJ128G8NY | |
|---|---|---|---|---|---|
| Noise | 2% | 6% | -1% | -6% | |
| off /ambiente * | 29 | 30.15 -4% | 31.6 -9% | 30 -3% | |
| Idle Minimum * | 32.1 | 32.2 -0% | 30.2 6% | 31.6 2% | 35 -9% |
| Idle Average * | 32.2 | 32.2 -0% | 30.2 6% | 31.6 2% | 36 -12% |
| Idle Maximum * | 32.2 | 33.7 -5% | 31 4% | 33.4 -4% | 37 -15% |
| Load Average * | 37.4 | 39.4 -5% | 38 -2% | 41.7 -11% | 41 -10% |
| Load Maximum * | 51.4 | 42.2 18% | 38.6 25% | 44.8 13% | 46 11% |
* ... Meglio usare valori piccoli
(+) La temperatura massima sul lato superiore è di 38.4 °C / 101 F, rispetto alla media di 36.9 °C / 98 F, che varia da 21.1 a 71 °C per questa classe Multimedia.
(+) Il lato inferiore si riscalda fino ad un massimo di 35.8 °C / 96 F, rispetto alla media di 39.1 °C / 102 F
(+) In idle, la temperatura media del lato superiore è di 24 °C / 75 F, rispetto alla media deld ispositivo di 31.2 °C / 88 F.
(+) I poggiapolsi e il touchpad raggiungono la temperatura massima della pelle (32.2 °C / 90 F) e quindi non sono caldi.
(-) La temperatura media della zona del palmo della mano di dispositivi simili e'stata di 28.8 °C / 83.8 F (-3.4 °C / -6.2 F).
MSI CX62 7QL analisi audio
(±) | potenza degli altiparlanti media ma buona (74.8 dB)
Bassi 100 - 315 Hz
(-) | quasi nessun basso - in media 19.6% inferiori alla media
(±) | la linearità dei bassi è media (11.1% delta rispetto alla precedente frequenza)
Medi 400 - 2000 Hz
(±) | medi elevati - circa 9.5% superiore alla media
(-) | medi non in linea (15.2% delta rispetto alla precedente frequenza)
Alti 2 - 16 kHz
(±) | alti elevati - circa 7.4% superiori alla media
(±) | la linearità degli alti è media (9.5% delta rispetto alla precedente frequenza)
Nel complesso 100 - 16.000 Hz
(-) | suono nel complesso non lineare (38.2% di differenza rispetto alla media
Rispetto alla stessa classe
» 99% di tutti i dispositivi testati in questa classe è stato migliore, 1% simile, 1% peggiore
» Il migliore ha avuto un delta di 5%, medio di 18%, peggiore di 45%
Rispetto a tutti i dispositivi testati
» 94% di tutti i dispositivi testati in questa classe è stato migliore, 1% similare, 6% peggiore
» Il migliore ha avuto un delta di 4%, medio di 25%, peggiore di 134%
Apple MacBook 12 (Early 2016) 1.1 GHz analisi audio
(+) | gli altoparlanti sono relativamente potenti (83.6 dB)
Bassi 100 - 315 Hz
(±) | bassi ridotti - in media 11.3% inferiori alla media
(±) | la linearità dei bassi è media (14.2% delta rispetto alla precedente frequenza)
Medi 400 - 2000 Hz
(+) | medi bilanciati - solo only 2.4% rispetto alla media
(+) | medi lineari (5.5% delta rispetto alla precedente frequenza)
Alti 2 - 16 kHz
(+) | Alti bilanciati - appena 2% dalla media
(+) | alti lineari (4.5% delta rispetto alla precedente frequenza)
Nel complesso 100 - 16.000 Hz
(+) | suono nel complesso lineare (10.2% differenza dalla media)
Rispetto alla stessa classe
» 5% di tutti i dispositivi testati in questa classe è stato migliore, 2% simile, 93% peggiore
» Il migliore ha avuto un delta di 5%, medio di 19%, peggiore di 53%
Rispetto a tutti i dispositivi testati
» 3% di tutti i dispositivi testati in questa classe è stato migliore, 1% similare, 96% peggiore
» Il migliore ha avuto un delta di 4%, medio di 25%, peggiore di 134%
| Off / Standby | |
| Idle | |
| Sotto carico |
|
Leggenda:
min: Attualmente utilizziamo il Metrahit Energy, un multimetro digitale professionale per la misurazione della qualità della potenza e dell'energia monofase, per le nostre misurazioni. | |
| MSI CX62 7QL i5-7200U, GeForce 940MX, WDC Scorpio Blue WD10JPVX-22JC3T0, TN LED, 1366x768, 15.60 | HP Pavilion 15t-au100 CTO (W0P31AV) i7-7500U, GeForce 940MX, Toshiba MQ01ABD100, IPS, 1920x1080, 15.60 | Lenovo Yoga 510-15IKB 80VC000XGE i5-7200U, Radeon R7 M460, Samsung MZYTY256HDHP, IPS, 1920x1080, 15.60 | Asus Zenbook UX510UW-CN044T 6500U, GeForce GTX 960M, SanDisk SD8SNAT256G1002, IPS, 1920x1080, 15.60 | MSI GL62-6QFi781H11 6700HQ, GeForce GTX 960M, Toshiba HG6 THNSNJ128G8NY, TN LED, 1920x1080, 15.60 | |
|---|---|---|---|---|---|
| Power Consumption | -15% | 6% | -36% | -110% | |
| Idle Minimum * | 6.3 | 6.16 2% | 3.9 38% | 5 21% | 10 -59% |
| Idle Average * | 7 | 8.48 -21% | 7.8 -11% | 8.9 -27% | 14 -100% |
| Idle Maximum * | 7.2 | 9.62 -34% | 8.4 -17% | 11.8 -64% | 19 -164% |
| Load Average * | 35.1 | 41.63 -19% | 37 -5% | 55 -57% | 82 -134% |
| Load Maximum * | 61.2 | 63.22 -3% | 46 25% | 93 -52% | 118 -93% |
* ... Meglio usare valori piccoli
| MSI CX62 7QL i5-7200U, GeForce 940MX, 41 Wh | HP Pavilion 15t-au100 CTO (W0P31AV) i7-7500U, GeForce 940MX, 41 Wh | Lenovo Yoga 510-15IKB 80VC000XGE i5-7200U, Radeon R7 M460, 35 Wh | Asus Zenbook UX510UW-CN044T 6500U, GeForce GTX 960M, 48 Wh | MSI GL62-6QFi781H11 6700HQ, GeForce GTX 960M, 41.4 Wh | |
|---|---|---|---|---|---|
| Autonomia della batteria | -22% | 13% | 20% | -44% | |
| Reader / Idle | 613 | 438 -29% | 816 33% | 339 -45% | |
| WiFi v1.3 | 283 | 220 -22% | 320 13% | 430 52% | 158 -44% |
| Load | 125 | 106 -15% | 95 -24% | 71 -43% |
Pro
Contro
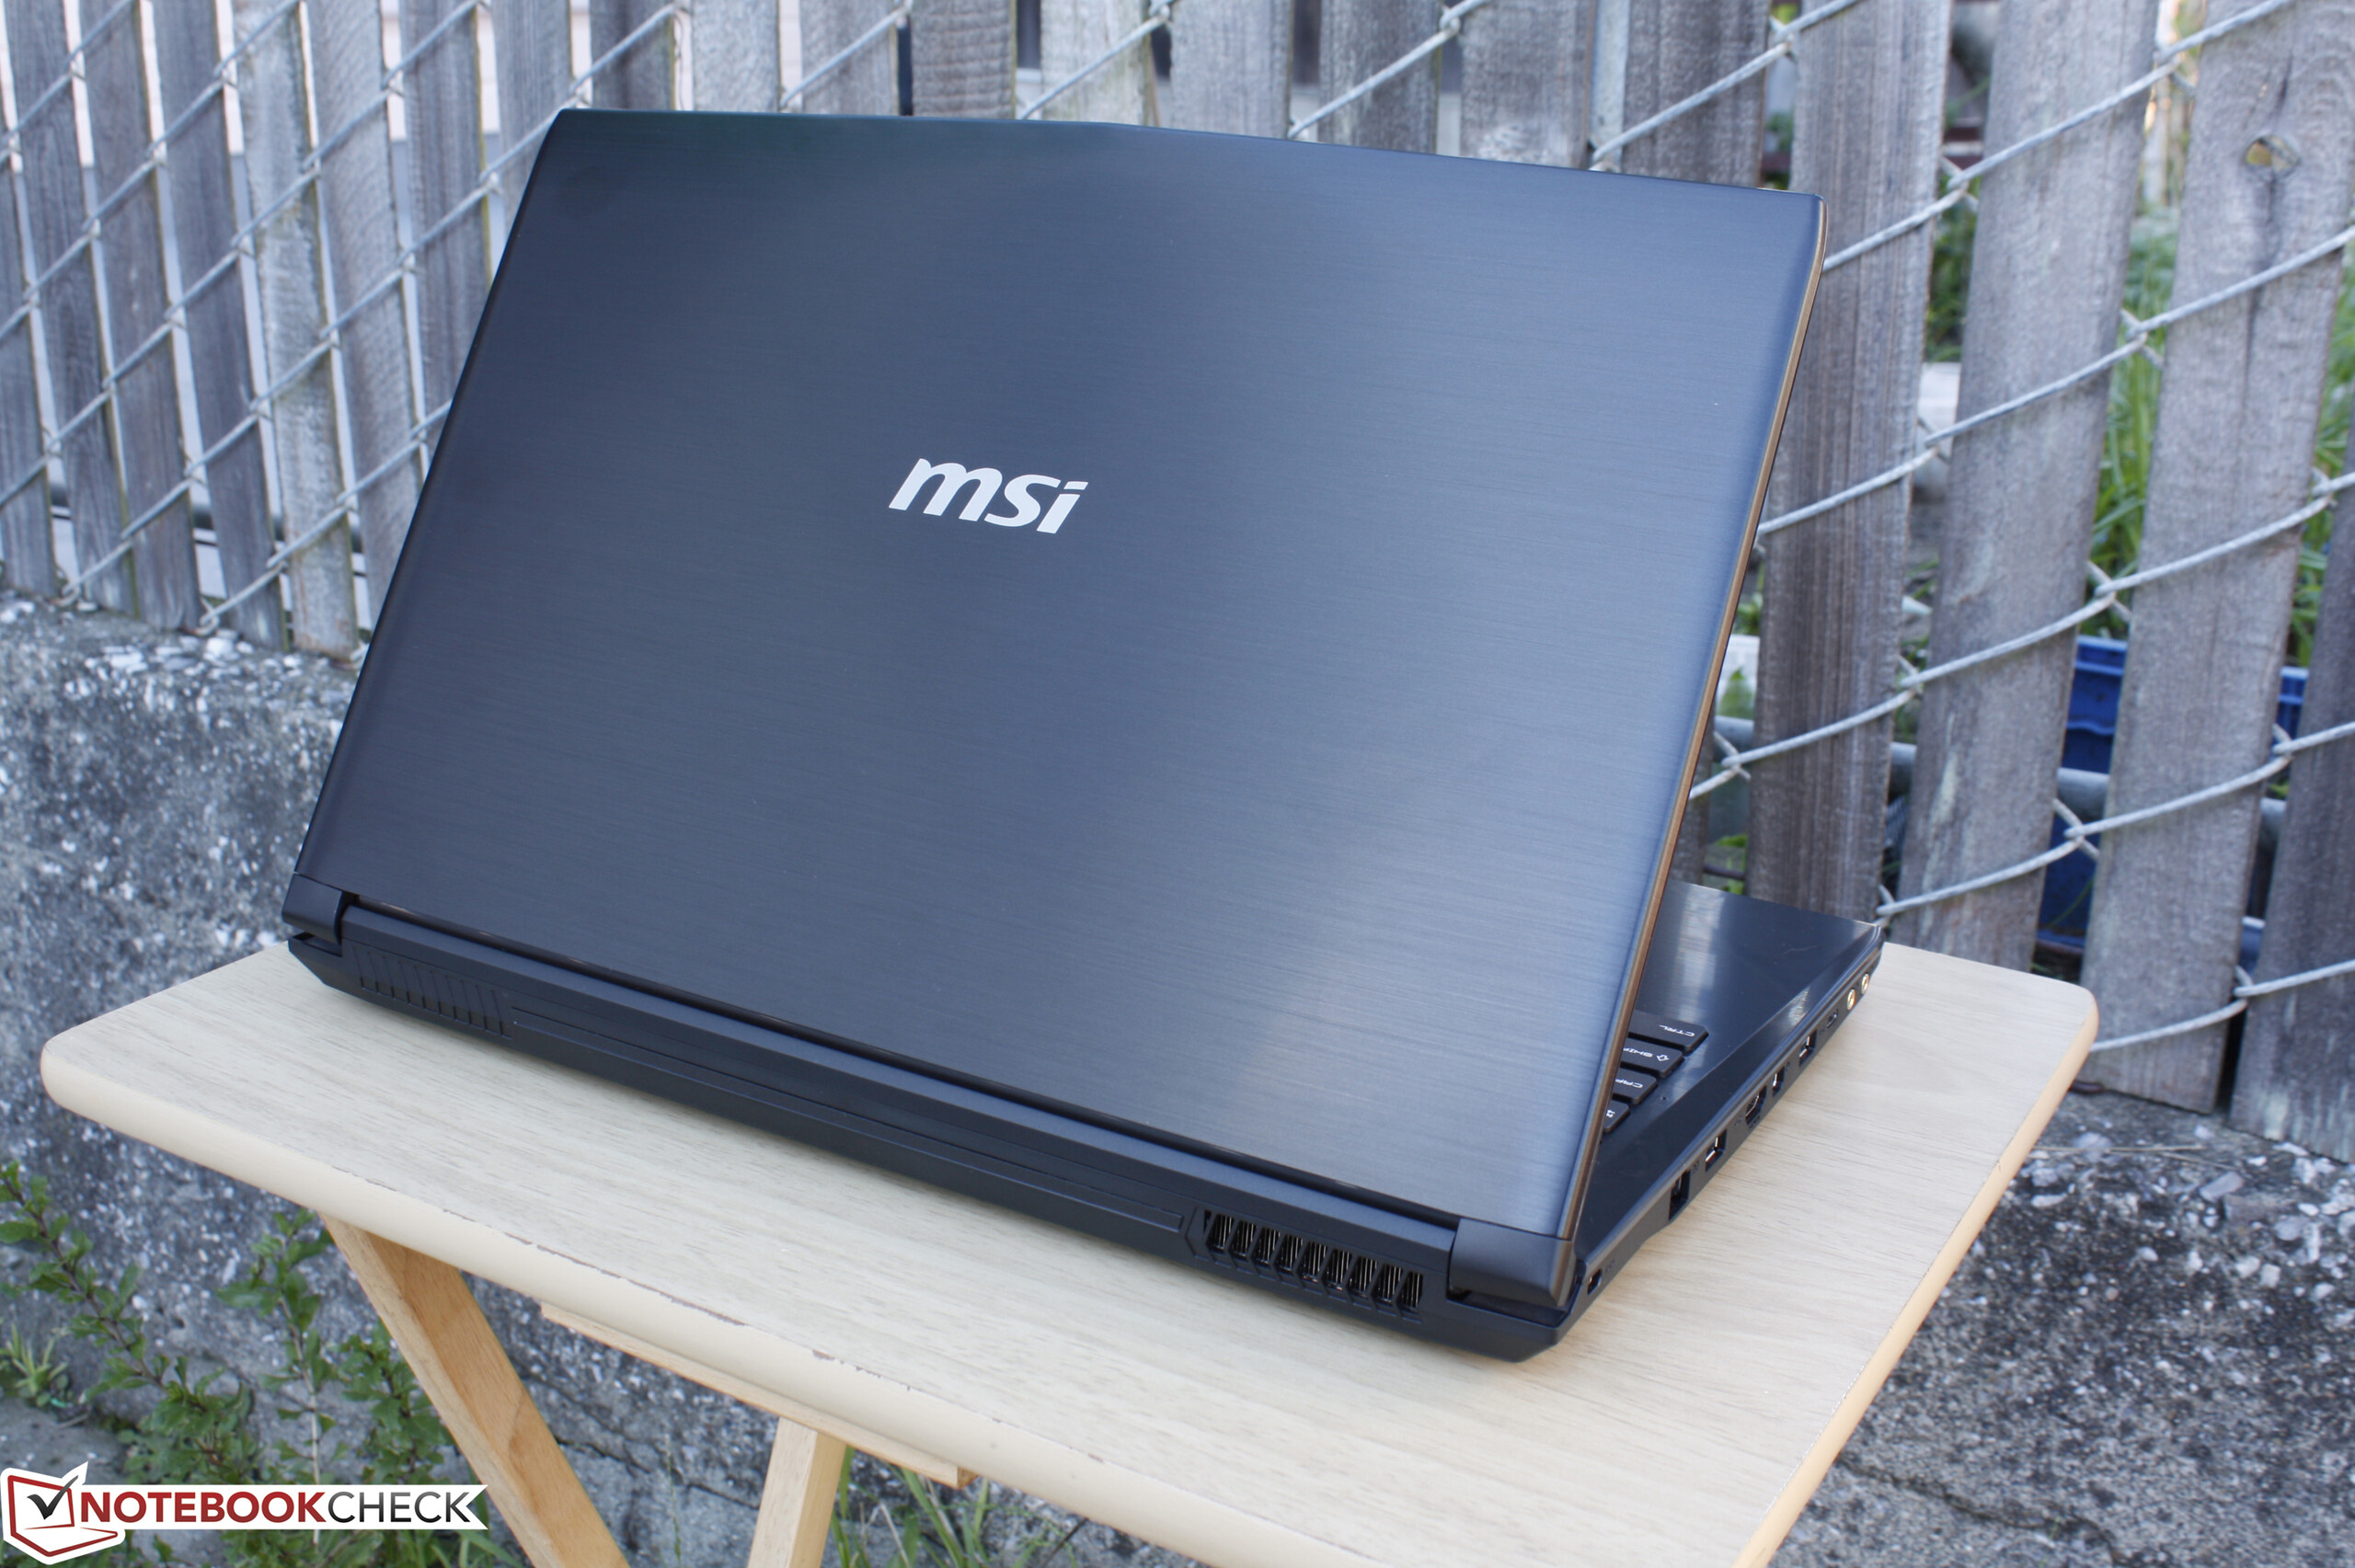
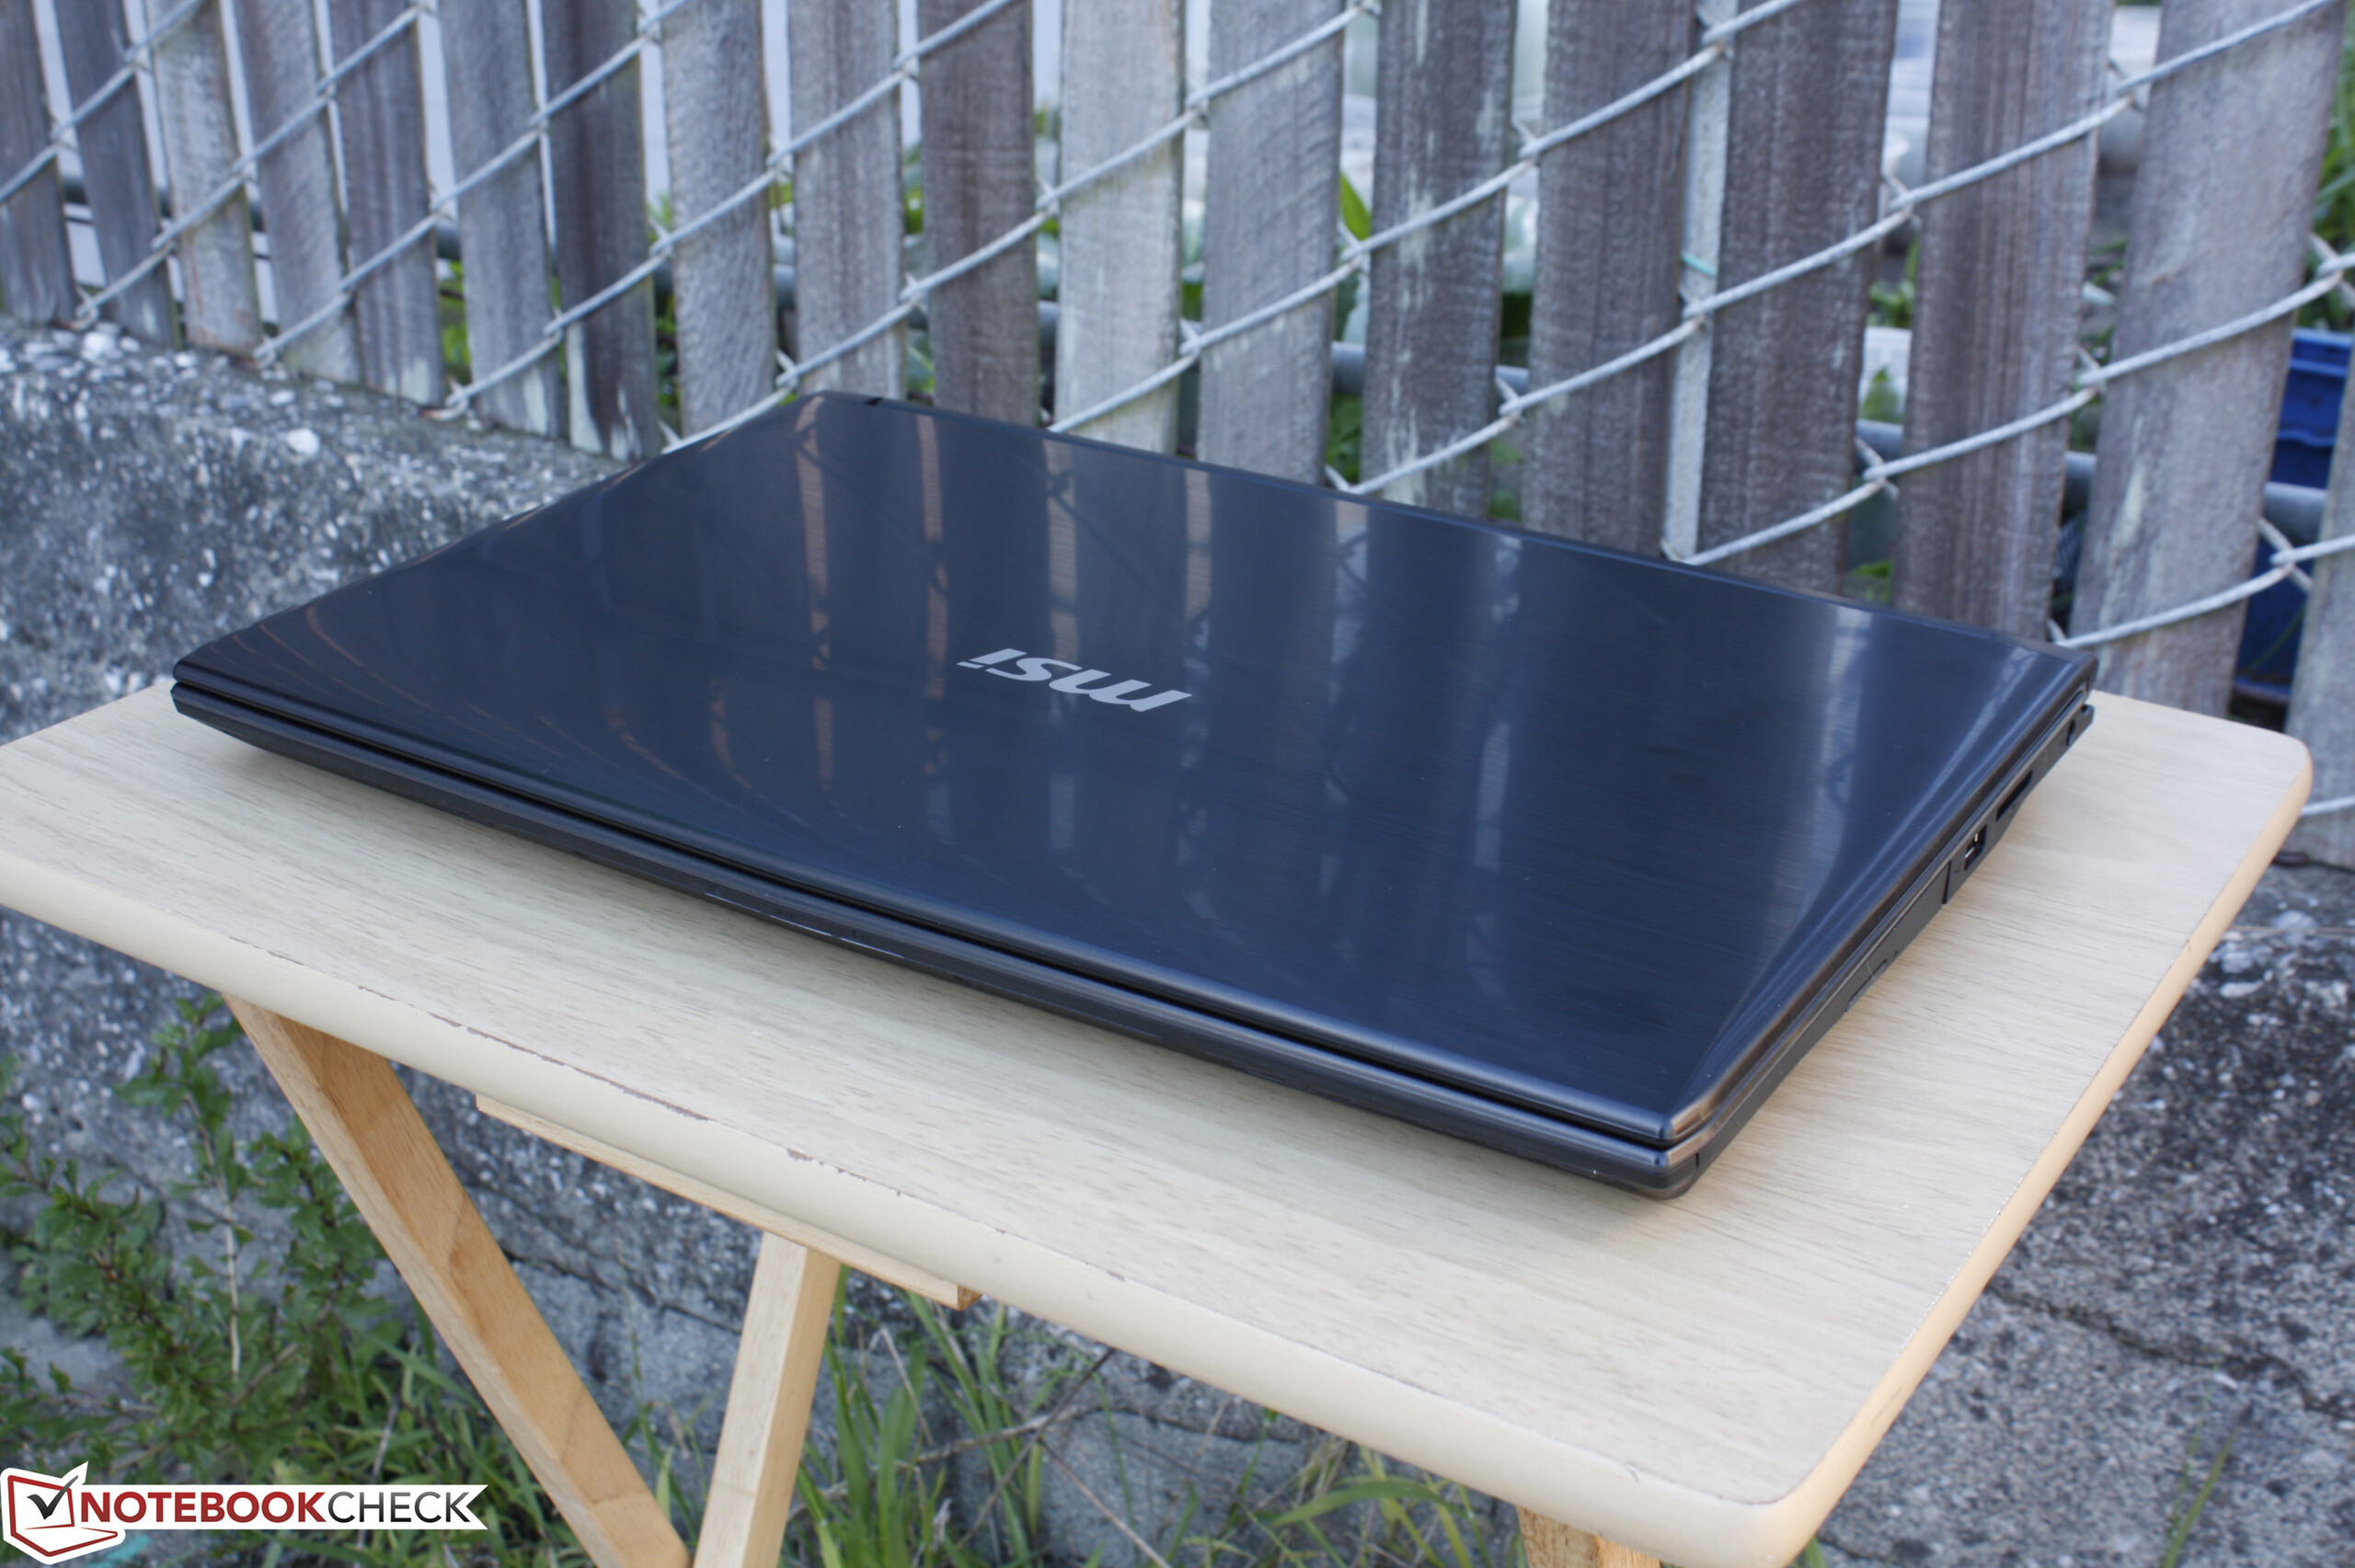
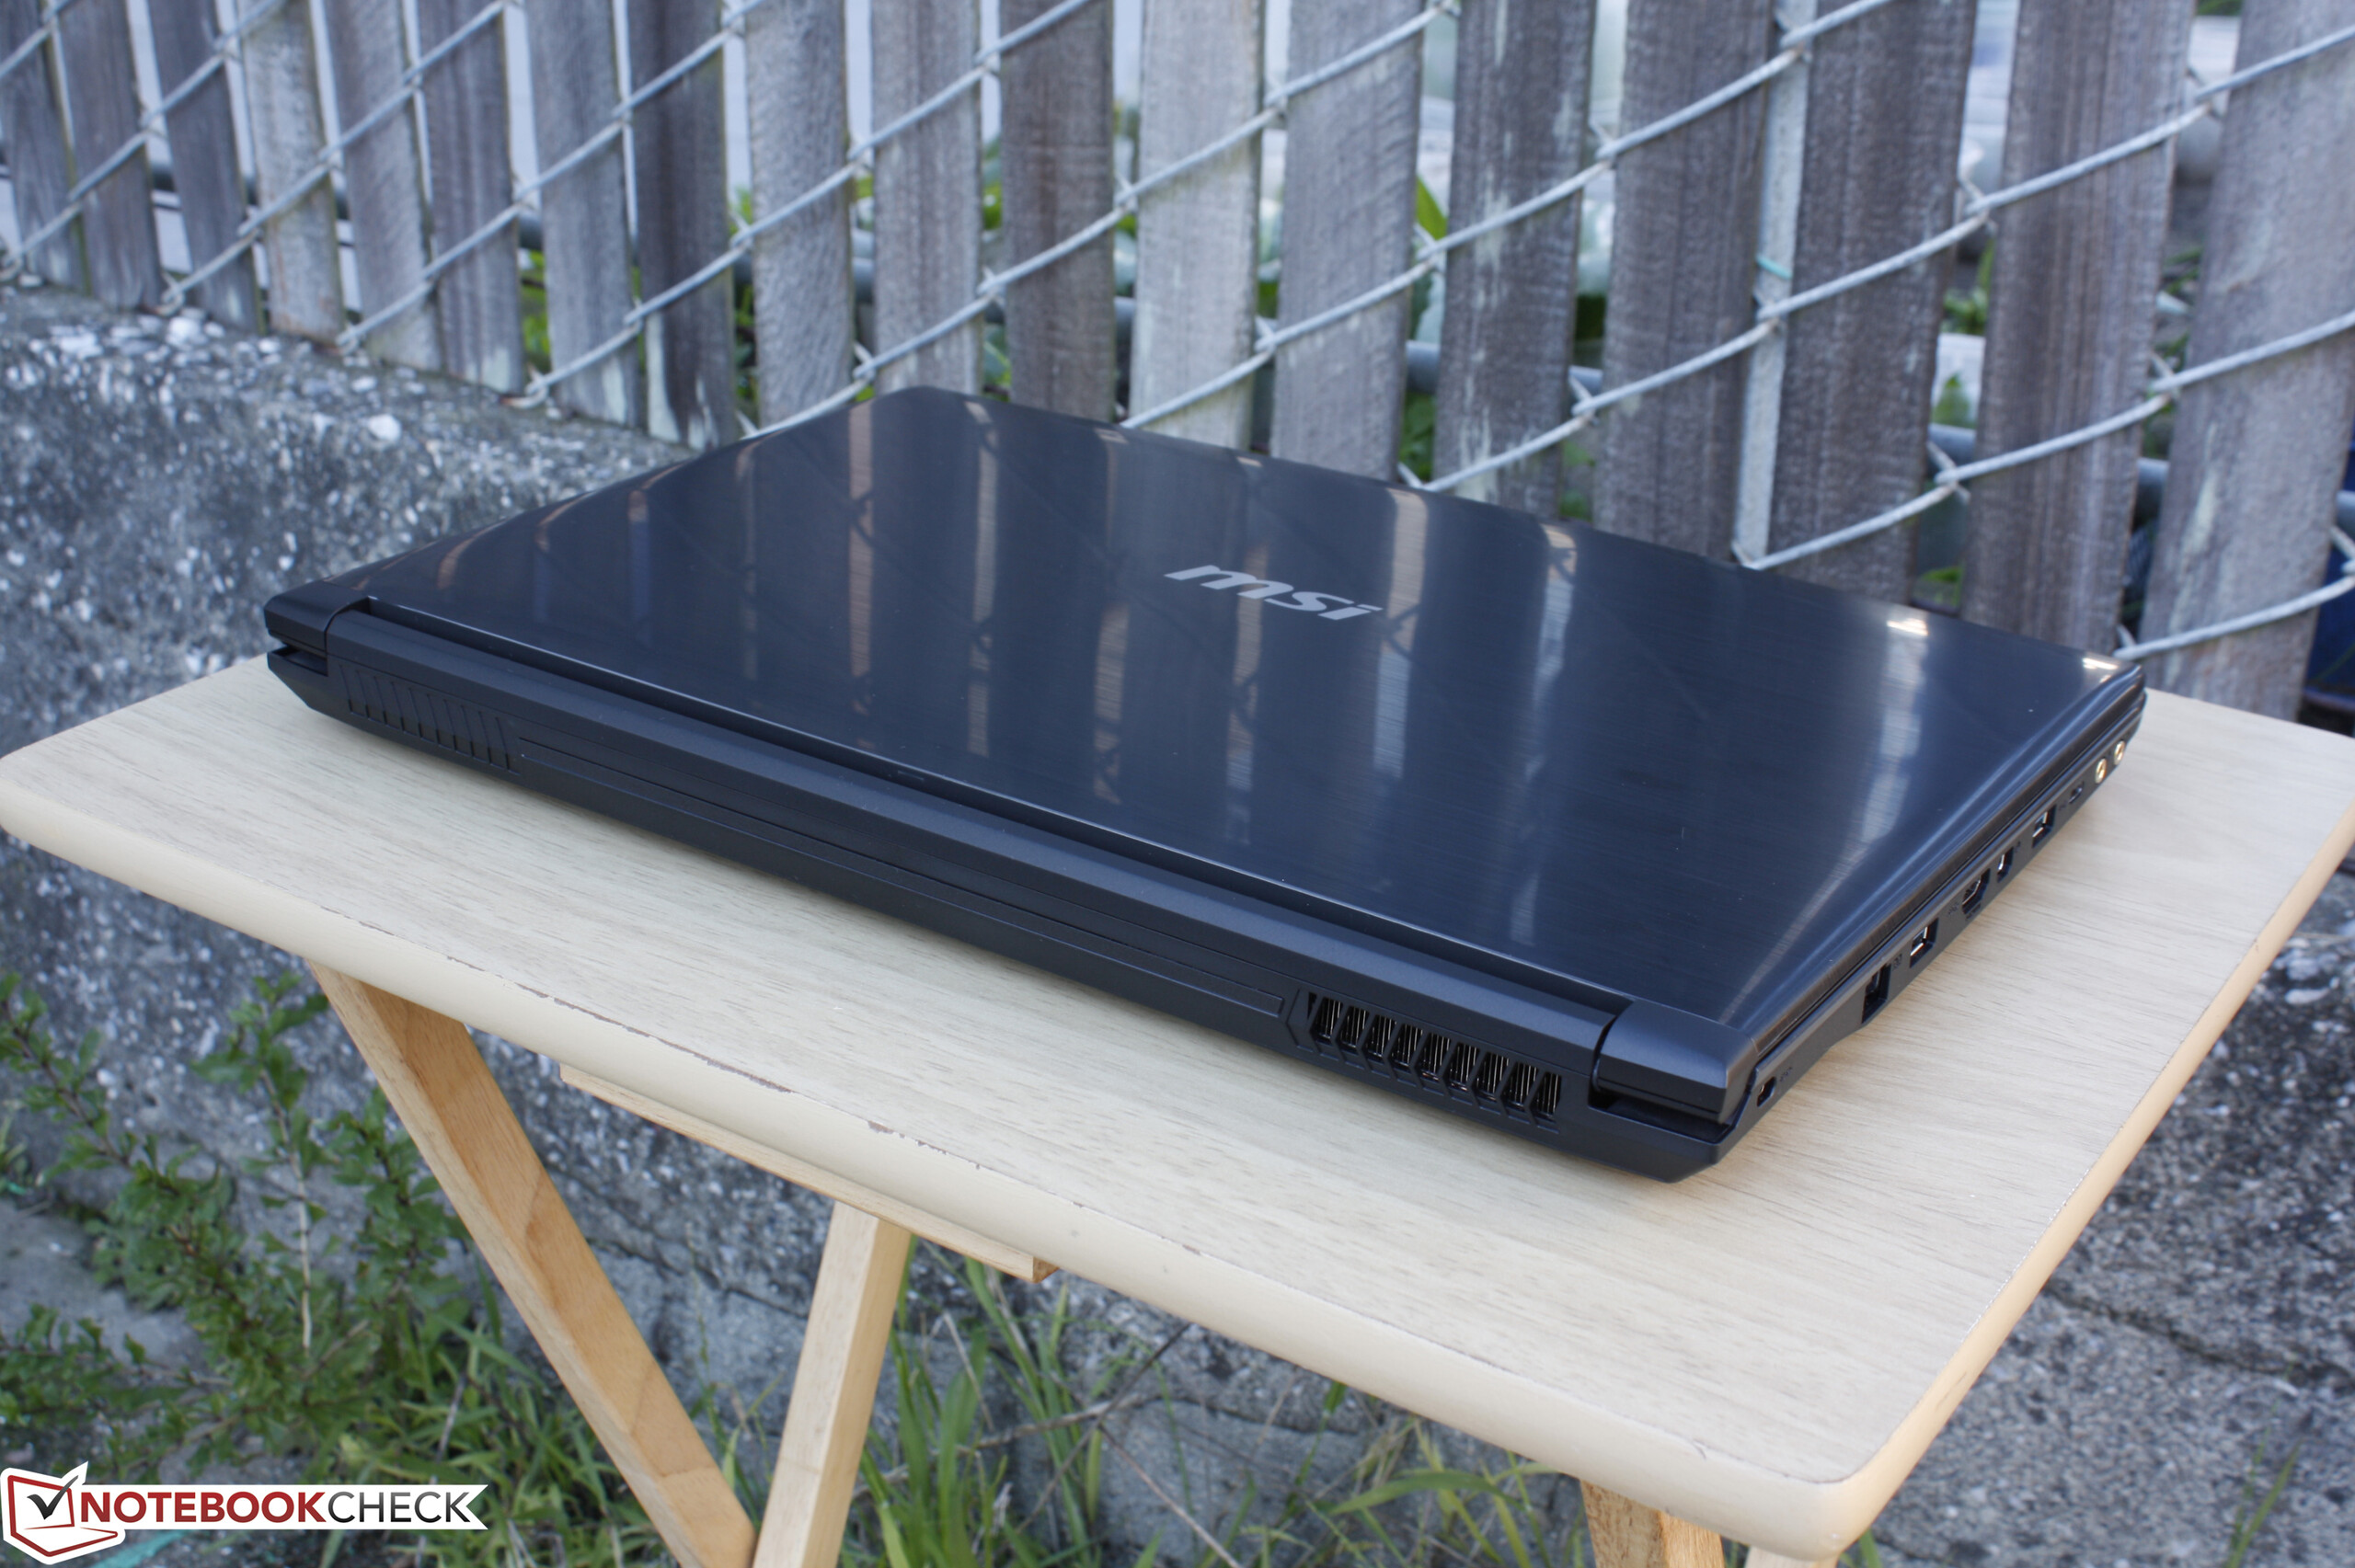
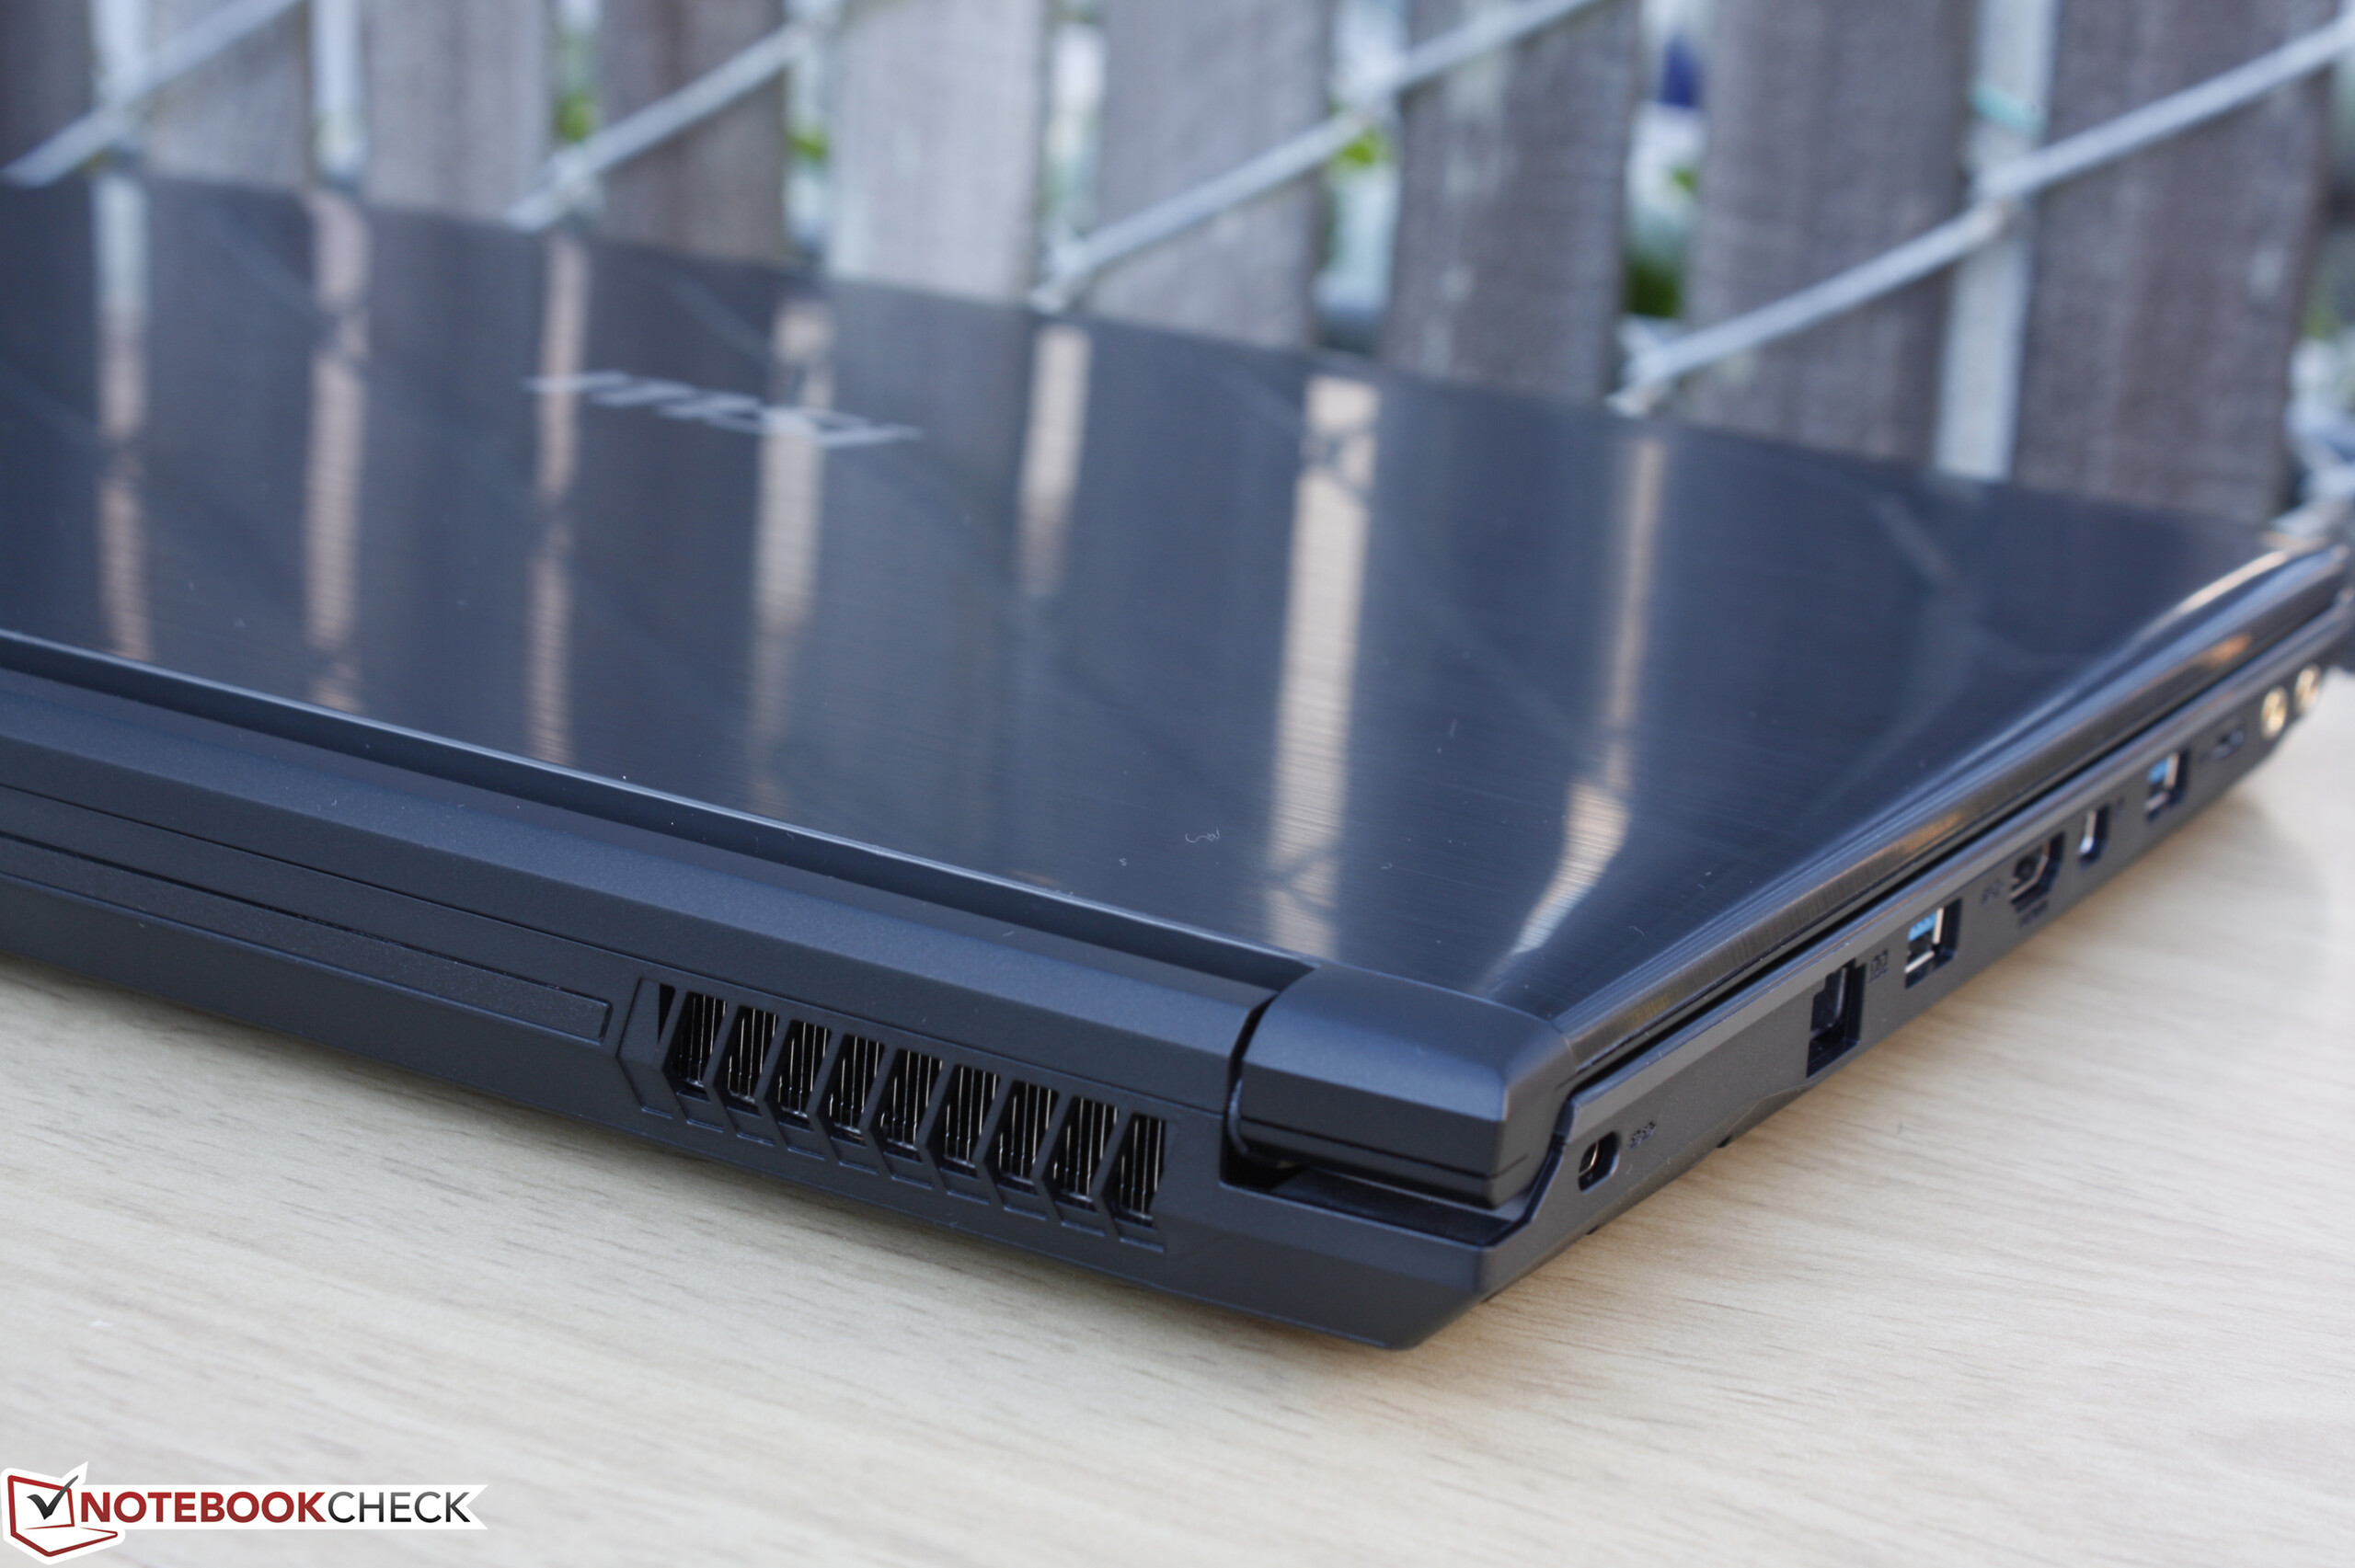
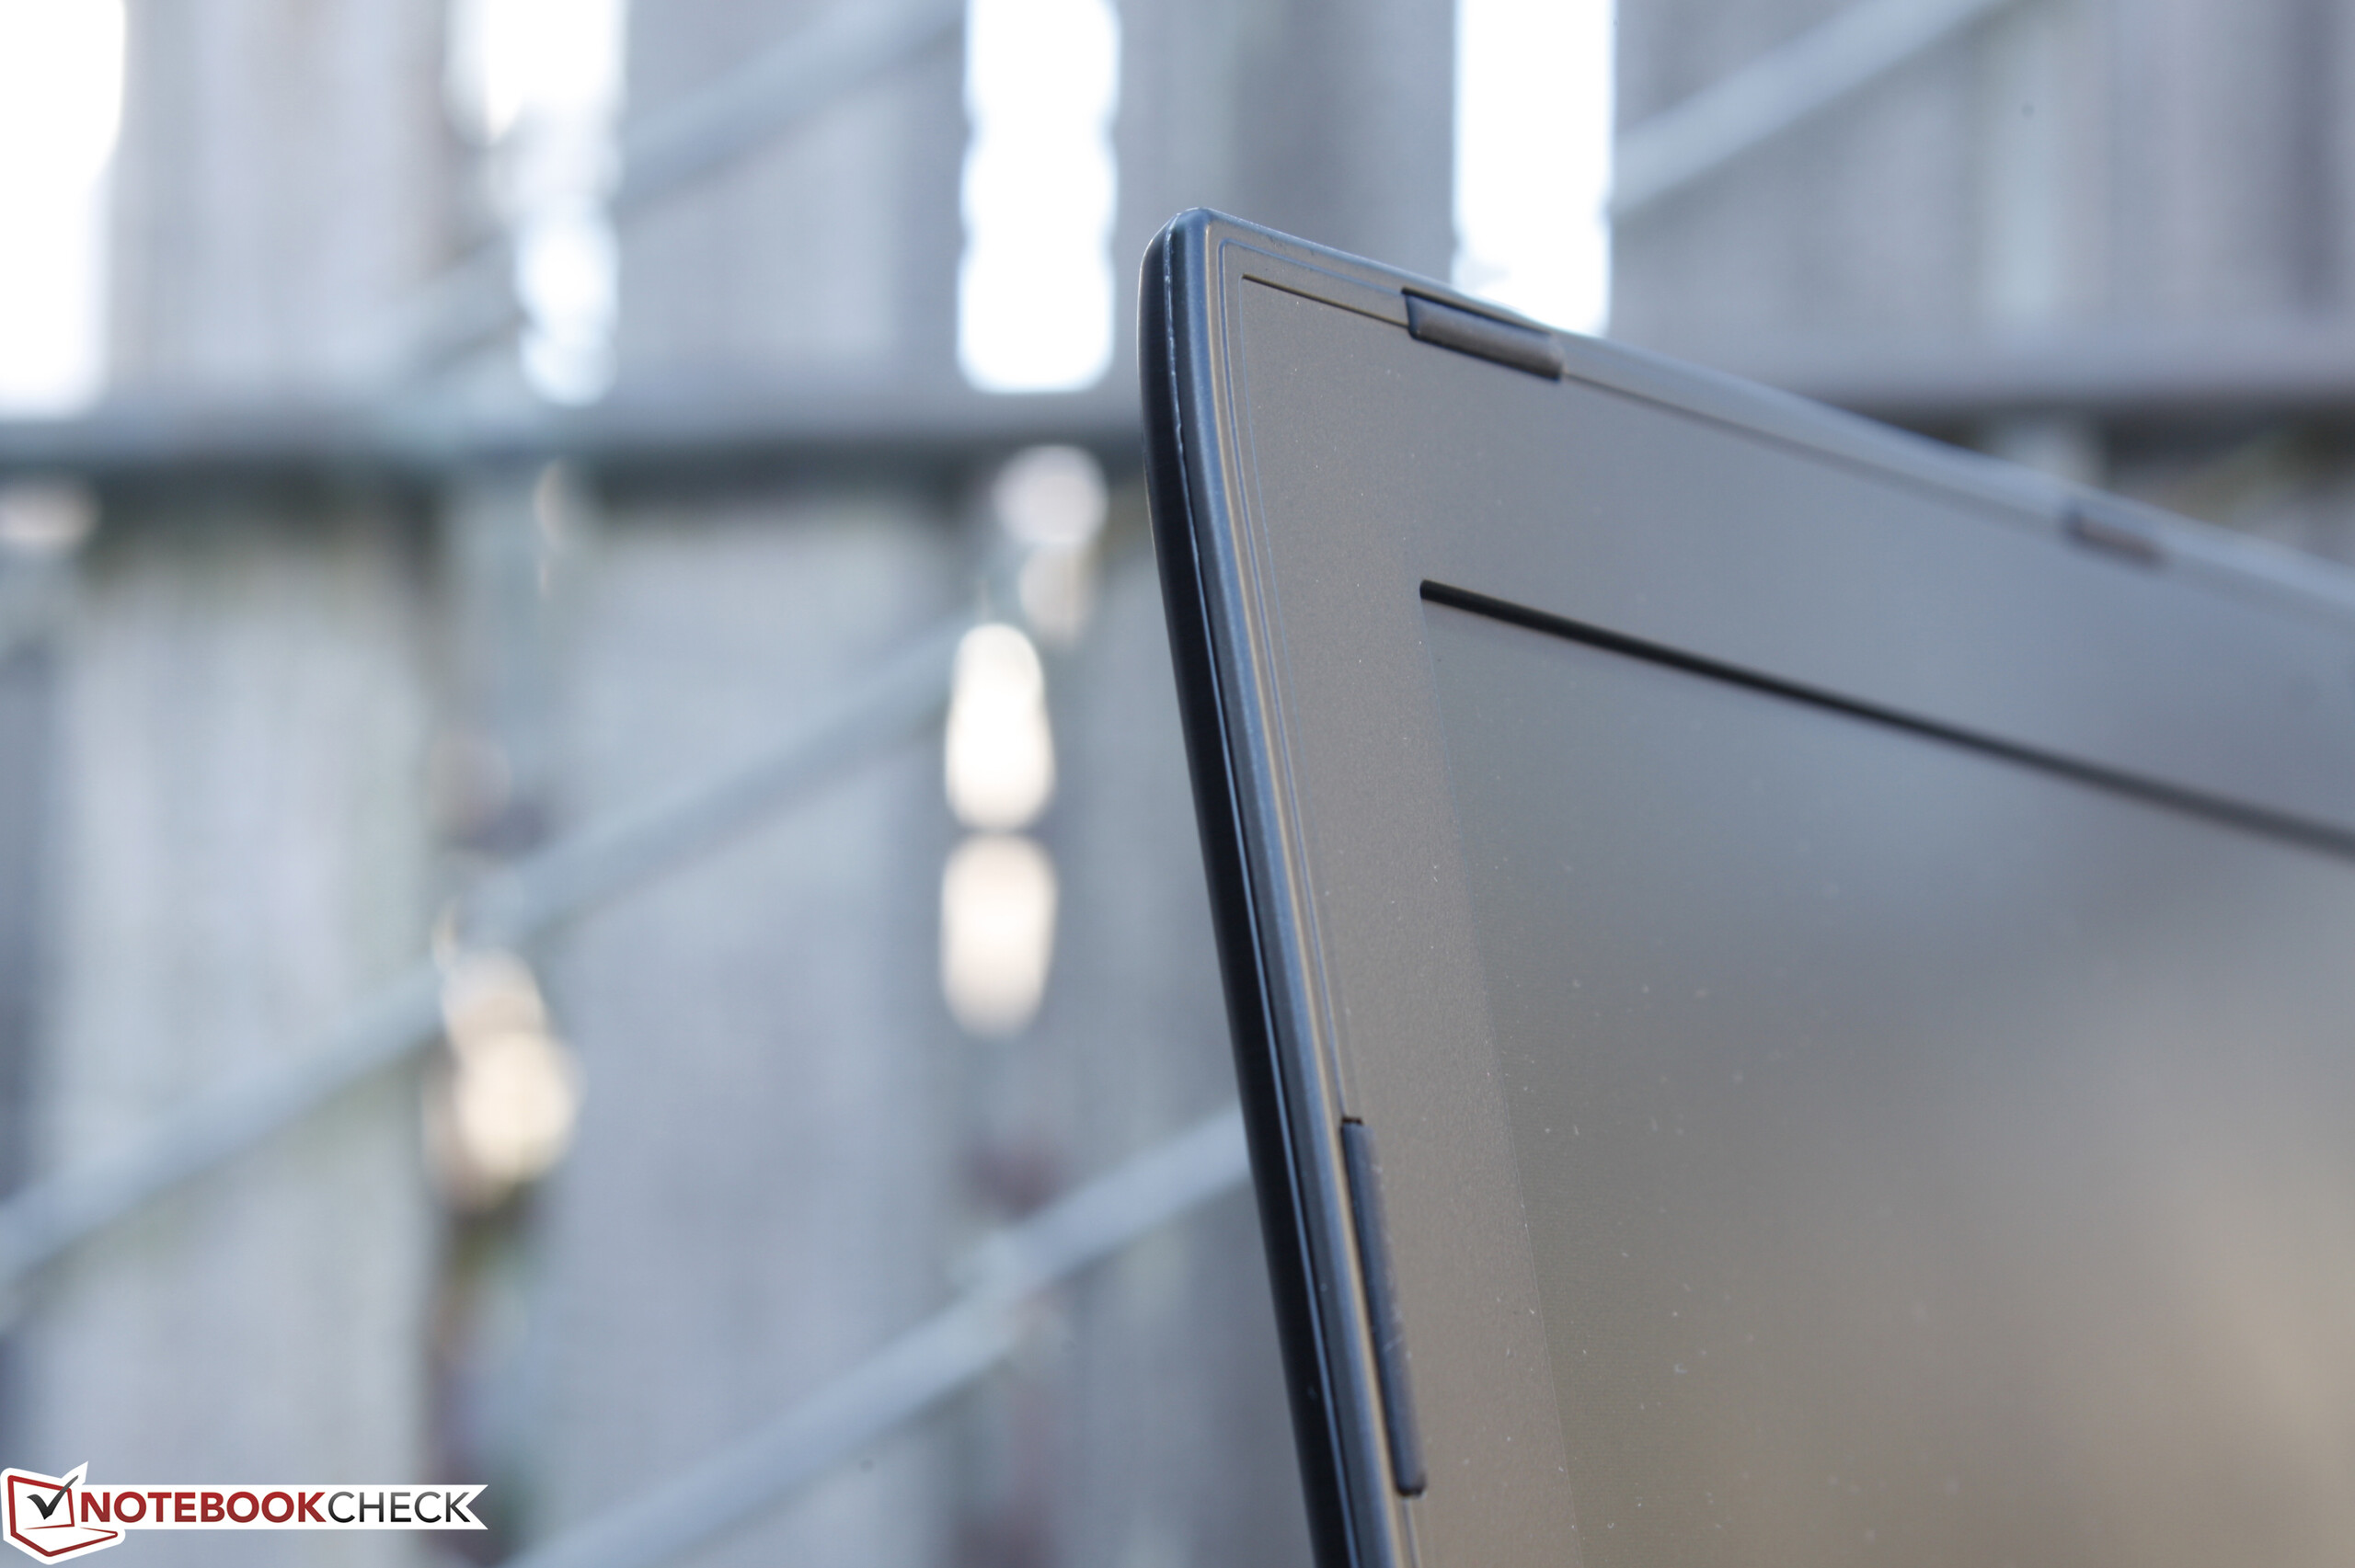
Le performance del CX62 sono sotto la media se si considerano le dimensioni ingombranti ed il peso. La CPU ULV Kaby Lake e la GeForce 940MX entry-level sono scarse per attività che vanno oltre il browsing e lo streaming multimedia. Il gaming è molto limitato dai settaggi 768p e specialmente per i titoli 3D mentre la ventola di sistema emette una pulsazione sotto sforzo. Lo chassis, sebbene quasi identico al rispettabile GE62, è più flessibile ed economico. Il problema principale è il display TN male calibrato con contrasto e illuminazione scarsi.
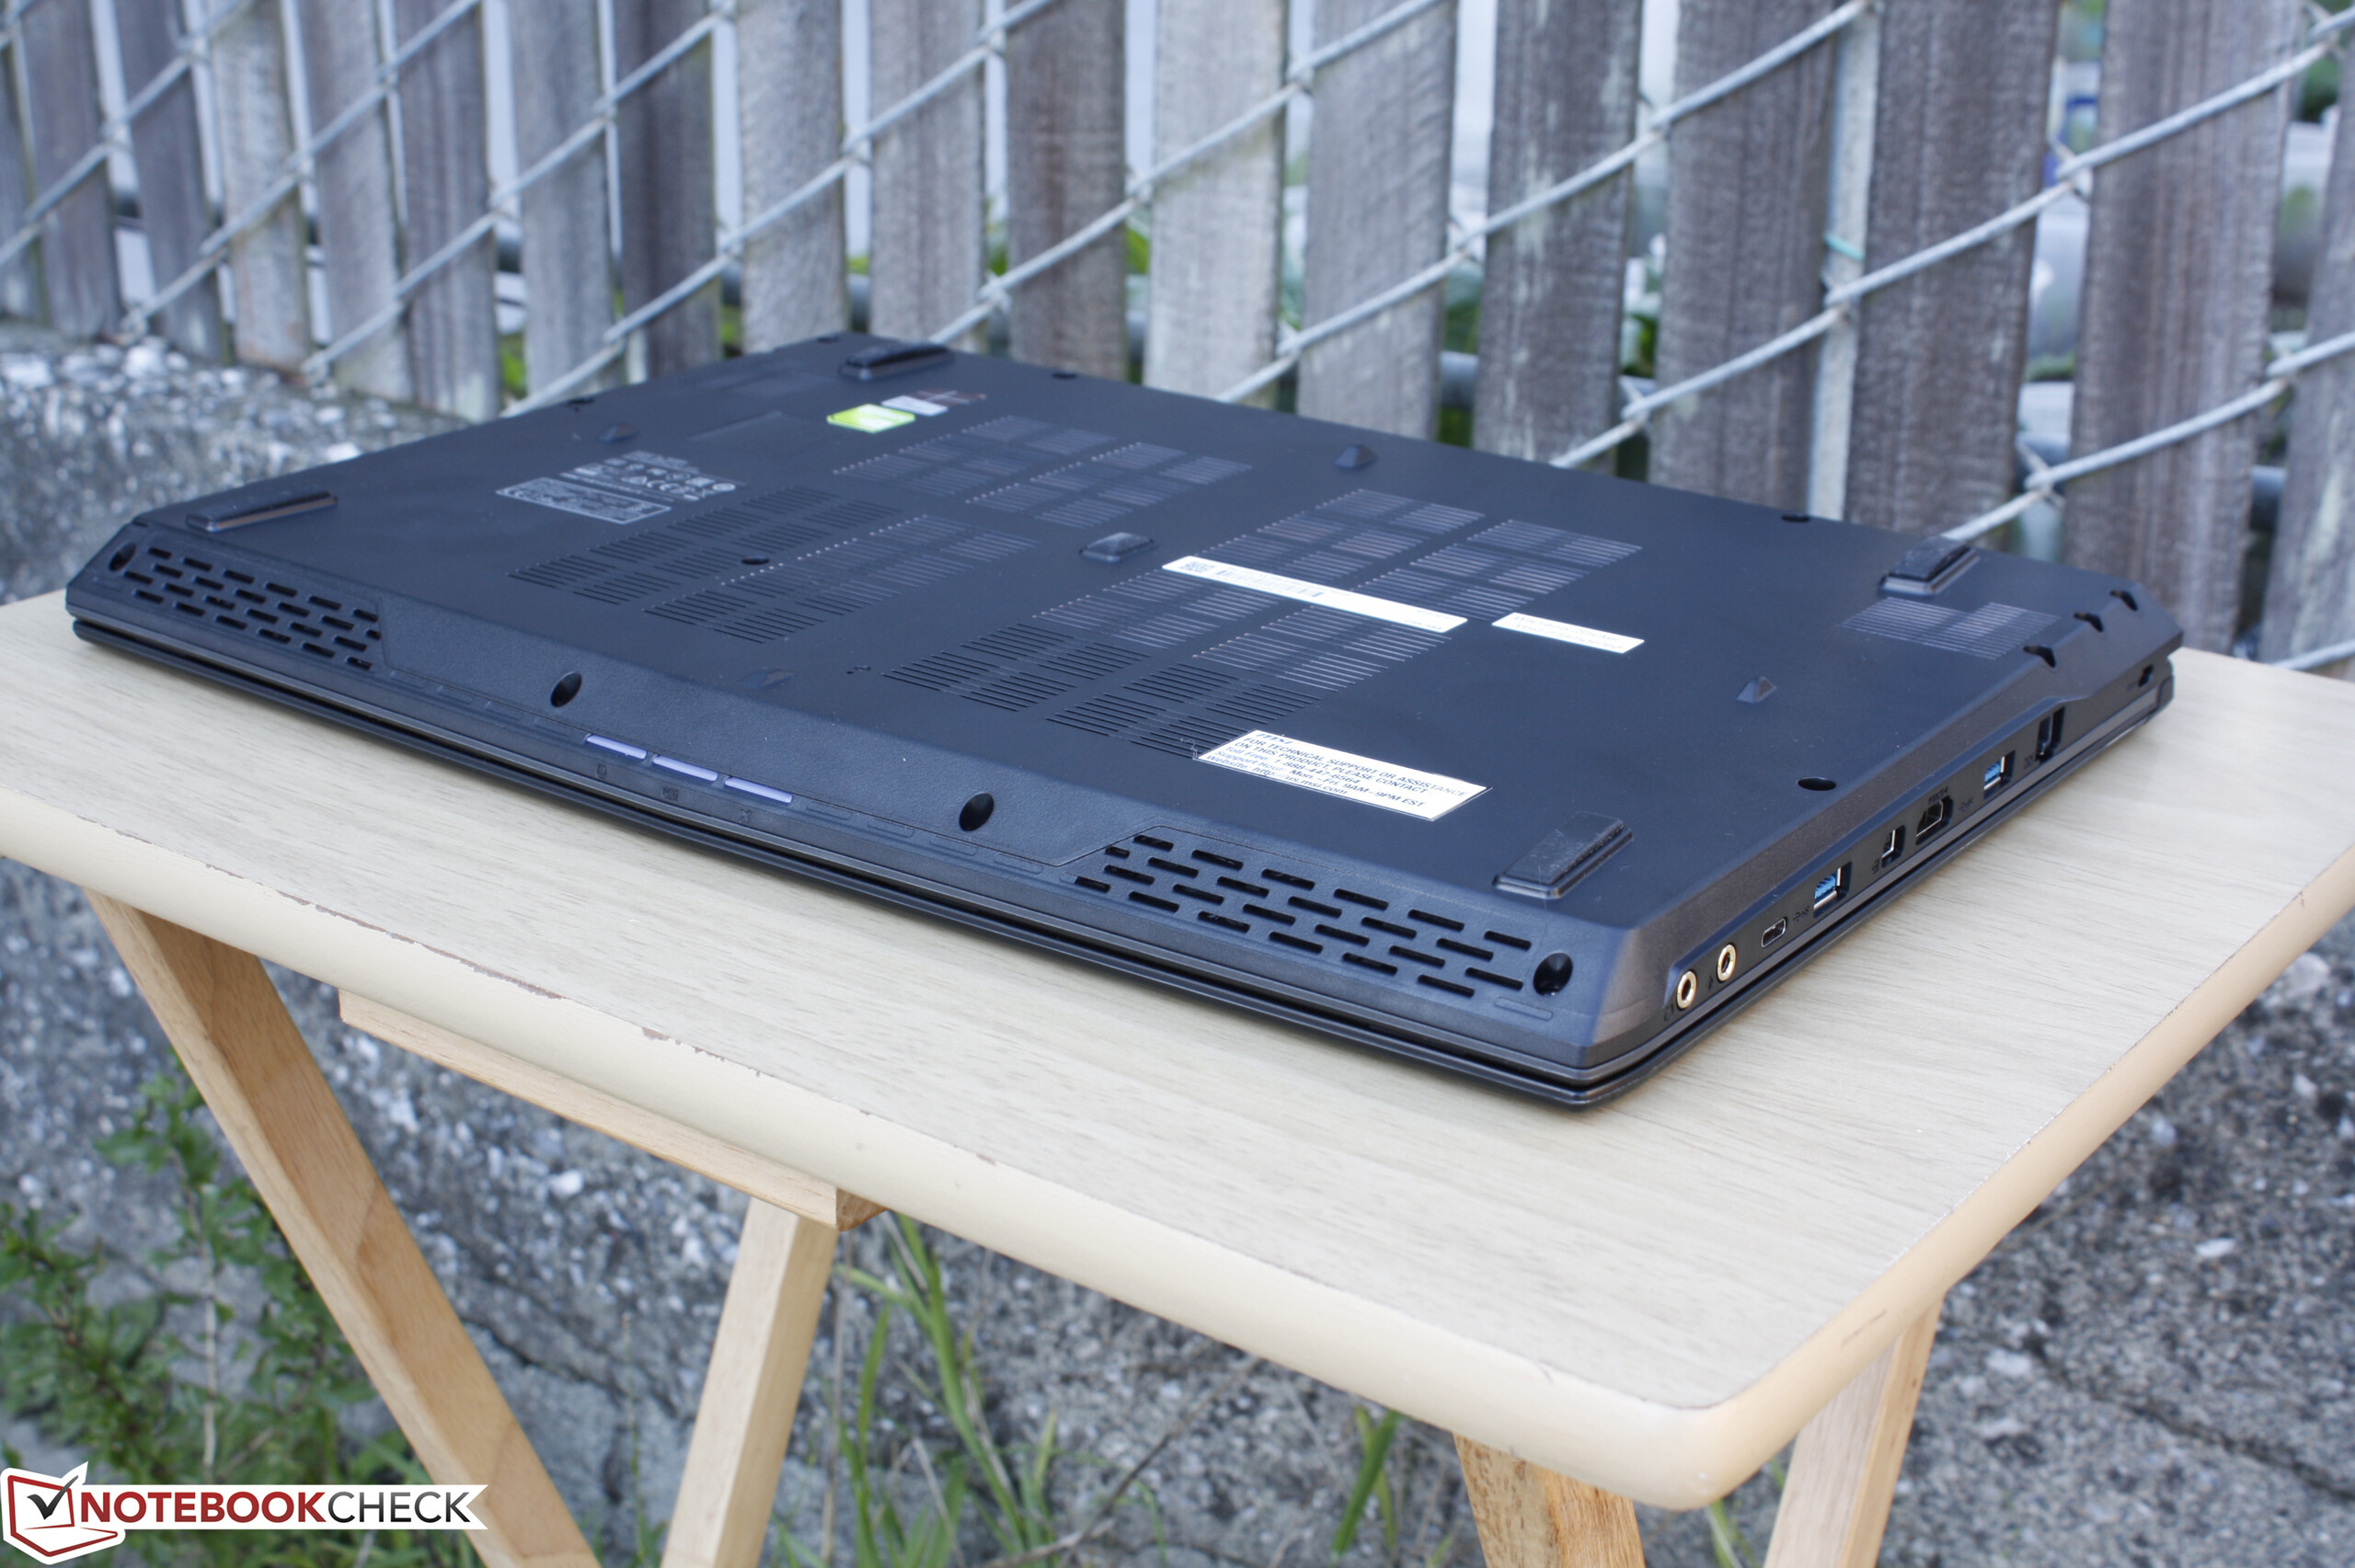
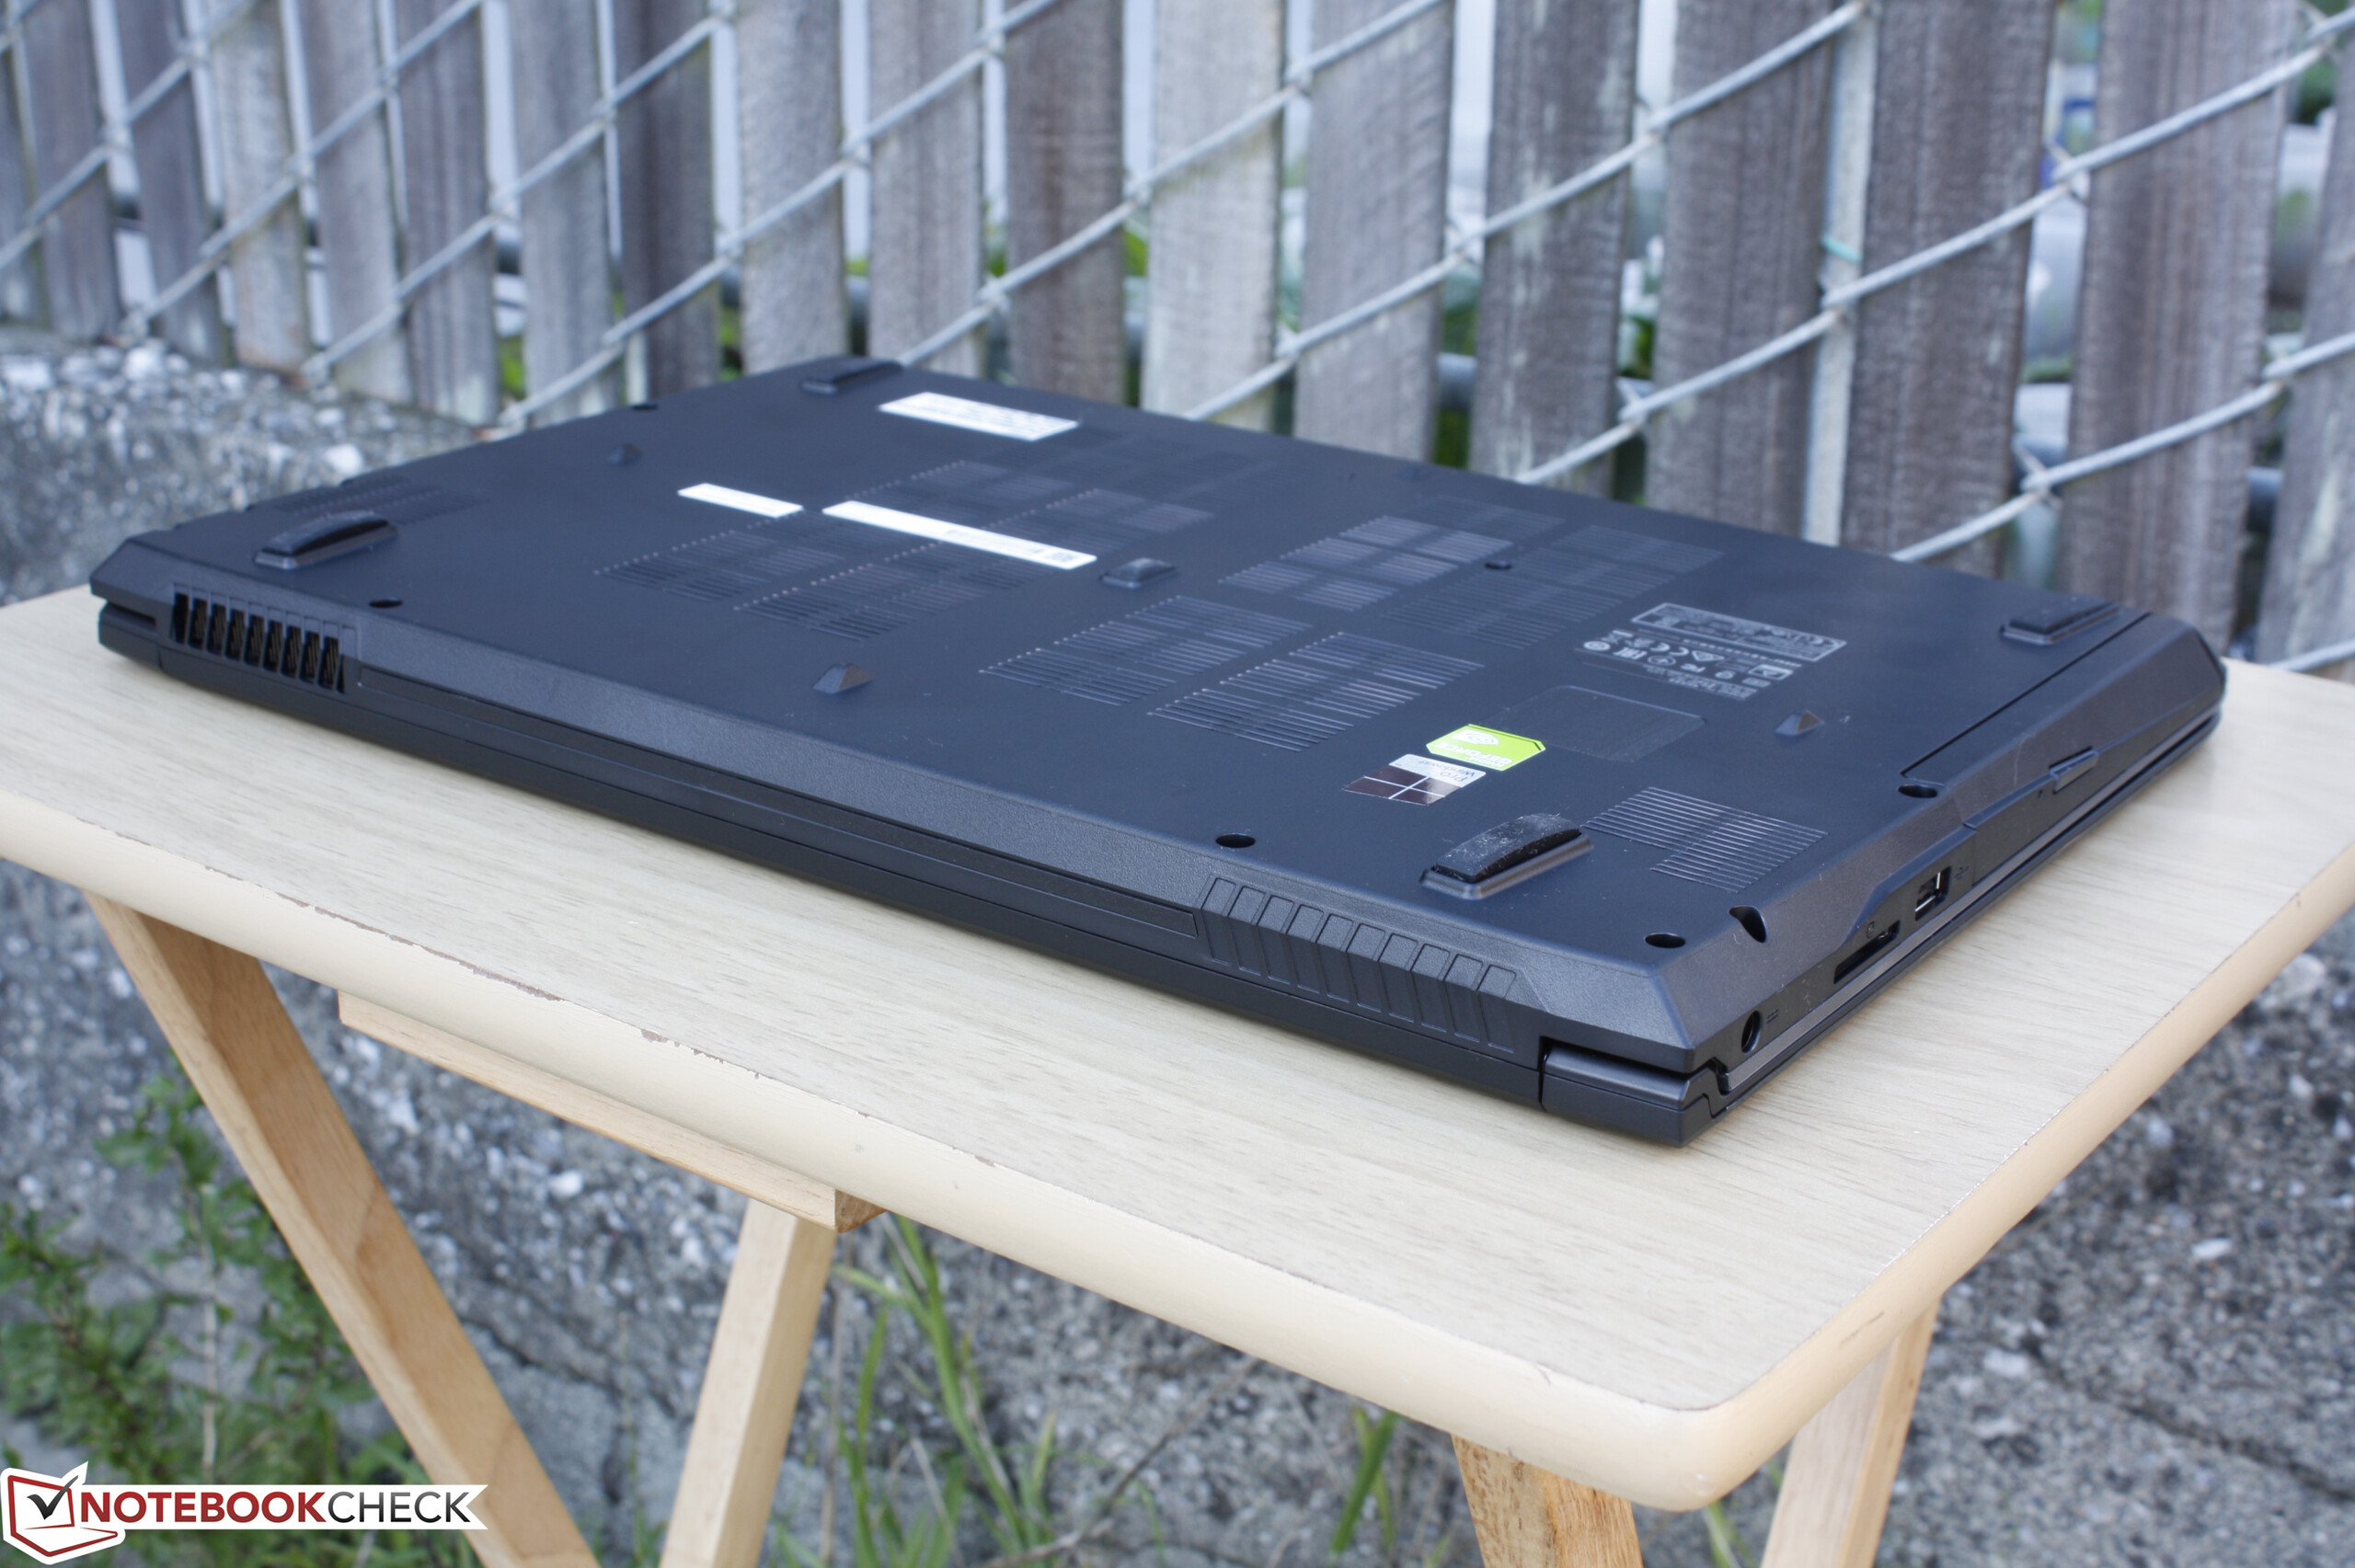
Le poche note positive sono lo slot NVMe M.2 e le temperature basse. Il primo potrebbe migliroare la riattività della nostra configurazione con HDD, sebbene una modifica fatta dall'utente invaliderebbe la garanzia. Nello stesso tempo le basse temperature core non dovrebbero sorprendere in quanto lo chassis è spesso e deriva dalla serie gaming G dove CPUs e GPUs hanno TDP molto più elevati. Questo consente al CX62 di mantenere buone velocità Turbo Boost e temperature basse meglio di sistemi con processori ULV simili.
Il CX62 è essenzialmente un portatile gaming depotenziato con hardware di un portatile multimedia economico. Ci sono troppi ragli e fareste meglio a spendere un paio di centinaia di euro in più per un vero Ultrabook con prestazioni CPU uguali o migliori e display superiore.
Nota: si tratta di una recensione breve, con alcune sezioni non tradotte, per la versione integrale in inglese guardate qui.
MSI CX62 7QL
-
01/16/2017 v6(old)
Allen Ngo
Pricecompare
