Recensione breve del Convertibile HP Pavilion x360 13t-u100
| SD Card Reader | |
| average JPG Copy Test (av. of 3 runs) | |
| Lenovo Yoga 3 Pro 13 80HE004LGE | |
| HP Pavilion x360 13t-u100 | |
| Dell Inspiron 13 5368 | |
| maximum AS SSD Seq Read Test (1GB) | |
| HP Pavilion x360 13t-u100 | |
| Lenovo Yoga 3 Pro 13 80HE004LGE | |
| Dell Inspiron 13 5368 | |
| Networking | |
| iperf Server (receive) TCP 1 m 512KB | |
| HP Spectre x360 13-w023dx | |
| Dell Inspiron 13 5368 | |
| HP Pavilion x360 13t-u100 | |
| iperf Client (transmit) TCP 1 m 512KB | |
| HP Spectre x360 13-w023dx | |
| Dell Inspiron 13 5368 | |
| HP Pavilion x360 13t-u100 | |
| |||||||||||||||||||||||||
Distribuzione della luminosità: 84 %
Al centro con la batteria: 256.4 cd/m²
Contrasto: 712:1 (Nero: 0.36 cd/m²)
ΔE ColorChecker Calman: 6.7 | ∀{0.5-29.43 Ø4.71}
ΔE Greyscale Calman: 5.4 | ∀{0.09-98 Ø4.96}
61% sRGB (Argyll 1.6.3 3D)
39% AdobeRGB 1998 (Argyll 1.6.3 3D)
42.2% AdobeRGB 1998 (Argyll 3D)
61% sRGB (Argyll 3D)
40.81% Display P3 (Argyll 3D)
Gamma: 2.21
CCT: 6235 K
| HP Pavilion x360 13t-u100 LGD052E, IPS, 13.3", 1366x768 | HP Spectre x360 13-w023dx Chi Mei CMN1367, IPS, 13.3", 1920x1080 | Dell Inspiron 13 5368 AUO B133HAB, IPS, 13.3", 1920x1080 | Asus VivoBook Flip TP301UA-DW006T BOE HB133WX1-402, TN, 13.3", 1920x1080 | Lenovo Yoga 3 Pro 13 80HE004LGE Samsung L_LLTN133YL03L01, IPS, 13.3", 3200x1800 | |
|---|---|---|---|---|---|
| Display | 55% | -5% | 2% | 53% | |
| Display P3 Coverage (%) | 40.81 | 65.4 60% | 38.88 -5% | 41.63 2% | 64.6 58% |
| sRGB Coverage (%) | 61 | 90.4 48% | 57.7 -5% | 62.6 3% | 89.5 47% |
| AdobeRGB 1998 Coverage (%) | 42.2 | 65.8 56% | 40.17 -5% | 43.02 2% | 65.5 55% |
| Response Times | 34% | 21% | 55% | 32% | |
| Response Time Grey 50% / Grey 80% * (ms) | 57.2 ? | 33.2 ? 42% | 44 ? 23% | 38 ? 34% | 36 ? 37% |
| Response Time Black / White * (ms) | 37.6 ? | 28 ? 26% | 31 ? 18% | 9 ? 76% | 28 ? 26% |
| PWM Frequency (Hz) | 50 ? | 1330 ? | |||
| Screen | 23% | 17% | 2% | 25% | |
| Brightness middle (cd/m²) | 256.4 | 334.6 30% | 240 -6% | 166 -35% | 314 22% |
| Brightness (cd/m²) | 251 | 319 27% | 229 -9% | 165 -34% | 294 17% |
| Brightness Distribution (%) | 84 | 90 7% | 92 10% | 90 7% | 83 -1% |
| Black Level * (cd/m²) | 0.36 | 0.336 7% | 0.24 33% | 0.44 -22% | 0.57 -58% |
| Contrast (:1) | 712 | 996 40% | 1000 40% | 377 -47% | 551 -23% |
| Colorchecker dE 2000 * | 6.7 | 6.21 7% | 4.75 29% | 4.07 39% | 2.18 67% |
| Colorchecker dE 2000 max. * | 25.5 | 12 53% | 9.09 64% | 6.38 75% | 6.48 75% |
| Greyscale dE 2000 * | 5.4 | 7.71 -43% | 4.3 20% | 3.99 26% | 2.45 55% |
| Gamma | 2.21 100% | 2.36 93% | 2.5 88% | 2.49 88% | 2.39 92% |
| CCT | 6235 104% | 6458 101% | 5893 110% | 7491 87% | 6745 96% |
| Color Space (Percent of AdobeRGB 1998) (%) | 39 | 58.6 50% | 36.79 -6% | 40 3% | 58 49% |
| Color Space (Percent of sRGB) (%) | 61 | 90 48% | 57.39 -6% | 63 3% | 89 46% |
| Media totale (Programma / Settaggio) | 37% /
31% | 11% /
13% | 20% /
9% | 37% /
31% |
* ... Meglio usare valori piccoli
Tempi di risposta del Display
| ↔ Tempi di risposta dal Nero al Bianco | ||
|---|---|---|
| 37.6 ms ... aumenta ↗ e diminuisce ↘ combinato | ↗ 8.4 ms Incremento | 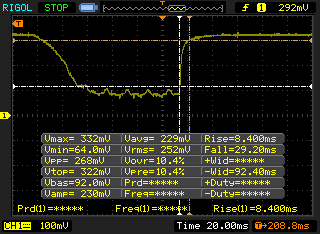 |
| ↘ 29.2 ms Calo | ||
| Lo schermo mostra tempi di risposta lenti nei nostri tests e sarà insoddisfacente per i gamers. In confronto, tutti i dispositivi di test variano da 0.1 (minimo) a 240 (massimo) ms. » 95 % di tutti i dispositivi è migliore. Questo significa che i tempi di risposta rilevati sono peggiori rispetto alla media di tutti i dispositivi testati (19.8 ms). | ||
| ↔ Tempo di risposta dal 50% Grigio all'80% Grigio | ||
| 57.2 ms ... aumenta ↗ e diminuisce ↘ combinato | ↗ 23.2 ms Incremento | 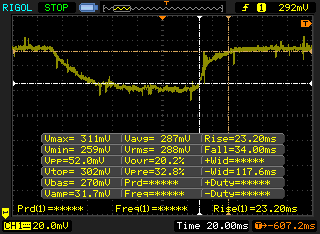 |
| ↘ 34 ms Calo | ||
| Lo schermo mostra tempi di risposta lenti nei nostri tests e sarà insoddisfacente per i gamers. In confronto, tutti i dispositivi di test variano da 0.165 (minimo) a 636 (massimo) ms. » 94 % di tutti i dispositivi è migliore. Questo significa che i tempi di risposta rilevati sono peggiori rispetto alla media di tutti i dispositivi testati (31 ms). | ||
Sfarfallio dello schermo / PWM (Pulse-Width Modulation)
| flickering dello schermo / PWM non rilevato | 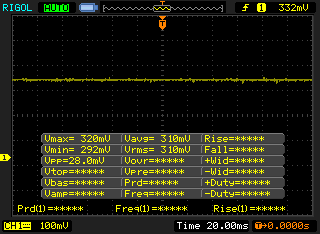 | ||
In confronto: 52 % di tutti i dispositivi testati non utilizza PWM per ridurre la luminosita' del display. Se è rilevato PWM, una media di 7754 (minimo: 5 - massimo: 343500) Hz è stata rilevata. | |||
| Cinebench R11.5 | |
| CPU Single 64Bit | |
| HP Spectre x360 13-w023dx | |
| HP Pavilion x360 13t-u100 | |
| CPU Multi 64Bit | |
| HP Pavilion x360 13t-u100 | |
| HP Spectre x360 13-w023dx | |
| Cinebench R15 | |
| CPU Single 64Bit | |
| Dell Inspiron 13 5368 | |
| HP Spectre x360 13-w023dx | |
| HP Pavilion x360 13t-u100 | |
| Asus VivoBook Flip TP301UA-DW006T | |
| Lenovo Yoga 3 Pro 13 80HE004LGE | |
| CPU Multi 64Bit | |
| HP Pavilion x360 13t-u100 | |
| HP Spectre x360 13-w023dx | |
| Dell Inspiron 13 5368 | |
| Asus VivoBook Flip TP301UA-DW006T | |
| Lenovo Yoga 3 Pro 13 80HE004LGE | |
| wPrime 2.10 - 1024m | |
| HP Pavilion x360 13t-u100 | |
| HP Spectre x360 13-w023dx | |
| Super Pi Mod 1.5 XS 32M - 32M | |
| HP Pavilion x360 13t-u100 | |
| HP Spectre x360 13-w023dx | |
* ... Meglio usare valori piccoli
| PCMark 8 | |
| Home Score Accelerated v2 | |
| HP Spectre x360 13-w023dx | |
| Dell Inspiron 13 5368 | |
| HP Pavilion x360 13t-u100 | |
| Asus VivoBook Flip TP301UA-DW006T | |
| Lenovo Yoga 3 Pro 13 80HE004LGE | |
| Work Score Accelerated v2 | |
| HP Spectre x360 13-w023dx | |
| HP Pavilion x360 13t-u100 | |
| Dell Inspiron 13 5368 | |
| Asus VivoBook Flip TP301UA-DW006T | |
| Lenovo Yoga 3 Pro 13 80HE004LGE | |
| Creative Score Accelerated v2 | |
| HP Spectre x360 13-w023dx | |
| HP Pavilion x360 13t-u100 | |
| Lenovo Yoga 3 Pro 13 80HE004LGE | |
| PCMark 8 Home Score Accelerated v2 | 3694 punti | |
| PCMark 8 Creative Score Accelerated v2 | 4365 punti | |
| PCMark 8 Work Score Accelerated v2 | 4821 punti | |
Aiuto | ||
| HP Pavilion x360 13t-u100 SanDisk Z400s SD8SNAT-128G | HP Spectre x360 13-w023dx Samsung PM951 NVMe MZVLV512 | Dell Inspiron 13 5368 Toshiba THNSNK256GCS8 | Asus VivoBook Flip TP301UA-DW006T Samsung CM871 MZ7LF128HCHP | Lenovo Yoga 3 Pro 13 80HE004LGE Samsung SSD PM851 MZNTE512HMJH | |
|---|---|---|---|---|---|
| CrystalDiskMark 3.0 | 157% | 35% | -56% | 47% | |
| Read Seq (MB/s) | 516 | 1376 167% | 479 -7% | 396 -23% | 521 1% |
| Write Seq (MB/s) | 185.2 | 571 208% | 270.1 46% | 133.5 -28% | 238.6 29% |
| Read 512 (MB/s) | 335.1 | 679 103% | 428.3 28% | 259.5 -23% | 417.3 25% |
| Write 512 (MB/s) | 179.5 | 571 218% | 267.9 49% | 23.86 -87% | 237.7 32% |
| Read 4k (MB/s) | 21.36 | 42.66 100% | 23.77 11% | 5.783 -73% | 35.9 68% |
| Write 4k (MB/s) | 73 | 137.9 89% | 81.4 12% | 8.507 -88% | 99.9 37% |
| Read 4k QD32 (MB/s) | 145 | 535 269% | 333.6 130% | 97.5 -33% | 366.6 153% |
| Write 4k QD32 (MB/s) | 176.7 | 361.2 104% | 200.9 14% | 8.515 -95% | 236.7 34% |

| 3DMark 11 | |
| 1280x720 Performance GPU | |
| HP Spectre x360 13-w023dx | |
| Dell Inspiron 13 5368 | |
| HP Pavilion x360 13t-u100 | |
| Asus VivoBook Flip TP301UA-DW006T | |
| Lenovo Yoga 3 Pro 13 80HE004LGE | |
| 1280x720 Performance Combined | |
| Dell Inspiron 13 5368 | |
| HP Spectre x360 13-w023dx | |
| HP Pavilion x360 13t-u100 | |
| Asus VivoBook Flip TP301UA-DW006T | |
| Lenovo Yoga 3 Pro 13 80HE004LGE | |
| 3DMark | |
| 1280x720 Cloud Gate Standard Graphics | |
| HP Spectre x360 13-w023dx | |
| Dell Inspiron 13 5368 | |
| HP Pavilion x360 13t-u100 | |
| Asus VivoBook Flip TP301UA-DW006T | |
| Lenovo Yoga 3 Pro 13 80HE004LGE | |
| 1920x1080 Fire Strike Graphics | |
| HP Spectre x360 13-w023dx | |
| HP Pavilion x360 13t-u100 | |
| Lenovo Yoga 3 Pro 13 80HE004LGE | |
| 1920x1080 Ice Storm Extreme Graphics | |
| HP Spectre x360 13-w023dx | |
| HP Pavilion x360 13t-u100 | |
| 3DMark 11 Performance | 1523 punti | |
| 3DMark Ice Storm Standard Score | 44760 punti | |
| 3DMark Cloud Gate Standard Score | 5061 punti | |
| 3DMark Fire Strike Score | 653 punti | |
Aiuto | ||
| Rise of the Tomb Raider | |
| 1024x768 Lowest Preset (ordina per valore) | |
| HP Pavilion x360 13t-u100 | |
| HP Spectre x360 13-w023dx | |
| Dell Inspiron 13 5368 | |
| Asus VivoBook Flip TP301UA-DW006T | |
| Lenovo Yoga 3 Pro 13 80HE004LGE | |
| 1366x768 Medium Preset AF:2x (ordina per valore) | |
| HP Pavilion x360 13t-u100 | |
| HP Spectre x360 13-w023dx | |
| Dell Inspiron 13 5368 | |
| Asus VivoBook Flip TP301UA-DW006T | |
| Lenovo Yoga 3 Pro 13 80HE004LGE | |
| BioShock Infinite | |
| 1280x720 Very Low Preset (ordina per valore) | |
| HP Pavilion x360 13t-u100 | |
| HP Spectre x360 13-w023dx | |
| Dell Inspiron 13 5368 | |
| Asus VivoBook Flip TP301UA-DW006T | |
| Lenovo Yoga 3 Pro 13 80HE004LGE | |
| 1366x768 Medium Preset (ordina per valore) | |
| HP Pavilion x360 13t-u100 | |
| HP Spectre x360 13-w023dx | |
| Dell Inspiron 13 5368 | |
| Asus VivoBook Flip TP301UA-DW006T | |
| Lenovo Yoga 3 Pro 13 80HE004LGE | |
| basso | medio | alto | ultra | |
|---|---|---|---|---|
| BioShock Infinite (2013) | 43 | 25 | 20 | |
| Rise of the Tomb Raider (2016) | 17 | 10 |
Rumorosità
| Idle |
| 28.9 / 28.9 / 29.2 dB(A) |
| Sotto carico |
| 36 / 40.3 dB(A) |
 | ||
30 dB silenzioso 40 dB(A) udibile 50 dB(A) rumoroso |
||
min: | ||
| HP Pavilion x360 13t-u100 HD Graphics 620, i5-7200U, SanDisk Z400s SD8SNAT-128G | HP Spectre x360 13-w023dx HD Graphics 620, i7-7500U, Samsung PM951 NVMe MZVLV512 | Dell Inspiron 13 5368 HD Graphics 520, 6500U, Toshiba THNSNK256GCS8 | Asus VivoBook Flip TP301UA-DW006T HD Graphics 520, 6100U, Samsung CM871 MZ7LF128HCHP | Lenovo Yoga 3 Pro 13 80HE004LGE HD Graphics 5300, 5Y70, Samsung SSD PM851 MZNTE512HMJH | |
|---|---|---|---|---|---|
| Noise | -2% | 3% | -3% | -1% | |
| off /ambiente * (dB) | 28.9 | 29.1 -1% | 29 -0% | 31 -7% | 31.2 -8% |
| Idle Minimum * (dB) | 28.9 | 29.1 -1% | 29 -0% | 31.3 -8% | 31.2 -8% |
| Idle Average * (dB) | 28.9 | 29.1 -1% | 29 -0% | 31.3 -8% | 31.4 -9% |
| Idle Maximum * (dB) | 29.2 | 31.2 -7% | 29 1% | 32.9 -13% | 31.8 -9% |
| Load Average * (dB) | 36 | 37.3 -4% | 31 14% | 35 3% | 32.3 10% |
| Load Maximum * (dB) | 40.3 | 39.6 2% | 40.3 -0% | 34.9 13% | 32 21% |
* ... Meglio usare valori piccoli
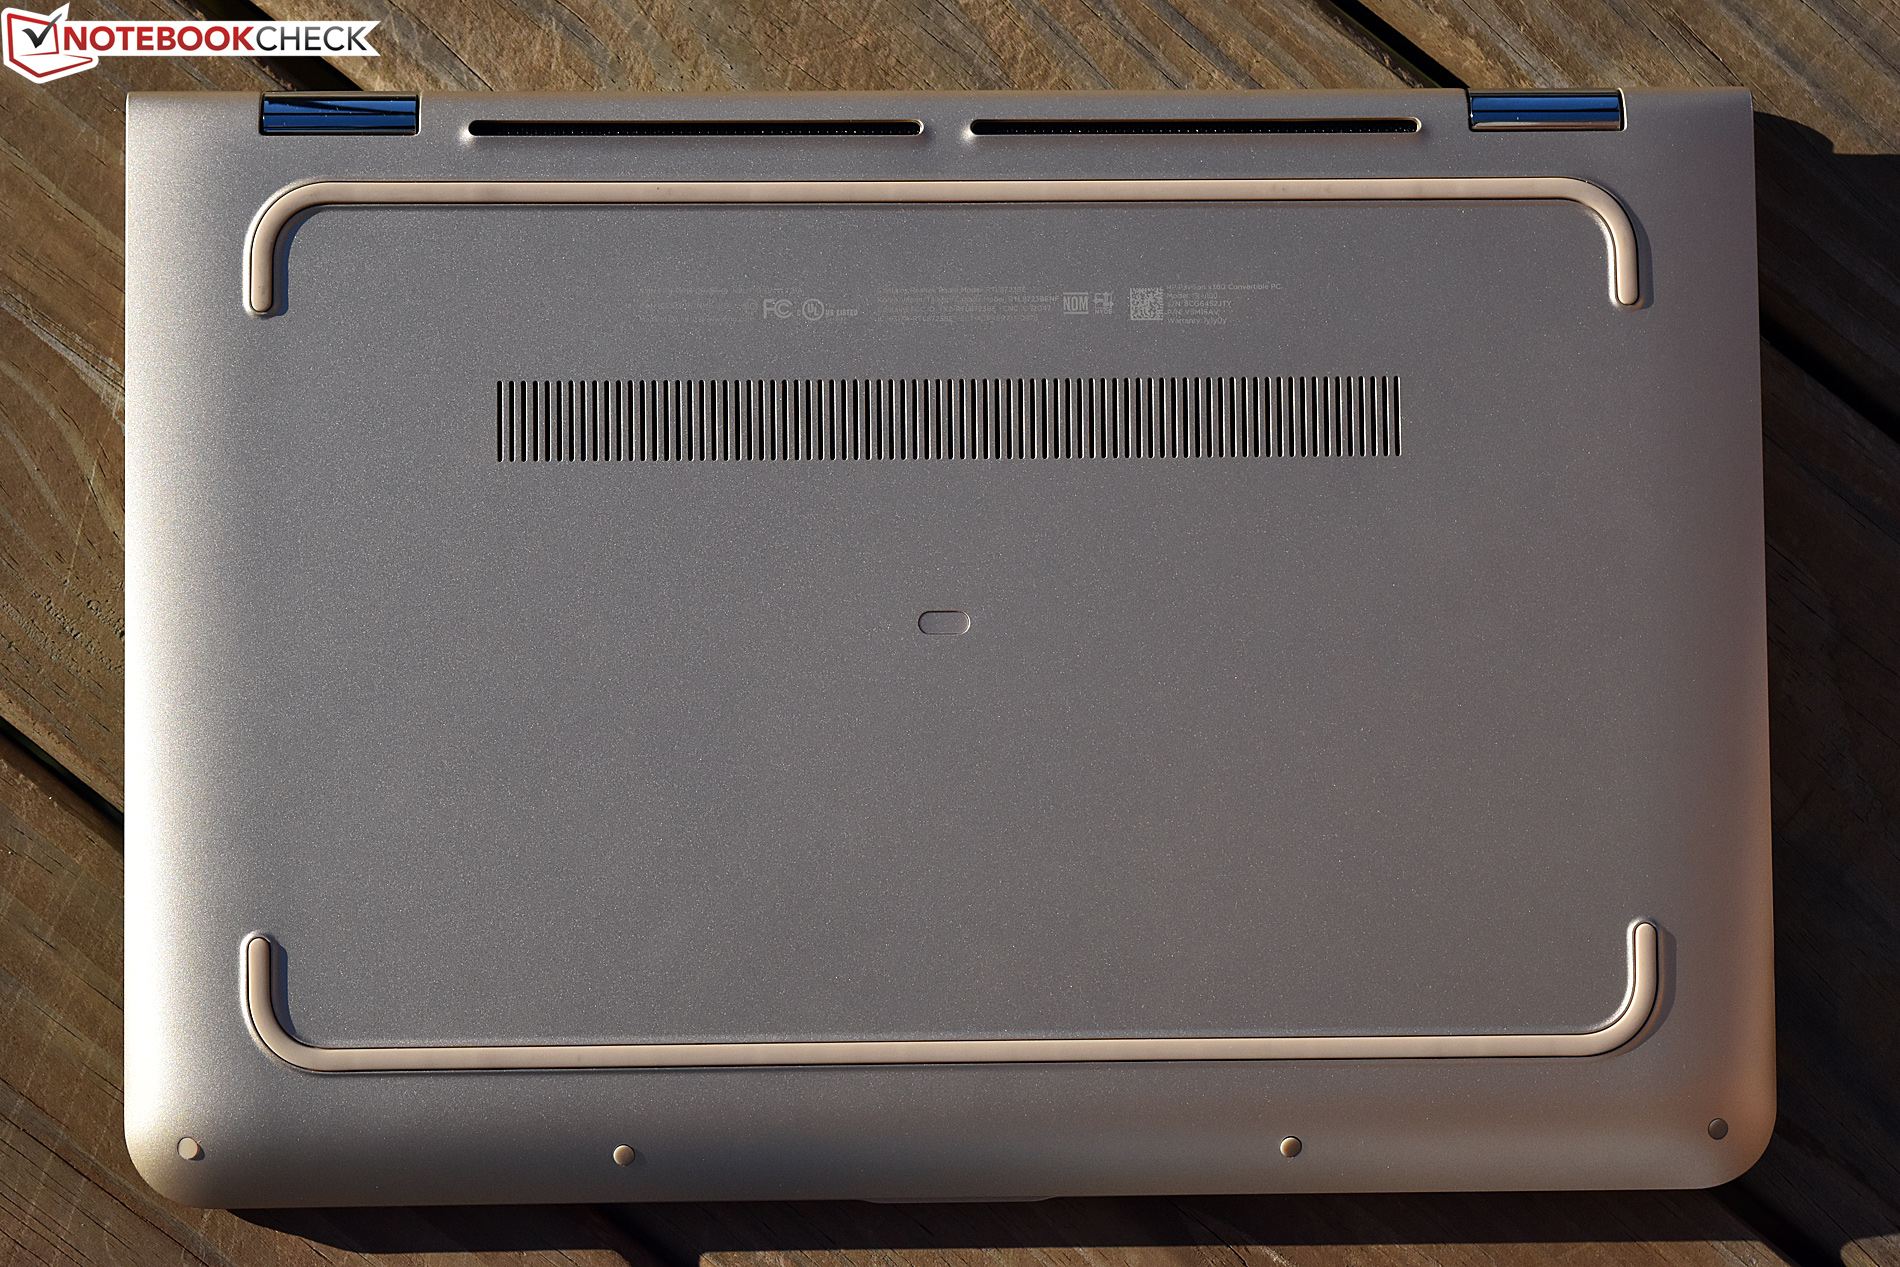
(±) La temperatura massima sul lato superiore è di 42 °C / 108 F, rispetto alla media di 35.4 °C / 96 F, che varia da 19.6 a 60 °C per questa classe Convertible.
(-) Il lato inferiore si riscalda fino ad un massimo di 49 °C / 120 F, rispetto alla media di 36.9 °C / 98 F
(+) In idle, la temperatura media del lato superiore è di 22.7 °C / 73 F, rispetto alla media deld ispositivo di 30.3 °C / 87 F.
(+) I poggiapolsi e il touchpad sono piu' freddi della temperatura della pelle con un massimo di 22.2 °C / 72 F e sono quindi freddi al tatto.
(+) La temperatura media della zona del palmo della mano di dispositivi simili e'stata di 28 °C / 82.4 F (+5.8 °C / 10.4 F).
HP Pavilion x360 13t-u100 analisi audio
(±) | potenza degli altiparlanti media ma buona (76.9 dB)
Bassi 100 - 315 Hz
(-) | quasi nessun basso - in media 22.2% inferiori alla media
(±) | la linearità dei bassi è media (11.9% delta rispetto alla precedente frequenza)
Medi 400 - 2000 Hz
(±) | medi elevati - circa 5.4% superiore alla media
(±) | linearità dei medi adeguata (8% delta rispetto alla precedente frequenza)
Alti 2 - 16 kHz
(+) | Alti bilanciati - appena 3.6% dalla media
(±) | la linearità degli alti è media (9.6% delta rispetto alla precedente frequenza)
Nel complesso 100 - 16.000 Hz
(±) | la linearità complessiva del suono è media (27.6% di differenza rispetto alla media
Rispetto alla stessa classe
» 84% di tutti i dispositivi testati in questa classe è stato migliore, 3% simile, 13% peggiore
» Il migliore ha avuto un delta di 6%, medio di 20%, peggiore di 57%
Rispetto a tutti i dispositivi testati
» 84% di tutti i dispositivi testati in questa classe è stato migliore, 3% similare, 13% peggiore
» Il migliore ha avuto un delta di 4%, medio di 23%, peggiore di 134%
HP Spectre x360 13-w023dx analisi audio
(±) | potenza degli altiparlanti media ma buona (76.2 dB)
Bassi 100 - 315 Hz
(-) | quasi nessun basso - in media 17% inferiori alla media
(±) | la linearità dei bassi è media (12.7% delta rispetto alla precedente frequenza)
Medi 400 - 2000 Hz
(+) | medi bilanciati - solo only 3.7% rispetto alla media
(+) | medi lineari (6.3% delta rispetto alla precedente frequenza)
Alti 2 - 16 kHz
(+) | Alti bilanciati - appena 2.4% dalla media
(±) | la linearità degli alti è media (7.2% delta rispetto alla precedente frequenza)
Nel complesso 100 - 16.000 Hz
(±) | la linearità complessiva del suono è media (21.9% di differenza rispetto alla media
Rispetto alla stessa classe
» 63% di tutti i dispositivi testati in questa classe è stato migliore, 7% simile, 30% peggiore
» Il migliore ha avuto un delta di 6%, medio di 20%, peggiore di 57%
Rispetto a tutti i dispositivi testati
» 63% di tutti i dispositivi testati in questa classe è stato migliore, 7% similare, 30% peggiore
» Il migliore ha avuto un delta di 4%, medio di 23%, peggiore di 134%
| Off / Standby | |
| Idle | |
| Sotto carico |
|
Leggenda:
min: | |
| HP Pavilion x360 13t-u100 i5-7200U, HD Graphics 620, SanDisk Z400s SD8SNAT-128G, IPS, 1366x768, 13.3" | HP Spectre x360 13-w023dx i7-7500U, HD Graphics 620, Samsung PM951 NVMe MZVLV512, IPS, 1920x1080, 13.3" | Dell Inspiron 13 5368 6500U, HD Graphics 520, Toshiba THNSNK256GCS8, IPS, 1920x1080, 13.3" | Asus VivoBook Flip TP301UA-DW006T 6100U, HD Graphics 520, Samsung CM871 MZ7LF128HCHP, TN, 1920x1080, 13.3" | Lenovo Yoga 3 Pro 13 80HE004LGE 5Y70, HD Graphics 5300, Samsung SSD PM851 MZNTE512HMJH, IPS, 3200x1800, 13.3" | |
|---|---|---|---|---|---|
| Power Consumption | -25% | -11% | 7% | -25% | |
| Idle Minimum * (Watt) | 3.7 | 5.5 -49% | 4.4 -19% | 2.95 20% | 4.8 -30% |
| Idle Average * (Watt) | 6 | 6.7 -12% | 6.1 -2% | 5.6 7% | 10.7 -78% |
| Idle Maximum * (Watt) | 6.9 | 7.1 -3% | 6.8 1% | 7.7 -12% | 11.8 -71% |
| Load Average * (Watt) | 23.4 | 33.1 -41% | 29 -24% | 22.6 3% | 18.3 22% |
| Load Maximum * (Watt) | 28.8 | 35.2 -22% | 31.9 -11% | 23.5 18% | 19.7 32% |
* ... Meglio usare valori piccoli
| HP Pavilion x360 13t-u100 i5-7200U, HD Graphics 620, 43 Wh | HP Spectre x360 13-w023dx i7-7500U, HD Graphics 620, 57.8 Wh | Dell Inspiron 13 5368 6500U, HD Graphics 520, 42 Wh | Asus VivoBook Flip TP301UA-DW006T 6100U, HD Graphics 520, 55 Wh | Lenovo Yoga 3 Pro 13 80HE004LGE 5Y70, HD Graphics 5300, 44 Wh | |
|---|---|---|---|---|---|
| Autonomia della batteria | 35% | -25% | 39% | -33% | |
| Reader / Idle (h) | 14.7 | 20.6 40% | 11.2 -24% | 21 43% | |
| WiFi v1.3 (h) | 6.6 | 9.3 41% | 4 -39% | 4.8 -27% | 4.4 -33% |
| Load (h) | 1.6 | 2 25% | 1.4 -13% | 3.2 100% |
Pro
Contro


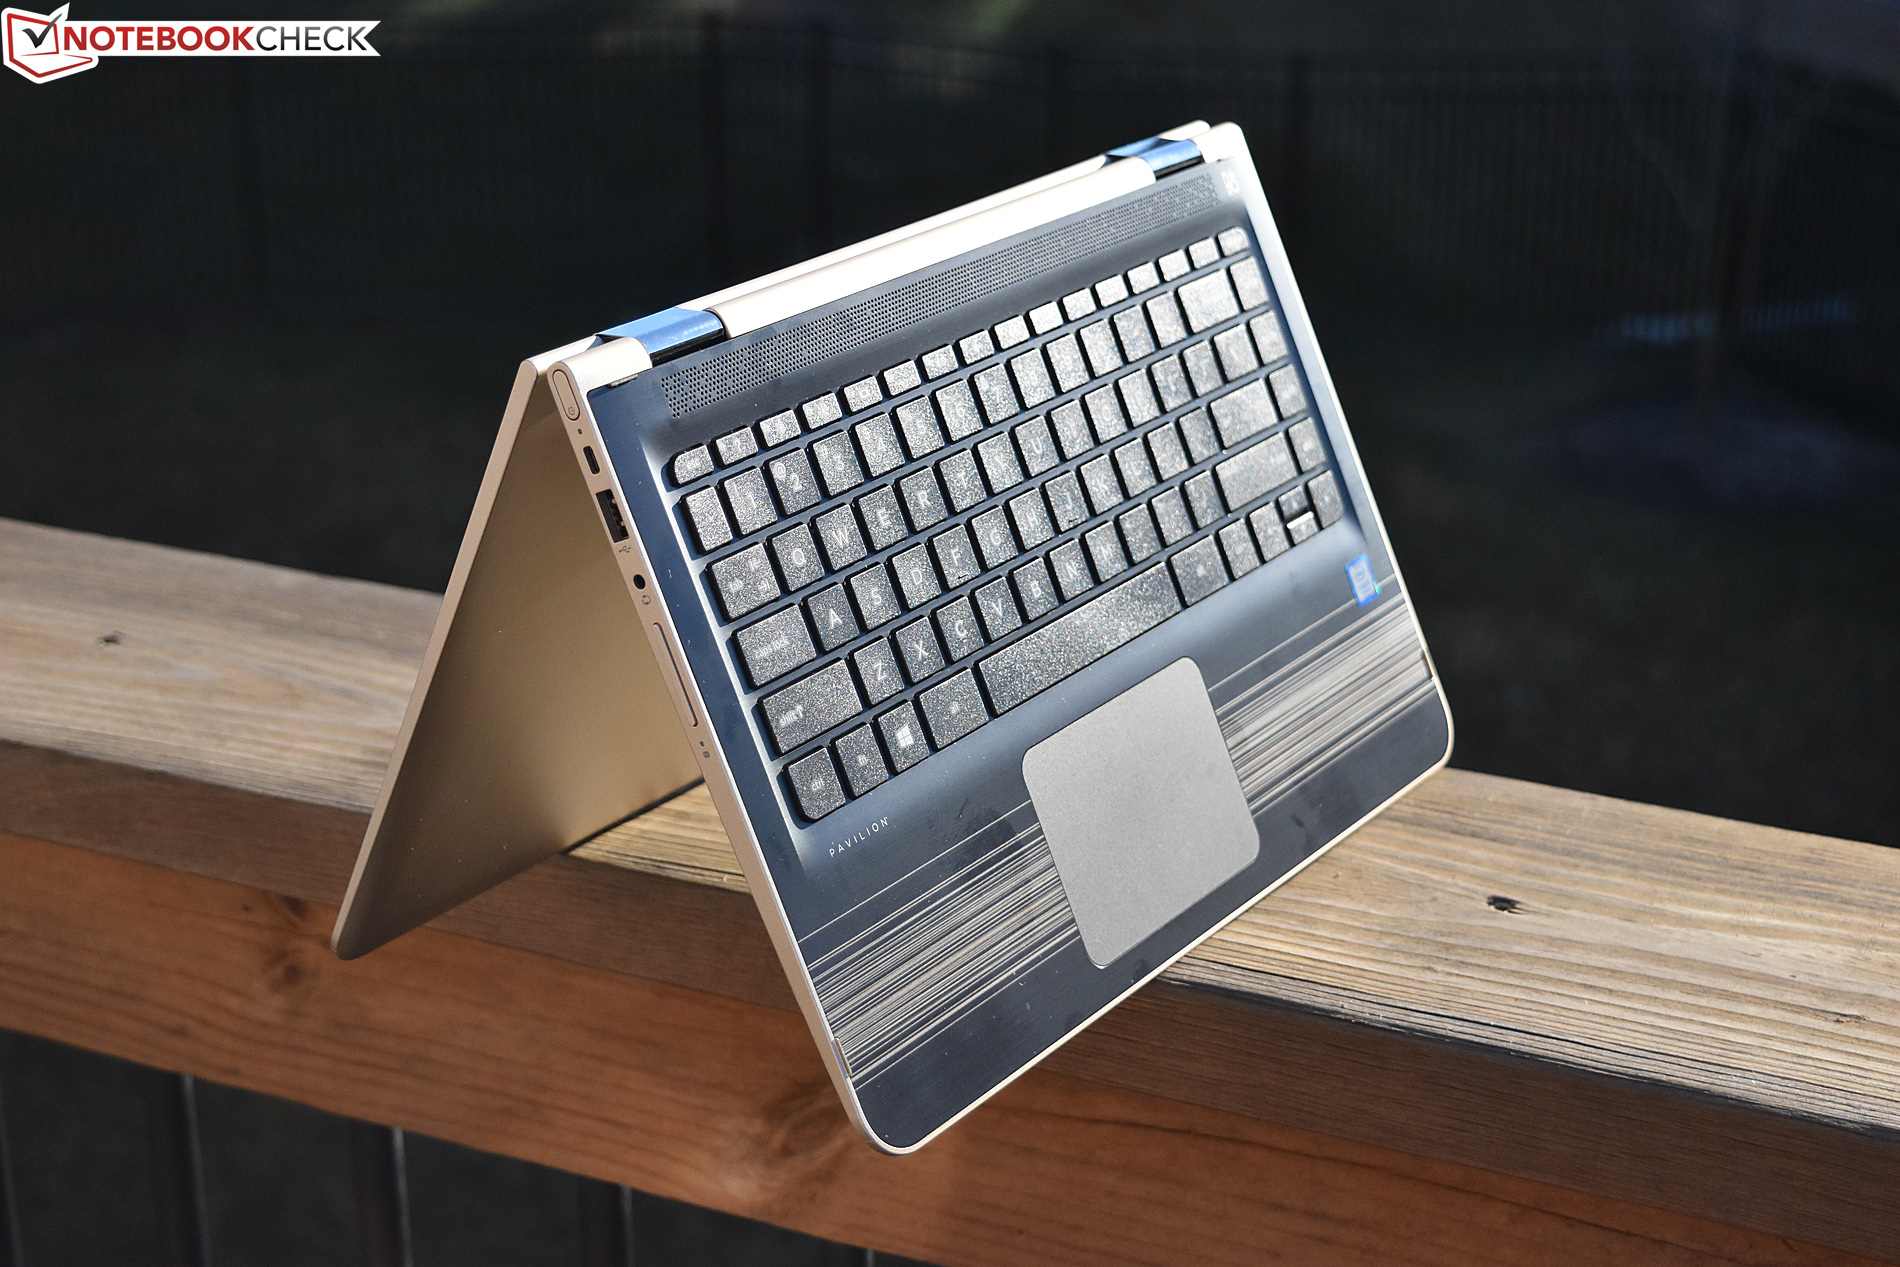
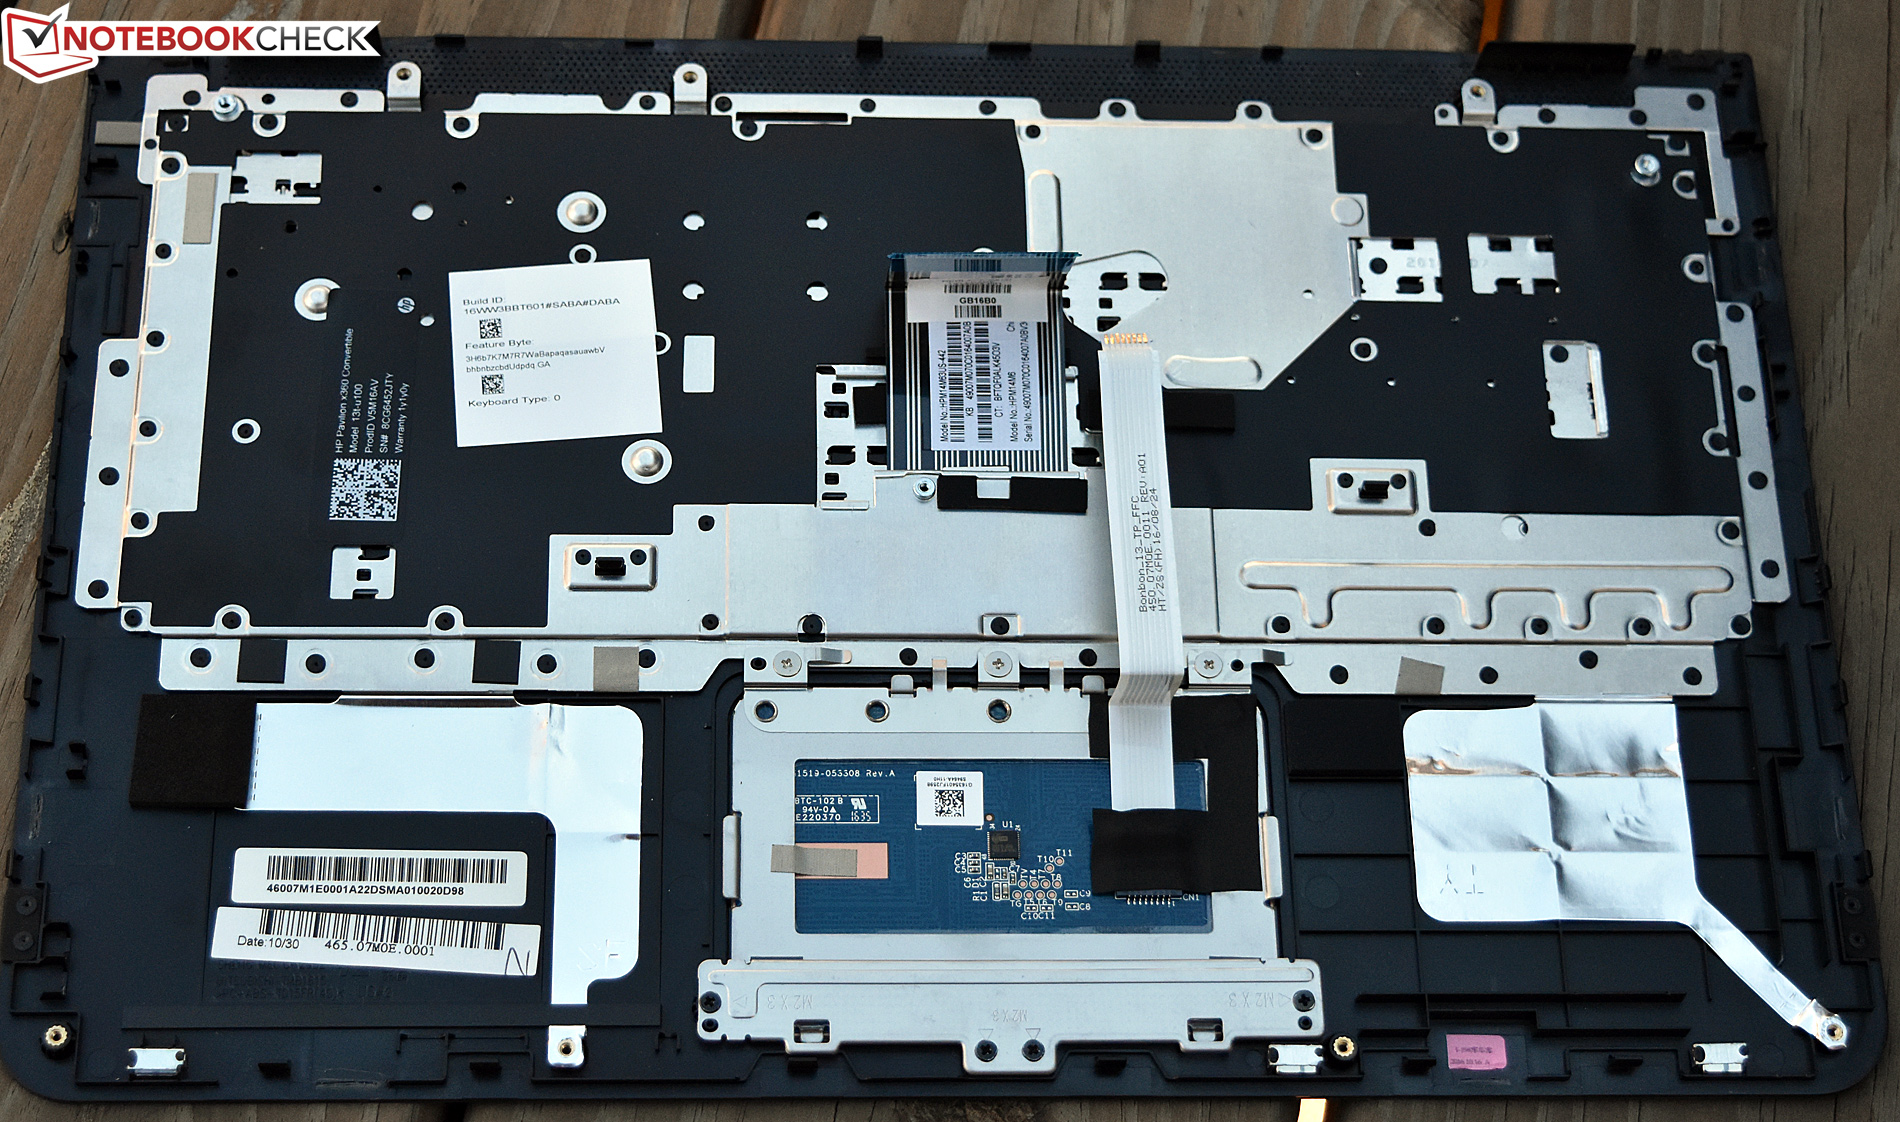
Il Pavilion x360 13t-u100 è una solida macchina per un particolare tipo di utenti, ma non è esente da compromessi. In particolare vale la pena considerare la qualità non eccellente del case e la durabilità, oltre alla manutenzione e gli upgrades, o gli aspetti high-end da Ultrabook (come schermi 1080p+, archiviazione NVMe, e ampia autonomia). Ci sono anche altre pecche significative, come la connettività wireless scarsa e l'assenza si una alternativa Ethernet. E' difficile completare il pacchetto, ma ancora una volta, non si può avere tutto, specialmente in questa fascia di prezzo (attualmente $665 su Amazon).
Ma quello che avete per questo prezzo è una CPU dalle prestazioni eccellenti (una Kaby Lake Core i5 in questo caso) senza throttling, temperature del case ragionevoli e buona rumorosità ( a parte i picchi della vntola), un SSD, e molta RAM — il tutto in un pratico formato e peso (specialmente se si paragona al 15.6" Envy x360 recensito lo scorso mese). Quindi in definitiva, chi cerca un convertibile senza fronzoli per un utilizzo generico e vuole risparmiare apprezzerà questo affidabile dispositivo.
Nota: si tratta di una recensione breve, con alcune sezioni non tradotte, per la versione integrale in inglese guardate qui.
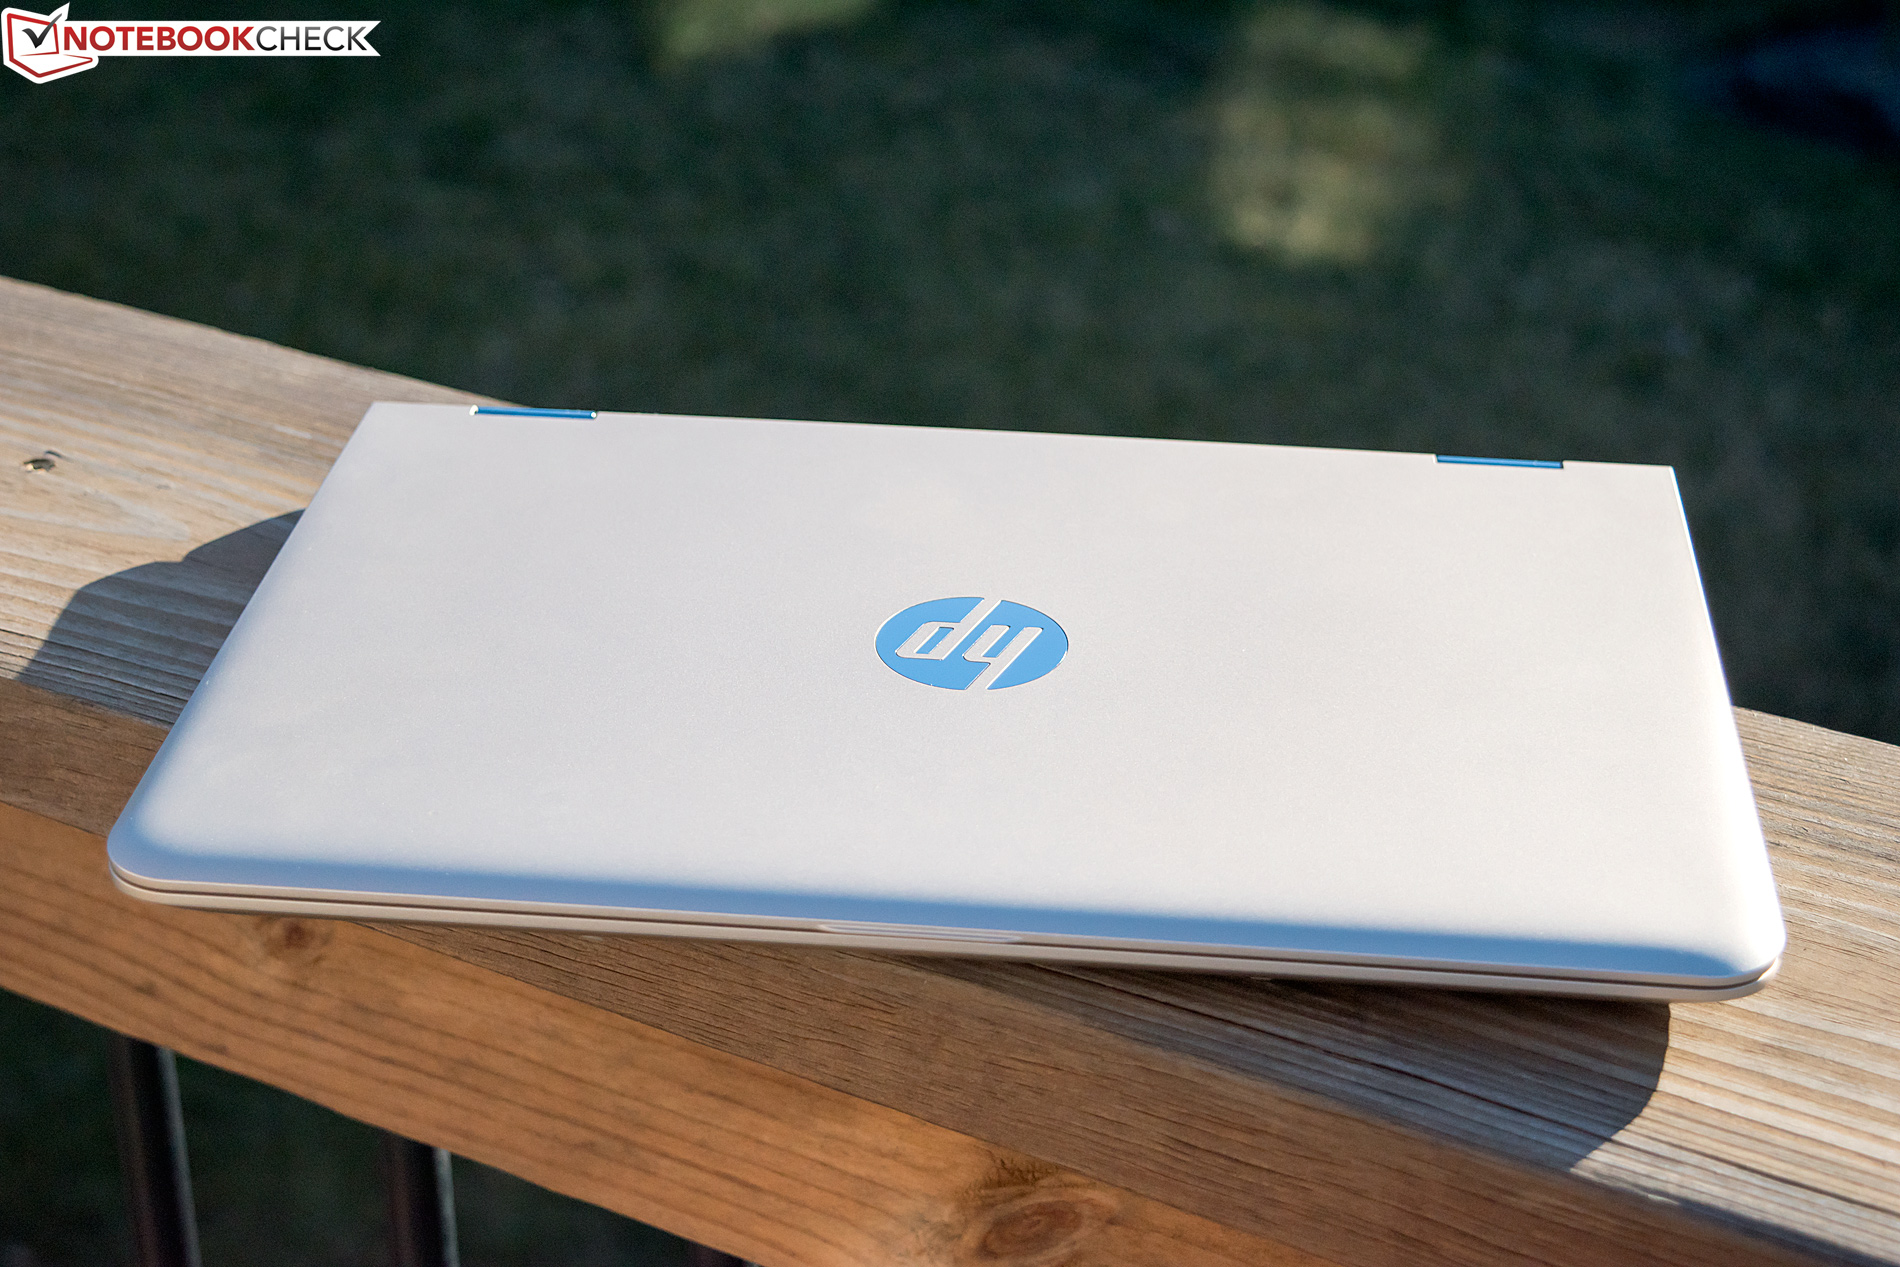
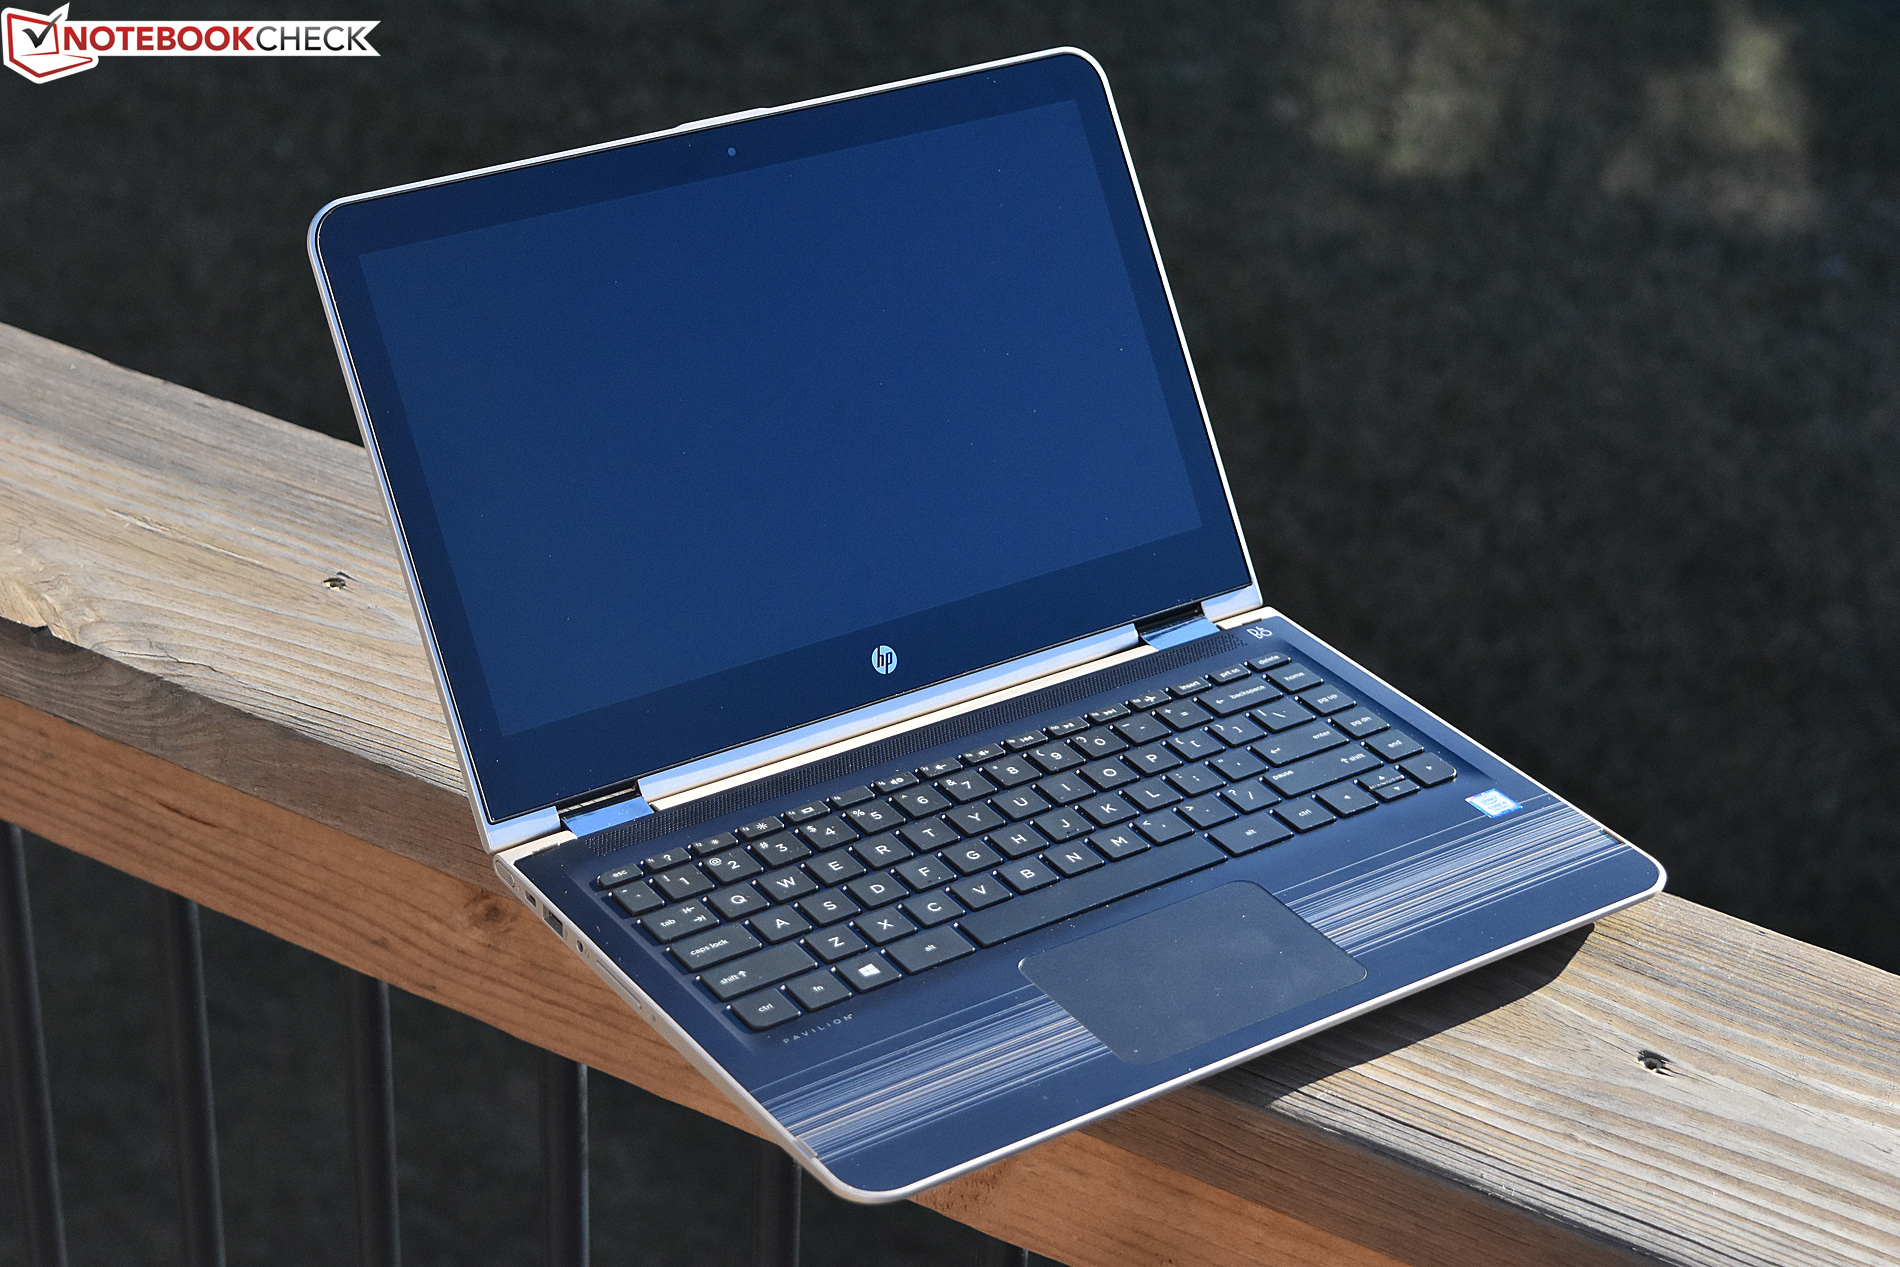
HP Pavilion x360 13t-u100
- 01/08/2017 v6 (old)
Steve Schardein
Price comparison
